| OMB APPROVAL |
OMB Number: 3235-0570 Expires: January 31, 2014 Estimated average burden hours per response: 20.6 |
UNITED STATES
SECURITIES AND EXCHANGE COMMISSION
Washington, D.C. 20549
FORM N-CSR
CERTIFIED SHAREHOLDER REPORT OF REGISTERED
MANAGEMENT INVESTMENT COMPANIES
Investment Company Act file number 811-02699
AIM Growth Series (Invesco Growth Series)
(Exact name of registrant as specified in charter)
11 Greenway Plaza, Suite 1000 Houston, Texas 77046
(Address of principal executive offices) (Zip code)
Philip A. Taylor 11 Greenway Plaza, Suite 1000 Houston, Texas 77046
(Name and address of agent for service)
Registrant’s telephone number, including area code: (713) 626-1919
Date of fiscal year end: 12/31
Date of reporting period: 12/31/12
| Item 1. | Reports to Stockholders. |
|
| |||
Annual Report to Shareholders
| December 31, 2012 | |||
Invesco Balanced-Risk Retirement Funds Invesco Balanced-Risk Retirement Now Fund Invesco Balanced-Risk Retirement 2020 Fund Invesco Balanced-Risk Retirement 2030 Fund Invesco Balanced-Risk Retirement 2040 Fund Invesco Balanced-Risk Retirement 2050 Fund | ||||


Letters to Shareholders
Philip Taylor | Dear Shareholders: This annual report contains information about your Fund and the factors that affected its performance during the reporting period. Inside, you’ll find a discussion from your portfolio managers about how they managed your Fund, performance data for your Fund, a complete list of your Fund’s investments as of the close of the reporting period and other important information. I hope you find this report of interest. The reporting period covered by this report was challenging. As the year began, investors cheered generally positive economic indicators, and markets generally rose. Soon, however, US economic data turned mixed and investors’ attention shifted to the efforts of eurozone governments to implement new policies intended to reduce debt levels, strengthen the banking system and stimulate economic growth. Later in the year, in the US, mixed economic data, competing | ||||||||

proposals on how to reduce the federal budget deficit and a contentious presidential contest increased investor uncertainty and hindered market performance. Throughout the year, your Fund’s portfolio managers adhered to their long-term investment strategies, and later in this report they explain why your Fund performed as it did during the reporting period.
Adhering to your long-term investment plan can be difficult, particularly during periods of market volatility and economic uncertainty. That’s one reason Invesco suggests investors work with a skilled and trusted financial adviser who is familiar with their financial situation, investment goals and risk tolerance. A good financial adviser can provide insight and perspective when markets are volatile; motivation and reassurance when times are uncertain; and advice and recommendations when your financial situation or investment goals change.
Timely insight and information from many of Invesco’s investment professionals is available at our website, invesco.com/us. We offer in-depth articles, video clips and audio commentaries from many of our portfolio managers and other investment professionals on a wide range of topics of interest to investors. At invesco.com/us, you also can access information about your Invesco account at any time.
What we mean by Intentional Investing
At Invesco, all of our people and all of our resources are dedicated to helping investors achieve their financial objectives. It’s a philosophy we call Intentional Investing®, and it guides the way we:
| n | Manage investments – Our dedicated investment professionals search the world for the best opportunities, and each investment team follows a clear, disciplined process to build portfolios and mitigate risk. |
| n | Provide choices – We offer equity, fixed income, asset allocation and alternative strategies so you and your financial adviser an build can investment portfolio designed for your individual needs and goals. |
| n | Connect with you – We’re committed to giving you the expert insights you need to make informed investing decisions, and we are well-equipped to provide high-quality support for investors and advisers. |
Invesco believes in putting investors first, and that’s why investment management is all we do. Our sole focus on managing your money allows your financial adviser to build a portfolio of Invesco funds appropriate for your investment needs and goals now and when your circumstances change.
Have a question?
If you have a question about your account, please contact an Invesco client services representative at 800 959 4246. If you have an Invesco-related question or comment, feel free to email me directly at phil@invesco.com.
All of us at Invesco look forward to serving your investment management needs for many years to come. Thank you for investing with us.
Sincerely,

Philip Taylor
Senior Managing Director, Invesco Ltd.
2 Invesco Balanced-Risk Retirement Funds
Bruce Crockett | Dear Fellow Shareholders: While short-term challenges for the financial markets regularly come and go, it’s clear that significant and longer term economic obstacles remain both here at home and abroad. There appear to be no easy solutions to many of these issues. As a result, the financial markets have had little conviction to respond to what has been slow, yet noticeable improvement in some economic benchmarks in recent months. No one likes uncertainty, especially financial markets. But even in these uncertain times, it appears that investors are still approaching the market with cautious optimism, with some taking on more risk in order to refocus on their long-term savings goals. Maybe this describes you, or perhaps you have been sitting on the sidelines thinking about | ||||||||

getting back into the market, but are still a bit hesitant to act because of market uncertainty. Clearly, risk remains a primary focus for investors of all types. As Trustees of the Invesco Funds, one of our primary responsibilities is to ensure your fund’s adviser is cognizant of the risks in each of the funds it manages. A thoughtful risk management plan may help investors navigate through market turbulence or an economic downturn. This is why we make risk management a critical element of our annual contract renewal process, like the one we complete with Invesco every year.
To be sure, there will always be risks involved with investing, but you shouldn’t let short-term news or your emotions dictate your investments. Because no one can predict with 100% accuracy the movements of financial markets, I strongly encourage you to speak with a professional financial adviser who can assist you in building an investment portfolio that reflects your individual risk tolerance and is designed to help achieve your individual financial objectives.
You can be sure your Board remains committed to doing its part in helping you along the way. In addition to ensuring that your fund’s adviser is focused on the risks in the funds it manages, we also remain committed to managing fund costs and working with your fund’s adviser to provide a compelling and diversified product offering to potentially meet your investing goals.
In that regard, your Board approved a number of fund mergers and the launch of several new funds, including the first Invesco mutual fund available to US retail investors managed by investment professionals at Invesco Perpetual*, one of the largest independent investment managers in the UK.
Let me close by thanking Carl Frischling upon his retirement from the Invesco Funds Board for his 35 years of distinguished service and unwavering commitment to our funds’ shareholders. As always, please contact me at bruce@brucecrockett.com with any questions or concerns you may have.
On behalf of the Board, we look forward to continuing to represent your interests and serving your investment needs.
Sincerely,

Bruce L. Crockett
Independent Chair
Invesco Funds Board of Trustees
| * | Invesco Perpetual is a business name of Invesco Asset Management Limited (IAML), a registered investment adviser. IAML is a wholly owned, indirect subsidiary of Invesco Ltd. |
3 Invesco Balanced-Risk Retirement Funds
Management’s Discussion of Fund Performance
Performance summary – Invesco Balanced-Risk Retirement Now Fund
For the year ended December 31, 2012, Invesco Balanced-Risk Retirement Now Fund underperformed the Custom Balanced-Risk Retirement Now Index, the Fund’s custom style-specific benchmark. Positive absolute performance from the Fund’s strategic equity, fixed income and commodity exposures, in addition to a positive impact from active positioning, drove results for the reporting period. Most of the Fund’s underperformance occurred in the second half of 2012, when stocks performed very well. In such an environment, the equity-dominant benchmark may outperform the Fund’s risk-balanced approach.
Your Fund’s long-term performance appears later in this report.
Fund vs. Indexes
Total returns, 12/31/11 to 12/31/12, at net asset value (NAV). Performance shown does not include applicable contingent deferred sales charges (CDSC) or front-end sales charges, which would have reduced performance.
| Class A Shares | 6.22 | % | |||
| Class AX Shares* | 6.22 | ||||
| Class B Shares | 5.50 | ||||
| Class C Shares | 5.37 | ||||
| Class CX Shares* | 5.50 | ||||
| Class R Shares | 5.98 | ||||
| Class RX Shares* | 5.98 | ||||
| Class Y Shares | 6.58 | ||||
| Class R5 Shares** | 6.46 | ||||
| Class R6 Shares*** | 6.29 | ||||
| S&P 500 Index‚ (Broad Market Index) | 16.00 | ||||
| Custom Balanced-Risk Allocation Broad Indexn (Style-Specific Index) | 11.40 | ||||
| Custom Balanced-Risk Retirement Now Indexn (Style-Specific Index) | 6.73 | ||||
| Lipper Mixed-Asset Target Allocation Conservative Funds Index¨ (Peer Group Index) | 8.92 |
Source(s): ‚Invesco, S&P-Dow Jones via FactSet Research Systems Inc.; nInvesco, Lipper Inc.; ¨Lipper Inc.
| * | Effective September 24, 2012, Class A5 shares, Class C5 shares and Class R5 shares were renamed Class AX shares, Class CX shares and Class RX shares, respectively. |
| ** | Effective September 24, 2012, Institutional Class shares were renamed Class R5 shares. |
| *** | Share class incepted during the reporting period. See page 15 for a detailed explanation of Fund performance. |
How we invest
Invesco Balanced-Risk Retirement Now Fund uses a combination of Invesco Balanced-Risk Allocation Fund and affiliated money market funds to provide broad market diversification and execute the Fund’s glide path strategy.
Invesco Balanced-Risk Allocation Fund, which is held by Invesco Balanced-Risk Retirement Now Fund, employs a total return asset allocation strategy that invests in equity, fixed income and commodity markets. The fund uses a long-only,
proprietary risk-balanced investment process that seeks to provide greater capital loss protection than traditional balanced portfolios. It is composed of asset classes that are expected to perform differently during a variety of economic environments, and uses active positioning – a tactical asset allocation strategy – in striving to enhance returns. The fund gains access to the underlying markets in which it invests through the use of derivatives and other financially linked instruments, specifically exchange-traded futures and swap
agreements, that provide leveraged exposure, liquidity and transparency.
The glide path strategy begins 10 years from Invesco Balanced-Risk Retirement Now Fund’s target date. Prior to the implementation of the glide path, the Fund is allocated 100% to Invesco Balanced-Risk Allocation Fund. Upon implementation, the glide path allocation process takes place on a quarterly basis. Each quarter, a percentage of the Fund is moved from Invesco Balanced-Risk Allocation Fund and allocated to the affiliated money market funds. This results in a blend of 60% Invesco Balanced-Risk Allocation Fund and 40% affiliated money market funds at the target date.
In the asset accumulation stage, investors’ concerns include not achieving enough growth to outpace inflation and the possibility that market losses may lead to abandoning their investment program. To address these concerns, Invesco Balanced-Risk Retirement Now Fund seeks to provide asset growth while attempting to provide greater capital loss protection and more consistent returns across all market environments relative to traditional balanced portfolios.
The primary concerns of investors in retirement include preserving purchasing power, combating the effects of inflation and having little or no ability to offset losses with additional contributions. To address these concerns, Invesco Balanced-Risk Retirement Now Fund maintains the real return strategy of 60% Invesco Balanced-Risk Allocation Fund and 40% affiliated money market funds once the target date is achieved.
Market conditions and your Fund
All three asset classes, as well as tactical decisions, produced positive returns for the Fund for the year ended December 31, 2012.
The year began with equities and commodities advancing, driven by improving economic data and continued stimulus
Target Risk Allocation and Notional Asset Weights† | ||||||||||
| By asset class | ||||||||||
| Asset Class* |
| Risk Allocation |
| | % of Total Net Assets as | | ||||
| Equities | 39.03 | % | 22.37 | % | ||||||
| Fixed Income | 26.91 | 51.59 | ||||||||
| Commodities | 30.75 | 18.92 | ||||||||
| Cash | 3.31 | 40.18 | ||||||||
| Total Net Assets | $48.5 million | ||||
| * | Based on the expected market exposure through investments in the underlying funds. |
| ** | Due to the use of leverage, the percentages may not equal 100%. |
The underlying Fund uses commodity-linked derivative investments and enhanced investment techniques such as leverage.
| Fund Nasdaq Symbols | |||||
| Class A Shares | IANAX | ||||
| Class AX Shares | VIRAX | ||||
| Class B Shares | IANBX | ||||
| Class C Shares | IANCX | ||||
| Class CX Shares | VIRCX | ||||
| Class R Shares | IANRX | ||||
| Class RX Shares | VIRRX | ||||
| Class Y Shares | IANYX | ||||
| Class R5 Shares | IANIX | ||||
| Class R6 Shares | IANFX | ||||
| † | Risk contribution is measured as the standard deviation of each asset as a percentage of total portfolio standard deviation. The risk contribution of each underlying asset determines the dollar-weighting of that asset. Standard deviation measures a fund’s range of total returns and fluctuations over a defined period of time. |
4 Invesco Balanced-Risk Retirement Funds
from monetary authorities around the globe. Equity gains were particularly strong in the Japanese and US markets. Heightened tensions between the US and Iran increased the price of oil, while gold declined sharply at the end of February and continued to fall in March. Most bond markets fell during the first quarter on signs of improving economic conditions, reduced economic strains in Europe and declining expectations for further US Treasury bond purchase programs. Contributions from equities and commodities were essentially even, while bonds detracted from Fund performance for the quarter. The Fund’s tactical overweight position to riskier assets proved beneficial.
Effective April 1, 2012, we expanded the underlying funds’ strategic commodity exposure to reduce single-asset risk across the commodity complexes – the result of the Global Asset Allocation team’s ongoing research process.
Over April and May, gains in equities and commodities from earlier in the year were eroded by renewed fears arising from the ongoing European crisis, coupled with weakening economic data in key markets. Commodities were broadly negative, with the exception of select agricultural commodities, on weakening demand and a strengthening dollar. Equities were also notably weaker. Government bonds once again fulfilled their role as safe haven assets as yields contracted in response to the weakness in riskier assets. In April and May, the Fund was negative, with bonds providing the only positive contribution. Nevertheless, the Fund outperformed the Custom Balanced-Risk Retirement Now Index, its style-specific index, as the Fund’s defensive posture provide beneficial in a difficult environment.
In the third quarter, equity, fixed income and commodity markets all posted impressive results. This stood in contrast to the prior months during the “mini-swoon” which saw riskier assets under pressure and bonds as the sole asset class above water. Riskier assets, especially commodities, were able to rally from these depressed levels on expectations for additional monetary easing and hope that Europe would be able to finally make headway on its lingering economic issues. Bond yields spiked twice during the third quarter, but managed to settle down to similar or slightly lower levels than where they stood at the start of the quarter, as markets seesawed between concerns over inflation and continuing weakness in Europe. Commodities were
the primary driver of returns, though all three asset classes produced gains for the Fund for the quarter.
In the fourth quarter, a lift in equities was offset by declines in bonds and commodities. Investors had a host of political issues to navigate, including elections in the US, China and Japan; “fiscal cliff” negotiations in the US; and continuing concerns over European and Chinese economic growth. The performance of equities was the lone bright spot, with Asian markets benefiting most from favorable reaction to political elections. Commodity markets were weighed down by concerns over falling demand and improved crop yields. Bond yields ultimately made their way higher as the market experienced both rallies and sell offs that were fairly range bound. Australia and the UK led the increase in yields.
Please note that our strategy is principally implemented with derivative instruments that include futures and total return swaps. Therefore, all or most of the performance of the strategy, both positive and negative, can be attributed to these instruments. Derivatives can be a more liquid and cost-effective way to gain exposure to asset classes. Additionally, the leverage used in the strategy is inherent in these instruments.
Thank you for your continued commitment to Invesco Balanced-Risk Retirement Now Fund.
The views and opinions expressed in management’s discussion of Fund performance are those of Invesco Advisers, Inc. These views and opinions are subject to change at any time based on factors such as market and economic conditions. These views and opinions may not be relied upon as investment advice or recommendations, or as an offer for a particular security. The information is not a complete analysis of every aspect of any market, country, industry, security or the Fund. Statements of fact are from sources considered reliable, but Invesco Advisers, Inc. makes no representation or warranty as to their completeness or accuracy. Although historical performance is no guarantee of future results, these insights may help you understand our investment management philosophy.
See important Fund and, if applicable, index disclosures later in this report.
 | Mark Ahnrud Chartered Financial Analyst, portfolio manager, is manager of Invesco Balanced-Risk Retirement Now Fund. | |
| He joined Invesco in 2000. Mr. Ahnrud earned a BS in finance and investments from Babson College and an MBA from Duke University Fuqua School of Business. | ||
 | Chris Devine Chartered Financial Analyst, portfolio manager, is manager of Invesco Balanced-Risk Retirement Now Fund. | |
| He joined Invesco in 1998. Mr. Devine earned a BA in economics from Wake Forest University and an MBA from the University of Georgia. | ||
 | Scott Hixon Chartered Financial Analyst, portfolio manager, is manager of Invesco Balanced-Risk Retirement Now Fund. | |
| He joined Invesco in 1994. Mr. Hixon earned a BBA in finance from Georgia Southern University and an MBA in finance from Georgia State University. | ||
 | Christian Ulrich Chartered Financial Analyst, portfolio manager, is manager of Invesco Balanced-Risk Retirement Now Fund. | |
| He joined Invesco in 2000. Mr. Ulrich earned the equivalent of a BBA from the KV Zurich Business School in Zurich, Switzerland. | ||
 | Scott Wolle Chartered Financial Analyst, portfolio manager, is manager of Invesco Balanced-Risk Retirement Now Fund. | |
| He joined Invesco in 1999. Mr. Wolle earned a BS in finance from Virginia Polytechnic Institute and State University and an MBA from Duke University Fuqua School of Business. | ||
Assisted by the Global Asset Allocation Team
5 Invesco Balanced-Risk Retirement Funds
Management’s Discussion of Fund Performance
Performance summary – Invesco Balanced-Risk Retirement 2020 Fund
For the year ended December 31, 2012, Invesco Balanced-Risk Retirement 2020 Fund underperformed the Custom Balanced-Risk Retirement 2020 Index, the Fund’s custom style-specific benchmark. Positive absolute performance from the Fund’s strategic equity, fixed income and commodity exposures, in addition to a positive impact from active positioning, drove results for the reporting period. Most of the Fund’s underperformance occurred in the second half of 2012, when stocks performed very well. In such an environment, the equity-dominant benchmark may outperform the Fund’s risk-balanced approach.
Your Fund’s long-term performance appears later in this report.
Fund vs. Indexes
Total returns, 12/31/11 to 12/31/12, at net asset value (NAV). Performance shown does not include applicable contingent deferred sales charges (CDSC) or front-end sales charges, which would have reduced performance.
| Class A Shares | 9.89 | % | |||
| Class AX Shares* | 9.89 | ||||
| Class B Shares | 8.95 | ||||
| Class C Shares | 8.97 | ||||
| Class CX Shares* | 8.97 | ||||
| Class R Shares | 9.58 | ||||
| Class RX Shares* | 9.58 | ||||
| Class Y Shares | 10.00 | ||||
| Class R5 Shares** | 10.08 | ||||
| Class R6 Shares*** | 10.01 | ||||
| S&P 500 Index‚ (Broad Market Index) | 16.00 | ||||
| Custom Balanced-Risk Allocation Broad Indexn (Style-Specific Index) | 11.40 | ||||
| Custom Balanced-Risk Retirement 2020 Indexn (Style-Specific Index) | 11.30 | ||||
| Lipper Mixed-Asset Target 2020 Funds Index¨ (Peer Group Index) | 12.27 |
Source(s): ‚Invesco, S&P-Dow Jones via FactSet Research Systems Inc.; nInvesco, Lipper Inc.; ¨Lipper Inc.
| * | Effective September 24, 2012, Class A5 shares, Class C5 shares and Class R5 shares were renamed Class AX shares, Class CX shares and Class RX shares, respectively. |
| ** | Effective September 24, 2012, Institutional Class shares were renamed Class R5 shares. |
| *** | Share class incepted during the reporting period. See page 17 for a detailed explanation of Fund performance. |
How we invest
Invesco Balanced-Risk Retirement 2020 Fund uses a combination of Invesco Balanced-Risk Allocation Fund and affiliated money market funds to provide broad market diversification and execute the Fund’s glide path strategy.
Invesco Balanced-Risk Allocation Fund, which is held by Invesco Balanced-Risk Retirement 2020 Fund, employs a total return asset allocation strategy that invests in equity, fixed income and commodity markets. The fund uses
a long-only, proprietary risk-balanced investment process that seeks to provide greater capital loss protection than traditional balanced portfolios. It is composed of asset classes that are expected to perform differently during a variety of economic environments, and uses active positioning – a tactical asset allocation strategy – in striving to enhance returns. The fund gains access to the underlying markets in which it invests through the use of derivatives and other financially linked instruments, specifically exchange-traded futures and swap agreements,
that provide leveraged exposure, liquidity and transparency.
The glide path strategy begins 10 years from Invesco Balanced-Risk Retirement 2020 Fund’s target date. Prior to the implementation of the glide path, the Fund is allocated 100% to Invesco Balanced-Risk Allocation Fund. Upon implementation, the glide path allocation process takes place on a quarterly basis. Each quarter, a percentage of the Fund is moved from Invesco Balanced-Risk Allocation Fund and allocated to the affiliated money market funds. This results in a blend of 60% Invesco Balanced-Risk Allocation Fund and 40% affiliated money market funds at the target date.
In the asset accumulation stage, investors’ concerns include not achieving enough growth to outpace inflation and the possibility that market losses may lead to abandoning their investment program. To address these concerns, Invesco Balanced-Risk Retirement 2020 Fund seeks to provide asset growth while attempting to provide greater capital loss protection and more consistent returns across all market environments relative to traditional balanced portfolios.
For investors in the pre-retirement stage, defined as 10 years away from their target retirement date, a primary concern is holding a significant pool of assets that may be subject to loss should difficult market conditions arise, but without the luxury of time to make up those losses prior to their target retirement date. To address this concern, Invesco Balanced-Risk Retirement 2020 Fund seeks to reduce risk and protect accumulated wealth by transitioning from an accumulation strategy to a real return strategy. This is executed through the glide path migration, which transitions the portfolio from a 100% allocation to Invesco Balanced-Risk Allocation Fund to a portfolio consisting of 60% Invesco Balanced-Risk Allocation Fund and 40% affiliated money market funds over a 10-year period.
Target Risk Allocation and Notional Asset Weights† | ||||||||||
| By asset class | ||||||||||
| Asset Class* |
| Risk Allocation |
| | % of Total Net Assets as | | ||||
| Equities | 40.14 | % | 33.29 | % | ||||||
| Fixed Income | 27.67 | 76.77 | ||||||||
| Commodities | 31.62 | 28.15 | ||||||||
| Cash | 0.57 | 10.06 | ||||||||
| Total Net Assets | $99.0 million | ||||
| * | Based on the expected market exposure through investments in the underlying funds. |
| ** | Due to the use of leverage, the percentages may not equal 100%. |
The underlying Fund uses commodity-linked derivative investments and enhanced investment techniques such as leverage.
| Fund Nasdaq Symbols | |||||
| Class A Shares | AFTAX | ||||
| Class AX Shares | VRCAX | ||||
| Class B Shares | AFTBX | ||||
| Class C Shares | AFTCX | ||||
| Class CX Shares | VRCCX | ||||
| Class R Shares | ATFRX | ||||
| Class RX Shares | VRCRX | ||||
| Class Y Shares | AFTYX | ||||
| Class R5 Shares | AFTSX | ||||
| Class R6 Shares | VRCFX | ||||
| † | Risk contribution is measured as the standard deviation of each asset as a percentage of total portfolio standard deviation. The risk contribution of each underlying asset determines the dollar-weighting of that asset. Standard deviation measures a fund’s range of total returns and fluctuations over a defined period of time. |
6 Invesco Balanced-Risk Retirement Funds
Market conditions and your Fund
All three asset classes, as well as tactical decisions, produced positive returns for the Fund for the year ended December 31, 2012.
The year began with equities and commodities advancing, driven by improving economic data and continued stimulus from monetary authorities around the globe. Equity gains were particularly strong in the Japanese and US markets. Heightened tensions between the US and Iran increased the price of oil, while gold declined sharply at the end of February and continued to fall in March. Most bond markets fell during the first quarter on signs of improving economic conditions, reduced economic strains in Europe and declining expectations for further US Treasury bond purchase programs. Contributions from equities and commodities were essentially even, while bonds detracted from Fund performance for the quarter. The Fund’s tactical overweight position to riskier assets proved beneficial.
Effective April 1, 2012, we expanded the underlying funds’ strategic commodity exposure to reduce single-asset risk across the commodity complexes – the result of the Global Asset Allocation team’s ongoing research process.
Over April and May, gains in equities and commodities from earlier in the year were eroded by renewed fears arising from the ongoing European crisis, coupled with weakening economic data in key markets. Commodities were broadly negative, with the exception of select agricultural commodities, on weakening demand and a strengthening dollar. Equities were also notably weaker. Government bonds once again fulfilled their role as safe haven assets as yields contracted in response to the weakness in riskier assets. In April and May, the Fund was negative, with bonds providing the only positive contribution. Nevertheless, the Fund outperformed the Custom Balanced-Risk Retirement 2020 Index, its style-specific index, as the Fund’s defensive posture provide beneficial in a difficult environment.
In the third quarter, equity, fixed income and commodity markets all posted impressive results. This stood in contrast to the prior months during the “mini-swoon” which saw riskier assets under pressure and bonds as the sole asset class above water. Riskier assets, especially commodities, were able to rally from these depressed levels on expectations for additional monetary easing and hope that Europe would be able to finally make headway on its lingering economic
issues. Bond yields spiked twice during the third quarter, but managed to settle down to similar or slightly lower levels than where they stood at the start of the quarter, as markets seesawed between concerns over inflation and continuing weakness in Europe. Commodities were the primary driver of returns, though all three asset classes produced gains for the Fund for the quarter.
In the fourth quarter, a lift in equities was offset by declines in bonds and commodities. Investors had a host of political issues to navigate, including elections in the US, China and Japan; “fiscal cliff” negotiations in the US; and continuing concerns over European and Chinese economic growth. The performance of equities was the lone bright spot, with Asian markets benefiting most from favorable reaction to political elections. Commodity markets were weighed down by concerns over falling demand and improved crop yields. Bond yields ultimately made their way higher as the market experienced both rallies and sell offs that were fairly range bound. Australia and the UK led the increase in yields.
Please note that our strategy is principally implemented with derivative instruments that include futures and total return swaps. Therefore, all or most of the performance of the strategy, both positive and negative, can be attributed to these instruments. Derivatives can be a more liquid and cost-effective way to gain exposure to asset classes. Additionally, the leverage used in the strategy is inherent in these instruments.
Thank you for your continued commitment to Invesco Balanced-Risk Retirement 2020 Fund.
The views and opinions expressed in management’s discussion of Fund performance are those of Invesco Advisers, Inc. These views and opinions are subject to change at any time based on factors such as market and economic conditions. These views and opinions may not be relied upon as investment advice or recommendations, or as an offer for a particular security. The information is not a complete analysis of every aspect of any market, country, industry, security or the Fund. Statements of fact are from sources considered reliable, but Invesco Advisers, Inc. makes no representation or warranty as to their completeness or accuracy. Although historical performance is no guarantee of future results, these insights may help you understand our investment management philosophy.
See important Fund and, if applicable, index disclosures later in this report.
| Mark Ahnrud Chartered Financial Analyst, portfolio manager, is manager of Invesco Balanced-Risk Retirement 2020 Fund. | |
| He joined Invesco in 2000. Mr. Ahnrud earned a BS in finance and investments from Babson College and an MBA from Duke University Fuqua School of Business. | ||
| Chris Devine Chartered Financial Analyst, portfolio manager, is manager of Invesco Balanced-Risk Retirement 2020 Fund. | |
| He joined Invesco in 1998. Mr. Devine earned a BA in economics from Wake Forest University and an MBA from the University of Georgia. | ||
| Scott Hixon Chartered Financial Analyst, portfolio manager, is manager of Invesco Balanced-Risk Retirement 2020 Fund. | |
| He joined Invesco in 1994. Mr. Hixon earned a BBA in finance from Georgia Southern University and an MBA in finance from Georgia State University. | ||
| Christian Ulrich Chartered Financial Analyst, portfolio manager, is manager of Invesco Balanced-Risk Retirement 2020 Fund. | |
| He joined Invesco in 2000. Mr. Ulrich earned the equivalent of a BBA from the KV Zurich Business School in Zurich, Switzerland. | ||
| Scott Wolle Chartered Financial Analyst, portfolio manager, is manager of Invesco Balanced-Risk Retirement 2020 Fund. | |
| He joined Invesco in 1999. Mr. Wolle earned a BS in finance from Virginia Polytechnic Institute and State University and an MBA from Duke University Fuqua School of Business. | ||
Assisted by the Global Asset Allocation Team
7 Invesco Balanced-Risk Retirement Funds
Management’s Discussion of Fund Performance
Performance summary – Invesco Balanced-Risk Retirement 2030 Fund
For the year ended December 31, 2012, Invesco Balanced-Risk Retirement 2030 Fund underperformed the Custom Balanced-Risk Retirement 2030 Index, the Fund’s custom style-specific benchmark. Positive absolute performance from the Fund’s strategic equity, fixed income and commodity exposures, in addition to a positive impact from active positioning, drove results for the reporting period. Most of the Fund’s underperformance occurred in the second half of 2012, when stocks performed very well. In such an environment, the equity-dominant benchmark may outperform the Fund’s risk-balanced approach.
Your Fund’s long-term performance appears later in this report.
Fund vs. Indexes
Total returns, 12/31/11 to 12/31/12, at net asset value (NAV). Performance shown does not include applicable contingent deferred sales charges (CDSC) or front-end sales charges, which would have reduced performance.
| Class A Shares | 10.55 | % | |||
| Class AX Shares* | 10.55 | ||||
| Class B Shares | 9.70 | ||||
| Class C Shares | 9.71 | ||||
| Class CX Shares* | 9.71 | ||||
| Class R Shares | 10.25 | ||||
| Class RX Shares* | 10.26 | ||||
| Class Y Shares | 10.88 | ||||
| Class R5 Shares** | 10.86 | ||||
| Class R6 Shares*** | 10.66 | ||||
| S&P 500 Index‚ (Broad Market Index) | 16.00 | ||||
| Custom Balanced-Risk Allocation Broad Indexn (Style-Specific Index) | 11.40 | ||||
| Custom Balanced-Risk Retirement 2030 Indexn (Style-Specific Index) | 11.30 | ||||
| Lipper Mixed-Asset Target 2030 Funds Index¨ (Peer Group Index) | 14.07 |
Source(s): ‚Invesco, S&P-Dow Jones via FactSet Research Systems Inc.; nInvesco, Lipper Inc.; ¨Lipper Inc.
| * | Effective September 24, 2012, Class A5 shares, Class C5 shares and Class R5 shares were renamed Class AX shares, Class CX shares and Class RX shares, respectively. |
| ** | Effective September 24, 2012, Institutional Class shares were renamed Class R5 shares. |
| *** | Share class incepted during the reporting period. See page 19 for a detailed explanation of Fund performance. |
How we invest
Invesco Balanced-Risk Retirement 2030 Fund uses a combination of Invesco Balanced-Risk Allocation Fund and affiliated money market funds to provide broad market diversification and execute the Fund’s glide path strategy.
Invesco Balanced-Risk Allocation Fund, which is held by Invesco Balanced-Risk Retirement 2030 Fund, employs a total return asset allocation strategy that invests in equity, fixed income and commodity markets. The fund uses a long-only,
proprietary risk-balanced investment process that seeks to provide greater capital loss protection than traditional balanced portfolios. It is composed of asset classes that are expected to perform differently during a variety of economic environments, and uses active positioning – a tactical asset allocation strategy – in striving to enhance returns. The fund gains access to the underlying markets in which it invests through the use of derivatives and other financially linked instruments, specifically exchange-traded futures and swap
agreements, that provide leveraged exposure, liquidity and transparency.
The glide path strategy begins 10 years from Invesco Balanced-Risk Retirement 2030 Fund’s target date. Prior to the implementation of the glide path, the Fund is allocated 100% to Invesco Balanced-Risk Allocation Fund. Upon implementation, the glide path allocation process takes place on a quarterly basis. Each quarter, a percentage of the Fund is moved from Invesco Balanced-Risk Allocation Fund and allocated to the affiliated money market funds. This results in a blend of 60% Invesco Balanced-Risk Allocation Fund and 40% affiliated money market funds at the target date.
In the asset accumulation stage, investors’ concerns include not achieving enough growth to outpace inflation and the possibility that market losses may lead to abandoning their investment program. To address these concerns, Invesco Balanced-Risk Retirement 2030 Fund seeks to provide asset growth while attempting to provide greater capital loss protection and more consistent returns across all market environments relative to traditional balanced portfolios.
For investors in the pre-retirement stage, defined as 10 years away from their target retirement date, a primary concern is holding a significant pool of assets that may be subject to loss should difficult market conditions arise, but without the luxury of time to make up those losses prior to their target retirement date. To address this concern, Invesco Balanced-Risk Retirement 2030 Fund seeks to reduce risk and protect accumulated wealth by transitioning from an accumulation strategy to a real return strategy. This is executed through the glide path migration, which transitions the portfolio from a 100% allocation to Invesco Balanced-Risk Allocation Fund to a portfolio consisting of 60% Invesco Balanced-Risk Allocation Fund and 40% affiliated money market funds over a 10-year period.
Target Risk Allocation and Notional Asset Weights† | ||||||||||
| By asset class | ||||||||||
| Asset Class* |
| Risk Allocation |
| | % of Total Net Assets as | | ||||
| Equities | 40.34 | % | 37.20 | % | ||||||
| Fixed Income | 27.81 | 85.78 | ||||||||
| Commodities | 31.79 | 31.45 | ||||||||
| Cash | 0.06 | 1.16 | ||||||||
| Total Net Assets | $101.0 million | ||||
| * | Based on the expected market exposure through investments in the underlying funds. |
| ** | Due to the use of leverage, the percentages may not equal 100%. |
The underlying Fund uses commodity-linked derivative investments and enhanced investment techniques such as leverage.
| Fund Nasdaq Symbols | |||||
| Class A Shares | TNAAX | ||||
| Class AX Shares | VREAX | ||||
| Class B Shares | TNABX | ||||
| Class C Shares | TNACX | ||||
| Class CX Shares | VRECX | ||||
| Class R Shares | TNARX | ||||
| Class RX Shares | VRERX | ||||
| Class Y Shares | TNAYX | ||||
| Class R5 Shares | TNAIX | ||||
| Class R6 Shares | TNAFX | ||||
| † | Risk contribution is measured as the standard deviation of each asset as a percentage of total portfolio standard deviation. The risk contribution of each underlying asset determines the dollar-weighting of that asset. Standard deviation measures a fund’s range of total returns and fluctuations over a defined period of time. |
8 Invesco Balanced-Risk Retirement Funds
Market conditions and your Fund
All three asset classes, as well as tactical decisions, produced positive returns for the Fund for the year ended December 31, 2012.
The year began with equities and commodities advancing, driven by improving economic data and continued stimulus from monetary authorities around the globe. Equity gains were particularly strong in the Japanese and US markets. Heightened tensions between the US and Iran increased the price of oil, while gold declined sharply at the end of February and continued to fall in March. Most bond markets fell during the first quarter on signs of improving economic conditions, reduced economic strains in Europe and declining expectations for further US Treasury bond purchase programs. Contributions from equities and commodities were essentially even, while bonds detracted from Fund performance for the quarter. The Fund’s tactical overweight position to riskier assets proved beneficial.
Effective April 1, 2012, we expanded the underlying funds’ strategic commodity exposure to reduce single-asset risk across the commodity complexes – the result of the Global Asset Allocation team’s ongoing research process.
Over April and May, gains in equities and commodities from earlier in the year were eroded by renewed fears arising from the ongoing European crisis, coupled with weakening economic data in key markets. Commodities were broadly negative, with the exception of select agricultural commodities, on weakening demand and a strengthening dollar. Equities were also notably weaker. Government bonds once again fulfilled their role as safe haven assets as yields contracted in response to the weakness in riskier assets. In April and May, the Fund was negative, with bonds providing the only positive contribution. Nevertheless, the Fund outperformed the Custom Balanced-Risk Retirement 2030 Index, its style-specific index, as the Fund’s defensive posture provide beneficial in a difficult environment.
In the third quarter, equity, fixed income and commodity markets all posted impressive results. This stood in contrast to the prior months during the “mini-swoon” which saw riskier assets under pressure and bonds as the sole asset class above water. Riskier assets, especially commodities, were able to rally from these depressed levels on expectations for additional monetary easing and hope that Europe would be able to finally make headway on its lingering economic
issues. Bond yields spiked twice during the third quarter, but managed to settle down to similar or slightly lower levels than where they stood at the start of the quarter, as markets seesawed between concerns over inflation and continuing weakness in Europe. Commodities were the primary driver of returns, though all three asset classes produced gains for the Fund for the quarter.
In the fourth quarter, a lift in equities was offset by declines in bonds and commodities. Investors had a host of political issues to navigate, including elections in the US, China and Japan; “fiscal cliff” negotiations in the US; and continuing concerns over European and Chinese economic growth. The performance of equities was the lone bright spot, with Asian markets benefiting most from favorable reaction to political elections. Commodity markets were weighed down by concerns over falling demand and improved crop yields. Bond yields ultimately made their way higher as the market experienced both rallies and sell offs that were fairly range bound. Australia and the UK led the increase in yields.
Please note that our strategy is principally implemented with derivative instruments that include futures and total return swaps. Therefore, all or most of the performance of the strategy, both positive and negative, can be attributed to these instruments. Derivatives can be a more liquid and cost-effective way to gain exposure to asset classes. Additionally, the leverage used in the strategy is inherent in these instruments.
Thank you for your continued commitment to Invesco Balanced-Risk Retirement 2030 Fund.
The views and opinions expressed in management’s discussion of Fund performance are those of Invesco Advisers, Inc. These views and opinions are subject to change at any time based on factors such as market and economic conditions. These views and opinions may not be relied upon as investment advice or recommendations, or as an offer for a particular security. The information is not a complete analysis of every aspect of any market, country, industry, security or the Fund. Statements of fact are from sources considered reliable, but Invesco Advisers, Inc. makes no representation or warranty as to their completeness or accuracy. Although historical performance is no guarantee of future results, these insights may help you understand our investment management philosophy.
See important Fund and, if applicable, index disclosures later in this report.
| Mark Ahnrud Chartered Financial Analyst, portfolio manager, is manager of Invesco Balanced-Risk Retirement 2030 Fund. | |
| He joined Invesco in 2000. Mr. Ahnrud earned a BS in finance and investments from Babson College and an MBA from Duke University Fuqua School of Business. | ||
| Chris Devine Chartered Financial Analyst, portfolio manager, is manager of Invesco Balanced-Risk Retirement 2030 Fund. | |
| He joined Invesco in 1998. Mr. Devine earned a BA in economics from Wake Forest University and an MBA from the University of Georgia. | ||
| Scott Hixon Chartered Financial Analyst, portfolio manager, is manager of Invesco Balanced-Risk Retirement 2030 Fund. | |
| He joined Invesco in 1994. Mr. Hixon earned a BBA in finance from Georgia Southern University and an MBA in finance from Georgia State University. | ||
| Christian Ulrich Chartered Financial Analyst, portfolio manager, is manager of Invesco Balanced-Risk Retirement 2030 Fund. | |
| He joined Invesco in 2000. Mr. Ulrich earned the equivalent of a BBA from the KV Zurich Business School in Zurich, Switzerland. | ||
| Scott Wolle Chartered Financial Analyst, portfolio manager, is manager of Invesco Balanced-Risk Retirement 2030 Fund. | |
| He joined Invesco in 1999. Mr. Wolle earned a BS in finance from Virginia Polytechnic Institute and State University and an MBA from Duke University Fuqua School of Business. | ||
Assisted by the Global Asset Allocation Team
9 Invesco Balanced-Risk Retirement Funds
Management’s Discussion of Fund Performance
Performance summary – Invesco Balanced-Risk Retirement 2040 Fund
For the year ended December 31, 2012, Invesco Balanced-Risk Retirement 2040 Fund underperformed the Custom Balanced-Risk Retirement 2040 Index, the Fund’s custom style-specific benchmark. Positive absolute performance from the Fund’s strategic equity, fixed income and commodity exposures, in addition to a positive impact from active positioning, drove results for the reporting period. Most of the Fund’s underperformance occurred in the second half of 2012, when stocks performed very well. In such an environment, the equity-dominant benchmark may outperform the Fund’s risk-balanced approach.
Your Fund’s long-term performance appears later in this report.
Fund vs. Indexes
Total returns, 12/31/11 to 12/31/12, at net asset value (NAV). Performance shown does not include applicable contingent deferred sales charges (CDSC) or front-end sales charges, which would have reduced performance.
| Class A Shares | 10.38 | % | |||
| Class AX Shares* | 10.51 | ||||
| Class B Shares | 9.79 | ||||
| Class C Shares | 9.81 | ||||
| Class CX Shares* | 9.68 | ||||
| Class R Shares | 10.33 | ||||
| Class RX Shares* | 10.19 | ||||
| Class Y Shares | 10.83 | ||||
| Class R5 Shares** | 10.69 | ||||
| Class R6 Shares*** | 10.59 | ||||
| S&P 500 Index‚ (Broad Market Index) | 16.00 | ||||
| Custom Balanced-Risk Allocation Broad Indexn (Style-Specific Index) | 11.40 | ||||
| Custom Balanced-Risk Retirement 2040 Indexn (Style-Specific Index) | 11.30 | ||||
| Lipper Mixed-Asset Target 2040 Funds Index¨ (Peer Group Index) | 15.24 |
Source(s): ‚Invesco, S&P-Dow Jones via FactSet Research Systems Inc.; nInvesco, Lipper Inc.; ¨Lipper Inc.
| * | Effective September 24, 2012, Class A5 shares, Class C5 shares and Class R5 shares were renamed Class AX shares, Class CX shares and Class RX shares, respectively. |
| ** | Effective September 24, 2012, Institutional Class shares were renamed Class R5 shares. |
| *** | Share class incepted during the reporting period. See page 21 for a detailed explanation of Fund performance. |
How we invest
Invesco Balanced-Risk Retirement 2040 Fund uses a combination of Invesco Balanced-Risk Allocation Fund and affiliated money market funds to provide broad market diversification and execute the Fund’s glide path strategy.
Invesco Balanced-Risk Allocation Fund, which is held by Invesco Balanced-Risk Retirement 2040 Fund, employs a total return asset allocation strategy that invests in equity, fixed income and commodity markets. The fund uses
a long-only, proprietary risk-balanced investment process that seeks to provide greater capital loss protection than traditional balanced portfolios. It is composed of asset classes that are expected to perform differently during a variety of economic environments, and uses active positioning – a tactical asset allocation strategy – in striving to enhance returns. The fund gains access to the underlying markets in which it invests through the use of derivatives and other financially linked instruments, specifically exchange-traded futures and
swap agreements, that provide leveraged exposure, liquidity and transparency.
The glide path strategy begins 10 years from Invesco Balanced-Risk Retirement 2040 Fund’s target date. Prior to the implementation of the glide path, the Fund is allocated 100% to Invesco Balanced-Risk Allocation Fund. Upon implementation, the glide path allocation process takes place on a quarterly basis. Each quarter, a percentage of the Fund is moved from Invesco Balanced-Risk Allocation Fund and allocated to the affiliated money market funds. This results in a blend of 60% Invesco Balanced-Risk Allocation Fund and 40% affiliated money market funds at the target date.
In the asset accumulation stage, investors’ concerns include not achieving enough growth to outpace inflation and the possibility that market losses may lead to abandoning their investment program. To address these concerns, Invesco Balanced-Risk Retirement 2040 Fund seeks to provide asset growth while attempting to provide greater capital loss protection and more consistent returns across all market environments relative to traditional balanced portfolios.
For investors in the pre-retirement stage, defined as 10 years away from their target retirement date, a primary concern is holding a significant pool of assets that may be subject to loss should difficult market conditions arise, but without the luxury of time to make up those losses prior to their target retirement date. To address this concern, Invesco Balanced-Risk Retirement 2040 Fund seeks to reduce risk and protect accumulated wealth by transitioning from an accumulation strategy to a real return strategy. This is executed through the glide path migration, which transitions the portfolio from a 100% allocation to Invesco Balanced-Risk Allocation Fund to a portfolio consisting of 60% Invesco Balanced-Risk Allocation Fund and 40% affiliated money market funds over a 10-year period.
Target Risk Allocation and Notional Asset Weights† | ||||||||||
| By asset class | ||||||||||
| Asset Class* |
| Risk Allocation |
| | % of Total Net Assets as | | ||||
| Equities | 40.35 | % | 36.78 | % | ||||||
| Fixed Income | 27.82 | 84.81 | ||||||||
| Commodities | 31.80 | 31.10 | ||||||||
| Cash | 0.03 | 0.64 | ||||||||
| Total Net Assets | $57.7 million | ||||
| * | Based on the expected market exposure through investments in the underlying funds. |
| ** | Due to the use of leverage, the percentages may not equal 100%. |
The underlying Fund uses commodity-linked derivative investments and enhanced investment techniques such as leverage.
| Fund Nasdaq Symbols | |||||
| Class A Shares | TNDAX | ||||
| Class AX Shares | VRGAX | ||||
| Class B Shares | TNDBX | ||||
| Class C Shares | TNDCX | ||||
| Class CX Shares | VRGCX | ||||
| Class R Shares | TNDRX | ||||
| Class RX Shares | VRGRX | ||||
| Class Y Shares | TNDYX | ||||
| Class R5 Shares | TNDIX | ||||
| Class R6 Shares | TNDFX | ||||
| † | Risk contribution is measured as the standard deviation of each asset as a percentage of total portfolio standard deviation. The risk contribution of each underlying asset determines the dollar-weighting of that asset. Standard deviation measures a fund’s range of total returns and fluctuations over a defined period of time. |
10 Invesco Balanced-Risk Retirement Funds
Market conditions and your Fund
All three asset classes, as well as tactical decisions, produced positive returns for the Fund for the year ended December 31, 2012.
The year began with equities and commodities advancing, driven by improving economic data and continued stimulus from monetary authorities around the globe. Equity gains were particularly strong in the Japanese and US markets. Heightened tensions between the US and Iran increased the price of oil, while gold declined sharply at the end of February and continued to fall in March. Most bond markets fell during the first quarter on signs of improving economic conditions, reduced economic strains in Europe and declining expectations for further US Treasury bond purchase programs. Contributions from equities and commodities were essentially even, while bonds detracted from Fund performance for the quarter. The Fund’s tactical overweight position to riskier assets proved beneficial.
Effective April 1, 2012, we expanded the underlying funds’ strategic commodity exposure to reduce single-asset risk across the commodity complexes – the result of the Global Asset Allocation team’s ongoing research process.
Over April and May, gains in equities and commodities from earlier in the year were eroded by renewed fears arising from the ongoing European crisis, coupled with weakening economic data in key markets. Commodities were broadly negative, with the exception of select agricultural commodities, on weakening demand and a strengthening dollar. Equities were also notably weaker. Government bonds once again fulfilled their role as safe haven assets as yields contracted in response to the weakness in riskier assets. In April and May, the Fund was negative, with bonds providing the only positive contribution. Nevertheless, the Fund outperformed the Custom Balanced-Risk Retirement 2040 Index, its style-specific index, as the Fund’s defensive posture provide beneficial in a difficult environment.
In the third quarter, equity, fixed income and commodity markets all posted impressive results. This stood in contrast to the prior months during the “mini-swoon” which saw riskier assets under pressure and bonds as the sole asset class above water. Riskier assets, especially commodities, were able to rally from these depressed levels on expectations for additional monetary easing and hope that Europe would be able to finally make headway on its lingering economic
issues. Bond yields spiked twice during the third quarter, but managed to settle down to similar or slightly lower levels than where they stood at the start of the quarter, as markets seesawed between concerns over inflation and continuing weakness in Europe. Commodities were the primary driver of returns, though all three asset classes produced gains for the Fund for the quarter.
In the fourth quarter, a lift in equities was offset by declines in bonds and commodities. Investors had a host of political issues to navigate, including elections in the US, China and Japan; “fiscal cliff” negotiations in the US; and continuing concerns over European and Chinese economic growth. The performance of equities was the lone bright spot, with Asian markets benefiting most from favorable reaction to political elections. Commodity markets were weighed down by concerns over falling demand and improved crop yields. Bond yields ultimately made their way higher as the market experienced both rallies and sell offs that were fairly range bound. Australia and the UK led the increase in yields.
Please note that our strategy is principally implemented with derivative instruments that include futures and total return swaps. Therefore, all or most of the performance of the strategy, both positive and negative, can be attributed to these instruments. Derivatives can be a more liquid and cost-effective way to gain exposure to asset classes. Additionally, the leverage used in the strategy is inherent in these instruments.
Thank you for your continued commitment to Invesco Balanced-Risk Retirement 2040 Fund.
The views and opinions expressed in management’s discussion of Fund performance are those of Invesco Advisers, Inc. These views and opinions are subject to change at any time based on factors such as market and economic conditions. These views and opinions may not be relied upon as investment advice or recommendations, or as an offer for a particular security. The information is not a complete analysis of every aspect of any market, country, industry, security or the Fund. Statements of fact are from sources considered reliable, but Invesco Advisers, Inc. makes no representation or warranty as to their completeness or accuracy. Although historical performance is no guarantee of future results, these insights may help you understand our investment management philosophy.
See important Fund and, if applicable, index disclosures later in this report.
| Mark Ahnrud Chartered Financial Analyst, portfolio manager, is manager of Invesco Balanced-Risk Retirement 2040 Fund. | |
| He joined Invesco in 2000. Mr. Ahnrud earned a BS in finance and investments from Babson College and an MBA from Duke University Fuqua School of Business. | ||
| Chris Devine Chartered Financial Analyst, portfolio manager, is manager of Invesco Balanced-Risk Retirement 2040 Fund. | |
| He joined Invesco in 1998. Mr. Devine earned a BA in economics from Wake Forest University and an MBA from the University of Georgia. | ||
| Scott Hixon Chartered Financial Analyst, portfolio manager, is manager of Invesco Balanced-Risk Retirement 2040 Fund. | |
| He joined Invesco in 1994. Mr. Hixon earned a BBA in finance from Georgia Southern University and an MBA in finance from Georgia State University. | ||
| Christian Ulrich Chartered Financial Analyst, portfolio manager, is manager of Invesco Balanced-Risk Retirement 2040 Fund. | |
| He joined Invesco in 2000. Mr. Ulrich earned the equivalent of a BBA from the KV Zurich Business School in Zurich, Switzerland. | ||
| Scott Wolle Chartered Financial Analyst, portfolio manager, is manager of Invesco Balanced-Risk Retirement 2040 Fund. | |
| He joined Invesco in 1999. Mr. Wolle earned a BS in finance from Virginia Polytechnic Institute and State University and an MBA from Duke University Fuqua School of Business. | ||
Assisted by the Global Asset Allocation Team
11 Invesco Balanced-Risk Retirement Funds
Management’s Discussion of Fund Performance
Performance summary – Invesco Balanced-Risk Retirement 2050 Fund
For the year ended December 31, 2012, Invesco Balanced-Risk Retirement 2050 Fund underperformed the Custom Balanced-Risk Retirement 2050 Index, the Fund’s custom style-specific benchmark. Positive absolute performance from the Fund’s strategic equity, fixed income and commodity exposures, in addition to a positive impact from active positioning, drove results for the reporting period. Most of the Fund’s underperformance occurred in the second half of 2012, when stocks performed very well. In such an environment, the equity-dominant benchmark may outperform the Fund’s risk-balanced approach.
Your Fund’s long-term performance appears later in this report.
Fund vs. Indexes
Total returns, 12/31/11 to 12/31/12, at net asset value (NAV). Performance shown does not include applicable contingent deferred sales charges (CDSC) or front-end sales charges, which would have reduced performance.
| Class A Shares | 10.47 | % | |||
| Class AX Shares* | 10.59 | ||||
| Class B Shares | 9.68 | ||||
| Class C Shares | 9.66 | ||||
| Class CX Shares* | 9.67 | ||||
| Class R Shares | 10.17 | ||||
| Class RX Shares* | 10.30 | ||||
| Class Y Shares | 10.68 | ||||
| Class R5 Shares** | 10.80 | ||||
| Class R6 Shares*** | 10.58 | ||||
| S&P 500 Index‚ (Broad Market Index) | 16.00 | ||||
| Custom Balanced-Risk Allocation Broad Indexn (Style-Specific Index) | 11.40 | ||||
| Custom Balanced-Risk Retirement 2050 Indexn (Style-Specific Index) | 11.30 | ||||
| Lipper Mixed-Asset Target 2050+ Funds Classification Average¨ (Peer Group) | 15.21 |
Source(s): ‚Invesco, S&P-Dow Jones via FactSet Research Systems Inc.; nInvesco, Lipper Inc.; ¨Lipper Inc.
| * | Effective September 24, 2012, Class A5 shares, Class C5 shares and Class R5 shares were renamed Class AX shares, Class CX shares and Class RX shares, respectively. |
| ** | Effective September 24, 2012, Institutional Class shares were renamed Class R5 shares. |
| *** | Share class incepted during the reporting period. See page 23 for a detailed explanation of Fund performance. |
How we invest
Invesco Balanced-Risk Retirement 2050 Fund uses a combination of Invesco Balanced-Risk Allocation Fund and affiliated money market funds to provide broad market diversification and execute the Fund’s glide path strategy.
Invesco Balanced-Risk Allocation Fund, which is held by Invesco Balanced-Risk Retirement 2050 Fund, employs a total return asset allocation strategy that invests in equity, fixed income and commodity markets. The fund uses
a long-only, proprietary risk-balanced investment process that seeks to provide greater capital loss protection than traditional balanced portfolios. It is composed of asset classes that are expected to perform differently during a variety of economic environments, and uses active positioning – a tactical asset allocation strategy – in striving to enhance returns. The fund gains access to the underlying markets in which it invests through the use of derivatives and other financially linked instruments, specifically exchange-traded futures and
swap agreements, that provide leveraged exposure, liquidity and transparency.
The glide path strategy begins 10 years from Invesco Balanced-Risk Retirement 2050 Fund’s target date. Prior to the implementation of the glide path, the Fund is allocated 100% to Invesco Balanced-Risk Allocation Fund. Upon implementation, the glide path allocation process takes place on a quarterly basis. Each quarter, a percentage of the Fund is moved from Invesco Balanced-Risk Allocation Fund and allocated to the affiliated money market funds. This results in a blend of 60% Invesco Balanced-Risk Allocation Fund and 40% affiliated money market funds at the target date.
In the asset accumulation stage, investors’ concerns include not achieving enough growth to outpace inflation and the possibility that market losses may lead to abandoning their investment program. To address these concerns, Invesco Balanced-Risk Retirement 2050 Fund seeks to provide asset growth while attempting to provide greater capital loss protection and more consistent returns across all market environments relative to traditional balanced portfolios.
For investors in the pre-retirement stage, defined as 10 years away from their target retirement date, a primary concern is holding a significant pool of assets that may be subject to loss should difficult market conditions arise, but without the luxury of time to make up those losses prior to their target retirement date. To address this concern, Invesco Balanced-Risk Retirement 2050 Fund seeks to reduce risk and protect accumulated wealth by transitioning from an accumulation strategy to a real return strategy. This is executed through the glide path migration, which transitions the portfolio from a 100% allocation to Invesco Balanced-Risk Allocation Fund to a portfolio consisting of 60% Invesco Balanced-Risk Allocation Fund and 40% affiliated money market funds over a 10-year period.
Target Risk Allocation and Notional Asset Weights† | ||||||||||
| By asset class | ||||||||||
| Asset Class* |
| Risk Allocation |
| | % of Total Net Assets as | | ||||
| Equities | 40.34 | % | 37.24 | % | ||||||
| Fixed Income | 27.81 | 85.88 | ||||||||
| Commodities | 31.79 | 31.49 | ||||||||
| Cash | 0.06 | 1.08 | ||||||||
| Total Net Assets | $29.9 million | ||||
| * | Based on the expected market exposure through investments in the underlying funds. |
| ** | Due to the use of leverage, the percentages may not equal 100%. |
The underlying Fund uses commodity-linked derivative investments and enhanced investment techniques such as leverage.
| Fund Nasdaq Symbols | |||||
| Class A Shares | TNEAX | ||||
| Class AX Shares | VRIAX | ||||
| Class B Shares | TNEBX | ||||
| Class C Shares | TNECX | ||||
| Class CX Shares | VRICX | ||||
| Class R Shares | TNERX | ||||
| Class RX Shares | VRIRX | ||||
| Class Y Shares | TNEYX | ||||
| Class R5 Shares | TNEIX | ||||
| Class R6 Shares | TNEFX | ||||
| † | Risk contribution is measured as the standard deviation of each asset as a percentage of total portfolio standard deviation. The risk contribution of each underlying asset determines the dollar-weighting of that asset. Standard deviation measures a fund’s range of total returns and fluctuations over a defined period of time. |
12 Invesco Balanced-Risk Retirement Funds
Market conditions and your Fund
All three asset classes, as well as tactical decisions, produced positive returns for the Fund for the year ended December 31, 2012.
The year began with equities and commodities advancing, driven by improving economic data and continued stimulus from monetary authorities around the globe. Equity gains were particularly strong in the Japanese and US markets. Heightened tensions between the US and Iran increased the price of oil, while gold declined sharply at the end of February and continued to fall in March. Most bond markets fell during the first quarter on signs of improving economic conditions, reduced economic strains in Europe and declining expectations for further US Treasury bond purchase programs. Contributions from equities and commodities were essentially even, while bonds detracted from Fund performance for the quarter. The Fund’s tactical overweight position to riskier assets proved beneficial.
Effective April 1, 2012, we expanded the underlying funds’ strategic commodity exposure to reduce single-asset risk across the commodity complexes – the result of the Global Asset Allocation team’s ongoing research process.
Over April and May, gains in equities and commodities from earlier in the year were eroded by renewed fears arising from the ongoing European crisis, coupled with weakening economic data in key markets. Commodities were broadly negative, with the exception of select agricultural commodities, on weakening demand and a strengthening dollar. Equities were also notably weaker. Government bonds once again fulfilled their role as safe haven assets as yields contracted in response to the weakness in riskier assets. In April and May, the Fund was negative, with bonds providing the only positive contribution. Nevertheless, the Fund outperformed the Custom Balanced-Risk Retirement 2050 Index, its style-specific index, as the Fund’s defensive posture provide beneficial in a difficult environment.
In the third quarter, equity, fixed income and commodity markets all posted impressive results. This stood in contrast to the prior months during the “mini-swoon” which saw riskier assets under pressure and bonds as the sole asset class above water. Riskier assets, especially commodities, were able to rally from these depressed levels on expectations for additional monetary easing and hope that Europe would be able to finally make headway on its lingering economic
issues. Bond yields spiked twice during the third quarter, but managed to settle down to similar or slightly lower levels than where they stood at the start of the quarter, as markets seesawed between concerns over inflation and continuing weakness in Europe. Commodities were the primary driver of returns, though all three asset classes produced gains for the Fund for the quarter.
In the fourth quarter, a lift in equities was offset by declines in bonds and commodities. Investors had a host of political issues to navigate, including elections in the US, China and Japan; “fiscal cliff” negotiations in the US; and continuing concerns over European and Chinese economic growth. The performance of equities was the lone bright spot, with Asian markets benefiting most from favorable reaction to political elections. Commodity markets were weighed down by concerns over falling demand and improved crop yields. Bond yields ultimately made their way higher as the market experienced both rallies and sell offs that were fairly range bound. Australia and the UK led the increase in yields.
Please note that our strategy is principally implemented with derivative instruments that include futures and total return swaps. Therefore, all or most of the performance of the strategy, both positive and negative, can be attributed to these instruments. Derivatives can be a more liquid and cost-effective way to gain exposure to asset classes. Additionally, the leverage used in the strategy is inherent in these instruments.
Thank you for your continued commitment to Invesco Balanced-Risk Retirement 2050 Fund.
The views and opinions expressed in management’s discussion of Fund performance are those of Invesco Advisers, Inc. These views and opinions are subject to change at any time based on factors such as market and economic conditions. These views and opinions may not be relied upon as investment advice or recommendations, or as an offer for a particular security. The information is not a complete analysis of every aspect of any market, country, industry, security or the Fund. Statements of fact are from sources considered reliable, but Invesco Advisers, Inc. makes no representation or warranty as to their completeness or accuracy. Although historical performance is no guarantee of future results, these insights may help you understand our investment management philosophy.
See important Fund and, if applicable, index disclosures later in this report.
| Mark Ahnrud Chartered Financial Analyst, portfolio manager, is manager of Invesco Balanced-Risk Retirement 2050 Fund. | |
| He joined Invesco in 2000. Mr. Ahnrud earned a BS in finance and investments from Babson College and an MBA from Duke University Fuqua School of Business. | ||
| Chris Devine Chartered Financial Analyst, portfolio manager, is manager of Invesco Balanced-Risk Retirement 2050 Fund. | |
| He joined Invesco in 1998. Mr. Devine earned a BA in economics from Wake Forest University and an MBA from the University of Georgia. | ||
| Scott Hixon Chartered Financial Analyst, portfolio manager, is manager of Invesco Balanced-Risk Retirement 2050 Fund. | |
| He joined Invesco in 1994. Mr. Hixon earned a BBA in finance from Georgia Southern University and an MBA in finance from Georgia State University. | ||
| Christian Ulrich Chartered Financial Analyst, portfolio manager, is manager of Invesco Balanced-Risk Retirement 2050 Fund. | |
| He joined Invesco in 2000. Mr. Ulrich earned the equivalent of a BBA from the KV Zurich Business School in Zurich, Switzerland. | ||
| Scott Wolle Chartered Financial Analyst, portfolio manager, is manager of Invesco Balanced-Risk Retirement 2050 Fund. | |
| He joined Invesco in 1999. Mr. Wolle earned a BS in finance from Virginia Polytechnic Institute and State University and an MBA from Duke University Fuqua School of Business. | ||
Assisted by the Global Asset Allocation Team
13 Invesco Balanced-Risk Retirement Funds
Invesco Balanced-Risk Retirement Now Fund’s Long-Term Performance
Results of a $10,000 Investment – Oldest Share Class(es) since Inception
Fund and index data from 1/31/07
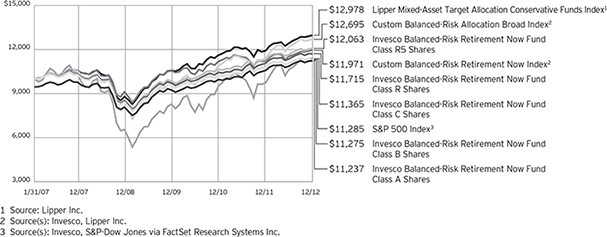
Past performance cannot guarantee comparable future results.
The data shown in the chart include reinvested distributions, applicable sales charges and Fund expenses including management fees. Results for Class B shares are calculated as if a hypothetical
shareholder had liquidated his entire investment in the Fund at the close of the reporting period and paid the contingent deferred sales charges, if applicable. Index results include reinvested dividends, but they do not reflect sales charges. Performance of the peer group,
if applicable, reflects fund expenses and management fees; performance of a market index does not. Performance shown in the chart and table(s) does not reflect deduction of taxes a shareholder would pay on Fund distributions or sale of Fund shares.
14 Invesco Balanced-Risk Retirement Funds
Average Annual Total Returns | |||||
As of 12/31/12, including maximum applicable sales charges
|
| ||||
| Class A Shares | |||||
| Inception (1/31/07) | 1.99 | % | |||
| 5 Years | 1.66 | ||||
| 1 Year | 0.42 | ||||
| Class AX Shares | |||||
| Inception | 1.97 | % | |||
| 5 Years | 1.63 | ||||
| 1 Year | 0.42 | ||||
| Class B Shares | |||||
| Inception (1/31/07) | 2.05 | % | |||
| 5 Years | 1.69 | ||||
| 1 Year | 0.50 | ||||
| Class C Shares | |||||
| Inception (1/31/07) | 2.19 | % | |||
| 5 Years | 2.03 | ||||
| 1 Year | 4.37 | ||||
| Class CX Shares | |||||
| Inception | 2.18 | % | |||
| 5 Years | 2.03 | ||||
| 1 Year | 4.50 | ||||
| Class R Shares | |||||
| Inception (1/31/07) | 2.71 | % | |||
| 5 Years | 2.57 | ||||
| 1 Year | 5.98 | ||||
| Class RX Shares | |||||
| Inception | 2.69 | % | |||
| 5 Years | 2.53 | ||||
| 1 Year | 5.98 | ||||
| Class Y Shares | |||||
| Inception | 3.16 | % | |||
| 5 Years | 3.05 | ||||
| 1 Year | 6.58 | ||||
| Class R5 Shares | |||||
| Inception (1/31/07) | 3.22 | % | |||
| 5 Years | 3.06 | ||||
| 1 Year | 6.46 | ||||
| Class R6 Shares | |||||
| Inception | 2.98 | % | |||
| 5 Years | 2.83 | ||||
| 1 Year | 6.29 | ||||
Class AX shares incepted on June 1, 2010. Performance shown prior to that date is that of Class A shares and includes the 12b-1 fees applicable to Class A shares. Class A share performance reflects any applicable fee waivers or expense reimbursements.
Class CX and Class RX shares incepted on June 1, 2010. Performance shown prior to that date is that of Class A shares, restated to reflect the higher 12b-1 fees applicable to Class CX and Class RX shares. Class A share performance reflects any applicable fee waivers or expense reimbursements.
Class Y shares incepted on October 3, 2008. Performance shown prior to that date is that of Class A shares and includes the 12b-1 fees applicable to Class A shares. Class A share performance reflects any applicable fee waivers or expense reimbursements.
Class R6 shares incepted on September 24, 2012. Performance shown prior to that date is that of Class A shares and includes the 12b-1 fees applicable to Class A shares. Class A share performance reflects any applicable fee waivers or expense reimbursements.
The performance data quoted represent past performance and cannot guarantee comparable future results; current performance may be lower or higher. Please visit invesco.com/performance for the most recent month-end performance. Performance figures reflect reinvested distributions, changes in net asset value and the effect of the maximum sales charge unless otherwise stated. Investment return and principal value will fluctuate so that you may have a gain or loss when you sell shares.
The net annual Fund operating expense ratio set forth in the most recent Fund prospectus as of the date of this report for Class A, Class AX, Class B, Class C, Class CX, Class R, Class RX, Class Y, Class R5 and Class R6 shares was 0.84%, 0.84%, 1.59%, 1.59%, 1.59%, 1.09%, 1.09%, 0.59%, 0.59% and 0.59%, respectively.1,2 The total annual Fund operating expense ratio set forth in the most recent Fund prospectus as of the date of this report for Class A, Class AX, Class B, Class C, Class CX, Class R, Class RX, Class Y, Class R5 and Class R6 shares was 1.68%, 1.68%, 2.43%, 2.43%, 2.43%, 1.93%, 1.93%, 1.43%, 1.34% and 1.34%, respectively.2 The expense
ratios presented above may vary from the expense ratios presented in other sections of this report that are based on expenses incurred during the period covered by this report.
Class A and Class AX share performance reflects the maximum 5.50% sales charge, and Class B, Class C and Class CX share performance reflects the applicable contingent deferred sales charge (CDSC) for the period involved. The CDSC on Class B shares declines from 5% beginning at the time of purchase to 0% at the beginning of the seventh year. The CDSC on Class C and Class CX shares is 1% for the first year after purchase. Class R, Class RX, Class Y, Class R5 and Class R6 shares do not have a front-end sales charge or a CDSC; therefore, performance is at net asset value.
The performance of the Fund’s share classes will differ primarily due to different sales charge structures and class expenses.
Had the adviser not waived fees and/ or reimbursed expenses, performance would have been lower.
| 1 | Total annual Fund operating expenses after any contractual fee waivers and/or expense reimbursements by the adviser in effect through at least April 30, 2014. See current prospectus for more information. |
| 2 | The expense ratio includes acquired fund fees and expenses of 0.52% for the underlying funds in which the Fund invests. |
15 Invesco Balanced-Risk Retirement Funds
Invesco Balanced-Risk Retirement 2020 Fund’s Long-Term Performance
Results of a $10,000 Investment – Oldest Share Class(es) since Inception
Fund and index data from 1/31/07
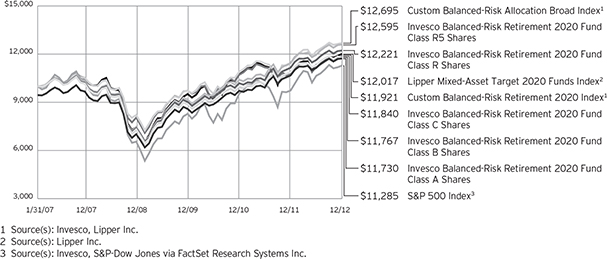
Past performance cannot guarantee comparable future results.
The data shown in the chart include reinvested distributions, applicable sales charges and Fund expenses including management fees. Results for Class B shares are calculated as if a hypothetical
shareholder had liquidated his entire investment in the Fund at the close of the reporting period and paid the contingent deferred sales charges, if applicable. Index results include reinvested dividends, but they do not reflect sales charges. Performance of the peer group,
if applicable, reflects fund expenses and management fees; performance of a market index does not. Performance shown in the chart and table(s) does not reflect deduction of taxes a shareholder would pay on Fund distributions or sale of Fund shares.
16 Invesco Balanced-Risk Retirement Funds
Average Annual Total Returns | |||||
As of 12/31/12, including maximum applicable sales charges
| |||||
| Class A Shares | |||||
| Inception (1/31/07) | 2.73 | % | |||
| 5 Years | 2.75 | ||||
| 1 Year | 3.81 | ||||
| Class AX Shares | |||||
| Inception | 2.73 | % | |||
| 5 Years | 2.75 | ||||
| 1 Year | 3.81 | ||||
| Class B Shares | |||||
| Inception (1/31/07) | 2.79 | % | |||
| 5 Years | 2.79 | ||||
| 1 Year | 3.95 | ||||
| Class C Shares | |||||
| Inception (1/31/07) | 2.90 | % | |||
| 5 Years | 3.09 | ||||
| 1 Year | 7.97 | ||||
| Class CX Shares | |||||
| Inception | 2.93 | % | |||
| 5 Years | 3.13 | ||||
| 1 Year | 7.97 | ||||
| Class R Shares | |||||
| Inception (1/31/07) | 3.45 | % | |||
| 5 Years | 3.64 | ||||
| 1 Year | 9.58 | ||||
| Class RX Shares | |||||
| Inception | 3.45 | % | |||
| 5 Years | 3.66 | ||||
| 1 Year | 9.58 | ||||
| Class Y Shares | |||||
| Inception | 3.88 | % | |||
| 5 Years | 4.11 | ||||
| 1 Year | 10.00 | ||||
| Class R5 Shares | |||||
| Inception (1/31/07) | 3.98 | % | |||
| 5 Years | 4.15 | ||||
| 1 Year | 10.08 | ||||
| Class R6 Shares | |||||
| Inception | 3.74 | % | |||
| 5 Years | 3.94 | ||||
| 1 Year | 10.01 | ||||
Class AX shares incepted on June 1, 2010. Performance shown prior to that date is that of Class A shares and includes the 12b-1 fees applicable to Class A shares. Class A share performance reflects any applicable fee waivers or expense reimbursements.
Class CX and Class RX shares incepted on June 1, 2010. Performance shown prior to that date is that of Class A shares, restated to reflect the higher 12b-1 fees applicable to Class CX and Class RX shares. Class A share performance reflects any applicable fee waivers or expense reimbursements.
Class Y shares incepted on October 3, 2008. Performance shown prior to that date is that of Class A shares and includes the 12b-1 fees applicable to Class A shares. Class A share performance reflects any applicable fee waivers or expense reimbursements.
Class R6 shares incepted on September 24, 2012. Performance shown prior to that date is that of Class A shares and includes the 12b-1 fees applicable to Class A shares. Class A share performance reflects any applicable fee waivers or expense reimbursements.
The performance data quoted represent past performance and cannot guarantee comparable future results; current performance may be lower or higher. Please visit invesco.com/performance for the most recent month-end performance. Performance figures reflect reinvested distributions, changes in net asset value and the effect of the maximum sales charge unless otherwise stated. Investment return and principal value will fluctuate so that you may have a gain or loss when you sell shares.
The net annual Fund operating expense ratio set forth in the most recent Fund prospectus as of the date of this report for Class A, Class AX, Class B, Class C, Class CX, Class R, Class RX, Class Y, Class R5 and Class R6 shares was 1.10%, 1.10%, 1.85%, 1.85%, 1.85%, 1.35%, 1.35%, 0.85%, 0.85% and 0.85%, respectively.1,2 The total annual Fund operating expense ratio set forth in the most recent Fund prospectus as of the date of this report for Class A, Class AX, Class B, Class C, Class CX, Class R, Class RX, Class Y, Class R5 and Class R6 shares was 1.65%, 1.65%, 2.40%, 2.40%, 2.40%, 1.90%, 1.90%, 1.40%, 1.32% and 1.32%, respectively.2 The expense
ratios presented above may vary from the expense ratios presented in other sections of this report that are based on expenses incurred during the period covered by this report.
Class A and Class AX share performance reflects the maximum 5.50% sales charge, and Class B, Class C and Class CX share performance reflects the applicable contingent deferred sales charge (CDSC) for the period involved. The CDSC on Class B shares declines from 5% beginning at the time of purchase to 0% at the beginning of the seventh year. The CDSC on Class C and Class CX shares is 1% for the first year after purchase. Class R, Class RX, Class Y, Class R5 and Class R6 shares do not have a front-end sales charge or a CDSC; therefore, performance is at net asset value.
The performance of the Fund’s share classes will differ primarily due to different sales charge structures and class expenses.
Had the adviser not waived fees and/ or reimbursed expenses, performance would have been lower.
| 1 | Total annual Fund operating expenses after any contractual fee waivers and/or expense reimbursements by the adviser in effect through at least April 30, 2014. See current prospectus for more information. |
| 2 | The expense ratio includes acquired fund fees and expenses of 0.71% for the underlying funds in which the Fund invests. |
17 Invesco Balanced-Risk Retirement Funds
Invesco Balanced-Risk Retirement 2030 Fund’s Long-Term Performance
Results of a $10,000 Investment – Oldest Share Class(es) since Inception
Fund and index data from 1/31/07
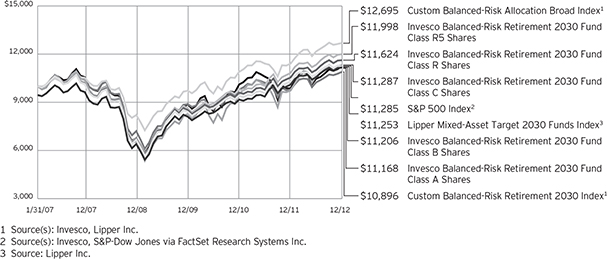
Past performance cannot guarantee comparable future results.
The data shown in the chart include reinvested distributions, applicable sales charges and Fund expenses including management fees. Results for Class B shares are calculated as if a hypothetical
shareholder had liquidated his entire investment in the Fund at the close of the reporting period and paid the contingent deferred sales charges, if applicable. Index results include reinvested dividends, but they do not reflect sales charges. Performance of the peer group,
if applicable, reflects fund expenses and management fees; performance of a market index does not. Performance shown in the chart and table(s) does not reflect deduction of taxes a shareholder would pay on Fund distributions or sale of Fund shares.
18 Invesco Balanced-Risk Retirement Funds
Average Annual Total Returns | |||||
As of 12/31/12, including maximum applicable sales charges
| |||||
| Class A Shares | |||||
| Inception (1/31/07) | 1.88 | % | |||
| 5 Years | 1.81 | ||||
| 1 Year | 4.44 | ||||
| Class AX Shares | |||||
| Inception | 1.88 | % | |||
| 5 Years | 1.81 | ||||
| 1 Year | 4.44 | ||||
| Class B Shares | |||||
| Inception (1/31/07) | 1.94 | % | |||
| 5 Years | 1.84 | ||||
| 1 Year | 4.70 | ||||
| Class C Shares | |||||
| Inception (1/31/07) | 2.07 | % | |||
| 5 Years | 2.16 | ||||
| 1 Year | 8.71 | ||||
| Class CX Shares | |||||
| Inception | 2.09 | % | |||
| 5 Years | 2.21 | ||||
| 1 Year | 8.71 | ||||
| Class R Shares | |||||
| Inception (1/31/07) | 2.58 | % | |||
| 5 Years | 2.69 | ||||
| 1 Year | 10.25 | ||||
| Class RX Shares | |||||
| Inception | 2.61 | % | |||
| 5 Years | 2.73 | ||||
| 1 Year | 10.26 | ||||
| Class Y Shares | |||||
| Inception | 3.05 | % | |||
| 5 Years | 3.20 | ||||
| 1 Year | 10.88 | ||||
| Class R5 Shares | �� | ||||
| Inception (1/31/07) | 3.13 | % | |||
| 5 Years | 3.25 | ||||
| 1 Year | 10.86 | ||||
| Class R6 Shares | |||||
| Inception | 2.88 | % | |||
| 5 Years | 3.00 | ||||
| 1 Year | 10.66 | ||||
Class AX shares incepted on June 1, 2010. Performance shown prior to that date is that of Class A shares and includes the 12b-1 fees applicable to Class A shares. Class A share performance reflects any applicable fee waivers or expense reimbursements.
Class CX and Class RX shares incepted on June 1, 2010. Performance shown prior to that date is that of Class A shares, restated to reflect the higher 12b-1 fees applicable to Class CX and Class RX shares. Class A share performance reflects any applicable fee waivers or expense reimbursements.
Class Y shares incepted on October 3, 2008. Performance shown prior to that date is that of Class A shares and includes the 12b-1 fees applicable to Class A shares. Class A share performance reflects any applicable fee waivers or expense reimbursements.
Class R6 shares incepted on September 24, 2012. Performance shown prior to that date is that of Class A shares and includes the 12b-1 fees applicable to Class A shares. Class A share performance reflects any applicable fee waivers or expense reimbursements.
The performance data quoted represent past performance and cannot guarantee comparable future results; current performance may be lower or higher. Please visit invesco.com/performance for the most recent month-end performance. Performance figures reflect reinvested distributions, changes in net asset value and the effect of the maximum sales charge unless otherwise stated. Investment return and principal value will fluctuate so that you may have a gain or loss when you sell shares.
The net annual Fund operating expense ratio set forth in the most recent Fund prospectus as of the date of this report for Class A, Class AX, Class B, Class C, Class CX, Class R, Class RX, Class Y, Class R5 and Class R6 shares was 1.12%, 1.12%, 1.87%, 1.87%, 1.87%, 1.37%, 1.37%, 0.87%, 0.87% and 0.87%, respectively.1,2 The total annual Fund operating expense ratio set forth in the most recent Fund prospectus as of the date of this report for Class A, Class AX, Class B, Class C, Class CX, Class R, Class RX, Class Y, Class R5 and Class R6 shares was 1.82%, 1.82%, 2.57%, 2.57%, 2.57%, 2.07%, 2.07%, 1.57%, 1.38% and 1.36%, respectively.2 The expense
ratios presented above may vary from the expense ratios presented in other sections of this report that are based on expenses incurred during the period covered by this report.
Class A and Class AX share performance reflects the maximum 5.50% sales charge, and Class B, Class C and Class CX share performance reflects the applicable contingent deferred sales charge (CDSC) for the period involved. The CDSC on Class B shares declines from 5% beginning at the time of purchase to 0% at the beginning of the seventh year. The CDSC on Class C and Class CX shares is 1% for the first year after purchase. Class R, Class RX, Class Y, Class R5 and Class R6 shares do not have a front-end sales charge or a CDSC; therefore, performance is at net asset value.
The performance of the Fund’s share classes will differ primarily due to different sales charge structures and class expenses.
Had the adviser not waived fees and/ or reimbursed expenses, performance would have been lower.
| 1 | Total annual Fund operating expenses after any contractual fee waivers and/or expense reimbursements by the adviser in effect through at least April 30, 2014. See current prospectus for more information. |
| 2 | The expense ratio includes acquired fund fees and expenses of 0.85% for the underlying funds in which the Fund invests. |
19 Invesco Balanced-Risk Retirement Funds
Invesco Balanced-Risk Retirement 2040 Fund’s Long-Term Performance
Results of a $10,000 Investment – Oldest Share Class(es) since Inception
Fund and index data from 1/31/07
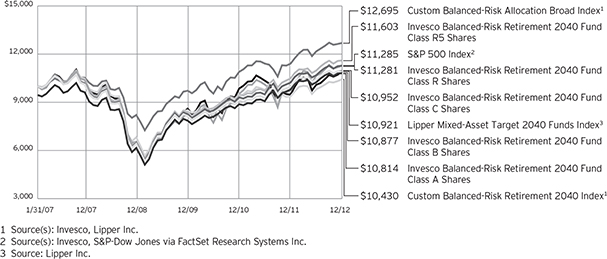
Past performance cannot guarantee comparable future results.
The data shown in the chart include reinvested distributions, applicable sales charges and Fund expenses including management fees. Results for Class B shares are calculated as if a hypothetical
shareholder had liquidated his entire investment in the Fund at the close of the reporting period and paid the contingent deferred sales charges, if applicable. Index results include reinvested dividends, but they do not reflect sales charges. Performance of the peer group,
if applicable, reflects fund expenses and management fees; performance of a market index does not. Performance shown in the chart and table(s) does not reflect deduction of taxes a shareholder would pay on Fund distributions or sale of Fund shares.
20 Invesco Balanced-Risk Retirement Funds
| Average Annual Total Returns | |||||
| As of 12/31/12, including maximum applicable sales charges | |||||
| Class A Shares | |||||
| Inception (1/31/07) | 1.33 | % | |||
| 5 Years | 1.21 | ||||
| 1 Year | 4.29 | ||||
| Class AX Shares | |||||
| Inception | 1.33 | % | |||
| 5 Years | 1.21 | ||||
| 1 Year | 4.42 | ||||
| Class B Shares | |||||
| Inception (1/31/07) | 1.43 | % | |||
| 5 Years | 1.29 | ||||
| 1 Year | 4.79 | ||||
| Class C Shares | |||||
| Inception (1/31/07) | 1.55 | % | |||
| 5 Years | 1.60 | ||||
| 1 Year | 8.81 | ||||
| Class CX Shares | |||||
| Inception | 1.54 | % | |||
| 5 Years | 1.60 | ||||
| 1 Year | 8.68 | ||||
| Class R Shares | |||||
| Inception (1/31/07) | 2.06 | % | |||
| 5 Years | 2.12 | ||||
| 1 Year | 10.33 | ||||
| Class RX Shares | |||||
| Inception | 2.06 | % | |||
| 5 Years | 2.13 | ||||
| 1 Year | 10.19 | ||||
| Class Y Shares | |||||
| Inception | 2.51 | % | |||
| 5 Years | 2.60 | ||||
| 1 Year | 10.83 | ||||
| Class R5 Shares | |||||
| Inception (1/31/07) | 2.54 | % | |||
| 5 Years | 2.60 | ||||
| 1 Year | 10.69 | ||||
| Class R6 Shares | |||||
| Inception | 2.33 | % | |||
| 5 Years | 2.40 | ||||
| 1 Year | 10.59 | ||||
Class AX shares incepted on June 1, 2010. Performance shown prior to that date is that of Class A shares and includes the 12b-1 fees applicable to Class A shares. Class A share performance reflects any applicable fee waivers or expense reimbursements.
Class CX and Class RX shares incepted on June 1, 2010. Performance shown prior to that date is that of Class A shares, restated to reflect the higher 12b-1 fees applicable to Class CX and Class RX shares. Class A share performance reflects any applicable fee waivers or expense reimbursements.
Class Y shares incepted on October 3, 2008. Performance shown prior to that date is that of Class A shares and includes the 12b-1 fees applicable to Class A shares. Class A share performance reflects any applicable fee waivers or expense reimbursements.
Class R6 shares incepted on September 24, 2012. Performance shown prior to that date is that of Class A shares and includes the 12b-1 fees applicable to Class A shares. Class A share performance reflects any applicable fee waivers or expense reimbursements.
The performance data quoted represent past performance and cannot guarantee comparable future results; current performance may be lower or higher. Please visit invesco.com/performance for the most recent month-end performance. Performance figures reflect reinvested distributions, changes in net asset value and the effect of the maximum sales charge unless otherwise stated. Investment return and principal value will fluctuate so that you may have a gain or loss when you sell shares.
The net annual Fund operating expense ratio set forth in the most recent Fund prospectus as of the date of this report for Class A, Class AX, Class B, Class C, Class CX, Class R, Class RX, Class Y, Class R5 and Class R6 shares was 1.23%, 1.23%, 1.98% 1.98%, 1.98%, 1.48%, 1.48%, 0.98%, 0.98% and 0.98%, respectively.1,2 The total annual Fund operating expense ratio set forth in the most recent Fund prospectus as of the date of this report for Class A, Class AX, Class B, Class C, Class CX, Class R, Class RX, Class Y, Class R5 and Class R6 shares was 2.50%, 2.50%, 3.25%, 3.25%, 3.25%, 2.75%, 2.75%, 2.25%, 2.00% and 2.00%, respectively.2 The expense
ratios presented above may vary from the expense ratios presented in other sections of this report that are based on expenses incurred during the period covered by this report.
Class A and Class AX share performance reflects the maximum 5.50% sales charge, and Class B, Class C and Class CX share performance reflects the applicable contingent deferred sales charge (CDSC) for the period involved. The CDSC on Class B shares declines from 5% beginning at the time of purchase to 0% at the beginning of the seventh year. The CDSC on Class C and Class CX shares is 1% for the first year after purchase. Class R, Class RX, Class Y, Class R5 and Class R6 shares do not have a front-end sales charge or a CDSC; therefore, performance is at net asset value.
The performance of the Fund’s share classes will differ primarily due to different sales charge structures and class expenses.
Had the adviser not waived fees and/ or reimbursed expenses, performance would have been lower.
| 1 | Total annual Fund operating expenses after any contractual fee waivers and/or expense reimbursements by the adviser in effect through at least April 30, 2014. See current prospectus for more information. |
| 2 | The expense ratio includes acquired fund fees and expenses of 0.98% for the underlying funds in which the Fund invests. |
21 Invesco Balanced-Risk Retirement Funds
Invesco Balanced-Risk Retirement 2050 Fund’s Long-Term Performance
Results of a $10,000 Investment – Oldest Share Class(es) since Inception
Fund and index data from 1/31/07
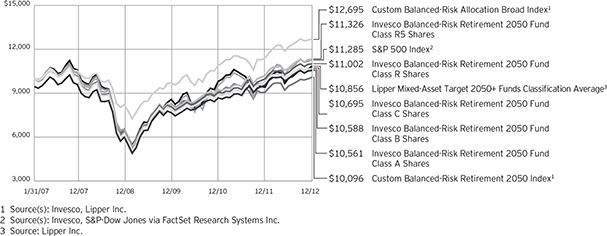
Past performance cannot guarantee comparable future results.
The data shown in the chart include reinvested distributions, applicable sales charges and Fund expenses including management fees. Results for Class B shares are calculated as if a hypothetical
shareholder had liquidated his entire investment in the Fund at the close of the reporting period and paid the contingent deferred sales charges, if applicable. Index results include reinvested dividends, but they do not reflect sales charges. Performance of the peer group,
if applicable, reflects fund expenses and management fees; performance of a market index does not. Performance shown in the chart and table(s) does not reflect deduction of taxes a shareholder would pay on Fund distributions or sale of Fund shares.
22 Invesco Balanced-Risk Retirement Funds
Average Annual Total Returns | |||||
As of 12/31/12, including maximum applicable sales charges |
| ||||
Class A Shares | |||||
| Inception (1/31/07) | 0.93 | % | |||
| 5 Years | 0.78 | ||||
| 1 Year | 4.36 | ||||
| Class AX Shares | |||||
| Inception | 0.92 | % | |||
| 5 Years | 0.77 | ||||
| 1 Year | 4.48 | ||||
| Class B Shares | |||||
| Inception (1/31/07) | 0.97 | % | |||
| 5 Years | 0.81 | ||||
| 1 Year | 4.68 | ||||
| Class C Shares | |||||
| Inception (1/31/07) | 1.14 | % | |||
| 5 Years | 1.17 | ||||
| 1 Year | 8.66 | ||||
| Class CX Shares | |||||
| Inception | 1.11 | % | |||
| 5 Years | 1.14 | ||||
| 1 Year | 8.67 | ||||
| Class R Shares | |||||
| Inception (1/31/07) | 1.63 | % | |||
| 5 Years | 1.67 | ||||
| 1 Year | 10.17 | ||||
| Class RX Shares | |||||
| Inception | 1.64 | % | |||
| 5 Years | 1.67 | ||||
| 1 Year | 10.30 | ||||
| Class Y Shares | |||||
| Inception | 2.06 | % | |||
| 5 Years | 2.13 | ||||
| 1 Year | 10.68 | ||||
| Class R5 Shares | |||||
| Inception (1/31/07) | 2.13 | % | |||
| 5 Years | 2.16 | ||||
| 1 Year | 10.80 | ||||
| Class R6 Shares | |||||
| Inception | 1.91 | % | |||
| 5 Years | 1.95 | ||||
| 1 Year | 10.58 | ||||
Class AX shares incepted on June 1, 2010. Performance shown prior to that date is that of Class A shares and includes the 12b-1 fees applicable to Class A shares. Class A share performance reflects any applicable fee waivers or expense reimbursements.
Class CX and Class RX shares incepted on June 1, 2010. Performance shown prior to that date is that of Class A shares, restated to reflect the higher 12b-1 fees applicable to Class CX and Class RX shares. Class A share performance reflects any applicable fee waivers or expense reimbursements.
Class Y shares incepted on October 3, 2008. Performance shown prior to that date is that of Class A shares and includes the 12b-1 fees applicable to Class A shares. Class A share performance reflects any applicable fee waivers or expense reimbursements.
Class R6 shares incepted on September 24, 2012. Performance shown prior to that date is that of Class A shares and includes the 12b-1 fees applicable to Class A shares. Class A share performance reflects any applicable fee waivers or expense reimbursements.
The performance data quoted represent past performance and cannot guarantee comparable future results; current performance may be lower or higher. Please visit invesco.com/performance for the most recent month-end performance. Performance figures reflect reinvested distributions, changes in net asset value and the effect of the maximum sales charge unless otherwise stated. Investment return and principal value will fluctuate so that you may have a gain or loss when you sell shares.
The net annual Fund operating expense ratio set forth in the most recent Fund prospectus as of the date of this report for Class A, Class AX, Class B, Class C, Class CX, Class R, Class RX, Class Y, Class R5 and Class R6 shares was 1.36%, 1.36%, 2.11%, 2.11%, 2.11%, 1.61%, 1.61%, 1.11%, 1.11% and 1.11%, respectively.1,2 The total annual Fund operating expense ratio set forth in the most recent Fund prospectus as of the date of this report for Class A, Class AX, Class B, Class C, Class CX, Class R, Class RX, Class Y, Class R5 and Class R6 shares was 4.12%, 4.12%, 4.87%, 4.87%, 4.87%, 4.37%, 4.37%, 3.87%, 3.47% and 3.47%, respectively.2 The expense
ratios presented above may vary from the expense ratios presented in other sections of this report that are based on expenses incurred during the period covered by this report.
Class A and Class AX share performance reflects the maximum 5.50% sales charge, and Class B, Class C and Class CX share performance reflects the applicable contingent deferred sales charge (CDSC) for the period involved. The CDSC on Class B shares declines from 5% beginning at the time of purchase to 0% at the beginning of the seventh year. The CDSC on Class C and Class CX shares is 1% for the first year after purchase. Class R, Class RX, Class Y, Class R5 and Class R6 shares do not have a front-end sales charge or a CDSC; therefore, performance is at net asset value.
The performance of the Fund’s share classes will differ primarily due to different sales charge structures and class expenses.
Had the adviser not waived fees and/ or reimbursed expenses, performance would have been lower.
| 1 | Total annual Fund operating expenses after any contractual fee waivers and/or expense reimbursements by the adviser in effect through at least April 30, 2014. See current prospectus for more information. |
| 2 | The expense ratio includes acquired fund fees and expenses of 1.11% for the underlying funds in which the Fund invests. |
23 Invesco Balanced-Risk Retirement Funds
Invesco Balanced-Risk Retirement Now Fund’s investment objective is to provide real return and, as a secondary objective, capital preservation.
Invesco Balanced-Risk Retirement 2020 Fund’s, Invesco Balanced-Risk Retirement 2030 Fund’s, Invesco Balanced-Risk Retirement 2040 Fund’s and Invesco Balanced-Risk Retirement 2050 Fund’s investment objective is to provide total return with a low to moderate correlation to traditional financial market indices and, as a secondary objective, capital preservation.
| n | Unless otherwise stated, information presented in this report is as of December 31, 2012, and is based on total net assets. |
| n | Unless otherwise noted, all data provided by Invesco. |
| n | To access your Fund’s reports/prospectus, visit invesco.com/fundreports. |
About share classes
| n | Class AX shares, Class CX shares, Class RX shares and Class Y shares are available only to certain investors. On September 24, 2012, Class A5 shares, Class C5 shares and Class R5 shares were renamed Class AX shares, Class CX shares and Class RX shares, respectively. Please see the prospectus for more information. |
| n | Class B shares may not be purchased for new or additional investments. Please see the prospectus for more information. |
| n | Class R shares are generally available only to employer sponsored retirement and benefit plans. Please see the prospectus for more information. |
| n | Class R5 shares and Class R6 shares are primarily intended for employer sponsored retirement and benefit plans that meet certain standards and for institutional investors. On September 24, 2012, Institutional Class shares were renamed Class R5 shares. Please see the prospectus for more information. |
Principal risks of investing in Invesco Balanced-Risk Retirement Funds
| n | Commodity-linked notes risk. An underlying fund’s investments in commodity-linked notes may involve substantial risks, including risk of loss of a significant portion of their principal value. In addition to risks associated with the underlying commodities, they may be subject to additional special risks, such as the lack of a secondary trading market and temporary price distortions due to speculators and/or the continuous rolling over of futures contracts underlying the notes. Commodity- |
linked notes are also subject to counterparty risk, which is the risk that the other party to the contract will not fulfill its contractual obligation to complete the transaction with an underlying fund. |
| n | Commodity risk. Invesco Balanced-Risk Allocation Fund, an underlying fund, will invest in commodities through a wholly-owned subsidiary of that underlying fund organized under the laws of the Cayman Islands (the Subsidiary). Investment exposure to the commodities markets and/or a particular sector of the commodities markets, may subject the underlying fund and the Subsidiary to greater volatility than investments in traditional securities, such as stocks and bonds. The commodities markets may fluctuate widely based on a variety of factors, including changes in overall market movements, domestic and foreign political and economic events and policies, war, acts of terrorism, changes in domestic or foreign interest rates and/ or investor expectations concerning interest rates, domestic and foreign inflation rates and investment and trading activities of mutual funds, hedge funds and commodities funds. Prices of various commodities may also be affected by factors such as drought, floods, weather, livestock disease, embargoes, tariffs and other regulatory developments. The prices of commodities can also fluctuate widely due to supply and demand disruptions in major producing or consuming regions. Because certain of the underlying fund’s and the Subsidiary’s performance are linked to the performance of potentially volatile commodities, investors should be willing to assume the risks of potentially significant fluctuations in the value of the underlying fund’s shares. |
| n | Concentration risk. To the extent Invesco Balanced-Risk Allocation Fund, an underlying fund, invests a greater amount in any one sector or industry, an underlying fund’s performance will depend to a greater extent on the overall condition of the sector or industry, and there is increased risk to an underlying fund if conditions adversely affect that sector or industry. |
| n | Counterparty risk. Counterparty risk is the risk that the other party to the contract will not fulfill its contractual obligations, which may cause losses or additional costs to an underlying Fund. |
| n | Credit risk. The issuer of instruments in which an underlying fund invests may be unable to meet interest and/or principal payments, thereby causing its instruments to decrease in value and lowering the issuer’s credit rating. |
| n | Currency/exchange rate risk. The dollar value of an underlying fund’s foreign investments will be affected by changes in the exchange rates between the dollar and the currencies in which those investments are traded. |
| n | Derivatives risk. The performance of derivative instruments is tied to the performance of an underlying currency, security, index or other instrument. In addition to risks relating to their underlying instruments, the use of derivatives may include other, possibly greater, risks. Derivatives involve costs, may be volatile, and may involve a small initial investment relative to the risk assumed. Risks associated with the use of derivatives include counterparty, leverage, correlation, liquidity, tax, market, interest rate and management risks. Derivatives may also be more difficult to purchase, sell or value than other investments. The Fund may lose more than the cash amount invested on investments in derivatives. |
| This report must be accompanied or preceded by a currently effective Fund prospectus, which contains more complete information, including sales charges and expenses. Investors should read it carefully before investing. | ||
NOT FDIC INSURED | MAY LOSE VALUE | NO BANK GUARANTEE |
24 Invesco Balanced-Risk Retirement Funds
Investors should bear in mind that, while the Fund intends to use derivative strategies, it is not obligated to actively engage in these transactions generally or in any particular kind of derivative, if the investment manager elects not to do so due to availability, cost, market conditions or other factors.
| n | Developing/emerging markets risk. Securities issued by foreign companies and governments located in developing/emerging countries may be affected more negatively by inflation, devaluation of their currencies, higher transaction costs, delays in settlement, adverse political developments, the introduction of capital controls, withholding taxes, nationalization of private assets, expropriation, social unrest, war or lack of timely information than those in developed countries. |
| n | Exchange-traded funds risk. An investment by the Fund or underlying fund in exchange-traded funds generally presents the same primary risks as an investment in a mutual fund. In addition, an exchange-traded fund may be subject to the following: (1) a discount of the exchange-traded fund’s shares to its net asset value; (2) failure to develop an active trading market for the exchange-traded fund’s shares; (3) the listing exchange halting trading of the exchange-traded fund’s shares; (4) failure of the exchange-traded fund’s shares to track the referenced index; and (5) holding troubled securities in the referenced index. Exchange-traded funds may involve duplication of management fees and certain other expenses, as the Fund or underlying fund indirectly bears its proportionate share of any expenses paid by the exchange-traded funds in which it invests. Further, certain of the exchange-traded funds in which the Fund or underlying fund may invest are leveraged. The more the Fund invests in such leveraged exchange-traded funds, the more this leverage will magnify any losses on those investments. |
| n | Exchange-traded notes risk. Exchange-traded notes are subject to credit risk, including the credit risk of the issuer, and the value of the exchange-traded note may drop due to a downgrade in the issuer’s credit rating, despite the underlying market benchmark or strategy remaining unchanged. The value of an exchange-traded note may also be influenced by time to maturity, level of supply and demand for the exchange-traded note, volatility and lack of liquidity in the underlying |
market, changes in the applicable interest rates, changes in the issuer’s credit rating, and economic, legal, political or geographic events that affect the referenced underlying market or strategy. Exchange-traded notes are also subject to counterparty risk. |
| n | Foreign securities risk. An underlying fund’s foreign investments may be affected by changes in a foreign country’s exchange rates, political and social instability, changes in economic or taxation policies, difficulties when enforcing obligations, decreased liquidity, and increased volatility. Foreign companies may be subject to less regulation resulting in less publicly available information about the companies. |
| n | Fund of funds risk. The Fund’s performance depends on the underlying funds in which it invests, and it is subject to the risks of the underlying funds. Market fluctuations may change the target weightings in the underlying funds. The underlying funds may change their investment objectives, policies or practices and may not achieve their investment objectives, all of which may cause the Fund to withdraw its investments therein at a disadvantageous time. |
| n | Interest rate risk. Interest rate risk refers to the risk that bond prices generally fall as interest rates rise; conversely, bond prices generally rise as interest rates fall. Specific bonds differ in their sensitivity to changes in interest rates depending on their individual characteristics, including duration. |
| n | Leverage risk. Leverage exists when an underlying fund purchases or sells an instrument or enters into a transaction without investing cash in an amount equal to the full economic exposure of the instrument or transaction and an underlying fund could lose more than it invested. Leverage created from borrowing or certain types of transactions or instruments may impair an underlying fund’s liquidity, cause it to liquidate positions at an unfavorable time, increase volatility or otherwise not achieve its intended objective. |
| n | Liquidity risk. An underlying fund may hold illiquid securities that it is unable to sell at the preferred time or price and could lose its entire investment in such securities. |
| n | Management risk. The investment techniques and risk analysis used by the Fund’s and the underlying funds’ portfolio managers may not produce the desired results. |
| n | Market risk. The prices of and the income generated by the underlying fund’s securities may decline in response to, among other things, investor sentiment, general economic and market conditions, regional or global instability and currency and interest rate fluctuations. |
| n | Non-diversification risk. Certain of the underlying funds are non-diversified and can invest a greater portion of its assets in a single issuer. A change in the value of the issuer could affect the value of an underlying fund more than if it was a diversified fund. |
| n | Subsidiary risk. By investing in the Subsidiary, an underlying fund is indirectly exposed to risks associated with the Subsidiary’s investments. The Subsidiary is not registered under the Investment Company Act of 1940 (1940 Act), and except as otherwise noted in the prospectus, is not subject to the investor protections of the 1940 Act. Changes in the laws of the United States and/or the Cayman Islands, under which the underlying fund and the Subsidiary, respectively, are organized, could result in the inability of the underlying fund and/or the Subsidiary to operate as described in the underlying fund prospectus and statement of additional information (SAI) and could negatively affect the underlying fund and its shareholders. |
| n | Tax risk. The tax treatment of commodity-linked derivative instruments may be adversely affected by changes in legislation, regulations or other legally binding authority. If, as a result of any such adverse action, the income of Invesco Balanced-Risk Allocation Fund, an underlying fund, from certain commodity-linked derivatives was treated as non-qualifying income, Invesco Balanced-Risk Allocation Fund might fail to qualify as a regulated investment company and be subject to federal income tax at the fund level. Invesco Balanced-Risk Allocation Fund has received private letter rulings from the Internal Revenue Service confirming that income derived from its investments in the Subsidiary and a form of commodity-linked note constitutes qualifying income to Invesco Balanced-Risk Allocation Fund. However, the Internal Revenue Service has suspended issuance of any further private letter rulings pending a review of its position. Should the Internal Revenue Service issue guidance, or Congress enact legislation that adversely affects the tax treatment |
continued on page 26
25 Invesco Balanced-Risk Retirement Funds
continued from page 25
of Invesco Balanced-Risk Allocation Fund’s use of commodity-linked notes, or the Subsidiary, it could limit its ability to pursue its investment strategy. In this event, Invesco Balanced-Risk Allocation Fund’s Board of Trustees may authorize a significant change in investment strategy or Fund liquidation. Invesco Balanced-Risk Allocation Fund also may incur transaction and other costs to comply with any new or additional guidance from the Internal Revenue Service.
| n | US government obligations risk. An underlying fund may invest in obligations issued by US government agencies and instrumentalities that may receive varying levels of support from the government, which could affect an underlying fund’s ability to recover should they default. |
Additional risks of investing in Invesco Balanced-Risk Retirement Now Fund and Invesco Balanced-Risk Retirement 2020 Fund
| n | Foreign credit exposure risk. US dollar-denominated securities carrying foreign credit exposure may be affected by unfavorable political, economic or governmental developments that could affect payments of principal and interest. |
| n | Industry focus risk. To the extent a fund invests in securities issued or guaranteed by companies in the banking and financial services industries, the fund’s performance will depend on the overall condition of those industries, which may be affected by the following factors: the supply of short-term financing; changes in government regulation and interest rates; and the overall economy. |
| n | Money market fund risk. Although the underlying fund seeks to preserve the value of your investment at $1.00 per share, you may lose money by investing in the underlying fund. The share price of money market funds can fall below the $1.00 share price. You should not rely on or expect the underlying fund’s adviser or its affiliates to enter into support agreements or take other actions to maintain the underlying fund’s $1.00 share price. The credit quality of the underlying fund’s holdings can change rapidly in certain markets, and the default of a single holding could have an adverse impact on the underlying fund’s share price. |
The underlying fund’s share price can also be negatively affected during periods of high redemption pressures and/or illiquid markets. Further regulation could impact the way the underlying fund is managed, possibly negatively impacting its return. Additionally, the underlying fund’s yield will vary as the short-term securities in its portfolio mature or are sold and the proceeds are reinvested in other securities.
| n | Municipal securities risk. An underlying fund may invest in municipal securities. Constitutional amendments, legislative enactments, executive orders, administrative regulations, voter initiatives, and the issuer’s regional economic conditions may affect the municipal security’s value, interest payments, repayment of principal and the underlying fund’s ability to sell it. Failure of a municipal security issuer to comply with applicable tax requirements may make income paid thereon taxable, resulting in a decline in the security’s value. In addition, there could be changes in applicable tax laws or tax treatments that reduce or eliminate the current federal income tax exemption on municipal securities or otherwise adversely affect the current federal or state tax status of municipal securities. |
| n | Repurchase agreement risk. If the seller of a repurchase agreement in which the Fund invests defaults on its obligation or declares bankruptcy, the Fund may experience delays in selling the securities underlying the repurchase agreement, resulting in losses. |
| n | Variable-rate demand notes risk. The absence of an active secondary market for certain variable and floating rate notes could make it difficult to dispose of the instruments, and a portfolio could suffer a loss if the issuer defaults during periods in which a portfolio is not entitled to exercise its demand rights. |
About indexes used in this report
| n | The Barclays U.S. Aggregate Index is an unmanaged index considered representative of the US investment-grade, fixed-rate bond market. |
| n | The Barclays U.S. Universal Index represents the union of the U.S. Aggregate Index, the U.S. High-Yield Corporate Index, the 144A Index, the Eurodollar Index, the Emerging Markets Index and the non-ERISA portion of the CMBS Index. |
| n | The Custom Balanced-Risk Allocation Broad Index consists of 60% S&P 500 Index and 40% Barclays U.S. Aggregate Index. |
| n | The Custom Balanced-Risk Retirement 2020 Index was created by Invesco to serve as a style-specific benchmark for Invesco Balanced-Risk Retirement 2020 Fund. From the inception of the Fund to November 4, 2009, the index comprised the Custom Independence 2020 Index, which included the following indexes: the Russell 3000 Index, the MSCI EAFE Index, the FTSE NAREIT Equity REITs Index and the Barclays U.S. Universal Index. From November 4, 2009, through November 30, 2009, the index comprised the MSCI World Index and the JP Morgan Global Government Bond Index. Since December 1, 2009, the index has comprised the MSCI World Index and the Barclays U.S. Aggregate Index. |
| n | The Custom Balanced-Risk Retirement 2030 Index was created by Invesco to serve as a style-specific benchmark for Invesco Balanced-Risk Retirement 2030 Fund. From the inception of the Fund to November 4, 2009, the index comprised the Custom Independence 2030 Index, which included the following indexes: the Russell 3000 Index, the MSCI EAFE Index, the FTSE NAREIT Equity REITs index and the Barclays U.S. Universal Index. From November 4, 2009, through November 30, 2009, the index comprised the MSCI World Index and the JP Morgan Global Government Bond Index. Since December 1, 2009, the index has comprised the MSCI World Index and the Barclays U.S. Aggregate Index. |
| n | The Custom Balanced-Risk Retirement 2040 Index was created by Invesco to serve as a style-specific benchmark for Invesco Balanced-Risk Retirement 2040 Fund. From the inception of the Fund to November 4, 2009, the index comprised the Custom Independence 2040 Index, which included the following indexes: the Russell 3000 Index, the MSCI EAFE Index, the FTSE NAREIT Equity REITs Index and the Barclays U.S. Universal Index. From November 4, 2009, through November 30, 2009, the index comprised the MSCI World Index and the JP Morgan Global Government Bond Index. Since December 1, 2009, the index has comprised the MSCI World Index and the Barclays U.S. Aggregate Index. |
26 Invesco Balanced-Risk Retirement Funds
| n | The Custom Balanced-Risk Retirement 2050 Index was created by Invesco to serve as a style-specific benchmark for Invesco Balanced-Risk Retirement 2050 Fund. From the inception of the Fund to November 4, 2009, the index comprised the Custom Independence 2050 Index, which included the following indexes: the Russell 3000 Index, the MSCI EAFE Index, the FTSE NAREIT Equity REITs Index and the Barclays U.S. Universal Index. From November 4, 2009, through November 30, 2009, the index comprised the MSCI World Index and the JP Morgan Global Government Bond Index. Since December 1, 2009, the index has comprised the MSCI World Index and the Barclays U.S. Aggregate Index. |
| n | The Custom Balanced-Risk Retirement Now Index was created by Invesco to serve as a style-specific benchmark for Invesco Balanced-Risk Retirement Now Fund. From the inception of the Fund to November 4, 2009, the index comprised the Custom Independence Now Index, which included the following indexes: the Russell 3000 Index, the MSCI EAFE Index, the FTSE NAREIT Equity REITs Index, the Barclays U.S. Universal Index and the three-month US Treasury bill. From November 4, 2009 through November 30, 2009, the index was composed of the MSCI World Index, the JPMorgan Global Government Bond Index and the three-month US Treasury bill. Since December 1, 2009, the index has comprised the MSCI World Index, the Barclays U.S. Aggregate Index and the three-month US Treasury bill. |
| n | The FTSE NAREIT Equity REIT Index is an unmanaged index considered representative of US REITs. |
| n | The JP Morgan Global Government Bond Index is a total return, market capitalization weighted index that is rebalanced monthly and includes the following countries: Australia, Belgium, Canada, Denmark, Germany, Italy, Japan, the Netherlands, Spain, Sweden, the United Kingdom and the United States. |
| n | The Lipper Mixed-Asset Target 2020 Funds Index is an unmanaged index considered representative of mixed-asset target 2020 funds tracked by Lipper. |
| n | The Lipper Mixed-Asset Target 2030 Funds Index is an unmanaged index considered representative of mixed-asset target 2030 funds tracked by Lipper. |
| n | The Lipper Mixed-Asset Target 2040 Funds Index is an unmanaged index considered representative of mixed-asset target 2040 funds tracked by Lipper. |
| n | The Lipper Mixed-Asset Target 2050+ Funds Classification Average represents an average of all funds in the Lipper Mixed-Asset Target 2050+ Funds classification. |
| n | The Lipper Mixed-Asset Target Allocation Conservative Funds Index is an unmanaged index considered representative of mixed-asset target allocation conservative funds tracked by Lipper. |
| n | The MSCI EAFE® Index is an unmanaged index considered representative of stocks of Europe, Australasia and the Far East. |
| n | The MSCI World IndexSM is an unmanaged index considered representative of stocks of developed countries. |
| n | The Russell 3000® Index is an unmanaged index considered representative of the US stock market. The Russell 3000 Index is a trademark/service mark of the Frank Russell Co. Russell® is a trademark of the Frank Russell Co. |
| n | The S&P 500® Index is an unmanaged index considered representative of the US stock market. |
| n | The composition of a custom index may change from time to time based on the target asset allocation of the Fund. Therefore, the current composition of the index does not reflect its historical composition and will likely be altered in the future to better reflect the objective of the Fund. |
| n | The Fund is not managed to track the performance of any particular index, including the index(es) defined here, and consequently, the performance of the Fund may deviate significantly from the performance of the index(es). |
| n | A direct investment cannot be made in an index. Unless otherwise indicated, index results include reinvested dividends, and they do not reflect sales charges. Performance of the peer group, if applicable, reflects fund expenses; performance of a market index does not. |
Other information
| n | The returns shown in management’s discussion of Fund performance are based on net asset values calculated for shareholder transactions. Generally accepted accounting principles require adjustments to be made to the net assets of the Fund at period end for financial reporting purposes, and as such, the net asset values for shareholder transactions and the returns based on those net asset values may differ from the net asset values and returns reported in the Financial Highlights. |
27 Invesco Balanced-Risk Retirement Funds
Schedule of Investments
December 31, 2012
Invesco Balanced-Risk Retirement Now Fund
Schedule of Investments in Affiliated Issuers–100.06%(a)
| % of Net Assets 12/31/12 | Value 12/31/11 | Purchases at Cost | Proceeds from Sales | Change in Unrealized Appreciation | Realized Gain | Dividend Income | Shares 12/31/12 | Value 12/31/12 | ||||||||||||||||||||||||||||
Asset Allocation Funds–59.88% |
| |||||||||||||||||||||||||||||||||||
Invesco Balanced Risk Allocation Fund(b) | 59.88 | % | $ | 24,880,657 | $ | 4,813,904 | $ | (1,999,956 | ) | $ | 1,139,634 | $ | 1,006,924 | $ | 688,966 | 2,320,206 | $ | 29,072,193 | ||||||||||||||||||
Money Market Funds–40.18% |
| |||||||||||||||||||||||||||||||||||
Liquid Assets Portfolio–Institutional Class | 20.09 | % | 8,246,508 | 6,479,779 | (4,974,628 | ) | — | — | 14,921 | 9,751,659 | 9,751,659 | |||||||||||||||||||||||||
Premier Portfolio–Institutional Class | 20.09 | % | 8,246,508 | 6,479,779 | (4,974,628 | ) | — | — | 11,366 | 9,751,659 | 9,751,659 | |||||||||||||||||||||||||
Total Money Market Funds | 16,493,016 | 12,959,558 | (9,949,256 | ) | — | — | 26,287 | 19,503,318 | 19,503,318 | |||||||||||||||||||||||||||
TOTAL INVESTMENTS IN AFFILIATED MUTUAL FUNDS (Cost $45,110,303) | 100.06 | % | $ | 41,373,673 | $ | 17,773,462 | $ | (11,949,212 | ) | $ | 1,139,634 | $ | 1,006,924 | (c) | $ | 715,253 | $ | 48,575,511 | ||||||||||||||||||
OTHER ASSETS LESS LIABILITIES | (0.06 | )% | (28,479 | ) | ||||||||||||||||||||||||||||||||
NET ASSETS | 100.00 | % | $ | 48,547,032 | ||||||||||||||||||||||||||||||||
Invesco Balanced-Risk Retirement 2020 Fund
Schedule of Investments in Affiliated Issuers–99.17%(a)
| % of Net Assets 12/31/12 | Value 12/31/11 | Purchases at Cost | Proceeds from Sales | Change in Unrealized Appreciation | Realized Gain | Dividend Income | Shares 12/31/12 | Value 12/31/12 | ||||||||||||||||||||||||||||
Asset Allocation Funds–89.11% |
| |||||||||||||||||||||||||||||||||||
Invesco Balanced Risk Allocation Fund(b) | 89.11 | % | $ | 57,992,978 | $ | 31,541,116 | $ | (4,485,312 | ) | $ | 2,816,468 | $ | 2,697,144 | $ | 2,067,546 | 7,043,337 | $ | 88,253,017 | ||||||||||||||||||
Money Market Funds–10.06% |
| |||||||||||||||||||||||||||||||||||
Liquid Assets Portfolio–Institutional Class | 5.03 | % | 1,871,475 | 19,177,783 | (16,067,342 | ) | — | — | 5,514 | 4,981,916 | 4,981,916 | |||||||||||||||||||||||||
Premier Portfolio–Institutional Class | 5.03 | % | 1,871,475 | 19,177,783 | (16,067,342 | ) | — | — | 4,192 | 4,981,916 | 4,981,916 | |||||||||||||||||||||||||
Total Money Market Funds | 3,742,950 | 38,355,566 | (32,134,684 | ) | — | — | 9,706 | 9,963,832 | 9,963,832 | |||||||||||||||||||||||||||
TOTAL INVESTMENTS IN AFFILIATED MUTUAL FUNDS (Cost $90,377,369) | 99.17 | % | $ | 61,735,928 | $ | 69,896,682 | $ | (36,619,996 | ) | $ | 2,816,468 | $ | 2,697,144 | (c) | $ | 2,077,252 | $ | 98,216,849 | ||||||||||||||||||
OTHER ASSETS LESS LIABILITIES | 0.83 | % | 824,376 | |||||||||||||||||||||||||||||||||
NET ASSETS | 100.00 | % | $ | 99,041,225 | ||||||||||||||||||||||||||||||||
Invesco Balanced-Risk Retirement 2030 Fund
Schedule of Investments in Affiliated Issuers–100.73%(a)
| % of Net Assets 12/31/12 | Value 12/31/11 | Purchases at Cost | Proceeds from Sales | Change in Unrealized Appreciation | Realized Gain | Dividend Income | Shares 12/31/12 | Value 12/31/12 | ||||||||||||||||||||||||||||
Asset Allocation Funds–99.57% |
| |||||||||||||||||||||||||||||||||||
Invesco Balanced Risk Allocation Fund(b) | 99.57 | % | $ | 54,793,262 | $ | 44,893,522 | $ | (2,081,724 | ) | $ | 3,003,733 | $ | 2,584,055 | $ | 2,398,395 | 7,968,124 | $ | 100,513,852 | ||||||||||||||||||
Money Market Funds–1.16% |
| |||||||||||||||||||||||||||||||||||
Liquid Assets Portfolio–Institutional Class | 0.58 | % | 245,091 | 21,018,399 | (20,675,300 | ) | — | — | 556 | 588,190 | 588,190 | |||||||||||||||||||||||||
Premier Portfolio–Institutional Class | 0.58 | % | 245,091 | 21,018,399 | (20,675,300 | ) | — | — | 422 | 588,190 | 588,190 | |||||||||||||||||||||||||
Total Money Market Funds | 490,182 | 42,036,798 | (41,350,600 | ) | — | — | 978 | 1,176,380 | 1,176,380 | |||||||||||||||||||||||||||
TOTAL INVESTMENTS IN AFFILIATED MUTUAL FUNDS (Cost $94,202,906) | 100.73 | % | $ | 55,283,444 | $ | 86,930,320 | $ | (43,432,324 | ) | $ | 3,003,733 | $ | 2,584,055 | (c) | $ | 2,399,373 | $ | 101,690,232 | ||||||||||||||||||
OTHER ASSETS LESS LIABILITIES | (0.73 | )% | (739,702 | ) | ||||||||||||||||||||||||||||||||
NET ASSETS | 100.00 | % | $ | 100,950,530 | ||||||||||||||||||||||||||||||||
Notes to Schedule of Investments:
| (a) | Each underlying fund and the Fund are affiliated by either having the same investment adviser or an investment adviser under common control with the Fund’s investment adviser. |
| (b) | Effective September 24, 2012, the Fund began investing in Class R6 shares. |
| (c) | Includes $768,970, $2,309,377 and $2,678,996 of capital gains from affiliated underlying funds for Invesco Balanced-Risk Retirement Now Fund, Invesco Balanced-Risk Retirement 2020 Fund and Invesco Balanced-Risk Retirement 2030 Fund, respectively. |
See accompanying Notes to Financial Statements which are an integral part of the financial statements.
28 Invesco Balanced-Risk Retirement Funds
Schedule of Investments—(continued)
December 31, 2012
Invesco Balanced-Risk Retirement 2040 Fund
Schedule of Investments in Affiliated Issuers–99.08%(a)
| % of Net Assets 12/31/12 | Value 12/31/11 | Purchases at Cost | Proceeds from Sales | Change in Unrealized Appreciation | Realized Gain | Dividend Income | Shares 12/31/12 | Value 12/31/12 | ||||||||||||||||||||||||||||
Asset Allocation Funds–98.44% |
| |||||||||||||||||||||||||||||||||||
Invesco Balanced Risk Allocation Fund(b) | 98.44 | % | $ | 27,237,168 | $ | 29,780,103 | $ | (1,734,693 | ) | $ | 1,542,391 | $ | 1,445,954 | $ | 1,329,447 | 4,532,015 | $ | 56,786,150 | ||||||||||||||||||
Money Market Funds–0.64% |
| |||||||||||||||||||||||||||||||||||
Liquid Assets Portfolio–Institutional Class | 0.32 | % | 134,469 | 12,703,761 | (12,651,447 | ) | — | — | 314 | 186,783 | 186,783 | |||||||||||||||||||||||||
Premier Portfolio–Institutional Class | 0.32 | % | 134,468 | 12,703,761 | (12,651,446 | ) | — | — | 239 | 186,783 | 186,783 | |||||||||||||||||||||||||
Total Money Market Funds | 268,937 | 25,407,522 | (25,302,893 | ) | — | — | 553 | 373,566 | 373,566 | |||||||||||||||||||||||||||
TOTAL INVESTMENTS IN AFFILIATED MUTUAL FUNDS (Cost $53,373,991) | 99.08 | % | $ | 27,506,105 | $ | 55,187,625 | $ | (27,037,586 | ) | $ | 1,542,391 | $ | 1,445,954 | (c) | $ | 1,330,000 | $ | 57,159,716 | ||||||||||||||||||
OTHER ASSETS LESS LIABILITIES | 0.92 | % | 528,962 | |||||||||||||||||||||||||||||||||
NET ASSETS | 100.00 | % | $ | 57,688,678 | ||||||||||||||||||||||||||||||||
Invesco Balanced-Risk Retirement 2050 Fund
Schedule of Investments in Affiliated Issuers–100.77%(a)
| % of Net Assets 12/31/12 | Value 12/31/11 | Purchases at Cost | Proceeds from Sales | Change in Unrealized Appreciation | Realized Gain | Dividend Income | Shares 12/31/12 | Value 12/31/12 | ||||||||||||||||||||||||||||
Asset Allocation Funds–99.69% |
| |||||||||||||||||||||||||||||||||||
Invesco Balanced Risk Allocation Fund(b) | 99.69 | % | $ | 13,898,204 | $ | 16,132,853 | $ | (1,086,607 | ) | $ | 853,068 | $ | 812,928 | $ | 710,738 | 2,365,571 | $ | 29,816,869 | ||||||||||||||||||
Money Market Funds–1.08% |
| |||||||||||||||||||||||||||||||||||
Liquid Assets Portfolio–Institutional Class | 0.54 | % | 47,505 | 7,578,074 | (7,463,001 | ) | — | — | 165 | 162,578 | 162,578 | |||||||||||||||||||||||||
Premier Portfolio–Institutional Class | 0.54 | % | 47,505 | 7,578,074 | (7,463,001 | ) | — | — | 125 | 162,578 | 162,578 | |||||||||||||||||||||||||
Total Money Market Funds | 95,010 | 15,156,148 | (14,926,002 | ) | — | — | 290 | 325,156 | 325,156 | |||||||||||||||||||||||||||
TOTAL INVESTMENTS IN AFFILIATED MUTUAL FUNDS (Cost $28,449,677) | 100.77 | % | $ | 13,993,214 | $ | 31,289,001 | $ | (16,012,609 | ) | $ | 853,068 | $ | 812,928 | (c) | $ | 711,028 | $ | 30,142,025 | ||||||||||||||||||
OTHER ASSETS LESS LIABILITIES | (0.77 | )% | (231,321 | ) | ||||||||||||||||||||||||||||||||
NET ASSETS | 100.00 | % | $ | 29,910,704 | ||||||||||||||||||||||||||||||||
Notes to Schedule of Investments:
| (a) | Each underlying fund and the Fund are affiliated by either having the same investment adviser or an investment adviser under common control with the Fund’s investment adviser. |
| (b) | Effective September 24, 2012, the Fund began investing in Class R6 shares. |
| (c) | Includes $1,484,773 and $793,577 of capital gains from affiliated underlying funds for Invesco Balanced-Risk Retirement 2040 Fund and Invesco Balanced-Risk Retirement 2050 Fund, respectively. |
See accompanying Notes to Financial Statements which are an integral part of the financial statements.
29 Invesco Balanced-Risk Retirement Funds
Statement of Assets and Liabilities
December 31, 2012
| Invesco Balanced- Risk Retirement Now Fund | Invesco Balanced- Risk Retirement 2020 Fund | Invesco Balanced- Risk Retirement 2030 Fund | Invesco Balanced- Risk Retirement 2040 Fund | Invesco Balanced- Risk Retirement 2050 Fund | ||||||||||||||||||||||||||
Assets: | ||||||||||||||||||||||||||||||
Investments in affiliated underlying funds, at value | $ | 48,575,511 | $ | 98,216,849 | $ | 101,690,232 | $ | 57,159,716 | $ | 30,142,025 | ||||||||||||||||||||
Receivable for: | ||||||||||||||||||||||||||||||
Fund shares sold | 83,570 | 1,044,356 | 429,841 | 601,155 | 56,791 | |||||||||||||||||||||||||
Dividends from underlying funds | 2,196 | 1,115 | 100 | 49 | 25 | |||||||||||||||||||||||||
Fund expenses absorbed | — | 8,549 | 7,990 | 6,001 | 8,527 | |||||||||||||||||||||||||
Investment for trustee deferred compensation and retirement plans | 28,310 | 18,443 | 18,605 | 18,565 | 17,544 | |||||||||||||||||||||||||
Other assets | 48,372 | 51,451 | 53,033 | 49,945 | 49,260 | |||||||||||||||||||||||||
Total assets | 48,737,959 | 99,340,763 | 102,199,801 | 57,835,431 | 30,274,172 | |||||||||||||||||||||||||
Liabilities: | ||||||||||||||||||||||||||||||
Payable for: | ||||||||||||||||||||||||||||||
Investments purchased | — | — | 673,265 | — | 176,269 | |||||||||||||||||||||||||
Fund shares reacquired | 47,101 | 172,740 | 451,054 | 48,443 | 107,643 | |||||||||||||||||||||||||
Accrued fees to affiliates | 32,287 | 67,490 | 64,818 | 44,037 | 28,890 | |||||||||||||||||||||||||
Accrued operating expenses | 81,238 | 37,542 | 38,641 | 34,330 | 32,581 | |||||||||||||||||||||||||
Trustee deferred compensation and retirement plans | 30,301 | 21,766 | 21,493 | 19,943 | 18,085 | |||||||||||||||||||||||||
Total liabilities | 190,927 | 299,538 | 1,249,271 | 146,753 | 363,468 | |||||||||||||||||||||||||
Net assets applicable to shares outstanding | $ | 48,547,032 | $ | 99,041,225 | $ | 100,950,530 | $ | 57,688,678 | $ | 29,910,704 | ||||||||||||||||||||
Net assets consist of: | ||||||||||||||||||||||||||||||
Shares of beneficial interest | $ | 44,814,302 | $ | 90,319,785 | $ | 92,557,410 | $ | 53,504,821 | $ | 27,984,932 | ||||||||||||||||||||
Undistributed net investment income (loss) | (26,927 | ) | 8,014 | 648 | 59,479 | (15,997 | ) | |||||||||||||||||||||||
Undistributed net realized gain | 294,449 | 873,946 | 905,146 | 338,653 | 249,421 | |||||||||||||||||||||||||
Unrealized appreciation | 3,465,208 | 7,839,480 | 7,487,326 | 3,785,725 | 1,692,348 | |||||||||||||||||||||||||
| $ | 48,547,032 | $ | 99,041,225 | $ | 100,950,530 | $ | 57,688,678 | $ | 29,910,704 | |||||||||||||||||||||
See accompanying Notes to Financial Statements which are an integral part of the financial statements.
30 Invesco Balanced-Risk Retirement Funds
Statement of Assets and Liabilities—(continued)
December 31, 2012
| Invesco Balanced- Risk Retirement Now Fund | Invesco Balanced- Risk Retirement 2020 Fund | Invesco Balanced- Risk Retirement 2030 Fund | Invesco Balanced- Risk Retirement 2040 Fund | Invesco Balanced- Risk Retirement 2050 Fund | ||||||||||||||||||||||||||
Net Assets: |
| |||||||||||||||||||||||||||||
Class A | $ | 13,959,311 | $ | 41,873,200 | $ | 38,141,586 | $ | 28,425,825 | $ | 12,933,095 | ||||||||||||||||||||
Class AX | $ | 18,345,145 | $ | 14,124,588 | $ | 10,272,837 | $ | 3,998,651 | $ | 1,257,813 | ||||||||||||||||||||
Class B | $ | 683,571 | $ | 3,501,034 | $ | 3,507,437 | $ | 1,263,223 | $ | 472,926 | ||||||||||||||||||||
Class C | $ | 4,772,971 | $ | 10,550,341 | $ | 10,976,043 | $ | 6,376,639 | $ | 3,975,499 | ||||||||||||||||||||
Class CX | $ | 4,666,587 | $ | 3,758,973 | $ | 2,017,172 | $ | 589,966 | $ | 127,764 | ||||||||||||||||||||
Class R | $ | 2,005,732 | $ | 10,941,930 | $ | 12,296,489 | $ | 8,197,118 | $ | 3,846,339 | ||||||||||||||||||||
Class RX | $ | 496,823 | $ | 1,957,146 | $ | 1,176,720 | $ | 781,290 | $ | 204,527 | ||||||||||||||||||||
Class Y | $ | 672,681 | $ | 6,485,640 | $ | 4,076,888 | $ | 1,967,382 | $ | 1,336,366 | ||||||||||||||||||||
Class R5 | $ | 2,934,507 | $ | 5,838,778 | $ | 18,475,750 | $ | 6,078,922 | $ | 5,746,764 | ||||||||||||||||||||
Class R6 | $ | 9,704 | $ | 9,595 | $ | 9,608 | $ | 9,662 | $ | 9,611 | ||||||||||||||||||||
Shares outstanding, $0.01 par value per share, |
| |||||||||||||||||||||||||||||
Class A | 1,538,497 | 4,404,541 | 4,133,803 | 3,245,432 | 1,490,302 | |||||||||||||||||||||||||
Class AX | 2,024,146 | 1,485,798 | 1,113,087 | 456,873 | 144,809 | |||||||||||||||||||||||||
Class B | 76,209 | 372,435 | 383,578 | 145,732 | 55,165 | |||||||||||||||||||||||||
Class C | 531,805 | 1,124,625 | 1,201,839 | 736,576 | 462,965 | |||||||||||||||||||||||||
Class CX | 520,166 | 400,579 | 220,878 | 68,205 | 14,884 | |||||||||||||||||||||||||
Class R | 221,764 | 1,155,673 | 1,339,424 | 940,292 | 445,095 | |||||||||||||||||||||||||
Class RX | 54,965 | 206,718 | 128,234 | 89,554 | 23,654 | |||||||||||||||||||||||||
Class Y | 73,873 | 682,075 | 440,857 | 224,148 | 153,704 | |||||||||||||||||||||||||
Class R5 | 322,385 | 611,152 | 1,993,340 | 692,034 | 660,294 | |||||||||||||||||||||||||
Class R6 | 1,066 | 1,004 | 1,036 | 1,100 | 1,104 | |||||||||||||||||||||||||
Class A: | ||||||||||||||||||||||||||||||
Net asset value per share | $ | 9.07 | $ | 9.51 | $ | 9.23 | $ | 8.76 | $ | 8.68 | ||||||||||||||||||||
Maximum offering price per share (Net asset value ÷ 94.50%) | $ | 9.60 | $ | 10.06 | $ | 9.77 | $ | 9.27 | $ | 9.19 | ||||||||||||||||||||
Class AX: | ||||||||||||||||||||||||||||||
Net asset value and offering price per share | $ | 9.06 | $ | 9.51 | $ | 9.23 | $ | 8.75 | $ | 8.69 | ||||||||||||||||||||
Maximum offering price per share (Net asset value ÷ 94.50%) | $ | 9.59 | $ | 10.06 | $ | 9.77 | $ | 9.26 | $ | 9.20 | ||||||||||||||||||||
Class B: | $ | 8.97 | $ | 9.40 | $ | 9.14 | $ | 8.67 | $ | 8.57 | ||||||||||||||||||||
Class C: | $ | 8.98 | $ | 9.38 | $ | 9.13 | $ | 8.66 | $ | 8.59 | ||||||||||||||||||||
Class CX: | $ | 8.97 | $ | 9.38 | $ | 9.13 | $ | 8.65 | $ | 8.58 | ||||||||||||||||||||
Class R: | $ | 9.04 | $ | 9.47 | $ | 9.18 | $ | 8.72 | $ | 8.64 | ||||||||||||||||||||
Class RX: | $ | 9.04 | $ | 9.47 | $ | 9.18 | $ | 8.72 | $ | 8.65 | ||||||||||||||||||||
Class Y: | $ | 9.11 | $ | 9.51 | $ | 9.25 | $ | 8.78 | $ | 8.69 | ||||||||||||||||||||
Class R5: | $ | 9.10 | $ | 9.55 | $ | 9.27 | $ | 8.78 | $ | 8.70 | ||||||||||||||||||||
Class R6: | $ | 9.10 | $ | 9.56 | $ | 9.27 | $ | 8.78 | $ | 8.71 | ||||||||||||||||||||
Cost of Investments in affiliated underlying funds | $ | 45,110,303 | $ | 90,377,369 | $ | 94,202,906 | $ | 53,373,991 | $ | 28,449,677 | ||||||||||||||||||||
See accompanying Notes to Financial Statements which are an integral part of the financial statements.
31 Invesco Balanced-Risk Retirement Funds
Statement of Operations
For the year ended December 31, 2012
| Invesco Balanced- Risk Retirement Now Fund | Invesco Balanced- Risk Retirement 2020 Fund | Invesco Balanced- Risk Retirement 2030 Fund | Invesco Balanced- Risk Retirement 2040 Fund | Invesco Balanced- Risk Retirement 2050 Fund | ||||||||||||||||||||||||||
Investment income: | ||||||||||||||||||||||||||||||
Dividends from affiliated underlying funds | $ | 715,253 | $ | 2,077,252 | $ | 2,399,373 | $ | 1,330,000 | $ | 711,028 | ||||||||||||||||||||
Expenses: | ||||||||||||||||||||||||||||||
Administrative services fees | 50,000 | 50,000 | 50,000 | 50,000 | 50,000 | |||||||||||||||||||||||||
Custodian fees | 7,638 | 7,648 | 7,654 | 7,677 | 7,661 | |||||||||||||||||||||||||
Distribution fees: | ||||||||||||||||||||||||||||||
Class A | 31,033 | 85,854 | 77,820 | 51,737 | 27,772 | |||||||||||||||||||||||||
Class AX | 48,713 | 37,515 | 26,580 | 10,172 | 3,658 | |||||||||||||||||||||||||
Class B | 7,495 | 34,200 | 34,429 | 13,016 | 4,875 | |||||||||||||||||||||||||
Class C | 35,706 | 79,722 | 84,751 | 50,230 | 30,798 | |||||||||||||||||||||||||
Class CX | 47,768 | 37,982 | 19,665 | 5,814 | 1,140 | |||||||||||||||||||||||||
Class R | 9,296 | 42,553 | 49,302 | 32,015 | 14,054 | |||||||||||||||||||||||||
Class RX | 2,505 | 8,196 | 5,082 | 3,498 | 903 | |||||||||||||||||||||||||
Transfer agent fees | 68,347 | 141,940 | 135,808 | 106,394 | 67,172 | |||||||||||||||||||||||||
Transfer agent fees — R5 | 2,602 | 4,867 | 10,432 | 5,472 | 4,892 | |||||||||||||||||||||||||
Trustees’ and officers’ fees and benefits | 22,719 | 23,970 | 23,701 | 22,739 | 21,603 | |||||||||||||||||||||||||
Registration and filing fees | 104,535 | 108,749 | 106,888 | 104,642 | 102,390 | |||||||||||||||||||||||||
Professional services fees | 40,076 | 36,900 | 36,882 | 36,173 | 36,422 | |||||||||||||||||||||||||
Other | 32,468 | 36,606 | 37,021 | 29,773 | 25,313 | |||||||||||||||||||||||||
Total expenses | 510,901 | 736,702 | 706,015 | 529,352 | 398,653 | |||||||||||||||||||||||||
Less: Fees waived, expenses reimbursed and expense offset arrangement(s) | (328,439 | ) | (410,832 | ) | (408,475 | ) | (362,955 | ) | (315,494 | ) | ||||||||||||||||||||
Net expenses | 182,462 | 325,870 | 297,540 | 166,397 | 83,159 | |||||||||||||||||||||||||
Net investment income | 532,791 | 1,751,382 | 2,101,833 | 1,163,603 | 627,869 | |||||||||||||||||||||||||
Realized and unrealized gain (loss) from: | ||||||||||||||||||||||||||||||
Net realized gain (loss) from affiliated underlying funds | 237,954 | 387,767 | (94,941 | ) | (38,819 | ) | 19,351 | |||||||||||||||||||||||
Net realized gain from distributions of affiliated underlying fund shares | 768,970 | 2,309,377 | 2,678,996 | 1,484,773 | 793,577 | |||||||||||||||||||||||||
Net realized gain from affiliated underlying fund shares | 1,006,924 | 2,697,144 | 2,584,055 | 1,445,954 | 812,928 | |||||||||||||||||||||||||
Change in net unrealized appreciation of affiliated underlying fund shares | 1,139,634 | 2,816,468 | 3,003,733 | 1,542,391 | 853,068 | |||||||||||||||||||||||||
Net increase in net assets resulting from operations | $ | 2,679,349 | $ | 7,264,994 | $ | 7,689,621 | $ | 4,151,948 | $ | 2,293,865 | ||||||||||||||||||||
See accompanying Notes to Financial Statements which are an integral part of the financial statements.
32 Invesco Balanced-Risk Retirement Funds
Statement of Changes In Net Assets
For the years ended December 31, 2012 and 2011
| Invesco Balanced-Risk Retirement Now Fund | Invesco Balanced-Risk Retirement 2020 Fund | |||||||||||||||||||
| 2012 | 2011 | 2012 | 2011 | |||||||||||||||||
Operations: | ||||||||||||||||||||
Net investment income | $ | 532,791 | $ | 576,436 | $ | 1,751,382 | $ | 1,351,674 | ||||||||||||
Net realized gain | 1,006,924 | 795,291 | 2,697,144 | 1,066,500 | ||||||||||||||||
Change in net unrealized appreciation | 1,139,634 | 685,013 | 2,816,468 | 2,788,131 | ||||||||||||||||
Net increase in net assets resulting from operations | 2,679,349 | 2,056,740 | 7,264,994 | 5,206,305 | ||||||||||||||||
Distributions to shareholders from net investment income: | ||||||||||||||||||||
Class A | (299,926 | ) | (142,006 | ) | (1,335,635 | ) | (637,429 | ) | ||||||||||||
Class AX | (406,439 | ) | (300,736 | ) | (472,452 | ) | (379,073 | ) | ||||||||||||
Class B | (12,854 | ) | (9,373 | ) | (93,869 | ) | (57,488 | ) | ||||||||||||
Class C | (86,393 | ) | (28,937 | ) | (286,752 | ) | (91,258 | ) | ||||||||||||
Class CX | (84,769 | ) | (57,934 | ) | (103,448 | ) | (70,161 | ) | ||||||||||||
Class R | (40,136 | ) | (24,061 | ) | (343,233 | ) | (133,027 | ) | ||||||||||||
Class RX | (10,242 | ) | (5,323 | ) | (60,516 | ) | (32,129 | ) | ||||||||||||
Class Y | (14,994 | ) | (4,411 | ) | (232,925 | ) | (10,034 | ) | ||||||||||||
Class R5 | (65,288 | ) | (407 | ) | (193,084 | ) | (340 | ) | ||||||||||||
Class R6 | (207 | ) | — | (353 | ) | — | ||||||||||||||
Total distributions from net investment income | (1,021,248 | ) | (573,188 | ) | (3,122,267 | ) | (1,410,939 | ) | ||||||||||||
Distributions to shareholders from net realized gains: | ||||||||||||||||||||
Class A | (167,650 | ) | (116,966 | ) | (419,007 | ) | (317,750 | ) | ||||||||||||
Class AX | (223,709 | ) | (256,120 | ) | (148,215 | ) | (188,963 | ) | ||||||||||||
Class B | (8,702 | ) | (9,596 | ) | (36,203 | ) | (39,478 | ) | ||||||||||||
Class C | (58,465 | ) | (29,727 | ) | (110,594 | ) | (62,653 | ) | ||||||||||||
Class CX | (57,385 | ) | (62,055 | ) | (39,897 | ) | (48,181 | ) | ||||||||||||
Class R | (23,807 | ) | (21,674 | ) | (114,633 | ) | (73,004 | ) | ||||||||||||
Class RX | (6,028 | ) | (4,457 | ) | (20,211 | ) | (17,632 | ) | ||||||||||||
Class Y | (8,097 | ) | (3,368 | ) | (68,597 | ) | (4,580 | ) | ||||||||||||
Class R5 | (35,155 | ) | (324 | ) | (56,864 | ) | (155 | ) | ||||||||||||
Class R6 | (121 | ) | — | (104 | ) | — | ||||||||||||||
Total distributions from net realized gains | (589,119 | ) | (504,287 | ) | (1,014,325 | ) | (752,396 | ) | ||||||||||||
Share transactions–net: | ||||||||||||||||||||
Class A | 3,562,416 | 7,468,007 | 14,139,281 | 7,377,508 | ||||||||||||||||
Class AX | (2,589,651 | ) | 6,896,451 | (1,962,200 | ) | (6,813,063 | ) | |||||||||||||
Class B | (147,609 | ) | 492,764 | 172,834 | 108,462 | |||||||||||||||
Class C | 2,323,503 | 1,484,874 | 5,006,139 | 1,127,300 | ||||||||||||||||
Class CX | (338,074 | ) | 1,873,454 | (290,351 | ) | (885,178 | ) | |||||||||||||
Class R | 192,022 | 989,227 | 4,776,823 | 431,958 | ||||||||||||||||
Class RX | 17,608 | 443,364 | 449,315 | 32,653 | ||||||||||||||||
Class Y | 361,235 | 158,367 | 6,107,226 | 253,865 | ||||||||||||||||
Class R5 | 2,875,078 | 12,119 | 5,664,585 | — | ||||||||||||||||
Class R6 | 10,000 | — | 10,000 | — | ||||||||||||||||
Net increase in net assets resulting from share transactions | 6,266,528 | 19,818,627 | 34,073,652 | 1,633,505 | ||||||||||||||||
Net increase in net assets | 7,335,510 | 20,797,892 | 37,202,054 | 4,676,475 | ||||||||||||||||
Net assets: | ||||||||||||||||||||
Beginning of year | 41,211,522 | 20,413,630 | 61,839,171 | 57,162,696 | ||||||||||||||||
End of year * | $ | 48,547,032 | $ | 41,211,522 | $ | 99,041,225 | $ | 61,839,171 | ||||||||||||
* Includes accumulated undistributed net investment income (loss) | $ | (26,927 | ) | $ | (2,473 | ) | $ | 8,014 | $ | (12,782 | ) | |||||||||
See accompanying Notes to Financial Statements which are an integral part of the financial statements.
33 Invesco Balanced-Risk Retirement Funds
Statement of Changes In Net Assets—(continued)
For the years ended December 31, 2012 and 2011
| Invesco Balanced-Risk Retirement 2030 Fund | Invesco Balanced-Risk Retirement 2040 Fund | |||||||||||||||||||
| 2012 | 2011 | 2012 | 2011 | |||||||||||||||||
Operations: | ||||||||||||||||||||
Net investment income | $ | 2,101,833 | $ | 1,292,984 | $ | 1,163,603 | $ | 646,115 | ||||||||||||
Net realized gain | 2,584,055 | 598,022 | 1,445,954 | 334,919 | ||||||||||||||||
Change in net unrealized appreciation | 3,003,733 | 2,668,629 | 1,542,391 | 1,317,183 | ||||||||||||||||
Net increase in net assets resulting from operations | 7,689,621 | 4,559,635 | 4,151,948 | 2,298,217 | ||||||||||||||||
Distributions to shareholders from net investment income: | ||||||||||||||||||||
Class A | (1,381,098 | ) | (564,945 | ) | (1,021,751 | ) | (550,998 | ) | ||||||||||||
Class AX | (381,811 | ) | (278,684 | ) | (147,086 | ) | (171,505 | ) | ||||||||||||
Class B | (111,871 | ) | (58,549 | ) | (39,445 | ) | (45,917 | ) | ||||||||||||
Class C | (322,351 | ) | (113,705 | ) | (193,340 | ) | (120,717 | ) | ||||||||||||
Class CX | (63,073 | ) | (35,879 | ) | (18,219 | ) | (21,120 | ) | ||||||||||||
Class R | (447,355 | ) | (176,712 | ) | (275,939 | ) | (144,708 | ) | ||||||||||||
Class RX | (40,965 | ) | (19,667 | ) | (26,682 | ) | (24,812 | ) | ||||||||||||
Class Y | (238,473 | ) | (65,916 | ) | (81,260 | ) | (8,277 | ) | ||||||||||||
Class R5 | (715,653 | ) | (342 | ) | (231,269 | ) | (571 | ) | ||||||||||||
Class R6 | (391 | ) | — | (386 | ) | — | ||||||||||||||
Total distributions from net investment income | (3,703,041 | ) | (1,314,399 | ) | (2,035,377 | ) | (1,088,625 | ) | ||||||||||||
Distributions to shareholders from net realized gains: | ||||||||||||||||||||
Class A | (196,416 | ) | (35,294 | ) | — | — | ||||||||||||||
Class AX | (54,300 | ) | (17,410 | ) | — | — | ||||||||||||||
Class B | (19,148 | ) | (4,966 | ) | — | — | ||||||||||||||
Class C | (55,173 | ) | (9,644 | ) | — | — | ||||||||||||||
Class CX | (10,796 | ) | (3,043 | ) | — | — | ||||||||||||||
Class R | (67,295 | ) | (12,091 | ) | — | — | ||||||||||||||
Class RX | (6,162 | ) | (1,346 | ) | — | — | ||||||||||||||
Class Y | (32,091 | ) | (3,790 | ) | — | — | ||||||||||||||
Class R5 | (96,305 | ) | (20 | ) | — | — | ||||||||||||||
Class R6 | (53 | ) | — | — | — | |||||||||||||||
Total distributions from net realized gains | (537,739 | ) | (87,604 | ) | — | — | ||||||||||||||
Share transactions-net: | ||||||||||||||||||||
Class A | 14,256,599 | 7,306,290 | 14,043,110 | 4,240,080 | ||||||||||||||||
Class AX | (1,193,851 | ) | (3,347,824 | ) | (350,806 | ) | (2,350,403 | ) | ||||||||||||
Class B | 256,113 | (365,435 | ) | (106,429 | ) | 111,726 | ||||||||||||||
Class C | 4,508,710 | 2,215,599 | 2,668,058 | 1,181,933 | ||||||||||||||||
Class CX | 26,908 | (1,237,852 | ) | (40,277 | ) | (186,529 | ) | |||||||||||||
Class R | 4,276,054 | 490,209 | 4,231,062 | (20,352 | ) | |||||||||||||||
Class RX | 279,384 | 99,640 | 108,855 | 27,297 | ||||||||||||||||
Class Y | 1,679,219 | 1,321,955 | 1,786,587 | (214,877 | ) | |||||||||||||||
Class R5 | 18,104,226 | (6,375 | ) | 5,772,560 | — | |||||||||||||||
Class R6 | 10,000 | — | 10,000 | — | ||||||||||||||||
Net increase in net assets resulting from share transactions | 42,203,362 | 6,476,207 | 28,122,720 | 2,788,875 | ||||||||||||||||
Net increase in net assets | 45,652,203 | 9,633,839 | 30,239,291 | 3,998,467 | ||||||||||||||||
Net assets: | ||||||||||||||||||||
Beginning of year | 55,298,327 | 45,664,488 | 27,449,387 | 23,450,920 | ||||||||||||||||
End of year * | $ | 100,950,530 | $ | 55,298,327 | $ | 57,688,678 | $ | 27,449,387 | ||||||||||||
* Includes accumulated undistributed net investment income (loss) | $ | 648 | $ | (12,568 | ) | $ | 59,479 | $ | 36,494 | |||||||||||
See accompanying Notes to Financial Statements which are an integral part of the financial statements.
34 Invesco Balanced-Risk Retirement Funds
Statement of Changes In Net Assets—(continued)
For the years ended December 31, 2012 and 2011
| Invesco Balanced-Risk Retirement 2050 Fund | ||||||||||
| 2012 | 2011 | |||||||||
Operations: | ||||||||||
Net investment income | $ | 627,869 | $ | 307,248 | ||||||
Net realized gain | 812,928 | 144,435 | ||||||||
Change in net unrealized appreciation | 853,068 | 479,859 | ||||||||
Net increase in net assets resulting from operations | 2,293,865 | 931,542 | ||||||||
Distributions to shareholders from net investment income: | ||||||||||
Class A | (502,940 | ) | (155,715 | ) | ||||||
Class AX | (48,878 | ) | (32,532 | ) | ||||||
Class B | (15,982 | ) | (7,997 | ) | ||||||
Class C | (129,615 | ) | (29,754 | ) | ||||||
Class CX | (4,255 | ) | (1,758 | ) | ||||||
Class R | (143,806 | ) | (39,813 | ) | ||||||
Class RX | (7,555 | ) | (3,001 | ) | ||||||
Class Y | (53,084 | ) | (14,620 | ) | ||||||
Class R5 | (232,589 | ) | (280 | ) | ||||||
Class R6 | (409 | ) | — | |||||||
Total distributions from net investment income | (1,139,113 | ) | (285,470 | ) | ||||||
Distributions to shareholders from net realized gains: | ||||||||||
Class A | (35,884 | ) | — | |||||||
Class AX | (3,487 | ) | — | |||||||
Class B | (1,343 | ) | — | |||||||
Class C | (10,888 | ) | — | |||||||
Class CX | (357 | ) | — | |||||||
Class R | (10,781 | ) | — | |||||||
Class RX | (566 | ) | — | |||||||
Class Y | (3,595 | ) | — | |||||||
Class R5 | (15,753 | ) | — | |||||||
Class R6 | (28 | ) | — | |||||||
Total distributions from net realized gains | (82,682 | ) | — | |||||||
Share transactions-net: | ||||||||||
Class A | 4,833,007 | 3,602,431 | ||||||||
Class AX | (263,983 | ) | (482,501 | ) | ||||||
Class B | (33,237 | ) | (44,422 | ) | ||||||
Class C | 1,992,261 | 1,092,972 | ||||||||
Class CX | 22,773 | (241,415 | ) | |||||||
Class R | 1,827,797 | 100,199 | ||||||||
Class RX | 49,749 | 782 | ||||||||
Class Y | 849,613 | 293,051 | ||||||||
Class R5 | 5,515,524 | — | ||||||||
Class R6 | 10,000 | — | ||||||||
Net increase in net assets resulting from share transactions | 14,803,504 | 4,321,097 | ||||||||
Net increase in net assets | 15,875,574 | 4,967,169 | ||||||||
Net assets: | ||||||||||
Beginning of year | 14,035,130 | 9,067,961 | ||||||||
End of year * | $ | 29,910,704 | $ | 14,035,130 | ||||||
* Includes accumulated undistributed net investment income (loss) | $ | (15,997 | ) | $ | 14,590 | |||||
See accompanying Notes to Financial Statements which are an integral part of the financial statements.
35 Invesco Balanced-Risk Retirement Funds
Notes to Financial Statements
December 31, 2012
NOTE 1—Significant Accounting Policies
AIM Growth Series (Invesco Growth Series) (the “Trust”) is organized as a Delaware statutory trust and is registered under the Investment Company Act of 1940, as amended (the “1940 Act”), as an open-end series management investment company consisting of sixteen separate series portfolios (each constituting a “Fund”), each authorized to issue an unlimited number of shares of beneficial interest. The Funds covered in this report, each a series portfolio of the Trust, are Invesco Balanced-Risk Retirement Now Fund, Invesco Balanced-Risk Retirement 2020 Fund, Invesco Balanced-Risk Retirement 2030 Fund, Invesco Balanced-Risk Retirement 2040 Fund and Invesco Balanced-Risk Retirement 2050 Fund (collectively, the “Funds”). The assets, liabilities and operations of each Fund are accounted for separately. Information presented in these financial statements pertains only to the Funds. Matters affecting each Fund or class will be voted on exclusively by the shareholders of such Fund or class.
The investment objectives of the Funds are: to provide real return and, as a secondary objective, capital preservation for Invesco Balanced-Risk Retirement Now Fund; and to provide total return with a low to moderate correlation to traditional financial market indices and, as a secondary objective, capital preservation for Invesco Balanced-Risk Retirement 2020 Fund, Invesco Balanced-Risk Retirement 2030 Fund, Invesco Balanced-Risk Retirement 2040 Fund and Invesco Balanced-Risk Retirement 2050 Fund.
Each Fund currently consists of ten different classes of shares: Class A, Class AX, Class B, Class C, Class CX, Class R, Class RX, Class Y, Class R5 and Class R6. On September 24, 2012, Class A5, C5, R5 and Institutional Class shares were renamed Class AX, CX, RX and R5 shares, respectively, and the Fund began offering Class R6 shares. Class AX, Class CX and Class RX shares are closed to new investors. Class A shares and Class AX shares are sold with a front-end sales charge unless certain waiver criteria are met and under certain circumstances load waived shares may be subject to contingent deferred sales charges (“CDSC”). Class C and Class CX shares are sold with a CDSC. Class R, Class RX, Class Y, Class R5 and Class R6 shares are sold at net asset value. Effective November 30, 2010, new or additional investments in Class B shares are no longer permitted. Existing shareholders of Class B shares may continue to reinvest dividends and capital gains distributions in Class B shares until they convert to Class A shares. Also, shareholders in Class B shares will be able to exchange those shares for Class B shares of other Invesco Funds offering such shares until they convert to Class A shares. Generally, Class B shares will automatically convert to Class A shares on or about the month-end, which is at least eight years after the date of purchase. Redemption of Class B shares prior to the conversion date will be subject to a CDSC.
Each Fund is a “fund of funds,” in that it invests in other mutual funds (“underlying funds”) advised by Invesco Advisers, Inc. (the “Adviser” or “Invesco”). The Adviser may change each Fund’s asset class allocations, the underlying funds or the target weightings in an underlying fund without shareholder approval. Effective February 26, 2013, Invesco Balanced-Risk Aggressive Allocation Fund has been added as an underlying fund. The underlying funds may engage in a number of investment techniques and practices, which involve certain risks. Each underlying fund’s accounting policies are outlined in the underlying fund’s financial statements and are available upon request.
The following is a summary of the significant accounting policies followed by the Funds in the preparation of their financial statements.
| A. | Security Valuations — Securities of investment companies that trade on an exchange are valued at the last sales price or official closing price as of the close of the customary trading session on the exchange where the security is principally traded. Investments in shares of funds that are not traded on an exchange are valued at the end of day net asset value per share of such fund. Securities in the underlying funds, including restricted securities are valued in accordance with valuation policy of such fund. The policies of underlying funds affiliated with the funds as a result of having the same investment advisor are set forth below. |
A security listed or traded on an exchange (except convertible bonds) is valued at its last sales price or official closing price as of the close of the customary trading session on the exchange where the security is principally traded, or lacking any sales or official closing price on a particular day, the security may be valued at the closing bid price on that day. Securities traded in the over-the-counter market are valued based on prices furnished by independent pricing services or market makers. When such securities are valued by an independent pricing service they may be considered fair valued. Futures contracts are valued at the final settlement price set by an exchange on which they are principally traded. Listed options are valued at the mean between the last bid and ask prices from the exchange on which they are principally traded. Options not listed on an exchange are valued by an independent source at the mean between the last bid and ask prices. For purposes of determining net asset value per share, futures and option contracts generally are valued 15 minutes after the close of the customary trading session of the New York Stock Exchange (“NYSE”).
Senior secured floating rate loans and senior secured floating rate debt securities are fair valued using an evaluated quote provided by an independent pricing service. Evaluated quotes provided by the pricing service may reflect appropriate factors such as ratings, tranche type, industry, company performance, spread, individual trading characteristics, institution-size trading in similar groups of securities and other market data.
Investments in open-end and closed-end registered investment companies that do not trade on an exchange are valued at the end of day net asset value per share. Investments in open-end and closed-end registered investment companies that trade on an exchange are valued at the last sales price or official closing price as of the close of the customary trading session on the exchange where the security is principally traded.
Debt obligations (including convertible bonds) and unlisted equities are fair valued using an evaluated quote provided by an independent pricing service. Evaluated quotes provided by the pricing service may be determined without exclusive reliance on quoted prices, and may reflect appropriate factors such as institution-size trading in similar groups of securities, developments related to specific securities, dividend rate (for unlisted equities), yield (for debt obligations), quality, type of issue, coupon rate (for debt obligations), maturity (for debt obligations), individual trading characteristics and other market data. Debt obligations are subject to interest rate and credit risks. In addition, all debt obligations involve some risk of default with respect to interest and/or principal payments.
Foreign securities’ (including foreign exchange contracts) prices are converted into U.S. dollar amounts using the applicable exchange rates as of the close of the NYSE. If market quotations are available and reliable for foreign exchange-traded equity securities, the securities will be valued at the market quotations. Because trading hours for certain foreign securities end before the close of the NYSE, closing market quotations may become unreliable. If between the time trading ends on a particular security and the close of the customary trading session on the NYSE, events occur that the Adviser determines are significant and make the closing price unreliable, the Fund may fair value the security. If the event is likely to have affected the closing price of the security, the security will be valued at fair value in good faith using procedures approved by the Board of
36 Invesco Balanced-Risk Retirement Funds
Trustees. Adjustments to closing prices to reflect fair value may also be based on a screening process of an independent pricing service to indicate the degree of certainty, based on historical data, that the closing price in the principal market where a foreign security trade is not the current value as of the close of the NYSE. Foreign securities’ prices meeting the approved degree of certainty that the price is not reflective of current value will be priced at the indication of fair value from the independent pricing service. Multiple factors may be considered by the independent pricing service in determining adjustments to reflect fair value and may include information relating to sector indices, American Depositary Receipts and domestic and foreign index futures. Foreign securities may have additional risks including exchange rate changes, potential for sharply devalued currencies and high inflation, political and economic upheaval, the relative lack of issuer information, relatively low market liquidity and the potential lack of strict financial and accounting controls and standards.
Swap agreements are fair valued using an evaluated quote provided by an independent pricing service. Evaluated quotes provided by the pricing service are valued based on a model which may include end of day net present values, spreads, ratings, industry, and company performance.
Securities for which market prices are not provided by any of the above methods may be valued based upon quotes furnished by independent sources. The last bid price may be used to value equity securities. The mean between the last bid and asked prices is used to value debt obligations, including Corporate Loans.
Securities for which market quotations are not readily available or became unreliable are valued at fair value as determined in good faith by or under the supervision of the Trust’s officers following procedures approved by the Board of Trustees. Issuer specific events, market trends, bid/ask quotes of brokers and information providers and other market data may be reviewed in the course of making a good faith determination of a security’s fair value.
Valuations change in response to many factors including the historical and prospective earnings of the issuer, the value of the issuer’s assets, general economic conditions, interest rates, investor perceptions and market liquidity. Because of the inherent uncertainties of valuation, the values reflected in the financial statements may materially differ from the value received upon actual sale of those investments.
| B. | Securities Transactions and Investment Income — Securities transactions are accounted for on a trade date basis. Realized gains or losses on sales are computed on the basis of specific identification of the securities sold. Distributions from ordinary income from underlying funds, if any, are recorded as dividend income on ex-dividend date. Distributions from gains from underlying funds, if any, are recorded as realized gains on the ex-dividend date. The following policies are followed by the underlying fund: Interest income is recorded on the accrual basis from settlement date. Dividend income (net of withholding tax, if any) is recorded on the ex-dividend date. Bond premiums and discounts are amortized and/or accreted for financial reporting purposes. |
Each Fund allocates income and realized and unrealized capital gains and losses to a class based on the relative net assets of each class.
| C. | Distributions — Invesco Balanced-Risk Retirement Now Fund generally declares and pays dividends from income, if any, quarterly. Invesco Balanced-Risk Retirement 2020 Fund, Invesco Balanced-Risk Retirement 2030 Fund, Invesco Balanced-Risk Retirement 2040 Fund and Invesco Balanced-Risk Retirement 2050 Fund generally declare and pay dividends from income, if any, annually. Distributions from net realized capital gains, if any, are generally paid annually and recorded on the ex-dividend date. The Funds may elect to treat a portion of the proceeds from redemptions as distributions for federal income tax purposes. |
| D. | Federal Income Taxes — The Funds intend to comply with the requirements of Subchapter M of the Internal Revenue Code necessary to qualify as a regulated investment company and to distribute substantially all of the Funds’ taxable earnings to shareholders. As such, the Funds will not be subject to federal income taxes on otherwise taxable income (including net realized capital gain) that is distributed to shareholders. Therefore, no provision for federal income taxes is recorded in the financial statements. |
Each Fund files tax returns in the U.S. Federal jurisdiction and certain other jurisdictions. Generally, each Fund is subject to examinations by such taxing authorities for up to three years after the filing of the return for the tax period.
| E. | Expenses — Expenses included in the accompanying financial statements reflect the expenses of the Funds and do not include any expenses of the underlying funds. The effects of the underlying funds expenses are included in the realized and unrealized gain/loss on the investments in the underlying funds. |
Fees provided for under the Rule 12b-1 plan of a particular class of each Fund and which are directly attributable to that class are charged to the operations of such class. Transfer agency fees and expenses and other shareholder recordkeeping fees and expenses attributable to Class R5 and R6 are charged to such class. Transfer agency fees and expenses and other shareholder recordkeeping fees and expenses relating to all other classes are allocated among those classes based on relative net assets. All other expenses are allocated among the classes based on relative net assets.
| F. | Accounting Estimates — The preparation of financial statements in conformity with accounting principles generally accepted in the United States of America (“GAAP”) requires management to make estimates and assumptions that affect the reported amounts of assets and liabilities at the date of the financial statements and the reported amounts of revenues and expenses during the reporting period including estimates and assumptions related to taxation. Actual results could differ from those estimates by a significant amount. In addition, the Fund monitors for material events or transactions that may occur or become known after the period-end date and before the date the financial statements are released to print. |
| G. | Indemnifications — Under the Trust’s organizational documents, each Trustee, officer, employee or other agent of the Trust is indemnified against certain liabilities that may arise out of the performance of their duties to the Funds. Additionally, in the normal course of business, the Funds enter into contracts, including each Funds’ servicing agreements, that contain a variety of indemnification clauses. Each Fund’s maximum exposure under these arrangements is unknown as this would involve future claims that may be made against such Fund that have not yet occurred. The risk of material loss as a result of such indemnification claims is considered remote. |
37 Invesco Balanced-Risk Retirement Funds
NOTE 2—Advisory Fees and Other Fees Paid to Affiliates
The Trust has entered into a master investment advisory agreement with Invesco. Under the terms of the investment advisory agreement, the Funds do not pay an advisory fee. However, each Fund pays advisory fees to Invesco indirectly as a shareholder of the underlying funds.
Under the terms of a master sub-advisory agreement between the Adviser and each of Invesco Asset Management Deutschland GmbH, Invesco Asset Management Limited, Invesco Asset Management (Japan) Limited, Invesco Australia Limited, Invesco Hong Kong Limited, Invesco Senior Secured Management, Inc. and Invesco Canada Ltd. (collectively, the “Affiliated Sub-Advisers”) the Adviser, not the Funds, may pay 40% of the fees paid to the Adviser to any such Affiliated Sub-Adviser(s) that provide discretionary investment management services to each Fund or underlying fund based on the percentage of assets allocated to such Sub-Adviser(s).
Invesco has contractually agreed, through at least April 30, 2014, to reimburse expenses to the extent necessary to limit total annual fund operating expenses after expense reimbursement (excluding certain items discussed below) of Class A, Class AX, Class B, Class C, Class CX, Class R, Class RX, Class Y, Class R5 and Class R6 shares for each Fund as shown in the following table:
| Class A/AX | Class B | Class C/CX | Class R/RX | Class Y | Class R5 | Class R6 | ||||||||||||||||||||||
Invesco Balanced-Risk Retirement Now Fund | 0.25 | % | 1.00 | % | 1.00 | % | 0.50 | % | 0.00 | % | 0.00 | % | 0.00 | % | ||||||||||||||
Invesco Balanced-Risk Retirement 2020 Fund | 0.25 | 1.00 | 1.00 | 0.50 | 0.00 | 0.00 | 0.00 | |||||||||||||||||||||
Invesco Balanced-Risk Retirement 2030 Fund | 0.25 | 1.00 | 1.00 | 0.50 | 0.00 | 0.00 | 0.00 | |||||||||||||||||||||
Invesco Balanced-Risk Retirement 2040 Fund | 0.25 | 1.00 | 1.00 | 0.50 | 0.00 | 0.00 | 0.00 | |||||||||||||||||||||
Invesco Balanced-Risk Retirement 2050 Fund | 0.25 | 1.00 | 1.00 | 0.50 | 0.00 | 0.00 | 0.00 | |||||||||||||||||||||
In determining Invesco’s obligation to reimburse expenses, the following expenses are not taken into account, and could cause the total annual fund operating expenses after expense reimbursement to exceed the numbers reflected above: (1) interest; (2) taxes; (3) dividend expense on short sales; (4) extraordinary or non-routine items, including litigation expenses; and (5) expenses that the Funds have incurred but did not actually pay because of an expense offset arrangement. Acquired Fund Fees and Expenses are not fees and expenses incurred by the Fund directly, but are fees and expenses, including management fees, of the investment companies in which the Fund invests. As a result, total annual fund operating expenses may exceed the expense limits above. You incur these expenses indirectly through the valuation of the Fund’s investment in those investment companies. The impact of the Acquired Fund Fees and Expenses are included in the total return of the Fund. Unless the Board of Trustees and Invesco mutually agree to amend or continue each Fund’s fee waiver agreement, it will terminate on April 30, 2014.
For the year ended December 31, 2012, Invesco waived and/or reimbursed the following fees and expenses:
| Fees waived | Expenses reimbursed | |||||||||||||||||||||||||||||||||||||||||||
| Fund Level | Class A | Class AX | Class B | Class C | Class CX | Class R | Class RX | Class Y | Class R5 | Class R6 | ||||||||||||||||||||||||||||||||||
Invesco Balanced-Risk Retirement Now Fund | $ | 257,490 | $ | 19,296 | $ | 30,288 | $ | 1,165 | $ | 5,550 | $ | 7,425 | $ | 2,890 | $ | 779 | $ | 828 | $ | 2,602 | $ | 0 | ||||||||||||||||||||||
Invesco Balanced-Risk Retirement 2020 Fund | 264,026 | 61,986 | 27,085 | 6,173 | 14,390 | 6,856 | 15,361 | 2,959 | 6,824 | 4,867 | 0 | |||||||||||||||||||||||||||||||||
Invesco Balanced-Risk Retirement 2030 Fund | 262,235 | 60,726 | 20,741 | 6,717 | 16,533 | 3,836 | 19,236 | 1,983 | 5,743 | 10,432 | 0 | |||||||||||||||||||||||||||||||||
Invesco Balanced-Risk Retirement 2040 Fund | 251,089 | 55,332 | 10,878 | 3,480 | 13,430 | 1,554 | 17,120 | 1,871 | 2,494 | 5,472 | 0 | |||||||||||||||||||||||||||||||||
Invesco Balanced-Risk Retirement 2050 Fund | 243,431 | 37,409 | 4,928 | 1,641 | 10,371 | 384 | 9,465 | 608 | 2,197 | 4,892 | 0 | |||||||||||||||||||||||||||||||||
The Trust has entered into a master administrative services agreement with Invesco pursuant to which each Fund has agreed to pay Invesco for certain administrative costs incurred in providing accounting services to such Fund. For the year ended December 31, 2012, expenses incurred under the agreement are shown in the Statement of Operations as Administrative services fees.
The Trust has entered into a transfer agency and service agreement with Invesco Investment Services, Inc. (“IIS”) pursuant to which each Fund has agreed to pay IIS a fee for providing transfer agency and shareholder services to such Fund. For the year ended December 31, 2012, expenses incurred under the agreement are shown in the Statement of Operations as Transfer agent fees.
The Trust has entered into master distribution agreements with Invesco Distributors, Inc. (“IDI”) to serve as the distributor for the Class A, Class AX, Class B, Class C, Class CX, Class R, Class RX, Class Y, Class R5 and Class R6 shares of each Fund. The Trust has adopted plans pursuant to Rule 12b-1 under the 1940 Act with respect to each Fund’s Class A, Class AX, Class B, Class C, Class CX, Class R and Class RX shares (collectively, the “Plans”). Each Fund, pursuant to the Plans, pays IDI compensation at the annual rate of 0.25% of the average daily net assets of Class A shares, 1.00% of the average daily net assets of Class B and Class C shares and 0.50% of the average daily net assets of Class R shares. Also, each Fund, pursuant to the Plans, reimburses IDI up to a maximum annual rate of 0.25% of each Fund’s average daily net assets of Class AX shares, 1.00% of the average daily net assets of each Fund’s Class CX shares and 0.50% of each Fund’s average daily net assets of Class RX shares. Of the Plan payments, up to 0.25% of the average daily net assets of each class of shares may be paid to furnish continuing personal shareholder services to customers who purchase and own shares of such classes. Any amounts not paid as a service fee under the Plans would constitute an asset-based sales charge. Rules of the Financial Industry Regulatory Authority (“FINRA”) impose a cap on the total sales charges, including asset-based sales charges, that may be paid by any class of shares of each Fund. For the year ended December 31, 2012, expenses incurred under the Plans are shown in the Statement of Operations as Distribution fees.
38 Invesco Balanced-Risk Retirement Funds
Front-end sales commissions and CDSC are not recorded as expenses of the Funds. Front-end sales commissions are deducted from proceeds from the sales of Fund shares prior to investment in Class A and Class AX shares of the Funds. CDSC are deducted from redemption proceeds prior to remittance to the shareholder. During the year ended December 31, 2012, IDI advised the Funds that IDI retained the following in front-end sales commissions from the sale of Class A and Class AX shares and received the following in CDSC imposed on redemptions by shareholders:
| Front End Sales Charges | Contingent Deferred Sales Charges | |||||||||||||||||||||||||||
| Class A | Class AX | Class A | Class AX | Class B | Class C | Class CX | ||||||||||||||||||||||
Invesco Balanced-Risk Retirement Now Fund | $ | 9,392 | $ | 1,596 | $ | 0 | $ | 0 | $ | 901 | $ | 419 | $ | 0 | ||||||||||||||
Invesco Balanced-Risk Retirement 2020 Fund | 26,799 | 2,081 | 10 | 0 | 7,396 | 1,432 | 0 | |||||||||||||||||||||
Invesco Balanced-Risk Retirement 2030 Fund | 27,241 | 1,217 | 59 | 0 | 2,764 | 1,296 | 351 | |||||||||||||||||||||
Invesco Balanced-Risk Retirement 2040 Fund | 21,074 | 716 | 5 | 0 | 1,421 | 2,176 | 32 | |||||||||||||||||||||
Invesco Balanced-Risk Retirement 2050 Fund | 9,489 | 404 | 2 | 0 | 606 | 401 | 0 | |||||||||||||||||||||
The underlying Invesco Funds pay no distribution fees for Class R5 and R6 shares and the Fund pays no sales loads or other similar compensation to IDI for acquiring the underlying fund shares.
Certain officers and trustees of the Trust are officers and directors of the Adviser, IIS and/or IDI.
NOTE 3—Additional Valuation Information
GAAP defines fair value as the price that would be received to sell an asset or paid to transfer a liability in an orderly transaction between market participants at the measurement date, under current market conditions. GAAP establishes a hierarchy that prioritizes the inputs to valuation methods giving the highest priority to readily available unadjusted quoted prices in an active market for identical assets (Level 1) and the lowest priority to significant unobservable inputs (Level 3) generally when market prices are not readily available or are unreliable. Based on the valuation inputs, the securities or other investments are tiered into one of three levels. Changes in valuation methods may result in transfers in or out of an investment’s assigned level:
| Level 1 — | Prices are determined using quoted prices in an active market for identical assets. |
| Level 2 — | Prices are determined using other significant observable inputs. Observable inputs are inputs that other market participants may use in pricing a security. These may include quoted prices for similar securities, interest rates, prepayment speeds, credit risk, yield curves, loss severities, default rates, discount rates, volatilities and others. |
| Level 3 — | Prices are determined using significant unobservable inputs. In situations where quoted prices or observable inputs are unavailable (for example, when there is little or no market activity for an investment at the end of the period), unobservable inputs may be used. Unobservable inputs reflect the Fund’s own assumptions about the factors market participants would use in determining fair value of the securities or instruments and would be based on the best available information. |
The following is a summary of the tiered valuation input levels, as of December 31, 2012. The level assigned to the securities valuations may not be an indication of the risk or liquidity associated with investing in those securities. Because of the inherent uncertainties of valuation, the values reflected in the financial statements may materially differ from the value received upon actual sale of those investments.
| Equity Securities | ||||||||||||||||
| Fund Name | Level 1 | Level 2 | Level 3 | Total | ||||||||||||
Invesco Balanced-Risk Retirement Now Fund | $ | 48,575,511 | $ | — | $ | — | $ | 48,575,511 | ||||||||
Invesco Balanced-Risk Retirement 2020 Fund | 98,216,849 | — | — | 98,216,849 | ||||||||||||
Invesco Balanced-Risk Retirement 2030 Fund | 101,690,232 | — | — | 101,690,232 | ||||||||||||
Invesco Balanced-Risk Retirement 2040 Fund | 57,159,716 | — | — | 57,159,716 | ||||||||||||
Invesco Balanced-Risk Retirement 2050 Fund | 30,142,025 | — | — | 30,142,025 | ||||||||||||
NOTE 4—Expense Offset Arrangement(s)
The expense offset arrangement is comprised of transfer agency credits which result from balances in Demand Deposit Accounts (DDA) used by the transfer agent for clearing shareholder transactions. For the year ended December 31, 2012, the Funds received credits from this arrangement, which resulted in the reduction of the Funds’ total expenses of:
| Transfer Agent Credits | ||||
Invesco Balanced-Risk Retirement Now Fund | $ | 126 | ||
Invesco Balanced-Risk Retirement 2020 Fund | 305 | |||
Invesco Balanced-Risk Retirement 2030 Fund | 293 | |||
Invesco Balanced-Risk Retirement 2040 Fund | 235 | |||
Invesco Balanced-Risk Retirement 2050 Fund | 168 | |||
39 Invesco Balanced-Risk Retirement Funds
NOTE 5—Trustees’ and Officers’ Fees and Benefits
“Trustees’ and Officers’ Fees and Benefits” include amounts accrued by each Fund to pay remuneration to certain Trustees and Officers of such Fund. Trustees have the option to defer compensation payable by the Funds, and “Trustees’ and Officers’ Fees and Benefits” also include amounts accrued by each Fund to fund such deferred compensation amounts. Those Trustees who defer compensation have the option to select various Invesco Funds in which their deferral accounts shall be deemed to be invested. Finally, certain current Trustees are eligible to participate in a retirement plan that provides for benefits to be paid upon retirement to Trustees over a period of time based on the number of years of service. The Funds may have certain former Trustees who also participate in a retirement plan and receive benefits under such plan. “Trustees’ and Officers’ Fees and Benefits” include amounts accrued by each Fund to fund such retirement benefits. Obligations under the deferred compensation and retirement plans represent unsecured claims against the general assets of the Funds.
NOTE 6—Cash Balances
The Funds are permitted to temporarily carry a negative or overdrawn balance in their account with State Street Bank and Trust Company, the custodian bank. Such balances, if any at period end, are shown in the Statement of Assets and Liabilities under the payable caption Amount due custodian. To compensate the custodian bank for such overdrafts, the overdrawn Fund may either (1) leave funds as a compensating balance in the account so the custodian bank can be compensated by earning the additional interest; or (2) compensate by paying the custodian bank at a rate agreed upon by the custodian bank and Invesco, not to exceed the contractually agreed upon rate.
NOTE 7—Distributions to Shareholders and Tax Components of Net Assets
Tax Character of Distributions to Shareholders Paid During the Years Ended December 31, 2012 and 2011:
| 2012 | 2011 | |||||||||||||||||||||||
| Ordinary Income | Long-term Capital Gain | Total Distributions | Ordinary Income | Long-term Capital Gain | Total Distributions | |||||||||||||||||||
Invesco Balanced-Risk Retirement Now Fund | $ | 1,021,248 | $ | 589,119 | $ | 1,610,367 | $ | 706,412 | $ | 371,063 | $ | 1,077,475 | ||||||||||||
Invesco Balanced-Risk Retirement 2020 Fund | 3,122,267 | 1,014,325 | 4,136,592 | 1,789,776 | 373,559 | 2,163,335 | ||||||||||||||||||
Invesco Balanced-Risk Retirement 2030 Fund | 3,703,041 | 537,739 | 4,240,780 | 1,314,067 | 87,936 | 1,402,003 | ||||||||||||||||||
Invesco Balanced-Risk Retirement 2040 Fund | 2,035,377 | — | 2,035,377 | 1,088,625 | — | 1,088,625 | ||||||||||||||||||
Invesco Balanced-Risk Retirement 2050 Fund | 1,137,746 | 84,049 | 1,221,795 | 285,470 | — | 285,470 | ||||||||||||||||||
Tax Components of Net Assets at Period-End:
| Undistributed Ordinary Income | Undistributed Long-term Gain | Net Unrealized | Temporary Book/Tax Differences | Shares of Beneficial Interest | Total Net Assets | |||||||||||||||||||
Invesco Balanced-Risk Retirement Now Fund | $ | 108 | $ | 301,233 | $ | 3,458,316 | $ | (26,927 | ) | $ | 44,814,302 | $ | 48,547,032 | |||||||||||
Invesco Balanced-Risk Retirement 2020 Fund | 27,582 | 904,145 | 7,809,281 | (19,568 | ) | 90,319,785 | 99,041,225 | |||||||||||||||||
Invesco Balanced-Risk Retirement 2030 Fund | 30,160 | 1,052,061 | 7,330,177 | (19,278 | ) | 92,557,410 | 100,950,530 | |||||||||||||||||
Invesco Balanced-Risk Retirement 2040 Fund | 77,209 | 440,623 | 3,683,755 | (17,730 | ) | 53,504,821 | 57,688,678 | |||||||||||||||||
Invesco Balanced-Risk Retirement 2050 Fund | — | 311,974 | 1,629,795 | (15,997 | ) | 27,984,932 | 29,910,704 | |||||||||||||||||
The difference between book-basis and tax-basis unrealized appreciation (depreciation) is due to differences in the timing of recognition of gains and losses on investments for tax and book purposes. The Funds net unrealized appreciation differences are attributable primarily to wash sales.
The temporary book/tax differences are a result of timing differences between book and tax recognition of income and/or expenses. The Funds temporary book/tax differences are the result of the trustee deferral of compensation and retirement plan benefits.
Capital loss carryforward is calculated and reported as of a specific date. Results of transactions and other activity after that date may affect the amount of capital loss carryforward actually available for the Trust to utilize. The Regulated Investment Company Modernization Act of 2010 (the “Act”) eliminated the eight-year carryover period for capital losses that arise in taxable years beginning after its enactment date of December 22, 2010. Consequently, these capital losses can be carried forward for an unlimited period. However, capital losses with an expiration period may not be used to offset capital gains until all net capital losses without an expiration date have been utilized. Additionally, post-enactment capital loss carryovers will retain their character as either short-term or long-term capital losses instead of as short-term capital losses as under prior law. The ability to utilize capital loss carryforward in the future may be limited under the Internal Revenue Code and related regulations based on the results of future transactions.
Invesco Balanced-Risk Retirement 2040 Fund utilized $157,662 of capital loss carryforward in the current period to offset net realized capital gain for federal income tax purposes.
The Funds do not have a capital loss carryforward as of December 31, 2012.
40 Invesco Balanced-Risk Retirement Funds
NOTE 8—Investment Securities
The aggregate amount of investment securities purchased and sold by each Fund and aggregate cost and the net unrealized appreciation (depreciation) of investments for tax purposes are as follows:
| For the year ended December 31, 2012* | At December 31, 2012 | |||||||||||||||||||||||||
| Purchases | Sales | Federal Tax Cost** | Unrealized Appreciation | Unrealized (Depreciation) | Net Unrealized Appreciation | |||||||||||||||||||||
Invesco Balanced-Risk Retirement Now Fund | $ | 4,813,904 | $ | 1,999,956 | $ | 45,117,195 | $ | 3,458,316 | $ | — | $ | 3,458,316 | ||||||||||||||
Invesco Balanced-Risk Retirement 2020 Fund | 31,541,116 | 4,485,312 | 90,407,568 | 7,809,281 | — | 7,809,281 | ||||||||||||||||||||
Invesco Balanced-Risk Retirement 2030 Fund | 44,893,522 | 2,081,724 | 94,360,055 | 7,330,177 | — | 7,330,177 | ||||||||||||||||||||
Invesco Balanced-Risk Retirement 2040 Fund | 29,780,103 | 1,734,693 | 53,475,961 | 3,683,755 | — | 3,683,755 | ||||||||||||||||||||
Invesco Balanced-Risk Retirement 2050 Fund | 16,132,853 | 1,086,607 | 28,512,230 | 1,629,795 | — | 1,629,795 | ||||||||||||||||||||
| * | Excludes U.S. Treasury obligations and money market funds, if any. |
| ** | Cost of investments on a tax basis includes the adjustments for financial reporting purposes as of the most recently completed federal income tax reporting period end. |
NOTE 9—Reclassification of Permanent Differences
Primarily as a result of differing book/tax treatment of distributions, on December 31, 2012, reclassifications were made to the Funds, as shown below. These reclassifications had no effect on the net assets of each Fund.
| Undistributed Net Investment Income | Undistributed Net Realized Gain (Loss) | Shares of Beneficial Interest | ||||||||||
Invesco Balanced-Risk Retirement Now Fund | $ | 464,003 | $ | (464,003 | ) | $ | — | |||||
Invesco Balanced-Risk Retirement 2020 Fund | 1,391,681 | (1,391,681 | ) | — | ||||||||
Invesco Balanced-Risk Retirement 2030 Fund | 1,614,424 | (1,614,424 | ) | — | ||||||||
Invesco Balanced-Risk Retirement 2040 Fund | 894,759 | (894,759 | ) | — | ||||||||
Invesco Balanced-Risk Retirement 2050 Fund | 480,657 | (480,657 | ) | — | ||||||||
41 Invesco Balanced-Risk Retirement Funds
NOTE 10—Share Information
Invesco Balanced-Risk Retirement Now Fund
| Summary of Share Activity | ||||||||||||||||
| Years ended December 31, | ||||||||||||||||
| 2012(a) | 2011 | |||||||||||||||
| Shares | Amount | Shares | Amount | |||||||||||||
Sold: | ||||||||||||||||
Class A | 715,048 | $ | 6,533,884 | 441,218 | $ | 3,904,803 | ||||||||||
Class AX | 39,388 | 360,775 | 29,834 | 262,471 | ||||||||||||
Class B | 18,380 | 167,023 | 16,716 | 146,884 | ||||||||||||
Class C | 329,012 | 2,978,836 | 139,070 | 1,220,557 | ||||||||||||
Class CX | 20,455 | 185,072 | 11,920 | 104,824 | ||||||||||||
Class R | 84,736 | 775,898 | 48,212 | 425,012 | ||||||||||||
Class RX | 24,592 | 223,990 | 16,184 | 143,052 | ||||||||||||
Class Y | 43,445 | 398,194 | 10,042 | 89,900 | ||||||||||||
Class R5 | 786,118 | 7,096,390 | — | — | ||||||||||||
Class R6(b) | 1,066 | 10,000 | — | — | ||||||||||||
Issued as reinvestment of dividends: | ||||||||||||||||
Class A | 50,107 | 453,426 | 29,224 | 255,421 | ||||||||||||
Class AX | 68,992 | 623,611 | 62,106 | 541,662 | ||||||||||||
Class B | 2,330 | 20,856 | 2,077 | 18,028 | ||||||||||||
Class C | 14,882 | 133,342 | 6,627 | 57,530 | ||||||||||||
Class CX | 15,237 | 136,372 | 13,276 | 115,193 | ||||||||||||
Class R | 6,649 | 59,780 | 5,174 | 45,053 | ||||||||||||
Class RX | 1,701 | 15,343 | 1,027 | 8,965 | ||||||||||||
Class Y | 2,498 | 22,681 | 812 | 7,121 | ||||||||||||
Class R5 | 11,020 | 100,040 | — | — | ||||||||||||
Issued in connection with acquisitions:(c) | ||||||||||||||||
Class A | — | — | 743,682 | 6,458,527 | ||||||||||||
Class AX | — | — | 1,648,414 | 14,297,609 | ||||||||||||
Class B | — | — | 83,133 | 718,020 | ||||||||||||
Class C | — | — | 182,087 | 1,573,641 | ||||||||||||
Class CX | — | — | 354,659 | 3,063,453 | ||||||||||||
Class R | — | — | 112,181 | 972,857 | ||||||||||||
Class RX | — | — | 42,576 | 369,016 | ||||||||||||
Class Y | — | — | 53,205 | 462,458 | ||||||||||||
Class R5 | — | — | 1,395 | 12,119 | ||||||||||||
Automatic conversion of Class B shares to Class A shares: | ||||||||||||||||
Class A | 15,267 | 139,631 | 29,846 | 262,319 | ||||||||||||
Class B | (15,418 | ) | (139,631 | ) | (30,048 | ) | (262,319 | ) | ||||||||
Reacquired: | ||||||||||||||||
Class A | (390,114 | ) | (3,564,525 | ) | (385,665 | ) | (3,413,063 | ) | ||||||||
Class AX | (391,027 | ) | (3,574,037 | ) | (940,077 | ) | (8,205,291 | ) | ||||||||
Class B | (21,608 | ) | (195,857 | ) | (14,580 | ) | (127,849 | ) | ||||||||
Class C | (87,279 | ) | (788,675 | ) | (154,740 | ) | (1,366,854 | ) | ||||||||
Class CX | (72,890 | ) | (659,518 | ) | (161,876 | ) | (1,410,016 | ) | ||||||||
Class R | (70,708 | ) | (643,656 | ) | (51,936 | ) | (453,695 | ) | ||||||||
Class RX | (24,295 | ) | (221,725 | ) | (8,799 | ) | (77,669 | ) | ||||||||
Class Y | (6,436 | ) | (59,640 | ) | (45,550 | ) | (401,112 | ) | ||||||||
Class R5 | (477,641 | ) | (4,321,352 | ) | — | — | ||||||||||
Net increase in share activity | 693,507 | $ | 6,266,528 | 2,291,426 | $ | 19,818,627 | ||||||||||
42 Invesco Balanced-Risk Retirement Funds
| (a) | There are entities that are record owners of more than 5% of the outstanding shares of the Fund and in the aggregate own 25% of the outstanding shares of the Fund. IDI has an agreement with these entities to sell Fund shares. The Fund, Invesco and/or Invesco affiliates may make payments to these entities, which are considered to be related to the Fund, for providing services to the Fund, Invesco and/or Invesco affiliates including but not limited to services such as securities brokerage, distribution, third party record keeping and account servicing. The Trust has no knowledge as to whether all or any portion of the shares owned of record by these entities are also owned beneficially. |
| (b) | Commencement date of September 24, 2012. |
| (c) | As of the opening of business on June 6, 2011, the Fund acquired all the net assets of Invesco Balanced-Risk Retirement 2010 Fund (the “Target Fund”) pursuant to a plan of reorganization approved by the Trustees of the Fund on November 10, 2010. The acquisition was accomplished by a tax-free exchange of 3,221,332 shares of the Fund for 3,126,746 shares outstanding of Target Fund as of the close of business on June 3, 2011. Each class of Target Fund was exchanged for the like class of shares of the Fund based on the relative net asset value of Target Fund to the net asset value of the Fund on the close of business, June 3, 2011. Target Fund’s net assets at that date of $27,927,700 including $1,145,635 of unrealized appreciation, was combined with those of the Fund. The net assets of the Fund immediately before the acquisition were $17,482,979. The net assets of the Fund immediately following the acquisition were $45,410,679. |
| The pro forma results of operations for the year ended December 31, 2011, assuming the reorganization had been completed on January 1, 2011, the beginning of the annual reporting period, are as follows: |
Net investment income | $ | 620,877 | ||
Net realized/unrealized gains | 1,951,735 | |||
Change in net assets resulting from operations | $ | 2,572,612 |
| The combined investment portfolios have been managed as a single integrated portfolio since the acquisition was completed, it is not practicable to separate the amounts of revenue and earnings of the Target Fund that have been included in the Fund’s Statement of Operations since June 6, 2011. |
43 Invesco Balanced-Risk Retirement Funds
NOTE 10—Share Information—(continued)
Invesco Balanced-Risk Retirement 2020 Fund
| Summary of Share Activity | ||||||||||||||||
| Years ended December 31, | ||||||||||||||||
| 2012(a) | 2011 | |||||||||||||||
| Shares | Amount | Shares | Amount | |||||||||||||
Sold: | ||||||||||||||||
Class A | 2,228,771 | $ | 21,313,085 | 1,416,575 | $ | 12,655,682 | ||||||||||
Class AX | 60,768 | 579,800 | 65,807 | 578,778 | ||||||||||||
Class B | 111,750 | 1,043,189 | 99,064 | 877,618 | ||||||||||||
Class C | 679,001 | 6,419,657 | 262,080 | 2,307,502 | ||||||||||||
Class CX | 19,869 | 186,622 | 17,757 | 154,849 | ||||||||||||
Class R | 640,526 | 6,139,466 | 338,507 | 2,977,655 | ||||||||||||
Class RX | 82,783 | 792,571 | 51,283 | 451,272 | ||||||||||||
Class Y | 777,340 | 7,466,745 | 39,496 | 356,904 | ||||||||||||
Class R5 | 1,524,369 | 14,268,205 | — | — | ||||||||||||
Class R6(b) | 1,004 | 10,000 | — | — | ||||||||||||
Issued as reinvestment of dividends: | ||||||||||||||||
Class A | 172,526 | 1,633,821 | 106,424 | 948,237 | ||||||||||||
Class AX | 65,537 | 620,631 | 63,059 | 561,854 | ||||||||||||
Class B | 13,769 | 129,015 | 10,890 | 96,160 | ||||||||||||
Class C | 37,841 | 353,818 | 17,444 | 153,681 | ||||||||||||
Class CX | 13,671 | 127,825 | 13,361 | 117,709 | ||||||||||||
Class R | 38,257 | 361,152 | 23,202 | 206,030 | ||||||||||||
Class RX | 7,530 | 71,091 | 5,515 | 48,969 | ||||||||||||
Class Y | 31,620 | 299,444 | 1,483 | 13,214 | ||||||||||||
Class R5 | 26,191 | 249,336 | — | — | ||||||||||||
Automatic conversion of Class B shares to Class A shares: | ||||||||||||||||
Class A | 51,100 | 490,372 | 44,923 | 393,678 | ||||||||||||
Class B | (51,773 | ) | (490,372 | ) | (45,455 | ) | (393,678 | ) | ||||||||
Reacquired: | ||||||||||||||||
Class A | (965,723 | ) | (9,297,997 | ) | (743,962 | ) | (6,620,089 | ) | ||||||||
Class AX | (329,325 | ) | (3,162,631 | ) | (907,930 | ) | (7,953,695 | ) | ||||||||
Class B | (54,079 | ) | (508,998 | ) | (53,199 | ) | (471,638 | ) | ||||||||
Class C | (186,835 | ) | (1,767,336 | ) | (152,860 | ) | (1,333,883 | ) | ||||||||
Class CX | (64,372 | ) | (604,798 | ) | (135,637 | ) | (1,157,736 | ) | ||||||||
Class R | (180,276 | ) | (1,723,795 | ) | (315,249 | ) | (2,751,727 | ) | ||||||||
Class RX | (43,534 | ) | (414,347 | ) | (52,385 | ) | (467,588 | ) | ||||||||
Class Y | (170,548 | ) | (1,658,963 | ) | (12,828 | ) | (116,253 | ) | ||||||||
Class R5 | (940,755 | ) | (8,852,956 | ) | — | — | ||||||||||
Net increase in share activity | 3,597,003 | $ | 34,073,652 | 157,365 | $ | 1,633,505 | ||||||||||
| (a) | There are entities that are record owners of more than 5% of the outstanding shares of the Fund and in the aggregate own 29% of the outstanding shares of the Fund. IDI has an agreement with these entities to sell Fund shares. The Fund, Invesco and/or Invesco affiliates may make payments to these entities, which are considered to be related to the Fund, for providing services to the Fund, Invesco and/or Invesco affiliates including but not limited to services such as securities brokerage, distribution, third party record keeping and account servicing. The Trust has no knowledge as to whether all or any portion of the shares owned of record by these entities are also owned beneficially. |
| (b) | Commencement date of September 24, 2012. |
44 Invesco Balanced-Risk Retirement Funds
NOTE 10—Share Information—(continued)
Invesco Balanced-Risk Retirement 2030 Fund
| Summary of Share Activity | ||||||||||||||||
| Years ended December 31, | ||||||||||||||||
| 2012(a) | 2011 | |||||||||||||||
| Shares | Amount | Shares | Amount | |||||||||||||
Sold: | ||||||||||||||||
Class A | 2,034,968 | $ | 18,779,447 | 1,231,897 | $ | 10,394,223 | ||||||||||
Class AX | 58,555 | 539,931 | 99,775 | 833,258 | ||||||||||||
Class B | 93,722 | 851,946 | 31,817 | 267,407 | ||||||||||||
Class C | 614,314 | 5,620,373 | 341,392 | 2,835,785 | ||||||||||||
Class CX | 18,821 | 171,195 | 21,372 | 176,442 | ||||||||||||
Class R | 761,061 | 7,051,791 | 399,934 | 3,376,630 | ||||||||||||
Class RX | 44,380 | 406,905 | 38,876 | 325,922 | ||||||||||||
Class Y | 578,830 | 5,497,810 | 254,668 | 2,271,927 | ||||||||||||
Class R5 | 3,685,652 | 33,404,755 | — | — | ||||||||||||
Class R6(b) | 1,036 | 10,000 | — | — | ||||||||||||
Issued as reinvestment of dividends: | ||||||||||||||||
Class A | 151,230 | 1,389,802 | 69,923 | 599,239 | ||||||||||||
Class AX | 47,261 | 434,331 | 33,618 | 288,445 | ||||||||||||
Class B | 14,376 | 130,968 | 7,461 | 63,489 | ||||||||||||
Class C | 36,556 | 332,660 | 14,472 | 123,013 | ||||||||||||
Class CX | 5,001 | 45,508 | 4,579 | 38,917 | ||||||||||||
Class R | 39,884 | 364,940 | 22,105 | 188,776 | ||||||||||||
Class RX | 4,877 | 44,578 | 2,413 | 20,584 | ||||||||||||
Class Y | 29,311 | 269,957 | 8,072 | 69,334 | ||||||||||||
Class R5 | 87,906 | 811,369 | — | — | ||||||||||||
Automatic conversion of Class B shares to Class A shares: | ||||||||||||||||
Class A | 39,471 | 366,562 | 51,064 | 429,500 | ||||||||||||
Class B | (39,913 | ) | (366,562 | ) | (51,574 | ) | (429,500 | ) | ||||||||
Reacquired: | ||||||||||||||||
Class A | (673,348 | ) | (6,279,212 | ) | (489,507 | ) | (4,116,672 | ) | ||||||||
Class AX | (234,900 | ) | (2,168,113 | ) | (535,856 | ) | (4,469,527 | ) | ||||||||
Class B | (39,124 | ) | (360,239 | ) | (31,828 | ) | (266,831 | ) | ||||||||
Class C | (155,611 | ) | (1,444,323 | ) | (88,897 | ) | (743,199 | ) | ||||||||
Class CX | (20,813 | ) | (189,795 | ) | (178,210 | ) | (1,453,211 | ) | ||||||||
Class R | (341,087 | ) | (3,140,677 | ) | (369,863 | ) | (3,075,197 | ) | ||||||||
Class RX | (18,729 | ) | (172,099 | ) | (29,460 | ) | (246,866 | ) | ||||||||
Class Y | (442,422 | ) | (4,088,548 | ) | (123,918 | ) | (1,019,306 | ) | ||||||||
Class R5 | (1,781,592 | ) | (16,111,898 | ) | (784 | ) | (6,375 | ) | ||||||||
Net increase in share activity | 4,599,673 | $ | 42,203,362 | 733,541 | $ | 6,476,207 | ||||||||||
| (a) | There are entities that are record owners of more than 5% of the outstanding shares of the Fund and in the aggregate own 36% of the outstanding shares of the Fund. IDI has an agreement with these entities to sell Fund shares. The Fund, Invesco and/or Invesco affiliates may make payments to these entities, which are considered to be related to the Fund, for providing services to the Fund, Invesco and/or Invesco affiliates including but not limited to services such as securities brokerage, distribution, third party record keeping and account servicing. The Trust has no knowledge as to whether all or any portion of the shares owned of record by these entities are also owned beneficially. |
| (b) | Commencement date of September 24, 2012. |
45 Invesco Balanced-Risk Retirement Funds
NOTE 10—Share Information—(continued)
Invesco Balanced-Risk Retirement 2040 Fund
| Summary of Share Activity | ||||||||||||||||
| Years ended December 31, | ||||||||||||||||
| 2012(a) | 2011 | |||||||||||||||
| Shares | Amount | Shares | Amount | |||||||||||||
Sold: | ||||||||||||||||
Class A | 2,082,300 | $ | 18,222,449 | 744,838 | $ | 6,036,525 | ||||||||||
Class AX | 34,221 | 297,292 | 59,568 | 475,418 | ||||||||||||
Class B | 22,178 | 188,864 | 43,192 | 345,684 | ||||||||||||
Class C | 437,131 | 3,758,028 | 219,570 | 1,743,588 | ||||||||||||
Class CX | 8,597 | 73,597 | 10,230 | 81,257 | ||||||||||||
Class R | 720,789 | 6,284,502 | 276,025 | 2,206,461 | ||||||||||||
Class RX | 22,794 | 197,734 | 21,237 | 171,517 | ||||||||||||
Class Y | 229,600 | 2,034,826 | 14,732 | 123,725 | ||||||||||||
Class R5 | 1,974,249 | 16,728,209 | — | — | ||||||||||||
Class R6(b) | 1,100 | 10,000 | — | — | ||||||||||||
Issued as reinvestment of dividends: | ||||||||||||||||
Class A | 103,674 | 905,072 | 68,018 | 550,263 | ||||||||||||
Class AX | 16,868 | 147,086 | 21,166 | 171,025 | ||||||||||||
Class B | 4,540 | 39,223 | 5,637 | 45,207 | ||||||||||||
Class C | 19,044 | 164,348 | 15,071 | 120,717 | ||||||||||||
Class CX | 1,537 | 13,245 | 2,297 | 18,403 | ||||||||||||
Class R | 22,914 | 198,895 | 17,953 | 144,706 | ||||||||||||
Class RX | 2,876 | 24,989 | 2,965 | 23,893 | ||||||||||||
Class Y | 9,239 | 80,754 | 955 | 7,735 | ||||||||||||
Class R5 | 26,370 | 230,736 | — | — | ||||||||||||
Automatic conversion of Class B shares to Class A shares: | ||||||||||||||||
Class A | 13,367 | 116,805 | 10,235 | 82,488 | ||||||||||||
Class B | (13,528 | ) | (116,805 | ) | (10,348 | ) | (82,488 | ) | ||||||||
Reacquired: | ||||||||||||||||
Class A | (592,883 | ) | (5,201,216 | ) | (303,659 | ) | (2,429,196 | ) | ||||||||
Class AX | (91,412 | ) | (795,184 | ) | (381,032 | ) | (2,996,846 | ) | ||||||||
Class B | (25,494 | ) | (217,711 | ) | (24,563 | ) | (196,677 | ) | ||||||||
Class C | (145,438 | ) | (1,254,318 | ) | (85,266 | ) | (682,372 | ) | ||||||||
Class CX | (14,982 | ) | (127,119 | ) | (36,177 | ) | (286,189 | ) | ||||||||
Class R | (253,991 | ) | (2,252,335 | ) | (298,717 | ) | (2,371,519 | ) | ||||||||
Class RX | (13,110 | ) | (113,868 | ) | (20,630 | ) | (168,113 | ) | ||||||||
Class Y | (37,789 | ) | (328,993 | ) | (43,576 | ) | (346,337 | ) | ||||||||
Class R5 | (1,310,106 | ) | (11,186,385 | ) | — | — | ||||||||||
Net increase in share activity | 3,254,655 | $ | 28,122,720 | 329,721 | $ | 2,788,875 | ||||||||||
| (a) | There are entities that are record owners of more than 5% of the outstanding shares of the Fund and in the aggregate own 41% of the outstanding shares of the Fund. IDI has an agreement with these entities to sell Fund shares. The Fund, Invesco and/or Invesco affiliates may make payments to these entities, which are considered to be related to the Fund, for providing services to the Fund, Invesco and/or Invesco affiliates including but not limited to services such as securities brokerage, distribution, third party record keeping and account servicing. The Trust has no knowledge as to whether all or any portion of the shares owned of record by these entities are also owned beneficially. |
| (b) | Commencement date of September 24, 2012. |
46 Invesco Balanced-Risk Retirement Funds
NOTE 10—Share Information—(continued)
Invesco Balanced-Risk Retirement 2050 Fund
| Summary of Share Activity | ||||||||||||||||
| Years ended December 31, | ||||||||||||||||
| 2012(a) | 2011 | |||||||||||||||
| Shares | Amount | Shares | Amount | |||||||||||||
Sold: | ||||||||||||||||
Class A | 821,397 | $ | 7,109,258 | 661,978 | $ | 5,335,644 | ||||||||||
Class AX | 15,345 | 132,618 | 23,506 | 185,954 | ||||||||||||
Class B | 17,919 | 153,140 | 7,883 | 63,167 | ||||||||||||
Class C | 299,063 | 2,565,971 | 156,754 | 1,248,741 | ||||||||||||
Class CX | 3,111 | 26,796 | 3,302 | 25,633 | ||||||||||||
Class R | 267,894 | 2,342,207 | 124,840 | 980,348 | ||||||||||||
Class RX | 6,654 | 57,597 | 6,439 | 50,540 | ||||||||||||
Class Y | 139,250 | 1,230,423 | 67,648 | 565,932 | ||||||||||||
Class R5 | 1,723,529 | 14,543,814 | — | — | ||||||||||||
Class R6(b) | 1,104 | 10,000 | — | — | ||||||||||||
Issued as reinvestment of dividends: | ||||||||||||||||
Class A | 60,781 | 525,152 | 19,238 | 155,057 | ||||||||||||
Class AX | 6,051 | 52,338 | 4,026 | 32,488 | ||||||||||||
Class B | 2,029 | 17,325 | 984 | 7,854 | ||||||||||||
Class C | 14,220 | 121,726 | 3,720 | 29,754 | ||||||||||||
Class CX | 439 | 3,751 | 220 | 1,758 | ||||||||||||
Class R | 13,312 | 114,613 | 4,952 | 39,812 | ||||||||||||
Class RX | 858 | 7,384 | 329 | 2,642 | ||||||||||||
Class Y | 6,477 | 56,093 | 1,774 | 14,314 | ||||||||||||
Class R5 | 28,582 | 247,805 | — | — | ||||||||||||
Automatic conversion of Class B shares to Class A shares: | ||||||||||||||||
Class A | 6,697 | 57,661 | 1,916 | 14,991 | ||||||||||||
Class B | (6,790 | ) | (57,661 | ) | (1,937 | ) | (14,991 | ) | ||||||||
Reacquired: | ||||||||||||||||
Class A | (324,013 | ) | (2,859,064 | ) | (242,568 | ) | (1,903,261 | ) | ||||||||
Class AX | (50,903 | ) | (448,939 | ) | (88,523 | ) | (700,943 | ) | ||||||||
Class B | (16,872 | ) | (146,041 | ) | (12,827 | ) | (100,452 | ) | ||||||||
Class C | (80,729 | ) | (695,436 | ) | (23,746 | ) | (185,523 | ) | ||||||||
Class CX | (907 | ) | (7,774 | ) | (35,552 | ) | (268,806 | ) | ||||||||
Class R | (72,366 | ) | (629,023 | ) | (118,488 | ) | (919,961 | ) | ||||||||
Class RX | (1,714 | ) | (15,232 | ) | (6,720 | ) | (52,400 | ) | ||||||||
Class Y | (50,776 | ) | (436,903 | ) | (36,346 | ) | (287,195 | ) | ||||||||
Class R5 | (1,093,173 | ) | (9,276,095 | ) | — | — | ||||||||||
Net increase in share activity | 1,736,469 | $ | 14,803,504 | 522,802 | $ | 4,321,097 | ||||||||||
| (a) | There are entities that are record owners of more than 5% of the outstanding shares of the Fund and in the aggregate own 45% of the outstanding shares of the Fund. IDI has an agreement with these entities to sell Fund shares. The Fund, Invesco and/or Invesco affiliates may make payments to these entities, which are considered to be related to the Fund, for providing services to the Fund, Invesco and/or Invesco affiliates including but not limited to services such as securities brokerage, distribution, third party record keeping and account servicing. The Trust has no knowledge as to whether all or any portion of the shares owned of record by these entities are also owned beneficially. |
| (b) | Commencement date of September 24, 2012. |
47 Invesco Balanced-Risk Retirement Funds
NOTE 11—Financial Highlights
The following schedule presents financial highlights for a share of each Fund outstanding throughout the periods indicated.
Invesco Balanced-Risk Retirement Now Fund
| Net asset value, beginning of period | Net investment income(a) | Net gains (losses) on securities (both realized and unrealized) | Total from investment operations | Dividends from net investment income | Distributions from net realized gains | Total distributions | Net asset value, end of period | Total return(b) | Net assets, end of period (000s omitted) | Ratio of expenses to average net assets with fee waivers and/or expense reimbursements(c) | Ratio of expenses to average net assets without fee waivers and/or expense reimbursements | Ratio of net investment income to average net assets | Portfolio turnover(d) | |||||||||||||||||||||||||||||||||||||||||||
Class A | ||||||||||||||||||||||||||||||||||||||||||||||||||||||||
Year ended 12/31/12 | $ | 8.84 | $ | 0.12 | $ | 0.42 | $ | 0.54 | $ | (0.20 | ) | $ | (0.11 | ) | $ | (0.31 | ) | $ | 9.07 | 6.22 | % | $ | 13,959 | 0.25 | %(e) | 0.96 | %(e) | 1.30 | %(e) | 7 | % | |||||||||||||||||||||||||
Year ended 12/31/11 | 8.58 | 0.17 | 0.35 | 0.52 | (0.14 | ) | (0.12 | ) | (0.26 | ) | 8.84 | 6.18 | 10,150 | 0.25 | 1.09 | 1.95 | 15 | |||||||||||||||||||||||||||||||||||||||
Year ended 12/31/10 | 8.23 | 0.37 | 0.26 | 0.63 | (0.28 | ) | — | (0.28 | ) | 8.58 | 7.74 | 2,488 | 0.25 | 3.45 | 4.35 | 67 | ||||||||||||||||||||||||||||||||||||||||
Year ended 12/31/09 | 7.59 | 0.47 | 0.61 | 1.08 | (0.44 | ) | — | (0.44 | ) | 8.23 | 14.53 | 1,399 | 0.27 | 10.47 | 5.93 | 155 | ||||||||||||||||||||||||||||||||||||||||
Year ended 12/31/08 | 9.78 | 0.43 | (2.08 | ) | (1.65 | ) | (0.51 | ) | (0.03 | ) | (0.54 | ) | 7.59 | (17.45 | ) | 942 | 0.31 | 11.88 | 4.89 | 36 | ||||||||||||||||||||||||||||||||||||
Class AX | ||||||||||||||||||||||||||||||||||||||||||||||||||||||||
Year ended 12/31/12 | 8.83 | 0.12 | 0.42 | 0.54 | (0.20 | ) | (0.11 | ) | (0.31 | ) | 9.06 | 6.22 | 18,345 | 0.25 | (e) | 0.96 | (e) | 1.30 | (e) | 7 | ||||||||||||||||||||||||||||||||||||
Year ended 12/31/11 | 8.58 | 0.17 | 0.34 | 0.51 | (0.14 | ) | (0.12 | ) | (0.26 | ) | 8.83 | 6.06 | 20,371 | 0.25 | 1.09 | 1.95 | 15 | |||||||||||||||||||||||||||||||||||||||
Year ended 12/31/10(f) | 8.30 | 0.22 | 0.32 | 0.54 | (0.26 | ) | — | (0.26 | ) | 8.58 | 6.53 | 12,929 | 0.25 | (g) | 1.24 | (g) | 4.35 | (g) | 67 | |||||||||||||||||||||||||||||||||||||
Class B | ||||||||||||||||||||||||||||||||||||||||||||||||||||||||
Year ended 12/31/12 | 8.77 | 0.05 | 0.43 | 0.48 | (0.17 | ) | (0.11 | ) | (0.28 | ) | 8.97 | 5.50 | 684 | 1.00 | (e) | 1.71 | (e) | 0.55 | (e) | 7 | ||||||||||||||||||||||||||||||||||||
Year ended 12/31/11 | 8.56 | 0.11 | 0.33 | 0.44 | (0.11 | ) | (0.12 | ) | (0.23 | ) | 8.77 | 5.19 | 812 | 1.00 | 1.84 | 1.20 | 15 | |||||||||||||||||||||||||||||||||||||||
Year ended 12/31/10 | 8.24 | 0.30 | 0.27 | 0.57 | (0.25 | ) | — | (0.25 | ) | 8.56 | 6.95 | 301 | 1.00 | 4.20 | 3.60 | 67 | ||||||||||||||||||||||||||||||||||||||||
Year ended 12/31/09 | 7.60 | 0.41 | 0.61 | 1.02 | (0.38 | ) | — | (0.38 | ) | 8.24 | 13.66 | 374 | 1.02 | 11.22 | 5.18 | 155 | ||||||||||||||||||||||||||||||||||||||||
Year ended 12/31/08 | 9.79 | 0.37 | (2.09 | ) | (1.72 | ) | (0.44 | ) | (0.03 | ) | (0.47 | ) | 7.60 | (18.05 | ) | 346 | 1.06 | 12.63 | 4.14 | 36 | ||||||||||||||||||||||||||||||||||||
Class C | ||||||||||||||||||||||||||||||||||||||||||||||||||||||||
Year ended 12/31/12 | 8.78 | 0.05 | 0.43 | 0.48 | (0.17 | ) | (0.11 | ) | (0.28 | ) | 8.98 | 5.49 | 4,773 | 1.00 | (e) | 1.71 | (e) | 0.55 | (e) | 7 | ||||||||||||||||||||||||||||||||||||
Year ended 12/31/11 | 8.56 | 0.11 | 0.34 | 0.45 | (0.11 | ) | (0.12 | ) | (0.23 | ) | 8.78 | 5.31 | 2,416 | 1.00 | 1.84 | 1.20 | 15 | |||||||||||||||||||||||||||||||||||||||
Year ended 12/31/10 | 8.23 | 0.31 | 0.27 | 0.58 | (0.25 | ) | — | (0.25 | ) | 8.56 | 7.08 | 874 | 1.00 | 4.20 | 3.60 | 67 | ||||||||||||||||||||||||||||||||||||||||
Year ended 12/31/09 | 7.59 | 0.41 | 0.61 | 1.02 | (0.38 | ) | — | (0.38 | ) | 8.23 | 13.67 | 277 | 1.02 | 11.22 | 5.18 | 155 | ||||||||||||||||||||||||||||||||||||||||
Year ended 12/31/08 | 9.79 | 0.36 | (2.09 | ) | (1.73 | ) | (0.44 | ) | (0.03 | ) | (0.47 | ) | 7.59 | (18.15 | ) | 174 | 1.06 | 12.63 | 4.14 | 36 | ||||||||||||||||||||||||||||||||||||
Class CX | ||||||||||||||||||||||||||||||||||||||||||||||||||||||||
Year ended 12/31/12 | 8.78 | 0.05 | 0.42 | 0.47 | (0.17 | ) | (0.11 | ) | (0.28 | ) | 8.97 | 5.38 | 4,667 | 1.00 | (e) | 1.71 | (e) | 0.55 | (e) | 7 | ||||||||||||||||||||||||||||||||||||
Year ended 12/31/11 | 8.56 | 0.11 | 0.34 | 0.45 | (0.11 | ) | (0.12 | ) | (0.23 | ) | 8.78 | 5.31 | 4,891 | 1.00 | 1.84 | 1.20 | 15 | |||||||||||||||||||||||||||||||||||||||
Year ended 12/31/10(f) | 8.30 | 0.18 | 0.32 | 0.50 | (0.24 | ) | — | (0.24 | ) | 8.56 | 6.08 | 2,905 | 1.00 | (g) | 1.99 | (g) | 3.60 | (g) | 67 | |||||||||||||||||||||||||||||||||||||
Class R | ||||||||||||||||||||||||||||||||||||||||||||||||||||||||
Year ended 12/31/12 | 8.82 | 0.10 | 0.42 | 0.52 | (0.19 | ) | (0.11 | ) | (0.30 | ) | 9.04 | 5.98 | 2,006 | 0.50 | (e) | 1.21 | (e) | 1.05 | (e) | 7 | ||||||||||||||||||||||||||||||||||||
Year ended 12/31/11 | 8.58 | 0.15 | 0.34 | 0.49 | (0.13 | ) | (0.12 | ) | (0.25 | ) | 8.82 | 5.81 | 1,774 | 0.50 | 1.34 | 1.70 | 15 | |||||||||||||||||||||||||||||||||||||||
Year ended 12/31/10 | 8.24 | 0.35 | 0.26 | 0.61 | (0.27 | ) | — | (0.27 | ) | 8.58 | 7.47 | 750 | 0.50 | 3.70 | 4.10 | 67 | ||||||||||||||||||||||||||||||||||||||||
Year ended 12/31/09 | 7.59 | 0.45 | 0.62 | 1.07 | (0.42 | ) | — | (0.42 | ) | 8.24 | 14.38 | 371 | 0.52 | 10.72 | 5.68 | 155 | ||||||||||||||||||||||||||||||||||||||||
Year ended 12/31/08 | 9.78 | 0.40 | (2.07 | ) | (1.67 | ) | (0.49 | ) | (0.03 | ) | (0.52 | ) | 7.59 | (17.66 | ) | 107 | 0.56 | 12.13 | 4.64 | 36 | ||||||||||||||||||||||||||||||||||||
Class RX | ||||||||||||||||||||||||||||||||||||||||||||||||||||||||
Year ended 12/31/12 | 8.82 | 0.10 | 0.42 | 0.52 | (0.19 | ) | (0.11 | ) | (0.30 | ) | 9.04 | 5.98 | 497 | 0.50 | (e) | 1.21 | (e) | 1.05 | (e) | 7 | ||||||||||||||||||||||||||||||||||||
Year ended 12/31/11 | 8.58 | 0.15 | 0.34 | 0.49 | (0.13 | ) | (0.12 | ) | (0.25 | ) | 8.82 | 5.82 | 467 | 0.50 | 1.34 | 1.70 | 15 | |||||||||||||||||||||||||||||||||||||||
Year ended 12/31/10(f) | 8.31 | 0.20 | 0.32 | 0.52 | (0.25 | ) | — | (0.25 | ) | 8.58 | 6.34 | 17 | 0.50 | (g) | 1.49 | (g) | 4.10 | (g) | 67 | |||||||||||||||||||||||||||||||||||||
Class Y | ||||||||||||||||||||||||||||||||||||||||||||||||||||||||
Year ended 12/31/12 | 8.86 | 0.14 | 0.44 | 0.58 | (0.22 | ) | (0.11 | ) | (0.33 | ) | 9.11 | 6.58 | 673 | 0.00 | (e) | 0.71 | (e) | 1.55 | (e) | 7 | ||||||||||||||||||||||||||||||||||||
Year ended 12/31/11 | 8.60 | 0.20 | 0.34 | 0.54 | (0.16 | ) | (0.12 | ) | (0.28 | ) | 8.86 | 6.30 | 305 | 0.00 | 0.84 | 2.20 | 15 | |||||||||||||||||||||||||||||||||||||||
Year ended 12/31/10 | 8.23 | 0.39 | 0.27 | 0.66 | (0.29 | ) | — | (0.29 | ) | 8.60 | 8.13 | 136 | 0.00 | 3.20 | 4.60 | 67 | ||||||||||||||||||||||||||||||||||||||||
Year ended 12/31/09 | 7.59 | 0.49 | 0.61 | 1.10 | (0.46 | ) | — | (0.46 | ) | 8.23 | 14.82 | 18 | 0.02 | 10.22 | 6.18 | 155 | ||||||||||||||||||||||||||||||||||||||||
Year ended 12/31/08(f) | 8.30 | 0.10 | (0.67 | ) | (0.57 | ) | (0.14 | ) | — | (0.14 | ) | 7.59 | (6.86 | ) | 9 | 0.02 | (g) | 19.09 | (g) | 5.18 | (g) | 36 | ||||||||||||||||||||||||||||||||||
Class R5 | ||||||||||||||||||||||||||||||||||||||||||||||||||||||||
Year ended 12/31/12 | 8.86 | 0.14 | 0.43 | 0.57 | (0.22 | ) | (0.11 | ) | (0.33 | ) | 9.10 | 6.46 | 2,935 | 0.00 | (e) | 0.66 | (e) | 1.55 | (e) | 7 | ||||||||||||||||||||||||||||||||||||
Year ended 12/31/11 | 8.59 | 0.20 | 0.35 | 0.55 | (0.16 | ) | (0.12 | ) | (0.28 | ) | 8.86 | 6.42 | 26 | 0.00 | 0.75 | 2.20 | 15 | |||||||||||||||||||||||||||||||||||||||
Year ended 12/31/10 | 8.23 | 0.39 | 0.26 | 0.65 | (0.29 | ) | — | (0.29 | ) | 8.59 | 8.00 | 13 | 0.00 | 2.93 | 4.60 | 67 | ||||||||||||||||||||||||||||||||||||||||
Year ended 12/31/09 | 7.59 | 0.49 | 0.61 | 1.10 | (0.46 | ) | — | (0.46 | ) | 8.23 | 14.82 | 49 | 0.02 | 9.92 | 6.18 | 155 | ||||||||||||||||||||||||||||||||||||||||
Year ended 12/31/08 | 9.78 | 0.46 | (2.09 | ) | (1.63 | ) | (0.53 | ) | (0.03 | ) | (0.56 | ) | 7.59 | (17.23 | ) | 43 | 0.06 | 11.41 | 5.14 | 36 | ||||||||||||||||||||||||||||||||||||
Class R6 | ||||||||||||||||||||||||||||||||||||||||||||||||||||||||
Year ended 12/31/12(f) | 9.38 | 0.04 | (0.02 | ) | 0.02 | (0.19 | ) | (0.11 | ) | (0.30 | ) | 9.10 | 0.30 | 10 | 0.00 | (e)(g) | 0.62 | (e)(g) | 1.55 | (e)(g) | 7 | |||||||||||||||||||||||||||||||||||
| (a) | Calculated using average shares outstanding. |
| (b) | Includes adjustments in accordance with accounting principles generally accepted in the United States of America and as such, the net asset value for financial reporting purposes and the returns based upon those net asset values may differ from the net asset value and returns for shareholder transactions. Does not include sales charges and is not annualized for periods less than one year, if applicable. |
| (c) | In addition to the fees and expenses which the Fund bears directly; the Fund indirectly bears a pro rata share of the fees and expenses of the underlying funds in which the Fund invests. Because the underlying funds have varied expenses and fee levels and the Fund may own different proportions at different times, the amount of fees and expenses incurred indirectly by the Fund will vary. Estimated underlying fund expenses are not expenses that are incurred directly by your Fund. They are expenses that are incurred directly by the underlying funds and are deducted from the value of the funds your Fund invests in. The effect of the estimated underlying fund expenses that you bear indirectly is included in your Fund’s total return. Estimated acquired fund fees from underlying funds were 0.52%, 0.59%, 0.55%, 0.63% and 0.65% for the years ended December 31, 2012, December 31, 2011, December 31, 2010, December 31, 2009 and December 31, 2008, respectively. |
| (d) | Portfolio turnover is calculated at the fund level and is not annualized for periods less than one year, if applicable. |
| (e) | Ratios are based on average daily net assets (000’s) of $12,413, $19,485, $750, $3,571, $4,777, $1,859, $501, $533, $2,403 and $3 for Class A, Class AX, Class B, Class C, Class CX, Class R, Class RX Class Y, Class R5 and Class R6 shares, respectively. |
| (f) | Commencement date October 3, 2008 for Class Y shares; June 1, 2010 for Class AX, CX and RX shares and September 24, 2012 for Class R6 shares, respectively. |
| (g) | Annualized. |
48 Invesco Balanced-Risk Retirement Funds
NOTE 11—Financial Highlights—(continued)
Invesco Balanced-Risk Retirement 2020 Fund
| Net asset value, beginning of period | Net investment income(a) | Net gains (losses) on securities (both realized and unrealized) | Total from investment operations | Dividends from net investment income | Distributions from net realized gains | Total distributions | Net asset value, end of period | Total return(b) | Net assets, end of period (000s omitted) | Ratio of expenses to average net assets with fee waivers and/or expense reimbursements(c) | Ratio of expenses to average net assets without fee waivers and/or expense reimbursements | Ratio of net investment income to average net assets | Portfolio turnover(d) | |||||||||||||||||||||||||||||||||||||||||||
Class A | ||||||||||||||||||||||||||||||||||||||||||||||||||||||||
Year ended 12/31/12 | $ | 9.05 | $ | 0.22 | $ | 0.67 | $ | 0.89 | $ | (0.33 | ) | $ | (0.10 | ) | $ | (0.43 | ) | $ | 9.51 | 9.89 | % | $ | 41,873 | 0.25 | %(e) | 0.75 | %(e) | 2.24 | %(e) | 6 | % | |||||||||||||||||||||||||
Year ended 12/31/11 | 8.56 | 0.23 | 0.61 | 0.84 | (0.23 | ) | (0.12 | ) | (0.35 | ) | 9.05 | 9.84 | 26,420 | 0.25 | 0.80 | 2.59 | 15 | |||||||||||||||||||||||||||||||||||||||
Year ended 12/31/10 | 7.97 | 0.55 | 0.49 | 1.04 | (0.44 | ) | (0.01 | ) | (0.45 | ) | 8.56 | 13.11 | 17,933 | 0.25 | 1.13 | 6.61 | 57 | |||||||||||||||||||||||||||||||||||||||
Year ended 12/31/09 | 6.93 | 0.62 | 0.94 | 1.56 | (0.52 | ) | — | (0.52 | ) | 7.97 | 22.49 | 11,371 | 0.30 | 2.08 | 8.23 | 185 | ||||||||||||||||||||||||||||||||||||||||
Year ended 12/31/08 | 9.96 | 0.39 | (3.13 | ) | (2.74 | ) | (0.25 | ) | (0.04 | ) | (0.29 | ) | 6.93 | (27.53 | ) | 5,899 | 0.38 | 3.48 | 4.54 | 30 | ||||||||||||||||||||||||||||||||||||
Class AX | ||||||||||||||||||||||||||||||||||||||||||||||||||||||||
Year ended 12/31/12 | 9.05 | 0.21 | 0.68 | 0.89 | (0.33 | ) | (0.10 | ) | (0.43 | ) | 9.51 | 9.89 | 14,125 | 0.25 | (e) | 0.75 | (e) | 2.24 | (e) | 6 | ||||||||||||||||||||||||||||||||||||
Year ended 12/31/11 | 8.56 | 0.23 | 0.61 | 0.84 | (0.23 | ) | (0.12 | ) | (0.35 | ) | 9.05 | 9.84 | 15,291 | 0.25 | 0.80 | 2.59 | 15 | |||||||||||||||||||||||||||||||||||||||
Year ended 12/31/10(f) | 8.14 | 0.33 | 0.54 | 0.87 | (0.44 | ) | (0.01 | ) | (0.45 | ) | 8.56 | 10.75 | 21,136 | 0.25 | (g) | 0.73 | (g) | 6.61 | (g) | 57 | ||||||||||||||||||||||||||||||||||||
Class B | ||||||||||||||||||||||||||||||||||||||||||||||||||||||||
Year ended 12/31/12 | 8.97 | 0.14 | 0.66 | 0.80 | (0.27 | ) | (0.10 | ) | (0.37 | ) | 9.40 | 8.95 | 3,501 | 1.00 | (e) | 1.50 | (e) | 1.49 | (e) | 6 | ||||||||||||||||||||||||||||||||||||
Year ended 12/31/11 | 8.49 | 0.16 | 0.60 | 0.76 | (0.16 | ) | (0.12 | ) | (0.28 | ) | 8.97 | 9.04 | 3,163 | 1.00 | 1.55 | 1.84 | 15 | |||||||||||||||||||||||||||||||||||||||
Year ended 12/31/10 | 7.91 | 0.49 | 0.48 | 0.97 | (0.38 | ) | (0.01 | ) | (0.39 | ) | 8.49 | 12.30 | 2,899 | 1.00 | 1.88 | 5.86 | 57 | |||||||||||||||||||||||||||||||||||||||
Year ended 12/31/09 | 6.90 | 0.56 | 0.92 | 1.48 | (0.47 | ) | — | (0.47 | ) | 7.91 | 21.45 | 1,997 | 1.05 | 2.83 | 7.48 | 185 | ||||||||||||||||||||||||||||||||||||||||
Year ended 12/31/08 | 9.92 | 0.32 | (3.10 | ) | (2.78 | ) | (0.20 | ) | (0.04 | ) | (0.24 | ) | 6.90 | (28.01 | ) | 1,431 | 1.13 | 4.23 | 3.79 | 30 | ||||||||||||||||||||||||||||||||||||
Class C | ||||||||||||||||||||||||||||||||||||||||||||||||||||||||
Year ended 12/31/12 | 8.95 | 0.14 | 0.66 | 0.80 | (0.27 | ) | (0.10 | ) | (0.37 | ) | 9.38 | 8.97 | 10,550 | 1.00 | (e) | 1.50 | (e) | 1.49 | (e) | 6 | ||||||||||||||||||||||||||||||||||||
Year ended 12/31/11 | 8.47 | 0.16 | 0.60 | 0.76 | (0.16 | ) | (0.12 | ) | (0.28 | ) | 8.95 | 9.06 | 5,322 | 1.00 | 1.55 | 1.84 | 15 | |||||||||||||||||||||||||||||||||||||||
Year ended 12/31/10 | 7.90 | 0.49 | 0.47 | 0.96 | (0.38 | ) | (0.01 | ) | (0.39 | ) | 8.47 | 12.19 | 3,966 | 1.00 | 1.88 | 5.86 | 57 | |||||||||||||||||||||||||||||||||||||||
Year ended 12/31/09 | 6.88 | 0.56 | 0.93 | 1.49 | (0.47 | ) | — | (0.47 | ) | 7.90 | 21.66 | 2,125 | 1.05 | 2.83 | 7.48 | 185 | ||||||||||||||||||||||||||||||||||||||||
Year ended 12/31/08 | 9.92 | 0.32 | (3.12 | ) | (2.80 | ) | (0.20 | ) | (0.04 | ) | (0.24 | ) | 6.88 | (28.21 | ) | 852 | 1.13 | 4.23 | 3.79 | 30 | ||||||||||||||||||||||||||||||||||||
Class CX | ||||||||||||||||||||||||||||||||||||||||||||||||||||||||
Year ended 12/31/12 | 8.95 | 0.14 | 0.66 | 0.80 | (0.27 | ) | (0.10 | ) | (0.37 | ) | 9.38 | 8.97 | 3,759 | 1.00 | (e) | 1.50 | (e) | 1.49 | (e) | 6 | ||||||||||||||||||||||||||||||||||||
Year ended 12/31/11 | 8.48 | 0.16 | 0.60 | 0.76 | (0.17 | ) | (0.12 | ) | (0.29 | ) | 8.95 | 8.93 | 3,862 | 1.00 | 1.55 | 1.84 | 15 | |||||||||||||||||||||||||||||||||||||||
Year ended 12/31/10(f) | 8.04 | 0.29 | 0.54 | 0.83 | (0.38 | ) | (0.01 | ) | (0.39 | ) | 8.48 | 10.37 | 4,543 | 1.00 | (g) | 1.48 | (g) | 5.86 | (g) | 57 | ||||||||||||||||||||||||||||||||||||
Class R | ||||||||||||||||||||||||||||||||||||||||||||||||||||||||
Year ended 12/31/12 | 9.02 | 0.19 | 0.67 | 0.86 | (0.31 | ) | (0.10 | ) | (0.41 | ) | 9.47 | 9.58 | 10,942 | 0.50 | (e) | 1.00 | (e) | 1.99 | (e) | 6 | ||||||||||||||||||||||||||||||||||||
Year ended 12/31/11 | 8.54 | 0.21 | 0.60 | 0.81 | (0.21 | ) | (0.12 | ) | (0.33 | ) | 9.02 | 9.49 | 5,930 | 0.50 | 1.05 | 2.34 | 15 | |||||||||||||||||||||||||||||||||||||||
Year ended 12/31/10 | 7.95 | 0.53 | 0.49 | 1.02 | (0.42 | ) | (0.01 | ) | (0.43 | ) | 8.54 | 12.90 | 5,214 | 0.50 | 1.38 | 6.36 | 57 | |||||||||||||||||||||||||||||||||||||||
Year ended 12/31/09 | 6.92 | 0.61 | 0.92 | 1.53 | (0.50 | ) | — | (0.50 | ) | 7.95 | 22.15 | 2,542 | 0.55 | 2.33 | 7.98 | 185 | ||||||||||||||||||||||||||||||||||||||||
Year ended 12/31/08 | 9.95 | 0.38 | (3.14 | ) | (2.76 | ) | (0.23 | ) | (0.04 | ) | (0.27 | ) | 6.92 | (27.72 | ) | 974 | 0.63 | 3.73 | 4.29 | 30 | ||||||||||||||||||||||||||||||||||||
Class RX | ||||||||||||||||||||||||||||||||||||||||||||||||||||||||
Year ended 12/31/12 | 9.02 | 0.19 | 0.67 | 0.86 | (0.31 | ) | (0.10 | ) | (0.41 | ) | 9.47 | 9.58 | 1,957 | 0.50 | (e) | 1.00 | (e) | 1.99 | (e) | 6 | ||||||||||||||||||||||||||||||||||||
Year ended 12/31/11 | 8.54 | 0.21 | 0.60 | 0.81 | (0.21 | ) | (0.12 | ) | (0.33 | ) | 9.02 | 9.49 | 1,443 | 0.50 | 1.05 | 2.34 | 15 | |||||||||||||||||||||||||||||||||||||||
Year ended 12/31/10(f) | 8.11 | 0.32 | 0.54 | 0.86 | (0.42 | ) | (0.01 | ) | (0.43 | ) | 8.54 | 10.67 | 1,328 | 0.50 | (g) | 0.98 | (g) | 6.36 | (g) | 57 | ||||||||||||||||||||||||||||||||||||
Class Y | ||||||||||||||||||||||||||||||||||||||||||||||||||||||||
Year ended 12/31/12 | 9.06 | 0.24 | 0.66 | 0.90 | (0.35 | ) | (0.10 | ) | (0.45 | ) | 9.51 | 10.00 | 6,486 | 0.00 | (e) | 0.50 | (e) | 2.49 | (e) | 6 | ||||||||||||||||||||||||||||||||||||
Year ended 12/31/11 | 8.57 | 0.25 | 0.61 | 0.86 | (0.25 | ) | (0.12 | ) | (0.37 | ) | 9.06 | 10.08 | 395 | 0.00 | 0.55 | 2.84 | 15 | |||||||||||||||||||||||||||||||||||||||
Year ended 12/31/10 | 7.97 | 0.58 | 0.49 | 1.07 | (0.46 | ) | (0.01 | ) | (0.47 | ) | 8.57 | 13.52 | 133 | 0.00 | 0.88 | 6.86 | 57 | |||||||||||||||||||||||||||||||||||||||
Year ended 12/31/09 | 6.93 | 0.63 | 0.94 | 1.57 | (0.53 | ) | — | (0.53 | ) | 7.97 | 22.70 | 16 | 0.05 | 1.83 | 8.48 | 185 | ||||||||||||||||||||||||||||||||||||||||
Year ended 12/31/08(f) | 8.21 | 0.08 | (1.07 | ) | (0.99 | ) | (0.25 | ) | (0.04 | ) | (0.29 | ) | 6.93 | (12.03 | ) | 50 | 0.08 | (g) | 4.83 | (g) | 4.84 | (g) | 30 | |||||||||||||||||||||||||||||||||
Class R5 | ||||||||||||||||||||||||||||||||||||||||||||||||||||||||
Year ended 12/31/12 | 9.09 | 0.24 | 0.67 | 0.91 | (0.35 | ) | (0.10 | ) | (0.45 | ) | 9.55 | 10.08 | 5,839 | 0.00 | (e) | 0.42 | (e) | 2.49 | (e) | 6 | ||||||||||||||||||||||||||||||||||||
Year ended 12/31/11 | 8.60 | 0.25 | 0.61 | 0.86 | (0.25 | ) | (0.12 | ) | (0.37 | ) | 9.09 | 10.04 | 12 | 0.00 | 0.47 | 2.84 | 15 | |||||||||||||||||||||||||||||||||||||||
Year ended 12/31/10 | 8.00 | 0.58 | 0.49 | 1.07 | (0.46 | ) | (0.01 | ) | (0.47 | ) | 8.60 | 13.47 | 12 | 0.00 | 0.72 | 6.86 | 57 | |||||||||||||||||||||||||||||||||||||||
Year ended 12/31/09 | 6.95 | 0.64 | 0.94 | 1.58 | (0.53 | ) | — | (0.53 | ) | 8.00 | 22.79 | 11 | 0.07 | 1.68 | 8.46 | 185 | ||||||||||||||||||||||||||||||||||||||||
Year ended 12/31/08 | 9.99 | 0.42 | (3.16 | ) | (2.74 | ) | (0.26 | ) | (0.04 | ) | (0.30 | ) | 6.95 | (27.41 | ) | 9 | 0.13 | 2.98 | 4.79 | 30 | ||||||||||||||||||||||||||||||||||||
Class R6 | ||||||||||||||||||||||||||||||||||||||||||||||||||||||||
Year ended 12/31/12(f) | 9.96 | 0.07 | (0.02 | ) | 0.05 | (0.35 | ) | (0.10 | ) | (0.45 | ) | 9.56 | 0.57 | 10 | 0.00 | e)(g) | 0.30 | (e)(g) | 2.49 | (e)(g) | 6 | |||||||||||||||||||||||||||||||||||
| (a) | Calculated using average shares outstanding. |
| (b) | Includes adjustments in accordance with accounting principles generally accepted in the United States of America and as such, the net asset value for financial reporting purposes and the returns based upon those net asset values may differ from the net asset value and returns for shareholder transactions. Does not include sales charges and is not annualized for periods less than one year, if applicable. |
| (c) | In addition to the fees and expenses which the Fund bears directly; the Fund indirectly bears a pro rata share of the fees and expenses of the underlying funds in which the Fund invests. Because the underlying funds have varied expenses and fee levels and the Fund may own different proportions at different times, the amount of fees and expenses incurred indirectly by the Fund will vary. Estimated underlying fund expenses are not expenses that are incurred directly by your Fund. They are expenses that are incurred directly by the underlying funds and are deducted from the value of the funds your Fund invests in. The effect of the estimated underlying fund expenses that you bear indirectly is included in your Fund’s total return. Estimated acquired fund fees from underlying funds were 0.71%, 0.85%, 0.79%, 0.74% and 0.74% for the years ended December 31, 2012, December 31, 2011, December 31, 2010, December 31, 2009 and December 31, 2008, respectively. |
| (d) | Portfolio turnover is calculated at the fund level and is not annualized for periods less than one year, if applicable. |
| (e) | Ratios are based on average daily net assets (000’s) of $34,341, $15,006, $3,420, $7,972, $3,798, $8,511, $1,639, $3,781, $4,867 and $3 for Class A, Class AX, Class B, Class C, Class CX, Class R Class RX, Class Y, Class R5 and Class R6 shares, respectively. |
| (f) | Commencement date October 3, 2008 for Class Y shares; June 1, 2010 for Class AX, CX and RX shares and September 24, 2012 for Class R6 shares, respectively. |
| (g) | Annualized. |
49 Invesco Balanced-Risk Retirement Funds
NOTE 11—Financial Highlights—(continued)
Invesco Balanced-Risk Retirement 2030 Fund
| Net asset value, beginning of period | Net investment income(a) | Net gains (losses) on securities (both realized and unrealized) | Total from investment operations | Dividends from net investment income | Distributions from net realized gains | Total distributions | Net asset value, end of period | Total return(b) | Net assets, end of period (000s omitted) | Ratio of expenses to average net assets with fee waivers and/or expense reimbursements(c) | Ratio of expenses to average net assets without fee waivers and/or expense reimbursements | Ratio of net investment income to average net assets | Portfolio turnover(d) | |||||||||||||||||||||||||||||||||||||||||||
Class A |
| |||||||||||||||||||||||||||||||||||||||||||||||||||||||
Year ended 12/31/12 | $ | 8.72 | $ | 0.25 | $ | 0.67 | $ | 0.92 | $ | (0.36 | ) | $ | (0.05 | ) | $ | (0.41 | ) | $ | 9.23 | 10.55 | % | $ | 38,142 | 0.25 | %(e) | 0.76 | %(e) | 2.66 | %(e) | 3 | % | |||||||||||||||||||||||||
Year ended 12/31/11 | 8.14 | 0.25 | 0.57 | 0.82 | (0.23 | ) | (0.01 | ) | (0.24 | ) | 8.72 | 10.16 | 22,508 | 0.25 | 0.95 | 2.89 | 9 | |||||||||||||||||||||||||||||||||||||||
Year ended 12/31/10 | 7.58 | 0.53 | 0.45 | 0.98 | (0.42 | ) | — | (0.42 | ) | 8.14 | 13.06 | 13,983 | 0.25 | 1.32 | 6.63 | 32 | ||||||||||||||||||||||||||||||||||||||||
Year ended 12/31/09 | 6.33 | 0.57 | 1.12 | 1.69 | (0.44 | ) | — | (0.44 | ) | 7.58 | 26.76 | 8,346 | 0.33 | 2.40 | 8.05 | 201 | ||||||||||||||||||||||||||||||||||||||||
Year ended 12/31/08 | 9.89 | 0.29 | (3.62 | ) | (3.33 | ) | (0.18 | ) | (0.05 | ) | (0.23 | ) | 6.33 | (33.64 | ) | 3,088 | 0.40 | 4.07 | 3.50 | 17 | ||||||||||||||||||||||||||||||||||||
Class AX | ||||||||||||||||||||||||||||||||||||||||||||||||||||||||
Year ended 12/31/12 | 8.72 | 0.25 | 0.67 | 0.92 | (0.36 | ) | (0.05 | ) | (0.41 | ) | 9.23 | 10.55 | 10,273 | 0.25 | (e) | 0.76 | (e) | 2.66 | (e) | 3 | ||||||||||||||||||||||||||||||||||||
Year ended 12/31/11 | 8.14 | 0.25 | 0.57 | 0.82 | (0.23 | ) | (0.01 | ) | (0.24 | ) | 8.72 | 10.16 | 10,834 | 0.25 | 0.95 | 2.89 | 9 | |||||||||||||||||||||||||||||||||||||||
Year ended 12/31/10(f) | 7.73 | 0.32 | 0.51 | 0.83 | (0.42 | ) | — | (0.42 | ) | 8.14 | 10.86 | 13,388 | 0.25 | (g) | 0.92 | (g) | 6.63 | (g) | 32 | |||||||||||||||||||||||||||||||||||||
Class B | ||||||||||||||||||||||||||||||||||||||||||||||||||||||||
Year ended 12/31/12 | 8.65 | 0.18 | 0.66 | 0.84 | (0.30 | ) | (0.05 | ) | (0.35 | ) | 9.14 | 9.70 | 3,507 | 1.00 | (e) | 1.51 | (e) | 1.91 | (e) | 3 | ||||||||||||||||||||||||||||||||||||
Year ended 12/31/11 | 8.08 | 0.18 | 0.57 | 0.75 | (0.17 | ) | (0.01 | ) | (0.18 | ) | 8.65 | 9.36 | 3,068 | 1.00 | 1.70 | 2.14 | 9 | |||||||||||||||||||||||||||||||||||||||
Year ended 12/31/10 | 7.54 | 0.46 | 0.44 | 0.90 | (0.36 | ) | — | (0.36 | ) | 8.08 | 12.08 | 3,223 | 1.00 | 2.07 | 5.88 | 32 | ||||||||||||||||||||||||||||||||||||||||
Year ended 12/31/09 | 6.31 | 0.51 | 1.12 | 1.63 | (0.40 | ) | — | (0.40 | ) | 7.54 | 25.86 | 2,424 | 1.08 | 3.15 | 7.30 | 201 | ||||||||||||||||||||||||||||||||||||||||
Year ended 12/31/08 | 9.87 | 0.22 | (3.59 | ) | (3.37 | ) | (0.14 | ) | (0.05 | ) | (0.19 | ) | 6.31 | (34.18 | ) | 1,386 | 1.15 | 4.82 | 2.75 | 17 | ||||||||||||||||||||||||||||||||||||
Class C | ||||||||||||||||||||||||||||||||||||||||||||||||||||||||
Year ended 12/31/12 | 8.64 | 0.18 | 0.66 | 0.84 | (0.30 | ) | (0.05 | ) | (0.35 | ) | 9.13 | 9.71 | 10,976 | 1.00 | (e) | 1.51 | (e) | 1.91 | (e) | 3 | ||||||||||||||||||||||||||||||||||||
Year ended 12/31/11 | 8.07 | 0.18 | 0.57 | 0.75 | (0.17 | ) | (0.01 | ) | (0.18 | ) | 8.64 | 9.37 | 6,107 | 1.00 | 1.70 | 2.14 | 9 | |||||||||||||||||||||||||||||||||||||||
Year ended 12/31/10 | 7.54 | 0.46 | 0.43 | 0.89 | (0.36 | ) | — | (0.36 | ) | 8.07 | 11.95 | 3,550 | 1.00 | 2.07 | 5.88 | 32 | ||||||||||||||||||||||||||||||||||||||||
Year ended 12/31/09 | 6.31 | 0.52 | 1.11 | 1.63 | (0.40 | ) | — | (0.40 | ) | 7.54 | 25.86 | 2,164 | 1.08 | 3.15 | 7.30 | 201 | ||||||||||||||||||||||||||||||||||||||||
Year ended 12/31/08 | 9.87 | 0.23 | (3.60 | ) | (3.37 | ) | (0.14 | ) | (0.05 | ) | (0.19 | ) | 6.31 | (34.18 | ) | 938 | 1.15 | 4.82 | 2.75 | 17 | ||||||||||||||||||||||||||||||||||||
Class CX | ||||||||||||||||||||||||||||||||||||||||||||||||||||||||
Year ended 12/31/12 | 8.64 | 0.17 | 0.67 | 0.84 | (0.30 | ) | (0.05 | ) | (0.35 | ) | 9.13 | 9.71 | 2,017 | 1.00 | (e) | 1.51 | (e) | 1.91 | (e) | 3 | ||||||||||||||||||||||||||||||||||||
Year ended 12/31/11 | 8.07 | 0.18 | 0.57 | 0.75 | (0.17 | ) | (0.01 | ) | (0.18 | ) | 8.64 | 9.37 | 1,883 | 1.00 | 1.70 | 2.14 | 9 | |||||||||||||||||||||||||||||||||||||||
Year ended 12/31/10(f) | 7.65 | 0.28 | 0.50 | 0.78 | (0.36 | ) | — | (0.36 | ) | 8.07 | 10.34 | 2,989 | 1.00 | (g) | 1.67 | (g) | 5.88 | (g) | 32 | |||||||||||||||||||||||||||||||||||||
Class R | ||||||||||||||||||||||||||||||||||||||||||||||||||||||||
Year ended 12/31/12 | 8.68 | 0.22 | 0.67 | 0.89 | (0.34 | ) | (0.05 | ) | (0.39 | ) | 9.18 | 10.25 | 12,296 | 0.50 | (e) | 1.01 | (e) | 2.41 | (e) | 3 | ||||||||||||||||||||||||||||||||||||
Year ended 12/31/11 | 8.11 | 0.22 | 0.57 | 0.79 | (0.21 | ) | (0.01 | ) | (0.22 | ) | 8.68 | 9.83 | 7,636 | 0.50 | 1.20 | 2.64 | 9 | |||||||||||||||||||||||||||||||||||||||
Year ended 12/31/10 | 7.56 | 0.51 | 0.44 | 0.95 | (0.40 | ) | — | (0.40 | ) | 8.11 | 12.71 | 6,707 | 0.50 | 1.57 | 6.38 | 32 | ||||||||||||||||||||||||||||||||||||||||
Year ended 12/31/09 | 6.31 | 0.56 | 1.12 | 1.68 | (0.43 | ) | — | (0.43 | ) | 7.56 | 26.64 | 3,934 | 0.58 | 2.65 | 7.80 | 201 | ||||||||||||||||||||||||||||||||||||||||
Year ended 12/31/08 | 9.88 | 0.26 | (3.61 | ) | (3.35 | ) | (0.17 | ) | (0.05 | ) | (0.22 | ) | 6.31 | (33.92 | ) | 1,534 | 0.65 | 4.32 | 3.25 | 17 | ||||||||||||||||||||||||||||||||||||
Class RX | ||||||||||||||||||||||||||||||||||||||||||||||||||||||||
Year ended 12/31/12 | 8.68 | 0.22 | 0.67 | 0.89 | (0.34 | ) | (0.05 | ) | (0.39 | ) | 9.18 | 10.26 | 1,177 | 0.50 | (e) | 1.01 | (e) | 2.41 | (e) | 3 | ||||||||||||||||||||||||||||||||||||
Year ended 12/31/11 | 8.10 | 0.22 | 0.58 | 0.80 | (0.21 | ) | (0.01 | ) | (0.22 | ) | 8.68 | 9.97 | 848 | 0.50 | 1.20 | 2.64 | 9 | |||||||||||||||||||||||||||||||||||||||
Year ended 12/31/10(f) | 7.69 | 0.30 | 0.51 | 0.81 | (0.40 | ) | — | (0.40 | ) | 8.10 | 10.68 | 696 | 0.50 | (g) | 1.17 | (g) | 6.38 | (g) | 32 | |||||||||||||||||||||||||||||||||||||
Class Y | ||||||||||||||||||||||||||||||||||||||||||||||||||||||||
Year ended 12/31/12 | 8.73 | 0.27 | 0.68 | 0.95 | (0.38 | ) | (0.05 | ) | (0.43 | ) | 9.25 | 10.88 | 4,077 | 0.00 | (e) | 0.51 | (e) | 2.91 | (e) | 3 | ||||||||||||||||||||||||||||||||||||
Year ended 12/31/11 | 8.15 | 0.27 | 0.57 | 0.84 | (0.25 | ) | (0.01 | ) | (0.26 | ) | 8.73 | 10.40 | 2,403 | 0.00 | 0.70 | 3.14 | 9 | |||||||||||||||||||||||||||||||||||||||
Year ended 12/31/10 | 7.59 | 0.55 | 0.45 | 1.00 | (0.44 | ) | — | (0.44 | ) | 8.15 | 13.30 | 1,112 | 0.00 | 1.07 | 6.88 | 32 | ||||||||||||||||||||||||||||||||||||||||
Year ended 12/31/09 | 6.33 | 0.60 | 1.12 | 1.72 | (0.46 | ) | — | (0.46 | ) | 7.59 | 27.13 | 221 | 0.08 | 2.15 | 8.30 | 201 | ||||||||||||||||||||||||||||||||||||||||
Year ended 12/31/08(f) | 7.77 | 0.06 | (1.26 | ) | (1.20 | ) | (0.19 | ) | (0.05 | ) | (0.24 | ) | 6.33 | (15.49 | ) | 50 | 0.11 | (g) | 5.07 | (g) | 3.79 | (g) | 17 | |||||||||||||||||||||||||||||||||
Class R5 | ||||||||||||||||||||||||||||||||||||||||||||||||||||||||
Year ended 12/31/12 | 8.75 | 0.27 | 0.68 | 0.95 | (0.38 | ) | (0.05 | ) | (0.43 | ) | 9.27 | 10.86 | 18,476 | 0.00 | (e) | 0.40 | (e) | 2.91 | (e) | 3 | ||||||||||||||||||||||||||||||||||||
Year ended 12/31/11 | 8.17 | 0.27 | 0.57 | 0.84 | (0.25 | ) | (0.01 | ) | (0.26 | ) | 8.75 | 10.37 | 12 | 0.00 | 0.51 | 3.14 | 9 | |||||||||||||||||||||||||||||||||||||||
Year ended 12/31/10 | 7.60 | 0.55 | 0.46 | 1.01 | (0.44 | ) | — | (0.44 | ) | 8.17 | 13.43 | 18 | 0.00 | 0.91 | 6.88 | 32 | ||||||||||||||||||||||||||||||||||||||||
Year ended 12/31/09 | 6.34 | 0.58 | 1.14 | 1.72 | (0.46 | ) | — | (0.46 | ) | 7.60 | 27.10 | 10 | 0.09 | 1.90 | 8.29 | 201 | ||||||||||||||||||||||||||||||||||||||||
Year ended 12/31/08 | 9.90 | 0.32 | (3.63 | ) | (3.31 | ) | (0.20 | ) | (0.05 | ) | (0.25 | ) | 6.34 | (33.46 | ) | 8 | 0.15 | 3.50 | 3.75 | 17 | ||||||||||||||||||||||||||||||||||||
Class R6 | ||||||||||||||||||||||||||||||||||||||||||||||||||||||||
Year ended 12/31/12(f) | 9.65 | 0.07 | (0.02 | ) | 0.05 | (0.38 | ) | (0.05 | ) | (0.43 | ) | 9.27 | 0.52 | 10 | 0.00 | (e)(g) | 0.32 | (e)(g) | 2.91 | (e)(g) | 3 | |||||||||||||||||||||||||||||||||||
| (a) | Calculated using average shares outstanding. |
| (b) | Includes adjustments in accordance with accounting principles generally accepted in the United States of America and as such, the net asset value for financial reporting purposes and the returns based upon those net asset values may differ from the net asset value and returns for shareholder transactions. Does not include sales charges and is not annualized for periods less than one year, if applicable. |
| (c) | In addition to the fees and expenses which the Fund bears directly; the Fund indirectly bears a pro rata share of the fees and expenses of the underlying funds in which the Fund invests. Because the underlying funds have varied expenses and fee levels and the Fund may own different proportions at different times, the amount of fees and expenses incurred indirectly by the Fund will vary. Estimated underlying fund expenses are not expenses that are incurred directly by your Fund. They are expenses that are incurred directly by the underlying funds and are deducted from the value of the funds your Fund invests in. The effect of the estimated underlying fund expenses that you bear indirectly is included in your Fund’s total return. Estimated acquired fund fees from underlying funds were 0.85%, 0.87%, 0.79%, 0.78% and 0.76% for the years ended December 31, 2012, December 31, 2011, December 31, 2010, December 31, 2009 and December 31, 2008, respectively. |
| (d) | Portfolio turnover is calculated at the fund level and is not annualized for periods less than one year, if applicable. |
| (e) | Ratios are based on average daily net assets (000’s) of $31,128, $10,632, $3,443, $8,475, $1,966, $9,860, $1,016, $2,944, $12,922 and $3 for Class A, Class AX, Class B, Class C, Class CX, Class R Class RX, Class Y, Class R5 and Class R6 shares, respectively. |
| (f) | Commencement date October 3, 2008 for Class Y shares; June 1, 2010 for Class AX, CX and RX shares and September 24, 2012 for Class R6 shares, respectively. |
| (g) | Annualized. |
50 Invesco Balanced-Risk Retirement Funds
NOTE 11—Financial Highlights—(continued)
Invesco Balanced-Risk Retirement 2040 Fund
| Net asset value, beginning of period | Net investment income(a) | Net gains (losses) on securities (both realized and unrealized) | Total from investment operations | Dividends from net investment income | Distributions from net realized gains | Total distributions | Net asset value, end of period | Total return(b) | Net assets, end of period (000s omitted) | Ratio of expenses to average net assets with fee waivers and/or expense reimbursements(c) | Ratio of expenses to average net assets without fee waivers and/or expense reimbursements | Ratio of net investment income to average net assets | Portfolio turnover(d) | |||||||||||||||||||||||||||||||||||||||||||
Class A |
| |||||||||||||||||||||||||||||||||||||||||||||||||||||||
Year ended 12/31/12 | $ | 8.23 | $ | 0.24 | $ | 0.62 | $ | 0.86 | $ | (0.33 | ) | $ | — | $ | (0.33 | ) | $ | 8.76 | 10.38 | % | $ | 28,426 | 0.25 | %(e) | 1.07 | %(e) | 2.69 | %(e) | 4 | % | ||||||||||||||||||||||||||
Year ended 12/31/11 | 7.79 | 0.23 | 0.57 | 0.80 | (0.36 | ) | — | (0.36 | ) | 8.23 | 10.30 | 13,484 | 0.25 | 1.52 | 2.88 | 14 | ||||||||||||||||||||||||||||||||||||||||
Year ended 12/31/10 | 7.36 | 0.53 | 0.42 | 0.95 | (0.25 | ) | (0.27 | ) | (0.52 | ) | 7.79 | 13.03 | 8,727 | 0.25 | 1.94 | 6.79 | 26 | |||||||||||||||||||||||||||||||||||||||
Year ended 12/31/09 | 6.09 | 0.53 | 1.15 | 1.68 | (0.41 | ) | — | (0.41 | ) | 7.36 | 27.59 | 4,605 | 0.33 | 4.14 | 7.69 | 214 | ||||||||||||||||||||||||||||||||||||||||
Year ended 12/31/08 | 9.83 | 0.23 | (3.78 | ) | (3.55 | ) | (0.15 | ) | (0.04 | ) | (0.19 | ) | 6.09 | (36.00 | ) | 1,907 | 0.41 | 8.63 | 2.88 | 29 | ||||||||||||||||||||||||||||||||||||
Class AX | ||||||||||||||||||||||||||||||||||||||||||||||||||||||||
Year ended 12/31/12 | 8.22 | 0.23 | 0.63 | 0.86 | (0.33 | ) | — | (0.33 | ) | 8.75 | 10.51 | 3,999 | 0.25 | (e) | 1.07 | (e) | 2.69 | (e) | 4 | |||||||||||||||||||||||||||||||||||||
Year ended 12/31/11 | 7.79 | 0.23 | 0.56 | 0.79 | (0.36 | ) | — | (0.36 | ) | 8.22 | 10.17 | 4,087 | 0.25 | 1.52 | 2.88 | 14 | ||||||||||||||||||||||||||||||||||||||||
Year ended 12/31/10(f) | 7.50 | 0.31 | 0.50 | 0.81 | (0.25 | ) | (0.27 | ) | (0.52 | ) | 7.79 | 10.92 | 6,212 | 0.25 | (g) | 1.42 | (g) | 6.79 | (g) | 26 | ||||||||||||||||||||||||||||||||||||
Class B | ||||||||||||||||||||||||||||||||||||||||||||||||||||||||
Year ended 12/31/12 | 8.15 | 0.17 | 0.63 | 0.80 | (0.28 | ) | — | (0.28 | ) | 8.67 | 9.79 | 1,263 | 1.00 | (e) | 1.82 | (e) | 1.94 | (e) | 4 | |||||||||||||||||||||||||||||||||||||
Year ended 12/31/11 | 7.73 | 0.17 | 0.55 | 0.72 | (0.30 | ) | — | (0.30 | ) | 8.15 | 9.37 | 1,289 | 1.00 | 2.27 | 2.13 | 14 | ||||||||||||||||||||||||||||||||||||||||
Year ended 12/31/10 | 7.32 | 0.46 | 0.41 | 0.87 | (0.19 | ) | (0.27 | ) | (0.46 | ) | 7.73 | 12.08 | 1,115 | 1.00 | 2.69 | 6.04 | 26 | |||||||||||||||||||||||||||||||||||||||
Year ended 12/31/09 | 6.06 | 0.47 | 1.16 | 1.63 | (0.37 | ) | — | (0.37 | ) | 7.32 | 26.90 | 773 | 1.08 | 4.89 | 6.94 | 214 | ||||||||||||||||||||||||||||||||||||||||
Year ended 12/31/08 | 9.80 | 0.17 | (3.76 | ) | (3.59 | ) | (0.11 | ) | (0.04 | ) | (0.15 | ) | 6.06 | (36.53 | ) | 522 | 1.16 | 9.38 | 2.13 | 29 | ||||||||||||||||||||||||||||||||||||
Class C | ||||||||||||||||||||||||||||||||||||||||||||||||||||||||
Year ended 12/31/12 | 8.14 | 0.17 | 0.63 | 0.80 | (0.28 | ) | — | (0.28 | ) | 8.66 | 9.81 | 6,377 | 1.00 | (e) | 1.82 | (e) | 1.94 | (e) | 4 | |||||||||||||||||||||||||||||||||||||
Year ended 12/31/11 | 7.73 | 0.17 | 0.54 | 0.71 | (0.30 | ) | — | (0.30 | ) | 8.14 | 9.24 | 3,468 | 1.00 | 2.27 | 2.13 | 14 | ||||||||||||||||||||||||||||||||||||||||
Year ended 12/31/10 | 7.31 | 0.46 | 0.42 | 0.88 | (0.19 | ) | (0.27 | ) | (0.46 | ) | 7.73 | 12.24 | 2,136 | 1.00 | 2.69 | 6.04 | 26 | |||||||||||||||||||||||||||||||||||||||
Year ended 12/31/09 | 6.06 | 0.47 | 1.15 | 1.62 | (0.37 | ) | — | (0.37 | ) | 7.31 | 26.72 | 1,387 | 1.08 | 4.89 | 6.94 | 214 | ||||||||||||||||||||||||||||||||||||||||
Year ended 12/31/08 | 9.80 | 0.17 | (3.76 | ) | (3.59 | ) | (0.11 | ) | (0.04 | ) | (0.15 | ) | 6.06 | (36.53 | ) | 597 | 1.16 | 9.38 | 2.13 | 29 | ||||||||||||||||||||||||||||||||||||
Class CX | ||||||||||||||||||||||||||||||||||||||||||||||||||||||||
Year ended 12/31/12 | 8.14 | 0.17 | 0.62 | 0.79 | (0.28 | ) | — | (0.28 | ) | 8.65 | 9.68 | 590 | 1.00 | (e) | 1.82 | (e) | 1.94 | (e) | 4 | |||||||||||||||||||||||||||||||||||||
Year ended 12/31/11 | 7.72 | 0.17 | 0.55 | 0.72 | (0.30 | ) | — | (0.30 | ) | 8.14 | 9.38 | 595 | 1.00 | 2.27 | 2.13 | 14 | ||||||||||||||||||||||||||||||||||||||||
Year ended 12/31/10(f) | 7.42 | 0.28 | 0.48 | 0.76 | (0.19 | ) | (0.27 | ) | (0.46 | ) | 7.72 | 10.44 | 747 | 1.00 | (g) | 2.17 | (g) | 6.04 | (g) | 26 | ||||||||||||||||||||||||||||||||||||
Class R | ||||||||||||||||||||||||||||||||||||||||||||||||||||||||
Year ended 12/31/12 | 8.19 | 0.21 | 0.63 | 0.84 | (0.31 | ) | — | (0.31 | ) | 8.72 | 10.33 | 8,197 | 0.50 | (e) | 1.32 | (e) | 2.44 | (e) | 4 | |||||||||||||||||||||||||||||||||||||
Year ended 12/31/11 | 7.77 | 0.21 | 0.55 | 0.76 | (0.34 | ) | — | (0.34 | ) | 8.19 | 9.81 | 3,692 | 0.50 | 1.77 | 2.63 | 14 | ||||||||||||||||||||||||||||||||||||||||
Year ended 12/31/10 | 7.34 | 0.51 | 0.42 | 0.93 | (0.23 | ) | (0.27 | ) | (0.50 | ) | 7.77 | 12.83 | 3,536 | 0.50 | 2.19 | 6.54 | 26 | |||||||||||||||||||||||||||||||||||||||
Year ended 12/31/09 | 6.07 | 0.52 | 1.15 | 1.67 | (0.40 | ) | — | (0.40 | ) | 7.34 | 27.47 | 1,840 | 0.58 | 4.39 | 7.44 | 214 | ||||||||||||||||||||||||||||||||||||||||
Year ended 12/31/08 | 9.82 | 0.21 | (3.78 | ) | (3.57 | ) | (0.14 | ) | (0.04 | ) | (0.18 | ) | 6.07 | (36.27 | ) | 432 | 0.66 | 8.88 | 2.63 | 29 | ||||||||||||||||||||||||||||||||||||
Class RX | ||||||||||||||||||||||||||||||||||||||||||||||||||||||||
Year ended 12/31/12 | 8.20 | 0.21 | 0.62 | 0.83 | (0.31 | ) | — | (0.31 | ) | 8.72 | 10.19 | 781 | 0.50 | (e) | 1.32 | (e) | 2.44 | (e) | 4 | |||||||||||||||||||||||||||||||||||||
Year ended 12/31/11 | 7.76 | 0.21 | 0.57 | 0.78 | (0.34 | ) | — | (0.34 | ) | 8.20 | 10.08 | 631 | 0.50 | 1.77 | 2.63 | 14 | ||||||||||||||||||||||||||||||||||||||||
Year ended 12/31/10(f) | 7.47 | 0.30 | 0.49 | 0.79 | (0.23 | ) | (0.27 | ) | (0.50 | ) | 7.76 | 10.73 | 570 | 0.50 | (g) | 1.67 | (g) | 6.54 | (g) | 26 | ||||||||||||||||||||||||||||||||||||
Class Y | ||||||||||||||||||||||||||||||||||||||||||||||||||||||||
Year ended 12/31/12 | 8.24 | 0.26 | 0.63 | 0.89 | (0.35 | ) | — | (0.35 | ) | 8.78 | 10.83 | 1,967 | 0.00 | (e) | 0.82 | (e) | 2.94 | (e) | 4 | |||||||||||||||||||||||||||||||||||||
Year ended 12/31/11 | 7.81 | 0.25 | 0.56 | 0.81 | (0.38 | ) | — | (0.38 | ) | 8.24 | 10.39 | 190 | 0.00 | 1.27 | 3.13 | 14 | ||||||||||||||||||||||||||||||||||||||||
Year ended 12/31/10 | 7.37 | 0.55 | 0.43 | 0.98 | (0.27 | ) | (0.27 | ) | (0.54 | ) | 7.81 | 13.42 | 398 | 0.00 | 1.69 | 7.04 | 26 | |||||||||||||||||||||||||||||||||||||||
Year ended 12/31/09 | 6.09 | 0.56 | 1.14 | 1.70 | (0.42 | ) | — | (0.42 | ) | 7.37 | 27.96 | 75 | 0.08 | 3.89 | 7.94 | 214 | ||||||||||||||||||||||||||||||||||||||||
Year ended 12/31/08(f) | 7.56 | 0.05 | (1.32 | ) | (1.27 | ) | (0.16 | ) | (0.04 | ) | (0.20 | ) | 6.09 | (16.73 | ) | 24 | 0.10 | (g) | 10.26 | (g) | 3.19 | (g) | 29 | |||||||||||||||||||||||||||||||||
Class R5 | ||||||||||||||||||||||||||||||||||||||||||||||||||||||||
Year ended 12/31/12 | 8.25 | 0.26 | 0.62 | 0.88 | (0.35 | ) | — | (0.35 | ) | 8.78 | 10.69 | 6,079 | 0.00 | (e) | 0.65 | (e) | 2.94 | (e) | 4 | |||||||||||||||||||||||||||||||||||||
Year ended 12/31/11 | 7.81 | 0.25 | 0.57 | 0.82 | (0.38 | ) | — | (0.38 | ) | 8.25 | 10.52 | 13 | 0.00 | 1.02 | 3.13 | 14 | ||||||||||||||||||||||||||||||||||||||||
Year ended 12/31/10 | 7.38 | 0.55 | 0.42 | 0.97 | (0.27 | ) | (0.27 | ) | (0.54 | ) | 7.81 | 13.25 | 12 | 0.00 | 1.38 | 7.04 | 26 | |||||||||||||||||||||||||||||||||||||||
Year ended 12/31/09 | 6.09 | 0.53 | 1.18 | 1.71 | (0.42 | ) | — | (0.42 | ) | 7.38 | 28.13 | 11 | 0.08 | 3.49 | 7.94 | 214 | ||||||||||||||||||||||||||||||||||||||||
Year ended 12/31/08 | 9.84 | 0.28 | (3.82 | ) | (3.54 | ) | (0.17 | ) | (0.04 | ) | (0.21 | ) | 6.09 | (35.94 | ) | 9 | 0.15 | 7.72 | 3.14 | 29 | ||||||||||||||||||||||||||||||||||||
Class R6 | ||||||||||||||||||||||||||||||||||||||||||||||||||||||||
Year ended 12/31/12(f) | 9.09 | 0.07 | (0.03 | ) | 0.04 | (0.35 | ) | — | (0.35 | ) | 8.78 | 0.46 | 10 | 0.00 | e)(g) | 0.53 | (e)(g) | 2.94 | (e)(g) | 4 | ||||||||||||||||||||||||||||||||||||
| (a) | Calculated using average shares outstanding. |
| (b) | Includes adjustments in accordance with accounting principles generally accepted in the United States of America and as such, the net asset value for financial reporting purposes and the returns based upon those net asset values may differ from the net asset value and returns for shareholder transactions. Does not include sales charges and is not annualized for periods less than one year, if applicable. |
| (c) | In addition to the fees and expenses which the Fund bears directly; the Fund indirectly bears a pro rata share of the fees and expenses of the underlying funds in which the Fund invests. Because the underlying funds have varied expenses and fee levels and the Fund may own different proportions at different times, the amount of fees and expenses incurred indirectly by the Fund will vary. Estimated underlying fund expenses are not expenses that are incurred directly by your Fund. They are expenses that are incurred directly by the underlying funds and are deducted from the value of the funds your Fund invests in. The effect of the estimated underlying fund expenses that you bear indirectly is included in your Fund’s total return. Estimated acquired fund fees from underlying funds were 0.98%, 0.87%, 0.79%, 0.81% and 0.78% for the years ended December 31, 2012, December 31, 2011, December 31, 2010, December 31, 2009 and December 31, 2008, respectively. |
| (d) | Portfolio turnover is calculated at the fund level and is not annualized for periods less than one year, if applicable. |
| (e) | Ratios are based on average daily net assets (000’s) of $20,695, $4,069, $1,302, $5,023, $581, $6,403, $700, $933, $5,495 and $3 for Class A, Class AX, Class B, Class C, Class CX, Class R Class RX, Class Y, Class R5 and Class R6 shares, respectively. |
| (f) | Commencement date October 3, 2008 for Class Y shares; June 1, 2010 for Class AX, CX and RX shares and September 24, 2012 for Class R6 shares, respectively. |
| (g) | Annualized. |
51 Invesco Balanced-Risk Retirement Funds
NOTE 11—Financial Highlights—(continued)
Invesco Balanced-Risk Retirement 2050 Fund
| Net asset value, beginning of period | Net investment income(a) | Net gains (losses) on securities (both realized and unrealized) | Total from investment operations | Dividends from net investment income | Distributions from net realized gains | Total distributions | Net asset value, end of period | Total return(b) | Net assets, end of period (000s omitted) | Ratio of expenses to average net assets with fee waivers and/or expense reimbursements(c) | Ratio of expenses to average net assets without fee waivers and/or expense reimbursements | Ratio of net investment income to average net assets | Portfolio turnover(d) | |||||||||||||||||||||||||||||||||||||||||||
Class A |
| |||||||||||||||||||||||||||||||||||||||||||||||||||||||
Year ended 12/31/12 | $ | 8.20 | $ | 0.23 | $ | 0.63 | $ | 0.86 | $ | (0.35 | ) | $ | (0.03 | ) | $ | (0.38 | ) | $ | 8.68 | 10.47 | % | $ | 12,933 | 0.25 | %(e) | 1.57 | %(e) | 2.62 | %(e) | 4 | % | |||||||||||||||||||||||||
Year ended 12/31/11 | 7.62 | 0.27 | 0.50 | 0.77 | (0.19 | ) | — | (0.19 | ) | 8.20 | 10.16 | 7,586 | 0.25 | 3.01 | 3.34 | 22 | ||||||||||||||||||||||||||||||||||||||||
Year ended 12/31/10 | 7.13 | 0.48 | 0.44 | 0.92 | (0.43 | ) | — | (0.43 | ) | 7.62 | 13.08 | 3,693 | 0.25 | 3.63 | 6.42 | 27 | ||||||||||||||||||||||||||||||||||||||||
Year ended 12/31/09 | 5.87 | 0.45 | 1.19 | 1.64 | (0.38 | ) | — | (0.38 | ) | 7.13 | 27.92 | 2,533 | 0.32 | 7.20 | 6.87 | 214 | ||||||||||||||||||||||||||||||||||||||||
Year ended 12/31/08 | 9.78 | 0.17 | (3.84 | ) | (3.67 | ) | (0.17 | ) | (0.07 | ) | (0.24 | ) | 5.87 | (37.51 | ) | 1,248 | 0.42 | 11.10 | 2.10 | 27 | ||||||||||||||||||||||||||||||||||||
Class AX | ||||||||||||||||||||||||||||||||||||||||||||||||||||||||
Year ended 12/31/12 | 8.20 | 0.23 | 0.64 | 0.87 | (0.35 | ) | (0.03 | ) | (0.38 | ) | 8.69 | 10.59 | 1,258 | 0.25 | (e) | 1.57 | (e) | 2.62 | (e) | 4 | ||||||||||||||||||||||||||||||||||||
Year ended 12/31/11 | 7.62 | 0.27 | 0.50 | 0.77 | (0.19 | ) | — | (0.19 | ) | 8.20 | 10.16 | 1,430 | 0.25 | 3.01 | 3.34 | 22 | ||||||||||||||||||||||||||||||||||||||||
Year ended 12/31/10(f) | 7.27 | 0.29 | 0.49 | 0.78 | (0.43 | ) | — | (0.43 | ) | 7.62 | 10.91 | 1,793 | 0.25 | (g) | 2.97 | (g) | 6.42 | (g) | 27 | |||||||||||||||||||||||||||||||||||||
Class B | ||||||||||||||||||||||||||||||||||||||||||||||||||||||||
Year ended 12/31/12 | 8.11 | 0.16 | 0.63 | 0.79 | (0.30 | ) | (0.03 | ) | (0.33 | ) | 8.57 | 9.68 | 473 | 1.00 | (e) | 2.32 | (e) | 1.86 | (e) | 4 | ||||||||||||||||||||||||||||||||||||
Year ended 12/31/11 | 7.55 | 0.20 | 0.51 | 0.71 | (0.15 | ) | — | (0.15 | ) | 8.11 | 9.39 | 478 | 1.00 | 3.76 | 2.59 | 22 | ||||||||||||||||||||||||||||||||||||||||
Year ended 12/31/10 | 7.08 | 0.42 | 0.43 | 0.85 | (0.38 | ) | — | (0.38 | ) | 7.55 | 12.13 | 489 | 1.00 | 4.38 | 5.67 | 27 | ||||||||||||||||||||||||||||||||||||||||
Year ended 12/31/09 | 5.84 | 0.40 | 1.18 | 1.58 | (0.34 | ) | — | (0.34 | ) | 7.08 | 27.02 | 432 | 1.07 | 7.95 | 6.12 | 214 | ||||||||||||||||||||||||||||||||||||||||
Year ended 12/31/08 | 9.75 | 0.11 | (3.82 | ) | (3.71 | ) | (0.13 | ) | (0.07 | ) | (0.20 | ) | 5.84 | (38.03 | ) | 214 | 1.17 | 11.85 | 1.35 | 27 | ||||||||||||||||||||||||||||||||||||
Class C | ||||||||||||||||||||||||||||||||||||||||||||||||||||||||
Year ended 12/31/12 | 8.13 | 0.16 | 0.63 | 0.79 | (0.30 | ) | (0.03 | ) | (0.33 | ) | 8.59 | 9.66 | 3,975 | 1.00 | (e) | 2.32 | (e) | 1.87 | (e) | 4 | ||||||||||||||||||||||||||||||||||||
Year ended 12/31/11 | 7.57 | 0.20 | 0.51 | 0.71 | (0.15 | ) | — | (0.15 | ) | 8.13 | 9.36 | 1,872 | 1.00 | 3.76 | 2.59 | 22 | ||||||||||||||||||||||||||||||||||||||||
Year ended 12/31/10 | 7.09 | 0.42 | 0.44 | 0.86 | (0.38 | ) | — | (0.38 | ) | 7.57 | 12.26 | 709 | 1.00 | 4.38 | 5.67 | 27 | ||||||||||||||||||||||||||||||||||||||||
Year ended 12/31/09 | 5.85 | 0.40 | 1.18 | 1.58 | (0.34 | ) | — | (0.34 | ) | 7.09 | 26.97 | 487 | 1.07 | 7.95 | 6.12 | 214 | ||||||||||||||||||||||||||||||||||||||||
Year ended 12/31/08 | 9.76 | 0.10 | (3.81 | ) | (3.71 | ) | (0.13 | ) | (0.07 | ) | (0.20 | ) | 5.85 | (37.99 | ) | 253 | 1.17 | 11.85 | 1.35 | 27 | ||||||||||||||||||||||||||||||||||||
Class CX | ||||||||||||||||||||||||||||||||||||||||||||||||||||||||
Year ended 12/31/12 | 8.12 | 0.16 | 0.63 | 0.79 | (0.30 | ) | (0.03 | ) | (0.33 | ) | �� | 8.58 | 9.67 | 128 | 1.00 | (e) | 2.32 | (e) | 1.87 | (e) | 4 | |||||||||||||||||||||||||||||||||||
Year ended 12/31/11 | 7.56 | 0.20 | 0.51 | 0.71 | (0.15 | ) | — | (0.15 | ) | 8.12 | 9.37 | 99 | 1.00 | 3.76 | 2.59 | 22 | ||||||||||||||||||||||||||||||||||||||||
Year ended 12/31/10(f) | 7.20 | 0.25 | 0.49 | 0.74 | (0.38 | ) | — | (0.38 | ) | 7.56 | 10.40 | 335 | 1.00 | (g) | 3.72 | (g) | 5.67 | (g) | 27 | |||||||||||||||||||||||||||||||||||||
Class R | ||||||||||||||||||||||||||||||||||||||||||||||||||||||||
Year ended 12/31/12 | 8.17 | 0.21 | 0.62 | 0.83 | (0.33 | ) | (0.03 | ) | (0.36 | ) | 8.64 | 10.17 | 3,846 | 0.50 | (e) | 1.82 | (e) | 2.37 | (e) | 4 | ||||||||||||||||||||||||||||||||||||
Year ended 12/31/11 | 7.59 | 0.24 | 0.51 | 0.75 | (0.17 | ) | — | (0.17 | ) | 8.17 | 9.98 | 1,930 | 0.50 | 3.26 | 3.09 | 22 | ||||||||||||||||||||||||||||||||||||||||
Year ended 12/31/10 | 7.11 | 0.46 | 0.43 | 0.89 | (0.41 | ) | — | (0.41 | ) | 7.59 | 12.74 | 1,708 | 0.50 | 3.88 | 6.17 | 27 | ||||||||||||||||||||||||||||||||||||||||
Year ended 12/31/09 | 5.85 | 0.44 | 1.18 | 1.62 | (0.36 | ) | — | (0.36 | ) | 7.11 | 27.80 | 969 | 0.57 | 7.45 | 6.62 | 214 | ||||||||||||||||||||||||||||||||||||||||
Year ended 12/31/08 | 9.77 | 0.14 | (3.84 | ) | (3.70 | ) | (0.15 | ) | (0.07 | ) | (0.22 | ) | 5.85 | (37.78 | ) | 275 | 0.67 | 11.35 | 1.85 | 27 | ||||||||||||||||||||||||||||||||||||
Class RX | ||||||||||||||||||||||||||||||||||||||||||||||||||||||||
Year ended 12/31/12 | 8.17 | 0.21 | 0.63 | 0.84 | (0.33 | ) | (0.03 | ) | (0.36 | ) | 8.65 | 10.30 | 205 | 0.50 | (e) | 1.82 | (e) | 2.37 | (e) | 4 | ||||||||||||||||||||||||||||||||||||
Year ended 12/31/11 | 7.60 | 0.24 | 0.50 | 0.74 | (0.17 | ) | — | (0.17 | ) | 8.17 | 9.84 | 146 | 0.50 | 3.26 | 3.09 | 22 | ||||||||||||||||||||||||||||||||||||||||
Year ended 12/31/10(f) | 7.24 | 0.27 | 0.51 | 0.78 | (0.42 | ) | — | (0.42 | ) | 7.60 | 10.85 | 135 | 0.50 | (g) | 3.22 | (g) | 6.17 | (g) | 27 | |||||||||||||||||||||||||||||||||||||
Class Y | ||||||||||||||||||||||||||||||||||||||||||||||||||||||||
Year ended 12/31/12 | 8.21 | 0.25 | 0.63 | 0.88 | (0.37 | ) | (0.03 | ) | (0.40 | ) | 8.69 | 10.68 | 1,336 | 0.00 | (e) | 1.32 | (e) | 2.87 | (e) | 4 | ||||||||||||||||||||||||||||||||||||
Year ended 12/31/11 | 7.63 | 0.29 | 0.50 | 0.79 | (0.21 | ) | — | (0.21 | ) | 8.21 | 10.36 | 482 | 0.00 | 2.76 | 3.59 | 22 | ||||||||||||||||||||||||||||||||||||||||
Year ended 12/31/10 | 7.14 | 0.51 | 0.43 | 0.94 | (0.45 | ) | — | (0.45 | ) | 7.63 | 13.33 | 196 | 0.00 | 3.38 | 6.67 | 27 | ||||||||||||||||||||||||||||||||||||||||
Year ended 12/31/09 | 5.87 | 0.47 | 1.19 | 1.66 | (0.39 | ) | — | (0.39 | ) | 7.14 | 28.32 | 51 | 0.07 | 6.95 | 7.12 | 214 | ||||||||||||||||||||||||||||||||||||||||
Year ended 12/31/08(f) | 7.42 | 0.04 | (1.35 | ) | (1.31 | ) | (0.17 | ) | (0.07 | ) | (0.24 | ) | 5.87 | (17.57 | ) | 42 | 0.09 | (g) | 19.27 | (g) | 2.43 | (g) | 27 | |||||||||||||||||||||||||||||||||
Class R5 | ||||||||||||||||||||||||||||||||||||||||||||||||||||||||
Year ended 12/31/12 | 8.21 | 0.25 | 0.64 | 0.89 | (0.37 | ) | (0.03 | ) | (0.40 | ) | 8.70 | 10.80 | 5,747 | 0.00 | (e) | 1.08 | (e) | 2.87 | (e) | 4 | ||||||||||||||||||||||||||||||||||||
Year ended 12/31/11 | 7.62 | 0.29 | 0.51 | 0.80 | (0.21 | ) | — | (0.21 | ) | 8.21 | 10.50 | 11 | 0.00 | 2.36 | 3.59 | 22 | ||||||||||||||||||||||||||||||||||||||||
Year ended 12/31/10 | 7.14 | 0.50 | 0.43 | 0.93 | (0.45 | ) | — | (0.45 | ) | 7.62 | 13.18 | 10 | 0.00 | 3.03 | 6.67 | 27 | ||||||||||||||||||||||||||||||||||||||||
Year ended 12/31/09 | 5.87 | 0.44 | 1.22 | 1.66 | (0.39 | ) | — | (0.39 | ) | 7.14 | 28.32 | 21 | 0.06 | 6.36 | 7.13 | 214 | ||||||||||||||||||||||||||||||||||||||||
Year ended 12/31/08 | 9.79 | 0.19 | (3.86 | ) | (3.67 | ) | (0.18 | ) | (0.07 | ) | (0.25 | ) | 5.87 | (37.42 | ) | 32 | 0.15 | 10.22 | 2.37 | 27 | ||||||||||||||||||||||||||||||||||||
Class R6 | ||||||||||||||||||||||||||||||||||||||||||||||||||||||||
Year ended 12/31/12(f) | 9.06 | 0.07 | (0.02 | ) | 0.05 | (0.37 | ) | (0.03 | ) | (0.40 | ) | 8.71 | 0.52 | 10 | 0.00 | e)(g) | 0.99 | (e)(g) | 2.87 | (e)(g) | 4 | |||||||||||||||||||||||||||||||||||
| (a) | Calculated using average shares outstanding. |
| (b) | Includes adjustments in accordance with accounting principles generally accepted in the United States of America and as such, the net asset value for financial reporting purposes and the returns based upon those net asset values may differ from the net asset value and returns for shareholder transactions. Does not include sales charges and is not annualized for periods less than one year, if applicable. |
| (c) | In addition to the fees and expenses which the Fund bears directly; the Fund indirectly bears a pro rata share of the fees and expenses of the underlying funds in which the Fund invests. Because the underlying funds have varied expenses and fee levels and the Fund may own different proportions at different times, the amount of fees and expenses incurred indirectly by the Fund will vary. Estimated underlying fund expenses are not expenses that are incurred directly by your Fund. They are expenses that are incurred directly by the underlying funds and are deducted from the value of the funds your Fund invests in. The effect of the estimated underlying fund expenses that you bear indirectly is included in your Fund’s total return. Estimated acquired fund fees from underlying funds were 1.11%, 0.87%, 0.79%, 0.82% and 0.78% for the years ended December 31, 2012, December 31, 2011, December 31, 2010, December 31, 2009 and December 31, 2008, respectively. |
| (d) | Portfolio turnover is calculated at the fund level and is not annualized for periods less than one year, if applicable. |
| (e) | Ratios are based on average daily net assets (000’s) of $11,109, $1,463, $488, $3,080, $114, $2,811, $181, $652, $4,915 and $3 for Class A, Class AX, Class B, Class C, Class CX, Class R Class RX, Class Y, Class R5 and Class R6 shares, respectively. |
| (f) | Commencement date October 3, 2008 for Class Y shares; June 1, 2010 for Class AX, CX and RX shares and September 24, 2012 for Class R6 shares, respectively. |
| (g) | Annualized. |
52 Invesco Balanced-Risk Retirement Funds
Report of Independent Registered Public Accounting Firm
To the Board of Trustees of AIM Growth Series (Invesco Growth Series)
and Shareholders of Invesco Balanced-Risk Retirement Now Fund,
Invesco Balanced-Risk Retirement 2020 Fund,
Invesco Balanced-Risk Retirement 2030 Fund,
Invesco Balanced-Risk Retirement 2040 Fund
and Invesco Balanced-Risk Retirement 2050 Fund:
In our opinion, the accompanying statements of assets and liabilities, including the schedules of investments, and the related statements of operations and of changes in net assets and the financial highlights present fairly, in all material respects, the financial position of Invesco Balanced-Risk Retirement Now Fund, Invesco Balanced-Risk Retirement 2020 Fund, Invesco Balanced-Risk Retirement 2030 Fund, Invesco Balanced-Risk Retirement 2040 Fund and Invesco Balanced-Risk Retirement 2050 Fund (five of the funds constituting AIM Growth Series (Invesco Growth Series), hereafter referred to as the “Funds”) at December 31, 2012, the results of each of their operations for the year then ended, the changes in each of their net assets for each of the two years in the period then ended and each of their financial highlights for each of the five years in the period then ended, in conformity with accounting principles generally accepted in the United States of America. These financial statements and financial highlights (hereafter referred to as “financial statements”) are the responsibility of the Funds’ management; our responsibility is to express an opinion on these financial statements based on our audits. We conducted our audits of these financial statements in accordance with the standards of the Public Company Accounting Oversight Board (United States). Those standards require that we plan and perform the audit to obtain reasonable assurance about whether the financial statements are free of material misstatement. An audit includes examining, on a test basis, evidence supporting the amounts and disclosures in the financial statements, assessing the accounting principles used and significant estimates made by management, and evaluating the overall financial statement presentation. We believe that our audits, which included confirmation of securities at December 31, 2012 by correspondence with the custodian and transfer agent, provide a reasonable basis for our opinion.
PRICEWATERHOUSECOOPERS LLP
February 25, 2013
Houston, Texas
53 Invesco Balanced-Risk Retirement Funds
Calculating your ongoing Fund expenses
Example
As a shareholder of the Fund, you incur two types of costs: (1) transaction costs, which may include sales charges (loads) on purchase payments or contingent deferred sales charges on redemptions, and redemption fees, if any; and (2) ongoing costs, including distribution and/or service (12b-1) fees, and other Fund expenses. This example is intended to help you understand your ongoing costs (in dollars) of investing in the Fund and to compare these costs with ongoing costs of investing in other mutual funds. With the exception of the actual ending account value and expenses of the Class R6 Shares, the example is based on an investment of $1,000 invested at the beginning of the period and held for the entire period July 1, 2012, through December 31, 2012. The actual ending account value and expenses of the Class R6 shares in the example below are based on an investment of $1,000 invested as of close of business September 24, 2012 (commencement date) and held through December 31, 2012.
In addition to the fees and expenses which the Fund bears directly, the Fund indirectly bears a pro rata share of the fees and expenses of the underlying funds in which your Fund invests. The amount of fees and expenses incurred indirectly by your Fund will vary because the underlying funds have varied expenses and fee levels and the Fund may own different proportions of the underlying funds at different times. Estimated underlying fund expenses are not expenses that are incurred directly by your Fund. They are expenses that are incurred directly by the underlying funds and are deducted from the value of the underlying funds your Fund invests in. The effect of the estimated underlying fund expenses that you bear indirectly are included in your Fund’s total return.
Actual expenses
The table below provides information about actual account values and actual expenses. You may use the information in this table, together with the amount you invested, to estimate the expenses that you paid over the period. Simply divide your account value by $1,000 (for example, an $8,600 account value divided by $1,000 = 8.6), then multiply the result by the number in the table under the heading entitled “Actual Expenses Paid During Period” to estimate the expenses you paid on your account during this period (as of close of business September 24, 2012 through December 31, 2012 for the Class R6 shares). Because the actual ending account value and expense information in the example is not based upon a six month period for the Class S shares, the ending account value and expense information may not provide a meaningful comparison to mutual funds that provide such information for a full six month period.
Hypothetical example for comparison purposes
The table below also provides information about hypothetical account values and hypothetical expenses based on the Fund’s actual expense ratio and an assumed rate of return of 5% per year before expenses, which is not the Fund’s actual return.
The hypothetical account values and expenses may not be used to estimate the actual ending account balance or expenses you paid for the period. You may use this information to compare the ongoing costs of investing in the Fund and other funds. To do so, compare this 5% hypothetical example with the 5% hypothetical examples that appear in the shareholder reports of the other funds.
Please note that the expenses shown in the table are meant to highlight your ongoing costs only and do not reflect any transaction costs, such as sales charges (loads) on purchase payments, contingent deferred sales charges on redemptions, and redemption fees, if any. Therefore, the hypothetical information is useful in comparing ongoing costs only, and will not help you determine the relative total costs of owning different funds. In addition, expenses shown in the table do not include the expenses of the underlying funds, which are borne indirectly by the Fund. If transaction costs and indirect expenses were included, your costs would have been higher.
Invesco Balanced-Risk Retirement Now Fund
| Class | Beginning Account Value (07/01/12) | ACTUAL | HYPOTHETICAL (5% annual return before expenses) | Annualized Expense Ratio | ||||||||||||||||||||
| Ending Account Value (12/31/12)1 | Expenses Paid During Period2 | Ending Account Value (12/31/12) | Expenses Paid During Period3 | |||||||||||||||||||||
A | $ | 1,000.00 | $ | 1,033.30 | $ | 1.28 | $ | 1,023.88 | $ | 1.27 | 0.25 | % | ||||||||||||
AX | 1,000.00 | 1,033.30 | 1.28 | 1,023.88 | 1.27 | 0.25 | ||||||||||||||||||
B | 1,000.00 | 1,030.30 | 5.10 | 1,020.11 | 5.08 | 1.00 | ||||||||||||||||||
C | 1,000.00 | 1,029.10 | 5.10 | 1,020.11 | 5.08 | 1.00 | ||||||||||||||||||
CX | 1,000.00 | 1,030.30 | 5.10 | 1,020.11 | 5.08 | 1.00 | ||||||||||||||||||
R | 1,000.00 | 1,031.50 | 2.55 | 1,022.62 | 2.54 | 0.50 | ||||||||||||||||||
RX | 1,000.00 | 1,032.60 | 2.55 | 1,022.62 | 2.54 | 0.50 | ||||||||||||||||||
Y | 1,000.00 | 1,035.00 | 0.00 | 1,025.14 | 0.00 | 0.00 | ||||||||||||||||||
R5 | 1,000.00 | 1,035.00 | 0.00 | 1,025.14 | 0.00 | 0.00 | ||||||||||||||||||
R6 | 1,000.00 | 1,003.00 | 0.00 | 1,025.14 | 0.00 | 0.00 | ||||||||||||||||||
54 Invesco Balanced-Risk Retirement Funds
Invesco Balanced-Risk Retirement 2020 Fund
| Class | Beginning Account Value (07/01/12) | ACTUAL | HYPOTHETICAL (5% annual return before expenses) | Annualized Expense Ratio | ||||||||||||||||||||
| Ending Account Value (12/31/12)1 | Expenses Paid During Period2 | Ending Account Value (12/31/12) | Expenses Paid During Period3 | |||||||||||||||||||||
A | $ | 1,000.00 | $ | 1,052.40 | $ | 1.29 | $ | 1,023.88 | $ | 1.27 | 0.25 | % | ||||||||||||
AX | 1,000.00 | 1,052.40 | 1.29 | 1,023.88 | 1.27 | 0.25 | ||||||||||||||||||
B | 1,000.00 | 1,048.60 | 5.15 | 1,020.11 | 5.08 | 1.00 | ||||||||||||||||||
C | 1,000.00 | 1,047.50 | 5.15 | 1,020.11 | 5.08 | 1.00 | ||||||||||||||||||
CX | 1,000.00 | 1,047.50 | 5.15 | 1,020.11 | 5.08 | 1.00 | ||||||||||||||||||
R | 1,000.00 | 1,050.40 | 2.58 | 1,022.62 | 2.54 | 0.50 | ||||||||||||||||||
RX | 1,000.00 | 1,050.40 | 2.58 | 1,022.62 | 2.54 | 0.50 | ||||||||||||||||||
Y | 1,000.00 | 1,053.50 | 0.00 | 1,025.14 | 0.00 | 0.00 | ||||||||||||||||||
R5 | 1,000.00 | 1,053.30 | 0.00 | 1,025.14 | 0.00 | 0.00 | ||||||||||||||||||
R6 | 1,000.00 | 1,005.70 | 0.00 | 1,025.14 | 0.00 | 0.00 | ||||||||||||||||||
Invesco Balanced-Risk Retirement 2030 Fund
| Class | Beginning Account Value (07/01/12) | ACTUAL | HYPOTHETICAL (5% annual return before expenses) | Annualized Expense Ratio | ||||||||||||||||||||
| Ending Account Value (12/31/12)1 | Expenses Paid During Period2 | Ending Account Value (12/31/12) | Expenses Paid During Period3 | |||||||||||||||||||||
A | $ | 1,000.00 | $ | 1,057.00 | $ | 1.29 | $ | 1,023.88 | $ | 1.27 | 0.25 | % | ||||||||||||
AX | 1,000.00 | 1,055.80 | 1.29 | 1,023.88 | 1.27 | 0.25 | ||||||||||||||||||
B | 1,000.00 | 1,052.00 | 5.16 | 1,020.11 | 5.08 | 1.00 | ||||||||||||||||||
C | 1,000.00 | 1,052.00 | 5.16 | 1,020.11 | 5.08 | 1.00 | ||||||||||||||||||
CX | 1,000.00 | 1,052.00 | 5.16 | 1,020.11 | 5.08 | 1.00 | ||||||||||||||||||
R | 1,000.00 | 1,055.10 | 2.58 | 1,022.62 | 2.54 | 0.50 | ||||||||||||||||||
RX | 1,000.00 | 1,055.20 | 2.58 | 1,022.62 | 2.54 | 0.50 | ||||||||||||||||||
Y | 1,000.00 | 1,058.00 | 0.00 | 1,025.14 | 0.00 | 0.00 | ||||||||||||||||||
R5 | 1,000.00 | 1,057.80 | 0.00 | 1,025.14 | 0.00 | 0.00 | ||||||||||||||||||
R6 | 1,000.00 | 1,005.20 | 0.00 | 1,025.14 | 0.00 | 0.00 | ||||||||||||||||||
Invesco Balanced-Risk Retirement 2040 Fund
| Class | Beginning Account Value (07/01/12) | ACTUAL | HYPOTHETICAL (5% annual return before expenses) | Annualized Expense Ratio | ||||||||||||||||||||
| Ending Account Value (12/31/12)1 | Expenses Paid During Period2 | Ending Account Value (12/31/12) | Expenses Paid During Period3 | |||||||||||||||||||||
A | $ | 1,000.00 | $ | 1,055.00 | $ | 1.29 | $ | 1,023.88 | $ | 1.27 | 0.25 | % | ||||||||||||
AX | 1,000.00 | 1,056.30 | 1.29 | 1,023.88 | 1.27 | 0.25 | ||||||||||||||||||
B | 1,000.00 | 1,052.70 | 5.16 | 1,020.11 | 5.08 | 1.00 | ||||||||||||||||||
C | 1,000.00 | 1,052.80 | 5.16 | 1,020.11 | 5.08 | 1.00 | ||||||||||||||||||
CX | 1,000.00 | 1,052.90 | 5.16 | 1,020.11 | 5.08 | 1.00 | ||||||||||||||||||
R | 1,000.00 | 1,055.60 | 2.58 | 1,022.62 | 2.54 | 0.50 | ||||||||||||||||||
RX | 1,000.00 | 1,054.40 | 2.58 | 1,022.62 | 2.54 | 0.50 | ||||||||||||||||||
Y | 1,000.00 | 1,058.20 | 0.00 | 1,025.14 | 0.00 | 0.00 | ||||||||||||||||||
R5 | 1,000.00 | 1,056.90 | 0.00 | 1,025.14 | 0.00 | 0.00 | ||||||||||||||||||
R6 | 1,000.00 | 1,004.60 | 0.00 | 1,025.14 | 0.00 | 0.00 | ||||||||||||||||||
55 Invesco Balanced-Risk Retirement Funds
Invesco Balanced-Risk Retirement 2050 Fund
| Class | Beginning Account Value (07/01/12) | Actual | HYPOTHETICAL (5% annual return before expenses) | Annualized Expense Ratio | ||||||||||||||||||||
| Ending Account Value (12/31/12) 1 | Expenses Paid During Period 2 | Ending Account Value (12/31/12) | Expenses Paid During Period 3 | |||||||||||||||||||||
A | $ | 1,000.00 | $ | 1,055.80 | $ | 1.29 | $ | 1,023.88 | $ | 1.27 | 0.25 | % | ||||||||||||
AX | 1,000.00 | 1,056.90 | 1.29 | 1,023.88 | 1.27 | 0.25 | ||||||||||||||||||
B | 1,000.00 | 1,051.40 | 5.16 | 1,020.11 | 5.08 | 1.00 | ||||||||||||||||||
C | 1,000.00 | 1,052.50 | 5.16 | 1,020.11 | 5.08 | 1.00 | ||||||||||||||||||
CX | 1,000.00 | 1,051.40 | 5.16 | 1,020.11 | 5.08 | 1.00 | ||||||||||||||||||
R | 1,000.00 | 1,055.20 | 2.58 | 1,022.62 | 2.54 | 0.50 | ||||||||||||||||||
RX | 1,000.00 | 1,055.20 | 2.58 | 1,022.62 | 2.54 | 0.50 | ||||||||||||||||||
Y | 1,000.00 | 1,056.60 | 0.00 | 1,025.14 | 0.00 | 0.00 | ||||||||||||||||||
R5 | 1,000.00 | 1,056.60 | 0.00 | 1,025.14 | 0.00 | 0.00 | ||||||||||||||||||
R6 | 1,000.00 | 1,005.20 | 0.00 | 1,025.14 | 0.00 | 0.00 | ||||||||||||||||||
| 1 | The actual ending account value is based on the actual total return of the Funds for the period July 1, 2012, through December 31, 2012 (as of close of business September 24, 2012, through December 31, 2012 for the Class R6 shares), after actual expenses and will differ from the hypothetical ending account value which is based on the Fund’s expense ratio and a hypothetical annual return of 5% before expenses. |
| 2 | Expenses are equal to each Fund’s annualized expense ratio as indicated above multiplied by the average account value over the period, multiplied by 184/366 to reflect the most recent fiscal half year. For the Class R6 shares actual expenses are equal to the annualized expense ratio indicated above multiplied by the average account value over the period, multiplied by 99 (as of close of business September 24, 2012, through December 31, 2012)/366. Because the Class R6 shares have not been in existence for a full six month period, the actual ending account value and expense information shown may not provide a meaningful comparison to fund expense information of classes that show such data for a full six month period and, because the actual ending account value and expense information in the expense example covers a short time period, return and expense data may not be indicative of return and expense data for longer time periods. |
| 3 | Hypothetical expenses are equal to the annualized expense ratio indicated above multiplied by the average account value over the period, multiplied by 184/366 to reflect a one-half year period. The hypothetical ending account value and expenses may be used to compare ongoing costs of investing in Class R6 shares of each Fund and other funds because such data is based on a full six month period. |
56 Invesco Balanced-Risk Retirement Funds
Tax Information
Form 1099-DIV, Form 1042-S and other year–end tax information provide shareholders with actual calendar year amounts that should be included in their tax returns. Shareholders should consult their tax advisors.
The following distribution information is being provided as required by the Internal Revenue Code or to meet a specific state’s requirement.
The Funds designate the following amounts or, if subsequently determined to be different, the maximum amount allowable for its fiscal year ended December 31, 2012:
Federal and State Income Tax
| Long Term Capital Gain Distributions | Qualified Dividend Income* | Corporate Dividends Received Deduction* | U.S. Treasury Obligations* | |||||||||||||
Invesco Balanced-Risk Retirement Now Fund | $ | 589,119 | 0.00 | % | 0.00 | % | 0.35 | % | ||||||||
Invesco Balanced-Risk Retirement 2020 Fund | 1,014,325 | 0.00 | 0.00 | 0.34 | ||||||||||||
Invesco Balanced-Risk Retirement 2030 Fund | 537,739 | 0.00 | 0.00 | 0.34 | ||||||||||||
Invesco Balanced-Risk Retirement 2040 Fund | — | 0.00 | 0.00 | 0.34 | ||||||||||||
Invesco Balanced-Risk Retirement 2050 Fund | 82,682 | 0.00 | 0.00 | 0.34 | ||||||||||||
| * | The above percentages are based on ordinary income dividends paid to shareholders during the Fund’s fiscal year. |
57 Invesco Balanced-Risk Retirement Funds
Trustees and Officers
The address of each trustee and officer is AIM Growth Series (Invesco Growth Series) (the “Trust”), 11 Greenway Plaza, Suite 1000, Houston, Texas 77046-1173. The trustees serve for the life of the Trust, subject to their earlier death, incapacitation, resignation, retirement or removal as more specifically provided in the Trust’s organizational documents. Each officer serves for a one year term or until their successors are elected and qualified. Column two below includes length of time served with predecessor entities, if any.
| Name, Year of Birth and Position(s) Held with the Trust | Trustee and/ or Officer Since | Principal Occupation(s) During Past 5 Years | Number of Funds in Fund Complex Overseen by Trustee | Other Directorship(s) Held by Trustee During Past 5 Years | ||||
| Interested Persons | ||||||||
| Martin L. Flanagan1 — 1960 Trustee | 2007 | Executive Director, Chief Executive Officer and President, Invesco Ltd. (ultimate parent of Invesco and a global investment management firm); Advisor to the Board, Invesco Advisers, Inc. (formerly known as Invesco Institutional (N.A.), Inc.); Trustee, The Invesco Funds; Vice Chair, Investment Company Institute; and Member of Executive Board, SMU Cox School of Business
Formerly: Chairman and Chief Executive Officer, Invesco Advisers, Inc. (registered investment adviser); Director, Chairman, Chief Executive Officer and President, IVZ Inc. (holding company), INVESCO Group Services, Inc. (service provider) and Invesco North American Holdings, Inc. (holding company); Director, Chief Executive Officer and President, Invesco Holding Company Limited (parent of Invesco and a global investment management firm); Director, Invesco Ltd.; Chairman, Investment Company Institute and President, Co-Chief Executive Officer, Co-President, Chief Operating Officer and Chief Financial Officer, Franklin Resources, Inc. (global investment management organization) | 124 | None | ||||
Philip A. Taylor2 — 1954 Trustee, President and Principal Executive Officer | 2006 | Head of North American Retail and Senior Managing Director, Invesco Ltd.; Director, Co-Chairman, Co-President and Co-Chief Executive Officer, Invesco Advisers, Inc. (formerly known as Invesco Institutional (N.A.), Inc.) (registered investment adviser); Director, Chairman, Chief Executive Officer and President, Invesco Management Group, Inc. (formerly known as Invesco Aim Management Group, Inc.) (financial services holding company); Director and President, INVESCO Funds Group, Inc. (registered investment adviser and registered transfer agent); Director and Chairman, Invesco Investment Services, Inc. (formerly known as Invesco Aim Investment Services, Inc.) (registered transfer agent) and IVZ Distributors, Inc. (formerly known as INVESCO Distributors, Inc.) (registered broker dealer); Director, President and Chairman, Invesco Inc. (holding company) and Invesco Canada Holdings Inc. (holding company); Chief Executive Officer, Invesco Corporate Class Inc. (corporate mutual fund company) and Invesco Canada Fund Inc. (corporate mutual fund company); Director, Chairman and Chief Executive Officer, Invesco Canada Ltd. (formerly known as Invesco Trimark Ltd./Invesco Trimark Ltèe) (registered investment adviser and registered transfer agent); Trustee, President and Principal Executive Officer, The Invesco Funds (other than AIM Treasurer’s Series Trust (Invesco Treasurer’s Series Trust) and Short-Term Investments Trust); Trustee and Executive Vice President, The Invesco Funds (AIM Treasurer’s Series Trust (Invesco Treasurer’s Series Trust) and Short-Term Investments Trust only); Director, Invesco Investment Advisers LLC (formerly known as Van Kampen Asset Management); Director, Chief Executive Officer and President, Van Kampen Exchange Corp.
Formerly: Director and Chairman, Van Kampen Investor Services Inc.: Director, Chief Executive Officer and President, 1371 Preferred Inc. (holding company); and Van Kampen Investments Inc.; Director and President, AIM GP Canada Inc. (general partner for limited partnerships); and Van Kampen Advisors, Inc.; Director and Chief Executive Officer, Invesco Trimark Dealer Inc. (registered broker dealer); Director, Invesco Distributors, Inc. (formerly known as Invesco Aim Distributors, Inc.) (registered broker dealer); Manager, Invesco PowerShares Capital Management LLC; Director, Chief Executive Officer and President, Invesco Advisers, Inc.; Director, Chairman, Chief Executive Officer and President, Invesco Aim Capital Management, Inc.; President, Invesco Trimark Dealer Inc. and Invesco Trimark Ltd./Invesco Trimark Ltèe; Director and President, AIM Trimark Corporate Class Inc. and AIM Trimark Canada Fund Inc.; Senior Managing Director, Invesco Holding Company Limited; Trustee and Executive Vice President, Tax-Free Investments Trust; Director and Chairman, Fund Management Company (former registered broker dealer); President and Principal Executive Officer, The Invesco Funds (AIM Treasurer’s Series Trust (Invesco Treasurer’s Series Trust), Short-Term Investments Trust and Tax-Free Investments Trust only); President, AIM Trimark Global Fund Inc. and AIM Trimark Canada Fund Inc. | 124 | None | ||||
Wayne W. Whalen3 — 1939 Trustee | 2010 | Of Counsel, and prior to 2010, partner in the law firm of Skadden, Arps, Slate, Meagher & Flom LLP, legal counsel to certain funds in the Fund Complex
| 137 | Director of the Mutual Fund Directors Forum, a nonprofit membership organization for investment directors; Chairman and Director of the Abraham Lincoln Presidential Library Foundation; and Director of the Stevenson Center for Democracy |
| 1 | Mr. Flanagan is considered an interested person of the Trust because he is an officer of the adviser to the Trust, and an officer and a director of Invesco Ltd., ultimate parent of the adviser to the Trust. |
| 2 | Mr. Taylor is considered an interested person of the Trust because he is an officer and a director of the adviser to, and a director of the principal underwriter of, the Trust. |
| 3 | Mr. Whalen is considered an “interested person” (within the meaning of Section 2(a)(19) of the 1940 Act) of certain Funds in the Invesco Fund Complex by reason of he and his firm currently providing legal services as legal counsel to such Funds in the Invesco Fund Complex. |
T-1 �� Invesco Balanced-Risk Retirement Funds
Trustees and Officers—(continued)
| Name, Year of Birth and Position(s) Held with the Trust | Trustee and/ or Officer Since | Principal Occupation(s) During Past 5 Years | Number of Funds in Fund Complex Overseen by Trustee | Other Directorship(s) Held by Trustee During Past 5 Years | ||||
| Independent Trustees | ||||||||
Bruce L. Crockett — 1944 Trustee and Chair | 2001 | Chairman, Crockett Technologies Associates (technology consulting company)
Formerly: Director, Captaris (unified messaging provider); Director, President and Chief Executive Officer COMSAT Corporation; and Chairman, Board of Governors of INTELSAT (international communications company) | 124 | ACE Limited (insurance company); and Investment Company Institute | ||||
David C. Arch — 1945 Trustee | 2010 | Chairman and Chief Executive Officer of Blistex Inc., (consumer health care products manufacturer)
Formerly: Member of the Heartland Alliance Advisory Board, a nonprofit organization serving human needs based in Chicago | 137 | Board member of the Illinois Manufacturers’ Association; Member of the Board of Visitors, Institute for the Humanities, University of Michigan | ||||
Frank S. Bayley — 1939 Trustee | 1985 | Retired
Formerly: Director, Badgley Funds, Inc. (registered investment company) (2 portfolios) and General Partner and Of Counsel, law firm of Baker & McKenzie, LLP | 124 | Director and Chairman, C.D. Stimson Company (a real estate investment company); Trustee and Overseer, The Curtis institute of Music | ||||
James T. Bunch — 1942 Trustee | 2003 | Managing Member, Grumman Hill Group LLC (family office private equity management)
Formerly: Founder, Green, Manning & Bunch Ltd. (investment banking firm)(1988-2010); Executive Committee, United States Golf Association; and Director, Policy Studies, Inc. and Van Gilder Insurance Corporation | 124 | Chairman, Board of Governors, Western Golf Association; Chairman-elect, Evans Scholars Foundation; and Director, Denver Film Society | ||||
Rodney F. Dammeyer — 1940 Trustee | 2010 | Chairman of CAC, LLC, (private company offering capital investment and management advisory services)
Formerly: Prior to 2001, Managing Partner at Equity Group Corporate Investments; Prior to 1995, Vice Chairman of Anixter International; Prior to 1985, experience includes Senior Vice President and Chief Financial Officer of Household International, Inc., Executive Vice President and Chief Financial Officer of Northwest Industries, Inc. and Partner of Arthur Andersen & Co.; From 1987 to 2010, Director/Trustee of investment companies in the Van Kampen Funds complex | 126 | Director of Quidel Corporation and Stericycle, Inc.; Prior to May 2008, Trustee of The Scripps Research Institute; Prior to February 2008, Director of Ventana Medical Systems, Inc.; Prior to April 2007, Director of GATX Corporation; Prior to April 2004, Director of TheraSense, Inc. | ||||
Albert R. Dowden — 1941 Trustee | 2001 | Director of a number of public and private business corporations, including the Boss Group, Ltd. (private investment and management); Reich & Tang Funds (5 portfolios) (registered investment company); and Homeowners of America Holding Corporation/ Homeowners of America Insurance Company (property casualty company)
Formerly: Director, Continental Energy Services, LLC (oil and gas pipeline service); Director, CompuDyne Corporation (provider of product and services to the public security market) and Director, Annuity and Life Re (Holdings), Ltd. (reinsurance company); Director, President and Chief Executive Officer, Volvo Group North America, Inc.; Senior Vice President, AB Volvo; Director of various public and private corporations; Chairman, DHJ Media, Inc.; Director Magellan Insurance Company; and Director, The Hertz Corporation, Genmar Corporation (boat manufacturer), National Media Corporation; Advisory Board of Rotary Power International (designer, manufacturer, and seller of rotary power engines); and Chairman, Cortland Trust, Inc. (registered investment company) | 124 | Director of Nature’s Sunshine Products, Inc. | ||||
Jack M. Fields — 1952 Trustee | 2001 | Chief Executive Officer, Twenty First Century Group, Inc. (government affairs company); Owner and Chief Executive Officer, Dos Angeles Ranch, L.P. (cattle, hunting, corporate entertainment); and Discovery Global Education Fund (non-profit)
Formerly: Chief Executive Officer, Texana Timber LP (sustainable forestry company); Director of Cross Timbers Quail Research Ranch (non-profit); and member of the U.S. House of Representatives | 124 | Insperity, Inc. (formerly known as Administaff) | ||||
Prema Mathai-Davis — 1950 Trustee | 2001 | Retired
Formerly: Chief Executive Officer, YWCA of the U.S.A. | 124 | None | ||||
Larry Soll — 1942 Trustee | 2003 | Retired
Formerly: Chairman, Chief Executive Officer and President, Synergen Corp. (a biotechnology company) | 124 | None | ||||
Hugo F. Sonnenschein — 1940 Trustee | 2010 | Distinguished Service Professor and President Emeritus of the University of Chicago and the Adam Smith Distinguished Service Professor in the Department of Economics at the University of Chicago
Formerly: President of the University of Chicago | 137 | Trustee of the University of Rochester and a member of its investment committee. Member of the National Academy of Sciences, the American Philosophical Society and a fellow of the American Academy of Arts and Sciences |
T-2 Invesco Balanced-Risk Retirement Funds
Trustees and Officers—(continued)
| Name, Year of Birth and Position(s) Held with the Trust | Trustee and/ or Officer Since | Principal Occupation(s) During Past 5 Years | Number of Funds in Fund Complex Overseen by Trustee | Other Directorship(s) Held by Trustee During Past 5 Years | ||||
| Independent Trustees—(continued) | ||||||||
Raymond Stickel, Jr. — 1944 Trustee | 2005 | Retired
Formerly: Director, Mainstay VP Series Funds, Inc. (25 portfolios) and Partner, Deloitte & Touche | 124 | None | ||||
| Other Officers | ||||||||
| Russell C. Burk — 1958 Senior Vice President and Senior Officer | 2005 | Senior Vice President and Senior Officer, The Invesco Funds | N/A | N/A | ||||
| John M. Zerr — 1962 Senior Vice President, Chief Legal Officer and Secretary | 2006 | Director, Senior Vice President, Secretary and General Counsel, Invesco Management Group, Inc. (formerly known as Invesco Aim Management Group, Inc.) and Van Kampen Exchange Corp.; Senior Vice President, Invesco Advisers, Inc. (formerly known as Invesco Institutional (N.A.), Inc.) (registered investment adviser); Senior Vice President and Secretary, Invesco Distributors, Inc. (formerly known as Invesco Aim Distributors, Inc.); Director, Vice President and Secretary, Invesco Investment Services, Inc. (formerly known as Invesco Aim Investment Services, Inc.) and IVZ Distributors, Inc. (formerly known as INVESCO Distributors, Inc.); Director and Vice President, INVESCO Funds Group, Inc.; Senior Vice President, Chief Legal Officer and Secretary, The Invesco Funds; Manager, Invesco PowerShares Capital Management LLC; Director, Secretary and General Counsel, Invesco Investment Advisers LLC (formerly known as Van Kampen Asset Management); Secretary and General Counsel, Van Kampen Funds Inc. and Chief Legal Officer, PowerShares Exchange-Traded Fund Trust, PowerShares Exchange-Traded Fund Trust II, PowerShares India Exchange-Traded Fund Trust and PowerShares Actively Managed Exchange-Traded Fund Trust
Formerly: Director and Vice President, Van Kampen Advisors Inc.; Director, Vice President, Secretary and General Counsel Van Kampen Investor Services Inc.; Director, Invesco Distributors, Inc. (formerly known as Invesco Aim Distributors, Inc.); Director, Senior Vice President, General Counsel and Secretary, Invesco Advisers, Inc. and Van Kampen Investments Inc.; Director, Vice President and Secretary, Fund Management Company; Director, Senior Vice President, Secretary, General Counsel and Vice President, Invesco Aim Capital Management, Inc.; Chief Operating Officer and General Counsel, Liberty Ridge Capital, Inc. (an investment adviser); Vice President and Secretary, PBHG Funds (an investment company) and PBHG Insurance Series Fund (an investment company); Chief Operating Officer, General Counsel and Secretary, Old Mutual Investment Partners (a broker-dealer); General Counsel and Secretary, Old Mutual Fund Services (an administrator) and Old Mutual Shareholder Services (a shareholder servicing center); Executive Vice President, General Counsel and Secretary, Old Mutual Capital, Inc. (an investment adviser); and Vice President and Secretary, Old Mutual Advisors Funds (an investment company) | N/A | N/A | ||||
| Karen Dunn Kelley — 1960 Vice President | 2004 | Head of Invesco’s World Wide Fixed Income and Cash Management Group; Senior Vice President, Invesco Management Group, Inc. (formerly known as Invesco Aim Management Group, Inc.) and Invesco Advisers, Inc. (formerly known as Invesco Institutional (N.A.), Inc.) (registered investment adviser); Executive Vice President, Invesco Distributors, Inc. (formerly known as Invesco Aim Distributors, Inc.); Director, Invesco Mortgage Capital Inc., INVESCO Global Asset Management Limited, Invesco Management Company Limited and INVESCO Management S.A.; Vice President, The Invesco Funds (other than AIM Treasurer’s Series Trust (Invesco Treasurer’s Series Trust) and Short-Term Investments Trust); and President and Principal Executive Officer, The Invesco Funds (AIM Treasurer’s Series Trust (Invesco Treasurer’s Series Trust) and Short-Term Investments Trust only)
Formerly: Senior Vice President, Van Kampen Investments Inc.; Vice President, Invesco Advisers, Inc. (formerly known as Invesco Institutional (N.A.), Inc.); Director of Cash Management and Senior Vice President, Invesco Advisers, Inc. and Invesco Aim Capital Management, Inc.; President and Principal Executive Officer, Tax-Free Investments Trust; Director and President, Fund Management Company; Chief Cash Management Officer, Director of Cash Management, Senior Vice President, and Managing Director, Invesco Aim Capital Management, Inc.; Director of Cash Management, Senior Vice President, and Vice President, Invesco Advisers, Inc. and The Invesco Funds (AIM Treasurer’s Series Trust (Invesco Treasurer’s Series Trust), Short-Term Investments Trust and Tax-Free Investments Trust only) | N/A | N/A | ||||
T-3 Invesco Balanced-Risk Retirement Funds
Trustees and Officers—(continued)
| Name, Year of Birth and Position(s) Held with the Trust | Trustee and/ or Officer Since | Principal Occupation(s) During Past 5 Years | Number of Funds in Fund Complex Overseen by Trustee | Other Directorship(s) Held by Trustee During Past 5 Years | ||||
| Other Officers—(continued) | ||||||||
| Sheri Morris — 1964 Vice President, Treasurer and Principal Financial Officer | 1999 | Vice President, Treasurer and Principal Financial Officer, The Invesco Funds; Vice President, Invesco Advisers, Inc. (formerly known as Invesco Institutional (N.A.), Inc.) (registered investment adviser); and Vice President, PowerShares Exchange-Traded Fund Trust, PowerShares Exchange-Traded Fund Trust II, PowerShares India Exchange-Traded Fund Trust and PowerShares Actively Managed Exchange-Traded Fund Trust
Formerly: Vice President, Invesco Aim Advisers, Inc., Invesco Aim Capital Management, Inc. and Invesco Aim Private Asset Management, Inc.; Assistant Vice President and Assistant Treasurer, The Invesco Funds and Assistant Vice President, Invesco Advisers, Inc., Invesco Aim Capital Management, Inc. and Invesco Aim Private Asset Management, Inc.; and Treasurer, PowerShares Exchange-Traded Fund Trust, PowerShares Exchange-Traded Fund Trust II, PowerShares India Exchange-Traded Fund Trust and PowerShares Actively Managed Exchange-Traded Fund Trust | N/A | N/A | ||||
Yinka Akinsola — 1977 Anti-Money Laundering Compliance Officer | 2011 | Anti-Money Laundering Compliance Officer, Invesco Advisers, Inc. (formerly known as Invesco Institutional (N.A.), Inc.) (registered investment adviser); Invesco Distributors, Inc. (formerly known as Invesco Aim Distributors, Inc.), Invesco Investment Services, Inc. (formerly known as Invesco Aim Investment Services, Inc.), Invesco Management Group, Inc., The Invesco Funds, Invesco Van Kampen Closed-End Funds, Van Kampen Exchange Corp., Van Kampen Funds Inc., PowerShares Exchange-Traded Fund Trust, PowerShares Exchange-Traded Fund Trust II, PowerShares India Exchange-Traded Fund Trust, and PowerShares Actively Managed Exchange-Traded Fund Trust
Formerly: Regulatory Analyst III, Financial Industry Regulatory Authority (FINRA) | N/A | N/A | ||||
| Todd L. Spillane — 1958 Chief Compliance Officer | 2006 | Senior Vice President, Invesco Management Group, Inc. (formerly known as Invesco Aim Management Group, Inc.) and Van Kampen Exchange Corp.; Senior Vice President and Chief Compliance Officer, Invesco Advisers, Inc. (registered investment adviser) (formerly known as Invesco Institutional (N.A.), Inc.); Chief Compliance Officer, The Invesco Funds; Vice President, Invesco Distributors, Inc. (formerly known as Invesco Aim Distributors, Inc.) and Invesco Investment Services, Inc. (formerly known as Invesco Aim Investment Services, Inc.)
Formerly: Chief Compliance Officer, Invesco Van Kampen Closed-End Funds; Senior Vice President, Van Kampen Investments Inc.; Senior Vice President and Chief Compliance Officer, Invesco Aim Advisers, Inc. and Invesco Aim Capital Management, Inc.; Chief Compliance Officer, INVESCO Private Capital Investments, Inc. (holding company), Invesco Private Capital, Inc. (registered investment adviser), Invesco Global Asset Management (N.A.), Inc., Invesco Senior Secured Management, Inc. (registered investment adviser), Van Kampen Investor Services Inc., PowerShares Exchange-Traded Fund Trust, PowerShares Exchange-Traded Fund Trust II, PowerShares India Exchange-Traded Fund Trust and PowerShares Actively Managed Exchange-Traded Fund Trust; and Vice President, Invesco Aim Capital Management, Inc. and Fund Management Company | N/A | N/A |
The Statement of Additional Information of the Trust includes additional information about the Fund’s Trustees and is available upon request, without charge, by calling 1.800.959.4246. Please refer to the Fund’s prospectus for information on the Fund’s sub-advisers.
Office of the Fund 11 Greenway Plaza, Suite 1000 Houston, TX 77046-1173 | Investment Adviser Invesco Advisers, Inc. 1555 Peachtree Street, N.E. Atlanta, GA 30309 | Distributor Invesco Distributors, Inc. 11 Greenway Plaza, Suite 1000 Houston, TX 77046-1173 | Auditors PricewaterhouseCoopers LLP 1201 Louisiana Street, Suite 2900 Houston, TX 77002-5678 | |||
Counsel to the Fund Stradley Ronon Stevens & Young, LLP 2005 Market Street, Suite 2600 Philadelphia, PA 19103-7018 | Counsel to the Independent Trustees Goodwin Procter LLP 901 New York Avenue, N.W. | Transfer Agent Invesco Investment Services, Inc. 11 Greenway Plaza, Suite 1000 Houston, TX 77046-1173 | Custodian State Street Bank and Trust Company 225 Franklin Street Boston, MA 02110-2801 | |||
T-4 Invesco Balanced-Risk Retirement Funds

Invesco mailing information
Send general correspondence to Invesco Investment Services, Inc., P.O. Box 219078, Kansas City, MO 64121-9078.
Invesco privacy policy
You share personal and financial information with us that is necessary for your transactions and your account records. We take very seriously the obligation to keep that information confidential and private.
Invesco collects nonpublic personal information about you from account applications or other forms you complete and from your transactions with us or our affiliates. We do not disclose information about you or our former customers to service providers or other third parties except to the extent necessary to service your account and in other limited circumstances as permitted by law. For example, we use this information to facilitate the delivery of transaction confirmations, financial reports, prospectuses and tax forms.
Even within Invesco, only people involved in the servicing of your accounts and compliance monitoring have access to your information. To ensure the highest level of confidentiality and security, Invesco maintains physical, electronic and procedural safeguards that meet or exceed federal standards. Special measures, such as data encryption and authentication, apply to your communications with us on our website. More detail is available to you at invesco.com/privacy.
Important notice regarding delivery of security holder documents
To reduce Fund expenses, only one copy of most shareholder documents may be mailed to shareholders with multiple accounts at the same address (Householding). Mailing of your shareholder documents may be householded indefinitely unless you instruct us otherwise. If you do not want the mailing of these documents to be combined with those for other members of your household, please contact Invesco Investment Services, Inc. at 800 959 4246 or contact your financial institution. We will begin sending you individual copies for each account within 30 days after receiving your request.
Fund holdings and proxy voting information
The Fund provides a complete list of its holdings four times in each fiscal year, at the quarter-ends. For the second and fourth quarters, the lists appear in the Fund’s semiannual and annual reports to shareholders. For the first and third quarters, the Fund files the lists with the Securities and Exchange Commission (SEC) on Form N-Q. The most recent list of portfolio holdings is available at invesco.com/completeqtrholdings. Shareholders can also look up the Fund’s Forms N-Q on the SEC website at sec.gov. Copies of the Fund’s Forms N-Q may be reviewed and copied at the SEC Public Reference Room in Washington, D.C. You can obtain information on the operation of the Public Reference Room, including information about duplicating fee charges, by calling 202 551 8090 or 800 732 0330, or by electronic request at the following email address: publicinfo@sec.gov. The SEC file numbers for the Fund are shown below.
A description of the policies and procedures that the Fund uses to determine how to vote proxies relating to portfolio securities is available without charge, upon request, from our Client Services department at 800 959 4246 or at invesco.com/proxyguidelines. The information is also available on the SEC website, sec.gov.
Information regarding how the Fund voted proxies related to its portfolio securities during the 12 months ended June 30, 2012, is available at invesco.com/proxysearch. The information is also available on the SEC website, sec.gov. Invesco Advisers, Inc. is an investment adviser; it provides investment advisory services to individual and institutional clients and does not sell securities. Invesco Distributors, Inc. is the US distributor for Invesco Ltd.’s retail mutual funds, exchange-traded funds and institutional money market funds. Both are wholly owned, indirect subsidiaries of Invesco Ltd. |  |
SEC file numbers: 811-02699 and 002-57526 | IBRR-AR-1 | Invesco Distributors, Inc. |
| ||||||
 | Annual Report to Shareholders | December 31, 2012 | ||||
| ||||||
| Invesco Allocation Funds | ||||||
Invesco Conservative Allocation Fund Invesco Growth Allocation Fund Invesco Moderate Allocation Fund | ||||||

Invesco Conservative Allocation Fund’s Long-Term Performance
Results of a $10,000 Investment – Oldest Share Class(es) since Inception
Fund data from 4/29/05; index data from 4/30/05
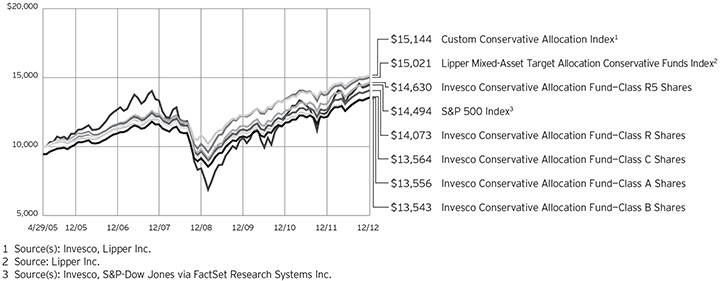
Past performance cannot guarantee comparable future results.
The data shown in the chart include reinvested distributions, applicable sales charges and Fund expenses including management fees. Results for Class B shares are calculated as if a hypothetical
shareholder had liquidated his entire investment in the Fund at the close of the reporting period and paid the contingent deferred sales charges, if applicable. Index results include reinvested dividends, but they do not reflect sales charges. Performance of the peer group,
if applicable, reflects fund expenses and management fees; performance of a market index does not. Performance shown in the chart and table(s) does not reflect deduction of taxes a shareholder would pay on Fund distributions or sale of Fund shares.
2 Invesco Allocation Funds
| Average Annual Total Returns | |||||
| As of 12/31/12, including maximum applicable sales charges | |||||
| Class A Shares | |||||
| Inception (4/29/05) | 4.04 | % | |||
5 Years | 1.98 | ||||
1 Year | 5.15 | ||||
| Class B Shares | |||||
| Inception (4/29/05) | 4.03 | % | |||
5 Years | 2.03 | ||||
1 Year | 5.33 | ||||
| Class C Shares | |||||
| Inception (4/29/05) | 4.05 | % | |||
5 Years | 2.39 | ||||
1 Year | 9.31 | ||||
| Class R Shares | |||||
| Inception (4/29/05) | 4.55 | % | |||
5 Years | 2.89 | ||||
1 Year | 10.92 | ||||
| Class S Shares | |||||
| Inception | 4.83 | % | |||
5 Years | 3.16 | ||||
1 Year | 11.27 | ||||
| Class Y Shares | |||||
| Inception | 4.92 | % | |||
5 Years | 3.30 | ||||
1 Year | 11.46 | ||||
| Class R5 Shares | |||||
| Inception (4/29/05) | 5.08 | % | |||
5 Years | 3.40 | ||||
1 Year | 11.56 | ||||
Class S shares incepted on June 6, 2011. Performance shown prior to that date is that of Class A shares and includes the 12b-1 fees applicable to Class A shares. Class A share performance reflects any applicable fee waivers or expense reimbursements.
Class Y shares incepted on October 3, 2008. Performance shown prior to that date is that of Class A shares and includes the 12b-1 fees applicable to Class A shares. Class A share performance reflects any applicable fee waivers or expense reimbursements.
The performance data quoted represent past performance and cannot guarantee comparable future results; current performance may
be lower or higher. Please visit invesco.com/performance for the most recent month-end performance. Performance figures reflect reinvested distributions, changes in net asset value and the effect of the maximum sales charge unless otherwise stated. Investment return and principal value will fluctuate so that you may have a gain or loss when you sell shares.
The total annual Fund operating expense ratio set forth in the most recent Fund prospectus as of the date of this report for Class A, Class B, Class C, Class R, Class S, Class Y and Class R5 shares was 1.17%, 1.92%, 1.92%, 1.42%, 1.07%, 0.92% and 0.85%, respectively.1 The expense ratios presented above may vary from the expense ratios presented in other sections of this report that are based on expenses incurred during the period covered by this report.
Class A share performance reflects the maximum 5.50% sales charge, and Class B and Class C share performance reflects the applicable contingent deferred sales charge (CDSC) for the period involved. The CDSC on Class B shares declines from 5% beginning at the time of purchase to 0% at the beginning of the seventh year. The CDSC on Class C shares is 1% for the first year after purchase. Class R, Class S, Class Y and Class R5 shares do not have a front-end sales charge or a CDSC; therefore, performance is at net asset value.
The performance of the Fund’s share classes will differ primarily due to different sales charge structures and class expenses.
Had the adviser not waived fees and/ or reimbursed expenses in the past, performance would have been lower.
| 1 | The expense ratio includes acquired fund fees and expenses of the underlying funds in which the Fund invests of 0.64% for Invesco Conservative Allocation Fund. |
3 Invesco Allocation Funds
Invesco Growth Allocation Fund’s Long-Term Performance
Results of a $10,000 Investment – Oldest Share Class(es) since Inception
Fund and index data from 4/30/04
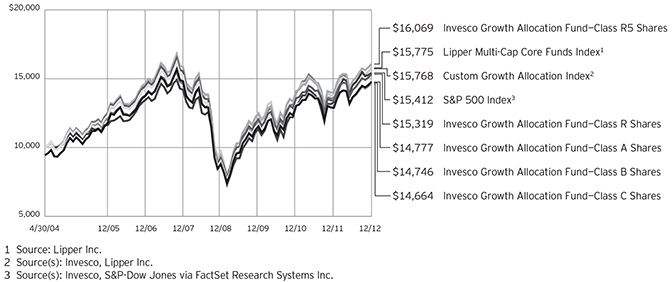
Past performance cannot guarantee comparable future results.
The data shown in the chart include reinvested distributions, applicable sales charges and Fund expenses including management fees. Results for Class B shares are calculated as if a hypothetical
shareholder had liquidated his entire investment in the Fund at the close of the reporting period and paid the contingent deferred sales charges, if applicable. Index results include reinvested dividends, but they do not reflect sales charges. Performance of the peer group,
if applicable, reflects fund expenses and management fees; performance of a market index does not. Performance shown in the chart and table(s) does not reflect deduction of taxes a shareholder would pay on Fund distributions or sale of Fund shares.
4 Invesco Allocation Funds
| Average Annual Total Returns | |||||
| As of 12/31/12, including maximum applicable sales charges | |||||
| Class A Shares | |||||
| Inception (4/30/04) | 4.61 | % | |||
5 Years | -1.18 | ||||
1 Year | 8.42 | ||||
| Class B Shares | |||||
| Inception (4/30/04) | 4.58 | % | |||
5 Years | -1.14 | ||||
1 Year | 8.73 | ||||
| Class C Shares | |||||
| Inception (4/30/04) | 4.51 | % | |||
5 Years | -0.79 | ||||
1 Year | 12.73 | ||||
| Class R Shares | �� | ||||
| Inception (4/30/04) | 5.04 | % | |||
5 Years | -0.29 | ||||
1 Year | 14.32 | ||||
| Class S Shares | |||||
| Inception | 5.33 | % | |||
5 Years | 0.02 | ||||
1 Year | 14.70 | ||||
| Class Y Shares | |||||
| Inception | 5.42 | % | |||
5 Years | 0.17 | ||||
1 Year | 14.88 | ||||
| Class R5 Shares | |||||
| Inception (4/30/04) | 5.62 | % | |||
5 Years | 0.27 | ||||
1 Year | 14.95 | ||||
Class S shares incepted on September 25, 2009. Performance shown prior to that date is that of Class A shares and includes the 12b-1 fees applicable to Class A shares. Class A share performance reflects any applicable fee waivers or expense reimbursements.
Class Y shares incepted on October 3, 2008. Performance shown prior to that date is that of Class A shares and includes the 12b-1 fees applicable to Class A shares. Class A share performance reflects any applicable fee waivers or expense reimbursements.
The performance data quoted represent past performance and cannot guarantee comparable future results; current performance may be lower or higher. Please visit invesco.com/performance for the
most recent month-end performance. Performance figures reflect reinvested distributions, changes in net asset value and the effect of the maximum sales charge unless otherwise stated. Investment return and principal value will fluctuate so that you may have a gain or loss when you sell shares.
The total annual Fund operating expense ratio set forth in the most recent Fund prospectus as of the date of this report for Class A, Class B, Class C, Class R, Class S, Class Y and Class R5 shares was 1.36%, 2.11%, 2.11%, 1.61%, 1.26%, 1.11% and 0.91%, respectively.1 The expense ratios presented above may vary from the expense ratios presented in other sections of this report that are based on expenses incurred during the period covered by this report.
Class A share performance reflects the maximum 5.50% sales charge, and Class B and Class C share performance reflects the applicable contingent deferred sales charge (CDSC) for the period involved. The CDSC on Class B shares declines from 5% beginning at the time of purchase to 0% at the beginning of the seventh year. The CDSC on Class C shares is 1% for the first year after purchase. Class R, Class S, Class Y and Class R5 shares do not have a front-end sales charge or a CDSC; therefore, performance is at net asset value.
The performance of the Fund’s share classes will differ primarily due to different sales charge structures and class expenses.
Had the adviser not waived fees and/ or reimbursed expenses on the Fund’s Class A, B, C, R, S and Y shares in the past, performance would have been lower.
| 1 | The expense ratio includes acquired fund fees and expenses of the underlying funds in which the Fund invests of 0.78% for Invesco Growth Allocation Fund. |
5 Invesco Allocation Funds
Invesco Moderate Allocation Fund’s Long-Term Performance
Results of a $10,000 Investment – Oldest Share Class(es) since Inception
Fund and index data from 4/30/04
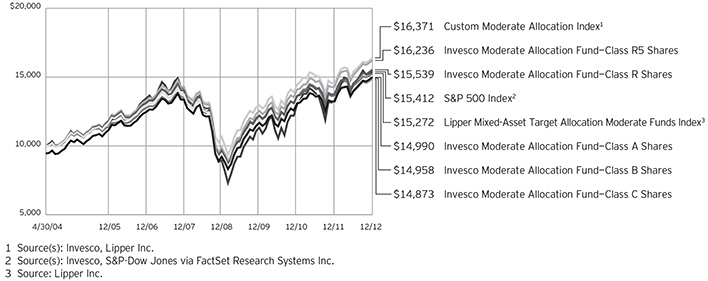
Past performance cannot guarantee comparable future results.
The data shown in the chart include reinvested distributions, applicable sales charges and Fund expenses including management fees. Results for Class B shares are calculated as if a hypothetical
shareholder had liquidated his entire investment in the Fund at the close of the reporting period and paid the contingent deferred sales charges, if applicable. Index results include reinvested dividends, but they do not reflect sales charges. Performance of the peer group,
if applicable, reflects fund expenses and management fees; performance of a market index does not. Performance shown in the chart and table(s) does not reflect deduction of taxes a shareholder would pay on Fund distributions or sale of Fund shares.
6 Invesco Allocation Funds
| Average Annual Total Returns | |||||
| As of 12/31/12, including maximum applicable sales charges | |||||
| Class A Shares | |||||
| Inception (4/30/04) | 4.78 | % | |||
5 Years | 1.18 | ||||
1 Year | 7.00 | ||||
| Class B Shares | |||||
| Inception (4/30/04) | 4.75 | % | |||
5 Years | 1.24 | ||||
1 Year | 7.37 | ||||
| Class C Shares | |||||
| Inception (4/30/04) | 4.68 | % | |||
5 Years | 1.57 | ||||
1 Year | 11.38 | ||||
| Class R Shares | |||||
| Inception (4/30/04) | 5.21 | % | |||
5 Years | 2.08 | ||||
1 Year | 12.91 | ||||
| Class S Shares | |||||
| Inception | 5.49 | % | |||
5 Years | 2.38 | ||||
1 Year | 13.31 | ||||
| Class Y Shares | |||||
| Inception | 5.59 | % | |||
5 Years | 2.54 | ||||
1 Year | 13.46 | ||||
| Class R5 Shares | |||||
| Inception (4/30/04) | 5.75 | % | |||
5 Years | 2.59 | ||||
1 Year | 13.49 | ||||
Class S shares incepted on September 25, 2009. Performance shown prior to that date is that of Class A shares and includes the 12b-1 fees applicable to Class A shares. Class A share performance reflects any applicable fee waivers or expense reimbursements.
Class Y shares incepted on October 3, 2008. Performance shown prior to that date is that of Class A shares and includes the 12b-1 fees applicable to Class A shares. Class A share performance reflects any applicable fee waivers or expense reimbursements.
The performance data quoted represent past performance and cannot guarantee comparable future results; current performance may be lower or higher. Please visit invesco.com/performance for the most recent month-end performance. Performance figures reflect reinvested
distributions, changes in net asset value and the effect of the maximum sales charge unless otherwise stated. Investment return and principal value will fluctuate so that you may have a gain or loss when you sell shares.
The total annual Fund operating expense ratio set forth in the most recent Fund prospectus as of the date of this report for Class A, Class B, Class C, Class R, Class S, Class Y and Class R5 shares was 1.23%, 1.98%, 1.98%, 1.48%, 1.13%. 0.98% and 0.82%, respectively.1 The expense ratios presented above may vary from the expense ratios presented in other sections of this report that are based on expenses incurred during the period covered by this report.
Class A share performance reflects the maximum 5.50% sales charge, and Class B and Class C share performance reflects the applicable contingent deferred sales charge (CDSC) for the period involved. The CDSC on Class B shares declines from 5% beginning at the time of purchase to 0% at the beginning of the seventh year. The CDSC on Class C shares is 1% for the first year after purchase. Class R, Class S, Class Y and Class R5 shares do not have a front-end sales charge or a CDSC; therefore, performance is at net asset value.
The performance of the Fund’s share classes will differ primarily due to different sales charge structures and class expenses.
Had the adviser not waived fees and/ or reimbursed expenses on the Fund’s Class A, B, C, R, S and Y shares in the past, performance would have been lower.
| 1 | The expense ratio includes acquired fund fees and expenses of the underlying funds in which the Fund invests of 0.72% for Invesco Moderate Allocation Fund. |
7 Invesco Allocation Funds
Letters to Shareholders
Philip Taylor | Dear Shareholders: This annual report contains information about your Fund and the factors that affected its performance during the reporting period. Inside, you’ll find a discussion from your portfolio managers about how they managed your Fund, performance data for your Fund, a complete list of your Fund’s investments as of the close of the reporting period and other important information. I hope you find this report of interest. The reporting period covered by this report was challenging. As the year began, investors cheered generally positive economic indicators, and markets generally rose. Soon, however, US economic data turned mixed and investors’ attention shifted to the efforts of eurozone governments to implement new policies intended to reduce debt levels, strengthen the banking system and stimulate economic growth. Later in the year, in the US, mixed | ||||||||
| economic data, competing proposals on how to reduce the federal budget deficit and a contentious presidential contest increased investor uncertainty and hindered market performance. Throughout the year, your Fund’s portfolio managers adhered to their long-term investment strategies, and later in this report they explain why your Fund performed as it did during the reporting period. | |||||||||

Adhering to your long-term investment plan can be difficult, particularly during periods of market volatility and economic uncertainty. That’s one reason Invesco suggests investors work with a skilled and trusted financial adviser who is familiar with their financial situation, investment goals and risk tolerance. A good financial adviser can provide insight and perspective when markets are volatile; motivation and reassurance when times are uncertain; and advice and recommendations when your financial situation or investment goals change.
Timely insight and information from many of Invesco’s investment professionals is available at our website, invesco.com/us. We offer in-depth articles, video clips and audio commentaries from many of our portfolio managers and other investment professionals on a wide range of topics of interest to investors. At invesco.com/us, you also can access information about your Invesco account at any time.
What we mean by Intentional Investing
At Invesco, all of our people and all of our resources are dedicated to helping investors achieve their financial objectives. It’s a philosophy we call Intentional Investing®, and it guides the way we:
| n | Manage investments – Our dedicated investment professionals search the world for the best opportunities, and each investment team follows a clear, disciplined process to build portfolios and mitigate risk. |
| n | Provide choices – We offer equity, fixed income, asset allocation and alternative strategies so you and your financial adviser can build an investment portfolio designed for your individual needs and goals. |
| n | Connect with you – We’re committed to giving you the expert insights you need to make informed investing decisions, and we are well-equipped to provide high-quality support for investors and advisers. |
Invesco believes in putting investors first, and that’s why investment management is all we do. Our sole focus on managing your money allows your financial adviser to build a portfolio of Invesco funds appropriate for your investment needs and goals now and when your circumstances change.
Have a question?
If you have a question about your account, please contact an Invesco client services representative at 800 959 4246. If you have an Invesco-related question or comment, feel free to email me directly at phil@invesco.com.
All of us at Invesco look forward to serving your investment management needs for many years to come. Thank you for investing with us.
Sincerely,

Philip Taylor
Senior Managing Director, Invesco Ltd.
8 Invesco Allocation Funds
Bruce Crockett | Dear Fellow Shareholders: While short-term challenges for the financial markets regularly come and go, it’s clear that significant and longer term economic obstacles remain both here at home and abroad. There appear to be no easy solutions to many of these issues. As a result, the financial markets have had little conviction to respond to what has been slow, yet noticeable improvement in some economic benchmarks in recent months. No one likes uncertainty, especially financial markets. But even in these uncertain times, it appears that investors are still approaching the market with cautious optimism, with some taking on more risk in order to refocus on their long-term savings goals. Maybe this describes you, or perhaps you have been sitting on the sidelines thinking about getting back into the market, but are still a bit hesitant to act because of market uncertainty. | ||||||||

Clearly, risk remains a primary focus for investors of all types. As Trustees of the Invesco Funds, one of our primary responsibilities is to ensure your fund’s adviser is cognizant of the risks in each of the funds it manages. A thoughtful risk management plan may help investors navigate through market turbulence or an economic downturn. This is why we make risk management a critical element of our annual contract renewal process, like the one we complete with Invesco every year.
To be sure, there will always be risks involved with investing, but you shouldn’t let short-term news or your emotions dictate your investments. Because no one can predict with 100% accuracy the movements of financial markets, I strongly encourage you to speak with a professional financial adviser who can assist you in building an investment portfolio that reflects your individual risk tolerance and is designed to help achieve your individual financial objectives.
You can be sure your Board remains committed to doing its part in helping you along the way. In addition to ensuring that your fund’s adviser is focused on the risks in the funds it manages, we also remain committed to managing fund costs and working with your fund’s adviser to provide a compelling and diversified product offering to potentially meet your investing goals.
In that regard, your Board approved a number of fund mergers and the launch of several new funds, including the first Invesco mutual fund available to US retail investors managed by investment professionals at Invesco Perpetual*, one of the largest independent investment managers in the UK.
Let me close by thanking Carl Frischling upon his retirement from the Invesco Funds Board for his 35 years of distinguished service and unwavering commitment to our funds’ shareholders. As always, please contact me at bruce@brucecrockett.com with any questions or concerns you may have.
On behalf of the Board, we look forward to continuing to represent your interests and serving your investment needs.
Sincerely,

Bruce L. Crockett
Independent Chair
Invesco Funds Board of Trustees
| * | Invesco Perpetual is a business name of Invesco Asset Management Limited (IAML), a registered investment adviser. IAML is a wholly owned, indirect subsidiary of Invesco Ltd. |
9 Invesco Allocation Funds
Management’s Discussion of Fund Performance
Performance summary – Invesco Conservative Allocation Fund
For the year ended December 31, 2012, Invesco Conservative Allocation Fund, at net asset value (NAV), outperformed its custom style-specific benchmark. Positive absolute performance from global developed market equities drove results throughout the year. Commodities declined overall and experienced meaningful volatility. Government bonds produced positive absolute returns serving as safe haven assets during periods of heightened volatility, particularly in April and May of 2012.
Your Fund’s long-term performance appears later in this report.
Fund vs. Indexes
Total returns, 12/31/11 to 12/31/12, at net asset value (NAV). Performance shown does not include applicable contingent deferred sales charges (CDSC) or front-end sales charges, which would have reduced performance.
| Class A Shares | 11.28 | % | |||
| Class B Shares | 10.33 | ||||
| Class C Shares | 10.31 | ||||
| Class R Shares | 10.92 | ||||
| Class S Shares | 11.27 | ||||
| Class Y Shares | 11.46 | ||||
| Class R5 Shares* | 11.56 | ||||
| S&P 500 Index‚ (Broad Market Index) | 16.00 | ||||
| Custom Conservative Allocation Indexn (Style-Specific Index) | 8.02 | ||||
| Lipper Mixed-Asset Target Allocation Conservative Funds Index ¿ (Peer Group Index) | 8.92 |
Source(s): ‚Invesco, S&P-Dow Jones via FactSet Research Systems Inc.; nInvesco, Lipper Inc.;
¿Lipper Inc.
| *Effective | September 24, 2012, Institutional Class shares were renamed Class R5 shares. |
How we invest
Invesco Conservative Allocation Fund is intended for investors with a low to moderate risk tolerance. The Fund invests in underlying funds diversified among asset classes (stocks, bonds and alternative asset classes), investment styles (value, blend/core and growth), regions (domestic and international) and market capitalizations (mid and large). The underlying funds include bond funds, which represent approximately 54.50% of the portfolio; stock funds, which represent approximately 30.08% of the portfolio; and alternative funds such as global real estate, balanced-risk allocation and commodity funds that represent
approximately 15.42% of the portfolio.
The balanced-risk allocation underlying funds can shift exposures between equities, fixed income and commodities. The commodity underlying fund invests in instruments that provide exposure to the commodities market. They gain exposure to their underlying assets through the use of derivatives, including futures, swap agreements and commodity-linked notes.
While no fund can guarantee positive performance, the broad portfolio diversification strives to provide exposure to areas of the market that may perform well in any given period. It also attempts to limit exposure to any one area of the
market that may be underperforming.
We establish target asset class weightings and underlying fund selections for the Fund and monitor the Fund on an ongoing basis. The underlying funds are actively managed by their respective management teams based on individual fund objectives, investment strategies and management techniques.
While the weightings of various underlying funds in the portfolio may vary from their targets during the year due to market movements, we rebalance the portfolio quarterly to maintain its target asset class allocations. There are also additional triggers in place to rebalance intra-quarter if allocations stray from a specified range.
Market conditions and your Fund
The year began with the advance of equities and commodities driven by indications of improving economic data and continued stimulus from global monetary authorities. Most sovereign bond markets fell during the first quarter of 2012 on signs of improving economic conditions, reduced economic strains in Europe and declining expectations for further Treasury bond purchase programs.
During April and May, risky asset gains from earlier in the year were eroded as a result of renewed fears arising from the ongoing European crisis coupled with weakening economic data in key markets. Government bonds once again fulfilled their role as safe haven assets as yields contracted in response to the weakness in risky assets.
In the third quarter, equity, fixed income and commodity markets all posted impressive results. Riskier assets, especially commodities, were able to
| Portfolio Composition | ||||||||||
| Asset Class | Target Allocation Range | % of Total Net Assets as of 12/31/12 | ||||||||
| Intermediate Term Taxable Investment Grade | 24.52 | % | 24.35 | % | ||||||
| Taxable Non-Investment Grade | 14.36 | 14.39 | ||||||||
| Balanced-Risk | 13.50 | 13.09 | ||||||||
| Large-Cap Value | 8.78 | 8.83 | ||||||||
| International/Global Blend | 4.00 | 4.26 | ||||||||
| Large-Cap Growth | 3.86 | 3.76 | ||||||||
| International/Global Growth | 3.68 | 3.76 | ||||||||
| Emerging Markets Fixed Income | 3.27 | 3.34 | ||||||||
| Emerging Markets | 3.20 | 3.31 | ||||||||
| Large-Cap Blend | 2.72 | 2.73 | ||||||||
| Mid-Cap Blend | 2.08 | 2.15 | ||||||||
| Global Real Estate | 1.92 | 2.02 | ||||||||
| Small-Cap Blend | 1.76 | 1.79 | ||||||||
| Cash Equivalents Plus Other Assets Less Liabilities | 12.35 | 12.22 | ||||||||
| Total Net Assets | $337.2 million |
Fund Nasdaq Symbols | |||||
Class A Shares | CAAMX | ||||
Class B Shares | CMBAX | ||||
Class C Shares | CACMX | ||||
Class R Shares | CMARX | ||||
Class S Shares | CMASX | ||||
Class Y Shares | CAAYX | ||||
Class R5 Shares | CMAIX |
10 Invesco Allocation Funds
stage a bounce back on expectations for additional monetary easing and hope that Europe would be able to finally make headway on its lingering economic issues. Bond yields spiked twice during the third quarter, but managed to settle down as markets see-sawed between concerns over inflation and the continuing weakness in Europe.
The year ended with a lift in equities offset by declines in bonds and commodities. Investors had a host of political issues to navigate, including elections in the US, China and Japan; “fiscal cliff” negotiations in the US; and continuing concerns over European and Chinese economic growth. Equities were the lone bright spot while commodity markets were weighed down by concerns over falling demand and an improvement in crop yields. Government bond yields ultimately made their way higher as the market experienced both rallies and sell-offs.
Invesco Core Plus Bond Fund, Invesco Balanced-Risk Allocation Fund and Invesco High Yield Fund were the top contributors to absolute Fund performance for the reporting period. There were no absolute detractors from overall Fund performance. Relative to the Fund’s custom style-specific index, Invesco International Core Equity Fund, PowerShares 1-30 Laddered Treasury Portfolio and Invesco American Franchise Fund were the largest detractors from performance.
Please note that some of the underlying funds – which include, but are not limited to, Invesco Balanced-Risk Allocation Fund, Invesco Balanced-Risk Commodity Strategy Fund and Invesco Core Plus Bond Fund – may be primarily implemented with derivatives, which may create economic leverage in the underlying funds. Please note that our strategy is principally implemented with derivative instruments that include futures and total return swaps. Therefore, all or most of the performance of the strategy, both positive and negative, can be attributed to these instruments. Derivatives can be a more liquid and cost-effective way to gain exposure to asset classes. Additionally, the leverage used in the strategy is inherent in these instruments.
Finally, we thank you for your continued commitment to Invesco Conservative Allocation Fund.
The views and opinions expressed in management’s discussion of Fund performance are those of Invesco Advisers, Inc. These views and opinions are subject to change at any time based on factors such as market and economic conditions. These views and opinions may not be relied upon as investment advice or recommendations, or as an offer for a particular security. The information is not a complete analysis of every aspect of any market, country, industry, security or the Fund. Statements of fact are from sources considered reliable, but Invesco Advisers, Inc. makes no representation or warranty as to their completeness or accuracy. Although historical performance is no guarantee of future results, these insights may help you understand our investment management philosophy.
See important Fund and, if applicable, index disclosures later in this report.
 | Mark Ahnrud Chartered Financial Analyst, portfolio manager, is manager of Invesco Conservative Allocation Fund. He | |
| joined Invesco in 2000. Mr. Ahnrud earned a BS in finance and investments from Babson College and an MBA from Duke University Fuqua School of Business. | ||
 | Chris Devine Chartered Financial Analyst, portfolio manager, is manager of Invesco Conservative Allocation Fund. He | |
| joined Invesco in 1998. Mr. Devine earned a BA in economics from Wake Forest University and an MBA from the University of Georgia. | ||
 | Scott Hixon Chartered Financial Analyst, portfolio manager, is manager of Invesco Conservative Allocation Fund. He | |
| joined Invesco in 1994. Mr. Hixon earned a BBA in finance from Georgia Southern University and an MBA in finance from Georgia State University. | ||
 | Christian Ulrich Chartered Financial Analyst, portfolio manager, is manager of Invesco Conservative Allocation Fund. He | |
| joined Invesco in 2000. Mr. Ulrich earned the equivalent of a BBA from the KV Zurich Business School in Zurich, Switzerland. | ||
 | Scott Wolle Chartered Financial Analyst, portfolio manager, is manager of Invesco Conservative Allocation Fund. He | |
| joined Invesco in 1999. Mr. Wolle earned a BS in finance from Virginia Polytechnic Institute and State University and an MBA from Duke University Fuqua School of Business. | ||
Assisted by the Global Asset Allocation Team
11 Invesco Allocation Funds
Management’s Discussion of Fund Performance
Performance summary – Invesco Growth Allocation Fund
For the year ended December 31, 2012, Invesco Growth Allocation Fund, at net asset value (NAV), performed in line with its custom style-specific benchmark. Positive absolute performance from global developed market equities drove results throughout the year. Commodities declined overall and experienced meaningful volatility. Government bonds produced positive absolute returns serving as safe haven assets during periods of heightened volatility, particularly in April and May of 2012.
Your Fund’s long-term performance appears later in this report.
Fund vs. Indexes
Total returns, 12/31/11 to 12/31/12, at net asset value (NAV). Performance shown does not include applicable contingent deferred sales charges (CDSC) or front-end sales charges, which would have reduced performance.
| Class A Shares | 14.68 | % | |||
| Class B Shares | 13.73 | ||||
| Class C Shares | 13.73 | ||||
| Class R Shares | 14.32 | ||||
| Class S Shares | 14.70 | ||||
| Class Y Shares | 14.88 | ||||
| Class R5 Shares* | 14.95 | ||||
| S&P 500 Index‚ (Broad Market Index) | 16.00 | ||||
| Custom Growth Allocation Indexn (Style-Specific Index) | 14.35 | ||||
| Lipper Multi-Cap Core Funds Index¿(Peer Group Index) | 16.15 |
Source(s): ‚Invesco, S&P-Dow Jones via FactSet Research Systems Inc.; nInvesco, Lipper Inc.;
¿Lipper Inc.
| *Effective | September 24, 2012, Institutional Class shares were renamed Class R5 shares. |
How we invest
Invesco Growth Allocation Fund is intended for investors with a relatively high risk tolerance. The Fund invests in underlying funds diversified among asset classes (stocks, bonds and alternative asset classes), investment styles (value, blend/ core and growth), regions (domestic and international) and market capitalizations (small, mid and large). These underlying funds include stock funds, which represent approximately 66.74% of the portfolio; alternative funds such as global real estate, balanced-risk allocation and commodity funds that which represent approximately 26.26% of the portfolio; and one bond fund, which represents
approximately 7% of the portfolio.
The balanced-risk allocation and underlying funds can shift exposures between equities, fixed income and commodities. The commodity underlying fund invests in instruments that provide exposure to the commodities market. They gain exposure to their underlying assets through the use of derivatives, including futures, swap agreements and commodity-linked notes.
While no fund can guarantee positive performance, the broad portfolio diversification strives to provide exposure to areas of the market that may perform well in any given period. It also attempts to limit exposure to any one area of the
market that may be underperforming.
We establish target asset class weightings and underlying fund selections for the Fund and monitor the Fund on an ongoing basis. The underlying funds are actively managed by their respective management teams based on individual fund objectives, investment strategies and management techniques.
While the weightings of various underlying funds in the portfolio may vary from their targets during the year due to market movements, we rebalance the portfolio quarterly to maintain its target asset class allocations. There are also additional triggers in place to rebalance intra-quarter if allocations stray from a specified range.
Market conditions and your Fund
The year began with the advance of equities and commodities driven by indications of improving economic data and continued stimulus from global monetary authorities. Most sovereign bond markets fell during the first quarter of 2012 on signs of improving economic conditions, reduced economic strains in Europe and declining expectations for further Treasury bond purchase programs.
During April and May, risky asset gains from earlier in the year were eroded as a result of renewed fears arising from the ongoing European crisis coupled with weakening economic data in key markets. Government bonds once again fulfilled their role as safe haven assets as yields contracted in response to the weakness in risky assets.
In the third quarter, equity, fixed income and commodity markets all posted impressive results. Riskier assets, especially commodities, were able to stage a bounce back on expectations for
| Portfolio Composition | ||||||||||
| Asset Class | Target Allocation Range* | % of Total Net Assets as of 12/31/12 | ||||||||
| Balanced-Risk | 22.00 | % | 21.15 | % | ||||||
| Large-Cap Value | 19.48 | 19.41 | ||||||||
| International/Global Blend | 8.88 | 9.37 | ||||||||
| International/Global Growth | 8.17 | 8.29 | ||||||||
| Large-Cap Growth | 8.57 | 8.27 | ||||||||
| Emerging Markets | 7.10 | 7.29 | ||||||||
| Taxable Non-Investment Grade | 7.00 | 6.85 | ||||||||
| Large-Cap Blend | 6.03 | 5.98 | ||||||||
| Mid-Cap Blend | 4.62 | 4.75 | ||||||||
| Global Real Estate | 4.26 | 4.43 | ||||||||
| Small-Cap Blend | 3.91 | 3.93 | ||||||||
| Cash Equivalents Plus Other Assets Less Liabilities | 0.00 | 0.28 | ||||||||
| * | Total may not equal 100% due to rounding. |
| Total Net Assets | $883.1 million |
Fund Nasdaq Symbols | |||||
| Class A Shares | AADAX | ||||
| Class B Shares | AAEBX | ||||
| Class C Shares | AADCX | ||||
| Class R Shares | AADRX | ||||
| Class S Shares | AADSX | ||||
| Class Y Shares | AADYX | ||||
| Class R5 Shares | AADIX |
12 Invesco Allocation Funds
additional monetary easing and hope that Europe would be able to finally make headway on its lingering economic issues. Bond yields spiked twice during the third quarter, but managed to settle down as markets see-sawed between concerns over inflation and the continuing weakness in Europe.
The year ended with a lift in equities offset by declines in bonds and commodities. Investors had a host of political issues to navigate, including elections in the US, China and Japan; “fiscal cliff” negotiations in the US; and continuing concerns over European and Chinese economic growth. Equities were the lone bright spot while commodity markets were weighed down by concerns over falling demand and an improvement in crop yields. Government bond yields ultimately made their way higher as the market experienced both rallies and sell-offs.
Invesco Balanced-Risk Allocation Fund, Invesco Diversified Dividend Fund and Invesco Developing Markets Fund were the top contributors to absolute Fund performance for the reporting period. There were no absolute detractors from overall Fund performance. Relative to the Fund’s custom style-specific index, Invesco International Core Equity Fund, Invesco American Franchise Fund and Invesco International Growth Fund were the largest detractors from performance.
Please note that some of the underlying funds – which include, but are not limited to, Invesco Balanced-Risk Allocation Fund and Invesco Balanced-Risk Commodity Strategy Fund – may be primarily implemented with derivatives, which may create economic leverage in the underlying funds. Please note that our strategy is principally implemented with derivative instruments that include futures and total return swaps. Therefore, all or most of the performance of the strategy, both positive and negative, can be attributed to these instruments. Derivatives can be a more liquid and cost-effective way to gain exposure to asset classes. Additionally, the leverage used in the strategy is inherent in these instruments.
Finally, we thank you for your continued commitment to Invesco Growth Allocation Fund.
The views and opinions expressed in management’s discussion of Fund performance are those of Invesco Advisers, Inc. These views and opinions are subject to change at any time based on factors such as market and economic conditions. These views and opinions may not be relied upon as investment advice or recommendations, or as an offer for a particular security. The information is not a complete analysis of every aspect of any market, country, industry, security or the Fund. Statements of fact are from sources considered reliable, but Invesco Advisers, Inc. makes no representation or warranty as to their completeness or accuracy. Although historical performance is no guarantee of future results, these insights may help you understand our investment management philosophy.
See important Fund and, if applicable, index disclosures later in this report.
| Mark Ahnrud Chartered Financial Analyst, portfolio manager, is manager of Invesco Growth Allocation Fund. He | |
| joined Invesco in 2000. Mr. Ahnrud earned a BS in finance and investments from Babson College and an MBA from Duke University Fuqua School of Business. | ||
| Chris Devine Chartered Financial Analyst, portfolio manager, is manager of Invesco Growth Allocation Fund. He | |
joined Invesco in 1998. Mr. Devine earned a BA in economics from Wake Forest University and an MBA from the University of Georgia. | ||
| Scott Hixon Chartered Financial Analyst, portfolio manager, is manager of Invesco Growth Allocation Fund. He | |
| joined Invesco in 1994. Mr. Hixon earned a BBA in finance from Georgia Southern University and an MBA in finance from Georgia State University. | ||
| Christian Ulrich Chartered Financial Analyst, portfolio manager, is manager of Invesco Growth Allocation Fund. He | |
| joined Invesco in 2000. Mr. Ulrich earned the equivalent of a BBA from the KV Zurich Business School in Zurich, Switzerland. | ||
| Scott Wolle Chartered Financial Analyst, portfolio manager, is manager of Invesco Growth Allocation Fund. He | |
| joined Invesco in 1999. Mr. Wolle earned a BS in finance from Virginia Polytechnic Institute and State University and an MBA from Duke University Fuqua School of Business. | ||
Assisted by the Global Asset Allocation Team
13 Invesco Allocation Funds
Management’s Discussion of Fund Performance
Performance summary – Invesco Moderate Allocation Fund
For the year ended December 31, 2012, Invesco Moderate Allocation Fund, at net asset value (NAV), outperformed its custom style-specific benchmark. Positive absolute performance from global developed market equities drove results throughout the year. Commodities declined overall and experienced meaningful volatility. Government bonds produced positive absolute returns serving as safe haven during periods of heightened volatility, particularly in April and May of 2012.
Your Fund’s long-term performance appears later in this report.
Fund vs. Indexes
Total returns, 12/31/11 to 12/31/12, at net asset value (NAV). Performance shown does not include applicable contingent deferred sales charges (CDSC) or front-end sales charges, which would have reduced performance.
| Class A Shares | 13.18 | % | |||
| Class B Shares | 12.37 | ||||
| Class C Shares | 12.38 | ||||
| Class R Shares | 12.91 | ||||
| Class S Shares | 13.31 | ||||
| Class Y Shares | 13.46 | ||||
| Class R5 Shares* | 13.49 | ||||
| S&P 500 Index‚ (Broad Market Index) | 16.00 | ||||
| Custom Moderate Allocation Indexn (Style-Specific Index) | 11.84 | ||||
| Lipper Mixed-Asset Target Allocation Moderate Funds Index¿ (Peer Group Index) | 11.74 |
Source(s): ‚Invesco, S&P-Dow Jones via FactSet Research Systems Inc.; nInvesco, Lipper Inc.;
¿Lipper Inc.
*Effective September 24, 2012, Institutional Class shares were renamed Class R5 shares.
How we invest
Invesco Moderate Allocation Fund is intended for investors with moderate risk tolerance. The Fund invests in underlying funds diversified among asset classes (stocks, bonds and alternative asset classes), investment styles (value, blend/ core and growth), regions (domestic and international) and market capitalizations (small, mid and large). These underlying funds include stock funds, which represent approximately 48.88% of the portfolio; bond funds, which represent approximately 30.50% of the portfolio; and alternative funds such as global real estate, balanced-risk allocation and commodity funds that represent
approximately 20.62% of the portfolio.
The balanced-risk allocation underlying funds can shift exposures between equities, fixed income and commodities. The commodity underlying fund invests in instruments that provide exposure to the commodities market. They gain exposure to their underlying assets through the use of derivatives, including futures, swap agreements and commodity-linked notes.
While no fund can guarantee positive performance, the broad portfolio diversification strives to provide exposure to areas of the market that may perform well in any given period. It also attempts to limit exposure to any one area of the market that may be underperforming.
We establish target asset class weightings and underlying fund selections for the Fund and monitor the Fund on an ongoing basis. The underlying funds are actively managed by their respective management teams based on individual fund objectives, investment strategies and management techniques.
While the weightings of various underlying funds in the portfolio may vary from their targets during the year due to market movements, we rebalance the portfolio quarterly to maintain its target asset class allocations. There are also additional triggers in place to rebalance intra-quarter if allocations stray from a specified range.
Market conditions and your Fund
The year began with the advance of equities and commodities driven by indications of improving economic data and continued stimulus from global monetary authorities. Most sovereign bond markets fell during the first quarter of 2012 on signs of improving economic conditions, reduced economic strains in Europe and declining expectations for further Treasury bond purchase programs.
During April and May, risky asset gains from earlier in the year were eroded as a result of renewed fears arising from the ongoing European crisis coupled with weakening economic data in key markets. Government bonds once again fulfilled their role as safe haven assets as yields contracted in response to the weakness in risky assets.
In the third quarter, equity, fixed income and commodity markets all posted impressive results. Riskier assets, especially commodities, were able to stage a bounce back on expectations for additional monetary easing and hope
| Portfolio Composition | ||||||||||
| Asset Class | Target Allocation Range | % of Total Net Assets as of 12/31/12 | ||||||||
| Balanced-Risk | 17.50 | % | 16.91 | % | ||||||
| Large-Cap Value | 14.28 | 14.29 | ||||||||
| Taxable Non-Investment Grade | 12.71 | 12.65 | ||||||||
| Intermediate Term Taxable Investment Grade | 9.15 | 9.06 | ||||||||
| International/Global Blend | 6.50 | 6.90 | ||||||||
| International/Global Growth | 5.98 | 6.11 | ||||||||
| Large-Cap Growth | 6.27 | 6.10 | ||||||||
| Emerging Markets | 5.20 | 5.36 | ||||||||
| Large-Cap Blend | 4.41 | 4.39 | ||||||||
| Mid-Cap Blend | 3.38 | 3.50 | ||||||||
| Global Real Estate | 3.12 | 3.25 | ||||||||
| Small-Cap Blend | 2.86 | 2.90 | ||||||||
| Emerging Markets Fixed Income | 2.44 | 2.48 | ||||||||
| Cash Equivalents Plus Other Assets Less Liabilities | 6.20 | 6.10 | ||||||||
| Total Net Assets | $802.3 million |
Fund Nasdaq Symbols | |||||
Class A Shares | AMKAX | ||||
Class B Shares | AMKBX | ||||
Class C Shares | AMKCX | ||||
Class R Shares | AMKRX | ||||
Class S Shares | AMKSX | ||||
Class Y Shares | ABKYX | ||||
Class R5 Shares | AMLIX |
14 Invesco Allocation Funds
that Europe would be able to finally make headway on its lingering economic issues. Bond yields spiked twice during the third quarter, but managed to settle down as markets see-sawed between concerns over inflation and the continuing weakness in Europe.
The year ended with a lift in equities offset by declines in bonds and commodities. Investors had a host of political issues to navigate, including elections in the US, China and Japan; “fiscal cliff” negotiations in the US; and continuing concerns over European and Chinese economic growth. Equities were the lone bright spot while commodity markets were weighed down by concerns over falling demand and an improvement in crop yields. Government bond yields ultimately made their way higher as the market experienced both rallies and sell-offs.
Invesco Balanced-Risk Allocation Fund, Invesco Diversified Dividend Fund and Invesco Developing Markets Fund were the top contributors to absolute Fund performance for the reporting period. There were no absolute detractors from overall Fund performance. Relative to the Fund’s custom style-specific index, Invesco International Core Equity Fund, Invesco American Franchise Fund and Invesco International Growth Fund were the largest detractors from performance.
Please note that some of the underlying funds – which include, but are not limited to, Invesco Balanced-Risk Allocation Fund, Invesco Balanced-Risk Commodity Strategy Fund and Invesco Core Plus Bond Fund – may be primarily implemented with derivatives, which may create economic leverage in the underlying funds. Please note that our strategy is principally implemented with derivative instruments that include futures and total return swaps. Therefore, all or most of the performance of the strategy, both positive and negative, can be attributed to these instruments. Derivatives can be a more liquid and cost-effective way to gain exposure to asset classes. Additionally, the leverage used in the strategy is inherent in these instruments.
Finally, we thank you for your continued commitment to Invesco Moderate Allocation Fund.
The views and opinions expressed in management’s discussion of Fund performance are those of Invesco Advisers, Inc. These views and opinions are subject to change at any time based on factors such as market and economic conditions. These views and opinions may not be relied upon as investment advice or recommendations, or as an offer for a particular security. The information is not a complete analysis of every aspect of any market, country, industry, security or the Fund. Statements of fact are from sources considered reliable, but Invesco Advisers, Inc. makes no representation or warranty as to their completeness or accuracy. Although historical performance is no guarantee of future results, these insights may help you understand our investment management philosophy.
See important Fund and, if applicable, index disclosures later in this report.
| Mark Ahnrud Chartered Financial Analyst, portfolio manager, is manager of Invesco Moderate Allocation Fund. He | |
| joined Invesco in 2000. Mr. Ahnrud earned a BS in finance and investments from Babson College and an MBA from Duke University Fuqua School of Business. | ||
| Chris Devine Chartered Financial Analyst, portfolio manager, is manager of Invesco Moderate Allocation Fund. He | |
| joined Invesco in 1998. Mr. Devine earned a BA in economics from Wake Forest University and an MBA from the University of Georgia. | ||
| Scott Hixon Chartered Financial Analyst, portfolio manager, is manager of Invesco Moderate Allocation Fund. He | |
| joined Invesco in 1994. Mr. Hixon earned a BBA in finance from Georgia Southern University and an MBA in finance from Georgia State University. | ||
| Christian Ulrich Chartered Financial Analyst, portfolio manager, is manager of Invesco Moderate Allocation Fund. He | |
| joined Invesco in 2000. Mr. Ulrich earned the equivalent of a BBA from the KV Zurich Business School in Zurich, Switzerland. | ||
| Scott Wolle Chartered Financial Analyst, portfolio manager, is manager of Invesco Moderate Allocation Fund. He | |
| joined Invesco in 1999. Mr. Wolle earned a BS in finance from Virginia Polytechnic Institute and State University and an MBA from Duke University Fuqua School of Business. | ||
Assisted by the Global Asset Allocation Team
15 Invesco Allocation Funds
Invesco Conservative Allocation Fund’s investment objective is total return consistent with a lower level of risk relative to the broad stock market.
Invesco Growth Allocation Fund’s investment objective is long-term growth of capital consistent with a higher level of risk relative to the broad stock market.
Invesco Moderate Allocation Fund’s investment objective is total return consistent with a moderate level of risk relative to the broad stock market.
| n | Unless otherwise stated, information presented in this report is as of December 31, 2012, and is based on total net assets. |
| n | Unless otherwise noted, all data provided by Invesco. |
| n | To access your Fund’s reports/prospectus, visit invesco.com/fundreports. |
About share classes
| n | Class B shares may not be purchased for new or additional investments. Please see the prospectus for more information. |
| n | Class R shares are generally available only to employer sponsored retirement and benefit plans. Please see the prospectus for more information. |
| n | Class S shares and Class Y shares are available only to certain investors. Please see the prospectus for more information. |
| n | Class R5 shares are primarily intended for employer sponsored retirement and benefit plans that meet certain standards and for institutional investors. On September 24, 2012, Institutional Class shares were renamed Class R5 shares. Please see the prospectus for more information. |
Principal risks of investing in the Funds
| Invesco Conservative Allocation Fund | Invesco Growth | Invesco Moderate | |||||||||||||
| Call risk | X | X | |||||||||||||
| Commodity-linked notes risk | X | X | X | ||||||||||||
| Commodity risk | X | X | X | ||||||||||||
| Concentration risk | X | X | X | ||||||||||||
| Convertible securities risk | X | ||||||||||||||
| Counterparty risk | X | X | X | ||||||||||||
| Credit risk | X | X | X | ||||||||||||
| Currency/exchange rate risk | X | X | X | ||||||||||||
| Debt securities risk | X | ||||||||||||||
| Derivatives risk | X | X | X | ||||||||||||
| Developing/emerging markets securities risk | X | X | X | ||||||||||||
| Dollar roll transactions risk | X | X | |||||||||||||
| Exchange-traded funds risk | X | X | X | ||||||||||||
| Exchange-traded notes risk | X | X | X | ||||||||||||
| Financial institutions risk | X | ||||||||||||||
| Foreign securities risk | X | X | X | ||||||||||||
| Fund of funds risk | X | X | X | ||||||||||||
| Geographic focus risk | X | ||||||||||||||
| Growth investing risk | X | ||||||||||||||
| High yield bond (junk bond) risk | X | X | X | ||||||||||||
| Indexing risk | X | ||||||||||||||
| Investing in the European Union risk | X | ||||||||||||||
| Interest rate risk | X | X | X | ||||||||||||
| Issuer-specific changes risk | X | ||||||||||||||
| Large investor risk | X | ||||||||||||||
| Leverage risk | X | X | X | ||||||||||||
| Liquidity risk | X | X | X | ||||||||||||
| Management risk | X | X | X | ||||||||||||
| Market risk | X | X | X | ||||||||||||
| Market Trading risk | X | ||||||||||||||
| Mortgage- and asset-backed securities risk | X | X | X | ||||||||||||
16 Invesco Allocation Funds
| Invesco Conservative Allocation Fund | Invesco Growth | Invesco Moderate | |||||||||||||
| Non-correlation risk | X | X | |||||||||||||
| Non-diversification risk | X | X | X | ||||||||||||
| Preferred securities risk | X | ||||||||||||||
| Reinvestment risk | X | X | X | ||||||||||||
| REIT risk/real estate risk | X | ||||||||||||||
| Small- and mid-capitalization risk | X | ||||||||||||||
| Subsidiary risk | X | X | X | ||||||||||||
| Synthetic securities risk | X | X | |||||||||||||
| Tax risk | X | X | X | ||||||||||||
| US government obligations risk | X | X | X | ||||||||||||
| Value investing style risk | X | ||||||||||||||
Principal risks defined
| n | Call risk. If interest rates fall, it is possible that issuers of debt securities with high interest rates will prepay or call their securities before their maturity dates. In this event, the proceeds from the called securities would likely be reinvested by an underlying fund in securities bearing the new, lower interest rates, resulting in a possible decline in an underlying funds income and distributions to shareholders. |
| n | Commodity-linked notes risk. An underlying fund’s investments in commodity-linked notes may involve substantial risks, including risk of loss of a significant portion of their principal value. In addition to risks associated with the underlying commodities, they may be subject to additional special risks, such as the lack of a secondary trading market and temporary price distortions due to speculators and/or the continuous rolling over of futures contracts underlying the notes. Commodity-linked notes are also subject to counterparty risk, which is the risk that the other party to the contract will not fulfill its contractual obligation to complete the transaction with an underlying Fund. |
| n | Commodity risk. Certain of the underlying fund’s and Invesco Cayman Commodity Fund I Ltd. or Invesco Cayman Commodity Fund III Ltd., each a wholly-owned subsidiary of certain underlying funds organized under the laws of Cayman Islands (each a Subsidiary) investment exposure to the commodities markets and/or a particular sector of the commodities markets, may subject the underlying fund and |
the Subsidiary to greater volatility than investments in traditional securities, such as stocks and bonds. The commodities markets may fluctuate widely based on a variety of factors, including changes in overall market movements, domestic and foreign political and economic events and policies, war, acts of terrorism, changes in domestic or foreign interest rates and/or investor expectations concerning interest rates, domestic and foreign inflation rates and investment and trading activities of mutual funds, hedge funds and commodities funds. Prices of various commodities may also be affected by factors such as drought, floods, weather, livestock disease, embargoes, tariffs and other regulatory developments. The prices of commodities can also fluctuate widely due to supply and demand disruptions in major producing or consuming regions. Because certain of the underlying fund’s and the Subsidiary’s performance are linked to the performance of potentially volatile commodities, investors should be willing to assume the risks of potentially significant fluctuations in the value of the underlying fund’s shares.
| n | Concentration risk. To the extent, an underlying fund invests a greater amount in any one sector or industry, an underlying fund’s performance will depend to a greater extent on the overall condition of the sector or industry, and there is increased risk to an underlying fund if conditions adversely affect that sector or industry. |
| n | Convertible securities risk. An underlying fund may own convertible securities, the value of which may be affected |
This report must be accompanied or preceded by a currently effective Fund prospectus, which contains more complete information, including sales charges and expenses. Investors should read it carefully before investing.
NOT FDIC INSURED | MAY LOSE VALUE | NO BANK GUARANTEE
by market interest rates, the risk that the issuer will default, the value of the underlying stock or the right of the issuer to buy back the convertible securities.
| n | Counterparty risk. Counterparty risk is the risk that the other party to the contract will not fulfill its contractual obligations, which may cause losses or additional costs to an underlying fund. |
| n | Credit risk. The issuer of instruments in which the underlying fund invests may be unable to meet interest and/or principal payments, thereby causing its instruments to decrease in value and lowering the issuer’s credit rating. |
| n | Currency/exchange rate risk. The dollar value of an underlying fund’s foreign investments will be affected by changes in the exchange rates between the dollar and the currencies in which those investments are traded. |
| n | Debt securities risk. An underlying fund may invest in debt securities that are affected by changing interest rates and changes in their effective maturities and credit quality. |
| n | Derivatives risk. The performance of derivative instruments is tied to the performance of an underlying currency, security, index or other instrument. In addition to risks relating to their underlying instruments, the use of derivatives may include other, possibly greater, risks. Derivatives involve costs, may be volatile, and may involve a small initial investment relative to the risk assumed. Risks associated with the use of derivatives include counterparty, leverage, correlation, liquidity, tax, market, interest rate and management risks. Derivatives may also be more difficult to purchase, sell or value than other investments. The Fund may lose more than the cash amount invested on investments in derivatives. |
Investors should bear in mind that, while the Fund intends to use derivative
continued on page 18
17 Invesco Allocation Funds
continued from page 17
strategies, it is not obligated to actively engage in these transactions, generally or in any particular kind of derivative, if the investment manager elects not to do so due to availability, cost, market conditions or other factors. |
| n | Developing/emerging markets securities risk. Securities issued by foreign companies and governments located in developing/emerging countries may be affected more negatively by inflation, devaluation of their currencies, higher transaction costs, delays in settlement, adverse political developments, the introduction of capital controls, withholding taxes, nationalization of private assets, expropriation, social unrest, war or lack of timely information than those in developed countries |
| n | Dollar roll transactions risk. Dollar roll transactions involve the risk that the market value and yield of the securities retained by an underlying fund may decline below the price of the mortgage-related securities sold by the underlying fund that it is obligated to repurchase. |
| n | Exchange-traded funds (ETFs) risk. An investment by the Fund or underlying fund in ETFs generally presents the same primary risks as an investment in a mutual fund. In addition, an ETF may be subject to the following: (1) a discount of the exchange-traded fund’s shares to its net asset value; (2) failure to develop an active trading market for the exchange-traded fund’s shares; (3) the listing exchange halting trading of the exchange-traded fund’s shares; (4) failure of the exchange-traded fund’s shares to track the referenced index; and (5) holding troubled securities in the referenced index. ETFs may involve duplication of management fees and certain other expenses, as the Fund or underlying fund indirectly bears its proportionate share of any expenses paid by the ETFs in which it invests. Further, certain of the ETFs in which the Fund or underlying fund may invest are leveraged. The more the Fund or underlying fund invests in such leveraged ETFs, the more this leverage will magnify any losses on those investments. |
| n | Exchange-traded notes (ETNs) risk. ETNs are subject to credit risk, including the credit risk of the issuer, and the value of the ETN may drop due to a downgrade in the issuer’s credit rating, despite the underlying market benchmark or strategy remaining unchanged. The value of an ETN may also be influenced by time to maturity, level of supply and demand for the ETN, volatility and lack of liquidity in the |
underlying market, changes in the applicable interest rates, changes in the issuer’s credit rating, and economic, legal, political, or geographic events that affect the referenced underlying market or strategy. ETNs are also subject to counterparty risk. |
| n | Financial institutions risk. Investments in financial institutions may be subject to certain risks, including, but not limited to, the risk of regulatory actions, changes in interest rates and concentration of loan portfolios in an industry or sector. Financial institutions are highly regulated and may suffer setbacks should regulatory rules and interpretations under which they operate change. Likewise, there is a high level of competition among financial institutions which could adversely affect the viability of an institution. |
| n | Foreign securities risk. An underlying fund’s foreign investments may be affected by changes in a foreign country’s exchange rates, political and social instability; changes in economic or taxation policies, difficulties when enforcing obligations, decreased liquidity, and increased volatility. Foreign companies may be subject to less regulation resulting in less publicly available information about the companies. |
| n | Fund of funds risk. The Fund’s performance depends on the underlying funds in which it invests, and it is subject to the risks of the underlying funds. Market fluctuations may change the target weightings in the underlying funds. The underlying funds may change their investment objectives, policies or practices and may not achieve their investment objectives, all of which may cause the Fund to withdraw its investments therein at a disadvantageous time. |
| n | Geographic focus risk. From time to time an underlying fund may invest a substantial amount of its assets in securities of issuers located in a single country or a limited number of countries. If an underlying fund focuses its investments in this manner, it assumes the risk that economic, political and social conditions in those countries will have a significant impact on its investment performance. An underlying fund’s investment performance may also be more volatile if it focuses its investments in certain countries, especially emerging market countries. |
| n | Growth investing risk. Growth stocks tend to be more expensive relative to their earnings or assets compared with other types of stock. As a result they tend to be more sensitive to changes in their earnings and can be more volatile. |
| n | High yield bond (junk bond) risk. Junk bonds involve a greater risk of default or price changes due to changes in the credit quality of the issuer. The values of junk bonds fluctuate more than those of high-quality bonds in response to company, political, regulatory or economic developments. Values of junk bonds can decline significantly over short periods of time. |
| n | Indexing risk. Unlike many investment companies, an underlying fund does not utilize an investing strategy that seeks returns in excess of the underlying index. Therefore, it would not necessarily sell a security unless that security is removed from the underlying index. |
| n | Interest rate risk. Interest rate risk refers to the risk that bond prices generally fall as interest rates rise; conversely, bond prices generally rise as interest rates fall. Specific bonds differ in their sensitivity to changes in interest rates depending on their individual characteristics, including duration. |
| n | Investing in the European Union risk. Many countries in the European Union are susceptible to high economic risks associated with high levels of debt, notably due to investments in sovereign debts of European countries such as Greece, Italy and Spain. One or more member states might exit the European Union, placing its currency and banking system in jeopardy. The European Union faces major issues involving its membership, structure, procedures and policies, including the adoption, abandonment or adjustment of the new constitutional treaty, the European Union’s enlargement to the south and east, and resolution of the European Union’s problematic fiscal and democratic accountability. Efforts of the member states to further unify their economic and monetary policies may increase the potential for the downward movement of one member state’s market to cause a similar effect on other member states’ markets. European countries that are part of the European Economic and Monetary Union may be significantly affected by the tight fiscal and monetary controls that the union seeks to impose on its members. |
| n | Issuer-specific changes risk. The value of an individual security or particular type of security can be more volatile than the market as a whole and can perform differently from the value of the market as a whole. |
| n | Large investor risk. An underlying fund may accept investments from funds of funds, as well as from similar |
18 Invesco Allocation Funds
investment vehicles, such as 529 Plans. From time to time, an underlying fund may experience large investments or redemptions due to allocations or rebalancing by these funds of funds and/or similar investment vehicles. While it is impossible to predict the overall impact of these transactions over time, there could be adverse effects on portfolio management. For example, an underlying fund may be required to sell securities or invest cash at times when it would not otherwise do so. These transactions could also have tax consequences if sales of securities result in gains, and could also increase transaction costs or portfolio turnover. |
| n | Leverage risk. Leverage exists when an underlying fund purchases or sells an instrument or enters into a transaction without investing cash in an amount equal to the full economic exposure of the instrument or transaction and the underlying fund could lose more than it invested. Leverage created from borrowing or certain types of transactions or instruments may impair an underlying fund’s liquidity, cause it to liquidate positions at an unfavorable time, increase volatility or otherwise not achieve its intended objective. |
| n | Liquidity risk. An underlying fund may hold illiquid securities that it is unable to sell at the preferred time or price and could lose its entire investment in such securities. |
| n | Management risk. The investment techniques and risk analysis used by the Fund’s and the underlying funds’ portfolio managers may not produce the desired results. |
| n | Market risk. The prices of and the income generated by an underlying fund’s securities may decline in response to, among other things, investor sentiment, general economic and market conditions, regional or global instability, and currency and interest rate fluctuations. |
| n | Market trading risk. Risk is inherent in all investing. An investment in an underlying fund involves risks similar to those of investing in any underlying fund of equity or fixed-income securities traded on exchanges. You should anticipate that the value of the shares will decline, more or less, in correlation with any decline in value of the underlying index of certain underlying exchange-traded funds. |
| n | Mortgage- and asset-backed securities risk. Certain of the underlying funds may invest in mortgage and asset-backed securities that are subject to |
prepayment or call risk, which is the risk that the borrower’s payments may be received earlier or later than expected due to changes in prepayment rates on underlying loans. Faster prepayments often happen when interest rates are falling. As a result, an underlying fund may reinvest these early payments at lower interest rates, thereby reducing the underlying fund’s income. Conversely, when interest rates rise, prepayments may happen more slowly, causing the security to lengthen in duration. Longer duration securities tend to be more volatile. Securities may be prepaid at a price less than the original purchase value. An unexpectedly high rate of defaults on the mortgages held by a mortgage pool may adversely affect the value of mortgage-backed securities and could result in losses to an underlying fund. The risk of such defaults is generally higher in the case of mortgage pools that include subprime mortgages. Subprime mortgages refer to loans made to borrowers with weakened credit histories or with lower capacity to make timely payments on their mortgages.
| n | Non-correlation risk. An underlying fund’s return may not match the return of the underlying index of certain underlying exchange-traded funds for a number of reasons. For example, the Fund incurs operating expenses not applicable to the underlying index, and incurs costs in buying and selling securities, especially when rebalancing an underlying fund’s securities holdings to reflect changes in the composition of an underlying index of certain underlying exchange-traded funds. In addition, the performance of an underlying fund and an underlying index of certain underlying exchange-traded funds may vary due to asset valuation differences and differences between an underlying fund’s portfolio and the underlying index of certain underlying exchange-traded funds resulting from legal restrictions, cost or liquidity constraints. |
| n | Non-diversification risk. Certain of the underlying funds are non-diversified and can invest a greater portion of their assets in a single issuer. A change in the value of the issuer could affect the value of an underlying fund more than if it was a diversified fund. |
| n | Preferred securities risk. There are special risks associated with investing in preferred securities. Preferred securities may include provisions that permit the issuer, in its discretion, to defer or omit distributions for a certain period of |
time. If an underlying fund owns a security that is deferring or omitting its distributions, an underlying fund may be required to report the distribution on its tax returns, even though it may not have received this income. Further, preferred securities may lose substantial value due to the omission or deferment of dividend payments.
| n | Reinvestment risk. Reinvestment risk is the risk that a bond’s cash flows (coupon income and principal repayment) will be reinvested at an interest rate below that on the original bond. |
| n | REIT risk/real estate risk. Investments in real-estate related instruments may be affected by economic, legal, cultural, environmental or technological factors that affect property values, rents or occupancies of real estate related to and underlying fund’s holdings. Real estate companies, including REITs or similar structures, tend to be small and mid cap companies, and their shares may be more volatile and less liquid. The value of investments in real estate related companies may be affected by the quality of management, the ability to repay loans, the utilization of leverage and financial covenants related thereto, whether the company carries adequate insurance and environmental factors. If a real estate related company defaults, an underlying fund may own real estate directly, which involves the following additional risks: environmental liabilities, difficulty in valuing and selling the real estate, and economic or regulatory changes. |
| n | Small- and mid-capitalization risk. Stocks of small and mid-sized companies tend to be more vulnerable to adverse developments in the above factors and may have little or no operating history or track record of success, and limited product lines, markets, management and financial resources. The securities of small and mid-sized companies may be more volatile due to less market interest and less publicly available information about the issuer. They also may be illiquid or restricted as to resale, or may trade less frequently and in smaller volumes, all of which may cause difficulty when establishing or closing a position at a desirable price. |
| n | Subsidiary risk. By investing in the Subsidiary, an underlying fund is indirectly exposed to risks associated with the Subsidiary’s investments. The Subsidiary is not registered under the Investment Company Act of 1940 (1940 Act), and except as otherwise noted in this prospectus, is not subject |
continued on page 20
19 Invesco Allocation Funds
continued from page 19
to the investor protections of the 1940 Act. Changes in the laws of the United States and/or the Cayman Islands, under which the underlying fund and the Subsidiary, respectively, are organized, could result in the inability of the underlying fund and/or the Subsidiary to operate as described in the underlying fund prospectus and SAI and could negatively affect the underlying fund and its shareholders. |
| n | Synthetic securities risk. Fluctuations in the values of synthetic securities may not correlate perfectly with the instruments they are designed to replicate. Synthetic securities may be subject to interest rate changes, market price fluctuations, counterparty risk and liquidity risk. |
| n | Tax risk. The tax treatment of commodity-linked derivative instruments may be adversely affected by changes in legislation, regulations or other legally binding authority. If, as a result of any such adverse action, the income of Invesco Balanced-Risk Allocation Fund, an underlying fund, from certain commodity-linked derivatives was treated as non-qualifying income, Invesco Balanced-Risk Allocation Fund might fail to qualify as a regulated investment company and be subject to federal income tax at the fund level. Invesco Balanced-Risk Allocation Fund has received private letter rulings from the Internal Revenue Service confirming that income derived from its investments in the Subsidiary and a form of commodity-linked note constitutes qualifying income to Invesco Balanced-Risk Allocation Fund. However, the Internal Revenue Service has suspended issuance of any further private letter rulings pending a review of its position. Should the Internal Revenue Service issue guidance, or Congress enact legislation, that adversely affects the tax treatment of Invesco Balanced-Risk Allocation Fund’s use of commodity-linked notes, or the Subsidiary, it could limit its ability to pursue its investment strategy. In this event, Invesco Balanced-Risk Allocation Fund’s Board of Trustees may authorize a significant change in investment strategy or Fund liquidation. Invesco Balanced-Risk Allocation Fund also may incur transaction and other costs to comply with any new or additional guidance from the Internal Revenue Service. |
| n | US government obligations risk. The Fund may invest in obligations issued by US government agencies and instrumentalities that may receive varying |
levels of support from the government, which could affect an underlying fund’s ability to recover should they default.
| n | Value investing risk. Certain underlying funds emphasize a value style of investing, which focuses on undervalued companies with characteristics for improved valuations. This style of investing is subject to the risk that the valuations never improve or that the returns on value equity securities are less than returns on other styles of investing or the overall stock market. Value stocks also may decline in price, even though in theory they are already underpriced. |
About indexes used in this report
| n | The S&P 500® Index is an unmanaged index considered representative of the US stock market. |
| n | The Custom Conservative Allocation Index, created by Invesco to serve as a benchmark for Invesco Conservative Allocation Fund, is composed of the S&P 500, the MSCI EAFE® and the Barclays U.S. Aggregate indexes. The composition of the index may change from time to time based on the target asset allocation of the Fund. Therefore, the current composition of the index does not reflect its historical composition and will likely be altered in the future to better reflect the objective of the Fund. |
| n | The Lipper Mixed-Asset Target Allocation Conservative Funds Index is an unmanaged index considered representative of mixed-asset target allocation conservative funds tracked by Lipper. |
| n | The MSCI EAFE® Index is an unmanaged index considered representative of stocks of Europe, Australasia and the Far East. |
| n | The Barclays U.S. Aggregate Index is an unmanaged index considered representative of the US investment-grade, fixed-rate bond market. |
| n | The Custom Growth Allocation Index, created by Invesco to serve as a benchmark for Invesco Growth Allocation Fund, comprises the S&P 500, MSCI EAFE and Barclays U.S. Aggregate indexes. The composition of the index may change from time to time based on the Fund’s target asset allocation. Therefore, the current composition of the index does not reflect its historical composition and will likely be altered in the future to better reflect the objective of the Fund. |
| n | The Lipper Multi-Cap Core Funds Index is an unmanaged index considered representative of multicap core |
funds tracked by Lipper. |
| n | The Custom Moderate Allocation Index, created by Invesco to serve as a benchmark for Invesco Moderate Allocation Fund, comprises the S&P 500, MSCI EAFE and Barclays U.S. Aggregate indexes. The composition of the index may change from time to time based on the Fund’s target asset allocation. Therefore, the current composition of the index does not reflect its historical composition and will likely be altered in the future to better reflect the objective of the Fund. |
| n | The Lipper Mixed-Asset Target Allocation Moderate Funds Index is an unmanaged index considered representative of mixed-asset target allocation moderate funds tracked by Lipper. |
| n | The Fund is not managed to track the performance of any particular index, including the index(es) defined here, and consequently, the performance of the Fund may deviate significantly from the performance of the index(es). |
| n | A direct investment cannot be made in an index. Unless otherwise indicated, index results include reinvested dividends, and they do not reflect sales charges. Performance of the peer group, if applicable, reflects fund expenses; performance of a market index does not. |
Other information
| n | The returns shown in management’s discussion of Fund performance are based on net asset values calculated for shareholder transactions. Generally accepted accounting principles require adjustments to be made to the net assets of the Fund at period end for financial reporting purposes, and as such, the net asset values for shareholder transactions and the returns based on those net asset values may differ from the net asset values and returns reported in the Financial Highlights. |
| n | Invesco Distributors, Inc. is the distributor of the PowerShares Exchange-Traded Fund Trust II. Invesco PowerShares Capital Management LLC and Invesco Distributors, Inc. are indirect, wholly owned subsidiaries of Invesco Ltd. Shares of PowerShares 1–30 Laddered Treasury Portfolio are not individually redeemable, and owners of the Shares may acquire those Shares from the Fund and tender those Shares for redemption to the Fund in Creation Units only, typically consisting of aggregations of 50,000 shares. |
20 Invesco Allocation Funds
Schedule of Investments
December 31, 2012
Invesco Conservative Allocation Fund
Schedule of Investments in Affiliated Issuers–100.09%(a)
| % of Net Assets 12/31/12 | Value 12/31/11 | Purchases at Cost | Proceeds from Sales | Change in Unrealized Appreciation (Depreciation) | Realized Gain (Loss) | Dividend Income | Shares 12/31/12 | Value 12/31/12 | ||||||||||||||||||||||||||||
Asset Allocation Funds–13.09% |
| |||||||||||||||||||||||||||||||||||
Invesco Balanced-Risk Allocation Fund | 9.40 | % | $ | 27,965,029 | $ | 2,886,615 | $ | (682,846 | ) | $ | 1,458,931 | $ | 907,114 | $ | 754,130 | 2,529,316 | $ | 31,692,331 | ||||||||||||||||||
Invesco Balanced-Risk Commodity Strategy Fund | 3.69 | % | 11,782,064 | 1,961,322 | (1,570,198 | ) | 189,212 | 96,090 | 262,561 | 1,208,389 | 12,458,490 | |||||||||||||||||||||||||
Total Asset Allocation Funds | 39,747,093 | 4,847,937 | (2,253,044 | ) | 1,648,143 | 1,003,204 | 1,016,691 | 44,150,821 | ||||||||||||||||||||||||||||
Domestic Equity Funds–19.26% |
| |||||||||||||||||||||||||||||||||||
Invesco American Franchise Fund | 3.76 | % | 11,477,896 | 1,596,055 | (2,007,414 | ) | 1,445,978 | 180,140 | 49,889 | 1,001,788 | 12,692,655 | |||||||||||||||||||||||||
Invesco Charter Fund | 2.73 | % | 8,160,396 | 729,587 | (680,573 | ) | 930,615 | 67,464 | 136,111 | 498,780 | 9,207,489 | |||||||||||||||||||||||||
Invesco Comstock Fund | 2.54 | % | 7,633,540 | 742,835 | (1,111,732 | ) | 1,174,514 | 136,966 | 159,413 | 481,805 | 8,576,123 | |||||||||||||||||||||||||
Invesco Diversified Dividend Fund | 4.18 | % | 12,590,644 | 1,020,751 | (1,216,052 | ) | 1,562,406 | 336,210 | 296,279 | 1,045,436 | 14,082,019 | |||||||||||||||||||||||||
Invesco Endeavor Fund | 2.15 | % | 6,326,491 | 1,360,444 | (976,743 | ) | 376,612 | 814,038 | 29,570 | 409,541 | 7,260,880 | |||||||||||||||||||||||||
Invesco Growth and Income Fund | 2.11 | % | 6,504,384 | 443,290 | (687,263 | ) | 753,440 | 84,635 | 139,306 | 338,507 | 7,098,486 | |||||||||||||||||||||||||
Invesco Small Cap Equity Fund | 1.79 | % | 5,342,125 | 775,614 | (621,103 | ) | 440,824 | 345,971 | — | 434,007 | 6,041,379 | |||||||||||||||||||||||||
Total Domestic Equity Funds | 58,035,476 | 6,668,576 | (7,300,880 | ) | 6,684,389 | 1,965,424 | 810,568 | 64,959,031 | ||||||||||||||||||||||||||||
Fixed-Income Funds–54.07% |
| |||||||||||||||||||||||||||||||||||
Invesco Core Plus Bond Fund | 24.35 | % | 75,409,626 | 8,878,419 | (5,254,812 | ) | 3,168,143 | (91,432 | ) | 3,163,460 | 7,471,332 | 82,109,944 | ||||||||||||||||||||||||
Invesco Emerging Market Local Currency Debt Fund | 3.34 | % | 8,963,952 | 2,269,796 | (1,181,232 | ) | 1,312,529 | (53,874 | ) | 368,184 | 1,112,674 | 11,260,263 | ||||||||||||||||||||||||
Invesco Floating Rate Fund | 5.45 | % | 16,740,960 | 1,780,774 | (934,505 | ) | 838,908 | (31,785 | ) | 933,843 | 2,337,275 | 18,394,352 | ||||||||||||||||||||||||
Invesco High Yield Fund | 4.99 | % | 15,168,622 | 1,216,859 | (1,165,838 | ) | 1,638,183 | (32,201 | ) | 992,296 | 3,798,110 | 16,825,625 | ||||||||||||||||||||||||
Invesco Premium Income Fund | 3.95 | % | 12,346,639 | 1,682,493 | (1,462,334 | ) | 723,456 | 215,507 | 690,134 | 1,245,569 | 13,315,136 | |||||||||||||||||||||||||
PowerShares 1-30 Laddered Treasury Portfolio–ETF | 11.99 | % | 38,158,744 | 7,123,870 | (5,107,191 | ) | (139,359 | ) | 528,916 | 816,967 | 1,240,400 | 40,437,040 | ||||||||||||||||||||||||
Total Fixed-Income Funds | 166,788,543 | 22,952,211 | (15,105,912 | ) | 7,541,860 | 535,131 | 6,964,884 | 182,342,360 | ||||||||||||||||||||||||||||
Foreign Equity Funds–11.33% |
| |||||||||||||||||||||||||||||||||||
Invesco Developing Markets Fund | 3.31 | % | 9,261,273 | 1,454,290 | (1,420,281 | ) | 1,822,666 | 38,971 | 127,825 | 329,794 | 11,156,919 | |||||||||||||||||||||||||
Invesco International Core Equity Fund | 4.26 | % | 11,474,001 | 3,016,868 | (1,742,534 | ) | 1,924,544 | (304,837 | ) | 346,432 | 1,388,217 | 14,368,042 | ||||||||||||||||||||||||
Invesco International Growth Fund | 3.76 | % | 10,830,312 | 1,543,500 | (1,309,725 | ) | 1,630,734 | 6,460 | 166,010 | 434,975 | 12,701,281 | |||||||||||||||||||||||||
Total Foreign Equity Funds | 31,565,586 | 6,014,658 | (4,472,540 | ) | 5,377,944 | (259,406 | ) | 640,267 | 38,226,242 | |||||||||||||||||||||||||||
Real Estate Funds–2.02% |
| |||||||||||||||||||||||||||||||||||
Invesco Global Real Estate Fund | 2.02 | % | 5,799,801 | 640,166 | (940,385 | ) | 1,236,806 | 65,565 | 289,716 | 582,858 | 6,801,953 | |||||||||||||||||||||||||
Money Market Funds–0.32% |
| |||||||||||||||||||||||||||||||||||
Liquid Assets Portfolio–Institutional Class | 0.16 | % | 1,443,743 | 16,285,665 | (17,199,143 | ) | — | — | 1,149 | 530,265 | 530,265 | |||||||||||||||||||||||||
Premier Portfolio–Institutional Class | 0.16 | % | 1,443,744 | 16,285,665 | (17,199,143 | ) | — | — | 876 | 530,266 | 530,266 | |||||||||||||||||||||||||
Total Money Market Funds | 2,887,487 | 32,571,330 | (34,398,286 | ) | — | — | 2,025 | 1,060,531 | ||||||||||||||||||||||||||||
TOTAL INVESTMENTS IN AFFILIATED ISSUERS | 100.09 | % | $ | 304,823,986 | $ | 73,694,878 | $ | (64,471,047 | ) | $ | 22,489,142 | (b) | $ | 3,309,918 | (c) | $ | 9,724,151 | $ | 337,540,938 | |||||||||||||||||
OTHER ASSETS LESS LIABILITIES | (0.09 | )% | (300,244 | ) | ||||||||||||||||||||||||||||||||
NET ASSETS | 100.00 | % | $ | 337,240,694 | ||||||||||||||||||||||||||||||||
Investment Abbreviations:
ETF – Exchange-Traded Fund
Notes to Schedule of Investments:
| (a) | Each underlying fund and the Fund are affiliated by either having the same investment adviser or an investment adviser under common control with the Fund’s investment adviser. Effective September 24, 2012, the Fund began investing in Class R6 shares. The Fund invests in Class R6 shares of the mutual funds listed and the Fund shares of the exchange-traded fund. |
| (b) | Includes $29,481 and $126,064 of return of capital from Invesco Emerging Market Local Currency Debt Fund and PowerShares 1-30 Laddered Treasury Portfolio—ETF. |
| (c) | Includes $842,512, $211,940, $639,962, $242,052, $21,427, $190,625 and $1,876 of capital gains from Invesco Balanced-Risk Allocation Fund, Invesco Diversified Dividend Fund, Invesco Endeavor Fund, Invesco Small Cap Equity Fund, Invesco Emerging Market Local Currency Debt Fund, Invesco Premium Income Fund and PowerShares 1-30 Laddered Treasury Portfolio—ETF, respectively. |
See accompanying Notes to Financial Statements which are an integral part of the financial statements.
21 Invesco Allocation Funds
Schedule of Investments—(continued)
December 31, 2012
Invesco Growth Allocation Fund
Schedule of Investments in Affiliated Issuers–100.09%(a)
| % of Net Assets 12/31/12 | Value 12/31/11 | Purchases at Cost | Proceeds from Sales | Change in Unrealized Appreciation (Depreciation) | Realized Gain (Loss) | Dividend Income | Shares 12/31/12 | Value 12/31/12 | ||||||||||||||||||||||||||||
Asset Allocation Funds–21.15% |
| |||||||||||||||||||||||||||||||||||
Invesco Balanced-Risk Allocation Fund | 15.67 | % | $ | 133,958,847 | $ | 17,809,893 | $ | (20,500,421 | ) | $ | 5,951,785 | $ | 4,837,097 | $ | 3,309,081 | 11,042,323 | $ | 138,360,305 | ||||||||||||||||||
Invesco Balanced-Risk Commodity Strategy Fund | 5.48 | % | 50,290,060 | 4,914,456 | (7,960,222 | ) | 641,776 | 507,889 | 1,025,154 | 4,693,886 | 48,393,959 | |||||||||||||||||||||||||
Total Asset Allocation Funds | 184,248,907 | 22,724,349 | (28,460,643 | ) | 6,593,561 | 5,344,986 | 4,334,235 | 186,754,264 | ||||||||||||||||||||||||||||
Domestic Equity Funds–42.34% |
| |||||||||||||||||||||||||||||||||||
Invesco American Franchise Fund | 8.27 | % | 72,433,403 | 5,777,968 | (14,933,235 | ) | 8,775,751 | 1,001,234 | 288,605 | 5,765,992 | 73,055,121 | |||||||||||||||||||||||||
Invesco Charter Fund | 5.98 | % | 51,321,889 | 1,826,036 | (6,293,648 | ) | 5,182,541 | 769,757 | 784,567 | 2,860,595 | 52,806,575 | |||||||||||||||||||||||||
Invesco Comstock Fund | 5.59 | % | 48,104,724 | 1,983,141 | (8,478,326 | ) | 6,643,761 | 1,122,852 | 948,786 | 2,773,941 | 49,376,152 | |||||||||||||||||||||||||
Invesco Diversified Dividend Fund | 9.19 | % | 79,218,917 | 5,485,848 | (13,569,137 | ) | 8,776,558 | 2,522,875 | 1,761,743 | 6,028,708 | 81,206,700 | |||||||||||||||||||||||||
Invesco Endeavor Fund | 4.75 | % | 40,037,226 | 7,053,412 | (8,469,338 | ) | 2,035,417 | 4,989,445 | 170,765 | 2,365,104 | 41,931,648 | |||||||||||||||||||||||||
Invesco Growth and Income Fund | 4.63 | % | 40,946,214 | 1,643,150 | (6,696,302 | ) | 4,304,204 | 664,042 | 826,854 | 1,948,560 | 40,861,308 | |||||||||||||||||||||||||
Invesco Small Cap Equity Fund | 3.93 | % | 33,816,007 | 2,577,329 | (4,902,274 | ) | 2,405,654 | 2,203,271 | — | 2,493,003 | 34,702,602 | |||||||||||||||||||||||||
Total Domestic Equity Funds | 365,878,380 | 26,346,884 | (63,342,260 | ) | 38,123,886 | 13,273,476 | 4,781,320 | 373,940,106 | ||||||||||||||||||||||||||||
Fixed-Income Funds–6.85% |
| |||||||||||||||||||||||||||||||||||
Invesco Premium Income Fund | 6.85 | % | 61,312,860 | 13,574,639 | (18,010,532 | ) | 3,322,576 | 1,128,228 | 3,267,533 | 5,655,551 | 60,457,841 | |||||||||||||||||||||||||
Foreign Equity Funds–24.95% |
| |||||||||||||||||||||||||||||||||||
Invesco Developing Markets Fund | 7.29 | % | 58,468,477 | 4,985,803 | (10,034,499 | ) | 10,715,419 | 234,518 | 741,216 | 1,902,741 | 64,369,718 | |||||||||||||||||||||||||
Invesco International Core Equity Fund | 9.37 | % | 72,485,244 | 12,935,968 | (11,832,035 | ) | 12,627,358 | (3,396,565 | ) | 2,006,965 | 8,001,929 | 82,819,970 | ||||||||||||||||||||||||
Invesco International Growth Fund | 8.29 | % | 68,448,471 | 3,536,439 | (8,345,501 | ) | 10,503,227 | (951,778 | ) | 961,469 | 2,506,536 | 73,190,858 | ||||||||||||||||||||||||
Total Foreign Equity Funds | 199,402,192 | 21,458,210 | (30,212,035 | ) | 33,846,004 | (4,113,825 | ) | 3,709,650 | 220,380,546 | |||||||||||||||||||||||||||
Real Estate Funds–4.43% |
| |||||||||||||||||||||||||||||||||||
Invesco Global Real Estate Fund | 4.43 | % | 36,517,161 | 3,086,267 | (8,228,502 | ) | 9,343,902 | (1,632,926 | ) | 1,695,531 | 3,349,263 | 39,085,902 | ||||||||||||||||||||||||
Money Market Funds–0.37% |
| |||||||||||||||||||||||||||||||||||
Liquid Assets Portfolio–Institutional Class | 0.18 | % | 91,912 | 50,716,958 | (49,181,313 | ) | — | — | 1,655 | 1,627,557 | 1,627,557 | |||||||||||||||||||||||||
Premier Portfolio–Institutional Class | 0.19 | % | 91,912 | 50,716,958 | (49,181,313 | ) | — | — | 1,276 | 1,627,557 | 1,627,557 | |||||||||||||||||||||||||
Total Money Market Funds | 183,824 | 101,433,916 | (98,362,626 | ) | — | — | 2,931 | 3,255,114 | ||||||||||||||||||||||||||||
TOTAL INVESTMENTS IN AFFILIATED ISSUERS | 100.09 | % | $ | 847,543,324 | $ | 188,624,265 | $ | (246,616,598 | ) | $ | 91,229,929 | $ | 13,999,939 | (b) | $ | 17,791,200 | $ | 883,873,773 | ||||||||||||||||||
OTHER ASSETS LESS LIABILITIES | (0.09 | )% | (756,965 | ) | ||||||||||||||||||||||||||||||||
NET ASSETS | 100.00 | % | $ | 883,116,808 | ||||||||||||||||||||||||||||||||
Notes to Schedule of Investments:
| (a) | Each underlying fund and the Fund are affiliated by either having the same investment adviser or an investment adviser under common control with the Fund’s investment adviser. Effective September 24, 2012, the Fund began investing in Class R6 shares. The Fund invests in Class R6 shares of the mutual funds listed. |
| (b) | Includes $3,696,896, $1,228,361, $3,714,514, $1,397,385 and $869,930 of capital gains from Invesco Balanced-Risk Allocation Fund, Invesco Diversified Dividend Fund, Invesco Endeavor Fund, Invesco Small Cap Equity Fund and Invesco Premium Income Fund, respectively. |
See accompanying Notes to Financial Statements which are an integral part of the financial statements.
22 Invesco Allocation Funds
Schedule of Investments—(continued)
December 31, 2012
Invesco Moderate Allocation Fund
Schedule of Investments in Affiliated Issuers–100.07%(a)
| % of Net Assets 12/31/12 | Value 12/31/11 | Purchases at Cost | Proceeds from Sales | Change in Unrealized Appreciation | Realized Gain (Loss) | Dividend Income | Shares 12/31/12 | Value 12/31/12 | ||||||||||||||||||||||||||||
Asset Allocation Funds–16.91% |
| |||||||||||||||||||||||||||||||||||
Invesco Balanced-Risk Allocation Fund | 12.31 | % | $ | 90,965,195 | $ | 9,855,535 | $ | (6,943,185 | ) | $ | 4,446,787 | $ | 3,083,118 | $ | 2,350,538 | 7,883,594 | $ | 98,781,435 | ||||||||||||||||||
Invesco Balanced-Risk Commodity Strategy Fund | 4.60 | % | 36,423,983 | 4,326,590 | (4,756,793 | ) | 488,947 | 376,467 | 776,802 | 3,575,091 | 36,859,194 | |||||||||||||||||||||||||
Total Asset Allocation Funds | 127,389,178 | 14,182,125 | (11,699,978 | ) | 4,935,734 | 3,459,585 | 3,127,340 | 135,640,629 | ||||||||||||||||||||||||||||
Domestic Equity Funds–31.18% |
| |||||||||||||||||||||||||||||||||||
Invesco American Franchise Fund | 6.10 | % | 46,008,953 | 4,153,009 | (7,588,596 | ) | 5,559,220 | 799,143 | 192,334 | 3,862,015 | 48,931,729 | |||||||||||||||||||||||||
Invesco Charter Fund | 4.39 | % | 32,627,618 | 1,420,745 | (2,741,930 | ) | 3,570,767 | 329,153 | 520,443 | 1,907,170 | 35,206,353 | |||||||||||||||||||||||||
Invesco Comstock Fund | 4.10 | % | 30,551,932 | 1,909,951 | (4,668,401 | ) | 4,512,638 | 600,768 | 622,423 | 1,848,702 | 32,906,888 | |||||||||||||||||||||||||
Invesco Diversified Dividend Fund | 6.78 | % | 50,588,914 | 2,787,147 | (5,533,065 | ) | 6,049,568 | 1,382,049 | 1,159,998 | 4,042,691 | 54,455,042 | |||||||||||||||||||||||||
Invesco Endeavor Fund | 3.50 | % | 25,597,083 | 4,422,546 | (4,104,199 | ) | 1,353,220 | 3,264,160 | 114,272 | 1,582,672 | 28,059,676 | |||||||||||||||||||||||||
Invesco Growth and Income Fund | 3.41 | % | 26,138,729 | 814,148 | (2,841,759 | ) | 2,946,466 | 314,259 | 543,722 | 1,305,286 | 27,371,843 | |||||||||||||||||||||||||
Invesco Small Cap Equity Fund | 2.90 | % | 21,467,814 | 1,973,234 | (2,308,720 | ) | 1,693,994 | 1,359,974 | — | 1,670,588 | 23,254,585 | |||||||||||||||||||||||||
Total Domestic Equity Funds | 232,981,043 | 17,480,780 | (29,786,670 | ) | 25,685,873 | 8,049,506 | 3,153,192 | 250,186,116 | ||||||||||||||||||||||||||||
Fixed-Income Funds–30.20% |
| |||||||||||||||||||||||||||||||||||
Invesco Core Plus Bond Fund | 9.06 | % | 69,521,152 | 10,141,320 | (9,763,508 | ) | 3,104,287 | (334,958 | ) | 2,857,579 | 6,612,220 | 72,668,293 | ||||||||||||||||||||||||
Invesco Emerging Market Local Currency Debt Fund | 2.48 | % | 16,551,421 | 3,496,310 | (2,292,857 | ) | 2,336,741 | (102,742 | ) | 665,455 | 1,966,114 | 19,897,071 | ||||||||||||||||||||||||
Invesco Floating Rate Fund | 3.03 | % | 23,179,690 | 2,937,278 | (2,861,399 | ) | 1,383,393 | (295,207 | ) | 1,261,891 | 3,093,234 | 24,343,755 | ||||||||||||||||||||||||
Invesco High Yield Fund | 3.71 | % | 27,968,433 | 2,660,728 | (3,731,244 | ) | 2,908,930 | (27,180 | ) | 1,789,788 | 6,722,272 | 29,779,667 | ||||||||||||||||||||||||
Invesco Premium Income Fund | 5.91 | % | 45,762,303 | 8,263,683 | (9,354,137 | ) | 2,581,394 | 809,867 | 2,500,558 | 4,432,622 | 47,384,733 | |||||||||||||||||||||||||
PowerShares 1-30 Laddered Treasury Portfolio–ETF | 6.01 | % | 47,302,296 | 9,562,136 | (9,017,883 | ) | (301,229 | ) | 988,354 | 806,404 | 1,478,300 | 48,192,580 | ||||||||||||||||||||||||
Total Fixed-Income Funds | 230,285,295 | 37,061,455 | (37,021,028 | ) | 12,013,516 | 1,038,134 | 9,881,675 | 242,266,099 | ||||||||||||||||||||||||||||
Foreign Equity Funds–18.37% |
| |||||||||||||||||||||||||||||||||||
Invesco Developing Markets Fund | 5.36 | % | 37,218,374 | 4,093,847 | (5,541,899 | ) | 7,073,343 | 147,586 | 492,553 | 1,270,803 | 42,991,251 | |||||||||||||||||||||||||
Invesco International Core Equity Fund | 6.90 | % | 46,110,088 | 9,410,645 | (6,297,354 | ) | 7,644,978 | (1,453,819 | ) | 1,336,117 | 5,354,062 | 55,414,538 | ||||||||||||||||||||||||
Invesco International Growth Fund | 6.11 | % | 43,598,173 | 3,796,704 | (4,726,717 | ) | 6,293,226 | 56,924 | 640,687 | 1,678,709 | 49,018,310 | |||||||||||||||||||||||||
Total Foreign Equity Funds | 126,926,635 | 17,301,196 | (16,565,970 | ) | 21,011,547 | (1,249,309 | ) | 2,469,357 | 147,424,099 | |||||||||||||||||||||||||||
Real Estate Funds–3.25% |
| |||||||||||||||||||||||||||||||||||
Invesco Global Real Estate Fund | 3.25 | % | 23,306,754 | 1,779,644 | (4,044,999 | ) | 4,813,561 | 264,530 | 1,121,116 | 2,238,174 | 26,119,490 | |||||||||||||||||||||||||
Money Market Funds–0.16% |
| |||||||||||||||||||||||||||||||||||
Liquid Assets Portfolio–Institutional Class | 0.08 | % | 2,845,384 | 37,111,517 | (39,320,860 | ) | — | — | 1,978 | 636,041 | 636,041 | |||||||||||||||||||||||||
Premier Portfolio–Institutional Class | 0.08 | % | 2,845,384 | 37,111,517 | (39,320,860 | ) | — | — | 1,511 | 636,041 | 636,041 | |||||||||||||||||||||||||
Total Money Market Funds | 5,690,768 | 74,223,034 | (78,641,720 | ) | — | — | 3,489 | 1,272,082 | ||||||||||||||||||||||||||||
TOTAL INVESTMENTS IN AFFILIATED ISSUERS | 100.07 | % | $ | 746,579,673 | $ | 162,028,234 | $ | (177,760,365 | ) | $ | 68,460,231 | (b) | $ | 11,562,446 | (c) | $ | 19,756,169 | $ | 802,908,515 | |||||||||||||||||
OTHER ASSETS LESS LIABILITIES | (0.07 | )% | (591,719 | ) | ||||||||||||||||||||||||||||||||
NET ASSETS | 100.00 | % | $ | 802,316,796 | ||||||||||||||||||||||||||||||||
Investment Abbreviations:
ETF – Exchange-Traded Fund
Notes to Schedule of Investments:
| (a) | Each underlying fund and the Fund are affiliated by either having the same investment adviser or an investment adviser under common control with the Fund’s investment adviser. Effective September 24, 2012, the Fund began investing in Class R6 shares. The Fund invests in Class R6 shares of the mutual funds listed and the Fund shares of the exchange-traded fund. |
| (b) | Includes $53,481 and $338,768 of return of capital from Invesco Emerging Market Local Currency Debt Fund and PowerShares 1-30 Laddered Treasury Portfolio—ETF. |
| (c) | Includes $2,626,015, $819,571, $2,473,134, $931,711, $38,321, $678,377 and $2,326 of capital gains from Invesco Balanced-Risk Allocation Fund, Invesco Diversified Dividend Fund, Invesco Endeavor Fund, Invesco Small Cap Equity Fund, Invesco Emerging Market Local Currency Debt Fund, Invesco Premium Income Fund and PowerShares 1-30 Laddered Treasury Portfolio—ETF, respectively. |
See accompanying Notes to Financial Statements which are an integral part of the financial statements.
23 Invesco Allocation Funds
Statement of Assets and Liabilities
December 31, 2012
| Invesco Conservative Allocation Fund | Invesco Growth Allocation Fund | Invesco Moderate Allocation Fund | ||||||||||||||||
Assets: | ||||||||||||||||||
Investments in affiliated underlying funds, at value | $ | 337,540,938 | $ | 883,873,773 | $ | 802,908,515 | ||||||||||||
Receivable for: | ||||||||||||||||||
Fund shares sold | 605,114 | 1,253,793 | 1,246,040 | |||||||||||||||
Dividends — affiliated underlying funds | 371 | 389 | 556 | |||||||||||||||
Investment for trustee deferred compensation and retirement plans | 41,903 | 51,481 | 36,835 | |||||||||||||||
Other assets | 70,394 | 27,050 | 30,268 | |||||||||||||||
Total assets | 338,258,720 | 885,206,486 | 804,222,214 | |||||||||||||||
Liabilities: | ||||||||||||||||||
Payable for: | ||||||||||||||||||
Fund shares reacquired | 712,229 | 1,174,270 | 1,161,544 | |||||||||||||||
Accrued fees to affiliates | 234,789 | 689,461 | 541,149 | |||||||||||||||
Accrued operating expenses | — | 78,093 | 85,120 | |||||||||||||||
Trustee deferred compensation and retirement plans | 71,008 | 147,854 | 117,605 | |||||||||||||||
Total liabilities | 1,018,026 | 2,089,678 | 1,905,418 | |||||||||||||||
Net assets applicable to shares outstanding | $ | 337,240,694 | $ | 883,116,808 | $ | 802,316,796 | ||||||||||||
Net assets consist of: | ||||||||||||||||||
Shares of beneficial interest | $ | 334,069,853 | $ | 994,252,942 | $ | 809,729,060 | ||||||||||||
Undistributed net investment income | 380,600 | 736,234 | 489,056 | |||||||||||||||
Undistributed net realized gain (loss) | (31,806,886 | ) | (226,374,982 | ) | (103,520,946 | ) | ||||||||||||
Unrealized appreciation | 34,597,127 | 114,502,614 | 95,619,626 | |||||||||||||||
| $ | 337,240,694 | $ | 883,116,808 | $ | 802,316,796 | |||||||||||||
Net Assets: |
| |||||||||||||||||
Class A | $ | 228,512,421 | $ | 597,879,316 | $ | 537,812,361 | ||||||||||||
Class B | $ | 31,089,934 | $ | 96,851,637 | $ | 80,028,802 | ||||||||||||
Class C | $ | 62,919,242 | $ | 131,069,040 | $ | 123,504,775 | ||||||||||||
Class R | $ | 8,845,202 | $ | 22,750,983 | $ | 20,557,379 | ||||||||||||
Class S | $ | 2,863,657 | $ | 31,802,635 | $ | 36,650,702 | ||||||||||||
Class Y | $ | 2,987,137 | $ | 2,552,674 | $ | 3,319,222 | ||||||||||||
Class R5 | $ | 23,101 | $ | 210,523 | $ | 443,555 | ||||||||||||
Shares outstanding, $0.01 par value per share, | ||||||||||||||||||
Class A | 21,365,173 | 49,913,768 | 47,501,445 | |||||||||||||||
Class B | 2,931,816 | 8,157,939 | 7,093,590 | |||||||||||||||
Class C | 5,921,772 | 11,038,741 | 10,953,891 | |||||||||||||||
Class R | 828,807 | 1,903,509 | 1,817,393 | |||||||||||||||
Class S | 267,549 | 2,657,072 | 3,239,752 | |||||||||||||||
Class Y | 279,957 | 213,457 | 293,115 | |||||||||||||||
Class R5 | 2,152 | 17,510 | 39,075 | |||||||||||||||
Class A: | ||||||||||||||||||
Net asset value per share | $ | 10.70 | $ | 11.98 | $ | 11.32 | ||||||||||||
Maximum offering price per share | $ | 11.32 | $ | 12.68 | $ | 11.98 | ||||||||||||
Class B: | $ | 10.60 | $ | 11.87 | $ | 11.28 | ||||||||||||
Class C: | $ | 10.63 | $ | 11.87 | $ | 11.27 | ||||||||||||
Class R: | $ | 10.67 | $ | 11.95 | $ | 11.31 | ||||||||||||
Class S: | $ | 10.70 | $ | 11.97 | $ | 11.31 | ||||||||||||
Class Y: | $ | 10.67 | $ | 11.96 | $ | 11.32 | ||||||||||||
Class R5: | $ | 10.73 | $ | 12.02 | $ | 11.35 | ||||||||||||
Cost of Investments in affiliated underlying funds | $ | 302,943,811 | $ | 769,371,159 | $ | 707,288,889 | ||||||||||||
See accompanying Notes to Financial Statements which are an integral part of the financial statements.
24 Invesco Allocation Funds
Statement of Operations
For the year ended December 31, 2012
| Invesco Conservative Allocation Fund | Invesco Growth Allocation Fund | Invesco Moderate Allocation Fund | ||||||||||||||||
Investment income: | ||||||||||||||||||
Dividends from affiliated underlying funds | $ | 9,724,151 | $ | 17,592,508 | $ | 19,756,169 | ||||||||||||
Other Income | 1,026 | 1,212 | 894 | |||||||||||||||
Total investment income | 9,725,177 | 17,593,720 | 19,757,063 | |||||||||||||||
Expenses: | ||||||||||||||||||
Administrative services fees | 119,301 | 246,253 | 224,674 | |||||||||||||||
Custodian fees | 9,319 | 13,399 | 10,372 | |||||||||||||||
Distribution fees: | ||||||||||||||||||
Class A | 537,698 | 1,455,674 | 1,282,519 | |||||||||||||||
Class B | 335,930 | 1,058,156 | 887,886 | |||||||||||||||
Class C | 605,301 | 1,295,087 | 1,199,391 | |||||||||||||||
Class R | 45,569 | 117,744 | 98,107 | |||||||||||||||
Class S | 4,119 | 47,378 | 54,496 | |||||||||||||||
Transfer agent fees — A, B, C, R, S and Y | 430,711 | 1,970,450 | 1,266,130 | |||||||||||||||
Transfer agent fees — R5 | 60 | 72 | 541 | |||||||||||||||
Trustees’ and officers’ fees and benefits | 33,080 | 54,657 | 50,506 | |||||||||||||||
Other | 194,283 | 329,572 | 269,325 | |||||||||||||||
Total expenses | 2,315,371 | 6,588,442 | 5,343,947 | |||||||||||||||
Less: Expenses reimbursed and expense offset arrangement(s) | (110,703 | ) | (801,856 | ) | (428,961 | ) | ||||||||||||
Net expenses | 2,204,668 | 5,786,586 | 4,914,986 | |||||||||||||||
Net investment income | 7,520,509 | 11,807,134 | 14,842,077 | |||||||||||||||
Realized and unrealized gain from: | ||||||||||||||||||
Net realized gain on sales of affiliated fund shares | 1,159,524 | 3,092,853 | 3,992,991 | |||||||||||||||
Net realized gain from distributions of affiliated underlying fund shares | 2,150,394 | 11,105,778 | 7,569,455 | |||||||||||||||
Net realized gain from affiliated underlying fund shares | 3,309,918 | 14,198,631 | 11,562,446 | |||||||||||||||
Change in net unrealized appreciation of affiliated underlying fund shares | 22,489,142 | 91,229,929 | 68,460,231 | |||||||||||||||
Net increase in net assets resulting from operations | $ | 33,319,569 | $ | 117,235,694 | $ | 94,864,754 | ||||||||||||
See accompanying Notes to Financial Statements which are an integral part of the financial statements.
25 Invesco Allocation Funds
Statement of Changes In Net Assets
For the years ended December 31, 2012 and 2011
| Invesco Conservative Allocation Fund | Invesco Growth Allocation Fund | Invesco Moderate Allocation Fund | ||||||||||||||||||||||||||||
| 2012 | 2011 | 2012 | 2011 | 2012 | 2011 | |||||||||||||||||||||||||
Operations: | ||||||||||||||||||||||||||||||
Net investment income | $ | 7,520,509 | $ | 6,275,091 | $ | 11,807,134 | $ | 9,670,429 | $ | 14,842,077 | $ | 14,239,218 | ||||||||||||||||||
Net realized gain | 3,309,918 | 2,354,717 | 14,198,631 | 17,042,847 | 11,562,446 | 14,564,545 | ||||||||||||||||||||||||
Change in net unrealized appreciation (depreciation) | 22,489,142 | (6,149,232 | ) | 91,229,929 | (54,918,979 | ) | 68,460,231 | (29,172,683 | ) | |||||||||||||||||||||
Net increase (decrease) in net assets resulting from operations | 33,319,569 | 2,480,576 | 117,235,694 | (28,205,703 | ) | 94,864,754 | (368,920 | ) | ||||||||||||||||||||||
Distributions to shareholders from net investment income: | ||||||||||||||||||||||||||||||
Class A | (7,648,747 | ) | (3,949,970 | ) | (15,644,861 | ) | (8,164,889 | ) | (19,979,574 | ) | (8,716,847 | ) | ||||||||||||||||||
Class B | (836,442 | ) | (528,279 | ) | (1,864,476 | ) | (592,500 | ) | (2,442,144 | ) | (1,196,956 | ) | ||||||||||||||||||
Class C | (1,668,782 | ) | (863,491 | ) | (2,484,578 | ) | (666,849 | ) | (3,692,988 | ) | (1,628,311 | ) | ||||||||||||||||||
Class R | (280,424 | ) | (180,559 | ) | (537,111 | ) | (291,565 | ) | (706,003 | ) | (416,441 | ) | ||||||||||||||||||
Class S | (99,121 | ) | (38,574 | ) | (867,434 | ) | (773,390 | ) | (1,394,591 | ) | (857,582 | ) | ||||||||||||||||||
Class Y | (107,199 | ) | (23,544 | ) | (73,643 | ) | (45,849 | ) | (132,600 | ) | (37,130 | ) | ||||||||||||||||||
Class R5 | (865 | ) | (1,930 | ) | (5,804 | ) | (2,518 | ) | (17,292 | ) | (26,850 | ) | ||||||||||||||||||
Total distributions from net investment income | (10,641,580 | ) | (5,586,347 | ) | (21,477,907 | ) | (10,537,560 | ) | (28,365,192 | ) | (12,880,117 | ) | ||||||||||||||||||
Share transactions-net: | ||||||||||||||||||||||||||||||
Class A | 12,270,308 | 156,273,954 | (21,918,931 | ) | 296,919,058 | 13,170,268 | 156,492,890 | |||||||||||||||||||||||
Class B | (6,263,467 | ) | 26,232,202 | (25,202,878 | ) | 45,628,236 | (21,080,133 | ) | 15,676,330 | |||||||||||||||||||||
Class C | 2,354,652 | 42,466,775 | (7,864,664 | ) | 56,467,542 | (1,731,268 | ) | 12,730,289 | ||||||||||||||||||||||
Class R | (5,973 | ) | 5,009,412 | (1,745,700 | ) | 8,051,908 | 980,867 | (3,488,100 | ) | |||||||||||||||||||||
Class S | 111,476 | 2,593,994 | (2,090,121 | ) | (802,298 | ) | (1,706,327 | ) | 843,959 | |||||||||||||||||||||
Class Y | 1,696,669 | 1,148,631 | (323,419 | ) | 1,436,360 | 1,283,454 | 798,323 | |||||||||||||||||||||||
Class R5 | (59,424 | ) | 45,736 | 162,813 | (70,694 | ) | (771,577 | ) | 59,937 | |||||||||||||||||||||
Net increase (decrease) in net assets resulting from share transactions | 10,104,241 | 233,770,704 | (58,982,900 | ) | 407,630,112 | (9,854,716 | ) | 183,113,628 | ||||||||||||||||||||||
Net increase in net assets | 32,782,230 | 230,664,933 | 36,774,887 | 368,886,849 | 56,644,846 | 169,864,591 | ||||||||||||||||||||||||
Net assets: | ||||||||||||||||||||||||||||||
Beginning of year | 304,458,464 | 73,793,531 | 846,341,921 | 477,455,072 | 745,671,950 | 575,807,359 | ||||||||||||||||||||||||
End of year* | $ | 337,240,694 | $ | 304,458,464 | $ | 883,116,808 | $ | 846,341,921 | $ | 802,316,796 | $ | 745,671,950 | ||||||||||||||||||
* Includes accumulated undistributed net investment income | $ | 380,600 | $ | 2,510,769 | $ | 736,234 | $ | 5,549,613 | $ | 489,056 | $ | 10,605,439 | ||||||||||||||||||
Notes to Financial Statements
December 31, 2012
NOTE 1—Significant Accounting Policies
AIM Growth Series (Invesco Growth Series) (the “Trust”) is organized as a Delaware statutory trust and is registered under the Investment Company Act of 1940, as amended (the “1940 Act”), as an open-end series management investment company consisting of sixteen separate series portfolios (each constituting a “Fund”), each authorized to issue an unlimited number of shares of beneficial interest. The Funds covered in this report, each a series portfolio of the Trust, are Invesco Conservative Allocation Fund, Invesco Growth Allocation Fund and Invesco Moderate Allocation Fund (collectively, the “Funds”). The assets, liabilities and operations of each portfolio are accounted for separately. Information presented in these financial statements pertains only to the Fund. Matters affecting each portfolio or class will be voted on exclusively by the shareholders of such portfolio or class.
The investment objectives of the Funds are: to provide total return consistent with a lower level of risk relative to the broad stock market for Invesco Conservative Allocation Fund, to provide long-term growth of capital consistent with a higher level of risk relative to the broad stock market for Invesco Growth Allocation Fund, and to provide total return consistent with a moderate level of risk relative to the broad stock market for Invesco Moderate Allocation Fund.
Each Fund is a “fund of funds,” in that it invests in other mutual funds (“underlying funds”) advised by Invesco Advisers, Inc. (“Invesco”) or exchange-traded funds advised by Invesco Powershares Capital Management LLC (“PowerShares Capital”), an affiliate of Invesco. Invesco and
26 Invesco Allocation Funds
PowerShares Capital are affiliates of each other as they are indirect wholly-owned subsidiaries of Invesco Ltd. Invesco may change each Fund’s asset class allocations, the underlying funds or target weightings in the underlying funds without shareholder approval. The underlying funds may engage in a number of investment techniques and practices, which involve certain risks. Each underlying fund’s accounting policies are outlined in the underlying fund’s financial statements and are available upon request.
Each Fund currently consists of seven different classes of shares: Class A, Class B, Class C, Class R, Class S, Class Y and Class R5. On September 24, 2012, Institutional Class shares were renamed Class R5 shares. Class A shares are sold with a front-end sales charge unless certain waiver criteria are met and under certain circumstances load waived shares may be subject to contingent deferred sales charges (“CDSC”). Class C shares are sold with a CDSC. Class R, Class S, Class Y and Class R5 shares are sold at net asset value. Effective November 30, 2010, new or additional investments in Class B shares are no longer permitted. Existing shareholders of Class B shares may continue to reinvest dividends and capital gains distributions in Class B shares until they convert to Class A shares. Also, shareholders in Class B shares will be able to exchange those shares for Class B shares of other Invesco Funds offering such shares until they convert to Class A shares. Generally, Class B shares will automatically convert to Class A shares on or about the month-end, which is at least eight years after the date of purchase. Redemption of Class B shares prior to the conversion date will be subject to a CDSC.
The following is a summary of the significant accounting policies followed by the Funds in the preparation of their financial statements.
| A. | Security Valuations — Securities of investment companies that trade on an exchange are valued at the last sales price or official closing price as of the close of the customary trading session on the exchange where the security is principally traded. Investments in shares of funds that are not traded on an exchange are valued at the end of day net asset value per share of such fund. Securities in the underlying funds, including restricted securities, are valued in accordance with the valuation policy of such fund. The policies of the underlying funds affiliated with the funds as a result of having the same investment adviser are set forth below. |
A security listed or traded on an exchange (except convertible bonds) is valued at its last sales price or official closing price as of the close of the customary trading session on the exchange where the security is principally traded, or lacking any sales or official closing price on a particular day, the security may be valued at the closing bid price on that day. Securities traded in the over-the-counter market are valued based on prices furnished by independent pricing services or market makers. When such securities are valued by an independent pricing service they may be considered fair valued. Futures contracts are valued at the final settlement price set by an exchange on which they are principally traded. Listed options are valued at the mean between the last bid and ask prices from the exchange on which they are principally traded. Options not listed on an exchange are valued by an independent source at the mean between the last bid and ask prices. For purposes of determining net asset value per share, futures and option contracts generally are valued 15 minutes after the close of the customary trading session of the New York Stock Exchange (“NYSE”).
Senior secured floating rate loans and senior secured floating rate debt securities are fair valued using an evaluated quote provided by an independent pricing service. Evaluated quotes provided by the pricing service may reflect appropriate factors such as ratings, tranche type, industry, company performance, spread, individual trading characteristics, institution-size trading in similar groups of securities and other market data.
Investments in open-end and closed-end registered investment companies that do not trade on an exchange are valued at the end of day net asset value per share. Investments in open-end and closed-end registered investment companies that trade on an exchange are valued at the last sales price or official closing price as of the close of the customary trading session on the exchange where the security is principally traded.
Debt obligations (including convertible bonds) and unlisted equities are fair valued using an evaluated quote provided by an independent pricing service. Evaluated quotes provided by the pricing service may be determined without exclusive reliance on quoted prices, and may reflect appropriate factors such as institution-size trading in similar groups of securities, developments related to specific securities, dividend rate (for unlisted equities), yield (for debt obligations), quality, type of issue, coupon rate (for debt obligations), maturity (for debt obligations), individual trading characteristics and other market data. Debt obligations are subject to interest rate and credit risks. In addition, all debt obligations involve some risk of default with respect to interest and/or principal payments.
Swap agreements are fair valued using an evaluated quote provided by an independent pricing service. Evaluated quotes provided by the pricing service are valued based on a model which may include end of day net present values, spreads, ratings, industry, and company performance.
Foreign securities’ (including foreign exchange contracts) prices are converted into U.S. dollar amounts using the applicable exchange rates as of the close of the NYSE. If market quotations are available and reliable for foreign exchange-traded equity securities, the securities will be valued at the market quotations. Because trading hours for certain foreign securities end before the close of the NYSE, closing market quotations may become unreliable. If between the time trading ends on a particular security and the close of the customary trading session on the NYSE, events occur that the Adviser determines are significant and make the closing price unreliable, the Fund may fair value the security. If the event is likely to have affected the closing price of the security, the security will be valued at fair value in good faith using procedures approved by the Board of Trustees. Adjustments to closing prices to reflect fair value may also be based on a screening process of an independent pricing service to indicate the degree of certainty, based on historical data, that the closing price in the principal market where a foreign security trade is not the current value as of the close of the NYSE. Foreign securities’ prices meeting the approved degree of certainty that the price is not reflective of current value will be priced at the indication of fair value from the independent pricing service. Multiple factors may be considered by the independent pricing service in determining adjustments to reflect fair value and may include information relating to sector indices, American Depositary Receipts and domestic and foreign index futures. Foreign securities may have additional risks including exchange rate changes, potential for sharply devalued currencies and high inflation, political and economic upheaval, the relative lack of issuer information, relatively low market liquidity and the potential lack of strict financial and accounting controls and standards.
Securities for which market prices are not provided by any of the above methods may be valued based upon quotes furnished by independent sources. The last bid price may be used to value equity securities. The mean between the last bid and asked prices is used to value debt obligations, including corporate loans.
Securities for which market quotations are not readily available or became unreliable are valued at fair value as determined in good faith by or under the supervision of the Trust’s officers following procedures approved by the Board of Trustees. Issuer specific events, market trends, bid/ask quotes of brokers and information providers and other market data may be reviewed in the course of making a good faith determination of a security’s fair value.
27 Invesco Allocation Funds
Valuations change in response to many factors including the historical and prospective earnings of the issuer, the value of the issuer’s assets, general economic conditions, interest rates, investor perceptions and market liquidity. Because of the inherent uncertainties of valuation, the values reflected in the financial statements may materially differ from the value received upon actual sale of those investments.
| B. | Securities Transactions and Investment Income — Securities transactions are accounted for on a trade date basis. Realized gains or losses on sales are computed on the basis of specific identification of the securities sold. Distributions from ordinary income from underlying funds, if any, are recorded as dividend income on ex-dividend date. Distributions from gains from underlying funds, if any, are recorded as realized gains on the ex-dividend date. The following policies are followed by the underlying funds: Interest income is recorded on the accrual basis from settlement date. Bond premiums and discounts are amortized and/or accreted for financial reporting purposes. Paydown gains and losses on mortgage and asset-backed securities are recorded as adjustments to interest income. |
The Fund allocates income and realized and unrealized capital gains and losses to a class based on the relative net assets of each class.
| C. | Distributions — Distributions from income and net realized capital gain, if any, are generally declared and paid annually and recorded on the ex-dividend date. The Funds may elect to treat a portion of the proceeds from redemptions as distributions for federal tax purposes. |
| D. | Federal Income Taxes — The Funds intend to comply with the requirements of Subchapter M of the Internal Revenue Code necessary to qualify as a regulated investment company and to distribute substantially all of the Funds’ taxable earnings to shareholders. As such, the Funds will not be subject to federal income taxes on otherwise taxable income (including net realized capital gain) that is distributed to shareholders. Therefore, no provision for federal income taxes is recorded in the financial statements. |
Each Fund files tax returns in the U.S. Federal jurisdiction and certain other jurisdictions. Generally, each Fund is subject to examinations by such taxing authorities for up to three years after the filing of the return for the tax period.
| E. | Expenses — Expenses included in the accompanying financial statements reflect the expenses of the Funds and do not include any expenses of the underlying funds. The effects of the underlying funds expenses are included in the realized and unrealized gain/loss on the investments in the underlying funds. |
Fees provided for under the Rule 12b-1 plan of a particular class of each Fund and which are directly attributable to that class are charged to the operations of such class. Transfer agency fees and expenses and other shareholder recordkeeping fees and expenses attributable to Class R5 are charged to such class. Transfer agency fees and expenses and other shareholder recordkeeping fees and expenses relating to all other classes are allocated among those classes based on relative net assets. All other expenses are allocated among the classes based on relative net assets.
| F. | Accounting Estimates — The preparation of financial statements in conformity with accounting principles generally accepted in the United States of America (“GAAP”) requires management to make estimates and assumptions that affect the reported amounts of assets and liabilities at the date of the financial statements and the reported amounts of revenues and expenses during the reporting period including estimates and assumptions related to taxation. Actual results could differ from those estimates by a significant amount. In addition, the Fund monitors for material events or transactions that may occur or become known after the period-end date and before the date the financial statements are released to print. |
| G. | Indemnifications — Under the Trust’s organizational documents, each Trustee, officer, employee or other agent of the Trust is indemnified against certain liabilities that may arise out of the performance of their duties to the Funds. Additionally, in the normal course of business, the Funds enter into contracts, including each Funds’ servicing agreements, that contain a variety of indemnification clauses. Each Fund’s maximum exposure under these arrangements is unknown as this would involve future claims that may be made against such Fund that have not yet occurred. The risk of material loss as a result of such indemnification claims is considered remote. |
NOTE 2—Advisory Fees and Other Fees Paid to Affiliates
The Trust has entered into a master investment advisory agreement with Invesco. Under the terms of the investment advisory agreement, the Funds do not pay an advisory fee. However, each Fund pays advisory fees to Invesco indirectly as a shareholder of the underlying funds.
Under the terms of a master sub-advisory agreement between the Adviser and each of Invesco Asset Management Deutschland GmbH, Invesco Asset Management Limited, Invesco Asset Management (Japan) Limited, Invesco Australia Limited, Invesco Hong Kong Limited, Invesco Senior Secured Management, Inc. and Invesco Canada Ltd. (collectively, the “Affiliated Sub-Advisers”) the Adviser, not the Funds, may pay 40% of the fees paid to the Adviser to any such Affiliated Sub-Adviser(s) that provide discretionary investment management services to each Fund or underlying funds based on the percentage of assets allocated to such Sub-Adviser(s).
Effective July 1, 2012, Invesco has contractually agreed, through June 30, 2013, to reimburse expenses to the extent necessary to limit total annual fund operating expenses after expense reimbursement (excluding certain items discussed below) of Class A, Class B, Class C, Class R, Class S, Class Y and Class R5 shares for each Fund as shown in the following table:
| Class A | Class B | Class C | Class R | Class S | Class Y | Class R5 | ||||||||||||||||||||||
Invesco Conservative Allocation Fund | 1.50 | % | 2.25 | % | 2.25 | % | 1.75 | % | 1.40 | % | 1.25 | % | 1.25 | % | ||||||||||||||
Invesco Growth Allocation Fund | 2.00 | % | 2.75 | % | 2.75 | % | 2.25 | % | 1.90 | % | 1.75 | % | 1.75 | % | ||||||||||||||
Invesco Moderate Allocation Fund | 1.50 | % | 2.25 | % | 2.25 | % | 1.75 | % | 1.40 | % | 1.25 | % | 1.25 | % | ||||||||||||||
Prior to July 1, 2012, Invesco had contractually agreed to reimburse expenses to the extent necessary to limit total annual fund operating expenses after expense reimbursement (excluding certain items discussed below) of Class A, Class B, Class C, Class R, Class S, Class Y and Class R5 shares for each Fund as shown in the following table:
| Class A | Class B | Class C | Class R | Class S | Class Y | Class R5 | ||||||||||||||||||||||
Invesco Conservative Allocation Fund | 0.39 | % | 1.14 | % | 1.14 | % | 0.64 | % | 0.29 | % | 0.14 | % | 0.14 | % | ||||||||||||||
Invesco Growth Allocation Fund | 0.37 | % | 1.12 | % | 1.12 | % | 0.62 | % | 0.27 | % | 0.12 | % | 0.12 | % | ||||||||||||||
Invesco Moderate Allocation Fund | 0.37 | % | 1.12 | % | 1.12 | % | 0.62 | % | 0.27 | % | 0.12 | % | 0.12 | % | ||||||||||||||
28 Invesco Allocation Funds
In determining Invesco’s obligation to reimburse expenses, the following expenses are not taken into account, and could cause the total annual fund operating expenses after expense reimbursement to exceed the numbers reflected above: (1) interest; (2) taxes; (3) dividend expense on short sales; (4) extraordinary or non-routine items, including litigation expenses; and (5) expenses that the Fund has incurred but did not actually pay because of an expense offset arrangement. Acquired Fund Fees and Expenses are not fees and expenses incurred by the Funds directly but are fees and expenses, including management fees, of the investment companies in which the Funds invest. As a result, total annual fund operating expenses after expense reimbursement may exceed the expense limits above. You incur these expenses indirectly through the valuation of each Fund’s investment in those investment companies. The impact of the Acquired Fund Fees and Expenses are included in the total return of the Funds. Unless the Board of Trustees and Invesco mutually agree to amend or continue the fee waiver agreement, it will terminate on June 30, 2013.
For the year ended December 31, 2012, Invesco reimbursed the following expenses:
| Class A | Class B | Class C | Class R | Class S | Class Y | Class R5 | ||||||||||||||||||||||
Invesco Conservative Allocation Fund | $ | 72,825 | $ | 11,374 | $ | 20,495 | $ | 3,086 | $ | 930 | $ | 773 | $ | 22 | ||||||||||||||
Invesco Growth Allocation Fund | 529,346 | 96,198 | 117,738 | 21,408 | 28,714 | 2,331 | 10 | |||||||||||||||||||||
Invesco Moderate Allocation Fund | 279,656 | 48,401 | 65,383 | 10,696 | 19,805 | 1,595 | — | |||||||||||||||||||||
The Trust has entered into a master administrative services agreement with Invesco pursuant to which each Fund has agreed to pay Invesco for certain administrative costs incurred in providing accounting services to such Fund. For the year ended December 31, 2012, expenses incurred under the agreement are shown in the Statement of Operations as Administrative services fees.
The Trust has entered into a transfer agency and service agreement with Invesco Investment Services, Inc. (“IIS”) pursuant to which each Fund has agreed to pay IIS a fee for providing transfer agency and shareholder services to the Fund and reimburse IIS for certain expenses incurred by IIS in the course of providing such services. IIS may make payments to intermediaries that provide omnibus account services, sub-accounting services and/or networking services. All fees payable by IIS to intermediaries that provide omnibus account services or sub-accounting are charged back to each Fund, subject to certain limitations approved by the Trust’s Board of Trustees. For the year ended December 31, 2012, expenses incurred under the agreement are shown in the Statement of Operations as Transfer agent fees.
The Trust has entered into master distribution agreements with Invesco Distributors, Inc. (“IDI”) to serve as the distributor for the Class A, Class B, Class C, Class R, Class S, Class Y and Class R5 shares of each Fund. The Trust has adopted plans pursuant to Rule 12b-1 under the 1940 Act with respect to each Fund’s Class A, Class B, Class C, Class R and Class S shares (collectively, the “Plans”). Each Fund, pursuant to the Plans, pays IDI compensation at the annual rate of 0.25% of each Fund’s average daily net assets of Class A shares, 1.00% of the average daily net assets of Class B and Class C shares, 0.50% of the average daily net assets of Class R shares and 0.15% of the average daily net assets of Class S shares. Of the Plan payments, up to 0.25% of the average daily net assets of Class A, Class B, Class C and Class R shares and 0.15% of the average daily net assets of Class S shares may be paid to furnish continuing personal shareholder services to customers who purchase and own shares of such classes. Any amounts not paid as a service fee under the Plans would constitute an asset-based sales charge. Rules of the Financial Industry Regulatory Authority (“FINRA”) impose a cap on the total sales charges, including asset-based sales charges, that may be paid by any class of shares of the Fund. For the year ended December 31, 2012, expenses incurred under the Plans are shown in the Statement of Operations as Distribution fees.
Front-end sales commissions and CDSC (collectively, the “sales charges”) are not recorded as expenses of the Funds. Front-end sales commissions are deducted from proceeds from the sales of Fund shares prior to investment in Class A shares of the Funds. CDSC are deducted from redemption proceeds prior to remittance to the shareholder. During the year ended December 31, 2012, IDI advised the Funds that IDI retained the following in front-end sales commissions from the sale of Class A shares and received the following in CDCS imposed on redemptions by shareholders:
| Front End Sales Charges | Contingent Deferred Sales Charges | |||||||||||||||
| Class A | Class A | Class B | Class C | |||||||||||||
Invesco Conservative Allocation Fund | $ | 105,524 | $ | 49 | $ | 33,313 | $ | 4,482 | ||||||||
Invesco Growth Allocation Fund | 252,201 | 368 | 131,903 | 9,674 | ||||||||||||
Invesco Moderate Allocation Fund | 238,904 | 658 | 99,285 | 7,191 | ||||||||||||
The underlying Invesco Funds pay no distribution fees for Class R5 and Class R6 shares and the Funds pay no sales loads or other similar compensation to IDI for acquiring the underlying fund shares.
Certain officers and trustees of the Trust are officers and directors of the Adviser, IIS and/or IDI.
NOTE 3—Additional Valuation Information
GAAP defines fair value as the price that would be received to sell an asset or paid to transfer a liability in an orderly transaction between market participants at the measurement date, under current market conditions. GAAP establishes a hierarchy that prioritizes the inputs to valuation methods giving the highest priority to readily available unadjusted quoted prices in an active market for identical assets (Level 1) and the lowest priority to significant unobservable inputs (Level 3) generally when market prices are not readily available or are unreliable. Based on the valuation inputs, the securities or other investments are tiered into one of three levels. Changes in valuation methods may result in transfers in or out of an investment’s assigned level:
| Level 1 — | Prices are determined using quoted prices in an active market for identical assets. |
| Level 2 — | Prices are determined using other significant observable inputs. Observable inputs are inputs that other market participants may use in pricing a security. These may include quoted prices for similar securities, interest rates, prepayment speeds, credit risk, yield curves, loss severities, default rates, discount rates, volatilities and others. |
| Level 3 — | Prices are determined using significant unobservable inputs. In situations where quoted prices or observable inputs are unavailable (for example, when there is little or no market activity for an investment at the end of the period), unobservable inputs may be used. Unobservable inputs reflect the Fund’s own assumptions about the factors market participants would use in determining fair value of the securities or instruments and would be based on the best available information. |
29 Invesco Allocation Funds
The following is a summary of the tiered valuation input levels, as of December 31, 2012. The level assigned to the securities valuations may not be an indication of the risk or liquidity associated with investing in those securities.
| Equity Securities | ||||||||||||||||
| Fund Name | Level 1 | Level 2 | Level 3 | Total | ||||||||||||
Invesco Conservative Allocation Fund | $ | 337,540,938 | $ | — | $ | — | $ | 337,540,938 | ||||||||
Invesco Growth Allocation Fund | 883,873,773 | — | — | 883,873,773 | ||||||||||||
Invesco Moderate Allocation Fund | 802,908,515 | — | — | 802,908,515 | ||||||||||||
NOTE 4—Expense Offset Arrangement(s)
The expense offset arrangement is comprised of transfer agency credits which result from balances in Demand Deposit Accounts (DDA) used by the transfer agent for clearing shareholder transactions. For the year ended December 31, 2012, the Funds received credits from this arrangement, which resulted in the reduction of the Funds’ total expenses of:
| Transfer Agent Credits | ||||
Invesco Conservative Allocation Fund | $ | 1,198 | ||
Invesco Growth Allocation Fund | 6,111 | |||
Invesco Moderate Allocation Fund | 3,425 | |||
NOTE 5—Trustees’ and Officers’ Fees and Benefits
“Trustees’ and Officers’ Fees and Benefits” include amounts accrued by each Fund to pay remuneration to certain Trustees and Officers of such Fund. Trustees have the option to defer compensation payable by the Funds, and “Trustees’ and Officers’ Fees and Benefits” also include amounts accrued by each Fund to fund such deferred compensation amounts. Those Trustees who defer compensation have the option to select various Invesco Funds in which their deferral accounts shall be deemed to be invested. Finally, certain current Trustees are eligible to participate in a retirement plan that provides for benefits to be paid upon retirement to Trustees over a period of time based on the number of years of service. The Funds may have certain former Trustees who also participate in a retirement plan and receive benefits under such plan. “Trustees’ and Officers’ Fees and Benefits” include amounts accrued by each Fund to fund such retirement benefits. Obligations under the deferred compensation and retirement plans represent unsecured claims against the general assets of the Funds.
NOTE 6—Cash Balances
The Funds are permitted to temporarily carry a negative or overdrawn balance in their account with State Street Bank and Trust Company, the custodian bank. Such balances, if any at period end, are shown in the Statement of Assets and Liabilities under the payable caption Amount due custodian. To compensate the custodian bank for such overdrafts, the overdrawn Fund may either (1) leave funds as a compensating balance in the account so the custodian bank can be compensated by earning the additional interest; or (2) compensate by paying the custodian bank at a rate agreed upon by the custodian bank and Invesco, not to exceed the contractually agreed upon rate.
NOTE 7—Distributions to Shareholders and Tax Components of Net Assets
Tax Character of Distributions to Shareholders Paid During the Years Ended December 31, 2012 and 2011:
| 2012 | 2011 | |||||||
| Ordinary Income | Ordinary Income | |||||||
Invesco Conservative Allocation Fund | $ | 10,641,580 | $ | 5,586,347 | ||||
Invesco Growth Allocation Fund | 21,477,907 | 10,537,560 | ||||||
Invesco Moderate Allocation Fund | 28,365,192 | 12,880,117 | ||||||
Tax Components of Net Assets at Period-End:
| Undistributed Ordinary Income | Net Unrealized Appreciation Investments | Temporary Book/Tax Differences | Capital Loss Carryforward | Post- October Deferrals | Shares of Beneficial Interest | Total Net Assets | ||||||||||||||||||||||
Invesco Conservative Allocation Fund | $ | 446,615 | $ | 26,225,104 | $ | (66,015 | ) | $ | (23,434,863 | ) | $ | — | $ | 334,069,853 | $ | 337,240,694 | ||||||||||||
Invesco Growth Allocation Fund | 877,954 | 99,674,113 | (141,720 | ) | (211,546,481 | ) | — | 994,252,942 | 883,116,808 | |||||||||||||||||||
Invesco Moderate Allocation Fund | 602,273 | 83,627,721 | (113,217 | ) | (91,515,754 | ) | (13,287 | ) | 809,729,060 | 802,316,796 | ||||||||||||||||||
The difference between book-basis and tax-basis unrealized appreciation (depreciation) is due to differences in the timing of recognition of gains and losses on investments for tax and book purposes. The Funds net unrealized appreciation (depreciation) differences are attributable primarily to wash sales.
The temporary book/tax differences are a result of timing differences between book and tax recognition of income and/or expenses. The Funds temporary book/tax differences are the result of the trustee deferral of compensation and retirement plan benefits.
Capital loss carryforward is calculated and reported as of a specific date. Results of transactions and other activity after that date may affect the amount of capital loss carryforward actually available for the Fund to utilize. The Regulated Investment Company Modernization Act of 2010
30 Invesco Allocation Funds
(the “Act”) eliminated the eight-year carryover period for capital losses that arise in taxable years beginning after its enactment date of December 22, 2010. Consequently, these capital losses can be carried forward for an unlimited period. However, capital losses with an expiration period may not be used to offset capital gains until all net capital losses without an expiration date have been utilized. Additionally, post-enactment capital loss carryovers will retain their character as either short-term or long-term capital losses instead of as short-term capital losses as under prior law. The ability to utilize capital loss carryforward in the future may be limited under the Internal Revenue Code and related regulations based on the results of future transactions.
The Funds capital loss carryforward limitations and amounts utilized in the current period to offset net realized capital gain for federal income tax purposes as follows:
| Capital Loss Carryforward Utilized | ||||
Invesco Conservative Allocation Fund | $ | 2,233,098 | ||
Invesco Growth Allocation Fund | 10,966,407 | |||
Invesco Moderate Allocation Fund | 8,972,601 | |||
The Funds have a capital loss carryforward as of December 31, 2012 which expires as follows:
| Invesco Conservative Allocation Fund | Invesco Growth Allocation Fund | Invesco Moderate Allocation Fund | ||||||||||||||||||||||||||||||||||
| Expiration* | Short-Term | Long-Term | Total | Short-Term | Long-Term | Total | Short-Term | Long-Term | Total | |||||||||||||||||||||||||||
December 31, 2015 | $ | — | $ | — | $ | — | $ | 1,230,807 | $ | — | $ | 1,230,807 | $ | — | $ | — | $ | — | ||||||||||||||||||
December 31, 2016 | 6,775,642 | — | 6,775,642 | 40,303,777 | — | 40,303,777 | 3,194,686 | — | 3,194,686 | |||||||||||||||||||||||||||
December 31, 2017 | 7,575,122 | 7,575,122 | 102,584,789 | — | 102,584,789 | 36,934,284 | — | 36,934,284 | ||||||||||||||||||||||||||||
December 31, 2018 | 9,084,099 | 9,084,099 | 67,427,108 | — | 67,427,108 | 51,386,784 | — | 51,386,784 | ||||||||||||||||||||||||||||
| * | Capital loss carryforward as of the date listed above is reduced for limitations, if any, to the extent required by the Internal Revenue Code. |
To the extent that unrealized gains as of June 6, 2011, the date of reorganization of Invesco Conservative Allocation Fund and Invesco Van Kampen Asset Allocation Conservative Fund into Invesco Conservative Allocation Fund (formerly Invesco Moderately Conservative Allocation Fund); Invesco Moderate Growth Allocation Fund and Invesco Van Kampen Asset Allocation Growth Fund into Invesco Growth Allocation Fund; Invesco Van Kampen Asset Allocation Moderate Fund into Invesco Moderate Allocation Fund and realized on securities held in each fund at such date of reorganization, the capital loss carryforward may be further limited for up to five years from the date of the reorganization.
NOTE 8—Investment Securities
The aggregate amount of investment securities purchased and sold by each Fund and aggregate cost and the net unrealized appreciation (depreciation) of investments for tax purposes are as follows:
| For the year ended December 31, 2012* | At December 31, 2012 | |||||||||||||||||||||||
| Federal Tax Cost** | Unrealized Appreciation | Unrealized (Depreciation) | Net Unrealized Appreciation | |||||||||||||||||||||
| Purchases | Sales | |||||||||||||||||||||||
Invesco Conservative Allocation Fund | $ | 41,123,548 | $ | 30,072,761 | $ | 311,315,834 | $ | 26,225,104 | $ | — | $ | 26,225,104 | ||||||||||||
Invesco Growth Allocation Fund | 87,190,349 | 148,253,972 | 784,199,660 | 106,012,496 | (6,338,383 | ) | 99,674,113 | |||||||||||||||||
Invesco Moderate Allocation Fund | 87,805,200 | 99,118,645 | 719,280,794 | 83,627,721 | — | 83,627,721 | ||||||||||||||||||
| * | Excludes U.S. Treasury obligations and money market funds, if any. |
| ** | Cost of investments on a tax basis includes the adjustments for financial reporting purposes as of the most recently completed federal income tax reporting period end. |
NOTE 9—Reclassification of Permanent Differences
Primarily as a result of differing book/tax treatment of capital gain distributions and expired capital loss carryforwards, on December 31, 2012. These reclassifications had no effect on the net assets of each Fund.
| Undistributed Net Investment Income | Undistributed Net Realized Gain (Loss) | Shares of Beneficial Interest | ||||||||||
Invesco Conservative Allocation Fund | $ | 990,902 | $ | (990,902 | ) | $ | — | |||||
Invesco Growth Allocation Fund | 4,857,394 | (4,857,394 | ) | – | ||||||||
Invesco Moderate Allocation Fund | 3,406,732 | (3,406,732 | ) | — | ||||||||
31 Invesco Allocation Funds
NOTE 10—Share Information
Invesco Conservative Allocation Fund
| Summary of Share Activity | ||||||||||||||||
| Years ended December 31, | ||||||||||||||||
| 2012(a) | 2011 | |||||||||||||||
| Shares | Amount | Shares | Amount | |||||||||||||
Sold: | ||||||||||||||||
Class A | 4,546,179 | $ | 48,358,668 | 2,842,578 | $ | 28,227,636 | ||||||||||
Class B | 294,544 | 3,098,376 | 293,861 | 2,934,017 | ||||||||||||
Class C | 1,346,787 | 14,120,355 | 980,179 | 9,773,192 | ||||||||||||
Class R | 249,040 | 2,616,894 | 221,162 | 2,202,445 | ||||||||||||
Class S (b) | 23,341 | 247,431 | 13,999 | 138,407 | ||||||||||||
Class Y | 274,424 | 2,884,676 | 19,778 | 196,924 | ||||||||||||
Issued as reinvestment of dividends: | ||||||||||||||||
Class A | 674,967 | 7,188,400 | 379,837 | 3,740,611 | ||||||||||||
Class B | 73,932 | 781,467 | 51,237 | 501,320 | ||||||||||||
Class C | 149,106 | 1,579,029 | 84,243 | 825,598 | ||||||||||||
Class R | 26,381 | 280,424 | 18,221 | 179,393 | ||||||||||||
Class S | 9,109 | 97,103 | 3,924 | 38,574 | ||||||||||||
Class Y | 9,660 | 102,692 | 2,288 | 22,492 | ||||||||||||
Class R5 | — | — | 36 | 357 | ||||||||||||
Issued in connection with acquisitions:(c) | ||||||||||||||||
Class A | — | — | 15,693,414 | 158,362,801 | ||||||||||||
Class B | — | — | 3,063,252 | 30,634,616 | ||||||||||||
Class C | — | — | 4,310,753 | 43,190,035 | ||||||||||||
Class R | — | — | 483,740 | 4,871,247 | ||||||||||||
Class S | — | — | 273,335 | 2,759,080 | ||||||||||||
Class Y | — | — | 108,312 | 1,091,637 | ||||||||||||
Class R5 | — | — | 4,482 | 45,379 | ||||||||||||
Automatic conversion of Class B shares to Class A shares: | ||||||||||||||||
Class A | 373,574 | 3,972,822 | 323,362 | 3,218,391 | ||||||||||||
Class B | (378,561 | ) | (3,972,822 | ) | (326,569 | ) | (3,218,391 | ) | ||||||||
Reacquired: | ||||||||||||||||
Class A | (4,459,184 | ) | (47,249,582 | ) | (3,734,223 | ) | (37,275,485 | ) | ||||||||
Class B | (587,622 | ) | (6,170,488 | ) | (466,665 | ) | (4,619,360 | ) | ||||||||
Class C | (1,270,437 | ) | (13,344,732 | ) | (1,142,515 | ) | (11,322,050 | ) | ||||||||
Class R | (272,058 | ) | (2,903,291 | ) | (224,326 | ) | (2,243,673 | ) | ||||||||
Class S | (21,973 | ) | (233,058 | ) | (34,186 | ) | (342,067 | ) | ||||||||
Class Y | (122,267 | ) | (1,290,699 | ) | (16,380 | ) | (162,422 | ) | ||||||||
Class R5 | (5,540 | ) | (59,424 | ) | — | — | ||||||||||
Net increase in share activity | 933,402 | $ | 10,104,241 | 23,227,129 | $ | 233,770,704 | ||||||||||
| (a) | There are entities that are record owners of more than 5% of the outstanding shares of the Fund and in the aggregate own 29% of the outstanding shares of the Fund. IDI has an agreement with these entities to sell Fund shares. The Fund, Invesco and/or Invesco affiliates may make payments to these entities, which are considered to be related to the Fund, for providing services to the Fund, Invesco and/or Invesco affiliates including but not limited to services such as securities brokerage, distribution, third party record keeping and account servicing. The Fund has no knowledge as to whether all or any portion of the shares owned of record by these entities are also owned beneficially. |
| (b) | Commencement date of June 6, 2011. |
| (c) | As of the opening of business on June 6, 2011, the Fund acquired all the net assets of Invesco Conservative Allocation Fund and Invesco Van Kampen Asset Allocation Conservative Fund (the “Target Funds”) pursuant to a plan of reorganization approved by the Trustees of the Fund on November 10, 2010 and by the shareholders of the Target Funds, respectively, on April 1, 2011. The acquisition was accomplished by a tax-free exchange of 23,937,288 shares of the Fund for 12,402,187 and 11,504,197 shares outstanding of the Target Funds, respectively, as of the close of business on June 3, 2011. Each class of the Target Funds were exchanged for the like class of shares of the Fund based on the relative net asset value of the Target Funds to the net asset value of the Fund on the close of business, June 3, 2011. The Target Funds’ net assets at that date of $122,348,797, including $7,190,686 of unrealized appreciation and $118,605,998, including $8,304,310 of unrealized appreciation, respectively, were combined with those of the Fund. The net assets of the Fund immediately before the acquisition were $76,970,136. The net assets immediately after the acquisition were $317,924,931. |
| The pro forma results of operations for the year ended December 31, 2011 assuming the reorganization had been completed on January 1, 2011, the beginning of the annual reporting period are as follows: |
Net investment income | $ | 8,687,847 | ||
Net realized/unrealized gains | 2,290,649 | |||
Change in net assets resulting from operations | $ | 10,978,496 |
| The combined investment portfolios have been managed as a single integrated portfolio since the acquisition was completed, it is not practicable to separate the amounts of revenue and earnings of the Target Funds that have been included in the Fund’s Statement of Operations since June 6, 2011. |
32 Invesco Allocation Funds
NOTE 10—Share Information—(continued)
Invesco Growth Allocation Fund
| Summary of Share Activity | ||||||||||||||||
| Years ended December 31, | ||||||||||||||||
| 2012(a) | 2011 | |||||||||||||||
| Shares | Amount | Shares | Amount | |||||||||||||
Sold: | ||||||||||||||||
Class A | 5,825,149 | $ | 67,963,557 | 5,058,931 | $ | 55,125,806 | ||||||||||
Class B | 145,644 | 1,672,825 | 247,038 | 2,949,156 | ||||||||||||
Class C | 1,450,212 | 16,663,075 | 1,362,854 | 15,177,107 | ||||||||||||
Class R | 412,240 | 4,779,583 | 426,363 | 4,685,929 | ||||||||||||
Class S | 211,191 | 2,456,852 | 349,743 | 3,892,607 | ||||||||||||
Class Y | 32,751 | 382,804 | 32,046 | 349,648 | ||||||||||||
Class R5 | 13,954 | 167,418 | — | — | ||||||||||||
Issued as reinvestment of dividends: | ||||||||||||||||
Class A | 1,286,839 | 15,261,907 | 733,010 | 7,989,669 | ||||||||||||
Class B | 154,395 | 1,815,684 | 52,064 | 579,341 | ||||||||||||
Class C | 204,610 | 2,406,212 | 58,294 | 648,661 | ||||||||||||
Class R | 45,402 | 537,103 | 26,572 | 291,560 | ||||||||||||
Class S | 73,201 | 867,434 | 70,167 | 773,073 | ||||||||||||
Class Y | 5,751 | 68,084 | 4,111 | 44,659 | ||||||||||||
Class R5 | 460 | 5,474 | 190 | 2,143 | ||||||||||||
Issued in connection with acquisitions:(b) | ||||||||||||||||
Class A | — | — | 29,215,586 | 331,306,545 | ||||||||||||
Class B | — | — | 6,166,274 | 69,168,046 | ||||||||||||
Class C | — | — | 6,307,493 | 70,764,522 | ||||||||||||
Class R | — | — | 731,849 | 8,278,649 | ||||||||||||
Class Y | — | — | 153,598 | 1,740,211 | ||||||||||||
Class R5 | — | — | 1,325 | 15,103 | ||||||||||||
Automatic conversion of Class B shares to Class A shares: | ||||||||||||||||
Class A | 1,007,572 | 11,805,258 | 789,522 | 8,697,642 | ||||||||||||
Class B | (1,019,345 | ) | (11,805,258 | ) | (800,021 | ) | (8,697,642 | ) | ||||||||
Reacquired: | ||||||||||||||||
Class A | (10,043,962 | ) | (116,949,653 | ) | (9,656,208 | ) | (106,200,604 | ) | ||||||||
Class B | (1,474,978 | ) | (16,886,129 | ) | (1,693,528 | ) | (18,370,665 | ) | ||||||||
Class C | (2,344,256 | ) | (26,933,951 | ) | (2,780,105 | ) | (30,122,748 | ) | ||||||||
Class R | (600,190 | ) | (7,062,386 | ) | (474,351 | ) | (5,204,230 | ) | ||||||||
Class S | (463,403 | ) | (5,414,407 | ) | (494,552 | ) | (5,467,978 | ) | ||||||||
Class Y | (66,207 | ) | (774,307 | ) | (63,701 | ) | (698,158 | ) | ||||||||
Class R5 | (858 | ) | (10,079 | ) | (7,555 | ) | (87,940 | ) | ||||||||
Net increase (decrease) in share activity | (5,143,828 | ) | $ | (58,982,900 | ) | 35,817,009 | $ | 407,630,112 | ||||||||
| (a) | There is an entity that is a record owner of more than 5% of the outstanding shares of the Fund and owns 9% of the outstanding shares of the Fund. IDI has an agreement with this entity to sell Fund shares. The Fund, Invesco and/or Invesco affiliates may make payments to this entity, which is considered to be related to the Fund, for providing services to the Fund, Invesco and/or Invesco affiliates including but not limited to services such as, securities brokerage, distribution, third party record keeping and account servicing. The Fund has no knowledge as to whether all or any portion of the shares owned of record by this entity are also owned beneficially. |
| (b) | As of the opening of business on June 6, 2011, the Fund acquired all the net assets of Invesco Moderate Growth Allocation Fund and Invesco Van Kampen Asset Allocation Growth Fund (the “Target Funds”) pursuant to a plan of reorganization approved by the Trustees of the Fund on November 10, 2010 and by the shareholders of the Target Funds, respectively, on April 1, 2011. The acquisition was accomplished by a tax-free exchange of 42,576,125 shares of the Fund for 27,865,526 and 16,606,461 shares outstanding of the Target Funds, respectively, as of the close of business on June 3, 2011. Each class of the Target Funds were exchanged for the like class of shares of the Fund based on the relative net asset value of the Target Funds to the net asset value of the Fund at the close of business on June 3, 2011. The Target Funds’ net assets at that date of $303,431,404, including $27,415,367 of unrealized appreciation and $177,841,672, including $24,150,979 of unrealized appreciation, respectively, were combined with those of the Fund. The net assets of the Fund immediately before the acquisition were $476,394,521. The net assets immediately after the acquisition were $957,667,597. |
| The pro forma results of operations for the year ended December 31, 2011 assuming the reorganization had been completed on January 1, 2011, the beginning of the annual reporting period are as follows: |
Net investment income | $ | 10,016,112 | ||
Net realized/unrealized gains (losses) | (20,195,677 | ) | ||
Change in net assets resulting from operations | $ | (10,179,565 | ) |
| The combined investment portfolios have been managed as a single integrated portfolio since the acquisition was completed, it is not practicable to separate the amounts of revenue and earnings of the Target Funds that have been included in the Fund’s Statement of Operations since June 6, 2011. |
33 Invesco Allocation Funds
NOTE 10—Share Information—(continued)
Invesco Moderate Allocation Fund
| Summary of Share Activity | ||||||||||||||||
| Years ended December 31, | ||||||||||||||||
| 2012(a) | 2011 | |||||||||||||||
| Shares | Amount | Shares | Amount | |||||||||||||
Sold: | ||||||||||||||||
Class A | 7,481,234 | $ | 83,710,897 | 5,261,451 | $ | 55,308,292 | ||||||||||
Class B | 317,478 | 3,502,321 | 505,266 | 5,353,606 | ||||||||||||
Class C | 1,581,941 | 17,538,747 | 1,492,000 | 15,627,390 | ||||||||||||
Class R | 413,876 | 4,581,033 | 447,188 | 4,693,422 | ||||||||||||
Class S | 257,468 | 2,878,725 | 418,454 | 4,429,517 | ||||||||||||
Class Y | 184,207 | 2,055,080 | 57,482 | 605,983 | ||||||||||||
Class R5 | 41,661 | 461,630 | 49,937 | 513,629 | ||||||||||||
Issued as reinvestment of dividends: | ||||||||||||||||
Class A | 1,701,207 | 19,121,562 | 804,669 | 8,400,853 | ||||||||||||
Class B | 211,217 | 2,367,746 | 109,777 | 1,158,448 | ||||||||||||
Class C | 317,485 | 3,555,835 | 148,973 | 1,572,150 | ||||||||||||
Class R | 62,042 | 696,735 | 38,766 | 407,314 | ||||||||||||
Class S | 124,086 | 1,393,489 | 81,871 | 856,256 | ||||||||||||
Class Y | 8,331 | 93,639 | 2,609 | 27,260 | ||||||||||||
Class R5 | 1,489 | 16,777 | 2,535 | 26,557 | ||||||||||||
Issued in connection with acquisitions:(b) | ||||||||||||||||
Class A | — | — | 16,832,386 | 180,773,828 | ||||||||||||
Class B | — | — | 3,338,667 | 35,632,035 | ||||||||||||
Class C | — | — | 2,338,455 | 24,925,814 | ||||||||||||
Class Y | — | — | 70,405 | 756,957 | ||||||||||||
Automatic conversion of Class B shares to Class A shares: | ||||||||||||||||
Class A | 1,070,655 | 12,038,704 | 859,288 | 9,061,670 | ||||||||||||
Class B | (1,078,355 | ) | (12,038,704 | ) | (865,188 | ) | (9,061,670 | ) | ||||||||
Reacquired: | ||||||||||||||||
Class A | (9,101,222 | ) | (101,700,895 | ) | (9,229,493 | ) | (97,051,753 | ) | ||||||||
Class B | (1,346,797 | ) | (14,911,496 | ) | (1,665,014 | ) | (17,406,089 | ) | ||||||||
Class C | (2,066,188 | ) | (22,825,850 | ) | (2,809,346 | ) | (29,395,065 | ) | ||||||||
Class R | (383,832 | ) | (4,296,901 | ) | (823,690 | ) | (8,588,836 | ) | ||||||||
Class S | (535,835 | ) | (5,978,541 | ) | (418,638 | ) | (4,441,814 | ) | ||||||||
Class Y | (77,617 | ) | (865,265 | ) | (55,647 | ) | (591,877 | ) | ||||||||
Class R5 | (110,631 | ) | (1,249,984 | ) | (46,682 | ) | (480,249 | ) | ||||||||
Net increase (decrease) in share activity | (926,100 | ) | $ | (9,854,716 | ) | 16,946,481 | $ | 183,113,628 | ||||||||
| (a) | There are entities that are record owners of more than 5% of the outstanding shares of the Fund and in the aggregate own 23% of the outstanding shares of the Fund. IDI has an agreement with these entities to sell Fund shares. The Fund, Invesco and/or Invesco affiliates may make payments to these entities, which are considered to be related to the Fund, for providing services to the Fund, Invesco and/or Invesco affiliates including but not limited to services such as securities brokerage, distribution, third party record keeping and account servicing. The Fund has no knowledge as to whether all or any portion of the shares owned of record by these entities are also owned beneficially. |
| (b) | As of the opening of business on June 6, 2011, the Fund acquired all the net assets of Invesco Van Kampen Asset Allocation Moderate Fund (the “Target Fund”) pursuant to a plan of reorganization approved by the Trustees of the Fund on November 10, 2010 and by the shareholders of the Target Fund on April 1, 2011. The acquisition was accomplished by a tax-free exchange of 22,579,913 shares of the Fund for 22,958,488 shares outstanding of the Target Fund as of the close of business on June 3, 2011. Each class of the Target Fund was exchanged for the like class of shares of the Fund based on the relative net asset value of the Target Fund to the net asset value of the Fund at the close of business on June 3, 2011. The Target Fund’s net assets at that date of $242,088,634, including $24,912,434 of unrealized appreciation, were combined with those of the Fund. The net assets of the Fund immediately before the acquisition were $573,476,672. The net assets immediately after the acquisition were $815,565,306. |
| The pro forma results of operations for the year ended December 31, 2011 assuming the reorganization had been completed on January 1, 2011, the beginning of the annual reporting period are as follows: |
Net investment income | $ | 15,769,020 | ||
Net realized/unrealized gains (losses) | (6,703,618 | ) | ||
Change in net assets resulting from operations | $ | 9,065,402 |
| The combined investment portfolios have been managed as a single integrated portfolio since the acquisition was completed, it is not practicable to separate the amounts of revenue and earnings of the Target Funds that have been included in the Fund’s Statement of Operations since June 6, 2011. |
34 Invesco Allocation Funds
NOTE 11—Financial Highlights
The following schedule presents financial highlights for a share of each Fund outstanding throughout the periods indicated.
Invesco Conservative Allocation Fund
| Net asset value, beginning of period | Net investment income(a) | Net gains (losses) on securities (both realized and unrealized) | Total from investment operations | Dividends from net investment income | Distributions from net realized gains | Total distributions | Net asset value, end of period | Total return(b) | Net assets, end of period (000s omitted) | Ratio of expenses to average net assets with fee waivers and/or expense reimbursements(c) | Ratio of expenses to average net assets without fee waivers and/or expense reimbursements | Ratio of net investment income to average net assets | Portfolio turnover(d) | |||||||||||||||||||||||||||||||||||||||||||
Class A |
| |||||||||||||||||||||||||||||||||||||||||||||||||||||||
Year ended 12/31/12 | $ | 9.95 | $ | 0.27 | $ | 0.85 | $ | 1.12 | $ | (0.37 | ) | $ | — | $ | (0.37 | ) | $ | 10.70 | 11.28 | % | $ | 228,512 | 0.46 | %(e) | 0.49 | %(e) | 2.55 | %(e) | 9 | % | ||||||||||||||||||||||||||
Year ended 12/31/11 | 9.94 | 0.33 | 0.04 | 0.37 | (0.36 | ) | — | (0.36 | ) | 9.95 | 3.77 | 201,299 | 0.39 | 0.53 | 3.26 | 27 | ||||||||||||||||||||||||||||||||||||||||
Year ended 12/31/10 | 9.35 | 0.29 | 0.58 | 0.87 | (0.28 | ) | — | (0.28 | ) | 9.94 | 9.33 | 46,954 | 0.39 | 0.73 | 3.04 | 70 | ||||||||||||||||||||||||||||||||||||||||
Year ended 12/31/09 | 8.35 | 0.32 | 1.12 | 1.44 | (0.44 | ) | — | (0.44 | ) | 9.35 | 17.28 | 41,152 | 0.39 | 0.71 | 3.66 | 26 | ||||||||||||||||||||||||||||||||||||||||
Year ended 12/31/08 | 11.24 | 0.46 | (2.84 | ) | (2.38 | ) | (0.40 | ) | (0.11 | ) | (0.51 | ) | 8.35 | (21.20 | ) | 58,819 | 0.39 | 0.63 | 4.45 | 28 | ||||||||||||||||||||||||||||||||||||
Class B |
| |||||||||||||||||||||||||||||||||||||||||||||||||||||||
Year ended 12/31/12 | 9.87 | 0.19 | 0.83 | 1.02 | (0.29 | ) | — | (0.29 | ) | 10.60 | 10.33 | 31,090 | 1.21 | (e) | 1.24 | (e) | 1.80 | (e) | 9 | |||||||||||||||||||||||||||||||||||||
Year ended 12/31/11 | 9.88 | 0.25 | 0.05 | 0.30 | (0.31 | ) | — | (0.31 | ) | 9.87 | 3.06 | 34,832 | 1.14 | 1.28 | 2.51 | 27 | ||||||||||||||||||||||||||||||||||||||||
Year ended 12/31/10 | 9.30 | 0.22 | 0.56 | 0.78 | (0.20 | ) | — | (0.20 | ) | 9.88 | 8.45 | 9,032 | 1.14 | 1.48 | 2.29 | 70 | ||||||||||||||||||||||||||||||||||||||||
Year ended 12/31/09 | 8.31 | 0.26 | 1.11 | 1.37 | (0.38 | ) | — | (0.38 | ) | 9.30 | 16.46 | 9,129 | 1.14 | 1.46 | 2.91 | 26 | ||||||||||||||||||||||||||||||||||||||||
Year ended 12/31/08 | 11.16 | 0.38 | (2.80 | ) | (2.42 | ) | (0.32 | ) | (0.11 | ) | (0.43 | ) | 8.31 | (21.69 | ) | 8,897 | 1.14 | 1.38 | 3.70 | 28 | ||||||||||||||||||||||||||||||||||||
Class C |
| |||||||||||||||||||||||||||||||||||||||||||||||||||||||
Year ended 12/31/12 | 9.89 | 0.19 | 0.84 | 1.03 | (0.29 | ) | – | (0.29 | ) | 10.63 | 10.41 | 62,919 | 1.21 | (e) | 1.24 | (e) | 1.80 | (e) | 9 | |||||||||||||||||||||||||||||||||||||
Year ended 12/31/11 | 9.90 | 0.25 | 0.05 | 0.30 | (0.31 | ) | — | (0.31 | ) | 9.89 | 3.05 | 56,322 | 1.14 | 1.28 | 2.51 | 27 | ||||||||||||||||||||||||||||||||||||||||
Year ended 12/31/10 | 9.32 | 0.22 | 0.56 | 0.78 | (0.20 | ) | — | (0.20 | ) | 9.90 | 8.43 | 14,494 | 1.14 | 1.48 | 2.29 | 70 | ||||||||||||||||||||||||||||||||||||||||
Year ended 12/31/09 | 8.33 | 0.26 | 1.11 | 1.37 | (0.38 | ) | — | (0.38 | ) | 9.32 | 16.42 | 14,731 | 1.14 | 1.46 | 2.91 | 26 | ||||||||||||||||||||||||||||||||||||||||
Year ended 12/31/08 | 11.17 | 0.37 | (2.78 | ) | (2.41 | ) | (0.32 | ) | (0.11 | ) | (0.43 | ) | 8.33 | (21.57 | ) | 13,118 | 1.14 | 1.38 | 3.70 | 28 | ||||||||||||||||||||||||||||||||||||
Class R |
| |||||||||||||||||||||||||||||||||||||||||||||||||||||||
Year ended 12/31/12 | 9.93 | 0.24 | 0.84 | 1.08 | (0.34 | ) | — | (0.34 | ) | 10.67 | 10.92 | 8,845 | 0.71 | (e) | 0.74 | (e) | 2.30 | (e) | 9 | |||||||||||||||||||||||||||||||||||||
Year ended 12/31/11 | 9.92 | 0.30 | 0.05 | 0.35 | (0.34 | ) | — | (0.34 | ) | 9.93 | 3.60 | 8,197 | 0.64 | 0.78 | 3.01 | 27 | ||||||||||||||||||||||||||||||||||||||||
Year ended 12/31/10 | 9.34 | 0.27 | 0.56 | 0.83 | (0.25 | ) | — | (0.25 | ) | 9.92 | 8.96 | 3,241 | 0.64 | 0.98 | 2.79 | 70 | ||||||||||||||||||||||||||||||||||||||||
Year ended 12/31/09 | 8.34 | 0.30 | 1.12 | 1.42 | (0.42 | ) | — | (0.42 | ) | 9.34 | 17.05 | 2,580 | 0.64 | 0.96 | 3.41 | 26 | ||||||||||||||||||||||||||||||||||||||||
Year ended 12/31/08 | 11.21 | 0.42 | (2.81 | ) | (2.39 | ) | (0.37 | ) | (0.11 | ) | (0.48 | ) | 8.34 | (21.31 | ) | 1,552 | 0.64 | 0.88 | 4.20 | 28 | ||||||||||||||||||||||||||||||||||||
Class S |
| |||||||||||||||||||||||||||||||||||||||||||||||||||||||
Year ended 12/31/12 | 9.96 | 0.28 | 0.84 | 1.12 | (0.38 | ) | — | (0.38 | ) | 10.70 | 11.27 | 2,864 | 0.36 | (e) | 0.39 | (e) | 2.65 | (e) | 9 | |||||||||||||||||||||||||||||||||||||
Year ended 12/31/11(f) | 10.09 | 0.19 | (0.17 | ) | 0.02 | (0.15 | ) | — | (0.15 | ) | 9.96 | 0.24 | 2,560 | 0.29 | (g) | 0.43 | (g) | 3.36 | (g) | 27 | ||||||||||||||||||||||||||||||||||||
Class Y |
| |||||||||||||||||||||||||||||||||||||||||||||||||||||||
Year ended 12/31/12 | 9.93 | 0.30 | 0.84 | 1.14 | (0.40 | ) | — | (0.40 | ) | 10.67 | 11.46 | 2,987 | 0.21 | (e) | 0.24 | (e) | 2.80 | (e) | 9 | |||||||||||||||||||||||||||||||||||||
Year ended 12/31/11 | 9.92 | 0.35 | 0.04 | 0.39 | (0.38 | ) | — | (0.38 | ) | 9.93 | 3.94 | 1,173 | 0.14 | 0.28 | 3.51 | 27 | ||||||||||||||||||||||||||||||||||||||||
Year ended 12/31/10 | 9.34 | 0.32 | 0.56 | 0.88 | (0.30 | ) | — | (0.30 | ) | 9.92 | 9.49 | 41 | 0.14 | 0.48 | 3.29 | 70 | ||||||||||||||||||||||||||||||||||||||||
Year ended 12/31/09 | 8.35 | 0.35 | 1.11 | 1.46 | (0.47 | ) | — | (0.47 | ) | 9.34 | 17.54 | 70 | 0.14 | 0.46 | 3.91 | 26 | ||||||||||||||||||||||||||||||||||||||||
Year ended 12/31/08(f) | 9.59 | 0.10 | (0.83 | ) | (0.73 | ) | (0.40 | ) | (0.11 | ) | (0.51 | ) | 8.35 | (7.56 | ) | 31 | 0.14 | (g) | 0.42 | (g) | 4.70 | (g) | 28 | |||||||||||||||||||||||||||||||||
Class R5 |
| |||||||||||||||||||||||||||||||||||||||||||||||||||||||
Year ended 12/31/12 | 9.98 | 0.30 | 0.85 | 1.15 | (0.40 | ) | — | (0.40 | ) | 10.73 | 11.56 | 23 | 0.17 | (e) | 0.21 | (e) | 2.83 | (e) | 9 | |||||||||||||||||||||||||||||||||||||
Year ended 12/31/11 | 9.96 | 0.35 | 0.05 | 0.40 | (0.38 | ) | — | (0.38 | ) | 9.98 | 4.03 | 77 | 0.14 | 0.21 | 3.51 | 27 | ||||||||||||||||||||||||||||||||||||||||
Year ended 12/31/10 | 9.37 | 0.32 | 0.57 | 0.89 | (0.30 | ) | — | (0.30 | ) | 9.96 | 9.57 | 32 | 0.14 | 0.36 | 3.29 | 70 | ||||||||||||||||||||||||||||||||||||||||
Year ended 12/31/09 | 8.38 | 0.35 | 1.11 | 1.46 | (0.47 | ) | — | (0.47 | ) | 9.37 | 17.48 | 29 | 0.14 | 0.32 | 3.91 | 26 | ||||||||||||||||||||||||||||||||||||||||
Year ended 12/31/08 | 11.27 | 0.48 | (2.83 | ) | (2.35 | ) | (0.43 | ) | (0.11 | ) | (0.54 | ) | 8.38 | (20.88 | ) | 25 | 0.14 | 0.27 | 4.70 | 28 | ||||||||||||||||||||||||||||||||||||
| (a) | Calculated using average shares outstanding. |
| (b) | Includes adjustments in accordance with accounting principles generally accepted in the United States of America and as such, the net asset value for financial reporting purposes and the returns based upon those net asset values may differ from the net asset value and returns for shareholder transactions. Does not include sales charges and is not annualized for periods less than one year, if applicable. |
| (c) | In addition to the fees and expenses which the Fund bears directly; the Fund indirectly bears a pro rata share of the fees and expenses of the underlying funds in which the Fund invests. Because the underlying funds have varied expenses and fee levels and the Fund may own different proportions at different times, the amount of fees and expenses incurred indirectly by the Fund will vary. Estimated underlying fund expenses are not expenses that are incurred directly by your Fund. They are expenses that are incurred directly by the underlying funds and are deducted from the value of the funds your Fund invests in. The effect of the estimated underlying fund expenses that you bear indirectly is included in your Fund’s total return. Estimated acquired fund fees from underlying funds were 0.64%, 0.64%, 0.64%, 0.67% and 0.69% for the years ended December 31, 2012, December 31, 2011, December 31, 2010, December 31, 2009 and December 31, 2008, respectively. |
| (d) | Portfolio turnover is calculated at the fund level and is not annualized for periods less than one year, if applicable. For the period ending December 31, 2011, the portfolio turnover calculation excludes the value of securities purchased of $226,619,088 and sold of $49,277,466 in the effort to realign the Fund’s portfolio holdings after the reorganization of Invesco Conservative Allocation Fund and Invesco Van Kampen Asset Allocation Conservative Fund into the Fund. |
| (e) | Ratios are annualized and based on average daily net assets (000’s omitted) of $215,079, $33,593, $60,530, $9,114, $2,746, $2,283 and $61 for Class A, Class B, Class C, Class R, Class S, Class Y and Class R5 shares, respectively. |
| (f) | Commencement date of June 6, 2011 for Class S shares and October 3, 2008 for Class Y shares. |
| (g) | Annualized. |
35 Invesco Allocation Funds
NOTE 11—Financial Highlights—(continued)
Invesco Growth Allocation Fund
| Net asset value, beginning of period | Net investment income(a) | Net gains (losses) on securities (both realized and unrealized) | Total from investment operations | Dividends from net investment income | Distributions from net realized gains | Total distributions | Net asset value, end of period | Total return(b) | Net assets, end of period (000s omitted) | Ratio of expenses to average net assets with fee waivers and/or expense reimbursements(c) | Ratio of expenses to average net assets without fee waivers and/or expense reimbursements | Ratio of net investment income to average net assets | Portfolio turnover(d) | |||||||||||||||||||||||||||||||||||||||||||
Class A |
| |||||||||||||||||||||||||||||||||||||||||||||||||||||||
Year ended 12/31/12 | $ | 10.73 | $ | 0.18 | $ | 1.39 | $ | 1.57 | $ | (0.32 | ) | $ | — | $ | (0.32 | ) | $ | 11.98 | 14.68 | % | $ | 597,879 | 0.46 | %(e) | 0.55 | %(e) | 1.55 | %(e) | 10 | % | ||||||||||||||||||||||||||
Year ended 12/31/11 | 11.10 | 0.17 | (0.29 | ) | (0.12 | ) | (0.25 | ) | — | (0.25 | ) | 10.73 | (1.13 | ) | 556,456 | 0.40 | 0.58 | 1.58 | 28 | |||||||||||||||||||||||||||||||||||||
Year ended 12/31/10 | 10.02 | 0.17 | 1.12 | 1.29 | (0.21 | ) | — | (0.21 | ) | 11.10 | 12.91 | 285,192 | 0.46 | 0.61 | 1.69 | 73 | ||||||||||||||||||||||||||||||||||||||||
Year ended 12/31/09 | 7.76 | 0.18 | 2.24 | 2.42 | (0.16 | ) | — | (0.16 | ) | 10.02 | 31.22 | 269,062 | 0.46 | 0.68 | 2.13 | 28 | ||||||||||||||||||||||||||||||||||||||||
Year ended 12/31/08 | 14.21 | 0.14 | (5.91 | ) | (5.77 | ) | (0.01 | ) | (0.67 | ) | (0.68 | ) | 7.76 | (40.62 | ) | 258,136 | 0.46 | 0.59 | 1.16 | 16 | ||||||||||||||||||||||||||||||||||||
Class B |
| |||||||||||||||||||||||||||||||||||||||||||||||||||||||
Year ended 12/31/12 | 10.64 | 0.09 | 1.37 | 1.46 | (0.23 | ) | — | (0.23 | ) | 11.87 | 13.73 | 96,852 | 1.21 | (e) | 1.30 | (e) | 0.80 | (e) | 10 | |||||||||||||||||||||||||||||||||||||
Year ended 12/31/11 | 10.93 | 0.09 | (0.28 | ) | (0.19 | ) | (0.10 | ) | — | (0.10 | ) | 10.64 | (1.79 | ) | 110,133 | 1.15 | 1.33 | 0.83 | 28 | |||||||||||||||||||||||||||||||||||||
Year ended 12/31/10 | 9.88 | 0.10 | 1.09 | 1.19 | (0.14 | ) | — | (0.14 | ) | 10.93 | 12.02 | 69,723 | 1.21 | 1.36 | 0.94 | 73 | ||||||||||||||||||||||||||||||||||||||||
Year ended 12/31/09 | 7.64 | 0.12 | 2.19 | 2.31 | (0.07 | ) | — | (0.07 | ) | 9.88 | 30.20 | 73,887 | 1.21 | 1.43 | 1.38 | 28 | ||||||||||||||||||||||||||||||||||||||||
Year ended 12/31/08 | 14.10 | 0.05 | (5.83 | ) | (5.78 | ) | (0.01 | ) | (0.67 | ) | (0.68 | ) | 7.64 | (41.00 | ) | 65,395 | 1.21 | 1.34 | 0.41 | 16 | ||||||||||||||||||||||||||||||||||||
Class C |
| |||||||||||||||||||||||||||||||||||||||||||||||||||||||
Year ended 12/31/12 | 10.64 | 0.09 | 1.37 | 1.46 | (0.23 | ) | — | (0.23 | ) | 11.87 | 13.73 | 131,069 | 1.21 | (e) | 1.30 | (e) | 0.80 | (e) | 10 | |||||||||||||||||||||||||||||||||||||
Year ended 12/31/11 | 10.93 | 0.09 | (0.28 | ) | (0.19 | ) | (0.10 | ) | — | (0.10 | ) | 10.64 | (1.79 | ) | 124,789 | 1.15 | 1.33 | 0.83 | 28 | |||||||||||||||||||||||||||||||||||||
Year ended 12/31/10 | 9.88 | 0.10 | 1.09 | 1.19 | (0.14 | ) | — | (0.14 | ) | 10.93 | 12.02 | 74,096 | 1.21 | 1.36 | 0.94 | 73 | ||||||||||||||||||||||||||||||||||||||||
Year ended 12/31/09 | 7.64 | 0.12 | 2.19 | 2.31 | (0.07 | ) | — | (0.07 | ) | 9.88 | 30.20 | 72,462 | 1.21 | 1.43 | 1.38 | 28 | ||||||||||||||||||||||||||||||||||||||||
Year ended 12/31/08 | 14.10 | 0.05 | (5.83 | ) | (5.78 | ) | (0.01 | ) | (0.67 | ) | (0.68 | ) | 7.64 | (41.00 | ) | 59,190 | 1.21 | 1.34 | 0.41 | 16 | ||||||||||||||||||||||||||||||||||||
Class R |
| |||||||||||||||||||||||||||||||||||||||||||||||||||||||
Year ended 12/31/12 | 10.71 | 0.15 | 1.38 | 1.53 | (0.29 | ) | — | (0.29 | ) | 11.95 | 14.32 | 22,751 | 0.71 | (e) | 0.80 | (e) | 1.30 | (e) | 10 | |||||||||||||||||||||||||||||||||||||
Year ended 12/31/11 | 11.05 | 0.15 | (0.29 | ) | (0.14 | ) | (0.20 | ) | — | (0.20 | ) | 10.71 | (1.32 | ) | 21,917 | 0.65 | 0.83 | 1.33 | 28 | |||||||||||||||||||||||||||||||||||||
Year ended 12/31/10 | 9.98 | 0.15 | 1.11 | 1.26 | (0.19 | ) | — | (0.19 | ) | 11.05 | 12.61 | 14,761 | 0.71 | 0.86 | 1.44 | 73 | ||||||||||||||||||||||||||||||||||||||||
Year ended 12/31/09 | 7.73 | 0.16 | 2.22 | 2.38 | (0.13 | ) | — | (0.13 | ) | 9.98 | 30.81 | 13,034 | 0.71 | 0.93 | 1.88 | 28 | ||||||||||||||||||||||||||||||||||||||||
Year ended 12/31/08 | 14.18 | 0.11 | (5.88 | ) | (5.77 | ) | (0.01 | ) | (0.67 | ) | (0.68 | ) | 7.73 | (40.70 | ) | 8,386 | 0.71 | 0.84 | 0.91 | 16 | ||||||||||||||||||||||||||||||||||||
Class S |
| |||||||||||||||||||||||||||||||||||||||||||||||||||||||
Year ended 12/31/12 | 10.73 | 0.19 | 1.38 | 1.57 | (0.33 | ) | — | (0.33 | ) | 11.97 | 14.70 | 31,803 | 0.36 | (e) | 0.45 | (e) | 1.65 | (e) | 10 | |||||||||||||||||||||||||||||||||||||
Year ended 12/31/11 | 11.10 | 0.19 | (0.29 | ) | (0.10 | ) | (0.27 | ) | — | (0.27 | ) | 10.73 | (0.96 | ) | 30,420 | 0.30 | 0.48 | 1.68 | 28 | |||||||||||||||||||||||||||||||||||||
Year ended 12/31/10 | 10.02 | 0.18 | 1.12 | 1.30 | (0.22 | ) | — | (0.22 | ) | 11.10 | 13.02 | 32,295 | 0.36 | 0.51 | 1.79 | 73 | ||||||||||||||||||||||||||||||||||||||||
Year ended 12/31/09(f) | 9.61 | 0.06 | 0.51 | 0.57 | (0.16 | ) | — | (0.16 | ) | 10.02 | 6.00 | 15,961 | 0.36 | (g) | 0.47 | (g) | 2.23 | (g) | 28 | |||||||||||||||||||||||||||||||||||||
Class Y |
| |||||||||||||||||||||||||||||||||||||||||||||||||||||||
Year ended 12/31/12 | 10.72 | 0.21 | 1.38 | 1.59 | (0.35 | ) | — | (0.35 | ) | 11.96 | 14.88 | 2,553 | 0.21 | (e) | 0.30 | (e) | 1.80 | (e) | 10 | |||||||||||||||||||||||||||||||||||||
Year ended 12/31/11 | 11.10 | 0.20 | (0.28 | ) | (0.08 | ) | (0.30 | ) | — | (0.30 | ) | 10.72 | (0.79 | ) | 2,585 | 0.15 | 0.33 | 1.83 | 28 | |||||||||||||||||||||||||||||||||||||
Year ended 12/31/10 | 10.02 | 0.20 | 1.12 | 1.32 | (0.24 | ) | — | (0.24 | ) | 11.10 | 13.17 | 1,278 | 0.21 | 0.36 | 1.94 | 73 | ||||||||||||||||||||||||||||||||||||||||
Year ended 12/31/09 | 7.77 | 0.21 | 2.23 | 2.44 | (0.19 | ) | — | (0.19 | ) | 10.02 | 31.50 | 1,386 | 0.21 | 0.43 | 2.38 | 28 | ||||||||||||||||||||||||||||||||||||||||
Year ended 12/31/08(f) | 10.26 | 0.03 | (1.84 | ) | (1.81 | ) | (0.01 | ) | (0.67 | ) | (0.68 | ) | 7.77 | (17.65 | ) | 658 | 0.21 | (g) | 0.46 | (g) | 1.42 | (g) | 16 | |||||||||||||||||||||||||||||||||
Class R5 |
| |||||||||||||||||||||||||||||||||||||||||||||||||||||||
Year ended 12/31/12 | 10.78 | 0.23 | 1.38 | 1.61 | (0.37 | ) | — | (0.37 | ) | 12.02 | 14.95 | 211 | 0.15 | (e) | 0.16 | (e) | 1.86 | (e) | 10 | |||||||||||||||||||||||||||||||||||||
Year ended 12/31/11 | 11.17 | 0.21 | (0.29 | ) | (0.08 | ) | (0.31 | ) | — | (0.31 | ) | 10.78 | (0.78 | ) | 43 | 0.13 | 0.13 | 1.85 | 28 | |||||||||||||||||||||||||||||||||||||
Year ended 12/31/10 | 10.08 | 0.21 | 1.12 | 1.33 | (0.24 | ) | — | (0.24 | ) | 11.17 | 13.24 | 112 | 0.13 | 0.13 | 2.02 | 73 | ||||||||||||||||||||||||||||||||||||||||
Year ended 12/31/09 | 7.82 | 0.21 | 2.26 | 2.47 | (0.21 | ) | — | (0.21 | ) | 10.08 | 31.59 | 100 | 0.16 | 0.16 | 2.43 | 28 | ||||||||||||||||||||||||||||||||||||||||
Year ended 12/31/08 | 14.25 | 0.18 | (5.93 | ) | (5.75 | ) | (0.01 | ) | (0.67 | ) | (0.68 | ) | 7.82 | (40.36 | ) | 63 | 0.12 | 0.12 | 1.50 | 16 | ||||||||||||||||||||||||||||||||||||
| (a) | Calculated using average shares outstanding. |
| (b) | Includes adjustments in accordance with accounting principles generally accepted in the United States of America and as such, the net asset value for financial reporting purposes and the returns based upon those net asset values may differ from the net asset value and returns for shareholder transactions. Does not include sales charges and is not annualized for periods less than one year, if applicable. |
| (c) | In addition to the fees and expenses which the Fund bears directly; the Fund indirectly bears a pro rata share of the fees and expenses of the underlying funds in which the Fund invests. Because the underlying funds have varied expenses and fee levels and the Fund may own different proportions at different times, the amount of fees and expenses incurred indirectly by the Fund will vary. Estimated underlying fund expenses are not expenses that are incurred directly by your Fund. They are expenses that are incurred directly by the underlying funds and are deducted from the value of the funds your Fund invests in. The effect of the estimated underlying fund expenses that you bear indirectly is included in your Fund’s total return. Estimated acquired fund fees from underlying funds were 0.78%, 0.78%, 0.77%, 0.82% and 0.80% for the years ended December 31, 2012, December 31, 2011, December 31, 2010, December 31, 2009 and December 31, 2008, respectively. |
| (d) | Portfolio turnover is calculated at the fund level and is not annualized for periods less than one year, if applicable. For the period ending December 31, 2011, the portfolio turnover calculation excludes the value of securities purchased of $430,512,343 and sold of $117,636,196 in the effort to realign the Fund’s portfolio holdings after the reorganization of Invesco Moderate Growth Fund and Invesco Van Kampen Asset Allocation Growth Fund into the Fund. |
| (e) | Ratios are annualized and based on average daily net assets (000’s omitted) of $582,269, $105,816, $129,509, $23,549, $31,585, $2,564 and $80 for Class A, Class B, Class C, Class R, Class S, Class Y and Class R5 shares, respectively. |
| (f) | Commencement date of September 25, 2009 for Class S shares and October 3, 2008 for Class Y shares. |
| (g) | Annualized. |
36 Invesco Allocation Funds
NOTE 11—Financial Highlights—(continued)
Invesco Moderate Allocation Fund
| Net asset value, beginning of period | Net investment income(a) | Net gains (losses) on securities (both realized and unrealized) | Total from investment operations | Dividends from net investment income | Distributions from net realized gains | Total distributions | Net asset value, end of period | Total return(b) | Net assets, end of period (000s omitted) | Ratio of expenses to average net assets with fee waivers and/or expense reimbursements(c) | Ratio of expenses to average net assets without fee waivers and/or expense reimbursements | Ratio of net investment income to average net assets | Portfolio turnover(d) | |||||||||||||||||||||||||||||||||||||||||||
Class A |
| |||||||||||||||||||||||||||||||||||||||||||||||||||||||
Year ended 12/31/12 | $ | 10.39 | $ | 0.24 | $ | 1.13 | $ | 1.37 | $ | (0.44 | ) | $ | — | $ | (0.44 | ) | $ | 11.32 | 13.18 | % | $ | 537,812 | 0.43 | %(e) | 0.48 | %(e) | 2.10 | %(e) | 11 | % | ||||||||||||||||||||||||||
Year ended 12/31/11 | 10.50 | 0.24 | (0.11 | ) | 0.13 | (0.24 | ) | — | (0.24 | ) | 10.39 | 1.26 | 481,483 | 0.37 | 0.51 | 2.30 | 26 | |||||||||||||||||||||||||||||||||||||||
Year ended 12/31/10 | 9.63 | 0.29 | 0.86 | 1.15 | (0.28 | ) | — | (0.28 | ) | 10.50 | 12.03 | 334,067 | 0.37 | 0.52 | 2.87 | 69 | ||||||||||||||||||||||||||||||||||||||||
Year ended 12/31/09 | 7.87 | 0.31 | 1.80 | 2.11 | (0.35 | ) | — | (0.35 | ) | 9.63 | 26.86 | 312,736 | 0.37 | 0.57 | 3.64 | 21 | ||||||||||||||||||||||||||||||||||||||||
Year ended 12/31/08 | 12.35 | 0.40 | (4.25 | ) | (3.85 | ) | (0.30 | ) | (0.33 | ) | (0.63 | ) | 7.87 | (31.11 | ) | 294,668 | 0.37 | 0.52 | 3.76 | 13 | ||||||||||||||||||||||||||||||||||||
Class B |
| |||||||||||||||||||||||||||||||||||||||||||||||||||||||
Year ended 12/31/12 | 10.35 | 0.15 | 1.13 | 1.28 | (0.35 | ) | — | (0.35 | ) | 11.28 | 12.37 | 80,029 | 1.18 | (e) | 1.23 | (e) | 1.35 | (e) | 11 | |||||||||||||||||||||||||||||||||||||
Year ended 12/31/11 | 10.46 | 0.16 | (0.10 | ) | 0.06 | (0.17 | ) | — | (0.17 | ) | 10.35 | 0.52 | 93,053 | 1.12 | 1.26 | 1.55 | 26 | |||||||||||||||||||||||||||||||||||||||
Year ended 12/31/10 | 9.59 | 0.21 | 0.87 | 1.08 | (0.21 | ) | — | (0.21 | ) | 10.46 | 11.25 | 79,150 | 1.12 | 1.27 | 2.12 | 69 | ||||||||||||||||||||||||||||||||||||||||
Year ended 12/31/09 | 7.85 | 0.25 | 1.77 | 2.02 | (0.28 | ) | — | (0.28 | ) | 9.59 | 25.80 | 85,714 | 1.12 | 1.32 | 2.89 | 21 | ||||||||||||||||||||||||||||||||||||||||
Year ended 12/31/08 | 12.27 | 0.32 | (4.20 | ) | (3.88 | ) | (0.21 | ) | (0.33 | ) | (0.54 | ) | 7.85 | (31.57 | ) | 85,928 | 1.12 | 1.27 | 3.01 | 13 | ||||||||||||||||||||||||||||||||||||
Class C |
| |||||||||||||||||||||||||||||||||||||||||||||||||||||||
Year ended 12/31/12 | 10.34 | 0.15 | 1.13 | 1.28 | (0.35 | ) | — | (0.35 | ) | 11.27 | 12.38 | 123,505 | 1.18 | (e) | 1.23 | (e) | 1.35 | (e) | 11 | |||||||||||||||||||||||||||||||||||||
Year ended 12/31/11 | 10.46 | 0.16 | (0.11 | ) | 0.05 | (0.17 | ) | — | (0.17 | ) | 10.34 | 0.42 | 115,040 | 1.12 | 1.26 | 1.55 | 26 | |||||||||||||||||||||||||||||||||||||||
Year ended 12/31/10 | 9.59 | 0.21 | 0.87 | 1.08 | (0.21 | ) | — | (0.21 | ) | 10.46 | 11.26 | 104,060 | 1.12 | 1.27 | 2.12 | 69 | ||||||||||||||||||||||||||||||||||||||||
Year ended 12/31/09 | 7.85 | 0.25 | 1.77 | 2.02 | (0.28 | ) | — | (0.28 | ) | 9.59 | 25.80 | 99,807 | 1.12 | 1.32 | 2.89 | 21 | ||||||||||||||||||||||||||||||||||||||||
Year ended 12/31/08 | 12.27 | 0.32 | (4.20 | ) | (3.88 | ) | (0.21 | ) | (0.33 | ) | (0.54 | ) | 7.85 | (31.57 | ) | 88,392 | 1.12 | 1.27 | 3.01 | 13 | ||||||||||||||||||||||||||||||||||||
Class R |
| |||||||||||||||||||||||||||||||||||||||||||||||||||||||
Year ended 12/31/12 | 10.38 | 0.21 | 1.13 | 1.34 | (0.41 | ) | — | (0.41 | ) | 11.31 | 12.91 | 20,557 | 0.68 | (e) | 0.73 | (e) | 1.85 | (e) | 11 | |||||||||||||||||||||||||||||||||||||
Year ended 12/31/11 | 10.49 | 0.22 | (0.11 | ) | 0.11 | (0.22 | ) | — | (0.22 | ) | 10.38 | 1.01 | 17,906 | 0.62 | 0.76 | 2.05 | 26 | |||||||||||||||||||||||||||||||||||||||
Year ended 12/31/10 | 9.62 | 0.26 | 0.87 | 1.13 | (0.26 | ) | — | (0.26 | ) | 10.49 | 11.77 | 21,639 | 0.62 | 0.77 | 2.62 | 69 | ||||||||||||||||||||||||||||||||||||||||
Year ended 12/31/09 | 7.87 | 0.29 | 1.79 | 2.08 | (0.33 | ) | — | (0.33 | ) | 9.62 | 26.44 | 18,886 | 0.62 | 0.82 | 3.39 | 21 | ||||||||||||||||||||||||||||||||||||||||
Year ended 12/31/08 | 12.33 | 0.37 | (4.23 | ) | (3.86 | ) | (0.27 | ) | (0.33 | ) | (0.60 | ) | 7.87 | (31.24 | ) | 14,176 | 0.62 | 0.77 | 3.51 | 13 | ||||||||||||||||||||||||||||||||||||
Class S |
| |||||||||||||||||||||||||||||||||||||||||||||||||||||||
Year ended 12/31/12 | 10.38 | 0.25 | 1.13 | 1.38 | (0.45 | ) | — | (0.45 | ) | 11.31 | 13.31 | 36,651 | 0.33 | (e) | 0.38 | (e) | 2.20 | (e) | 11 | |||||||||||||||||||||||||||||||||||||
Year ended 12/31/11 | 10.49 | 0.25 | (0.11 | ) | 0.14 | (0.25 | ) | — | (0.25 | ) | 10.38 | 1.35 | 35,229 | 0.27 | 0.41 | 2.40 | 26 | |||||||||||||||||||||||||||||||||||||||
Year ended 12/31/10 | 9.62 | 0.30 | 0.86 | 1.16 | (0.29 | ) | — | (0.29 | ) | 10.49 | 12.15 | 34,746 | 0.27 | 0.42 | 2.97 | 69 | ||||||||||||||||||||||||||||||||||||||||
Year ended 12/31/09(f) | 9.48 | 0.10 | 0.39 | 0.49 | (0.35 | ) | — | (0.35 | ) | 9.62 | 5.23 | 18,006 | 0.27 | (g) | 0.40 | (g) | 3.74 | (g) | 21 | |||||||||||||||||||||||||||||||||||||
Class Y |
| |||||||||||||||||||||||||||||||||||||||||||||||||||||||
Year ended 12/31/12 | 10.39 | 0.27 | 1.13 | 1.40 | (0.47 | ) | — | (0.47 | ) | 11.32 | 13.46 | 3,319 | 0.18 | (e) | 0.23 | (e) | 2.35 | (e) | 11 | |||||||||||||||||||||||||||||||||||||
Year ended 12/31/11 | 10.50 | 0.27 | (0.11 | ) | 0.16 | (0.27 | ) | — | (0.27 | ) | 10.39 | 1.49 | 1,851 | 0.12 | 0.26 | 2.55 | 26 | |||||||||||||||||||||||||||||||||||||||
Year ended 12/31/10 | 9.62 | 0.31 | 0.88 | 1.19 | (0.31 | ) | — | (0.31 | ) | 10.50 | 12.42 | 1,085 | 0.12 | 0.27 | 3.12 | 69 | ||||||||||||||||||||||||||||||||||||||||
Year ended 12/31/09 | 7.87 | 0.34 | 1.78 | 2.12 | (0.37 | ) | — | (0.37 | ) | 9.62 | 27.02 | 1,131 | 0.12 | 0.32 | 3.89 | 21 | ||||||||||||||||||||||||||||||||||||||||
Year ended 12/31/08(f) | 9.77 | 0.08 | (1.34 | ) | (1.26 | ) | (0.31 | ) | (0.33 | ) | (0.64 | ) | 7.87 | (12.84 | ) | 680 | 0.12 | (g) | 0.33 | (g) | 4.01 | (g) | 13 | |||||||||||||||||||||||||||||||||
Class R5 |
| |||||||||||||||||||||||||||||||||||||||||||||||||||||||
Year ended 12/31/12 | 10.42 | 0.27 | 1.13 | 1.40 | (0.47 | ) | — | (0.47 | ) | 11.35 | 13.49 | 444 | 0.13 | (e) | 0.13 | (e) | 2.40 | (e) | 11 | |||||||||||||||||||||||||||||||||||||
Year ended 12/31/11 | 10.53 | 0.27 | (0.11 | ) | 0.16 | (0.27 | ) | — | (0.27 | ) | 10.42 | 1.50 | 1,110 | 0.10 | 0.10 | 2.57 | 26 | |||||||||||||||||||||||||||||||||||||||
Year ended 12/31/10 | 9.66 | 0.32 | 0.86 | 1.18 | (0.31 | ) | — | (0.31 | ) | 10.53 | 12.28 | 1,061 | 0.11 | 0.11 | 3.13 | 69 | ||||||||||||||||||||||||||||||||||||||||
Year ended 12/31/09 | 7.89 | 0.34 | 1.80 | 2.14 | (0.37 | ) | — | (0.37 | ) | 9.66 | 27.21 | 11 | 0.13 | 0.19 | 3.88 | 21 | ||||||||||||||||||||||||||||||||||||||||
Year ended 12/31/08 | 12.39 | 0.43 | (4.27 | ) | (3.84 | ) | (0.33 | ) | (0.33 | ) | (0.66 | ) | 7.89 | (30.92 | ) | 8 | 0.13 | 0.17 | 4.00 | 13 | ||||||||||||||||||||||||||||||||||||
| (a) | Calculated using average shares outstanding. |
| (b) | Includes adjustments in accordance with accounting principles generally accepted in the United States of America and as such, the net asset value for financial reporting purposes and the returns based upon those net asset values may differ from the net asset value and returns for shareholder transactions. Does not include sales charges and is not annualized for periods less than one year, if applicable. |
| (c) | In addition to the fees and expenses which the Fund bears directly; the Fund indirectly bears a pro rata share of the fees and expenses of the underlying funds in which the Fund invests. Because the underlying funds have varied expenses and fee levels and the Fund may own different proportions at different times, the amount of fees and expenses incurred indirectly by the Fund will vary. Estimated underlying fund expenses are not expenses that are incurred directly by your Fund. They are expenses that are incurred directly by the underlying funds and are deducted from the value of the funds your Fund invests in. The effect of the estimated underlying fund expenses that you bear indirectly is included in your Fund’s total return. Estimated acquired fund fees from underlying funds were 0.72%, 0.72%, 0.71%, 0.72% and 0.75% for the years ended December 31, 2012, December 31, 2011, December 31, 2010, December 31, 2009 and December 31, 2008, respectively. |
| (d) | Portfolio turnover is calculated at the fund level and is not annualized for periods less than one year, if applicable. For the period ending December 31, 2011, the portfolio turnover calculation excludes the value of securities purchased of $218,592,415 and sold of $61,446,608 in the effort to realign the Fund’s portfolio holdings after the reorganization of Invesco Van Kampen Asset Allocation Moderate Fund into the Fund. |
| (e) | Ratios are annualized and based on average daily net assets (000’s omitted) of $513,008, $88,789, $119,939, $19,621, $36,331, $2,926 and $933 for Class A, Class B, Class C, Class R, Class S, Class Y and Class R5 shares, respectively. |
| (f) | Commencement date of September 25, 2009 for Class S shares and October 3, 2008 for Class Y shares. |
| (g) | Annualized. |
NOTE 12—Significant Event
The Board of Trustees unanimously approved an Agreement and Plan of Reorganization (the “Agreement”) pursuant to which Invesco Growth Allocation Fund (the “Acquiring Fund”) would acquire all of the assets and liabilities of Invesco Leaders Fund (the “Target Fund”) in exchange for shares of the Acquiring Fund (the “Reorganization”).
The Agreement requires approval of the Target Fund’s shareholders and will be submitted to the shareholders for their consideration at a meeting to be held in or around April 2013. Upon closing of the Reorganization, shareholders of the Target Fund will receive a corresponding class of shares of the Acquiring Fund in exchange for their shares of the Target Fund and the Target Fund will liquidate and cease operations.
37 Invesco Allocation Funds
Report of Independent Registered Public Accounting Firm
To the Board of Trustees of AIM Growth Series (Invesco Growth Series)
and Shareholders of Invesco Conservative Allocation Fund,
Invesco Growth Allocation Fund
and Invesco Moderate Allocation Fund:
In our opinion, the accompanying statements of assets and liabilities, including the schedules of investments, and the related statements of operations and of changes in net assets and the financial highlights present fairly, in all material respects, the financial position of Invesco Conservative Allocation Fund, Invesco Growth Allocation Fund and Invesco Moderate Allocation Fund (three of the funds constituting AIM Growth Series (Invesco Growth Series), hereafter referred to as the “Funds”) at December 31, 2012, the results of each of their operations for the year then ended, the changes in each of their net assets for each of the two years in the period then ended and each of their financial highlights for each of the five years in the period then ended, in conformity with accounting principles generally accepted in the United States of America. These financial statements and financial highlights (hereafter referred to as “financial statements”) are the responsibility of the Funds’ management; our responsibility is to express an opinion on these financial statements based on our audits. We conducted our audits of these financial statements in accordance with the standards of the Public Company Accounting Oversight Board (United States). Those standards require that we plan and perform the audit to obtain reasonable assurance about whether the financial statements are free of material misstatement. An audit includes examining, on a test basis, evidence supporting the amounts and disclosures in the financial statements, assessing the accounting principles used and significant estimates made by management, and evaluating the overall financial statement presentation. We believe that our audits, which included confirmation of securities at December 31, 2012 by correspondence with the custodian and transfer agent, provide a reasonable basis for our opinion.
PRICEWATERHOUSECOOPERS LLP
February 25, 2013
Houston, Texas
38 Invesco Allocation Funds
Calculating your ongoing Fund expenses
Example
As a shareholder of the Fund, you incur two types of costs: (1) transaction costs, which may include sales charges (loads) on purchase payments or contingent deferred sales charges on redemptions, and redemption fees, if any; and (2) ongoing costs, including distribution and/or service (12b-1) fees, and other Fund expenses. This example is intended to help you understand your ongoing costs (in dollars) of investing in the Fund and to compare these costs with ongoing costs of investing in other mutual funds. The example is based on an investment of $1,000 invested at the beginning of the period and held for the entire period July 1, 2012, through December 31, 2012.
In addition to the fees and expenses which the Fund bears directly, the Fund indirectly bears a pro rata share of the fees and expenses of the underlying funds in which your Fund invests. The amount of fees and expenses incurred indirectly by your Fund will vary because the underlying funds have varied expenses and fee levels and the Fund may own different proportions of the underlying funds at different times. Estimated underlying fund expenses are not expenses that are incurred directly by your Fund. They are expenses that are incurred directly by the underlying funds and are deducted from the value of the underlying funds your Fund invests in. The effect of the estimated underlying fund expenses that you bear indirectly are included in your Fund’s total return.
Actual expenses
The table below provides information about actual account values and actual expenses. You may use the information in this table, together with the amount you invested, to estimate the expenses that you paid over the period. Simply divide your account value by $1,000 (for example, an $8,600 account value divided by $1,000 = 8.6), then multiply the result by the number in the table under the heading entitled “Actual Expenses Paid During Period” to estimate the expenses you paid on your account during this period.
Hypothetical example for comparison purposes
The table below also provides information about hypothetical account values and hypothetical expenses based on the Fund’s actual expense ratio and an assumed rate of return of 5% per year before expenses, which is not the Fund’s actual return.
The hypothetical account values and expenses may not be used to estimate the actual ending account balance or expenses you paid for the period. You may use this information to compare the ongoing costs of investing in the Fund and other funds. To do so, compare this 5% hypothetical example with the 5% hypothetical examples that appear in the shareholder reports of the other funds.
Please note that the expenses shown in the table are meant to highlight your ongoing costs only and do not reflect any transaction costs, such as sales charges (loads) on purchase payments, contingent deferred sales charges on redemptions, and redemption fees, if any. Therefore, the hypothetical information is useful in comparing ongoing costs only, and will not help you determine the relative total costs of owning different funds. In addition, expenses shown in the table do not include the expenses of the underlying funds, which are borne indirectly by the Fund. If transaction costs and indirect expenses were included, your costs would have been higher.
Invesco Conservative Allocation Fund
| Class | Beginning Account Value (07/01/12) | ACTUAL | HYPOTHETICAL (5% annual return before expenses) | Annualized Expense Ratio | ||||||||||||||||||||
| Ending Account Value (12/31/12)1 | Expenses Paid During Period2 | Ending Account Value (12/31/12) | Expenses Paid During Period2 | |||||||||||||||||||||
| A | $ | 1,000.00 | $ | 1,056.50 | $ | 2.69 | $ | 1,022.52 | $ | 2.64 | 0.52 | % | ||||||||||||
| B | 1,000.00 | 1,051.10 | 6.55 | 1,018.75 | 6.44 | 1.27 | ||||||||||||||||||
| C | 1,000.00 | 1,051.00 | 6.55 | 1,018.75 | 6.44 | 1.27 | ||||||||||||||||||
| R | 1,000.00 | 1,054.00 | 3.98 | 1,021.27 | 3.91 | 0.77 | ||||||||||||||||||
| S | 1,000.00 | 1,055.50 | 2.17 | 1,023.03 | 2.14 | 0.42 | ||||||||||||||||||
| Y | 1,000.00 | 1,057.10 | 1.40 | 1,023.78 | 1.37 | 0.27 | ||||||||||||||||||
| R5 | 1,000.00 | 1,057.30 | 1.14 | 1,024.03 | 1.12 | 0.22 | ||||||||||||||||||
39 Invesco Allocation Funds
Invesco Growth Allocation Fund
| Class | Beginning Account Value (07/01/12) | ACTUAL | HYPOTHETICAL (5% annual return before expenses) | Annualized Expense Ratio | ||||||||||||||||||||
| Ending Account Value (12/31/12)1 | Expenses Paid During Period2 | Ending Account Value (12/31/12) | Expenses Paid During Period2 | |||||||||||||||||||||
| A | $ | 1,000.00 | $ | 1,081.30 | $ | 2.83 | $ | 1,022.42 | $ | 2.75 | 0.54 | % | ||||||||||||
| B | 1,000.00 | 1,076.60 | 6.73 | 1,018.65 | 6.55 | 1.29 | ||||||||||||||||||
| C | 1,000.00 | 1,076.60 | 6.73 | 1,018.65 | 6.55 | 1.29 | ||||||||||||||||||
| R | 1,000.00 | 1,079.70 | 4.13 | 1,021.17 | 4.01 | 0.79 | ||||||||||||||||||
| S | 1,000.00 | 1,081.50 | 2.30 | 1,022.92 | 2.24 | 0.44 | ||||||||||||||||||
| Y | 1,000.00 | 1,082.20 | 1.52 | 1,023.68 | 1.48 | 0.29 | ||||||||||||||||||
| R5 | 1,000.00 | 1,083.20 | 0.84 | 1,024.33 | 0.81 | 0.16 | ||||||||||||||||||
Invesco Moderate Allocation Fund
| Class | Beginning Account Value (07/01/12) | ACTUAL | HYPOTHETICAL (5% annual return before expenses) | Annualized Expense Ratio | ||||||||||||||||||||
| Ending Account Value (12/31/12)1 | Expenses Paid During Period2 | Ending Account Value (12/31/12) | Expenses Paid During Period2 | |||||||||||||||||||||
| A | $ | 1,000.00 | $ | 1,070.00 | $ | 2.50 | $ | 1,022.72 | $ | 2.44 | 0.48 | % | ||||||||||||
| B | 1,000.00 | 1,066.00 | 6.39 | 1,018.95 | 6.24 | 1.23 | ||||||||||||||||||
| C | 1,000.00 | 1,066.10 | 6.39 | 1,018.95 | 6.24 | 1.23 | ||||||||||||||||||
| R | 1,000.00 | 1,068.40 | 3.80 | 1,021.47 | 3.71 | 0.73 | ||||||||||||||||||
| S | 1,000.00 | 1,070.20 | 1.98 | 1,023.23 | 1.93 | 0.38 | ||||||||||||||||||
| Y | 1,000.00 | 1,070.70 | 1.20 | 1,023.98 | 1.17 | 0.23 | ||||||||||||||||||
| R5 | 1,000.00 | 1,071.10 | 0.89 | 1,024.28 | 0.87 | 0.17 | ||||||||||||||||||
| 1 | The actual ending account value is based on the actual total return of the Funds for the period July 1, 2012, through December 31, 2012, after actual expenses and will differ from the hypothetical ending account value which is based on each Fund’s expense ratio and a hypothetical annual return of 5% before expenses. |
| 2 | Expenses are equal to each Fund’s annualized expense ratio as indicated above multiplied by the average account value over the period, multiplied by 184/366 to reflect the most recent fiscal half year. |
40 Invesco Allocation Funds
Tax Information
Form 1099-DIV, Form 1042-S and other year–end tax information provide shareholders with actual calendar year amounts that should be included in their tax returns. Shareholders should consult their tax advisors.
The following distribution information is being provided as required by the Internal Revenue Code or to meet a specific state’s requirement.
The Funds designate the following amounts or, if subsequently determined to be different, the maximum amount allowable for its fiscal year ended December 31, 2012:
Federal and State Income Tax | ||||||||||||||||
| Long Term Capital Gain Distributions | Qualified Dividend Income* | Corporate Dividends Received Deduction* | U.S. Treasury Obligations* | |||||||||||||
Invesco Conservative Allocation Fund | $ | — | 18.75 | % | 9.76 | % | 10.41 | % | ||||||||
Invesco Growth Allocation Fund | — | 63.00 | % | 32.00 | % | 1.25 | % | |||||||||
Invesco Moderate Allocation Fund | — | 34.77 | % | 17.71 | % | 5.88 | % | |||||||||
| * | The above percentages are based on ordinary income dividends paid to shareholders during the Fund’s fiscal year. |
41 Invesco Allocation Funds
Trustees and Officers
The address of each trustee and officer is AIM Growth Series (Invesco Growth Series) (the “Trust”), 11 Greenway Plaza, Suite 1000, Houston, Texas 77046-1173. The trustees serve for the life of the Trust, subject to their earlier death, incapacitation, resignation, retirement or removal as more specifically provided in the Trust’s organizational documents. Each officer serves for a one year term or until their successors are elected and qualified. Column two below includes length of time served with predecessor entities, if any.
| Name, Year of Birth and Position(s) Held with the Trust | Trustee and/ or Officer Since | Principal Occupation(s) During Past 5 Years | Number of Funds in Fund Complex Overseen by Trustee | Other Directorship(s) Held by Trustee During Past 5 Years | ||||
| Interested Persons | ||||||||
| Martin L. Flanagan1 — 1960 Trustee | 2007 | Executive Director, Chief Executive Officer and President, Invesco Ltd. (ultimate parent of Invesco and a global investment management firm); Advisor to the Board, Invesco Advisers, Inc. (formerly known as Invesco Institutional (N.A.), Inc.); Trustee, The Invesco Funds; Vice Chair, Investment Company Institute; and Member of Executive Board, SMU Cox School of Business
Formerly: Chairman and Chief Executive Officer, Invesco Advisers, Inc. (registered investment adviser); Director, Chairman, Chief Executive Officer and President, IVZ Inc. (holding company), INVESCO Group Services, Inc. (service provider) and Invesco North American Holdings, Inc. (holding company); Director, Chief Executive Officer and President, Invesco Holding Company Limited (parent of Invesco and a global investment management firm); Director, Invesco Ltd.; Chairman, Investment Company Institute and President, Co-Chief Executive Officer, Co-President, Chief Operating Officer and Chief Financial Officer, Franklin Resources, Inc. (global investment management organization) | 124 | None | ||||
Philip A. Taylor2 — 1954 Trustee, President and Principal Executive Officer | 2006 | Head of North American Retail and Senior Managing Director, Invesco Ltd.; Director, Co-Chairman, Co-President and Co-Chief Executive Officer, Invesco Advisers, Inc. (formerly known as Invesco Institutional (N.A.), Inc.) (registered investment adviser); Director, Chairman, Chief Executive Officer and President, Invesco Management Group, Inc. (formerly known as Invesco Aim Management Group, Inc.) (financial services holding company); Director and President, INVESCO Funds Group, Inc. (registered investment adviser and registered transfer agent); Director and Chairman, Invesco Investment Services, Inc. (formerly known as Invesco Aim Investment Services, Inc.) (registered transfer agent) and IVZ Distributors, Inc. (formerly known as INVESCO Distributors, Inc.) (registered broker dealer); Director, President and Chairman, Invesco Inc. (holding company) and Invesco Canada Holdings Inc. (holding company); Chief Executive Officer, Invesco Corporate Class Inc. (corporate mutual fund company) and Invesco Canada Fund Inc. (corporate mutual fund company); Director, Chairman and Chief Executive Officer, Invesco Canada Ltd. (formerly known as Invesco Trimark Ltd./Invesco Trimark Ltèe) (registered investment adviser and registered transfer agent); Trustee, President and Principal Executive Officer, The Invesco Funds (other than AIM Treasurer’s Series Trust (Invesco Treasurer’s Series Trust) and Short-Term Investments Trust); Trustee and Executive Vice President, The Invesco Funds (AIM Treasurer’s Series Trust (Invesco Treasurer’s Series Trust) and Short-Term Investments Trust only); Director, Invesco Investment Advisers LLC (formerly known as Van Kampen Asset Management); Director, Chief Executive Officer and President, Van Kampen Exchange Corp.
Formerly: Director and Chairman, Van Kampen Investor Services Inc.: Director, Chief Executive Officer and President, 1371 Preferred Inc. (holding company); and Van Kampen Investments Inc.; Director and President, AIM GP Canada Inc. (general partner for limited partnerships); and Van Kampen Advisors, Inc.; Director and Chief Executive Officer, Invesco Trimark Dealer Inc. (registered broker dealer); Director, Invesco Distributors, Inc. (formerly known as Invesco Aim Distributors, Inc.) (registered broker dealer); Manager, Invesco PowerShares Capital Management LLC; Director, Chief Executive Officer and President, Invesco Advisers, Inc.; Director, Chairman, Chief Executive Officer and President, Invesco Aim Capital Management, Inc.; President, Invesco Trimark Dealer Inc. and Invesco Trimark Ltd./Invesco Trimark Ltèe; Director and President, AIM Trimark Corporate Class Inc. and AIM Trimark Canada Fund Inc.; Senior Managing Director, Invesco Holding Company Limited; Trustee and Executive Vice President, Tax-Free Investments Trust; Director and Chairman, Fund Management Company (former registered broker dealer); President and Principal Executive Officer, The Invesco Funds (AIM Treasurer’s Series Trust (Invesco Treasurer’s Series Trust), Short-Term Investments Trust and Tax-Free Investments Trust only); President, AIM Trimark Global Fund Inc. and AIM Trimark Canada Fund Inc. | 124 | None | ||||
Wayne W. Whalen3 — 1939 Trustee | 2010 | Of Counsel, and prior to 2010, partner in the law firm of Skadden, Arps, Slate, Meagher & Flom LLP, legal counsel to certain funds in the Fund Complex
| 137 | Director of the Mutual Fund Directors Forum, a nonprofit membership organization for investment directors; Chairman and Director of the Abraham Lincoln Presidential Library Foundation; and Director of the Stevenson Center for Democracy |
| 1 | Mr. Flanagan is considered an interested person of the Trust because he is an officer of the adviser to the Trust, and an officer and a director of Invesco Ltd., ultimate parent of the adviser to the Trust. |
| 2 | Mr. Taylor is considered an interested person of the Trust because he is an officer and a director of the adviser to, and a director of the principal underwriter of, the Trust. |
| 3 | Mr. Whalen is considered an “interested person” (within the meaning of Section 2(a)(19) of the 1940 Act) of certain Funds in the Invesco Fund Complex by reason of he and his firm currently providing legal services as legal counsel to such Funds in the Invesco Fund Complex. |
T-1 Invesco Allocation Funds
Trustees and Officers—(continued)
| Name, Year of Birth and Position(s) Held with the Trust | Trustee and/ or Officer Since | Principal Occupation(s) During Past 5 Years | Number of Funds in Fund Complex Overseen by Trustee | Other Directorship(s) Held by Trustee During Past 5 Years | ||||
| Independent Trustees | ||||||||
Bruce L. Crockett — 1944 Trustee and Chair | 2001 | Chairman, Crockett Technologies Associates (technology consulting company)
Formerly: Director, Captaris (unified messaging provider); Director, President and Chief Executive Officer COMSAT Corporation; and Chairman, Board of Governors of INTELSAT (international communications company) | 124 | ACE Limited (insurance company); and Investment Company Institute | ||||
David C. Arch — 1945 Trustee | 2010 | Chairman and Chief Executive Officer of Blistex Inc., (consumer health care products manufacturer)
Formerly: Member of the Heartland Alliance Advisory Board, a nonprofit organization serving human needs based in Chicago | 137 | Board member of the Illinois Manufacturers’ Association; Member of the Board of Visitors, Institute for the Humanities, University of Michigan | ||||
Frank S. Bayley — 1939 Trustee | 1985 | Retired
Formerly: Director, Badgley Funds, Inc. (registered investment company) (2 portfolios) and General Partner and Of Counsel, law firm of Baker & McKenzie, LLP | 124 | Director and Chairman, C.D. Stimson Company (a real estate investment company); Trustee and Overseer, The Curtis institute of Music | ||||
James T. Bunch — 1942 Trustee | 2003 | Managing Member, Grumman Hill Group LLC (family office private equity management)
Formerly: Founder, Green, Manning & Bunch Ltd. (investment banking firm) (1988-2010); Executive Committee, United States Golf Association; and Director, Policy Studies, Inc. and Van Gilder Insurance Corporation | 124 | Chairman, Board of Governors, Western Golf Association; Chairman-elect, Evans Scholars Foundation; and Director, Denver Film Society | ||||
Rodney F. Dammeyer — 1940 Trustee | 2010 | Chairman of CAC, LLC, (private company offering capital investment and management advisory services)
Formerly: Prior to 2001, Managing Partner at Equity Group Corporate Investments; Prior to 1995, Vice Chairman of Anixter International; Prior to 1985, experience includes Senior Vice President and Chief Financial Officer of Household International, Inc., Executive Vice President and Chief Financial Officer of Northwest Industries, Inc. and Partner of Arthur Andersen & Co.; From 1987 to 2010, Director/Trustee of investment companies in the Van Kampen Funds complex | 126 | Director of Quidel Corporation and Stericycle, Inc.; Prior to May 2008, Trustee of The Scripps Research Institute; Prior to February 2008, Director of Ventana Medical Systems, Inc.; Prior to April 2007, Director of GATX Corporation; Prior to April 2004, Director of TheraSense, Inc. | ||||
Albert R. Dowden — 1941 Trustee | 2001 | Director of a number of public and private business corporations, including the Boss Group, Ltd. (private investment and management); Reich & Tang Funds (5 portfolios) (registered investment company); and Homeowners of America Holding Corporation/ Homeowners of America Insurance Company (property casualty company)
Formerly: Director, Continental Energy Services, LLC (oil and gas pipeline service); Director, CompuDyne Corporation (provider of product and services to the public security market) and Director, Annuity and Life Re (Holdings), Ltd. (reinsurance company); Director, President and Chief Executive Officer, Volvo Group North America, Inc.; Senior Vice President, AB Volvo; Director of various public and private corporations; Chairman, DHJ Media, Inc.; Director Magellan Insurance Company; and Director, The Hertz Corporation, Genmar Corporation (boat manufacturer), National Media Corporation; Advisory Board of Rotary Power International (designer, manufacturer, and seller of rotary power engines); and Chairman, Cortland Trust, Inc. (registered investment company) | 124 | Director of Nature’s Sunshine Products, Inc. | ||||
Jack M. Fields — 1952 Trustee | 2001 | Chief Executive Officer, Twenty First Century Group, Inc. (government affairs company); Owner and Chief Executive Officer, Dos Angeles Ranch, L.P. (cattle, hunting, corporate entertainment); and Discovery Global Education Fund (non-profit)
Formerly: Chief Executive Officer, Texana Timber LP (sustainable forestry company); Director of Cross Timbers Quail Research Ranch (non-profit); and member of the U.S. House of Representatives | 124 | Insperity, Inc. (formerly known as Administaff) | ||||
Prema Mathai-Davis — 1950 Trustee | 2001 | Retired
Formerly: Chief Executive Officer, YWCA of the U.S.A. | 124 | None | ||||
Larry Soll — 1942 Trustee | 2003 | Retired
Formerly: Chairman, Chief Executive Officer and President, Synergen Corp. (a biotechnology company) | 124 | None | ||||
Hugo F. Sonnenschein — 1940 Trustee | 2010 | Distinguished Service Professor and President Emeritus of the University of Chicago and the Adam Smith Distinguished Service Professor in the Department of Economics at the University of Chicago
Formerly: President of the University of Chicago | 137 | Trustee of the University of Rochester and a member of its investment committee. Member of the National Academy of Sciences, the American Philosophical Society and a fellow of the American Academy of Arts and Sciences |
T-2 Invesco Allocation Funds
Trustees and Officers—(continued)
| Name, Year of Birth and Position(s) Held with the Trust | Trustee and/ or Officer Since | Principal Occupation(s) During Past 5 Years | Number of Funds in Fund Complex Overseen by Trustee | Other Directorship(s) Held by Trustee During Past 5 Years | ||||
| Independent Trustees—(continued) | ||||||||
Raymond Stickel, Jr. — 1944 Trustee | 2005 | Retired
Formerly: Director, Mainstay VP Series Funds, Inc. (25 portfolios) and Partner, Deloitte & Touche | 124 | None | ||||
| Other Officers | ||||||||
| Russell C. Burk — 1958 Senior Vice President and Senior Officer | 2005 | Senior Vice President and Senior Officer, The Invesco Funds | N/A | N/A | ||||
| John M. Zerr — 1962 Senior Vice President, Chief Legal Officer and Secretary | 2006 | Director, Senior Vice President, Secretary and General Counsel, Invesco Management Group, Inc. (formerly known as Invesco Aim Management Group, Inc.) and Van Kampen Exchange Corp.; Senior Vice President, Invesco Advisers, Inc. (formerly known as Invesco Institutional (N.A.), Inc.) (registered investment adviser); Senior Vice President and Secretary, Invesco Distributors, Inc. (formerly known as Invesco Aim Distributors, Inc.); Director, Vice President and Secretary, Invesco Investment Services, Inc. (formerly known as Invesco Aim Investment Services, Inc.) and IVZ Distributors, Inc. (formerly known as INVESCO Distributors, Inc.); Director and Vice President, INVESCO Funds Group, Inc.; Senior Vice President, Chief Legal Officer and Secretary, The Invesco Funds; Manager, Invesco PowerShares Capital Management LLC; Director, Secretary and General Counsel, Invesco Investment Advisers LLC (formerly known as Van Kampen Asset Management); Secretary and General Counsel, Van Kampen Funds Inc. and Chief Legal Officer, PowerShares Exchange-Traded Fund Trust, PowerShares Exchange-Traded Fund Trust II, PowerShares India Exchange-Traded Fund Trust and PowerShares Actively Managed Exchange-Traded Fund Trust
Formerly: Director and Vice President, Van Kampen Advisors Inc.; Director, Vice President, Secretary and General Counsel Van Kampen Investor Services Inc.; Director, Invesco Distributors, Inc. (formerly known as Invesco Aim Distributors, Inc.); Director, Senior Vice President, General Counsel and Secretary, Invesco Advisers, Inc. and Van Kampen Investments Inc.; Director, Vice President and Secretary, Fund Management Company; Director, Senior Vice President, Secretary, General Counsel and Vice President, Invesco Aim Capital Management, Inc.; Chief Operating Officer and General Counsel, Liberty Ridge Capital, Inc. (an investment adviser); Vice President and Secretary, PBHG Funds (an investment company) and PBHG Insurance Series Fund (an investment company); Chief Operating Officer, General Counsel and Secretary, Old Mutual Investment Partners (a broker-dealer); General Counsel and Secretary, Old Mutual Fund Services (an administrator) and Old Mutual Shareholder Services (a shareholder servicing center); Executive Vice President, General Counsel and Secretary, Old Mutual Capital, Inc. (an investment adviser); and Vice President and Secretary, Old Mutual Advisors Funds (an investment company) | N/A | N/A | ||||
| Karen Dunn Kelley — 1960 Vice President | 2004 | Head of Invesco’s World Wide Fixed Income and Cash Management Group; Senior Vice President, Invesco Management Group, Inc. (formerly known as Invesco Aim Management Group, Inc.) and Invesco Advisers, Inc. (formerly known as Invesco Institutional (N.A.), Inc.) (registered investment adviser); Executive Vice President, Invesco Distributors, Inc. (formerly known as Invesco Aim Distributors, Inc.); Director, Invesco Mortgage Capital Inc., INVESCO Global Asset Management Limited, Invesco Management Company Limited and INVESCO Management S.A.; Vice President, The Invesco Funds (other than AIM Treasurer’s Series Trust (Invesco Treasurer’s Series Trust) and Short-Term Investments Trust); and President and Principal Executive Officer, The Invesco Funds (AIM Treasurer’s Series Trust (Invesco Treasurer’s Series Trust) and Short-Term Investments Trust only)
Formerly: Senior Vice President, Van Kampen Investments Inc.; Vice President, Invesco Advisers, Inc. (formerly known as Invesco Institutional (N.A.), Inc.); Director of Cash Management and Senior Vice President, Invesco Advisers, Inc. and Invesco Aim Capital Management, Inc.; President and Principal Executive Officer, Tax-Free Investments Trust; Director and President, Fund Management Company; Chief Cash Management Officer, Director of Cash Management, Senior Vice President, and Managing Director, Invesco Aim Capital Management, Inc.; Director of Cash Management, Senior Vice President, and Vice President, Invesco Advisers, Inc. and The Invesco Funds (AIM Treasurer’s Series Trust (Invesco Treasurer’s Series Trust), Short-Term Investments Trust and Tax-Free Investments Trust only) | N/A | N/A | ||||
T-3 Invesco Allocation Funds
Trustees and Officers—(continued)
| Name, Year of Birth and Position(s) Held with the Trust | Trustee and/ or Officer Since | Principal Occupation(s) During Past 5 Years | Number of Funds in Fund Complex Overseen by Trustee | Other Directorship(s) Held by Trustee During Past 5 Years | ||||
| Other Officers—(continued) | ||||||||
| Sheri Morris — 1964 Vice President, Treasurer and Principal Financial Officer | 1999 | Vice President, Treasurer and Principal Financial Officer, The Invesco Funds; Vice President, Invesco Advisers, Inc. (formerly known as Invesco Institutional (N.A.), Inc.) (registered investment adviser); and Vice President, PowerShares Exchange-Traded Fund Trust, PowerShares Exchange-Traded Fund Trust II, PowerShares India Exchange-Traded Fund Trust and PowerShares Actively Managed Exchange-Traded Fund Trust
Formerly: Vice President, Invesco Aim Advisers, Inc., Invesco Aim Capital Management, Inc. and Invesco Aim Private Asset Management, Inc.; Assistant Vice President and Assistant Treasurer, The Invesco Funds and Assistant Vice President, Invesco Advisers, Inc., Invesco Aim Capital Management, Inc. and Invesco Aim Private Asset Management, Inc.; and Treasurer, PowerShares Exchange-Traded Fund Trust, PowerShares Exchange-Traded Fund Trust II, PowerShares India Exchange-Traded Fund Trust and PowerShares Actively Managed Exchange-Traded Fund Trust | N/A | N/A | ||||
Yinka Akinsola — 1977 Anti-Money Laundering Compliance Officer | 2011 | Anti-Money Laundering Compliance Officer, Invesco Advisers, Inc. (formerly known as Invesco Institutional (N.A.), Inc.) (registered investment adviser); Invesco Distributors, Inc. (formerly known as Invesco Aim Distributors, Inc.), Invesco Investment Services, Inc. (formerly known as Invesco Aim Investment Services, Inc.), Invesco Management Group, Inc., The Invesco Funds, Invesco Van Kampen Closed-End Funds, Van Kampen Exchange Corp., Van Kampen Funds Inc., PowerShares Exchange-Traded Fund Trust, PowerShares Exchange-Traded Fund Trust II, PowerShares India Exchange-Traded Fund Trust, and PowerShares Actively Managed Exchange-Traded Fund Trust
Formerly: Regulatory Analyst III, Financial Industry Regulatory Authority (FINRA) | N/A | N/A | ||||
| Todd L. Spillane — 1958 Chief Compliance Officer | 2006 | Senior Vice President, Invesco Management Group, Inc. (formerly known as Invesco Aim Management Group, Inc.) and Van Kampen Exchange Corp.; Senior Vice President and Chief Compliance Officer, Invesco Advisers, Inc. (registered investment adviser) (formerly known as Invesco Institutional (N.A.), Inc.); Chief Compliance Officer, The Invesco Funds; Vice President, Invesco Distributors, Inc. (formerly known as Invesco Aim Distributors, Inc.) and Invesco Investment Services, Inc. (formerly known as Invesco Aim Investment Services, Inc.)
Formerly: Chief Compliance Officer, Invesco Van Kampen Closed-End Funds; Senior Vice President, Van Kampen Investments Inc.; Senior Vice President and Chief Compliance Officer, Invesco Aim Advisers, Inc. and Invesco Aim Capital Management, Inc.; Chief Compliance Officer, INVESCO Private Capital Investments, Inc. (holding company), Invesco Private Capital, Inc. (registered investment adviser), Invesco Global Asset Management (N.A.), Inc., Invesco Senior Secured Management, Inc. (registered investment adviser), Van Kampen Investor Services Inc., PowerShares Exchange-Traded Fund Trust, PowerShares Exchange-Traded Fund Trust II, PowerShares India Exchange-Traded Fund Trust and PowerShares Actively Managed Exchange-Traded Fund Trust; and Vice President, Invesco Aim Capital Management, Inc. and Fund Management Company | N/A | N/A |
The Statement of Additional Information of the Trust includes additional information about the Fund’s Trustees and is available upon request, without charge, by calling 1.800.959.4246. Please refer to the Fund’s prospectus for information on the Fund’s sub-advisers.
Office of the Fund 11 Greenway Plaza, Suite 1000 Houston, TX 77046-1173 | Investment Adviser Invesco Advisers, Inc. 1555 Peachtree Street, N.E. Atlanta, GA 30309 | Distributor Invesco Distributors, Inc. 11 Greenway Plaza, Suite 1000 Houston, TX 77046-1173 | Auditors PricewaterhouseCoopers LLP 1201 Louisiana Street, Suite 2900 Houston, TX 77002-5678 | |||
Counsel to the Fund Stradley Ronon Stevens & Young, LLP 2005 Market Street, Suite 2600 Philadelphia, PA 19103-7018 | Counsel to the Independent Trustees Goodwin Procter LLP 901 New York Avenue, N.W. | Transfer Agent Invesco Investment Services, Inc. 11 Greenway Plaza, Suite 1000 Houston, TX 77046-1173 | Custodian State Street Bank and Trust Company 225 Franklin Street Boston, MA 02110-2801 | |||
T-4 Invesco Allocation Funds

Invesco mailing information
Send general correspondence to Invesco Investment Services, Inc., P.O. Box 219078, Kansas City, MO 64121-9078.
Invesco privacy policy
You share personal and financial information with us that is necessary for your transactions and your account records. We take very seriously the obligation to keep that information confidential and private.
Invesco collects nonpublic personal information about you from account applications or other forms you complete and from your transactions with us or our affiliates. We do not disclose information about you or our former customers to service providers or other third parties except to the extent necessary to service your account and in other limited circumstances as permitted by law. For example, we use this information to facilitate the delivery of transaction confirmations, financial reports, prospectuses and tax forms.
Even within Invesco, only people involved in the servicing of your accounts and compliance monitoring have access to your information. To ensure the highest level of confidentiality and security, Invesco maintains physical, electronic and procedural safeguards that meet or exceed federal standards. Special measures, such as data encryption and authentication, apply to your communications with us on our website. More detail is available to you at invesco.com/privacy.
Important notice regarding delivery of security holder documents
To reduce Fund expenses, only one copy of most shareholder documents may be mailed to shareholders with multiple accounts at the same address (House holding). Mailing of your shareholder documents may be householded indefinitely unless you instruct us otherwise. If you do not want the mailing of these documents to be combined with those for other members of your household, please contact Invesco Investment Services, Inc. at 800 959 4246 or contact your financial institution. We will begin sending you individual copies for each account within 30 days after receiving your request.
Fund holdings and proxy voting information
The Fund provides a complete list of its holdings four times in each fiscal year, at the quarter-ends. For the second and fourth quarters, the lists appear in the Fund’s semiannual and annual reports to shareholders. For the first and third quarters, the Fund files the lists with the Securities and Exchange Commission (SEC) on Form N-Q. The most recent list of portfolio holdings is available at invesco.com/completeqtrholdings. Shareholders can also look up the Fund’s Forms N-Q on the SEC website at sec.gov. Copies of the Fund’s Forms N-Q may be reviewed and copied at the SEC Public Reference Room in Washington, D.C. You can obtain information on the operation of the Public Reference Room, including information about duplicating fee charges, by calling 202 551 8090 or 800 732 0330, or by electronic request at the following email address: publicinfo@sec.gov. The SEC file numbers for the Fund are shown below.
A description of the policies and procedures that the Fund uses to determine how to vote proxies relating to portfolio securities is available without charge, upon request, from our Client Services department at 800 959 4246 or at invesco.com/proxyguidelines. The information is also available on the SEC website, sec.gov.
Information regarding how the Fund voted proxies related to its portfolio securities during the 12 months ended June 30, 2012, is available at invesco.com/proxysearch. The information is also available on the SEC website, sec.gov. Invesco Advisers, Inc. is an investment adviser; it provides investment advisory services to individual and institutional clients and does not sell securities. Invesco Distributors, Inc. is the US distributor for Invesco Ltd.’s retail mutual funds, exchange-traded funds and institutional money market funds. Both are wholly owned, indirect subsidiaries of Invesco Ltd. |  | |
SEC file numbers: 811-02699 and 002-57526 AAS-AR-1 Invesco Distributors, Inc. |
| ||||
 | Annual Report to Shareholders
| December 31, 2012 | ||
| ||||
| Invesco Convertible Securities Fund | ||||
Nasdaq: A: CNSAX n B: CNSBX n C: CNSCX n Y: CNSDX n R5: CNSIX n R6: CNSFX | ||||

Letters to Shareholders
Philip Taylor | Dear Shareholders: This annual report contains information about your Fund and the factors that affected its performance during the reporting period. Inside, you’ll find a discussion from your portfolio managers about how they managed your Fund, performance data for your Fund, a complete list of your Fund’s investments as of the close of the reporting period and other important information. I hope you find this report of interest. The reporting period covered by this report was challenging. As the year began, investors cheered generally positive economic indicators, and markets generally rose. Soon, however, US economic data turned mixed and investors’ attention shifted to the efforts of eurozone governments to implement new policies intended to reduce debt levels, strengthen the banking system and stimulate economic growth. Later in the year, in the US, mixed economic data, | ||||||||

competing proposals on how to reduce the federal budget deficit and a contentious presidential contest increased investor uncertainty and hindered market performance. Throughout the year, your Fund’s portfolio managers adhered to their long-term investment strategies, and later in this report they explain why your Fund performed as it did during the reporting period.
Adhering to your long-term investment plan can be difficult, particularly during periods of market volatility and economic uncertainty. That’s one reason Invesco suggests investors work with a skilled and trusted financial adviser who is familiar with their financial situation, investment goals and risk tolerance. A good financial adviser can provide insight and perspective when markets are volatile; motivation and reassurance when times are uncertain; and advice and recommendations when your financial situation or investment goals change.
Timely insight and information from many of Invesco’s investment professionals is available at our website, invesco.com/us. We offer in-depth articles, video clips and audio commentaries from many of our portfolio managers and other investment professionals on a wide range of topics of interest to investors. At invesco.com/us, you also can access information about your Invesco account at any time.
What we mean by Intentional Investing
At Invesco, all of our people and all of our resources are dedicated to helping investors achieve their financial objectives. It’s a philosophy we call Intentional Investing®, and it guides the way we:
| n | Manage investments – Our dedicated investment professionals search the world for the best opportunities, and each investment team follows a clear, disciplined process to build portfolios and mitigate risk. |
| n | Provide choices – We offer equity, fixed income, asset allocation and alternative strategies so you and your financial adviser can build an investment portfolio designed for your individual needs and goals. |
| n | Connect with you – We’re committed to giving you the expert insights you need to make informed investing decisions, and we are well-equipped to provide high-quality support for investors and advisers. |
Invesco believes in putting investors first, and that’s why investment management is all we do. Our sole focus on managing your money allows your financial adviser to build a portfolio of Invesco funds appropriate for your investment needs and goals now and when your circumstances change.
Have a question?
If you have a question about your account, please contact an Invesco client services representative at 800 959 4246. If you have an Invesco-related question or comment, feel free to email me directly at phil@invesco.com.
All of us at Invesco look forward to serving your investment management needs for many years to come. Thank you for investing with us.
Sincerely,

PhilipTaylor
Senior Managing Director, Invesco Ltd.
2 Invesco Convertible Securities Fund
Bruce Crockett | Dear Fellow Shareholders: While short-term challenges for the financial markets regularly come and go, it’s clear that significant and longer term economic obstacles remain both here at home and abroad. There appear to be no easy solutions to many of these issues. As a result, the financial markets have had little conviction to respond to what has been slow, yet noticeable improvement in some economic benchmarks in recent months. No one likes uncertainty, especially financial markets. But even in these uncertain times, it appears that investors are still approaching the market with cautious optimism, with some taking on more risk in order to refocus on their long-term savings goals. Maybe this describes you, or perhaps you have been sitting on the sidelines thinking about getting back into the market, but are still a bit hesitant to act because of market uncertainty. | ||||||||

Clearly, risk remains a primary focus for investors of all types. As Trustees of the Invesco Funds, one of our primary responsibilities is to ensure your fund’s adviser is cognizant of the risks in each of the funds it manages. A thoughtful risk management plan may help investors navigate through market turbulence or an economic downturn. This is why we make risk management a critical element of our annual contract renewal process, like the one we complete with Invesco every year.
To be sure, there will always be risks involved with investing, but you shouldn’t let short-term news or your emotions dictate your investments. Because no one can predict with 100% accuracy the movements of financial markets, I strongly encourage you to speak with a professional financial adviser who can assist you in building an investment portfolio that reflects your individual risk tolerance and is designed to help achieve your individual financial objectives.
You can be sure your Board remains committed to doing its part in helping you along the way. In addition to ensuring that your fund’s adviser is focused on the risks in the funds it manages, we also remain committed to managing fund costs and working with your fund’s adviser to provide a compelling and diversified product offering to potentially meet your investing goals.
In that regard, your Board approved a number of fund mergers and the launch of several new funds, including the first Invesco mutual fund available to US retail investors managed by investment professionals at Invesco Perpetual*, one of the largest independent investment managers in the UK.
Let me close by thanking Carl Frischling upon his retirement from the Invesco Funds Board for his 35 years of distinguished service and unwavering commitment to our funds’ shareholders. As always, please contact me at bruce@brucecrockett.com with any questions or concerns you may have.
On behalf of the Board, we look forward to continuing to represent your interests and serving your investment needs.
Sincerely,

Bruce L. Crockett
Independent Chair
Invesco Funds Board of Trustees
| * | Invesco Perpetual is a business name of Invesco Asset Management Limited (IAML), a registered investment adviser. IAML is a wholly owned, indirect subsidiary of Invesco Ltd. |
3 Invesco Convertible Securities Fund
Management’s Discussion of Fund Performance
Performance summary
Invesco Convertible Securities Fund, at net asset value (NAV), posted positive returns for the year ended December 31, 2012. At NAV, the Fund underperformed its broad market/style-specific index, the Bank of America Merrill Lynch All U.S. Convertibles Index. During the reporting period, the Fund benefited from its investments in the financials and utilities sectors.
Your Fund’s long-term performance appears later in this report.
Fund vs. Indexes
Total returns, 12/31/11 to 12/31/12, at net asset value (NAV). Performance shown does not include applicable contingent deferred sales charges (CDSC) or front-end sales charges, which would have reduced performance.
| Class A Shares | 13.68 | % | |||
| Class B Shares | 12.80 | ||||
| Class C Shares | 13.02 | ||||
| Class Y Shares | 13.94 | ||||
| Class R5 Shares* | 14.07 | ||||
| Class R6 Shares** | 13.72 | ||||
| Bank of America Merrill Lynch All U.S. Convertibles Index‚ | |||||
| (Broad Market/Style Specific Index)*** | 14.96 | ||||
| Lipper Convertible Securities Funds Indexn (Peer Group Index) | 11.53 |
| Source | (s): ‚Invesco, Bank of America Merrill Lynch via FactSet Research Systems Inc.; nLipper Inc. |
| * | Effective September 24, 2012, Institutional Class shares were renamed Class R5 shares. |
| ** | Share class incepted during the reporting period. See page 7 for a detailed explanation of Fund performance. |
| *** | The Bank of America Merrill Lynch All Convertibles All Qualities Index has changed its name to the Bank of America Merrill Lynch All U.S. Convertibles Index. |
How we invest
The Fund’s investment objective is to seek a high level of total return on its assets through a combination of current income and capital appreciation.
The Fund normally invests at least 80% of its net assets (plus any borrowings for investment purposes) in convertible securities. A convertible security is a bond, preferred stock or other security that may be converted into a prescribed amount of common stock at a prestated price. We may retain that common stock to permit its orderly sale or to establish long-term holding periods for tax purposes. The Fund is not required to sell the common stock to assure that the
required percentage of its assets is invested in convertible securities. The Fund’s convertible securities may include lower rated fixed income securities commonly known as “junk bonds.” The convertible securities also may include exchangeable and synthetic convertible securities. Unlike traditional convertible securities whose conversion values are based on the common stock of the issuer of the convertible security, synthetic and exchangeable convertible securities are preferred stocks or debt obligations of an issuer that are combined with an equity component whose conversion value is based on the value of the common stock of a different issuer or a particular bench-mark
(which may include a foreign issuer or basket of foreign stocks, or a company whose stock is not yet publicly traded). In deciding which securities to buy, hold or sell, we consider market, economic and political conditions.
The Fund also can utilize derivative instruments, including forward foreign currency contracts. The Fund can utilize forward foreign currency contracts to mitigate the risk of foreign currency exposure. A forward foreign currency contract is an agreement between parties to exchange a specified amount of currency at a specified future time at a specified rate. Forward foreign currency contracts are used to protect against uncertainty in future foreign currency exchange rates. The Fund uses these contracts to hedge against adverse movements in the foreign currencies in which portfolio securities are denominated. The Fund also may invest in real estate investment trusts.
The remaining 20% of the Fund’s assets may be invested in common stocks directly, non-convertible preferred stocks, non-convertible fixed income securities, and/or foreign securities. The foreign securities may include non-US-dollar denominated securities and depositary receipts. The Fund’s fixed income investments may include zero coupon securities, which are purchased at a discount and generally accrue interest, but make no interest payments until maturity.
We have considerable discretion in deciding which investments we buy, hold or sell on a day-to-day basis and which investment strategies we use. For example, we may, at our discretion, use some permitted investment strategies while not using others. We sell a security when we believe that it no longer fits the Fund’s investment criteria.
| Portfolio Composition | |||||
| By sector | |||||
| Health Care | 22.9 | % | |||
| Information Technology | 21.1 | ||||
| Financials | 15.0 | ||||
| Industrials | 11.7 | ||||
| Consumer Discretionary | 11.4 | ||||
| Energy | 7.1 | ||||
| Materials | 6.2 | ||||
| Telecommunication Services | 0.8 | ||||
| Utilities | 0.8 | ||||
| Consumer Staples | 0.6 | ||||
| Money Market Funds | |||||
| Plus Other Assets Less Liabilities | 2.4 | ||||
| Top 10 Issuers* | |||||
| 1. Gilead Sciences Inc. | 2.0 | % | |||
| 2. Bank of America Corp. | 1.5 | ||||
| 3. MGM Resorts International | 1.5 | ||||
| 4. Wells Fargo & Co.-Class A | 1.5 | ||||
| 5. Cemex S.A.B. de C.V. | 1.4 | ||||
| 6. General Motors Co. | 1.3 | ||||
| 7. San Disk Corp. | 1.3 | ||||
| 8. WellPoint, Inc. | 1.2 | ||||
| 9. Lam Research Corp. | 1.2 | ||||
| 10. Teleflex Inc. | 1.2 | ||||
| Total Net Assets | $901.3 million | ||||
| Total Number of Holdings* | 141 | ||||
The Fund’s holdings are subject to change, and there is no assurance that the Fund will continue to hold any particular security.
* Excluding money market fund holdings.
4 Invesco Convertible Securities Fund
Market conditions and your Fund
The convertible bond market bounced back nicely in 2012. Performance was driven primarily by tightening credit spreads and positive earnings announcements coupled with improving economic data, declining yields and a modest Treasury rally. The Bank of America Merrill Lynch All U.S. Convertibles Index posted strong results relative to other asset classes, returning 14.96% for the year.1
The year 2012 began with economic data in the US showing improvement and a rally in equities that continued almost uninterrupted into the spring. Early in the year, investors were willing to assume more risk, but market sentiment shifted to be more cautious in April and May when the ongoing eurozone sovereign debt crisis intensified and caused volatility in global equity markets. Economic data began to decelerate as manufacturing, employment, consumer spending and consumer confidence weakened over the summer. However, corporate earnings remained solid with companies reporting better-than-expected earnings and providing favorable guidance, leading to healthy gains in equity markets.
Fears about the fate of the eurozone subsided in September after the European Central Bank announced new measures to support member economies through potentially unlimited purchases of sovereign debt, among other measures. In the US, economic data showed signs of improvement as the US Federal Reserve announced its plans for a third round of quantitative easing. In September, US unemployment fell below 8% for the first time since January 2009.2 The good news also trickled down to the housing market, where data showed improvement.
Near year end, market volatility returned as concerns about the outcome of the presidential election and the inability of the White House and Congress to reach an agreement on legislation averting the “fiscal cliff” – a variety of tax increases and spending cuts scheduled to take effect in January 2013 – dominated the market.
New convertible bond issuance remained low in 2012, but the market showed signs of improvement toward the end of the year. In early October, WellPoint, the second-largest health insurer in the US, announced plans to offer $1.35 billion in convertible bonds.3 This marked the convertible bond market’s first large investment grade deal since the global financial crisis.
During the reporting period, the Fund benefited from its investments in the financials and materials sectors. During the year, our security selection (relative to the Bank of America Merrill Lynch All U.S. Convertibles Index) to the financials sector was a contributor to Fund performance. The materials sector, specifically homebuilders, got an extra boost throughout the year as housing-start statistics and unemployment data improved.
Meanwhile, the information technology sector, primarily semiconductor companies, weakened as a result of many consumers moving away from personal computers to tablets. This resulted in increased supply in the channel and decreased demand. Broadly, there have been supply/demand issues surrounding many personal computer hardware and semiconductor companies.
We continue to believe avoiding issue-specific underperformers will be key to Fund performance in 2013. Other factors we continue to focus on to enhance performance include security selection, tactical sector rotation, primary market value, event-driven opportunities and, of course, good relative value.
Thank you for investing in Invesco Convertible Securities Fund and for sharing our long-term investment horizon.
| 1 | Source: Invesco, Bank of America Merrill Lynch via FactSet Research Systems Inc. |
| 2 | Source: Bureau of Labor Statistics |
| 3 | Source: WellPoint, Inc. |
The views and opinions expressed in management’s discussion of Fund performance are those of Invesco Advisers, Inc. These views and opinions are subject to change at any time based on factors such as market and economic conditions. These views and opinions may not be relied upon as investment advice or recommendations, or as an offer for a particular security. The information is not a complete analysis of every aspect of any market, country, industry, security or the Fund. Statements of fact are from sources considered reliable, but Invesco Advisers, Inc. makes no representation or warranty as to their completeness or accuracy. Although historical performance is no guarantee of future results, these insights may help you understand our investment management philosophy.
See important Fund and, if applicable, index disclosures later in this report.
 | Ellen Gold Portfolio manager, is lead manager of Invesco Convertible Securities Fund. She joined Invesco in 2010. | |
| Ms. Gold earned a BBA from George Washington University and an MBA from New York University. | ||
 | Ramez Nashed Portfolio manager, is manager of Invesco Convertible Securities Fund. He joined Invesco in 2010. | |
| Mr. Nashed earned a BA in finance from New Jersey City University and an MBA from Seton Hall University. | ||
5 Invesco Convertible Securities Fund
Your Fund’s Long-Term Performance
Results of a $10,000 Investment – Oldest Share Class(es)
Fund and index data from 12/31/02
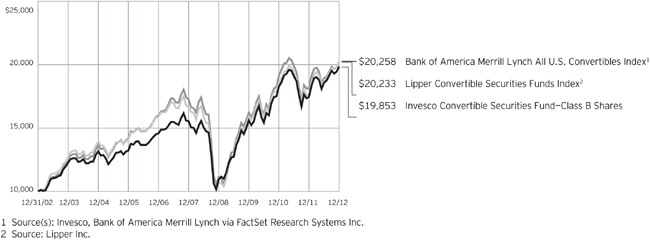
Past performance cannot guarantee comparable future results.
The data shown in the chart include reinvested distributions, applicable sales charges and Fund expenses including management fees. Results for Class B shares are calculated as if a hypothetical
shareholder had liquidated his entire investment in the Fund at the close of the reporting period and paid the contingent deferred sales charges, if applicable. Index results include reinvested dividends, but they do not reflect sales charges. Performance of the peer group,
if applicable, reflects fund expenses and management fees; performance of a market index does not. Performance shown in the chart and table(s) does not reflect deduction of taxes a shareholder would pay on Fund distributions or sale of Fund shares.
continued from page 8
Other information
| n | The returns shown in management’s discussion of Fund performance are based on net asset values calculated for shareholder transactions. Generally accepted accounting principles require adjustments to be made to the net assets of the Fund at period end for financial reporting purposes, and as such, the net asset values for shareholder transactions and the returns based on those net asset values may differ from the net asset values and returns reported in the Financial Highlights. |
| n | Industry classifications used in this report are generally according to the Global Industry Classification Standard, which was developed by and is the exclusive property and a service mark of MSCI Inc. and Standard & Poor’s. |
6 Invesco Convertible Securities Fund
| Average Annual Total Returns | |||||
| As of 12/31/12, including maximum applicable sales charges | |||||
| Class A Shares | |||||
| Inception (7/28/97) | 5.92 | % | |||
| 10 Years | 7.14 | ||||
| 5 Years | 4.32 | ||||
| 1 Year | 7.45 | ||||
| Class B Shares | |||||
| Inception (10/31/85) | 7.56 | % | |||
| 10 Years | 7.10 | ||||
| 5 Years | 4.36 | ||||
| 1 Year | 7.80 | ||||
| Class C Shares | |||||
| Inception (7/28/97) | 5.53 | % | |||
| 10 Years | 6.97 | ||||
| 5 Years | 4.74 | ||||
| 1 Year | 12.02 | ||||
| Class Y Shares | |||||
| Inception (7/28/97) | 6.57 | % | |||
| 10 Years | 8.02 | ||||
| 5 Years | 5.75 | ||||
| 1 Year | 13.94 | ||||
| Class R5 Shares | |||||
| 10 Years | 7.81 | % | |||
| 5 Years | 5.62 | ||||
| 1 Year | 14.07 | ||||
| Class R6 Shares | |||||
| 10 Years | 7.75 | % | |||
| 5 Years | 5.51 | ||||
| 1 Year | 13.72 | ||||
Effective June 1, 2010, Class A, Class B, Class C and Class I shares of the predecessor fund, Morgan Stanley Convertible Securities Trust, advised by Morgan Stanley Investment Advisors Inc. were reorganized into Class A, Class B, Class C and Class Y shares, respectively, of Invesco Convertible Securities Fund. Returns shown above for Class A, Class B, Class C and Class Y shares are blended returns of the predecessor fund and Invesco Convertible Securities Fund. Share class returns will differ from the predecessor fund because of different expenses.
Class R5 shares incepted on May 23, 2011. Performance shown prior to that date is that of the predecessor fund’s Class A shares and includes the 12b-1 fees applicable to Class A shares. Class A share performance reflects any applicable fee waivers or expense reimbursements.
Class R6 shares incepted on September 24, 2012. Performance shown prior to that date is that of Class A shares and includes the 12b-1 fees applicable to Class A shares. Class A share performance reflects any applicable fee waivers or expense reimbursements.
The performance data quoted represent past performance and cannot guarantee comparable future results; current performance may be lower or higher. Please visit invesco.com/performance for the most recent month-end performance. Performance figures reflect reinvested distributions, changes in net asset value and the effect of the maximum sales charge unless otherwise stated. Investment return and principal value will fluctuate so that you may have a gain or loss when you sell shares.
The total annual Fund operating expense ratio set forth in the most recent Fund prospectus as of the date of this report for Class A, Class B, Class C, Class Y, Class R5 and Class R6 shares was 0.98%, 1.73%, 1.73%, 0.73%, 0.58% and 0.58%, respectively. The expense ratios presented above may vary from the expense ratios presented in other sections of this report that are based on expenses incurred during the period covered by this report.
Class A share performance reflects the maximum 5.50% sales charge, and Class B and Class C share performance reflects the applicable contingent deferred sales charge (CDSC) for the period involved. The CDSC on Class B shares declines from 5% beginning at the time of purchase to 0% at the beginning of the seventh year. The CDSC on Class C shares is 1% for the first year after purchase. Class Y, Class R5 and Class R6 shares do not have a front-end sales charge or a CDSC; therefore, performance is at net asset value.
The performance of the Fund’s share classes will differ primarily due to different sales charge structures and class expenses.
7 Invesco Convertible Securities Fund
Invesco Convertible Securities Fund’s investment objective is to seek a high level of total return on its assets through a combination of current income and capital appreciation.
| n | Unless otherwise stated, information presented in this report is as of December 31, 2012, and is based on total net assets. |
| n | Unless otherwise noted, all data provided by Invesco. |
| n | To access your Fund’s reports/prospectus, visit invesco.com/fundreports. |
About share classes
| n | Class B shares may not be purchased for new or additional investments. Please see the prospectus for more information. |
| n | Class Y shares are available only to certain investors. Please see the prospectus for more information. |
| n | Class R5 shares and Class R6 shares are primarily intended for employer sponsored retirement and benefit plans that meet certain standards and for institutional investors. On September 24, 2012, Institutional Class shares were renamed Class R5 shares. Please see the prospectus for more information. |
Principal risks of investing in the Fund
| n | Convertible securities risk. The values of convertible securities in which the Fund may invest may be affected by market interest rates. The values of convertible securities also may be affected by the risk of actual issuer default on interest or principal payments and the value of the underlying stock. Additionally, an issuer may retain the right to buy back its convertible securities at a time and price unfavorable to the Fund. The value of a synthetic convertible security will respond differently to market fluctuations than a convertible security because a synthetic convertible security is composed of two or more separate securities, each with its own market value. |
| n | Derivatives risk. The performance of derivative instruments is tied to the performance of an underlying currency, security, index or other instrument. In addition to risks relating to their underlying instruments, the use of derivatives may include other, possibly greater, risks. Derivatives involve costs, may be volatile, and may |
involve a small initial investment relative to the risk assumed. Risks associated with the use of derivatives include counterparty, leverage, correlation, liquidity, tax, market, interest rate and management risks. Derivatives may also be more difficult to purchase, sell or value than other investments. The Fund may lose more than the cash amount invested on investments in derivatives.
Investors should bear in mind that, while the Fund intends to use derivative strategies, it is not obligated to actively engage in these transactions, generally or in any particular kind of derivative, if the investment manager elects not to do so due to availability, cost, market conditions or other factors.
| n | Fixed income securities risk. All fixed income securities are subject to two types of risk: credit risk and interest rate risk. When the general level of interest rates goes up, the prices of most fixed income securities go down. |
When the general level of interest rates goes down, the prices of most fixed income securities go up. Lower rated fixed income securities (commonly known as junk bonds) are subject to greater risk of loss of income and principal than higher rated securities. The prices of junk bonds are likely to be more sensitive to adverse economic changes or individual corporate developments and may be subject to a greater risk of default than higher rated securities. During an economic downturn or substantial period of rising interest rates, junk bond issuers and, in particular, highly leveraged issuers may experience financial stress.
| n | Common stocks and other equity securities risk. In general, stock and other equity securities values fluctuate in response to activities specific to the company as well as general market, economic and political conditions. |
This report must be accompanied or preceded by a currently effective Fund prospectus, which contains more complete information, including sales charges and expenses. Investors should read it carefully before investing.
NOT FDIC INSURED | MAY LOSE VALUE | NO BANK GUARANTEE
| n | Foreign securities risk. The Fund’s foreign investments may be affected by changes in a foreign country’s exchange rates; political and social instability; changes in economic or taxation policies; difficulties when enforcing obligations; decreased liquidity; and increased volatility. Foreign companies may be subject to less regulation resulting in less publicly available information about the companies. |
| n | Synthetic securities risk. Fluctuations in the values of synthetic securities may not correlate perfectly with the instruments they are designed to replicate. Synthetic securities may be subject to interest rate changes, market price fluctuations, counterparty risk and liquidity risk. |
About indexes used in this report
| n | The Bank of America Merrill Lynch All U.S. Convertibles Index tracks the performance of US dollar-denominated convertible securities that are not currently in bankruptcy and have total market values of more than $50 million at issuance. |
| n | The Lipper Convertible Securities Funds Index represents the average performance of the 10 largest convertible securities mutual funds, as classified by Lipper. |
| n | The Fund is not managed to track the performance of any particular index, including the index(es) defined here, and consequently, the performance of the Fund may deviate significantly from the performance of the index(es). |
| n | A direct investment cannot be made in an index. Unless otherwise indicated, index results include reinvested dividends, and they do not reflect sales charges. Performance of the peer group, if applicable, reflects fund expenses; performance of a market index does not. |
continued on page 6
| Fund Nasdaq Symbols | |||||
| Class A Shares | CNSAX | ||||
| Class B Shares | CNSBX | ||||
| Class C Shares | CNSCX | ||||
| Class Y Shares | CNSDX | ||||
| Class R5 Shares | CNSIX | ||||
| Class R6 Shares | CNSFX |
8 Invesco Convertible Securities Fund
Schedule of Investments(a)
December 31, 2012
| Principal Amount | Value | |||||||
Bonds and Notes–79.46% |
| |||||||
| Air Freight & Logistics–0.53% | ||||||||
XPO Logistics Inc., Sr. Unsec. Conv. Notes, 4.50%, 10/01/17 | $ | 4,000,000 | $ | 4,777,500 | ||||
| Alternative Carriers–0.22% | ||||||||
Level 3 Communications Inc., Sr. Unsec. Conv. Notes, 6.50%, 10/01/16 | 1,400,000 | 1,987,125 | ||||||
| Aluminum–0.23% | ||||||||
Kaiser Aluminum Corp., Sr. Unsec. Conv. Notes, 4.50%, 04/01/15 | 1,500,000 | 2,026,875 | ||||||
| Apparel, Accessories & Luxury Goods–1.15% | ||||||||
Iconix Brand Group Inc., Sr. Unsec. Sub. Conv. Notes, 2.50%, 06/01/16(b) | 10,000,000 | 10,406,250 | ||||||
| Application Software–3.85% | ||||||||
Bottomline Technologies de Inc., Sr. Unsec. Conv. Notes, 1.50%, 12/01/17 | 3,370,000 | 3,759,656 | ||||||
Concur Technologies Inc., Sr. Unsec. Conv. Notes, 2.50%, 04/15/15(b) | 2,650,000 | 3,718,281 | ||||||
Mentor Graphics Corp, Unsec. Sub. Conv. Deb., 4.00%, 04/01/18(c) | 6,350,000 | 7,496,969 | ||||||
Nuance Communications Inc., Sr. Unsec. Conv. Notes, 2.75%, 11/01/17(c) | 8,150,000 | 8,888,594 | ||||||
TIBCO Software Inc., Sr. Unsec. Conv. Notes, 2.25%, 05/01/17(b)(c) | 5,700,000 | 5,447,062 | ||||||
TiVo Inc., Sr. Unsec. Conv. Notes, 4.00%, 03/15/16(b) | 4,000,000 | 5,362,500 | ||||||
| 34,673,062 | ||||||||
| Asset Management & Custody Banks–2.59% | ||||||||
Affiliated Managers Group, Inc., Sr. Unsec. Conv. Notes, 3.95%, 08/15/13(c) | 8,010,000 | 8,911,125 | ||||||
Ares Capital Corp., Sr. Unsec. Conv. Notes, | 1,000,000 | 1,078,750 | ||||||
5.75%, 02/01/16(b) | 6,000,000 | 6,472,500 | ||||||
Janus Capital Group, Inc., Sr. Unsec. Conv. Notes, 3.25%, 07/15/14 | 1,000,000 | 1,043,750 | ||||||
Walter Investment Management Corp., Sr. Unsec. Conv. Sub. Notes, 4.50%, 11/01/19 | 5,500,000 | 5,833,437 | ||||||
| 23,339,562 | ||||||||
| Automobile Manufacturers–0.32% | ||||||||
Ford Motor Co., Sr. Unsec. Conv. Notes, 4.25%, 11/15/16 | 1,834,000 | 2,916,060 | ||||||
| Biotechnology–6.87% | ||||||||
Amgen Inc., Series B, Sr. Unsec. Conv. Notes, 0.38%, 02/01/13 | 7,500,000 | 8,432,812 | ||||||
Cubist Pharmaceuticals Inc., Sr. Unsec. Conv. Notes, 2.50%, 11/01/17 | 3,300,000 | 5,193,375 | ||||||
| Principal Amount | Value | |||||||
| Biotechnology–(continued) | ||||||||
Dendreon Corp., Sr. Unsec. Conv. Notes, 2.88%, 01/15/16 | $ | 4,752,000 | $ | 3,611,520 | ||||
Exelixis Inc., Sr. Unsec. Sub. Conv. Notes, 4.25%, 08/15/19 | 2,000,000 | 1,956,250 | ||||||
Gilead Sciences Inc., Series D, Sr. Unsec. Conv. Notes, 1.63%, 05/01/16 | 10,656,000 | 17,988,713 | ||||||
InterMune Inc., Sr. Unsec. Conv. Notes, 2.50%, 09/15/18 | 3,370,000 | 2,651,769 | ||||||
Isis Pharmaceuticals Inc., Sr. Unsec. Conv. Notes, 2.75%, 10/01/19(b) | 5,000,000 | 4,965,625 | ||||||
Medivation Inc., Sr. Unsec. Conv. Notes, 2.63%, 04/01/17 | 6,000,000 | 7,698,750 | ||||||
Theravance Inc., Unsec. Sub. Conv. Notes, 3.00%, 01/15/15 | 3,300,000 | 3,700,125 | ||||||
Vertex Pharmaceuticals Inc., Sr. Unsec. Sub. Conv. Notes, 3.35%, 10/01/15 | 5,050,000 | 5,703,344 | ||||||
| 61,902,283 | ||||||||
| Broadcasting–0.94% | ||||||||
Central European Media Enterprises Ltd. (Czech Republic), Jr. Sec. Gtd. Conv. Global Bonds, 5.00%, 11/15/15 | 4,100,000 | 3,761,750 | ||||||
Liberty Interactive LLC, Sr. Unsec. Conv. Notes, 3.25%, 03/15/31 | 5,000,000 | 4,750,000 | ||||||
| 8,511,750 | ||||||||
| Cable & Satellite–0.42% | ||||||||
XM Satellite Radio Inc., Sr. Gtd. Sub. Conv. Notes, 7.00%, 12/01/14(b) | 2,200,000 | 3,786,750 | ||||||
| Casinos & Gaming–1.48% | ||||||||
MGM Resorts International, Sr. Unsec. Gtd. Conv. Notes, 4.25%, 04/15/15 | 12,545,000 | 13,305,541 | ||||||
| Coal & Consumable Fuels–1.74% | ||||||||
Alpha Natural Resources Inc., Sr. Unsec. Conv. Notes, 2.38%, 04/15/15 | 7,000,000 | 6,536,250 | ||||||
Peabody Energy Corp., Jr. Unsec. Sub. Conv. Deb., 4.75%, 12/15/41 | 9,420,000 | 9,119,737 | ||||||
| 15,655,987 | ||||||||
| Communications Equipment–1.62% | ||||||||
Ciena Corp., Sr. Unsec. Conv. Notes, 4.00%, 12/15/20(b) | 7,205,000 | 8,281,247 | ||||||
Ixia, Sr. Unsec. Conv. Notes, 3.00%, 12/15/15 | 5,430,000 | 6,332,737 | ||||||
| 14,613,984 | ||||||||
| Computer Storage & Peripherals–2.64% | ||||||||
EMC Corp., Series B, Sr. Unsec. Conv. Notes, 1.75%, 12/01/13 | 5,425,000 | 8,663,074 | ||||||
NetApp Inc., Sr. Unsec. Conv. Notes, 1.75%, 06/01/13 | 3,255,000 | 3,674,081 | ||||||
SanDisk Corp., Sr. Unsec. Conv. Notes, 1.50%, 08/15/17 | 9,800,000 | 11,417,000 | ||||||
| 23,754,155 | ||||||||
See accompanying Notes to Financial Statements which are an integral part of the financial statements.
9 Invesco Convertible Securities Fund
| Principal Amount | Value | |||||||
| Construction & Engineering–0.46% | ||||||||
MasTec Inc., Sr. Unsec. Gtd. Conv. Notes, 4.00%, 06/15/14 | $ | 2,500,000 | $ | 4,118,750 | ||||
| Construction & Farm Machinery & Heavy Trucks–2.45% | ||||||||
Greenbrier Cos Inc., Sr. Unsec. Conv. Notes, 3.50%, 04/01/18 | 8,510,000 | 7,770,694 | ||||||
Navistar International Corp., Sr. Unsec. Sub. Conv. Notes, 3.00%, 10/15/14 | 10,750,000 | 9,869,843 | ||||||
Wabash National Corp., Sr. Unsec. Conv. Notes, 3.38%, 05/01/18 | 4,000,000 | 4,450,000 | ||||||
| 22,090,537 | ||||||||
| Construction Materials–1.43% | ||||||||
Cemex S.A.B. de C.V. (Mexico), | 7,500,000 | 8,540,625 | ||||||
Unsec. Sub. Conv. Notes, 4.88%, 03/15/15 | 4,000,000 | 4,380,000 | ||||||
| 12,920,625 | ||||||||
| Consumer Finance–0.67% | ||||||||
DFC Global Corp., Sr. Unsec. Conv. Notes, 3.25%, 04/15/17(b) | 5,500,000 | 6,019,063 | ||||||
| Data Processing & Outsourced Services–1.12% | ||||||||
Alliance Data Systems Corp., Sr. Unsec. Conv. Notes, 1.75%, 08/01/13 | 5,480,000 | 10,134,575 | ||||||
| Diversified Metals & Mining–0.73% | ||||||||
RTI International Metals Inc., Sr. Unsec. Gtd. Conv. Notes, 3.00%, 12/01/15 | 6,000,000 | 6,543,750 | ||||||
| Electrical Components & Equipment–0.76% | ||||||||
EnerSys, Sr. Unsec. Conv. Notes, 3.38%, 06/01/15(c)(d) | 4,012,000 | 4,706,578 | ||||||
General Cable Corp., Unsec. Sub. Conv. Global Notes, 4.50%, 11/15/29(e) | 2,000,000 | 2,167,500 | ||||||
| 6,874,078 | ||||||||
| Electronic Manufacturing Services–0.74% | ||||||||
TTM Technologies Inc., Sr. Unsec. Conv. Notes, 3.25%, 05/15/15 | 6,550,000 | 6,640,063 | ||||||
| Environmental & Facilities Services–0.81% | ||||||||
Covanta Holding Corp., Sr. Unsec. Conv. Notes, 3.25%, 06/01/14 | 6,000,000 | 7,278,750 | ||||||
| Gold–1.16% | ||||||||
Royal Gold Inc., Sr. Unsec. Conv. Notes, 2.88%, 06/15/19 | 9,400,000 | 10,498,625 | ||||||
| Health Care Equipment–6.21% | ||||||||
HeartWare International Inc., Sr. Unsec. Conv. Notes, 3.50%, 12/15/17 | 5,500,000 | 6,383,438 | ||||||
Hologic Inc., Series 2010, Sr. Unsec. Conv. Notes, 2.00%, 12/15/16(c)(d) | 8,000,000 | 8,960,000 | ||||||
Insulet Corp., Sr. Unsec. Conv. Notes, 3.75%, 06/15/16 | 4,500,000 | 4,907,813 | ||||||
Integra Lifesciences Holdings Corp., Sr. Unsec. Gtd. Conv. Notes, 1.63%, 12/15/16 | 8,500,000 | 8,590,312 | ||||||
| Principal Amount | Value | |||||||
| Health Care Equipment–(continued) | ||||||||
NuVasive Inc., Sr. Unsec. Conv. Notes, 2.75%, 07/01/17 | $ | 5,500,000 | $ | 4,840,000 | ||||
Teleflex Inc., Sr. Unsec. Sub. Conv. Notes, 3.88%, 08/01/17 | 8,200,000 | 10,547,250 | ||||||
Volcano Corp., Sr. Unsec. Conv. Notes, 1.75%, 12/01/17 | 5,080,000 | 5,143,500 | ||||||
Wright Medical Group Inc., Sr. Unsec. Conv. Notes, 2.00%, 08/15/17(b) | 6,250,000 | 6,632,812 | ||||||
| 56,005,125 | ||||||||
| Health Care Facilities–1.90% | ||||||||
Brookdale Senior Living Inc., Sr. Unsec. Conv. Notes, 2.75%, 06/15/18 | 9,100,000 | 10,504,812 | ||||||
LifePoint Hospitals Inc., Sr. Unsec. Sub. Conv. Notes, 3.50%, 05/15/14 | 6,400,000 | 6,612,000 | ||||||
| 17,116,812 | ||||||||
| Health Care Services–1.79% | ||||||||
Chemed Corp., Sr. Unsec. Gtd. Conv. Notes, 1.88%, 05/15/14 | 6,441,000 | 6,742,922 | ||||||
Omnicare Inc., Sr. Unsec. Gtd. Sub. Conv. Notes, 3.75%, 04/01/42 | 9,147,000 | 9,358,524 | ||||||
| 16,101,446 | ||||||||
| Home Entertainment Software–1.03% | ||||||||
Electronic Arts Inc., Sr. Unsec. Conv. Notes, 0.75%, 07/15/16 | 10,000,000 | 9,268,750 | ||||||
| Homebuilding–0.76% | ||||||||
DR Horton Inc., Sr. Unsec. Gtd. Conv. Notes, 2.00%, 05/15/14 | 2,000,000 | 3,176,250 | ||||||
Lennar Corp., Sr. Unsec. Gtd. Conv. Notes, 2.75%, 12/15/15(b)(c) | 2,000,000 | 3,690,000 | ||||||
| 6,866,250 | ||||||||
Housewares & Specialties–0.96% |
| |||||||
Jarden Corp., Sr. Gtd. Sub. Conv. Notes, 1.88%, 09/15/18(b) | 8,500,000 | 8,643,438 | ||||||
Industrial Machinery–0.69% |
| |||||||
Chart Industries Inc., Sr. Unsec. Sub. Conv. Notes, 2.00%, 08/01/18 | 5,000,000 | 6,184,375 | ||||||
Industrial REIT’s–0.43% |
| |||||||
ProLogis, Sr. Unsec. Gtd. Conv. Notes., 3.25%, 03/15/15 | 3,400,000 | 3,869,625 | ||||||
| Internet Retail–0.83% | ||||||||
priceline.com Inc., Sr. Unsec. Notes, 1.00%, 03/15/18(b) | 7,000,000 | 7,511,875 | ||||||
Internet Software & Services–2.14% |
| |||||||
Dealer Track Holdings Inc., Sr. Unsec. Gtd. Conv. Notes, 1.50%, 03/15/17(b) | 6,500,000 | 6,894,063 | ||||||
Equinix Inc., Unsec. Sub. Conv. Notes, 3.00%, 10/15/14 | 1,800,000 | 3,520,125 | ||||||
VeriSign Inc., Jr. Unsec. Sub. Conv. Global Notes, 3.25%, 08/15/37 | 7,005,000 | 8,870,081 | ||||||
| 19,284,269 | ||||||||
See accompanying Notes to Financial Statements which are an integral part of the financial statements.
10 Invesco Convertible Securities Fund
| Principal Amount | Value | |||||||
| Investment Banking & Brokerage–0.33% | ||||||||
Jefferies Group Inc., Sr. Unsec. Conv. Notes, 3.88%, 11/01/17(c) | $ | 3,000,000 | $ | 2,986,875 | ||||
Leisure Products–0.35% |
| |||||||
Callaway Golf Co., Sr. Unsec. Conv. Bonds, 3.75%, 08/15/19(b) | 3,000,000 | 3,183,750 | ||||||
Life & Health Insurance–0.60% |
| |||||||
American Equity Investment Life Holding Co., Sr. Unsec. Conv. Notes, 3.50%, 09/15/15(b) | 4,700,000 | 5,449,063 | ||||||
Life Sciences Tools & Services–0.64% |
| |||||||
Illumina Inc., Sr. Unsec. Conv. Notes, 0.25%, 03/15/16(b) | 4,700,000 | 4,579,563 | ||||||
Sequenom Inc., Sr. Unsec. Conv. Notes, 5.00%, 10/01/17(b) | 1,000,000 | 1,198,125 | ||||||
| 5,777,688 | ||||||||
| Managed Health Care–1.20% | ||||||||
WellPoint Inc., Sr. Unsec. Conv. Notes, 2.75%, 10/15/42(b) | 10,000,000 | 10,806,250 | ||||||
Mortgage REIT’s–0.45% |
| |||||||
Annaly Capital Management Inc., Sr. Unsec. Conv. Notes, 5.00%, 05/15/15 | 4,000,000 | 4,062,500 | ||||||
Movies & Entertainment–0.79% |
| |||||||
Liberty Interractive LLC, Sr. Unsec. Conv. Notes, 3.13%, 03/30/13(c) | 4,900,000 | 7,135,625 | ||||||
Office REIT’s–0.56% |
| |||||||
SL Green Operating Partnership L.P., Sr. Unsec. Gtd. Conv. Notes, 3.00%, 10/15/17(b) | 4,500,000 | 5,065,313 | ||||||
Oil & Gas Equipment & Services–2.32% |
| |||||||
Helix Energy Solutions Group, Inc., Sr. Unsec. Conv. Notes, 3.25%, 03/15/18(c) | 6,600,000 | 7,816,875 | ||||||
Hornbeck Offshore Services Inc., Sr. Unsec. Gtd. Conv. Notes, 1.50%, 09/01/19(b) | 7,000,000 | 7,070,000 | ||||||
SEACOR Holdings Inc., Sr. Unsec. Conv. Notes, 2.50%, 12/19/17(b)(c) | 5,880,000 | 6,019,650 | ||||||
| 20,906,525 | ||||||||
Oil & Gas Exploration & Production–2.24% |
| |||||||
Chesapeake Energy Corp., Sr. Unsec. Gtd. Conv. Notes, | 4,900,000 | 4,434,500 | ||||||
2.75%, 11/15/15(c) | 3,300,000 | 3,172,125 | ||||||
Cobalt International Energy Inc., Sr. Unsec. Conv. Notes, 2.63%, 12/01/19 | 6,720,000 | 6,816,600 | ||||||
Stone Energy Corp., Sr. Unsec. Gtd. Conv. Notes, 1.75%, 03/01/17(b) | 6,500,000 | 5,736,250 | ||||||
| 20,159,475 | ||||||||
| Principal Amount | Value | |||||||
| Pharmaceuticals–2.40% | ||||||||
Akorn Inc., Sr. Unsec. Conv. Notes, 3.50%, 06/01/16 | $ | 4,000,000 | $ | 6,712,500 | ||||
Medicines Co. (The), Sr. Unsec. Conv. Notes, 1.38%, 06/01/17(b) | 4,000,000 | 4,400,000 | ||||||
Salix Pharmaceuticals Ltd., Sr. Unsec. Conv. Notes, 1.50%, 03/15/19(b) | 8,000,000 | 7,745,000 | ||||||
Viropharma Inc., Sr. Unsec. Conv. Notes, 2.00%, 03/15/17 | 2,000,000 | 2,795,000 | ||||||
| 21,652,500 | ||||||||
| Precious Metals & Minerals–1.13% | ||||||||
Stillwater Mining Co., Sr. Unsec. Conv. Notes, 1.75%, 10/15/19(c) | 8,700,000 | 10,184,438 | ||||||
| Semiconductor Equipment–2.44% | ||||||||
Lam Research Corp., Series B, Sr. Unsec. Conv. Notes, 1.25%, 05/15/18 | 10,800,000 | 10,725,750 | ||||||
Novellus Systems Inc., Sr. Unsec. Gtd. Conv. Notes, 2.63%, 05/15/41 | 4,500,000 | 5,625,000 | ||||||
Photronics Inc., Sr. Unsec. Conv. Notes, 3.25%, 04/01/16 | 5,525,000 | 5,594,062 | ||||||
| 21,944,812 | ||||||||
| Semiconductors–4.75% | ||||||||
Intel Corp., Jr. Unsec. Sub. Conv. Deb., | 6,476,000 | 6,747,182 | ||||||
2.95%, 12/15/35(b) | 1,300,000 | 1,354,438 | ||||||
Linear Technology Corp., Series A, Sr. Unsec. Conv. Global Notes, 3.00%, 05/01/14(c) | 8,075,000 | 8,448,469 | ||||||
Micron Technology Inc., Series A, Sr. Unsec. Conv. Notes, 1.50%, 08/01/18(c) | 6,000,000 | 5,576,250 | ||||||
ON Semiconductor Corp., Sr. Unsec. Gtd. Sub. Conv. Notes, 2.63%, 12/15/16(c) | 8,000,000 | 8,565,000 | ||||||
SunPower Corp., Sr. Unsec. Conv. Notes, 4.75%, 04/15/14 | 4,850,000 | 4,595,375 | ||||||
Xilinx Inc., Sr. Unsec. Conv. Notes, 2.63%, 06/15/17 | 5,530,000 | 7,555,362 | ||||||
| 42,842,076 | ||||||||
| Specialized Finance–1.00% | ||||||||
Air Lease Corp., Sr. Unsec. Conv. Notes, 3.88%, 12/01/18(b) | 8,300,000 | 9,021,062 | ||||||
| Specialized REIT’s–0.62% | ||||||||
Rayonier TRS Holdings Inc., Sr. Unsec. Gtd. Conv. Notes, 4.50%, 08/15/15(b) | 3,500,000 | 5,554,063 | ||||||
| Steel–1.49% | ||||||||
AK Steel Corp., Sr. Unsec. Gtd. Conv. Notes, 5.00%, 11/15/19 | 9,050,000 | 10,226,500 | ||||||
Steel Dynamics Inc., Sr. Unsec. Gtd. Conv. Notes, 5.13%, 06/15/14 | 2,900,000 | 3,170,062 | ||||||
| 13,396,562 | ||||||||
See accompanying Notes to Financial Statements which are an integral part of the financial statements.
11 Invesco Convertible Securities Fund
| Principal Amount | Value | |||||||
| Systems Software–0.75% | ||||||||
Microsoft Corp., Sr. Unsec. Conv. Notes, 0%, 06/15/13(b)(f) | $ | 1,750,000 | $ | 1,759,844 | ||||
Symantec Corp., Series B, Sr. Unsec. Conv. Global Notes, 1.00%, 06/15/13 | 4,650,000 | 5,013,281 | ||||||
| �� | 6,773,125 | |||||||
| Thrifts & Mortgage Finance–1.05% | ||||||||
MGIC Investment Corp., Sr. Unsec. Conv. Notes, 5.00%, 05/01/17 | 2,550,000 | 1,930,031 | ||||||
Radian Group Inc., Sr. Unsec. Conv. Notes, 3.00%, 11/15/17 | 8,500,000 | 7,559,688 | ||||||
| 9,489,719 | ||||||||
| Tobacco–0.61% | ||||||||
Vector Group Ltd., Sr. Unsec. Conv. Notes, 2.50%, 01/15/19 | 5,040,000 | 5,516,925 | ||||||
| Trading Companies & Distributors–0.95% | ||||||||
Kaman Corp., Sr. Unsec. Conv. Notes, 3.25%, 11/15/17(b) | 1,235,000 | 1,557,644 | ||||||
Titan Machinery Inc., Sr. Unsec. Conv. Notes, 3.75%, 05/01/19(b) | 3,000,000 | 2,836,875 | ||||||
United Rentals Inc., Sr. Unsec. Conv. Notes, 4.00%, 11/15/15 | 1,000,000 | 4,125,000 | ||||||
| 8,519,519 | ||||||||
| Trucking–1.12% | ||||||||
Avis Budget Group Inc., Sr. Unsec. Conv. Notes, 3.50%, 10/01/14 | 7,365,000 | 10,122,272 | ||||||
Total Bonds and Notes |
| 716,177,802 | ||||||
| Shares | ||||||||
Preferred Stocks–15.66% |
| |||||||
| Aerospace & Defense–1.02% | ||||||||
United Technologies Corp., $3.75 Conv. Pfd. | 166,000 | 9,247,860 | ||||||
| Asset Management & Custody Banks–0.30% | ||||||||
AMG Capital Trust II, $2.58 Conv. Pfd. | 58,000 | 2,751,375 | ||||||
| Automobile Manufacturers–1.33% | ||||||||
General Motors Co., Series B, $2.38 Conv. Pfd. | 272,750 | 12,036,458 | ||||||
| Diversified Banks–1.47% | ||||||||
Wells Fargo & Co.-Class A, Series L, $75.00 Conv. Pfd. | 10,800 | 13,230,000 | ||||||
| Electric Utilities–0.79% | ||||||||
PPL Corp., | ||||||||
$4.38 Conv. Pfd. | 33,500 | 1,799,955 | ||||||
$4.75 Conv. Pfd. | 101,300 | 5,299,003 | ||||||
| 7,098,958 | ||||||||
| Health Care Facilities–0.66% | ||||||||
HealthSouth Corp., Series A, $65.00 Conv. Pfd. | 5,700 | 5,915,175 | ||||||
| Shares | Value | |||||||
| Health Care Services–0.44% | ||||||||
Omnicare Capital Trust II, Series B, $2.00 Conv. Pfd. | 82,133 | $ | 3,948,133 | |||||
Industrial Machinery–1.01% |
| |||||||
Stanley Black & Decker Inc., $4.75 Conv. Pfd. | 75,500 | 9,114,360 | ||||||
Life & Health Insurance–0.48% |
| |||||||
MetLife Inc., $2.50 Conv. Pfd. | 98,400 | 4,375,848 | ||||||
Multi-Line Insurance–0.80% |
| |||||||
Hartford Financial Services Group Inc., Series F, $1.81 Conv. Pfd. | 348,800 | 7,202,720 | ||||||
Oil & Gas Exploration & Production–0.80% |
| |||||||
Apache Corp., Series D, $3.00 Conv. Pfd. | 157,200 | 7,184,040 | ||||||
Other Diversified Financial Services–1.50% |
| |||||||
Bank of America Corp., Series L, $72.50 Conv. Pfd. | 11,900 | 13,506,500 | ||||||
Railroads–0.86% |
| |||||||
Genesee & Wyoming Inc., $5.00 Conv. Pfd. | 70,000 | 7,798,700 | ||||||
Regional Banks–1.26% |
| |||||||
KeyCorp, Series A, $7.75 Conv. Pfd. | 18,000 | 2,254,500 | ||||||
Wintrust Financial Corp., | ||||||||
$3.75 Conv. Pfd. | 147,300 | 8,027,850 | ||||||
Class C, $50.00 Conv. Pfd. | 1,000 | 1,040,250 | ||||||
| 11,322,600 | ||||||||
| Research & Consulting Services–0.46% | ||||||||
Nielsen Holdings N.V., $3.13 Conv. Pfd. | 73,120 | 4,124,421 | ||||||
Specialized REIT’s–0.77% |
| |||||||
Health Care REIT, Inc., Series I, $3.25 Conv. Pfd. | 121,300 | 6,937,147 | ||||||
| Tires & Rubber–1.08% | ||||||||
Goodyear Tire & Rubber Co. (The), $2.94 Conv. Pfd. | 206,000 | 9,725,260 | ||||||
| Trucking–0.63% | ||||||||
2010 Swift Mandatory Common Exchange Security Trust, $0.66 Conv. Pfd.(b) | 606,100 | 5,647,700 | ||||||
Total Preferred Stocks |
| 141,167,255 | ||||||
Common Stocks–2.51% |
| |||||||
| Biotechnology–0.77% | ||||||||
Alexion Pharmaceuticals, | 73,464 | 6,891,658 | ||||||
| Other Diversified Financial Services–1.14% | ||||||||
Citigroup Inc. | 259,414 | 10,262,416 | ||||||
Wireless Telecommunication Services–0.60% |
| |||||||
Crown Castle International Corp.(g) | 75,336 | 5,436,246 | ||||||
Total Common Stocks (Cost $14,101,473) | 22,590,320 | |||||||
See accompanying Notes to Financial Statements which are an integral part of the financial statements.
12 Invesco Convertible Securities Fund
| Shares | Value | |||||||
Money Market Funds–2.02% |
| |||||||
Liquid Assets Portfolio–Institutional | 9,105,600 | $ | 9,105,600 | |||||
Premier Portfolio–Institutional Class(h) | 9,105,599 | 9,105,599 | ||||||
Total Money Market Funds (Cost $18,211,199) | 18,211,199 | |||||||
TOTAL INVESTMENTS–99.65% |
| 898,146,576 | ||||||
OTHER ASSETS LESS LIABILITIES–0.35% |
| 3,152,382 | ||||||
NET ASSETS–100.00% |
| $ | 901,298,958 | |||||
Investment Abbreviations:
| Conv. | – Convertible | |
| Deb. | – Debentures | |
| Gtd. | – Guaranteed | |
| Jr. | – Junior | |
| Pfd. | – Preferred | |
| REIT | – Real Estate Investment Trust | |
| Sec. | – Secured | |
| Sr. | – Senior | |
| Sub. | – Subordinated | |
| Unsec. | – Unsecured | |
| Unsub. | – Unsubordinated |
Notes to Schedule of Investments:
| (a) | Industry and/or sector classifications used in this report are generally according to the Global Industry Classification Standard, which was developed by and is the exclusive property and a service mark of MSCI Inc. and Standard & Poor’s. |
| (b) | Security purchased or received in a transaction exempt from registration under the Securities Act of 1933, as amended. The security may be resold pursuant to an exemption from registration under the 1933 Act, typically to qualified institutional buyers. The aggregate value of these securities at December 31, 2012 was $176,816,056, which represented 19.62% of the Fund’s Net Assets. |
| (c) | Security has an irrevocable call by the issuer or mandatory put by the holder. Maturity date reflects such call or put. |
| (d) | Step coupon bond. Rate shown is the rate in effect on December 31, 2012. |
| (e) | Step coupon bond. The interest rate represents the coupon rate at which the bond will accrue at a specified future date. |
| (f) | Zero coupon bond issued at a discount. |
| (g) | Non-income producing security. |
| (h) | The money market fund and the Fund are affiliated by having the same investment adviser. |
See accompanying Notes to Financial Statements which are an integral part of the financial statements.
13 Invesco Convertible Securities Fund
Statement of Assets and Liabilities
December 31, 2012
Assets: |
| |||
Investments, at value (Cost $819,751,630) | $ | 879,935,377 | ||
Investments in affiliated money market funds, at value and cost | 18,211,199 | |||
Total investments, at value (Cost $837,962,829) | 898,146,576 | |||
Cash | 181,663 | |||
Receivable for: | ||||
Fund shares sold | 2,998,760 | |||
Dividends and interest | 4,676,123 | |||
Investment for trustee deferred compensation and retirement plans | 19,628 | |||
Other assets | 45,180 | |||
Total assets | 906,067,930 | |||
Liabilities: |
| |||
Payable for: | ||||
Fund shares reacquired | 3,942,920 | |||
Accrued fees to affiliates | 580,933 | |||
Accrued other operating expenses | 121,278 | |||
Trustee deferred compensation and retirement plans | 123,841 | |||
Total liabilities | 4,768,972 | |||
Net assets applicable to shares outstanding | $ | 901,298,958 | ||
Net assets consist of: |
| |||
Shares of beneficial interest | $ | 836,924,547 | ||
Undistributed net investment income | 4,395,968 | |||
Undistributed net realized gain (loss) | (205,304 | ) | ||
Unrealized appreciation | 60,183,747 | |||
| $ | 901,298,958 | |||
Net Assets: |
| |||
Class A | $ | 538,961,700 | ||
Class B | $ | 7,324,840 | ||
Class C | $ | 82,876,461 | ||
Class Y | $ | 269,399,540 | ||
Class R5 | $ | 2,726,367 | ||
Class R6 | $ | 10,050 | ||
Shares outstanding, $0.01 par value per share, |
| |||
Class A | 25,814,014 | |||
Class B | 349,892 | |||
Class C | 3,988,635 | |||
Class Y | 12,890,654 | |||
Class R5 | 130,559 | |||
Class R6 | 481 | |||
Class A: | ||||
Net asset value per share | $ | 20.88 | ||
Maximum offering price per share | ||||
(Net asset value of $20.88 ¸ 94.50%) | $ | 22.10 | ||
Class B: | ||||
Net asset value and offering price per share | $ | 20.93 | ||
Class C: | ||||
Net asset value and offering price per share | $ | 20.78 | ||
Class Y: | ||||
Net asset value and offering price per share | $ | 20.90 | ||
Class R5: | ||||
Net asset value and offering price per share | $ | 20.88 | ||
Class R6: | ||||
Net asset value and offering price per share | $ | 20.89 | ||
See accompanying Notes to Financial Statements which are an integral part of the financial statements.
14 Invesco Convertible Securities Fund
Statement of Operations
For the year ended December 31, 2012
Investment income: |
| |||
Interest | $ | 17,882,781 | ||
Dividends | 11,275,580 | |||
Dividends from affiliated money market funds | 42,726 | |||
Total investment income | 29,201,087 | |||
Expenses: | ||||
Advisory fees | 4,482,432 | |||
Administrative services fees | 232,300 | |||
Custodian fees | 31,890 | |||
Distribution fees: | ||||
Class A | 1,225,102 | |||
Class B | 89,373 | |||
Class C | 709,681 | |||
Transfer agent fees | 1,040,699 | |||
Transfer agent fees — R5 | 470 | |||
Trustees’ and officers’ fees and benefits | 58,755 | |||
Other | 391,252 | |||
Total expenses | 8,261,954 | |||
Less: Fees waived and expense offset arrangement(s) | (45,630 | ) | ||
Net expenses | 8,216,324 | |||
Net investment income | 20,984,763 | |||
Realized and unrealized gain from: | ||||
Net realized gain from investment securities | 19,129,108 | |||
Change in net unrealized appreciation of investment securities | 69,911,582 | |||
Net realized and unrealized gain | 89,040,690 | |||
Net increase in net assets resulting from operations | $ | 110,025,453 | ||
See accompanying Notes to Financial Statements which are an integral part of the financial statements.
15 Invesco Convertible Securities Fund
Statement of Changes in Net Assets
For the years ended December 31, 2012 and 2011
| 2012 | 2011 | |||||||
Operations: |
| |||||||
Net investment income | $ | 20,984,763 | $ | 15,372,481 | ||||
Net realized gain (loss) | 19,129,108 | (14,150,218 | ) | |||||
Change in net unrealized appreciation (depreciation) | 69,911,582 | (81,408,913 | ) | |||||
Net increase (decrease) in net assets resulting from operations | 110,025,453 | (80,186,650 | ) | |||||
Distributions to shareholders from net investment income: | ||||||||
Class A | (12,090,682 | ) | (9,209,678 | ) | ||||
Class B | (131,515 | ) | (151,638 | ) | ||||
Class C | (1,384,026 | ) | (976,967 | ) | ||||
Class Y | (6,224,036 | ) | (4,016,291 | ) | ||||
Class R5 | (68,920 | ) | (30,690 | ) | ||||
Class R6 | (69 | ) | — | |||||
Total distributions from net investment income | (19,899,248 | ) | (14,385,264 | ) | ||||
Share transactions-net: | ||||||||
Class A | (35,397,834 | ) | 460,823,869 | |||||
Class B | (4,205,115 | ) | 597,013 | |||||
Class C | (13,591,258 | ) | 78,526,174 | |||||
Class Y | 41,215,438 | 209,775,935 | ||||||
Class R5 | 652,715 | 2,017,823 | ||||||
Class R6 | 10,000 | — | ||||||
Net increase (decrease) in net assets resulting from share transactions | (11,316,054 | ) | 751,740,814 | |||||
Net increase in net assets | 78,810,151 | 657,168,900 | ||||||
Net assets: | ||||||||
Beginning of year | 822,488,807 | 165,319,907 | ||||||
End of year (includes undistributed net investment income of $4,395,968 and $(71,087), respectively) | $ | 901,298,958 | $ | 822,488,807 | ||||
Notes to Financial Statements
December 31, 2012
NOTE 1—Significant Accounting Policies
Invesco Convertible Securities Fund (the “Fund”) is a series portfolio of AIM Growth Series (Invesco Growth Series) (the “Trust”). The Trust is organized as a Delaware statutory trust and is registered under the Investment Company Act of 1940, as amended (the “1940 Act”), as an open-end series management investment company consisting of sixteen separate series portfolios, each authorized to issue an unlimited number of shares of beneficial interest. The assets, liabilities and operations of each portfolio are accounted for separately. Information presented in these financial statements pertains only to the Fund. Matters affecting each portfolio or class will be voted on exclusively by the shareholders of such portfolio or class.
The Fund’s investment objective is to seek a high level of total return on its assets through a combination of current income and capital appreciation.
The Fund currently consists of six different classes of shares: Class A, Class B, Class C, Class Y, Class R5 and Class R6. On September 24, 2012, Institutional Class shares were renamed Class R5 shares and the Fund began offering Class R6 shares. Class A shares are sold with a front-end sales charge unless certain waiver criteria are met and under certain circumstances load waived shares may be subject to contingent deferred sales charges (“CDSC”). Class C shares are sold with a CDSC. Class Y, Class R5 and Class R6 shares are sold at net asset value. Effective November 30, 2010, new or additional investments in Class B shares are no longer permitted. Existing shareholders of Class B shares may continue to reinvest dividends and capital gains distributions in Class B shares until they convert to Class A shares. Also, shareholders in Class B shares will be able to exchange those shares for Class B shares of other Invesco Funds offering such shares until they convert to Class A shares. Generally, Class B shares will automatically convert to Class A shares on or about the month-end, which is at least eight years after the date of purchase. Redemption of Class B shares prior to the conversion date will be subject to a CDSC.
The following is a summary of the significant accounting policies followed by the Fund in the preparation of its financial statements.
| A. | Security Valuations — Securities, including restricted securities, are valued according to the following policy. Debt obligations (including convertible bonds) and unlisted equities are fair valued using an evaluated quote provided by an independent pricing service. Evaluated quotes provided by the pricing service may be determined without exclusive reliance on quoted prices, and may reflect appropriate factors such as institution-size trading in similar groups of securities, developments related to specific securities, dividend rate (for unlisted equities), yield (for debt obligations), quality, type of issue, coupon rate (for debt obligations), maturity (for debt obligations), individual trading characteristics and other market data. Debt obligations are subject to interest rate and credit risks. In addition, all debt obligations involve some risk of default with respect to interest and/or principal payments. |
16 Invesco Convertible Securities Fund
A security listed or traded on an exchange (except convertible bonds) is valued at its last sales price or official closing price as of the close of the customary trading session on the exchange where the security is principally traded, or lacking any sales or official closing price on a particular day, the security may be valued at the closing bid price on that day. Securities traded in the over-the-counter market are valued based on prices furnished by independent pricing services or market makers. When such securities are valued by an independent pricing service they may be considered fair valued. Futures contracts are valued at the final settlement price set by an exchange on which they are principally traded. Listed options are valued at the mean between the last bid and ask prices from the exchange on which they are principally traded. Options not listed on an exchange are valued by an independent source at the mean between the last bid and ask prices. For purposes of determining net asset value per share, futures and option contracts generally are valued 15 minutes after the close of the customary trading session of the New York Stock Exchange (“NYSE”).
Investments in open-end and closed-end registered investment companies that do not trade on an exchange are valued at the end of day net asset value per share. Investments in open-end and closed-end registered investment companies that trade on an exchange are valued at the last sales price or official closing price as of the close of the customary trading session on the exchange where the security is principally traded.
Swap agreements are fair valued using an evaluated quote provided by an independent pricing service. Evaluated quotes provided by the pricing service are valued based on a model which may include end of day net present values, spreads, ratings, industry, and company performance.
Foreign securities’ (including foreign exchange contracts) prices are converted into U.S. dollar amounts using the applicable exchange rates as of the close of the NYSE. If market quotations are available and reliable for foreign exchange-traded equity securities, the securities will be valued at the market quotations. Because trading hours for certain foreign securities end before the close of the NYSE, closing market quotations may become unreliable. If between the time trading ends on a particular security and the close of the customary trading session on the NYSE, events occur that the Adviser determines are significant and make the closing price unreliable, the Fund may fair value the security. If the event is likely to have affected the closing price of the security, the security will be valued at fair value in good faith using procedures approved by the Board of Trustees. Adjustments to closing prices to reflect fair value may also be based on a screening process of an independent pricing service to indicate the degree of certainty, based on historical data, that the closing price in the principal market where a foreign security trade is not the current value as of the close of the NYSE. Foreign securities’ prices meeting the approved degree of certainty that the price is not reflective of current value will be priced at the indication of fair value from the independent pricing service. Multiple factors may be considered by the independent pricing service in determining adjustments to reflect fair value and may include information relating to sector indices, American Depositary Receipts and domestic and foreign index futures. Foreign securities may have additional risks including exchange rate changes, potential for sharply devalued currencies and high inflation, political and economic upheaval, the relative lack of issuer information, relatively low market liquidity and the potential lack of strict financial and accounting controls and standards.
Securities for which market prices are not provided by any of the above methods may be valued based upon quotes furnished by independent sources. The last bid price may be used to value equity securities. The mean between the last bid and asked prices is used to value debt obligations, including corporate loans.
Securities for which market quotations are not readily available or became unreliable are valued at fair value as determined in good faith by or under the supervision of the Trust’s officers following procedures approved by the Board of Trustees. Issuer specific events, market trends, bid/ask quotes of brokers and information providers and other market data may be reviewed in the course of making a good faith determination of a security’s fair value.
Valuations change in response to many factors including the historical and prospective earnings of the issuer, the value of the issuer’s assets, general economic conditions, interest rates, investor perceptions and market liquidity. Because of the inherent uncertainties of valuation, the values reflected in the financial statements may materially differ from the value received upon actual sale of those investments.
| B. | Securities Transactions and Investment Income — Securities transactions are accounted for on a trade date basis. Realized gains or losses on sales are computed on the basis of specific identification of the securities sold. Interest income is recorded on the accrual basis from settlement date. Paydown gains and losses on mortgage and asset-backed securities are recorded as adjustments to interest income. Dividend income (net of withholding tax, if any) is recorded on the ex-dividend date. Bond premiums and discounts are amortized and/or accreted for financial reporting purposes. |
The Fund may periodically participate in litigation related to Fund investments. As such, the Fund may receive proceeds from litigation settlements. Any proceeds received are included in the Statement of Operations as realized gain (loss) for investments no longer held and as unrealized gain (loss) for investments still held.
Brokerage commissions and mark ups are considered transaction costs and are recorded as an increase to the cost basis of securities purchased and/or a reduction of proceeds on a sale of securities. Such transaction costs are included in the determination of net realized and unrealized gain (loss) from investment securities reported in the Statement of Operations and the Statement of Changes in Net Assets and the net realized and unrealized gains (losses) on securities per share in the Financial Highlights. Transaction costs are included in the calculation of the Fund’s net asset value and, accordingly, they reduce the Fund’s total returns. These transaction costs are not considered operating expenses and are not reflected in net investment income reported in the Statement of Operations and Statement of Changes in Net Assets, or the net investment income per share and ratios of expenses and net investment income reported in the Financial Highlights, nor are they limited by any expense limitation arrangements between the Fund and the investment adviser.
The Fund allocates income and realized and unrealized capital gains and losses to a class based on the relative net assets of each class.
| C. | Country Determination — For the purposes of making investment selection decisions and presentation in the Schedule of Investments, the investment adviser may determine the country in which an issuer is located and/or credit risk exposure based on various factors. These factors include the laws of the country under which the issuer is organized, where the issuer maintains a principal office, the country in which the issuer derives 50% or more of its total revenues and the country that has the primary market for the issuer’s securities, as well as other criteria. Among the other criteria that may be evaluated for making this determination are the country in which the issuer maintains 50% or more of its assets, the type of security, financial guarantees and enhancements, the nature of the collateral and the sponsor organization. Country of issuer and/or credit risk exposure has been determined to be the United States of America, unless otherwise noted. |
| D. | Distributions — Distributions from income are declared and paid quarterly and are recorded on the ex-dividend date. Distributions from net realized capital gain, if any, are generally declared and paid annually and recorded on the ex-dividend date. The Fund may elect to treat a portion of the proceeds from redemptions as distributions for federal income tax purposes. |
17 Invesco Convertible Securities Fund
| E. | Federal Income Taxes — The Fund intends to comply with the requirements of Subchapter M of the Internal Revenue Code necessary to qualify as a regulated investment company and to distribute substantially all of the Fund’s taxable earnings to shareholders. As such, the Fund will not be subject to federal income taxes on otherwise taxable income (including net realized capital gain) that is distributed to shareholders. Therefore, no provision for federal income taxes is recorded in the financial statements. |
The Fund files tax returns in the U.S. Federal jurisdiction and certain other jurisdictions. Generally, the Fund is subject to examinations by such taxing authorities for up to three years after the filing of the return for the tax period.
| F. | Expenses — Fees provided for under the Rule 12b-1 plan of a particular class of the Fund are charged to the operations of such class. Transfer agency fees and expenses and other shareholder recordkeeping fees and expenses attributable to Class R5 and Class R6 are allocated to each share class based on relative net assets. Sub-accounting fees attributable to Class R5 are charged to the operations of the class. Transfer agency fees and expenses and other shareholder recordkeeping fees and expenses relating to all other classes are allocated among those classes based on relative net assets. All other expenses are allocated among the classes based on relative net assets. |
| G. | Accounting Estimates — The preparation of financial statements in conformity with accounting principles generally accepted in the United States of America (“GAAP”) requires management to make estimates and assumptions that affect the reported amounts of assets and liabilities at the date of the financial statements and the reported amounts of revenues and expenses during the reporting period including estimates and assumptions related to taxation. Actual results could differ from those estimates by a significant amount. In addition, the Fund monitors for material events or transactions that may occur or become known after the period-end date and before the date the financial statements are released to print. |
| H. | Indemnifications — Under the Trust’s organizational documents, each Trustee, officer, employee or other agent of the Trust is indemnified against certain liabilities that may arise out of the performance of their duties to the Fund. Additionally, in the normal course of business, the Fund enters into contracts, including the Fund’s servicing agreements, that contain a variety of indemnification clauses. The Fund’s maximum exposure under these arrangements is unknown as this would involve future claims that may be made against the Fund that have not yet occurred. The risk of material loss as a result of such indemnification claims is considered remote. |
NOTE 2—Advisory Fees and Other Fees Paid to Affiliates
The Trust has entered into a master investment advisory agreement with Invesco Advisers, Inc. (the “Adviser” or “Invesco”). Under the terms of the investment advisory agreement, the Fund pays an advisory fee to the Adviser based on the annual rate of the Fund’s average daily net assets as follows:
| Average Daily Net Assets | Rate | |||||
First $750 million | 0 | .520% | ||||
Next $250 million | 0 | .470% | ||||
Next $500 million | 0 | .420% | ||||
Next $500 million | 0 | .395% | ||||
Next $1 billion | 0 | .370% | ||||
Over $3 billion | 0 | .345% | ||||
Under the terms of a master sub-advisory agreement between the Adviser and each of Invesco Asset Management Deutschland GmbH, Invesco Asset Management Limited, Invesco Asset Management (Japan) Limited, Invesco Australia Limited, Invesco Hong Kong Limited, Invesco Senior Secured Management, Inc. and Invesco Canada Ltd. (collectively, the “Affiliated Sub-Advisers”) the Adviser, not the Fund, may pay 40% of the fees paid to the Adviser to any such Affiliated Sub-Adviser(s) that provide discretionary investment management services to the Fund based on the percentage of assets allocated to such Sub-Adviser(s).
Effective July 1, 2012, the Adviser has contractually agreed, through at least June 30, 2013, to waive advisory fees and/or reimburse expenses of all shares to the extent necessary to limit total annual fund operating expenses after fee waiver and/or expense reimbursement (excluding certain items discussed below) of Class A, Class B, Class C, Class Y, Class R5 and Class R6 shares to 1.50%, 2.25%, 2.25%, 1.25%, 1.25% and 1.25%, respectively, of average daily net assets. Prior to July 1, 2012, the Adviser had contractually agreed to waive advisory fees and/or reimburse expenses of all shares to the extent necessary to limit total annual fund operating expenses after fee waiver and/or expense reimbursement (excluding certain items discussed below) of Class A, Class B, Class C, Class Y and Class R5 shares to 1.11%, 1.86%, 1.86%, 0.86% and 0.86%, respectively, of average daily net assets. In determining the Adviser’s obligation to waive advisory fees and/or reimburse expenses, the following expenses are not taken into account, and could cause the total annual fund operating expenses after fee waiver and/or expense reimbursement to exceed the numbers reflected above: (1) interest; (2) taxes; (3) dividend expense on short sales; (4) extraordinary or non-routine items, including litigation expenses; and (5) expenses that the Fund has incurred but did not actually pay because of an expense offset arrangement. Unless the Board of Trustees and Invesco mutually agree to amend or continue the fee waiver agreement, it will terminate on June 30, 2013. The Adviser did not waive fees and/or reimburse expenses during the period under the expense limitation.
Further, the Adviser has contractually agreed, through at least June 30, 2013, to waive the advisory fee payable by the Fund in an amount equal to 100% of the net advisory fees the Adviser receives from the affiliated money market funds on investments by the Fund of uninvested cash in such affiliated money market funds.
For the year ended December 31, 2012, the Adviser waived advisory fees of $44,125.
The Trust has entered into a master administrative services agreement with Invesco pursuant to which the Fund has agreed to pay Invesco for certain administrative costs incurred in providing accounting services to the Fund. For the year ended December 31, 2012, expenses incurred under the agreement are shown in the Statement of Operations as Administrative services fees.
The Trust has entered into a transfer agency and service agreement with Invesco Investment Services, Inc. (“IIS”) pursuant to which the Fund has agreed to pay IIS a fee for providing transfer agency and shareholder services to the Fund and reimburse IIS for certain expenses incurred by IIS in the course of providing such services. IIS may make payments to intermediaries that provide omnibus account services, sub-accounting services and/or networking services. All fees payable by IIS to intermediaries that provide omnibus account services or sub-accounting are charged back to the Fund,
18 Invesco Convertible Securities Fund
subject to certain limitations approved by the Trust’s Board of Trustees. For the year ended December 31, 2012, expenses incurred under the agreement are shown in the Statement of Operations as Transfer agent fees.
Shares of the Fund are distributed by Invesco Distributors, Inc. (“IDI”), an affiliate of the Adviser. The Fund has adopted a Plan of Distribution (the “Plan”) pursuant to Rule 12b-1 under the 1940 Act. The Plan provides that the Fund will reimburse IDI for distribution related expenses that IDI incurs up to a maximum of the following annual rates: (1) Class A — up to 0.25% of the average daily net assets of Class A shares; (2) Class B — up to 1.00% of the average daily net assets of Class B shares; and (3) Class C — up to 1.00% of the average daily net assets of Class C shares.
In the case of Class B shares, provided that the Plan continues in effect, any cumulative expenses incurred by IDI, but not yet reimbursed to IDI, may be recovered through the payment of future distribution fees from the Fund pursuant to the Plan and contingent deferred sales charges paid by investors upon redemption of Class B shares.
For the year ended December 31, 2012, expenses incurred under these agreements are shown in the Statement of Operations as Distribution fees.
Front-end sales commissions and CDSC (collectively, the “sales charges”) are not recorded as expenses of the Fund. Front-end sales commissions are deducted from proceeds from the sales of Fund shares prior to investment in Class A shares of the Fund. CDSC are deducted from redemption proceeds prior to remittance to the shareholder. During the year ended December 31, 2012, IDI advised the Fund that IDI retained $65,831 in front-end sales commissions from the sale of Class A shares and $7,433, $14,378 and $25,946 from Class A, Class B and Class C shares, respectively, for CDSC imposed on redemptions by shareholders.
Certain officers and trustees of the Trust are officers and directors of the Adviser, IIS and/or IDI.
NOTE 3—Additional Valuation Information
GAAP defines fair value as the price that would be received to sell an asset or paid to transfer a liability in an orderly transaction between market participants at the measurement date, under current market conditions. GAAP establishes a hierarchy that prioritizes the inputs to valuation methods giving the highest priority to readily available unadjusted quoted prices in an active market for identical assets (Level 1) and the lowest priority to significant unobservable inputs (Level 3) generally when market prices are not readily available or are unreliable. Based on the valuation inputs, the securities or other investments are tiered into one of three levels. Changes in valuation methods may result in transfers in or out of an investment’s assigned level:
| Level 1 — | Prices are determined using quoted prices in an active market for identical assets. |
| Level 2 — | Prices are determined using other significant observable inputs. Observable inputs are inputs that other market participants may use in pricing a security. These may include quoted prices for similar securities, interest rates, prepayment speeds, credit risk, yield curves, loss severities, default rates, discount rates, volatilities and others. |
| Level 3 — | Prices are determined using significant unobservable inputs. In situations where quoted prices or observable inputs are unavailable (for example, when there is little or no market activity for an investment at the end of the period), unobservable inputs may be used. Unobservable inputs reflect the Fund’s own assumptions about the factors market participants would use in determining fair value of the securities or instruments and would be based on the best available information. |
The following is a summary of the tiered valuation input levels, as of December 31, 2012. The level assigned to the securities valuations may not be an indication of the risk or liquidity associated with investing in those securities. Because of the inherent uncertainties of valuation, the values reflected in the financial statements may materially differ from the value received upon actual sale of those investments.
| Level 1 | Level 2 | Level 3 | Total | |||||||||||||
Equity Securities | $ | 154,462,003 | $ | 27,506,771 | $ | — | $ | 181,968,774 | ||||||||
Corporate Debt Securities | — | 716,177,802 | — | 716,177,802 | ||||||||||||
Total Investments | $ | 154,462,003 | $ | 743,684,573 | $ | — | $ | 898,146,576 | ||||||||
NOTE 4—Expense Offset Arrangement(s)
The expense offset arrangement is comprised of transfer agency credits which result from balances in Demand Deposit Accounts (DDA) used by the transfer agent for clearing shareholder transactions. For the year ended December 31, 2012, the Fund received credits from this arrangement, which resulted in the reduction of the Fund’s total expenses of $1,505.
NOTE 5—Trustees’ and Officers’ Fees and Benefits
“Trustees’ and Officers’ Fees and Benefits” include amounts accrued by the Fund to pay remuneration to certain Trustees and Officers of the Fund. Trustees have the option to defer compensation payable by the Fund, and “Trustees’ and Officers’ Fees and Benefits” also include amounts accrued by the Fund to fund such deferred compensation amounts. Those Trustees who defer compensation have the option to select various Invesco Funds in which their deferral accounts shall be deemed to be invested. Finally, certain current Trustees are eligible to participate in a retirement plan that provides for benefits to be paid upon retirement to Trustees over a period of time based on the number of years of service. The Fund may have certain former Trustees who also participate in a retirement plan and receive benefits under such plan. “Trustees’ and Officers’ Fees and Benefits” include amounts accrued by the Fund to fund such retirement benefits. Obligations under the deferred compensation and retirement plans represent unsecured claims against the general assets of the Fund.
NOTE 6—Cash Balances
The Fund is permitted to temporarily carry a negative or overdrawn balance in its account with State Street Bank and Trust Company, the custodian bank. Such balances, if any at period end, are shown in the Statement of Assets and Liabilities under the payable caption Amount due custodian. To compensate the custodian bank for such overdrafts, the overdrawn Fund may either (1) leave funds as a compensating balance in the account so the custodian bank can be compensated by earning the additional interest; or (2) compensate by paying the custodian bank at a rate agreed upon by the custodian bank and Invesco, not to exceed the contractually agreed upon rate.
19 Invesco Convertible Securities Fund
NOTE 7—Distributions to Shareholders and Tax Components of Net Assets
Tax Character of Distributions to Shareholders Paid During the Years Ended December 31, 2012 and 2011:
| 2012 | 2011 | |||||||
Ordinary income | $ | 19,899,248 | $ | 14,385,264 | ||||
Tax Components of Net Assets at Period-End:
| 2012 | ||||
Undistributed ordinary income | $ | 8,077,735 | ||
Undistributed long-term gain | 1,532,489 | |||
Net unrealized appreciation — investments | 55,465,710 | |||
Temporary book/tax differences | (121,503 | ) | ||
Post-October deferrals | (580,020 | ) | ||
Shares of beneficial interest | 836,924,547 | |||
Total net assets | $ | 901,298,958 | ||
The difference between book-basis and tax-basis unrealized appreciation (depreciation) is due to differences in the timing of recognition of gains and losses on investments for tax and book purposes. The Fund’s net unrealized appreciation difference is attributable primarily to wash sales and book to tax accretion and amortization differences.
The temporary book/tax differences are a result of timing differences between book and tax recognition of income and/or expenses. The Fund’s temporary book/tax differences are the result of the trustee deferral of compensation and retirement plan benefits.
Capital loss carryforward is calculated and reported as of a specific date. Results of transactions and other activity after that date may affect the amount of capital loss carryforward actually available for the Fund to utilize. The Regulated Investment Company Modernization Act of 2010 (the “Act”) eliminated the eight-year carryover period for capital losses that arise in taxable years beginning after its enactment date of December 22, 2010. Consequently, these capital losses can be carried forward for an unlimited period. However, capital losses with an expiration period may not be used to offset capital gains until all net capital losses without an expiration date have been utilized. Additionally, post-enactment capital loss carryovers will retain their character as either short-term or long-term capital losses instead of as short-term capital losses as under prior law. The ability to utilize capital loss carryforward in the future may be limited under the Internal Revenue Code and related regulations based on the results of future transactions.
The Fund utilized $7,174,336 of capital loss carryforward in the current period to offset net realized capital gain for federal income tax purposes. The Fund does not have a capital loss carryforward at period-end.
NOTE 8—Investment Securities
The aggregate amount of investment securities (other than short-term securities, U.S. Treasury obligations and money market funds, if any) purchased and sold by the Fund during the year ended December 31, 2012 was $488,999,319 and $489,045,143, respectively. Cost of investments on a tax basis includes the adjustments for financial reporting purposes as of the most recently completed federal income tax reporting period-end.
| Unrealized Appreciation (Depreciation) of Investment Securities on a Tax Basis | ||||
Aggregate unrealized appreciation of investment securities | $ | 73,666,348 | ||
Aggregate unrealized (depreciation) of investment securities | (18,200,638 | ) | ||
Net unrealized appreciation of investment securities | $ | 55,465,710 | ||
Cost of investments for tax purposes is $842,680,866.
20 Invesco Convertible Securities Fund
NOTE 9—Reclassification of Permanent Differences
Primarily as a result of differing book/tax treatment of convertible preferred sale adjustment and prior year bond premium amortization, on December 31, 2012, undistributed net investment income was increased by $3,381,540, undistributed net realized gain (loss) was decreased by $2,764,724 and shares of beneficial interest was decreased by $616,816. This reclassification had no effect on the net assets of the Fund.
NOTE 10—Share Information
| Summary of Share Activity | ||||||||||||||||
| Years ended December 31, | ||||||||||||||||
| 2012(a) | 2011 | |||||||||||||||
| Shares | Amount | Shares | Amount | |||||||||||||
Sold: | ||||||||||||||||
Class A | 6,880,930 | $ | 139,319,188 | 13,317,412 | $ | 271,534,918 | ||||||||||
Class B | 31,321 | 630,446 | 122,242 | 2,512,516 | ||||||||||||
Class C | 1,065,967 | 21,480,711 | 3,672,839 | 74,859,030 | ||||||||||||
Class Y | 8,767,192 | 177,589,797 | 13,913,381 | 281,440,401 | ||||||||||||
Class R5(b) | 60,488 | 1,229,279 | 33,432 | 640,720 | ||||||||||||
Class R6(b) | 481 | 10,000 | — | — | ||||||||||||
Issued as reinvestment of dividends: | ||||||||||||||||
Class A | 470,959 | 9,542,077 | 392,683 | 7,603,988 | ||||||||||||
Class B | 5,292 | 107,367 | 6,391 | 125,094 | ||||||||||||
Class C | 53,479 | 1,078,990 | 42,819 | 825,578 | ||||||||||||
Class Y | 207,873 | 4,212,523 | 153,002 | 2,970,058 | ||||||||||||
Class R5 | 3,298 | 66,779 | 1,587 | 30,487 | ||||||||||||
Automatic conversion of Class B shares to Class A shares: | ||||||||||||||||
Class A | 145,080 | 2,934,262 | 177,265 | 3,485,358 | ||||||||||||
Class B | (144,404 | ) | (2,934,262 | ) | (176,832 | ) | (3,485,358 | ) | ||||||||
Issued in connection with acquisitions:(c) | ||||||||||||||||
Class A | — | — | 14,616,812 | 309,284,242 | ||||||||||||
Class B | — | — | 348,851 | 7,397,271 | ||||||||||||
Class C | — | — | 1,244,991 | 26,175,151 | ||||||||||||
Class Y | — | — | 1,629,301 | 34,518,583 | ||||||||||||
Class R5 | — | — | 64,292 | 1,362,216 | ||||||||||||
Reacquired: | ||||||||||||||||
Class A | (9,287,480 | ) | (187,193,361 | ) | (6,802,978 | ) | (131,084,637 | ) | ||||||||
Class B | (100,198 | ) | (2,008,666 | ) | (291,825 | ) | (5,952,510 | ) | ||||||||
Class C | (1,806,467 | ) | (36,150,959 | ) | (1,223,711 | ) | (23,333,585 | ) | ||||||||
Class Y | (6,945,469 | ) | (140,586,882 | ) | (5,691,697 | ) | (109,153,107 | ) | ||||||||
Class R5 | (31,769 | ) | (643,343 | ) | (769 | ) | (15,600 | ) | ||||||||
Net increase (decrease) in share activity | (623,427 | ) | $ | (11,316,054 | ) | 35,549,488 | $ | 751,740,814 | ||||||||
| (a) | There are entities that are record owners of more than 5% of the outstanding shares of the Fund and in the aggregate own 44% of the outstanding shares of the Fund. IDI has an agreement with these entities to sell Fund shares. The Fund, Invesco and/or Invesco affiliates may make payments to these entities, which are considered to be related to the Fund, for providing services to the Fund, Invesco and/or Invesco affiliates including but not limited to services such as securities brokerage, distribution, third party record keeping and account servicing. The Fund has no knowledge as to whether all or any portion of the shares owned of record by these entities are also owned beneficially. |
| (b) | Commencement date of May 23, 2011 and September 24, 2012 for Class R5 and Class R6 shares, respectively. |
| (c) | As of the opening of business on May 23, 2011, the Fund acquired all the net assets of Invesco Van Kampen Harbor Fund (the “Target Fund”) pursuant to a plan of reorganization approved by the Trustees of the Fund on November 10, 2010 and by the shareholders of the Target Fund on April 1, 2011. The acquisition was accomplished by a tax-free exchange of 17,904,247 shares of the Fund for 21,325,851 shares outstanding of the Target Fund as of the close of business on May 20, 2011. Each class of the Target Fund was exchanged for the like class of shares of the Fund based on the relative net asset value of the Target Fund to the net asset value of the Fund on the close of business, April 29, 2011. The Target Fund’s net assets at that date of $378,737,463 including $53,787,265 of unrealized appreciation, was combined with those of the Fund. The net assets of the Fund immediately before the acquisition were $522,752,156. The net assets immediately after the acquisition were $901,489,619. |
| The pro forma results of operations for the year ended December 31, 2011 assuming the reorganization had been completed on January 1, 2011, the beginning of the annual reporting period, are as follows: |
Net investment income | $ | 19,163,880 | ||
Net realized/unrealized gains (losses) | (77,709,141 | ) | ||
Change in net assets resulting from operations | $ | (58,545,261 | ) |
| The combined investment portfolios have been managed as a single integrated portfolio since the acquisition was completed, it is not practicable to separate the amounts of revenue and earnings of the Target Fund that have been included in the Fund’s Statement of Operations since May 23, 2011. |
21 Invesco Convertible Securities Fund
NOTE 11—Financial Highlights
The following schedule presents financial highlights for a share of the Fund outstanding throughout the periods indicated.
| Net asset value, beginning of period | Net investment income(a) | Net gains (losses) on securities (both realized and unrealized) | Total from investment operations | Dividends from net investment income | Distributions from net realized gains | Total distributions | Net asset value, end of period | Total return(b) | Net assets, end of period (000’s omitted) | Ratio of expenses to average net assets with fee waivers and/or expenses absorbed | Ratio of expenses to average net assets without fee waivers and/or expenses absorbed | Ratio of net investment income to average net assets | Portfolio turnover(c) | |||||||||||||||||||||||||||||||||||||||||||||||||||||||||
| Class A | ||||||||||||||||||||||||||||||||||||||||||||||||||||||||||||||||||||||
| Year ended 12/31/12 | $ | 18.78 | $ | 0.48 | $ | 2.08 | $ | 2.56 | $ | (0.46 | ) | $ | — | $ | (0.46 | ) | $ | 20.88 | 13.74 | % | $ | 538,962 | 0.93 | %(d)(e) | 0.94 | %(d)(e) | 2.41 | %(d)(e) | 58 | % | ||||||||||||||||||||||||||||||||||||||||
| Year ended 12/31/11 | 20.05 | 0.46 | (1.34 | ) | (0.88 | ) | (0.39 | ) | — | (0.39 | ) | 18.78 | (4.46 | ) | 518,426 | 0.97 | 0.98 | 2.37 | 38 | |||||||||||||||||||||||||||||||||||||||||||||||||||
| Three months ended 12/31/10 | 18.71 | 0.12 | 1.35 | 1.47 | (0.13 | ) | — | (0.13 | ) | 20.05 | 7.86 | 118,359 | 1.09 | (f) | 1.10 | (f) | 2.42 | (f) | 24 | |||||||||||||||||||||||||||||||||||||||||||||||||||
| Year ended 09/30/10 | 16.86 | 0.59 | 1.97 | 2.56 | (0.71 | ) | — | (0.71 | ) | 18.71 | 15.45 | 90,840 | 1.17 | 1.17 | 3.33 | 85 | ||||||||||||||||||||||||||||||||||||||||||||||||||||||
| Year ended 09/30/09 | 15.35 | 0.40 | 1.72 | 2.12 | (0.49 | ) | (0.12 | ) | (0.61 | ) | 16.86 | 14.80 | 82,241 | 1.27 | (g) | 2.86 | (g) | 104 | ||||||||||||||||||||||||||||||||||||||||||||||||||||
| Year ended 09/30/08 | 19.01 | 0.32 | (3.52 | ) | (3.20 | ) | (0.46 | ) | — | (0.46 | ) | 15.35 | (17.05 | ) | 80,731 | 1.12 | (g) | 1.76 | (g) | 95 | ||||||||||||||||||||||||||||||||||||||||||||||||||
| Class B | ||||||||||||||||||||||||||||||||||||||||||||||||||||||||||||||||||||||
| Year ended 12/31/12 | 18.83 | 0.33 | 2.08 | 2.41 | (0.31 | ) | — | (0.31 | ) | 20.93 | 12.85 | 7,325 | 1.70 | (d)(e) | 1.71 | (d)(e) | 1.64 | (d)(e) | 58 | |||||||||||||||||||||||||||||||||||||||||||||||||||
| Year ended 12/31/11 | 20.10 | 0.32 | (1.35 | ) | (1.03 | ) | (0.24 | ) | — | (0.24 | ) | 18.83 | (5.16 | ) | 10,505 | 1.72 | 1.73 | 1.62 | 38 | |||||||||||||||||||||||||||||||||||||||||||||||||||
| Three months ended 12/31/10 | 18.76 | 0.08 | 1.35 | 1.43 | (0.09 | ) | — | (0.09 | ) | 20.10 | 7.64 | 11,038 | 1.84 | (f) | 1.85 | (f) | 1.67 | (f) | 24 | |||||||||||||||||||||||||||||||||||||||||||||||||||
| Year ended 09/30/10 | 16.90 | 0.46 | 1.97 | 2.43 | (0.57 | ) | — | (0.57 | ) | 18.76 | 14.61 | 11,454 | 1.92 | 1.92 | 2.58 | 85 | ||||||||||||||||||||||||||||||||||||||||||||||||||||||
| Year ended 09/30/09 | 15.39 | 0.29 | 1.72 | 2.01 | (0.38 | ) | (0.12 | ) | (0.50 | ) | 16.90 | 13.93 | 16,790 | 2.02 | (g) | 2.11 | (g) | 104 | ||||||||||||||||||||||||||||||||||||||||||||||||||||
| Year ended 09/30/08 | 19.03 | 0.19 | (3.51 | ) | (3.32 | ) | (0.32 | ) | — | (0.32 | ) | 15.39 | (17.64 | ) | 23,691 | 1.88 | (g) | 1.00 | (g) | 95 | ||||||||||||||||||||||||||||||||||||||||||||||||||
| Class C | ||||||||||||||||||||||||||||||||||||||||||||||||||||||||||||||||||||||
| Year ended 12/31/12 | 18.69 | 0.36 | 2.06 | 2.42 | (0.33 | ) | — | (0.33 | ) | 20.78 | 13.02 | 82,876 | 1.53 | (d)(e) | 1.54 | (d)(e) | 1.81 | (d)(e) | 58 | |||||||||||||||||||||||||||||||||||||||||||||||||||
| Year ended 12/31/11 | 19.94 | 0.32 | (1.33 | ) | (1.01 | ) | (0.24 | ) | — | (0.24 | ) | 18.69 | (5.12 | ) | 87,388 | 1.72 | 1.73 | 1.62 | 38 | |||||||||||||||||||||||||||||||||||||||||||||||||||
| Three months ended 12/31/10 | 18.61 | 0.08 | 1.34 | 1.42 | (0.09 | ) | — | (0.09 | ) | 19.94 | 7.64 | 18,719 | 1.84 | (f) | 1.85 | (f) | 1.67 | (f) | 24 | |||||||||||||||||||||||||||||||||||||||||||||||||||
| Year ended 09/30/10 | 16.77 | 0.46 | 1.96 | 2.42 | (0.58 | ) | — | (0.58 | ) | 18.61 | 14.62 | 9,486 | 1.92 | 1.92 | 2.58 | 85 | ||||||||||||||||||||||||||||||||||||||||||||||||||||||
| Year ended 09/30/09 | 15.28 | 0.30 | 1.70 | 2.00 | (0.39 | ) | (0.12 | ) | (0.51 | ) | 16.77 | 13.96 | 6,175 | 2.02 | (g) | 2.11 | (g) | 104 | ||||||||||||||||||||||||||||||||||||||||||||||||||||
| Year ended 09/30/08 | 18.91 | 0.18 | (3.49 | ) | (3.31 | ) | (0.32 | ) | — | (0.32 | ) | 15.28 | (17.68 | ) | 5,981 | 1.88 | (g) | 1.00 | (g) | 95 | ||||||||||||||||||||||||||||||||||||||||||||||||||
| Class Y | ||||||||||||||||||||||||||||||||||||||||||||||||||||||||||||||||||||||
| Year ended 12/31/12 | 18.81 | 0.53 | 2.07 | 2.60 | (0.51 | ) | — | (0.51 | ) | 20.90 | 13.94 | 269,400 | 0.70 | (d) | 0.71 | (d) | 2.64 | (d) | 58 | |||||||||||||||||||||||||||||||||||||||||||||||||||
| Year ended 12/31/11 | 20.07 | 0.52 | (1.34 | ) | (0.82 | ) | (0.44 | ) | — | (0.44 | ) | 18.81 | (4.16 | ) | 204,319 | 0.72 | 0.73 | 2.62 | 38 | |||||||||||||||||||||||||||||||||||||||||||||||||||
| Three months ended 12/31/10 | 18.73 | 0.13 | 1.35 | 1.48 | (0.14 | ) | — | (0.14 | ) | 20.07 | 7.92 | 17,204 | 0.84 | (f) | 0.85 | (f) | 2.67 | (f) | 24 | |||||||||||||||||||||||||||||||||||||||||||||||||||
| Year ended 09/30/10 | 16.87 | 0.64 | 1.97 | 2.61 | (0.75 | ) | — | (0.75 | ) | 18.73 | 15.78 | 3,661 | 0.92 | 0.92 | 3.58 | 85 | ||||||||||||||||||||||||||||||||||||||||||||||||||||||
| Year ended 09/30/09 | 15.37 | 0.57 | 1.58 | 2.15 | (0.53 | ) | (0.12 | ) | (0.65 | ) | 16.87 | 15.07 | 1,022 | 1.02 | (g) | 3.11 | (g) | 104 | ||||||||||||||||||||||||||||||||||||||||||||||||||||
| Year ended 09/30/08 | 19.02 | 0.36 | (3.50 | ) | (3.14 | ) | (0.51 | ) | — | (0.51 | ) | 15.37 | (16.82 | ) | 86 | 0.88 | (g) | 2.00 | (g) | 95 | ||||||||||||||||||||||||||||||||||||||||||||||||||
| Class R5 | ||||||||||||||||||||||||||||||||||||||||||||||||||||||||||||||||||||||
| Year ended 12/31/12 | 18.78 | 0.55 | 2.08 | 2.63 | (0.53 | ) | — | (0.53 | ) | 20.88 | 14.13 | 2,726 | 0.60 | (d) | 0.61 | (d) | 2.74 | (d) | 58 | |||||||||||||||||||||||||||||||||||||||||||||||||||
| Year ended 12/31/11(h) | 21.19 | 0.33 | (2.38 | ) | (2.05 | ) | (0.36 | ) | — | (0.36 | ) | 18.78 | (9.70 | ) | 1,851 | 0.57 | (f) | 0.58 | (f) | 2.77 | (f) | 38 | ||||||||||||||||||||||||||||||||||||||||||||||||
| Class R6 | ||||||||||||||||||||||||||||||||||||||||||||||||||||||||||||||||||||||
| Year ended 12/31/12(h) | 20.78 | 0.15 | 0.10 | 0.25 | (0.14 | ) | — | (0.14 | ) | 20.89 | 1.23 | 10 | 0.58 | (d)(f) | 0.59 | (d)(f) | 2.76 | (d)(f) | 58 | |||||||||||||||||||||||||||||||||||||||||||||||||||
| (a) | Calculated using average shares outstanding. |
| (b) | Includes adjustments in accordance with accounting principles generally accepted in the United States of America and as such, the net asset value for financial reporting purposes and the returns based upon those net asset values may differ from the net asset value and returns for shareholder transactions. Does not include sales charges and is not annualized for periods less than one year, if applicable. |
| (c) | Portfolio turnover is calculated at the fund level and is not annualized for periods less than one year, if applicable. For the period ending December 31, 2011, the portfolio turnover calculation excludes the value of securities purchased of $310,063,973 and sold of $85,053,876 in effect to realign the Fund’s portfolio holdings after the reorganization of Invesco Van Kampen Harbor Fund into the Fund. |
| (d) | Ratios are based on average daily net assets (000’s) of $530,690, $8,937, $85,934, $245,785, $2,572 and $10 for Class A, Class B, Class C, Class Y, Class R5 and Class R6 shares, respectively. |
| (e) | The total return, ratio of expenses to average net assets and ratio of net investment income to average net assets reflect actual 12b-1 fees of 0.23%, 1.00% and 0.83% for Class A, Class B and Class C shares, respectively. |
| (f) | Annualized. |
| (g) | The ratios reflect the rebate of certain Fund expenses in connection with investments in a Morgan Stanley affiliate during the period. The effect of the rebate on the ratios was less than 0.005% for the year ended December 31, 2009 and 0.01% for the year ended December 31, 2008. |
| (h) | Commencement date of May 23, 2011 and September 24, 2012 for Class R5 and Class R6 shares, respectively. |
22 Invesco Convertible Securities Fund
Report of Independent Registered Public Accounting Firm
To the Board of Trustees of AIM Growth Series (Invesco Growth Series)
and Shareholders of Invesco Convertible Securities Fund:
In our opinion, the accompanying statement of assets and liabilities, including the schedule of investments, and the related statements of operations and of changes in net assets and the financial highlights present fairly, in all material respects, the financial position of Invesco Convertible Securities Fund (one of the funds constituting AIM Growth Series (Invesco Growth Series), hereafter referred to as the “Fund”) at December 31, 2012, the results of its operations for the year then ended, the changes in its net assets for each of the two years in the period then ended and the financial highlights for each of the two years in the period then ended, the period ended December 31, 2010 and the year ended September 30, 2010, in conformity with accounting principles generally accepted in the United States of America. These financial statements and financial highlights (hereafter referred to as “financial statements”) are the responsibility of the Fund’s management; our responsibility is to express an opinion on these financial statements based on our audits. We conducted our audits of these financial statements in accordance with the standards of the Public Company Accounting Oversight Board (United States). Those standards require that we plan and perform the audit to obtain reasonable assurance about whether the financial statements are free of material misstatement. An audit includes examining, on a test basis, evidence supporting the amounts and disclosures in the financial statements, assessing the accounting principles used and significant estimates made by management, and evaluating the overall financial statement presentation. We believe that our audits, which included confirmation of securities at December 31, 2012 by correspondence with the custodian, provide a reasonable basis for our opinion. The financial highlights of the Fund for the periods ended September 30, 2009 and prior were audited by another independent registered public accounting firm whose report dated November 24, 2009 expressed an unqualified opinion on those statements.
PRICEWATERHOUSECOOPERS LLP
February 25, 2013
Houston, Texas
23 Invesco Convertible Securities Fund
Calculating your ongoing Fund expenses
Example
As a shareholder of the Fund, you incur two types of costs: (1) transaction costs, which may include sales charges (loads) on purchase payments or contingent deferred sales charges on redemptions, and redemption fees, if any; and (2) ongoing costs, including management fees, distribution and/or service (12b-1) fees, and other Fund expenses. This example is intended to help you understand your ongoing costs (in dollars) of investing in the Fund and to compare these costs with ongoing costs of investing in other mutual funds. With the exception of the actual ending account value and expenses of the Class R6 shares, the example is based on an investment of $1,000 invested at the beginning of the period and held for the entire period July 1, 2012 through December 31, 2012. The actual ending account value and expenses of the Class R6 shares in the example below are based on an investment of $1,000 invested as of close of business September 24, 2012 (commencement date) and held through December 31, 2012.
Actual expenses
The table below provides information about actual account values and actual expenses. You may use the information in this table, together with the amount you invested, to estimate the expenses that you paid over the period. Simply divide your account value by $1,000 (for example, an $8,600 account value divided by $1,000 = 8.6), then multiply the result by the number in the table under the heading entitled “Actual Expenses Paid During Period” to estimate the expenses you paid on your account during this period (as of close of business September 24, 2012 through December 31, 2012 for the Class R6 shares). Because the actual ending account value and expense information in the example is not based upon a six month period for the Class R6 shares, the ending account value and expense information may not provide a meaningful comparison to mutual funds that provide such information for a full six month period.
Hypothetical example for comparison purposes
The table below also provides information about hypothetical account values and hypothetical expenses based on the Fund’s actual expense ratio and an assumed rate of return of 5% per year before expenses, which is not the Fund’s actual return.
The hypothetical account values and expenses may not be used to estimate the actual ending account balance or expenses you paid for the period. You may use this information to compare the ongoing costs of investing in the Fund and other funds. To do so, compare this 5% hypothetical example with the 5% hypothetical examples that appear in the shareholder reports of the other funds.
Please note that the expenses shown in the table are meant to highlight your ongoing costs only and do not reflect any transaction costs, such as sales charges (loads) on purchase payments, contingent deferred sales charges on redemptions, and redemption fees, if any. Therefore, the hypothetical information is useful in comparing ongoing costs only, and will not help you determine the relative total costs of owning different funds. In addition, if these transaction costs were included, your costs would have been higher.
| Class | Beginning Account Value (07/01/12) | ACTUAL | HYPOTHETICAL (5% annual return before expenses) | Annualized | ||||||||||||||||||||
| Ending Account Value (12/31/12)1 | Expenses Paid During Period2 | Ending Account Value (12/31/12) | Expenses Paid During Period3 | |||||||||||||||||||||
| A | $ | 1,000.00 | $ | 1,068.00 | $ | 4.83 | $ | 1,020.46 | $ | 4.72 | 0.93 | % | ||||||||||||
| B | 1,000.00 | 1,063.80 | 8.82 | 1,016.59 | 8.62 | 1.70 | ||||||||||||||||||
| C | 1,000.00 | 1,064.40 | 8.41 | 1,016.99 | 8.21 | 1.62 | ||||||||||||||||||
| Y | 1,000.00 | 1,069.20 | 3.64 | 1,021.62 | 3.56 | 0.70 | ||||||||||||||||||
| R5 | 1,000.00 | 1,069.60 | 3.23 | 1,022.02 | 3.15 | 0.62 | ||||||||||||||||||
| R6 | 1,000.00 | 1,011.80 | 1.58 | 1,022.22 | 2.95 | 0.58 | ||||||||||||||||||
| 1 | The actual ending account value is based on the actual total return of the Fund for the period July 1, 2012, through December 31, 2012 (as of close of business September 24, 2012 through December 31, 2012 for the Class R6 shares), after actual expenses and will differ from the hypothetical ending account value which is based on the Fund’s expense ratio and a hypothetical annual return of 5% before expenses. |
| 2 | Actual expenses are equal to the Fund’s annualized expense ratio as indicated above multiplied by the average account value over the period, multiplied by 184/366 to reflect the most recent fiscal half year. For the Class R6 shares actual expenses are equal to the annualized expense ratio indicated above multiplied by the average account value over the period, multiplied by 99 (as of close of business September 24, 2012 through December 31, 2012)/366. Because the Class R6 shares have not been in existence for a full six month period, the actual ending account value and expense information shown may not provide a meaningful comparison to fund expense information of classes that show such data for a full six month period and, because the actual ending account value and expense information in the expense example covers a short time period, return and expense data may not be indicative of return and expense data for longer time periods. |
| 3 | Hypothetical expenses are equal to the annualized expense ratio indicated above multiplied by the average account value over the period, multiplied by 184/366 to reflect a one-half year period. The hypothetical ending account value and expenses may be used to compare ongoing costs of investing in Class R6 shares of the Fund and other funds because such data is based on a full six month period. |
24 Invesco Convertible Securities Fund
Tax Information
Form 1099-DIV, Form 1042-S and other year–end tax information provide shareholders with actual calendar year amounts that should be included in their tax returns. Shareholders should consult their tax advisors.
The following distribution information is being provided as required by the Internal Revenue Code or to meet a specific state’s requirement.
The Fund designates the following amounts or, if subsequently determined to be different, the maximum amount allowable for its fiscal year ended December 31, 2012:
Federal and State Income Tax | ||||
Qualified Dividend Income* | 42.69 | % | ||
Corporate Dividends Received Deduction* | 44.80 | % | ||
| * | The above percentages are based on ordinary income dividends paid to shareholders during the Fund’s fiscal year. |
25 Invesco Convertible Securities Fund
Trustees and Officers
The address of each trustee and officer is AIM Growth Series (Invesco Growth Series) (the “Trust”), 11 Greenway Plaza, Suite 1000, Houston, Texas 77046-1173. The trustees serve for the life of the Trust, subject to their earlier death, incapacitation, resignation, retirement or removal as more specifically provided in the Trust’s organizational documents. Each officer serves for a one year term or until their successors are elected and qualified. Column two below includes length of time served with predecessor entities, if any.
| Name, Year of Birth and Position(s) Held with the Trust | Trustee and/ or Officer Since | Principal Occupation(s) During Past 5 Years | Number of Funds in Fund Complex Overseen by Trustee | Other Directorship(s) Held by Trustee During Past 5 Years | ||||
| Interested Persons | ||||||||
| Martin L. Flanagan1 — 1960 Trustee | 2007 | Executive Director, Chief Executive Officer and President, Invesco Ltd. (ultimate parent of Invesco and a global investment management firm); Advisor to the Board, Invesco Advisers, Inc. (formerly known as Invesco Institutional (N.A.), Inc.); Trustee, The Invesco Funds; Vice Chair, Investment Company Institute; and Member of Executive Board, SMU Cox School of Business
Formerly: Chairman and Chief Executive Officer, Invesco Advisers, Inc. (registered investment adviser); Director, Chairman, Chief Executive Officer and President, IVZ Inc. (holding company), INVESCO Group Services, Inc. (service provider) and Invesco North American Holdings, Inc. (holding company); Director, Chief Executive Officer and President, Invesco Holding Company Limited (parent of Invesco and a global investment management firm); Director, Invesco Ltd.; Chairman, Investment Company Institute and President, Co-Chief Executive Officer, Co-President, Chief Operating Officer and Chief Financial Officer, Franklin Resources, Inc. (global investment management organization) | 124 | None | ||||
Philip A. Taylor2 — 1954 Trustee, President and Principal Executive Officer | 2006 | Head of North American Retail and Senior Managing Director, Invesco Ltd.; Director, Co-Chairman, Co-President and Co-Chief Executive Officer, Invesco Advisers, Inc. (formerly known as Invesco Institutional (N.A.), Inc.) (registered investment adviser); Director, Chairman, Chief Executive Officer and President, Invesco Management Group, Inc. (formerly known as Invesco Aim Management Group, Inc.) (financial services holding company); Director and President, INVESCO Funds Group, Inc. (registered investment adviser and registered transfer agent); Director and Chairman, Invesco Investment Services, Inc. (formerly known as Invesco Aim Investment Services, Inc.) (registered transfer agent) and IVZ Distributors, Inc. (formerly known as INVESCO Distributors, Inc.) (registered broker dealer); Director, President and Chairman, Invesco Inc. (holding company) and Invesco Canada Holdings Inc. (holding company); Chief Executive Officer, Invesco Corporate Class Inc. (corporate mutual fund company) and Invesco Canada Fund Inc. (corporate mutual fund company); Director, Chairman and Chief Executive Officer, Invesco Canada Ltd. (formerly known as Invesco Trimark Ltd./Invesco Trimark Ltèe) (registered investment adviser and registered transfer agent); Trustee, President and Principal Executive Officer, The Invesco Funds (other than AIM Treasurer’s Series Trust (Invesco Treasurer’s Series Trust) and Short-Term Investments Trust); Trustee and Executive Vice President, The Invesco Funds (AIM Treasurer’s Series Trust (Invesco Treasurer’s Series Trust) and Short-Term Investments Trust only); Director, Invesco Investment Advisers LLC (formerly known as Van Kampen Asset Management); Director, Chief Executive Officer and President, Van Kampen Exchange Corp.
Formerly: Director and Chairman, Van Kampen Investor Services Inc.: Director, Chief Executive Officer and President, 1371 Preferred Inc. (holding company); and Van Kampen Investments Inc.; Director and President, AIM GP Canada Inc. (general partner for limited partnerships); and Van Kampen Advisors, Inc.; Director and Chief Executive Officer, Invesco Trimark Dealer Inc. (registered broker dealer); Director, Invesco Distributors, Inc. (formerly known as Invesco Aim Distributors, Inc.) (registered broker dealer); Manager, Invesco PowerShares Capital Management LLC; Director, Chief Executive Officer and President, Invesco Advisers, Inc.; Director, Chairman, Chief Executive Officer and President, Invesco Aim Capital Management, Inc.; President, Invesco Trimark Dealer Inc. and Invesco Trimark Ltd./Invesco Trimark Ltèe; Director and President, AIM Trimark Corporate Class Inc. and AIM Trimark Canada Fund Inc.; Senior Managing Director, Invesco Holding Company Limited; Trustee and Executive Vice President, Tax-Free Investments Trust; Director and Chairman, Fund Management Company (former registered broker dealer); President and Principal Executive Officer, The Invesco Funds (AIM Treasurer’s Series Trust (Invesco Treasurer’s Series Trust), Short-Term Investments Trust and Tax-Free Investments Trust only); President, AIM Trimark Global Fund Inc. and AIM Trimark Canada Fund Inc. | 124 | None | ||||
Wayne W. Whalen3 — 1939 Trustee | 2010 | Of Counsel, and prior to 2010, partner in the law firm of Skadden, Arps, Slate, Meagher & Flom LLP, legal counsel to certain funds in the Fund Complex
| 137 | Director of the Mutual Fund Directors Forum, a nonprofit membership organization for investment directors; Chairman and Director of the Abraham Lincoln Presidential Library Foundation; and Director of the Stevenson Center for Democracy |
| 1 | Mr. Flanagan is considered an interested person of the Trust because he is an officer of the adviser to the Trust, and an officer and a director of Invesco Ltd., ultimate parent of the adviser to the Trust. |
| 2 | Mr. Taylor is considered an interested person of the Trust because he is an officer and a director of the adviser to, and a director of the principal underwriter of, the Trust. |
| 3 | Mr. Whalen is considered an “interested person” (within the meaning of Section 2(a)(19) of the 1940 Act) of certain Funds in the Invesco Fund Complex by reason of he and his firm currently providing legal services as legal counsel to such Funds in the Invesco Fund Complex. |
T-1 Invesco Convertible Securities Fund
Trustees and Officers—(continued)
| Name, Year of Birth and Position(s) Held with the Trust | Trustee and/ or Officer Since | Principal Occupation(s) During Past 5 Years | Number of Funds in Fund Complex Overseen by Trustee | Other Directorship(s) Held by Trustee During Past 5 Years | ||||
| Independent Trustees | ||||||||
Bruce L. Crockett — 1944 Trustee and Chair | 2001 | Chairman, Crockett Technologies Associates (technology consulting company)
Formerly: Director, Captaris (unified messaging provider); Director, President and Chief Executive Officer COMSAT Corporation; and Chairman, Board of Governors of INTELSAT (international communications company) | 124 | ACE Limited (insurance company); and Investment Company Institute | ||||
David C. Arch — 1945 Trustee | 2010 | Chairman and Chief Executive Officer of Blistex Inc., (consumer health care products manufacturer)
Formerly: Member of the Heartland Alliance Advisory Board, a nonprofit organization serving human needs based in Chicago | 137 | Board member of the Illinois Manufacturers’ Association; Member of the Board of Visitors, Institute for the Humanities, University of Michigan | ||||
Frank S. Bayley — 1939 Trustee | 1985 | Retired
Formerly: Director, Badgley Funds, Inc. (registered investment company) (2 portfolios) and General Partner and Of Counsel, law firm of Baker & McKenzie, LLP | 124 | Director and Chairman, C.D. Stimson Company (a real estate investment company); Trustee and Overseer, The Curtis institute of Music | ||||
James T. Bunch — 1942 Trustee | 2003 | Managing Member, Grumman Hill Group LLC (family office private equity management)
Formerly: Founder, Green, Manning & Bunch Ltd. (investment banking firm)(1988-2010); Executive Committee, United States Golf Association; and Director, Policy Studies, Inc. and Van Gilder Insurance Corporation | 124 | Chairman, Board of Governors, Western Golf Association; Chairman-elect, Evans Scholars Foundation; and Director, Denver Film Society | ||||
Rodney F. Dammeyer — 1940 Trustee | 2010 | Chairman of CAC, LLC, (private company offering capital investment and management advisory services)
Formerly: Prior to 2001, Managing Partner at Equity Group Corporate Investments; Prior to 1995, Vice Chairman of Anixter International; Prior to 1985, experience includes Senior Vice President and Chief Financial Officer of Household International, Inc., Executive Vice President and Chief Financial Officer of Northwest Industries, Inc. and Partner of Arthur Andersen & Co.; From 1987 to 2010, Director/Trustee of investment companies in the Van Kampen Funds complex | 126 | Director of Quidel Corporation and Stericycle, Inc.; Prior to May 2008, Trustee of The Scripps Research Institute; Prior to February 2008, Director of Ventana Medical Systems, Inc.; Prior to April 2007, Director of GATX Corporation; Prior to April 2004, Director of TheraSense, Inc. | ||||
Albert R. Dowden — 1941 Trustee | 2001 | Director of a number of public and private business corporations, including the Boss Group, Ltd. (private investment and management); Reich & Tang Funds (5 portfolios) (registered investment company); and Homeowners of America Holding Corporation/ Homeowners of America Insurance Company (property casualty company)
Formerly: Director, Continental Energy Services, LLC (oil and gas pipeline service); Director, CompuDyne Corporation (provider of product and services to the public security market) and Director, Annuity and Life Re (Holdings), Ltd. (reinsurance company); Director, President and Chief Executive Officer, Volvo Group North America, Inc.; Senior Vice President, AB Volvo; Director of various public and private corporations; Chairman, DHJ Media, Inc.; Director Magellan Insurance Company; and Director, The Hertz Corporation, Genmar Corporation (boat manufacturer), National Media Corporation; Advisory Board of Rotary Power International (designer, manufacturer, and seller of rotary power engines); and Chairman, Cortland Trust, Inc. (registered investment company) | 124 | Director of Nature’s Sunshine Products, Inc. | ||||
Jack M. Fields — 1952 Trustee | 2001 | Chief Executive Officer, Twenty First Century Group, Inc. (government affairs company); Owner and Chief Executive Officer, Dos Angeles Ranch, L.P. (cattle, hunting, corporate entertainment); and Discovery Global Education Fund (non-profit)
Formerly: Chief Executive Officer, Texana Timber LP (sustainable forestry company); Director of Cross Timbers Quail Research Ranch (non-profit); and member of the U.S. House of Representatives | 124 | Insperity, Inc. (formerly known as Administaff) | ||||
Prema Mathai-Davis — 1950 Trustee | 2001 | Retired
Formerly: Chief Executive Officer, YWCA of the U.S.A. | 124 | None | ||||
Larry Soll — 1942 Trustee | 2003 | Retired
Formerly: Chairman, Chief Executive Officer and President, Synergen Corp. (a biotechnology company) | 124 | None | ||||
Hugo F. Sonnenschein — 1940 Trustee | 2010 | Distinguished Service Professor and President Emeritus of the University of Chicago and the Adam Smith Distinguished Service Professor in the Department of Economics at the University of Chicago
Formerly: President of the University of Chicago | 137 | Trustee of the University of Rochester and a member of its investment committee. Member of the National Academy of Sciences, the American Philosophical Society and a fellow of the American Academy of Arts and Sciences |
T-2 Invesco Convertible Securities Fund
Trustees and Officers—(continued)
| Name, Year of Birth and Position(s) Held with the Trust | Trustee and/ or Officer Since | Principal Occupation(s) During Past 5 Years | Number of Funds in Fund Complex Overseen by Trustee | Other Directorship(s) Held by Trustee During Past 5 Years | ||||
| Independent Trustees—(continued) | ||||||||
Raymond Stickel, Jr. — 1944 Trustee | 2005 | Retired
Formerly: Director, Mainstay VP Series Funds, Inc. (25 portfolios) and Partner, Deloitte & Touche | 124 | None | ||||
| Other Officers | ||||||||
| Russell C. Burk — 1958 Senior Vice President and Senior Officer | 2005 | Senior Vice President and Senior Officer, The Invesco Funds | N/A | N/A | ||||
| John M. Zerr — 1962 Senior Vice President, Chief Legal Officer and Secretary | 2006 | Director, Senior Vice President, Secretary and General Counsel, Invesco Management Group, Inc. (formerly known as Invesco Aim Management Group, Inc.) and Van Kampen Exchange Corp.; Senior Vice President, Invesco Advisers, Inc. (formerly known as Invesco Institutional (N.A.), Inc.) (registered investment adviser); Senior Vice President and Secretary, Invesco Distributors, Inc. (formerly known as Invesco Aim Distributors, Inc.); Director, Vice President and Secretary, Invesco Investment Services, Inc. (formerly known as Invesco Aim Investment Services, Inc.) and IVZ Distributors, Inc. (formerly known as INVESCO Distributors, Inc.); Director and Vice President, INVESCO Funds Group, Inc.; Senior Vice President, Chief Legal Officer and Secretary, The Invesco Funds; Manager, Invesco PowerShares Capital Management LLC; Director, Secretary and General Counsel, Invesco Investment Advisers LLC (formerly known as Van Kampen Asset Management); Secretary and General Counsel, Van Kampen Funds Inc. and Chief Legal Officer, PowerShares Exchange-Traded Fund Trust, PowerShares Exchange-Traded Fund Trust II, PowerShares India Exchange-Traded Fund Trust and PowerShares Actively Managed Exchange-Traded Fund Trust
Formerly: Director and Vice President, Van Kampen Advisors Inc.; Director, Vice President, Secretary and General Counsel Van Kampen Investor Services Inc.; Director, Invesco Distributors, Inc. (formerly known as Invesco Aim Distributors, Inc.); Director, Senior Vice President, General Counsel and Secretary, Invesco Advisers, Inc. and Van Kampen Investments Inc.; Director, Vice President and Secretary, Fund Management Company; Director, Senior Vice President, Secretary, General Counsel and Vice President, Invesco Aim Capital Management, Inc.; Chief Operating Officer and General Counsel, Liberty Ridge Capital, Inc. (an investment adviser); Vice President and Secretary, PBHG Funds (an investment company) and PBHG Insurance Series Fund (an investment company); Chief Operating Officer, General Counsel and Secretary, Old Mutual Investment Partners (a broker-dealer); General Counsel and Secretary, Old Mutual Fund Services (an administrator) and Old Mutual Shareholder Services (a shareholder servicing center); Executive Vice President, General Counsel and Secretary, Old Mutual Capital, Inc. (an investment adviser); and Vice President and Secretary, Old Mutual Advisors Funds (an investment company) | N/A | N/A | ||||
| Karen Dunn Kelley — 1960 Vice President | 2004 | Head of Invesco’s World Wide Fixed Income and Cash Management Group; Senior Vice President, Invesco Management Group, Inc. (formerly known as Invesco Aim Management Group, Inc.) and Invesco Advisers, Inc. (formerly known as Invesco Institutional (N.A.), Inc.) (registered investment adviser); Executive Vice President, Invesco Distributors, Inc. (formerly known as Invesco Aim Distributors, Inc.); Director, Invesco Mortgage Capital Inc., INVESCO Global Asset Management Limited, Invesco Management Company Limited and INVESCO Management S.A.; Vice President, The Invesco Funds (other than AIM Treasurer’s Series Trust (Invesco Treasurer’s Series Trust) and Short-Term Investments Trust); and President and Principal Executive Officer, The Invesco Funds (AIM Treasurer’s Series Trust (Invesco Treasurer’s Series Trust) and Short-Term Investments Trust only)
Formerly: Senior Vice President, Van Kampen Investments Inc.; Vice President, Invesco Advisers, Inc. (formerly known as Invesco Institutional (N.A.), Inc.); Director of Cash Management and Senior Vice President, Invesco Advisers, Inc. and Invesco Aim Capital Management, Inc.; President and Principal Executive Officer, Tax-Free Investments Trust; Director and President, Fund Management Company; Chief Cash Management Officer, Director of Cash Management, Senior Vice President, and Managing Director, Invesco Aim Capital Management, Inc.; Director of Cash Management, Senior Vice President, and Vice President, Invesco Advisers, Inc. and The Invesco Funds (AIM Treasurer’s Series Trust (Invesco Treasurer’s Series Trust), Short-Term Investments Trust and Tax-Free Investments Trust only) | N/A | N/A | ||||
T-3 Invesco Convertible Securities Fund
Trustees and Officers—(continued)
| Name, Year of Birth and Position(s) Held with the Trust | Trustee and/ or Officer Since | Principal Occupation(s) During Past 5 Years | Number of Funds in Fund Complex Overseen by Trustee | Other Directorship(s) Held by Trustee During Past 5 Years | ||||
| Other Officers—(continued) | ||||||||
| Sheri Morris — 1964 Vice President, Treasurer and Principal Financial Officer | 1999 | Vice President, Treasurer and Principal Financial Officer, The Invesco Funds; Vice President, Invesco Advisers, Inc. (formerly known as Invesco Institutional (N.A.), Inc.) (registered investment adviser); and Vice President, PowerShares Exchange-Traded Fund Trust, PowerShares Exchange-Traded Fund Trust II, PowerShares India Exchange-Traded Fund Trust and PowerShares Actively Managed Exchange-Traded Fund Trust
Formerly: Vice President, Invesco Aim Advisers, Inc., Invesco Aim Capital Management, Inc. and Invesco Aim Private Asset Management, Inc.; Assistant Vice President and Assistant Treasurer, The Invesco Funds and Assistant Vice President, Invesco Advisers, Inc., Invesco Aim Capital Management, Inc. and Invesco Aim Private Asset Management, Inc.; and Treasurer, PowerShares Exchange-Traded Fund Trust, PowerShares Exchange-Traded Fund Trust II, PowerShares India Exchange-Traded Fund Trust and PowerShares Actively Managed Exchange-Traded Fund Trust | N/A | N/A | ||||
Yinka Akinsola — 1977 Anti-Money Laundering Compliance Officer | 2011 | Anti-Money Laundering Compliance Officer, Invesco Advisers, Inc. (formerly known as Invesco Institutional (N.A.), Inc.) (registered investment adviser); Invesco Distributors, Inc. (formerly known as Invesco Aim Distributors, Inc.), Invesco Investment Services, Inc. (formerly known as Invesco Aim Investment Services, Inc.), Invesco Management Group, Inc., The Invesco Funds, Invesco Van Kampen Closed-End Funds, Van Kampen Exchange Corp., Van Kampen Funds Inc., PowerShares Exchange-Traded Fund Trust, PowerShares Exchange-Traded Fund Trust II, PowerShares India Exchange-Traded Fund Trust, and PowerShares Actively Managed Exchange-Traded Fund Trust
Formerly: Regulatory Analyst III, Financial Industry Regulatory Authority (FINRA) | N/A | N/A | ||||
| Todd L. Spillane — 1958 Chief Compliance Officer | 2006 | Senior Vice President, Invesco Management Group, Inc. (formerly known as Invesco Aim Management Group, Inc.) and Van Kampen Exchange Corp.; Senior Vice President and Chief Compliance Officer, Invesco Advisers, Inc. (registered investment adviser) (formerly known as Invesco Institutional (N.A.), Inc.); Chief Compliance Officer, The Invesco Funds; Vice President, Invesco Distributors, Inc. (formerly known as Invesco Aim Distributors, Inc.) and Invesco Investment Services, Inc. (formerly known as Invesco Aim Investment Services, Inc.)
Formerly: Chief Compliance Officer, Invesco Van Kampen Closed-End Funds; Senior Vice President, Van Kampen Investments Inc.; Senior Vice President and Chief Compliance Officer, Invesco Aim Advisers, Inc. and Invesco Aim Capital Management, Inc.; Chief Compliance Officer, INVESCO Private Capital Investments, Inc. (holding company), Invesco Private Capital, Inc. (registered investment adviser), Invesco Global Asset Management (N.A.), Inc., Invesco Senior Secured Management, Inc. (registered investment adviser), Van Kampen Investor Services Inc., PowerShares Exchange-Traded Fund Trust, PowerShares Exchange-Traded Fund Trust II, PowerShares India Exchange-Traded Fund Trust and PowerShares Actively Managed Exchange-Traded Fund Trust; and Vice President, Invesco Aim Capital Management, Inc. and Fund Management Company | N/A | N/A |
The Statement of Additional Information of the Trust includes additional information about the Fund’s Trustees and is available upon request, without charge, by calling 1.800.959.4246. Please refer to the Fund’s prospectus for information on the Fund’s sub-advisers.
Office of the Fund 11 Greenway Plaza, Suite 1000 Houston, TX 77046-1173 | Investment Adviser Invesco Advisers, Inc. 1555 Peachtree Street, N.E. Atlanta, GA 30309 | Distributor Invesco Distributors, Inc. 11 Greenway Plaza, Suite 1000 Houston, TX 77046-1173 | Auditors PricewaterhouseCoopers LLP 1201 Louisiana Street, Suite 2900 Houston, TX 77002-5678 | |||
Counsel to the Fund Stradley Ronon Stevens & Young, LLP 2005 Market Street, Suite 2600 Philadelphia, PA 19103-7018 | Counsel to the Independent Trustees Goodwin Procter LLP 901 New York Avenue, N.W. | Transfer Agent Invesco Investment Services, Inc. 11 Greenway Plaza, Suite 1000 Houston, TX 77046-1173 | Custodian State Street Bank and Trust Company 225 Franklin Street Boston, MA 02110-2801 | |||
T-4 Invesco Convertible Securities Fund

Invesco mailing information
Send general correspondence to Invesco Investment Services, Inc., P.O. Box 219078, Kansas City, MO 64121-9078.
Invesco privacy policy
You share personal and financial information with us that is necessary for your transactions and your account records. We take very seriously the obligation to keep that information confidential and private.
Invesco collects nonpublic personal information about you from account applications or other forms you complete and from your transactions with us or our affiliates. We do not disclose information about you or our former customers to service providers or other third parties except to the extent necessary to service your account and in other limited circumstances as permitted by law. For example, we use this information to facilitate the delivery of transaction confirmations, financial reports, prospectuses and tax forms.
Even within Invesco, only people involved in the servicing of your accounts and compliance monitoring have access to your information. To ensure the highest level of confidentiality and security, Invesco maintains physical, electronic and procedural safeguards that meet or exceed federal standards. Special measures, such as data encryption and authentication, apply to your communications with us on our website. More detail is available to you at invesco.com/privacy.
Important notice regarding delivery of security holder documents
To reduce Fund expenses, only one copy of most shareholder documents may be mailed to shareholders with multiple accounts at the same address (Householding). Mailing of your shareholder documents may be householded indefinitely unless you instruct us otherwise. If you do not want the mailing of these documents to be combined with those for other members of your household, please contact Invesco Investment Services, Inc. at 800 959 4246 or contact your financial institution. We will begin sending you individual copies for each account within 30 days after receiving your request.
Fund holdings and proxy voting information
The Fund provides a complete list of its holdings four times in each fiscal year, at the quarter-ends. For the second and fourth quarters, the lists appear in the Fund’s semiannual and annual reports to shareholders. For the first and third quarters, the Fund files the lists with the Securities and Exchange Commission (SEC) on Form N-Q. The most recent list of portfolio holdings is available at invesco.com/completeqtrholdings. Shareholders can also look up the Fund’s Forms N-Q on the SEC website at sec.gov. Copies of the Fund’s Forms N-Q may be reviewed and copied at the SEC Public Reference Room in Washington, D.C. You can obtain information on the operation of the Public Reference Room, including information about duplicating fee charges, by calling 202 551 8090 or 800 732 0330, or by electronic request at the following email address: publicinfo@sec.gov. The SEC file numbers for the Fund are shown below.
A description of the policies and procedures that the Fund uses to determine how to vote proxies relating to portfolio securities is available without charge, upon request, from our Client Services department at 800 959 4246 or at invesco.com/proxyguidelines. The information is also available on the SEC website, sec.gov.
Information regarding how the Fund voted proxies related to its portfolio securities during the 12 months ended June 30, 2012, is available at invesco.com/proxysearch. The information is also available on the SEC website, sec.gov.
Invesco Advisers, Inc. is an investment adviser; it provides investment advisory services to individual and institutional clients and does not sell securities. Invesco Distributors, Inc. is the US distributor for Invesco Ltd.’s retail mutual funds, exchange-traded funds and institutional money market funds. Both are wholly owned, indirect subsidiaries of Invesco Ltd.
SEC file numbers: 811-02699 and 002-57526 MS-CSEC-AR-1 Invesco Distributors, Inc. |  | |

| Annual Report to Shareholders | December 31, 2012 |
Invesco Global Quantitative Core Fund
Nasdaq:
A: GTNDX n B: GNDBX n C: GNDCX n R: GTNRX n Y: GTNYX n R5: GNDIX

Letters to Shareholders
Philip Taylor | Dear Shareholders: This annual report contains information about your Fund and the factors that affected its performance during the reporting period. Inside, you’ll find a discussion from your portfolio managers about how they managed your Fund, performance data for your Fund, a complete list of your Fund’s investments as of the close of the reporting period and other important information. I hope you find this report of interest. The reporting period covered by this report was challenging. As the year began, investors cheered generally positive economic indicators, and markets generally rose. Soon, however, US economic data turned mixed and investors’ attention shifted to the efforts of eurozone governments to implement new policies intended to reduce debt levels, strengthen the banking system and stimulate economic growth. Later in the year, in the US, | ||||||||
| mixed economic data, competing proposals on how to reduce the federal budget deficit and a contentious presidential contest increased investor uncertainty and hindered market performance. Throughout the year, your Fund’s portfolio managers adhered to their long-term investment strategies, and later in this report they explain why your Fund performed as it did during the reporting period. | |||||||||

Adhering to your long-term investment plan can be difficult, particularly during periods of market volatility and economic uncertainty. That’s one reason Invesco suggests investors work with a skilled and trusted financial adviser who is familiar with their financial situation, investment goals and risk tolerance. A good financial adviser can provide insight and perspective when markets are volatile; motivation and reassurance when times are uncertain; and advice and recommendations when your financial situation or investment goals change.
Timely insight and information from many of Invesco’s investment professionals is available at our website, invesco.com/us. We offer in-depth articles, video clips and audio commentaries from many of our portfolio managers and other investment professionals on a wide range of topics of interest to investors. At invesco.com/us, you also can access information about your Invesco account at any time.
What we mean by Intentional Investing
At Invesco, all of our people and all of our resources are dedicated to helping investors achieve their financial objectives. It’s a philosophy we call Intentional Investing®, and it guides the way we:
| n | Manage investments – Our dedicated investment professionals search the world for the best opportunities, and each investment team follows a clear, disciplined process to build portfolios and mitigate risk. |
| n | Provide choices – We offer equity, fixed income, asset allocation and alternative strategies so you and your financial adviser can build an investment portfolio designed for your individual needs and goals. |
| n | Connect with you – We’re committed to giving you the expert insights you need to make informed investing decisions, and we are well-equipped to provide high-quality support for investors and advisers. |
Invesco believes in putting investors first, and that’s why investment management is all we do. Our sole focus on managing your money allows your financial adviser to build a portfolio of Invesco funds appropriate for your investment needs and goals now and when your circumstances change.
Have a question?
If you have a question about your account, please contact an Invesco client services representative at 800 959 4246. If you have an Invesco-related question or comment, feel free to email me directly at phil@invesco.com.
All of us at Invesco look forward to serving your investment management needs for many years to come. Thank you for investing with us.
Sincerely,

Philip Taylor
Senior Managing Director, Invesco Ltd.
2 Invesco Global Quantitative Core Fund
Bruce Crockett | Dear Fellow Shareholders: While short-term challenges for the financial markets regularly come and go, it’s clear that significant and longer term economic obstacles remain both here at home and abroad. There appear to be no easy solutions to many of these issues. As a result, the financial markets have had little conviction to respond to what has been slow, yet noticeable improvement in some economic benchmarks in recent months. No one likes uncertainty, especially financial markets. But even in these uncertain times, it appears that investors are still approaching the market with cautious optimism, with some taking on more risk in order to refocus on their long-term savings goals. | ||||||||
Maybe this describes you, or perhaps you have been sitting on the sidelines thinking about getting back into the market, but are still a bit hesitant to act because of market uncertainty. | |||||||||

Clearly, risk remains a primary focus for investors of all types. As Trustees of the Invesco Funds, one of our primary responsibilities is to ensure your fund’s adviser is cognizant of the risks in each of the funds it manages. A thoughtful risk management plan may help investors navigate through market turbulence or an economic downturn. This is why we make risk management a critical element of our annual contract renewal process, like the one we complete with Invesco every year.
To be sure, there will always be risks involved with investing, but you shouldn’t let short-term news or your emotions dictate your investments. Because no one can predict with 100% accuracy the movements of financial markets, I strongly encourage you to speak with a professional financial adviser who can assist you in building an investment portfolio that reflects your individual risk tolerance and is designed to help achieve your individual financial objectives.
You can be sure your Board remains committed to doing its part in helping you along the way. In addition to ensuring that your fund’s adviser is focused on the risks in the funds it manages, we also remain committed to managing fund costs and working with your fund’s adviser to provide a compelling and diversified product offering to potentially meet your investing goals.
In that regard, your Board approved a number of fund mergers and the launch of several new funds, including the first Invesco mutual fund available to US retail investors managed by investment professionals at Invesco Perpetual*, one of the largest independent investment managers in the UK.
Let me close by thanking Carl Frischling upon his retirement from the Invesco Funds Board for his 35 years of distinguished service and unwavering commitment to our funds’ shareholders. As always, please contact me at bruce@brucecrockett.com with any questions or concerns you may have.
On behalf of the Board, we look forward to continuing to represent your interests and serving your investment needs.
Sincerely,

Bruce L. Crockett
Independent Chair
Invesco Funds Board of Trustees
| * | Invesco Perpetual is a business name of Invesco Asset Management Limited (IAML), a registered investment adviser. IAML is a wholly owned, indirect subsidiary of Invesco Ltd. |
3 Invesco Global Quantitative Core Fund
Management’s Discussion of Fund Performance
Performance summary
For the year ended December 31, 2012, Invesco Global Quantitative Core Fund, at net asset value (NAV), underperformed its style-specific index, the MSCI World Index. Stock selection for the reporting period was mixed. The Fund benefited from positive stock selection in the energy, financials, health care, materials and telecommunication services sectors. In contrast, stock selection was weak in the consumer discretionary and information technology (IT) sectors. In addition, stock selection in the consumer staples and industrials lagged the style-specific index.
Your Fund’s long-term performance appears later in this report.
Fund vs. Indexes
Total returns, 12/31/11 to 12/31/12, at net asset value (NAV). Performance shown does not include applicable contingent deferred sales charges (CDSC) or front-end sales charges, which would have reduced performance.
| Class A Shares | 13.32 | % | |||
| Class B Shares | 12.53 | ||||
| Class C Shares | 12.44 | ||||
| Class R Shares | 13.01 | ||||
| Class Y Shares | 13.55 | ||||
| Class R5 Shares* | 13.96 | ||||
| MSCI World Index‚ (Broad Market/Style-Specific Index) | 15.83 | ||||
| Lipper Global Multi-Cap Core Funds Indexn (Peer Group Index) | 16.19 |
Source(s): ‚Invesco, MSCI via FactSet Research Systems Inc.; nLipper Inc.
| * | Effective September 24, 2012, Institutional Class shares were renamed Class R5 shares. |
How we invest
We manage your Fund to provide exposure to global large-cap stocks. The portfolio is designed to outperform its style-specific index, the MSCI World Index, while minimizing the amount of additional risk relative to this benchmark. The Fund can be used as a long-term allocation to large-cap stocks that complements other style-specific strategies within a diversified asset allocation strategy.
The investment process integrates the following key steps:
| n | Universe development |
| n | Stock rankings |
| n | Risk assessment |
| n | Portfolio construction |
| n | Trading |
While the companies included in the MSCI World Index are used as a general guide for developing the Fund’s investable universe, non-index stocks may also be considered. Each stock in the universe is evaluated on four factors: company earnings momentum, price trend, management action and relative valuation. The scores from these four factors are combined to arrive at an overall alpha score (excess return forecast) for each stock. Each alpha score is relative to the other securities within the same industry. Stocks also are evaluated on a multitude of other factors to develop a stock-specific risk forecast and transaction cost forecast.
We then incorporate our forecasts for return, risk and transaction cost for each stock into an optimizer (a software tool) along with pre-specified product
parameters to build a portfolio that we believe is an optimal balance of potential risk and return. This portfolio is constructed according to certain constraints to increase the probability that the Fund’s relative performance and volatility remain within the Fund’s strategy guidelines. We continually monitor the portfolio, and the overall investment process is repeated on a monthly basis to determine which companies should be bought or sold in the portfolio.
In terms of risk management, we seek to minimize any style biases in the portfolio. Active managers of global portfolios typically add value in one of, or a combination of, five areas: beta bias (relative volatility), style bias, sector/industry over- and underweight, country over- and underweight, and stock selection. We attempt to add value through our stock selection decisions. Consequently, our risk management process seeks to neutralize the Fund’s exposure relative to the style-specific index with regard to the other exposures.
Market conditions and your Fund
Global equity markets rebounded in the beginning of 2012 following a difficult and volatile year of performance in 2011. Improvements in global economic indicators and continued accommodative policy measures from central banks provided support for the rally in stocks, with some of the worst performing areas of the market in recent years leading the way in the beginning of 2012. During the year, the macroeconomic concerns stemming largely from Greece and Spain eased somewhat as the pro-euro party won the Greek elections and Spanish banks were provided a bailout of up to 100 billion euros. Eurozone leaders also took steps during their most recent summit to allow for the direct recapitalization
| Portfolio Composition | |||||
By sector
|
| ||||
| Financials | 18.4 | % | |||
| Energy | 13.3 | ||||
| Health Care | 13.1 | ||||
| Information Technology | 12.1 | ||||
| Consumer Discretionary | 11.0 | ||||
| Industrials | 10.6 | ||||
| Consumer Staples | 7.5 | ||||
| Telecommunication Services | 6.5 | ||||
| Materials | 4.3 | ||||
| Utilities | 1.0 | ||||
Money Market Funds Plus Other Assets Less Liabilities | 2.2 | ||||
| Top 10 Equity Holdings* | |||||
1. Citigroup Inc. | 2.5 | % | |||
| 2. Verizon Communications Inc. | 2.4 | ||||
| 3. Pfizer Inc. | 2.3 | ||||
| 4. Cisco Systems, Inc. | 2.3 | ||||
| 5. ConocoPhillips | 2.2 | ||||
| 6. Philip Morris International Inc. | 2.1 | ||||
| 7. Amgen Inc. | 2.1 | ||||
| 8. U.S. Bancorp | 2.1 | ||||
| 9. Northrop Grumman Corp. | 2.1 | ||||
| 10. Next PLC | 2.0 | ||||
| Top Five Countries* | |||||
| 1. United States | 51.4 | % | |||
| 2. Japan | 9.6 | ||||
| 3. United Kingdom | 6.7 | ||||
| 4. Sweden | 4.3 | ||||
| 5. Australia | 4.0 | ||||
| Total Net Assets | $130.6 million | ||||
| Total Number of Holdings* | 80 | ||||
The Fund’s holdings are subject to change, and there is no assurance that the Fund will continue to hold any particular security.
* Excluding money market fund holdings.
4 Invesco Global Quantitative Core Fund
of banks through the European Stability Mechanism (the bailout fund) and to move closer to a regional banking union. In addition, the European Central Bank announced new measures to support Eurozone economies through potentially unlimited purchases of sovereign debt, with ECB President Mario Draghi pledging to “do whatever it takes” to save the euro (although key details of the plan remain unresolved). The US Federal Reserve announced a third round of quantitative easing with a promise to continue until the labor market outlook improved materially, and the Bank of Japan took steps to increase its asset purchase program. These easing measures were well received by investors and helped to drive equity markets higher for the year.
Regarding the results of Invesco Global Quantitative Core Fund, it’s important to understand our investment process to better evaluate the drivers of our relative performance versus the style-specific index. We generally evaluate performance based on the effectiveness of our stock selection and risk management.
Our stock selection model, based on the four factors (company earnings momentum, price trend, management action and relative value) that make up our alpha (excess return) forecast for stocks in our investment universe, was a detractor from Fund performance for the reporting period. However, when selecting Fund holdings we use our optimization software to assist in making investment decisions, based on risk and transaction cost forecasts, as well as our alpha forecast. Consequently, while our stock selection model may identify a stock with an attractive alpha forecast, the optimizer may indicate that its transaction costs are too high and/or its risk level is unacceptable.
For the reporting period, Invesco Global Quantitative Fund lagged its style-specific index, the MSCI World Index. Our stock selection in six sectors, including energy, financials, health care, materials, utilities and telecommunication services, was extremely strong and contributed to our Fund performance compared to the style-specific index. In contrast, stock selection in the consumer discretionary, consumer staples, industrials and IT sectors detracted from the overall positive performance of the Fund.
In the energy sector, Marathon Petroleum contributed to Fund performance. During the reporting period, Reuters reported that Marathon Petroleum is buying BP’s (not a Fund holding) Texas City refinery in a $2.5 billion deal. Also contributing to the outperformance of the Fund versus its style-specific index were US banking and
financial services companies, Citigroup and Discover Financial Services.
A primary detractor from Fund returns was Apollo Group, a US-based private education provider. It was reported that Apollo Group will cut about 800 jobs and shut down 115 campuses as part of its efforts to reduce costs by $300 million by fiscal year 2014.1 Also detracting were several IT companies, such as Dell and Intel. During the reporting period, Dell announced that it completed the acquisition of Quest Software (not a Fund holding), an IT management software provider. Quest Software offers software solutions that simplify and solve both common and challenging IT problems for organizations.
When looking closely at the regions in which the Fund invests, stock selection in the Asia/Pacific region lagged the MSCI World Index. Conversely, stock selection was very strong in Europe, which contributed to positive relative performance for the year.
Global markets ended 2012 on a strong note, with the MSCI World Index generating positive returns in six of the last seven months of the year.2 We believe accommodative monetary policy from global central banks is likely to continue, and market valuations will remain attractive from a historic perspective. That said, underlying issues plaguing markets over the past several years, such as high sovereign debt levels across the developed markets (particularly within Europe), have not been resolved, and could continue to weigh on global economic growth and add to market volatility. The Fund continues to find investment opportunities in this market environment.
We welcome any new investors who joined the Fund during the year, and thank all of our shareholders for your continued investment in Invesco Global Quantitative Core Fund.
| 1 | Source: Reuters |
| 2 | Source: Invesco, MSCI via FactSet Research Systems Inc. |
The views and opinions expressed in management’s discussion of Fund performance are those of Invesco Advisers, Inc. These views and opinions are subject to change at any time based on factors such as market and economic conditions. These views and opinions may not be relied upon as investment advice or recommendations, or as an offer for a particular security. The information is not a complete analysis of every aspect of any market, country, industry, security or the Fund. Statements of fact are from sources considered reliable, but Invesco Advisers, Inc. makes no representation or warranty as to their completeness or accuracy. Although historical performance is no guarantee of future results, these insights may help you understand our investment management philosophy.
See important Fund and, if applicable, index disclosures later in this report.
Michael Abata
Chartered Financial Analyst, portfolio manager, is manager of Invesco Global Quantitative Core Fund. He joined Invesco in 2011. Mr. Abata earned a BA in economics from Binghamton University.
Karl Georg Bayer
Portfolio manager, is manager of Invesco Global Quantitative Core Fund. He joined Invesco in 1991. Mr. Bayer earned Diplom Kaufmann and Diplom Ingenieur degrees from the University of Darmstadt.
Uwe Draeger
Portfolio manager, is manager of Invesco Global Quantitative Core Fund. He joined Invesco in 2005. Mr. Draeger earned a Diplom-Ökonom degree from Hochschule für Ökonomie Berlin, an MA from City of London Polytechnic and an MBA from Anglia Business School (Cambridge).
Jens Langewand
Portfolio manager, is manager of Invesco Global Quantitative Core Fund. He joined Invesco in 2007. Mr. Langewand earned a Diplom Kaufmann degree from the University of Münster and a PhD from the University of Augsburg.
Andrew Waisburd
Portfolio manager, is manager of Invesco Global Quantitative Core Fund. He joined Invesco in 2008. Mr. Waisburd earned a BS in statistics from Cornell University and an MS and a PhD in finance from Indiana University.
5 Invesco Global Quantitative Core Fund
Your Fund’s Long-Term Performance
Results of a $10,000 Investment – Oldest Share Class(es)
Fund and index data from 12/31/02
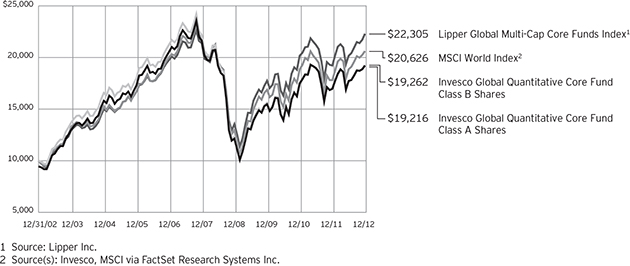
Past performance cannot guarantee comparable future results.
The data shown in the chart include reinvested distributions, applicable sales charges and Fund expenses including management fees. Results for Class B shares are calculated as if a hypothetical
shareholder had liquidated his entire investment in the Fund at the close of the reporting period and paid the contingent deferred sales charges, if applicable. Index results include reinvested dividends, but they do not reflect sales charges. Performance of the peer group, if applicable,
reflects fund expenses and management fees; performance of a market index does not. Performance shown in the chart and table(s) does not reflect deduction of taxes a shareholder would pay on Fund distributions or sale of Fund shares.
6 Invesco Global Quantitative Core Fund
Average Annual Total Returns As of 12/31/12, including maximum | |||||
| Class A Shares | |||||
| Inception (9/15/97) | 5.12 | % | |||
| 10 Years | 6.75 | ||||
| 5 Years | -3.44 | ||||
| 1 Year | 7.07 | ||||
| Class B Shares | |||||
| Inception (9/15/97) | 5.24 | % | |||
| 10 Years | 6.78 | ||||
| 5 Years | -3.41 | ||||
| 1 Year | 7.53 | ||||
| Class C Shares | |||||
| Inception (1/2/98) | 5.17 | % | |||
| 10 Years | 6.61 | ||||
| 5 Years | -3.07 | ||||
| 1 Year | 11.44 | ||||
| Class R Shares | |||||
| 10 Years | 7.12 | % | |||
| 5 Years | -2.58 | ||||
| 1 Year | 13.01 | ||||
| Class Y Shares | |||||
| 10 Years | 7.46 | % | |||
| 5 Years | -2.15 | ||||
| 1 Year | 13.55 | ||||
| Class R5 Shares | |||||
| 10 Years | 7.87 | % | |||
| 5 Years | -1.75 | ||||
| 1 Year | 13.96 | ||||
Class R shares incepted on October 31, 2005. Performance shown prior to that date is that of Class A shares, restated to reflect the higher 12b-1 fees applicable to Class R shares. Class A share performance reflects any applicable fee waivers or expense reimbursements.
Class Y shares incepted on October 3, 2008. Performance shown prior to that date is that of Class A shares and includes the 12b-1 fees applicable to Class A shares. Class A share performance reflects any applicable fee waivers or expense reimbursements.
Class R5 shares incepted on April 30, 2004. Performance shown prior to that date is that of Class A shares and includes the 12b-1 fees applicable to Class A shares. Class A share performance reflects any applicable fee waivers or expense reimbursements.
The performance data quoted represent past performance and cannot guarantee comparable future results; current performance may be lower or higher. Please visit invesco.com/performance for the most recent month-end performance. Performance figures reflect reinvested distributions, changes in net asset value and the effect of the maximum sales charge unless otherwise stated. Investment return and principal value will fluctuate so that you may have a gain or loss when you sell shares.
The total annual Fund operating expense ratio set forth in the most recent Fund prospectus as of the date of this report for Class A, Class B, Class C, Class R, Class Y and Class R5 shares was 1.56%, 2.31%, 2.31%, 1.81%, 1.31% and 0.98%, respectively. The expense ratios presented above may vary from the expense ratios presented in other sections of this report that are based on expenses incurred during the period covered by this report.
Class A share performance reflects the maximum 5.50% sales charge, and Class B and Class C share performance reflects the applicable contingent deferred sales charge (CDSC) for the period involved. The CDSC on Class B shares declines from 5% beginning at the time of purchase to 0% at the beginning of the seventh year. The CDSC on Class C shares is 1% for the first year after purchase. Class R, Class Y and Class R5 shares do not have a front-end sales charge or a CDSC; therefore, performance is at net asset value.
The performance of the Fund’s share classes will differ primarily due to different sales charge structures and class expenses.
continued from page 8
Other information
| n | The returns shown in management’s discussion of Fund performance are based on net asset values calculated for shareholder transactions. Generally accepted accounting principles require adjustments to be made to the net |
assets of the Fund at period end for financial reporting purposes, and as such, the net asset values for shareholder transactions and the returns based on those net asset values may differ from the net asset values and returns reported in the Financial Highlights.
| n | Industry classifications used in this report are generally according to the Global Industry Classification Standard, which was developed by and is the exclusive property and a service mark of MSCI Inc. and Standard & Poor’s. |
7 Invesco Global Quantitative Core Fund
Invesco Global Quantitative Core Fund’s investment objective is long-term growth of capital.
| n | Unless otherwise stated, information presented in this report is as of December 31, 2012, and is based on total net assets. |
| n | Unless otherwise noted, all data provided by Invesco. |
| n | To access your Fund’s reports/prospectus, visit invesco.com/fundreports. |
About share classes
| n | Class B shares may not be purchased for new or additional investments. Please see the prospectus for more information. |
| n | Class R shares are generally available only to employer sponsored retirement and benefit plans. Please see the prospectus for more information. |
| n | Class Y shares are available only to certain investors. Please see the prospectus for more information. |
| n | Class R5 shares are primarily intended for employer sponsored retirement and benefit plans that meet certain standards and for institutional investors. On September 24, 2012, Institutional Class shares were renamed Class R5 shares. Please see the prospectus for more information. |
Principal risks of investing in the Fund
| n | Currency/exchange rate risk. The dollar value of the Fund’s foreign investments will be affected by changes in the exchange rates between the dollar and the currencies in which those investments are traded. |
| n | Depository receipts risk. Depositary receipts involve many of the same risks as those associated with direct investment in foreign securities. In addition, the underlying issuers of certain depositary receipts, particularly unsponsored or unregistered depositary receipts, are under no obligation to distribute shareholder communications to the holders of such receipts or to pass through to them any voting rights with respect to the deposited securities. |
| n | Derivatives risk. The performance of derivative instruments is tied to the performance of an underlying currency, security, index or other instrument. In addition to risks relating to their underlying instruments, the use of derivatives may include other, possibly greater, risks. Derivatives involve costs, may be volatile, and may involve a small initial |
investment relative to the risk assumed. Risks associated with the use of derivatives include counterparty, leverage, correlation, liquidity, tax, market, interest rate and management risks. Derivatives may also be more difficult to purchase, sell or value than other investments. The Fund may lose more than the cash amount invested on investments in derivatives. |
Investors should bear in mind that, while the Fund intends to use derivative strategies, it is not obligated to actively engage in these transactions, generally or in any particular kind of derivative, if the investment manager elects not to do so due to availability, cost, market conditions or other factors.
| n | Developing/emerging markets securities risk. Securities issued by foreign companies and governments located in developing/emerging countries may be affected more negatively by inflation, devaluation of their currencies, higher transaction costs, delays in settlement, adverse political developments, the introduction of capital controls, withholding taxes, nationalization of private assets, expropriation, social unrest, war or lack of timely information than those in developed countries. |
| n | Foreign securities risk. The Fund’s foreign investments may be affected by changes in a foreign country’s exchange rates, political and social instability, changes in economic or taxation policies, difficulties when enforcing obligations, decreased liquidity, and increased volatility. Foreign companies may be subject to less regulation resulting in less publicly available information about the companies. |
| n | Geographic focus risk. From time to time the Fund may invest a substantial amount of its assets in securities of issuers located in a single country or a limited number of countries. If the Fund focuses its investments in this manner, it assumes the risk that economic, political and social conditions in those |
countries will have a significant impact on its investment performance. The Fund’s investment performance may also be more volatile if it focuses its investments in certain countries, especially emerging market countries. |
| n | Management risk. The investment techniques and risk analysis used by the Fund’s portfolio managers may not produce the desired results. |
| n | Market risk. The prices of and the income generated by the Fund’s securities may decline in response to, among other things, investor sentiment, general economic and market conditions, regional or global instability, and currency and interest rate fluctuations. |
| n | Synthetic securities risk. Fluctuations in the values of synthetic securities may not correlate perfectly with the instruments they are designed to replicate. Synthetic securities may be subject to interest rate changes, market price fluctuations, counterparty risk and liquidity risk. |
About indexes used in this report
| n | The MSCI World IndexSM is an unmanaged index considered representative of stocks of developed countries. |
| n | The Lipper Global Multi-Cap Core Funds Index is an unmanaged index considered representative of global multi-cap core funds tracked by Lipper. |
| n | The Fund is not managed to track the performance of any particular index, including the index(es) defined here, and consequently, the performance of the Fund may deviate significantly from the performance of the index(es). |
| n | A direct investment cannot be made in an index. Unless otherwise indicated, index results include reinvested dividends, and they do not reflect sales charges. Performance of the peer group, if applicable, reflects fund expenses; performance of a market index does not. |
continued on page 7
This report must be accompanied or preceded by a currently effective Fund prospectus, which contains more complete information, including sales charges and expenses. Investors should read it carefully before investing.
NOT FDIC INSURED | MAY LOSE VALUE | NO BANK GUARANTEE
| Fund Nasdaq Symbols | |||||
| Class A Shares | GTNDX | ||||
| Class B Shares | GNDBX | ||||
| Class C Shares | GNDCX | ||||
| Class R Shares | GTNRX | ||||
| Class Y Shares | GTNYX | ||||
| Class R5 Shares | GNDIX | ||||
8 Invesco Global Quantitative Core Fund
Schedule of Investments
December 31, 2012
| Shares | Value | |||||||
Common Stocks & Other Equity Interests–97.75% |
| |||||||
| Australia–4.01% | ||||||||
Coca-Cola Amatil Ltd. | 17,439 | $ | 245,453 | |||||
CSL Ltd. | 42,902 | 2,426,308 | ||||||
Lend Lease Group(a) | 41,055 | 400,420 | ||||||
Telstra Corp. Ltd. | 146,607 | 668,609 | ||||||
Woolworths Ltd. | 48,940 | 1,497,463 | ||||||
| 5,238,253 | ||||||||
| Austria–3.21% | ||||||||
Andritz AG | 40,637 | 2,609,765 | ||||||
Voestalpine AG | 42,935 | 1,578,130 | ||||||
| 4,187,895 | ||||||||
| Canada–3.14% | ||||||||
Alimentation Couche-Tard Inc.–Class B | 12,600 | 621,052 | ||||||
Encana Corp.(b) | 62,400 | 1,235,805 | ||||||
Husky Energy Inc. | 30,900 | 915,141 | ||||||
National Bank of Canada | 17,100 | 1,330,517 | ||||||
| 4,102,515 | ||||||||
| Denmark–1.41% | ||||||||
Coloplast A.S.–Class B | 5,035 | 246,680 | ||||||
Novo Nordisk A.S.–Class B | 9,786 | 1,597,682 | ||||||
| 1,844,362 | ||||||||
| France–1.95% | ||||||||
European Aeronautic Defence and Space Co. N.V. | 65,047 | 2,548,344 | ||||||
| Germany–2.62% | ||||||||
Aurubis AG | 11,249 | 799,722 | ||||||
Muenchener Rueckversicherungs–Gesellschaft AG | 10,070 | 1,806,945 | ||||||
ProSiebenSat.1 Media AG–Preference | 28,820 | 810,626 | ||||||
| 3,417,293 | ||||||||
| Hong Kong–1.09% | ||||||||
Cheung Kong (Holdings) Ltd. | 92,000 | 1,424,157 | ||||||
| Japan–9.60% | ||||||||
Canon Inc.(b) | 40,300 | 1,578,558 | ||||||
Central Japan Railway Co. | 31,100 | 2,519,975 | ||||||
COMSYS Holdings Corp. | 24,800 | 318,649 | ||||||
Daihatsu Motor Co., Ltd. | 8,000 | 157,787 | ||||||
Japan Tobacco Inc. | 67,300 | 1,892,934 | ||||||
Namco Bandai Holdings Inc. | 98,200 | 1,271,871 | ||||||
Sega Sammy Holdings Inc. | 53,000 | 893,968 | ||||||
Sumitomo Mitsui Financial Group, Inc. | 53,600 | 1,944,654 | ||||||
Suzuken Co., Ltd. | 4,400 | 123,829 | ||||||
Tokio Marine Holdings, Inc. | 65,800 | 1,832,203 | ||||||
| 12,534,428 | ||||||||
| Shares | Value | |||||||
| Netherlands–3.53% | ||||||||
ASML Holding N.V. | 32,329 | $ | 2,092,095 | |||||
Koninklijke Ahold N.V. | 189,342 | 2,513,925 | ||||||
| 4,606,020 | ||||||||
| New Zealand–1.75% | ||||||||
Telecom Corp. of New Zealand Ltd. | 1,206,864 | 2,287,867 | ||||||
| Norway–1.10% | ||||||||
TGS Nopec Geophysical Co. A.S.A. | 43,690 | 1,431,206 | ||||||
| Singapore–0.29% | ||||||||
UOL Group Ltd. | 77,000 | 380,136 | ||||||
| Sweden–4.32% | ||||||||
Boliden AB | 76,994 | 1,463,737 | ||||||
Saab AB–Class B | 50,562 | 1,054,941 | ||||||
Skandinaviska Enskilda Banken AB–Class A | 227,993 | 1,944,632 | ||||||
Svenska Handelsbanken AB–Class A | 32,961 | 1,181,237 | ||||||
| 5,644,547 | ||||||||
| Switzerland–1.64% | ||||||||
Roche Holding AG | 10,533 | 2,143,842 | ||||||
| United Kingdom–6.70% | ||||||||
Next PLC | 42,963 | 2,652,442 | ||||||
Rio Tinto PLC | 6,206 | 361,739 | ||||||
Royal Dutch Shell PLC–Class A | 60,677 | 2,144,587 | ||||||
Royal Dutch Shell PLC–Class B | 41,512 | 1,469,614 | ||||||
WH Smith PLC | 190,078 | 2,123,245 | ||||||
| 8,751,627 | ||||||||
| United States–51.39% | ||||||||
Abbott Laboratories | 13,200 | 864,600 | ||||||
Activision Blizzard, Inc. | 195,000 | 2,070,900 | ||||||
Allstate Corp. (The) | 8,000 | 321,360 | ||||||
American Eagle Outfitters, Inc. | 11,800 | 242,018 | ||||||
Amgen Inc. | 32,300 | 2,788,136 | ||||||
AOL Inc. | 66,100 | 1,957,221 | ||||||
Apollo Group, Inc.–Class A(c) | 61,500 | 1,286,580 | ||||||
Apple Inc. | 200 | 106,596 | ||||||
AT&T Inc. | 71,500 | 2,410,265 | ||||||
CF Industries Holdings, Inc. | 3,900 | 792,324 | ||||||
Cisco Systems, Inc. | 149,600 | 2,939,640 | ||||||
Citigroup Inc. | 84,000 | 3,323,040 | ||||||
ConocoPhillips | 48,800 | 2,829,912 | ||||||
Dell Inc. | 157,500 | 1,595,475 | ||||||
Discover Financial Services | 59,500 | 2,293,725 | ||||||
Eli Lilly & Co. | 51,800 | 2,554,776 | ||||||
Entergy Corp. | 20,100 | 1,281,375 | ||||||
Freeport-McMoRan Copper & Gold Inc. | 18,200 | 622,440 | ||||||
Gap, Inc. (The) | 80,800 | 2,508,032 | ||||||
Garmin Ltd.(b) | 58,600 | 2,392,052 | ||||||
See accompanying Notes to Financial Statements which are an integral part of the financial statements.
9 Invesco Global Quantitative Core Fund
| Shares | Value | |||||||
| United States–(continued) | ||||||||
Intel Corp. | 77,900 | $ | 1,607,077 | |||||
JPMorgan Chase & Co. | 50,700 | 2,229,279 | ||||||
KeyCorp | 100,100 | 842,842 | ||||||
Lockheed Martin Corp. | 23,300 | 2,150,357 | ||||||
Marathon Oil Corp. | 62,900 | 1,928,514 | ||||||
Marathon Petroleum Corp. | 41,100 | 2,589,300 | ||||||
Microsoft Corp. | 68,600 | 1,833,678 | ||||||
Northrop Grumman Corp. | 39,700 | 2,682,926 | ||||||
Pfizer Inc. | 117,600 | 2,949,408 | ||||||
Philip Morris International Inc. | 33,400 | 2,793,576 | ||||||
Tesoro Corp. | 9,000 | 396,450 | ||||||
U.S. Bancorp | 86,500 | 2,762,810 | ||||||
UnitedHealth Group Inc. | 26,200 | 1,421,088 | ||||||
Valero Energy Corp. | 24,800 | 846,176 | ||||||
Verizon Communications Inc. | 71,700 | 3,102,459 | ||||||
Wal-Mart Stores, Inc. | 4,000 | 272,920 | ||||||
Western Refining, Inc.(b) | 53,500 | 1,508,165 | ||||||
| 67,097,492 | ||||||||
Total Common Stocks & Other Equity Interests |
| 127,639,984 | ||||||
| Shares | Value | |||||||
Money Market Funds–0.97% | ||||||||
Liquid Assets Portfolio–Institutional Class(d) | 632,120 | $ | 632,120 | |||||
Premier Portfolio–Institutional Class(d) | 632,120 | 632,120 | ||||||
Total Money Market Funds |
| 1,264,240 | ||||||
TOTAL INVESTMENTS (excluding investments purchased with cash collateral from securities on loan)–98.72% (Cost $119,020,490) |
| 128,904,224 | ||||||
Investments Purchased with Cash Collateral from Securities on Loan |
| |||||||
Money Market Funds–3.62% |
| |||||||
Liquid Assets Portfolio–Institutional Class (Cost $4,723,310)(d)(e) | 4,723,310 | 4,723,310 | ||||||
TOTAL INVESTMENTS–102.34% |
| 133,627,534 | ||||||
OTHER ASSETS LESS LIABILITIES–(2.34)% |
| (3,056,475 | ) | |||||
NET ASSETS–100.00% |
| $ | 130,571,059 | |||||
Notes to Schedule of Investments:
| (a) | Stapled security consisting of 1 unit of Lend Lease Trust and 1 share of Lend Lease Corp. Ltd. |
| (b) | All or a portion of this security was out on loan at December 31, 2012. |
| (c) | Non-income producing security. |
| (d) | The money market fund and the Fund are affiliated by having the same investment adviser. |
| (e) | The security has been segregated to satisfy the commitment to return the cash collateral received in securities lending transactions upon the borrower’s return of the securities loaned. See Note 1I. |
See accompanying Notes to Financial Statements which are an integral part of the financial statements.
10 Invesco Global Quantitative Core Fund
Statement of Assets and Liabilities
December 31, 2012
Assets: |
| |||
Investments, at value (Cost $117,756,250)* | $ | 127,639,984 | ||
Investments in affiliated money market funds, at value and cost | 5,987,550 | |||
Total investments, at value (Cost $123,743,800) | 133,627,534 | |||
Foreign currencies, at value (Cost $1,655,682) | 1,667,993 | |||
Receivable for: | ||||
Deposits with brokers for open futures contracts | 148,642 | |||
Fund shares sold | 54,150 | |||
Dividends | 190,481 | |||
Investment for trustee deferred compensation and retirement plans | 34,363 | |||
Other assets | 25,856 | |||
Total assets | 135,749,019 | |||
Liabilities: |
| |||
Payable for: | ||||
Fund shares reacquired | 193,961 | |||
Collateral upon return of securities loaned | 4,723,310 | |||
Variation margin | 1,751 | |||
Accrued fees to affiliates | 102,040 | |||
Accrued other operating expenses | 79,844 | |||
Trustee deferred compensation and retirement plans | 77,054 | |||
Total liabilities | 5,177,960 | |||
Net assets applicable to shares outstanding | $ | 130,571,059 | ||
Net assets consist of: |
| |||
Shares of beneficial interest | $ | 225,987,552 | ||
Undistributed net investment income | 1,294,653 | |||
Undistributed net realized gain (loss) | (106,607,273 | ) | ||
Unrealized appreciation | 9,896,127 | |||
| $ | 130,571,059 | |||
Net Assets: |
| |||
Class A | $ | 94,785,356 | ||
Class B | $ | 6,625,629 | ||
Class C | $ | 8,864,283 | ||
Class R | $ | 930,899 | ||
Class Y | $ | 756,146 | ||
Class R5 | $ | 18,608,746 | ||
Shares outstanding, $0.01 par value per share, |
| |||
Class A | 8,330,434 | |||
Class B | 612,911 | |||
Class C | 821,230 | |||
Class R | 81,595 | |||
Class Y | 66,437 | |||
Class R5 | 1,618,932 | |||
Class A: | ||||
Net asset value per share | $ | 11.38 | ||
Maximum offering price per share | ||||
(Net asset value of $11.38 ¸ 94.50%) | $ | 12.04 | ||
Class B: | ||||
Net asset value and offering price per share | $ | 10.81 | ||
Class C: | ||||
Net asset value and offering price per share | $ | 10.79 | ||
Class R: | ||||
Net asset value and offering price per share | $ | 11.41 | ||
Class Y: | ||||
Net asset value and offering price per share | $ | 11.38 | ||
Class R5: | ||||
Net asset value and offering price per share | $ | 11.49 | ||
| * | At December 31, 2012, securities with an aggregate value of $4,635,001 were on loan to brokers. |
See accompanying Notes to Financial Statements which are an integral part of the financial statements.
11 Invesco Global Quantitative Core Fund
Statement of Operations
For the year ended December 31, 2012
Investment income: |
| |||
Dividends (net of foreign withholding taxes of $212,524) | $ | 3,741,198 | ||
Dividends from affiliated money market funds (includes securities lending income of $65,187) | 66,876 | |||
Total investment income | 3,808,074 | |||
Expenses: | ||||
Advisory fees | 1,074,418 | |||
Administrative services fees | 50,000 | |||
Custodian fees | 34,017 | |||
Distribution fees: | ||||
Class A | 245,264 | |||
Class B | 78,868 | |||
Class C | 91,398 | |||
Class R | 4,602 | |||
Transfer agent fees — A, B, C, R and Y | 390,705 | |||
Transfer agent fees — R5 | 2,175 | |||
Trustees’ and officers’ fees and benefits | 26,385 | |||
Other | 225,369 | |||
Total expenses | 2,223,201 | |||
Less: Fees waived and expense offset arrangement(s) | (5,669 | ) | ||
Net expenses | 2,217,532 | |||
Net investment income | 1,590,542 | |||
Realized and unrealized gain from: | ||||
Net realized gain (loss) from: | ||||
Investment securities | 6,287,438 | |||
Foreign currencies | (140,858 | ) | ||
Futures contracts | 466,498 | |||
| 6,613,078 | ||||
Change in net unrealized appreciation (depreciation) of: | ||||
Investment securities | 8,686,692 | |||
Foreign currencies | 22,111 | |||
Futures contracts | (94,030 | ) | ||
| 8,614,773 | ||||
Net realized and unrealized gain | 15,227,851 | |||
Net increase in net assets resulting from operations | $ | 16,818,393 | ||
See accompanying Notes to Financial Statements which are an integral part of the financial statements.
12 Invesco Global Quantitative Core Fund
Statement of Changes in Net Assets
For the years ended December 31, 2012 and 2011
| 2012 | 2011 | |||||||
Operations: |
| |||||||
Net investment income | $ | 1,590,542 | $ | 2,911,503 | ||||
Net realized gain | 6,613,078 | 10,896,208 | ||||||
Change in net unrealized appreciation (depreciation) | 8,614,773 | (17,569,695 | ) | |||||
Net increase (decrease) in net assets resulting from operations | 16,818,393 | (3,761,984 | ) | |||||
Distributions to shareholders from net investment income: | ||||||||
Class A | (2,226,850 | ) | (1,330,393 | ) | ||||
Class B | (93,077 | ) | (29,065 | ) | ||||
Class C | (122,844 | ) | (28,195 | ) | ||||
Class R | (19,325 | ) | (8,680 | ) | ||||
Class Y | (21,434 | ) | (10,566 | ) | ||||
Class R5 | (546,510 | ) | (340,871 | ) | ||||
Total distributions from net investment income | (3,030,040 | ) | (1,747,770 | ) | ||||
Share transactions-net: | ||||||||
Class A | (13,815,022 | ) | (21,616,264 | ) | ||||
Class B | (3,577,292 | ) | (4,723,668 | ) | ||||
Class C | (1,390,767 | ) | (1,852,914 | ) | ||||
Class R | (45,138 | ) | (221,763 | ) | ||||
Class Y | 92,773 | (84,299 | ) | |||||
Class R5 | 744,793 | (1,860,436 | ) | |||||
Net increase (decrease) in net assets resulting from share transactions | (17,990,653 | ) | (30,359,344 | ) | ||||
Net increase (decrease) in net assets | (4,202,300 | ) | (35,869,098 | ) | ||||
Net assets: | ||||||||
Beginning of year | 134,773,359 | 170,642,457 | ||||||
End of year (includes undistributed net investment income of $1,294,653 and $2,892,943, respectively) | $ | 130,571,059 | $ | 134,773,359 | ||||
Notes to Financial Statements
December 31, 2012
NOTE 1—Significant Accounting Policies
Invesco Global Quantitative Core Fund, formerly Invesco Global Equity Fund (the “Fund”) is a series portfolio of AIM Growth Series (Invesco Growth Series) (the “Trust”). The Trust is organized as a Delaware statutory trust and is registered under the Investment Company Act of 1940, as amended (the “1940 Act”), as an open-end series management investment company consisting of sixteen separate series portfolios, each authorized to issue an unlimited number of shares of beneficial interest. The assets, liabilities and operations of each portfolio are accounted for separately. Information presented in these financial statements pertains only to the Fund. Matters affecting each portfolio or class will be voted on exclusively by the shareholders of such portfolio or class.
The Fund’s investment objective is long-term growth of capital.
The Fund currently consists of six different classes of shares: Class A, Class B, Class C, Class R, Class Y and Class R5. On September 24, 2012, Institutional Class shares were renamed Class R5 shares. Class A shares are sold with a front-end sales charge unless certain waiver criteria are met and under certain circumstances load waived shares may be subject to contingent deferred sales charges (“CDSC”). Class C shares are sold with a CDSC. Class R, Class Y and Class R5 shares are sold at net asset value. Effective November 30, 2010, new or additional investments in Class B shares are no longer permitted. Existing shareholders of Class B shares may continue to reinvest dividends and capital gains distributions in Class B shares until they convert to Class A shares. Also, shareholders in Class B shares will be able to exchange those shares for Class B shares of other Invesco Funds offering such shares until they convert to Class A shares. Generally, Class B shares will automatically convert to Class A shares on or about the month-end, which is at least eight years after the date of purchase. Redemption of Class B shares prior to the conversion date will be subject to a CDSC.
The following is a summary of the significant accounting policies followed by the Fund in the preparation of its financial statements.
| A. | Security Valuations — Securities, including restricted securities, are valued according to the following policy. |
A security listed or traded on an exchange (except convertible bonds) is valued at its last sales price or official closing price as of the close of the customary trading session on the exchange where the security is principally traded, or lacking any sales or official closing price on a particular day, the security may be valued at the closing bid price on that day. Securities traded in the over-the-counter market are valued based on prices furnished by independent pricing services or market makers. When such securities are valued by an independent pricing service they may be
13 Invesco Global Quantitative Core Fund
considered fair valued. Futures contracts are valued at the final settlement price set by an exchange on which they are principally traded. Listed options are valued at the mean between the last bid and ask prices from the exchange on which they are principally traded. Options not listed on an exchange are valued by an independent source at the mean between the last bid and ask prices. For purposes of determining net asset value per share, futures and option contracts generally are valued 15 minutes after the close of the customary trading session of the New York Stock Exchange (“NYSE”).
Investments in open-end and closed-end registered investment companies that do not trade on an exchange are valued at the end of day net asset value per share. Investments in open-end and closed-end registered investment companies that trade on an exchange are valued at the last sales price or official closing price as of the close of the customary trading session on the exchange where the security is principally traded.
Debt obligations (including convertible bonds) and unlisted equities are fair valued using an evaluated quote provided by an independent pricing service. Evaluated quotes provided by the pricing service may be determined without exclusive reliance on quoted prices, and may reflect appropriate factors such as institution-size trading in similar groups of securities, developments related to specific securities, dividend rate (for unlisted equities), yield (for debt obligations), quality, type of issue, coupon rate (for debt obligations), maturity (for debt obligations), individual trading characteristics and other market data. Debt obligations are subject to interest rate and credit risks. In addition, all debt obligations involve some risk of default with respect to interest and/or principal payments.
Foreign securities’ (including foreign exchange contracts) prices are converted into U.S. dollar amounts using the applicable exchange rates as of the close of the NYSE. If market quotations are available and reliable for foreign exchange-traded equity securities, the securities will be valued at the market quotations. Because trading hours for certain foreign securities end before the close of the NYSE, closing market quotations may become unreliable. If between the time trading ends on a particular security and the close of the customary trading session on the NYSE, events occur that the Adviser determines are significant and make the closing price unreliable, the Fund may fair value the security. If the event is likely to have affected the closing price of the security, the security will be valued at fair value in good faith using procedures approved by the Board of Trustees. Adjustments to closing prices to reflect fair value may also be based on a screening process of an independent pricing service to indicate the degree of certainty, based on historical data, that the closing price in the principal market where a foreign security trade is not the current value as of the close of the NYSE. Foreign securities’ prices meeting the approved degree of certainty that the price is not reflective of current value will be priced at the indication of fair value from the independent pricing service. Multiple factors may be considered by the independent pricing service in determining adjustments to reflect fair value and may include information relating to sector indices, American Depositary Receipts and domestic and foreign index futures. Foreign securities may have additional risks including exchange rate changes, potential for sharply devalued currencies and high inflation, political and economic upheaval, the relative lack of issuer information, relatively low market liquidity and the potential lack of strict financial and accounting controls and standards.
Securities for which market prices are not provided by any of the above methods may be valued based upon quotes furnished by independent sources. The last bid price may be used to value equity securities. The mean between the last bid and asked prices is used to value debt obligations, including corporate loans.
Securities for which market quotations are not readily available or became unreliable are valued at fair value as determined in good faith by or under the supervision of the Trust’s officers following procedures approved by the Board of Trustees. Issuer specific events, market trends, bid/ask quotes of brokers and information providers and other market data may be reviewed in the course of making a good faith determination of a security’s fair value.
Valuations change in response to many factors including the historical and prospective earnings of the issuer, the value of the issuer’s assets, general economic conditions, interest rates, investor perceptions and market liquidity. Because of the inherent uncertainties of valuation, the values reflected in the financial statements may materially differ from the value received upon actual sale of those investments.
| B. | Securities Transactions and Investment Income — Securities transactions are accounted for on a trade date basis. Realized gains or losses on sales are computed on the basis of specific identification of the securities sold. Interest income is recorded on the accrual basis from settlement date. Dividend income (net of withholding tax, if any) is recorded on the ex-dividend date. |
The Fund may periodically participate in litigation related to Fund investments. As such, the Fund may receive proceeds from litigation settlements. Any proceeds received are included in the Statement of Operations as realized gain (loss) for investments no longer held and as unrealized gain (loss) for investments still held.
Brokerage commissions and mark ups are considered transaction costs and are recorded as an increase to the cost basis of securities purchased and/or a reduction of proceeds on a sale of securities. Such transaction costs are included in the determination of net realized and unrealized gain (loss) from investment securities reported in the Statement of Operations and the Statement of Changes in Net Assets and the net realized and unrealized gains (losses) on securities per share in the Financial Highlights. Transaction costs are included in the calculation of the Fund’s net asset value and, accordingly, they reduce the Fund’s total returns. These transaction costs are not considered operating expenses and are not reflected in net investment income reported in the Statement of Operations and Statement of Changes in Net Assets, or the net investment income per share and ratios of expenses and net investment income reported in the Financial Highlights, nor are they limited by any expense limitation arrangements between the Fund and the investment adviser.
The Fund allocates income and realized and unrealized capital gains and losses to a class based on the relative net assets of each class.
| C. | Country Determination — For the purposes of making investment selection decisions and presentation in the Schedule of Investments, the investment adviser may determine the country in which an issuer is located and/or credit risk exposure based on various factors. These factors include the laws of the country under which the issuer is organized, where the issuer maintains a principal office, the country in which the issuer derives 50% or more of its total revenues and the country that has the primary market for the issuer’s securities, as well as other criteria. Among the other criteria that may be evaluated for making this determination are the country in which the issuer maintains 50% or more of its assets, the type of security, financial guarantees and enhancements, the nature of the collateral and the sponsor organization. Country of issuer and/or credit risk exposure has been determined to be the United States of America, unless otherwise noted. |
| D. | Distributions — Distributions from income and net realized capital gain, if any, are generally declared and paid annually and recorded on the ex-dividend date. The Fund may elect to treat a portion of the proceeds from redemptions as distributions for federal income tax purposes. |
14 Invesco Global Quantitative Core Fund
| E. | Federal Income Taxes — The Fund intends to comply with the requirements of Subchapter M of the Internal Revenue Code necessary to qualify as a regulated investment company and to distribute substantially all of the Fund’s taxable earnings to shareholders. As such, the Fund will not be subject to federal income taxes on otherwise taxable income (including net realized capital gain) that is distributed to shareholders. Therefore, no provision for federal income taxes is recorded in the financial statements. |
The Fund files tax returns in the U.S. Federal jurisdiction and certain other jurisdictions. Generally, the Fund is subject to examinations by such taxing authorities for up to three years after the filing of the return for the tax period.
| F. | Expenses — Fees provided for under the Rule 12b-1 plan of a particular class of the Fund are charged to the operations of such class. Transfer agency fees and expenses and other shareholder recordkeeping fees and expenses attributable to Class R5 are charged to such class. Transfer agency fees and expenses and other shareholder recordkeeping fees and expenses relating to all other classes are allocated among those classes based on relative net assets. All other expenses are allocated among the classes based on relative net assets. |
| G. | Accounting Estimates — The preparation of financial statements in conformity with accounting principles generally accepted in the United States of America (“GAAP”) requires management to make estimates and assumptions that affect the reported amounts of assets and liabilities at the date of the financial statements and the reported amounts of revenues and expenses during the reporting period including estimates and assumptions related to taxation. Actual results could differ from those estimates by a significant amount. In addition, the Fund monitors for material events or transactions that may occur or become known after the period-end date and before the date the financial statements are released to print. |
| H. | Indemnifications — Under the Trust’s organizational documents, each Trustee, officer, employee or other agent of the Trust is indemnified against certain liabilities that may arise out of the performance of their duties to the Fund. Additionally, in the normal course of business, the Fund enters into contracts, including the Fund’s servicing agreements, that contain a variety of indemnification clauses. The Fund’s maximum exposure under these arrangements is unknown as this would involve future claims that may be made against the Fund that have not yet occurred. The risk of material loss as a result of such indemnification claims is considered remote. |
| I. | Securities Lending — The Fund may lend portfolio securities having a market value up to one-third of the Fund’s total assets. Such loans are secured by collateral equal to no less than the market value of the loaned securities determined daily by the securities lending provider. Such collateral will be cash or debt securities issued or guaranteed by the U.S. Government or any of its sponsored agencies. Cash collateral received in connection with these loans is invested in short-term money market instruments or affiliated money market funds and is shown as such on the Schedule of Investments. It is the Fund’s policy to obtain additional collateral from or return excess collateral to the borrower by the end of the next business day, following the valuation date of the securities loaned. Therefore, the value of the collateral held may be temporarily less than the value of the securities on loan. Lending securities entails a risk of loss to the Fund if and to the extent that the market value of the securities loaned were to increase and the borrower did not increase the collateral accordingly, and the borrower fails to return the securities. Upon the failure of the borrower to return the securities, collateral may be liquidated and the securities may be purchased on the open market to replace the loaned securities. The Fund could experience delays and costs in gaining access to the collateral. The Fund bears the risk of any deficiency in the amount of the collateral available for return to the borrower due to any loss on the collateral invested. Dividends received on cash collateral investments for securities lending transactions, which are net of compensation to counterparties, is included in Dividends from affiliated money market funds on the Statement of Operations. The aggregate value of securities out on loan is shown as a footnote on the Statement of Assets and Liabilities, if any. |
| J. | Foreign Currency Translations — Foreign currency is valued at the close of the NYSE based on quotations posted by banks and major currency dealers. Portfolio securities and other assets and liabilities denominated in foreign currencies are translated into U.S. dollar amounts at date of valuation. Purchases and sales of portfolio securities (net of foreign taxes withheld on disposition) and income items denominated in foreign currencies are translated into U.S. dollar amounts on the respective dates of such transactions. The Fund does not separately account for the portion of the results of operations resulting from changes in foreign exchange rates on investments and the fluctuations arising from changes in market prices of securities held. The combined results of changes in foreign exchange rates and the fluctuation of market prices on investments (net of estimated foreign tax withholding) are included with the net realized and unrealized gain or loss from investments in the Statement of Operations. Reported net realized foreign currency gains or losses arise from (1) sales of foreign currencies, (2) currency gains or losses realized between the trade and settlement dates on securities transactions, and (3) the difference between the amounts of dividends, interest, and foreign withholding taxes recorded on the Fund’s books and the U.S. dollar equivalent of the amounts actually received or paid. Net unrealized foreign currency gains and losses arise from changes in the fair values of assets and liabilities, other than investments in securities at fiscal period end, resulting from changes in exchange rates. |
The Fund may invest in foreign securities which may be subject to foreign taxes on income, gains on investments or currency repatriation, a portion of which may be recoverable.
| K. | Foreign Currency Contracts — The Fund may enter into foreign currency contracts to manage or minimize currency or exchange rate risk. The Fund may also enter into foreign currency contracts for the purchase or sale of a security denominated in a foreign currency in order to “lock in” the U.S. dollar price of that security. A foreign currency contract is an obligation to purchase or sell a specific currency for an agreed-upon price at a future date. The use of foreign currency contracts does not eliminate fluctuations in the price of the underlying securities the Fund owns or intends to acquire but establishes a rate of exchange in advance. Fluctuations in the value of these contracts are measured by the difference in the contract date and reporting date exchange rates and are recorded as unrealized appreciation (depreciation) until the contracts are closed. When the contracts are closed, realized gains (losses) are recorded. Realized and unrealized gains (losses) on the contracts are included in the Statement of Operations. The primary risks associated with foreign currency contracts include failure of the counterparty to meet the terms of the contract and the value of the foreign currency changing unfavorably. These risks may be in excess of the amounts reflected in the Statement of Assets and Liabilities. |
| L. | Futures Contracts — The Fund may enter into futures contracts to manage exposure to interest rate, equity and market price movements and/or currency risks. A futures contract is an agreement between two parties to purchase or sell a specified underlying security, currency or commodity (or delivery of a cash settlement price, in the case of an index future) for a fixed price at a future date. The Fund currently invests only in exchange-traded futures and they are standardized as to maturity date and underlying financial instrument. Initial margin deposits required upon entering into futures contracts are satisfied by the segregation of specific securities or cash as collateral at the futures commission |
15 Invesco Global Quantitative Core Fund
| merchant (broker). During the period the futures contracts are open, changes in the value of the contracts are recognized as unrealized gains or losses by recalculating the value of the contracts on a daily basis. Subsequent or variation margin payments are received or made depending upon whether unrealized gains or losses are incurred. These amounts are reflected as receivables or payables on the Statement of Assets and Liabilities. When the contracts are closed or expire, the Fund recognizes a realized gain or loss equal to the difference between the proceeds from, or cost of, the closing transaction and the Fund’s basis in the contract. The net realized gain (loss) and the change in unrealized gain (loss) on futures contracts held during the period is included on the Statement of Operations. The primary risks associated with futures contracts are market risk and the absence of a liquid secondary market. If the Fund were unable to liquidate a futures contract and/or enter into an offsetting closing transaction, the Fund would continue to be subject to market risk with respect to the value of the contracts and continue to be required to maintain the margin deposits on the futures contracts. Futures contracts have minimal counterparty risk since the exchange’s clearinghouse, as counterparty to all exchange-traded futures, guarantees the futures against default. Risks may exceed amounts recognized in the Statement of Assets and Liabilities. |
| M. | Collateral — To the extent the Fund has pledged or segregated a security as collateral and that security is subsequently sold, it is the Fund’s practice to replace such collateral no later than the next business day. This practice does not apply to securities pledged as collateral for securities lending transactions. |
NOTE 2—Advisory Fees and Other Fees Paid to Affiliates
The Trust has entered into a master investment advisory agreement with Invesco Advisers, Inc. (the “Adviser” or “Invesco”). Under the terms of the investment advisory agreement, the Fund pays an advisory fee to the Adviser based on the annual rate of the Fund’s average daily net assets as follows:
| Average Daily Net Assets | Rate | |||
First $250 million | 0.80% | |||
Next $250 million | 0.78% | |||
Next $500 million | 0.76% | |||
Next $1.5 billion | 0.74% | |||
Next $2.5 billion | 0.72% | |||
Next $2.5 billion | 0.70% | |||
Next $2.5 billion | 0.68% | |||
Over $10 billion | 0.66% | |||
Under the terms of a master sub-advisory agreement between the Adviser and each of Invesco Asset Management Deutschland GmbH, Invesco Asset Management Limited, Invesco Asset Management (Japan) Limited, Invesco Australia Limited, Invesco Hong Kong Limited, Invesco Senior Secured Management, Inc. and Invesco Canada Ltd. (collectively, the “Affiliated Sub-Advisers”) the Adviser, not the Fund, may pay 40% of the fees paid to the Adviser to any such Affiliated Sub-Adviser(s) that provide discretionary investment management services to the Fund based on the percentage of assets allocated to such Sub-Adviser(s).
The Adviser has contractually agreed, through at least June 30, 2013, to waive advisory fees and/or reimburse expenses of all shares to the extent necessary to limit total annual fund operating expenses after fee waiver and/or expense reimbursement (excluding certain items discussed below) of Class A, Class B, Class C, Class R, Class Y and Class R5 shares to 2.25%, 3.00%, 3.00%, 2.50%, 2.00% and 2.00%, respectively, of average daily net assets. In determining the Adviser’s obligation to waive advisory fees and/or reimburse expenses, the following expenses are not taken into account, and could cause the total annual fund operating expenses after fee waiver and/or expense reimbursement to exceed the numbers reflected above: (1) interest; (2) taxes; (3) dividend expense on short sales; (4) extraordinary or non-routine items, including litigation expenses; and (5) expenses that the Fund has incurred but did not actually pay because of an expense offset arrangement. Unless the Board of Trustees and Invesco mutually agree to amend or continue the fee waiver agreement, it will terminate on June 30, 2013. The Adviser did not waive fees and/or reimburse expenses during the period under the expense limitation.
Further, the Adviser has contractually agreed, through at least June 30, 2013, to waive the advisory fee payable by the Fund in an amount equal to 100% of the net advisory fees the Adviser receives from the affiliated money market funds on investments by the Fund of uninvested cash (excluding investments of cash collateral from securities lending) in such affiliated money market funds.
For the year ended December 31, 2012, the Adviser waived advisory fees of $1,689.
The Trust has entered into a master administrative services agreement with Invesco pursuant to which the Fund has agreed to pay Invesco for certain administrative costs incurred in providing accounting services to the Fund. For the year ended December 31, 2012, expenses incurred under the agreement are shown in the Statement of Operations as Administrative services fees.
The Trust has entered into a transfer agency and service agreement with Invesco Investment Services, Inc. (“IIS”) pursuant to which the Fund has agreed to pay IIS a fee for providing transfer agency and shareholder services to the Fund and reimburse IIS for certain expenses incurred by IIS in the course of providing such services. IIS may make payments to intermediaries that provide omnibus account services, sub-accounting services and/or networking services. All fees payable by IIS to intermediaries that provide omnibus account services or sub-accounting are charged back to the Fund, subject to certain limitations approved by the Trust’s Board of Trustees. For the year ended December 31, 2012, expenses incurred under the agreement are shown in the Statement of Operations as Transfer agent fees.
The Trust has entered into master distribution agreements with Invesco Distributors, Inc. (“IDI”) to serve as the distributor for the Class A, Class B, Class C, Class R, Class Y and Class R5 shares of the Fund. The Trust has adopted plans pursuant to Rule 12b-1 under the 1940 Act with respect to the Fund’s Class A, Class B, Class C and Class R shares (collectively, the “Plans”). The Fund, pursuant to the Plans, pays IDI compensation at the annual rate of 0.25% of the Fund’s average daily net assets of Class A shares, 1.00% of the average daily net assets of Class B and Class C shares and 0.50% of the average daily net assets of Class R shares. Of the Plan payments, up to 0.25% of the average daily net assets of each class of shares may be paid to furnish continuing personal shareholder services to customers who purchase and own shares of such classes. Any amounts not paid as a service fee under the Plans would constitute an asset-based sales charge. Rules of the Financial Industry Regulatory Authority (“FINRA”) impose a
16 Invesco Global Quantitative Core Fund
cap on the total sales charges, including asset-based sales charges, that may be paid by any class of shares of the Fund. For the year ended December 31, 2012, expenses incurred under the Plans are shown in the Statement of Operations as Distribution fees.
Front-end sales commissions and CDSC (collectively, the “sales charges”) are not recorded as expenses of the Fund. Front-end sales commissions are deducted from proceeds from the sales of Fund shares prior to investment in Class A shares of the Fund. CDSC are deducted from redemption proceeds prior to remittance to the shareholder. During the year ended December 31, 2012, IDI advised the Fund that IDI retained $8,604 in front-end sales commissions from the sale of Class A shares and $3, $9,649 and $789 from Class A, Class B and Class C shares, respectively, for CDSC imposed on redemptions by shareholders.
Certain officers and trustees of the Trust are officers and directors of the Adviser, IIS and/or IDI.
NOTE 3—Additional Valuation Information
GAAP defines fair value as the price that would be received to sell an asset or paid to transfer a liability in an orderly transaction between market participants at the measurement date, under current market conditions. GAAP establishes a hierarchy that prioritizes the inputs to valuation methods giving the highest priority to readily available unadjusted quoted prices in an active market for identical assets (Level 1) and the lowest priority to significant unobservable inputs (Level 3) generally when market prices are not readily available or are unreliable. Based on the valuation inputs, the securities or other investments are tiered into one of three levels. Changes in valuation methods may result in transfers in or out of an investment’s assigned level:
| Level 1 — | Prices are determined using quoted prices in an active market for identical assets. |
| Level 2 — | Prices are determined using other significant observable inputs. Observable inputs are inputs that other market participants may use in pricing a security. These may include quoted prices for similar securities, interest rates, prepayment speeds, credit risk, yield curves, loss severities, default rates, discount rates, volatilities and others. |
| Level 3 — | Prices are determined using significant unobservable inputs. In situations where quoted prices or observable inputs are unavailable (for example, when there is little or no market activity for an investment at the end of the period), unobservable inputs may be used. Unobservable inputs reflect the Fund’s own assumptions about the factors market participants would use in determining fair value of the securities or instruments and would be based on the best available information. |
The following is a summary of the tiered valuation input levels, as of December 31, 2012. The level assigned to the securities valuations may not be an indication of the risk or liquidity associated with investing in those securities. Because of the inherent uncertainties of valuation, the values reflected in the financial statements may materially differ from the value received upon actual sale of those investments.
During the year ended December 31, 2012, there were transfers from Level 1 to Level 2 of $13,649,813 due to foreign fair value adjustments.
| Level 1 | Level 2 | Level 3 | Total | |||||||||||||
Australia | $ | — | $ | 5,238,253 | $ | — | $ | 5,238,253 | ||||||||
Austria | — | 4,187,895 | — | 4,187,895 | ||||||||||||
Canada | 4,102,515 | — | — | 4,102,515 | ||||||||||||
Denmark | — | 1,844,362 | — | 1,844,362 | ||||||||||||
France | — | 2,548,344 | — | 2,548,344 | ||||||||||||
Germany | 1,806,945 | 1,610,348 | — | 3,417,293 | ||||||||||||
Hong Kong | — | 1,424,157 | — | 1,424,157 | ||||||||||||
Japan | 2,050,721 | 10,483,707 | — | 12,534,428 | ||||||||||||
Netherlands | — | 4,606,020 | — | 4,606,020 | ||||||||||||
New Zealand | — | 2,287,867 | — | 2,287,867 | ||||||||||||
Norway | — | 1,431,206 | — | 1,431,206 | ||||||||||||
Singapore | — | 380,136 | — | 380,136 | ||||||||||||
Sweden | — | 5,644,547 | — | 5,644,547 | ||||||||||||
Switzerland | — | 2,143,842 | — | 2,143,842 | ||||||||||||
United Kingdom | — | 8,751,627 | — | 8,751,627 | ||||||||||||
United States | 73,085,042 | — | — | 73,085,042 | ||||||||||||
| $ | 81,045,223 | $ | 52,582,311 | $ | — | $ | 133,627,534 | |||||||||
Futures* | 1,613 | — | — | 1,613 | ||||||||||||
Total Investments | $ | 81,046,836 | $ | 52,582,311 | $ | — | $ | 133,629,147 | ||||||||
| * | Unrealized appreciation (depreciation). |
17 Invesco Global Quantitative Core Fund
NOTE 4—Derivative Investments
Value of Derivative Instruments at Period-End
The table below summarizes the value of the Fund’s derivative instruments, detailed by primary risk exposure, held as of December 31, 2012:
| Value | ||||||||
| Risk Exposure/Derivative Type | Assets | Liabilities | ||||||
Market risk | ||||||||
Futures contracts(a) | $ | 20,568 | $ | (18,955 | ) | |||
| (a) | Includes cumulative appreciation (depreciation) of futures contracts. Only current day’s variation margin receivable is reported within the Statement of Assets and Liabilities. |
Effect of Derivative Instruments for the year ended December 31, 2012
The table below summarizes the gains (losses) on derivative instruments, detailed by primary risk exposure, recognized in earnings during the period:
| Location of Gain (Loss) on Statement of Operations | ||||
| Futures* | ||||
Realized Gain | ||||
Market risk | $ | 466,498 | ||
Change in Unrealized Appreciation (Depreciation) | ||||
Market risk | $ | (94,030 | ) | |
Total | $ | 372,468 | ||
| * | The average notional value of futures outstanding during the period was $3,398,393. |
| Open Futures Contracts* | ||||||||||||||||
| Long Contracts | Number of Contracts | Expiration Month | Notional Value | Unrealized Appreciation (Depreciation) | ||||||||||||
CME E-Mini S&P 500 Index | 16 | March-2013 | $ | 1,136,080 | $ | (10,272 | ) | |||||||||
Dow Jones EURO STOXX 50 Index | 13 | March-2013 | 448,530 | (6,011 | ) | |||||||||||
FTSE 100 Index | 2 | March-2013 | 190,048 | (2,672 | ) | |||||||||||
SGX NIKKEI 25 Index | 3 | March-2013 | 179,395 | 20,568 | ||||||||||||
Total | $ | 1,613 | ||||||||||||||
| * | Futures collateralized by $148,642 cash held with Merrill Lynch & Co, Inc. |
NOTE 5—Expense Offset Arrangement(s)
The expense offset arrangements are comprised of (1) transfer agency credits which result from balances in Demand Deposit Accounts (DDA) used by the transfer agent for clearing shareholder transactions and (2) custodian credits which result from periodic overnight cash balances at the custodian. For the year ended December 31, 2012, the Fund received credits from these arrangements, which resulted in the reduction of the Fund’s total expenses of $3,980.
NOTE 6—Trustees’ and Officers’ Fees and Benefits
“Trustees’ and Officers’ Fees and Benefits” include amounts accrued by the Fund to pay remuneration to certain Trustees and Officers of the Fund. Trustees have the option to defer compensation payable by the Fund, and “Trustees’ and Officers’ Fees and Benefits” also include amounts accrued by the Fund to fund such deferred compensation amounts. Those Trustees who defer compensation have the option to select various Invesco Funds in which their deferral accounts shall be deemed to be invested. Finally, certain current Trustees are eligible to participate in a retirement plan that provides for benefits to be paid upon retirement to Trustees over a period of time based on the number of years of service. The Fund may have certain former Trustees who also participate in a retirement plan and receive benefits under such plan. “Trustees’ and Officers’ Fees and Benefits” include amounts accrued by the Fund to fund such retirement benefits. Obligations under the deferred compensation and retirement plans represent unsecured claims against the general assets of the Fund.
NOTE 7—Cash Balances
The Fund is permitted to temporarily carry a negative or overdrawn balance in its account with State Street Bank and Trust Company, the custodian bank. Such balances, if any at period end, are shown in the Statement of Assets and Liabilities under the payable caption Amount due custodian. To compensate the custodian bank for such overdrafts, the overdrawn Fund may either (1) leave funds as a compensating balance in the account so the custodian bank can be compensated by earning the additional interest; or (2) compensate by paying the custodian bank at a rate agreed upon by the custodian bank and Invesco, not to exceed the contractually agreed upon rate.
18 Invesco Global Quantitative Core Fund
NOTE 8—Distributions to Shareholders and Tax Components of Net Assets
Tax Character of Distributions to Shareholders Paid During the Years Ended December 31, 2012 and 2011:
| 2012 | 2011 | |||||||
Ordinary income | $ | 3,030,040 | $ | 1,747,770 | ||||
Tax Components of Net Assets at Period-End:
| 2012 | ||||
Undistributed ordinary income | $ | 1,367,612 | ||
Net unrealized appreciation — investments | 9,869,355 | |||
Net unrealized appreciation — other investments | 25,328 | |||
Temporary book/tax differences | (72,959 | ) | ||
Capital loss carryforward | (106,605,829 | ) | ||
Shares of beneficial interest | 225,987,552 | |||
Total net assets | $ | 130,571,059 | ||
The difference between book-basis and tax-basis unrealized appreciation (depreciation) is due to differences in the timing of recognition of gains and losses on investments for tax and book purposes. The Fund’s net unrealized appreciation difference is attributable primarily to wash sales.
The temporary book/tax differences are a result of timing differences between book and tax recognition of income and/or expenses. The Fund’s temporary book/tax differences are the result of the trustee deferral of compensation and retirement plan benefits.
Capital loss carryforward is calculated and reported as of a specific date. Results of transactions and other activity after that date may affect the amount of capital loss carryforward actually available for the Fund to utilize. The Regulated Investment Company Modernization Act of 2010 (the “Act”) eliminated the eight-year carryover period for capital losses that arise in taxable years beginning after its enactment date of December 22, 2010. Consequently, these capital losses can be carried forward for an unlimited period. However, capital losses with an expiration period may not be used to offset capital gains until all net capital losses without an expiration date have been utilized. Additionally, post-enactment capital loss carryovers will retain their character as either short-term or long-term capital losses instead of as short-term capital losses as under prior law. The ability to utilize capital loss carryforward in the future may be limited under the Internal Revenue Code and related regulations based on the results of future transactions.
The Fund utilized $4,951,545 of capital loss carryforward in the current period to offset net realized capital gain for federal income tax purposes. The Fund has a capital loss carryforward as of December 31, 2012, which expires as follows:
| Capital Loss Carryforward* | ||||||||||||
| Expiration | Short-Term | Long-Term | Total | |||||||||
December 31, 2016 | $ | 41,269,436 | $ | — | $ | 41,269,436 | ||||||
December 31, 2017 | 65,336,393 | — | 65,336,393 | |||||||||
| $ | 106,605,829 | $ | — | $ | 106,605,829 | |||||||
| * | Capital loss carryforward as of the date listed above is reduced for limitations, if any, to the extent required by the Internal Revenue Code. |
NOTE 9—Investment Securities
The aggregate amount of investment securities (other than short-term securities, U.S. Treasury obligations and money market funds, if any) purchased and sold by the Fund during the year ended December 31, 2012 was $93,590,882 and $111,022,122, respectively. Cost of investments on a tax basis includes the adjustments for financial reporting purposes as of the most recently completed federal income tax reporting period-end.
| Unrealized Appreciation (Depreciation) of Investment Securities on a Tax Basis | ||||
Aggregate unrealized appreciation of investment securities | $ | 15,301,354 | ||
Aggregate unrealized (depreciation) of investment securities | (5,431,999 | ) | ||
Net unrealized appreciation of investment securities | $ | 9,869,355 | ||
Cost of investments for tax purposes is $123,758,179.
NOTE 10—Reclassification of Permanent Differences
Primarily as a result of differing book/tax treatment of foreign currency transactions and return on capital distributions on December 31, 2012, undistributed net investment income was decreased by $158,792 and undistributed net realized gain (loss) was increased by $158,792. This reclassification had no effect on the net assets of the Fund.
19 Invesco Global Quantitative Core Fund
NOTE 11—Share Information
| Summary of Share Activity | ||||||||||||||||
| Years ended December 31, | ||||||||||||||||
| 2012(a) | 2011 | |||||||||||||||
| Shares | Amount | Shares | Amount | |||||||||||||
Sold: | ||||||||||||||||
Class A | 368,099 | $ | 4,066,079 | 554,469 | $ | 6,063,301 | ||||||||||
Class B | 10,485 | 108,689 | 35,902 | 379,477 | ||||||||||||
Class C | 72,073 | 741,753 | 123,633 | 1,262,742 | ||||||||||||
Class R | 29,398 | 324,738 | 26,387 | 284,823 | ||||||||||||
Class Y | 36,805 | 412,000 | 17,859 | 202,079 | ||||||||||||
Class R5 | 67,297 | 741,549 | 57,284 | 642,000 | ||||||||||||
Issued as reinvestment of dividends: | ||||||||||||||||
Class A | 184,798 | 2,086,372 | 122,201 | 1,250,115 | ||||||||||||
Class B | 8,369 | 89,799 | 2,890 | 28,036 | ||||||||||||
Class C | 10,876 | 116,589 | 2,774 | 26,878 | ||||||||||||
Class R | 1,707 | 19,325 | 847 | 8,680 | ||||||||||||
Class Y | 1,584 | 17,882 | 705 | 7,214 | ||||||||||||
Class R5 | 47,940 | 546,510 | 32,886 | 340,038 | ||||||||||||
Automatic conversion of Class B shares to Class A shares: | ||||||||||||||||
Class A | 188,753 | 2,096,605 | 207,162 | 2,264,695 | ||||||||||||
Class B | (199,936 | ) | (2,096,605 | ) | (219,882 | ) | (2,264,695 | ) | ||||||||
Reacquired:(b) | ||||||||||||||||
Class A | (1,998,868 | ) | (22,064,078 | ) | (2,853,606 | ) | (31,194,375 | ) | ||||||||
Class B | (161,806 | ) | (1,679,175 | ) | (278,794 | ) | (2,866,486 | ) | ||||||||
Class C | (217,409 | ) | (2,249,109 | ) | (308,859 | ) | (3,142,534 | ) | ||||||||
Class R | (35,802 | ) | (389,201 | ) | (47,602 | ) | (515,266 | ) | ||||||||
Class Y | (30,120 | ) | (337,109 | ) | (27,285 | ) | (293,592 | ) | ||||||||
Class R5 | (48,677 | ) | (543,266 | ) | (263,076 | ) | (2,842,474 | ) | ||||||||
Net increase (decrease) in share activity | (1,664,434 | ) | $ | (17,990,653 | ) | (2,814,105 | ) | $ | (30,359,344 | ) | ||||||
| (a) | There are entities that are record owners of more than 5% of the outstanding shares of the Fund and in the aggregate own 21% of the outstanding shares of the Fund. IDI has an agreement with these entities to sell Fund shares. The Fund, Invesco and/or Invesco affiliates may make payments to these entities, which are considered to be related to the Fund, for providing services to the Fund, Invesco and/or Invesco affiliates including but not limited to services such as securities brokerage, distribution, third party record keeping and account servicing. The Fund has no knowledge as to whether all or any portion of the shares owned of record by these entities are also owned beneficially. |
| (b) | Net of redemption fees of $536 allocated among the classes based on relative net assets of each class for the year ended December 31, 2011. |
20 Invesco Global Quantitative Core Fund
NOTE 12—Financial Highlights
The following schedule presents financial highlights for a share of the Fund outstanding throughout the periods indicated.
| Net asset value, beginning of period | Net investment income(a) | Net gains (losses) on securities (both realized and unrealized) | Total from investment operations | Dividends from net investment income | Distributions from net realized gains | Total distributions | Net asset value, end of period(b) | Total return(c) | Net assets, end of period (000’s omitted) | Ratio of expenses to average net assets with fee waivers and/or expenses absorbed | Ratio of expenses to average net assets without fee waivers and/or expenses absorbed | Ratio of net investment income to average net assets | Portfolio turnover(d) | |||||||||||||||||||||||||||||||||||||||||||
Class A |
| |||||||||||||||||||||||||||||||||||||||||||||||||||||||
Year ended 12/31/12 | $ | 10.28 | $ | 0.13 | $ | 1.24 | $ | 1.37 | $ | (0.27 | ) | $ | — | $ | (0.27 | ) | $ | 11.38 | 13.32 | % | $ | 94,785 | 1.63 | %(e) | 1.63 | %(e) | 1.21 | %(e) | 72 | % | ||||||||||||||||||||||||||
Year ended 12/31/11 | 10.74 | 0.21 | (0.53 | ) | (0.32 | ) | (0.14 | ) | — | (0.14 | ) | 10.28 | (2.98 | ) | 98,542 | 1.56 | 1.56 | 1.91 | 86 | |||||||||||||||||||||||||||||||||||||
Year ended 12/31/10 | 9.63 | 0.11 | 1.14 | 1.25 | (0.14 | ) | — | (0.14 | ) | 10.74 | 13.00 | 124,102 | 1.61 | 1.61 | 1.09 | 74 | ||||||||||||||||||||||||||||||||||||||||
Year ended 12/31/09 | 7.70 | 0.09 | 2.02 | 2.11 | (0.18 | ) | — | (0.18 | ) | 9.63 | 27.47 | 138,058 | 1.66 | 1.66 | 1.13 | 72 | ||||||||||||||||||||||||||||||||||||||||
Year ended 12/31/08 | 14.81 | 0.15 | (6.67 | ) | (6.52 | ) | (0.03 | ) | (0.56 | ) | (0.59 | ) | 7.70 | (43.90 | ) | 132,058 | 1.54 | 1.54 | 1.22 | 114 | ||||||||||||||||||||||||||||||||||||
Class B |
| |||||||||||||||||||||||||||||||||||||||||||||||||||||||
Year ended 12/31/12 | 9.74 | 0.05 | 1.17 | 1.22 | (0.15 | ) | — | (0.15 | ) | 10.81 | 12.53 | 6,626 | 2.38 | (e) | 2.38 | (e) | 0.46 | (e) | 72 | |||||||||||||||||||||||||||||||||||||
Year ended 12/31/11 | 10.15 | 0.12 | (0.50 | ) | (0.38 | ) | (0.03 | ) | — | (0.03 | ) | 9.74 | (3.74 | ) | 9,313 | 2.31 | 2.31 | 1.16 | 86 | |||||||||||||||||||||||||||||||||||||
Year ended 12/31/10 | 9.09 | 0.03 | 1.08 | 1.11 | (0.05 | ) | — | (0.05 | ) | 10.15 | 12.18 | 14,370 | 2.36 | 2.36 | 0.34 | 74 | ||||||||||||||||||||||||||||||||||||||||
Year ended 12/31/09 | 7.21 | 0.03 | 1.88 | 1.91 | (0.03 | ) | — | (0.03 | ) | 9.09 | 26.50 | 19,741 | 2.41 | 2.41 | 0.38 | 72 | ||||||||||||||||||||||||||||||||||||||||
Year ended 12/31/08 | 14.04 | 0.06 | (6.30 | ) | (6.24 | ) | (0.03 | ) | (0.56 | ) | (0.59 | ) | 7.21 | (44.32 | ) | 22,770 | 2.29 | 2.29 | 0.47 | 114 | ||||||||||||||||||||||||||||||||||||
Class C |
| |||||||||||||||||||||||||||||||||||||||||||||||||||||||
Year ended 12/31/12 | 9.73 | 0.05 | 1.16 | 1.21 | (0.15 | ) | — | (0.15 | ) | 10.79 | 12.44 | 8,864 | 2.38 | (e) | 2.38 | (e) | 0.46 | (e) | 72 | |||||||||||||||||||||||||||||||||||||
Year ended 12/31/11 | 10.13 | 0.12 | (0.49 | ) | (0.37 | ) | (0.03 | ) | — | (0.03 | ) | 9.73 | (3.65 | ) | 9,298 | 2.31 | 2.31 | 1.16 | 86 | |||||||||||||||||||||||||||||||||||||
Year ended 12/31/10 | 9.08 | 0.03 | 1.07 | 1.10 | (0.05 | ) | — | (0.05 | ) | 10.13 | 12.09 | 11,535 | 2.36 | 2.36 | 0.34 | 74 | ||||||||||||||||||||||||||||||||||||||||
Year ended 12/31/09 | 7.20 | 0.03 | 1.88 | 1.91 | (0.03 | ) | — | (0.03 | ) | 9.08 | 26.54 | 13,008 | 2.41 | 2.41 | 0.38 | 72 | ||||||||||||||||||||||||||||||||||||||||
Year ended 12/31/08 | 14.02 | 0.06 | (6.29 | ) | (6.23 | ) | (0.03 | ) | (0.56 | ) | (0.59 | ) | 7.20 | (44.30 | ) | 13,575 | 2.29 | 2.29 | 0.47 | 114 | ||||||||||||||||||||||||||||||||||||
Class R |
| |||||||||||||||||||||||||||||||||||||||||||||||||||||||
Year ended 12/31/12 | 10.30 | 0.11 | 1.23 | 1.34 | (0.23 | ) | — | (0.23 | ) | 11.41 | 13.01 | 931 | 1.88 | (e) | 1.88 | (e) | 0.96 | (e) | 72 | |||||||||||||||||||||||||||||||||||||
Year ended 12/31/11 | 10.74 | 0.18 | (0.52 | ) | (0.34 | ) | (0.10 | ) | — | (0.10 | ) | 10.30 | (3.13 | ) | 888 | 1.81 | 1.81 | 1.66 | 86 | |||||||||||||||||||||||||||||||||||||
Year ended 12/31/10 | 9.63 | 0.08 | 1.14 | 1.22 | (0.11 | ) | — | (0.11 | ) | 10.74 | 12.68 | 1,146 | 1.86 | 1.86 | 0.84 | 74 | ||||||||||||||||||||||||||||||||||||||||
Year ended 12/31/09 | 7.68 | 0.07 | 2.01 | 2.08 | (0.13 | ) | — | (0.13 | ) | 9.63 | 27.14 | 875 | 1.91 | 1.91 | 0.88 | 72 | ||||||||||||||||||||||||||||||||||||||||
Year ended 12/31/08 | 14.81 | 0.11 | (6.65 | ) | (6.54 | ) | (0.03 | ) | (0.56 | ) | (0.59 | ) | 7.68 | (44.03 | ) | 607 | 1.79 | 1.79 | 0.97 | 114 | ||||||||||||||||||||||||||||||||||||
Class Y |
| |||||||||||||||||||||||||||||||||||||||||||||||||||||||
Year ended 12/31/12 | 10.29 | 0.16 | 1.23 | 1.39 | (0.30 | ) | — | (0.30 | ) | 11.38 | 13.55 | 756 | 1.38 | (e) | 1.38 | (e) | 1.46 | (e) | 72 | |||||||||||||||||||||||||||||||||||||
Year ended 12/31/11 | 10.76 | 0.24 | (0.54 | ) | (0.30 | ) | (0.17 | ) | — | (0.17 | ) | 10.29 | (2.76 | ) | 599 | 1.31 | 1.31 | 2.16 | 86 | |||||||||||||||||||||||||||||||||||||
Year ended 12/31/10 | 9.65 | 0.13 | 1.15 | 1.28 | (0.17 | ) | — | (0.17 | ) | 10.76 | 13.27 | 720 | 1.36 | 1.36 | 1.34 | 74 | ||||||||||||||||||||||||||||||||||||||||
Year ended 12/31/09 | 7.71 | 0.12 | 2.01 | 2.13 | (0.19 | ) | — | (0.19 | ) | 9.65 | 27.69 | 662 | 1.41 | 1.41 | 1.38 | 72 | ||||||||||||||||||||||||||||||||||||||||
Year ended 12/31/08(f) | 10.46 | 0.03 | (2.19 | ) | (2.16 | ) | (0.03 | ) | (0.56 | ) | (0.59 | ) | 7.71 | (20.46 | ) | 183 | 1.53 | (g) | 1.53 | (g) | 1.23 | (g) | 114 | |||||||||||||||||||||||||||||||||
Class R5 |
| |||||||||||||||||||||||||||||||||||||||||||||||||||||||
Year ended 12/31/12 | 10.39 | 0.20 | 1.25 | 1.45 | (0.35 | ) | — | (0.35 | ) | 11.49 | 13.96 | 18,609 | 1.06 | (e) | 1.06 | (e) | 1.78 | (e) | 72 | |||||||||||||||||||||||||||||||||||||
Year ended 12/31/11 | 10.88 | 0.28 | (0.54 | ) | (0.26 | ) | (0.23 | ) | — | (0.23 | ) | 10.39 | (2.44 | ) | 16,133 | 0.98 | 0.98 | 2.49 | 86 | |||||||||||||||||||||||||||||||||||||
Year ended 12/31/10 | 9.77 | 0.17 | 1.17 | 1.34 | (0.23 | ) | — | (0.23 | ) | 10.88 | 13.76 | 18,770 | 0.97 | 0.97 | 1.73 | 74 | ||||||||||||||||||||||||||||||||||||||||
Year ended 12/31/09 | 7.81 | 0.16 | 2.06 | 2.22 | (0.26 | ) | — | (0.26 | ) | 9.77 | 28.47 | 18,031 | 0.86 | 0.86 | 1.93 | 72 | ||||||||||||||||||||||||||||||||||||||||
Year ended 12/31/08 | 14.94 | 0.22 | (6.76 | ) | (6.54 | ) | (0.03 | ) | (0.56 | ) | (0.59 | ) | 7.81 | (43.64 | ) | 12,864 | 1.07 | 1.07 | 1.69 | 114 | ||||||||||||||||||||||||||||||||||||
| (a) | Calculated using average shares outstanding. |
| (b) | Includes redemption fees added to shares of beneficial interest which were less than $0.005 per share for the years ended prior to January 1, 2012. |
| (c) | Includes adjustments in accordance with accounting principles generally accepted in the United States of America and as such, the net asset value for financial reporting purposes and the returns based upon those net asset values may differ from the net asset value and returns for shareholder transactions. Does not include sales charges and is not annualized for periods less than one year, if applicable. |
| (d) | Portfolio turnover is calculated at the fund level and is not annualized for periods less than one year, if applicable. |
| (e) | Ratios are based on average daily net assets (000’s omitted) of $98,105, $7,887, $9,140, $920, $652 and $17,598 for Class A, Class B, Class C, Class R, Class Y and Class R5 shares, respectively. |
| (f) | Commencement date of October 3, 2008. |
| (g) | Annualized. |
21 Invesco Global Quantitative Core Fund
Report of Independent Registered Public Accounting Firm
To the Board of Trustees of AIM Growth Series (Invesco Growth Series)
and Shareholders of Invesco Global Quantitative Core Fund:
In our opinion, the accompanying statement of assets and liabilities, including the schedule of investments, and the related statements of operations and of changes in net assets and the financial highlights present fairly, in all material respects, the financial position of Invesco Global Quantitative Core Fund, (formerly known as Invesco Global Equity Fund; one of the funds constituting AIM Growth Series (Invesco Growth Series), hereafter referred to as the “Fund”) at December 31, 2012, the results of its operations for the year then ended, the changes in its net assets for each of the two years in the period then ended and the financial highlights for each of the five years in the period then ended, in conformity with accounting principles generally accepted in the United States of America. These financial statements and financial highlights (hereafter referred to as “financial statements”) are the responsibility of the Fund’s management; our responsibility is to express an opinion on these financial statements based on our audits. We conducted our audits of these financial statements in accordance with the standards of the Public Company Accounting Oversight Board (United States). Those standards require that we plan and perform the audit to obtain reasonable assurance about whether the financial statements are free of material misstatement. An audit includes examining, on a test basis, evidence supporting the amounts and disclosures in the financial statements, assessing the accounting principles used and significant estimates made by management, and evaluating the overall financial statement presentation. We believe that our audits, which included confirmation of securities at December 31, 2012 by correspondence with the custodian and brokers, provide a reasonable basis for our opinion.
PRICEWATERHOUSECOOPERS LLP
February 25, 2013
Houston, Texas
22 Invesco Global Quantitative Core Fund
Calculating your ongoing Fund expenses
Example
As a shareholder of the Fund, you incur two types of costs: (1) transaction costs, which may include sales charges (loads) on purchase payments or contingent deferred sales charges on redemptions, and redemption fees, if any; and (2) ongoing costs, including management fees, distribution and/or service (12b-1) fees, and other Fund expenses. This example is intended to help you understand your ongoing costs (in dollars) of investing in the Fund and to compare these costs with ongoing costs of investing in other mutual funds. The example is based on an investment of $1,000 invested at the beginning of the period and held for the entire period July 1, 2012 through December 31, 2012.
Actual expenses
The table below provides information about actual account values and actual expenses. You may use the information in this table, together with the amount you invested, to estimate the expenses that you paid over the period. Simply divide your account value by $1,000 (for example, an $8,600 account value divided by $1,000 = 8.6), then multiply the result by the number in the table under the heading entitled “Actual Expenses Paid During Period” to estimate the expenses you paid on your account during this period.
Hypothetical example for comparison purposes
The table below also provides information about hypothetical account values and hypothetical expenses based on the Fund’s actual expense ratio and an assumed rate of return of 5% per year before expenses, which is not the Fund’s actual return.
The hypothetical account values and expenses may not be used to estimate the actual ending account balance or expenses you paid for the period. You may use this information to compare the ongoing costs of investing in the Fund and other funds. To do so, compare this 5% hypothetical example with the 5% hypothetical examples that appear in the shareholder reports of the other funds.
Please note that the expenses shown in the table are meant to highlight your ongoing costs only and do not reflect any transaction costs, such as sales charges (loads) on purchase payments, contingent deferred sales charges on redemptions, and redemption fees, if any. Therefore, the hypothetical information is useful in comparing ongoing costs only, and will not help you determine the relative total costs of owning different funds. In addition, if these transaction costs were included, your costs would have been higher.
| Class | Beginning Account Value (07/01/12) | ACTUAL | HYPOTHETICAL (5% annual return before | Annualized Expense Ratio | ||||||||||||||||||||
| Ending Account Value (12/31/12)1 | Expenses Paid During Period2 | Ending Account Value (12/31/12) | Expenses Paid During Period2 | |||||||||||||||||||||
A | 1,000.00 | $ | 1,084.70 | $ | 8.60 | $ | 1,016.88 | $ | 8.32 | 1.64 | % | |||||||||||||
B | 1,000.00 | 1,079.90 | 12.51 | 1,013.11 | 12.10 | 2.39 | ||||||||||||||||||
C | 1,000.00 | 1,080.00 | 12.51 | 1,013.11 | 12.10 | 2.39 | ||||||||||||||||||
R | 1,000.00 | 1,082.80 | 9.91 | 1,015.62 | 9.59 | 1.89 | ||||||||||||||||||
Y | 1,000.00 | 1,084.90 | 7.30 | 1,018.14 | 7.06 | 1.39 | ||||||||||||||||||
R5 | 1,000.00 | 1,086.30 | 5.78 | 1,019.60 | 5.59 | 1.10 | ||||||||||||||||||
| 1 | The actual ending account value is based on the actual total return of the Fund for the period July 1, 2012 through December 31, 2012, after actual expenses and will differ from the hypothetical ending account value which is based on the Fund’s expense ratio and a hypothetical annual return of 5% before expenses. |
| 2 | Expenses are equal to the Fund’s annualized expense ratio as indicated above multiplied by the average account value over the period, multiplied by 184/366 to reflect the most recent fiscal half year. |
23 Invesco Global Quantitative Core Fund
Tax Information
Form 1099-DIV, Form 1042-S and other year–end tax information provide shareholders with actual calendar year amounts that should be included in their tax returns. Shareholders should consult their tax advisors.
The following distribution information is being provided as required by the Internal Revenue Code or to meet a specific state’s requirement.
The Fund designates the following amounts or, if subsequently determined to be different, the maximum amount allowable for its fiscal year ended December 31, 2012:
Federal and State Income Tax | ||||
Qualified Dividend Income* | 100.00 | % | ||
Corporate Dividends Received Deduction* | 28.82 | % | ||
| * | The above percentages are based on ordinary income dividends paid to shareholders during the Fund’s fiscal year. |
24 Invesco Global Quantitative Core Fund
Trustees and Officers
The address of each trustee and officer is AIM Growth Series (Invesco Growth Series) (the “Trust”), 11 Greenway Plaza, Suite 1000, Houston, Texas 77046-1173. The trustees serve for the life of the Trust, subject to their earlier death, incapacitation, resignation, retirement or removal as more specifically provided in the Trust’s organizational documents. Each officer serves for a one year term or until their successors are elected and qualified. Column two below includes length of time served with predecessor entities, if any.
| Name, Year of Birth and Position(s) Held with the Trust | Trustee and/ or Officer Since | Principal Occupation(s) During Past 5 Years | Number of Funds in Fund Complex Overseen by Trustee | Other Directorship(s) Held by Trustee During Past 5 Years | ||||
| Interested Persons | ||||||||
| Martin L. Flanagan1 — 1960 Trustee | 2007 | Executive Director, Chief Executive Officer and President, Invesco Ltd. (ultimate parent of Invesco and a global investment management firm); Advisor to the Board, Invesco Advisers, Inc. (formerly known as Invesco Institutional (N.A.), Inc.); Trustee, The Invesco Funds; Vice Chair, Investment Company Institute; and Member of Executive Board, SMU Cox School of Business
Formerly: Chairman and Chief Executive Officer, Invesco Advisers, Inc. (registered investment adviser); Director, Chairman, Chief Executive Officer and President, IVZ Inc. (holding company), INVESCO Group Services, Inc. (service provider) and Invesco North American Holdings, Inc. (holding company); Director, Chief Executive Officer and President, Invesco Holding Company Limited (parent of Invesco and a global investment management firm); Director, Invesco Ltd.; Chairman, Investment Company Institute and President, Co-Chief Executive Officer, Co-President, Chief Operating Officer and Chief Financial Officer, Franklin Resources, Inc. (global investment management organization) | 124 | None | ||||
Philip A. Taylor2 — 1954 Trustee, President and Principal Executive Officer | 2006 | Head of North American Retail and Senior Managing Director, Invesco Ltd.; Director, Co-Chairman, Co-President and Co-Chief Executive Officer, Invesco Advisers, Inc. (formerly known as Invesco Institutional (N.A.), Inc.) (registered investment adviser); Director, Chairman, Chief Executive Officer and President, Invesco Management Group, Inc. (formerly known as Invesco Aim Management Group, Inc.) (financial services holding company); Director and President, INVESCO Funds Group, Inc. (registered investment adviser and registered transfer agent); Director and Chairman, Invesco Investment Services, Inc. (formerly known as Invesco Aim Investment Services, Inc.) (registered transfer agent) and IVZ Distributors, Inc. (formerly known as INVESCO Distributors, Inc.) (registered broker dealer); Director, President and Chairman, Invesco Inc. (holding company) and Invesco Canada Holdings Inc. (holding company); Chief Executive Officer, Invesco Corporate Class Inc. (corporate mutual fund company) and Invesco Canada Fund Inc. (corporate mutual fund company); Director, Chairman and Chief Executive Officer, Invesco Canada Ltd. (formerly known as Invesco Trimark Ltd./Invesco Trimark Ltèe) (registered investment adviser and registered transfer agent); Trustee, President and Principal Executive Officer, The Invesco Funds (other than AIM Treasurer’s Series Trust (Invesco Treasurer’s Series Trust) and Short-Term Investments Trust); Trustee and Executive Vice President, The Invesco Funds (AIM Treasurer’s Series Trust (Invesco Treasurer’s Series Trust) and Short-Term Investments Trust only); Director, Invesco Investment Advisers LLC (formerly known as Van Kampen Asset Management); Director, Chief Executive Officer and President, Van Kampen Exchange Corp.
Formerly: Director and Chairman, Van Kampen Investor Services Inc.: Director, Chief Executive Officer and President, 1371 Preferred Inc. (holding company); and Van Kampen Investments Inc.; Director and President, AIM GP Canada Inc. (general partner for limited partnerships); and Van Kampen Advisors, Inc.; Director and Chief Executive Officer, Invesco Trimark Dealer Inc. (registered broker dealer); Director, Invesco Distributors, Inc. (formerly known as Invesco Aim Distributors, Inc.) (registered broker dealer); Manager, Invesco PowerShares Capital Management LLC; Director, Chief Executive Officer and President, Invesco Advisers, Inc.; Director, Chairman, Chief Executive Officer and President, Invesco Aim Capital Management, Inc.; President, Invesco Trimark Dealer Inc. and Invesco Trimark Ltd./Invesco Trimark Ltèe; Director and President, AIM Trimark Corporate Class Inc. and AIM Trimark Canada Fund Inc.; Senior Managing Director, Invesco Holding Company Limited; Trustee and Executive Vice President, Tax-Free Investments Trust; Director and Chairman, Fund Management Company (former registered broker dealer); President and Principal Executive Officer, The Invesco Funds (AIM Treasurer’s Series Trust (Invesco Treasurer’s Series Trust), Short-Term Investments Trust and Tax-Free Investments Trust only); President, AIM Trimark Global Fund Inc. and AIM Trimark Canada Fund Inc. | 124 | None | ||||
Wayne W. Whalen3 — 1939 Trustee | 2010 | Of Counsel, and prior to 2010, partner in the law firm of Skadden, Arps, Slate, Meagher & Flom LLP, legal counsel to certain funds in the Fund Complex
| 137 | Director of the Mutual Fund Directors Forum, a nonprofit membership organization for investment directors; Chairman and Director of the Abraham Lincoln Presidential Library Foundation; and Director of the Stevenson Center for Democracy |
| 1 | Mr. Flanagan is considered an interested person of the Trust because he is an officer of the adviser to the Trust, and an officer and a director of Invesco Ltd., ultimate parent of the adviser to the Trust. |
| 2 | Mr. Taylor is considered an interested person of the Trust because he is an officer and a director of the adviser to, and a director of the principal underwriter of, the Trust. |
| 3 | Mr. Whalen is considered an “interested person” (within the meaning of Section 2(a)(19) of the 1940 Act) of certain Funds in the Invesco Fund Complex by reason of he and his firm currently providing legal services as legal counsel to such Funds in the Invesco Fund Complex. |
T-1 Invesco Global Quantitative Core Fund
Trustees and Officers—(continued)
| Name, Year of Birth and Position(s) Held with the Trust | Trustee and/ or Officer Since | Principal Occupation(s) During Past 5 Years | Number of Funds in Fund Complex Overseen by Trustee | Other Directorship(s) Held by Trustee During Past 5 Years | ||||
| Independent Trustees | ||||||||
Bruce L. Crockett — 1944 Trustee and Chair | 2001 | Chairman, Crockett Technologies Associates (technology consulting company)
Formerly: Director, Captaris (unified messaging provider); Director, President and Chief Executive Officer COMSAT Corporation; and Chairman, Board of Governors of INTELSAT (international communications company) | 124 | ACE Limited (insurance company); and Investment Company Institute | ||||
David C. Arch — 1945 Trustee | 2010 | Chairman and Chief Executive Officer of Blistex Inc., (consumer health care products manufacturer)
Formerly: Member of the Heartland Alliance Advisory Board, a nonprofit organization serving human needs based in Chicago | 137 | Board member of the Illinois Manufacturers’ Association; Member of the Board of Visitors, Institute for the Humanities, University of Michigan | ||||
Frank S. Bayley — 1939 Trustee | 1985 | Retired
Formerly: Director, Badgley Funds, Inc. (registered investment company) (2 portfolios) and General Partner and Of Counsel, law firm of Baker & McKenzie, LLP | 124 | Director and Chairman, C.D. Stimson Company (a real estate investment company); Trustee and Overseer, The Curtis institute of Music | ||||
James T. Bunch — 1942 Trustee | 2003 | Managing Member, Grumman Hill Group LLC (family office private equity management)
Formerly: Founder, Green, Manning & Bunch Ltd. (investment banking firm)(1988-2010); Executive Committee, United States Golf Association; and Director, Policy Studies, Inc. and Van Gilder Insurance Corporation | 124 | Chairman, Board of Governors, Western Golf Association; Chairman-elect, Evans Scholars Foundation; and Director, Denver Film Society | ||||
Rodney F. Dammeyer — 1940 Trustee | 2010 | Chairman of CAC, LLC, (private company offering capital investment and management advisory services)
Formerly: Prior to 2001, Managing Partner at Equity Group Corporate Investments; Prior to 1995, Vice Chairman of Anixter International; Prior to 1985, experience includes Senior Vice President and Chief Financial Officer of Household International, Inc., Executive Vice President and Chief Financial Officer of Northwest Industries, Inc. and Partner of Arthur Andersen & Co.; From 1987 to 2010, Director/Trustee of investment companies in the Van Kampen Funds complex | 126 | Director of Quidel Corporation and Stericycle, Inc.; Prior to May 2008, Trustee of The Scripps Research Institute; Prior to February 2008, Director of Ventana Medical Systems, Inc.; Prior to April 2007, Director of GATX Corporation; Prior to April 2004, Director of TheraSense, Inc. | ||||
Albert R. Dowden — 1941 Trustee | 2001 | Director of a number of public and private business corporations, including the Boss Group, Ltd. (private investment and management); Reich & Tang Funds (5 portfolios) (registered investment company); and Homeowners of America Holding Corporation/ Homeowners of America Insurance Company (property casualty company)
Formerly: Director, Continental Energy Services, LLC (oil and gas pipeline service); Director, CompuDyne Corporation (provider of product and services to the public security market) and Director, Annuity and Life Re (Holdings), Ltd. (reinsurance company); Director, President and Chief Executive Officer, Volvo Group North America, Inc.; Senior Vice President, AB Volvo; Director of various public and private corporations; Chairman, DHJ Media, Inc.; Director Magellan Insurance Company; and Director, The Hertz Corporation, Genmar Corporation (boat manufacturer), National Media Corporation; Advisory Board of Rotary Power International (designer, manufacturer, and seller of rotary power engines); and Chairman, Cortland Trust, Inc. (registered investment company) | 124 | Director of Nature’s Sunshine Products, Inc. | ||||
Jack M. Fields — 1952 Trustee | 2001 | Chief Executive Officer, Twenty First Century Group, Inc. (government affairs company); Owner and Chief Executive Officer, Dos Angeles Ranch, L.P. (cattle, hunting, corporate entertainment); and Discovery Global Education Fund (non-profit)
Formerly: Chief Executive Officer, Texana Timber LP (sustainable forestry company); Director of Cross Timbers Quail Research Ranch (non-profit); and member of the U.S. House of Representatives | 124 | Insperity, Inc. (formerly known as Administaff) | ||||
Prema Mathai-Davis — 1950 Trustee | 2001 | Retired
Formerly: Chief Executive Officer, YWCA of the U.S.A. | 124 | None | ||||
Larry Soll — 1942 Trustee | 2003 | Retired
Formerly: Chairman, Chief Executive Officer and President, Synergen Corp. (a biotechnology company) | 124 | None | ||||
Hugo F. Sonnenschein — 1940 Trustee | 2010 | Distinguished Service Professor and President Emeritus of the University of Chicago and the Adam Smith Distinguished Service Professor in the Department of Economics at the University of Chicago
Formerly: President of the University of Chicago | 137 | Trustee of the University of Rochester and a member of its investment committee. Member of the National Academy of Sciences, the American Philosophical Society and a fellow of the American Academy of Arts and Sciences |
T-2 Invesco Global Quantitative Core Fund
Trustees and Officers—(continued)
| Name, Year of Birth and Position(s) Held with the Trust | Trustee and/ or Officer Since | Principal Occupation(s) During Past 5 Years | Number of Funds in Fund Complex Overseen by Trustee | Other Directorship(s) Held by Trustee During Past 5 Years | ||||
| Independent Trustees—(continued) | ||||||||
Raymond Stickel, Jr. — 1944 Trustee | 2005 | Retired
Formerly: Director, Mainstay VP Series Funds, Inc. (25 portfolios) and Partner, Deloitte & Touche | 124 | None | ||||
| Other Officers | ||||||||
| Russell C. Burk — 1958 Senior Vice President and Senior Officer | 2005 | Senior Vice President and Senior Officer, The Invesco Funds | N/A | N/A | ||||
| John M. Zerr — 1962 Senior Vice President, Chief Legal Officer and Secretary | 2006 | Director, Senior Vice President, Secretary and General Counsel, Invesco Management Group, Inc. (formerly known as Invesco Aim Management Group, Inc.) and Van Kampen Exchange Corp.; Senior Vice President, Invesco Advisers, Inc. (formerly known as Invesco Institutional (N.A.), Inc.) (registered investment adviser); Senior Vice President and Secretary, Invesco Distributors, Inc. (formerly known as Invesco Aim Distributors, Inc.); Director, Vice President and Secretary, Invesco Investment Services, Inc. (formerly known as Invesco Aim Investment Services, Inc.) and IVZ Distributors, Inc. (formerly known as INVESCO Distributors, Inc.); Director and Vice President, INVESCO Funds Group, Inc.; Senior Vice President, Chief Legal Officer and Secretary, The Invesco Funds; Manager, Invesco PowerShares Capital Management LLC; Director, Secretary and General Counsel, Invesco Investment Advisers LLC (formerly known as Van Kampen Asset Management); Secretary and General Counsel, Van Kampen Funds Inc. and Chief Legal Officer, PowerShares Exchange-Traded Fund Trust, PowerShares Exchange-Traded Fund Trust II, PowerShares India Exchange-Traded Fund Trust and PowerShares Actively Managed Exchange-Traded Fund Trust
Formerly: Director and Vice President, Van Kampen Advisors Inc.; Director, Vice President, Secretary and General Counsel Van Kampen Investor Services Inc.; Director, Invesco Distributors, Inc. (formerly known as Invesco Aim Distributors, Inc.); Director, Senior Vice President, General Counsel and Secretary, Invesco Advisers, Inc. and Van Kampen Investments Inc.; Director, Vice President and Secretary, Fund Management Company; Director, Senior Vice President, Secretary, General Counsel and Vice President, Invesco Aim Capital Management, Inc.; Chief Operating Officer and General Counsel, Liberty Ridge Capital, Inc. (an investment adviser); Vice President and Secretary, PBHG Funds (an investment company) and PBHG Insurance Series Fund (an investment company); Chief Operating Officer, General Counsel and Secretary, Old Mutual Investment Partners (a broker-dealer); General Counsel and Secretary, Old Mutual Fund Services (an administrator) and Old Mutual Shareholder Services (a shareholder servicing center); Executive Vice President, General Counsel and Secretary, Old Mutual Capital, Inc. (an investment adviser); and Vice President and Secretary, Old Mutual Advisors Funds (an investment company) | N/A | N/A | ||||
| Karen Dunn Kelley — 1960 Vice President | 2004 | Head of Invesco’s World Wide Fixed Income and Cash Management Group; Senior Vice President, Invesco Management Group, Inc. (formerly known as Invesco Aim Management Group, Inc.) and Invesco Advisers, Inc. (formerly known as Invesco Institutional (N.A.), Inc.) (registered investment adviser); Executive Vice President, Invesco Distributors, Inc. (formerly known as Invesco Aim Distributors, Inc.); Director, Invesco Mortgage Capital Inc., INVESCO Global Asset Management Limited, Invesco Management Company Limited and INVESCO Management S.A.; Vice President, The Invesco Funds (other than AIM Treasurer’s Series Trust (Invesco Treasurer’s Series Trust) and Short-Term Investments Trust); and President and Principal Executive Officer, The Invesco Funds (AIM Treasurer’s Series Trust (Invesco Treasurer’s Series Trust) and Short-Term Investments Trust only)
Formerly: Senior Vice President, Van Kampen Investments Inc.; Vice President, Invesco Advisers, Inc. (formerly known as Invesco Institutional (N.A.), Inc.); Director of Cash Management and Senior Vice President, Invesco Advisers, Inc. and Invesco Aim Capital Management, Inc.; President and Principal Executive Officer, Tax-Free Investments Trust; Director and President, Fund Management Company; Chief Cash Management Officer, Director of Cash Management, Senior Vice President, and Managing Director, Invesco Aim Capital Management, Inc.; Director of Cash Management, Senior Vice President, and Vice President, Invesco Advisers, Inc. and The Invesco Funds (AIM Treasurer’s Series Trust (Invesco Treasurer’s Series Trust), Short-Term Investments Trust and Tax-Free Investments Trust only) | N/A | N/A | ||||
T-3 Invesco Global Quantitative Core Fund
Trustees and Officers—(continued)
| Name, Year of Birth and Position(s) Held with the Trust | Trustee and/ or Officer Since | Principal Occupation(s) During Past 5 Years | Number of Funds in Fund Complex Overseen by Trustee | Other Directorship(s) Held by Trustee During Past 5 Years | ||||
| Other Officers—(continued) | ||||||||
| Sheri Morris — 1964 Vice President, Treasurer and Principal Financial Officer | 1999 | Vice President, Treasurer and Principal Financial Officer, The Invesco Funds; Vice President, Invesco Advisers, Inc. (formerly known as Invesco Institutional (N.A.), Inc.) (registered investment adviser); and Vice President, PowerShares Exchange-Traded Fund Trust, PowerShares Exchange-Traded Fund Trust II, PowerShares India Exchange-Traded Fund Trust and PowerShares Actively Managed Exchange-Traded Fund Trust
Formerly: Vice President, Invesco Aim Advisers, Inc., Invesco Aim Capital Management, Inc. and Invesco Aim Private Asset Management, Inc.; Assistant Vice President and Assistant Treasurer, The Invesco Funds and Assistant Vice President, Invesco Advisers, Inc., Invesco Aim Capital Management, Inc. and Invesco Aim Private Asset Management, Inc.; and Treasurer, PowerShares Exchange-Traded Fund Trust, PowerShares Exchange-Traded Fund Trust II, PowerShares India Exchange-Traded Fund Trust and PowerShares Actively Managed Exchange-Traded Fund Trust | N/A | N/A | ||||
Yinka Akinsola — 1977 Anti-Money Laundering Compliance Officer | 2011 | Anti-Money Laundering Compliance Officer, Invesco Advisers, Inc. (formerly known as Invesco Institutional (N.A.), Inc.) (registered investment adviser); Invesco Distributors, Inc. (formerly known as Invesco Aim Distributors, Inc.), Invesco Investment Services, Inc. (formerly known as Invesco Aim Investment Services, Inc.), Invesco Management Group, Inc., The Invesco Funds, Invesco Van Kampen Closed-End Funds, Van Kampen Exchange Corp., Van Kampen Funds Inc., PowerShares Exchange-Traded Fund Trust, PowerShares Exchange-Traded Fund Trust II, PowerShares India Exchange-Traded Fund Trust, and PowerShares Actively Managed Exchange-Traded Fund Trust
Formerly: Regulatory Analyst III, Financial Industry Regulatory Authority (FINRA) | N/A | N/A | ||||
| Todd L. Spillane — 1958 Chief Compliance Officer | 2006 | Senior Vice President, Invesco Management Group, Inc. (formerly known as Invesco Aim Management Group, Inc.) and Van Kampen Exchange Corp.; Senior Vice President and Chief Compliance Officer, Invesco Advisers, Inc. (registered investment adviser) (formerly known as Invesco Institutional (N.A.), Inc.); Chief Compliance Officer, The Invesco Funds; Vice President, Invesco Distributors, Inc. (formerly known as Invesco Aim Distributors, Inc.) and Invesco Investment Services, Inc. (formerly known as Invesco Aim Investment Services, Inc.)
Formerly: Chief Compliance Officer, Invesco Van Kampen Closed-End Funds; Senior Vice President, Van Kampen Investments Inc.; Senior Vice President and Chief Compliance Officer, Invesco Aim Advisers, Inc. and Invesco Aim Capital Management, Inc.; Chief Compliance Officer, INVESCO Private Capital Investments, Inc. (holding company), Invesco Private Capital, Inc. (registered investment adviser), Invesco Global Asset Management (N.A.), Inc., Invesco Senior Secured Management, Inc. (registered investment adviser), Van Kampen Investor Services Inc., PowerShares Exchange-Traded Fund Trust, PowerShares Exchange-Traded Fund Trust II, PowerShares India Exchange-Traded Fund Trust and PowerShares Actively Managed Exchange-Traded Fund Trust; and Vice President, Invesco Aim Capital Management, Inc. and Fund Management Company | N/A | N/A |
The Statement of Additional Information of the Trust includes additional information about the Fund’s Trustees and is available upon request, without charge, by calling 1.800.959.4246. Please refer to the Fund’s prospectus for information on the Fund’s sub-advisers.
Office of the Fund 11 Greenway Plaza, Suite 1000 Houston, TX 77046-1173 | Investment Adviser Invesco Advisers, Inc. 1555 Peachtree Street, N.E. Atlanta, GA 30309 | Distributor Invesco Distributors, Inc. 11 Greenway Plaza, Suite 1000 Houston, TX 77046-1173 | Auditors PricewaterhouseCoopers LLP 1201 Louisiana Street, Suite 2900 Houston, TX 77002-5678 | |||
Counsel to the Fund Stradley Ronon Stevens & Young, LLP 2005 Market Street, Suite 2600 Philadelphia, PA 19103-7018 | Counsel to the Independent Trustees Goodwin Procter LLP 901 New York Avenue, N.W. | Transfer Agent Invesco Investment Services, Inc. 11 Greenway Plaza, Suite 1000 Houston, TX 77046-1173 | Custodian State Street Bank and Trust Company 225 Franklin Street Boston, MA 02110-2801 | |||
T-4 Invesco Global Quantitative Core Fund

Invesco mailing information
Send general correspondence to Invesco Investment Services, Inc., P.O. Box 219078, Kansas City, MO 64121-9078.
Invesco privacy policy
You share personal and financial information with us that is necessary for your transactions and your account records. We take very seriously the obligation to keep that information confidential and private.
Invesco collects nonpublic personal information about you from account applications or other forms you complete and from your transactions with us or our affiliates. We do not disclose information about you or our former customers to service providers or other third parties except to the extent necessary to service your account and in other limited circumstances as permitted by law. For example, we use this information to facilitate the delivery of transaction confirmations, financial reports, prospectuses and tax forms.
Even within Invesco, only people involved in the servicing of your accounts and compliance monitoring have access to your information. To ensure the highest level of confidentiality and security, Invesco maintains physical, electronic and procedural safeguards that meet or exceed federal standards. Special measures, such as data encryption and authentication, apply to your communications with us on our website. More detail is available to you at invesco.com/privacy.
Important notice regarding delivery of security holder documents
To reduce Fund expenses, only one copy of most shareholder documents may be mailed to shareholders with multiple accounts at the same address (Householding). Mailing of your shareholder documents may be householded indefinitely unless you instruct us otherwise. If you do not want the mailing of these documents to be combined with those for other members of your household, please contact Invesco Investment Services, Inc. at 800 959 4246 or contact your financial institution. We will begin sending you individual copies for each account within 30 days after receiving your request.
Fund holdings and proxy voting information
The Fund provides a complete list of its holdings four times in each fiscal year, at the quarter-ends. For the second and fourth quarters, the lists appear in the Fund’s semiannual and annual reports to shareholders. For the first and third quarters, the Fund files the lists with the Securities and Exchange Commission (SEC) on Form N-Q. The most recent list of portfolio holdings is available at invesco.com/completeqtrholdings. Shareholders can also look up the Fund’s Forms N-Q on the SEC website at sec.gov. Copies of the Fund’s Forms N-Q may be reviewed and copied at the SEC Public Reference Room in Washington, D.C. You can obtain information on the operation of the Public Reference Room, including information about duplicating fee charges, by calling 202 551 8090 or 800 732 0330, or by electronic request at the following email address: publicinfo@sec.gov. The SEC file numbers for the Fund are shown below.
A description of the policies and procedures that the Fund uses to determine how to vote proxies relating to portfolio securities is available without charge, upon request, from our Client Services department at 800 959 4246 or at invesco.com/proxyguidelines. The information is also available on the SEC website, sec.gov.
Information regarding how the Fund voted proxies related to its portfolio securities during the 12 months ended June 30, 2012, is available at invesco.com/proxysearch. The information is also available on the SEC website, sec.gov. Invesco Advisers, Inc. is an investment adviser; it provides investment advisory services to individual and institutional clients and does not sell securities. Invesco Distributors, Inc. is the US distributor for Invesco Ltd.’s retail mutual funds, exchange-traded funds and institutional money market funds. Both are wholly owned, indirect subsidiaries of Invesco Ltd. |  |
SEC file numbers: 811-02699 and 002-57526 GQC-AR-1 Invesco Distributors, Inc.
| ||||
 | Annual Report to Shareholders
| December 31, 2012 | ||
| ||||
| Invesco Income Allocation Fund | ||||
Nasdaq: | ||||
| A: ALAAX ¡ B: BLIAX ¡ C: CLIAX ¡ R: RLIAX ¡ Y: ALAYX ¡ R5: ILAAX | ||||

Letters to Shareholders
Philip Taylor | Dear Shareholders: This annual report contains information about your Fund and the factors that affected its performance during the reporting period. Inside, you’ll find a discussion from your portfolio managers about how they managed your Fund, performance data for your Fund, a complete list of your Fund’s investments as of the close of the reporting period and other important information. I hope you find this report of interest. The reporting period covered by this report was challenging. As the year began, investors cheered generally positive economic indicators, and markets generally rose. Soon, however, US economic data turned mixed and investors’ attention shifted to the efforts of eurozone governments to implement new policies intended to reduce debt levels, strengthen the banking system and stimulate economic growth. Later in the year, in the US, mixed economic data, | ||||||||

competing proposals on how to reduce the federal budget deficit and a contentious presidential contest increased investor uncertainty and hindered market performance. Throughout the year, your Fund’s portfolio managers adhered to their long-term investment strategies, and later in this report they explain why your Fund performed as it did during the reporting period.
Adhering to your long-term investment plan can be difficult, particularly during periods of market volatility and economic uncertainty. That’s one reason Invesco suggests investors work with a skilled and trusted financial adviser who is familiar with their financial situation, investment goals and risk tolerance. A good financial adviser can provide insight and perspective when markets are volatile; motivation and reassurance when times are uncertain; and advice and recommendations when your financial situation or investment goals change.
Timely insight and information from many of Invesco’s investment professionals is available at our website, invesco.com/us. We offer in-depth articles, video clips and audio commentaries from many of our portfolio managers and other investment professionals on a wide range of topics of interest to investors. At invesco.com/us, you also can access information about your Invesco account at any time.
What we mean by Intentional Investing
At Invesco, all of our people and all of our resources are dedicated to helping investors achieve their financial objectives. It’s a philosophy we call Intentional Investing®, and it guides the way we:
| n | Manage investments – Our dedicated investment professionals search the world for the best opportunities, and each investment team follows a clear, disciplined process to build portfolios and mitigate risk. |
| n | Provide choices – We offer equity, fixed income, asset allocation and alternative strategies so you and your financial adviser can build an investment portfolio designed for your individual needs and goals. |
| n | Connect with you – We’re committed to giving you the expert insights you need to make informed investing decisions, and we are well-equipped to provide high-quality support for investors and advisers. |
Invesco believes in putting investors first, and that’s why investment management is all we do. Our sole focus on managing your money allows your financial adviser to build a portfolio of Invesco funds appropriate for your investment needs and goals now and when your circumstances change.
Have a question?
If you have a question about your account, please contact an Invesco client services representative at 800 9594 246. If you have an Invesco-related question or comment, feel free to email me directly at phil@invesco.com.
All of us at Invesco look forward to serving your investment management needs for many years to come. Thank you for investing with us.
Sincerely,

Philip Taylor
Senior Managing Director, Invesco Ltd.
2 Invesco Income Allocation Fund
Bruce Crockett | Dear Fellow Shareholders: While short-term challenges for the financial markets regularly come and go, it’s clear that significant and longer term economic obstacles remain both here at home and abroad. There appear to be no easy solutions to many of these issues. As a result, the financial markets have had little conviction to respond to what has been slow, yet noticeable improvement in some economic benchmarks in recent months. No one likes uncertainty, especially financial markets. But even in these uncertain times, it appears that investors are still approaching the market with cautious optimism, with some taking on more risk in order to refocus on their long-term savings goals. Maybe this describes you, or perhaps you have been sitting on the sidelines thinking about getting back into the market, but are still a bit hesitant to act because of market uncertainty. | ||||||||

Clearly, risk remains a primary focus for investors of all types. As Trustees of the Invesco Funds, one of our primary responsibilities is to ensure your fund’s adviser is cognizant of the risks in each of the funds it manages. A thoughtful risk management plan may help investors navigate through market turbulence or an economic downturn. This is why we make risk management a critical element of our annual contract renewal process, like the one we complete with Invesco every year.
To be sure, there will always be risks involved with investing, but you shouldn’t let short-term news or your emotions dictate your investments. Because no one can predict with 100% accuracy the movements of financial markets, I strongly encourage you to speak with a professional financial adviser who can assist you in building an investment portfolio that reflects your individual risk tolerance and is designed to help achieve your individual financial objectives.
You can be sure your Board remains committed to doing its part in helping you along the way. In addition to ensuring that your fund’s adviser is focused on the risks in the funds it manages, we also remain committed to managing fund costs and working with your fund’s adviser to provide a compelling and diversified product offering to potentially meet your investing goals.
In that regard, your Board approved a number of fund mergers and the launch of several new funds, including the first Invesco mutual fund available to US retail investors managed by investment professionals at Invesco Perpetual*, one of the largest independent investment managers in the UK.
Let me close by thanking Carl Frischling upon his retirement from the Invesco Funds Board for his 35 years of distinguished service and unwavering commitment to our funds’ shareholders. As always, please contact me at bruce@brucecrockett.com with any questions or concerns you may have.
On behalf of the Board, we look forward to continuing to represent your interests and serving your investment needs.
Sincerely,

Bruce L. Crockett
Independent Chair
Invesco Funds Board of Trustees
| * | Invesco Perpetual is a business name of Invesco Asset Management Limited (IAML), a registered investment adviser. IAML is a wholly owned, indirect subsidiary of Invesco Ltd. |
3 Invesco Income Allocation Fund
Management’s Discussion of Fund Performance
Performance summary
For the year ended December 31, 2012, Invesco Income Allocation Fund, at net asset value (NAV), outperformed its custom style-specific benchmark. In all, positive absolute performance from global developed market equities drove results throughout the year. Government bonds produced positive absolute returns serving as a safe haven asset during periods of heightened volatility, particularly in April and May of 2012.
Your Fund’s long-term performance appears later in this report.
Fund vs. Indexes
Total returns, 12/31/11 to 12/31/12, at net asset value (NAV). Performance shown does not include applicable contingent deferred sales charges (CDSC) or front-end sales charges, which would have reduced performance.
| Class A Shares | 11.83 | % | |||
| Class B Shares | 11.10 | ||||
| Class C Shares | 10.98 | ||||
| Class R Shares | 11.55 | ||||
| Class Y Shares | 12.12 | ||||
| Class R5 Shares* | 12.12 | ||||
| S&P 500 Index‚ (Broad Market Index) | 16.00 | ||||
| Custom Income Allocation Indexn (Style-Specific Index) | 9.77 | ||||
| Lipper Mixed-Asset Target Allocation Conservative Funds Index¨ (Peer Group Index) | 8.92 |
Source (s): ‚Invesco, S&P-Dow Jones via FactSet Research Systems Inc.; nInvesco, Lipper Inc.; ¨Lipper Inc.
| * | Effective September 24, 2012, Institutional Class shares were renamed Class R5 shares. |
How we invest
Invesco Income Allocation Fund invests in underlying funds diversified among asset classes (bonds, stocks and cash), investment styles (value and blend/core), regions (domestic and international) and market capitalizations (large and mid). These underlying funds include bond funds, which represent 64% of the portfolio, stock funds, which represent 29% and a global real estate fund, which represents the remaining 7% of the portfolio. The underlying funds invest in a wide range of income-producing securities, which may generate an attractive yield with less price volatility than individual asset classes.
Invesco Income Allocation Fund invests in underlying funds that may invest a significant portion of their assets in derivative instruments, such as options,
futures (including currency futures), forward currency contracts and swap agreements (including interest rate, currency, total return and credit default swaps). The funds may engage in these transactions for hedging or non-hedging purposes.
While no fund can guarantee positive performance, the broad portfolio diversification strives to provide exposure to areas of the market that may perform well in any given period. It also attempts to limit exposure to any one area of the market that may be underperforming.
We establish target asset class weightings and underlying fund selections for the Fund and also monitor the Fund on an ongoing basis. The underlying funds are actively managed by their respective management teams based on individual fund objectives, investment strategies and management techniques.
While the weightings of various underlying funds in the portfolio may vary from their targets during the year due to market movements, we rebalance the portfolio annually to maintain its target asset class allocations.
Market conditions and your Fund
The year began with the advance of equities and commodities driven by indications of improving economic data and continued stimulus from global monetary authorities. Most sovereign bond markets fell during the first quarter of 2012 on signs of improving economic conditions, reduced economic strains in Europe and declining expectations for further Treasury bond purchase programs.
During April and May, risky asset gains from earlier in the year were eroded as a result of renewed fears arising from the ongoing European crisis coupled with weakening economic data in key markets. Government bonds once again fulfilled their role as safe haven assets as yields contracted in response to the weakness in risky assets.
In the third quarter, equity, fixed income and commodity markets all posted impressive results. Riskier assets, especially commodities, were able to stage a bounce back on expectations for additional monetary easing and hope that Europe would be able to finally make headway on its lingering economic issues. Bond yields spiked twice during the third quarter, but managed to settle down as markets seesawed between concerns over inflation and the continuing weakness in Europe.
The year ended with a lift in equities offset by declines in bonds and commodities. Investors had a host of political issues to navigate including elections in the US, China and Japan, as well as the resulting focus on the US fiscal cliff, and continuing concerns over European and
| Portfolio Composition | ||||||||||
| Asset Class | Target Allocation | % of Total Net Assets as of 12/31/12 | ||||||||
| Intermediate Term Taxable Investment Grade | 23.75 | % | 41.84 | % | ||||||
| Taxable Non-investment Grade | 31.25 | 17.38 | ||||||||
| Large Cap Value | 15.00 | 15.59 | ||||||||
| Sector | 8.00 | 7.66 | ||||||||
| Real Estate | 7.00 | 7.20 | ||||||||
| Short Term Taxable Investment Grade | 5.00 | 4.78 | ||||||||
| International Blend | 10.00 | 5.57 | ||||||||
| Other Assets Less Liabilities | 0.00 | -0.02 | ||||||||
Based on the composition of the underlying funds.
| Total Net Assets | $119.7 million |
4 Invesco Income Allocation Fund
Chinese economic growth. Equities were the lone bright spot while commodity markets were weighed down by concerns over falling demand and an improvement in crop yields. Government bond yields ultimately made their way higher as the market experienced both rallies and sell-offs.
Of the underlying funds, Invesco Diversified Dividend Fund, Invesco Premium Income Fund and Invesco High Yield Fund contributed the most to absolute performance for the reporting period. There were no absolute detractors from overall Fund performance. Relative to the Fund’s style-specific index, Invesco Utilities Fund (renamed Invesco Dividend Income Fund after the close of the reporting period), Invesco International Core Equity Fund and Invesco Short Term Bond Fund detracted most from the overall Invesco Income Allocation Fund performance.
Please note that the strategy of some of the underlying funds – which include, but are not limited to, Invesco Core Plus Bond Fund – may utilize derivative instruments such as futures contracts and swap agreements, including interest rate futures and credit derivatives, credit default swaps and/or credit default indexes.
We thank you for your continued commitment to Invesco Income Allocation Fund.
The views and opinions expressed in management’s discussion of Fund performance are those of Invesco Advisers, Inc. These views and opinions are subject to change at any time based on factors such as market and economic conditions. These views and opinions may not be relied upon as investment advice or recommendations, or as an offer for a particular security. The information is not a complete analysis of every aspect of any market, country, industry, security or the Fund. Statements of fact are from sources considered reliable, but Invesco Advisers, Inc. makes no representation or warranty as to their completeness or accuracy. Although historical performance is no guarantee of future results, these insights may help you understand our investment management philosophy.
See important Fund and, if applicable, index disclosures later in this report.
 | Gary Wendler Head of Product Development and Investment Performance/Risk, is manager of Invesco | |
| Income Allocation Fund. He joined Invesco in 1995. Mr. Wendler earned a BBA in finance from Texas A&M University. | ||
5 Invesco Income Allocation Fund
Your Fund’s Long-Term Performance
Results of a $10,000 Investment – Oldest Share Class(es) since Inception
Fund and index data from 10/31/05
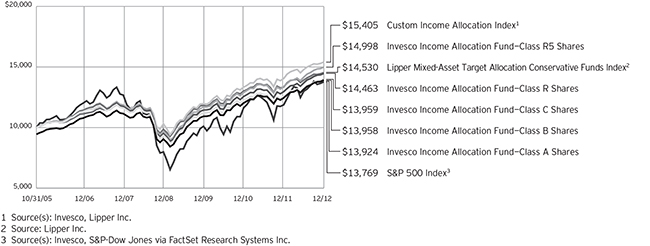
Past performance cannot guarantee comparable future results.
The data shown in the chart include reinvested distributions, applicable sales charges and Fund expenses including management fees. Results for Class B shares are calculated as if a hypothetical
shareholder had liquidated his entire investment in the Fund at the close of the reporting period and paid the contingent deferred sales charges, if applicable. Index results include reinvested dividends, but they do not reflect sales charges. Performance of the peer group,
if applicable, reflects fund expenses and management fees; performance of a market index does not. Performance shown in the chart and table(s) does not reflect deduction of taxes a shareholder would pay on Fund distributions or sale of Fund shares.
continued from page 10
likely be altered in the future to better reflect the Fund’s objective. The Russell 3000 Index is a trademark/service mark of the Frank Russell Co. Russell® is a trademark of the Frank Russell Co.
| n | The Lipper Mixed-Asset Target Allocation Conservative Funds Index is an unmanaged index considered representative of mixed-asset target allocation conservative funds tracked by Lipper. |
| n | The Russell 3000 Index is an unmanaged index considered representative of the US stock market. |
| n | The FTSE NAREIT Equity REITs Index is an unmanaged index considered representative of US REITs. |
| n | The Barclays U.S. Universal Index represents the union of the U.S. Aggregate Index, the U.S. High-Yield Corporate Index, the 144A Index, and the Euro- |
dollar Index, the Emerging Markets Index, and the non-ERISA portion of the CMBS Index. |
| n | The MSCI EAFE® Index is an unmanaged index considered representative of stocks of Europe, Australasia and the Far East. |
| n | The Fund is not managed to track the performance of any particular index, including the index(es) defined here, and consequently, the performance of the Fund may deviate significantly from the performance of the index(es). |
| n | A direct investment can not be made in an index. Unless otherwise indicated, index results include reinvested dividends, and they do not reflect sales charges. Performance of the peer group, if applicable, reflects fund expenses; performance of a market index does not. |
Other information
| n | The returns shown in management’s discussion of Fund performance are based on net asset values calculated for shareholder transactions. Generally accepted accounting principles require adjustments to be made to the net assets of the Fund at period end for financial reporting purposes, and as such, the net asset values for shareholder transactions and the returns based on those net asset values may differ from the net asset values and returns reported in the Financial Highlights. |
6 Invesco Income Allocation Fund
| Average Annual Total Returns | |||||
| As of 12/31/12, including maximum applicable sales charges | |||||
| Class A Shares | |||||
| Inception (10/31/05) | 4.73 | % | |||
5 Years | 3.36 | ||||
1 Year | 5.68 | ||||
| Class B Shares | |||||
| Inception (10/31/05) | 4.76 | % | |||
5 Years | 3.41 | ||||
1 Year | 6.10 | ||||
| Class C Shares | |||||
| Inception (10/31/05) | 4.76 | % | |||
5 Years | 3.75 | ||||
1 Year | 9.98 | ||||
| Class R Shares | |||||
| Inception (10/31/05) | 5.28 | % | |||
5 Years | 4.25 | ||||
1 Year | 11.55 | ||||
| Class Y Shares | |||||
| Inception | 5.71 | % | |||
5 Years | 4.76 | ||||
1 Year | 12.12 | ||||
| Class R5 Shares | |||||
| Inception (10/31/05) | 5.82 | % | |||
5 Years | 4.80 | ||||
1 Year | 12.12 | ||||
Class Y shares incepted on October 3, 2008. Performance shown prior to that date is that of Class A shares and includes the 12b-1 fees applicable to Class A shares. Class A share performance reflects any applicable fee waivers or expense reimbursements.
The performance data quoted represent past performance and cannot guarantee comparable future results; current performance may be lower or higher. Please visit invesco.com/performance for the most recent month-end performance. Performance figures reflect reinvested distributions, changes in net asset value and the effect of the maximum sales charge unless otherwise stated. Investment return and principal value will fluctuate so that you may have a gain or loss when you sell shares.
The net annual Fund operating expense ratio set forth in the most recent Fund prospectus as of the date of this report for Class A, Class B, Class C, Class R, Class Y and Class R5 shares was 0.90%, 1.65%, 1.65%, 1.15%, 0.65% and 0.65%, respectively.1,2 The total annual Fund operating expense ratio set forth in the most recent Fund prospectus as of the date of this report for Class A, Class B, Class C, Class R, Class Y and Class R5 shares was 1.30%, 2.05%, 2.05%, 1.55%, 1.05% and 0.99%, respectively.1 The expense ratios presented above may vary from the expense ratios presented in other sections of this report that are based on expenses incurred during the period covered by this report.
Class A share performance reflects the maximum 5.50% sales charge, and Class B and Class C share performance reflects the applicable contingent deferred sales charge (CDSC) for the period involved. The CDSC on Class B shares declines from 5% beginning at the time of purchase to 0% at the beginning of the seventh year. The CDSC on Class C shares is 1% for the first year after purchase. Class R, Class Y and Class R5 shares do not have a front-end sales charge or a CDSC; therefore, performance is at net asset value.
The performance of the Fund’s share classes will differ primarily due to different sales charge structures and class expenses.
Had the adviser not waived fees and/or reimbursed expenses, performance would have been lower.
| 1 | The expense ratio includes acquired fund fees and expenses of the underlying funds in which the Fund invests of 0.65% for Invesco Income Allocation Fund. |
| 2 | Total annual Fund operating expenses after any contractual fee waivers and/or expense reimbursements by the adviser in effect through April 30, 2013. See current prospectus for more information. |
7 Invesco Income Allocation Fund
Invesco Income Allocation Fund’s investment objective is current income and, secondarily, growth of capital.
| n | Unless otherwise stated, information presented in this report is as of December 31, 2012, and is based on total net assets. |
| n | Unless otherwise noted, all data provided by Invesco. |
| n | To access your Fund’s reports/prospectus, visit invesco.com/fundreports. |
About share classes
| n | Class B shares may not be purchased for new or additional investments. Please see the prospectus for more information. |
| n | Class R shares are generally available only to employer sponsored retirement and benefit plans. Please see the prospectus for more information. |
| n | Class Y shares are available only to certain investors. Please see the prospectus for more information. |
| n | Class R5 shares are primarily intended for employer sponsored retirement and benefit plans that meet certain standards and for institutional investors. On September 24, 2012, Institutional Class shares were renamed Class R5 shares. Please see the prospectus for more information. |
Principal risks of investing in the Fund
| n | Call risk. If interest rates fall, it is possible that issuers of debt securities with high interest rates will prepay or call their securities before their maturity dates. In this event, the proceeds from the called securities would likely be reinvested by an underlying fund in securities bearing the new, lower interest rates, resulting in a possible decline in an underlying fund’s income and distributions to shareholders. |
| n | Collateralized loan obligations risk. In addition to the normal interest rate, default and other risk of fixed income securities, collateralized loan obligations carry additional risks, including the possibility that distributions from collateral securities will not be adequate to make interest or other payments, the quality of the collateral may decline in value or default, an underlying fund may invest in collateralized loan obligations that are subordinate to other classes, values may be volatile, and disputes with the issuer may produce unexpected investment results. |
| n | Concentration risk. To the extent an underlying fund invests a greater |
amount in any one sector or industry, an underlying fund’s performance will depend to a greater extent on the overall condition of the sector or industry, and there is increased risk to an underlying fund if conditions adversely affect that sector or industry. |
| n | Convertible securities risk. An underlying fund may own convertible securities, the value of which may be affected by market interest rates, the risk that the issuer will default, the value of the underlying stock or the right of the issuer to buy back the convertible securities. |
| n | Counterparty risk. Counterparty risk is the risk that the other party to the contract will not fulfill its contractual obligations, which may cause losses or additional costs to an underlying fund. |
| n | Credit linked notes risk. Risks of credit linked notes include those risks associated with the underlying reference obligation including but not limited to market risk, interest rate risk, credit risk, default risk and foreign currency risk. In the case of a credit linked note created with credit default swaps, the structure will be “funded” such that the par amount of the security will represent the maximum loss that could be incurred on the investment and no leverage is introduced. An investor in a credit linked note bears counterparty risk or the risk that the issuer of the credit linked note will default or become bankrupt and not make timely payment of principal and interest of the structured security. |
| n | Credit risk. The issuer of instruments in which the underlying fund invests may be unable to meet interest and/or principal payments, thereby causing its instruments to decrease in value and lowering the issuer’s credit rating. |
| n | Currency/exchange rate risk. The dollar value of an underlying fund’s foreign investments will be affected by changes in the exchange rates between the dollar and the currencies in which those investments are traded. |
| n | Debt securities risk. An underlying fund |
may invest in debt securities that are affected by changing interest rates and changes in their effective maturities and credit quality. |
| n | Defaulted securities risk. Defaulted securities involve the substantial risk that principal will not be repaid. Defaulted securities and any securities received in an exchange for such securities may be subject to restrictions on resale. |
| n | Derivatives risk. The performance of derivative instruments is tied to the performance of an underlying currency, security, index or other instrument. In addition to risks relating to their underlying instruments, the use of derivatives may include other, possibly greater, risks. Derivatives involve costs, may be volatile, and may involve a small initial investment relative to the risk assumed. Risks associated with the use of derivatives include counterparty, leverage, correlation, liquidity, tax, market, interest rate and management risks. Derivatives may also be more difficult to purchase, sell or value than other investments. The Fund may lose more than the cash amount invested on investments in derivatives. |
Investors should bear in mind that, while the Fund intends to use derivative strategies, it is not obligated to actively engage in these transactions, generally or in any particular kind of derivative, if the investment manager elects not to do so due to availability, cost, market conditions or other factors.
| n | Developing/emerging markets securities risk. Securities issued by foreign companies and governments located in developing/emerging countries may be affected more negatively by inflation, devaluation of their currencies, higher transaction costs, delays in settlement, adverse political developments, the introduction of capital controls, withholding taxes, nationalization of private assets, expropriation, social unrest, war or lack of timely information than those in developed countries. |
continued on next page
This report must be accompanied or preceded by a currently effective Fund prospectus, which contains more complete information, including sales charges and expenses. Investors should read it carefully before investing.
NOT FDIC INSURED | MAY LOSE VALUE | NO BANK GUARANTEE
| Fund Nasdaq Symbols | |||||
| Class A Shares | ALAAX | ||||
| Class B Shares | BLIAX | ||||
| Class C Shares | CLIAX | ||||
| Class R Shares | RLIAX | ||||
| Class Y Shares | ALAYX | ||||
| Class R5 Shares | ILAAX | ||||
8 Invesco Income Allocation Fund
| n | Dollar roll transactions risk. Dollar roll transactions involve the risk that the market value and yield of the securities retained by an underlying fund may decline below the price of the mortgage-related securities sold by the underlying fund that it is obligated to repurchase. |
| n | Exchange-traded funds risk. An investment by the Fund or underlying fund in exchange-traded funds generally presents the same primary risks as an investment in a mutual fund. In addition, an exchange-traded fund may be subject to the following: (1) a discount of the exchange-traded fund’s shares to its net asset value; (2) failure to develop an active trading market for the exchange-traded fund’s shares; (3) the listing exchange halting trading of the exchange-traded fund’s shares; (4) failure of the exchange-traded fund’s shares to track the referenced index; and (5) holding troubled securities in the referenced index. Exchange-traded funds may involve duplication of management fees and certain other expenses, as the Fund or underlying fund indirectly bears its proportionate share of any expenses paid by the exchange-traded funds in which it invests. Further, certain of the exchange-traded funds in which the Fund or underlying fund may invest are leveraged. The more the Fund or underlying fund invests in such leveraged exchange-traded funds, the more this leverage will magnify any losses on those investments. |
| n | Financial institutions risk. Investments in financial institutions may be subject to certain risks, including, but not limited to, the risk of regulatory actions, changes in interest rates and concentration of loan portfolios in an industry or sector. Financial institutions are highly regulated and may suffer setbacks should regulatory rules and interpretations under which they operate change. Likewise, there is a high level of competition among financial institutions which could adversely affect the viability of an institution. |
| n | Floating rate risk. Some of the underlying funds may invest in senior secured floating rate loans and debt securities that require collateral. There is a risk that the value of the collateral may not be sufficient to cover the amount owed, collateral securing a loan may be found invalid, and collateral may be used to pay other outstanding obligations of the borrower under applicable law or may be difficult to sell. There is also the risk that the collateral may be difficult to |
liquidate, or that a majority of the collateral may be illiquid. |
| n | Foreign securities risk. An underlying fund’s foreign investments may be affected by changes in a foreign country’s exchange rates, political and social instability; changes in economic or taxation policies, difficulties when enforcing obligations, decreased liquidity, and increased volatility. Foreign companies may be subject to less regulation resulting in less publicly available information about the companies. |
| n | Fund of funds risk. The Fund’s performance depends on the underlying funds in which it invests, and it is subject to the risks of the underlying funds. Market fluctuations may change the target weightings in the underlying funds. The underlying funds may change their investment objectives, policies or practices and may not achieve their investment objectives, all of which may cause the Fund to withdraw its investments therein at a disadvantageous time. |
| n | High yield bond (junk bond) risk. Junk bonds involve a greater risk of default or price changes due to changes in the credit quality of the issuer. The values of junk bonds fluctuate more than those of high- quality bonds in response to company, political, regulatory or economic developments. Values of junk bonds can decline significantly over short periods of time. |
| n | Income risk. The income you receive from an underlying fund is based primarily on prevailing interest rates, which can vary widely over the short- and long-term. If interest rates drop, your income from an underlying fund may drop as well. |
| n | Industry focus risk. To the extent an underlying fund invests in securities issued or guaranteed by companies in the banking and financial services industries, the underlying fund’s performance will depend on the overall condition of those industries, which may be affected by the following factors: the supply of short-term financing; changes in government regulation and interest rates; and overall economy. |
| n | Interest rate risk. Interest rate risk refers to the risk that bond prices generally fall as interest rates rise; conversely, bond prices generally rise as interest rates fall. Specific bonds differ in their sensitivity to changes in interest rates depending on their individual characteristics, including duration. |
| n | Large investor risk. An underlying fund may accept investments from funds of funds, as well as from similar invest- |
ment vehicles, such as 529 Plans. From time to time, an underlying fund may experience large investments or redemptions due to allocations or rebal-ancings by these funds of funds and/or similar investment vehicles. While it is impossible to predict the overall impact of these transactions over time, there could be adverse effects on portfolio management. For example, an underlying fund may be required to sell securities or invest cash at times when it would not otherwise do so. These transactions could also have tax consequences if sales of securities result in gains, and could also increase transaction costs or portfolio turnover. |
| n | Leverage risk. Leverage exists when an underlying fund purchases or sells an instrument or enters into a transaction without investing cash in an amount equal to the full economic exposure of the instrument or transaction and the underlying fund could lose more than it invested. Leverage created from borrowing or certain types of transactions or instruments may impair an underlying fund’s liquidity, cause it to liquidate positions at an unfavorable time, increase volatility or otherwise not achieve its intended objective. |
| n | Liquidity risk. An underlying fund may hold illiquid securities that it is unable to sell at the preferred time or price and could lose its entire investment in such securities. |
| n | Management risk. The investment techniques and risk analysis used by the Fund’s and the underlying funds’ portfolio managers may not produce the desired results. |
| n | Market risk. The prices of and the income generated by an underlying fund’s securities may decline in response to, among other things, investor sentiment, general economic and market conditions, regional or global instability, and currency and interest rate fluctuations. |
| n | Mortgage- and asset-backed securities risk. Certain of the underlying funds may invest in mortgage and asset-backed securities that are subject to prepayment or call risk, which is the risk that the borrower’s payments may be received earlier or later than expected due to changes in prepayment rates on underlying loans. Faster prepayments often happen when interest rates are falling. As a result, an underlying fund may reinvest these early payments at lower interest rates, thereby reducing the underlying fund’s income. Conversely, when interest rates rise, prepayments may happen more slowly, causing the security to lengthen in |
continued on page 10
9 Invesco Income Allocation Fund
continued from page 9
duration. Longer duration securities tend to be more volatile. Securities may be prepaid at a price less than the original purchase value. An unexpectedly high rate of defaults on the mortgages held by a mortgage pool may adversely affect the value of mortgage-backed securities and could result in losses to an underlying fund. The risk of such defaults is generally higher in the case of mortgage pools that include subprime mortgages. Subprime mortgages refer to loans made to borrowers with weakened credit histories or with lower capacity to make timely payments on their mortgages.
| n | Non-correlation risk. The preferred equity segment of an underlying fund’s portfolio return may not match the return of the Index for a number of reasons. For example, an underlying fund incurs operating expenses not applicable to the Index, and incurs costs in buying and selling securities, especially when rebalancing securities holdings to reflect changes in the Index. In addition, the performance of the preferred equity segment and the Index may vary due to asset valuation differences and differences between the preferred equity segment and the Index resulting from legal restrictions, cost or liquidity constraints. |
| n | Non-diversification risk. Certain of the underlying funds are non-diversified and can invest a greater portion of their assets in a single issuer. A change in the value of the issuer could affect the value of an underlying fund more than if it was a diversified fund. |
| n | Preferred securities risk. There are special risks associated with investing in preferred securities. Preferred securities may include provisions that permit the issuer, in its discretion, to defer or omit distributions for a certain period of time. If an underlying fund owns a security that is deferring or omitting its distributions, an underlying fund may be required to report the distribution on its tax returns, even though it may not have received this income. Further, preferred securities may lose substantial value due to the omission or deferment of dividend payments. |
| n | Prepayment risk. An issuer’s ability to prepay principal on a loan or debt security prior to maturity can limit an underlying fund’s potential gains. Prepayments may require the underlying fund to replace the loan or debt security with a lower yielding security, adversely affecting an underlying fund’s yield. |
| n | Reinvestment risk. Reinvestment risk is the risk that a bond’s cash flows (coupon income and principal repayment) will be reinvested at an interest rate below that on the original bond. |
| n | Real estate investment trust/real estate risk. Investments in real-estate related instruments may be affected by economic, legal, cultural, environmental or technological factors that affect property values, rents or occupancies of real estate related to and underlying fund’s holdings. Real estate companies, including REITs or similar structures, tend to be small and mid-cap companies, and their shares may be more volatile and less liquid. The value of investments in real estate related companies may be affected by the quality of management, the ability to repay loans, the utilization of leverage and financial covenants related thereto, whether the company carries adequate insurance and environmental factors. If a real estate related company defaults, an underlying fund may own real estate directly, which involves the following additional risks: environmental liabilities, difficulty in valuing and selling the real estate, and economic or regulatory changes. |
| n | Sector fund risk. Certain of the underlying funds’ investments are concentrated in a comparatively narrow segment of the economy, which may make the underlying fund more volatile than non-concentrated funds. |
| n | Short sales risk. Short sales may cause an underlying fund to repurchase a security at a higher price, causing a loss. As there is no limit on how much the price of the security can increase, the underlying fund’s exposure is unlimited. |
| n | Small- and mid-capitalization risk. Stocks of small and mid-sized companies tend to be more vulnerable to adverse developments in the above factors and may have little or no operating history or track record of success, and limited product lines, markets, management and financial resources. The securities of small and mid-sized companies may be more volatile due to less market interest and less publicly available information about the issuer. They also may be illiquid or restricted as to resale, or may trade less frequently and in smaller volumes, all of which may cause difficulty when establishing or closing a position at a desirable price. |
| n | Synthetic securities risk. Fluctuations in the values of synthetic securities may not correlate perfectly with the |
instruments they are designed to replicate. Synthetic securities may be subject to interest rate changes, market price fluctuations, counterparty risk and liquidity risk. |
| n | Tax risk. If the US Treasury Department were to exercise its authority to issue regulations that exclude from the definition of “qualifying income” foreign currency gains not directly related to Invesco Premium Income Fund’s business of investing in securities, Invesco Premium Income Fund may be unable to qualify as a regulated investment company for one or more years. In this event, Invesco Premium Income Fund’s Board may authorize a significant change in investment strategy or Invesco Premium Income Fund liquidation. |
| n | US government obligations risk. The Fund may invest in obligations issued by US government agencies and instrumentalities that may receive varying levels of support from the government, which could affect an underlying fund’s ability to recover should they default. |
| n | Utilities sector risk. The following factors may affect an underlying fund’s investments in the utilities sector: governmental regulation, economic factors, ability of the issuer to obtain financing, prices of natural resources and risks associated with nuclear power. |
| n | Value investing style risk. Certain underlying funds emphasize a value style of investing, which focuses on undervalued companies with characteristics for improved valuations. This style of investing is subject to the risk that the valuations never improve or that the returns on value equity securities are less than returns on other styles of investing or the overall stock market. Value stocks also may decline in price, even though in theory they are already underpriced. |
About indexes used in this report
| n | The S&P 500® Index is an unmanaged index considered representative of the US stock market. |
| n | The Custom Income Allocation Index, created by Invesco to serve as a benchmark for Invesco Income Allocation Fund, comprises the following indexes: Russell 3000®, MSCI EAFE®, FTSE NAREIT Equity REITs and Barclays U.S. Universal Index. The composition of the index may change based on the Fund’s target asset allocation. Therefore, the current composition of the index does not reflect its historical composition and will |
continued on page 6
10 Invesco Income Allocation Fund
Schedule of Investments
December 31, 2012
Invesco Income Allocation Fund
Schedule of Investments in Affiliated Issuers–100.02%(a)
| % of Net Assets 12/31/12 | Value 12/31/11 | Purchases at Cost | Proceeds from Sales | Change in Unrealized Appreciation (Depreciation) | Realized Gain (Loss) | Dividend Income | Shares 12/31/12 | Value 12/31/12 | ||||||||||||||||||||||||||||
Domestic Equity Funds–23.25% |
| |||||||||||||||||||||||||||||||||||
Invesco Diversified Dividend Fund | 15.59 | % | $ | 13,659,359 | $ | 4,003,174 | $ | (887,543 | ) | $ | 2,005,732 | $ | 158,141 | $ | 352,859 | 1,385,679 | $ | 18,665,102 | ||||||||||||||||||
Invesco Utilities Fund | 7.66 | % | 8,066,266 | 1,883,360 | (818,416 | ) | 144,155 | (108,818 | ) | 261,685 | 536,683 | 9,166,547 | ||||||||||||||||||||||||
Total Domestic Equity Funds | 21,725,625 | 5,886,534 | (1,705,959 | ) | 2,149,887 | 49,323 | 614,544 | 27,831,649 | ||||||||||||||||||||||||||||
Fixed-Income Funds–64.00% |
| |||||||||||||||||||||||||||||||||||
Invesco Core Plus Bond Fund | 14.82 | % | 16,804,984 | 3,735,541 | (3,428,691 | ) | 995,066 | (363,331 | ) | 630,401 | 1,614,519 | 17,743,569 | ||||||||||||||||||||||||
Invesco Corporate Bond Fund(b) | 8.38 | % | 8,168,692 | 2,123,968 | (810,725 | ) | 699,011 | (149,182 | ) | 403,041 | 1,376,099 | 10,031,764 | ||||||||||||||||||||||||
Invesco Floating Rate Fund | 6.92 | % | 6,523,289 | 1,851,821 | (414,686 | ) | 402,477 | (76,855 | ) | 379,430 | 1,052,865 | 8,286,046 | ||||||||||||||||||||||||
Invesco High Yield Fund | 10.46 | % | 12,934,855 | 2,784,705 | (4,392,552 | ) | 1,304,429 | (96,165 | ) | 681,795 | 2,829,632 | 12,535,272 | ||||||||||||||||||||||||
Invesco International Total Return Fund | 4.82 | % | 4,613,439 | 1,284,061 | (295,421 | ) | 147,552 | 23,626 | 70,612 | 513,635 | 5,773,257 | |||||||||||||||||||||||||
Invesco Premium Income Fund | 13.82 | % | — | 17,186,862 | (1,181,144 | ) | 520,637 | 250,838 | 769,710 | 1,547,866 | 16,546,687 | |||||||||||||||||||||||||
Invesco Short Term Bond Fund | 4.78 | % | 5,611,431 | 1,171,685 | (1,165,137 | ) | 249,934 | (146,202 | ) | 118,907 | 653,910 | 5,721,711 | ||||||||||||||||||||||||
Invesco U.S. Government Fund | — | % | 6,908,985 | 62,847 | (6,956,942 | ) | (441,332 | ) | 426,442 | 23,902 | — | — | ||||||||||||||||||||||||
Total Fixed-Income Funds | 61,565,675 | 30,201,490 | (18,645,298 | ) | 3,877,774 | (130,829 | ) | 3,077,798 | 76,638,306 | |||||||||||||||||||||||||||
Foreign Equity Funds–5.57% |
| |||||||||||||||||||||||||||||||||||
Invesco International Core Equity Fund | 5.57 | % | 3,999,996 | 2,317,324 | (289,870 | ) | 823,024 | (178,392 | ) | 157,015 | 644,646 | 6,672,082 | ||||||||||||||||||||||||
Real Estate Funds–7.20% |
| |||||||||||||||||||||||||||||||||||
Invesco Global Real Estate Income Fund | 7.20 | % | 6,475,917 | 1,908,020 | (491,989 | ) | 763,321 | (39,591 | ) | 489,054 | 959,430 | 8,615,678 | ||||||||||||||||||||||||
TOTAL INVESTMENTS IN AFFILIATED MUTUAL FUNDS | 100.02 | % | $ | 93,767,213 | $ | 40,313,368 | $ | (21,133,116 | ) | $ | 7,614,006 | $ | (299,489 | )(c) | $ | 4,338,411 | $ | 119,757,715 | ||||||||||||||||||
OTHER ASSETS LESS LIABILITIES | (0.02 | )% | (18,694 | ) | ||||||||||||||||||||||||||||||||
NET ASSETS | 100.00 | % | $ | 119,739,021 | ||||||||||||||||||||||||||||||||
Notes to Schedule of Investments:
| (a) | Each underlying fund and the Fund are affiliated by either having the same investment adviser or an investment adviser under common control with the Fund’s investment adviser. Effective September 24, 2012, the Fund began investing in Class R6 shares. The Fund invests in Class R6 shares of the mutual funds listed. |
| (b) | Effective September 24, 2012, Invesco Van Kampen Corporate Bond Fund was renamed Invesco Corporate Bond Fund. |
| (c) | Includes $273,761 and $230,506 of capital gains from affiliated underlying funds for Invesco Diversified Dividend Fund and Invesco Premium Income Fund, respectively. |
See accompanying Notes to Financial Statements which are an integral part of the financial statements.
11 Invesco Income Allocation Fund
Statement of Assets and Liabilities
December 31, 2012
Assets: |
| |||
Investments in affiliated underlying funds, at value | $ | 119,757,715 | ||
Receivable for: | ||||
Fund shares sold | 346,788 | |||
Dividends — affiliated underlying funds | 122 | |||
Investment for trustee deferred compensation and retirement plans | 21,256 | |||
Other assets | 31,995 | |||
Total assets | 120,157,876 | |||
Liabilities: |
| |||
Payable for: | ||||
Investments purchased — affiliated underlying funds | 160,246 | |||
Fund shares reacquired | 113,140 | |||
Accrued fees to affiliates | 74,215 | |||
Accrued other operating expenses | 41,387 | |||
Trustee deferred compensation and retirement plans | 29,867 | |||
Total liabilities | 418,855 | |||
Net assets applicable to shares outstanding | $ | 119,739,021 | ||
Net assets consist of: |
| |||
Shares of beneficial interest | $ | 125,246,639 | ||
Undistributed net investment income | 1,074,881 | |||
Undistributed net realized gain (loss) | (13,409,869 | ) | ||
Unrealized appreciation | 6,827,370 | |||
| $ | 119,739,021 | |||
Net Assets: |
| |||
Class A | $ | 85,518,168 | ||
Class B | $ | 5,979,874 | ||
Class C | $ | 23,813,637 | ||
Class R | $ | 1,899,086 | ||
Class Y | $ | 2,301,524 | ||
Class R5 | $ | 226,732 | ||
Shares outstanding, $0.01 par value per share, |
| |||
Class A | 8,240,725 | |||
Class B | 575,655 | |||
Class C | 2,292,179 | |||
Class R | 182,884 | |||
Class Y | 221,789 | |||
Class R5 | 21,843 | |||
Class A: | ||||
Net asset value per share | $ | 10.38 | ||
Maximum offering price per share | ||||
(Net asset value of $10.38 ¸ 94.50%) | $ | 10.98 | ||
Class B: | ||||
Net asset value and offering price per share | $ | 10.39 | ||
Class C: | ||||
Net asset value and offering price per share | $ | 10.39 | ||
Class R: | ||||
Net asset value and offering price per share | $ | 10.38 | ||
Class Y: | ||||
Net asset value and offering price per share | $ | 10.38 | ||
Class R5: | ||||
Net asset value and offering price per share | $ | 10.38 | ||
See accompanying Notes to Financial Statements which are an integral part of the financial statements.
12 Invesco Income Allocation Fund
Statement of Operations
For the year ended December 31, 2012
Investment income: |
| |||
Dividends from affiliated underlying funds | $ | 4,338,411 | ||
Other Income | 483 | |||
Total investment income | 4,338,894 | |||
Expenses: | ||||
Administrative services fees | 50,000 | |||
Custodian fees | 7,574 | |||
Distribution fees: | ||||
Class A | 179,916 | |||
Class B | 61,687 | |||
Class C | 217,094 | |||
Class R | 7,782 | |||
Transfer agent fees — A, B, C, R and Y | 153,802 | |||
Transfer agent fees — R5 | 58 | |||
Trustees’ and officers’ fees and benefits | 24,718 | |||
Registration and filing fees | 74,080 | |||
Other | 76,020 | |||
Total expenses | 852,731 | |||
Less: Expenses reimbursed and expense offset arrangement(s) | (376,929 | ) | ||
Net expenses | 475,802 | |||
Net investment income | 3,863,092 | |||
Realized and unrealized gain (loss) from investments in affiliated underlying fund shares | ||||
Net realized gain (loss) on sales of affiliated underlying fund shares | (803,756 | ) | ||
Net realized gain from distributions of affiliated underlying fund shares | 504,267 | |||
Net realized gain (loss) from affiliated underlying fund shares | (299,489 | ) | ||
Change in net unrealized appreciation of affiliated underlying fund shares | 7,614,006 | |||
Net gain from affiliated underlying funds | 7,314,517 | |||
Net increase in net assets resulting from operations | $ | 11,177,609 | ||
See accompanying Notes to Financial Statements which are an integral part of the financial statements.
13 Invesco Income Allocation Fund
Statement of Changes in Net Assets
For the years ended December 31, 2012 and 2011
| 2012 | 2011 | |||||||
Operations: |
| |||||||
Net investment income | $ | 3,863,092 | $ | 3,354,418 | ||||
Net realized gain (loss) | (299,489 | ) | (1,174,826 | ) | ||||
Change in net unrealized appreciation | 7,614,006 | 570,883 | ||||||
Net increase in net assets resulting from operations | 11,177,609 | 2,750,475 | ||||||
Distributions to shareholders from net investment income: | ||||||||
Class A | (2,638,154 | ) | (2,224,613 | ) | ||||
Class B | (171,364 | ) | (200,472 | ) | ||||
Class C | (615,843 | ) | (572,781 | ) | ||||
Class R | (53,334 | ) | (37,343 | ) | ||||
Class Y | (60,435 | ) | (37,777 | ) | ||||
Class R5 | (3,965 | ) | (1,139 | ) | ||||
Total distributions from net investment income | (3,543,095 | ) | (3,074,125 | ) | ||||
Share transactions-net: | ||||||||
Class A | 16,485,594 | 8,458,632 | ||||||
Class B | (1,087,901 | ) | (211,272 | ) | ||||
Class C | 1,508,959 | 898,553 | ||||||
Class R | 614,148 | 93,513 | ||||||
Class Y | 698,448 | 743,028 | ||||||
Class R5 | 195,244 | 16,707 | ||||||
Net increase in net assets resulting from share transactions | 18,414,492 | 9,999,161 | ||||||
Net increase in net assets | 26,049,006 | 9,675,511 | ||||||
Net assets: | ||||||||
Beginning of year | 93,690,015 | 84,014,504 | ||||||
End of year (includes undistributed net investment income of $1,074,881 and $558,093, respectively) | $ | 119,739,021 | $ | 93,690,015 | ||||
Notes to Financial Statements
December 31, 2012
NOTE 1—Significant Accounting Policies
Invesco Income Allocation Fund (the “Fund”) is a series portfolio of AIM Growth Series (Invesco Growth Series) (the “Trust”). The Trust is organized as a Delaware statutory trust and is registered under the Investment Company Act of 1940, as amended (the “1940 Act”), as an open-end series management investment company consisting of sixteen separate series portfolios, each authorized to issue an unlimited number of shares of beneficial interest. The assets, liabilities and operations of each portfolio are accounted for separately. Information presented in these financial statements pertains only to the Fund. Matters affecting each portfolio or class will be voted on exclusively by the shareholders of such portfolio or class.
The Fund’s investment objective is current income and, secondarily, growth of capital. The Fund is a “fund of funds”, in that it invests in other mutual funds (“underlying funds”) advised by Invesco Advisers, Inc. (“Invesco”). The Adviser may change the Fund’s asset class allocations, the underlying funds or the target weightings in the underlying funds without shareholder approval. The underlying funds may engage in a number of investment techniques and practices, which involve certain risks. Each underlying fund’s accounting policies are outlined in the underlying fund’s financial statements and are available upon request.
The Fund currently consists of six different classes of shares: Class A, Class B, Class C, Class R, Class Y and Class R5. On September 24, 2012, Institutional Class shares were renamed Class R5 shares. Class A shares are sold with a front-end sales charge unless certain waiver criteria are met and under certain circumstances load waived shares may be subject to contingent deferred sales charges (“CDSC”). Class C shares are sold with a CDSC. Class R, Class Y and Class R5 shares are sold at net asset value. Effective November 30, 2010, new or additional investments in Class B shares are no longer permitted. Existing shareholders of Class B shares may continue to reinvest dividends and capital gains distributions in Class B shares until they convert to Class A shares. Also, shareholders in Class B shares will be able to exchange those shares for Class B shares of other Invesco Funds offering such shares until they convert to Class A shares. Generally, Class B shares will automatically convert to Class A shares on or about the month-end, which is at least eight years after the date of purchase. Redemption of Class B shares prior to the conversion date will be subject to a CDSC.
14 Invesco Income Allocation Fund
The following is a summary of the significant accounting policies followed by the Fund in the preparation of its financial statements.
| A. | Security Valuations — Securities of investment companies that trade on an exchange are valued at the last sales price or official closing price as of the close of the customary trading session on the exchange where the security is principally traded. Investments in shares of funds that are not traded on an exchange are valued at the end of day net asset value per share of such fund. Securities in the underlying funds, including restricted securities, are valued in accordance with the valuation policy of such fund. The policies of the underlying funds affiliated with the Fund as a result of having the same investment adviser or affiliate are set forth below. |
A security listed or traded on an exchange (except convertible bonds) is valued at its last sales price or official closing price as of the close of the customary trading session on the exchange where the security is principally traded, or lacking any sales or official closing price on a particular day, the security may be valued at the closing bid price on that day. Securities traded in the over-the-counter market are valued based on prices furnished by independent pricing services or market makers. When such securities are valued by an independent pricing service they may be considered fair valued. Futures contracts are valued at the final settlement price set by an exchange on which they are principally traded. Listed options are valued at the mean between the last bid and ask prices from the exchange on which they are principally traded. Options not listed on an exchange are valued by an independent source at the mean between the last bid and ask prices. For purposes of determining net asset value per share, futures and option contracts generally are valued 15 minutes after the close of the customary trading session of the New York Stock Exchange (“NYSE”).
Senior secured floating rate loans and senior secured floating rate debt securities are fair valued using an evaluated quote provided by an independent pricing service. Evaluated quotes provided by the pricing service may reflect appropriate factors such as ratings, tranche type, industry, company performance, spread, individual trading characteristics, institution-size trading in similar groups of securities and other market data.
Investments in open-end and closed-end registered investment companies that do not trade on an exchange are valued at the end of day net asset value per share. Investments in open-end and closed-end registered investment companies that trade on an exchange are valued at the last sales price or official closing price as of the close of the customary trading session on the exchange where the security is principally traded.
Debt obligations (including convertible bonds) and unlisted equities are fair valued using an evaluated quote provided by an independent pricing service. Evaluated quotes provided by the pricing service may be determined without exclusive reliance on quoted prices, and may reflect appropriate factors such as institution-size trading in similar groups of securities, developments related to specific securities, dividend rate (for unlisted equities), yield (for debt obligations), quality, type of issue, coupon rate (for debt obligations), maturity (for debt obligations), individual trading characteristics and other market data. Debt obligations are subject to interest rate and credit risks. In addition, all debt obligations involve some risk of default with respect to interest and/or principal payments.
Foreign securities’ (including foreign exchange contracts) prices are converted into U.S. dollar amounts using the applicable exchange rates as of the close of the NYSE. If market quotations are available and reliable for foreign exchange-traded equity securities, the securities will be valued at the market quotations. Because trading hours for certain foreign securities end before the close of the NYSE, closing market quotations may become unreliable. If between the time trading ends on a particular security and the close of the customary trading session on the NYSE, events occur that the Adviser determines are significant and make the closing price unreliable, the Fund may fair value the security. If the event is likely to have affected the closing price of the security, the security will be valued at fair value in good faith using procedures approved by the Board of Trustees. Adjustments to closing prices to reflect fair value may also be based on a screening process of an independent pricing service to indicate the degree of certainty, based on historical data, that the closing price in the principal market where a foreign security trade is not the current value as of the close of the NYSE. Foreign securities’ prices meeting the approved degree of certainty that the price is not reflective of current value will be priced at the indication of fair value from the independent pricing service. Multiple factors may be considered by the independent pricing service in determining adjustments to reflect fair value and may include information relating to sector indices, American Depositary Receipts and domestic and foreign index futures. Foreign securities may have additional risks including exchange rate changes, potential for sharply devalued currencies and high inflation, political and economic upheaval, the relative lack of issuer information, relatively low market liquidity and the potential lack of strict financial and accounting controls and standards.
Securities for which market prices are not provided by any of the above methods may be valued based upon quotes furnished by independent sources. The last bid price may be used to value equity securities. The mean between the last bid and asked prices is used to value debt obligations, including corporate loans.
Securities for which market quotations are not readily available or became unreliable are valued at fair value as determined in good faith by or under the supervision of the Trust’s officers following procedures approved by the Board of Trustees. Issuer specific events, market trends, bid/ask quotes of brokers and information providers and other market data may be reviewed in the course of making a good faith determination of a security’s fair value.
Valuations change in response to many factors including the historical and prospective earnings of the issuer, the value of the issuer’s assets, general economic conditions, interest rates, investor perceptions and market liquidity. Because of the inherent uncertainties of valuation, the values reflected in the financial statements may materially differ from the value received upon actual sale of those investments.
| B. | Securities Transactions and Investment Income — Securities transactions are accounted for on a trade date basis. Realized gains or losses on sales are computed on the basis of specific identification of the securities sold. Distributions from ordinary income from underlying funds, if any, are recorded as dividend income on ex-dividend date. Distributions from gains from underlying funds, if any, are recorded as realized gains on the ex-dividend date. The following policies are followed by the underlying funds: Interest income is recorded on the accrual basis from settlement date. Bond premiums and discounts are amortized and/or accreted for financial reporting purposes. Paydown gains and losses on mortgage and asset-backed securities are recorded as adjustments to interest income. |
The Fund allocates income and realized and unrealized capital gains and losses to a class based on the relative net assets of each class.
| C. | Distributions — Distributions from income, if any, are declared and paid quarterly and are recorded on the ex-dividend date. Distributions from net realized capital gain, if any, are generally declared and paid annually and recorded on the ex-dividend date. The Fund may elect to treat a portion of the proceeds from redemptions as distributions for federal income tax purposes. |
| D. | Federal Income Taxes — The Fund intends to comply with the requirements of Subchapter M of the Internal Revenue Code necessary to qualify as a regulated investment company and to distribute substantially all of the Fund’s taxable earnings to shareholders. As such, the Fund will |
15 Invesco Income Allocation Fund
| not be subject to federal income taxes on otherwise taxable income (including net realized capital gain) that is distributed to shareholders. Therefore, no provision for federal income taxes is recorded in the financial statements. |
The Fund files tax returns in the U.S. Federal jurisdiction and certain other jurisdictions. Generally, the Fund is subject to examinations by such taxing authorities for up to three years after the filing of the return for the tax period.
| E. | Expenses — Expenses included in the accompanying financial statements reflect the expenses of the Fund and do not include any expenses of the underlying funds. The effects of the underlying funds expenses are included in the realized and unrealized gain/loss on the investments in the underlying funds. |
Fees provided for under the Rule 12b-1 plan of a particular class of the Fund and which are directly attributable to that class are charged to the operations of such class. Transfer agency fees and expenses and other shareholder recordkeeping fees and expenses attributable to Class R5 are charged to such class. Transfer agency fees and expenses and other shareholder recordkeeping fees and expenses relating to all other classes are allocated among those classes based on relative net assets. All other expenses are allocated among the classes based on relative net assets.
| F. | Accounting Estimates — The preparation of financial statements in conformity with accounting principles generally accepted in the United States of America (“GAAP”) requires management to make estimates and assumptions that affect the reported amounts of assets and liabilities at the date of the financial statements and the reported amounts of revenues and expenses during the reporting period including estimates and assumptions related to taxation. Actual results could differ from those estimates by a significant amount. In addition, the Fund monitors for material events or transactions that may occur or become known after the period-end date and before the date the financial statements are released to print. |
| G. | Indemnifications — Under the Trust’s organizational documents, each Trustee, officer, employee or other agent of the Trust is indemnified against certain liabilities that may arise out of the performance of their duties to the Fund. Additionally, in the normal course of business, the Fund enters into contracts, including the Fund’s servicing agreements, that contain a variety of indemnification clauses. The Fund’s maximum exposure under these arrangements is unknown as this would involve future claims that may be made against the Fund that have not yet occurred. The risk of material loss as a result of such indemnification claims is considered remote. |
NOTE 2—Advisory Fees and Other Fees Paid to Affiliates
The Trust has entered into a master investment advisory agreement with Invesco. Under the terms of the investment advisory agreement, the Fund does not pay an advisory fee. However, the Fund pays advisory fees to Invesco indirectly as a shareholder of the underlying funds.
Under the terms of a master sub-advisory agreement between the Adviser and each of Invesco Asset Management Deutschland GmbH, Invesco Asset Management Limited, Invesco Asset Management (Japan) Limited, Invesco Australia Limited, Invesco Hong Kong Limited, Invesco Senior Secured Management, Inc. and Invesco Canada Ltd. (collectively, the “Affiliated Sub-Advisers”) the Adviser, not the Fund, may pay 40% of the fees paid to the Adviser to any such Affiliated Sub-Adviser(s) that provide(s) discretionary investment management services to the Fund or underlying funds based on the percentage of assets allocated to such Sub-Adviser(s).
Effective, May 1, 2012, the Adviser has contractually agreed, through at least April 30, 2014, to reimburse expenses to the extent necessary to limit total annual fund operating expenses after expense reimbursement (excluding certain items discussed below) of Class A, Class B, Class C, Class R, Class Y and Class R5 shares to 0.25%, 1.00%, 1.00%, 0.50%, 0.00% and 0.00% of average daily net assets, respectively. Prior to May 1, 2012, the Adviser had contractually agreed to reimburse expenses to the extent necessary to limit total annual fund operating expenses after expense reimbursement (excluding certain items discussed below) of Class A, Class B, Class C, Class R, Class Y and Class R5 shares to 0.28%, 1.03%, 1.03%, 0.53%, 0.03% and 0.03% of average daily net assets, respectively. In determining Adviser’s obligation to reimburse expenses, the following expenses are not taken into account, and could cause the total annual fund operating expenses after expense reimbursement to exceed the numbers reflected above: (1) interest; (2) taxes; (3) dividend expense on short sales; (4) extraordinary or non-routine items, including litigation expenses; and (5) expenses that the Fund has incurred but did not actually pay because of an expense offset arrangement. Acquired Fund Fees and Expenses are not fees and expenses incurred by the Fund directly but are fees and expenses, including management fees, of the investment companies in which the Fund invests. As a result, total annual fund operating expenses may exceed the expense limits above. You incur these expenses indirectly through the valuation of the Fund’s investment in those investment companies. The impact of the Acquired Fund Fees and Expenses are included in the total return of the Fund. Unless the Board of Trustees and Invesco mutually agree to amend or continue the fee waiver agreement, it will terminate on April 30, 2014.
For the year ended December 31, 2012, the Adviser reimbursed Fund level expenses of $223,069 and reimbursed class level expenses of $107,367, $9,203, $32,388, $2,322, $2,133 and $58 of Class A, Class B, Class C, Class R, Class Y and Class R5 shares, respectively.
The Trust has entered into a master administrative services agreement with Invesco pursuant to which the Fund has agreed to pay Invesco for certain administrative costs incurred in providing accounting services to the Fund. For the year ended December 31, 2012, expenses incurred under the agreement are shown in the Statement of Operations as Administrative services fees.
The Trust has entered into a transfer agency and service agreement with Invesco Investment Services, Inc. (“IIS”) pursuant to which the Fund has agreed to pay IIS a fee for providing transfer agency and shareholder services to the Fund and reimburse IIS for certain expenses incurred by IIS in the course of providing such services. IIS may make payments to intermediaries that provide omnibus account services, sub-accounting services and/or networking services. All fees payable by IIS to intermediaries that provide omnibus account services or sub-accounting are charged back to the Fund, subject to certain limitations approved by the Trust’s Board of Trustees. For the year ended December 31, 2012, expenses incurred under the agreement are shown in the Statement of Operations as Transfer agent fees.
The Trust has entered into master distribution agreements with Invesco Distributors, Inc. (“IDI”) to serve as the distributor for the Class A, Class B, Class C, Class R, Class Y and Class R5 shares of the Fund. The Trust has adopted plans pursuant to Rule 12b-1 under the 1940 Act with respect to the Fund’s Class A, Class B, Class C and Class R shares (collectively, the “Plans”). The Fund, pursuant to the Plans, pays IDI compensation at the annual rate of 0.25% of the Fund’s average daily net assets of Class A shares, 1.00% of the average daily net assets of Class B and Class C shares and 0.50% of the average daily net assets of Class R shares. Of the Plan payments, up to 0.25% of the average daily net assets of each class of shares may be paid to furnish continuing personal shareholder services to customers who purchase and own shares of such classes. Any amounts not paid as a service fee under the Plans would constitute an asset-based sales charge. Rules of the Financial Industry Regulatory Authority (“FINRA”) impose a
16 Invesco Income Allocation Fund
cap on the total sales charges, including asset-based sales charges, that may be paid by any class of shares of the Fund. For the year ended December 31, 2012, expenses incurred under the Plans are shown in the Statement of Operations as Distribution fees.
Front-end sales commissions and CDSC (collectively, the “sales charges”) are not recorded as expenses of the Fund. Front-end sales commissions are deducted from proceeds from the sales of Fund shares prior to investment in Class A shares of the Fund. CDSC are deducted from redemption proceeds prior to remittance to the shareholder. During the year ended December 31, 2012, IDI advised the Fund that IDI retained $66,498 in front-end sales commissions from the sale of Class A shares and $399, $5,854 and $1,419 from Class A, Class B and Class C shares, respectively, for CDSC imposed on redemptions by shareholders.
The underlying Invesco Funds pay no distribution fees for Class R5 and Class R6 shares and the Fund pays no sales loads or other similar compensation to IDI for acquiring underlying fund shares.
Certain officers and trustees of the Trust are officers and directors of the Adviser, IIS and/or IDI.
NOTE 3—Additional Valuation Information
GAAP defines fair value as the price that would be received to sell an asset or paid to transfer a liability in an orderly transaction between market participants at the measurement date, under current market conditions. GAAP establishes a hierarchy that prioritizes the inputs to valuation methods giving the highest priority to readily available unadjusted quoted prices in an active market for identical assets (Level 1) and the lowest priority to significant unobservable inputs (Level 3) generally when market prices are not readily available or are unreliable. Based on the valuation inputs, the securities or other investments are tiered into one of three levels. Changes in valuation methods may result in transfers in or out of an investment’s assigned level:
| Level 1 — | Prices are determined using quoted prices in an active market for identical assets. |
| Level 2 — | Prices are determined using other significant observable inputs. Observable inputs are inputs that other market participants may use in pricing a security. These may include quoted prices for similar securities, interest rates, prepayment speeds, credit risk, yield curves, loss severities, default rates, discount rates, volatilities and others. |
| Level 3 — | Prices are determined using significant unobservable inputs. In situations where quoted prices or observable inputs are unavailable (for example, when there is little or no market activity for an investment at the end of the period), unobservable inputs may be used. Unobservable inputs reflect the Fund’s own assumptions about the factors market participants would use in determining fair value of the securities or instruments and would be based on the best available information. |
The following is a summary of the tiered valuation input levels, as of December 31, 2012. The level assigned to the securities valuations may not be an indication of the risk or liquidity associated with investing in those securities.
| Level 1 | Level 2 | Level 3 | Total | |||||||||||||
Equity Securities | $ | 119,757,715 | $ | — | $ | — | $ | 119,757,715 | ||||||||
NOTE 4—Expense Offset Arrangement(s)
The expense offset arrangement is comprised of transfer agency credits which result from balances in Demand Deposit Accounts (DDA) used by the transfer agent for clearing shareholder transactions. For the year ended December 31, 2012, the Fund received credits from this arrangement, which resulted in the reduction of the Fund’s total expenses of $389.
NOTE 5—Trustees’ and Officers’ Fees and Benefits
“Trustees’ and Officers’ Fees and Benefits” include amounts accrued by the Fund to pay remuneration to certain Trustees and Officers of the Fund. Trustees have the option to defer compensation payable by the Fund, and “Trustees’ and Officers’ Fees and Benefits” also include amounts accrued by the Fund to fund such deferred compensation amounts. Those Trustees who defer compensation have the option to select various Invesco Funds in which their deferral accounts shall be deemed to be invested. Finally, certain current Trustees are eligible to participate in a retirement plan that provides for benefits to be paid upon retirement to Trustees over a period of time based on the number of years of service. The Fund may have certain former Trustees who also participate in a retirement plan and receive benefits under such plan. “Trustees’ and Officers’ Fees and Benefits” include amounts accrued by the Fund to fund such retirement benefits. Obligations under the deferred compensation and retirement plans represent unsecured claims against the general assets of the Fund.
NOTE 6—Cash Balances
The Fund is permitted to temporarily carry a negative or overdrawn balance in its account with State Street Bank and Trust Company, the custodian bank. Such balances, if any at period end, are shown in the Statement of Assets and Liabilities under the payable caption Amount due custodian. To compensate the custodian bank for such overdrafts, the overdrawn Fund may either (1) leave funds as a compensating balance in the account so the custodian bank can be compensated by earning the additional interest; or (2) compensate by paying the custodian bank at a rate agreed upon by the custodian bank and Invesco, not to exceed the contractually agreed upon rate.
17 Invesco Income Allocation Fund
NOTE 7—Distributions to Shareholders and Tax Components of Net Assets
Tax Character of Distributions to Shareholders Paid During the Years Ended December 31, 2012 and 2011:
| 2012 | 2011 | |||||||
Ordinary income | $ | 3,543,095 | $ | 3,074,125 | ||||
Tax Components of Net Assets at Period-End:
| 2012 | ||||
Undistributed ordinary income | $ | 1,102,216 | ||
Net unrealized appreciation (depreciation) — investments | (2,626,855 | ) | ||
Temporary book/tax differences | (27,335 | ) | ||
Capital loss carryforward | (3,955,644 | ) | ||
Shares of beneficial interest | 125,246,639 | |||
Total net assets | $ | 119,739,021 | ||
The difference between book-basis and tax-basis unrealized appreciation (depreciation) is due to differences in the timing of recognition of gains and losses on investments for tax and book purposes. The Fund’s net unrealized appreciation (depreciation) difference is attributable primarily to wash sales.
The temporary book/tax differences are a result of timing differences between book and tax recognition of income and/or expenses. The Fund’s temporary book/tax differences are the result of the trustee deferral of compensation and retirement plan benefits.
Capital loss carryforward is calculated and reported as of a specific date. Results of transactions and other activity after that date may affect the amount of capital loss carryforward actually available for the Fund to utilize. The Regulated Investment Company Modernization Act of 2010 (the “Act”) eliminated the eight-year carryover period for capital losses that arise in taxable years beginning after its enactment date of December 22, 2010. Consequently, these capital losses can be carried forward for an unlimited period. However, capital losses with an expiration period may not be used to offset capital gains until all net capital losses without an expiration date have been utilized. Additionally, post-enactment capital loss carryovers will retain their character as either short-term or long-term capital losses instead of as short-term capital losses as under prior law. The ability to utilize capital loss carryforward in the future may be limited under the Internal Revenue Code and related regulations based on the results of future transactions.
The Fund utilized $296,250 of capital loss carryforward in the current period to offset net realized capital gain for federal income tax purposes. The Fund has a capital loss carryforward as of December 31, 2012, which expires as follows:
| Capital Loss Carryforward* | ||||||||||||
| Expiration | Short-Term | Long-Term | Total | |||||||||
December 31, 2016 | $ | 1,382,854 | $ | — | $ | 1,382,854 | ||||||
December 31, 2017 | 2,118,568 | — | 2,118,568 | |||||||||
December 31, 2018 | 454,222 | — | 454,222 | |||||||||
Total capital loss carryforward | $ | 3,955,644 | $ | — | $ | 3,955,644 | ||||||
| * | Capital loss carryforward as of the date listed above is reduced for limitations, if any, to the extent required by the Internal Revenue Code. |
NOTE 8—Investment Securities
The aggregate amount of investment securities (other than short-term securities, U.S. Treasury obligations and money market funds, if any) purchased and sold by the Fund during the year ended December 31, 2012 was $40,313,368 and $21,133,116, respectively. Cost of investments on a tax basis includes the adjustments for financial reporting purposes as of the most recently completed federal income tax reporting period-end.
| Unrealized Appreciation (Depreciation) of Investment Securities on a Tax Basis | ||||
Aggregate unrealized appreciation of investment securities | $ | — | ||
Aggregate unrealized (depreciation) of investment securities | (2,626,855 | ) | ||
Net unrealized appreciation (depreciation) of investment securities | $ | (2,626,855 | ) | |
Cost of investments for tax purposes is $122,384,570.
NOTE 9—Reclassification of Permanent Differences
Primarily as a result of differing book/tax treatment of capital gain distributions, on December 31, 2012, undistributed net investment income was increased by $196,791 and undistributed net realized gain (loss) was decreased by $196,791. This reclassification had no effect on the net assets of the Fund.
18 Invesco Income Allocation Fund
NOTE 10—Share Information
| Summary of Share Activity | ||||||||||||||||
| Years ended December 31, | ||||||||||||||||
| 2012(a) | 2011 | |||||||||||||||
| Shares | Amount | Shares | Amount | |||||||||||||
Sold: | ||||||||||||||||
Class A | 2,833,744 | $ | 28,782,224 | 2,396,334 | $ | 23,310,387 | ||||||||||
Class B | 125,081 | 1,264,189 | 257,397 | 2,504,611 | ||||||||||||
Class C | 614,478 | 6,239,154 | 609,727 | 5,912,379 | ||||||||||||
Class R | 93,036 | 936,093 | 43,121 | 418,621 | ||||||||||||
Class Y | 171,353 | 1,753,048 | 127,972 | 1,229,326 | ||||||||||||
Class R5 | 20,853 | 213,827 | 4,040 | 39,619 | ||||||||||||
Issued as reinvestment of dividends: | ||||||||||||||||
Class A | 217,470 | 2,199,080 | 186,710 | 1,795,298 | ||||||||||||
Class B | 14,603 | 147,470 | 17,906 | 172,494 | ||||||||||||
Class C | 51,076 | 516,445 | 49,249 | 474,068 | ||||||||||||
Class R | 5,262 | 53,334 | 3,879 | 37,343 | ||||||||||||
Class Y | 4,547 | 46,052 | 3,051 | 29,416 | ||||||||||||
Class R5 | 345 | 3,520 | 63 | 607 | ||||||||||||
Automatic conversion of Class B shares to Class A shares: | ||||||||||||||||
Class A | 85,209 | 854,521 | 105,508 | 1,030,549 | ||||||||||||
Class B | (85,359 | ) | (854,521 | ) | (105,475 | ) | (1,030,549 | ) | ||||||||
Reacquired: | ||||||||||||||||
Class A | (1,522,938 | ) | (15,350,231 | ) | (1,822,441 | ) | (17,677,602 | ) | ||||||||
Class B | (163,555 | ) | (1,645,039 | ) | (190,529 | ) | (1,857,828 | ) | ||||||||
Class C | (520,556 | ) | (5,246,640 | ) | (563,048 | ) | (5,487,894 | ) | ||||||||
Class R | (37,306 | ) | (375,279 | ) | (36,789 | ) | (362,451 | ) | ||||||||
Class Y | (110,276 | ) | (1,100,652 | ) | (53,371 | ) | (515,714 | ) | ||||||||
Class R5 | (2,144 | ) | (22,103 | ) | (2,458 | ) | (23,519 | ) | ||||||||
Net increase in share activity | 1,794,923 | $ | 18,414,492 | 1,030,846 | $ | 9,999,161 | ||||||||||
| (a) | There are entities that are record owners of more than 5% of the outstanding shares of the Fund and in the aggregate own 36% of the outstanding shares of the Fund. IDI has an agreement with these entities to sell Fund shares. The Fund, Invesco and/or Invesco affiliates may make payments to these entities, which are considered to be related to the Fund, for providing services to the Fund, Invesco and/or Invesco affiliates including but not limited to services such as securities brokerage, distribution, third party record keeping and account servicing. The Fund has no knowledge as to whether all or any portion of the shares owned of record by these entities are also owned beneficially. |
19 Invesco Income Allocation Fund
NOTE 11—Financial Highlights
The following schedule presents financial highlights for a share of the Fund outstanding throughout the periods indicated.
| Net asset value, beginning of period | Net investment income(a) | Net gains (losses) on securities (both realized and unrealized) | Total from investment operations | Dividends from net investment income | Distributions from net realized gains | Total distributions | Net asset value, end of period | Total return(b) | Net assets, end of period (000’s omitted) | Ratio of expenses to average net assets with fee waivers and/or expenses absorbed(c) | Ratio of expenses to average net assets without fee waivers and/or expenses absorbed | Ratio of net investment income to average net assets | Portfolio turnover(d) | |||||||||||||||||||||||||||||||||||||||||||
Class A |
| |||||||||||||||||||||||||||||||||||||||||||||||||||||||
Year ended 12/31/12 | $ | 9.62 | $ | 0.40 | $ | 0.72 | $ | 1.12 | $ | (0.36 | ) | $ | — | $ | (0.36 | ) | $ | 10.38 | 11.83 | % | $ | 85,518 | 0.26 | %(e) | 0.63 | %(e) | 3.96 | %(e) | 20 | % | ||||||||||||||||||||||||||
Year ended 12/31/11 | 9.64 | 0.39 | (0.05 | ) | 0.34 | (0.36 | ) | — | (0.36 | ) | 9.62 | 3.54 | 63,727 | 0.28 | 0.65 | 4.00 | 11 | |||||||||||||||||||||||||||||||||||||||
Year ended 12/31/10 | 9.13 | 0.40 | 0.50 | 0.90 | (0.39 | ) | — | (0.39 | ) | 9.64 | 10.02 | 55,556 | 0.28 | 0.67 | 4.22 | 16 | ||||||||||||||||||||||||||||||||||||||||
Year ended 12/31/09 | 7.94 | 0.41 | 1.19 | 1.60 | (0.41 | ) | — | (0.41 | ) | 9.13 | 20.80 | 49,394 | 0.28 | 0.74 | 4.94 | 20 | ||||||||||||||||||||||||||||||||||||||||
Year ended 12/31/08 | 10.60 | 0.55 | (2.46 | ) | (1.91 | ) | (0.55 | ) | (0.20 | ) | (0.75 | ) | 7.94 | (18.88 | ) | 43,926 | 0.28 | 0.67 | 5.69 | 27 | ||||||||||||||||||||||||||||||||||||
Class B |
| |||||||||||||||||||||||||||||||||||||||||||||||||||||||
Year ended 12/31/12 | 9.63 | 0.32 | 0.72 | 1.04 | (0.28 | ) | — | (0.28 | ) | 10.39 | 10.98 | 5,980 | 1.01 | (e) | 1.38 | (e) | 3.21 | (e) | 20 | |||||||||||||||||||||||||||||||||||||
Year ended 12/31/11 | 9.65 | 0.31 | (0.05 | ) | 0.26 | (0.28 | ) | — | (0.28 | ) | 9.63 | 2.77 | 6,592 | 1.03 | 1.40 | 3.25 | 11 | |||||||||||||||||||||||||||||||||||||||
Year ended 12/31/10 | 9.13 | 0.33 | 0.51 | 0.84 | (0.32 | ) | — | (0.32 | ) | 9.65 | 9.31 | 6,811 | 1.03 | 1.42 | 3.47 | 16 | ||||||||||||||||||||||||||||||||||||||||
Year ended 12/31/09 | 7.95 | 0.35 | 1.18 | 1.53 | (0.35 | ) | — | (0.35 | ) | 9.13 | 19.74 | 6,573 | 1.03 | 1.49 | 4.19 | 20 | ||||||||||||||||||||||||||||||||||||||||
Year ended 12/31/08 | 10.61 | 0.48 | (2.46 | ) | (1.98 | ) | (0.48 | ) | (0.20 | ) | (0.68 | ) | 7.95 | (19.46 | ) | 7,177 | 1.03 | 1.42 | 4.94 | 27 | ||||||||||||||||||||||||||||||||||||
Class C |
| |||||||||||||||||||||||||||||||||||||||||||||||||||||||
Year ended 12/31/12 | 9.63 | 0.32 | 0.72 | 1.04 | (0.28 | ) | — | (0.28 | ) | 10.39 | 10.98 | 23,814 | 1.01 | (e) | 1.38 | (e) | 3.21 | (e) | 20 | |||||||||||||||||||||||||||||||||||||
Year ended 12/31/11 | 9.65 | 0.31 | (0.05 | ) | 0.26 | (0.28 | ) | — | (0.28 | ) | 9.63 | 2.77 | 20,669 | 1.03 | 1.40 | 3.25 | 11 | |||||||||||||||||||||||||||||||||||||||
Year ended 12/31/10 | 9.14 | 0.33 | 0.50 | 0.83 | (0.32 | ) | — | (0.32 | ) | 9.65 | 9.18 | 19,802 | 1.03 | 1.42 | 3.47 | 16 | ||||||||||||||||||||||||||||||||||||||||
Year ended 12/31/09 | 7.95 | 0.35 | 1.19 | 1.54 | (0.35 | ) | — | (0.35 | ) | 9.14 | 19.87 | 20,859 | 1.03 | 1.49 | 4.19 | 20 | ||||||||||||||||||||||||||||||||||||||||
Year ended 12/31/08 | 10.61 | 0.48 | (2.46 | ) | (1.98 | ) | (0.48 | ) | (0.20 | ) | (0.68 | ) | 7.95 | (19.47 | ) | 19,324 | 1.03 | 1.42 | 4.94 | 27 | ||||||||||||||||||||||||||||||||||||
Class R |
| |||||||||||||||||||||||||||||||||||||||||||||||||||||||
Year ended 12/31/12 | 9.62 | 0.38 | 0.72 | 1.10 | (0.34 | ) | — | (0.34 | ) | 10.38 | 11.55 | 1,899 | 0.51 | (e) | 0.88 | (e) | 3.71 | (e) | 20 | |||||||||||||||||||||||||||||||||||||
Year ended 12/31/11 | 9.65 | 0.36 | (0.06 | ) | 0.30 | (0.33 | ) | — | (0.33 | ) | 9.62 | 3.18 | 1,173 | 0.53 | 0.90 | 3.75 | 11 | |||||||||||||||||||||||||||||||||||||||
Year ended 12/31/10 | 9.13 | 0.37 | 0.51 | 0.88 | (0.36 | ) | — | (0.36 | ) | 9.65 | 9.86 | 1,078 | 0.53 | 0.92 | 3.97 | 16 | ||||||||||||||||||||||||||||||||||||||||
Year ended 12/31/09 | 7.95 | 0.39 | 1.18 | 1.57 | (0.39 | ) | — | (0.39 | ) | 9.13 | 20.34 | 721 | 0.53 | 0.99 | 4.69 | 20 | ||||||||||||||||||||||||||||||||||||||||
Year ended 12/31/08 | 10.61 | 0.52 | (2.45 | ) | (1.93 | ) | (0.53 | ) | (0.20 | ) | (0.73 | ) | 7.95 | (19.06 | ) | 419 | 0.53 | 0.92 | 5.44 | 27 | ||||||||||||||||||||||||||||||||||||
Class Y |
| |||||||||||||||||||||||||||||||||||||||||||||||||||||||
Year ended 12/31/12 | 9.62 | 0.43 | 0.72 | 1.15 | (0.39 | ) | — | (0.39 | ) | 10.38 | 12.12 | 2,302 | 0.01 | (e) | 0.38 | (e) | 4.21 | (e) | 20 | |||||||||||||||||||||||||||||||||||||
Year ended 12/31/11 | 9.65 | 0.41 | (0.06 | ) | 0.35 | (0.38 | ) | — | (0.38 | ) | 9.62 | 3.70 | 1,502 | 0.03 | 0.40 | 4.25 | 11 | |||||||||||||||||||||||||||||||||||||||
Year ended 12/31/10 | 9.13 | 0.42 | 0.51 | 0.93 | (0.41 | ) | — | (0.41 | ) | 9.65 | 10.42 | 757 | 0.03 | 0.42 | 4.47 | 16 | ||||||||||||||||||||||||||||||||||||||||
Year ended 12/31/09 | 7.94 | 0.44 | 1.18 | 1.62 | (0.43 | ) | — | (0.43 | ) | 9.13 | 21.10 | 459 | 0.03 | 0.49 | 5.19 | 20 | ||||||||||||||||||||||||||||||||||||||||
Year ended 12/31/08(f) | 8.93 | 0.12 | (0.94 | ) | (0.82 | ) | (0.17 | ) | — | (0.17 | ) | 7.94 | (9.14 | ) | 234 | 0.03 | (g) | 0.57 | (g) | 5.94 | (g) | 27 | ||||||||||||||||||||||||||||||||||
Class R5 |
| |||||||||||||||||||||||||||||||||||||||||||||||||||||||
Year ended 12/31/12 | 9.62 | 0.43 | 0.72 | 1.15 | (0.39 | ) | — | (0.39 | ) | 10.38 | 12.12 | 227 | 0.01 | (e) | 0.30 | (e) | 4.21 | (e) | 20 | |||||||||||||||||||||||||||||||||||||
Year ended 12/31/11 | 9.64 | 0.41 | (0.05 | ) | 0.36 | (0.38 | ) | — | (0.38 | ) | 9.62 | 3.81 | 27 | 0.03 | 0.34 | 4.25 | 11 | |||||||||||||||||||||||||||||||||||||||
Year ended 12/31/10 | 9.13 | 0.42 | 0.50 | 0.92 | (0.41 | ) | — | (0.41 | ) | 9.64 | 10.30 | 11 | 0.03 | 0.33 | 4.47 | 16 | ||||||||||||||||||||||||||||||||||||||||
Year ended 12/31/09 | 7.94 | 0.43 | 1.19 | 1.62 | (0.43 | ) | — | (0.43 | ) | 9.13 | 21.10 | 10 | 0.04 | 0.39 | 5.18 | 20 | ||||||||||||||||||||||||||||||||||||||||
Year ended 12/31/08 | 10.60 | 0.56 | (2.44 | ) | (1.88 | ) | (0.58 | ) | (0.20 | ) | (0.78 | ) | 7.94 | (18.67 | ) | 12 | 0.04 | 0.36 | 5.93 | 27 | ||||||||||||||||||||||||||||||||||||
| (a) | Calculated using average shares outstanding. |
| (b) | Includes adjustments in accordance with accounting principles generally accepted in the United States of America and as such, the net asset value for financial reporting purposes and the returns based upon those net asset values may differ from the net asset value and returns for shareholder transactions. Does not include sales charges and is not annualized for periods less than one year, if applicable. |
| (c) | In addition to the fees and expenses which the Fund bears directly; the Fund indirectly bears a pro rata share of the fees and expenses of the underlying funds in which the Fund invests. Because the underlying funds have varied expenses and fee levels and the Fund may own different proportions at different times, the amount of fees and expenses incurred indirectly by the Fund will vary. Estimated underlying fund expenses are not expenses that are incurred directly by your Fund. They are expenses that are incurred directly by the underlying funds and are deducted from the value of the funds your Fund invests in. The effect of the estimated underlying fund expenses that you bear indirectly is included in your Fund’s total return. Estimated acquired fund fees from underlying funds were 0.65%, 0.65%, 0.60%, 0.62% and 0.71% for the years ended December 31, 2012, December 31, 2011, December 31, 2010, December 31, 2009 and December 31, 2008, respectively. |
| (d) | Portfolio turnover is calculated at the fund level and is not annualized for periods less than one year, if applicable. |
| (e) | Ratios are based on average daily net assets (000’s) of $71,966, $6,169, $21,709, $1,556, $1,430 and $80 for Class A, Class B, Class C, Class R, Class Y and Class R5 shares, respectively. |
| (f) | Commencement date of October 3, 2008. |
| (g) | Annualized. |
20 Invesco Income Allocation Fund
Report of Independent Registered Public Accounting Firm
To the Board of Trustees of AIM Growth Series (Invesco Growth Series)
and Shareholders of Invesco Income Allocation Fund:
In our opinion, the accompanying statement of assets and liabilities, including the schedule of investments, and the related statements of operations and of changes in net assets and the financial highlights present fairly, in all material respects, the financial position of Invesco Income Allocation Fund (one of the funds constituting AIM Growth Series (Invesco Growth Series), hereafter referred to as the “Fund”) at December 31, 2012, the results of its operations for the year then ended, the changes in its net assets for each of the two years in the period then ended and the financial highlights for each of the five years in the period then ended, in conformity with accounting principles generally accepted in the United States of America. These financial statements and financial highlights (hereafter referred to as “financial statements”) are the responsibility of the Fund’s management; our responsibility is to express an opinion on these financial statements based on our audits. We conducted our audits of these financial statements in accordance with the standards of the Public Company Accounting Oversight Board (United States). Those standards require that we plan and perform the audit to obtain reasonable assurance about whether the financial statements are free of material misstatement. An audit includes examining, on a test basis, evidence supporting the amounts and disclosures in the financial statements, assessing the accounting principles used and significant estimates made by management, and evaluating the overall financial statement presentation. We believe that our audits, which included confirmation of securities at December 31, 2012 by correspondence with the custodian and transfer agent, provide a reasonable basis for our opinion.
PRICEWATERHOUSECOOPERS LLP
February 25, 2013
Houston, Texas
21 Invesco Income Allocation Fund
Calculating your ongoing Fund expenses
Example
As a shareholder of the Fund, you incur two types of costs: (1) transaction costs, which may include sales charges (loads) on purchase payments or contingent deferred sales charges on redemptions, and redemption fees, if any; and (2) ongoing costs, including distribution and/or service (12b-1) fees, and other Fund expenses. This example is intended to help you understand your ongoing costs (in dollars) of investing in the Fund and to compare these costs with ongoing costs of investing in other mutual funds. The example is based on an investment of $1,000 invested at the beginning of the period and held for the entire period July 1, 2012, through December 31, 2012.
In addition to the fees and expenses which the Fund bears directly, the Fund indirectly bears a pro rata share of the fees and expenses of the underlying funds in which your Fund invests. The amount of fees and expenses incurred indirectly by your Fund will vary because the underlying funds have varied expenses and fee levels and the Fund may own different proportions of the underlying funds at different times. Estimated underlying fund expenses are not expenses that are incurred directly by your Fund. They are expenses that are incurred directly by the underlying funds and are deducted from the value of the underlying funds your Fund invests in. The effect of the estimated underlying fund expenses that you bear indirectly are included in your Fund’s total return.
Actual expenses
The table below provides information about actual account values and actual expenses. You may use the information in this table, together with the amount you invested, to estimate the expenses that you paid over the period. Simply divide your account value by $1,000 (for example, an $8,600 account value divided by $1,000 = 8.6), then multiply the result by the number in the table under the heading entitled “Actual Expenses Paid During Period” to estimate the expenses you paid on your account during this period.
Hypothetical example for comparison purposes
The table below also provides information about hypothetical account values and hypothetical expenses based on the Fund’s actual expense ratio and an assumed rate of return of 5% per year before expenses, which is not the Fund’s actual return.
The hypothetical account values and expenses may not be used to estimate the actual ending account balance or expenses you paid for the period. You may use this information to compare the ongoing costs of investing in the Fund and other funds. To do so, compare this 5% hypothetical example with the 5% hypothetical examples that appear in the shareholder reports of the other funds.
Please note that the expenses shown in the table are meant to highlight your ongoing costs only and do not reflect any transaction costs, such as sales charges (loads) on purchase payments, contingent deferred sales charges on redemptions, and redemption fees, if any. Therefore, the hypothetical information is useful in comparing ongoing costs only, and will not help you determine the relative total costs of owning different funds. In addition, expenses shown in the table do not include the expenses of the underlying funds, which are borne indirectly by the Fund. If transaction costs and indirect expenses were included, your costs would have been higher.
| Class | Beginning Account Value (07/01/12) | ACTUAL | HYPOTHETICAL (5% annual return before | Annualized Expense Ratio | ||||||||||||||||||||
| Ending Account Value (12/31/12)1 | Expenses Paid During Period2 | Ending Account Value (12/31/12) | Expenses Paid During Period2 | |||||||||||||||||||||
| A | $ | 1,000.00 | $ | 1,057.80 | $ | 1.29 | $ | 1,023.88 | $ | 1.27 | 0.25 | % | ||||||||||||
| B | 1,000.00 | 1,053.70 | 5.16 | 1,020.11 | 5.08 | 1.00 | ||||||||||||||||||
| C | 1,000.00 | 1,053.70 | 5.16 | 1,020.11 | 5.08 | 1.00 | ||||||||||||||||||
| R | 1,000.00 | 1,056.40 | 2.58 | 1,022.62 | 2.54 | 0.50 | ||||||||||||||||||
| Y | 1,000.00 | 1,059.10 | 0.00 | 1,025.14 | 0.00 | 0.00 | ||||||||||||||||||
| R5 | 1,000.00 | 1,059.10 | 0.00 | 1,025.14 | 0.00 | 0.00 | ||||||||||||||||||
| 1 | The actual ending account value is based on the actual total return of the Fund for the period July 1, 2012 through December 31, 2012, after actual expenses and will differ from the hypothetical ending account value which is based on the Fund’s expense ratio and a hypothetical annual return of 5% before expenses. |
| 2 | Expenses are equal to the Fund’s annualized expense ratio as indicated above multiplied by the average account value over the period, multiplied by 184/366 to reflect the most recent fiscal half year. |
22 Invesco Income Allocation Fund
Tax Information
Form 1099-DIV, Form 1042-S and other year—end tax information provide shareholders with actual calendar year amounts that should be included in their tax returns. Shareholders should consult their tax advisors.
The following distribution information is being provided as required by the Internal Revenue Code or to meet a specific state’s requirement.
The Fund designates the following amounts or, if subsequently determined to be different, the maximum amount allowable for its fiscal year ended December 31, 2012:
Federal and State Income Tax | ||||
Qualified Dividend Income* | 26.47 | % | ||
Corporate Dividends Received Deduction* | 20.98 | % | ||
U.S. Treasury Obligations* | 2.95 | % | ||
| * | The above percentages are based on ordinary income dividends paid to shareholders during the Fund’s fiscal year. |
23 Invesco Income Allocation Fund
Trustees and Officers
The address of each trustee and officer is AIM Growth Series (Invesco Growth Series) (the “Trust”), 11 Greenway Plaza, Suite 1000, Houston, Texas 77046-1173. The trustees serve for the life of the Trust, subject to their earlier death, incapacitation, resignation, retirement or removal as more specifically provided in the Trust’s organizational documents. Each officer serves for a one year term or until their successors are elected and qualified. Column two below includes length of time served with predecessor entities, if any.
| Name, Year of Birth and Position(s) Held with the Trust | Trustee and/ or Officer Since | Principal Occupation(s) During Past 5 Years | Number of Funds in Fund Complex Overseen by Trustee | Other Directorship(s) Held by Trustee During Past 5 Years | ||||
| Interested Persons | ||||||||
| Martin L. Flanagan1 — 1960 Trustee | 2007 | Executive Director, Chief Executive Officer and President, Invesco Ltd. (ultimate parent of Invesco and a global investment management firm); Advisor to the Board, Invesco Advisers, Inc. (formerly known as Invesco Institutional (N.A.), Inc.); Trustee, The Invesco Funds; Vice Chair, Investment Company Institute; and Member of Executive Board, SMU Cox School of Business
Formerly: Chairman and Chief Executive Officer, Invesco Advisers, Inc. (registered investment adviser); Director, Chairman, Chief Executive Officer and President, IVZ Inc. (holding company), INVESCO Group Services, Inc. (service provider) and Invesco North American Holdings, Inc. (holding company); Director, Chief Executive Officer and President, Invesco Holding Company Limited (parent of Invesco and a global investment management firm); Director, Invesco Ltd.; Chairman, Investment Company Institute and President, Co-Chief Executive Officer, Co-President, Chief Operating Officer and Chief Financial Officer, Franklin Resources, Inc. (global investment management organization) | 124 | None | ||||
Philip A. Taylor2 — 1954 Trustee, President and Principal Executive Officer | 2006 | Head of North American Retail and Senior Managing Director, Invesco Ltd.; Director, Co-Chairman, Co-President and Co-Chief Executive Officer, Invesco Advisers, Inc. (formerly known as Invesco Institutional (N.A.), Inc.) (registered investment adviser); Director, Chairman, Chief Executive Officer and President, Invesco Management Group, Inc. (formerly known as Invesco Aim Management Group, Inc.) (financial services holding company); Director and President, INVESCO Funds Group, Inc. (registered investment adviser and registered transfer agent); Director and Chairman, Invesco Investment Services, Inc. (formerly known as Invesco Aim Investment Services, Inc.) (registered transfer agent) and IVZ Distributors, Inc. (formerly known as INVESCO Distributors, Inc.) (registered broker dealer); Director, President and Chairman, Invesco Inc. (holding company) and Invesco Canada Holdings Inc. (holding company); Chief Executive Officer, Invesco Corporate Class Inc. (corporate mutual fund company) and Invesco Canada Fund Inc. (corporate mutual fund company); Director, Chairman and Chief Executive Officer, Invesco Canada Ltd. (formerly known as Invesco Trimark Ltd./Invesco Trimark Ltèe) (registered investment adviser and registered transfer agent); Trustee, President and Principal Executive Officer, The Invesco Funds (other than AIM Treasurer’s Series Trust (Invesco Treasurer’s Series Trust) and Short-Term Investments Trust); Trustee and Executive Vice President, The Invesco Funds (AIM Treasurer’s Series Trust (Invesco Treasurer’s Series Trust) and Short-Term Investments Trust only); Director, Invesco Investment Advisers LLC (formerly known as Van Kampen Asset Management); Director, Chief Executive Officer and President, Van Kampen Exchange Corp.
Formerly: Director and Chairman, Van Kampen Investor Services Inc.: Director, Chief Executive Officer and President, 1371 Preferred Inc. (holding company); and Van Kampen Investments Inc.; Director and President, AIM GP Canada Inc. (general partner for limited partnerships); and Van Kampen Advisors, Inc.; Director and Chief Executive Officer, Invesco Trimark Dealer Inc. (registered broker dealer); Director, Invesco Distributors, Inc. (formerly known as Invesco Aim Distributors, Inc.) (registered broker dealer); Manager, Invesco PowerShares Capital Management LLC; Director, Chief Executive Officer and President, Invesco Advisers, Inc.; Director, Chairman, Chief Executive Officer and President, Invesco Aim Capital Management, Inc.; President, Invesco Trimark Dealer Inc. and Invesco Trimark Ltd./Invesco Trimark Ltèe; Director and President, AIM Trimark Corporate Class Inc. and AIM Trimark Canada Fund Inc.; Senior Managing Director, Invesco Holding Company Limited; Trustee and Executive Vice President, Tax-Free Investments Trust; Director and Chairman, Fund Management Company (former registered broker dealer); President and Principal Executive Officer, The Invesco Funds (AIM Treasurer’s Series Trust (Invesco Treasurer’s Series Trust), Short-Term Investments Trust and Tax-Free Investments Trust only); President, AIM Trimark Global Fund Inc. and AIM Trimark Canada Fund Inc. | 124 | None | ||||
Wayne W. Whalen3 — 1939 Trustee | 2010 | Of Counsel, and prior to 2010, partner in the law firm of Skadden, Arps, Slate, Meagher & Flom LLP, legal counsel to certain funds in the Fund Complex
| 137 | Director of the Mutual Fund Directors Forum, a nonprofit membership organization for investment directors; Chairman and Director of the Abraham Lincoln Presidential Library Foundation; and Director of the Stevenson Center for Democracy |
| 1 | Mr. Flanagan is considered an interested person of the Trust because he is an officer of the adviser to the Trust, and an officer and a director of Invesco Ltd., ultimate parent of the adviser to the Trust. |
| 2 | Mr. Taylor is considered an interested person of the Trust because he is an officer and a director of the adviser to, and a director of the principal underwriter of, the Trust. |
| 3 | Mr. Whalen is considered an “interested person” (within the meaning of Section 2(a)(19) of the 1940 Act) of certain Funds in the Invesco Fund Complex by reason of he and his firm currently providing legal services as legal counsel to such Funds in the Invesco Fund Complex. |
T-1 Invesco Income Allocation Fund
Trustees and Officers—(continued)
| Name, Year of Birth and Position(s) Held with the Trust | Trustee and/ or Officer Since | Principal Occupation(s) During Past 5 Years | Number of Funds in Fund Complex Overseen by Trustee | Other Directorship(s) Held by Trustee During Past 5 Years | ||||
| Independent Trustees | ||||||||
Bruce L. Crockett — 1944 Trustee and Chair | 2001 | Chairman, Crockett Technologies Associates (technology consulting company)
Formerly: Director, Captaris (unified messaging provider); Director, President and Chief Executive Officer COMSAT Corporation; and Chairman, Board of Governors of INTELSAT (international communications company) | 124 | ACE Limited (insurance company); and Investment Company Institute | ||||
David C. Arch — 1945 Trustee | 2010 | Chairman and Chief Executive Officer of Blistex Inc., (consumer health care products manufacturer)
Formerly: Member of the Heartland Alliance Advisory Board, a nonprofit organization serving human needs based in Chicago | 137 | Board member of the Illinois Manufacturers’ Association; Member of the Board of Visitors, Institute for the Humanities, University of Michigan | ||||
Frank S. Bayley — 1939 Trustee | 1985 | Retired
Formerly: Director, Badgley Funds, Inc. (registered investment company) (2 portfolios) and General Partner and Of Counsel, law firm of Baker & McKenzie, LLP | 124 | Director and Chairman, C.D. Stimson Company (a real estate investment company); Trustee and Overseer, The Curtis institute of Music | ||||
James T. Bunch — 1942 Trustee | 2003 | Managing Member, Grumman Hill Group LLC (family office private equity management)
Formerly: Founder, Green, Manning & Bunch Ltd. (investment banking firm) (1988-2010); Executive Committee, United States Golf Association; and Director, Policy Studies, Inc. and Van Gilder Insurance Corporation | 124 | Chairman, Board of Governors, Western Golf Association; Chairman-elect, Evans Scholars Foundation; and Director, Denver Film Society | ||||
Rodney F. Dammeyer — 1940 Trustee | 2010 | Chairman of CAC, LLC, (private company offering capital investment and management advisory services)
Formerly: Prior to 2001, Managing Partner at Equity Group Corporate Investments; Prior to 1995, Vice Chairman of Anixter International; Prior to 1985, experience includes Senior Vice President and Chief Financial Officer of Household International, Inc., Executive Vice President and Chief Financial Officer of Northwest Industries, Inc. and Partner of Arthur Andersen & Co.; From 1987 to 2010, Director/Trustee of investment companies in the Van Kampen Funds complex | 126 | Director of Quidel Corporation and Stericycle, Inc.; Prior to May 2008, Trustee of The Scripps Research Institute; Prior to February 2008, Director of Ventana Medical Systems, Inc.; Prior to April 2007, Director of GATX Corporation; Prior to April 2004, Director of TheraSense, Inc. | ||||
Albert R. Dowden — 1941 Trustee | 2001 | Director of a number of public and private business corporations, including the Boss Group, Ltd. (private investment and management); Reich & Tang Funds (5 portfolios) (registered investment company); and Homeowners of America Holding Corporation/ Homeowners of America Insurance Company (property casualty company)
Formerly: Director, Continental Energy Services, LLC (oil and gas pipeline service); Director, CompuDyne Corporation (provider of product and services to the public security market) and Director, Annuity and Life Re (Holdings), Ltd. (reinsurance company); Director, President and Chief Executive Officer, Volvo Group North America, Inc.; Senior Vice President, AB Volvo; Director of various public and private corporations; Chairman, DHJ Media, Inc.; Director Magellan Insurance Company; and Director, The Hertz Corporation, Genmar Corporation (boat manufacturer), National Media Corporation; Advisory Board of Rotary Power International (designer, manufacturer, and seller of rotary power engines); and Chairman, Cortland Trust, Inc. (registered investment company) | 124 | Director of Nature’s Sunshine Products, Inc. | ||||
Jack M. Fields — 1952 Trustee | 2001 | Chief Executive Officer, Twenty First Century Group, Inc. (government affairs company); Owner and Chief Executive Officer, Dos Angeles Ranch, L.P. (cattle, hunting, corporate entertainment); and Discovery Global Education Fund (non-profit)
Formerly: Chief Executive Officer, Texana Timber LP (sustainable forestry company); Director of Cross Timbers Quail Research Ranch (non-profit); and member of the U.S. House of Representatives | 124 | Insperity, Inc. (formerly known as Administaff) | ||||
Prema Mathai-Davis — 1950 Trustee | 2001 | Retired
Formerly: Chief Executive Officer, YWCA of the U.S.A. | 124 | None | ||||
Larry Soll — 1942 Trustee | 2003 | Retired
Formerly: Chairman, Chief Executive Officer and President, Synergen Corp. (a biotechnology company) | 124 | None | ||||
Hugo F. Sonnenschein — 1940 Trustee | 2010 | Distinguished Service Professor and President Emeritus of the University of Chicago and the Adam Smith Distinguished Service Professor in the Department of Economics at the University of Chicago
Formerly: President of the University of Chicago | 137 | Trustee of the University of Rochester and a member of its investment committee. Member of the National Academy of Sciences, the American Philosophical Society and a fellow of the American Academy of Arts and Sciences |
T-2 Invesco Income Allocation Fund
Trustees and Officers—(continued)
| Name, Year of Birth and Position(s) Held with the Trust | Trustee and/ or Officer Since | Principal Occupation(s) During Past 5 Years | Number of Funds in Fund Complex Overseen by Trustee | Other Directorship(s) Held by Trustee During Past 5 Years | ||||
| Independent Trustees—(continued) | ||||||||
Raymond Stickel, Jr. — 1944 Trustee | 2005 | Retired
Formerly: Director, Mainstay VP Series Funds, Inc. (25 portfolios) and Partner, Deloitte & Touche | 124 | None | ||||
| Other Officers | ||||||||
| Russell C. Burk — 1958 Senior Vice President and Senior Officer | 2005 | Senior Vice President and Senior Officer, The Invesco Funds | N/A | N/A | ||||
| John M. Zerr — 1962 Senior Vice President, Chief Legal Officer and Secretary | 2006 | Director, Senior Vice President, Secretary and General Counsel, Invesco Management Group, Inc. (formerly known as Invesco Aim Management Group, Inc.) and Van Kampen Exchange Corp.; Senior Vice President, Invesco Advisers, Inc. (formerly known as Invesco Institutional (N.A.), Inc.) (registered investment adviser); Senior Vice President and Secretary, Invesco Distributors, Inc. (formerly known as Invesco Aim Distributors, Inc.); Director, Vice President and Secretary, Invesco Investment Services, Inc. (formerly known as Invesco Aim Investment Services, Inc.) and IVZ Distributors, Inc. (formerly known as INVESCO Distributors, Inc.); Director and Vice President, INVESCO Funds Group, Inc.; Senior Vice President, Chief Legal Officer and Secretary, The Invesco Funds; Manager, Invesco PowerShares Capital Management LLC; Director, Secretary and General Counsel, Invesco Investment Advisers LLC (formerly known as Van Kampen Asset Management); Secretary and General Counsel, Van Kampen Funds Inc. and Chief Legal Officer, PowerShares Exchange-Traded Fund Trust, PowerShares Exchange-Traded Fund Trust II, PowerShares India Exchange-Traded Fund Trust and PowerShares Actively Managed Exchange-Traded Fund Trust
Formerly: Director and Vice President, Van Kampen Advisors Inc.; Director, Vice President, Secretary and General Counsel Van Kampen Investor Services Inc.; Director, Invesco Distributors, Inc. (formerly known as Invesco Aim Distributors, Inc.); Director, Senior Vice President, General Counsel and Secretary, Invesco Advisers, Inc. and Van Kampen Investments Inc.; Director, Vice President and Secretary, Fund Management Company; Director, Senior Vice President, Secretary, General Counsel and Vice President, Invesco Aim Capital Management, Inc.; Chief Operating Officer and General Counsel, Liberty Ridge Capital, Inc. (an investment adviser); Vice President and Secretary, PBHG Funds (an investment company) and PBHG Insurance Series Fund (an investment company); Chief Operating Officer, General Counsel and Secretary, Old Mutual Investment Partners (a broker-dealer); General Counsel and Secretary, Old Mutual Fund Services (an administrator) and Old Mutual Shareholder Services (a shareholder servicing center); Executive Vice President, General Counsel and Secretary, Old Mutual Capital, Inc. (an investment adviser); and Vice President and Secretary, Old Mutual Advisors Funds (an investment company) | N/A | N/A | ||||
| Karen Dunn Kelley — 1960 Vice President | 2004 | Head of Invesco’s World Wide Fixed Income and Cash Management Group; Senior Vice President, Invesco Management Group, Inc. (formerly known as Invesco Aim Management Group, Inc.) and Invesco Advisers, Inc. (formerly known as Invesco Institutional (N.A.), Inc.) (registered investment adviser); Executive Vice President, Invesco Distributors, Inc. (formerly known as Invesco Aim Distributors, Inc.); Director, Invesco Mortgage Capital Inc., INVESCO Global Asset Management Limited, Invesco Management Company Limited and INVESCO Management S.A.; Vice President, The Invesco Funds (other than AIM Treasurer’s Series Trust (Invesco Treasurer’s Series Trust) and Short-Term Investments Trust); and President and Principal Executive Officer, The Invesco Funds (AIM Treasurer’s Series Trust (Invesco Treasurer’s Series Trust) and Short-Term Investments Trust only)
Formerly: Senior Vice President, Van Kampen Investments Inc.; Vice President, Invesco Advisers, Inc. (formerly known as Invesco Institutional (N.A.), Inc.); Director of Cash Management and Senior Vice President, Invesco Advisers, Inc. and Invesco Aim Capital Management, Inc.; President and Principal Executive Officer, Tax-Free Investments Trust; Director and President, Fund Management Company; Chief Cash Management Officer, Director of Cash Management, Senior Vice President, and Managing Director, Invesco Aim Capital Management, Inc.; Director of Cash Management, Senior Vice President, and Vice President, Invesco Advisers, Inc. and The Invesco Funds (AIM Treasurer’s Series Trust (Invesco Treasurer’s Series Trust), Short-Term Investments Trust and Tax-Free Investments Trust only) | N/A | N/A | ||||
T-3 Invesco Income Allocation Fund
Trustees and Officers—(continued)
| Name, Year of Birth and Position(s) Held with the Trust | Trustee and/ or Officer Since | Principal Occupation(s) During Past 5 Years | Number of Funds in Fund Complex Overseen by Trustee | Other Directorship(s) Held by Trustee During Past 5 Years | ||||
| Other Officers—(continued) | ||||||||
| Sheri Morris — 1964 Vice President, Treasurer and Principal Financial Officer | 1999 | Vice President, Treasurer and Principal Financial Officer, The Invesco Funds; Vice President, Invesco Advisers, Inc. (formerly known as Invesco Institutional (N.A.), Inc.) (registered investment adviser); and Vice President, PowerShares Exchange-Traded Fund Trust, PowerShares Exchange-Traded Fund Trust II, PowerShares India Exchange-Traded Fund Trust and PowerShares Actively Managed Exchange-Traded Fund Trust
Formerly: Vice President, Invesco Aim Advisers, Inc., Invesco Aim Capital Management, Inc. and Invesco Aim Private Asset Management, Inc.; Assistant Vice President and Assistant Treasurer, The Invesco Funds and Assistant Vice President, Invesco Advisers, Inc., Invesco Aim Capital Management, Inc. and Invesco Aim Private Asset Management, Inc.; and Treasurer, PowerShares Exchange-Traded Fund Trust, PowerShares Exchange-Traded Fund Trust II, PowerShares India Exchange-Traded Fund Trust and PowerShares Actively Managed Exchange-Traded Fund Trust | N/A | N/A | ||||
Yinka Akinsola — 1977 Anti-Money Laundering Compliance Officer | 2011 | Anti-Money Laundering Compliance Officer, Invesco Advisers, Inc. (formerly known as Invesco Institutional (N.A.), Inc.) (registered investment adviser); Invesco Distributors, Inc. (formerly known as Invesco Aim Distributors, Inc.), Invesco Investment Services, Inc. (formerly known as Invesco Aim Investment Services, Inc.), Invesco Management Group, Inc., The Invesco Funds, Invesco Van Kampen Closed-End Funds, Van Kampen Exchange Corp., Van Kampen Funds Inc., PowerShares Exchange-Traded Fund Trust, PowerShares Exchange-Traded Fund Trust II, PowerShares India Exchange-Traded Fund Trust, and PowerShares Actively Managed Exchange-Traded Fund Trust
Formerly: Regulatory Analyst III, Financial Industry Regulatory Authority (FINRA) | N/A | N/A | ||||
| Todd L. Spillane — 1958 Chief Compliance Officer | 2006 | Senior Vice President, Invesco Management Group, Inc. (formerly known as Invesco Aim Management Group, Inc.) and Van Kampen Exchange Corp.; Senior Vice President and Chief Compliance Officer, Invesco Advisers, Inc. (registered investment adviser) (formerly known as Invesco Institutional (N.A.), Inc.); Chief Compliance Officer, The Invesco Funds; Vice President, Invesco Distributors, Inc. (formerly known as Invesco Aim Distributors, Inc.) and Invesco Investment Services, Inc. (formerly known as Invesco Aim Investment Services, Inc.)
Formerly: Chief Compliance Officer, Invesco Van Kampen Closed-End Funds; Senior Vice President, Van Kampen Investments Inc.; Senior Vice President and Chief Compliance Officer, Invesco Aim Advisers, Inc. and Invesco Aim Capital Management, Inc.; Chief Compliance Officer, INVESCO Private Capital Investments, Inc. (holding company), Invesco Private Capital, Inc. (registered investment adviser), Invesco Global Asset Management (N.A.), Inc., Invesco Senior Secured Management, Inc. (registered investment adviser), Van Kampen Investor Services Inc., PowerShares Exchange-Traded Fund Trust, PowerShares Exchange-Traded Fund Trust II, PowerShares India Exchange-Traded Fund Trust and PowerShares Actively Managed Exchange-Traded Fund Trust; and Vice President, Invesco Aim Capital Management, Inc. and Fund Management Company | N/A | N/A |
The Statement of Additional Information of the Trust includes additional information about the Fund’s Trustees and is available upon request, without charge, by calling 1.800.959.4246. Please refer to the Fund’s prospectus for information on the Fund’s sub-advisers.
Office of the Fund 11 Greenway Plaza, Suite 1000 Houston, TX 77046-1173 | Investment Adviser Invesco Advisers, Inc. 1555 Peachtree Street, N.E. Atlanta, GA 30309 | Distributor Invesco Distributors, Inc. 11 Greenway Plaza, Suite 1000 Houston, TX 77046-1173 | Auditors PricewaterhouseCoopers LLP 1201 Louisiana Street, Suite 2900 Houston, TX 77002-5678 | |||
Counsel to the Fund Stradley Ronon Stevens & Young, LLP 2005 Market Street, Suite 2600 Philadelphia, PA 19103-7018 | Counsel to the Independent Trustees Goodwin Procter LLP 901 New York Avenue, N.W. | Transfer Agent Invesco Investment Services, Inc. 11 Greenway Plaza, Suite 1000 Houston, TX 77046-1173 | Custodian State Street Bank and Trust Company 225 Franklin Street Boston, MA 02110-2801 | |||
T-4 Invesco Income Allocation Fund

Invesco mailing information
Send general correspondence to Invesco Investment Services, Inc., P.O. Box 219078, Kansas City, MO 64121-9078.
Invesco privacy policy
You share personal and financial information with us that is necessary for your transactions and your account records. We take very seriously the obligation to keep that information confidential and private.
Invesco collects nonpublic personal information about you from account applications or other forms you complete and from your transactions with us or our affiliates. We do not disclose information about you or our former customers to service providers or other third parties except to the extent necessary to service your account and in other limited circumstances as permitted by law. For example, we use this information to facilitate the delivery of transaction confirmations, financial reports, prospectuses and tax forms.
Even within Invesco, only people involved in the servicing of your accounts and compliance monitoring have access to your information. To ensure the highest level of confidentiality and security, Invesco maintains physical, electronic and procedural safeguards that meet or exceed federal standards. Special measures, such as data encryption and authentication, apply to your communications with us on our website. More detail is available to you at invesco.com/privacy.
Important notice regarding delivery of security holder documents
To reduce Fund expenses, only one copy of most shareholder documents may be mailed to shareholders with multiple accounts at the same address (Householding). Mailing of your shareholder documents may be householded indefinitely unless you instruct us otherwise. If you do not want the mailing of these documents to be combined with those for other members of your household, please contact Invesco Investment Services, Inc. at 800 959 4246 or contact your financial institution. We will begin sending you individual copies for each account within 30 days after receiving your request.
Fund holdings and proxy voting information
The Fund provides a complete list of its holdings four times in each fiscal year, at the quarter-ends. For the second and fourth quarters, the lists appear in the Fund’s semiannual and annual reports to shareholders. For the first and third quarters, the Fund files the lists with the Securities and Exchange Commission (SEC) on Form N-Q. The most recent list of portfolio holdings is available at invesco.com/completeqtrholdings. Shareholders can also look up the Fund’s Forms
N-Q on the SEC website at sec.gov. Copies of the Fund’s Forms N-Q may be reviewed and copied at the SEC Public Reference Room in Washington, D.C. You can obtain information on the operation of the Public Reference Room, including information about duplicating fee charges, by calling 202 551 8090 or 800 732 0330, or by electronic request at the following email address: publicinfo@sec.gov. The SEC file numbers for the Fund are shown below.
A description of the policies and procedures that the Fund uses to determine how to vote proxies relating to portfolio securities is available without charge, upon request, from our Client Services department at 800 959 4246 or at invesco.com/proxyguidelines. The information is also available on the SEC website, sec.gov.
Information regarding how the Fund voted proxies related to its portfolio securities during the 12 months ended June 30, 2012, is available at invesco.com/proxysearch. The information is also available on the SEC website, sec.gov. Invesco Advisers, Inc. is an investment adviser; it provides investment advisory services to individual and institutional clients and does not sell securities. Invesco Distributors, Inc. is the US distributor for Invesco Ltd.’s retail mutual funds, exchange-traded funds and institutional money market funds. Both are wholly owned, indirect subsidiaries of Invesco Ltd. |  | |
| SEC file numbers: 811-02699 and 002-57526 INCAL-AR-1 Invesco Distributors, Inc. | ||
 | Annual Report to Shareholders
| December 31, 2012 | ||
| ||||
| Invesco International Allocation Fund | ||||
Nasdaq: | ||||
| A: AINAX n B: INABX n C: INACX n R: RINAX n Y: AINYX n R5: INAIX | ||||

Letters to Shareholders
Philip Taylor | Dear Shareholders: This annual report contains information about your Fund and the factors that affected its performance during the reporting period. Inside, you’ll find a discussion from your portfolio managers about how they managed your Fund, performance data for your Fund, a complete list of your Fund’s investments as of the close of the reporting period and other important information. I hope you find this report of interest. The reporting period covered by this report was challenging. As the year began, investors cheered generally positive economic indicators, and markets generally rose. Soon, however, US economic data turned mixed and investors’ attention shifted to the efforts of eurozone governments to implement new policies intended to reduce debt levels, strengthen the | ||||||||

banking system and stimulate economic growth. Later in the year, in the US, mixed economic data, competing proposals on how to reduce the federal budget deficit and a contentious presidential contest increased investor uncertainty and hindered market performance. Throughout the year, your Fund’s portfolio managers adhered to their long-term investment strategies, and later in this report they explain why your Fund performed as it did during the reporting period.
Adhering to your long-term investment plan can be difficult, particularly during periods of market volatility and economic uncertainty. That’s one reason Invesco suggests investors work with a skilled and trusted financial adviser who is familiar with their financial situation, investment goals and risk tolerance. A good financial adviser can provide insight and perspective when markets are volatile; motivation and reassurance when times are uncertain; and advice and recommendations when your financial situation or investment goals change.
Timely insight and information from many of Invesco’s investment professionals is available at our website, invesco.com/us. We offer in-depth articles, video clips and audio commentaries from many of our portfolio managers and other investment professionals on a wide range of topics of interest to investors. At invesco.com/us, you also can access information about your Invesco account at any time.
What we mean by Intentional Investing
At Invesco, all of our people and all of our resources are dedicated to helping investors achieve their financial objectives. It’s a philosophy we call Intentional Investing®, and it guides the way we:
| n | Manage investments – Our dedicated investment professionals search the world for the best opportunities, and each investment team follows a clear, disciplined process to build portfolios and mitigate risk. |
| n | Provide choices – We offer equity, fixed income, asset allocation and alternative strategies so you and your financial adviser can build an investment portfolio designed for your individual needs and goals. |
| n | Connect with you – We’re committed to giving you the expert insights you need to make informed investing decisions, and we are well-equipped to provide high-quality support for investors and advisers. |
Invesco believes in putting investors first, and that’s why investment management is all we do. Our sole focus on managing your money allows your financial adviser to build a portfolio of Invesco funds appropriate for your investment needs and goals now and when your circumstances change.
Have a question?
If you have a question about your account, please contact an Invesco client services representative at 800 959 4246. If you have an Invesco-related question or comment, feel free to email me directly at phil@invesco.com.
All of us at Invesco look forward to serving your investment management needs for many years to come. Thank you for investing with us.
Sincerely,

Philip Taylor
Senior Managing Director, Invesco Ltd.
2 Invesco International Allocation Fund
Bruce Crockett | Dear Fellow Shareholders: While short-term challenges for the financial markets regularly come and go, it’s clear that significant and longer term economic obstacles remain both here at home and abroad. There appear to be no easy solutions to many of these issues. As a result, the financial markets have had little conviction to respond to what has been slow, yet noticeable improvement in some economic benchmarks in recent months. No one likes uncertainty, especially financial markets. But even in these uncertain times, it appears that investors are still approaching the market with cautious optimism, with some taking on more risk in order to refocus on their long-term savings goals. Maybe this describes you, or perhaps you have been sitting on the sidelines thinking about | ||||||||

getting back into the market, but are still a bit hesitant to act because of market uncertainty. Clearly, risk remains a primary focus for investors of all types. As Trustees of the Invesco Funds, one of our primary responsibilities is to ensure your fund’s adviser is cognizant of the risks in each of the funds it manages. A thoughtful risk management plan may help investors navigate through market turbulence or an economic downturn. This is why we make risk management a critical element of our annual contract renewal process, like the one we complete with Invesco every year.
To be sure, there will always be risks involved with investing, but you shouldn’t let short-term news or your emotions dictate your investments. Because no one can predict with 100% accuracy the movements of financial markets, I strongly encourage you to speak with a professional financial adviser who can assist you in building an investment portfolio that reflects your individual risk tolerance and is designed to help achieve your individual financial objectives.
You can be sure your Board remains committed to doing its part in helping you along the way. In addition to ensuring that your fund’s adviser is focused on the risks in the funds it manages, we also remain committed to managing fund costs and working with your fund’s adviser to provide a compelling and diversified product offering to potentially meet your investing goals.
In that regard, your Board approved a number of fund mergers and the launch of several new funds, including the first Invesco mutual fund available to US retail investors managed by investment professionals at Invesco Perpetual*, one of the largest independent investment managers in the UK.
Let me close by thanking Carl Frischling upon his retirement from the Invesco Funds Board for his 35 years of distinguished service and unwavering commitment to our funds’ shareholders. As always, please contact me at bruce@brucecrockett.com with any questions or concerns you may have.
On behalf of the Board, we look forward to continuing to represent your interests and serving your investment needs.
Sincerely,

Bruce L. Crockett
Independent Chair
Invesco Funds Board of Trustees
| * | Invesco Perpetual is a business name of Invesco Asset Management Limited (IAML), a registered investment adviser. IAML is a wholly owned, indirect subsidiary of Invesco Ltd. |
3 Invesco International Allocation Fund
Management’s Discussion of Fund Performance
Performance summary
For the year ended December 31, 2012, Invesco International Allocation Fund, at net asset value (NAV), had a double-digit return but underperformed its style-specific benchmark, the MSCI All Country World ex-US Index, which returned 16.83%.
Positive absolute results over the reporting period were supported by the Fund’s developed larger-cap international equity exposure. The Fund’s small-cap and emerging markets exposure was supportive as well.
Your Fund’s long-term performance appears later in this report.
Fund vs. Indexes
Total returns, 12/31/11 to 12/31/12, at net asset value (NAV). Performance shown does not include applicable contingent deferred sales charges (CDSC) or front-end sales charges, which would have reduced performance.
| Class A Shares | 13.62 | % | |||
| Class B Shares | 12.78 | ||||
| Class C Shares | 12.78 | ||||
| Class R Shares | 13.35 | ||||
| Class Y Shares | 13.90 | ||||
| Class R5 Shares* | 14.09 | ||||
| MSCI All Country World ex-US Index‚ (Broad Market/Style-Specific Index) | 16.83 | ||||
| Lipper International Multi-Cap Core Funds Index‚ (Peer Group Index) | 18.82 |
Source(s): ‚Lipper Inc.
*Effective September 24, 2012, Institutional Class shares were renamed Class R5 shares.
How we invest
The Fund offers investors convenient entry into international markets through a single, broadly diversified portfolio that has the flexibility to invest across investment styles (growth, value and core), market capitalizations (small and large), sectors and countries (both emerging and developed).
The portfolio blends six unique, complementary funds – Invesco International Core Equity Fund, Invesco International Growth Fund, PowerShares International Dividend AchieversTM Portfolio, Invesco International Small Company Fund, Invesco Developing Markets Fund and Invesco Emerging Markets Equity Fund – to create a versatile core holding that provides broad international diversification across both developed and emerging markets.
We determine target asset class weightings and underlying fund selections for the Fund and monitor the Fund
on an ongoing basis. The underlying funds in the portfolio are actively managed by their respective management teams based on individual fund objectives, investment strategies and management techniques. While the weightings of various underlying funds in the portfolio may vary from their targets during the year due to market movements, we rebalance the portfolio annually to maintain the target asset class allocations.
Market conditions and your Fund
Global equity markets rebounded in the beginning of 2012 following a difficult and volatile year in 2011. Improvements in global economic indicators and continued accommodative policy measures from central banks provided support for the rally in stocks, with some of the worst performing areas of the market in recent years leading the way in the beginning of 2012.
During the year, macroeconomic concerns stemming largely from Greece and Spain eased somewhat as the pro-euro party won the Greek elections and Spanish banks were provided a bailout of up to 100 billion euros. Eurozone leaders also took steps during their most recent summit to allow for the direct recapitalization of banks through European Stability Mechanism (the bailout fund) and to move closer to a regional banking union. In addition, the European Central Bank (ECB) announced new measures to support eurozone economies through potentially unlimited purchases of sovereign debt, with ECB President Mario Draghi pledging to “do whatever it takes” to save the euro (although key details of the plan remain unresolved).
The US Federal Reserve announced a third round of quantitative easing with a promise to continue until the labor market outlook improved materially, and the Bank of Japan took steps to increase its asset purchase program. These easing measures were well received by investors and helped to drive equity markets higher during the year.
Of the underlying funds, Invesco International Core Equity Fund, Invesco International Growth Fund and Powershares International Dividend Achievers Portfolio contributed the most to absolute performance for the reporting period.
Allocations to these three funds accounted for approximately 80% of the overall portfolio. There were no absolute detractors from overall Fund performance.
From a relative performance perspective, all but Invesco Developing Markets Fund, underperformed the Fund’s style-specific index, the MSCI All Country World ex-US Index. The largest relative underperformers included Invesco Emerging Markets Equity Fund and the PowerShares International Dividend Achievers portfolio.
| Portfolio Composition | ||||||||||
| Asset Class | Target Allocation | % of Total Net Assets as of 12/31/12 | ||||||||
| Emerging Markets | 9.00% | 8.78% | ||||||||
| International/Global Blend | 31.00 | 31.67 | ||||||||
| International/Global Growth | 32.50 | 32.26 | ||||||||
| International/Global Value | 27.50 | 27.30 | ||||||||
| Cash Equivalents Plus Other Assets Less Liabilities | 0.00 | -0.01 | ||||||||
Based on the composition of the underlying funds.
| Total Net Assets | $176.7 million |
4 Invesco International Allocation Fund
In closing, volatile markets can test an investor’s resolve, but it’s worth remembering that real investment opportunity can present itself when the markets are turbulent. We welcome any new investors who have joined the Fund during the fiscal year, and we thank all of our shareholders for your continued investment in Invesco International Allocation Fund.
The views and opinions expressed in management’s discussion of Fund performance are those of Invesco Advisers, Inc. These views and opinions are subject to change at any time based on factors such as market and economic conditions. These views and opinions may not be relied upon as investment advice or recommendations, or as an offer for a particular security. The information is not a complete analysis of every aspect of any market, country, industry, security or the Fund. Statements of fact are from sources considered reliable, but Invesco Advisers, Inc. makes no representation or warranty as to their completeness or accuracy. Although historical performance is no guarantee of future results, these insights may help you understand our investment management philosophy.
See important Fund and, if applicable, index disclosures later in this report.
 | Gary Wendler Head of Product Development and Investment Performance/Risk, is manager of Invesco | |
| International Allocation Fund. He joined Invesco in 1995. Mr. Wendler earned a BBA in finance from Texas A&M University. | ||
5 Invesco International Allocation Fund
Your Fund’s Long-Term Performance
Results of a $10,000 Investment – Oldest Share Class(es) since Inception
Fund and index data from 10/31/05
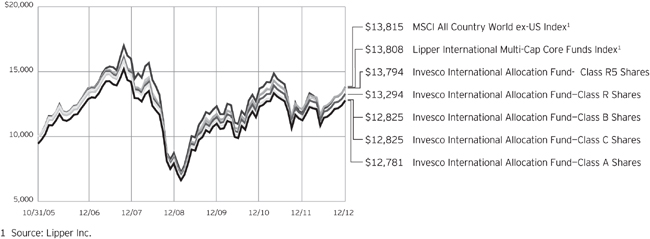
Past performance cannot guarantee comparable future results.
The data shown in the chart include reinvested distributions, applicable sales charges and Fund expenses including management fees. Results for Class B shares are calculated as if a hypothetical
shareholder had liquidated his entire investment in the Fund at the close of the reporting period and paid the contingent deferred sales charges, if applicable. Index results include reinvested dividends, but they do not reflect sales charges. Performance of the peer group,
if applicable, reflects fund expenses and management fees; performance of a market index does not. Performance shown in the chart and table(s) does not reflect deduction of taxes a shareholder would pay on Fund distributions or sale of Fund shares.
6 Invesco International Allocation Fund
| Average Annual Total Returns | |||||
| As of 12/31/12, including maximum applicable sales charges | |||||
| Class A Shares | |||||
| Inception (10/31/05) | 3.48 | % | |||
| 5 Years | -3.19 | ||||
| 1 Year | 7.35 | ||||
| Class B Shares | |||||
| Inception (10/31/05) | 3.53 | % | |||
| 5 Years | -3.15 | ||||
| 1 Year | 7.78 | ||||
| Class C Shares | |||||
| Inception (10/31/05) | 3.53 | % | |||
| 5 Years | -2.82 | ||||
| 1 Year | 11.78 | ||||
| Class R Shares | |||||
| Inception (10/31/05) | 4.05 | % | |||
| 5 Years | -2.34 | ||||
| 1 Year | 13.35 | ||||
| Class Y Shares | |||||
| Inception | 4.47 | % | |||
| 5 Years | -1.88 | ||||
| 1 Year | 13.90 | ||||
| Class R5 Shares | |||||
| Inception (10/31/05) | 4.59 | % | |||
| 5 Years | -1.82 | ||||
| 1 Year | 14.09 | ||||
Class Y shares incepted on October 3, 2008. Performance shown prior to that date is that of Class A shares and includes the 12b-1 fees applicable to Class A shares. Class A share performance reflects any applicable fee waivers or expense reimbursements.
The performance data quoted represent past performance and cannot guarantee comparable future results; current performance may be lower or higher. Please visit invesco.com/performance for the most recent month-end performance. Performance figures reflect reinvested distributions, changes in net asset value and the effect of the maximum sales charge unless otherwise stated. Investment return and principal value will fluctuate so that you may have a gain or loss when you sell shares.
The total annual Fund operating expense ratio set forth in the most recent Fund prospectus as of the date of this report for Class A, Class B, Class C, Class R, Class Y and Class R5 shares was 1.54%, 2.29%, 2.29%, 1.79%, 1.29% and 1.10%, respectively.1 The expense ratios presented above may vary from the expense ratios presented in other sections of this report that are based on expenses incurred during the period covered by this report.
Class A share performance reflects the maximum 5.50% sales charge, and Class B and Class C share performance reflects the applicable contingent deferred sales charge (CDSC) for the period involved. The CDSC on Class B shares declines from 5% beginning at the time of purchase to 0% at the beginning of the seventh year. The CDSC on Class C shares is 1% for the first year after purchase. Class R, Class Y and Class R5 shares do not have a front-end sales charge or a CDSC; therefore, performance is at net asset value.
The performance of the Fund’s share classes will differ primarily due to different sales charge structures and class expenses.
Had the adviser not waived fees and/or reimbursed expenses in the past on the Fund’s Class A, B, C, R and Y shares, performance would have been lower.
| 1 | The expense ratio includes acquired fund fees and expenses of the underlying funds in which the Fund invests of 0.88% for Invesco International Allocation Fund. |
7 Invesco International Allocation Fund
Invesco International Allocation Fund’s investment objective is long-term growth of capital.
| n | Unless otherwise stated, information presented in this report is as of December 31, 2012, and is based on total net assets. |
| n | Unless otherwise noted, all data provided by Invesco. |
| n | To access your Fund’s reports/prospectus, visit invesco.com/fundreports. |
About share classes
| n | Class B shares may not be purchased for new or additional investments. Please see the prospectus for more information. |
| n | Class R shares are generally available only to employer sponsored retirement and benefit plans. Please see the prospectus for more information. |
| n | Class Y shares are available only to certain investors. Please see the prospectus for more information. |
| n | Class R5 shares are primarily intended for employer sponsored retirement and benefit plans that meet certain standards and for institutional investors. On September 24, 2012, Institutional Class shares were renamed Class R5 shares. Please see the prospectus for more information. |
Principal risks of investing in the Fund
| n | Concentration risk. To the extent, an underlying fund invests a greater amount in any one sector or industry, an underlying fund’s performance will depend to a greater extent on the overall condition of the sector or industry, and there is increased risk to an underlying fund if conditions adversely affect that sector or industry. |
| n | Derivatives risk. The performance of derivative instruments is tied to the performance of an underlying currency, security, index or other instrument. In addition to risks relating to their underlying instruments, the use of derivatives may include other, possibly greater, risks. Derivatives involve costs, may be volatile, and may involve a small initial investment relative to the risk assumed. Risks associated with the use of derivatives include counterparty, leverage, correlation, liquidity, tax, market, interest rate and management risks. Derivatives may also be more difficult to purchase, sell or value than other investments. The Fund may lose more than the cash amount invested on investments in |
derivatives. Investors should bear in mind that, while the underlying funds intend to use derivative strategies, they are not obligated to actively engage in these transactions, generally or in any particular kind of derivative, if the investment manager elects not to do so due to availability, cost, market conditions or other factors. |
| n | Developing/emerging markets securities risk. Securities issued by foreign companies and governments located in developing/emerging countries may be affected more negatively by inflation, devaluation of their currencies, higher transaction costs, delays in settlement, adverse political developments, the introduction of capital controls, withholding taxes, nationalization of private assets, expropriation, social unrest, war or lack of timely information than those in developed countries. |
| n | Dividend paying security risk. Securities that pay high dividends as a group can fall out of favor with the market, causing such companies to underperform companies that do not pay high dividends. Also changes in the dividend policies of the companies in the underlying index and the capital resources available for such companies’ dividend payments may affect the Fund. |
| n | Exchange-traded funds risk. An investment by the Fund or underlying fund in exchange-traded funds generally presents the same primary risks as an investment in a mutual fund. In addition, an exchange-traded fund may be subject to the following: (1) a discount of the exchange-traded fund’s shares to its net asset value; (2) failure to develop an active trading market for the exchange-traded fund’s shares; (3) the listing exchange halting trading of the exchange-traded fund’s shares; (4) failure of the exchange-traded fund’s shares to track the referenced index; and (5) holding troubled securities in the referenced index. Exchange-traded funds may involve duplication of management fees and certain other |
expenses, as the Fund or underlying fund indirectly bears its proportionate share of any expenses paid by the exchange-traded funds in which it invests. Further, certain of the exchange-traded funds in which the Fund or underlying fund may invest are leveraged. The more the Fund or underlying fund invests in such leveraged exchange-traded funds, the more this leverage will magnify any losses on those investments. |
| n | Financial services sector risk. The financial services sector is subject to extensive government regulation, which may change frequently. In addition, the profitability of businesses in the financial services sector depends on the availability and cost of money and may fluctuate significantly in response to changes in government regulation, interest rates and general economic conditions. Businesses in the financial sector often operate with substantial financial leverage. |
| n | Foreign securities risk. An underlying fund’s foreign investments may be affected by changes in a foreign country’s exchange rates, political and social instability; changes in economic or taxation policies, difficulties when enforcing obligations, decreased liquidity, and increased volatility. Foreign companies may be subject to less regulation resulting in less publicly available information about the companies. |
| n | Fund of funds risk. The Fund’s performance depends on the underlying funds in which it invests, and it is subject to the risks of the underlying funds. Market fluctuations may change the target weightings in the underlying funds. The underlying funds may change their investment objectives, policies or practices and may not achieve their investment objectives, all of which may cause the Fund to withdraw its investments therein at a disadvantageous time. |
| n | Geographic focus risk. From time to time an underlying fund may invest a |
This report must be accompanied or preceded by a currently effective Fund prospectus, which contains more complete information, including sales charges and expenses. Investors should read it carefully before investing.
NOT FDIC INSURED | MAY LOSE VALUE | NO BANK GUARANTEE
Fund Nasdaq Symbols | |||||
| Class A Shares | AINAX | ||||
| Class B Shares | INABX | ||||
| Class C Shares | INACX | ||||
| Class R Shares | RINAX | ||||
| Class Y Shares | AINYX | ||||
| Class R5 Shares | INAIX |
8 Invesco International Allocation Fund
substantial amount of its assets in securities of issuers located in a single country or a limited number of countries. If an underlying fund focuses its investments in this manner, it assumes the risk that economic, political and social conditions in those countries will have a significant impact on its investment performance. An underlying fund’s investment performance may also be more volatile if it focuses its investments in certain countries, especially emerging market countries. |
| n | Growth investing risk. Growth stocks tend to be more expensive relative to their earnings or assets compared with other types of stock. As a result, they tend to be more sensitive to changes in their earnings and can be more volatile. |
| n | Indexing risk. Unlike many investment companies, an underlying fund does not utilize an investing strategy that seeks returns in excess of the underlying index. Therefore, it would not necessarily sell a security unless that security is removed from the underlying index. |
| n | Investing in the European Union risk. Many countries in the European Union are susceptible to high economic risks associated with high levels of debt, notably due to investments in sovereign debts of European countries such as Greece, Italy and Spain. One or more member states might exit the European Union, placing its currency and banking system in jeopardy. The European Union faces major issues involving its membership, structure, procedures and policies, including the adoption, abandonment or adjustment of the new constitutional treaty, the European Union’s enlargement to the south and east, and resolution of the European Union’s problematic fiscal and democratic accountability. Efforts of the member states to further unify their economic and monetary policies may increase the potential for the downward movement of one member state’s market to cause a similar effect on other member states’ markets. European countries that are part of the European Economic and Monetary Union may be significantly affected by the tight fiscal and monetary controls that the union seeks to impose on its members. |
| n | Issuer-specific changes risk. The value of an individual security or particular type of security can be more volatile than the market as a whole and can perform differently from the value of the market as a whole. |
| n | Management risk. The investment techniques and risk analysis used by the Fund’s and the underlying funds’ portfolio managers may not produce the desired results. |
| n | Market risk. The prices of and the income generated by an underlying fund’s securities may decline in response to, among other things, investor sentiment, general economic and market conditions, regional or global instability, and currency and interest rate fluctuations. |
| n | Market trading risk. Risk is inherent in all investing. An investment in an underlying fund involves risks similar to those of investing in any underlying fund of equity or fixed-income securities traded on exchanges. You should anticipate that the value of the shares will decline, more or less, in correlation with any decline in value of the underlying index of certain underlying exchange-traded funds. |
| n | Non-correlation risk. The preferred equity segment of an underlying fund’s portfolio return may not match the return of the Index for a number of reasons. For example, an underlying fund incurs operating expenses not applicable to the Index, and incurs costs in buying and selling securities, especially when rebalancing securities holdings to reflect changes in the Index. In addition, the performance of the preferred equity segment and the Index may vary due to asset valuation differences and differences between the preferred equity segment and the Index resulting from legal restrictions, cost or liquidity constraints. |
| n | Non-diversification risk. Certain of the underlying funds are non-diversified and can invest a greater portion of their assets in a single issuer. A change in the value of the issuer could affect the value of an underlying fund more than if it was a diversified fund. |
| n | Small- and mid-capitalization risk. Stocks of small and mid-sized companies tend to be more vulnerable to adverse developments in the above factors and may have little or no operating history or track record of success, and limited product lines, markets, management and financial resources. The securities of small and mid-sized companies may be more volatile due to less market interest and less publicly available information about the issuer. They also may be illiquid or restricted as to resale, or may trade less frequently and in smaller volumes, all of which may cause difficulty when establishing or closing a position at a desirable price. |
| n | Synthetic securities risk. Fluctuations in the values of synthetic securities may not correlate perfectly with the instruments they are designed to replicate. Synthetic securities may be subject to interest rate changes, market price fluctuations, counterparty risk and liquidity risk. |
About indexes used in this report
| n | The MSCI All Country World ex-US Index is an index considered representative of developed and emerging market stock markets, excluding the US. |
| n | The Lipper International Multi-Cap Core Funds Index is an unmanaged index considered representative of international multicap core funds tracked by Lipper. |
| n | The Fund is not managed to track the performance of any particular index, including the index(es) defined here, and consequently, the performance of the Fund may deviate significantly from the performance of the index(es). |
| n | A direct investment cannot be made in an index. Unless otherwise indicated, index results include reinvested dividends, and they do not reflect sales charges. Performance of the peer group, if applicable, reflects fund expenses; performance of a market index does not. |
Other information
| n | The returns shown in management’s discussion of Fund performance are based on net asset values calculated for shareholder transactions. Generally accepted accounting principles require adjustments to be made to the net assets of the Fund at period end for financial reporting purposes, and as such, the net asset values for shareholder transactions and the returns based on those net asset values may differ from the net asset values and returns reported in the Financial Highlights. |
| n | Invesco Distributors, Inc. is the distributor of the PowerShares Exchange-Traded Fund Trust. Invesco PowerShares Capital Management LLC and Invesco Distributors, Inc. are indirect, wholly owned subsidiaries of Invesco Ltd. Shares of PowerShares International Dividend Achievers Portfolio are not individually redeemable, and owners of the Shares may acquire those Shares from the Fund and tender those Shares for redemption to the Fund in Creation Units only, typically consisting of aggregations of 50,000 shares. |
9 Invesco International Allocation Fund
Schedule of Investments
December 31, 2012
Invesco International Allocation Fund
Schedule of Investments in Affiliated Issuers–100.19%(a)
| % of Net Assets 12/31/12 | Value 12/31/11 | Purchases at Cost | Proceeds from Sales | Change in Unrealized Appreciation | Realized Gain (Loss) | Dividend Income | Shares 12/31/12 | Value 12/31/12 | ||||||||||||||||||||||||||||
Foreign Equity Funds–100.01% |
| |||||||||||||||||||||||||||||||||||
Invesco Developing Markets Fund | 4.43 | % | $ | 7,679,859 | $ | 341,713 | $ | (1,520,370 | ) | $ | 1,410,587 | $ | (82,419 | ) | $ | 92,074 | 231,433 | $ | 7,829,370 | |||||||||||||||||
Invesco Emerging Markets Equity Fund | 4.35 | % | 7,057,298 | 1,116,073 | (1,168,153 | ) | 852,936 | (171,128 | ) | 95,809 | 956,098 | 7,687,026 | ||||||||||||||||||||||||
Invesco International Core Equity Fund | 31.67 | % | 52,895,418 | 4,931,976 | (8,047,272 | ) | 11,382,844 | (5,204,579 | ) | 1,383,575 | 5,406,607 | 55,958,387 | ||||||||||||||||||||||||
Invesco International Growth Fund | 22.05 | % | 39,860,380 | 1,770,681 | (7,780,234 | ) | 6,382,748 | (1,284,006 | ) | 522,484 | 1,333,889 | 38,949,569 | ||||||||||||||||||||||||
Invesco International Small Company Fund | 10.21 | % | 17,778,698 | 656,498 | (3,018,059 | ) | 3,146,173 | (521,443 | ) | 101,743 | 870,747 | 18,041,867 | ||||||||||||||||||||||||
PowerShares International Dividend | 27.30 | % | 49,368,114 | 1,244,167 | (6,373,078 | ) | 4,905,616 | (912,898 | ) | 1,394,165 | 3,048,794 | 48,231,921 | ||||||||||||||||||||||||
Total Foreign Equity Funds | 100.01 | % | 174,639,767 | 10,061,108 | (27,907,166 | ) | 28,080,904 | (8,176,473 | ) | 3,589,850 | 176,698,140 | |||||||||||||||||||||||||
Money Market Funds–0.18% |
| |||||||||||||||||||||||||||||||||||
Liquid Assets Portfolio–Institutional Class | 0.09 | % | 478,118 | 8,058,964 | (8,384,667 | ) | — | — | 240 | 152,415 | 152,415 | |||||||||||||||||||||||||
Premier Portfolio–Institutional Class | 0.09 | % | 478,118 | 8,058,964 | (8,384,667 | ) | — | — | 182 | 152,415 | 152,415 | |||||||||||||||||||||||||
Total Money Market Funds | 0.18 | % | 956,236 | 16,117,928 | (16,769,334 | ) | — | — | 422 | 304,830 | ||||||||||||||||||||||||||
TOTAL INVESTMENTS IN AFFILIATED MUTUAL FUNDS (Cost $181,832,337) | 100.19 | % | $ | 175,596,003 | $ | 26,179,036 | $ | (44,676,500 | ) | $ | 28,080,904 | $ | (8,176,473 | ) | $ | 3,590,272 | $ | 177,002,970 | ||||||||||||||||||
OTHER ASSETS LESS LIABILITIES | (0.19 | )% | (343,545 | ) | ||||||||||||||||||||||||||||||||
NET ASSETS | 100.00 | % | $ | 176,659,425 | ||||||||||||||||||||||||||||||||
Investment Abbreviations:
ETF – Exchange-Traded Fund
Notes to Schedule of Investments:
| (a) | Each underlying fund and the Fund are affiliated by either having the same investment adviser or an investment adviser under common control with the Fund’s investment adviser. Effective September 24, 2012, the Fund began investing in Class R6 shares. The Fund invests in Class R6 shares of the mutual funds listed. The Fund invests in the fund shares of the Exchanged-Traded Fund. |
See accompanying Notes to Financial Statements which are an integral part of the financial statements.
10 Invesco International Allocation Fund
Statement of Assets and Liabilities
December 31, 2012
Assets: | ||||
Investments in affiliated underlying funds, at value (Cost $181,832,337) | $ | 177,002,970 | ||
Receivable for: | ||||
Fund shares sold | 205,036 | |||
Dividends from affiliated underlying funds | 21 | |||
Investment for trustee deferred compensation and retirement plans | 22,676 | |||
Other assets | 29,096 | |||
Total assets | 177,259,799 | |||
Liabilities: |
| |||
Payable for: | ||||
Investments purchased | 47,227 | |||
Fund shares reacquired | 256,466 | |||
Amount due custodian | 40,918 | |||
Accrued fees to affiliates | 160,451 | |||
Accrued other operating expenses | 48,705 | |||
Trustee deferred compensation and retirement plans | 46,607 | |||
Total liabilities | 600,374 | |||
Net assets applicable to shares outstanding | $ | 176,659,425 | ||
Net assets consist of: |
| |||
Shares of beneficial interest | $ | 276,808,476 | ||
Undistributed net investment income | 192,931 | |||
Undistributed net realized gain (loss) | (95,512,615 | ) | ||
Unrealized appreciation (depreciation) | (4,829,367 | ) | ||
| $ | 176,659,425 | |||
Net Assets: | ||||
Class A | $ | 125,565,586 | ||
Class B | $ | 10,605,827 | ||
Class C | $ | 27,928,524 | ||
Class R | $ | 5,553,640 | ||
Class Y | $ | 6,731,999 | ||
Class R5 | $ | 273,849 | ||
Shares outstanding, $0.01 par value per share, |
| |||
Class A | 12,628,265 | |||
Class B | 1,066,975 | |||
Class C | 2,810,276 | |||
Class R | 558,475 | |||
Class Y | 679,294 | |||
Class R5 | 27,542 | |||
Class A: | ||||
Net asset value per share | $ | 9.94 | ||
Maximum offering price per share | ||||
(Net asset value of $9.94 ¸ 94.50%) | $ | 10.52 | ||
Class B: | ||||
Net asset value and offering price per share | $ | 9.94 | ||
Class C: | ||||
Net asset value and offering price per share | $ | 9.94 | ||
Class R: | ||||
Net asset value and offering price per share | $ | 9.94 | ||
Class Y: | ||||
Net asset value and offering price per share | $ | 9.91 | ||
Class R5: | ||||
Net asset value and offering price per share | $ | 9.94 | ||
See accompanying Notes to Financial Statements which are an integral part of the financial statements.
11 Invesco International Allocation Fund
Statement of Operations
For the year ended December 31, 2012
Investment income: | ||||
Dividends from affiliated underlying funds | $ | 3,590,272 | ||
Other Income | 516 | |||
Total investment income | 3,590,788 | |||
Expenses: | ||||
Administrative services fees | 50,000 | |||
Custodian fees | 8,266 | |||
Distribution fees: | ||||
Class A | 316,389 | |||
Class B | 113,372 | |||
Class C | 285,402 | |||
Class R | 25,846 | |||
Transfer agent fees — A, B, C, R and Y | 492,096 | |||
Transfer agent fees — R5 | 188 | |||
Trustees’ and officers’ fees and benefits | 27,937 | |||
Other | 176,797 | |||
Total expenses | 1,496,293 | |||
Less: Expenses reimbursed and expense offset arrangement(s) | (148,016 | ) | ||
Net expenses | 1,348,277 | |||
Net investment income | 2,242,511 | |||
Realized and unrealized gain (loss) from: | ||||
Net realized gain (loss) on sales of affiliated underlying fund shares | (8,176,473 | ) | ||
Change in net unrealized appreciation of affiliated underlying fund shares | 28,080,904 | |||
Net gain from affiliated underlying funds | 19,904,431 | |||
Net increase in net assets resulting from operations | $ | 22,146,942 | ||
See accompanying Notes to Financial Statements which are an integral part of the financial statements.
12 Invesco International Allocation Fund
Statement of Changes in Net Assets
For the years ended December 31, 2012 and 2011
| 2012 | 2011 | |||||||
Operations: |
| |||||||
Net investment income | $ | 2,242,511 | $ | 3,483,509 | ||||
Net realized gain (loss) | (8,176,473 | ) | (9,726,030 | ) | ||||
Change in net unrealized appreciation (depreciation) | 28,080,904 | (10,542,051 | ) | |||||
Net increase (decrease) in net assets resulting from operations | 22,146,942 | (16,784,572 | ) | |||||
Distributions to shareholders from net investment income: | ||||||||
Class A | (4,445,461 | ) | (2,146,251 | ) | ||||
Class B | (197,140 | ) | (96,162 | ) | ||||
Class C | (513,227 | ) | (229,007 | ) | ||||
Class R | (161,667 | ) | (69,055 | ) | ||||
Class Y | (267,886 | ) | (83,627 | ) | ||||
Class R5 | (11,642 | ) | (3,600 | ) | ||||
Total distributions from net investment income | (5,597,023 | ) | (2,627,702 | ) | ||||
Share transactions-net: | ||||||||
Class A | (9,641,038 | ) | (3,013,742 | ) | ||||
Class B | (2,960,807 | ) | (3,540,121 | ) | ||||
Class C | (4,664,222 | ) | (6,957,447 | ) | ||||
Class R | 132,282 | (240,796 | ) | |||||
Class Y | 1,863,238 | (103,940 | ) | |||||
Class R5 | 82,039 | 100,679 | ||||||
Net increase (decrease) in net assets resulting from share transactions | (15,188,508 | ) | (13,755,367 | ) | ||||
Net increase (decrease) in net assets | 1,361,411 | (33,167,641 | ) | |||||
Net assets: | ||||||||
Beginning of year | 175,298,014 | 208,465,655 | ||||||
End of year (includes undistributed net investment income of $192,931 and $3,547,443, respectively) | $ | 176,659,425 | $ | 175,298,014 | ||||
Notes to Financial Statements
December 31, 2012
NOTE 1—Significant Accounting Policies
Invesco International Allocation Fund (the “Fund”) is a series portfolio of AIM Growth Series (Invesco Growth Series) (the “Trust”). The Trust is organized as a Delaware statutory trust and is registered under the Investment Company Act of 1940, as amended (the “1940 Act”), as an open-end series management investment company consisting of sixteen separate series portfolios, each authorized to issue an unlimited number of shares of beneficial interest. The assets, liabilities and operations of each portfolio are accounted for separately. Information presented in these financial statements pertains only to the Fund. Matters affecting each portfolio or class will be voted on exclusively by the shareholders of such portfolio or class.
The Fund’s investment objective is long-term growth of capital. The Fund is a “fund of funds,” in that it invests in other mutual funds (“underlying funds”) advised by Invesco Advisers, Inc. (“Invesco”) or exchange traded funds advised by Invesco Powershares Capital Management LLC (“PowerShares Capital”), an affiliate of Invesco. Invesco and PowerShares Capital are affiliates of each other as they are indirect wholly-owned subsidiaries of Invesco Ltd. Invesco may change the Fund’s asset class allocations, the underlying funds or target weightings in the underlying funds without shareholder approval. The underlying funds may engage in a number of investment techniques and practices, which involve certain risks. Each underlying fund’s accounting policies are outlined in the underlying fund’s financial statements and are available upon request.
The Fund currently consists of six different classes of shares: Class A, Class B, Class C, Class R, Class Y and Class R5. On September 24, 2012, Institutional Class shares were renamed Class R5 shares. Class A shares are sold with a front-end sales charge unless certain waiver criteria are met and under certain circumstances load waived shares may be subject to contingent deferred sales charges (“CDSC”). Class C shares are sold with a CDSC. Class R, Class Y and Class R5 shares are sold at net asset value. Effective November 30, 2010, new or additional investments in Class B shares are no longer permitted. Existing shareholders of Class B shares may continue to reinvest dividends and capital gains distributions in Class B shares until they convert to Class A shares. Also, shareholders in Class B shares will be able to exchange those shares for Class B shares of other Invesco Funds offering such shares until they convert to Class A shares. Generally, Class B shares will automatically convert to Class A shares on or about the month-end, which is at least eight years after the date of purchase. Redemption of Class B shares prior to the conversion date will be subject to a CDSC.
13 Invesco International Allocation Fund
The following is a summary of the significant accounting policies followed by the Fund in the preparation of its financial statements.
| A. | Security Valuations — Securities of investment companies that trade on an exchange are valued at the last sales price or official closing price as of the close of the customary trading session on the exchange where the security is principally traded. Investments in shares of funds that are not traded on an exchange are valued at the end of day net asset value per share of such fund. Securities in the underlying funds, including restricted securities, are valued in accordance with the valuation policy of such fund. The policies of the underlying funds affiliated with the Fund as a result of having the same investment adviser are set forth below. |
A security listed or traded on an exchange (except convertible bonds) is valued at its last sales price or official closing price as of the close of the customary trading session on the exchange where the security is principally traded, or lacking any sales or official closing price on a particular day, the security may be valued at the closing bid price on that day. Securities traded in the over-the-counter market are valued based on prices furnished by independent pricing services or market makers. When such securities are valued by an independent pricing service they may be considered fair valued. Futures contracts are valued at the final settlement price set by an exchange on which they are principally traded. Listed options are valued at the mean between the last bid and ask prices from the exchange on which they are principally traded. Options not listed on an exchange are valued by an independent source at the mean between the last bid and ask prices. For purposes of determining net asset value per share, futures and option contracts generally are valued 15 minutes after the close of the customary trading session of the New York Stock Exchange (“NYSE”).
Investments in open-end and closed-end registered investment companies that do not trade on an exchange are valued at the end of day net asset value per share. Investments in open-end and closed-end registered investment companies that trade on an exchange are valued at the last sales price or official closing price as of the close of the customary trading session on the exchange where the security is principally traded.
Debt obligations (including convertible bonds) and unlisted equities are fair valued using an evaluated quote provided by an independent pricing service. Evaluated quotes provided by the pricing service may be determined without exclusive reliance on quoted prices, and may reflect appropriate factors such as institution-size trading in similar groups of securities, developments related to specific securities, dividend rate (for unlisted equities), yield (for debt obligations), quality, type of issue, coupon rate (for debt obligations), maturity (for debt obligations), individual trading characteristics and other market data. Debt obligations are subject to interest rate and credit risks. In addition, all debt obligations involve some risk of default with respect to interest and/or principal payments.
Foreign securities’ (including foreign exchange contracts) prices are converted into U.S. dollar amounts using the applicable exchange rates as of the close of the NYSE. If market quotations are available and reliable for foreign exchange-traded equity securities, the securities will be valued at the market quotations. Because trading hours for certain foreign securities end before the close of the NYSE, closing market quotations may become unreliable. If between the time trading ends on a particular security and the close of the customary trading session on the NYSE, events occur that the Adviser determines are significant and make the closing price unreliable, the Fund may fair value the security. If the event is likely to have affected the closing price of the security, the security will be valued at fair value in good faith using procedures approved by the Board of Trustees. Adjustments to closing prices to reflect fair value may also be based on a screening process of an independent pricing service to indicate the degree of certainty, based on historical data, that the closing price in the principal market where a foreign security trade is not the current value as of the close of the NYSE. Foreign securities’ prices meeting the approved degree of certainty that the price is not reflective of current value will be priced at the indication of fair value from the independent pricing service. Multiple factors may be considered by the independent pricing service in determining adjustments to reflect fair value and may include information relating to sector indices, American Depositary Receipts and domestic and foreign index futures. Foreign securities may have additional risks including exchange rate changes, potential for sharply devalued currencies and high inflation, political and economic upheaval, the relative lack of issuer information, relatively low market liquidity and the potential lack of strict financial and accounting controls and standards.
Securities for which market prices are not provided by any of the above methods may be valued based upon quotes furnished by independent sources. The last bid price may be used to value equity securities. The mean between the last bid and asked prices is used to value debt obligations, including corporate loans.
Securities for which market quotations are not readily available or became unreliable are valued at fair value as determined in good faith by or under the supervision of the Trust’s officers following procedures approved by the Board of Trustees. Issuer specific events, market trends, bid/ask quotes of brokers and information providers and other market data may be reviewed in the course of making a good faith determination of a security’s fair value.
Valuations change in response to many factors including the historical and prospective earnings of the issuer, the value of the issuer’s assets, general economic conditions, interest rates, investor perceptions and market liquidity. Because of the inherent uncertainties of valuation, the values reflected in the financial statements may materially differ from the value received upon actual sale of those investments.
| B. | Securities Transactions and Investment Income — Securities transactions are accounted for on a trade date basis. Realized gains or losses on sales are computed on the basis of specific identification of the securities sold. Distributions from ordinary income from underlying funds, if any, are recorded as dividend income on ex-dividend date. Distributions from gains from underlying funds, if any, are recorded as realized gains on the ex-dividend date. |
The Fund allocates income and realized and unrealized capital gains and losses to a class based on the relative net assets of each class.
| C. | Distributions — Distributions from income, if any, are declared and paid annually and are recorded on the ex-dividend date. Distributions from net realized capital gain, if any, are generally declared and paid annually and recorded on the ex-dividend date. The Fund may elect to treat a portion of the proceeds from redemptions as distributions for federal income tax purposes. |
| D. | Federal Income Taxes — The Fund intends to comply with the requirements of Subchapter M of the Internal Revenue Code necessary to qualify as a regulated investment company and to distribute substantially all of the Fund’s taxable earnings to shareholders. As such, the Fund will not be subject to federal income taxes on otherwise taxable income (including net realized capital gain) that is distributed to shareholders. Therefore, no provision for federal income taxes is recorded in the financial statements. |
14 Invesco International Allocation Fund
The Fund files tax returns in the U.S. Federal jurisdiction and certain other jurisdictions. Generally, the Fund is subject to examinations by such taxing authorities for up to three years after the filing of the return for the tax period.
| E. | Expenses — Expenses included in the accompanying financial statements reflect the expenses of the Fund and do not include any expenses of the underlying funds. The effects of the underlying funds expenses are included in the realized and unrealized gain/loss on the investments in the underlying funds. |
Fees provided for under the Rule 12b-1 plan of a particular class of the Fund and which are directly attributable to that class are charged to the operations of such class. Transfer agency fees and expenses and other shareholder recordkeeping fees and expenses attributable to Class R5 are charged to such class. Transfer agency fees and expenses and other shareholder recordkeeping fees and expenses relating to all other classes are allocated among those classes based on relative net assets. All other expenses are allocated among the classes based on relative net assets.
| F. | Accounting Estimates — The preparation of financial statements in conformity with accounting principles generally accepted in the United States of America (“GAAP”) requires management to make estimates and assumptions that affect the reported amounts of assets and liabilities at the date of the financial statements and the reported amounts of revenues and expenses during the reporting period including estimates and assumptions related to taxation. Actual results could differ from those estimates by a significant amount. In addition, the Fund monitors for material events or transactions that may occur or become known after the period-end date and before the date the financial statements are released to print. |
| G. | Indemnifications — Under the Trust’s organizational documents, each Trustee, officer, employee or other agent of the Trust is indemnified against certain liabilities that may arise out of the performance of their duties to the Fund. Additionally, in the normal course of business, the Fund enters into contracts, including the Fund’s servicing agreements, that contain a variety of indemnification clauses. The Fund’s maximum exposure under these arrangements is unknown as this would involve future claims that may be made against the Fund that have not yet occurred. The risk of material loss as a result of such indemnification claims is considered remote. |
| H. | Redemption Fees — The Fund had a 2% redemption fee that was retained by the Fund to offset transaction costs and other expenses associated with short-term redemptions and exchanges. The fee, subject to certain exceptions, was imposed on certain redemptions or exchanges of shares within 31 days of purchase. The redemption fee was recorded as an increase in shareholder capital and was allocated among the share classes based on the relative net assets of each class. Effective January 1, 2012, the Fund eliminated the 2% redemption fee assessed on shares of the Fund redeemed or exchanged within 31 days of purchase. |
NOTE 2—Advisory Fees and Other Fees Paid to Affiliates
The Trust has entered into a master investment advisory agreement with Invesco. Under the terms of the investment advisory agreement, the Fund does not pay an advisory fee. However, the Fund pays advisory fees to Invesco indirectly as a shareholder of the underlying funds.
Under the terms of a master sub-advisory agreement between the Adviser and each of Invesco Asset Management Deutschland GmbH, Invesco Asset Management Limited, Invesco Asset Management (Japan) Limited, Invesco Australia Limited, Invesco Hong Kong Limited, Invesco Senior Secured Management, Inc. and Invesco Canada Ltd. (collectively, the “Affiliated Sub-Advisers”) the Adviser, not the Fund, may pay 40% of the fees paid to the Adviser to any such Affiliated Sub-Adviser(s) that provide(s) discretionary investment management services to the Fund or underlying funds based on the percentage of assets allocated to such Sub-Adviser(s).
Effective, May 1, 2012, the Adviser has contractually agreed, through at least June 30, 2013, to reimburse expenses to the extent necessary to limit total annual fund operating expenses after expense reimbursement (excluding certain items discussed below) of Class A, Class B, Class C, Class R, Class Y and Class R5 shares to 2.25%, 3.00%, 3.00%, 2.50%, 2.00% and 2.00% of average daily net assets, respectively. Prior to May 1, 2012, the Adviser had contractually agreed to reimburse expenses to the extent necessary to limit total annual fund operating expenses after expense reimbursement (excluding certain items discussed below) of Class A, Class B, Class C, Class R, Class Y and Class R5 shares to 0.43%, 1.18%, 1.18%, 0.68%, 0.18% and 0.18% of average daily net assets, respectively. In determining Adviser’s obligation to reimburse expenses, the following expenses are not taken into account, and could cause the total annual fund operating expenses after expense reimbursement to exceed the numbers reflected above: (1) interest; (2) taxes; (3) dividend expense on short sales; (4) extraordinary or non-routine items, including litigation expenses; and (5) expenses that the Fund has incurred but did not actually pay because of an expense offset arrangement. Acquired Fund Fees and Expenses are not fees and expenses incurred by the Fund directly but are fees and expenses, including management fees, of the investment companies in which the Fund invests. As a result, total annual fund operating expenses may exceed the expense limits above. You incur these expenses indirectly through the valuation of the Fund’s investment in those investment companies. The impact of the Acquired Fund Fees and Expenses are included in the total return of the Fund. Unless the Board of Trustees and Invesco mutually agree to amend or continue the fee waiver agreement, it will terminate on June 30, 2013.
For the year ended December 31, 2012, Invesco reimbursed class level expenses of $104,837, $9,392, $23,642, $4,282, $4,582 and $21 of Class A, Class B, Class C, Class R, Class Y and Class R5 shares, respectively.
The Trust has entered into a master administrative services agreement with Invesco pursuant to which the Fund has agreed to pay Invesco for certain administrative costs incurred in providing accounting services to the Fund. For the year ended December 31, 2012, expenses incurred under the agreement are shown in the Statement of Operations as Administrative services fees.
The Trust has entered into a transfer agency and service agreement with Invesco Investment Services, Inc. (“IIS”) pursuant to which the Fund has agreed to pay IIS a fee for providing transfer agency and shareholder services to the Fund and reimburse IIS for certain expenses incurred by IIS in the course of providing such services. IIS may make payments to intermediaries that provide omnibus account services, sub-accounting services and/or networking services. All fees payable by IIS to intermediaries that provide omnibus account services or sub-accounting are charged back to the Fund, subject to certain limitations approved by the Trust’s Board of Trustees. For the year ended December 31, 2012, expenses incurred under the agreement are shown in the Statement of Operations as Transfer agent fees.
The Trust has entered into master distribution agreements with Invesco Distributors, Inc. (“IDI”) to serve as the distributor for the Class A, Class B, Class C, Class R, Class Y and Class R5 shares of the Fund. The Trust has adopted plans pursuant to Rule 12b-1 under the 1940 Act with respect to the Fund’s Class A, Class B, Class C and Class R shares (collectively, the “Plans”). The Fund, pursuant to the Plans, pays IDI compensation at the annual rate of 0.25% of the Fund’s average daily net assets of Class A shares, 1.00% of the average daily net assets of Class B and Class C shares and 0.50% of the average daily net assets of Class R shares. Of the Plan payments, up to 0.25% of the average daily net assets of each class of shares
15 Invesco International Allocation Fund
may be paid to furnish continuing personal shareholder services to customers who purchase and own shares of such classes. Any amounts not paid as a service fee under the Plans would constitute an asset-based sales charge. Rules of the Financial Industry Regulatory Authority (“FINRA”) impose a cap on the total sales charges, including asset-based sales charges, that may be paid by any class of shares of the Fund. For the year ended December 31, 2012, expenses incurred under the Plans are shown in the Statement of Operations as Distribution fees.
Front-end sales commissions and CDSC (collectively, the “sales charges”) are not recorded as expenses of the Fund. Front-end sales commissions are deducted from proceeds from the sales of Fund shares prior to investment in Class A shares of the Fund. CDSC are deducted from redemption proceeds prior to remittance to the shareholder. During the year ended December 31, 2012, IDI advised the Fund that IDI retained $38,265 in front-end sales commissions from the sale of Class A shares and $2,565, $13,059 and $1,212 from Class A, Class B and Class C shares, respectively, for CDSC imposed on redemptions by shareholders.
The underlying Invesco Funds pay no distribution fees for class R5 and R6 shares and the Fund pays no sales loads or other similar compensation to IDI for acquiring underlying fund shares.
Certain officers and trustees of the Trust are officers and directors of the Adviser, IIS and/or IDI.
NOTE 3—Additional Valuation Information
GAAP defines fair value as the price that would be received to sell an asset or paid to transfer a liability in an orderly transaction between market participants at the measurement date, under current market conditions. GAAP establishes a hierarchy that prioritizes the inputs to valuation methods giving the highest priority to readily available unadjusted quoted prices in an active market for identical assets (Level 1) and the lowest priority to significant unobservable inputs (Level 3) generally when market prices are not readily available or are unreliable. Based on the valuation inputs, the securities or other investments are tiered into one of three levels. Changes in valuation methods may result in transfers in or out of an investment’s assigned level:
| Level 1 — | Prices are determined using quoted prices in an active market for identical assets. |
| Level 2 — | Prices are determined using other significant observable inputs. Observable inputs are inputs that other market participants may use in pricing a security. These may include quoted prices for similar securities, interest rates, prepayment speeds, credit risk, yield curves, loss severities, default rates, discount rates, volatilities and others. |
| Level 3 — | Prices are determined using significant unobservable inputs. In situations where quoted prices or observable inputs are unavailable (for example, when there is little or no market activity for an investment at the end of the period), unobservable inputs may be used. Unobservable inputs reflect the Fund’s own assumptions about the factors market participants would use in determining fair value of the securities or instruments and would be based on the best available information. |
The following is a summary of the tiered valuation input levels, as of December 31, 2012. The level assigned to the securities valuations may not be an indication of the risk or liquidity associated with investing in those securities.
| Level 1 | Level 2 | Level 3 | Total | |||||||||||||
Equity Securities | $ | 177,002,970 | $ | — | $ | — | $ | 177,002,970 | ||||||||
NOTE 4—Expense Offset Arrangement(s)
The expense offset arrangement is comprised of transfer agency credits which result from balances in Demand Deposit Accounts (DDA) used by the transfer agent for clearing shareholder transactions. For the year ended December 31, 2012, the Fund received credits from this arrangement, which resulted in the reduction of the Fund’s total expenses of $1,260.
NOTE 5—Trustees’ and Officers’ Fees and Benefits
“Trustees’ and Officers’ Fees and Benefits” include amounts accrued by the Fund to pay remuneration to certain Trustees and Officers of the Fund. Trustees have the option to defer compensation payable by the Fund, and “Trustees’ and Officers’ Fees and Benefits” also include amounts accrued by the Fund to fund such deferred compensation amounts. Those Trustees who defer compensation have the option to select various Invesco Funds in which their deferral accounts shall be deemed to be invested. Finally, certain current Trustees are eligible to participate in a retirement plan that provides for benefits to be paid upon retirement to Trustees over a period of time based on the number of years of service. The Fund may have certain former Trustees who also participate in a retirement plan and receive benefits under such plan. “Trustees’ and Officers’ Fees and Benefits” include amounts accrued by the Fund to fund such retirement benefits. Obligations under the deferred compensation and retirement plans represent unsecured claims against the general assets of the Fund.
NOTE 6—Cash Balances
The Fund is permitted to temporarily carry a negative or overdrawn balance in its account with State Street Bank and Trust Company, the custodian bank. Such balances, if any at period end, are shown in the Statement of Assets and Liabilities under the payable caption Amount due custodian. To compensate the custodian bank for such overdrafts, the overdrawn Fund may either (1) leave funds as a compensating balance in the account so the custodian bank can be compensated by earning the additional interest; or (2) compensate by paying the custodian bank at a rate agreed upon by the custodian bank and Invesco, not to exceed the contractually agreed upon rate.
16 Invesco International Allocation Fund
NOTE 7—Distributions to Shareholders and Tax Components of Net Assets
Tax Character of Distributions to Shareholders Paid During the Years Ended December 31, 2012 and 2011:
| 2012 | 2011 | |||||||
Ordinary income | $ | 5,597,023 | $ | 2,627,702 | ||||
Tax Components of Net Assets at Period-End:
| 2012 | ||||
Undistributed ordinary income | $ | 236,836 | ||
Net unrealized appreciation (depreciation) — investments | (28,981,035 | ) | ||
Temporary book/tax differences | (43,905 | ) | ||
Post-October deferrals | (899,753 | ) | ||
Capital loss carryforward | (70,461,194 | ) | ||
Shares of beneficial interest | 276,808,476 | |||
Total net assets | $ | 176,659,425 | ||
The difference between book-basis and tax-basis unrealized appreciation (depreciation) is due to differences in the timing of recognition of gains and losses on investments for tax and book purposes. The Fund’s net unrealized appreciation (depreciation) difference is attributable primarily to wash sales.
The temporary book/tax differences are a result of timing differences between book and tax recognition of income and/or expenses. The Fund’s temporary book/tax differences are the result of the trustee deferral of compensation and retirement plan benefits.
Capital loss carryforward is calculated and reported as of a specific date. Results of transactions and other activity after that date may affect the amount of capital loss carryforward actually available for the Fund to utilize. The Regulated Investment Company Modernization Act of 2010 (the “Act”) eliminated the eight-year carryover period for capital losses that arise in taxable years beginning after its enactment date of December 22, 2010. Consequently, these capital losses can be carried forward for an unlimited period. However, capital losses with an expiration period may not be used to offset capital gains until all net capital losses without an expiration date have been utilized. Additionally, post-enactment capital loss carryovers will retain their character as either short-term or long-term capital losses instead of as short-term capital losses as under prior law. The ability to utilize capital loss carryforward in the future may be limited under the Internal Revenue Code and related regulations based on the results of future transactions.
The Fund has a capital loss carryforward as of December 31, 2012, which expires as follows:
| Capital Loss Carryforward* | ||||||||||||
| Expiration | Short-Term | Long-Term | Total | |||||||||
December 31, 2016 | $ | 27,122,541 | $ | — | $ | 27,122,541 | ||||||
December 31, 2017 | 23,283,288 | — | 23,283,288 | |||||||||
December 31, 2018 | 9,317,140 | — | 9,317,140 | |||||||||
Not subject to expiration | 141,154 | 10,597,071 | 10,738,225 | |||||||||
Total capital loss carryforward | $ | 59,864,123 | $ | 10,597,071 | $ | 70,461,194 | ||||||
| * | Capital loss carryforward as of the date listed above is reduced for limitations, if any, to the extent required by the Internal Revenue Code. |
NOTE 8—Investment Securities
The aggregate amount of investment securities (other than short-term securities, U.S. Treasury obligations and money market funds, if any) purchased and sold by the Fund during the year ended December 31, 2012 was $10,061,108 and $27,907,166, respectively. Cost of investments on a tax basis includes the adjustments for financial reporting purposes as of the most recently completed federal income tax reporting period-end.
| Unrealized Appreciation (Depreciation) of Investment Securities on a Tax Basis | ||||
Aggregate unrealized appreciation of investment securities | $ | 6,284,296 | ||
Aggregate unrealized (depreciation) of investment securities | (35,265,331 | ) | ||
Net unrealized appreciation (depreciation) of investment securities | $ | (28,981,035 | ) | |
Cost of investments for tax purposes is $205,984,005.
17 Invesco International Allocation Fund
NOTE 9—Share Information
| Summary of Share Activity | ||||||||||||||||
| Years ended December 31, | ||||||||||||||||
| 2012(a) | 2011 | |||||||||||||||
| Shares | Amount | Shares | Amount | |||||||||||||
Sold: | ||||||||||||||||
Class A | 2,284,884 | $ | 21,833,456 | 2,904,935 | $ | 28,706,059 | ||||||||||
Class B | 37,252 | 351,034 | 78,071 | 769,637 | ||||||||||||
Class C | 426,239 | 3,998,824 | 355,526 | 3,492,612 | ||||||||||||
Class R | 198,291 | 1,880,950 | 136,029 | 1,343,564 | ||||||||||||
Class Y | 323,505 | 3,100,009 | 131,538 | 1,288,508 | ||||||||||||
Class R5 | 13,776 | 133,310 | 10,947 | 103,840 | ||||||||||||
Issued as reinvestment of dividends: | ||||||||||||||||
Class A | 409,091 | 4,009,097 | 223,817 | 1,969,591 | ||||||||||||
Class B | 18,674 | 183,011 | 10,459 | 91,101 | ||||||||||||
Class C | 48,281 | 473,149 | 24,548 | 213,818 | ||||||||||||
Class R | 16,468 | 161,385 | 7,852 | 68,861 | ||||||||||||
Class Y | 19,765 | 193,103 | 7,809 | 68,722 | ||||||||||||
Class R5 | 853 | 8,360 | 361 | 3,191 | ||||||||||||
Automatic conversion of Class B shares to Class A shares: | ||||||||||||||||
Class A | 118,050 | 1,133,960 | 148,386 | 1,492,724 | ||||||||||||
Class B | (120,484 | ) | (1,133,960 | ) | (150,741 | ) | (1,492,724 | ) | ||||||||
Reacquired:(b) | ||||||||||||||||
Class A | (3,816,595 | ) | (36,617,551 | ) | (3,545,816 | ) | (35,182,116 | ) | ||||||||
Class B | (248,540 | ) | (2,360,892 | ) | (296,645 | ) | (2,908,135 | ) | ||||||||
Class C | (975,592 | ) | (9,136,195 | ) | (1,083,703 | ) | (10,663,877 | ) | ||||||||
Class R | (201,333 | ) | (1,910,053 | ) | (163,558 | ) | (1,653,221 | ) | ||||||||
Class Y | (148,752 | ) | (1,429,874 | ) | (146,208 | ) | (1,461,170 | ) | ||||||||
Class R5 | (6,506 | ) | (59,631 | ) | (684 | ) | (6,352 | ) | ||||||||
Net increase (decrease) in share activity | (1,602,673 | ) | $ | (15,188,508 | ) | (1,347,077 | ) | $ | (13,755,367 | ) | ||||||
| (a) | There are entities that are record owners of more than 5% of the outstanding shares of the Fund and in the aggregate own 32% of the outstanding shares of the Fund. IDI has an agreement with these entities to sell Fund shares. The Fund, Invesco and/or Invesco affiliates may make payments to these entities, which are considered to be related to the Fund, for providing services to the Fund, Invesco and/or Invesco affiliates including but not limited to services such as securities brokerage, distribution, third party record keeping and account servicing. The Fund has no knowledge as to whether all or any portion of the shares owned of record by these entities are also owned beneficially. |
| (b) | Net of redemption fees of $1,849 allocated among the classes based on relative net assets of each class for the year ended December 31, 2011. |
18 Invesco International Allocation Fund
NOTE 10—Financial Highlights
The following schedule presents financial highlights for a share of the Fund outstanding throughout the periods indicated.
| Net asset value, beginning of period | Net investment income(a) | Net gains (losses) on securities (both realized and unrealized) | Total from investment operations | Dividends from net investment income | Distributions from net realized gains | Total distributions | Net asset value, end of period(b) | Total return(c) | Net assets, end of period (000’s omitted) | Ratio of expenses to average net assets with fee waivers and/or expenses absorbed(d) | Ratio of absorbed | Ratio of net investment income to average net assets | Portfolio turnover(e) | |||||||||||||||||||||||||||||||||||||||||||
Class A |
| |||||||||||||||||||||||||||||||||||||||||||||||||||||||
Year ended 12/31/12 | $ | 9.07 | $ | 0.14 | $ | 1.09 | $ | 1.23 | $ | (0.36 | ) | $ | — | $ | (0.36 | ) | $ | 9.94 | 13.62 | % | $ | 125,566 | 0.60 | %(f) | 0.68 | %(f) | 1.42 | %(f) | 6 | % | ||||||||||||||||||||||||||
Year ended 12/31/11 | 10.10 | 0.20 | (1.07 | ) | (0.87 | ) | (0.16 | ) | — | (0.16 | ) | 9.07 | (8.57 | ) | 123,677 | 0.43 | 0.66 | 1.97 | 11 | |||||||||||||||||||||||||||||||||||||
Year ended 12/31/10 | 9.20 | 0.14 | 0.96 | 1.10 | (0.20 | ) | — | (0.20 | ) | 10.10 | 12.04 | 140,375 | 0.43 | 0.64 | 1.50 | 6 | ||||||||||||||||||||||||||||||||||||||||
Year ended 12/31/09 | 6.79 | 0.17 | 2.45 | 2.62 | (0.21 | ) | — | (0.21 | ) | 9.20 | 38.68 | 148,986 | 0.44 | 0.76 | 2.22 | 11 | ||||||||||||||||||||||||||||||||||||||||
Year ended 12/31/08 | 14.14 | 0.18 | (6.43 | ) | (6.25 | ) | (0.01 | ) | (1.09 | ) | (1.10 | ) | 6.79 | (44.27 | ) | 120,847 | 0.44 | 0.65 | 1.56 | 38 | ||||||||||||||||||||||||||||||||||||
Class B |
| |||||||||||||||||||||||||||||||||||||||||||||||||||||||
Year ended 12/31/12 | 8.98 | 0.06 | 1.08 | 1.14 | (0.18 | ) | — | (0.18 | ) | 9.94 | 12.78 | 10,606 | 1.35 | (f) | 1.43 | (f) | 0.67 | (f) | 6 | |||||||||||||||||||||||||||||||||||||
Year ended 12/31/11 | 9.97 | 0.12 | (1.04 | ) | (0.92 | ) | (0.07 | ) | — | (0.07 | ) | 8.98 | (9.21 | ) | 12,392 | 1.18 | 1.41 | 1.22 | 11 | |||||||||||||||||||||||||||||||||||||
Year ended 12/31/10 | 9.09 | 0.07 | 0.94 | 1.01 | (0.13 | ) | — | (0.13 | ) | 9.97 | 11.18 | 17,336 | 1.18 | 1.39 | 0.75 | 6 | ||||||||||||||||||||||||||||||||||||||||
Year ended 12/31/09 | 6.68 | 0.11 | 2.40 | 2.51 | (0.10 | ) | — | (0.10 | ) | 9.09 | 37.68 | 19,284 | 1.19 | 1.51 | 1.47 | 11 | ||||||||||||||||||||||||||||||||||||||||
Year ended 12/31/08 | 14.06 | 0.09 | (6.37 | ) | (6.28 | ) | (0.01 | ) | (1.09 | ) | (1.10 | ) | 6.68 | (44.74 | ) | 17,571 | 1.19 | 1.40 | 0.81 | 38 | ||||||||||||||||||||||||||||||||||||
Class C |
| |||||||||||||||||||||||||||||||||||||||||||||||||||||||
Year ended 12/31/12 | 8.98 | 0.06 | 1.08 | 1.14 | (0.18 | ) | — | (0.18 | ) | 9.94 | 12.78 | 27,929 | 1.35 | (f) | 1.43 | (f) | 0.67 | (f) | 6 | |||||||||||||||||||||||||||||||||||||
Year ended 12/31/11 | 9.97 | 0.12 | (1.04 | ) | (0.92 | ) | (0.07 | ) | — | (0.07 | ) | 8.98 | (9.21 | ) | 29,727 | 1.18 | 1.41 | 1.22 | 11 | |||||||||||||||||||||||||||||||||||||
Year ended 12/31/10 | 9.09 | 0.07 | 0.94 | 1.01 | (0.13 | ) | — | (0.13 | ) | 9.97 | 11.18 | 40,020 | 1.18 | 1.39 | 0.75 | 6 | ||||||||||||||||||||||||||||||||||||||||
Year ended 12/31/09 | 6.68 | 0.11 | 2.40 | 2.51 | (0.10 | ) | — | (0.10 | ) | 9.09 | 37.68 | 42,315 | 1.19 | 1.51 | 1.47 | 11 | ||||||||||||||||||||||||||||||||||||||||
Year ended 12/31/08 | 14.05 | 0.09 | (6.36 | ) | (6.27 | ) | (0.01 | ) | (1.09 | ) | (1.10 | ) | 6.68 | (44.70 | ) | 35,579 | 1.19 | 1.40 | 0.81 | 38 | ||||||||||||||||||||||||||||||||||||
Class R |
| |||||||||||||||||||||||||||||||||||||||||||||||||||||||
Year ended 12/31/12 | 9.04 | 0.11 | 1.09 | 1.20 | (0.30 | ) | — | (0.30 | ) | 9.94 | 13.35 | 5,554 | 0.85 | (f) | 0.93 | (f) | 1.17 | (f) | 6 | |||||||||||||||||||||||||||||||||||||
Year ended 12/31/11 | 10.06 | 0.17 | (1.06 | ) | (0.89 | ) | (0.13 | ) | — | (0.13 | ) | 9.04 | (8.81 | ) | 4,929 | 0.68 | 0.91 | 1.72 | 11 | |||||||||||||||||||||||||||||||||||||
Year ended 12/31/10 | 9.16 | 0.12 | 0.96 | 1.08 | (0.18 | ) | — | (0.18 | ) | 10.06 | 11.84 | 5,679 | 0.68 | 0.89 | 1.25 | 6 | ||||||||||||||||||||||||||||||||||||||||
Year ended 12/31/09 | 6.75 | 0.15 | 2.43 | 2.58 | (0.17 | ) | — | (0.17 | ) | 9.16 | 38.38 | 4,625 | 0.69 | 1.01 | 1.97 | 11 | ||||||||||||||||||||||||||||||||||||||||
Year ended 12/31/08 | 14.12 | 0.15 | (6.42 | ) | (6.27 | ) | (0.01 | ) | (1.09 | ) | (1.10 | ) | 6.75 | (44.48 | ) | 2,980 | 0.69 | 0.90 | 1.31 | 38 | ||||||||||||||||||||||||||||||||||||
Class Y |
| |||||||||||||||||||||||||||||||||||||||||||||||||||||||
Year ended 12/31/12 | 9.07 | 0.16 | 1.09 | 1.25 | (0.41 | ) | — | (0.41 | ) | 9.91 | 13.90 | 6,732 | 0.35 | (f) | 0.43 | (f) | 1.67 | (f) | 6 | |||||||||||||||||||||||||||||||||||||
Year ended 12/31/11 | 10.10 | 0.22 | (1.06 | ) | (0.84 | ) | (0.19 | ) | — | (0.19 | ) | 9.07 | (8.30 | ) | 4,396 | 0.18 | 0.41 | 2.22 | 11 | |||||||||||||||||||||||||||||||||||||
Year ended 12/31/10 | 9.20 | 0.16 | 0.97 | 1.13 | (0.23 | ) | — | (0.23 | ) | 10.10 | 12.29 | 4,965 | 0.18 | 0.39 | 1.75 | 6 | ||||||||||||||||||||||||||||||||||||||||
Year ended 12/31/09 | 6.80 | 0.21 | 2.44 | 2.65 | (0.25 | ) | — | (0.25 | ) | 9.20 | 38.99 | 4,033 | 0.19 | 0.51 | 2.47 | 11 | ||||||||||||||||||||||||||||||||||||||||
Year ended 12/31/08(g) | 9.83 | 0.03 | (1.96 | ) | (1.93 | ) | (0.01 | ) | (1.09 | ) | (1.10 | ) | 6.80 | (19.74 | ) | 477 | 0.19 | (h) | 0.64 | (h) | 1.81 | (h) | 38 | |||||||||||||||||||||||||||||||||
Class R5 |
| |||||||||||||||||||||||||||||||||||||||||||||||||||||||
Year ended 12/31/12 | 9.10 | 0.17 | 1.11 | 1.28 | (0.44 | ) | — | (0.44 | ) | 9.94 | 14.09 | 274 | 0.21 | (f) | 0.22 | (f) | 1.81 | (f) | 6 | |||||||||||||||||||||||||||||||||||||
Year ended 12/31/11 | 10.16 | 0.22 | (1.09 | ) | (0.87 | ) | (0.19 | ) | — | (0.19 | ) | 9.10 | (8.52 | ) | 177 | 0.18 | 0.22 | 2.22 | 11 | |||||||||||||||||||||||||||||||||||||
Year ended 12/31/10 | 9.23 | 0.17 | 0.99 | 1.16 | (0.23 | ) | — | (0.23 | ) | 10.16 | 12.59 | 89 | 0.16 | 0.16 | 1.77 | 6 | ||||||||||||||||||||||||||||||||||||||||
Year ended 12/31/09 | 6.83 | 0.19 | 2.46 | 2.65 | (0.25 | ) | — | (0.25 | ) | 9.23 | 38.90 | 66 | 0.18 | 0.23 | 2.48 | 11 | ||||||||||||||||||||||||||||||||||||||||
Year ended 12/31/08 | 14.17 | 0.21 | (6.45 | ) | (6.24 | ) | (0.01 | ) | (1.09 | ) | (1.10 | ) | 6.83 | (44.11 | ) | 50 | 0.15 | 0.15 | 1.85 | 38 | ||||||||||||||||||||||||||||||||||||
| (a) | Calculated using average shares outstanding. |
| (b) | Includes redemption fees added to shares of beneficial interest which were less than $0.005 per share for the years ended December 31, 2011, December 31, 2010, December 31, 2009 and December 31, 2008, respectively. |
| (c) | Includes adjustments in accordance with accounting principles generally accepted in the United States of America and as such, the net asset value for financial reporting purposes and the returns based upon those net asset values may differ from the net asset value and returns for shareholder transactions. Does not include sales charges and is not annualized for periods less than one year, if applicable. |
| (d) | In addition to the fees and expenses which the Fund bears directly; the Fund indirectly bears a pro rata share of the fees and expenses of the underlying funds in which the Fund invests. Because the underlying funds have varied expenses and fee levels and the Fund may own different proportions at different times, the amount of fees and expenses incurred indirectly by the Fund will vary. Estimated underlying fund expenses are not expenses that are incurred directly by your Fund. They are expenses that are incurred directly by the underlying funds and are deducted from the value of the funds your Fund invests in. The effect of the estimated underlying fund expenses that you bear indirectly is included in your Fund’s total return. Estimated acquired fund fees from underlying funds were 0.88%, 0.88%, 0.88%, 0.90% and 0.98% for the years ended December 31, 2012, December 31, 2011, December 31, 2010, December 31, 2009 and December 31, 2008, respectively. |
| (e) | Portfolio turnover is calculated at the fund level and is not annualized for periods less than one year, if applicable. |
| (f) | Ratios are based on average daily net assets (000’s omitted) of $126,556, $11,337, $28,540, $5,169, $5,531 and $256 for Class A, Class B, Class C, Class R, Class Y and Class R5 shares, respectively. |
| (g) | Commencement date of October 3, 2008 for Class Y shares. |
| (h) | Annualized. |
19 Invesco International Allocation Fund
Report of Independent Registered Public Accounting Firm
To the Board of Trustees of AIM Growth Series (Invesco Growth Series)
and Shareholders of Invesco International Allocation Fund:
In our opinion, the accompanying statement of assets and liabilities, including the schedule of investments, and the related statements of operations and of changes in net assets and the financial highlights present fairly, in all material respects, the financial position of Invesco International Allocation Fund (one of the funds constituting AIM Growth Series (Invesco Growth Series), hereafter referred to as the “Fund”) at December 31, 2012, the results of its operations for the year then ended, the changes in its net assets for each of the two years in the period then ended and the financial highlights for each of the five years in the period then ended, in conformity with accounting principles generally accepted in the United States of America. These financial statements and financial highlights (hereafter referred to as “financial statements”) are the responsibility of the Fund’s management; our responsibility is to express an opinion on these financial statements based on our audits. We conducted our audits of these financial statements in accordance with the standards of the Public Company Accounting Oversight Board (United States). Those standards require that we plan and perform the audit to obtain reasonable assurance about whether the financial statements are free of material misstatement. An audit includes examining, on a test basis, evidence supporting the amounts and disclosures in the financial statements, assessing the accounting principles used and significant estimates made by management, and evaluating the overall financial statement presentation. We believe that our audits, which included confirmation of securities at December 31, 2012 by correspondence with the custodian and transfer agent, provide a reasonable basis for our opinion.
PRICEWATERHOUSECOOPERS LLP
February 25, 2013
Houston, Texas
20 Invesco International Allocation Fund
Calculating your ongoing Fund expenses
Example
As a shareholder of the Fund, you incur two types of costs: (1) transaction costs, which may include sales charges (loads) on purchase payments or contingent deferred sales charges on redemptions, and redemption fees, if any; and (2) ongoing costs, including distribution and/or service (12b-1) fees, and other Fund expenses. This example is intended to help you understand your ongoing costs (in dollars) of investing in the Fund and to compare these costs with ongoing costs of investing in other mutual funds. The example is based on an investment of $1,000 invested at the beginning of the period and held for the entire period July 1, 2012, through December 31, 2012.
In addition to the fees and expenses which the Fund bears directly, the Fund indirectly bears a pro rata share of the fees and expenses of the underlying funds in which your Fund invests. The amount of fees and expenses incurred indirectly by your Fund will vary because the underlying funds have varied expenses and fee levels and the Fund may own different proportions of the underlying funds at different times. Estimated underlying fund expenses are not expenses that are incurred directly by your Fund. They are expenses that are incurred directly by the underlying funds and are deducted from the value of the underlying funds your Fund invests in. The effect of the estimated underlying fund expenses that you bear indirectly are included in your Fund’s total return.
Actual expenses
The table below provides information about actual account values and actual expenses. You may use the information in this table, together with the amount you invested, to estimate the expenses that you paid over the period. Simply divide your account value by $1,000 (for example, an $8,600 account value divided by $1,000 = 8.6), then multiply the result by the number in the table under the heading entitled “Actual Expenses Paid During Period” to estimate the expenses you paid on your account during this period.
Hypothetical example for comparison purposes
The table below also provides information about hypothetical account values and hypothetical expenses based on the Fund’s actual expense ratio and an assumed rate of return of 5% per year before expenses, which is not the Fund’s actual return.
The hypothetical account values and expenses may not be used to estimate the actual ending account balance or expenses you paid for the period. You may use this information to compare the ongoing costs of investing in the Fund and other funds. To do so, compare this 5% hypothetical example with the 5% hypothetical examples that appear in the shareholder reports of the other funds.
Please note that the expenses shown in the table are meant to highlight your ongoing costs only and do not reflect any transaction costs, such as sales charges (loads) on purchase payments, contingent deferred sales charges on redemptions, and redemption fees, if any. Therefore, the hypothetical information is useful in comparing ongoing costs only, and will not help you determine the relative total costs of owning different funds. In addition, expenses shown in the table do not include the expenses of the underlying funds, which are borne indirectly by the Fund. If transaction costs and indirect expenses were included, your costs would have been higher.
| Class | Beginning | ACTUAL | HYPOTHETICAL (5% annual return before expenses) | Annualized | ||||||||||||||||||||
| Ending Account Value (12/31/12)1 | Expenses Paid During Period2 | Ending Account Value (12/31/12) | Expenses Paid During Period2 | |||||||||||||||||||||
| A | $ | 1,000.00 | $ | 1,117.80 | $ | 3.63 | $ | 1,021.71 | $ | 3.46 | 0.68 | % | ||||||||||||
| B | 1,000.00 | 1,114.10 | 7.60 | 1,017.95 | 7.25 | 1.43 | ||||||||||||||||||
| C | 1,000.00 | 1,114.10 | 7.60 | 1,017.95 | 7.25 | 1.43 | ||||||||||||||||||
| R | 1,000.00 | 1,116.20 | 4.95 | 1,020.46 | 4.72 | 0.93 | ||||||||||||||||||
| Y | 1,000.00 | 1,120.50 | 2.29 | 1,022.97 | 2.19 | 0.43 | ||||||||||||||||||
| R5 | 1,000.00 | 1,121.20 | 1.28 | 1,023.93 | 1.22 | 0.24 | ||||||||||||||||||
| 1 | The actual ending account value is based on the actual total return of the Fund for the period July 1, 2012 through December 31, 2012, after actual expenses and will differ from the hypothetical ending account value which is based on the Fund’s expense ratio and a hypothetical annual return of 5% before expenses. |
| 2 | Expenses are equal to the Fund’s annualized expense ratio as indicated above multiplied by the average account value over the period, multiplied by 184/366 to reflect the most recent fiscal half year. |
21 Invesco International Allocation Fund
Tax Information
Form 1099-DIV, Form 1042-S and other year–end tax information provide shareholders with actual calendar year amounts that should be included in their tax returns. Shareholders should consult their tax advisors.
The following distribution information is being provided as required by the Internal Revenue Code or to meet a specific state’s requirement.
The Fund designates the following amounts or, if subsequently determined to be different, the maximum amount allowable for its fiscal year ended December 31, 2012:
Federal and State Income Tax | ||||
Qualified Dividend Income* | 100 | % | ||
Corporate Dividends Received Deduction* | 3.32 | % | ||
| * | The above percentages are based on ordinary income dividends paid to shareholders during the Fund’s fiscal year. |
22 Invesco International Allocation Fund
Trustees and Officers
The address of each trustee and officer is AIM Growth Series (Invesco Growth Series) (the “Trust”), 11 Greenway Plaza, Suite 1000, Houston, Texas 77046-1173. The trustees serve for the life of the Trust, subject to their earlier death, incapacitation, resignation, retirement or removal as more specifically provided in the Trust’s organizational documents. Each officer serves for a one year term or until their successors are elected and qualified. Column two below includes length of time served with predecessor entities, if any.
| Name, Year of Birth and Position(s) Held with the Trust | Trustee and/ or Officer Since | Principal Occupation(s) During Past 5 Years | Number of Funds in Fund Complex Overseen by Trustee | Other Directorship(s) Held by Trustee During Past 5 Years | ||||
| Interested Persons | ||||||||
| Martin L. Flanagan1 — 1960 Trustee | 2007 | Executive Director, Chief Executive Officer and President, Invesco Ltd. (ultimate parent of Invesco and a global investment management firm); Advisor to the Board, Invesco Advisers, Inc. (formerly known as Invesco Institutional (N.A.), Inc.); Trustee, The Invesco Funds; Vice Chair, Investment Company Institute; and Member of Executive Board, SMU Cox School of Business
Formerly: Chairman and Chief Executive Officer, Invesco Advisers, Inc. (registered investment adviser); Director, Chairman, Chief Executive Officer and President, IVZ Inc. (holding company), INVESCO Group Services, Inc. (service provider) and Invesco North American Holdings, Inc. (holding company); Director, Chief Executive Officer and President, Invesco Holding Company Limited (parent of Invesco and a global investment management firm); Director, Invesco Ltd.; Chairman, Investment Company Institute and President, Co-Chief Executive Officer, Co-President, Chief Operating Officer and Chief Financial Officer, Franklin Resources, Inc. (global investment management organization) | 124 | None | ||||
Philip A. Taylor2 — 1954 Trustee, President and Principal Executive Officer | 2006 | Head of North American Retail and Senior Managing Director, Invesco Ltd.; Director, Co-Chairman, Co-President and Co-Chief Executive Officer, Invesco Advisers, Inc. (formerly known as Invesco Institutional (N.A.), Inc.) (registered investment adviser); Director, Chairman, Chief Executive Officer and President, Invesco Management Group, Inc. (formerly known as Invesco Aim Management Group, Inc.) (financial services holding company); Director and President, INVESCO Funds Group, Inc. (registered investment adviser and registered transfer agent); Director and Chairman, Invesco Investment Services, Inc. (formerly known as Invesco Aim Investment Services, Inc.) (registered transfer agent) and IVZ Distributors, Inc. (formerly known as INVESCO Distributors, Inc.) (registered broker dealer); Director, President and Chairman, Invesco Inc. (holding company) and Invesco Canada Holdings Inc. (holding company); Chief Executive Officer, Invesco Corporate Class Inc. (corporate mutual fund company) and Invesco Canada Fund Inc. (corporate mutual fund company); Director, Chairman and Chief Executive Officer, Invesco Canada Ltd. (formerly known as Invesco Trimark Ltd./Invesco Trimark Ltèe) (registered investment adviser and registered transfer agent); Trustee, President and Principal Executive Officer, The Invesco Funds (other than AIM Treasurer’s Series Trust (Invesco Treasurer’s Series Trust) and Short-Term Investments Trust); Trustee and Executive Vice President, The Invesco Funds (AIM Treasurer’s Series Trust (Invesco Treasurer’s Series Trust) and Short-Term Investments Trust only); Director, Invesco Investment Advisers LLC (formerly known as Van Kampen Asset Management); Director, Chief Executive Officer and President, Van Kampen Exchange Corp.
Formerly: Director and Chairman, Van Kampen Investor Services Inc.: Director, Chief Executive Officer and President, 1371 Preferred Inc. (holding company); and Van Kampen Investments Inc.; Director and President, AIM GP Canada Inc. (general partner for limited partnerships); and Van Kampen Advisors, Inc.; Director and Chief Executive Officer, Invesco Trimark Dealer Inc. (registered broker dealer); Director, Invesco Distributors, Inc. (formerly known as Invesco Aim Distributors, Inc.) (registered broker dealer); Manager, Invesco PowerShares Capital Management LLC; Director, Chief Executive Officer and President, Invesco Advisers, Inc.; Director, Chairman, Chief Executive Officer and President, Invesco Aim Capital Management, Inc.; President, Invesco Trimark Dealer Inc. and Invesco Trimark Ltd./Invesco Trimark Ltèe; Director and President, AIM Trimark Corporate Class Inc. and AIM Trimark Canada Fund Inc.; Senior Managing Director, Invesco Holding Company Limited; Trustee and Executive Vice President, Tax-Free Investments Trust; Director and Chairman, Fund Management Company (former registered broker dealer); President and Principal Executive Officer, The Invesco Funds (AIM Treasurer’s Series Trust (Invesco Treasurer’s Series Trust), Short-Term Investments Trust and Tax-Free Investments Trust only); President, AIM Trimark Global Fund Inc. and AIM Trimark Canada Fund Inc. | 124 | None | ||||
Wayne W. Whalen3 — 1939 Trustee | 2010 | Of Counsel, and prior to 2010, partner in the law firm of Skadden, Arps, Slate, Meagher & Flom LLP, legal counsel to certain funds in the Fund Complex
| 137 | Director of the Mutual Fund Directors Forum, a nonprofit membership organization for investment directors; Chairman and Director of the Abraham Lincoln Presidential Library Foundation; and Director of the Stevenson Center for Democracy |
| 1 | Mr. Flanagan is considered an interested person of the Trust because he is an officer of the adviser to the Trust, and an officer and a director of Invesco Ltd., ultimate parent of the adviser to the Trust. |
| 2 | Mr. Taylor is considered an interested person of the Trust because he is an officer and a director of the adviser to, and a director of the principal underwriter of, the Trust. |
| 3 | Mr. Whalen is considered an “interested person” (within the meaning of Section 2(a)(19) of the 1940 Act) of certain Funds in the Invesco Fund Complex by reason of he and his firm currently providing legal services as legal counsel to such Funds in the Invesco Fund Complex. |
T-1 Invesco International Allocation Fund
Trustees and Officers—(continued)
| Name, Year of Birth and Position(s) Held with the Trust | Trustee and/ or Officer Since | Principal Occupation(s) During Past 5 Years | Number of Funds in Fund Complex Overseen by Trustee | Other Directorship(s) Held by Trustee During Past 5 Years | ||||
| Independent Trustees | ||||||||
Bruce L. Crockett — 1944 Trustee and Chair | 2001 | Chairman, Crockett Technologies Associates (technology consulting company)
Formerly: Director, Captaris (unified messaging provider); Director, President and Chief Executive Officer COMSAT Corporation; and Chairman, Board of Governors of INTELSAT (international communications company) | 124 | ACE Limited (insurance company); and Investment Company Institute | ||||
David C. Arch — 1945 Trustee | 2010 | Chairman and Chief Executive Officer of Blistex Inc., (consumer health care products manufacturer)
Formerly: Member of the Heartland Alliance Advisory Board, a nonprofit organization serving human needs based in Chicago | 137 | Board member of the Illinois Manufacturers’ Association; Member of the Board of Visitors, Institute for the Humanities, University of Michigan | ||||
Frank S. Bayley — 1939 Trustee | 1985 | Retired
Formerly: Director, Badgley Funds, Inc. (registered investment company) (2 portfolios) and General Partner and Of Counsel, law firm of Baker & McKenzie, LLP | 124 | Director and Chairman, C.D. Stimson Company (a real estate investment company); Trustee and Overseer, The Curtis institute of Music | ||||
James T. Bunch — 1942 Trustee | 2003 | Managing Member, Grumman Hill Group LLC (family office private equity management)
Formerly: Founder, Green, Manning & Bunch Ltd. (investment banking firm)(1988-2010); Executive Committee, United States Golf Association; and Director, Policy Studies, Inc. and Van Gilder Insurance Corporation | 124 | Chairman, Board of Governors, Western Golf Association; Chairman-elect, Evans Scholars Foundation; and Director, Denver Film Society | ||||
Rodney F. Dammeyer — 1940 Trustee | 2010 | Chairman of CAC, LLC, (private company offering capital investment and management advisory services)
Formerly: Prior to 2001, Managing Partner at Equity Group Corporate Investments; Prior to 1995, Vice Chairman of Anixter International; Prior to 1985, experience includes Senior Vice President and Chief Financial Officer of Household International, Inc., Executive Vice President and Chief Financial Officer of Northwest Industries, Inc. and Partner of Arthur Andersen & Co.; From 1987 to 2010, Director/Trustee of investment companies in the Van Kampen Funds complex | 126 | Director of Quidel Corporation and Stericycle, Inc.; Prior to May 2008, Trustee of The Scripps Research Institute; Prior to February 2008, Director of Ventana Medical Systems, Inc.; Prior to April 2007, Director of GATX Corporation; Prior to April 2004, Director of TheraSense, Inc. | ||||
Albert R. Dowden — 1941 Trustee | 2001 | Director of a number of public and private business corporations, including the Boss Group, Ltd. (private investment and management); Reich & Tang Funds (5 portfolios) (registered investment company); and Homeowners of America Holding Corporation/ Homeowners of America Insurance Company (property casualty company)
Formerly: Director, Continental Energy Services, LLC (oil and gas pipeline service); Director, CompuDyne Corporation (provider of product and services to the public security market) and Director, Annuity and Life Re (Holdings), Ltd. (reinsurance company); Director, President and Chief Executive Officer, Volvo Group North America, Inc.; Senior Vice President, AB Volvo; Director of various public and private corporations; Chairman, DHJ Media, Inc.; Director Magellan Insurance Company; and Director, The Hertz Corporation, Genmar Corporation (boat manufacturer), National Media Corporation; Advisory Board of Rotary Power International (designer, manufacturer, and seller of rotary power engines); and Chairman, Cortland Trust, Inc. (registered investment company) | 124 | Director of Nature’s Sunshine Products, Inc. | ||||
Jack M. Fields — 1952 Trustee | 2001 | Chief Executive Officer, Twenty First Century Group, Inc. (government affairs company); Owner and Chief Executive Officer, Dos Angeles Ranch, L.P. (cattle, hunting, corporate entertainment); and Discovery Global Education Fund (non-profit)
Formerly: Chief Executive Officer, Texana Timber LP (sustainable forestry company); Director of Cross Timbers Quail Research Ranch (non-profit); and member of the U.S. House of Representatives | 124 | Insperity, Inc. (formerly known as Administaff) | ||||
Prema Mathai-Davis — 1950 Trustee | 2001 | Retired
Formerly: Chief Executive Officer, YWCA of the U.S.A. | 124 | None | ||||
Larry Soll — 1942 Trustee | 2003 | Retired
Formerly: Chairman, Chief Executive Officer and President, Synergen Corp. (a biotechnology company) | 124 | None | ||||
Hugo F. Sonnenschein — 1940 Trustee | 2010 | Distinguished Service Professor and President Emeritus of the University of Chicago and the Adam Smith Distinguished Service Professor in the Department of Economics at the University of Chicago
Formerly: President of the University of Chicago | 137 | Trustee of the University of Rochester and a member of its investment committee. Member of the National Academy of Sciences, the American Philosophical Society and a fellow of the American Academy of Arts and Sciences |
T-2 Invesco International Allocation Fund
Trustees and Officers—(continued)
| Name, Year of Birth and Position(s) Held with the Trust | Trustee and/ or Officer Since | Principal Occupation(s) During Past 5 Years | Number of Funds in Fund Complex Overseen by Trustee | Other Directorship(s) Held by Trustee During Past 5 Years | ||||
| Independent Trustees—(continued) | ||||||||
Raymond Stickel, Jr. — 1944 Trustee | 2005 | Retired
Formerly: Director, Mainstay VP Series Funds, Inc. (25 portfolios) and Partner, Deloitte & Touche | 124 | None | ||||
| Other Officers | ||||||||
| Russell C. Burk — 1958 Senior Vice President and Senior Officer | 2005 | Senior Vice President and Senior Officer, The Invesco Funds | N/A | N/A | ||||
| John M. Zerr — 1962 Senior Vice President, Chief Legal Officer and Secretary | 2006 | Director, Senior Vice President, Secretary and General Counsel, Invesco Management Group, Inc. (formerly known as Invesco Aim Management Group, Inc.) and Van Kampen Exchange Corp.; Senior Vice President, Invesco Advisers, Inc. (formerly known as Invesco Institutional (N.A.), Inc.) (registered investment adviser); Senior Vice President and Secretary, Invesco Distributors, Inc. (formerly known as Invesco Aim Distributors, Inc.); Director, Vice President and Secretary, Invesco Investment Services, Inc. (formerly known as Invesco Aim Investment Services, Inc.) and IVZ Distributors, Inc. (formerly known as INVESCO Distributors, Inc.); Director and Vice President, INVESCO Funds Group, Inc.; Senior Vice President, Chief Legal Officer and Secretary, The Invesco Funds; Manager, Invesco PowerShares Capital Management LLC; Director, Secretary and General Counsel, Invesco Investment Advisers LLC (formerly known as Van Kampen Asset Management); Secretary and General Counsel, Van Kampen Funds Inc. and Chief Legal Officer, PowerShares Exchange-Traded Fund Trust, PowerShares Exchange-Traded Fund Trust II, PowerShares India Exchange-Traded Fund Trust and PowerShares Actively Managed Exchange-Traded Fund Trust
Formerly: Director and Vice President, Van Kampen Advisors Inc.; Director, Vice President, Secretary and General Counsel Van Kampen Investor Services Inc.; Director, Invesco Distributors, Inc. (formerly known as Invesco Aim Distributors, Inc.); Director, Senior Vice President, General Counsel and Secretary, Invesco Advisers, Inc. and Van Kampen Investments Inc.; Director, Vice President and Secretary, Fund Management Company; Director, Senior Vice President, Secretary, General Counsel and Vice President, Invesco Aim Capital Management, Inc.; Chief Operating Officer and General Counsel, Liberty Ridge Capital, Inc. (an investment adviser); Vice President and Secretary, PBHG Funds (an investment company) and PBHG Insurance Series Fund (an investment company); Chief Operating Officer, General Counsel and Secretary, Old Mutual Investment Partners (a broker-dealer); General Counsel and Secretary, Old Mutual Fund Services (an administrator) and Old Mutual Shareholder Services (a shareholder servicing center); Executive Vice President, General Counsel and Secretary, Old Mutual Capital, Inc. (an investment adviser); and Vice President and Secretary, Old Mutual Advisors Funds (an investment company) | N/A | N/A | ||||
| Karen Dunn Kelley — 1960 Vice President | 2004 | Head of Invesco’s World Wide Fixed Income and Cash Management Group; Senior Vice President, Invesco Management Group, Inc. (formerly known as Invesco Aim Management Group, Inc.) and Invesco Advisers, Inc. (formerly known as Invesco Institutional (N.A.), Inc.) (registered investment adviser); Executive Vice President, Invesco Distributors, Inc. (formerly known as Invesco Aim Distributors, Inc.); Director, Invesco Mortgage Capital Inc., INVESCO Global Asset Management Limited, Invesco Management Company Limited and INVESCO Management S.A.; Vice President, The Invesco Funds (other than AIM Treasurer’s Series Trust (Invesco Treasurer’s Series Trust) and Short-Term Investments Trust); and President and Principal Executive Officer, The Invesco Funds (AIM Treasurer’s Series Trust (Invesco Treasurer’s Series Trust) and Short-Term Investments Trust only)
Formerly: Senior Vice President, Van Kampen Investments Inc.; Vice President, Invesco Advisers, Inc. (formerly known as Invesco Institutional (N.A.), Inc.); Director of Cash Management and Senior Vice President, Invesco Advisers, Inc. and Invesco Aim Capital Management, Inc.; President and Principal Executive Officer, Tax-Free Investments Trust; Director and President, Fund Management Company; Chief Cash Management Officer, Director of Cash Management, Senior Vice President, and Managing Director, Invesco Aim Capital Management, Inc.; Director of Cash Management, Senior Vice President, and Vice President, Invesco Advisers, Inc. and The Invesco Funds (AIM Treasurer’s Series Trust (Invesco Treasurer’s Series Trust), Short-Term Investments Trust and Tax-Free Investments Trust only) | N/A | N/A | ||||
T-3 Invesco International Allocation Fund
Trustees and Officers—(continued)
| Name, Year of Birth and Position(s) Held with the Trust | Trustee and/ or Officer Since | Principal Occupation(s) During Past 5 Years | Number of Funds in Fund Complex Overseen by Trustee | Other Directorship(s) Held by Trustee During Past 5 Years | ||||
| Other Officers—(continued) | ||||||||
| Sheri Morris — 1964 Vice President, Treasurer and Principal Financial Officer | 1999 | Vice President, Treasurer and Principal Financial Officer, The Invesco Funds; Vice President, Invesco Advisers, Inc. (formerly known as Invesco Institutional (N.A.), Inc.) (registered investment adviser); and Vice President, PowerShares Exchange-Traded Fund Trust, PowerShares Exchange-Traded Fund Trust II, PowerShares India Exchange-Traded Fund Trust and PowerShares Actively Managed Exchange-Traded Fund Trust
Formerly: Vice President, Invesco Aim Advisers, Inc., Invesco Aim Capital Management, Inc. and Invesco Aim Private Asset Management, Inc.; Assistant Vice President and Assistant Treasurer, The Invesco Funds and Assistant Vice President, Invesco Advisers, Inc., Invesco Aim Capital Management, Inc. and Invesco Aim Private Asset Management, Inc.; and Treasurer, PowerShares Exchange-Traded Fund Trust, PowerShares Exchange-Traded Fund Trust II, PowerShares India Exchange-Traded Fund Trust and PowerShares Actively Managed Exchange-Traded Fund Trust | N/A | N/A | ||||
Yinka Akinsola — 1977 Anti-Money Laundering Compliance Officer | 2011 | Anti-Money Laundering Compliance Officer, Invesco Advisers, Inc. (formerly known as Invesco Institutional (N.A.), Inc.) (registered investment adviser); Invesco Distributors, Inc. (formerly known as Invesco Aim Distributors, Inc.), Invesco Investment Services, Inc. (formerly known as Invesco Aim Investment Services, Inc.), Invesco Management Group, Inc., The Invesco Funds, Invesco Van Kampen Closed-End Funds, Van Kampen Exchange Corp., Van Kampen Funds Inc., PowerShares Exchange-Traded Fund Trust, PowerShares Exchange-Traded Fund Trust II, PowerShares India Exchange-Traded Fund Trust, and PowerShares Actively Managed Exchange-Traded Fund Trust
Formerly: Regulatory Analyst III, Financial Industry Regulatory Authority (FINRA) | N/A | N/A | ||||
| Todd L. Spillane — 1958 Chief Compliance Officer | 2006 | Senior Vice President, Invesco Management Group, Inc. (formerly known as Invesco Aim Management Group, Inc.) and Van Kampen Exchange Corp.; Senior Vice President and Chief Compliance Officer, Invesco Advisers, Inc. (registered investment adviser) (formerly known as Invesco Institutional (N.A.), Inc.); Chief Compliance Officer, The Invesco Funds; Vice President, Invesco Distributors, Inc. (formerly known as Invesco Aim Distributors, Inc.) and Invesco Investment Services, Inc. (formerly known as Invesco Aim Investment Services, Inc.)
Formerly: Chief Compliance Officer, Invesco Van Kampen Closed-End Funds; Senior Vice President, Van Kampen Investments Inc.; Senior Vice President and Chief Compliance Officer, Invesco Aim Advisers, Inc. and Invesco Aim Capital Management, Inc.; Chief Compliance Officer, INVESCO Private Capital Investments, Inc. (holding company), Invesco Private Capital, Inc. (registered investment adviser), Invesco Global Asset Management (N.A.), Inc., Invesco Senior Secured Management, Inc. (registered investment adviser), Van Kampen Investor Services Inc., PowerShares Exchange-Traded Fund Trust, PowerShares Exchange-Traded Fund Trust II, PowerShares India Exchange-Traded Fund Trust and PowerShares Actively Managed Exchange-Traded Fund Trust; and Vice President, Invesco Aim Capital Management, Inc. and Fund Management Company | N/A | N/A |
The Statement of Additional Information of the Trust includes additional information about the Fund’s Trustees and is available upon request, without charge, by calling 1.800.959.4246. Please refer to the Fund’s prospectus for information on the Fund’s sub-advisers.
Office of the Fund 11 Greenway Plaza, Suite 1000 Houston, TX 77046-1173 | Investment Adviser Invesco Advisers, Inc. 1555 Peachtree Street, N.E. Atlanta, GA 30309 | Distributor Invesco Distributors, Inc. 11 Greenway Plaza, Suite 1000 Houston, TX 77046-1173 | Auditors PricewaterhouseCoopers LLP 1201 Louisiana Street, Suite 2900 Houston, TX 77002-5678 | |||
Counsel to the Fund Stradley Ronon Stevens & Young, LLP 2005 Market Street, Suite 2600 Philadelphia, PA 19103-7018 | Counsel to the Independent Trustees Goodwin Procter LLP 901 New York Avenue, N.W. | Transfer Agent Invesco Investment Services, Inc. 11 Greenway Plaza, Suite 1000 Houston, TX 77046-1173 | Custodian State Street Bank and Trust Company 225 Franklin Street Boston, MA 02110-2801 | |||
T-4 Invesco International Allocation Fund

Invesco mailing information
Send general correspondence to Invesco Investment Services, Inc., P.O. Box 219078, Kansas City, MO 64121-9078.
Invesco privacy policy
You share personal and financial information with us that is necessary for your transactions and your account records. We take very seriously the obligation to keep that information confidential and private.
Invesco collects nonpublic personal information about you from account applications or other forms you complete and from your transactions with us or our affiliates. We do not disclose information about you or our former customers to service providers or other third parties except to the extent necessary to service your account and in other limited circumstances as permitted by law. For example, we use this information to facilitate the delivery of transaction confirmations, financial reports, prospectuses and tax forms.
Even within Invesco, only people involved in the servicing of your accounts and compliance monitoring have access to your information. To ensure the highest level of confidentiality and security, Invesco maintains physical, electronic and procedural safeguards that meet or exceed federal standards. Special measures, such as data encryption and authentication, apply to your communications with us on our website. More detail is available to you at invesco.com/privacy.
Important notice regarding delivery of security holder documents
To reduce Fund expenses, only one copy of most shareholder documents may be mailed to shareholders with multiple accounts at the same address (Householding). Mailing of your shareholder documents may be householded indefinitely unless you instruct us otherwise. If you do not want the mailing of these documents to be combined with those for other members of your household, please contact Invesco Investment Services, Inc. at 800 959 4246 or contact your financial institution. We will begin sending you individual copies for each account within 30 days after receiving your request.
Fund holdings and proxy voting information
The Fund provides a complete list of its holdings four times in each fiscal year, at the quarter-ends. For the second and fourth quarters, the lists appear in the Fund’s semiannual and annual reports to shareholders. For the first and third quarters, the Fund files the lists with the Securities and Exchange Commission (SEC) on Form N-Q. The most recent list of portfolio holdings is available at invesco.com/completeqtrholdings. Shareholders can also look up the Fund’s Forms N-Q on the SEC website at sec.gov. Copies of the Fund’s Forms N-Q may be reviewed and copied at the SEC Public Reference Room in Washington, D.C. You can obtain information on the operation of the Public Reference Room, including information about duplicating fee charges, by calling 202 551 8090 or 800 732 0330, or by electronic request at the following email address: publicinfo@sec.gov. The SEC file numbers for the Fund are shown below.
A description of the policies and procedures that the Fund uses to determine how to vote proxies relating to portfolio securities is available without charge, upon request, from our Client Services department at 800 959 4246 or at invesco.com/proxyguidelines. The information is also available on the SEC website, sec.gov.
Information regarding how the Fund voted proxies related to its portfolio securities during the 12 months ended June 30, 2012, is available at invesco.com/proxysearch. The information is also available on the SEC website, sec.gov. Invesco Advisers, Inc. is an investment adviser; it provides investment advisory services to individual and institutional clients and does not sell securities. Invesco Distributors, Inc. is the US distributor for Invesco Ltd.’s retail mutual funds, exchange-traded funds and institutional money market funds. Both are wholly owned, indirect subsidiaries of Invesco Ltd. |  | |
| SEC file numbers: 811-02699 and 002-57526 INTAL-AR-1 Invesco Distributors, Inc. | ||

| Annual Report to Shareholders | December 31, 2012 |
Invesco Mid Cap Core Equity Fund
Nasdaq:
A: GTAGX ¡ B: GTABX ¡ C: GTACX ¡ R: GTARX ¡ Y: GTAYX ¡ R5: GTAVX ¡ R6: GTAFX

Letters to Shareholders
Philip Taylor | Dear Shareholders: This annual report contains information about your Fund and the factors that affected its performance during the reporting period. Inside, you’ll find a discussion from your portfolio managers about how they managed your Fund, performance data for your Fund, a complete list of your Fund’s investments as of the close of the reporting period and other important information. I hope you find this report of interest. The reporting period covered by this report was challenging. As the year began, investors cheered generally positive economic indicators, and markets generally rose. Soon, however, US economic data turned mixed and investors’ attention shifted to the efforts of eurozone governments to implement new policies intended to reduce debt levels, strengthen the banking | ||||||||
| system and stimulate economic growth. Later in the year, in the US, mixed economic data, competing proposals on how to reduce the federal budget deficit and a contentious presidential contest increased investor uncertainty and hindered market performance. Throughout the year, your Fund’s portfolio managers adhered to their long-term investment strategies, and later in this report they explain why your Fund performed as it did during the reporting period. | |||||||||

Adhering to your long-term investment plan can be difficult, particularly during periods of market volatility and economic uncertainty. That’s one reason Invesco suggests investors work with a skilled and trusted financial adviser who is familiar with their financial situation, investment goals and risk tolerance. A good financial adviser can provide insight and perspective when markets are volatile; motivation and reassurance when times are uncertain; and advice and recommendations when your financial situation or investment goals change.
Timely insight and information from many of Invesco’s investment professionals is available at our website, invesco.com/us. We offer in-depth articles, video clips and audio commentaries from many of our portfolio managers and other investment professionals on a wide range of topics of interest to investors. At invesco.com/us, you also can access information about your Invesco account at any time.
What we mean by Intentional Investing
At Invesco, all of our people and all of our resources are dedicated to helping investors achieve their financial objectives. It’s a philosophy we call Intentional Investing®, and it guides the way we:
| n | Manage investments – Our dedicated investment professionals search the world for the best opportunities, and each invest-ment team follows a clear, disciplined process to build portfolios and mitigate risk. |
| n | Provide choices – We offer equity, fixed income, asset allocation and alternative strategies so you and your financial adviser can build an investment portfolio designed for your individual needs and goals. |
| n | Connect with you – We’re committed to giving you the expert insights you need to make informed investing decisions, and we are well-equipped to provide high-quality support for investors and advisers. |
Invesco believes in putting investors first, and that’s why investment management is all we do. Our sole focus on managing your money allows your financial adviser to build a portfolio of Invesco funds appropriate for your investment needs and goals now and when your circumstances change.
Have a question?
If you have a question about your account, please contact an Invesco client services representative at 800 959 4246. If you have an Invesco-related question or comment, feel free to email me directly at phil@invesco.com.
All of us at Invesco look forward to serving your investment management needs for many years to come. Thank you for investing with us.
Sincerely,

Philip Taylor
Senior Managing Director, Invesco Ltd.
2 Invesco Mid Cap Core Equity Fund
Bruce Crockett | Dear Fellow Shareholders: While short-term challenges for the financial markets regularly come and go, it’s clear that significant and longer term economic obstacles remain both here at home and abroad. There appear to be no easy solutions to many of these issues. As a result, the financial markets have had little conviction to respond to what has been slow, yet noticeable improvement in some economic benchmarks in recent months. No one likes uncertainty, especially financial markets. But even in these uncertain times, it appears that investors are still approaching the market with cautious optimism, with some taking on more risk in order to refocus on their long-term savings goals. Maybe this describes you, or perhaps you have been sitting on the sidelines thinking | ||||||||

about getting back into the market, but are still a bit hesitant to act because of market uncertainty. Clearly, risk remains a primary focus for investors of all types. As Trustees of the Invesco Funds, one of our primary responsibilities is to ensure your fund’s adviser is cognizant of the risks in each of the funds it manages. A thoughtful risk management plan may help investors navigate through market turbulence or an economic downturn. This is why we make risk management a critical element of our annual contract renewal process, like the one we complete with Invesco every year.
To be sure, there will always be risks involved with investing, but you shouldn’t let short-term news or your emotions dictate your investments. Because no one can predict with 100% accuracy the movements of financial markets, I strongly encourage you to speak with a professional financial adviser who can assist you in building an investment portfolio that reflects your individual risk tolerance and is designed to help achieve your individual financial objectives.
You can be sure your Board remains committed to doing its part in helping you along the way. In addition to ensuring that your fund’s adviser is focused on the risks in the funds it manages, we also remain committed to managing fund costs and working with your fund’s adviser to provide a compelling and diversified product offering to potentially meet your investing goals.
In that regard, your Board approved a number of fund mergers and the launch of several new funds, including the first Invesco mutual fund available to US retail investors managed by investment professionals at Invesco Perpetual*, one of the largest independent investment managers in the UK.
Let me close by thanking Carl Frischling upon his retirement from the Invesco Funds Board for his 35 years of distinguished service and unwavering commitment to our funds’ shareholders. As always, please contact me at bruce@brucecrockett.com with any questions or concerns you may have.
On behalf of the Board, we look forward to continuing to represent your interests and serving your investment needs.
Sincerely,

Bruce L. Crockett
Independent Chair
Invesco Funds Board of Trustees
| * | Invesco Perpetual is a business name of Invesco Asset Management Limited (IAML), a registered investment adviser. IAML is a wholly owned, indirect subsidiary of Invesco Ltd. |
3 Invesco Mid Cap Core Equity Fund
Management’s Discussion of Fund Performance
Performance summary
Invesco Mid Cap Core Equity Fund delivered positive returns for the year ended December 31, 2012, which trailed the broad market, as measured by the S&P 500 Index, and the Fund’s style-specific benchmark, the Russell Midcap Index. The Fund benefited from holdings in the industrials and information technology (IT) sectors, while the energy sector detracted from both absolute and relative results. The Fund’s underweight position in the consumer discretionary sector was the largest detractor from results versus the style-specific benchmark. The Fund’s allocation to cash also tempered results for the reporting period.
Your Fund’s long-term performance appears later in this report.
Fund vs. Indexes
Total returns, 12/31/11 to 12/31/12, at net asset value (NAV). Performance shown does not include applicable contingent deferred sales charges (CDSC) or front-end sales charges, which would have reduced performance.
| Class A Shares | 10.38 | % | |||
| Class B Shares | 9.60 | ||||
| Class C Shares | 9.62 | ||||
| Class R Shares | 10.17 | ||||
| Class Y Shares | 10.68 | ||||
| Class R5 Shares* | 10.78 | ||||
| Class R6 Shares** | 10.56 | ||||
| S&P 500 Index‚ (Broad Market Index) | 16.00 | ||||
| Russell Midcap Index¡ (Style-Specific Index) | 17.28 | ||||
| Lipper Mid-Cap Core Funds Indext (Peer Group Index) | 16.27 |
Source(s): ‚ Invesco, S&P-Dow Jones via FactSet Research Systems Inc.;
| ¡ Invesco, Russell via FactSet Research Systems Inc.; tLipper Inc. |
| * | Effective September 24, 2012, Institutional Class shares were renamed Class R5 shares. |
| ** | Share class incepted during the reporting period. See page 7 for a detailed explanation of Fund performance. |
How we invest
We seek to manage your Fund with the goal of achieving long-run realized investor returns in excess of the Fund’s passive benchmarks across a full market cycle, which we define as market trough to market trough, or peak-to-peak. As Fund managers, we believe investors need a reason to stick with the Fund for long periods of time in order to realize these returns, and believe the best way we can encourage this behavior is by delivering a smoother (less volatile) investor experience – especially in turbulent, down-trending markets. The portfolio we construct is intended to provide attractive participation during positive-trending equity
markets, but with a greater emphasis on comparative downside protection during more turbulent, down-trending equity markets. We position the Fund to act as a “conservative cornerstone” – a stable foundational component within a well-diversified portfolio of assets.
The Fund’s portfolio is composed of “core stocks.” A core stock encompasses elements of growth (revenues, profits, economic value) and value (both absolute and comparative measures). Along this growth-value continuum, we seek to identify and invest in areas of temporary disconnection between market perception and the view our research uncovers.
To build a portfolio of core stocks, we conduct thorough fundamental research of businesses to gain a deeper understanding of the companies’ prospects, growth potential and return on invested capital (ROIC) characteristics. The analytical process we use to identify potential investments for the Fund includes three phases: financial, business and valuation.
Financial analysis provides insights into historical ROIC (a key indicator of business quality) and historical capital allocation (a key indicator of management quality). Business analysis evaluates the competitive landscape and any structural or cyclical business opportunities or threats and allows us to identify key revenue, profit and return drivers of the company. Both the financial and business analyses serve as bases to construct valuation models that help us assess a company’s intrinsic worth. Our valuation analysis employs three primary techniques, including discounted cash flow, traditional valuation multiples and net asset value.
We consider selling a stock when it exceeds our target price, we have not seen a demonstrable improvement in fundamentals, or a more compelling investment opportunity exists.
Market conditions and your Fund
The year began with improving economic data in the US and a rally in the equity markets. However, the ongoing European debt crisis intensified in April and May, dominating headlines and creating significant volatility in equity markets across the globe.
With pressure from overseas, US economic data began to decelerate, and indicators for manufacturing, employment and the consumer weakened over the summer. Despite these headwinds, corporate earnings were resilient, and the equity markets delivered strong results for the year. All sectors in the S&P 500
| Portfolio Composition | |||||
| By sector | |||||
| Information Technology | 18.3 | % | |||
| Industrials | 12.9 | ||||
| Financials | 12.0 | ||||
| Consumer Staples | 9.2 | ||||
| Health Care | 9.0 | ||||
| Consumer Discretionary | 8.0 | ||||
| Materials | 7.9 | ||||
| Energy | 6.7 | ||||
| Utilities | 0.7 | ||||
Money Market Funds Plus Other Assets Less Liabilities | 15.3 | ||||
| Top 10 Equity Holdings* | |||||
1. Kellogg Co. | 2.6 | % | |||
2. Linear Technology Corp. | 2.2 | ||||
3. Northern Trust Corp. | 2.2 | ||||
4. Symantec Corp. | 2.1 | ||||
5. Progressive Corp. (The) | 1.9 | ||||
6. Agilent Technologies, Inc. | 1.8 | ||||
7. Dr. Pepper Snapple Group, Inc. | 1.7 | ||||
8. Amphenol Corp.-Class A | 1.7 | ||||
9. Adobe Systems Inc. | 1.6 | ||||
10. International Flavors & Fragrances Inc. | 1.5 | ||||
| Top Five Industries* | |||||
1. Industrial Machinery | 5.3 | % | |||
2. Semiconductors | 4.6 | ||||
3. Oil and Gas Equipment and Services | 4.0 | ||||
4. Packaged Foods and Meats | 3.7 | ||||
5. Property and Casualty Insurance | 3.3 | ||||
| Total Net Assets | $2.4 billion | ||||
| Total Number of Holdings* | 80 | ||||
The Fund’s holdings are subject to change, and there is no assurance that the Fund will continue to hold any particular security.
*Excluding money market fund holdings.
4 Invesco Mid Cap Core Equity Fund
Index posted gains. The financials and consumer discretionary sectors were the leading performers, while the utilities and energy sectors lagged.
The Fund’s investments in industrials were the largest contributors to returns, including companies such as Terex. The global equipment manufacturer’s commercial construction, late-cycle end markets had been depressed in recent years. We invested in the company as we believed there were opportunities to improve working capital and increase margins, and believed that its aerial work platforms business had troughed. The stock performed well during the year as strong sales growth indicated a more sustainable recovery in its end markets, and we trimmed our position as a result.
Another strong contributor to the Fund’s results was Adobe. The company is a leading provider of creative, multimedia content-authoring software and document technologies, and it markets widely-known software products such as Photoshop, Illustrator, Acrobat and Flash. In our opinion, Adobe is a high-quality company that is a dominant player in its respective business lines. We invested in the company several years ago as its growth slowed and a series of acquisitions created some uncertainty. The stock performed well during the year as expanded product offerings improved sales. We used the opportunity to reduce our position in the stock.
The largest detractor for the year was Navistar, which manufactures heavy and medium trucks. The company’s stock was under pressure due to decelerating industry truck orders across segments and geographies and a failed emission certification from the Environmental Protection Agency. While the company was taking appropriate steps to rationalize costs, reduce facilities and improve its balance sheet, we had greater confidence in the risk/reward profile of other investments and sold our position during the reporting period.
Another detractor was Weatherford International. The company dealt with a series of tax reporting issues, which included a restatement of its financial results for the second consecutive year. As a result of these issues, the company’s chief financial officer departed in March, which we believe was a step in the right direction. We believe the company is currently undervalued and, in the long term, has an opportunity to improve margins and capital efficiency.
Over the course of the year, we took profits in the health care, energy and industrials sectors and increased our exposure to the consumer staples and materials sectors. At the end of the reporting period, our largest overweight positions relative to the Russell Midcap Index were in the IT and consumer staples sectors, and the largest underweight positions were in the consumer discretionary and financials sectors.
Regardless of market conditions, our goal remains the same: to serve as a conservative cornerstone for your mid-cap investment allocation, seeking to provide upside participation with a measure of downside protection, so that over a full market cycle we have the potential to deliver strong investment results with reduced risk relative to the Fund’s style-specific benchmark. As always, we would like to thank you for your continued investment in Invesco Mid Cap Core Equity Fund.
The views and opinions expressed in management’s discussion of Fund performance are those of Invesco Advisers, Inc. These views and opinions are subject to change at any time based on factors such as market and economic conditions. These views and opinions may not be relied upon as investment advice or recommendations, or as an offer for a particular security. The information is not a complete analysis of every aspect of any market, country, industry, security or the Fund. Statements of fact are from sources considered reliable, but Invesco Advisers, Inc. makes no representation or warranty as to their completeness or accuracy. Although historical performance is no guarantee of future results, these insights may help you understand our investment management philosophy.
See important Fund and, if applicable, index disclosures later in this report.
 | Ronald Sloan Chartered Financial Analyst, portfolio manager and chief investment officer of Invesco’s domestic | |
core investments team, is lead manager of Invesco Mid Cap Core Equity Fund. He joined Invesco in 1998. Mr. Sloan earned a BS in business administration and an MBA from the University of Missouri. | ||
 | Douglas Asiello Chartered Financial Analyst, portfolio manager, is manager of Invesco Mid Cap Core Equity Fund. He joined | |
Invesco in 2000. Mr. Asiello earned a BA in international relations and Spanish from Vanderbilt University. He also earned an MBA with a concentration in finance from the Wharton School and an MA in international management from the Joseph H. Lauder Institute of Management and International Studies, both of the University of Pennsylvania. | ||
 | Brian Nelson Chartered Financial Analyst, portfolio manager, is manager of Invesco Mid Cap Core Equity Fund. He joined | |
Invesco in 2004. Mr. Nelson earned a BA from the University of California, Santa Barbara. | ||
5 Invesco Mid Cap Core Equity Fund
Your Fund’s Long-Term Performance
Results of a $10,000 Investment – Oldest Share Class(es)
Fund and index data from 12/31/02
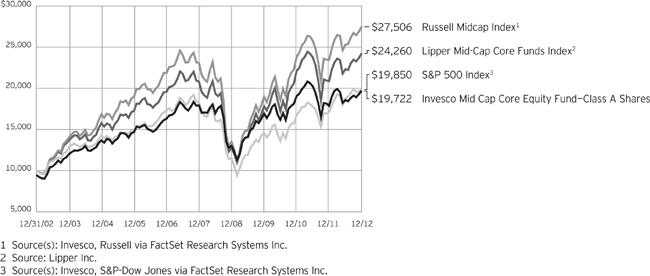
Past performance cannot guarantee comparable future results.
The data shown in the chart include reinvested distributions, applicable sales charges and Fund expenses including
management fees. Index results include reinvested dividends, but they do not reflect sales charges. Performance of the peer group, if applicable, reflects fund expenses and management fees;
performance of a market index does not. Performance shown in the chart and table(s) does not reflect deduction of taxes a shareholder would pay on Fund distributions or sale of Fund shares.
6 Invesco Mid Cap Core Equity Fund
Average Annual Total Returns | |||||
| As of 12/31/12, including maximum applicable sales charges | |||||
| Class A Shares | |||||
| Inception (6/9/87) | 10.19 | % | |||
10 Years | 7.03 | ||||
5 Years | 0.77 | ||||
1 Year | 4.33 | ||||
| Class B Shares | |||||
| Inception (4/1/93) | 9.52 | % | |||
10 Years | 7.00 | ||||
5 Years | 0.84 | ||||
1 Year | 4.63 | ||||
| Class C Shares | |||||
| Inception (5/3/99) | 7.31 | % | |||
10 Years | 6.84 | ||||
5 Years | 1.17 | ||||
1 Year | 8.63 | ||||
| Class R Shares | |||||
| Inception (6/3/02) | 5.50 | % | |||
10 Years | 7.38 | ||||
5 Years | 1.67 | ||||
1 Year | 10.17 | ||||
| Class Y Shares | |||||
10 Years | 7.75 | % | |||
5 Years | 2.13 | ||||
1 Year | 10.68 | ||||
| Class R5 Shares | |||||
| Inception (3/15/02) | 5.90 | % | |||
10 Years | 8.12 | ||||
5 Years | 2.33 | ||||
1 Year | 10.78 | ||||
| Class R6 Shares | |||||
10 Years | 7.65 | % | |||
5 Years | 1.95 | ||||
1 Year | 10.56 | ||||
Class Y shares incepted on October 3, 2008. Performance shown prior to that date is that of Class A shares and includes the 12b-1 fees applicable to Class A shares. Class A share performance reflects any applicable fee waivers or expense reimbursements.
Class R6 shares incepted on September 24, 2012. Performance shown prior to that date is that of Class A shares and includes the 12b-1 fees applicable to Class A shares. Class A share performance reflects any applicable fee waivers or expense reimbursements.
The performance data quoted represent past performance and cannot guarantee comparable future results; current performance may be lower or higher. Please visit
invesco.com/performance for the most recent month-end performance. Performance figures reflect reinvested distributions, changes in net asset value and the effect of the maximum sales charge unless otherwise stated. Performance figures do not reflect deduction of taxes a shareholder would pay on Fund distributions or sale of Fund shares. Investment return and principal value will fluctuate so that you may have a gain or loss when you sell shares.
The total annual Fund operating expense ratio set forth in the most recent Fund prospectus as of the date of this report for Class A, Class B, Class C, Class R, Class Y, Class R5 and Class R6 shares was 1.19%, 1.94%, 1.94%, 1.44%, 0.94%, 0.82% and 0.73%, respectively. The expense ratios presented above may vary from the expense ratios presented in other sections of this report that are based on expenses incurred during the period covered by this report.
Class A share performance reflects the maximum 5.50% sales charge, and Class B and Class C share performance reflects the applicable contingent deferred sales charge (CDSC) for the period involved. The CDSC on Class B shares declines from 5% beginning at the time of purchase to 0% at the beginning of the seventh year. The CDSC on Class C shares is 1% for the first year after purchase. Class R, Class Y, Class R5 and Class R6 shares do not have a front-end sales charge or a CDSC; therefore, performance is at net asset value.
The performance of the Fund’s share classes will differ primarily due to different sales charge structures and class expenses.
7 Invesco Mid Cap Core Equity Fund
Invesco Mid Cap Core Equity Fund’s investment objective is long-term growth of capital.
| n | Unless otherwise stated, information presented in this report is as of December 31, 2012, and is based on total net assets. |
| n | Unless otherwise noted, all data provided by Invesco. |
| n | To access your Fund’s reports/prospectus, visit invesco.com/fundreports. |
About share classes
| n | Class B shares may not be purchased for new or additional investments. Please see the prospectus for more information. |
| n | Class R shares are generally available only to employer sponsored retirement and benefit plans. Please see the prospectus for more information. |
| n | Class Y shares are available only to certain investors. Please see the prospectus for more information. |
| n | Class R5 shares and Class R6 shares are primarily intended for employer sponsored retirement and benefit plans that meet certain standards and for institutional investors. On September 24, 2012, Institutional Class shares were renamed Class R5 shares. Please see the prospectus for more information. |
Principal risks of investing in the Fund
| n | Cash/cash equivalents risk. Holding cash or cash equivalents may negatively affect performance. |
| n | Derivatives risk. The performance of derivative instruments is tied to the performance of an underlying currency, security, index or other instrument. In addition to risks relating to their underlying instruments, the use of derivatives may include other, possibly greater, risks. Derivatives involve costs, may be volatile, and may involve a small initial investment relative to the risk assumed. Risks associated with the use of derivatives include counterparty, leverage, correlation, liquidity, tax, market, interest rate and management risks. Derivatives may also be more difficult to purchase, sell or value than other investments. The Fund may lose more than the cash amount invested on investments in derivatives. |
Investors should bear in mind that, while the Fund intends to use derivative strategies, it is not obligated to actively engage in these transactions, generally or in any particular kind of derivative, if
the investment manager elects not to do so due to availability, cost, market conditions or other factors.
| n | Foreign securities risk. The Fund’s foreign investments may be affected by changes in a foreign country’s exchange rates, political and social instability, changes in economic or taxation policies, difficulties when enforcing obligations, decreased liquidity, and increased volatility. Foreign companies may be subject to less regulation resulting in less publicly available information about the companies. |
| n | Management risk. The investment techniques and risk analysis used by the Fund’s portfolio managers may not produce the desired results. |
| n | Market risk. The prices of and the income generated by the Fund’s securities may decline in response to, among other things, investor sentiment, general economic and market conditions, regional or global instability, and currency and interest rate fluctuations. |
| n | Small and mid-capitalization risk. Stocks of small and mid-sized companies tend to be more vulnerable to adverse developments in the above factors and may have little or no operating history or track record of success, and limited product lines, markets, management and financial resources. The securities of small and mid-sized companies may be more volatile due to less market interest and less publicly available information about the issuer. They also may be illiquid or restricted as to resale, or may trade less frequently and in smaller volumes, all of which may cause difficulty when establishing or closing a position at a desirable price. |
| n | Synthetic securities risk. Fluctuations in the values of synthetic securities may not correlate perfectly with the instruments they are designed to replicate. Synthetic securities may be subject to interest rate changes, market price fluctuations, counterparty risk and liquidity risk. |
About indexes used in this report
| n | The S&P 500® Index is an unmanaged index considered representative of the US stock market. |
| n | The Russell Midcap® Index is an unmanaged index considered representative of mid-cap stocks. The Russell Midcap Index is a trademark/service mark of the Frank Russell Co. Russell® is a trademark of the Frank Russell Co. |
| n | The Lipper Mid-Cap Core Funds Index is an unmanaged index considered representative of mid-cap core funds tracked by Lipper. |
| n | The Fund is not managed to track the performance of any particular index, including the indexes defined here, and consequently, the performance of the Fund may deviate significantly from the performance of the indexes. |
| n | A direct investment cannot be made in an index. Unless otherwise indicated, index results include reinvested dividends, and they do not reflect sales charges. Performance of the peer group, if applicable, reflects fund expenses; performance of a market index does not. |
Other information
| n | The returns shown in management’s discussion of Fund performance are based on net asset values calculated for shareholder transactions. Generally accepted accounting principles require adjustments to be made to the net assets of the Fund at period end for financial reporting purposes, and as such, the net asset values for shareholder transactions and the returns based on those net asset values may differ from the net asset values and returns reported in the Financial Highlights. |
| n | Industry classifications used in this report are generally according to the Global Industry Classification Standard, which was developed by and is the exclusive property and a service mark of MSCI Inc. and Standard & Poor’s. |
This report must be accompanied or preceded by a currently effective Fund prospectus, which contains more complete information, including sales charges and expenses. Investors should read it carefully before investing.
NOT FDIC INSURED | MAY LOSE VALUE | NO BANK GUARANTEE
| Fund Nasdaq Symbols | |||||
| Class A Shares | GTAGX | ||||
| Class B Shares | GTABX | ||||
| Class C Shares | GTACX | ||||
| Class R Shares | GTARX | ||||
| Class Y Shares | GTAYX | ||||
| Class R5 Shares | GTAVX | ||||
| Class R6 Shares | GTAFX | ||||
8 Invesco Mid Cap Core Equity Fund
Schedule of Investments(a)
December 31, 2012
| Shares | Value | |||||||
Common Stocks & Other Equity Interests–84.74% |
| |||||||
| Aerospace & Defense–1.87% | ||||||||
Exelis Inc. | 2,209,154 | $ | 24,897,165 | |||||
Moog Inc.–Class A(b) | 500,057 | 20,517,339 | ||||||
| 45,414,504 | ||||||||
| Apparel Retail–0.34% | ||||||||
Guess?, Inc. | 335,330 | 8,228,998 | ||||||
| Application Software–1.59% | ||||||||
Adobe Systems Inc.(b) | 1,026,067 | 38,662,205 | ||||||
| Asset Management & Custody Banks–2.20% | ||||||||
Northern Trust Corp. | 1,063,508 | 53,345,561 | ||||||
| Brewers–2.53% | ||||||||
Boston Beer Company, Inc. (The)–Class A(b) | 181,962 | 24,464,791 | ||||||
Molson Coors Brewing Co.–Class B | 864,442 | 36,989,473 | ||||||
| 61,454,264 | ||||||||
| Communications Equipment–3.00% | ||||||||
Acme Packet, Inc.(b) | 740,000 | 16,368,800 | ||||||
F5 Networks, Inc.(b) | 328,979 | 31,960,310 | ||||||
Polycom, Inc.(b) | 1,374,239 | 14,374,540 | ||||||
Tellabs, Inc. | 4,490,146 | 10,237,533 | ||||||
| 72,941,183 | ||||||||
| Computer & Electronics Retail–1.01% | ||||||||
GameStop Corp.–Class A | 982,404 | 24,648,516 | ||||||
| Computer Storage & Peripherals–1.26% | ||||||||
NetApp, Inc.(b) | 909,334 | 30,508,156 | ||||||
| Construction & Engineering–1.00% | ||||||||
Chicago Bridge & Iron Co. N.V.–New York Shares | 522,706 | 24,227,423 | ||||||
| Construction & Farm Machinery & Heavy Trucks–1.87% | ||||||||
Joy Global Inc. | 332,000 | 21,174,960 | ||||||
Terex Corp.(b) | 863,186 | 24,264,158 | ||||||
| 45,439,118 | ||||||||
| Construction Materials–1.13% | ||||||||
CRH PLC (Ireland) | 1,319,640 | 27,372,263 | ||||||
| Data Processing & Outsourced Services–0.47% | ||||||||
Western Union Co. (The) | 834,047 | 11,351,380 | ||||||
| Department Stores–0.86% | ||||||||
Macy’s, Inc. | 534,992 | 20,875,388 | ||||||
| Diversified Chemicals–1.38% | ||||||||
Huntsman Corp. | 2,110,728 | 33,560,575 | ||||||
| Diversified Metals & Mining–0.78% | ||||||||
Compass Minerals International, Inc. | 254,036 | 18,979,030 | ||||||
| Shares | Value | |||||||
| Electronic Components–1.66% | ||||||||
Amphenol Corp.–Class A | 621,444 | $ | 40,207,427 | |||||
| Electronic Manufacturing Services–0.93% | ||||||||
Molex Inc. | 828,283 | 22,636,974 | ||||||
| Environmental & Facilities Services–1.27% | ||||||||
Republic Services, Inc. | 1,053,030 | 30,885,370 | ||||||
| Food Retail–0.62% | ||||||||
Safeway Inc. | 829,649 | 15,008,350 | ||||||
| Footwear–1.00% | ||||||||
Wolverine World Wide, Inc. | 590,000 | 24,178,200 | ||||||
| General Merchandise Stores–1.95% | ||||||||
Big Lots, Inc.(b) | 951,560 | 27,081,397 | ||||||
Family Dollar Stores, Inc. | 319,131 | 20,236,097 | ||||||
| 47,317,494 | ||||||||
| Health Care Equipment–0.77% | ||||||||
Boston Scientific Corp.(b) | 3,283,824 | 18,816,312 | ||||||
| Health Care Services–0.80% | ||||||||
Quest Diagnostics Inc. | 331,664 | 19,326,061 | ||||||
| Homebuilding–0.78% | ||||||||
D.R. Horton, Inc. | 956,929 | 18,928,056 | ||||||
| Industrial Machinery–5.27% | ||||||||
Dover Corp. | 436,000 | 28,649,560 | ||||||
Flowserve Corp. | 154,000 | 22,607,200 | ||||||
ITT Corp. | 1,289,932 | 30,261,805 | ||||||
SPX Corp. | 302,440 | 21,216,166 | ||||||
Stanley Black & Decker Inc. | 341,000 | 25,223,770 | ||||||
| 127,958,501 | ||||||||
| Insurance Brokers–1.30% | ||||||||
Marsh & McLennan Cos., Inc. | 918,373 | 31,656,317 | ||||||
| Investment Banking & Brokerage–0.95% | ||||||||
Charles Schwab Corp. (The) | 1,599,562 | 22,969,710 | ||||||
| Life & Health Insurance–1.40% | ||||||||
Torchmark Corp. | 656,131 | 33,902,289 | ||||||
| Life Sciences Tools & Services–2.61% | ||||||||
Agilent Technologies, Inc. | 1,082,215 | 44,305,882 | ||||||
Life Technologies Corp.(b) | 390,003 | 19,141,347 | ||||||
| 63,447,229 | ||||||||
| Managed Health Care–2.56% | ||||||||
Aetna Inc. | 589,238 | 27,281,719 | ||||||
Health Net Inc.(b) | 621,033 | 15,091,102 | ||||||
Humana Inc. | 288,000 | 19,765,440 | ||||||
| 62,138,261 | ||||||||
See accompanying Notes to Financial Statements which are an integral part of the financial statements.
9 Invesco Mid Cap Core Equity Fund
| Shares | Value | |||||||
| Marine–0.87% | ||||||||
Kirby Corp.(b) | 339,774 | $ | 21,028,613 | |||||
| Multi–Sector Holdings–0.35% | ||||||||
PICO Holdings, Inc.(b) | 425,720 | 8,629,344 | ||||||
| Multi–Utilities–0.76% | ||||||||
CMS Energy Corp. | 754,608 | 18,397,343 | ||||||
| Office Services & Supplies–1.82% | ||||||||
Avery Dennison Corp. | 841,000 | 29,367,720 | ||||||
Pitney Bowes Inc. | 1,397,690 | 14,871,422 | ||||||
| 44,239,142 | ||||||||
| Oil & Gas Drilling–0.68% | ||||||||
Transocean Ltd. | 371,728 | 16,597,655 | ||||||
| Oil & Gas Equipment & Services–4.04% | ||||||||
Cameron International Corp.(b) | 404,042 | 22,812,211 | ||||||
Dresser–Rand Group, Inc.(b) | 371,000 | 20,827,940 | ||||||
Lufkin Industries, Inc. | 351,000 | 20,403,630 | ||||||
Weatherford International Ltd.(b) | 3,036,713 | 33,980,819 | ||||||
| 98,024,600 | ||||||||
| Oil & Gas Exploration & Production–1.98% | ||||||||
Concho Resources Inc.(b) | 216,403 | 17,433,425 | ||||||
Southwestern Energy Co.(b) | 726,941 | 24,287,099 | ||||||
Talisman Energy Inc. (Canada) | 569,881 | 6,458,307 | ||||||
| 48,178,831 | ||||||||
| Packaged Foods & Meats–3.67% | ||||||||
JM Smucker Co. (The) | 315,876 | 27,241,146 | ||||||
Kellogg Co. | 1,109,949 | 61,990,652 | ||||||
| 89,231,798 | ||||||||
| Paper Packaging–0.91% | ||||||||
Packaging Corp. of America | 572,000 | 22,004,840 | ||||||
| Personal Products–0.64% | ||||||||
Avon Products, Inc. | 1,085,346 | 15,585,569 | ||||||
| Pharmaceuticals–2.29% | ||||||||
Endo Health Solutions Inc.(b) | 805,326 | 21,155,914 | ||||||
Shire PLC–ADR (Ireland) | 373,774 | 34,454,487 | ||||||
| 55,610,401 | ||||||||
| Property & Casualty Insurance–3.31% | ||||||||
Arch Capital Group Ltd.(b) | 754,000 | 33,191,080 | ||||||
Progressive Corp. (The) | 2,238,740 | 47,237,414 | ||||||
| 80,428,494 | ||||||||
| Shares | Value | |||||||
| Restaurants–1.04% | ||||||||
Darden Restaurants, Inc. | 562,537 | $ | 25,353,543 | |||||
| Semiconductor Equipment–2.16% | ||||||||
Lam Research Corp.(b) | 600,000 | 21,678,000 | ||||||
Teradyne, Inc.(b) | 1,830,000 | 30,908,700 | ||||||
| 52,586,700 | ||||||||
| Semiconductors–4.61% | ||||||||
Hittite Microwave Corp.(b) | 41,954 | 2,605,343 | ||||||
Linear Technology Corp. | 1,577,763 | 54,117,271 | ||||||
Microchip Technology Inc. | 600,326 | 19,564,624 | ||||||
Xilinx, Inc. | 992,422 | 35,627,950 | ||||||
| 111,915,188 | ||||||||
| Soft Drinks–1.70% | ||||||||
Dr. Pepper Snapple Group, Inc. | 934,635 | 41,292,174 | ||||||
| Specialized Finance–1.13% | ||||||||
Moody’s Corp. | 546,201 | 27,484,834 | ||||||
| Specialty Chemicals–3.05% | ||||||||
International Flavors & Fragrances Inc. | 557,036 | 37,065,176 | ||||||
Sigma–Aldrich Corp. | 501,790 | 36,921,708 | ||||||
| 73,986,884 | ||||||||
| Steel–0.62% | ||||||||
Allegheny Technologies, Inc. | 495,180 | 15,033,665 | ||||||
| Systems Software–2.63% | ||||||||
CA, Inc. | 589,699 | 12,961,584 | ||||||
Symantec Corp.(b) | 2,709,824 | 50,971,790 | ||||||
| 63,933,374 | ||||||||
| Thrifts & Mortgage Finance–1.32% | ||||||||
People’s United Financial Inc. | 2,659,064 | 32,148,084 | ||||||
Total Common Stocks & Other Equity Interests |
| 2,058,076,191 | ||||||
Money Market Funds–16.76% |
| |||||||
Liquid Assets Portfolio–Institutional Class(c) | 203,559,144 | 203,559,144 | ||||||
Premier Portfolio–Institutional Class(c) | 203,559,144 | 203,559,144 | ||||||
Total Money Market Funds |
| 407,118,288 | ||||||
TOTAL INVESTMENTS–101.50% |
| 2,465,194,479 | ||||||
OTHER ASSETS LESS LIABILITIES–(1.50)% |
| (36,403,319 | ) | |||||
NET ASSETS–100.00% |
| $ | 2,428,791,160 | |||||
Investment Abbreviations:
| ADR | – American Depositary Receipt |
Notes to Schedule of Investments:
| (a) | Industry and/or sector classifications used in this report are generally according to the Global Industry Classification Standard, which was developed by and is the exclusive property and a service mark of MSCI Inc. and Standard & Poor’s. |
| (b) | Non-income producing security. |
| (c) | The money market fund and the Fund are affiliated by having the same investment adviser. |
See accompanying Notes to Financial Statements which are an integral part of the financial statements.
10 Invesco Mid Cap Core Equity Fund
Statement of Assets and Liabilities
December 31, 2012
Assets: |
| |||
Investments, at value (Cost $1,849,746,737) | $ | 2,058,076,191 | ||
Investments in affiliated money market funds, at value and cost | 407,118,288 | |||
Total investments, at value (Cost $2,256,865,025) | 2,465,194,479 | |||
Foreign currencies, at value (Cost $65,380) | 64,513 | |||
Receivable for: | ||||
Investments sold | 512,433 | |||
Fund shares sold | 4,554,754 | |||
Dividends | 1,326,453 | |||
Investment for trustee deferred compensation and retirement plans | 84,926 | |||
Other assets | 50,168 | |||
Total assets | 2,471,787,726 | |||
Liabilities: |
| |||
Payable for: | ||||
Investments purchased | 15,286,937 | |||
Fund shares reacquired | 25,044,664 | |||
Accrued fees to affiliates | 2,053,433 | |||
Accrued other operating expenses | 180,071 | |||
Trustee deferred compensation and retirement plans | 431,461 | |||
Total liabilities | 42,996,566 | |||
Net assets applicable to shares outstanding | $ | 2,428,791,160 | ||
Net assets consist of: |
| |||
Shares of beneficial interest | $ | 2,206,443,993 | ||
Undistributed net investment income | (456,229 | ) | ||
Undistributed net realized gain | 14,474,037 | |||
Unrealized appreciation | 208,329,359 | |||
| $ | 2,428,791,160 | |||
Net Assets: |
| |||
Class A | $ | 1,352,885,646 | ||
Class B | $ | 36,795,296 | ||
Class C | $ | 190,301,579 | ||
Class R | $ | 125,474,391 | ||
Class Y | $ | 469,509,587 | ||
Class R5 | $ | 253,815,296 | ||
Class R6 | $ | 9,365 | ||
Shares outstanding, $0.01 par value per share, |
| |||
Class A | 63,308,540 | |||
Class B | 2,223,876 | |||
Class C | 11,529,459 | |||
Class R | 5,976,382 | |||
Class Y | 21,839,815 | |||
Class R5 | 11,293,286 | |||
Class R6 | 416.6 | |||
Class A: | ||||
Net asset value per share | $ | 21.37 | ||
Maximum offering price per share | ||||
(Net asset value of $21.37 ¸ 94.50%) | $ | 22.61 | ||
Class B: | ||||
Net asset value and offering price per share | $ | 16.55 | ||
Class C: | ||||
Net asset value and offering price per share | $ | 16.51 | ||
Class R: | ||||
Net asset value and offering price per share | $ | 21.00 | ||
Class Y: | ||||
Net asset value and offering price per share | $ | 21.50 | ||
Class R5: | ||||
Net asset value and offering price per share | $ | 22.47 | ||
Class R6: | ||||
Net asset value and offering price per share | $ | 22.48 | ||
See accompanying Notes to Financial Statements which are an integral part of the financial statements.
11 Invesco Mid Cap Core Equity Fund
Statement of Operations
For the year ended December 31, 2012
Investment income: |
| |||
Dividends (net of foreign withholding taxes of $95,107) | $ | 43,579,965 | ||
Dividends from affiliated money market funds | 836,502 | |||
Total investment income | 44,416,467 | |||
Expenses: | ||||
Advisory fees | 17,525,557 | |||
Administrative services fees | 524,295 | |||
Custodian fees | 62,027 | |||
Distribution fees: | ||||
Class A | 3,741,502 | |||
Class B | 450,965 | |||
Class C | 2,123,467 | |||
Class R | 774,020 | |||
Transfer agent fees — A, B, C, R and Y | 5,050,535 | |||
Transfer agent fees — R5 | 334,921 | |||
Trustees’ and officers’ fees and benefits | 120,483 | |||
Other | 555,946 | |||
Total expenses | 31,263,718 | |||
Less: Fees waived and expense offset arrangement(s) | (882,985 | ) | ||
Net expenses | 30,380,733 | |||
Net investment income | 14,035,734 | |||
Realized and unrealized gain (loss) from: | ||||
Net realized gain (loss) from: | ||||
Investment securities (includes net gains from securities sold to affiliates of $1,178,397) | 176,355,530 | |||
Foreign currencies | (56,637 | ) | ||
| 176,298,893 | ||||
Change in net unrealized appreciation of: | ||||
Investment securities | 71,004,510 | |||
Foreign currencies | 1,121 | |||
| 71,005,631 | ||||
Net realized and unrealized gain | 247,304,524 | |||
Net increase in net assets resulting from operations | $ | 261,340,258 | ||
See accompanying Notes to Financial Statements which are an integral part of the financial statements.
12 Invesco Mid Cap Core Equity Fund
Statement of Changes in Net Assets
For the years ended December 31, 2012 and 2011
| 2012 | 2011 | |||||||
Operations: |
| |||||||
Net investment income (loss) | $ | 14,035,734 | $ | (3,931,293 | ) | |||
Net realized gain | 176,298,893 | 107,501,297 | ||||||
Change in net unrealized appreciation (depreciation) | 71,005,631 | (287,953,063 | ) | |||||
Net increase (decrease) in net assets resulting from operations | 261,340,258 | (184,383,059 | ) | |||||
Distributions to shareholders from net investment income: | ||||||||
Class A | (7,236,589 | ) | — | |||||
Class R | (279,265 | ) | — | |||||
Class Y | (3,690,126 | ) | — | |||||
Class R5 | (2,819,739 | ) | — | |||||
Class R6 | (94 | ) | — | |||||
Total distributions from net investment income | (14,025,813 | ) | — | |||||
Distributions to shareholders from net realized gains: | ||||||||
Class A | (101,390,749 | ) | (51,719,481 | ) | ||||
Class B | (3,508,096 | ) | (2,377,868 | ) | ||||
Class C | (18,107,740 | ) | (9,157,530 | ) | ||||
Class R | (9,428,266 | ) | (5,597,657 | ) | ||||
Class Y | (33,865,767 | ) | (6,063,023 | ) | ||||
Class R5 | (21,529,628 | ) | (11,501,182 | ) | ||||
Class R6 | (701 | ) | — | |||||
Total distributions from net realized gains | (187,830,947 | ) | (86,416,741 | ) | ||||
Share transactions-net: | ||||||||
Class A | (242,756,085 | ) | (119,304,444 | ) | ||||
Class B | (19,614,774 | ) | (52,612,532 | ) | ||||
Class C | (32,066,888 | ) | (2,311,668 | ) | ||||
Class R | (45,078,942 | ) | (5,101,898 | ) | ||||
Class Y | 291,447,667 | 7,064,518 | ||||||
Class R5 | (94,801,385 | ) | 59,859,250 | |||||
Class R6 | 10,000 | — | ||||||
Net increase (decrease) in net assets resulting from share transactions | (142,860,407 | ) | (112,406,774 | ) | ||||
Net increase (decrease) in net assets | (83,376,909 | ) | (383,206,574 | ) | ||||
Net assets: | ||||||||
Beginning of year | 2,512,168,069 | 2,895,374,643 | ||||||
End of year (includes undistributed net investment income (loss) of $(456,229) and $(431,784), respectively) | $ | 2,428,791,160 | $ | 2,512,168,069 | ||||
Notes to Financial Statements
December 31, 2012
NOTE 1—Significant Accounting Policies
Invesco Mid Cap Core Equity Fund (the “Fund”) is a series portfolio of AIM Growth Series (Invesco Growth Series) (the “Trust”). The Trust is organized as a Delaware statutory trust and is registered under the Investment Company Act of 1940, as amended (the “1940 Act”), as an open-end series management investment company consisting of sixteen separate series portfolios, each authorized to issue an unlimited number of shares of beneficial interest. The assets, liabilities and operations of each portfolio are accounted for separately. Information presented in these financial statements pertains only to the Fund. Matters affecting each portfolio or class will be voted on exclusively by the shareholders of such portfolio or class.
The Fund’s investment objective is long-term growth of capital.
The Fund currently consists of seven different classes of shares: Class A, Class B, Class C, Class R, Class Y, Class R5 and Class R6. On September 24, 2012, Institutional Class shares were renamed Class R5 shares and the Fund began offering Class R6 shares. Class A shares are sold with a front-end sales charge unless certain waiver criteria are met and under certain circumstances load waived shares may be subject to contingent deferred sales charges (“CDSC”). Class C shares are sold with a CDSC. Class R, Class Y, Class R5 and Class R6 shares are sold at net asset value. Effective November 30, 2010, new or additional investments in Class B shares are no longer permitted. Existing shareholders of Class B shares may
13 Invesco Mid Cap Core Equity Fund
continue to reinvest dividends and capital gains distributions in Class B shares until they convert to Class A shares. Also, shareholders in Class B shares will be able to exchange those shares for Class B shares of other Invesco Funds offering such shares until they convert to Class A shares. Generally, Class B shares will automatically convert to Class A shares on or about the month-end, which is at least eight years after the date of purchase. Redemption of Class B shares prior to the conversion date will be subject to a CDSC.
The following is a summary of the significant accounting policies followed by the Fund in the preparation of its financial statements.
| A. | Security Valuations — Securities, including restricted securities, are valued according to the following policy. |
A security listed or traded on an exchange (except convertible bonds) is valued at its last sales price or official closing price as of the close of the customary trading session on the exchange where the security is principally traded, or lacking any sales or official closing price on a particular day, the security may be valued at the closing bid price on that day. Securities traded in the over-the-counter market are valued based on prices furnished by independent pricing services or market makers. When such securities are valued by an independent pricing service they may be considered fair valued. Futures contracts are valued at the final settlement price set by an exchange on which they are principally traded. Listed options are valued at the mean between the last bid and ask prices from the exchange on which they are principally traded. Options not listed on an exchange are valued by an independent source at the mean between the last bid and ask prices. For purposes of determining net asset value per share, futures and option contracts generally are valued 15 minutes after the close of the customary trading session of the New York Stock Exchange (“NYSE”).
Investments in open-end and closed-end registered investment companies that do not trade on an exchange are valued at the end of day net asset value per share. Investments in open-end and closed-end registered investment companies that trade on an exchange are valued at the last sales price or official closing price as of the close of the customary trading session on the exchange where the security is principally traded.
Debt obligations (including convertible bonds) and unlisted equities are fair valued using an evaluated quote provided by an independent pricing service. Evaluated quotes provided by the pricing service may be determined without exclusive reliance on quoted prices, and may reflect appropriate factors such as institution-size trading in similar groups of securities, developments related to specific securities, dividend rate (for unlisted equities), yield (for debt obligations), quality, type of issue, coupon rate (for debt obligations), maturity (for debt obligations), individual trading characteristics and other market data. Debt obligations are subject to interest rate and credit risks. In addition, all debt obligations involve some risk of default with respect to interest and/or principal payments.
Foreign securities’ (including foreign exchange contracts) prices are converted into U.S. dollar amounts using the applicable exchange rates as of the close of the NYSE. If market quotations are available and reliable for foreign exchange-traded equity securities, the securities will be valued at the market quotations. Because trading hours for certain foreign securities end before the close of the NYSE, closing market quotations may become unreliable. If between the time trading ends on a particular security and the close of the customary trading session on the NYSE, events occur that the Adviser determines are significant and make the closing price unreliable, the Fund may fair value the security. If the event is likely to have affected the closing price of the security, the security will be valued at fair value in good faith using procedures approved by the Board of Trustees. Adjustments to closing prices to reflect fair value may also be based on a screening process of an independent pricing service to indicate the degree of certainty, based on historical data, that the closing price in the principal market where a foreign security trade is not the current value as of the close of the NYSE. Foreign securities’ prices meeting the approved degree of certainty that the price is not reflective of current value will be priced at the indication of fair value from the independent pricing service. Multiple factors may be considered by the independent pricing service in determining adjustments to reflect fair value and may include information relating to sector indices, American Depositary Receipts and domestic and foreign index futures. Foreign securities may have additional risks including exchange rate changes, potential for sharply devalued currencies and high inflation, political and economic upheaval, the relative lack of issuer information, relatively low market liquidity and the potential lack of strict financial and accounting controls and standards.
Securities for which market prices are not provided by any of the above methods may be valued based upon quotes furnished by independent sources. The last bid price may be used to value equity securities. The mean between the last bid and asked prices is used to value debt obligations, including corporate loans.
Securities for which market quotations are not readily available or became unreliable are valued at fair value as determined in good faith by or under the supervision of the Trust’s officers following procedures approved by the Board of Trustees. Issuer specific events, market trends, bid/ask quotes of brokers and information providers and other market data may be reviewed in the course of making a good faith determination of a security’s fair value.
Valuations change in response to many factors including the historical and prospective earnings of the issuer, the value of the issuer’s assets, general economic conditions, interest rates, investor perceptions and market liquidity. Because of the inherent uncertainties of valuation, the values reflected in the financial statements may materially differ from the value received upon actual sale of those investments.
| B. | Securities Transactions and Investment Income — Securities transactions are accounted for on a trade date basis. Realized gains or losses on sales are computed on the basis of specific identification of the securities sold. Interest income is recorded on the accrual basis from settlement date. Dividend income (net of withholding tax, if any) is recorded on the ex-dividend date. |
The Fund may periodically participate in litigation related to Fund investments. As such, the Fund may receive proceeds from litigation settlements. Any proceeds received are included in the Statement of Operations as realized gain (loss) for investments no longer held and as unrealized gain (loss) for investments still held.
Brokerage commissions and mark ups are considered transaction costs and are recorded as an increase to the cost basis of securities purchased and/or a reduction of proceeds on a sale of securities. Such transaction costs are included in the determination of net realized and unrealized gain (loss) from investment securities reported in the Statement of Operations and the Statement of Changes in Net Assets and the net realized and unrealized gains (losses) on securities per share in the Financial Highlights. Transaction costs are included in the calculation of the Fund’s net asset value and, accordingly, they reduce the Fund’s total returns. These transaction costs are not considered operating expenses and are not reflected in net investment income reported in the Statement of Operations and Statement of Changes in Net Assets, or the net investment income per share and ratios of expenses and net investment income reported in the Financial Highlights, nor are they limited by any expense limitation arrangements between the Fund and the investment adviser.
The Fund allocates income and realized and unrealized capital gains and losses to a class based on the relative net assets of each class.
| C. | Country Determination — For the purposes of making investment selection decisions and presentation in the Schedule of Investments, the investment adviser may determine the country in which an issuer is located and/or credit risk exposure based on various factors. These factors include the laws of the country under which the issuer is organized, where the issuer maintains a principal office, the country in which the issuer |
14 Invesco Mid Cap Core Equity Fund
| derives 50% or more of its total revenues and the country that has the primary market for the issuer’s securities, as well as other criteria. Among the other criteria that may be evaluated for making this determination are the country in which the issuer maintains 50% or more of its assets, the type of security, financial guarantees and enhancements, the nature of the collateral and the sponsor organization. Country of issuer and/or credit risk exposure has been determined to be the United States of America, unless otherwise noted. |
| D. | Distributions — Distributions from income and net realized capital gain, if any, are generally declared and paid annually and recorded on the ex-dividend date. The Fund may elect to treat a portion of the proceeds from redemptions as distributions for federal income tax purposes. |
| E. | Federal Income Taxes — The Fund intends to comply with the requirements of Subchapter M of the Internal Revenue Code necessary to qualify as a regulated investment company and to distribute substantially all of the Fund’s taxable earnings to shareholders. As such, the Fund will not be subject to federal income taxes on otherwise taxable income (including net realized capital gain) that is distributed to shareholders. Therefore, no provision for federal income taxes is recorded in the financial statements. |
The Fund files tax returns in the U.S. Federal jurisdiction and certain other jurisdictions. Generally, the Fund is subject to examinations by such taxing authorities for up to three years after the filing of the return for the tax period.
| F. | Expenses — Fees provided for under the Rule 12b-1 plan of a particular class of the Fund are charged to the operations of such class. Transfer agency fees and expenses and other shareholder recordkeeping fees and expenses attributable to Class R5 and Class R6 are allocated to each share class based on relative net assets. Sub-accounting fees attributable to Class R5 are charged to the operations of the class. Transfer agency fees and expenses and other shareholder recordkeeping fees and expenses relating to all other classes are allocated among those classes based on relative net assets. All other expenses are allocated among the classes based on relative net assets. |
| G. | Accounting Estimates — The preparation of financial statements in conformity with accounting principles generally accepted in the United States of America (“GAAP”) requires management to make estimates and assumptions that affect the reported amounts of assets and liabilities at the date of the financial statements and the reported amounts of revenues and expenses during the reporting period including estimates and assumptions related to taxation. Actual results could differ from those estimates by a significant amount. In addition, the Fund monitors for material events or transactions that may occur or become known after the period-end date and before the date the financial statements are released to print. |
| H. | Indemnifications — Under the Trust’s organizational documents, each Trustee, officer, employee or other agent of the Trust is indemnified against certain liabilities that may arise out of the performance of their duties to the Fund. Additionally, in the normal course of business, the Fund enters into contracts, including the Fund’s servicing agreements, that contain a variety of indemnification clauses. The Fund’s maximum exposure under these arrangements is unknown as this would involve future claims that may be made against the Fund that have not yet occurred. The risk of material loss as a result of such indemnification claims is considered remote. |
| I. | Foreign Currency Translations — Foreign currency is valued at the close of the NYSE based on quotations posted by banks and major currency dealers. Portfolio securities and other assets and liabilities denominated in foreign currencies are translated into U.S. dollar amounts at date of valuation. Purchases and sales of portfolio securities (net of foreign taxes withheld on disposition) and income items denominated in foreign currencies are translated into U.S. dollar amounts on the respective dates of such transactions. The Fund does not separately account for the portion of the results of operations resulting from changes in foreign exchange rates on investments and the fluctuations arising from changes in market prices of securities held. The combined results of changes in foreign exchange rates and the fluctuation of market prices on investments (net of estimated foreign tax withholding) are included with the net realized and unrealized gain or loss from investments in the Statement of Operations. Reported net realized foreign currency gains or losses arise from (1) sales of foreign currencies, (2) currency gains or losses realized between the trade and settlement dates on securities transactions, and (3) the difference between the amounts of dividends, interest, and foreign withholding taxes recorded on the Fund’s books and the U.S. dollar equivalent of the amounts actually received or paid. Net unrealized foreign currency gains and losses arise from changes in the fair values of assets and liabilities, other than investments in securities at fiscal period end, resulting from changes in exchange rates. |
The Fund may invest in foreign securities which may be subject to foreign taxes on income, gains on investments or currency repatriation, a portion of which may be recoverable.
| J. | Foreign Currency Contracts — The Fund may enter into foreign currency contracts to manage or minimize currency or exchange rate risk. The Fund may also enter into foreign currency contracts for the purchase or sale of a security denominated in a foreign currency in order to “lock in” the U.S. dollar price of that security. A foreign currency contract is an obligation to purchase or sell a specific currency for an agreed-upon price at a future date. The use of foreign currency contracts does not eliminate fluctuations in the price of the underlying securities the Fund owns or intends to acquire but establishes a rate of exchange in advance. Fluctuations in the value of these contracts are measured by the difference in the contract date and reporting date exchange rates and are recorded as unrealized appreciation (depreciation) until the contracts are closed. When the contracts are closed, realized gains (losses) are recorded. Realized and unrealized gains (losses) on the contracts are included in the Statement of Operations. The primary risks associated with foreign currency contracts include failure of the counterparty to meet the terms of the contract and the value of the foreign currency changing unfavorably. These risks may be in excess of the amounts reflected in the Statement of Assets and Liabilities. |
NOTE 2—Advisory Fees and Other Fees Paid to Affiliates
The Trust has entered into a master investment advisory agreement with Invesco Advisers, Inc. (the “Adviser” or “Invesco”). Under the terms of the investment advisory agreement, the Fund pays an advisory fee to the Adviser based on the annual rate of the Fund’s average daily net assets as follows:
| Average Daily Net Assets | Rate | |||||
First $500 million | 0 | .725% | ||||
Next $500 million | 0 | .70% | ||||
Next $500 million | 0 | .675% | ||||
Over $1.5 billion | 0 | .65% | ||||
Under the terms of a master sub-advisory agreement between the Adviser and each of Invesco Asset Management Deutschland GmbH, Invesco Asset Management Limited, Invesco Asset Management (Japan) Limited, Invesco Australia Limited, Invesco Hong Kong Limited, Invesco Senior Secured
15 Invesco Mid Cap Core Equity Fund
Management, Inc. and Invesco Canada Ltd. (collectively, the “Affiliated Sub-Advisers”) the Adviser, not the Fund, may pay 40% of the fees paid to the Adviser to any such Affiliated Sub-Adviser(s) that provide discretionary investment management services to the Fund based on the percentage of assets allocated to such Sub-Adviser(s).
The Adviser has contractually agreed, through at least June 30, 2013, to waive advisory fees and/or reimburse expenses of all shares to the extent necessary to limit total annual fund operating expenses after fee waiver and/or expense reimbursement (excluding certain items discussed below) of Class A, Class B, Class C, Class R, Class Y, Class R5 and Class R6 shares to 2.00%, 2.75%, 2.75%, 2.25%, 1.75%, 1.75% and 1.75%, respectively, of average daily net assets. In determining the Adviser’s obligation to waive advisory fees and/or reimburse expenses, the following expenses are not taken into account, and could cause the total annual fund operating expenses after fee waiver and/or expense reimbursement to exceed the numbers reflected above: (1) interest; (2) taxes; (3) dividend expense on short sales; (4) extraordinary or non-routine items, including litigation expenses; and (5) expenses that the Fund has incurred but did not actually pay because of an expense offset arrangement. Unless the Board of Trustees and Invesco mutually agree to amend or continue the fee waiver agreement, it will terminate on June 30, 2013. The Adviser did not waive fees and/or reimburse expenses during the period under this limitation.
Further, the Adviser has contractually agreed, through at least June 30, 2013, to waive the advisory fee payable by the Fund in an amount equal to 100% of the net advisory fees the Adviser receives from the affiliated money market funds on investments by the Fund of uninvested cash in such affiliated money market funds.
For the year ended December 31, 2012, the Adviser waived advisory fees of $877,228.
The Trust has entered into a master administrative services agreement with Invesco pursuant to which the Fund has agreed to pay Invesco for certain administrative costs incurred in providing accounting services to the Fund. For the year ended December 31, 2012, expenses incurred under the agreement are shown in the Statement of Operations as Administrative services fees.
The Trust has entered into a transfer agency and service agreement with Invesco Investment Services, Inc. (“IIS”) pursuant to which the Fund has agreed to pay IIS a fee for providing transfer agency and shareholder services to the Fund and reimburse IIS for certain expenses incurred by IIS in the course of providing such services. IIS may make payments to intermediaries that provide omnibus account services, sub-accounting services and/or networking services. All fees payable by IIS to intermediaries that provide omnibus account services or sub-accounting are charged back to the Fund, subject to certain limitations approved by the Trust’s Board of Trustees. For the year ended December 31, 2012, expenses incurred under the agreement are shown in the Statement of Operations as Transfer agent fees.
The Trust has entered into master distribution agreements with Invesco Distributors, Inc. (“IDI”) to serve as the distributor for the Class A, Class B, Class C, Class R, Class Y, Class R5 and Class R6 shares of the Fund. The Trust has adopted plans pursuant to Rule 12b-1 under the 1940 Act with respect to the Fund’s Class A, Class B, Class C and Class R shares (collectively, the “Plans”). The Fund, pursuant to the Plans, pays IDI compensation at the annual rate of 0.25% of the Fund’s average daily net assets of Class A shares, 1.00% of the average daily net assets of Class B and Class C shares and 0.50% of the average daily net assets of Class R shares. Of the Plan payments, up to 0.25% of the average daily net assets of each class of shares may be paid to furnish continuing personal shareholder services to customers who purchase and own shares of such classes. Any amounts not paid as a service fee under the Plans would constitute an asset-based sales charge. Rules of the Financial Industry Regulatory Authority (“FINRA”) impose a cap on the total sales charges, including asset-based sales charges, that may be paid by any class of shares of the Fund. For the year ended December 31, 2012, expenses incurred under the Plans are shown in the Statement of Operations as Distribution fees.
Front-end sales commissions and CDSC (collectively, the “sales charges”) are not recorded as expenses of the Fund. Front-end sales commissions are deducted from proceeds from the sales of Fund shares prior to investment in Class A shares of the Fund. CDSC are deducted from redemption proceeds prior to remittance to the shareholder. During the year ended December 31, 2012, IDI advised the Fund that IDI retained $167,281 in front-end sales commissions from the sale of Class A shares and $8,876, $63,115 and $17,529 from Class A, Class B and Class C shares, respectively, for CDSC imposed on redemptions by shareholders.
For the year ended December 31, 2012, the Fund incurred $10,967 in brokerage commissions with Invesco Capital Markets, Inc., an affiliate of the Adviser and IDI, for portfolio transactions executed on behalf of the Fund.
Certain officers and trustees of the Trust are officers and directors of the Adviser, IIS and/or IDI.
NOTE 3—Additional Valuation Information
GAAP defines fair value as the price that would be received to sell an asset or paid to transfer a liability in an orderly transaction between market participants at the measurement date, under current market conditions. GAAP establishes a hierarchy that prioritizes the inputs to valuation methods giving the highest priority to readily available unadjusted quoted prices in an active market for identical assets (Level 1) and the lowest priority to significant unobservable inputs (Level 3) generally when market prices are not readily available or are unreliable. Based on the valuation inputs, the securities or other investments are tiered into one of three levels. Changes in valuation methods may result in transfers in or out of an investment’s assigned level:
| Level 1 — | Prices are determined using quoted prices in an active market for identical assets. |
| Level 2 — | Prices are determined using other significant observable inputs. Observable inputs are inputs that other market participants may use in pricing a security. These may include quoted prices for similar securities, interest rates, prepayment speeds, credit risk, yield curves, loss severities, default rates, discount rates, volatilities and others. |
| Level 3 — | Prices are determined using significant unobservable inputs. In situations where quoted prices or observable inputs are unavailable (for example, when there is little or no market activity for an investment at the end of the period), unobservable inputs may be used. Unobservable inputs reflect the Fund’s own assumptions about the factors market participants would use in determining fair value of the securities or instruments and would be based on the best available information. |
The following is a summary of the tiered valuation input levels, as of December 31, 2012. The level assigned to the securities valuations may not be an indication of the risk or liquidity associated with investing in those securities. Because of the inherent uncertainties of valuation, the values reflected in the financial statements may materially differ from the value received upon actual sale of those investments.
| Level 1 | Level 2 | Level 3 | Total | |||||||||||||
Equity Securities | $ | 2,437,822,216 | $ | 27,372,263 | $ | — | $ | 2,465,194,479 | ||||||||
16 Invesco Mid Cap Core Equity Fund
NOTE 4—Security Transactions with Affiliated Funds
The Fund is permitted to purchase or sell securities from or to certain other Invesco Funds under specified conditions outlined in procedures adopted by the Board of Trustees of the Trust. The procedures have been designed to ensure that any purchase or sale of securities by the Fund from or to another fund or portfolio that is or could be considered an affiliate by virtue of having a common investment adviser (or affiliated investment advisers), common Trustees and/or common officers complies with Rule 17a-7 of the 1940 Act. Further, as defined under the procedures, each transaction is effected at the current market price. Pursuant to these procedures, for the year ended December 31, 2012, the Fund engaged in securities purchases of $6,433,293 and securities sales of $9,710,086, which resulted in net realized gains of $1,178,397.
NOTE 5—Expense Offset Arrangement(s)
The expense offset arrangements are comprised of (1) transfer agency credits which result from balances in Demand Deposit Accounts (DDA) used by the transfer agent for clearing shareholder transactions and (2) custodian credits which result from periodic overnight cash balances at the custodian. For the year ended December 31, 2012, the Fund received credits from these arrangements, which resulted in the reduction of the Fund’s total expenses of $5,757.
NOTE 6—Trustees’ and Officers’ Fees and Benefits
“Trustees’ and Officers’ Fees and Benefits” include amounts accrued by the Fund to pay remuneration to certain Trustees and Officers of the Fund. Trustees have the option to defer compensation payable by the Fund, and “Trustees’ and Officers’ Fees and Benefits” also include amounts accrued by the Fund to fund such deferred compensation amounts. Those Trustees who defer compensation have the option to select various Invesco Funds in which their deferral accounts shall be deemed to be invested. Finally, certain current Trustees are eligible to participate in a retirement plan that provides for benefits to be paid upon retirement to Trustees over a period of time based on the number of years of service. The Fund may have certain former Trustees who also participate in a retirement plan and receive benefits under such plan. “Trustees’ and Officers’ Fees and Benefits” include amounts accrued by the Fund to fund such retirement benefits. Obligations under the deferred compensation and retirement plans represent unsecured claims against the general assets of the Fund.
NOTE 7—Cash Balances
The Fund is permitted to temporarily carry a negative or overdrawn balance in its account with State Street Bank and Trust Company, the custodian bank. Such balances, if any at period end, are shown in the Statement of Assets and Liabilities under the payable caption Amount due custodian. To compensate the custodian bank for such overdrafts, the overdrawn Fund may either (1) leave funds as a compensating balance in the account so the custodian bank can be compensated by earning the additional interest; or (2) compensate by paying the custodian bank at a rate agreed upon by the custodian bank and Invesco, not to exceed the contractually agreed upon rate.
NOTE 8—Distributions to Shareholders and Tax Components of Net Assets
Tax Character of Distributions to Shareholders Paid During the Years Ended December 31, 2012 and 2011:
| 2012 | 2011 | |||||||
Ordinary income | $ | 61,541,158 | $ | 2,435,120 | ||||
Long-term capital gain | 140,315,602 | 83,981,621 | ||||||
Total distributions | $ | 201,856,760 | $ | 86,416,741 | ||||
Tax Components of Net Assets at Period-End:
| 2012 | ||||
Undistributed ordinary income | $ | 7,947,469 | ||
Undistributed long-term gain | 10,652,619 | |||
Net unrealized appreciation — investments | 204,203,403 | |||
Net unrealized appreciation (depreciation) — other investments | (95 | ) | ||
Temporary book/tax differences | (421,342 | ) | ||
Late year ordinary loss deferrals | (34,887 | ) | ||
Shares of beneficial interest | 2,206,443,993 | |||
Total net assets | $ | 2,428,791,160 | ||
The difference between book-basis and tax-basis unrealized appreciation (depreciation) is due to differences in the timing of recognition of gains and losses on investments for tax and book purposes. The Fund’s net unrealized appreciation difference is attributable primarily to wash sales.
The temporary book/tax differences are a result of timing differences between book and tax recognition of income and/or expenses. The Fund’s temporary book/tax differences are the result of the trustee deferral of compensation and retirement plan benefits.
Capital loss carryforward is calculated and reported as of a specific date. Results of transactions and other activity after that date may affect the amount of capital loss carryforward actually available for the Trust to utilize. The Regulated Investment Company Modernization Act of 2010 (the “Act”) eliminated the eight-year carryover period for capital losses that arise in taxable years beginning after its enactment date of December 22, 2010. Consequently, these capital losses can be carried forward for an unlimited period. However, capital losses with an expiration period may not be used to offset capital gains until all net capital losses without an expiration date have been utilized. Additionally, post-enactment capital loss carryovers will retain
17 Invesco Mid Cap Core Equity Fund
their character as either short-term or long-term capital losses instead of as short-term capital losses as under prior law. The ability to utilize capital loss carryforward in the future may be limited under the Internal Revenue Code and related regulations based on the results of future transactions.
The Fund does not have a capital loss carryforward at period-end.
NOTE 9—Investment Securities
The aggregate amount of investment securities (other than short-term securities, U.S. Treasury obligations and money market funds, if any) purchased and sold by the Fund during the year ended December 31, 2012 was $1,206,630,741 and $1,414,380,221, respectively. Cost of investments on a tax basis includes the adjustments for financial reporting purposes as of the most recently completed federal income tax reporting period-end.
| Unrealized Appreciation (Depreciation) of Investment Securities on a Tax Basis | ||||
Aggregate unrealized appreciation of investment securities | $ | 310,819,358 | ||
Aggregate unrealized (depreciation) of investment securities | (106,615,955 | ) | ||
Net unrealized appreciation of investment securities | $ | 204,203,403 | ||
Cost of investments for tax purposes is $2,260,991,076.
NOTE 10—Reclassification of Permanent Differences
Primarily as a result of differing book/tax treatment of foreign currency transactions and distributions, on December 31, 2012, undistributed net investment income was decreased by $34,366 and undistributed net realized gain was increased by $34,366. This reclassification had no effect on the net assets of the Fund.
NOTE 11—Share Information
| Summary of Share Activity | ||||||||||||||||
| Years ended December 31, | ||||||||||||||||
| 2012(a) | 2011 | |||||||||||||||
| Shares | Amount | Shares | Amount | |||||||||||||
Sold: | ||||||||||||||||
Class A | 8,307,298 | $ | 185,841,734 | 15,925,002 | $ | 370,507,604 | ||||||||||
Class B | 64,252 | 1,146,331 | 172,477 | 3,266,003 | ||||||||||||
Class C | 1,144,960 | 20,167,337 | 2,596,265 | 48,473,603 | ||||||||||||
Class R | 1,678,187 | 36,729,127 | 3,207,913 | 73,524,458 | ||||||||||||
Class Y | 17,877,137 | 390,716,357 | 5,833,729 | 137,156,545 | ||||||||||||
Class R5 | 3,100,223 | 72,403,278 | 6,845,390 | 159,732,258 | ||||||||||||
Class R6(b) | 416.6 | 10,000 | — | — | ||||||||||||
Issued as reinvestment of dividends: | ||||||||||||||||
Class A | 4,932,874 | 103,639,678 | 2,330,955 | 49,556,106 | ||||||||||||
Class B | 207,589 | 3,379,553 | 136,918 | 2,308,442 | ||||||||||||
Class C | 1,056,620 | 17,159,536 | 512,776 | 8,630,025 | ||||||||||||
Class R | 469,718 | 9,699,674 | 267,408 | 5,591,499 | ||||||||||||
Class Y | 1,659,573 | 35,066,759 | 210,404 | 4,500,550 | ||||||||||||
Class R5 | 1,076,494 | 23,779,752 | 514,841 | 11,470,657 | ||||||||||||
Automatic conversion of Class B shares to Class A shares: | ||||||||||||||||
Class A | 605,810 | 13,675,178 | 1,706,192 | 39,546,892 | ||||||||||||
Class B | (767,032 | ) | (13,675,178 | ) | (2,127,632 | ) | (39,546,892 | ) | ||||||||
Reacquired: | ||||||||||||||||
Class A | (24,520,470 | ) | (545,912,675 | ) | (25,336,377 | ) | (578,915,046 | ) | ||||||||
Class B | (592,392 | ) | (10,465,480 | ) | (994,030 | ) | (18,640,085 | ) | ||||||||
Class C | (3,953,453 | ) | (69,393,761 | ) | (3,246,600 | ) | (59,415,296 | ) | ||||||||
Class R | (4,196,156 | ) | (91,507,743 | ) | (3,713,443 | ) | (84,217,855 | ) | ||||||||
Class Y | (6,011,133 | ) | (134,335,449 | ) | (5,999,518 | ) | (134,592,577 | ) | ||||||||
Class R5 | (8,310,145 | ) | (190,984,415 | ) | (4,827,772 | ) | (111,343,665 | ) | ||||||||
Net increase (decrease) in share activity | (6,169,629.4 | ) | $ | (142,860,407 | ) | (5,985,102 | ) | $ | (112,406,774 | ) | ||||||
| (a) | There are entities that are record owners of more than 5% of the outstanding shares of the Fund and in the aggregate own 23% of the outstanding shares of the Fund. IDI has an agreement with these entities to sell Fund shares. The Fund, Invesco and/or Invesco affiliates may make payments to these entities, which are considered to be related to the Fund, for providing services to the Fund, Invesco and/or Invesco affiliates including but not limited to services such as securities brokerage, distribution, third party record keeping and account servicing. The Fund has no knowledge as to whether all or any portion of the shares owned of record by these entities are also owned beneficially. |
| (b) | Commencement date of September 24, 2012. |
18 Invesco Mid Cap Core Equity Fund
NOTE 12—Financial Highlights
The following schedule presents financial highlights for a share of the Fund outstanding throughout the periods indicated.
| Net asset value, beginning of period | Net investment income (loss)(a) | Net gains (losses) on securities (both realized and unrealized) | Total from investment operations | Dividends from net investment income | Distributions from net realized gains | Total distributions | Net assetvalue, end of period | Total return(b) | Net assets, end of period (000’s omitted) | Ratio of expenses to average net assets with fee waivers and/or expenses absorbed | Ratio of expenses to average net assets without fee waivers and/or expenses absorbed | Ratio of net investment income (loss) to average net assets | Portfolio turnover(c) | |||||||||||||||||||||||||||||||||||||||||||
Class A | ||||||||||||||||||||||||||||||||||||||||||||||||||||||||
Year ended 12/31/12 | $ | 21.02 | $ | 0.12 | (d) | $ | 2.03 | $ | 2.15 | $ | (0.12 | ) | $ | (1.68 | ) | $ | (1.80 | ) | $ | 21.37 | 10.38 | % | $ | 1,352,886 | 1.17 | %(e) | 1.20 | %(e) | 0.55 | %(d)(e) | 61 | % | ||||||||||||||||||||||||
Year ended 12/31/11 | 23.17 | (0.02 | ) | (1.42 | ) | (1.44 | ) | — | (0.71 | ) | (0.71 | ) | 21.02 | (6.24 | ) | 1,554,838 | 1.16 | 1.19 | (0.09 | ) | 57 | |||||||||||||||||||||||||||||||||||
Year ended 12/31/10 | 20.95 | 0.01 | 2.61 | 2.62 | (0.01 | ) | (0.39 | ) | (0.40 | ) | 23.17 | 12.52 | 1,838,719 | 1.18 | 1.21 | 0.06 | 61 | |||||||||||||||||||||||||||||||||||||||
Year ended 12/31/09 | 16.11 | 0.05 | 4.81 | 4.86 | (0.02 | ) | — | (0.02 | ) | 20.95 | 30.16 | 1,515,079 | 1.24 | 1.27 | 0.26 | 24 | ||||||||||||||||||||||||||||||||||||||||
Year ended 12/31/08 | 23.63 | 0.17 | (6.69 | ) | (6.52 | ) | (0.18 | ) | (0.82 | ) | (1.00 | ) | 16.11 | (27.45 | ) | 879,531 | 1.25 | 1.28 | 0.79 | 60 | ||||||||||||||||||||||||||||||||||||
Class B | ||||||||||||||||||||||||||||||||||||||||||||||||||||||||
Year ended 12/31/12 | 16.66 | (0.03 | )(d) | 1.60 | 1.57 | — | (1.68 | ) | (1.68 | ) | 16.55 | 9.60 | 36,795 | 1.92 | (e) | 1.95 | (e) | (0.20 | )(d)(e) | 61 | ||||||||||||||||||||||||||||||||||||
Year ended 12/31/11 | 18.66 | (0.16 | ) | (1.13 | ) | (1.29 | ) | — | (0.71 | ) | (0.71 | ) | 16.66 | (6.95 | ) | 55,166 | 1.91 | 1.94 | (0.84 | ) | 57 | |||||||||||||||||||||||||||||||||||
Year ended 12/31/10 | 17.06 | (0.12 | ) | 2.10 | 1.98 | — | (0.38 | ) | (0.38 | ) | 18.66 | 11.65 | 114,279 | 1.93 | 1.96 | (0.69 | ) | 61 | ||||||||||||||||||||||||||||||||||||||
Year ended 12/31/09 | 13.22 | (0.07 | ) | 3.93 | 3.86 | (0.02 | ) | — | (0.02 | ) | 17.06 | 29.19 | 183,219 | 1.99 | 2.02 | (0.49 | ) | 24 | ||||||||||||||||||||||||||||||||||||||
Year ended 12/31/08 | 19.59 | 0.01 | (5.52 | ) | (5.51 | ) | (0.04 | ) | (0.82 | ) | (0.86 | ) | 13.22 | (27.97 | ) | 197,599 | 2.00 | 2.03 | 0.04 | 60 | ||||||||||||||||||||||||||||||||||||
Class C | ||||||||||||||||||||||||||||||||||||||||||||||||||||||||
Year ended 12/31/12 | 16.62 | (0.03 | )(d) | 1.60 | 1.57 | — | (1.68 | ) | (1.68 | ) | 16.51 | 9.62 | 190,302 | 1.92 | (e) | 1.95 | (e) | (0.20 | )(d)(e) | 61 | ||||||||||||||||||||||||||||||||||||
Year ended 12/31/11 | 18.62 | (0.16 | ) | (1.13 | ) | (1.29 | ) | — | (0.71 | ) | (0.71 | ) | 16.62 | (6.97 | ) | 220,772 | 1.91 | 1.94 | (0.84 | ) | 57 | |||||||||||||||||||||||||||||||||||
Year ended 12/31/10 | 17.02 | (0.12 | ) | 2.10 | 1.98 | — | (0.38 | ) | (0.38 | ) | 18.62 | 11.68 | 249,883 | 1.93 | 1.96 | (0.69 | ) | 61 | ||||||||||||||||||||||||||||||||||||||
Year ended 12/31/09 | 13.19 | (0.07 | ) | 3.92 | 3.85 | (0.02 | ) | — | (0.02 | ) | 17.02 | 29.18 | 202,853 | 1.99 | 2.02 | (0.49 | ) | 24 | ||||||||||||||||||||||||||||||||||||||
Year ended 12/31/08 | 19.55 | 0.01 | (5.51 | ) | (5.50 | ) | (0.04 | ) | (0.82 | ) | (0.86 | ) | 13.19 | (27.98 | ) | 115,735 | 2.00 | 2.03 | 0.04 | 60 | ||||||||||||||||||||||||||||||||||||
Class R | ||||||||||||||||||||||||||||||||||||||||||||||||||||||||
Year ended 12/31/12 | 20.66 | 0.07 | (d) | 2.00 | 2.07 | (0.05 | ) | (1.68 | ) | (1.73 | ) | 21.00 | 10.17 | 125,474 | 1.42 | (e) | 1.45 | (e) | 0.30 | (d)(e) | 61 | |||||||||||||||||||||||||||||||||||
Year ended 12/31/11 | 22.85 | (0.08 | ) | (1.40 | ) | (1.48 | ) | — | (0.71 | ) | (0.71 | ) | 20.66 | (6.51 | ) | 165,812 | 1.41 | 1.44 | (0.34 | ) | 57 | |||||||||||||||||||||||||||||||||||
Year ended 12/31/10 | 20.71 | (0.04 | ) | 2.56 | 2.52 | — | (0.38 | ) | (0.38 | ) | 22.85 | 12.21 | 188,803 | 1.43 | 1.46 | (0.19 | ) | 61 | ||||||||||||||||||||||||||||||||||||||
Year ended 12/31/09 | 15.96 | — | 4.77 | 4.77 | (0.02 | ) | — | (0.02 | ) | 20.71 | 29.88 | 101,828 | 1.49 | 1.52 | 0.01 | 24 | ||||||||||||||||||||||||||||||||||||||||
Year ended 12/31/08 | 23.40 | 0.11 | (6.61 | ) | (6.50 | ) | (0.12 | ) | (0.82 | ) | (0.94 | ) | 15.96 | (27.63 | ) | 49,456 | 1.50 | 1.53 | 0.54 | 60 | ||||||||||||||||||||||||||||||||||||
Class Y | ||||||||||||||||||||||||||||||||||||||||||||||||||||||||
Year ended 12/31/12 | 21.14 | 0.18 | (d) | 2.04 | 2.22 | (0.18 | ) | (1.68 | ) | (1.86 | ) | 21.50 | 10.68 | 469,510 | 0.92 | (e) | 0.95 | (e) | 0.80 | (d)(e) | 61 | |||||||||||||||||||||||||||||||||||
Year ended 12/31/11 | 23.25 | 0.04 | (1.44 | ) | (1.40 | ) | — | (0.71 | ) | (0.71 | ) | 21.14 | (6.05 | ) | 175,773 | 0.91 | 0.94 | 0.16 | 57 | |||||||||||||||||||||||||||||||||||||
Year ended 12/31/10 | 20.97 | 0.07 | 2.60 | 2.67 | (0.01 | ) | (0.38 | ) | (0.39 | ) | 23.25 | 12.80 | 192,236 | 0.93 | 0.96 | 0.31 | 61 | |||||||||||||||||||||||||||||||||||||||
Year ended 12/31/09 | 16.10 | 0.10 | 4.82 | 4.92 | (0.05 | ) | — | (0.05 | ) | 20.97 | 30.59 | 86,803 | 0.99 | 1.02 | 0.51 | 24 | ||||||||||||||||||||||||||||||||||||||||
Year ended 12/31/08(f) | 20.44 | 0.04 | (3.37 | ) | (3.33 | ) | (0.19 | ) | (0.82 | ) | (1.01 | ) | 16.10 | (16.12 | ) | 2,349 | 1.06 | (g) | 1.09 | (g) | 0.98 | (g) | 60 | |||||||||||||||||||||||||||||||||
Class R5 | ||||||||||||||||||||||||||||||||||||||||||||||||||||||||
Year ended 12/31/12 | 22.03 | 0.22 | (d) | 2.12 | 2.34 | (0.22 | ) | (1.68 | ) | (1.90 | ) | 22.47 | 10.78 | 253,815 | 0.80 | (e) | 0.83 | (e) | 0.92 | (d)(e) | 61 | |||||||||||||||||||||||||||||||||||
Year ended 12/31/11 | 24.15 | 0.07 | (1.48 | ) | (1.41 | ) | — | (0.71 | ) | (0.71 | ) | 22.03 | (5.87 | ) | 339,807 | 0.79 | 0.82 | 0.28 | 57 | |||||||||||||||||||||||||||||||||||||
Year ended 12/31/10 | 21.74 | 0.11 | 2.70 | 2.81 | (0.01 | ) | (0.39 | ) | (0.40 | ) | 24.15 | 12.94 | 311,455 | 0.76 | 0.79 | 0.48 | 61 | |||||||||||||||||||||||||||||||||||||||
Year ended 12/31/09 | 16.67 | 0.13 | 5.01 | 5.14 | (0.07 | ) | — | (0.07 | ) | 21.74 | 30.84 | 200,303 | 0.80 | 0.83 | 0.70 | 24 | ||||||||||||||||||||||||||||||||||||||||
Year ended 12/31/08 | 24.44 | 0.26 | (6.95 | ) | (6.69 | ) | (0.26 | ) | (0.82 | ) | (1.08 | ) | 16.67 | (27.19 | ) | 67,379 | 0.85 | 0.88 | �� | 1.19 | 60 | |||||||||||||||||||||||||||||||||||
Class R6 | ||||||||||||||||||||||||||||||||||||||||||||||||||||||||
Year ended 12/31/12(f) | 24.00 | 0.07 | (d) | 0.31 | 0.38 | (0.22 | ) | (1.68 | ) | (1.90 | ) | 22.48 | 1.75 | 9 | 0.67 | (e)(g) | 0.70 | (e)(g) | 1.05 | (d)(e)(g) | 61 | |||||||||||||||||||||||||||||||||||
| (a) | Calculated using average shares outstanding. |
| (b) | Includes adjustments in accordance with accounting principles generally accepted in the United States of America and as such, the net asset value for financial reporting purposes and the returns based upon those net asset values may differ from the net asset value and returns for shareholder transactions. Does not include sales charges and is not annualized for periods less than one year, if applicable. |
| (c) | Portfolio turnover is calculated at the fund level and is not annualized for periods less than one year, if applicable. For the period ending December 31, 2009, the portfolio turnover calculation excludes the value of securities purchased of $36,332,046 and sold of $40,409,014 in the effort to realign the Fund’s portfolio holdings after the reorganization of Atlantic Whitehall Mid Cap Growth Fund into the Fund. |
| (d) | Net investment income (loss) per share and the ratio of net investment income (loss) to average net assets include a special cash dividend received of $1.00 per share owned of Tellabs Inc. on December 24, 2012. Net investment income (loss) per share and the ratio of net investment income (loss) to average net assets excluding the special dividend are $0.08 and 0.38%, $(0.07) and (0.37)%, $(0.07) and (0.37)%, $0.03 and 0.13%, $0.14 and 0.63%, $0.18 and 0.75% and $0.03 and 0.88% for Class A, Class B, Class C, Class R, Class Y, Class R5 and Class R6 shares, respectively. |
| (e) | Ratios are based on average daily net assets (000’s) of $1,496,601, $45,097, $212,347, $154,804, $337,086, $334,918 and $10 for Class A, Class B, Class C, Class R, Class Y, Class R5 and Class R6 shares, respectively. |
| (f) | Commencement date of October 3, 2008 for Class Y shares and September 24, 2012 for Class R6 shares. |
| (g) | Annualized. |
19 Invesco Mid Cap Core Equity Fund
Report of Independent Registered Public Accounting Firm
To the Board of Trustees of AIM Growth Series (Invesco Growth Series)
and Shareholders of Invesco Mid Cap Core Equity Fund:
In our opinion, the accompanying statement of assets and liabilities, including the schedule of investments, and the related statements of operations and of changes in net assets and the financial highlights present fairly, in all material respects, the financial position of Invesco Mid Cap Core Equity Fund (one of the funds constituting AIM Growth Series (Invesco Growth Series), hereafter referred to as the “Fund”) at December 31, 2012, the results of its operations for the year then ended, the changes in its net assets for each of the two years in the period then ended and the financial highlights for each of the five years in the period then ended, in conformity with accounting principles generally accepted in the United States of America. These financial statements and financial highlights (hereafter referred to as “financial statements”) are the responsibility of the Fund’s management; our responsibility is to express an opinion on these financial statements based on our audits. We conducted our audits of these financial statements in accordance with the standards of the Public Company Accounting Oversight Board (United States). Those standards require that we plan and perform the audit to obtain reasonable assurance about whether the financial statements are free of material misstatement. An audit includes examining, on a test basis, evidence supporting the amounts and disclosures in the financial statements, assessing the accounting principles used and significant estimates made by management, and evaluating the overall financial statement presentation. We believe that our audits, which included confirmation of securities at December 31, 2012 by correspondence with the custodian and brokers, provide a reasonable basis for our opinion.
PRICEWATERHOUSECOOPERS LLP
February 25, 2013
Houston, Texas
20 Invesco Mid Cap Core Equity Fund
Calculating your ongoing Fund expenses
Example
As a shareholder of the Fund, you incur two types of costs: (1) transaction costs, which may include sales charges (loads) on purchase payments or contingent deferred sales charges on redemptions, and redemption fees, if any; and (2) ongoing costs, including management fees, distribution and/or service (12b-1) fees, and other Fund expenses. This example is intended to help you understand your ongoing costs (in dollars) of investing in the Fund and to compare these costs with ongoing costs of investing in other mutual funds. With the exception of the actual ending account value and expenses of the Class R6 shares, the example is based on an investment of $1,000 invested at the beginning of the period and held for the entire period July 1, 2012 through December 31, 2012. The actual ending account value and expenses of the Class R6 shares in the example below are based on an investment of $1,000 invested as of close of business September 24, 2012 (commencement date) and held through December 31, 2012.
Actual expenses
The table below provides information about actual account values and actual expenses. You may use the information in this table, together with the amount you invested, to estimate the expenses that you paid over the period. Simply divide your account value by $1,000 (for example, an $8,600 account value divided by $1,000 = 8.6), then multiply the result by the number in the table under the heading entitled “Actual Expenses Paid During Period” to estimate the expenses you paid on your account during this period (as of close of business September 24, 2012 through December 31, 2012 for the Class R6 shares). Because the actual ending account value and expense information in the example is not based upon a six month period for the Class R6 shares, the ending account value and expense information may not provide a meaningful comparison to mutual funds that provide such information for a full six month period.
Hypothetical example for comparison purposes
The table below also provides information about hypothetical account values and hypothetical expenses based on the Fund’s actual expense ratio and an assumed rate of return of 5% per year before expenses, which is not the Fund’s actual return.
The hypothetical account values and expenses may not be used to estimate the actual ending account balance or expenses you paid for the period. You may use this information to compare the ongoing costs of investing in the Fund and other funds. To do so, compare this 5% hypothetical example with the 5% hypothetical examples that appear in the shareholder reports of the other funds.
Please note that the expenses shown in the table are meant to highlight your ongoing costs only and do not reflect any transaction costs, such as sales charges (loads) on purchase payments, contingent deferred sales charges on redemptions, and redemption fees, if any. Therefore, the hypothetical information is useful in comparing ongoing costs only, and will not help you determine the relative total costs of owning different funds. In addition, if these transaction costs were included, your costs would have been higher.
| Class | Beginning Account Value (07/01/12) | ACTUAL | HYPOTHETICAL (5% annual return before | Annualized Expense Ratio | ||||||||||||||||||||
| Ending Account Value (12/31/12)1 | Expenses Paid During Period2 | Ending Account Value (12/31/12) | Expenses Paid During Period3 | |||||||||||||||||||||
A | $ | 1,000.00 | $ | 1,061.40 | $ | 6.11 | $ | 1,019.20 | $ | 5.99 | 1.18 | % | ||||||||||||
B | 1,000.00 | 1,057.90 | 9.98 | 1,015.43 | 9.78 | 1.93 | ||||||||||||||||||
C | 1,000.00 | 1,057.40 | 9.98 | 1,015.43 | 9.78 | 1.93 | ||||||||||||||||||
R | 1,000.00 | 1,060.10 | 7.41 | 1,017.95 | 7.25 | 1.43 | ||||||||||||||||||
Y | 1,000.00 | 1,062.50 | 4.82 | 1,020.46 | 4.72 | 0.93 | ||||||||||||||||||
R5 | 1,000.00 | 1,063.30 | 4.10 | 1,021.17 | 4.01 | 0.79 | ||||||||||||||||||
R6 | 1,000.00 | 1,017.50 | 1.83 | 1,021.77 | 3.40 | 0.67 | ||||||||||||||||||
| 1 | The actual ending account value is based on the actual total return of the Fund for the period July 1, 2012, through December 31, 2012 (as of close of business September 24, 2012 through December 31, 2012 for the Class R6 shares), after actual expenses and will differ from the hypothetical ending account value which is based on the Fund’s expense ratio and a hypothetical annual return of 5% before expenses. |
| 2 | Actual expenses are equal to the Fund’s annualized expense ratio as indicated above multiplied by the average account value over the period, multiplied by 184/366 to reflect the most recent fiscal half year. For the Class R6 shares actual expenses are equal to the annualized expense ratio indicated above multiplied by the average account value over the period, multiplied by 99 (as of close of business September 24, 2012 through December 31, 2012)/366. Because the Class R6 shares have not been in existence for a full six month period, the actual ending account value and expense information shown may not provide a meaningful comparison to fund expense information of classes that show such data for a full six month period and, because the actual ending account value and expense information in the expense example covers a short time period, return and expense data may not be indicative of return and expense data for longer time periods. |
| 3 | Hypothetical expenses are equal to the annualized expense ratio indicated above multiplied by the average account value over the period, multiplied by 184/366 to reflect a one-half year period. The hypothetical ending account value and expenses may be used to compare ongoing costs of investing in Class R6 shares of the Fund and other funds because such data is based on a full six month period. |
21 Invesco Mid Cap Core Equity Fund
Tax Information
Form 1099-DIV, Form 1042-S and other year–end tax information provide shareholders with actual calendar year amounts that should be included in their tax returns. Shareholders should consult their tax advisors.
The following distribution information is being provided as required by the Internal Revenue Code or to meet a specific state’s requirement.
The Fund designates the following amounts or, if subsequently determined to be different, the maximum amount allowable for its fiscal year ended December 31, 2012:
Federal and State Income Tax | ||||
Long-Term Capital Gain Dividends | $ | 140,315,602 | ||
Qualified Dividend Income* | 62.83 | % | ||
Corporate Dividends Received Deduction* | 54.83 | % | ||
| * | The above percentages are based on ordinary income dividends paid to shareholders during the Fund’s fiscal year. |
22 Invesco Mid Cap Core Equity Fund
Trustees and Officers
The address of each trustee and officer is AIM Growth Series (Invesco Growth Series) (the “Trust”), 11 Greenway Plaza, Suite 1000, Houston, Texas 77046-1173. The trustees serve for the life of the Trust, subject to their earlier death, incapacitation, resignation, retirement or removal as more specifically provided in the Trust’s organizational documents. Each officer serves for a one year term or until their successors are elected and qualified. Column two below includes length of time served with predecessor entities, if any.
| Name, Year of Birth and Position(s) Held with the Trust | Trustee and/ or Officer Since | Principal Occupation(s) During Past 5 Years | Number of Funds in Fund Complex Overseen by Trustee | Other Directorship(s) Held by Trustee During Past 5 Years | ||||
| Interested Persons | ||||||||
| Martin L. Flanagan1 — 1960 Trustee | 2007 | Executive Director, Chief Executive Officer and President, Invesco Ltd. (ultimate parent of Invesco and a global investment management firm); Advisor to the Board, Invesco Advisers, Inc. (formerly known as Invesco Institutional (N.A.), Inc.); Trustee, The Invesco Funds; Vice Chair, Investment Company Institute; and Member of Executive Board, SMU Cox School of Business
Formerly: Chairman and Chief Executive Officer, Invesco Advisers, Inc. (registered investment adviser); Director, Chairman, Chief Executive Officer and President, IVZ Inc. (holding company), INVESCO Group Services, Inc. (service provider) and Invesco North American Holdings, Inc. (holding company); Director, Chief Executive Officer and President, Invesco Holding Company Limited (parent of Invesco and a global investment management firm); Director, Invesco Ltd.; Chairman, Investment Company Institute and President, Co-Chief Executive Officer, Co-President, Chief Operating Officer and Chief Financial Officer, Franklin Resources, Inc. (global investment management organization) | 124 | None | ||||
Philip A. Taylor2 — 1954 Trustee, President and Principal Executive Officer | 2006 | Head of North American Retail and Senior Managing Director, Invesco Ltd.; Director, Co-Chairman, Co-President and Co-Chief Executive Officer, Invesco Advisers, Inc. (formerly known as Invesco Institutional (N.A.), Inc.) (registered investment adviser); Director, Chairman, Chief Executive Officer and President, Invesco Management Group, Inc. (formerly known as Invesco Aim Management Group, Inc.) (financial services holding company); Director and President, INVESCO Funds Group, Inc. (registered investment adviser and registered transfer agent); Director and Chairman, Invesco Investment Services, Inc. (formerly known as Invesco Aim Investment Services, Inc.) (registered transfer agent) and IVZ Distributors, Inc. (formerly known as INVESCO Distributors, Inc.) (registered broker dealer); Director, President and Chairman, Invesco Inc. (holding company) and Invesco Canada Holdings Inc. (holding company); Chief Executive Officer, Invesco Corporate Class Inc. (corporate mutual fund company) and Invesco Canada Fund Inc. (corporate mutual fund company); Director, Chairman and Chief Executive Officer, Invesco Canada Ltd. (formerly known as Invesco Trimark Ltd./Invesco Trimark Ltèe) (registered investment adviser and registered transfer agent); Trustee, President and Principal Executive Officer, The Invesco Funds (other than AIM Treasurer’s Series Trust (Invesco Treasurer’s Series Trust) and Short-Term Investments Trust); Trustee and Executive Vice President, The Invesco Funds (AIM Treasurer’s Series Trust (Invesco Treasurer’s Series Trust) and Short-Term Investments Trust only); Director, Invesco Investment Advisers LLC (formerly known as Van Kampen Asset Management); Director, Chief Executive Officer and President, Van Kampen Exchange Corp.
Formerly: Director and Chairman, Van Kampen Investor Services Inc.: Director, Chief Executive Officer and President, 1371 Preferred Inc. (holding company); and Van Kampen Investments Inc.; Director and President, AIM GP Canada Inc. (general partner for limited partnerships); and Van Kampen Advisors, Inc.; Director and Chief Executive Officer, Invesco Trimark Dealer Inc. (registered broker dealer); Director, Invesco Distributors, Inc. (formerly known as Invesco Aim Distributors, Inc.) (registered broker dealer); Manager, Invesco PowerShares Capital Management LLC; Director, Chief Executive Officer and President, Invesco Advisers, Inc.; Director, Chairman, Chief Executive Officer and President, Invesco Aim Capital Management, Inc.; President, Invesco Trimark Dealer Inc. and Invesco Trimark Ltd./Invesco Trimark Ltèe; Director and President, AIM Trimark Corporate Class Inc. and AIM Trimark Canada Fund Inc.; Senior Managing Director, Invesco Holding Company Limited; Trustee and Executive Vice President, Tax-Free Investments Trust; Director and Chairman, Fund Management Company (former registered broker dealer); President and Principal Executive Officer, The Invesco Funds (AIM Treasurer’s Series Trust (Invesco Treasurer’s Series Trust), Short-Term Investments Trust and Tax-Free Investments Trust only); President, AIM Trimark Global Fund Inc. and AIM Trimark Canada Fund Inc. | 124 | None | ||||
Wayne W. Whalen3 — 1939 Trustee | 2010 | Of Counsel, and prior to 2010, partner in the law firm of Skadden, Arps, Slate, Meagher & Flom LLP, legal counsel to certain funds in the Fund Complex
| 137 | Director of the Mutual Fund Directors Forum, a nonprofit membership organization for investment directors; Chairman and Director of the Abraham Lincoln Presidential Library Foundation; and Director of the Stevenson Center for Democracy |
| 1 | Mr. Flanagan is considered an interested person of the Trust because he is an officer of the adviser to the Trust, and an officer and a director of Invesco Ltd., ultimate parent of the adviser to the Trust. |
| 2 | Mr. Taylor is considered an interested person of the Trust because he is an officer and a director of the adviser to, and a director of the principal underwriter of, the Trust. |
| 3 | Mr. Whalen is considered an “interested person” (within the meaning of Section 2(a)(19) of the 1940 Act) of certain Funds in the Invesco Fund Complex by reason of he and his firm currently providing legal services as legal counsel to such Funds in the Invesco Fund Complex. |
T-1 Invesco Mid Cap Core Equity Fund
Trustees and Officers—(continued)
| Name, Year of Birth and Position(s) Held with the Trust | Trustee and/ or Officer Since | Principal Occupation(s) During Past 5 Years | Number of Funds in Fund Complex Overseen by Trustee | Other Directorship(s) Held by Trustee During Past 5 Years | ||||
| Independent Trustees | ||||||||
Bruce L. Crockett — 1944 Trustee and Chair | 2001 | Chairman, Crockett Technologies Associates (technology consulting company)
Formerly: Director, Captaris (unified messaging provider); Director, President and Chief Executive Officer COMSAT Corporation; and Chairman, Board of Governors of INTELSAT (international communications company) | 124 | ACE Limited (insurance company); and Investment Company Institute | ||||
David C. Arch — 1945 Trustee | 2010 | Chairman and Chief Executive Officer of Blistex Inc., (consumer health care products manufacturer)
Formerly: Member of the Heartland Alliance Advisory Board, a nonprofit organization serving human needs based in Chicago | 137 | Board member of the Illinois Manufacturers’ Association; Member of the Board of Visitors, Institute for the Humanities, University of Michigan | ||||
Frank S. Bayley — 1939 Trustee | 1985 | Retired
Formerly: Director, Badgley Funds, Inc. (registered investment company) (2 portfolios) and General Partner and Of Counsel, law firm of Baker & McKenzie, LLP | 124 | Director and Chairman, C.D. Stimson Company (a real estate investment company); Trustee and Overseer, The Curtis institute of Music | ||||
James T. Bunch — 1942 Trustee | 2003 | Managing Member, Grumman Hill Group LLC (family office private equity management)
Formerly: Founder, Green, Manning & Bunch Ltd. (investment banking firm)(1988-2010); Executive Committee, United States Golf Association; and Director, Policy Studies, Inc. and Van Gilder Insurance Corporation | 124 | Chairman, Board of Governors, Western Golf Association; Chairman-elect, Evans Scholars Foundation; and Director, Denver Film Society | ||||
Rodney F. Dammeyer — 1940 Trustee | 2010 | Chairman of CAC, LLC, (private company offering capital investment and management advisory services)
Formerly: Prior to 2001, Managing Partner at Equity Group Corporate Investments; Prior to 1995, Vice Chairman of Anixter International; Prior to 1985, experience includes Senior Vice President and Chief Financial Officer of Household International, Inc., Executive Vice President and Chief Financial Officer of Northwest Industries, Inc. and Partner of Arthur Andersen & Co.; From 1987 to 2010, Director/Trustee of investment companies in the Van Kampen Funds complex | 126 | Director of Quidel Corporation and Stericycle, Inc.; Prior to May 2008, Trustee of The Scripps Research Institute; Prior to February 2008, Director of Ventana Medical Systems, Inc.; Prior to April 2007, Director of GATX Corporation; Prior to April 2004, Director of TheraSense, Inc. | ||||
Albert R. Dowden — 1941 Trustee | 2001 | Director of a number of public and private business corporations, including the Boss Group, Ltd. (private investment and management); Reich & Tang Funds (5 portfolios) (registered investment company); and Homeowners of America Holding Corporation/ Homeowners of America Insurance Company (property casualty company)
Formerly: Director, Continental Energy Services, LLC (oil and gas pipeline service); Director, CompuDyne Corporation (provider of product and services to the public security market) and Director, Annuity and Life Re (Holdings), Ltd. (reinsurance company); Director, President and Chief Executive Officer, Volvo Group North America, Inc.; Senior Vice President, AB Volvo; Director of various public and private corporations; Chairman, DHJ Media, Inc.; Director Magellan Insurance Company; and Director, The Hertz Corporation, Genmar Corporation (boat manufacturer), National Media Corporation; Advisory Board of Rotary Power International (designer, manufacturer, and seller of rotary power engines); and Chairman, Cortland Trust, Inc. (registered investment company) | 124 | Director of Nature’s Sunshine Products, Inc. | ||||
Jack M. Fields — 1952 Trustee | 2001 | Chief Executive Officer, Twenty First Century Group, Inc. (government affairs company); Owner and Chief Executive Officer, Dos Angeles Ranch, L.P. (cattle, hunting, corporate entertainment); and Discovery Global Education Fund (non-profit)
Formerly: Chief Executive Officer, Texana Timber LP (sustainable forestry company); Director of Cross Timbers Quail Research Ranch (non-profit); and member of the U.S. House of Representatives | 124 | Insperity, Inc. (formerly known as Administaff) | ||||
Prema Mathai-Davis — 1950 Trustee | 2001 | Retired
Formerly: Chief Executive Officer, YWCA of the U.S.A. | 124 | None | ||||
Larry Soll — 1942 Trustee | 2003 | Retired
Formerly: Chairman, Chief Executive Officer and President, Synergen Corp. (a biotechnology company) | 124 | None | ||||
Hugo F. Sonnenschein — 1940 Trustee | 2010 | Distinguished Service Professor and President Emeritus of the University of Chicago and the Adam Smith Distinguished Service Professor in the Department of Economics at the University of Chicago
Formerly: President of the University of Chicago | 137 | Trustee of the University of Rochester and a member of its investment committee. Member of the National Academy of Sciences, the American Philosophical Society and a fellow of the American Academy of Arts and Sciences |
T-2 Invesco Mid Cap Core Equity Fund
Trustees and Officers—(continued)
| Name, Year of Birth and Position(s) Held with the Trust | Trustee and/ or Officer Since | Principal Occupation(s) During Past 5 Years | Number of Funds in Fund Complex Overseen by Trustee | Other Directorship(s) Held by Trustee During Past 5 Years | ||||
| Independent Trustees—(continued) | ||||||||
Raymond Stickel, Jr. — 1944 Trustee | 2005 | Retired
Formerly: Director, Mainstay VP Series Funds, Inc. (25 portfolios) and Partner, Deloitte & Touche | 124 | None | ||||
| Other Officers | ||||||||
| Russell C. Burk — 1958 Senior Vice President and Senior Officer | 2005 | Senior Vice President and Senior Officer, The Invesco Funds | N/A | N/A | ||||
| John M. Zerr — 1962 Senior Vice President, Chief Legal Officer and Secretary | 2006 | Director, Senior Vice President, Secretary and General Counsel, Invesco Management Group, Inc. (formerly known as Invesco Aim Management Group, Inc.) and Van Kampen Exchange Corp.; Senior Vice President, Invesco Advisers, Inc. (formerly known as Invesco Institutional (N.A.), Inc.) (registered investment adviser); Senior Vice President and Secretary, Invesco Distributors, Inc. (formerly known as Invesco Aim Distributors, Inc.); Director, Vice President and Secretary, Invesco Investment Services, Inc. (formerly known as Invesco Aim Investment Services, Inc.) and IVZ Distributors, Inc. (formerly known as INVESCO Distributors, Inc.); Director and Vice President, INVESCO Funds Group, Inc.; Senior Vice President, Chief Legal Officer and Secretary, The Invesco Funds; Manager, Invesco PowerShares Capital Management LLC; Director, Secretary and General Counsel, Invesco Investment Advisers LLC (formerly known as Van Kampen Asset Management); Secretary and General Counsel, Van Kampen Funds Inc. and Chief Legal Officer, PowerShares Exchange-Traded Fund Trust, PowerShares Exchange-Traded Fund Trust II, PowerShares India Exchange-Traded Fund Trust and PowerShares Actively Managed Exchange-Traded Fund Trust
Formerly: Director and Vice President, Van Kampen Advisors Inc.; Director, Vice President, Secretary and General Counsel Van Kampen Investor Services Inc.; Director, Invesco Distributors, Inc. (formerly known as Invesco Aim Distributors, Inc.); Director, Senior Vice President, General Counsel and Secretary, Invesco Advisers, Inc. and Van Kampen Investments Inc.; Director, Vice President and Secretary, Fund Management Company; Director, Senior Vice President, Secretary, General Counsel and Vice President, Invesco Aim Capital Management, Inc.; Chief Operating Officer and General Counsel, Liberty Ridge Capital, Inc. (an investment adviser); Vice President and Secretary, PBHG Funds (an investment company) and PBHG Insurance Series Fund (an investment company); Chief Operating Officer, General Counsel and Secretary, Old Mutual Investment Partners (a broker-dealer); General Counsel and Secretary, Old Mutual Fund Services (an administrator) and Old Mutual Shareholder Services (a shareholder servicing center); Executive Vice President, General Counsel and Secretary, Old Mutual Capital, Inc. (an investment adviser); and Vice President and Secretary, Old Mutual Advisors Funds (an investment company) | N/A | N/A | ||||
| Karen Dunn Kelley — 1960 Vice President | 2004 | Head of Invesco’s World Wide Fixed Income and Cash Management Group; Senior Vice President, Invesco Management Group, Inc. (formerly known as Invesco Aim Management Group, Inc.) and Invesco Advisers, Inc. (formerly known as Invesco Institutional (N.A.), Inc.) (registered investment adviser); Executive Vice President, Invesco Distributors, Inc. (formerly known as Invesco Aim Distributors, Inc.); Director, Invesco Mortgage Capital Inc., INVESCO Global Asset Management Limited, Invesco Management Company Limited and INVESCO Management S.A.; Vice President, The Invesco Funds (other than AIM Treasurer’s Series Trust (Invesco Treasurer’s Series Trust) and Short-Term Investments Trust); and President and Principal Executive Officer, The Invesco Funds (AIM Treasurer’s Series Trust (Invesco Treasurer’s Series Trust) and Short-Term Investments Trust only)
Formerly: Senior Vice President, Van Kampen Investments Inc.; Vice President, Invesco Advisers, Inc. (formerly known as Invesco Institutional (N.A.), Inc.); Director of Cash Management and Senior Vice President, Invesco Advisers, Inc. and Invesco Aim Capital Management, Inc.; President and Principal Executive Officer, Tax-Free Investments Trust; Director and President, Fund Management Company; Chief Cash Management Officer, Director of Cash Management, Senior Vice President, and Managing Director, Invesco Aim Capital Management, Inc.; Director of Cash Management, Senior Vice President, and Vice President, Invesco Advisers, Inc. and The Invesco Funds (AIM Treasurer’s Series Trust (Invesco Treasurer’s Series Trust), Short-Term Investments Trust and Tax-Free Investments Trust only) | N/A | N/A | ||||
T-3 Invesco Mid Cap Core Equity Fund
Trustees and Officers—(continued)
| Name, Year of Birth and Position(s) Held with the Trust | Trustee and/ or Officer Since | Principal Occupation(s) During Past 5 Years | Number of Funds in Fund Complex Overseen by Trustee | Other Directorship(s) Held by Trustee During Past 5 Years | ||||
| Other Officers—(continued) | ||||||||
| Sheri Morris — 1964 Vice President, Treasurer and Principal Financial Officer | 1999 | Vice President, Treasurer and Principal Financial Officer, The Invesco Funds; Vice President, Invesco Advisers, Inc. (formerly known as Invesco Institutional (N.A.), Inc.) (registered investment adviser); and Vice President, PowerShares Exchange-Traded Fund Trust, PowerShares Exchange-Traded Fund Trust II, PowerShares India Exchange-Traded Fund Trust and PowerShares Actively Managed Exchange-Traded Fund Trust
Formerly: Vice President, Invesco Aim Advisers, Inc., Invesco Aim Capital Management, Inc. and Invesco Aim Private Asset Management, Inc.; Assistant Vice President and Assistant Treasurer, The Invesco Funds and Assistant Vice President, Invesco Advisers, Inc., Invesco Aim Capital Management, Inc. and Invesco Aim Private Asset Management, Inc.; and Treasurer, PowerShares Exchange-Traded Fund Trust, PowerShares Exchange-Traded Fund Trust II, PowerShares India Exchange-Traded Fund Trust and PowerShares Actively Managed Exchange-Traded Fund Trust | N/A | N/A | ||||
Yinka Akinsola — 1977 Anti-Money Laundering Compliance Officer | 2011 | Anti-Money Laundering Compliance Officer, Invesco Advisers, Inc. (formerly known as Invesco Institutional (N.A.), Inc.) (registered investment adviser); Invesco Distributors, Inc. (formerly known as Invesco Aim Distributors, Inc.), Invesco Investment Services, Inc. (formerly known as Invesco Aim Investment Services, Inc.), Invesco Management Group, Inc., The Invesco Funds, Invesco Van Kampen Closed-End Funds, Van Kampen Exchange Corp., Van Kampen Funds Inc., PowerShares Exchange-Traded Fund Trust, PowerShares Exchange-Traded Fund Trust II, PowerShares India Exchange-Traded Fund Trust, and PowerShares Actively Managed Exchange-Traded Fund Trust
Formerly: Regulatory Analyst III, Financial Industry Regulatory Authority (FINRA) | N/A | N/A | ||||
| Todd L. Spillane — 1958 Chief Compliance Officer | 2006 | Senior Vice President, Invesco Management Group, Inc. (formerly known as Invesco Aim Management Group, Inc.) and Van Kampen Exchange Corp.; Senior Vice President and Chief Compliance Officer, Invesco Advisers, Inc. (registered investment adviser) (formerly known as Invesco Institutional (N.A.), Inc.); Chief Compliance Officer, The Invesco Funds; Vice President, Invesco Distributors, Inc. (formerly known as Invesco Aim Distributors, Inc.) and Invesco Investment Services, Inc. (formerly known as Invesco Aim Investment Services, Inc.)
Formerly: Chief Compliance Officer, Invesco Van Kampen Closed-End Funds; Senior Vice President, Van Kampen Investments Inc.; Senior Vice President and Chief Compliance Officer, Invesco Aim Advisers, Inc. and Invesco Aim Capital Management, Inc.; Chief Compliance Officer, INVESCO Private Capital Investments, Inc. (holding company), Invesco Private Capital, Inc. (registered investment adviser), Invesco Global Asset Management (N.A.), Inc., Invesco Senior Secured Management, Inc. (registered investment adviser), Van Kampen Investor Services Inc., PowerShares Exchange-Traded Fund Trust, PowerShares Exchange-Traded Fund Trust II, PowerShares India Exchange-Traded Fund Trust and PowerShares Actively Managed Exchange-Traded Fund Trust; and Vice President, Invesco Aim Capital Management, Inc. and Fund Management Company | N/A | N/A |
The Statement of Additional Information of the Trust includes additional information about the Fund’s Trustees and is available upon request, without charge, by calling 1.800.959.4246. Please refer to the Fund’s prospectus for information on the Fund’s sub-advisers.
Office of the Fund 11 Greenway Plaza, Suite 1000 Houston, TX 77046-1173 | Investment Adviser Invesco Advisers, Inc. 1555 Peachtree Street, N.E. Atlanta, GA 30309 | Distributor Invesco Distributors, Inc. 11 Greenway Plaza, Suite 1000 Houston, TX 77046-1173 | Auditors PricewaterhouseCoopers LLP 1201 Louisiana Street, Suite 2900 Houston, TX 77002-5678 | |||
Counsel to the Fund Stradley Ronon Stevens & Young, LLP 2005 Market Street, Suite 2600 Philadelphia, PA 19103-7018 | Counsel to the Independent Trustees Goodwin Procter LLP 901 New York Avenue, N.W. | Transfer Agent Invesco Investment Services, Inc. 11 Greenway Plaza, Suite 1000 Houston, TX 77046-1173 | Custodian State Street Bank and Trust Company 225 Franklin Street Boston, MA 02110-2801 | |||
T-4 Invesco Mid Cap Core Equity Fund

Invesco mailing information
Send general correspondence to Invesco Investment Services, Inc., P.O. Box 219078, Kansas City, MO 64121-9078.
Invesco privacy policy
You share personal and financial information with us that is necessary for your transactions and your account records. We take very seriously the obligation to keep that information confidential and private.
Invesco collects nonpublic personal information about you from account applications or other forms you complete and from your transactions with us or our affiliates. We do not disclose information about you or our former customers to service providers or other third parties except to the extent necessary to service your account and in other limited circumstances as permitted by law. For example, we use this information to facilitate the delivery of transaction confirmations, financial reports, prospectuses and tax forms.
Even within Invesco, only people involved in the servicing of your accounts and compliance monitoring have access to your information. To ensure the highest level of confidentiality and security, Invesco maintains physical, electronic and procedural safeguards that meet or exceed federal standards. Special measures, such as data encryption and authentication, apply to your communications with us on our website. More detail is available to you at invesco.com/privacy.
Important notice regarding delivery of security holder documents
To reduce Fund expenses, only one copy of most shareholder documents may be mailed to shareholders with multiple accounts at the same address (Householding). Mailing of your shareholder documents may be householded indefinitely unless you instruct us otherwise. If you do not want the mailing of these documents to be combined with those for other members of your household, please contact Invesco Investment Services, Inc. at 800 959 4246 or contact your financial institution. We will begin sending you individual copies for each account within 30 days after receiving your request.
Fund holdings and proxy voting information
The Fund provides a complete list of its holdings four times in each fiscal year, at the quarter-ends. For the second and fourth quarters, the lists appear in the Fund’s semiannual and annual reports to shareholders. For the first and third quarters, the Fund files the lists with the Securities and Exchange Commission (SEC) on Form N-Q. The most recent list of portfolio holdings is available at invesco.com/completeqtrholdings. Shareholders can also look up the Fund’s Forms N-Q on the SEC website at sec.gov. Copies of the Fund’s Forms N-Q may be reviewed and copied at the SEC Public Reference Room in Washington, D.C. You can obtain information on the operation of the Public Reference Room, including information about duplicating fee charges, by calling 202 551 8090 or 800 732 0330, or by electronic request at the following email address: publicinfo@sec.gov. The SEC file numbers for the Fund are shown below.
A description of the policies and procedures that the Fund uses to determine how to vote proxies relating to portfolio securities is available without charge, upon request, from our Client Services department at 800 959 4246 or at invesco.com/proxyguidelines. The information is also available on the SEC website, sec.gov.
Information regarding how the Fund voted proxies related to its portfolio securities during the 12 months ended June 30, 2012, is available at invesco.com/proxysearch. The information is also available on the SEC website, sec.gov.
| Invesco Advisers, Inc. is an investment adviser; it provides investment advisory services to individual and institutional clients and does not sell securities. Invesco Distributors, Inc. is the US distributor for Invesco Ltd.’s retail mutual funds, exchange-traded funds and institutional money market funds. Both are wholly owned, indirect subsidiaries of Invesco Ltd. |  | |
| SEC file numbers: 811-02699 and 002-57526 MCCE-AR-1 Invesco Distributors, Inc. | ||
| ||||
 | Annual Report to Shareholders
| December 31, 2012 | ||
| ||||
| Invesco Small Cap Growth Fund | ||||
Nasdaq: | ||||
| A: GTSAX § B: GTSBX § C: GTSDX § R: GTSRX § Y: GTSYX § Investor: GTSIX § R5: GTSVX § R6: GTSFX | ||||

Letters to Shareholders
Philip Taylor | Dear Shareholders: This annual report contains information about your Fund and the factors that affected its performance during the reporting period. Inside, you’ll find a discussion from your portfolio managers about how they managed your Fund, performance data for your Fund, a complete list of your Fund’s investments as of the close of the reporting period and other important information. I hope you find this report of interest. The reporting period covered by this report was challenging. As the year began, investors cheered generally positive economic indicators, and markets generally rose. Soon, however, US economic data turned mixed and investors’ attention shifted to the efforts of eurozone governments to implement new policies intended to reduce debt levels, strengthen the banking system and stimulate economic growth. Later in the year, in the US, mixed economic data, | ||||||||

competing proposals on how to reduce the federal budget deficit and a contentious presidential contest increased investor uncertainty and hindered market performance. Throughout the year, your Fund’s portfolio managers adhered to their long-term investment strategies, and later in this report they explain why your Fund performed as it did during the reporting period.
Adhering to your long-term investment plan can be difficult, particularly during periods of market volatility and economic uncertainty. That’s one reason Invesco suggests investors work with a skilled and trusted financial adviser who is familiar with their financial situation, investment goals and risk tolerance. A good financial adviser can provide insight and perspective when markets are volatile; motivation and reassurance when times are uncertain; and advice and recommendations when your financial situation or investment goals change.
Timely insight and information from many of Invesco’s investment professionals is available at our website, invesco.com/us. We offer in-depth articles, video clips and audio commentaries from many of our portfolio managers and other investment professionals on a wide range of topics of interest to investors. At invesco.com/us, you also can access information about your Invesco account at any time.
What we mean by Intentional Investing
At Invesco, all of our people and all of our resources are dedicated to helping investors achieve their financial objectives. It’s a philosophy we call Intentional Investing®, and it guides the way we:
| n | Manage investments – Our dedicated investment professionals search the world for the best opportunities, and each investment team follows a clear, disciplined process to build portfolios and mitigate risk. |
| n | Provide choices – We offer equity, fixed income, asset allocation and alternative strategies so you and your financial adviser can build an investment portfolio designed for your individual needs and goals. |
| n | Connect with you – We’re committed to giving you the expert insights you need to make informed investing decisions, and we are well-equipped to provide high-quality support for investors and advisers. |
Invesco believes in putting investors first, and that’s why investment management is all we do. Our sole focus on managing your money allows your financial adviser to build a portfolio of Invesco funds appropriate for your investment needs and goals now and when your circumstances change.
Have a question?
If you have a question about your account, please contact an Invesco client services representative at 800 959 4246. If you have an Invesco-related question or comment, feel free to email me directly at phil@invesco.com.
All of us at Invesco look forward to serving your investment management needs for many years to come. Thank you for investing with us.
Sincerely,

Philip Taylor
Senior Managing Director, Invesco Ltd.
2 Invesco Small Cap Growth Fund
Bruce Crockett | Dear Fellow Shareholders: While short-term challenges for the financial markets regularly come and go, it’s clear that significant and longer term economic obstacles remain both here at home and abroad. There appear to be no easy solutions to many of these issues. As a result, the financial markets have had little conviction to respond to what has been slow, yet noticeable improvement in some economic benchmarks in recent months. No one likes uncertainty, especially financial markets. But even in these uncertain times, it appears that investors are still approaching the market with cautious optimism, with some taking on more risk in order to refocus on their long-term savings goals. Maybe this describes you, or perhaps you have been sitting on the sidelines thinking about getting back into the market, but are still a bit hesitant to act because of market uncertainty. | ||||||||

Clearly, risk remains a primary focus for investors of all types. As Trustees of the Invesco Funds, one of our primary responsibilities is to ensure your fund’s adviser is cognizant of the risks in each of the funds it manages. A thoughtful risk management plan may help investors navigate through market turbulence or an economic downturn. This is why we make risk management a critical element of our annual contract renewal process, like the one we complete with Invesco every year.
To be sure, there will always be risks involved with investing, but you shouldn’t let short-term news or your emotions dictate your investments. Because no one can predict with 100% accuracy the movements of financial markets, I strongly encourage you to speak with a professional financial adviser who can assist you in building an investment portfolio that reflects your individual risk tolerance and is designed to help achieve your individual financial objectives.
You can be sure your Board remains committed to doing its part in helping you along the way. In addition to ensuring that your fund’s adviser is focused on the risks in the funds it manages, we also remain committed to managing fund costs and working with your fund’s adviser to provide a compelling and diversified product offering to potentially meet your investing goals.
In that regard, your Board approved a number of fund mergers and the launch of several new funds, including the first Invesco mutual fund available to US retail investors managed by investment professionals at Invesco Perpetual*, one of the largest independent investment managers in the UK.
Let me close by thanking Carl Frischling upon his retirement from the Invesco Funds Board for his 35 years of distinguished service and unwavering commitment to our funds’ shareholders. As always, please contact me at bruce@brucecrockett.com with any questions or concerns you may have.
On behalf of the Board, we look forward to continuing to represent your interests and serving your investment needs.
Sincerely,

Bruce L. Crockett
Independent Chair
Invesco Funds Board of Trustees
| * | Invesco Perpetual is a business name of Invesco Asset Management Limited (IAML), a registered investment adviser. IAML is a wholly owned, indirect subsidiary of Invesco Ltd. |
3 Invesco Small Cap Growth Fund
Management’s Discussion of Fund Performance
Performance summary
For the fiscal year ended December 31, 2012, Invesco Small Cap Growth Fund, at net asset value (NAV), had solid positive returns and outperformed the Fund’s style- specific index, the Russell 2000 Growth Index, driven by stock selection across a number of sectors.
Your Fund’s long-term performance appears later in this report.
Fund vs. Indexes
Total returns, 12/31/11 to 12/31/12, at net asset value (NAV). Performance shown does not include applicable contingent deferred sales charges (CDSC) or front-end sales charges, which would have reduced performance.
| Class A Shares | 18.35 | % | |||
| Class B Shares | 17.44 | ||||
| Class C Shares | 17.41 | ||||
| Class R Shares | 18.05 | ||||
| Class Y Shares | 18.64 | ||||
| Investor Class Shares | 18.34 | ||||
| Class R5 Shares* | 18.77 | ||||
| Class R6 Shares** | 18.50 | ||||
| S&P 500 Index‚ (Broad Market Index) | 16.00 | ||||
| Russell 2000 Growth Indexn (Style-Specific Index) | 14.59 | ||||
| Lipper Small-Cap Growth Funds Indext (Peer Group Index) | 14.95 |
| Source | (s): ‚Invesco, S&P-Dow Jones via FactSet Research Systems Inc.; |
| n | Invesco, Russell via FactSet Research Systems Inc.; tLipper Inc. |
| * | Effective September 24, 2012, Institutional Class shares were renamed Class R5 shares. |
| **Share | class incepted during the reporting period. See page 7 for a detailed explanation of Fund performance. |
How we invest
We believe a growth investment strategy is an essential component of a diversified portfolio.
Our investment process seeks to identify attractively valued small-cap companies with high growth potential, demonstrated by consistent and accelerating revenue and earnings growth.
We begin with a quantitative model that ranks companies based on a set of growth, quality and timeliness factors. This proprietary model provides an objective approach to identifying new investment opportunities, as the highest ranked stocks become the primary focus of our research efforts.
Our stock selection process is based on a rigorous three-step process that includes fundamental, valuation and timeliness analysis.
| 1. | Fundamental analysis. Building financial models and conducting in-depth interviews with company management. |
| 2. | Valuation analysis. Identifying attractively valued stocks given their growth potential over a one- to two-year horizon. |
| 3. | Timeliness analysis. Identifying the “timeliness” of a stock purchase. We review trading volume characteristics and trend analysis to make sure there are no signs of the stock deteriorating. This also serves as a risk management measure that helps us confirm our high conviction candidates. |
Portfolio construction plays an important role in risk management. We align the Fund with the Russell 2000 Growth Index; the benchmark we believe represents the small-cap growth asset class. We seek to manage risk by keeping the
Fund’s sector weightings in line with the benchmark by staying fully diversified in all those sectors. We also seek to limit stock-specific risk by investing in typically 130 to 140 holdings.
We consider selling a stock when it no longer meets our investment criteria, for the following reasons:
| n | Our original investment thesis is not valid because the fundamentals are no longer intact. |
| n | The price target set at purchase is exceeded. |
| n | The company’s timeliness profile deteriorates. |
Market conditions and your Fund
The year 2012 began with improving economic data in the US and a rally in equities that continued almost uninterrupted into the spring. However, the ongoing eurozone sovereign debt crisis intensified in April and May, dominating headlines and creating significant volatility in global equity markets.
This negative news from overseas precipitated a slowdown in the US, where economic data began to decelerate as manufacturing, employment, consumer spending and consumer confidence weakened over the summer. While corporate earnings remained solid until late in the year, financial markets were influenced negatively by these weakening economic data. Fears about the fate of the eurozone began to subside after the European Central Bank announced new measures to support member economies through potentially unlimited purchases of sovereign debt, among other measures. At the same time, continued risk aversion among investors and corporations, along with tepid employment growth, prompted the US Federal Reserve to initiate a third round of quantitative easing and to promise to remain accommodative until the labor market outlook improved materially. Near year
| Portfolio Composition By sector | |||||
| Information Technology | 23.5 | % | |||
| Consumer Discretionary | 17.9 | ||||
| Health Care | 17.3 | ||||
| Industrials | 16.3 | ||||
| Financials | 8.7 | ||||
| Energy | 5.7 | ||||
| Materials | 3.9 | ||||
| Consumer Staples | 2.3 | ||||
| Utilities | 1.5 | ||||
| Telecommunication Services | 1.3 | ||||
| Money Market Funds Plus Other Assets Less Liabilities | 1.6 | ||||
| Top 10 Equity Holdings* | |||||
1. CoStar Group Inc. | 1.4 | % | |||
2. Cymer, Inc. | 1.3 | ||||
3. Aspen Technology, Inc. | 1.3 | ||||
4. SolarWinds, Inc. | 1.3 | ||||
5. Manhattan Associates, Inc. | 1.3 | ||||
6. SBA Communications Corp.-Class A | 1.3 | ||||
7. Alliance Data Systems Corp. | 1.2 | ||||
8. Affiliated Managers Group, Inc. | 1.2 | ||||
9. Penn National Gaming, Inc. | 1.2 | ||||
10. Warnaco Group, Inc. (The) | 1.1 | ||||
| Total Net Assets | $1.7 billion | ||||
| Total Number of Holdings* | 125 | ||||
The Fund’s holdings are subject to change, and there is no assurance that the Fund will continue to hold any particular security.
*Excluding money market fund holdings.
4 Invesco Small Cap Growth Fund
end, market psychology turned negative – first, due to uncertainty about the outcome of the presidential election, and then due to the apparent inability of the White House and Congress to reach an agreement on legislation averting the “fiscal cliff” – a variety of tax increases and spending cuts scheduled to take effect in January 2013.
Despite volatility for much of the year, major equity market indexes delivered double-digit gains, and all 10 sectors of the S&P 500 Index had positive returns.1
The Fund at NAV had strong positive returns and outperformed the Russell 2000 Growth Index due primarily to solid stock selection. The Fund outperformed the index in the consumer discretionary, information technology (IT), industrials and telecommunication services sectors. Performance in the health care, consumer staples and financials sectors was below the style-specific index.
The Fund outperformed the Russell 2000 Growth Index by the widest margin in the consumer discretionary sector due primarily to stock selection; however, the sector overall was strong, and our modest overweight allocation was also beneficial. As the US housing market bottomed and a recovery began to materialize, homebuilder Ryland appreciated by more than 100% and benefited Fund performance. Other strong contributors in this sector included TRW Automotive and DSW.
IT was another significant positive sector for the Fund during the year. Solar-Winds is a provider of powerful and affordable IT management software that continued to benefit from increased revenue from its innovative web-based delivery model and showed resilient growth through recent macroeconomic disruptions. Another contributor was Cymer. A leading producer of lasers for semiconductor manufacturing, Cymer’s stock was up strongly late in the year when they agreed in principle to be acquired for a substantial premium, although the stock was still a holding at the end of the year.
The Fund also outperformed the Russell 2000 Growth Index in the industrials sector due to stock selection. Aerospace and defense parts supplier Transdigm continued to benefit from a recovery in after-market aerospace parts, while private prison operator Corrections Corporation of America benefited from preliminary moves to convert its business structure into a real estate investment trust, which was rewarded by the market.
The Fund underperformed the style-specific index in the health care sector due both to stock selection and an underweight position in this relatively strong market sector. One significant detractor was Nuvasive, which offers leading technology in neuromonitoring systems and minimally invasive lateral surgeries. The company pre-announced that they would miss third-quarter earnings guidance, and the market dramatically punished the stock despite the apparent short-term nature of its issues. Health care systems software company Quality Systems, which we sold during the year, and Salix Pharmaceuticals also detracted from performance during the year.
The Fund also was challenged in the consumer staples sector due to stock selection. Diamond Foods is a snack and nut company that negatively impacted performance during the year. Concerns surrounding accounting practices for walnut company stocks eventually led to a pending restatement of the firm’s financials. Additionally the company’s relationships with walnut suppliers became strained, and some refused to honor their delivery contracts. The stock was sold from the portfolio during the year. A modest cash position in the Fund also detracted from relative performance since the small-cap market was up significantly during the year.
Fund positioning was based primarily on our bottom-up stock selection process, and our long-term investment horizon lead to relatively low turnover. Throughout the year the Fund maintained a “barbell” positioning that provided exposure to cyclical growth opportunities as well as more defensive areas of the market. Changes were modest within this framework, however the most significant changes included reductions in the consumer staples, IT and energy sectors. Exposure to the financials and industrials sectors was increased.
As we’ve discussed, the stock market experienced significant volatility during the fiscal year. We would like to caution investors against making investment decisions based on short-term performance. We thank you for your commitment to Invesco Small Cap Growth Fund.
| 1 | Source: Lipper Inc. |
 | Juliet Ellis Chartered Financial Analyst, portfolio manager and chief investment officer of Invesco’s domestic | |
| growth investments team, is lead manager of Invesco Small Cap Growth Fund. She joined Invesco in 2004. Ms. Ellis earned a BA in economics and political science from Indiana University. | ||
 | Juan Hartsfield Chartered Financial Analyst, portfolio manager, is manager of Invesco Small Cap Growth Fund. He | |
| joined Invesco in 2004. Mr. Hartsfield earned a BS in petroleum engineering from The University of Texas at Austin and an MBA from the University of Michigan. | ||
 | Clay Manley Chartered Financial Analyst, portfolio manager, is manager of Invesco Small Cap Growth Fund. He | |
| joined Invesco in 2001. Mr. Manley earned a BA in history and geology from Vanderbilt University and an MBA with concentrations in finance and accounting from Emory University’s Goizueta Business School. | ||
The views and opinions expressed in management’s discussion of Fund performance are those of Invesco Advisers, Inc. These views and opinions are subject to change at any time based on factors such as market and economic conditions. These views and opinions may not be relied upon as investment advice or recommendations, or as an offer for a particular security. The information is not a complete analysis of every aspect of any market, country, industry, security or the Fund. Statements of fact are from sources considered reliable, but Invesco Advisers, Inc. makes no representation or warranty as to their completeness or accuracy. Although historical performance is no guarantee of future results, these insights may help you understand our investment management philosophy.
See important Fund and, if applicable, index disclosures later in this report.
5 Invesco Small Cap Growth Fund
Your Fund’s Long-Term Performance
Results of a $10,000 Investment – Oldest Share Class(es)
Fund and index data from 12/31/02
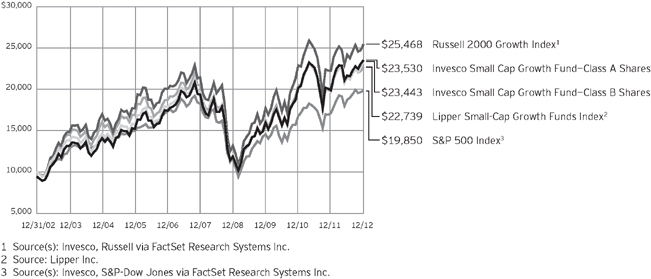
Past performance cannot guarantee comparable future results.
The data shown in the chart include reinvested distributions, applicable sales charges and Fund expenses including management fees. Results for Class B shares are calculated as if a hypothetical
shareholder had liquidated his entire investment in the Fund at the close of the reporting period and paid the contingent deferred sales charges, if applicable. Index results include reinvested dividends, but they do not reflect sales charges. Performance of the peer group,
if applicable, reflects fund expenses and management fees; performance of a market index does not. Performance shown in the chart and table(s) does not reflect deduction of taxes a shareholder would pay on Fund distributions or sale of Fund shares.
6 Invesco Small Cap Growth Fund
Average Annual Total Returns | |||||
As of 12/31/12, including maximum applicable sales charges |
| ||||
| Class A Shares | |||||
| Inception (10/18/95) | 9.34 | % | |||
| 10 Years | 8.93 | ||||
| 5 Years | 2.81 | ||||
| 1 Year | 11.85 | ||||
| Class B Shares | |||||
| Inception (10/18/95) | 9.34 | % | |||
| 10 Years | 8.89 | ||||
| 5 Years | 2.85 | ||||
| 1 Year | 12.44 | ||||
| Class C Shares | |||||
| Inception (5/3/99) | 6.29 | % | |||
| 10 Years | 8.73 | ||||
| 5 Years | 3.19 | ||||
| 1 Year | 16.41 | ||||
| Class R Shares | |||||
| Inception (6/3/02) | 6.66 | % | |||
| 10 Years | 9.28 | ||||
| 5 Years | 3.71 | ||||
| 1 Year | 18.05 | ||||
| Class Y Shares | |||||
| 10 Years | 9.67 | % | |||
| 5 Years | 4.19 | ||||
| 1 Year | 18.64 | ||||
| Investor Class Shares | |||||
| 10 Years | 9.55 | % | |||
| 5 Years | 3.98 | ||||
| 1 Year | 18.34 | ||||
| Class R5 Shares | |||||
| Inception (3/15/02) | 6.44 | % | |||
| 10 Years | 10.05 | ||||
| 5 Years | 4.42 | ||||
| 1 Year | 18.77 | ||||
| Class R6 Shares | |||||
| 10 Years | 9.57 | % | |||
| 5 Years | 4.01 | ||||
| 1 Year | 18.50 | ||||
Class Y shares incepted on October 3, 2008. Performance shown prior to that date is that of Class A shares and includes the 12b-1 fees applicable to Class A shares. Class A share performance reflects any applicable fee waivers or expense reimbursements.
Investor Class shares incepted on April 7, 2006. Performance shown prior to that date is that of Class A shares and includes the 12b-1 fees applicable to Class A shares. Class A share performance reflects any applicable fee waivers or expense reimbursements.
Class R6 shares incepted on September 24, 2012. Performance shown prior to that date is that of Class A shares and includes the 12b-1 fees applicable to Class A shares. Class A share performance reflects any applicable fee waivers or expense reimbursements.
The performance data quoted represent past performance and cannot guarantee comparable future results; current performance may be lower or higher. Please visit invesco.com/performance for the most recent month-end performance. Performance figures reflect reinvested distributions, changes in net asset value and the effect of the maximum sales charge unless otherwise stated. Performance figures do not reflect deduction of taxes a shareholder would pay on Fund distributions or sale of Fund shares. Investment return and principal value will fluctuate so that you may have a gain or loss when you sell shares.
The total annual Fund operating expense ratio set forth in the most recent Fund prospectus as of the date of this report for Class A, Class B, Class C, Class R, Class Y, Investor Class, Class R5 and Class R6 shares was 1.27%, 2.02%, 2.02%, 1.52%, 1.02%, 1.27%, 0.83% and 0.75%, respectively. The expense ratios presented above may vary from the expense ratios presented in other sections of this report that are based on expenses incurred during the period covered by this report.
Class A share performance reflects the maximum 5.50% sales charge, and Class B and Class C share performance reflects the applicable contingent deferred sales charge (CDSC) for the period involved. The CDSC on Class B shares declines from 5% beginning at the time of purchase to 0% at the beginning of the seventh year. The CDSC on Class C shares is 1% for the first year after purchase. Class R, Class Y, Investor Class, Class R5 and Class R6 shares do not have a front-end sales charge or a CDSC; therefore, performance is at net asset value.
The performance of the Fund’s share classes will differ primarily due to different sales charge structures and class expenses.
7 Invesco Small Cap Growth Fund
Invesco Small Cap Growth Fund’s investment objective is long-term growth of capital.
| n | Unless otherwise stated, information presented in this report is as of December 31, 2012, and is based on total net assets. |
| n | Unless otherwise noted, all data provided by Invesco. |
| n | To access your Fund’s reports/prospectus, visit invesco.com/fundreports. |
About share classes
| n | Class B shares may not be purchased for new or additional investments. Please see the prospectus for more information. |
| n | Class R shares are generally available only to employer sponsored retirement and benefit plans. Please see the prospectus for more information. |
| n | Class Y shares are available only to certain investors. Please see the prospectus for more information. |
| n | Investor Class shares are closed to new investors. Contact your financial adviser about purchasing our other share classes. Please see the prospectus for more information. |
| n | Class R5 shares and Class R6 shares are primarily intended for employer sponsored retirement and benefit plans that meet certain standards and for institutional investors. On September 24, 2012, Institutional Class shares were renamed Class R5 shares. Please see the prospectus for more information. |
Principal risks of investing in the Fund
| n | Foreign securities risk. The Fund’s foreign investments may be affected by changes in a foreign country’s exchange rates, political and social instability, changes in economic or taxation policies, difficulties when enforcing obligations, decreased liquidity, and increased volatility. Foreign companies may be subject to less regulation resulting in less publicly available information about the companies. |
| n | Growth investing risk. Growth stocks tend to be more expensive relative to their earnings or assets compared with other types of stock. As a result they tend to be more sensitive to changes in their earnings and can be more volatile. |
| n | Management risk. The investment techniques and risk analysis used by the Fund’s portfolio managers may not produce the desired results. |
| n | Market risk. The prices of and the income generated by the Fund’s securities may decline in response to, among other things, investor sentiment, general economic and market conditions, regional or global instability, and currency and interest rate fluctuations. |
| n | Small- and mid-capitalization risk. Stocks of small and mid-sized companies tend to be more vulnerable to adverse developments in the above factors and may have little or no operating history or track record of success, and limited product lines, markets, management and financial resources. The securities of small and mid-sized companies may be more volatile due to less market interest and less publicly available information about the issuer. They also may be illiquid or restricted as to resale, or may trade less frequently and in smaller volumes, all of which may cause difficulty when establishing or closing a position at a desirable price |
| n | Synthetic securities risk. Fluctuations in the values of synthetic securities may not correlate perfectly with the instruments they are designed to replicate. Synthetic securities may be subject to interest rate changes, market price fluctuations, counterparty risk and liquidity risk. |
About indexes used in this report
| n | The S&P 500® Index is an unmanaged index considered representative of the US stock market. |
| n | The Russell 2000® Growth Index is an unmanaged index considered representative of small-cap growth stocks. The Russell 2000 Growth Index is a trademark/service mark of the Frank Russell Co. Russell® is a trademark of the Frank Russell Co. |
| n | The Lipper Small-Cap Growth Funds Index is an unmanaged index considered representative of small-cap growth funds tracked by Lipper. |
| n | The Fund is not managed to track the performance of any particular index, including the index(es) defined here, and consequently, the performance of the Fund may deviate significantly from the performance of the index(es). |
| n | A direct investment cannot be made in an index. Unless otherwise indicated, index results include reinvested dividends, and they do not reflect sales charges. Performance of the peer group, if applicable, reflects fund expenses; performance of a market index does not. |
Other information
| n | The returns shown in management’s discussion of Fund performance are based on net asset values calculated for shareholder transactions. Generally accepted accounting principles require adjustments to be made to the net assets of the Fund at period end for financial reporting purposes, and as such, the net asset values for shareholder transactions and the returns based on those net asset values may differ from the net asset values and returns reported in the Financial Highlights. Additionally, the returns and net asset values shown throughout this report are at the Fund level only and do not include variable product issuer charges. If such charges were included, the total returns would be lower. |
| n | Industry classifications used in this report are generally according to the Global Industry Classification Standard, which was developed by and is the exclusive property and a service mark of MSCI Inc. and Standard & Poor’s. |
This report must be accompanied or preceded by a currently effective Fund prospectus, which contains more complete information, including sales charges and expenses. Investors should read it carefully before investing.
NOT FDIC INSURED | MAY LOSE VALUE | NO BANK GUARANTEE
| Fund Nasdaq Symbols | |||||
| Class A Shares | GTSAX | ||||
| Class B Shares | GTSBX | ||||
| Class C Shares | GTSDX | ||||
| Class R Shares | GTSRX | ||||
| Class Y Shares | GTSYX | ||||
| Investor Class Shares | GTSIX | ||||
| Class R5 Shares | GTSVX | ||||
| Class R6 Shares | GTSFX | ||||
8 Invesco Small Cap Growth Fund
Schedule of Investments(a)
December 31, 2012
| Shares | Value | |||||||
Common Stocks & Other Equity Interests–98.38% |
| |||||||
| Aerospace & Defense–1.96% | ||||||||
Hexcel Corp.(b) | 595,525 | $ | 16,055,354 | |||||
TransDigm Group, Inc. | 133,443 | 18,196,287 | ||||||
| 34,251,641 | ||||||||
| Air Freight & Logistics–1.53% | ||||||||
Forward Air Corp. | 358,758 | 12,560,118 | ||||||
Hub Group, Inc.–Class A(b) | 422,372 | 14,191,699 | ||||||
| 26,751,817 | ||||||||
| Apparel Retail–1.89% | ||||||||
DSW Inc.–Class A | 255,829 | 16,805,407 | ||||||
Foot Locker, Inc. | 503,483 | 16,171,874 | ||||||
| 32,977,281 | ||||||||
| Apparel, Accessories & Luxury Goods–1.74% | ||||||||
Under Armour, Inc.–Class A(b) | 240,843 | 11,688,111 | ||||||
Warnaco Group, Inc. (The)(b) | 259,998 | 18,608,057 | ||||||
| 30,296,168 | ||||||||
| Application Software–8.88% | ||||||||
ANSYS, Inc.(b) | 227,666 | 15,331,029 | ||||||
Aspen Technology, Inc.(b) | 838,086 | 23,164,697 | ||||||
Cadence Design Systems, Inc.(b) | 1,067,939 | 14,427,856 | ||||||
Informatica Corp.(b) | 423,903 | 12,852,739 | ||||||
Interactive Intelligence Group, Inc.(b) | 329,629 | 11,055,757 | ||||||
Manhattan Associates, Inc.(b) | 381,164 | 22,999,436 | ||||||
Mentor Graphics Corp.(b) | 690,121 | 11,745,859 | ||||||
MicroStrategy Inc.–Class A(b) | 99,601 | 9,300,741 | ||||||
Parametric Technology Corp.(b) | 485,304 | 10,924,193 | ||||||
SolarWinds, Inc.(b) | 439,296 | 23,041,075 | ||||||
| 154,843,382 | ||||||||
| Asset Management & Custody Banks–1.61% | ||||||||
Affiliated Managers Group, Inc.(b) | 154,414 | 20,096,982 | ||||||
SEI Investments Co. | 345,846 | 8,072,046 | ||||||
| 28,169,028 | ||||||||
| Auto Parts & Equipment–1.98% | ||||||||
Tenneco Inc.(b) | 454,297 | 15,950,368 | ||||||
TRW Automotive Holdings Corp.(b) | 345,064 | 18,498,881 | ||||||
| 34,449,249 | ||||||||
| Automotive Retail–1.50% | ||||||||
Group 1 Automotive, Inc. | 241,720 | 14,984,223 | ||||||
Monro Muffler Brake, Inc. | 318,637 | 11,142,736 | ||||||
| 26,126,959 | ||||||||
| Biotechnology–5.11% | ||||||||
Acorda Therapeutics Inc.(b) | 333,277 | 8,285,266 | ||||||
Amarin Corp. PLC –ADR (Ireland)(b)(c) | 908,524 | 7,349,959 | ||||||
BioMarin Pharmaceutical Inc.(b) | 340,320 | 16,760,760 | ||||||
Incyte Corp.(b)(c) | 867,625 | 14,411,251 | ||||||
| Shares | Value | |||||||
| Biotechnology–(continued) | ||||||||
Myriad Genetics, Inc.(b) | 568,492 | $ | 15,491,407 | |||||
Seattle Genetics, Inc.(b)(c) | 550,847 | 12,779,651 | ||||||
United Therapeutics Corp.(b) | 261,688 | 13,979,373 | ||||||
| 89,057,667 | ||||||||
| Building Products–1.06% | ||||||||
A.O. Smith Corp. | 292,517 | 18,449,047 | ||||||
| Casinos & Gaming–1.15% | ||||||||
Penn National Gaming, Inc.(b) | 408,711 | 20,071,797 | ||||||
| Communications Equipment–1.34% | ||||||||
Finisar Corp.(b)(c) | 551,703 | 8,992,759 | ||||||
NETGEAR, Inc.(b) | 363,514 | 14,329,722 | ||||||
| 23,322,481 | ||||||||
| Construction & Farm Machinery & Heavy Trucks–2.69% | ||||||||
Lindsay Corp. | 199,591 | 15,991,231 | ||||||
WABCO Holdings Inc.(b) | 218,836 | 14,265,919 | ||||||
Wabtec Corp. | 190,315 | 16,660,175 | ||||||
| 46,917,325 | ||||||||
| Construction Materials–0.81% | ||||||||
Martin Marietta Materials, Inc.(c) | 150,550 | 14,193,854 | ||||||
| Data Processing & Outsourced Services–1.20% | ||||||||
Alliance Data Systems Corp.(b) | 144,377 | 20,900,015 | ||||||
| Distributors–0.98% | ||||||||
Pool Corp. | 403,664 | 17,083,060 | ||||||
| Diversified Chemicals–0.76% | ||||||||
Olin Corp. | 617,741 | 13,337,028 | ||||||
| Electric Utilities–0.82% | ||||||||
ITC Holdings Corp. | 186,097 | 14,312,720 | ||||||
| Electrical Components & Equipment–1.71% | ||||||||
Acuity Brands, Inc. | 221,296 | 14,988,378 | ||||||
Regal-Beloit Corp. | 210,579 | 14,839,502 | ||||||
| 29,827,880 | ||||||||
| Electronic Components–0.86% | ||||||||
Littelfuse, Inc. | 241,843 | 14,924,132 | ||||||
| Electronic Equipment & Instruments–1.40% | ||||||||
Cognex Corp. | 316,718 | 11,661,557 | ||||||
National Instruments Corp. | 492,206 | 12,703,837 | ||||||
| 24,365,394 | ||||||||
| Electronic Manufacturing Services–0.40% | ||||||||
IPG Photonics Corp.(c) | 105,930 | 7,060,235 | ||||||
| Environmental & Facilities Services–0.89% | ||||||||
Tetra Tech, Inc.(b) | 585,547 | 15,487,718 | ||||||
See accompanying Notes to Financial Statements which are an integral part of the financial statements.
9 �� Invesco Small Cap Growth Fund
| Shares | Value | |||||||
| Fertilizers & Agricultural Chemicals–0.42% | ||||||||
Intrepid Potash, Inc. | 344,956 | $ | 7,344,113 | |||||
| Food Retail–0.62% | ||||||||
Harris Teeter Supermarkets Inc. | 280,285 | 10,807,790 | ||||||
| Footwear–0.75% | ||||||||
Steven Madden, Ltd.(b) | 307,519 | 12,998,828 | ||||||
| Gold–0.46% | ||||||||
Allied Nevada Gold Corp.(b) | 134,071 | 4,039,559 | ||||||
Detour Gold Corp. (Canada)(b) | 159,748 | 4,005,367 | ||||||
| 8,044,926 | ||||||||
| Health Care Equipment–4.25% | ||||||||
Insulet Corp.(b) | 443,682 | 9,414,932 | ||||||
Masimo Corp. | 494,537 | 10,390,222 | ||||||
NuVasive, Inc.(b) | 512,126 | 7,917,468 | ||||||
Sirona Dental Systems, Inc.(b) | 280,387 | 18,073,746 | ||||||
STERIS Corp. | 402,007 | 13,961,703 | ||||||
Thoratec Corp.(b) | 381,907 | 14,329,151 | ||||||
| 74,087,222 | ||||||||
| Health Care Facilities–1.11% | ||||||||
Health Management Associates Inc.–Class A(b) | 1,184,269 | 11,037,387 | ||||||
VCA Antech, Inc.(b) | 397,822 | 8,374,153 | ||||||
| 19,411,540 | ||||||||
| Health Care Services–2.27% | ||||||||
Chemed Corp. | 236,876 | 16,247,325 | ||||||
HMS Holdings Corp.(b) | 370,719 | 9,609,036 | ||||||
MEDNAX, Inc.(b) | 171,759 | 13,658,276 | ||||||
| 39,514,637 | ||||||||
| Health Care Supplies–0.46% | ||||||||
Meridian Bioscience, Inc. | 392,440 | 7,946,910 | ||||||
| Home Furnishings–1.44% | ||||||||
Ethan Allen Interiors Inc. | 443,676 | 11,406,910 | ||||||
Mohawk Industries, Inc.(b) | 150,674 | 13,631,477 | ||||||
| 25,038,387 | ||||||||
| Homebuilding–0.84% | ||||||||
Ryland Group, Inc. (The) | 402,252 | 14,682,198 | ||||||
| Hotels, Resorts & Cruise Lines–0.53% | ||||||||
Choice Hotels International, Inc. | 275,702 | 9,269,101 | ||||||
| Industrial Machinery–1.71% | ||||||||
Crane Co. | 278,257 | 12,877,734 | ||||||
Lincoln Electric Holdings, Inc. | 348,884 | 16,983,673 | ||||||
| 29,861,407 | ||||||||
| Insurance Brokers–0.83% | ||||||||
Brown & Brown, Inc. | 568,954 | 14,485,569 | ||||||
| Internet Software & Services–3.14% | ||||||||
CoStar Group Inc.(b) | 271,041 | 24,222,934 | ||||||
DealerTrack Holdings Inc.(b) | 451,692 | 12,972,594 | ||||||
| Shares | Value | |||||||
| Internet Software & Services–(continued) | ||||||||
ValueClick, Inc.(b) | 904,221 | $ | 17,550,930 | |||||
| 54,746,458 | ||||||||
| Investment Banking & Brokerage–1.10% | ||||||||
Greenhill & Co., Inc. | 140,362 | 7,297,420 | ||||||
Stifel Financial Corp.(b) | 374,066 | 11,958,890 | ||||||
| 19,256,310 | ||||||||
| Leisure Facilities–0.93% | ||||||||
Life Time Fitness, Inc.(b) | 329,779 | 16,228,425 | ||||||
| Leisure Products–0.88% | ||||||||
Brunswick Corp. | 529,293 | 15,397,133 | ||||||
| Life Sciences Tools & Services–2.36% | ||||||||
PAREXEL International Corp.(b) | 570,521 | 16,881,716 | ||||||
PerkinElmer, Inc. | 441,989 | 14,028,731 | ||||||
Techne Corp. | 149,390 | 10,209,313 | ||||||
| 41,119,760 | ||||||||
| Managed Health Care–0.90% | ||||||||
Centene Corp.(b) | 383,508 | 15,723,828 | ||||||
| Marine–0.57% | ||||||||
Kirby Corp.(b) | 161,023 | 9,965,713 | ||||||
| Multi-Line Insurance–0.86% | ||||||||
HCC Insurance Holdings, Inc. | 404,119 | 15,037,268 | ||||||
| Oil & Gas Drilling–1.50% | ||||||||
Atwood Oceanics, Inc.(b) | 276,677 | 12,669,040 | ||||||
Patterson-UTI Energy, Inc.(c) | 720,156 | 13,416,506 | ||||||
| 26,085,546 | ||||||||
| Oil & Gas Equipment & Services–2.27% | ||||||||
Dresser-Rand Group, Inc.(b) | 270,869 | 15,206,585 | ||||||
Dril-Quip, Inc.(b) | 199,296 | 14,558,573 | ||||||
Lufkin Industries, Inc. | 168,483 | 9,793,917 | ||||||
| 39,559,075 | ||||||||
| Oil & Gas Exploration & Production–2.61% | ||||||||
Berry Petroleum Co.–Class A | 324,008 | 10,870,468 | ||||||
Energen Corp. | 266,733 | 12,026,991 | ||||||
Oasis Petroleum Inc.(b) | 472,586 | 15,028,235 | ||||||
Resolute Energy Corp.(b)(c) | 931,187 | 7,570,550 | ||||||
| 45,496,244 | ||||||||
| Packaged Foods & Meats–1.71% | ||||||||
B&G Foods Inc. | 498,902 | 14,123,915 | ||||||
Lancaster Colony Corp. | 225,957 | 15,633,965 | ||||||
| 29,757,880 | ||||||||
| Pharmaceuticals–0.81% | ||||||||
Salix Pharmaceuticals, Ltd.(b) | 349,745 | 14,157,678 | ||||||
| Regional Banks–3.48% | ||||||||
East West Bancorp, Inc. | 584,889 | 12,569,265 | ||||||
Huntington Bancshares Inc. | 1,623,324 | 10,373,040 | ||||||
See accompanying Notes to Financial Statements which are an integral part of the financial statements.
10 Invesco Small Cap Growth Fund
| Shares | Value | |||||||
| Regional Banks–(continued) | ||||||||
PrivateBancorp, Inc. | 810,663 | $ | 12,419,357 | |||||
Prosperity Bancshares, Inc. | 309,977 | 13,019,034 | ||||||
SVB Financial Group(b) | 221,496 | 12,397,131 | ||||||
| 60,777,827 | ||||||||
| Residential REIT’s–0.80% | ||||||||
Colonial Properties Trust | 649,246 | 13,874,387 | ||||||
| Restaurants–1.72% | ||||||||
Domino’s Pizza, Inc. | 363,966 | 15,850,719 | ||||||
Jack in the Box Inc.(b) | 494,395 | 14,139,697 | ||||||
| 29,990,416 | ||||||||
| Security & Alarm Services–1.05% | ||||||||
Corrections Corp. of America | 518,005 | 18,373,637 | ||||||
| Semiconductor Equipment–2.75% | ||||||||
Cymer, Inc.(b) | 256,908 | 23,232,191 | ||||||
MKS Instruments, Inc. | 419,562 | 10,816,308 | ||||||
Teradyne, Inc.(b) | 821,154 | 13,869,291 | ||||||
| 47,917,790 | ||||||||
| Semiconductors–2.21% | ||||||||
Microsemi Corp.(b) | 635,683 | 13,374,770 | ||||||
Power Integrations, Inc. | 329,526 | 11,075,369 | ||||||
Semtech Corp.(b) | 484,190 | 14,017,301 | ||||||
| 38,467,440 | ||||||||
| Specialty Chemicals–0.68% | ||||||||
Rockwood Holdings Inc. | 238,324 | 11,787,505 | ||||||
| Specialty Stores–1.59% | ||||||||
Tractor Supply Co. | 162,960 | 14,399,146 | ||||||
Vitamin Shoppe, Inc.(b) | 231,095 | 13,255,609 | ||||||
| 27,654,755 | ||||||||
| Steel–0.79% | ||||||||
Carpenter Technology Corp. | 267,832 | 13,828,166 | ||||||
| Shares | Value | |||||||
| Systems Software–1.96% | ||||||||
CommVault Systems, Inc.(b) | 225,537 | $ | 15,722,184 | |||||
MICROS Systems, Inc.(b) | 312,888 | 13,278,967 | ||||||
Websense, Inc.(b) | 346,905 | 5,217,451 | ||||||
| 34,218,602 | ||||||||
| Technology Distributors–0.70% | ||||||||
SYNNEX Corp.(b) | 353,355 | 12,148,345 | ||||||
| Trading Companies & Distributors–1.73% | ||||||||
Watsco, Inc. | 194,770 | 14,588,273 | ||||||
WESCO International, Inc.(b) | 231,857 | 15,634,118 | ||||||
| 30,222,391 | ||||||||
| Wireless Telecommunication Services–1.32% | ||||||||
SBA Communications Corp.–Class A(b) | 323,196 | 22,953,380 | ||||||
Total Common Stocks & Other Equity Interests (Cost $1,275,068,336) |
| 1,715,414,465 | ||||||
Money Market Funds–1.56% |
| |||||||
Liquid Assets Portfolio–Institutional Class(d) | 13,629,871 | 13,629,871 | ||||||
Premier Portfolio–Institutional Class(d) | 13,629,871 | 13,629,871 | ||||||
Total Money Market Funds | 27,259,742 | |||||||
TOTAL INVESTMENTS (excluding investments purchased with cash collateral from securities on loan)–99.94% (Cost $1,302,328,078) |
| 1,742,674,207 | ||||||
Investments Purchased with Cash Collateral from Securities on Loan |
| |||||||
Money Market Funds–2.69% |
| |||||||
Liquid Assets Portfolio–Institutional Class (Cost $46,979,865)(d)(e) | 46,979,865 | 46,979,865 | ||||||
TOTAL INVESTMENTS–102.63% |
| 1,789,654,072 | ||||||
OTHER ASSETS LESS LIABILITIES–(2.63)% |
| (45,897,250 | ) | |||||
NET ASSETS–100.00% |
| $ | 1,743,756,822 | |||||
Investment Abbreviations:
| ADR | – American Depositary Receipt | |
| REIT | – Real Estate Investment Trust |
Notes to Schedule of Investments:
| (a) | Industry and/or sector classifications used in this report are generally according to the Global Industry Classification Standard, which was developed by and is the exclusive property and a service mark of MSCI Inc. and Standard & Poor’s. |
| (b) | Non-income producing security. |
| (c) | All or a portion of this security was out on loan at December 31, 2012. |
| (d) | The money market fund and the Fund are affiliated by having the same investment adviser. |
| (e) | The security has been segregated to satisfy the commitment to return the cash collateral received in securities lending transactions upon the borrower’s return of the securities loaned. See Note 1I. |
See accompanying Notes to Financial Statements which are an integral part of the financial statements.
11 Invesco Small Cap Growth Fund
Statement of Assets and Liabilities
December 31, 2012
Assets: |
| |||
Investments, at value (Cost $1,275,068,336)* | $ | 1,715,414,465 | ||
Investments in affiliated money market funds, at value and cost | 74,239,607 | |||
Total investments, at value (Cost $1,349,307,943) | 1,789,654,072 | |||
Cash | 9,217,248 | |||
Receivable for: | ||||
Investments sold | 5,052,680 | |||
Fund shares sold | 2,866,337 | |||
Dividends | 362,815 | |||
Investment for trustee deferred compensation and retirement plans | 76,617 | |||
Other assets | 40,040 | |||
Total assets | 1,807,269,809 | |||
Liabilities: |
| |||
Payable for: | ||||
Investments purchased | 4,845,565 | |||
Fund shares reacquired | 10,147,975 | |||
Collateral upon return of securities loaned | 46,979,865 | |||
Accrued fees to affiliates | 1,111,916 | |||
Accrued other operating expenses | 116,593 | |||
Trustee deferred compensation and retirement plans | 311,073 | |||
Total liabilities | 63,512,987 | |||
Net assets applicable to shares outstanding | $ | 1,743,756,822 | ||
Net assets consist of: |
| |||
Shares of beneficial interest | $ | 1,296,824,964 | ||
Undistributed net investment income | 570,993 | |||
Undistributed net realized gain | 6,014,736 | |||
Unrealized appreciation | 440,346,129 | |||
| $ | 1,743,756,822 | |||
Net Assets: |
| |||
Class A | $ | 766,786,993 | ||
Class B | $ | 5,717,498 | ||
Class C | $ | 17,656,980 | ||
Class R | $ | 87,605,773 | ||
Class Y | $ | 34,616,101 | ||
Investor Class | $ | 209,841,817 | ||
Class R5 | $ | 621,522,300 | ||
Class R6 | $ | 9,360 | ||
Shares outstanding, $0.01 par value per share, |
| |||
Class A | 25,559,612 | |||
Class B | 229,581 | |||
Class C | 709,918 | |||
Class R | 3,026,001 | |||
Class Y | 1,141,314 | |||
Investor Class | 6,785,931 | |||
Class R5 | 19,468,535 | |||
Class R6 | 293.2 | |||
Class A: | ||||
Net asset value per share | $ | 30.00 | ||
Maximum offering price per share | ||||
(Net asset value of $30.00 ¸ 94.50%) | $ | 31.75 | ||
Class B: | ||||
Net asset value and offering price per share | $ | 24.90 | ||
Class C: | ||||
Net asset value and offering price per share | $ | 24.87 | ||
Class R: | ||||
Net asset value and offering price per share | $ | 28.95 | ||
Class Y: | ||||
Net asset value and offering price per share | $ | 30.33 | ||
Investor Class: | ||||
Net asset value and offering price per share | $ | 30.92 | ||
Class R5: | ||||
Net asset value and offering price per share | $ | 31.92 | ||
Class R6: | ||||
Net asset value and offering price per share | $ | 31.92 | ||
| * | At December 31, 2012, securities with an aggregate value of $47,027,083 were on loan to brokers. |
See accompanying Notes to Financial Statements which are an integral part of the financial statements.
12 Invesco Small Cap Growth Fund
Statement of Operations
For the year ended December 31, 2012
Investment income: |
| |||
Dividends | $ | 21,608,067 | ||
Dividends from affiliated money market funds (includes securities lending income of $653,827) | 693,286 | |||
Total investment income | 22,301,353 | |||
Expenses: | ||||
Advisory fees | 12,163,117 | |||
Administrative services fees | 424,533 | |||
Custodian fees | 54,161 | |||
Distribution fees: | ||||
Class A | 2,073,029 | |||
Class B | 68,021 | |||
Class C | 183,491 | |||
Class R | 433,737 | |||
Investor Class | 552,607 | |||
Transfer agent fees — A, B, C, R, Y and Investor | 2,722,528 | |||
Transfer agent fees — R5 | 512,133 | |||
Trustees’ and officers’ fees and benefits | 89,300 | |||
Other | 343,524 | |||
Total expenses | 19,620,181 | |||
Less: Fees waived and expense offset arrangement(s) | (40,987 | ) | ||
Net expenses | 19,579,194 | |||
Net investment income | 2,722,159 | |||
Realized and unrealized gain from: | ||||
Net realized gain from: | ||||
Investment securities (includes net gains from securities sold to affiliates of $6,265,479 and | 151,286,489 | |||
Foreign currencies | 12 | |||
| 151,286,501 | ||||
Change in net unrealized appreciation of investment securities | 138,780,461 | |||
Net realized and unrealized gain | 290,066,962 | |||
Net increase in net assets resulting from operations | $ | 292,789,121 | ||
See accompanying Notes to Financial Statements which are an integral part of the financial statements.
13 Invesco Small Cap Growth Fund
Statement of Changes in Net Assets
For the years ended December 31, 2012 and 2011
| 2012 | 2011 | |||||||
Operations: |
| |||||||
Net investment income (loss) | $ | 2,722,159 | $ | (9,789,082 | ) | |||
Net realized gain | 151,286,501 | 105,320,263 | ||||||
Change in net unrealized appreciation (depreciation) | 138,780,461 | (124,366,524 | ) | |||||
Net increase (decrease) in net assets resulting from operations | 292,789,121 | (28,835,343 | ) | |||||
Distributions to shareholders from net investment income: | ||||||||
Class Y | (5,023 | ) | — | |||||
Class R5 | (838,954 | ) | — | |||||
Class R6 | (16 | ) | — | |||||
Total distributions from net investment income | (843,993 | ) | — | |||||
Distributions to shareholders from net realized gains: | ||||||||
Class A | (65,907,987 | ) | (15,755,105 | ) | ||||
Class B | (582,657 | ) | (170,369 | ) | ||||
Class C | (1,772,373 | ) | (392,069 | ) | ||||
Class R | (7,677,813 | ) | (1,355,821 | ) | ||||
Class Y | (1,225,442 | ) | (149,450 | ) | ||||
Investor Class | (18,277,155 | ) | (3,798,394 | ) | ||||
Class R5 | (49,507,374 | ) | (8,680,259 | ) | ||||
Class R6 | (801 | ) | — | |||||
Total distributions from net realized gains | (144,951,602 | ) | (30,301,467 | ) | ||||
Share transactions-net: | ||||||||
Class A | (139,029,119 | ) | (72,033,508 | ) | ||||
Class B | (2,431,679 | ) | (4,466,089 | ) | ||||
Class C | (1,383,039 | ) | (2,687,335 | ) | ||||
Class R | 11,086,458 | 6,710,379 | ||||||
Class Y | 25,613,386 | 2,223,361 | ||||||
Investor Class | (18,055,278 | ) | (15,166,971 | ) | ||||
Class R5 | 75,701,714 | 90,633,718 | ||||||
Class R6 | 10,000 | — | ||||||
Net increase (decrease) in net assets resulting from share transactions | (48,487,557 | ) | 5,213,555 | |||||
Net increase (decrease) in net assets | 98,505,969 | (53,923,255 | ) | |||||
Net assets: | ||||||||
Beginning of year | 1,645,250,853 | 1,699,174,108 | ||||||
End of year (includes undistributed net investment income (loss) of $570,993 and $(1,314,582), respectively) | $ | 1,743,756,822 | $ | 1,645,250,853 | ||||
Notes to Financial Statements
December 31, 2012
NOTE 1—Significant Accounting Policies
Invesco Small Cap Growth Fund (the “Fund”) is a series portfolio of AIM Growth Series (Invesco Growth Series) (the “Trust”). The Trust is organized as a Delaware statutory trust and is registered under the Investment Company Act of 1940, as amended (the “1940 Act”), as an open-end series management investment company consisting of sixteen separate series portfolios, each authorized to issue an unlimited number of shares of beneficial interest. The assets, liabilities and operations of each portfolio are accounted for separately. Information presented in these financial statements pertains only to the Fund. Matters affecting each portfolio or class will be voted on exclusively by the shareholders of such portfolio or class.
The Fund’s investment objective is long-term growth of capital.
The Fund currently consists of eight different classes of shares: Class A, Class B, Class C, Class R, Class Y, Investor Class, Class R5 and Class R6. On September 24, 2012, Institutional Class shares were renamed Class R5 shares and the Fund began offering Class R6 shares. Investor Class shares of the Fund are offered only to certain grandfathered investors. Class A shares are sold with a front-end sales charge unless certain waiver criteria are
14 Invesco Small Cap Growth Fund
met and under certain circumstances load waived shares may be subject to contingent deferred sales charges (“CDSC”). Class C shares are sold with a CDSC. Class R, Class Y, Investor Class, Class R5 and Class R6 shares are sold at net asset value. Effective November 30, 2010, new or additional investments in Class B shares are no longer permitted. Existing shareholders of Class B shares may continue to reinvest dividends and capital gains distributions in Class B shares until they convert to Class A shares. Also, shareholders in Class B shares will be able to exchange those shares for Class B shares of other Invesco Funds offering such shares until they convert to Class A shares. Generally, Class B shares will automatically convert to Class A shares on or about the month-end, which is at least eight years after the date of purchase. Redemption of Class B shares prior to the conversion date will be subject to a CDSC.
Effective as of the close of business on March 18, 2002, the Fund’s shares were offered on a limited basis to certain investors.
The following is a summary of the significant accounting policies followed by the Fund in the preparation of its financial statements.
| A. | Security Valuations — Securities, including restricted securities, are valued according to the following policy. |
A security listed or traded on an exchange (except convertible bonds) is valued at its last sales price or official closing price as of the close of the customary trading session on the exchange where the security is principally traded, or lacking any sales or official closing price on a particular day, the security may be valued at the closing bid price on that day. Securities traded in the over-the-counter market are valued based on prices furnished by independent pricing services or market makers. When such securities are valued by an independent pricing service they may be considered fair valued. Futures contracts are valued at the final settlement price set by an exchange on which they are principally traded. Listed options are valued at the mean between the last bid and ask prices from the exchange on which they are principally traded. Options not listed on an exchange are valued by an independent source at the mean between the last bid and ask prices. For purposes of determining net asset value per share, futures and option contracts generally are valued 15 minutes after the close of the customary trading session of the New York Stock Exchange (“NYSE”).
Investments in open-end and closed-end registered investment companies that do not trade on an exchange are valued at the end of day net asset value per share. Investments in open-end and closed-end registered investment companies that trade on an exchange are valued at the last sales price or official closing price as of the close of the customary trading session on the exchange where the security is principally traded.
Debt obligations (including convertible bonds) and unlisted equities are fair valued using an evaluated quote provided by an independent pricing service. Evaluated quotes provided by the pricing service may be determined without exclusive reliance on quoted prices, and may reflect appropriate factors such as institution-size trading in similar groups of securities, developments related to specific securities, dividend rate (for unlisted equities), yield (for debt obligations), quality, type of issue, coupon rate (for debt obligations), maturity (for debt obligations), individual trading characteristics and other market data. Debt obligations are subject to interest rate and credit risks. In addition, all debt obligations involve some risk of default with respect to interest and/or principal payments.
Foreign securities’ (including foreign exchange contracts) prices are converted into U.S. dollar amounts using the applicable exchange rates as of the close of the NYSE. If market quotations are available and reliable for foreign exchange-traded equity securities, the securities will be valued at the market quotations. Because trading hours for certain foreign securities end before the close of the NYSE, closing market quotations may become unreliable. If between the time trading ends on a particular security and the close of the customary trading session on the NYSE, events occur that the Adviser determines are significant and make the closing price unreliable, the Fund may fair value the security. If the event is likely to have affected the closing price of the security, the security will be valued at fair value in good faith using procedures approved by the Board of Trustees. Adjustments to closing prices to reflect fair value may also be based on a screening process of an independent pricing service to indicate the degree of certainty, based on historical data, that the closing price in the principal market where a foreign security trade is not the current value as of the close of the NYSE. Foreign securities’ prices meeting the approved degree of certainty that the price is not reflective of current value will be priced at the indication of fair value from the independent pricing service. Multiple factors may be considered by the independent pricing service in determining adjustments to reflect fair value and may include information relating to sector indices, American Depositary Receipts and domestic and foreign index futures. Foreign securities may have additional risks including exchange rate changes, potential for sharply devalued currencies and high inflation, political and economic upheaval, the relative lack of issuer information, relatively low market liquidity and the potential lack of strict financial and accounting controls and standards.
Securities for which market prices are not provided by any of the above methods may be valued based upon quotes furnished by independent sources. The last bid price may be used to value equity securities. The mean between the last bid and asked prices is used to value debt obligations, including corporate loans.
Securities for which market quotations are not readily available or became unreliable are valued at fair value as determined in good faith by or under the supervision of the Trust’s officers following procedures approved by the Board of Trustees. Issuer specific events, market trends, bid/ask quotes of brokers and information providers and other market data may be reviewed in the course of making a good faith determination of a security’s fair value.
Valuations change in response to many factors including the historical and prospective earnings of the issuer, the value of the issuer’s assets, general economic conditions, interest rates, investor perceptions and market liquidity. Because of the inherent uncertainties of valuation, the values reflected in the financial statements may materially differ from the value received upon actual sale of those investments.
| B. | Securities Transactions and Investment Income — Securities transactions are accounted for on a trade date basis. Realized gains or losses on sales are computed on the basis of specific identification of the securities sold. Interest income is recorded on the accrual basis from settlement date. Dividend income (net of withholding tax, if any) is recorded on the ex-dividend date. |
The Fund may periodically participate in litigation related to Fund investments. As such, the Fund may receive proceeds from litigation settlements. Any proceeds received are included in the Statement of Operations as realized gain (loss) for investments no longer held and as unrealized gain (loss) for investments still held.
Brokerage commissions and mark ups are considered transaction costs and are recorded as an increase to the cost basis of securities purchased and/or a reduction of proceeds on a sale of securities. Such transaction costs are included in the determination of net realized and unrealized gain (loss) from investment securities reported in the Statement of Operations and the Statement of Changes in Net Assets and the net realized and unrealized gains (losses) on securities per share in the Financial Highlights. Transaction costs are included in the calculation of the Fund’s net asset value and, accordingly, they reduce the Fund’s total returns. These transaction costs are not considered operating expenses and are not reflected in net investment income reported in the Statement of Operations and Statement of Changes in Net Assets, or the net investment
15 Invesco Small Cap Growth Fund
income per share and ratios of expenses and net investment income reported in the Financial Highlights, nor are they limited by any expense limitation arrangements between the Fund and the investment adviser.
The Fund allocates income and realized and unrealized capital gains and losses to a class based on the relative net assets of each class.
| C. | Country Determination — For the purposes of making investment selection decisions and presentation in the Schedule of Investments, the investment adviser may determine the country in which an issuer is located and/or credit risk exposure based on various factors. These factors include the laws of the country under which the issuer is organized, where the issuer maintains a principal office, the country in which the issuer derives 50% or more of its total revenues and the country that has the primary market for the issuer’s securities, as well as other criteria. Among the other criteria that may be evaluated for making this determination are the country in which the issuer maintains 50% or more of its assets, the type of security, financial guarantees and enhancements, the nature of the collateral and the sponsor organization. Country of issuer and/or credit risk exposure has been determined to be the United States of America, unless otherwise noted. |
| D. | Distributions — Distributions from income and net realized capital gain, if any, are generally declared and paid annually and recorded on the ex-dividend date. The Fund may elect to treat a portion of the proceeds from redemptions as distributions for federal income tax purposes. |
| E. | Federal Income Taxes — The Fund intends to comply with the requirements of Subchapter M of the Internal Revenue Code necessary to qualify as a regulated investment company and to distribute substantially all of the Fund’s taxable earnings to shareholders. As such, the Fund will not be subject to federal income taxes on otherwise taxable income (including net realized capital gain) that is distributed to shareholders. Therefore, no provision for federal income taxes is recorded in the financial statements. |
The Fund files tax returns in the U.S. Federal jurisdiction and certain other jurisdictions. Generally, the Fund is subject to examinations by such taxing authorities for up to three years after the filing of the return for the tax period.
| F. | Expenses — Fees provided for under the Rule 12b-1 plan of a particular class of the Fund are charged to the operations of such class. Transfer agency fees and expenses and other shareholder recordkeeping fees and expenses attributable to Class R5 and Class R6 are allocated to each share class based on relative net assets. Sub-accounting fees attributable to Class R5 are charged to the operations of the class. Transfer agency fees and expenses and other shareholder recordkeeping fees and expenses relating to all other classes are allocated among those classes based on relative net assets. All other expenses are allocated among the classes based on relative net assets. |
| G. | Accounting Estimates — The preparation of financial statements in conformity with accounting principles generally accepted in the United States of America (“GAAP”) requires management to make estimates and assumptions that affect the reported amounts of assets and liabilities at the date of the financial statements and the reported amounts of revenues and expenses during the reporting period including estimates and assumptions related to taxation. Actual results could differ from those estimates by a significant amount. In addition, the Fund monitors for material events or transactions that may occur or become known after the period-end date and before the date the financial statements are released to print. |
| H. | Indemnifications — Under the Trust’s organizational documents, each Trustee, officer, employee or other agent of the Trust is indemnified against certain liabilities that may arise out of the performance of their duties to the Fund. Additionally, in the normal course of business, the Fund enters into contracts, including the Fund’s servicing agreements, that contain a variety of indemnification clauses. The Fund’s maximum exposure under these arrangements is unknown as this would involve future claims that may be made against the Fund that have not yet occurred. The risk of material loss as a result of such indemnification claims is considered remote. |
| I. | Securities Lending — The Fund may lend portfolio securities having a market value up to one-third of the Fund’s total assets. Such loans are secured by collateral equal to no less than the market value of the loaned securities determined daily by the securities lending provider. Such collateral will be cash or debt securities issued or guaranteed by the U.S. Government or any of its sponsored agencies. Cash collateral received in connection with these loans is invested in short-term money market instruments or affiliated money market funds and is shown as such on the Schedule of Investments. It is the Fund’s policy to obtain additional collateral from or return excess collateral to the borrower by the end of the next business day, following the valuation date of the securities loaned. Therefore, the value of the collateral held may be temporarily less than the value of the securities on loan. Lending securities entails a risk of loss to the Fund if and to the extent that the market value of the securities loaned were to increase and the borrower did not increase the collateral accordingly, and the borrower fails to return the securities. Upon the failure of the borrower to return the securities, collateral may be liquidated and the securities may be purchased on the open market to replace the loaned securities. The Fund could experience delays and costs in gaining access to the collateral. The Fund bears the risk of any deficiency in the amount of the collateral available for return to the borrower due to any loss on the collateral invested. Dividends received on cash collateral investments for securities lending transactions, which are net of compensation to counterparties, is included in Dividends from affiliated money market funds on the Statement of Operations. The aggregate value of securities out on loan is shown as a footnote on the Statement of Assets and Liabilities, if any. |
| J. | Foreign Currency Translations — Foreign currency is valued at the close of the NYSE based on quotations posted by banks and major currency dealers. Portfolio securities and other assets and liabilities denominated in foreign currencies are translated into U.S. dollar amounts at date of valuation. Purchases and sales of portfolio securities (net of foreign taxes withheld on disposition) and income items denominated in foreign currencies are translated into U.S. dollar amounts on the respective dates of such transactions. The Fund does not separately account for the portion of the results of operations resulting from changes in foreign exchange rates on investments and the fluctuations arising from changes in market prices of securities held. The combined results of changes in foreign exchange rates and the fluctuation of market prices on investments (net of estimated foreign tax withholding) are included with the net realized and unrealized gain or loss from investments in the Statement of Operations. Reported net realized foreign currency gains or losses arise from (1) sales of foreign currencies, (2) currency gains or losses realized between the trade and settlement dates on securities transactions, and (3) the difference between the amounts of dividends, interest, and foreign withholding taxes recorded on the Fund’s books and the U.S. dollar equivalent of the amounts actually received or paid. Net unrealized foreign currency gains and losses arise from changes in the fair values of assets and liabilities, other than investments in securities at fiscal period end, resulting from changes in exchange rates. |
The Fund may invest in foreign securities which may be subject to foreign taxes on income, gains on investments or currency repatriation, a portion of which may be recoverable.
| K. | Foreign Currency Contracts — The Fund may enter into foreign currency contracts to manage or minimize currency or exchange rate risk. The Fund may also enter into foreign currency contracts for the purchase or sale of a security denominated in a foreign currency in order to “lock |
16 Invesco Small Cap Growth Fund
| in” the U.S. dollar price of that security. A foreign currency contract is an obligation to purchase or sell a specific currency for an agreed-upon price at a future date. The use of foreign currency contracts does not eliminate fluctuations in the price of the underlying securities the Fund owns or intends to acquire but establishes a rate of exchange in advance. Fluctuations in the value of these contracts are measured by the difference in the contract date and reporting date exchange rates and are recorded as unrealized appreciation (depreciation) until the contracts are closed. When the contracts are closed, realized gains (losses) are recorded. Realized and unrealized gains (losses) on the contracts are included in the Statement of Operations. The primary risks associated with foreign currency contracts include failure of the counterparty to meet the terms of the contract and the value of the foreign currency changing unfavorably. These risks may be in excess of the amounts reflected in the Statement of Assets and Liabilities. |
NOTE 2—Advisory Fees and Other Fees Paid to Affiliates
The Trust has entered into a master investment advisory agreement with Invesco Advisers, Inc. (the “Adviser” or “Invesco”). Under the terms of the investment advisory agreement, the Fund pays an advisory fee to the Adviser based on the annual rate of the Fund’s average daily net assets as follows:
| Average Daily Net Assets | Rate | |||||
First $500 million | 0 | .725% | ||||
Next $500 million | 0 | .70% | ||||
Next $500 million | 0 | .675% | ||||
Over $1.5 billion | 0 | .65% | ||||
Under the terms of a master sub-advisory agreement between the Adviser and each of Invesco Asset Management Deutschland GmbH, Invesco Asset Management Limited, Invesco Asset Management (Japan) Limited, Invesco Australia Limited, Invesco Hong Kong Limited, Invesco Senior Secured Management, Inc. and Invesco Canada Ltd. (collectively, the “Affiliated Sub-Advisers”) the Adviser, not the Fund, may pay 40% of the fees paid to the Adviser to any such Affiliated Sub-Adviser(s) that provide discretionary investment management services to the Fund based on the percentage of assets allocated to such Sub-Adviser(s).
The Adviser has contractually agreed, through at least June 30, 2013, to waive advisory fees and/or reimburse expenses of all shares to the extent necessary to limit total annual fund operating expenses after fee waiver and/or expense reimbursement (excluding certain items discussed below) of Class A, Class B, Class C, Class R, Class Y, Investor Class, Class R5 and Class R6 shares to 2.00%, 2.75%, 2.75%, 2.25%, 1.75%, 2.00%, 1.75% and 1.75%, respectively, of average daily net assets. In determining the Adviser’s obligation to waive advisory fees and/or reimburse expenses, the following expenses are not taken into account, and could cause the total annual fund operating expenses after fee waiver and/or expense reimbursement to exceed the numbers reflected above: (1) interest; (2) taxes; (3) dividend expense on short sales; (4) extraordinary or non-routine items, including litigation expenses; and (5) expenses that the Fund has incurred but did not actually pay because of an expense offset arrangement. Unless the Board of Trustees and Invesco mutually agree to amend or continue the fee waiver agreement, it will terminate on June 30, 2013. The Adviser did not waive fees and/or reimburse expenses during the period under this expense limitation.
Further, the Adviser has contractually agreed, through at least June 30, 2013, to waive the advisory fee payable by the Fund in an amount equal to 100% of the net advisory fees the Adviser receives from the affiliated money market funds on investments by the Fund of uninvested cash (excluding investments of cash collateral from securities lending) in such affiliated money market funds.
For the year ended December 31, 2012, the Adviser waived advisory fees of $38,627.
The Trust has entered into a master administrative services agreement with Invesco pursuant to which the Fund has agreed to pay Invesco for certain administrative costs incurred in providing accounting services to the Fund. For the year ended December 31, 2012, expenses incurred under the agreement are shown in the Statement of Operations as Administrative services fees.
The Trust has entered into a transfer agency and service agreement with Invesco Investment Services, Inc. (“IIS”) pursuant to which the Fund has agreed to pay IIS a fee for providing transfer agency and shareholder services to the Fund and reimburse IIS for certain expenses incurred by IIS in the course of providing such services. IIS may make payments to intermediaries that provide omnibus account services, sub-accounting services and/or networking services. All fees payable by IIS to intermediaries that provide omnibus account services or sub-accounting are charged back to the Fund, subject to certain limitations approved by the Trust’s Board of Trustees. For the year ended December 31, 2012, expenses incurred under the agreement are shown in the Statement of Operations as Transfer agent fees.
The Trust has entered into master distribution agreements with Invesco Distributors, Inc. (“IDI”) to serve as the distributor for the Class A, Class B, Class C, Class R, Class Y, Investor Class, Class R5 and Class R6 shares of the Fund. The Trust has adopted plans pursuant to Rule 12b-1 under the 1940 Act with respect to the Fund’s Class A, Class B, Class C, Class R and Investor Class shares (collectively, the “Plans”). The Fund, pursuant to the Plans, pays IDI compensation at the annual rate of 0.25% of the Fund’s average daily net assets of Class A shares, 1.00% of the average daily net assets of Class B and Class C shares and 0.50% of the average daily net assets of Class R shares. The Fund, pursuant to the Investor Class Plan, reimburses IDI for its allocated share of expenses incurred pursuant to the Investor Class Plan for the period, up to a maximum annual rate of 0.25% of the average daily net assets of Investor Class shares. Of the Plan payments, up to 0.25% of the average daily net assets of each class of shares may be paid to furnish continuing personal shareholder services to customers who purchase and own shares of such classes. Any amounts not paid as a service fee under the Plans would constitute an asset-based sales charge. Rules of the Financial Industry Regulatory Authority (“FINRA”) impose a cap on the total sales charges, including asset-based sales charges, that may be paid by any class of shares of the Fund. For the year ended December 31, 2012, expenses incurred under the Plans are shown in the Statement of Operations as Distribution fees.
Front-end sales commissions and CDSC (collectively, the “sales charges”) are not recorded as expenses of the Fund. Front-end sales commissions are deducted from proceeds from the sales of Fund shares prior to investment in Class A shares of the Fund. CDSC are deducted from redemption proceeds prior to remittance to the shareholder. During the year ended December 31, 2012, IDI advised the Fund that IDI retained $6,568 in front-end sales commissions from the sale of Class A shares and $8, $4,922 and $328 from Class A, Class B and Class C shares, respectively, for CDSC imposed on redemptions by shareholders.
Certain officers and trustees of the Trust are officers and directors of the Adviser, IIS and/or IDI.
17 Invesco Small Cap Growth Fund
NOTE 3—Additional Valuation Information
GAAP defines fair value as the price that would be received to sell an asset or paid to transfer a liability in an orderly transaction between market participants at the measurement date, under current market conditions. GAAP establishes a hierarchy that prioritizes the inputs to valuation methods giving the highest priority to readily available unadjusted quoted prices in an active market for identical assets (Level 1) and the lowest priority to significant unobservable inputs (Level 3) generally when market prices are not readily available or are unreliable. Based on the valuation inputs, the securities or other investments are tiered into one of three levels. Changes in valuation methods may result in transfers in or out of an investment’s assigned level:
| Level 1 — | Prices are determined using quoted prices in an active market for identical assets. |
| Level 2 — | Prices are determined using other significant observable inputs. Observable inputs are inputs that other market participants may use in pricing a security. These may include quoted prices for similar securities, interest rates, prepayment speeds, credit risk, yield curves, loss severities, default rates, discount rates, volatilities and others. |
| Level 3 — | Prices are determined using significant unobservable inputs. In situations where quoted prices or observable inputs are unavailable (for example, when there is little or no market activity for an investment at the end of the period), unobservable inputs may be used. Unobservable inputs reflect the Fund’s own assumptions about the factors market participants would use in determining fair value of the securities or instruments and would be based on the best available information. |
The following is a summary of the tiered valuation input levels, as of December 31, 2012. The level assigned to the securities valuations may not be an indication of the risk or liquidity associated with investing in those securities. Because of the inherent uncertainties of valuation, the values reflected in the financial statements may materially differ from the value received upon actual sale of those investments.
| Level 1 | Level 2 | Level 3 | Total | |||||||||||||
Equity Securities | $ | 1,789,654,072 | $ | — | $ | — | $ | 1,789,654,072 | ||||||||
NOTE 4—Security Transactions with Affiliated Funds
The Fund is permitted to purchase or sell securities from or to certain other Invesco Funds under specified conditions outlined in procedures adopted by the Board of Trustees of the Trust. The procedures have been designed to ensure that any purchase or sale of securities by the Fund from or to another fund or portfolio that is or could be considered an affiliate by virtue of having a common investment adviser (or affiliated investment advisers), common Trustees and/or common officers complies with Rule 17a-7 of the 1940 Act. Further, as defined under the procedures, each transaction is effected at the current market price. Pursuant to these procedures, for the year ended December 31, 2012, the Fund engaged in securities purchases of $1,708,754 and securities sales of $39,559,758, which resulted in net realized gains of $6,265,479.
NOTE 5—Expense Offset Arrangement(s)
The expense offset arrangement is comprised of transfer agency credits which result from balances in Demand Deposit Accounts (DDA) used by the transfer agent for clearing shareholder transactions. For the year ended December 31, 2012, the Fund received credits from this arrangement, which resulted in the reduction of the Fund’s total expenses of $2,360.
NOTE 6—Trustees’ and Officers’ Fees and Benefits
“Trustees’ and Officers’ Fees and Benefits” include amounts accrued by the Fund to pay remuneration to certain Trustees and Officers of the Fund. Trustees have the option to defer compensation payable by the Fund, and “Trustees’ and Officers’ Fees and Benefits” also include amounts accrued by the Fund to fund such deferred compensation amounts. Those Trustees who defer compensation have the option to select various Invesco Funds in which their deferral accounts shall be deemed to be invested. Finally, certain current Trustees are eligible to participate in a retirement plan that provides for benefits to be paid upon retirement to Trustees over a period of time based on the number of years of service. The Fund may have certain former Trustees who also participate in a retirement plan and receive benefits under such plan. “Trustees’ and Officers’ Fees and Benefits” include amounts accrued by the Fund to fund such retirement benefits. Obligations under the deferred compensation and retirement plans represent unsecured claims against the general assets of the Fund.
NOTE 7—Cash Balances
The Fund is permitted to temporarily carry a negative or overdrawn balance in its account with State Street Bank and Trust Company, the custodian bank. Such balances, if any at period end, are shown in the Statement of Assets and Liabilities under the payable caption Amount due custodian. To compensate the custodian bank for such overdrafts, the overdrawn Fund may either (1) leave funds as a compensating balance in the account so the custodian bank can be compensated by earning the additional interest; or (2) compensate by paying the custodian bank at a rate agreed upon by the custodian bank and Invesco, not to exceed the contractually agreed upon rate.
18 Invesco Small Cap Growth Fund
NOTE 8—Distributions to Shareholders and Tax Components of Net Assets
Tax Character of Distributions to Shareholders Paid During the Years Ended December 31, 2012 and 2011:
| 2012 | 2011 | |||||||
Ordinary income | $ | 19,847,599 | $ | — | ||||
Long-term capital gain | 125,947,996 | 30,301,467 | ||||||
Total distributions | $ | 145,795,595 | $ | 30,301,467 | ||||
Tax Components of Net Assets at Period-End:
| 2012 | ||||
Undistributed ordinary income | $ | 1,878,566 | ||
Undistributed long-term gain | 5,752,478 | |||
Net unrealized appreciation — investments | 439,805,139 | |||
Temporary book/tax differences | (301,416 | ) | ||
Late-Year ordinary loss deferrals | (202,909 | ) | ||
Shares of beneficial interest | 1,296,824,964 | |||
Total net assets | $ | 1,743,756,822 | ||
The difference between book-basis and tax-basis unrealized appreciation is due to differences in the timing of recognition of gains and losses on investments for tax and book purposes. The Fund’s net unrealized appreciation difference is attributable primarily to wash sales.
The temporary book/tax differences are a result of timing differences between book and tax recognition of income and/or expenses. The Fund’s temporary book/tax differences are the result of the trustee deferral of compensation and retirement plan benefits.
Capital loss carryforward is calculated and reported as of a specific date. Results of transactions and other activity after that date may affect the amount of capital loss carryforward actually available for the Trust to utilize. The Regulated Investment Company Modernization Act of 2010 (the “Act”) eliminated the eight-year carryover period for capital losses that arise in taxable years beginning after its enactment date of December 22, 2010. Consequently, these capital losses can be carried forward for an unlimited period. However, capital losses with an expiration period may not be used to offset capital gains until all net capital losses without an expiration date have been utilized. Additionally, post-enactment capital loss carryovers will retain their character as either short-term or long-term capital losses instead of as short-term capital losses as under prior law. The ability to utilize capital loss carryforward in the future may be limited under the Internal Revenue Code and related regulations based on the results of future transactions.
The Fund does not have a capital loss carryforward at period-end.
On January 26, 2012, 48,363 of Class A shares and 731,338 of Class R5 shares valued at $1,436,878 and $22,949,390 respectively, were redeemed by a significant shareholder and settled through a redemption-in-kind transaction, which resulted in a realized gain of $8,355,789 to the Fund for book purposes. From a federal income tax perspective, the realized gains are not recognized.
NOTE 9—Investment Securities
The aggregate amount of investment securities (other than short-term securities, U.S. Treasury obligations and money market funds, if any) purchased and sold by the Fund during the year ended December 31, 2012 was $418,512,956 and $631,257,325, respectively. Cost of investments on a tax basis includes the adjustments for financial reporting purposes as of the most recently completed federal income tax reporting period-end.
| Unrealized Appreciation (Depreciation) of Investment Securities on a Tax Basis | ||||
Aggregate unrealized appreciation of investment securities | $ | 489,409,065 | ||
Aggregate unrealized (depreciation) of investment securities | (49,603,926 | ) | ||
Net unrealized appreciation of investment securities | $ | 439,805,139 | ||
Cost of investments for tax purposes is $1,349,848,933.
NOTE 10—Reclassification of Permanent Differences
Primarily as a result of differing book/tax treatment of redemption-in-kind, on December 31, 2012, undistributed net investment income was increased by $7,409, undistributed net realized gain was decreased by $8,325,812 and shares of beneficial interest was increased by $8,318,403. This reclassification had no effect on the net assets of the Fund.
19 Invesco Small Cap Growth Fund
NOTE 11—Share Information
| Summary of Share Activity | ||||||||||||||||
| Years ended December 31, | ||||||||||||||||
| 2012(a) | 2011 | |||||||||||||||
| Shares | Amount | Shares | Amount | |||||||||||||
Sold: | ||||||||||||||||
Class A | 3,909,047 | $ | 119,656,929 | 7,873,328 | $ | 235,687,610 | ||||||||||
Class B | 9,769 | 254,570 | 22,773 | 583,128 | ||||||||||||
Class C | 67,382 | 1,749,224 | 108,526 | 2,755,865 | ||||||||||||
Class R | 1,195,764 | 35,244,470 | 1,542,217 | 44,436,875 | ||||||||||||
Class Y | 892,483 | 26,947,342 | 117,275 | 3,525,468 | ||||||||||||
Investor Class | 906,168 | 28,664,060 | 1,458,873 | 44,972,918 | ||||||||||||
Class R5 | 6,710,902 | 219,364,877 | 6,690,660 | 208,159,275 | ||||||||||||
Class R6(b) | 293 | 10,000 | — | — | ||||||||||||
Issued as reinvestment of dividends: | ||||||||||||||||
Class A | 2,223,313 | 65,209,759 | 557,155 | 15,633,752 | ||||||||||||
Class B | 23,353 | 568,885 | 6,942 | 165,847 | ||||||||||||
Class C | 70,751 | 1,721,373 | 16,067 | 383,208 | ||||||||||||
Class R | 271,196 | 7,677,553 | 49,790 | 1,355,771 | ||||||||||||
Class Y | 35,219 | 1,044,246 | 5,070 | 143,392 | ||||||||||||
Investor Class | 588,161 | 17,780,113 | 129,262 | 3,729,198 | ||||||||||||
Class R5 | 1,547,474 | 48,281,192 | 277,369 | 8,218,459 | ||||||||||||
Automatic conversion of Class B shares to Class A shares: | ||||||||||||||||
Class A | 67,972 | 2,097,627 | 96,875 | 2,871,390 | ||||||||||||
Class B | (80,313 | ) | (2,097,627 | ) | (112,993 | ) | (2,871,390 | ) | ||||||||
Reacquired: | ||||||||||||||||
Class A | (10,579,510 | ) | (325,993,434 | ) | (11,236,451 | ) | (326,226,260 | ) | ||||||||
Class B | (44,311 | ) | (1,157,507 | ) | (91,651 | ) | (2,343,674 | ) | ||||||||
Class C | (186,106 | ) | (4,853,636 | ) | (230,059 | ) | (5,826,408 | ) | ||||||||
Class R | (1,071,663 | ) | (31,835,565 | ) | (1,385,475 | ) | (39,082,267 | ) | ||||||||
Class Y | (76,666 | ) | (2,378,202 | ) | (49,396 | ) | (1,445,499 | ) | ||||||||
Investor Class | (2,057,503 | ) | (64,499,451 | ) | (2,099,996 | ) | (63,869,087 | ) | ||||||||
Class R5 | (5,938,231 | ) | (191,944,355 | ) | (4,070,681 | ) | (125,744,016 | ) | ||||||||
Net increase (decrease) in share activity | (1,515,056 | ) | $ | (48,487,557 | ) | (324,520 | ) | $ | 5,213,555 | |||||||
| (a) | There are entities that are record owners of more than 5% of the outstanding shares of the Fund and in the aggregate own 29% of the outstanding shares of the Fund. IDI has an agreement with these entities to sell Fund shares. The Fund, Invesco and/or Invesco affiliates may make payments to these entities, which are considered to be related to the Fund, for providing services to the Fund, Invesco and/or Invesco affiliates including but not limited to services such as securities brokerage, distribution, third party record keeping and account servicing. The Fund has no knowledge as to whether all or any portion of the shares owned of record by these entities are also owned beneficially. |
| (b) | Commencement date of September 24, 2012. |
20 Invesco Small Cap Growth Fund
NOTE 12—Financial Highlights
The following schedule presents financial highlights for a share of the Fund outstanding throughout the periods indicated.
| Net asset value, beginning of period | Net investment income (loss)(a) | Net gains (losses) on securities (both realized and unrealized) | Total from investment operations | Dividends from net investment income | Distributions from net realized gains | Total distributions | Net asset value, end of period | Total return(b) | Net assets, end of period (000’s omitted) | Ratio of expenses to average net assets with fee waivers and/or expenses absorbed | Ratio of expenses to average net assets without fee waivers and/or expenses absorbed | Ratio of net investment income (loss) to average net assets | Portfolio turnover(c) | |||||||||||||||||||||||||||||||||||||||||||
Class A |
| |||||||||||||||||||||||||||||||||||||||||||||||||||||||
Year ended 12/31/12 | $ | 27.71 | $ | 0.01 | (d) | $ | 5.01 | $ | 5.02 | $ | — | $ | (2.73 | ) | $ | (2.73 | ) | $ | 30.00 | 18.35 | % | $ | 766,787 | 1.23 | %(e) | 1.23 | %(e) | 0.04 | %(d)(e) | 24 | % | |||||||||||||||||||||||||
Year ended 12/31/11 | 28.59 | (0.19 | ) | (0.17 | ) | (0.36 | ) | — | (0.52 | ) | (0.52 | ) | 27.71 | (1.27 | ) | 829,696 | 1.27 | 1.27 | (0.65 | ) | 38 | |||||||||||||||||||||||||||||||||||
Year ended 12/31/10 | 22.64 | (0.15 | ) | 6.10 | 5.95 | — | — | — | 28.59 | 26.28 | 933,268 | 1.25 | 1.25 | (0.62 | ) | 38 | ||||||||||||||||||||||||||||||||||||||||
Year ended 12/31/09 | 16.83 | (0.05 | ) | 5.86 | 5.81 | — | — | — | 22.64 | 34.52 | 777,780 | 1.31 | 1.31 | (0.25 | ) | 36 | ||||||||||||||||||||||||||||||||||||||||
Year ended 12/31/08 | 29.00 | (0.13 | ) | (11.16 | ) | (11.29 | ) | — | (0.88 | ) | (0.88 | ) | 16.83 | (38.77 | ) | 630,729 | 1.28 | 1.28 | (0.56 | ) | 29 | |||||||||||||||||||||||||||||||||||
Class B |
| |||||||||||||||||||||||||||||||||||||||||||||||||||||||
Year ended 12/31/12 | 23.58 | (0.18 | )(d) | 4.23 | 4.05 | — | (2.73 | ) | (2.73 | ) | 24.90 | 17.44 | 5,717 | 1.98 | (e) | 1.98 | (e) | (0.71 | )(d)(e) | 24 | ||||||||||||||||||||||||||||||||||||
Year ended 12/31/11 | 24.59 | (0.36 | ) | (0.13 | ) | (0.49 | ) | — | (0.52 | ) | (0.52 | ) | 23.58 | (2.01 | ) | 7,572 | 2.02 | 2.02 | (1.40 | ) | 38 | |||||||||||||||||||||||||||||||||||
Year ended 12/31/10 | 19.62 | (0.28 | ) | 5.25 | 4.97 | — | — | — | 24.59 | 25.33 | 12,195 | 2.00 | 2.00 | (1.37 | ) | 38 | ||||||||||||||||||||||||||||||||||||||||
Year ended 12/31/09 | 14.70 | (0.16 | ) | 5.08 | 4.92 | — | — | — | 19.62 | 33.47 | 21,853 | 2.06 | 2.06 | (1.00 | ) | 36 | ||||||||||||||||||||||||||||||||||||||||
Year ended 12/31/08 | 25.71 | (0.28 | ) | (9.85 | ) | (10.13 | ) | — | (0.88 | ) | (0.88 | ) | 14.70 | (39.22 | ) | 25,347 | 2.03 | 2.03 | (1.31 | ) | 29 | |||||||||||||||||||||||||||||||||||
Class C |
| |||||||||||||||||||||||||||||||||||||||||||||||||||||||
Year ended 12/31/12 | 23.55 | (0.18 | )(d) | 4.23 | 4.05 | — | (2.73 | ) | (2.73 | ) | 24.87 | 17.46 | 17,657 | 1.98 | (e) | 1.98 | (e) | (0.71 | )(d)(e) | 24 | ||||||||||||||||||||||||||||||||||||
Year ended 12/31/11 | 24.56 | (0.36 | ) | (0.13 | ) | (0.49 | ) | — | (0.52 | ) | (0.52 | ) | 23.55 | (2.01 | ) | 17,851 | 2.02 | 2.02 | (1.40 | ) | 38 | |||||||||||||||||||||||||||||||||||
Year ended 12/31/10 | 19.59 | (0.28 | ) | 5.25 | 4.97 | — | — | — | 24.56 | 25.37 | 21,201 | 2.00 | 2.00 | (1.37 | ) | 38 | ||||||||||||||||||||||||||||||||||||||||
Year ended 12/31/09 | 14.69 | (0.16 | ) | 5.06 | 4.90 | — | — | — | 19.59 | 33.36 | 18,541 | 2.06 | 2.06 | (1.00 | ) | 36 | ||||||||||||||||||||||||||||||||||||||||
Year ended 12/31/08 | 25.69 | (0.28 | ) | (9.84 | ) | (10.12 | ) | — | (0.88 | ) | (0.88 | ) | 14.69 | (39.21 | ) | 14,889 | 2.03 | 2.03 | (1.31 | ) | 29 | |||||||||||||||||||||||||||||||||||
Class R |
| |||||||||||||||||||||||||||||||||||||||||||||||||||||||
Year ended 12/31/12 | 26.89 | (0.06 | )(d) | 4.85 | 4.79 | — | (2.73 | ) | (2.73 | ) | 28.95 | 18.05 | 87,606 | 1.48 | (e) | 1.48 | (e) | (0.21 | )(d)(e) | 24 | ||||||||||||||||||||||||||||||||||||
Year ended 12/31/11 | 27.83 | (0.26 | ) | (0.16 | ) | (0.42 | ) | — | (0.52 | ) | (0.52 | ) | 26.89 | (1.52 | ) | 70,749 | 1.52 | 1.52 | (0.90 | ) | 38 | |||||||||||||||||||||||||||||||||||
Year ended 12/31/10 | 22.09 | (0.20 | ) | 5.94 | 5.74 | — | — | — | 27.83 | 25.98 | 67,464 | 1.50 | 1.50 | (0.87 | ) | 38 | ||||||||||||||||||||||||||||||||||||||||
Year ended 12/31/09 | 16.47 | (0.09 | ) | 5.71 | 5.62 | — | — | — | 22.09 | 34.12 | 43,786 | 1.56 | 1.56 | (0.50 | ) | 36 | ||||||||||||||||||||||||||||||||||||||||
Year ended 12/31/08 | 28.48 | (0.19 | ) | (10.94 | ) | (11.13 | ) | — | (0.88 | ) | (0.88 | ) | 16.47 | (38.91 | ) | 27,218 | 1.53 | 1.53 | (0.81 | ) | 29 | |||||||||||||||||||||||||||||||||||
Class Y |
| |||||||||||||||||||||||||||||||||||||||||||||||||||||||
Year ended 12/31/12 | 27.93 | 0.09 | (d) | 5.05 | 5.14 | (0.01 | ) | (2.73 | ) | (2.74 | ) | 30.33 | 18.64 | 34,616 | 0.98 | (e) | 0.98 | (e) | 0.29 | (d)(e) | 24 | |||||||||||||||||||||||||||||||||||
Year ended 12/31/11 | 28.73 | (0.12 | ) | (0.16 | ) | (0.28 | ) | — | (0.52 | ) | (0.52 | ) | 27.93 | (0.99 | ) | 8,108 | 1.02 | 1.02 | (0.40 | ) | 38 | |||||||||||||||||||||||||||||||||||
Year ended 12/31/10 | 22.70 | (0.09 | ) | 6.12 | 6.03 | — | — | — | 28.73 | 26.56 | 6,245 | 1.00 | 1.00 | (0.37 | ) | 38 | ||||||||||||||||||||||||||||||||||||||||
Year ended 12/31/09 | 16.84 | – | 5.86 | 5.86 | — | — | — | 22.70 | 34.80 | 4,744 | 1.06 | 1.06 | — | 36 | ||||||||||||||||||||||||||||||||||||||||||
Year ended 12/31/08(f) | 21.87 | (0.02 | ) | (4.13 | ) | (4.15 | ) | — | (0.88 | ) | (0.88 | ) | 16.84 | (18.76 | ) | 2,136 | 1.10 | (g) | 1.11 | (g) | (0.38 | )(g) | 29 | |||||||||||||||||||||||||||||||||
Investor Class |
| |||||||||||||||||||||||||||||||||||||||||||||||||||||||
Year ended 12/31/12 | 28.49 | 0.01 | (d) | 5.15 | 5.16 | — | (2.73 | ) | (2.73 | ) | 30.92 | 18.34 | 209,842 | 1.23 | (e) | 1.23 | (e) | 0.04 | (d)(e) | 24 | ||||||||||||||||||||||||||||||||||||
Year ended 12/31/11 | 29.37 | (0.20 | ) | (0.16 | ) | (0.36 | ) | — | (0.52 | ) | (0.52 | ) | 28.49 | (1.24 | ) | 209,381 | 1.27 | 1.27 | (0.65 | ) | 38 | |||||||||||||||||||||||||||||||||||
Year ended 12/31/10 | 23.26 | (0.15 | ) | 6.26 | 6.11 | — | — | — | 29.37 | 26.27 | 230,909 | 1.25 | 1.25 | (0.62 | ) | 38 | ||||||||||||||||||||||||||||||||||||||||
Year ended 12/31/09 | 17.30 | (0.05 | ) | 6.01 | 5.96 | — | — | — | 23.26 | 34.45 | 175,672 | 1.31 | 1.31 | (0.25 | ) | 36 | ||||||||||||||||||||||||||||||||||||||||
Year ended 12/31/08 | 29.76 | (0.14 | ) | (11.44 | ) | (11.58 | ) | — | (0.88 | ) | (0.88 | ) | 17.30 | (38.75 | ) | 149,594 | 1.28 | 1.28 | (0.56 | ) | 29 | |||||||||||||||||||||||||||||||||||
Class R5 |
| |||||||||||||||||||||||||||||||||||||||||||||||||||||||
Year ended 12/31/12 | 29.27 | 0.14 | (d) | 5.29 | 5.43 | (0.05 | ) | (2.73 | ) | (2.78 | ) | 31.92 | 18.77 | 621,522 | 0.83 | (e) | 0.83 | (e) | 0.44 | (d)(e) | 24 | |||||||||||||||||||||||||||||||||||
Year ended 12/31/11 | 30.03 | (0.06 | ) | (0.18 | ) | (0.24 | ) | — | (0.52 | ) | (0.52 | ) | 29.27 | (0.81 | ) | 501,895 | 0.83 | 0.83 | (0.21 | ) | 38 | |||||||||||||||||||||||||||||||||||
Year ended 12/31/10 | 23.68 | (0.05 | ) | 6.40 | 6.35 | — | — | — | 30.03 | 26.82 | 427,893 | 0.82 | 0.82 | (0.19 | ) | 38 | ||||||||||||||||||||||||||||||||||||||||
Year ended 12/31/09 | 17.52 | 0.04 | 6.12 | 6.16 | — | — | — | 23.68 | 35.16 | 241,589 | 0.85 | 0.85 | 0.21 | 36 | ||||||||||||||||||||||||||||||||||||||||||
Year ended 12/31/08 | 30.01 | (0.03 | ) | (11.58 | ) | (11.61 | ) | — | (0.88 | ) | (0.88 | ) | 17.52 | (38.53 | ) | 133,585 | 0.86 | 0.86 | (0.14 | ) | 29 | |||||||||||||||||||||||||||||||||||
Class R6 |
| |||||||||||||||||||||||||||||||||||||||||||||||||||||||
Year ended 12/31/12(f) | 34.10 | 0.05 | (d) | 0.56 | 0.61 | (0.06 | ) | (2.73 | ) | (2.79 | ) | 31.92 | 1.97 | 9 | 0.75 | (e)(g) | 0.75 | (e)(g) | 0.52 | (d)(e)(g) | 24 | |||||||||||||||||||||||||||||||||||
| (a) | Calculated using average shares outstanding. |
| (b) | Includes adjustments in accordance with accounting principles generally accepted in the United States of America and as such, the net asset value for financial reporting purposes and the returns based upon those net asset values may differ from the net asset value and returns for shareholder transactions. Does not include sales charges and is not annualized for periods less than one year, if applicable. |
| (c) | Portfolio turnover is calculated at the fund level and is not annualized for periods less than one year, if applicable. |
| (d) | Net investment income (loss) per share and the ratio of net investment income (loss) to average net assets includes special cash dividends received during the period. Net investment income (loss) per share and the ratio of net investment income (loss) to average net assets excluding the special dividends are $(0.12) and (0.39)%, $(0.29) and (1.14)%, $(0.29) and (1.14)%, $(0.19) and (0.64)%, $(0.04) and (0.14)%, $(0.12) and (0.39)%, $0.01 and 0.01% and $0.01 and 0.09% for Class A, Class B, Class C, Class R, Class Y, Investor Class, Class R5 and Class R6 shares, respectively. |
| (e) | Ratios are based on average daily net assets (000’s) of $829,211, $6,802, $18,349, $86,747, $12,555, $221,043, $581,154 and $10 for Class A, Class B, Class C, Class R, Class Y, Investor Class, Class R5 and Class R6 shares, respectively. |
| (f) | Commencement date of October 3, 2008 and September 24, 2012 for Class Y shares and Class R6 shares, respectively. |
| (g) | Annualized. |
21 Invesco Small Cap Growth Fund
Report of Independent Registered Public Accounting Firm
To the Board of Trustees of AIM Growth Series (Invesco Growth Series)
and Shareholders of Invesco Small Cap Growth Fund:
In our opinion, the accompanying statement of assets and liabilities, including the schedule of investments, and the related statements of operations and of changes in net assets and the financial highlights present fairly, in all material respects, the financial position of Invesco Small Cap Growth Fund (one of the funds constituting AIM Growth Series (Invesco Growth Series), hereafter referred to as the “Fund”) at December 31, 2012, the results of its operations for the year then ended, the changes in its net assets for each of the two years in the period then ended and the financial highlights for each of the five years in the period then ended, in conformity with accounting principles generally accepted in the United States of America. These financial statements and financial highlights (hereafter referred to as “financial statements”) are the responsibility of the Fund’s management; our responsibility is to express an opinion on these financial statements based on our audits. We conducted our audits of these financial statements in accordance with the standards of the Public Company Accounting Oversight Board (United States). Those standards require that we plan and perform the audit to obtain reasonable assurance about whether the financial statements are free of material misstatement. An audit includes examining, on a test basis, evidence supporting the amounts and disclosures in the financial statements, assessing the accounting principles used and significant estimates made by management, and evaluating the overall financial statement presentation. We believe that our audits, which included confirmation of securities at December 31, 2012 by correspondence with the custodian and brokers, provide a reasonable basis for our opinion.
PRICEWATERHOUSECOOPERS LLP
February 25, 2013
Houston, Texas
22 Invesco Small Cap Growth Fund
Calculating your ongoing Fund expenses
Example
As a shareholder of the Fund, you incur two types of costs: (1) transaction costs, which may include sales charges (loads) on purchase payments or contingent deferred sales charges on redemptions, and redemption fees, if any; and (2) ongoing costs, including management fees, distribution and/or service (12b-1) fees, and other Fund expenses. This example is intended to help you understand your ongoing costs (in dollars) of investing in the Fund and to compare these costs with ongoing costs of investing in other mutual funds. With the exception of the actual ending account value and expenses of the Class R6 shares, the example is based on an investment of $1,000 invested at the beginning of the period and held for the entire period July 1, 2012 through December 31, 2012. The actual ending account value and expenses of the Class R6 shares in the example below are based on an investment of $1,000 invested as of close of business September 24, 2012 (commencement date) and held through December 31, 2012.
Actual expenses
The table below provides information about actual account values and actual expenses. You may use the information in this table, together with the amount you invested, to estimate the expenses that you paid over the period. Simply divide your account value by $1,000 (for example, an $8,600 account value divided by $1,000 = 8.6), then multiply the result by the number in the table under the heading entitled “Actual Expenses Paid During Period” to estimate the expenses you paid on your account during this period (as of close of business September 24, 2012 through December 31, 2012 for the Class R6 shares). Because the actual ending account value and expense information in the example is not based upon a six month period for the Class R6 shares, the ending account value and expense information may not provide a meaningful comparison to mutual funds that provide such information for a full six month period.
Hypothetical example for comparison purposes
The table below also provides information about hypothetical account values and hypothetical expenses based on the Fund’s actual expense ratio and an assumed rate of return of 5% per year before expenses, which is not the Fund’s actual return.
The hypothetical account values and expenses may not be used to estimate the actual ending account balance or expenses you paid for the period. You may use this information to compare the ongoing costs of investing in the Fund and other funds. To do so, compare this 5% hypothetical example with the 5% hypothetical examples that appear in the shareholder reports of the other funds.
Please note that the expenses shown in the table are meant to highlight your ongoing costs only and do not reflect any transaction costs, such as sales charges (loads) on purchase payments, contingent deferred sales charges on redemptions, and redemption fees, if any. Therefore, the hypothetical information is useful in comparing ongoing costs only, and will not help you determine the relative total costs of owning different funds. In addition, if these transaction costs were included, your costs would have been higher.
| Class | Beginning Account Value (07/01/12) | ACTUAL | HYPOTHETICAL (5% annual return before expenses) | Annualized Expense Ratio | ||||||||||||||||||||
| Ending Account Value (12/31/12)1 | Expenses Paid During Period2 | Ending Account Value (12/31/12) | Expenses Paid During Period3 | |||||||||||||||||||||
A | $ | 1,000.00 | $ | 1,085.90 | $ | 6.50 | $ | 1,018.90 | $ | 6.29 | 1.24 | % | ||||||||||||
B | 1,000.00 | 1,081.30 | 10.41 | 1,015.13 | 10.08 | 1.99 | ||||||||||||||||||
C | 1,000.00 | 1,081.40 | 10.41 | 1,015.13 | 10.08 | 1.99 | ||||||||||||||||||
R | 1,000.00 | 1,084.50 | 7.81 | 1,017.65 | 7.56 | 1.49 | ||||||||||||||||||
Y | 1,000.00 | 1,087.10 | 5.19 | 1,020.16 | 5.03 | 0.99 | ||||||||||||||||||
Investor | 1,000.00 | 1,085.80 | 6.50 | 1,018.90 | 6.29 | 1.24 | ||||||||||||||||||
R5 | 1,000.00 | 1,087.70 | 4.46 | 1,020.86 | 4.32 | 0.85 | ||||||||||||||||||
R6 | 1,000.00 | 1,019.70 | 2.05 | 1,021.37 | 3.81 | 0.75 | ||||||||||||||||||
| 1 | The actual ending account value is based on the actual total return of the Fund for the period July 1, 2012, through December 31, 2012 (as of close of business September 24, 2012, through December 31, 2012 for the Class R6 shares), after actual expenses and will differ from the hypothetical ending account value which is based on the Fund’s expense ratio and a hypothetical annual return of 5% before expenses. |
| 2 | Actual expenses are equal to the Fund’s annualized expense ratio as indicated above multiplied by the average account value over the period, multiplied by 184/366 to reflect the most recent fiscal half year. For the Class R6 shares actual expenses are equal to the annualized expense ratio indicated above multiplied by the average account value over the period, multiplied by 99 (as of close of business September 24, 2012, through December 31, 2012)/366. Because the Class R6 shares have not been in existence for a full six month period, the actual ending account value and expense information shown may not provide a meaningful comparison to fund expense information of classes that show such data for a full six month period and, because the actual ending account value and expense information in the expense example covers a short time period, return and expense data may not be indicative of return and expense data for longer time periods. |
| 3 | Hypothetical expenses are equal to the annualized expense ratio indicated above multiplied by the average account value over the period, multiplied by 184/366 to reflect a one-half year period. The hypothetical ending account value and expenses may be used to compare ongoing costs of investing in Class R6 shares of the Fund and other funds because such data is based on a full six month period. |
23 Invesco Small Cap Growth Fund
Tax Information
Form 1099-DIV, Form 1042-S and other year–end tax information provide shareholders with actual calendar year amounts that should be included in their tax returns. Shareholders should consult their tax advisors.
The following distribution information is being provided as required by the Internal Revenue Code or to meet a specific state’s requirement.
The Fund designates the following amounts or, if subsequently determined to be different, the maximum amount allowable for its fiscal year ended December 31, 2012:
Federal and State Income Tax | ||||
Long-Term Capital Gain Distributions | $ | 125,947,996 | ||
Qualified Dividend Income* | 81 | % | ||
Corporate Dividends Received Deduction* | 81 | % | ||
| * | The above percentages are based on ordinary income dividends paid to shareholders during the Fund’s fiscal year. |
24 Invesco Small Cap Growth Fund
Trustees and Officers
The address of each trustee and officer is AIM Growth Series (Invesco Growth Series) (the “Trust”), 11 Greenway Plaza, Suite 1000, Houston, Texas 77046-1173. The trustees serve for the life of the Trust, subject to their earlier death, incapacitation, resignation, retirement or removal as more specifically provided in the Trust’s organizational documents. Each officer serves for a one year term or until their successors are elected and qualified. Column two below includes length of time served with predecessor entities, if any.
| Name, Year of Birth and Position(s) Held with the Trust | Trustee and/ or Officer Since | Principal Occupation(s) During Past 5 Years | Number of Funds in Fund Complex Overseen by Trustee | Other Directorship(s) Held by Trustee During Past 5 Years | ||||
| Interested Persons | ||||||||
| Martin L. Flanagan1 — 1960 Trustee | 2007 | Executive Director, Chief Executive Officer and President, Invesco Ltd. (ultimate parent of Invesco and a global investment management firm); Advisor to the Board, Invesco Advisers, Inc. (formerly known as Invesco Institutional (N.A.), Inc.); Trustee, The Invesco Funds; Vice Chair, Investment Company Institute; and Member of Executive Board, SMU Cox School of Business
Formerly: Chairman and Chief Executive Officer, Invesco Advisers, Inc. (registered investment adviser); Director, Chairman, Chief Executive Officer and President, IVZ Inc. (holding company), INVESCO Group Services, Inc. (service provider) and Invesco North American Holdings, Inc. (holding company); Director, Chief Executive Officer and President, Invesco Holding Company Limited (parent of Invesco and a global investment management firm); Director, Invesco Ltd.; Chairman, Investment Company Institute and President, Co-Chief Executive Officer, Co-President, Chief Operating Officer and Chief Financial Officer, Franklin Resources, Inc. (global investment management organization) | 124 | None | ||||
Philip A. Taylor2 — 1954 Trustee, President and Principal Executive Officer | 2006 | Head of North American Retail and Senior Managing Director, Invesco Ltd.; Director, Co-Chairman, Co-President and Co-Chief Executive Officer, Invesco Advisers, Inc. (formerly known as Invesco Institutional (N.A.), Inc.) (registered investment adviser); Director, Chairman, Chief Executive Officer and President, Invesco Management Group, Inc. (formerly known as Invesco Aim Management Group, Inc.) (financial services holding company); Director and President, INVESCO Funds Group, Inc. (registered investment adviser and registered transfer agent); Director and Chairman, Invesco Investment Services, Inc. (formerly known as Invesco Aim Investment Services, Inc.) (registered transfer agent) and IVZ Distributors, Inc. (formerly known as INVESCO Distributors, Inc.) (registered broker dealer); Director, President and Chairman, Invesco Inc. (holding company) and Invesco Canada Holdings Inc. (holding company); Chief Executive Officer, Invesco Corporate Class Inc. (corporate mutual fund company) and Invesco Canada Fund Inc. (corporate mutual fund company); Director, Chairman and Chief Executive Officer, Invesco Canada Ltd. (formerly known as Invesco Trimark Ltd./Invesco Trimark Ltèe) (registered investment adviser and registered transfer agent); Trustee, President and Principal Executive Officer, The Invesco Funds (other than AIM Treasurer’s Series Trust (Invesco Treasurer’s Series Trust) and Short-Term Investments Trust); Trustee and Executive Vice President, The Invesco Funds (AIM Treasurer’s Series Trust (Invesco Treasurer’s Series Trust) and Short-Term Investments Trust only); Director, Invesco Investment Advisers LLC (formerly known as Van Kampen Asset Management); Director, Chief Executive Officer and President, Van Kampen Exchange Corp.
Formerly: Director and Chairman, Van Kampen Investor Services Inc.: Director, Chief Executive Officer and President, 1371 Preferred Inc. (holding company); and Van Kampen Investments Inc.; Director and President, AIM GP Canada Inc. (general partner for limited partnerships); and Van Kampen Advisors, Inc.; Director and Chief Executive Officer, Invesco Trimark Dealer Inc. (registered broker dealer); Director, Invesco Distributors, Inc. (formerly known as Invesco Aim Distributors, Inc.) (registered broker dealer); Manager, Invesco PowerShares Capital Management LLC; Director, Chief Executive Officer and President, Invesco Advisers, Inc.; Director, Chairman, Chief Executive Officer and President, Invesco Aim Capital Management, Inc.; President, Invesco Trimark Dealer Inc. and Invesco Trimark Ltd./Invesco Trimark Ltèe; Director and President, AIM Trimark Corporate Class Inc. and AIM Trimark Canada Fund Inc.; Senior Managing Director, Invesco Holding Company Limited; Trustee and Executive Vice President, Tax-Free Investments Trust; Director and Chairman, Fund Management Company (former registered broker dealer); President and Principal Executive Officer, The Invesco Funds (AIM Treasurer’s Series Trust (Invesco Treasurer’s Series Trust), Short-Term Investments Trust and Tax-Free Investments Trust only); President, AIM Trimark Global Fund Inc. and AIM Trimark Canada Fund Inc. | 124 | None | ||||
Wayne W. Whalen3 — 1939 Trustee | 2010 | Of Counsel, and prior to 2010, partner in the law firm of Skadden, Arps, Slate, Meagher & Flom LLP, legal counsel to certain funds in the Fund Complex
| 137 | Director of the Mutual Fund Directors Forum, a nonprofit membership organization for investment directors; Chairman and Director of the Abraham Lincoln Presidential Library Foundation; and Director of the Stevenson Center for Democracy |
| 1 | Mr. Flanagan is considered an interested person of the Trust because he is an officer of the adviser to the Trust, and an officer and a director of Invesco Ltd., ultimate parent of the adviser to the Trust. |
| 2 | Mr. Taylor is considered an interested person of the Trust because he is an officer and a director of the adviser to, and a director of the principal underwriter of, the Trust. |
| 3 | Mr. Whalen is considered an “interested person” (within the meaning of Section 2(a)(19) of the 1940 Act) of certain Funds in the Invesco Fund Complex by reason of he and his firm currently providing legal services as legal counsel to such Funds in the Invesco Fund Complex. |
T-1 Invesco Small Cap Growth Fund
Trustees and Officers—(continued)
| Name, Year of Birth and Position(s) Held with the Trust | Trustee and/ or Officer Since | Principal Occupation(s) During Past 5 Years | Number of Funds in Fund Complex Overseen by Trustee | Other Directorship(s) Held by Trustee During Past 5 Years | ||||
| Independent Trustees | ||||||||
Bruce L. Crockett — 1944 Trustee and Chair | 2001 | Chairman, Crockett Technologies Associates (technology consulting company)
Formerly: Director, Captaris (unified messaging provider); Director, President and Chief Executive Officer COMSAT Corporation; and Chairman, Board of Governors of INTELSAT (international communications company) | 124 | ACE Limited (insurance company); and Investment Company Institute | ||||
David C. Arch — 1945 Trustee | 2010 | Chairman and Chief Executive Officer of Blistex Inc., (consumer health care products manufacturer)
Formerly: Member of the Heartland Alliance Advisory Board, a nonprofit organization serving human needs based in Chicago | 137 | Board member of the Illinois Manufacturers’ Association; Member of the Board of Visitors, Institute for the Humanities, University of Michigan | ||||
Frank S. Bayley — 1939 Trustee | 1985 | Retired
Formerly: Director, Badgley Funds, Inc. (registered investment company) (2 portfolios) and General Partner and Of Counsel, law firm of Baker & McKenzie, LLP | 124 | Director and Chairman, C.D. Stimson Company (a real estate investment company); Trustee and Overseer, The Curtis institute of Music | ||||
James T. Bunch — 1942 Trustee | 2003 | Managing Member, Grumman Hill Group LLC (family office private equity management)
Formerly: Founder, Green, Manning & Bunch Ltd. (investment banking firm)(1988-2010); Executive Committee, United States Golf Association; and Director, Policy Studies, Inc. and Van Gilder Insurance Corporation | 124 | Chairman, Board of Governors, Western Golf Association; Chairman-elect, Evans Scholars Foundation; and Director, Denver Film Society | ||||
Rodney F. Dammeyer — 1940 Trustee | 2010 | Chairman of CAC, LLC, (private company offering capital investment and management advisory services)
Formerly: Prior to 2001, Managing Partner at Equity Group Corporate Investments; Prior to 1995, Vice Chairman of Anixter International; Prior to 1985, experience includes Senior Vice President and Chief Financial Officer of Household International, Inc., Executive Vice President and Chief Financial Officer of Northwest Industries, Inc. and Partner of Arthur Andersen & Co.; From 1987 to 2010, Director/Trustee of investment companies in the Van Kampen Funds complex | 126 | Director of Quidel Corporation and Stericycle, Inc.; Prior to May 2008, Trustee of The Scripps Research Institute; Prior to February 2008, Director of Ventana Medical Systems, Inc.; Prior to April 2007, Director of GATX Corporation; Prior to April 2004, Director of TheraSense, Inc. | ||||
Albert R. Dowden — 1941 Trustee | 2001 | Director of a number of public and private business corporations, including the Boss Group, Ltd. (private investment and management); Reich & Tang Funds (5 portfolios) (registered investment company); and Homeowners of America Holding Corporation/ Homeowners of America Insurance Company (property casualty company)
Formerly: Director, Continental Energy Services, LLC (oil and gas pipeline service); Director, CompuDyne Corporation (provider of product and services to the public security market) and Director, Annuity and Life Re (Holdings), Ltd. (reinsurance company); Director, President and Chief Executive Officer, Volvo Group North America, Inc.; Senior Vice President, AB Volvo; Director of various public and private corporations; Chairman, DHJ Media, Inc.; Director Magellan Insurance Company; and Director, The Hertz Corporation, Genmar Corporation (boat manufacturer), National Media Corporation; Advisory Board of Rotary Power International (designer, manufacturer, and seller of rotary power engines); and Chairman, Cortland Trust, Inc. (registered investment company) | 124 | Director of Nature’s Sunshine Products, Inc. | ||||
Jack M. Fields — 1952 Trustee | 2001 | Chief Executive Officer, Twenty First Century Group, Inc. (government affairs company); Owner and Chief Executive Officer, Dos Angeles Ranch, L.P. (cattle, hunting, corporate entertainment); and Discovery Global Education Fund (non-profit)
Formerly: Chief Executive Officer, Texana Timber LP (sustainable forestry company); Director of Cross Timbers Quail Research Ranch (non-profit); and member of the U.S. House of Representatives | 124 | Insperity, Inc. (formerly known as Administaff) | ||||
Prema Mathai-Davis — 1950 Trustee | 2001 | Retired
Formerly: Chief Executive Officer, YWCA of the U.S.A. | 124 | None | ||||
Larry Soll — 1942 Trustee | 2003 | Retired
Formerly: Chairman, Chief Executive Officer and President, Synergen Corp. (a biotechnology company) | 124 | None | ||||
Hugo F. Sonnenschein — 1940 Trustee | 2010 | Distinguished Service Professor and President Emeritus of the University of Chicago and the Adam Smith Distinguished Service Professor in the Department of Economics at the University of Chicago
Formerly: President of the University of Chicago | 137 | Trustee of the University of Rochester and a member of its investment committee. Member of the National Academy of Sciences, the American Philosophical Society and a fellow of the American Academy of Arts and Sciences |
T-2 Invesco Small Cap Growth Fund
Trustees and Officers—(continued)
| Name, Year of Birth and Position(s) Held with the Trust | Trustee and/ or Officer Since | Principal Occupation(s) During Past 5 Years | Number of Funds in Fund Complex Overseen by Trustee | Other Directorship(s) Held by Trustee During Past 5 Years | ||||
| Independent Trustees—(continued) | ||||||||
Raymond Stickel, Jr. — 1944 Trustee | 2005 | Retired
Formerly: Director, Mainstay VP Series Funds, Inc. (25 portfolios) and Partner, Deloitte & Touche | 124 | None | ||||
| Other Officers | ||||||||
| Russell C. Burk — 1958 Senior Vice President and Senior Officer | 2005 | Senior Vice President and Senior Officer, The Invesco Funds | N/A | N/A | ||||
| John M. Zerr — 1962 Senior Vice President, Chief Legal Officer and Secretary | 2006 | Director, Senior Vice President, Secretary and General Counsel, Invesco Management Group, Inc. (formerly known as Invesco Aim Management Group, Inc.) and Van Kampen Exchange Corp.; Senior Vice President, Invesco Advisers, Inc. (formerly known as Invesco Institutional (N.A.), Inc.) (registered investment adviser); Senior Vice President and Secretary, Invesco Distributors, Inc. (formerly known as Invesco Aim Distributors, Inc.); Director, Vice President and Secretary, Invesco Investment Services, Inc. (formerly known as Invesco Aim Investment Services, Inc.) and IVZ Distributors, Inc. (formerly known as INVESCO Distributors, Inc.); Director and Vice President, INVESCO Funds Group, Inc.; Senior Vice President, Chief Legal Officer and Secretary, The Invesco Funds; Manager, Invesco PowerShares Capital Management LLC; Director, Secretary and General Counsel, Invesco Investment Advisers LLC (formerly known as Van Kampen Asset Management); Secretary and General Counsel, Van Kampen Funds Inc. and Chief Legal Officer, PowerShares Exchange-Traded Fund Trust, PowerShares Exchange-Traded Fund Trust II, PowerShares India Exchange-Traded Fund Trust and PowerShares Actively Managed Exchange-Traded Fund Trust
Formerly: Director and Vice President, Van Kampen Advisors Inc.; Director, Vice President, Secretary and General Counsel Van Kampen Investor Services Inc.; Director, Invesco Distributors, Inc. (formerly known as Invesco Aim Distributors, Inc.); Director, Senior Vice President, General Counsel and Secretary, Invesco Advisers, Inc. and Van Kampen Investments Inc.; Director, Vice President and Secretary, Fund Management Company; Director, Senior Vice President, Secretary, General Counsel and Vice President, Invesco Aim Capital Management, Inc.; Chief Operating Officer and General Counsel, Liberty Ridge Capital, Inc. (an investment adviser); Vice President and Secretary, PBHG Funds (an investment company) and PBHG Insurance Series Fund (an investment company); Chief Operating Officer, General Counsel and Secretary, Old Mutual Investment Partners (a broker-dealer); General Counsel and Secretary, Old Mutual Fund Services (an administrator) and Old Mutual Shareholder Services (a shareholder servicing center); Executive Vice President, General Counsel and Secretary, Old Mutual Capital, Inc. (an investment adviser); and Vice President and Secretary, Old Mutual Advisors Funds (an investment company) | N/A | N/A | ||||
| Karen Dunn Kelley — 1960 Vice President | 2004 | Head of Invesco’s World Wide Fixed Income and Cash Management Group; Senior Vice President, Invesco Management Group, Inc. (formerly known as Invesco Aim Management Group, Inc.) and Invesco Advisers, Inc. (formerly known as Invesco Institutional (N.A.), Inc.) (registered investment adviser); Executive Vice President, Invesco Distributors, Inc. (formerly known as Invesco Aim Distributors, Inc.); Director, Invesco Mortgage Capital Inc., INVESCO Global Asset Management Limited, Invesco Management Company Limited and INVESCO Management S.A.; Vice President, The Invesco Funds (other than AIM Treasurer’s Series Trust (Invesco Treasurer’s Series Trust) and Short-Term Investments Trust); and President and Principal Executive Officer, The Invesco Funds (AIM Treasurer’s Series Trust (Invesco Treasurer’s Series Trust) and Short-Term Investments Trust only)
Formerly: Senior Vice President, Van Kampen Investments Inc.; Vice President, Invesco Advisers, Inc. (formerly known as Invesco Institutional (N.A.), Inc.); Director of Cash Management and Senior Vice President, Invesco Advisers, Inc. and Invesco Aim Capital Management, Inc.; President and Principal Executive Officer, Tax-Free Investments Trust; Director and President, Fund Management Company; Chief Cash Management Officer, Director of Cash Management, Senior Vice President, and Managing Director, Invesco Aim Capital Management, Inc.; Director of Cash Management, Senior Vice President, and Vice President, Invesco Advisers, Inc. and The Invesco Funds (AIM Treasurer’s Series Trust (Invesco Treasurer’s Series Trust), Short-Term Investments Trust and Tax-Free Investments Trust only) | N/A | N/A | ||||
T-3 Invesco Small Cap Growth Fund
Trustees and Officers—(continued)
| Name, Year of Birth and Position(s) Held with the Trust | Trustee and/ or Officer Since | Principal Occupation(s) During Past 5 Years | Number of Funds in Fund Complex Overseen by Trustee | Other Directorship(s) Held by Trustee During Past 5 Years | ||||
| Other Officers—(continued) | ||||||||
| Sheri Morris — 1964 Vice President, Treasurer and Principal Financial Officer | 1999 | Vice President, Treasurer and Principal Financial Officer, The Invesco Funds; Vice President, Invesco Advisers, Inc. (formerly known as Invesco Institutional (N.A.), Inc.) (registered investment adviser); and Vice President, PowerShares Exchange-Traded Fund Trust, PowerShares Exchange-Traded Fund Trust II, PowerShares India Exchange-Traded Fund Trust and PowerShares Actively Managed Exchange-Traded Fund Trust
Formerly: Vice President, Invesco Aim Advisers, Inc., Invesco Aim Capital Management, Inc. and Invesco Aim Private Asset Management, Inc.; Assistant Vice President and Assistant Treasurer, The Invesco Funds and Assistant Vice President, Invesco Advisers, Inc., Invesco Aim Capital Management, Inc. and Invesco Aim Private Asset Management, Inc.; and Treasurer, PowerShares Exchange-Traded Fund Trust, PowerShares Exchange-Traded Fund Trust II, PowerShares India Exchange-Traded Fund Trust and PowerShares Actively Managed Exchange-Traded Fund Trust | N/A | N/A | ||||
Yinka Akinsola — 1977 Anti-Money Laundering Compliance Officer | 2011 | Anti-Money Laundering Compliance Officer, Invesco Advisers, Inc. (formerly known as Invesco Institutional (N.A.), Inc.) (registered investment adviser); Invesco Distributors, Inc. (formerly known as Invesco Aim Distributors, Inc.), Invesco Investment Services, Inc. (formerly known as Invesco Aim Investment Services, Inc.), Invesco Management Group, Inc., The Invesco Funds, Invesco Van Kampen Closed-End Funds, Van Kampen Exchange Corp., Van Kampen Funds Inc., PowerShares Exchange-Traded Fund Trust, PowerShares Exchange-Traded Fund Trust II, PowerShares India Exchange-Traded Fund Trust, and PowerShares Actively Managed Exchange-Traded Fund Trust
Formerly: Regulatory Analyst III, Financial Industry Regulatory Authority (FINRA) | N/A | N/A | ||||
| Todd L. Spillane — 1958 Chief Compliance Officer | 2006 | Senior Vice President, Invesco Management Group, Inc. (formerly known as Invesco Aim Management Group, Inc.) and Van Kampen Exchange Corp.; Senior Vice President and Chief Compliance Officer, Invesco Advisers, Inc. (registered investment adviser) (formerly known as Invesco Institutional (N.A.), Inc.); Chief Compliance Officer, The Invesco Funds; Vice President, Invesco Distributors, Inc. (formerly known as Invesco Aim Distributors, Inc.) and Invesco Investment Services, Inc. (formerly known as Invesco Aim Investment Services, Inc.)
Formerly: Chief Compliance Officer, Invesco Van Kampen Closed-End Funds; Senior Vice President, Van Kampen Investments Inc.; Senior Vice President and Chief Compliance Officer, Invesco Aim Advisers, Inc. and Invesco Aim Capital Management, Inc.; Chief Compliance Officer, INVESCO Private Capital Investments, Inc. (holding company), Invesco Private Capital, Inc. (registered investment adviser), Invesco Global Asset Management (N.A.), Inc., Invesco Senior Secured Management, Inc. (registered investment adviser), Van Kampen Investor Services Inc., PowerShares Exchange-Traded Fund Trust, PowerShares Exchange-Traded Fund Trust II, PowerShares India Exchange-Traded Fund Trust and PowerShares Actively Managed Exchange-Traded Fund Trust; and Vice President, Invesco Aim Capital Management, Inc. and Fund Management Company | N/A | N/A |
The Statement of Additional Information of the Trust includes additional information about the Fund’s Trustees and is available upon request, without charge, by calling 1.800.959.4246. Please refer to the Fund’s prospectus for information on the Fund’s sub-advisers.
Office of the Fund 11 Greenway Plaza, Suite 1000 Houston, TX 77046-1173 | Investment Adviser Invesco Advisers, Inc. 1555 Peachtree Street, N.E. Atlanta, GA 30309 | Distributor Invesco Distributors, Inc. 11 Greenway Plaza, Suite 1000 Houston, TX 77046-1173 | Auditors PricewaterhouseCoopers LLP 1201 Louisiana Street, Suite 2900 Houston, TX 77002-5678 | |||
Counsel to the Fund Stradley Ronon Stevens & Young, LLP 2005 Market Street, Suite 2600 Philadelphia, PA 19103-7018 | Counsel to the Independent Trustees Goodwin Procter LLP 901 New York Avenue, N.W. | Transfer Agent Invesco Investment Services, Inc. 11 Greenway Plaza, Suite 1000 Houston, TX 77046-1173 | Custodian State Street Bank and Trust Company 225 Franklin Street Boston, MA 02110-2801 | |||
T-4 Invesco Small Cap Growth Fund

Invesco mailing information
Send general correspondence to Invesco Investment Services, Inc., P.O. Box 219078, Kansas City, MO 64121-9078.
Invesco privacy policy
You share personal and financial information with us that is necessary for your transactions and your account records. We take very seriously the obligation to keep that information confidential and private.
Invesco collects nonpublic personal information about you from account applications or other forms you complete and from your transactions with us or our affiliates. We do not disclose information about you or our former customers to service providers or other third parties except to the extent necessary to service your account and in other limited circumstances as permitted by law. For example, we use this information to facilitate the delivery of transaction confirmations, financial reports, prospectuses and tax forms.
Even within Invesco, only people involved in the servicing of your accounts and compliance monitoring have access to your information. To ensure the highest level of confidentiality and security, Invesco maintains physical, electronic and procedural safeguards that meet or exceed federal standards. Special measures, such as data encryption and authentication, apply to your communications with us on our website. More detail is available to you at invesco.com/privacy.
Important notice regarding delivery of security holder documents
To reduce Fund expenses, only one copy of most shareholder documents may be mailed to shareholders with multiple accounts at the same address (Householding). Mailing of your shareholder documents may be householded indefinitely unless you instruct us otherwise. If you do not want the mailing of these documents to be combined with those for other members of your household, please contact Invesco Investment Services, Inc. at 800 959 4246 or contact your financial institution. We will begin sending you individual copies for each account within 30 days after receiving your request.
Fund holdings and proxy voting information
The Fund provides a complete list of its holdings four times in each fiscal year, at the quarter-ends. For the second and fourth quarters, the lists appear in the Fund’s semiannual and annual reports to shareholders. For the first and third quarters, the Fund files the lists with the Securities and Exchange Commission (SEC) on Form N-Q. The most recent list of portfolio holdings is available at invesco.com/completeqtrholdings. Shareholders can also look up the Fund’s Forms N-Q on the SEC website at sec.gov. Copies of the Fund’s Forms N-Q may be reviewed and copied at the SEC Public Reference Room in Washington, D.C. You can obtain information on the operation of the Public Reference Room, including information about duplicating fee charges, by calling 202 551 8090 or 800 732 0330, or by electronic request at the following email address: publicinfo@sec.gov. The SEC file numbers for the Fund are shown below.
A description of the policies and procedures that the Fund uses to determine how to vote proxies relating to portfolio securities is available without charge, upon request, from our Client Services department at 800 959 4246 or at invesco.com/proxyguidelines. The information is also available on the SEC website, sec.gov.
Information regarding how the Fund voted proxies related to its portfolio securities during the 12 months ended June 30, 2012, is available at invesco.com/proxysearch. The information is also available on the SEC website, sec.gov. Invesco Advisers, Inc. is an investment adviser; it provides investment advisory services to individual and institutional clients and does not sell securities. Invesco Distributors, Inc. is the US distributor for Invesco Ltd.’s retail mutual funds, exchange-traded funds and institutional money market funds. Both are wholly owned, indirect subsidiaries of Invesco Ltd. |  | |
| SEC file numbers: 811-02699 and 002-57526 SCG-AR-1 Invesco Distributors, Inc. | ||
| ||||
| Annual Report to Shareholders
| December 31, 2012 | ||
| ||||
Invesco Leaders Fund Effective September 24, 2012, Invesco Van Kampen Leaders Fund was renamed Invesco Leaders Fund. | ||||
Nasdaq: A: VLFAX § B: VLFBX § C: VLFCX § Y: VLFIX | ||||


Letters to Shareholders
Philip Taylor | Dear Shareholders: This annual report contains information about your Fund and the factors that affected its performance during the reporting period. Inside, you’ll find a discussion from your portfolio managers about how they managed your Fund, performance data for your Fund, a complete list of your Fund’s investments as of the close of the reporting period and other important information. I hope you find this report of interest. The reporting period covered by this report was challenging. As the year began, investors cheered generally positive economic indicators, and markets generally rose. Soon, however, US economic data turned mixed and investors’ attention shifted to the efforts of eurozone governments to implement new policies intended to reduce debt levels, strengthen the banking system and stimulate economic growth. Later in the year, in the US, mixed economic data, | ||||||||

competing proposals on how to reduce the federal budget deficit and a contentious presidential contest increased investor uncertainty and hindered market performance. Throughout the year, your Fund’s portfolio managers adhered to their long-term investment strategies, and later in this report they explain why your Fund performed as it did during the reporting period.
Adhering to your long-term investment plan can be difficult, particularly during periods of market volatility and economic uncertainty. That’s one reason Invesco suggests investors work with a skilled and trusted financial adviser who is familiar with their financial situation, investment goals and risk tolerance. A good financial adviser can provide insight and perspective when markets are volatile; motivation and reassurance when times are uncertain; and advice and recommendations when your financial situation or investment goals change.
Timely insight and information from many of Invesco’s investment professionals is available at our website, invesco.com/us. We offer in-depth articles, video clips and audio commentaries from many of our portfolio managers and other investment professionals on a wide range of topics of interest to investors. At invesco.com/us, you also can access information about your Invesco account at any time.
What we mean by Intentional Investing
At Invesco, all of our people and all of our resources are dedicated to helping investors achieve their financial objectives. It’s a philosophy we call Intentional Investing®, and it guides the way we:
| n | Manage investments – Our dedicated investment professionals search the world for the best opportunities, and each investment team follows a clear, disciplined process to build portfolios and mitigate risk. |
| n | Provide choices – We offer equity, fixed income, asset allocation and alternative strategies so you and your financial adviser can build an investment portfolio designed for your individual needs and goals. |
| n | Connect with you – We’re committed to giving you the expert insights you need to make informed investing decisions, and we are well-equipped to provide high-quality support for investors and advisers. |
Invesco believes in putting investors first, and that’s why investment management is all we do. Our sole focus on managing your money allows your financial adviser to build a portfolio of Invesco funds appropriate for your investment needs and goals now and when your circumstances change.
Have a question?
If you have a question about your account, please contact an Invesco client services representative at 800 959 4246. If you have an Invesco-related question or comment, feel free to email me directly at phil@invesco.com.
All of us at Invesco look forward to serving your investment management needs for many years to come. Thank you for investing with us.
Sincerely,

Philip Taylor
Senior Managing Director, Invesco Ltd.
2 Invesco Leaders Fund
Bruce Crockett | Dear Fellow Shareholders: While short-term challenges for the financial markets regularly come and go, it’s clear that significant and longer term economic obstacles remain both here at home and abroad. There appear to be no easy solutions to many of these issues. As a result, the financial markets have had little conviction to respond to what has been slow, yet noticeable improvement in some economic benchmarks in recent months. No one likes uncertainty, especially financial markets. But even in these uncertain times, it appears that investors are still approaching the market with cautious optimism, with some taking on more risk in order to refocus on their long-term savings goals. Maybe this describes you, or perhaps you have been sitting on the sidelines thinking about getting back into the market, but are still a bit hesitant to act because of market uncertainty. | ||||||||

Clearly, risk remains a primary focus for investors of all types. As Trustees of the Invesco Funds, one of our primary responsibilities is to ensure your fund’s adviser is cognizant of the risks in each of the funds it manages. A thoughtful risk management plan may help investors navigate through market turbulence or an economic downturn. This is why we make risk management a critical element of our annual contract renewal process, like the one we complete with Invesco every year.
To be sure, there will always be risks involved with investing, but you shouldn’t let short-term news or your emotions dictate your investments. Because no one can predict with 100% accuracy the movements of financial markets, I strongly encourage you to speak with a professional financial adviser who can assist you in building an investment portfolio that reflects your individual risk tolerance and is designed to help achieve your individual financial objectives.
You can be sure your Board remains committed to doing its part in helping you along the way. In addition to ensuring that your fund’s adviser is focused on the risks in the funds it manages, we also remain committed to managing fund costs and working with your fund’s adviser to provide a compelling and diversified product offering to potentially meet your investing goals.
In that regard, your Board approved a number of fund mergers and the launch of several new funds, including the first Invesco mutual fund available to US retail investors managed by investment professionals at Invesco Perpetual*, one of the largest independent investment managers in the UK.
Let me close by thanking Carl Frischling upon his retirement from the Invesco Funds Board for his 35 years of distinguished service and unwavering commitment to our funds’ shareholders. As always, please contact me at bruce@brucecrockett.com with any questions or concerns you may have.
On behalf of the Board, we look forward to continuing to represent your interests and serving your investment needs.
Sincerely,

Bruce L. Crockett
Independent Chair
Invesco Funds Board of Trustees
| * | Invesco Perpetual is a business name of Invesco Asset Management Limited (IAML), a registered investment adviser. IAML is a wholly owned, indirect subsidiary of Invesco Ltd. |
3 Invesco Leaders Fund
Management’s Discussion of Fund Performance
Performance summary
For the year ended December 31, 2012, Invesco Leaders Fund, at net asset value (NAV), produced double-digit returns. The Fund consists of three underlying Invesco funds, which delivered mixed results against their respective benchmarks.
Invesco Comstock Fund, at NAV, outperformed its style-specific index, the Russell 1000 Value Index.
Invesco Equity and Income Fund, at NAV, outperformed its style-specific index, the Barclays U.S. Government/Credit Index.
And Invesco International Growth Fund, at NAV, underperformed its style-specific index, the MSCI EAFE Growth Index.
All three underlying funds made positive absolute contributions to Fund performance. Strength in global equity markets helped propel Fund performance in 2012, as it bounced back from a challenging 2011.
Your Fund’s long-term performance appears later in this report.
Fund vs. Indexes
Total returns, 12/31/11 to 12/31/12, at net asset value (NAV). Performance shown does not include applicable contingent deferred sales charges (CDSC) or front-end sales charges, which would have reduced performance.
| Class A Shares | 15.40 | % | |||
| Class B Shares | 14.55 | ||||
| Class C Shares | 14.48 | ||||
| Class Y Shares | 15.69 | ||||
S&P 500 Index‚ (Broad Market Index) | 16.00 | ||||
| MSCI EAFE Growth Indexn (Style-Specific Index)* | 16.86 | ||||
Barclays U.S. Government/Credit Index¨ (Style-Specific Index) | 4.82 | ||||
Russell 1000 Value Indexp (Style-Specific Index) | 17.51 | ||||
MSCI EAFE Indexn (Former Style-Specific Index)* | 17.32 |
Source(s): ‚Invesco, S&P-Dow Jones via FactSet Research Systems Inc.; nInvesco, MSCI via FactSet Research Systems Inc.; ¨ Lipper Inc.; pInvesco, Russell via FactSet Research Systems Inc.
| * | During the reporting period, the Fund has elected to use the MSCI EAFE Growth Index as one of its style-specific indexes, rather than the MSCI EAFE Index, because one of the Fund’s underlying holdings changed its index from the MSCI EAFE Index to the MSCI EAFE Growth Index, and the Fund wanted to remain consistent with that underlying holding. |
How we invest
The Fund’s principal investment objective is capital appreciation, and its secondary investment objective is income.
The Fund seeks to achieve its investment objectives by investing primarily in three Invesco funds (“the underlying funds”) on a fixed percentage allocation basis. The underlying funds invest in US and foreign equities, fixed income
securities and money market securities. One of the underlying funds, Invesco Equity and Income Fund, also invests in derivatives – specifically, US Treasury futures – to manage its duration.
The Fund makes equal allocations of its assets into three underlying funds: Invesco Comstock Fund, Invesco Equity and Income Fund and Invesco International Growth Fund. The investment
results of the underlying funds will vary. As a result, the percentage allocations to the underlying funds are monitored daily. The Fund’s allocations to the underlying funds are rebalanced whenever the actual allocations exceed plus or minus 5% of the pre-determined fixed percentage allocation basis.
Market conditions and your Fund
The year began with equities and commodities advancing, driven by improving economic data and continued stimulus from monetary authorities around the globe. Most bond markets fell during the first quarter on signs of improving economic conditions, reduced economic strains in Europe and declining expectations for further US Treasury bond purchase programs.
Over April and May, gains in equities and commodities from earlier in the year were eroded by renewed fears arising from the ongoing European crisis coupled with weakening economic data in key markets. Government bonds once again fulfilled their role as safe haven assets as yields contracted in response to the weakness in riskier assets.
In the third quarter, equity, fixed income and commodity markets all posted impressive results. Riskier assets, especially commodities, were able to rally from depressed levels on expectations for additional monetary easing and hope that Europe would be able to finally make headway on its lingering economic issues. Bond yields spiked twice during the third quarter but managed to settle down to similar or slightly lower levels than where they stood at the start of the quarter, as markets seesawed between concerns over inflation and continuing weakness in Europe.
| Portfolio Composition | |||||
| By asset allocation | |||||
| Domestic Blend | 33.4 | % | |||
| Primarily Domestic Equity | 33.3 | ||||
| Primarily Foreign Equity | 33.3 | ||||
| Money Market Funds | 0.4 | ||||
| Assets Less Liabilities | -0.4 | ||||
The Fund’s holdings are subject to change, and there is no assurance that the Fund will continue to hold any particular security.
Total Net Assets | | $168.0 million | | ||
4 Invesco Leaders Fund
In the fourth quarter, a rise in equities was offset by declines in bonds and commodities. Investors had a host of political issues to navigate, including elections in the US, China and Japan; “fiscal cliff” negotiations in the US; and continuing concerns over European and Chinese economic growth. Commodity markets were weighed down by concerns over falling demand and improved crop yields. Bond yields ultimately made their way higher as the market experienced both rallies and sell offs that were fairly range bound.
Thank you for your continued commitment to Invesco Leaders Fund and for sharing our long-term investment horizon.
The views and opinions expressed in management’s discussion of Fund performance are those of Invesco Advisers, Inc. These views and opinions are subject to change at any time based on factors such as market and economic conditions. These views and opinions may not be relied upon as investment advice or recommendations, or as an offer for a particular security. The information is not a complete analysis of every aspect of any market, country, industry, security or the Fund. Statements of fact are from sources considered reliable, but Invesco Advisers, Inc. makes no representation or warranty as to their completeness or accuracy. Although historical performance is no guarantee of future results, these insights may help you understand our investment management philosophy.
See important Fund and, if applicable, index disclosures later in this report.
 | Mark Ahnrud Chartered Financial Analyst, portfolio manager, is manager of Invesco Leaders Fund. He joined Invesco in | |
| 2000. Mr. Ahnrud earned a BS in finance and investments from Babson College and an MBA from Duke University Fuqua School of Business. | ||
 | Chris Devine Chartered Financial Analyst, portfolio manager, is manager of Invesco Leaders Fund. He joined Invesco in | |
| 1998. Mr. Devine earned a BA in economics from Wake Forest University and an MBA from the University of Georgia. | ||
 | Scott Hixon Chartered Financial Analyst, portfolio manager, is manager of Invesco Leaders Fund. He joined Invesco in | |
| 1994. Mr. Hixon earned a BBA in finance from Georgia Southern University and an MBA in finance from Georgia State University. | ||
 | Christian Ulrich Chartered Financial Analyst, portfolio manager, is manager of Invesco Leaders Fund. He joined Invesco in | |
| 2000. Mr. Ulrich earned the equivalent of a BBA from the KV Zurich Business School in Zurich, Switzerland. | ||
 | Scott Wolle Chartered Financial Analyst, portfolio manager, is manager of Invesco Leaders Fund. He joined Invesco in | |
| 1999. Mr. Wolle earned a BS in finance from Virginia Polytechnic Institute and State University and an MBA from Duke University Fuqua School of Business. | ||
Assisted by Invesco’s Global Asset Allocation Team
5 Invesco Leaders Fund
Your Fund’s Long-Term Performance
Results of a $10,000 Investment – Oldest Share Class(es) since Inception
Fund data from 2/27/06; index data from 2/28/06
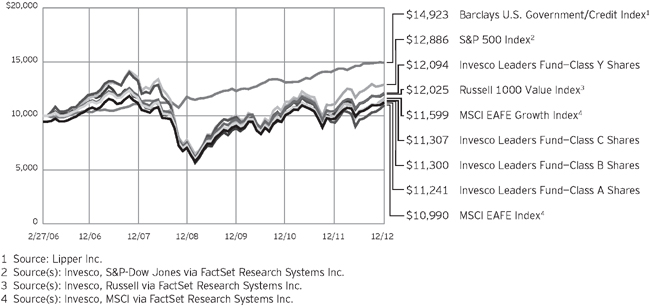
Past performance cannot guarantee comparable future results.
During the reporting period, the Fund has elected to use the MSCI EAFE Growth Index as one of its style-specific indexes, rather than the MSCI EAFE Index, because one of the Fund’s underlying holdings changed its index from the MSCI EAFE Index to the MSCI EAFE Growth Index, and the Fund wanted to remain consistent with that underlying holding. Because this is the first reporting
period since we have adopted the new index, SEC guidelines require that we compare performance to both the old and new indexes.
The data shown in the chart include reinvested distributions, applicable sales charges and Fund expenses including management fees. Results for Class B shares are calculated as if a hypothetical shareholder had liquidated his entire investment in the Fund at the close of the reporting period and paid the contingent
deferred sales charges, if applicable. Index results include reinvested dividends, but they do not reflect sales charges. Performance of the peer group, if applicable, reflects fund expenses and management fees; performance of a market index does not. Performance shown in the chart and table(s) does not reflect deduction of taxes a shareholder would pay on Fund distributions or sale of Fund shares.
continued from page 8
Investors should bear in mind that, while the Fund intends to use derivative strategies, it is not obligated to actively engage in these transactions, generally or in any particular kind of derivative, if the investment manager elects not to do so due to availability, cost, market conditions or other factors.
| n | Investing in the European Union risk. Many countries in the European Union are susceptible to high economic risks associated with high levels of debt, notably due to investments in sovereign debts of European countries such as Greece, Italy and Spain. One or more member states might exit the European Union, placing its currency and banking system in jeopardy. The European Union faces major issues involving its membership, structure, procedures and policies, including the adoption, abandonment or adjustment of the new constitutional treaty, the European Union’s |
enlargement to the south and east, and resolution of the European Union’s problematic fiscal and democratic accountability. Efforts of the member states to further unify their economic and monetary policies may increase the potential for the downward movement of one member state’s market to cause a similar effect on other member states’ markets. European countries that are part of the European Economic and Monetary Union may be significantly affected by the tight fiscal and monetary controls that the union seeks to impose on its members.
| n | Style-specific investing risk. A value style of investing (used by Invesco Comstock Fund and Invesco Equity and Income Fund) emphasizes undervalued companies with characteristics for improved valuations. This style of investing is subject to the risk that the valuations never improve or that the |
returns on value securities are less than returns on other styles of investing or the overall market.
A growth style of investing (used by Invesco International Growth Fund) emphasizes companies with growth characteristics. The market values of growth securities may be more volatile than those of other types of investments. The returns on growth securities may or may not move in tandem with the returns on other styles of investing or the overall stock markets.
| n | Developing/emerging markets securities risk. Securities issued by foreign companies and governments located in developing/emerging countries may be affected more negatively by inflation, devaluation of their currencies, higher transaction costs, delays in settlement, adverse political developments, the introduction of capital controls, withholding taxes, nationalization of private |
continued on page 7
6 Invesco Leaders Fund
Average Annual Total Returns | |||||
As of 12/31/12, including maximum applicable sales charges | |||||
| Class A Shares | |||||
| Inception (2/27/06) | 1.72 | % | |||
5 Years | -1.06 | ||||
1 Year | 9.04 | ||||
| Class B Shares | |||||
| Inception (2/27/06) | 1.80 | % | |||
5 Years | -1.03 | ||||
1 Year | 9.55 | ||||
| Class C Shares | |||||
| Inception (2/27/06) | 1.81 | % | |||
5 Years | -0.66 | ||||
1 Year | 13.48 | ||||
| Class Y Shares | |||||
| Inception (2/27/06) | 2.82 | % | |||
5 Years | 0.33 | ||||
1 Year | 15.69 | ||||
Effective June 1, 2010, Class A, Class B, Class C and Class I shares of the predecessor fund, Van Kampen Leaders Fund, advised by Van Kampen Asset Management, were reorganized into Class A, Class B, Class C and Class Y shares, respectively, of Invesco Van Kampen Leaders Fund. Returns shown above for Class A, Class B, Class C and Class Y
shares are blended returns of the predecessor fund and Invesco Van Kampen Leaders Fund (renamed Invesco Leaders Fund). Share class returns will differ from the predecessor fund because of different expenses.
The performance data quoted represent past performance and cannot guarantee comparable future results; current performance may be lower or higher. Please visit invesco.com/performance for the most recent month-end performance. Performance figures reflect reinvested distributions, changes in net asset value and the effect of the maximum sales charge unless otherwise stated. Investment return and principal value will fluctuate so that you may have a gain or loss when you sell shares.
The total annual Fund operating expense ratio set forth in the most recent Fund prospectus as of the date of this report for Class A, Class B, Class C, and Class Y shares was 1.26%, 2.01%, 2.01% and 1.01%, respectively. The expense ratios presented above may vary from the expense ratios presented in other sections of this report that are based on expenses incurred during the period covered by this report.
Class A share performance reflects the maximum 5.50% sales charge, and Class B and Class C share performance reflects the applicable contingent deferred sales charge (CDSC) for the period
involved. For shares purchased prior to June 1, 2010, the CDSC on Class B shares declines from 5% at the time of purchase to 0% at the beginning of the sixth year. For shares purchased on or after June 1, 2010, the CDSC on Class B shares declines from 5% beginning at the time of purchase to 0% at the beginning of the seventh year. The CDSC on Class C shares is 1% for the first year after purchase. Class Y shares do not have a front-end sales charge or a CDSC; therefore, performance is at net asset value.
The performance of the Fund’s share classes will differ primarily due to different sales charge structures and class expenses.
Had the adviser not waived fees and/or reimbursed expenses in the past, performance would have been lower.
continued from page 6
assets, expropriation, social unrest, war or lack of timely information than those in developed countries.
About indexes used in this report
| n | The S&P 500® Index is an unmanaged index considered representative of the US stock market. |
| n | The MSCI EAFE® Growth Index is an unmanaged index considered representative of growth stocks of Europe, Australasia and the Far East. |
| n | The Barclays U.S. Government/ Credit Index includes treasuries and agencies that represent the government portion of the index, and includes publically issued U.S. corporate and foreign debentures and secured notes that meet specified maturity, liquidity and quality requirements. |
| n | The Russell 1000® Value Index is an unmanaged index considered representative of large-cap value stocks. |
The Russell 1000 Value Index is a trademark/service mark of the Frank Russell Co. Russell® is a trademark of the Frank Russell Co.
| n | The MSCI EAFE® Index is an unmanaged index considered representative of stocks of Europe, Australasia and the Far East. |
| n | The Fund is not managed to track the performance of any particular index, including the index(es) defined here, and consequently, the performance of the Fund may deviate significantly from the performance of the index(es). |
| n | A direct investment cannot be made in an index. Unless otherwise indicated, index results include reinvested dividends, and they do not reflect sales charges. Performance of the peer group, if applicable, reflects fund expenses; performance of a market index does not. |
Other information
| n | The returns shown in management’s discussion of Fund performance are based on net asset values calculated for shareholder transactions. Generally accepted accounting principles require adjustments to be made to the net assets of the Fund at period end for financial reporting purposes, and as such, the net asset values for shareholder transactions and the returns based on those net asset values may differ from the net asset values and returns reported in the Financial Highlights. |
7 Invesco Leaders Fund
Invesco Leaders Fund’s principal investment objective is capital appreciation. The Fund’s secondary investment objective is income.
| n | Unless otherwise stated, information presented in this report is as of December 31, 2012, and is based on total net assets. |
| n | Unless otherwise noted, all data provided by Invesco. |
| n | To access your Fund’s reports/prospectus, visit invesco.com/fundreports. |
About share classes
| n | Class B shares may not be purchased for new or additional investments. Please see the prospectus for more information. |
| n | Class Y shares are available to only certain investors. Please see the prospectus for more information. |
Principal risks of investing in the Fund
| n | Non-diversified fund risk. A non-diversified fund generally is subject to greater risk than a diversified fund because changes in the financial condition or market assessment of a single issuer may cause greater fluctuations in the value of such non-diversified funds’ shares. |
| n | Market risk. Market risk is the possibility that the market values of securities owned by the underlying fund will decline. Investment in common stocks and other equity securities generally are affected by changes in the stock markets, which fluctuate substantially over time, sometimes suddenly and sharply. Investments in debt securities generally are affected by changes in interest rates and the creditworthiness of the issuer. The prices of such securities tend to fall as interest rates rise, and such declines tend to be greater among securities with longer maturities. The value of a convertible security tends to decline as interest rates rise and, because of the conversion feature, tends to vary with fluctuations in the market value of the underlying equity security. |
| n | Small and medium-sized companies risk. During an overall stock market decline, stock prices of small or medium-sized companies (in which the underlying funds may invest) often fluctuate more than stock prices of larger companies. |
| n | Income risk. The ability of the underlying funds’ equity securities to generate income generally depends on the earnings and the continuing declaration of dividends by the issuers of such securities. The interest income on the underlying funds’ debt securities |
generally is affected by prevailing interest rates, which can vary widely over the short- and long-term.
| n | Call risk. If interest rates fall, it is possible that issuers of callable securities held by the underlying funds will call or prepay their securities before their maturity dates. In this event, the proceeds from the called securities would most likely be reinvested by the underlying funds in securities bearing the new, lower interest rates, resulting in a possible decline in the Fund’s income and distributions to shareholders. |
| n | Credit risk. Credit risk refers to an issuer’s ability to make timely payments of interest and principal. Because an underlying fund generally invests only in investment grade-quality debt securities, it is subject to a lower level of credit risk than a fund investing in lower-quality securities. Securities rated BBB by Standard & Poor’s (S&P) or Baa by Moody’s Investor Service, Inc. (Moody’s) are in the lowest of the four investment grades and are considered by the rating agencies to be medium-grade obligations, which possess speculative characteristics so that changes in economic conditions or other circumstances are more likely to lead to a weakened capacity of the issuer to make principal and interest payments than in the case of higher-rated securities. |
| n | Foreign securities risk. An underlying fund’s foreign investments may be affected by changes in a foreign country’s exchange rates; political and social instability; changes in economic or taxation policies; difficulties when enforcing obligations; decreased liquidity; and increased volatility. Foreign companies may be subject to less regulation resulting in less publicly available information about the companies. |
| n | REIT risk/real estate risk. Investments in real estate-related instruments may be affected by economic, legal, cultural, environmental or technological factors that affect property values, rents or occupancies of real estate related to an underlying fund’s holdings. Real estate companies, including |
real estate investment trusts (REITs) or similar structures, tend to be small and mid-cap companies, and their shares may be more volatile and less liquid. The value of investments in real estate related companies may be affected by the quality of management, the ability to repay loans, the utilization of leverage and financial covenants related thereto, whether the company carries adequate insurance and environmental factors. If a real estate-related company defaults, an underlying fund may own real estate directly, which involves the following additional risks: environmental liabilities, difficulty in valuing and selling the real estate, and economic or regulatory changes.
| n | Geographic concentration risk. Because an underlying fund has a significant level of investment in issuers in the developed countries of Western Europe and Japan, an underlying fund’s performance is expected to be closely tied to social, political and economic conditions within countries in those regions and to be more volatile than the performance of more geographically diversified funds. |
| n | Management risk. The investment techniques and risk analysis used by the Fund’s and the underlying funds’ portfolio managers may not produce the desired results. |
| n | Derivatives risk. The performance of derivative instruments is tied to the performance of an underlying currency, security, index or other instrument. In addition to risks relating to their underlying instruments, the use of derivatives may include other, possibly greater, risks. Derivatives involve costs, may be volatile, and may involve a small initial investment relative to the risk assumed. Risks associated with the use of derivatives include counterparty, leverage, correlation, liquidity, tax, market, interest rate and management risks. Derivatives may also be more difficult to purchase, sell or value than other investments. An underlying fund may lose more than the cash amount invested on investments in derivatives. |
continued on page 6
This report must be accompanied or preceded by a currently effective Fund prospectus, which contains more complete information, including sales charges and expenses. Investors should read it carefully before investing.
NOT FDIC INSURED | MAY LOSE VALUE | NO BANK GUARANTEE
| Fund Nasdaq Symbols | |||||
| Class A Shares | VLFAX | ||||
| Class B Shares | VLFBX | ||||
| Class C Shares | VLFCX | ||||
| Class Y Shares | VLFIX | ||||
8 Invesco Leaders Fund
Schedule of Investments
December 31, 2012
Schedule of Investments in Affiliated Issuers–100.46%(a)
% of Assets 12/31/12 | Value 12/31/11 | Purchases at Cost | Proceeds from Sales | Change in Unrealized Appreciation | Realized Gain (Loss) | Dividend Income | Shares 12/31/12 | Value 12/31/12 | ||||||||||||||||||||||||||||
Domestic Equity Funds–66.71% |
| |||||||||||||||||||||||||||||||||||
Invesco Comstock Fund | 33.39 | % | $ | 57,264,919 | $ | 1,432,747 | $ | (11,710,689 | ) | $ | 9,867,527 | $ | (771,571 | ) | $ | 1,112,034 | 3,150,727 | $ | 56,082,933 | |||||||||||||||||
Invesco Equity and Income Fund | 33.32 | % | 57,322,550 | 3,315,294 | (10,398,949 | ) | 5,712,051 | 5,674 | 1,428,267 | 6,088,860 | 55,956,620 | |||||||||||||||||||||||||
Total Domestic Equity Funds | 114,587,469 | 4,748,041 | (22,109,638 | ) | 15,579,578 | (765,897 | ) | 2,540,301 | 112,039,553 | |||||||||||||||||||||||||||
Foreign Equity Funds–33.35% |
| |||||||||||||||||||||||||||||||||||
Invesco International Growth Fund | 33.35 | % | 57,569,413 | 2,488,414 | (11,651,500 | ) | 9,032,416 | (1,418,102 | ) | 752,163 | 1,918,515 | 56,020,641 | ||||||||||||||||||||||||
Money Market Funds–0.40% |
| |||||||||||||||||||||||||||||||||||
Liquid Assets Portfolio–Institutional Class | 0.20 | % | 205,921 | 12,356,997 | (12,224,921 | ) | — | — | 320 | 337,997 | 337,997 | |||||||||||||||||||||||||
Premier Portfolio–Institutional Class | 0.20 | % | 205,921 | 12,356,997 | (12,224,921 | ) | — | — | 244 | 337,997 | 337,997 | |||||||||||||||||||||||||
Total Money Market Funds | 411,842 | 24,713,994 | (24,449,842 | ) | — | — | 564 | 675,994 | ||||||||||||||||||||||||||||
TOTAL INVESTMENTS IN AFFILIATED ISSUERS | 100.46 | % | $ | 172,568,724 | $ | 31,950,449 | $ | (58,210,980 | ) | $ | 24,611,994 | $ | (2,183,999 | ) | $ | 3,293,028 | $ | 168,736,188 | ||||||||||||||||||
OTHER ASSETS LESS LIABILITIES | (0.46 | )% | (770,543 | ) | ||||||||||||||||||||||||||||||||
NET ASSETS | 100.00 | % | $ | 167,965,645 | ||||||||||||||||||||||||||||||||
Notes to Schedule of Investments:
| (a) | Each underlying fund and the Fund are affiliated by either having the same investment adviser or an investment adviser under common control with the Fund’s investment adviser. Effective September 24, 2012, the Fund began investing in Class R6 shares. The Fund invests in Class R6 of the mutual funds listed. |
See accompanying Notes to Financial Statements which are an integral part of the financial statements.
9 Invesco Leaders Fund
Statement of Assets and Liabilities
December 31, 2012
Assets: |
| |||
Investments in affiliated underlying funds, at value (Cost $140,572,123) | $ | 168,736,188 | ||
Receivable for: | ||||
Fund shares sold | 91,695 | |||
Dividends from affiliated underlying funds | 33 | |||
Investment for trustee deferred compensation and retirement plans | 12,807 | |||
Other assets | 8,145 | |||
Total assets | 168,848,868 | |||
Liabilities: |
| |||
Payable for: | ||||
Fund shares reacquired | 555,747 | |||
Accrued fees to affiliates | 241,130 | |||
Accrued other operating expenses | 63,410 | |||
Trustee deferred compensation and retirement plans | 22,936 | |||
Total liabilities | 883,223 | |||
Net assets applicable to shares outstanding | $ | 167,965,645 | ||
Net assets consist of: |
| |||
Shares of beneficial interest | $ | 216,290,019 | ||
Undistributed net investment income | 700,702 | |||
Undistributed net realized gain (loss) | (77,189,141 | ) | ||
Unrealized appreciation | 28,164,065 | |||
| $ | 167,965,645 | |||
Net Assets: |
| |||
Class A | $ | 115,766,012 | ||
Class B | $ | 36,818,618 | ||
Class C | $ | 15,064,837 | ||
Class Y | $ | 316,178 | ||
Shares outstanding, $0.01 par value per share, |
| |||
Class A | 11,613,935 | |||
Class B | 3,696,774 | |||
Class C | 1,530,975 | |||
Class Y | 31,723 | |||
Class A: | ||||
Net asset value per share | $ | 9.97 | ||
Maximum offering price per share | ||||
(Net asset value of $9.97 ¸ 94.50%) | $ | 10.55 | ||
Class B: | ||||
Net asset value and offering price per share | $ | 9.96 | ||
Class C: | ||||
Net asset value and offering price per share | $ | 9.84 | ||
Class Y: | ||||
Net asset value and offering price per share | $ | 9.97 | ||
See accompanying Notes to Financial Statements which are an integral part of the financial statements.
10 Invesco Leaders Fund
Statement of Operations
For the year ended December 31, 2012
Investment income: |
| |||
Dividends from affiliated underlying funds | $ | 3,293,028 | ||
Other Income | 341 | |||
Total investment income | 3,293,369 | |||
Expenses: | ||||
Administrative services fees | 50,000 | |||
Custodian fees | 11,544 | |||
Distribution fees: | ||||
Class A | 294,238 | |||
Class B | 386,463 | |||
Class C | 158,051 | |||
Transfer agent fees | 586,535 | |||
Trustees’ and officers’ fees and benefits | 27,935 | |||
Other | 151,605 | |||
Total expenses | 1,666,371 | |||
Less: Expenses reimbursed and expense offset arrangement(s) | (191,298 | ) | ||
Net expenses | 1,475,073 | |||
Net investment income | 1,818,296 | |||
Realized and unrealized gain (loss) from: | ||||
Net realized gain (loss) from affiliated underlying fund shares | (2,183,999 | ) | ||
Change in net unrealized appreciation of affiliated underlying fund shares | 24,611,994 | |||
Net realized and unrealized gain from affiliated underlying funds | 22,427,995 | |||
Net increase in net assets resulting from operations | $ | 24,246,291 | ||
See accompanying Notes to Financial Statements which are an integral part of the financial statements.
11 Invesco Leaders Fund
Statement of Changes in Net Assets
For the years ended December 31, 2012 and 2011
| 2012 | 2011 | |||||||
Operations: |
| |||||||
Net investment income | $ | 1,818,296 | $ | 3,031,739 | ||||
Net realized gain (loss) | (2,183,999 | ) | (5,325,719 | ) | ||||
Change in net unrealized appreciation (depreciation) | 24,611,994 | (4,126,670 | ) | |||||
Net increase (decrease) in net assets resulting from operations | 24,246,291 | (6,420,650 | ) | |||||
Distributions to shareholders from net investment income: | ||||||||
Class A | (1,497,574 | ) | (2,315,321 | ) | ||||
Class B | (201,754 | ) | (491,927 | ) | ||||
Class C | (81,965 | ) | (339,573 | ) | ||||
Class Y | (4,302 | ) | (5,692 | ) | ||||
Total distributions from net investment income | (1,785,595 | ) | (3,152,513 | ) | ||||
Share transactions-net: | ||||||||
Class A | (15,704,786 | ) | (15,125,563 | ) | ||||
Class B | (8,171,566 | ) | (9,357,780 | ) | ||||
Class C | (2,768,838 | ) | (3,404,942 | ) | ||||
Class Y | 53,277 | 45,989 | ||||||
Net increase (decrease) in net assets resulting from share transactions | (26,591,913 | ) | (27,842,296 | ) | ||||
Net increase (decrease) in net assets | (4,131,217 | ) | (37,415,459 | ) | ||||
Net assets: | ||||||||
Beginning of year | 172,096,862 | 209,512,321 | ||||||
End of year (includes undistributed net investment income of $700,702 and $668,001, respectively) | $ | 167,965,645 | $ | 172,096,862 | ||||
Notes to Financial Statements
December 31, 2012
NOTE 1—Significant Accounting Policies
Invesco Leaders Fund, formerly Invesco Van Kampen Leaders Fund (the “Fund”), is a series portfolio of AIM Growth Series (Invesco Growth Series) (the “Trust”). The Trust is organized as a Delaware statutory trust and is registered under the Investment Company Act of 1940, as amended (the “1940 Act”), as an open-end series management investment company consisting of sixteen separate series portfolios, each authorized to issue an unlimited number of shares of beneficial interest. The assets, liabilities and operations of each portfolio are accounted for separately. Information presented in these financial statements pertains only to the Fund. Matters affecting each portfolio or class will be voted on exclusively by the shareholders of such portfolio or class.
The Fund’s principal investment objective is capital appreciation. The Fund’s secondary investment objective is income.
The Fund primarily invests in affiliated mutual funds (“underlying funds”) advised by Invesco Advisers, Inc. (the “Adviser” or “Invesco”). The Adviser may change the Fund’s asset class allocations, the underlying funds or the target weightings in the underlying funds without shareholder approval. The underlying funds may engage in a number of investment techniques and practices, which involve certain risks. Each underlying fund’s accounting policies are outlined in the underlying fund’s financial statements and are available upon request.
The Fund currently consists of four different classes of shares: Class A, Class B, Class C and Class Y. Class A shares are sold with a front-end sales charge unless certain waiver criteria are met and under certain circumstances load waived shares may be subject to contingent deferred sales charges (“CDSC”). Class C shares are sold with a CDSC. Class Y shares are sold at net asset value. Effective November 30, 2010, new or additional investments in Class B shares are no longer permitted. Existing shareholders of Class B shares may continue to reinvest dividends and capital gains distributions in Class B shares until they convert to Class A shares. Also, shareholders in Class B shares will be able to exchange those shares for Class B shares of other Invesco Funds offering such shares until they convert to Class A shares. Generally, Class B shares will automatically convert to Class A shares on or about the month-end, which is at least eight years after the date of purchase. Redemption of Class B shares prior to the conversion date will be subject to a CDSC.
The following is a summary of the significant accounting policies followed by the Fund in the preparation of its financial statements.
| A. | Security Valuations — Securities of investment companies that trade on an exchange are valued at the last sales price or official closing price as of the close of the customary trading session on the exchange where the security is principally traded. Investments in shares of funds that are not traded on an exchange are valued at the end of day net asset value per share of such fund. Securities in the underlying funds, including restricted securities, are valued in accordance with the valuation policy of such fund. The policies of the underlying funds affiliated with the Fund as a result of having the same investment adviser are set forth below. |
A security listed or traded on an exchange (except convertible bonds) is valued at its last sales price or official closing price as of the close of the customary trading session on the exchange where the security is principally traded, or lacking any sales or official closing price on a particular
12 Invesco Leaders Fund
day, the security may be valued at the closing bid price on that day. Securities traded in the over-the-counter market are valued based on prices furnished by independent pricing services or market makers. When such securities are valued by an independent pricing service they may be considered fair valued. Futures contracts are valued at the final settlement price set by an exchange on which they are principally traded. Listed options are valued at the mean between the last bid and ask prices from the exchange on which they are principally traded. Options not listed on an exchange are valued by an independent source at the mean between the last bid and ask prices. For purposes of determining net asset value per share, futures and option contracts generally are valued 15 minutes after the close of the customary trading session of the New York Stock Exchange (“NYSE”).
Investments in open-end and closed-end registered investment companies that do not trade on an exchange are valued at the end of day net asset value per share. Investments in open-end and closed-end registered investment companies that trade on an exchange are valued at the last sales price or official closing price as of the close of the customary trading session on the exchange where the security is principally traded.
Debt obligations (including convertible bonds) and unlisted equities are fair valued using an evaluated quote provided by an independent pricing service. Evaluated quotes provided by the pricing service may be determined without exclusive reliance on quoted prices, and may reflect appropriate factors such as institution-size trading in similar groups of securities, developments related to specific securities, dividend rate (for unlisted equities), yield (for debt obligations), quality, type of issue, coupon rate (for debt obligations), maturity (for debt obligations), individual trading characteristics and other market data. Debt obligations are subject to interest rate and credit risks. In addition, all debt obligations involve some risk of default with respect to interest and/or principal payments.
Foreign securities’ (including foreign exchange contracts) prices are converted into U.S. dollar amounts using the applicable exchange rates as of the close of the NYSE. If market quotations are available and reliable for foreign exchange-traded equity securities, the securities will be valued at the market quotations. Because trading hours for certain foreign securities end before the close of the NYSE, closing market quotations may become unreliable. If between the time trading ends on a particular security and the close of the customary trading session on the NYSE, events occur that the Adviser determines are significant and make the closing price unreliable, the Fund may fair value the security. If the event is likely to have affected the closing price of the security, the security will be valued at fair value in good faith using procedures approved by the Board of Trustees. Adjustments to closing prices to reflect fair value may also be based on a screening process of an independent pricing service to indicate the degree of certainty, based on historical data, that the closing price in the principal market where a foreign security trade is not the current value as of the close of the NYSE. Foreign securities’ prices meeting the approved degree of certainty that the price is not reflective of current value will be priced at the indication of fair value from the independent pricing service. Multiple factors may be considered by the independent pricing service in determining adjustments to reflect fair value and may include information relating to sector indices, American Depositary Receipts and domestic and foreign index futures. Foreign securities may have additional risks including exchange rate changes, potential for sharply devalued currencies and high inflation, political and economic upheaval, the relative lack of issuer information, relatively low market liquidity and the potential lack of strict financial and accounting controls and standards.
Securities for which market prices are not provided by any of the above methods may be valued based upon quotes furnished by independent sources. The last bid price may be used to value equity securities. The mean between the last bid and asked prices is used to value debt obligations, including corporate loans.
Securities for which market quotations are not readily available or became unreliable are valued at fair value as determined in good faith by or under the supervision of the Trust’s officers following procedures approved by the Board of Trustees. Issuer specific events, market trends, bid/ask quotes of brokers and information providers and other market data may be reviewed in the course of making a good faith determination of a security’s fair value.
Valuations change in response to many factors including the historical and prospective earnings of the issuer, the value of the issuer’s assets, general economic conditions, interest rates, investor perceptions and market liquidity. Because of the inherent uncertainties of valuation, the values reflected in the financial statements may materially differ from the value received upon actual sale of those investments.
| B. | Securities Transactions and Investment Income — Securities transactions are accounted for on a trade date basis. Realized gains or losses on sales are computed on the basis of specific identification of the securities sold. Distributions from ordinary income from underlying funds, if any, are recorded as dividend income on ex-dividend date. Distributions from gains from underlying funds, if any, are recorded as realized gains on the ex-dividend date. The following policies are followed by the underlying funds: Interest income is recorded on the accrual basis from settlement date. Bond premiums and discounts are amortized and/or accreted for financial reporting purposes. Paydown gains and losses on mortgage and asset-backed securities are recorded as adjustments to interest income. |
The Fund allocates income and realized and unrealized capital gains and losses to a class based on the relative net assets of each class.
| C. | Distributions — Distributions from income, if any, are declared and paid quarterly and are recorded on the ex-dividend date. Distributions from net realized capital gain, if any, are generally declared and paid annually and recorded on the ex-dividend date. The Fund may elect to treat a portion of the proceeds from redemptions as distributions for federal income tax purposes. |
| D. | Federal Income Taxes — The Fund intends to comply with the requirements of Subchapter M of the Internal Revenue Code necessary to qualify as a regulated investment company and to distribute substantially all of the Fund’s taxable earnings to shareholders. As such, the Fund will not be subject to federal income taxes on otherwise taxable income (including net realized capital gain) that is distributed to shareholders. Therefore, no provision for federal income taxes is recorded in the financial statements. |
Each Fund files tax returns in the U.S. Federal jurisdiction and certain other jurisdictions. Generally, each Fund is subject to examinations by such taxing authorities for up to three years after the filing of the return for the tax period.
| E. | Expenses — Expenses included in the accompanying financial statements reflect the expenses of the Fund and do not include any expenses of the underlying funds. The effects of the underlying funds expenses are included in the realized and unrealized gain/loss on the investments in the underlying funds. |
Fees provided for under the Rule 12b-1 plan of a particular class of the Fund and which are directly attributable to that class are charged to the operations of such class. All other expenses are allocated among the classes based on relative net assets.
13 Invesco Leaders Fund
| F. | Accounting Estimates — The preparation of financial statements in conformity with accounting principles generally accepted in the United States of America (“GAAP”) requires management to make estimates and assumptions that affect the reported amounts of assets and liabilities at the date of the financial statements and the reported amounts of revenues and expenses during the reporting period including estimates and assumptions related to taxation. Actual results could differ from those estimates by a significant amount. In addition, the Fund monitors for material events or transactions that may occur or become known after the period-end date and before the date the financial statements are released to print. |
| G. | Indemnifications — Under the Trust’s organizational documents, each Trustee, officer, employee or other agent of the Trust is indemnified against certain liabilities that may arise out of the performance of their duties to the Fund. Additionally, in the normal course of business, the Fund enters into contracts, including the Fund’s servicing agreements, that contain a variety of indemnification clauses. The Fund’s maximum exposure under these arrangements is unknown as this would involve future claims that may be made against the Fund that have not yet occurred. The risk of material loss as a result of such indemnification claims is considered remote. |
NOTE 2—Advisory Fees and Other Fees Paid to Affiliates
The Trust has entered into a master investment advisory agreement with the Adviser. Under the terms of the investment advisory agreement, the Fund does not pay an advisory fee. However, the Fund pays advisory fees to Invesco as a shareholder of the underlying funds.
Under the terms of a master sub-advisory agreement between the Adviser and each of Invesco Asset Management Deutschland GmbH, Invesco Asset Management Limited, Invesco Asset Management (Japan) Limited, Invesco Australia Limited, Invesco Hong Kong Limited, Invesco Senior Secured Management, Inc. and Invesco Canada Ltd. (collectively, the “Affiliated Sub-Advisers”) the Adviser, not the Fund, may pay 40% of the fees paid to the Adviser to any such Affiliated Sub-Adviser(s) that provide(s) discretionary investment management services to the Fund or underlying funds based on the percentage of assets allocated to such Sub-Adviser(s).
Effective July 1, 2012, the Adviser has contractually agreed, through at least June 30, 2013, to waive advisory fees and/or reimburse expenses of all shares to the extent necessary to limit total annual fund operating expenses after fee waiver and/or expense reimbursement (excluding certain items discussed below) of Class A, Class B, Class C and Class Y shares to 2.25%, 3.00%, 3.00% and 2.00%, respectively, of average daily net assets. Prior to July 1, 2012, the Adviser had contractually agreed to waive advisory fees and/or reimburse expenses of all shares to the extent necessary to limit total annual fund operating expenses after fee waiver and/or expense reimbursement (excluding certain items discussed below) of Class A, Class B, Class C and Class Y shares to 0.50%, 1.25%, 1.25% and 0.25%, respectively, of average daily net assets. In determining the Adviser’s obligation to waive advisory fees and/or reimburse expenses, the following expenses are not taken into account, and could cause the total annual fund operating expenses after fee waiver and/or expense reimbursement to exceed the numbers reflected above: (1) interest; (2) taxes; (3) dividend expense on short sales; (4) extraordinary or non-routine items, including litigation expenses; and (5) expenses that the Fund has incurred but did not actually pay because of an expense offset arrangement. Acquired Fund Fees and Expenses are not fees and expenses incurred by the Fund directly but are fees and expenses, including management fees, of the investment companies in which the Fund invests. As a result, total annual fund operating expenses may exceed the expense limits above. You incur these expenses indirectly through the valuation of the Fund’s investment in those investment companies. The impact of the Acquired Fund Fees and Expenses are included in the total return of the Fund. Unless the Board of Trustees and Invesco mutually agree to amend or continue the fee waiver agreement, it will terminate on June 30, 2013.
Further, the Adviser has contractually agreed, through at least June 30, 2013, to waive the advisory fee payable by the Fund in an amount equal to 100% of the net advisory fees the Adviser receives from the affiliated money market funds on investments by the Fund of uninvested cash in such affiliated money market funds.
For the year ended December 31, 2012, the Adviser reimbursed Fund expenses of $190,757.
The Trust has entered into a master administrative services agreement with Invesco pursuant to which the Fund has agreed to pay Invesco for certain administrative costs incurred in providing accounting services to the Fund. For the year ended December 31, 2012, expenses incurred under the agreement are shown in the Statement of Operations as Administrative services fees.
The Trust has entered into a transfer agency and service agreement with Invesco Investment Services, Inc. (“IIS”) pursuant to which the Fund has agreed to pay IIS a fee for providing transfer agency and shareholder services to the Fund and reimburse IIS for certain expenses incurred by IIS in the course of providing such services. IIS may make payments to intermediaries that provide omnibus account services, sub-accounting services and/or networking services. All fees payable by IIS to intermediaries that provide omnibus account services or sub-accounting are charged back to the Fund, subject to certain limitations approved by the Trust’s Board of Trustees. For the year ended December 31, 2012, the expenses incurred under the agreement are shown in the Statement of Operations as Transfer agent fees.
Shares of the Fund are distributed by Invesco Distributors, Inc. (“IDI”). The Fund has adopted a distribution plan pursuant to Rule 12b-1 under the 1940 Act, and a service plan (collectively, the “Plans”) for Class A shares, Class B shares and Class C shares to compensate IDI for the sale, distribution, shareholder servicing and maintenance of shareholder accounts for these shares. Under the Plans, the Fund will incur annual fees of up to 0.25% of Class A average daily net assets and up to 1.00% each of Class B and Class C average daily net assets.
With respect to Class B and Class C shares, the Fund is authorized to reimburse in future years any distribution related expenses that exceed the maximum annual reimbursement rate for such class, so long as such reimbursement does not cause the Fund to exceed the Class B and Class C maximum annual reimbursement rate, respectively. With respect to Class A shares, distribution related expenses that exceed the maximum annual reimbursement rate for such class are not carried forward to future years and the Fund will not reimburse IDI for any such expenses.
For the year ended December 31, 2012, expenses incurred under these agreements are shown in the Statement of Operations as Distribution fees.
Front-end sales commissions and CDSC (collectively, the “sales charges”) are not recorded as expenses of the Fund. Front-end sales commissions are deducted from proceeds from the sales of Fund shares prior to investment in Class A shares of the Fund. CDSC are deducted from redemption proceeds prior to remittance to the shareholder. During the year ended December 31, 2012, IDI advised the Fund that IDI retained $50,996 in front-end sales commissions from the sale of Class A shares and $49, $63,843 and $1,037 from Class A, Class B and Class C shares, respectively, for CDSC imposed on redemptions by shareholders.
The underlying Invesco Funds pay no distribution fees for Class R5 and Class R6 shares and the Fund pays no sales loads or other similar compensation to IDI for acquiring the underlying fund shares.
Certain officers and trustees of the Trust are officers and directors of the Adviser, IIS and/or IDI.
14 Invesco Leaders Fund
NOTE 3—Additional Valuation Information
GAAP defines fair value as the price that would be received to sell an asset or paid to transfer a liability in an orderly transaction between market participants at the measurement date, under current market conditions. GAAP establishes a hierarchy that prioritizes the inputs to valuation methods giving the highest priority to readily available unadjusted quoted prices in an active market for identical assets (Level 1) and the lowest priority to significant unobservable inputs (Level 3) generally when market prices are not readily available or are unreliable. Based on the valuation inputs, the securities or other investments are tiered into one of three levels. Changes in valuation methods may result in transfers in or out of an investment’s assigned level:
| Level 1 — | Prices are determined using quoted prices in an active market for identical assets. |
| Level 2 — | Prices are determined using other significant observable inputs. Observable inputs are inputs that other market participants may use in pricing a security. These may include quoted prices for similar securities, interest rates, prepayment speeds, credit risk, yield curves, loss severities, default rates, discount rates, volatilities and others. |
| Level 3 — | Prices are determined using significant unobservable inputs. In situations where quoted prices or observable inputs are unavailable (for example, when there is little or no market activity for an investment at the end of the period), unobservable inputs may be used. Unobservable inputs reflect the Fund’s own assumptions about the factors market participants would use in determining fair value of the securities or instruments and would be based on the best available information. |
The following is a summary of the tiered valuation input levels, as of December 31, 2012. The level assigned to the securities valuations may not be an indication of the risk or liquidity associated with investing in those securities. Because of the inherent uncertainties of valuation, the values reflected in the financial statements may materially differ from the value received upon actual sale of those investments.
| Level 1 | Level 2 | Level 3 | Total | |||||||||||||
Equity Securities | $ | 168,736,188 | $ | — | $ | — | $ | 168,736,188 | ||||||||
NOTE 4—Expense Offset Arrangement(s)
The expense offset arrangement is comprised of transfer agency credits which result from balances in Demand Deposit Accounts (DDA) used by the transfer agent for clearing shareholder transactions. For the year ended December 31, 2012, the Fund received credits from this arrangement, which resulted in the reduction of the Fund’s total expenses of $541.
NOTE 5—Trustees’ and Officers’ Fees and Benefits
“Trustees’ and Officers’ Fees and Benefits” include amounts accrued by the Fund to pay remuneration to certain Trustees and Officers of the Fund. Trustees have the option to defer compensation payable by the Fund, and “Trustees’ and Officers’ Fees and Benefits” also include amounts accrued by the Fund to fund such deferred compensation amounts. Those Trustees who defer compensation have the option to select various Invesco Funds in which their deferral accounts shall be deemed to be invested. Finally, certain current Trustees are eligible to participate in a retirement plan that provides for benefits to be paid upon retirement to Trustees over a period of time based on the number of years of service. The Fund may have certain former Trustees who also participate in a retirement plan and receive benefits under such plan. “Trustees’ and Officers’ Fees and Benefits” include amounts accrued by the Fund to fund such retirement benefits. Obligations under the deferred compensation and retirement plans represent unsecured claims against the general assets of the Fund.
NOTE 6—Cash Balances
The Fund is permitted to temporarily carry a negative or overdrawn balance in its account with State Street Bank and Trust Company, the custodian bank. Such balances, if any at period end, are shown in the Statement of Assets and Liabilities under the payable caption Amount due custodian. To compensate the custodian bank for such overdrafts, the overdrawn Fund may either (1) leave funds as a compensating balance in the account so the custodian bank can be compensated by earning the additional interest; or (2) compensate by paying the custodian bank at a rate agreed upon by the custodian bank and Invesco, not to exceed the contractually agreed upon rate.
NOTE 7—Distributions to Shareholders and Tax Components of Net Assets
Tax Character of Distributions to Shareholders Paid During the Years Ended December 31, 2012 and 2011:
| 2012 | 2011 | |||||||
Ordinary income | $ | 1,785,595 | $ | 3,152,513 | ||||
Tax Components of Net Assets at Period-End:
| 2012 | ||||
Undistributed ordinary income | $ | 722,112 | ||
Net unrealized appreciation — investments | 24,653,716 | |||
Temporary book/tax differences | (21,410 | ) | ||
Post-October deferrals | (98,484 | ) | ||
Capital loss carryforward | (73,580,308 | ) | ||
Shares of beneficial interest | 216,290,019 | |||
Total net assets | $ | 167,965,645 | ||
15 Invesco Leaders Fund
The difference between book-basis and tax-basis unrealized appreciation (depreciation) is due to differences in the timing of recognition of gains and losses on investments for tax and book purposes. The Fund’s net unrealized appreciation (depreciation) difference is attributable primarily to wash sales.
The temporary book/tax differences are a result of timing differences between book and tax recognition of income and/or expenses. The Fund’s temporary book/tax differences are the result of the trustee deferral of compensation and retirement plan benefits.
Capital loss carryforward is calculated and reported as of a specific date. Results of transactions and other activity after that date may affect the amount of capital loss carryforward actually available for the Fund to utilize. The Regulated Investment Company Modernization Act of 2010 (the “Act”) eliminated the eight-year carryover period for capital losses that arise in taxable years beginning after its enactment date of December 22, 2010. Consequently, these capital losses can be carried forward for an unlimited period. However, capital losses with an expiration period may not be used to offset capital gains until all net capital losses without an expiration date have been utilized. Additionally, post-enactment capital loss carryovers will retain their character as either short-term or long-term capital losses instead of as short-term capital losses as under prior law. The ability to utilize capital loss carryforward in the future may be limited under the Internal Revenue Code and related regulations based on the results of future transactions.
The Fund has a capital loss carryforward as of December 31, 2012, which expires as follows:
| Capital Loss Carryforward* | ||||||||||||
| Expiration | Short-Term | Long-Term | Total | |||||||||
December 31, 2016 | $ | 9,220,402 | $ | — | $ | 9,220,402 | ||||||
December 31, 2017 | 19,944,094 | — | 19,944,094 | |||||||||
December 31, 2018 | 38,069,815 | — | 38,069,815 | |||||||||
Not subject to expiration | — | 6,345,997 | 6,345,997 | |||||||||
| $ | 67,234,311 | $ | 6,345,997 | $ | 73,580,308 | |||||||
| * | Capital loss carryforward as of the date listed above is reduced for limitations, if any, to the extent required by the Internal Revenue Code. |
NOTE 8—Investment Securities
The aggregate amount of investment securities (other than short-term securities, U.S. Treasury obligations and money market funds, if any) purchased and sold by the Fund during the year ended December 31, 2012 was $7,236,455 and $33,761,138, respectively. Cost of investments on a tax basis includes the adjustments for financial reporting purposes as of the most recently completed federal income tax reporting period-end.
| Unrealized Appreciation (Depreciation) of Investment Securities on a Tax Basis | ||||
Aggregate unrealized appreciation of investment securities | $ | 24,653,716 | ||
Aggregate unrealized (depreciation) of investment securities | — | |||
Net unrealized appreciation of investment securities | $ | 24,653,716 | ||
Cost of investments for tax purposes is $144,082,472.
16 Invesco Leaders Fund
NOTE 9—Share Information
| Summary of Share Activity | ||||||||||||||||
| Years ended December 31, | ||||||||||||||||
| 2012(a) | 2011 | |||||||||||||||
| Shares | Amount | Shares | Amount | |||||||||||||
Sold: | ||||||||||||||||
Class A | 1,146,736 | $ | 10,838,057 | 1,579,994 | $ | 14,495,852 | ||||||||||
Class B | 15,709 | 144,257 | 18,918 | 175,690 | ||||||||||||
Class C | 73,719 | 691,057 | 94,582 | 868,874 | ||||||||||||
Class Y | 8,355 | 79,208 | 20,027 | 191,289 | ||||||||||||
Issued as reinvestment of dividends: | ||||||||||||||||
Class A | 152,149 | 1,449,270 | 256,527 | 2,275,401 | ||||||||||||
Class B | 20,779 | 197,259 | 54,413 | 480,906 | ||||||||||||
Class C | 7,961 | 74,671 | 36,012 | 317,087 | ||||||||||||
Class Y | 402 | 3,836 | 547 | 4,875 | ||||||||||||
Automatic conversion of Class B shares to Class A shares: | ||||||||||||||||
Class A | 88,689 | 845,958 | 131,720 | 1,243,814 | ||||||||||||
Class B | (85,610 | ) | (845,958 | ) | (132,179 | ) | (1,243,814 | ) | ||||||||
Reacquired: | ||||||||||||||||
Class A | (3,049,711 | ) | (28,838,071 | ) | (3,604,417 | ) | (33,140,630 | ) | ||||||||
Class B | (816,909 | ) | (7,667,124 | ) | (963,368 | ) | (8,770,562 | ) | ||||||||
Class C | (376,765 | ) | (3,534,566 | ) | (505,621 | ) | (4,590,903 | ) | ||||||||
Class Y | (3,089 | ) | (29,767 | ) | (16,126 | ) | (150,175 | ) | ||||||||
Net increase (decrease) in share activity | (2,817,585 | ) | $ | (26,591,913 | ) | (3,028,971 | ) | $ | (27,842,296 | ) | ||||||
| (a) | There are entities that are record owners of more than 5% of the outstanding shares of the Fund and in the aggregate own 60% of the outstanding shares of the Fund. IDI has an agreement with these entities to sell Fund shares. The Fund, Invesco and/or Invesco affiliates may make payments to these entities, which are considered to be related to the Fund, for providing services to the Fund, Invesco and/or Invesco affiliates including but not limited to services such as securities brokerage, distribution, third party record keeping and account servicing. The Fund has no knowledge as to whether all or any portion of the shares owned of record by these entities are also owned beneficially. |
17 Invesco Leaders Fund
NOTE 10—Financial Highlights
The following schedule presents financial highlights for a share of the Fund outstanding throughout the periods indicated.
| Net asset value, beginning of period | Net investment income(a) | Net gains (losses) on securities (both realized and unrealized) | Total from investment operations | Dividends from net investment income | Distributions from net realized gains | Total distributions | Net asset value, end of period | Total return | Net assets, end of period (000’s omitted) | Ratio of expenses to average net assets with fee waivers and/or expenses absorbed(b) | Ratio of expenses to average net assets without fee waivers and/or expenses absorbed(b) | Ratio of net investment income to average net assets(b) | Portfolio turnover(c) | |||||||||||||||||||||||||||||||||||||||||||
Class A | ||||||||||||||||||||||||||||||||||||||||||||||||||||||||
Year ended 12/31/12 | $ | 8.75 | $ | 0.12 | $ | 1.22 | $ | 1.34 | $ | (0.12 | ) | $ | — | $ | (0.12 | ) | $ | 9.97 | 15.40 | %(d) | $ | 115,766 | 0.62 | %(e) | 0.73 | %(e) | 1.29 | %(e) | 4 | % | ||||||||||||||||||||||||||
Year ended 12/31/11 | 9.23 | 0.17 | (0.48 | ) | (0.31 | ) | (0.17 | ) | — | (0.17 | ) | 8.75 | (3.39 | )(d) | 116,194 | 0.50 | 0.68 | 1.81 | 7 | |||||||||||||||||||||||||||||||||||||
Nine months ended 12/31/10 | 8.76 | 0.09 | 0.49 | 0.58 | (0.11 | ) | — | (0.11 | ) | 9.23 | 6.70 | (d) | 137,607 | 0.50 | (f) | 0.70 | (f) | 1.37 | (f) | 4 | ||||||||||||||||||||||||||||||||||||
Year ended 03/31/10 | 5.90 | 0.11 | 2.89 | 3.00 | (0.14 | ) | — | (0.14 | ) | 8.76 | 51.13 | (g) | 149,281 | 0.50 | 0.76 | 1.38 | 9 | |||||||||||||||||||||||||||||||||||||||
Year ended 12/31/09 | 10.49 | 0.19 | (4.25 | ) | (4.06 | ) | (0.16 | ) | (0.37 | ) | (0.53 | ) | 5.90 | (39.27 | )(g) | 109,881 | 0.50 | 0.73 | 2.21 | 21 | ||||||||||||||||||||||||||||||||||||
Year ended 12/31/08 | 11.26 | 0.16 | (0.68 | ) | (0.52 | ) | (0.15 | ) | (0.10 | ) | (0.25 | ) | 10.49 | (4.77 | )(g) | 201,430 | 0.50 | 0.57 | 1.42 | 3 | ||||||||||||||||||||||||||||||||||||
Class B | ||||||||||||||||||||||||||||||||||||||||||||||||||||||||
Year ended 12/31/12 | 8.74 | 0.05 | 1.22 | 1.27 | (0.05 | ) | — | (0.05 | ) | 9.96 | 14.55 | (d) | 36,819 | 1.37 | (e) | 1.48 | (e) | 0.54 | (e) | 4 | ||||||||||||||||||||||||||||||||||||
Year ended 12/31/11 | 9.22 | 0.10 | (0.48 | ) | (0.38 | ) | (0.10 | ) | — | (0.10 | ) | 8.74 | (4.12 | )(d) | 39,899 | 1.25 | 1.43 | 1.06 | 7 | |||||||||||||||||||||||||||||||||||||
Nine months ended 12/31/10 | 8.76 | 0.04 | 0.48 | 0.52 | (0.06 | ) | — | (0.06 | ) | 9.22 | 5.99 | (d) | 51,495 | 1.25 | (f) | 1.45 | (f) | 0.64 | (f) | 4 | ||||||||||||||||||||||||||||||||||||
Year ended 03/31/10 | 5.90 | 0.05 | 2.89 | 2.94 | (0.08 | ) | — | (0.08 | ) | 8.76 | 50.02 | (g) | 52,751 | 1.25 | 1.51 | 0.64 | 9 | |||||||||||||||||||||||||||||||||||||||
Year ended 12/31/09 | 10.48 | 0.12 | (4.23 | ) | (4.11 | ) | (0.10 | ) | (0.37 | ) | (0.47 | ) | 5.90 | (39.65 | )(g) | 36,265 | 1.25 | 1.49 | 1.49 | 21 | ||||||||||||||||||||||||||||||||||||
Year ended 12/31/08 | 11.25 | 0.08 | (0.69 | ) | (0.61 | ) | (0.06 | ) | (0.10 | ) | (0.16 | ) | 10.48 | (5.49 | )(g) | 62,594 | 1.25 | 1.32 | 0.66 | 3 | ||||||||||||||||||||||||||||||||||||
Class C | ||||||||||||||||||||||||||||||||||||||||||||||||||||||||
Year ended 12/31/12 | 8.64 | 0.05 | 1.20 | 1.25 | (0.05 | ) | — | (0.05 | ) | 9.84 | 14.48 | (d) | 15,065 | 1.37 | (e) | 1.48 | (e) | 0.54 | (e) | 4 | ||||||||||||||||||||||||||||||||||||
Year ended 12/31/11 | 9.18 | 0.10 | (0.47 | ) | (0.37 | ) | (0.17 | ) | — | (0.17 | ) | 8.64 | (4.03 | )(d) | 15,776 | 1.25 | 1.43 | 1.06 | 7 | |||||||||||||||||||||||||||||||||||||
Nine months ended 12/31/10 | 8.75 | 0.04 | 0.49 | 0.53 | (0.10 | ) | — | (0.10 | ) | 9.18 | 6.12 | (d) | 20,211 | 1.16 | (f) | 1.36 | (f) | 0.70 | (f) | 4 | ||||||||||||||||||||||||||||||||||||
Year ended 03/31/10 | 5.90 | 0.05 | 2.88 | 2.93 | (0.08 | ) | — | (0.08 | ) | 8.75 | 49.88 | (g) | 23,173 | 1.25 | 1.51 | 0.61 | 9 | |||||||||||||||||||||||||||||||||||||||
Year ended 12/31/09 | 10.48 | 0.12 | (4.23 | ) | (4.11 | ) | (0.10 | ) | (0.37 | ) | (0.47 | ) | 5.90 | (39.65 | )(g) | 19,113 | 1.25 | 1.47 | 1.37 | 21 | ||||||||||||||||||||||||||||||||||||
Year ended 12/31/08 | 11.25 | 0.07 | (0.68 | ) | (0.61 | ) | (0.06 | ) | (0.10 | ) | (0.16 | ) | 10.48 | (5.49 | )(g) | 43,984 | 1.25 | 1.32 | 0.65 | 3 | ||||||||||||||||||||||||||||||||||||
Class Y(h) | ||||||||||||||||||||||||||||||||||||||||||||||||||||||||
Year ended 12/31/12 | 8.75 | 0.15 | 1.22 | 1.37 | (0.15 | ) | — | (0.15 | ) | 9.97 | 15.69 | (d) | 316 | 0.37 | (e) | 0.48 | (e) | 1.54 | (e) | 4 | ||||||||||||||||||||||||||||||||||||
Year ended 12/31/11 | 9.23 | 0.19 | (0.48 | ) | (0.29 | ) | (0.19 | ) | — | (0.19 | ) | 8.75 | (3.15 | )(d) | 228 | 0.25 | 0.43 | 2.06 | 7 | |||||||||||||||||||||||||||||||||||||
Nine months ended 12/31/10 | 8.77 | 0.11 | 0.47 | 0.58 | (0.12 | ) | — | (0.12 | ) | 9.23 | 6.78 | (d) | 199 | 0.25 | (f) | 0.45 | (f) | 1.76 | (f) | 4 | ||||||||||||||||||||||||||||||||||||
Year ended 03/31/10 | 5.90 | 0.13 | 2.90 | 3.03 | (0.16 | ) | — | (0.16 | ) | 8.77 | 51.68 | (g) | 201 | 0.25 | 0.51 | 1.68 | 9 | |||||||||||||||||||||||||||||||||||||||
Year ended 12/31/09 | 10.49 | 0.21 | (4.25 | ) | (4.04 | ) | (0.18 | ) | (0.37 | ) | (0.55 | ) | 5.90 | (39.12 | )(g) | 161 | 0.25 | 0.47 | 2.45 | 21 | ||||||||||||||||||||||||||||||||||||
Year ended 12/31/08 | 11.27 | 0.19 | (0.69 | ) | (0.50 | ) | (0.18 | ) | (0.10 | ) | (0.28 | ) | 10.49 | (4.62 | )(g) | 335 | 0.25 | 0.32 | 1.66 | 3 | ||||||||||||||||||||||||||||||||||||
| (a) | Calculated using average shares outstanding. |
| (b) | In addition to the fees and expenses which the Fund bears directly; the Fund indirectly bears a pro rata share of the fees and expenses of the underlying funds in which the Fund invests. Because the underlying funds have varied expenses and fee levels and the Fund may own different proportions at different times, the amount of fees and expenses incurred indirectly by the Fund will vary. Estimated underlying fund expenses are not expenses that are incurred directly by your Fund. They are expenses that are incurred directly by the underlying funds and are deducted from the value of the funds your Fund invests in. The effect of the estimated underlying fund expenses that you bear indirectly is included in your Fund’s total return. Estimated acquired fund fees from underlying funds were 0.58%, 0.58%, 0.63%, 0.75%, 0.76% and 0.69% for the years ended December 31, 2012 and 2011, the nine months ended December 31, 2010 and the years ended March 31, 2010, 2009 and 2008, respectively. |
| (c) | Portfolio turnover is calculated at the fund level and is not annualized for periods less than one year, if applicable. |
| (d) | Includes adjustments in accordance with accounting principles generally accepted in the United States of America and as such, the net asset value for financial reporting purposes and the returns based upon those net asset values may differ from the net asset value and returns for shareholder transactions. Does not include sales charges and is not annualized for periods less than one year, if applicable. |
| (e) | Ratios are based on average daily net assets (000’s) of $117,695, $38,646, $15,805 and $277 for Class A, Class B, Class C and Class Y shares, respectively. |
| (f) | Annualized. |
| (g) | Assumes reinvestment of all distributions for the period and does not include payment of the maximum sales charge of 5.50% or contingent deferred sales charge (CDSC) for Class A shares. On Class A share purchases of $1 million or more, a CDSC of 1% may be imposed on certain redemptions made within eighteen months of purchase. Does not include payment of the maximum CDSC of 5% for Class B shares, charged on certain redemptions made within one year of purchase and declining to 0% after the fifth year and does not include the maximum CDSC of 1% for Class C shares. If the sales charges were included, total returns would be lower. These returns include combined Rule 12b-1 fees and service fees of up to 0.25% for Class A and up to 1% for Class B and Class C, respectively, and do not reflect the deduction of taxes that a shareholder would pay on Fund distributions or the redemption of Fund shares. |
| (h) | On June 1, 2010, the Class I shares of Van Kampen Leaders Fund were reorganized into Class Y shares of the Fund. |
NOTE 11—Subsequent Event
The Board of Trustees unanimously approved an Agreement and Plan of Reorganization (the “Agreement”) pursuant to which the Fund would transfer all of its assets and liabilities (the “Reorganization”) to Invesco Growth Allocation Fund (the “Acquiring Fund”).
The Agreement requires approval of the Fund’s shareholders and will be submitted to the shareholders for their consideration at a meeting to be held in or around April 2013. Upon closing of the Reorganization, shareholders of the Fund will receive a corresponding class of shares of the Acquiring Fund in exchange for their shares of the Fund and the Fund will liquidate and cease operations.
18 Invesco Leaders Fund
Report of Independent Registered Public Accounting Firm
To the Board of Trustees of AIM Growth Series (Invesco Growth Series)
and Shareholders of Invesco Leaders Fund:
In our opinion, the accompanying statement of assets and liabilities, including the schedule of investments, and the related statements of operations and of changes in net assets and the financial highlights present fairly, in all material respects, the financial position of Invesco Leaders Fund, (formerly known as Invesco Van Kampen Leaders Fund; one of the funds constituting AIM Growth Series (Invesco Growth Series), hereafter referred to as the “Fund”) at December 31, 2012, the results of its operations for the year then ended, the changes in its net assets for each of the two years in the period then ended and the financial highlights for each of the two years in the period then ended and for the period April 1, 2010 to December 31, 2010, in conformity with accounting principles generally accepted in the United States of America. These financial statements and financial highlights (hereafter referred to as “financial statements”) are the responsibility of the Fund’s management; our responsibility is to express an opinion on these financial statements based on our audits. We conducted our audits of these financial statements in accordance with the standards of the Public Company Accounting Oversight Board (United States). Those standards require that we plan and perform the audit to obtain reasonable assurance about whether the financial statements are free of material misstatement. An audit includes examining, on a test basis, evidence supporting the amounts and disclosures in the financial statements, assessing the accounting principles used and significant estimates made by management, and evaluating the overall financial statement presentation. We believe that our audits, which included confirmation of securities at December 31, 2012 by correspondence with the custodian and transfer agent, provide a reasonable basis for our opinion. The financial highlights of the Fund for the periods ended March 31, 2010 and prior were audited by another independent registered public accounting firm whose report dated May 18, 2010 expressed an unqualified opinion on those statements.
PRICEWATERHOUSECOOPERS LLP
February 25, 2013
Houston, Texas
19 Invesco Leaders Fund
Calculating your ongoing Fund expenses
Example
As a shareholder of the Fund, you incur two types of costs: (1) transaction costs, which may include sales charges (loads) on purchase payments or contingent deferred sales charges on redemptions, and redemption fees, if any; and (2) ongoing costs, including management fees, distribution and/or service (12b-1) fees, and other Fund expenses. This example is intended to help you understand your ongoing costs (in dollars) of investing in the Fund and to compare these costs with ongoing costs of investing in other mutual funds. The example is based on an investment of $1,000 invested at the beginning of the period and held for the entire period July 1, 2012 through December 31, 2012.
Actual expenses
The table below provides information about actual account values and actual expenses. You may use the information in this table, together with the amount you invested, to estimate the expenses that you paid over the period. Simply divide your account value by $1,000 (for example, an $8,600 account value divided by $1,000 = 8.6), then multiply the result by the number in the table under the heading entitled “Actual Expenses Paid During Period” to estimate the expenses you paid on your account during this period.
Hypothetical example for comparison purposes
The table below also provides information about hypothetical account values and hypothetical expenses based on the Fund’s actual expense ratio and an assumed rate of return of 5% per year before expenses, which is not the Fund’s actual return.
The hypothetical account values and expenses may not be used to estimate the actual ending account balance or expenses you paid for the period. You may use this information to compare the ongoing costs of investing in the Fund and other funds. To do so, compare this 5% hypothetical example with the 5% hypothetical examples that appear in the shareholder reports of the other funds.
Please note that the expenses shown in the table are meant to highlight your ongoing costs only and do not reflect any transaction costs, such as sales charges (loads) on purchase payments, contingent deferred sales charges on redemptions, and redemption fees, if any. Therefore, the hypothetical information is useful in comparing ongoing costs only, and will not help you determine the relative total costs of owning different funds. In addition, if these transaction costs were included, your costs would have been higher.
| Class | Beginning Account Value (07/01/12) | ACTUAL | HYPOTHETICAL (5% annual return before expenses) | Annualized Expense Ratio | ||||||||||||||||||||
| Ending Account Value (12/31/12)1 | Expenses Paid During Period2 | Ending Account Value (12/31/12) | Expenses Paid During Period2 | |||||||||||||||||||||
A | $ | 1,000.00 | $ | 1,083.50 | $ | 3.88 | $ | 1,021.42 | $ | 3.76 | 0.74 | % | ||||||||||||
B | 1,000.00 | 1,079.50 | 7.79 | 1,017.65 | 7.56 | 1.49 | ||||||||||||||||||
C | 1,000.00 | 1,079.30 | 7.79 | 1,017.65 | 7.56 | 1.49 | ||||||||||||||||||
Y | 1,000.00 | 1,084.80 | 2.57 | 1,022.67 | 2.49 | 0.49 | ||||||||||||||||||
| 1 | The actual ending account value is based on the actual total return of the Fund for the period July 1, 2012 through December 31, 2012, after actual expenses and will differ from the hypothetical ending account value which is based on the Fund’s expense ratio and a hypothetical annual return of 5% before expenses. |
| 2 | Expenses are equal to the Fund’s annualized expense ratio as indicated above multiplied by the average account value over the period, multiplied by 184/365 to reflect the most recent fiscal half year. |
20 Invesco Leaders Fund
Tax Information
Form 1099-DIV, Form 1042-S and other year–end tax information provide shareholders with actual calendar year amounts that should be included in their tax returns. Shareholders should consult their tax advisors.
The following distribution information is being provided as required by the Internal Revenue Code or to meet a specific state’s requirement.
The Fund designates the following amounts or, if subsequently determined to be different, the maximum amount allowable for its fiscal year ended December 31, 2012:
Federal and State Income Tax | ||||
Qualified Dividend Income* | 95.76 | % | ||
Corporate Dividends Received Deduction* | 57.50 | % | ||
| * | The above percentages are based on ordinary income dividends paid to shareholders during the Fund’s fiscal year. |
21 Invesco Leaders Fund
Trustees and Officers
The address of each trustee and officer is AIM Growth Series (Invesco Growth Series) (the “Trust”), 11 Greenway Plaza, Suite 1000, Houston, Texas 77046-1173. The trustees serve for the life of the Trust, subject to their earlier death, incapacitation, resignation, retirement or removal as more specifically provided in the Trust’s organizational documents. Each officer serves for a one year term or until their successors are elected and qualified. Column two below includes length of time served with predecessor entities, if any.
| Name, Year of Birth and Position(s) Held with the Trust | Trustee and/ or Officer Since | Principal Occupation(s) During Past 5 Years | Number of Funds in Fund Complex Overseen by Trustee | Other Directorship(s) Held by Trustee During Past 5 Years | ||||
| Interested Persons | ||||||||
| Martin L. Flanagan1 — 1960 Trustee | 2007 | Executive Director, Chief Executive Officer and President, Invesco Ltd. (ultimate parent of Invesco and a global investment management firm); Advisor to the Board, Invesco Advisers, Inc. (formerly known as Invesco Institutional (N.A.), Inc.); Trustee, The Invesco Funds; Vice Chair, Investment Company Institute; and Member of Executive Board, SMU Cox School of Business
Formerly: Chairman and Chief Executive Officer, Invesco Advisers, Inc. (registered investment adviser); Director, Chairman, Chief Executive Officer and President, IVZ Inc. (holding company), INVESCO Group Services, Inc. (service provider) and Invesco North American Holdings, Inc. (holding company); Director, Chief Executive Officer and President, Invesco Holding Company Limited (parent of Invesco and a global investment management firm); Director, Invesco Ltd.; Chairman, Investment Company Institute and President, Co-Chief Executive Officer, Co-President, Chief Operating Officer and Chief Financial Officer, Franklin Resources, Inc. (global investment management organization) | 124 | None | ||||
Philip A. Taylor2 — 1954 Trustee, President and Principal Executive Officer | 2006 | Head of North American Retail and Senior Managing Director, Invesco Ltd.; Director, Co-Chairman, Co-President and Co-Chief Executive Officer, Invesco Advisers, Inc. (formerly known as Invesco Institutional (N.A.), Inc.) (registered investment adviser); Director, Chairman, Chief Executive Officer and President, Invesco Management Group, Inc. (formerly known as Invesco Aim Management Group, Inc.) (financial services holding company); Director and President, INVESCO Funds Group, Inc. (registered investment adviser and registered transfer agent); Director and Chairman, Invesco Investment Services, Inc. (formerly known as Invesco Aim Investment Services, Inc.) (registered transfer agent) and IVZ Distributors, Inc. (formerly known as INVESCO Distributors, Inc.) (registered broker dealer); Director, President and Chairman, Invesco Inc. (holding company) and Invesco Canada Holdings Inc. (holding company); Chief Executive Officer, Invesco Corporate Class Inc. (corporate mutual fund company) and Invesco Canada Fund Inc. (corporate mutual fund company); Director, Chairman and Chief Executive Officer, Invesco Canada Ltd. (formerly known as Invesco Trimark Ltd./Invesco Trimark Ltèe) (registered investment adviser and registered transfer agent); Trustee, President and Principal Executive Officer, The Invesco Funds (other than AIM Treasurer’s Series Trust (Invesco Treasurer’s Series Trust) and Short-Term Investments Trust); Trustee and Executive Vice President, The Invesco Funds (AIM Treasurer’s Series Trust (Invesco Treasurer’s Series Trust) and Short-Term Investments Trust only); Director, Invesco Investment Advisers LLC (formerly known as Van Kampen Asset Management); Director, Chief Executive Officer and President, Van Kampen Exchange Corp.
Formerly: Director and Chairman, Van Kampen Investor Services Inc.: Director, Chief Executive Officer and President, 1371 Preferred Inc. (holding company); and Van Kampen Investments Inc.; Director and President, AIM GP Canada Inc. (general partner for limited partnerships); and Van Kampen Advisors, Inc.; Director and Chief Executive Officer, Invesco Trimark Dealer Inc. (registered broker dealer); Director, Invesco Distributors, Inc. (formerly known as Invesco Aim Distributors, Inc.) (registered broker dealer); Manager, Invesco PowerShares Capital Management LLC; Director, Chief Executive Officer and President, Invesco Advisers, Inc.; Director, Chairman, Chief Executive Officer and President, Invesco Aim Capital Management, Inc.; President, Invesco Trimark Dealer Inc. and Invesco Trimark Ltd./Invesco Trimark Ltèe; Director and President, AIM Trimark Corporate Class Inc. and AIM Trimark Canada Fund Inc.; Senior Managing Director, Invesco Holding Company Limited; Trustee and Executive Vice President, Tax-Free Investments Trust; Director and Chairman, Fund Management Company (former registered broker dealer); President and Principal Executive Officer, The Invesco Funds (AIM Treasurer’s Series Trust (Invesco Treasurer’s Series Trust), Short-Term Investments Trust and Tax-Free Investments Trust only); President, AIM Trimark Global Fund Inc. and AIM Trimark Canada Fund Inc. | 124 | None | ||||
Wayne W. Whalen3 — 1939 Trustee | 2010 | Of Counsel, and prior to 2010, partner in the law firm of Skadden, Arps, Slate, Meagher & Flom LLP, legal counsel to certain funds in the Fund Complex
| 137 | Director of the Mutual Fund Directors Forum, a nonprofit membership organization for investment directors; Chairman and Director of the Abraham Lincoln Presidential Library Foundation; and Director of the Stevenson Center for Democracy |
| 1 | Mr. Flanagan is considered an interested person of the Trust because he is an officer of the adviser to the Trust, and an officer and a director of Invesco Ltd., ultimate parent of the adviser to the Trust. |
| 2 | Mr. Taylor is considered an interested person of the Trust because he is an officer and a director of the adviser to, and a director of the principal underwriter of, the Trust. |
| 3 | Mr. Whalen is considered an “interested person” (within the meaning of Section 2(a)(19) of the 1940 Act) of certain Funds in the Invesco Fund Complex by reason of he and his firm currently providing legal services as legal counsel to such Funds in the Invesco Fund Complex. |
T-1 Invesco Leaders Fund
Trustees and Officers—(continued)
| Name, Year of Birth and Position(s) Held with the Trust | Trustee and/ or Officer Since | Principal Occupation(s) During Past 5 Years | Number of Funds in Fund Complex Overseen by Trustee | Other Directorship(s) Held by Trustee During Past 5 Years | ||||
| Independent Trustees | ||||||||
Bruce L. Crockett — 1944 Trustee and Chair | 2001 | Chairman, Crockett Technologies Associates (technology consulting company)
Formerly: Director, Captaris (unified messaging provider); Director, President and Chief Executive Officer COMSAT Corporation; and Chairman, Board of Governors of INTELSAT (international communications company) | 124 | ACE Limited (insurance company); and Investment Company Institute | ||||
David C. Arch — 1945 Trustee | 2010 | Chairman and Chief Executive Officer of Blistex Inc., (consumer health care products manufacturer)
Formerly: Member of the Heartland Alliance Advisory Board, a nonprofit organization serving human needs based in Chicago | 137 | Board member of the Illinois Manufacturers’ Association; Member of the Board of Visitors, Institute for the Humanities, University of Michigan | ||||
Frank S. Bayley — 1939 Trustee | 1985 | Retired
Formerly: Director, Badgley Funds, Inc. (registered investment company) (2 portfolios) and General Partner and Of Counsel, law firm of Baker & McKenzie, LLP | 124 | Director and Chairman, C.D. Stimson Company (a real estate investment company); Trustee and Overseer, The Curtis institute of Music | ||||
James T. Bunch — 1942 Trustee | 2003 | Managing Member, Grumman Hill Group LLC (family office private equity management)
Formerly: Founder, Green, Manning & Bunch Ltd. (investment banking firm)(1988-2010); Executive Committee, United States Golf Association; and Director, Policy Studies, Inc. and Van Gilder Insurance Corporation | 124 | Chairman, Board of Governors, Western Golf Association; Chairman-elect, Evans Scholars Foundation; and Director, Denver Film Society | ||||
Rodney F. Dammeyer — 1940 Trustee | 2010 | Chairman of CAC, LLC, (private company offering capital investment and management advisory services)
Formerly: Prior to 2001, Managing Partner at Equity Group Corporate Investments; Prior to 1995, Vice Chairman of Anixter International; Prior to 1985, experience includes Senior Vice President and Chief Financial Officer of Household International, Inc., Executive Vice President and Chief Financial Officer of Northwest Industries, Inc. and Partner of Arthur Andersen & Co.; From 1987 to 2010, Director/Trustee of investment companies in the Van Kampen Funds complex | 126 | Director of Quidel Corporation and Stericycle, Inc.; Prior to May 2008, Trustee of The Scripps Research Institute; Prior to February 2008, Director of Ventana Medical Systems, Inc.; Prior to April 2007, Director of GATX Corporation; Prior to April 2004, Director of TheraSense, Inc. | ||||
Albert R. Dowden — 1941 Trustee | 2001 | Director of a number of public and private business corporations, including the Boss Group, Ltd. (private investment and management); Reich & Tang Funds (5 portfolios) (registered investment company); and Homeowners of America Holding Corporation/ Homeowners of America Insurance Company (property casualty company)
Formerly: Director, Continental Energy Services, LLC (oil and gas pipeline service); Director, CompuDyne Corporation (provider of product and services to the public security market) and Director, Annuity and Life Re (Holdings), Ltd. (reinsurance company); Director, President and Chief Executive Officer, Volvo Group North America, Inc.; Senior Vice President, AB Volvo; Director of various public and private corporations; Chairman, DHJ Media, Inc.; Director Magellan Insurance Company; and Director, The Hertz Corporation, Genmar Corporation (boat manufacturer), National Media Corporation; Advisory Board of Rotary Power International (designer, manufacturer, and seller of rotary power engines); and Chairman, Cortland Trust, Inc. (registered investment company) | 124 | Director of Nature’s Sunshine Products, Inc. | ||||
Jack M. Fields — 1952 Trustee | 2001 | Chief Executive Officer, Twenty First Century Group, Inc. (government affairs company); Owner and Chief Executive Officer, Dos Angeles Ranch, L.P. (cattle, hunting, corporate entertainment); and Discovery Global Education Fund (non-profit)
Formerly: Chief Executive Officer, Texana Timber LP (sustainable forestry company); Director of Cross Timbers Quail Research Ranch (non-profit); and member of the U.S. House of Representatives | 124 | Insperity, Inc. (formerly known as Administaff) | ||||
Prema Mathai-Davis — 1950 Trustee | 2001 | Retired
Formerly: Chief Executive Officer, YWCA of the U.S.A. | 124 | None | ||||
Larry Soll — 1942 Trustee | 2003 | Retired
Formerly: Chairman, Chief Executive Officer and President, Synergen Corp. (a biotechnology company) | 124 | None | ||||
Hugo F. Sonnenschein — 1940 Trustee | 2010 | Distinguished Service Professor and President Emeritus of the University of Chicago and the Adam Smith Distinguished Service Professor in the Department of Economics at the University of Chicago
Formerly: President of the University of Chicago | 137 | Trustee of the University of Rochester and a member of its investment committee. Member of the National Academy of Sciences, the American Philosophical Society and a fellow of the American Academy of Arts and Sciences |
T-2 Invesco Leaders Fund
Trustees and Officers—(continued)
| Name, Year of Birth and Position(s) Held with the Trust | Trustee and/ or Officer Since | Principal Occupation(s) During Past 5 Years | Number of Funds in Fund Complex Overseen by Trustee | Other Directorship(s) Held by Trustee During Past 5 Years | ||||
| Independent Trustees—(continued) | ||||||||
Raymond Stickel, Jr. — 1944 Trustee | 2005 | Retired
Formerly: Director, Mainstay VP Series Funds, Inc. (25 portfolios) and Partner, Deloitte & Touche | 124 | None | ||||
| Other Officers | ||||||||
| Russell C. Burk — 1958 Senior Vice President and Senior Officer | 2005 | Senior Vice President and Senior Officer, The Invesco Funds | N/A | N/A | ||||
| John M. Zerr — 1962 Senior Vice President, Chief Legal Officer and Secretary | 2006 | Director, Senior Vice President, Secretary and General Counsel, Invesco Management Group, Inc. (formerly known as Invesco Aim Management Group, Inc.) and Van Kampen Exchange Corp.; Senior Vice President, Invesco Advisers, Inc. (formerly known as Invesco Institutional (N.A.), Inc.) (registered investment adviser); Senior Vice President and Secretary, Invesco Distributors, Inc. (formerly known as Invesco Aim Distributors, Inc.); Director, Vice President and Secretary, Invesco Investment Services, Inc. (formerly known as Invesco Aim Investment Services, Inc.) and IVZ Distributors, Inc. (formerly known as INVESCO Distributors, Inc.); Director and Vice President, INVESCO Funds Group, Inc.; Senior Vice President, Chief Legal Officer and Secretary, The Invesco Funds; Manager, Invesco PowerShares Capital Management LLC; Director, Secretary and General Counsel, Invesco Investment Advisers LLC (formerly known as Van Kampen Asset Management); Secretary and General Counsel, Van Kampen Funds Inc. and Chief Legal Officer, PowerShares Exchange-Traded Fund Trust, PowerShares Exchange-Traded Fund Trust II, PowerShares India Exchange-Traded Fund Trust and PowerShares Actively Managed Exchange-Traded Fund Trust
Formerly: Director and Vice President, Van Kampen Advisors Inc.; Director, Vice President, Secretary and General Counsel Van Kampen Investor Services Inc.; Director, Invesco Distributors, Inc. (formerly known as Invesco Aim Distributors, Inc.); Director, Senior Vice President, General Counsel and Secretary, Invesco Advisers, Inc. and Van Kampen Investments Inc.; Director, Vice President and Secretary, Fund Management Company; Director, Senior Vice President, Secretary, General Counsel and Vice President, Invesco Aim Capital Management, Inc.; Chief Operating Officer and General Counsel, Liberty Ridge Capital, Inc. (an investment adviser); Vice President and Secretary, PBHG Funds (an investment company) and PBHG Insurance Series Fund (an investment company); Chief Operating Officer, General Counsel and Secretary, Old Mutual Investment Partners (a broker-dealer); General Counsel and Secretary, Old Mutual Fund Services (an administrator) and Old Mutual Shareholder Services (a shareholder servicing center); Executive Vice President, General Counsel and Secretary, Old Mutual Capital, Inc. (an investment adviser); and Vice President and Secretary, Old Mutual Advisors Funds (an investment company) | N/A | N/A | ||||
| Karen Dunn Kelley — 1960 Vice President | 2004 | Head of Invesco’s World Wide Fixed Income and Cash Management Group; Senior Vice President, Invesco Management Group, Inc. (formerly known as Invesco Aim Management Group, Inc.) and Invesco Advisers, Inc. (formerly known as Invesco Institutional (N.A.), Inc.) (registered investment adviser); Executive Vice President, Invesco Distributors, Inc. (formerly known as Invesco Aim Distributors, Inc.); Director, Invesco Mortgage Capital Inc., INVESCO Global Asset Management Limited, Invesco Management Company Limited and INVESCO Management S.A.; Vice President, The Invesco Funds (other than AIM Treasurer’s Series Trust (Invesco Treasurer’s Series Trust) and Short-Term Investments Trust); and President and Principal Executive Officer, The Invesco Funds (AIM Treasurer’s Series Trust (Invesco Treasurer’s Series Trust) and Short-Term Investments Trust only)
Formerly: Senior Vice President, Van Kampen Investments Inc.; Vice President, Invesco Advisers, Inc. (formerly known as Invesco Institutional (N.A.), Inc.); Director of Cash Management and Senior Vice President, Invesco Advisers, Inc. and Invesco Aim Capital Management, Inc.; President and Principal Executive Officer, Tax-Free Investments Trust; Director and President, Fund Management Company; Chief Cash Management Officer, Director of Cash Management, Senior Vice President, and Managing Director, Invesco Aim Capital Management, Inc.; Director of Cash Management, Senior Vice President, and Vice President, Invesco Advisers, Inc. and The Invesco Funds (AIM Treasurer’s Series Trust (Invesco Treasurer’s Series Trust), Short-Term Investments Trust and Tax-Free Investments Trust only) | N/A | N/A | ||||
T-3 Invesco Leaders Fund
Trustees and Officers—(continued)
| Name, Year of Birth and Position(s) Held with the Trust | Trustee and/ or Officer Since | Principal Occupation(s) During Past 5 Years | Number of Funds in Fund Complex Overseen by Trustee | Other Directorship(s) Held by Trustee During Past 5 Years | ||||
| Other Officers—(continued) | ||||||||
| Sheri Morris — 1964 Vice President, Treasurer and Principal Financial Officer | 1999 | Vice President, Treasurer and Principal Financial Officer, The Invesco Funds; Vice President, Invesco Advisers, Inc. (formerly known as Invesco Institutional (N.A.), Inc.) (registered investment adviser); and Vice President, PowerShares Exchange-Traded Fund Trust, PowerShares Exchange-Traded Fund Trust II, PowerShares India Exchange-Traded Fund Trust and PowerShares Actively Managed Exchange-Traded Fund Trust
Formerly: Vice President, Invesco Aim Advisers, Inc., Invesco Aim Capital Management, Inc. and Invesco Aim Private Asset Management, Inc.; Assistant Vice President and Assistant Treasurer, The Invesco Funds and Assistant Vice President, Invesco Advisers, Inc., Invesco Aim Capital Management, Inc. and Invesco Aim Private Asset Management, Inc.; and Treasurer, PowerShares Exchange-Traded Fund Trust, PowerShares Exchange-Traded Fund Trust II, PowerShares India Exchange-Traded Fund Trust and PowerShares Actively Managed Exchange-Traded Fund Trust | N/A | N/A | ||||
Yinka Akinsola — 1977 Anti-Money Laundering Compliance Officer | 2011 | Anti-Money Laundering Compliance Officer, Invesco Advisers, Inc. (formerly known as Invesco Institutional (N.A.), Inc.) (registered investment adviser); Invesco Distributors, Inc. (formerly known as Invesco Aim Distributors, Inc.), Invesco Investment Services, Inc. (formerly known as Invesco Aim Investment Services, Inc.), Invesco Management Group, Inc., The Invesco Funds, Invesco Van Kampen Closed-End Funds, Van Kampen Exchange Corp., Van Kampen Funds Inc., PowerShares Exchange-Traded Fund Trust, PowerShares Exchange-Traded Fund Trust II, PowerShares India Exchange-Traded Fund Trust, and PowerShares Actively Managed Exchange-Traded Fund Trust
Formerly: Regulatory Analyst III, Financial Industry Regulatory Authority (FINRA) | N/A | N/A | ||||
| Todd L. Spillane — 1958 Chief Compliance Officer | 2006 | Senior Vice President, Invesco Management Group, Inc. (formerly known as Invesco Aim Management Group, Inc.) and Van Kampen Exchange Corp.; Senior Vice President and Chief Compliance Officer, Invesco Advisers, Inc. (registered investment adviser) (formerly known as Invesco Institutional (N.A.), Inc.); Chief Compliance Officer, The Invesco Funds; Vice President, Invesco Distributors, Inc. (formerly known as Invesco Aim Distributors, Inc.) and Invesco Investment Services, Inc. (formerly known as Invesco Aim Investment Services, Inc.)
Formerly: Chief Compliance Officer, Invesco Van Kampen Closed-End Funds; Senior Vice President, Van Kampen Investments Inc.; Senior Vice President and Chief Compliance Officer, Invesco Aim Advisers, Inc. and Invesco Aim Capital Management, Inc.; Chief Compliance Officer, INVESCO Private Capital Investments, Inc. (holding company), Invesco Private Capital, Inc. (registered investment adviser), Invesco Global Asset Management (N.A.), Inc., Invesco Senior Secured Management, Inc. (registered investment adviser), Van Kampen Investor Services Inc., PowerShares Exchange-Traded Fund Trust, PowerShares Exchange-Traded Fund Trust II, PowerShares India Exchange-Traded Fund Trust and PowerShares Actively Managed Exchange-Traded Fund Trust; and Vice President, Invesco Aim Capital Management, Inc. and Fund Management Company | N/A | N/A |
The Statement of Additional Information of the Trust includes additional information about the Fund’s Trustees and is available upon request, without charge, by calling 1.800.959.4246. Please refer to the Fund’s prospectus for information on the Fund’s sub-advisers.
Office of the Fund 11 Greenway Plaza, Suite 1000 Houston, TX 77046-1173 | Investment Adviser Invesco Advisers, Inc. 1555 Peachtree Street, N.E. Atlanta, GA 30309 | Distributor Invesco Distributors, Inc. 11 Greenway Plaza, Suite 1000 Houston, TX 77046-1173 | Auditors PricewaterhouseCoopers LLP 1201 Louisiana Street, Suite 2900 Houston, TX 77002-5678 | |||
Counsel to the Fund Stradley Ronon Stevens & Young, LLP 2005 Market Street, Suite 2600 Philadelphia, PA 19103-7018 | Counsel to the Independent Trustees Goodwin Procter LLP 901 New York Avenue, N.W. | Transfer Agent Invesco Investment Services, Inc. 11 Greenway Plaza, Suite 1000 Houston, TX 77046-1173 | Custodian State Street Bank and Trust Company 225 Franklin Street Boston, MA 02110-2801 | |||
T-4 Invesco Leaders Fund

Invesco mailing information
Send general correspondence to Invesco Investment Services, Inc., P.O. Box 219078, Kansas City, MO 64121-9078.
Invesco privacy policy
You share personal and financial information with us that is necessary for your transactions and your account records. We take very seriously the obligation to keep that information confidential and private.
Invesco collects nonpublic personal information about you from account applications or other forms you complete and from your transactions with us or our affiliates. We do not disclose information about you or our former customers to service providers or other third parties except to the extent necessary to service your account and in other limited circumstances as permitted by law. For example, we use this information to facilitate the delivery of transaction confirmations, financial reports, prospectuses and tax forms.
Even within Invesco, only people involved in the servicing of your accounts and compliance monitoring have access to your information. To ensure the highest level of confidentiality and security, Invesco maintains physical, electronic and procedural safeguards that meet or exceed federal standards. Special measures, such as data encryption and authentication, apply to your communications with us on our website. More detail is available to you at invesco.com/privacy.
Important notice regarding delivery of security holder documents
To reduce Fund expenses, only one copy of most shareholder documents may be mailed to shareholders with multiple accounts at the same address (Householding). Mailing of your shareholder documents may be householded indefinitely unless you instruct us otherwise. If you do not want the mailing of these documents to be combined with those for other members of your household, please contact Invesco Investment Services, Inc. at 800 959 4246 or contact your financial institution. We will begin sending you individual copies for each account within 30 days after receiving your request.
Fund holdings and proxy voting information
The Fund provides a complete list of its holdings four times in each fiscal year, at the quarter-ends. For the second and fourth quarters, the lists appear in the Fund’s semiannual and annual reports to shareholders. For the first and third quarters, the Fund files the lists with the Securities and Exchange Commission (SEC) on Form N-Q. The most recent list of portfolio holdings is available at invesco.com/completeqtrholdings. Shareholders can also look up the Fund’s Forms N-Q on the SEC website at sec.gov. Copies of the Fund’s Forms N-Q may be reviewed and copied at the SEC Public Reference Room in Washington, D.C. You can obtain information on the operation of the Public Reference Room, including information about duplicating fee charges, by calling 202 551 8090 or 800 732 0330, or by electronic request at the following email address: publicinfo@sec.gov. The SEC file numbers for the Fund are shown below.
A description of the policies and procedures that the Fund uses to determine how to vote proxies relating to portfolio securities is available without charge, upon request, from our Client Services department at 800 959 4246 or at invesco.com/proxyguidelines. The information is also available on the SEC website, sec.gov.
Information regarding how the Fund voted proxies related to its portfolio securities during the 12 months ended June 30, 2012, is available at invesco.com/proxysearch. The information is also available on the SEC website, sec.gov. Invesco Advisers, Inc. is an investment adviser; it provides investment advisory services to individual and institutional clients and does not sell securities. Invesco Distributors, Inc. is the US distributor for Invesco Ltd.’s retail mutual funds, exchange-traded funds and institutional money market funds. Both are wholly owned, indirect subsidiaries of Invesco Ltd. |  | |
| SEC file numbers: 811-02699 and 002-57526 VK-LEA-AR-1 Invesco Distributors, Inc. | ||
| ||||
 | Annual Report to Shareholders | December 31, 2012
| ||
| ||||
| Invesco U.S. Mortgage Fund | ||||
Effective September 24, 2012, Invesco Van Kampen U.S. Mortgage Fund was renamed Invesco U.S. Mortgage Fund.
| ||||
Nasdaq: A: VKMGX n B: VUSBX n C: VUSCX n Y: VUSIX n R5: VUSJX | ||||

Letters to Shareholders
Philip Taylor | Dear Shareholders: This annual report contains information about your Fund and the factors that affected its performance during the reporting period. Inside, you’ll find a discussion from your portfolio managers about how they managed your Fund, performance data for your Fund, a complete list of your Fund’s investments as of the close of the reporting period and other important information. I hope you find this report of interest. The reporting period covered by this report was challenging. As the year began, investors cheered generally positive economic indicators, and markets generally rose. Soon, however, US economic data turned mixed and investors’ attention shifted to the efforts of eurozone governments to implement new policies intended to reduce debt levels, strengthen the banking system and stimulate economic growth. Later in the year, in the US, mixed economic | ||||||||
| data, competing proposals on how to reduce the federal budget deficit and a contentious presidential contest increased investor uncertainty and hindered market performance. Throughout the year, your Fund’s portfolio managers adhered to their long-term investment strategies, and later in this report they explain why your Fund performed as it did during the reporting period. | |||||||||

Adhering to your long-term investment plan can be difficult, particularly during periods of market volatility and economic uncertainty. That’s one reason Invesco suggests investors work with a skilled and trusted financial adviser who is familiar with their financial situation, investment goals and risk tolerance. A good financial adviser can provide insight and perspective when markets are volatile; motivation and reassurance when times are uncertain; and advice and recommendations when your financial situation or investment goals change.
Timely insight and information from many of Invesco’s investment professionals is available at our website, invesco.com/us. We offer in-depth articles, video clips and audio commentaries from many of our portfolio managers and other investment professionals on a wide range of topics of interest to investors. At invesco.com/us, you also can access information about your Invesco account at any time.
What we mean by Intentional Investing
At Invesco, all of our people and all of our resources are dedicated to helping investors achieve their financial objectives. It’s a philosophy we call Intentional Investing®, and it guides the way we:
| n | Manage investments – Our dedicated investment professionals search the world for the best opportunities, and each investment team follows a clear, disciplined process to build portfolios and mitigate risk. |
| n | Provide choices – We offer equity, fixed income, asset allocation and alternative strategies so you and your financial adviser can build an investment portfolio designed for your individual needs and goals. |
| n | Connect with you – We’re committed to giving you the expert insights you need to make informed investing decisions, and we are well-equipped to provide high-quality support for investors and advisers. |
Invesco believes in putting investors first, and that’s why investment management is all we do. Our sole focus on managing your money allows your financial adviser to build a portfolio of Invesco funds appropriate for your investment needs and goals now and when your circumstances change.
Have a question?
If you have a question about your account, please contact an Invesco client services representative at 800 959 4246. If you have an Invesco-related question or comment, feel free to email me directly at phil@invesco.com.
All of us at Invesco look forward to serving your investment management needs for many years to come. Thank you for investing with us.
Sincerely,

Philip Taylor
Senior Managing Director, Invesco Ltd.
2 Invesco U.S. Mortgage Fund
Bruce Crockett | Dear Fellow Shareholders: While short-term challenges for the financial markets regularly come and go, it’s clear that significant and longer term economic obstacles remain both here at home and abroad. There appear to be no easy solutions to many of these issues. As a result, the financial markets have had little conviction to respond to what has been slow, yet noticeable improvement in some economic benchmarks in recent months. No one likes uncertainty, especially financial markets. But even in these uncertain times, it appears that investors are still approaching the market with cautious optimism, with some taking on more risk in order to refocus on their long-term savings goals. Maybe this describes you, or perhaps you have been sitting on the sidelines thinking about getting back into the market, but are still a bit hesitant to act because of market uncertainty. | ||||||||

Clearly, risk remains a primary focus for investors of all types. As Trustees of the Invesco Funds, one of our primary responsibilities is to ensure your fund’s adviser is cognizant of the risks in each of the funds it manages. A thoughtful risk management plan may help investors navigate through market turbulence or an economic downturn. This is why we make risk management a critical element of our annual contract renewal process, like the one we complete with Invesco every year.
To be sure, there will always be risks involved with investing, but you shouldn’t let short-term news or your emotions dictate your investments. Because no one can predict with 100% accuracy the movements of financial markets, I strongly encourage you to speak with a professional financial adviser who can assist you in building an investment portfolio that reflects your individual risk tolerance and is designed to help achieve your individual financial objectives.
You can be sure your Board remains committed to doing its part in helping you along the way. In addition to ensuring that your fund’s adviser is focused on the risks in the funds it manages, we also remain committed to managing fund costs and working with your fund’s adviser to provide a compelling and diversified product offering to potentially meet your investing goals.
In that regard, your Board approved a number of fund mergers and the launch of several new funds, including the first Invesco mutual fund available to US retail investors managed by investment professionals at Invesco Perpetual*, one of the largest independent investment managers in the UK.
Let me close by thanking Carl Frischling upon his retirement from the Invesco Funds Board for his 35 years of distinguished service and unwavering commitment to our funds’ shareholders. As always, please contact me at bruce@brucecrockett.comwith any questions or concerns you may have.
On behalf of the Board, we look forward to continuing to represent your interests and serving your investment needs.
Sincerely,

Bruce L.Crockett
Independent Chair
Invesco Funds Board of Trustees
| * | Invesco Perpetual is a business name of Invesco Asset Management Limited (IAML), a registered investment adviser. |
| IAML is a wholly owned, indirect subsidiary of Invesco Ltd. |
3 Invesco U.S. Mortgage Fund
Management’s Discussion of Fund Performance
Performance summary
For the year ended December 31, 2012, Invesco U.S. Mortgage Fund, at net asset value (NAV), outperformed its style-specific index, the Barclays U.S. Mortgage Backed Securities Index. Sector allocation and security selection decisions were each major contributors to the Fund’s outperformance at NAV versus its style-specific benchmark for the year.
Your Fund’s long-term performance appears later in this report.
Fund vs. Indexes
Total returns, 12/31/11 to 12/31/12, at net asset value (NAV). Performance shown does not include applicable contingent deferred sales charges (CDSC) or front-end sales charges, which would have reduced performance.
| Class A Shares | 4.54 | % | |||
| Class B Shares | 3.75 | ||||
| Class C Shares | 3.75 | ||||
| Class Y Shares | 4.87 | ||||
| Class R5 Shares* | 4.80 | ||||
| BofA Merrill Lynch 1-10 Year Treasury Index‚ (Broad Market Index) | 1.87 | ||||
| Barclays U.S. Mortgage Backed Securities Index‚ (Style-Specific Index) | 2.59 |
Source(s): ‚Lipper Inc.
| *Effective September | 24, 2012, Institutional Class shares were renamed Class R5 shares. |
How we invest
The Fund seeks high current income with liquidity and safety of principal. It does this by investing primarily in mortgage-backed securities (MBS) of any maturity or type guaranteed by, or secured by, collateral that is guaranteed by the US government, its agencies, instrumentalities or sponsored corporations (a “federal agency”), and in mortgage-backed securities privately issued in the United States. Fund shares are neither insured nor guaranteed by the US government. The Fund invests from time to time in derivative instruments such as exchange traded interest rate futures contracts. It can also engage in mortgage dollar roll transactions, a form of repurchase agreement activity in the to-be-announced (TBA) market for agency MBS. These strategies are implemented within the risk profile of the guidelines set forth in the Fund’s prospectus.
We believe dynamic and complex fixed income markets may create opportunities for investors that are best captured by independent specialist decision makers interconnected as a global team. We use this philosophy in an effort to generate a total return consisting of income and capital appreciation.
Our security selection is supported by a team of independent specialists. Team members conduct top-down macroeconomic analysis as well as bottom-up analysis on individual securities. Recommendations are communicated to portfolio managers through proprietary technology that allows all investment professionals to communicate in a timely manner.
Portfolio construction begins with a well-defined Fund design that establishes the target investment vehicles for generating the desired “alpha” (the extra return above a specific benchmark) as well as the risk parameters for the Fund. Investment vehicles are evaluated for liquidity and risk versus relative value.
Sell decisions are based on:
| n | A conscious decision to alter the Fund’s macroeconomic risk exposure (for example, duration, yield curve positioning and sector exposure). |
| n | The need to limit or reduce exposure to a particular sector or issuer. |
| n | Degradation of an issuer’s credit quality. |
| n | Realignment of a valuation target. |
| n | Presentation of a better relative value opportunity. |
Market conditions and your Fund
During 2012, most major segments of the US bond market produced positive returns, buoyed by generally slow economic growth, continued low interest rates and investor demand for yield. The US showed positive, if lethargic, economic and employment growth while signs of recession across Europe and Japan, and slowing growth in China, weighed on global demand for US goods and services. With inflation expectations held in check by modest economic and employment growth prospects, the US Federal Reserve (the Fed), along with other major central banks around the world, continued its accommodative monetary policies and bond buying programs aimed at spurring economic activity by keeping interest rates low.
Throughout the year, US Treasuries experienced mild rallies and sell-offs as uncertainties concerning slowing global economies, the US presidential election, the pending “fiscal cliff” and geopolitical risks were reflected in market prices. Nonetheless, Treasury yields remained very low and little changed across the maturity spectrum from the start of the year to its end.
Low yields provided by Treasuries, and increased investor confidence that rates would remain low for an extended period, pushed demand toward segments of the bond market that provided relative value and higher yields than comparable maturity
| Portfolio Composition | |||||
By security type, based on total investments | |||||
US Government Sponsored | |||||
| Mortgage-Backed Securities | 81.3 | % | |||
| Asset-Backed Securities | 16.8 | ||||
| US Treasury Securities | 0.7 | ||||
| Money Market Funds | |||||
| Plus Other Assets Less Liabilities | 1.2 | ||||
Top 10 Fixed Income Issuers*
| |||||
1. Federal National Mortgage Association | 64.0 | % | |||
2. Federal Home Loan Mortgage Corp. | 30.5 | ||||
3. Ginnie Mae REMICs | 7.2 | ||||
4. Freddie Mac REMICs | 6.9 | ||||
5. Fannie Mae REMICs | 5.7 | ||||
6. Government National Mortgage Association | 3.4 | ||||
7. Citigroup Mortgage Loan Trust, Inc. | 2.2 | ||||
8. La Hipotecaria Panamanian Mortgage Trust | 2.2 | ||||
9. Golden Credit Card Trust | 1.8 | ||||
10. First Horizon Mortgage Pass Through Trust | 1.6 | ||||
| Total Net Assets | $553.0 million | ||||
| Total Number of Holdings* | 992 | ||||
The Fund’s holdings are subject to change, and there is no assurance that the Fund will continue to hold any particular security.
*Excluding money market fund holdings.
4 Invesco U.S. Mortgage Fund
Treasuries in return for the additional risks they carry. In lieu of significant rate declines, US bond market returns for 2012 were supported by demand for riskier assets such as corporate bonds and MBS.
In this market environment, the Fund generated positive returns and, at NAV, outperformed its style-specific index, the Barclays U.S. Mortgage Backed Securities Index, for the year. Our sector allocation decisions that incorporated off-benchmark, high quality, short average life collateralized mortgage obligations (CMO) benefited relative return versus the style-specific index, and contributed to a higher-than-index average portfolio yield-to-maturity for the reporting period. We maintained the Fund’s allocation to non-agency residential MBS at 10% to 15% of the portfolio’s market value; this also contributed to relative performance due to a highly supportive supply/demand dynamic and fundamental improvements in the underlying mortgage loans that attracted investors. A sustained allocation to lower duration, high quality commercial mortgage-backed securities (CMBS), which also averaged between 10% to 15% of the portfolio’s market value throughout the year, was another significant contributor to relative results for the same reasons. The Fund’s security selection decisions across the maturity, coupon, vintage and issuer strata of the residential MBS market were also advantageous for relative returns. Among agency MBS, an emphasis on 30-year, fixed rate, lower coupon securities contributed to returns as they benefited from favorable prepayment trends, as well as a very positive market environment in which demand exceeded supply, especially following the Fed’s announcement of an open-ended bond purchasing program for lower coupon agency MBS in September.
The Fund also benefited from incremental income earned by engaging in mortgage dollar roll activity, which involves the Fund selling an MBS to a financial institution, with an agreement to repurchase a substantially similar security at an agreed upon price and date. Excess portfolio cash resulting from the use of this strategy is subsequently invested in short-term instruments to generate additional return for the Fund.
The Fund uses active duration and yield curve positioning for risk management and for generating alpha versus its style-specific benchmark. Duration measures a
portfolio’s price sensitivity to interest rate changes, with a shorter duration portfolio tending to be less sensitive to these changes. During the reporting period, we maintained the portfolio’s duration and yield curve positioning close to that of the style-specific benchmark, on average, but the timing of changes and degree of variance from the benchmark were mild detractors from relative returns as rates fluctuated throughout the reporting period. Buying and selling US Treasury futures contracts was an important tool we used for the management of interest rate risk and to maintain our targeted portfolio duration.
We thank you for your investment in Invesco U.S. Mortgage Fund.
The views and opinions expressed in management’s discussion of Fund performance are those of Invesco Advisers, Inc. These views and opinions are subject to change at any time based on factors such as market and economic conditions. These views and opinions may not be relied upon as investment advice or recommendations, or as an offer for a particular security. The information is not a complete analysis of every aspect of any market, country, industry, security or the Fund. Statements of fact are from sources considered reliable, but Invesco Advisers, Inc. makes no representation or warranty as to their completeness or accuracy. Although historical performance is no guarantee of future results, these insights may help you understand our investment management philosophy.
See important Fund and, if applicable, index disclosures later in this report.
 | Clint Dudley Chartered Financial Analyst, portfolio manager, is manager of Invesco U.S. Mortgage Fund. He joined | |
| Invesco in 1998. Mr. Dudley earned a BBA and an MBA from Baylor University. | ||
 | Jason Marshall Portfolio manager, is manager of Invesco U.S. Mortgage Fund. He joined Invesco in 2007. Mr. Marshall | |
| earned a BS in finance from Indiana University of Pennsylvania and an MBA from Duquesne University. | ||
 | Brian Norris Chartered Financial Analyst, portfolio manager, is manager of Invesco U.S. Mortgage Fund. He joined | |
| Invesco in 2001. Mr. Norris earned a BBA from the University of Louisville. | ||
5 Invesco U.S. Mortgage Fund
Your Fund’s Long-Term Performance
Results of a $10,000 Investment – Oldest Share Class(es)
Fund and index data from 12/31/02
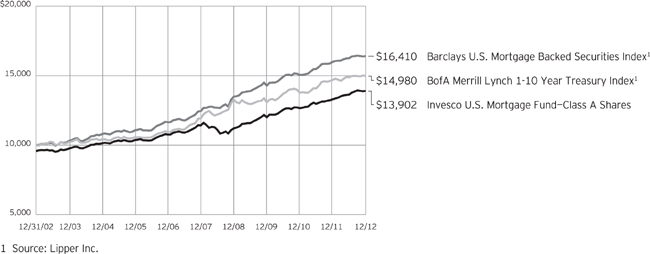
Past performance cannot guarantee comparable future results.
The data shown in the chart include reinvested distributions, applicable sales charges and Fund expenses including
management fees. Index results include reinvested dividends, but they do not reflect sales charges. Performance of the peer group, if applicable, reflects fund expenses and management fees;
performance of a market index does not. Performance shown in the chart and table(s) does not reflect deduction of taxes a shareholder would pay on Fund distributions or sale of Fund shares.
6 Invesco U.S. Mortgage Fund
| Average Annual Total Returns | |||||
As of 12/31/12, including maximum applicable sales charges |
| ||||
| Class A Shares | |||||
| Inception (5/31/84) | 6.91 | % | |||
10 Years | 3.35 | ||||
5 Years | 3.10 | ||||
1 Year | 0.07 | ||||
| Class B Shares | |||||
| Inception (8/24/92) | 4.72 | % | |||
10 Years | 3.16 | ||||
5 Years | 2.87 | ||||
1 Year | -1.25 | ||||
| Class C Shares | |||||
| Inception (8/13/93) | 4.03 | % | |||
10 Years | 3.01 | ||||
5 Years | 3.22 | ||||
1 Year | 2.75 | ||||
| Class Y Shares | |||||
| Inception (9/25/06) | 4.63 | % | |||
5 Years | 4.33 | ||||
1 Year | 4.87 | ||||
| Class R5 Shares | |||||
10 Years | 3.87 | % | |||
5 Years | 4.14 | ||||
1 Year | 4.80 | ||||
Effective June 1, 2010, Class A, Class B, Class C and Class I shares of the predecessor fund, Van Kampen U.S. Mortgage Fund, advised by Van Kampen Asset Management were reorganized into Class A, Class B, Class C
and Class Y shares, respectively, of Invesco Van Kampen U.S. Mortgage Fund. Returns shown above for Class A, Class B, Class C and Class Y shares are blended returns of the predecessor fund and Invesco Van Kampen U.S. Mortgage Fund (renamed Invesco U.S. Mortgage Fund). Share class returns will differ from the predecessor fund because of different expenses.
Class R5 shares incepted on June 1, 2010. Performance shown prior to that date is that of the predecessor fund’s Class A shares and includes the 12b-1 fees applicable to Class A shares. Class A share performance reflects any applicable fee waivers or expense reimbursements.
The performance data quoted represent past performance and cannot guarantee comparable future results; current performance may be lower or higher. Please visit invesco.com/performance for the most recent month-end performance. Performance figures reflect reinvested distributions, changes in net asset value and the effect of the maximum sales charge unless otherwise stated. Investment return and principal value will fluctuate so that you may have a gain or loss when you sell shares.
The total annual Fund operating expense ratio set forth in the most recent Fund prospectus as of the date
of this report for Class A, Class B, Class C, Class Y and Class R5 shares was 0.90%, 1.66%, 1.66%, 0.66% and 0.63%, respectively. The expense ratios presented above may vary from the expense ratios presented in other sections of this report that are based on expenses incurred during the period covered by this report.
Class A share performance reflects the maximum 4.25% sales charge, and Class B and Class C share performance reflects the applicable contingent deferred sales charge (CDSC) for the period involved. For shares purchased prior to June 1, 2010, the CDSC on Class B shares declines from 4% at the time of purchase to 0% at the beginning of the seventh year. For shares purchased on or after June 1, 2010, the CDSC on Class B shares declines from 5% at the time of purchase to 0% at the beginning of the seventh year. The CDSC on Class C shares is 1% for the first year after purchase. Class Y and Class R5 shares do not have a front-end sales charge or a CDSC; therefore, performance is at net asset value.
The performance of the Fund’s share classes will differ primarily due to different sales charge structures and class expenses.
continued from page 8
such borrowed money exceeds the interest payable and other expenses of the leverage, the Fund’s net income will be less than if the Fund did not use. The Fund’s use of leverage also may impair the ability of the Fund to maintain its qualification for federal income tax purposes as a regulated investment company. |
| n | US government obligations risk. The Fund may invest in obligations issued by US government agencies and instrumentalities that may receive varying levels of support from the government, which could affect the Fund’s ability to recover should they default. |
About indexes used in this report
| n | The BofA Merrill Lynch 1-10 Year Treasury Index tracks the performance of US Treasury securities with maturities of one to 9.99 years. |
| n | The Barclays U.S. Mortgage Backed Securities Index represents mortgage- backed pass-through securities of Ginnie Mae, Fannie Mae and Freddie Mac. |
| n | The Fund is not managed to track the performance of any particular index, including the index(es) defined here, and consequently, the performance of the Fund may deviate significantly from the performance of the index(es). |
| n | A direct investment cannot be made in an index. Unless otherwise indicated, index results include reinvested dividends, and they do not reflect sales charges. Performance of the peer group, if applicable, reflects fund expenses; performance of a market index does not. |
Other information
| n | The returns shown in management’s discussion of Fund performance are based on net asset values calculated for shareholder transactions. Generally accepted accounting principles require adjustments to be made to the net assets of the Fund at period end for financial reporting purposes, and as such, the net asset values for shareholder transactions and the returns based on those net asset values may differ from the net asset values and returns reported in the Financial Highlights. |
7 Invesco U.S. Mortgage Fund
Invesco U.S. Mortgage Fund’s investment objective is to provide a high level of current income, with liquidity and safety of principal.
| n | Unless otherwise stated, information presented in this report is as of December 31, 2012, and is based on total net assets. |
| n | Unless otherwise noted, all data provided by Invesco. |
| n | To access your Fund’s reports/prospectus, visit invesco.com/fundreports. |
About share classes
| n | Class B shares may not be purchased for new or additional investments. Please see the prospectus for more information. |
| n | Class Y shares are available only to certain investors. Please see the prospectus for more information. |
| n | Class R5 shares are primarily intended for employer sponsored retirement plans and benefit plans that meet certain standards and for institutional investors. On September 24, 2012, Institutional Class shares were renamed Class R5 shares. Please see the prospectus for more information. |
Principal risks of investing in the Fund
| n | Active trading risk. The Fund engages in frequent trading of portfolio securities. Active trading results in added expenses and may result in a lower return and increased tax liability. |
| n | Synthetic securities risk. Fluctuations in the values of synthetic securities may not correlate perfectly with the instruments they are designed to replicate. Synthetic securities may be subject to interest rate changes, market price fluctuations, counterparty risk and liquidity risk. |
| n | Market risk. Market risk is the possibility that the market values of securities owned by the Fund will decline. The prices of debt securities tend to fall as interest rates rise, and such declines tend to be greater among debt securities with longer maturities or longer durations. The yields and market prices of US government securities may move differently and adversely compared to the yields and market prices of the overall debt securities markets. US government securities, while backed by the US government, are not guaranteed against declines in their market prices. |
| n | Mortgage- and asset-backed securities risk. The Fund may invest in mortgage- and asset-backed securities that are subject to prepayment or call risk, |
which is the risk that the borrower’s payments may be received earlier or later than expected due to changes in prepayment rates on underlying loans. Faster prepayments often happen when interest rates are falling. As a result, the Fund may reinvest these early payments at lower interest rates, thereby reducing the Fund’s income. Conversely, when interest rates rise, prepayments may happen more slowly, causing the security to lengthen in duration. Longer duration securities tend to be more volatile. Securities may be prepaid at a price less than the original purchase value. An unexpectedly high rate of defaults on the mortgages held by a mortgage pool may adversely affect the value of mortgage-backed securities and could result in losses to the Fund. The risk of such defaults is generally higher in the case of mortgage pools that include subprime mortgages. Subprime mortgages refer to loans made to borrowers with weakened credit histories or with lower capacity to make timely payments on their mortgages.
| n | Credit risk. Credit risk refers to an issuer’s ability to make timely payments of interest and principal. Credit risk should be low for the Fund because it invests primarily in obligations issued or guaranteed by the US government, its agencies or instrumentalities. |
| n | Income risk. The income you receive from the Fund is based primarily on interest rates, which can vary widely over the short and long term. If interest rates drop, your income from the Fund may drop as well. The more the Fund invests in adjustable, variable or floating rate securities or in securities susceptible to prepayment risk, the greater the Fund’s income risk. |
| n | Prepayment risk. If interest rates fall, the principal on debt securities held by the Fund may be paid earlier than expected. If this happens, the proceeds from a prepaid security would likely be |
This report must be accompanied or preceded by a currently effective Fund prospectus, which contains more complete information, including sales charges and expenses. Investors should read it carefully before investing.
NOT FDIC INSURED | MAY LOSE VALUE | NO BANK GUARANTEE
reinvested by the Fund in securities bearing the new, lower interest rates, resulting in a possible decline in the Fund’s income and distributions to shareholders. |
| n | Extension risk. The prices of debt securities tend to fall as interest rates rise. For mortgage-backed securities, if interest rates rise, borrowers may prepay mortgages more slowly than originally expected. This may further reduce the market value of the securities and lengthen their durations. |
| n | Derivative instruments risk. The performance of derivative instruments is tied to the performance of an underlying currency, security, index or other instrument. In addition to risks relating to their underlying instruments, the use of derivatives may include other, possibly greater, risks. Derivatives involve costs, may be volatile, and may involve a small initial investment relative to the risk assumed. Risks associated with the use of derivatives include counterparty, leverage, correlation, liquidity, tax, market, interest rate and management risks. Derivatives may also be more difficult to purchase, sell or value than other investments. The Fund may lose more than the cash amount invested on investments in derivatives. Investors should bear in mind that, while the Fund intends to use derivative strategies, it is not obligated to actively engage in these transactions, generally or in any particular kind of derivative, if the investment manager elects not to do so due to availability, cost, market conditions or other factors. |
| n | Borrowing risks. The Fund may borrow money for investment purposes, which is known as leverage. The Fund may use leverage to seek to enhance income to shareholders, but the use of leverage creates the likelihood of greater volatility in the net asset value of the Fund’s shares. To the extent that income from investments made with |
continued on page 7
| Fund Nasdaq Symbols | |||||
| Class A Shares | VKMGX | ||||
| Class B Shares | VUSBX | ||||
| Class C Shares | VUSCX | ||||
| Class Y Shares | VUSIX | ||||
| Class R5 Shares | VUSJX | ||||
8 Invesco U.S. Mortgage Fund
Schedule of Investments
December 31, 2012
Principal Amount | Value | |||||||
U.S. Government Sponsored Mortgage-Backed Securities–120.74% |
| |||||||
| Collateralized Mortgage Obligations–22.83% | ||||||||
Fannie Mae ACES, 0.73%, 08/25/19(a) | $ | 6,753,422 | $ | 6,844,850 | ||||
Fannie Mae Grantor Trust, | 666,189 | 755,548 | ||||||
Fannie Mae Interest STRIPS, | ||||||||
6.50%, 10/01/24, IO | 561,659 | 96,961 | ||||||
8.00%, 05/01/30, IO | 1,737,255 | 338,101 | ||||||
7.50%, 01/01/32, IO | 619,971 | 139,434 | ||||||
Fannie Mae REMICs, | 1,823,994 | 1,861,716 | ||||||
4.50%, 07/25/19 | 1,040,748 | 1,057,838 | ||||||
7.00%, 09/25/32 | 712,822 | 838,570 | ||||||
0.98%, 06/25/37(a) | 8,148,163 | 8,257,943 | ||||||
6.58%, 06/25/39(a) | 2,434,589 | 2,907,879 | ||||||
0.71%, 03/25/40 to 05/25/41(a) | 13,193,372 | 13,292,915 | ||||||
2.00%, 08/25/13, IO | 33,103,292 | 357,641 | ||||||
4.50%, 11/25/23, IO | 19,800,633 | 1,415,704 | ||||||
3.00%, 10/25/26, IO | 7,784,299 | 762,390 | ||||||
8.00%, 08/18/27 to 09/18/27, IO | 2,080,323 | 466,278 | ||||||
6.00%, 08/25/32 to 05/25/33, IO | 500,917 | 28,192 | ||||||
7.00%, 05/25/33, IO | 2,062,955 | 474,941 | ||||||
Freddie Mac REMICs, | 759,230 | 760,627 | ||||||
4.16%, 07/15/17 | 13,138 | 13,135 | ||||||
3.77%, 09/15/17 | 966,908 | 971,087 | ||||||
3.84%, 09/15/17 | 1,511,805 | 1,522,473 | ||||||
4.50%, 06/15/18 | 584,256 | 619,510 | ||||||
3.00%, 10/15/18 to 04/15/26 | 5,301,523 | 5,525,747 | ||||||
3.75%, 10/15/18 | 1,931,335 | 1,989,129 | ||||||
0.61%, 05/15/37(a) | 7,314,377 | 7,360,312 | ||||||
0.66%, 03/15/39(a) | 7,356,350 | 7,397,832 | ||||||
0.71%, 03/15/40(a) | 4,472,587 | 4,520,450 | ||||||
0.76%, 03/15/41(a) | 3,877,701 | 3,908,521 | ||||||
3.00%, 09/15/25, IO | 14,326,778 | 1,061,600 | ||||||
2.50%, 09/15/27, IO | 6,215,305 | 773,111 | ||||||
2.18%, 04/15/38, IO(a) | 25,128,536 | 1,329,770 | ||||||
4.00%, 12/15/41, IO | 5,117,280 | 651,751 | ||||||
Freddie Mac STRIPS, 8.00%, 06/01/31 | 2,806,798 | 568,223 | ||||||
Freddie Mac Structured Pass Through Securities, | ||||||||
6.50%, 02/25/43 | 3,220,563 | 3,817,642 | ||||||
1.54%, 07/25/44(a) | 3,461,303 | 3,549,856 | ||||||
Ginnie Mae REMICs, | ||||||||
4.00%, 04/16/33 | 1,889,920 | 1,986,254 | ||||||
4.50%, 10/20/33 | 1,093,111 | 1,137,705 | ||||||
5.85%, 01/20/39(a) | 4,377,099 | 5,095,445 | ||||||
1.21%, 02/16/39 to 07/20/39(a) | 9,737,175 | 9,981,860 | ||||||
4.51%, 07/20/41(a) | 8,848,870 | 10,041,884 | ||||||
0.59%, 03/20/42(a) | 11,675,625 | 11,778,826 | ||||||
2.00%, 01/16/13, IO | 64,692,390 | 10,629 | ||||||
| 126,270,280 | ||||||||
Principal Amount | Value | |||||||
| Federal Home Loan Mortgage Corp. (FHLMC)–30.51% | ||||||||
Pass Through Ctfs., | ||||||||
5.00%, 10/01/18 to 06/01/40 | $ | 27,629,566 | $ | 30,042,152 | ||||
6.50%, 07/01/14 to 08/01/33 | 1,366,262 | 1,564,549 | ||||||
8.50%, 01/01/17 to 08/01/31 | 893,781 | 1,080,770 | ||||||
7.50%, 01/01/20 to 05/01/35 | 959,771 | 1,172,763 | ||||||
3.50%, 08/01/26 | 1,868,762 | 2,002,534 | ||||||
6.00%, 03/01/29 | 13,437 | 14,944 | ||||||
8.00%, 08/01/32 | 527,707 | 652,794 | ||||||
5.50%, 12/01/36 | 1,692,635 | 1,831,957 | ||||||
4.50%, 05/01/38 to 02/01/42 | 21,416,006 | 23,234,473 | ||||||
5.35%, 07/01/38 to 10/17/38 | 7,119,279 | 7,830,519 | ||||||
5.80%, 10/01/38 to 01/20/39 | 6,658,851 | 7,495,632 | ||||||
5.45%, 11/25/38 | 6,117,090 | 6,743,924 | ||||||
3.39%, 03/01/41(a) | 1,194,358 | 1,259,046 | ||||||
3.00%, 01/01/43(b)(c) | 7,900,000 | 8,261,672 | ||||||
Pass Through Ctfs., ARM, | ||||||||
2.93%, 07/01/36 to 05/01/37(a) | 6,928,713 | 7,426,696 | ||||||
3.15%, 02/01/37(a) | 537,682 | 569,749 | ||||||
3.26%, 03/01/37(a) | 1,541,891 | 1,648,438 | ||||||
3.01%, 11/01/37(a) | 3,717,895 | 4,011,732 | ||||||
5.32%, 01/01/38(a) | 720,764 | 762,697 | ||||||
Pass Through Ctfs., TBA | ||||||||
2.50%, 01/01/28(b)(c) | 8,000,000 | 8,351,250 | ||||||
3.50%, 01/01/43(b)(c) | 21,500,000 | 22,868,946 | ||||||
4.00%, 01/01/43(b)(c) | 28,000,000 | 29,898,750 | ||||||
| 168,725,987 | ||||||||
| Federal National Mortgage Association (FNMA)–64.00% | ||||||||
Pass Through Ctfs., | ||||||||
5.00%, 03/01/22 to 01/01/41 | 22,190,702 | 24,173,596 | ||||||
7.00%, 05/01/13 to 07/01/34 | 709,857 | 835,082 | ||||||
6.50%, 11/01/13 to 11/01/38 | 11,179,558 | 12,787,257 | ||||||
6.00%, 01/01/14 to 05/01/40 | 13,042,755 | 14,314,011 | ||||||
8.50%, 08/01/14 to 10/01/32 | 1,196,618 | 1,468,620 | ||||||
7.50%, 04/01/15 to 08/01/37 | 1,489,628 | 1,812,506 | ||||||
13.00%, 06/01/15 | 32,047 | 34,651 | ||||||
4.50%, 05/01/19 to 01/01/40 | 22,091,897 | 24,080,989 | ||||||
8.00%, 07/01/20 to 04/01/33 | 1,315,457 | 1,625,390 | ||||||
5.50%, 11/01/22 to 04/01/38 | 33,428,316 | 36,689,698 | ||||||
4.00%, 06/01/24 to 02/01/42 | 14,783,356 | 16,020,546 | ||||||
9.50%, 04/01/30 | 208,972 | 252,120 | ||||||
5.45%, 01/01/38 | 2,027,207 | 2,278,140 | ||||||
5.63%, 03/01/41 | 1,231,489 | 1,406,378 | ||||||
Pass Through Ctfs., ARM | ||||||||
3.25%, 03/01/36(a) | 11,339,204 | 12,210,755 | ||||||
2.82%, 03/01/38(a) | 594,000 | 630,907 | ||||||
2.45%, 02/01/39(a) | 8,315,500 | 8,774,508 | ||||||
Pass Through Ctfs., BAL | ||||||||
3.84%, 04/01/18(c) | 3,293,608 | 3,693,451 | ||||||
See accompanying Notes to Financial Statements which are an integral part of the financial statements.
9 Invesco U.S. Mortgage Fund
Principal Amount | Value | |||||||
| Federal National Mortgage Association (FNMA)–(continued) | ||||||||
Pass Through Ctfs., TBA | ||||||||
2.50%, 01/01/28(b)(c) | $ | 8,000,000 | $ | 8,367,500 | ||||
3.00%, 01/01/28 to 01/01/43(b)(c) | 43,700,000 | 45,925,563 | ||||||
3.50%, 01/01/43(b)(c) | 52,300,000 | 55,775,089 | ||||||
4.00%, 01/01/43(b)(c) | 29,750,000 | 31,897,578 | ||||||
4.50%, 02/01/43(b)(c) | 45,275,000 | 48,891,694 | ||||||
| 353,946,029 | ||||||||
| Government National Mortgage Association (GNMA)–3.40% | ||||||||
Pass Through Ctfs., | ||||||||
13.00%, 09/15/13 to 05/15/15 | 3,510 | 3,540 | ||||||
9.00%, 11/15/15 to 08/15/24 | 1,050,439 | 1,108,396 | ||||||
9.50%, 02/15/16 to 08/15/22 | 627,948 | 655,320 | ||||||
8.00%, 05/15/16 to 12/15/21 | 645,089 | 676,192 | ||||||
8.50%, 02/20/17 | 2,419 | 2,686 | ||||||
7.00%, 08/15/22 to 01/15/29 | 593,733 | 703,811 | ||||||
6.50%, 04/15/26 to 11/15/28 | 326,765 | 378,565 | ||||||
6.00%, 01/15/28 to 04/20/29 | 1,188,250 | 1,336,133 | ||||||
5.50%, 05/15/33 to 10/15/34 | 2,454,980 | 2,714,667 | ||||||
5.00%, 11/20/37 | 5,828,007 | 6,358,732 | ||||||
Pass Through Ctfs., TBA | ||||||||
3.50%, 01/01/43(b)(c) | 4,500,000 | 4,890,586 | ||||||
| 18,828,628 | ||||||||
Total U.S. Government Sponsored Mortgage- |
| 667,770,924 | ||||||
Asset-Backed Securities–24.90% |
| |||||||
American Home Mortgage Investment Trust, Series 2005-1, Class 7A1, Floating Rate Pass Through Ctfs., 2.51%, 06/25/45(a) | 2,410,216 | 2,404,056 | ||||||
ARI Fleet Lease Trust, Series 2012-A, Class A, Floating Rate Pass Through Ctfs., 0.76%, | 3,721,947 | 3,733,288 | ||||||
BAMLL-DB Trust, Series 2012-OSI, Class A2FX, Pass Through Ctfs., 3.35%, 04/13/29(d) | 4,997,674 | 5,296,825 | ||||||
Banc of America Merrill Lynch Commercial Mortgage Inc., Series 2005-1, Class A4, Variable Rate Pass Through Ctfs., 5.08%, 11/10/42(a) | 775,000 | 790,956 | ||||||
BCAP LLC Trust, Series 2012-RR6, Class 4A3, Floating Rate Pass Through Ctfs., | 5,379,202 | 5,072,588 | ||||||
Bear Stearns Commercial Mortgage Securities, Series 2005-PWR7, Class AJ, Variable Rate Pass Through Ctfs., 5.17%, 02/11/41(a) | 3,050,000 | 3,145,186 | ||||||
Series 2006-PW11, Class A4, Variable Rate Pass Through Ctfs., 5.45%, 03/11/39(a) | 3,347,000 | 3,784,244 | ||||||
Bear Stearns Mortgage Funding Trust, Series 2006-AR2, Class 1A1, Floating Rate Pass Through Ctfs., 0.41%, 09/25/46(a) | 155,622 | 90,719 | ||||||
Principal Amount | Value | |||||||
CHL Mortgage Pass Through Trust, Series 2004-29, Class 1A1, Floating Rate Pass Through Ctfs., 0.75%, 02/25/35(a) | $ | 950,997 | $ | 875,715 | ||||
Citigroup Mortgage Loan Trust, Inc., | 1,147,380 | 1,138,018 | ||||||
Series 2009-12, Class 5A1, Pass Through Ctfs., 5.50%, 07/25/37(d) | 6,131,201 | 6,483,745 | ||||||
Series 2012-6, Class 2A1, Floating Rate Pass Through Ctfs., 2.75%, 08/25/36(a)(d) | 4,496,374 | 4,595,355 | ||||||
Commercial Mortgage Asset Trust, Series 1999-C1, Class A4, Variable Rate Pass Through Ctfs., 6.98%, 01/17/32(a) | 2,793,046 | 2,805,325 | ||||||
Credit Suisse Mortgage Capital Ctfs., Series 2010-6R, Class 1A1, Pass Through Ctfs., 5.50%, 02/27/37 (Acquired 12/22/10; Cost $608,874)(d) | 591,141 | 627,556 | ||||||
First Horizon Mortgage Pass Through Trust, Series 2005-4, Class 1A5, Pass Through Ctfs., 5.50%, 06/25/21 | 8,771,977 | 8,902,758 | ||||||
Fontainebleau Miami Beach Trust, | 5,000,000 | 5,201,522 | ||||||
Series 2012, Class B, Pass Through Ctfs., 3.88%, 05/05/27(d) | 2,000,000 | 2,096,874 | ||||||
GE Capital Commercial Mortgage Corp., Series 2004-C2, Class A4, Pass Through Ctfs., 4.89%, 03/10/40 | 800,000 | 834,094 | ||||||
Golden Credit Card Trust, | 5,000,000 | 5,149,224 | ||||||
Series 2012-5A, Class A, Pass Through Ctfs., 0.79%, 09/15/17(d) | 5,000,000 | 5,015,818 | ||||||
GS Mortgage Securities Corp. Trust, | 1,830,000 | 2,064,543 | ||||||
Series 2012-ALOH, Class B, Pass Through Ctfs., 4.05%, 04/10/34(d) | 6,198,000 | 6,776,850 | ||||||
JP Morgan Chase Commercial Mortgage Securities Corp. Trust, | 2,200,000 | 2,526,077 | ||||||
Series 2012-LC9, Class B, Variable Rate Pass Through Ctfs., 3.81%, 12/15/47(a)(d) | 5,000,000 | 5,128,117 | ||||||
JP Morgan Resecuritization Trust, Series 2009-7, Class 5A1, Variable Rate Pass Through Ctfs., 6.00%, 02/27/37 (Acquired 08/23/11; Cost $1,907,536)(a)(d) | 1,870,133 | 1,917,772 | ||||||
La Hipotecaria Panamanian Mortgage Trust (Panama), Series 2010-1GA, Class A, Floating Rate Pass Through Ctfs., 3.00%, 09/08/39 (Acquired 11/05/10-06/25/12; Cost $12,083,585)(a)(d) | 11,679,473 | 12,175,850 | ||||||
See accompanying Notes to Financial Statements which are an integral part of the financial statements.
10 Invesco U.S. Mortgage Fund
Principal Amount | Value | |||||||
LB-UBS Commercial Mortgage Trust, Series 2006-C4, Class AM, Variable Rate Pass Through Ctfs., 5.89%, 06/15/38(a) | $ | 2,945,000 | $ | 3,329,381 | ||||
Luminent Mortgage Trust, Series 2006-1, Class A1, Floating Rate Pass Through Ctfs., 0.45%, 04/25/36(a) | 125,691 | 74,031 | ||||||
Merrill Lynch Mortgage Investors Trust, | 414,464 | 399,932 | ||||||
Series 2005-A, Class A1, Floating Rate Pass Through Ctfs., 0.67%, 03/25/30(a) | 2,673,700 | 2,633,378 | ||||||
Morgan Stanley Capital I Trust, Series 2005-HQ7, Class AJ, Variable Rate Pass Through Ctfs., 5.21%, | 2,615,000 | 2,751,259 | ||||||
RALI Trust, Series 2006-QO2, Class A2, Floating Rate Pass Through Ctfs., 0.48%, 02/25/46(a) | 82,203 | 37,508 | ||||||
RBSSP Resecuritization Trust, Series 2010-1, Class 2A1, Floating Rate Pass Through Ctfs., 2.59%, 07/26/45 (Acquired 01/31/11; | 4,185,982 | 4,296,538 | ||||||
Sequoia Mortgage Trust, | 3,799,471 | 3,907,574 | ||||||
Series 2012-2, Class A1, Variable Rate Pass Through Ctfs., 3.50%, 04/25/42(a) | 4,091,401 | 4,253,983 | ||||||
Structured Adjustable Rate Mortgage Loan Trust, | 958,068 | 795,762 | ||||||
Series 2004-6, Class 3A2, Floating Rate Pass Through Ctfs., 2.71%, 06/25/34(a) | 6,236,673 | 6,243,493 | ||||||
Principal Amount | Value | |||||||
Structured Asset Mortgage Investments, Inc., Series 2005-AR2, Class 2A1, Floating Rate Pass Through Ctfs., 0.44%, 05/25/45(a) | $ | 2,364,164 | $ | 1,709,990 | ||||
Wachovia Bank Commercial Mortgage Trust, | 2,525,475 | 2,598,006 | ||||||
Series 2005-C21, Class AJ, Variable Rate Pass Through Ctfs., 5.24%, 10/15/44(a) | 1,254,000 | 1,337,281 | ||||||
Wells Fargo Mortgage Backed Securities Trust, Series 2004-K, Class 1A2, Floating Rate Pass Through Ctfs., 2.62%, 07/25/34(a) | 4,560,875 | 4,681,645 | ||||||
Total Asset-Backed Securities (Cost $133,230,129) |
| 137,682,836 | ||||||
U.S. Treasury Notes–1.11% |
| |||||||
3.25%, 12/31/16(e) | 1,000,000 | 1,107,605 | ||||||
0.75%, 12/31/17 | 5,000,000 | 5,009,206 | ||||||
Total U.S. Treasury Notes |
| 6,116,811 | ||||||
| Shares | ||||||||
Money Market Funds–1.77% |
| |||||||
Liquid Assets Portfolio–Institutional Class(f) | 4,902,956 | 4,902,956 | ||||||
Premier Portfolio–Institutional Class(f) | 4,902,956 | 4,902,956 | ||||||
Total Money Market Funds |
| 9,805,912 | ||||||
TOTAL INVESTMENTS–148.52% |
| 821,376,483 | ||||||
OTHER ASSETS LESS LIABILITIES–(48.52)% |
| (268,328,005 | ) | |||||
NET ASSETS–100.00% | $ | 553,048,478 | ||||||
Investment Abbreviations:
| ACES | – Automatically Converted Extendable Security | |
| ARM | – Adjustable Rate Mortgage | |
| BAL | – Balloon | |
| Ctfs. | – Certificates | |
| IO | – Interest Only | |
| REMIC | – Real Estate Mortgage Investment Conduits | |
| STRIPS | – Separately Traded Registered Interest and Principal Security | |
| TBA | – To Be Announced |
Notes to Schedule of Investments:
| (a) | Interest or dividend rate is redetermined periodically. Rate shown is the rate in effect on December 31, 2012. |
| (b) | This security is subject to dollar roll transactions. See Note 1H. |
| (c) | Security purchased on a forward commitment basis. |
| (d) | Security purchased or received in a transaction exempt from registration under the Securities Act of 1933, as amended. The security may be resold pursuant to an exemption from registration under the 1933 Act, typically to qualified institutional buyers. The aggregate value of these securities at December 31, 2012 was $73,567,922, which represented 13.30% of the Fund’s Net Assets. |
| (e) | All or a portion of the value was pledged as collateral to cover margin requirements for open futures contracts. See Note 1I and Note 4. |
| (f) | The money market fund and the Fund are affiliated by having the same investment adviser. |
See accompanying Notes to Financial Statements which are an integral part of the financial statements.
11 Invesco U.S. Mortgage Fund
Statement of Assets and Liabilities
December 31, 2012
Assets: |
| |||
Investments, at value (Cost $797,109,247) | $ | 811,570,571 | ||
Investments in affiliated money market funds, at value and cost | 9,805,912 | |||
Total investments, at value (Cost $806,915,159) | 821,376,483 | |||
Receivable for: | ||||
Investments sold | 48,928,126 | |||
Variation margin | 147,710 | |||
Fund shares sold | 104,819 | |||
Dividends and interest | 2,399,046 | |||
Principal paydowns | 242,864 | |||
Investment for trustee deferred compensation and retirement plans | 16,216 | |||
Other assets | 160,161 | |||
Total assets | 873,375,425 | |||
Liabilities: | ||||
Payable for: | ||||
Investments purchased | 318,969,474 | |||
Fund shares reacquired | 559,446 | |||
Amount due custodian | 10,936 | |||
Dividends | 408,093 | |||
Accrued fees to affiliates | 264,199 | |||
Accrued other operating expenses | 65,459 | |||
Trustee deferred compensation and retirement plans | 49,340 | |||
Total liabilities | 320,326,947 | |||
Net assets applicable to shares outstanding | $ | 553,048,478 | ||
Net assets consist of: | ||||
Shares of beneficial interest | $ | 660,081,227 | ||
Undistributed net investment income | 309,981 | |||
Undistributed net realized gain (loss) | (122,265,170 | ) | ||
Unrealized appreciation | 14,922,440 | |||
| $ | 553,048,478 | |||
Net Assets: |
| |||
Class A | $ | 531,547,190 | ||
Class B | $ | 5,729,198 | ||
Class C | $ | 12,002,802 | ||
Class Y | $ | 3,759,155 | ||
Class R5 | $ | 10,133 | ||
Shares outstanding, $0.01 par value per share, |
| |||
Class A | 40,825,650 | |||
Class B | 442,289 | |||
Class C | 928,431 | |||
Class Y | 287,712 | |||
Class R5 | 776 | |||
Class A: | ||||
Net asset value per share | $ | 13.02 | ||
Maximum offering price per share | ||||
(Net asset value of $13.02 ÷ 95.75%) | $ | 13.60 | ||
Class B: | ||||
Net asset value and offering price per share | $ | 12.95 | ||
Class C: | ||||
Net asset value and offering price per share | $ | 12.93 | ||
Class Y: | ||||
Net asset value and offering price per share | $ | 13.07 | ||
Class R5: | ||||
Net asset value and offering price per share | $ | 13.06 | ||
See accompanying Notes to Financial Statements which are an integral part of the financial statements.
12 Invesco U.S. Mortgage Fund
Statement of Operations
For the year ended December 31, 2012
Investment income: |
| |||
Interest | $ | 16,160,588 | ||
Dividends from affiliated money market funds | 7,742 | |||
Total investment income | 16,168,330 | |||
Expenses: | ||||
Advisory fees | 2,692,677 | |||
Administrative services fees | 161,715 | |||
Custodian fees | 52,396 | |||
Distribution fees: | ||||
Class A | 1,333,223 | |||
Class B | 68,638 | |||
Class C | 107,874 | |||
Transfer agent fees — A, B, C and Y | 673,375 | |||
Transfer agent fees — R5 | 7 | |||
Trustees’ and officers’ fees and benefits | 44,995 | |||
Other | 356,098 | |||
Total expenses | 5,490,998 | |||
Less: Fees waived and expense offset arrangement(s) | (11,945 | ) | ||
Net expenses | 5,479,053 | |||
Net investment income | 10,689,277 | |||
Realized and unrealized gain (loss) from: | ||||
Net realized gain (loss) from: | ||||
Investment securities | 19,117,838 | |||
Futures contracts | (3,580,440 | ) | ||
| 15,537,398 | ||||
Change in net unrealized appreciation (depreciation) of: | ||||
Investment securities | (2,319,588 | ) | ||
Futures contracts | 1,506,111 | |||
| (813,477 | ) | |||
Net realized and unrealized gain | 14,723,921 | |||
Net increase in net assets resulting from operations | $ | 25,413,198 | ||
See accompanying Notes to Financial Statements which are an integral part of the financial statements.
13 Invesco U.S. Mortgage Fund
Statement of Changes in Net Assets
For the years ended December 31, 2012 and 2011
| 2012 | 2011 | |||||||
Operations: |
| |||||||
Net investment income | $ | 10,689,277 | $ | 17,955,889 | ||||
Net realized gain | 15,537,398 | 13,377,276 | ||||||
Change in net unrealized appreciation (depreciation) | (813,477 | ) | (1,277,124 | ) | ||||
Net increase in net assets resulting from operations | 25,413,198 | 30,056,041 | ||||||
Distributions to shareholders from net investment income: | ||||||||
Class A | (23,364,120 | ) | (29,287,480 | ) | ||||
Class B | (244,453 | ) | (423,201 | ) | ||||
Class C | (359,589 | ) | (383,212 | ) | ||||
Class Y | (123,984 | ) | (112,876 | ) | ||||
Class R5 | (454 | ) | (542 | ) | ||||
Total distributions from net investment income | (24,092,600 | ) | (30,207,311 | ) | ||||
Share transactions-net: | ||||||||
Class A | (34,601,710 | ) | (45,170,010 | ) | ||||
Class B | (2,476,459 | ) | (5,407,147 | ) | ||||
Class C | 2,676,551 | (247,409 | ) | |||||
Class Y | 2,034,214 | (639,614 | ) | |||||
Net increase (decrease) in net assets resulting from share transactions | (32,367,404 | ) | (51,464,180 | ) | ||||
Net increase (decrease) in net assets | (31,046,806 | ) | (51,615,450 | ) | ||||
Net assets: | ||||||||
Beginning of year | 584,095,284 | 635,710,734 | ||||||
End of year (includes undistributed net investment income of $309,981 and $2,898,968, respectively) | $ | 553,048,478 | $ | 584,095,284 | ||||
Notes to Financial Statements
December 31, 2012
NOTE 1—Significant Accounting Policies
Invesco U.S. Mortgage Fund, formerly Invesco Van Kampen U.S. Mortgage Fund, (the “Fund”) is a series portfolio of AIM Growth Series (Invesco Growth Series) (the “Trust”). The Trust is organized as a Delaware statutory trust and is registered under the Investment Company Act of 1940, as amended (the “1940 Act”), as an open-end series management investment company consisting of sixteen separate series portfolios, each authorized to issue an unlimited number of shares of beneficial interest. The assets, liabilities and operations of each portfolio are accounted for separately. Information presented in these financial statements pertains only to the Fund. Matters affecting each portfolio or class will be voted on exclusively by the shareholders of such portfolio or class.
The Fund’s investment objective is to provide a high level of current income, with liquidity and safety of principal.
The Fund currently consists of five different classes of shares: Class A, Class B, Class C, Class Y and Class R5. On September 24, 2012, the front-end sales charge for Class A shares changed from 4.75% to 4.25% and Institutional Class shares were renamed Class R5 shares. Class A shares are sold with a front-end sales charge unless certain waiver criteria are met and under certain circumstances load waived shares may be subject to contingent deferred sales charges (“CDSC”). Class C shares are sold with a CDSC. Class Y and Class R5 shares are sold at net asset value. Effective November 30, 2010, new or additional investments in Class B shares are no longer permitted. Existing shareholders of Class B shares may continue to reinvest dividends and capital gains distributions in Class B shares until they convert to Class A shares. Also, shareholders in Class B shares will be able to exchange those shares for Class B shares of other Invesco Funds offering such shares until they convert to Class A shares. Generally, Class B shares will automatically convert to Class A shares on or about the month-end, which is at least eight years after the date of purchase. Redemption of Class B shares prior to the conversion date will be subject to a CDSC.
The following is a summary of the significant accounting policies followed by the Fund in the preparation of its financial statements.
| A. | Security Valuations — Securities, including restricted securities, are valued according to the following policy. |
Debt obligations (including convertible bonds) and unlisted equities are fair valued using an evaluated quote provided by an independent pricing service. Evaluated quotes provided by the pricing service may be determined without exclusive reliance on quoted prices, and may reflect appropriate factors such as institution-size trading in similar groups of securities, developments related to specific securities, dividend rate (for unlisted equities), yield (for debt obligations), quality, type of issue, coupon rate (for debt obligations), maturity (for debt obligations), individual trading characteristics and other market data. Debt obligations are subject to interest rate and credit risks. In addition, all debt obligations involve some risk of default with respect to interest and/or principal payments.
14 Invesco U.S. Mortgage Fund
A security listed or traded on an exchange (except convertible bonds) is valued at its last sales price or official closing price as of the close of the customary trading session on the exchange where the security is principally traded, or lacking any sales or official closing price on a particular day, the security may be valued at the closing bid price on that day. Securities traded in the over-the-counter market are valued based on prices furnished by independent pricing services or market makers. When such securities are valued by an independent pricing service they may be considered fair valued. Futures contracts are valued at the final settlement price set by an exchange on which they are principally traded. Listed options are valued at the mean between the last bid and ask prices from the exchange on which they are principally traded. Options not listed on an exchange are valued by an independent source at the mean between the last bid and ask prices. For purposes of determining net asset value per share, futures and option contracts generally are valued 15 minutes after the close of the customary trading session of the New York Stock Exchange (“NYSE”).
Investments in open-end and closed-end registered investment companies that do not trade on an exchange are valued at the end of day net asset value per share. Investments in open-end and closed-end registered investment companies that trade on an exchange are valued at the last sales price or official closing price as of the close of the customary trading session on the exchange where the security is principally traded.
Swap agreements are fair valued using an evaluated quote provided by an independent pricing service. Evaluated quotes provided by the pricing service are valued based on a model which may include end of day net present values, spreads, ratings, industry, and company performance.
Foreign securities’ (including foreign exchange contracts) prices are converted into U.S. dollar amounts using the applicable exchange rates as of the close of the NYSE. If market quotations are available and reliable for foreign exchange-traded equity securities, the securities will be valued at the market quotations. Because trading hours for certain foreign securities end before the close of the NYSE, closing market quotations may become unreliable. If between the time trading ends on a particular security and the close of the customary trading session on the NYSE, events occur that the Adviser determines are significant and make the closing price unreliable, the Fund may fair value the security. If the event is likely to have affected the closing price of the security, the security will be valued at fair value in good faith using procedures approved by the Board of Trustees. Adjustments to closing prices to reflect fair value may also be based on a screening process of an independent pricing service to indicate the degree of certainty, based on historical data, that the closing price in the principal market where a foreign security trade is not the current value as of the close of the NYSE. Foreign securities’ prices meeting the approved degree of certainty that the price is not reflective of current value will be priced at the indication of fair value from the independent pricing service. Multiple factors may be considered by the independent pricing service in determining adjustments to reflect fair value and may include information relating to sector indices, American Depositary Receipts and domestic and foreign index futures. Foreign securities may have additional risks including exchange rate changes, potential for sharply devalued currencies and high inflation, political and economic upheaval, the relative lack of issuer information, relatively low market liquidity and the potential lack of strict financial and accounting controls and standards.
Securities for which market prices are not provided by any of the above methods may be valued based upon quotes furnished by independent sources. The last bid price may be used to value equity securities. The mean between the last bid and asked prices is used to value debt obligations, including corporate loans.
Securities for which market quotations are not readily available or became unreliable are valued at fair value as determined in good faith by or under the supervision of the Trust’s officers following procedures approved by the Board of Trustees. Issuer specific events, market trends, bid/ask quotes of brokers and information providers and other market data may be reviewed in the course of making a good faith determination of a security’s fair value.
Valuations change in response to many factors including the historical and prospective earnings of the issuer, the value of the issuer’s assets, general economic conditions, interest rates, investor perceptions and market liquidity. Because of the inherent uncertainties of valuation, the values reflected in the financial statements may materially differ from the value received upon actual sale of those investments.
| B. | Securities Transactions and Investment Income — Securities transactions are accounted for on a trade date basis. Realized gains or losses on sales are computed on the basis of specific identification of the securities sold. Interest income is recorded on the accrual basis from settlement date. Paydown gains and losses on mortgage and asset-backed securities are recorded as adjustments to interest income. Dividend income (net of withholding tax, if any) is recorded on the ex-dividend date. Bond premiums and discounts are amortized and/or accreted for financial reporting purposes. |
The Fund may periodically participate in litigation related to Fund investments. As such, the Fund may receive proceeds from litigation settlements. Any proceeds received are included in the Statement of Operations as realized gain (loss) for investments no longer held and as unrealized gain (loss) for investments still held.
Brokerage commissions and mark ups are considered transaction costs and are recorded as an increase to the cost basis of securities purchased and/or a reduction of proceeds on a sale of securities. Such transaction costs are included in the determination of net realized and unrealized gain (loss) from investment securities reported in the Statement of Operations and the Statement of Changes in Net Assets and the net realized and unrealized gains (losses) on securities per share in the Financial Highlights. Transaction costs are included in the calculation of the Fund’s net asset value and, accordingly, they reduce the Fund’s total returns. These transaction costs are not considered operating expenses and are not reflected in net investment income reported in the Statement of Operations and Statement of Changes in Net Assets, or the net investment income per share and ratios of expenses and net investment income reported in the Financial Highlights, nor are they limited by any expense limitation arrangements between the Fund and the investment adviser.
The Fund allocates income and realized and unrealized capital gains and losses to a class based on the relative net assets of each class.
| C. | Distributions — Distributions from income are declared daily and paid monthly. Distributions from net realized capital gain, if any, are generally declared and paid annually and recorded on the ex-dividend date. The Fund may elect to treat a portion of the proceeds from redemptions as distributions for federal income tax purposes. |
| D. | Federal Income Taxes — The Fund intends to comply with the requirements of Subchapter M of the Internal Revenue Code necessary to qualify as a regulated investment company and to distribute substantially all of the Fund’s taxable earnings to shareholders. As such, the Fund will not be subject to federal income taxes on otherwise taxable income (including net realized capital gain) that is distributed to shareholders. Therefore, no provision for federal income taxes is recorded in the financial statements. |
15 Invesco U.S. Mortgage Fund
Each Fund files tax returns in the U.S. Federal jurisdiction and certain other jurisdictions. Generally, each Fund is subject to examinations by such taxing authorities for up to three years after the filing of the return for the tax period.
| E. | Expenses — Fees provided for under the Rule 12b-1 plan of a particular class of the Fund are charged to the operations of such class. Transfer agency fees and expenses and other shareholder recordkeeping fees and expenses attributable to Class R5 are charged to such class. Transfer agency fees and expenses and other shareholder recordkeeping fees and expenses relating to all other classes are allocated among those classes based on relative net assets. All other expenses are allocated among the classes based on relative net assets. |
| F. | Accounting Estimates — The preparation of financial statements in conformity with accounting principles generally accepted in the United States of America (“GAAP”) requires management to make estimates and assumptions that affect the reported amounts of assets and liabilities at the date of the financial statements and the reported amounts of revenues and expenses during the reporting period including estimates and assumptions related to taxation. Actual results could differ from those estimates by a significant amount. In addition, the Fund monitors for material events or transactions that may occur or become known after the period-end date and before the date the financial statements are released to print. |
| G. | Indemnifications — Under the Trust’s organizational documents, each Trustee, officer, employee or other agent of the Trust is indemnified against certain liabilities that may arise out of the performance of their duties to the Fund. Additionally, in the normal course of business, the Fund enters into contracts, including the Fund’s servicing agreements, that contain a variety of indemnification clauses. The Fund’s maximum exposure under these arrangements is unknown as this would involve future claims that may be made against the Fund that have not yet occurred. The risk of material loss as a result of such indemnification claims is considered remote. |
| H. | Dollar Rolls and Forward Commitment Transactions — The Fund may enter into dollar roll transactions to enhance the Fund’s performance. The Fund executes its dollar roll transactions in the to be announced (“TBA”) market whereby the Fund makes a forward commitment to purchase a security and, instead of accepting delivery, the position is offset by the sale of the security with a simultaneous agreement to repurchase at a future date. |
The Fund accounts for dollar roll transactions as purchases and sales and realizes gains and losses on these transactions. These transactions increase the Fund’s portfolio turnover rate. The Fund will segregate liquid assets in an amount equal to its dollar roll commitments. Dollar roll transactions are considered borrowings under the 1940 Act.
Dollar roll transactions involve the risk that a counter-party to the transaction may fail to complete the transaction. If this occurs, the Fund may lose the opportunity to purchase or sell the security at the agreed upon price. Dollar rolls transactions also involve the risk that the value of the securities retained by the Fund may decline below the price of the securities that the Fund has sold but is obligated to purchase under the agreement.
| I. | Futures Contracts — The Fund may enter into futures contracts to manage exposure to interest rate, equity and market price movements and/or currency risks. A futures contract is an agreement between two parties to purchase or sell a specified underlying security, currency or commodity (or delivery of a cash settlement price, in the case of an index future) for a fixed price at a future date. The Fund currently invests only in exchange-traded futures and they are standardized as to maturity date and underlying financial instrument. Initial margin deposits required upon entering into futures contracts are satisfied by the segregation of specific securities or cash as collateral at the futures commission merchant (broker). During the period the futures contracts are open, changes in the value of the contracts are recognized as unrealized gains or losses by recalculating the value of the contracts on a daily basis. Subsequent or variation margin payments are received or made depending upon whether unrealized gains or losses are incurred. These amounts are reflected as receivables or payables on the Statement of Assets and Liabilities. When the contracts are closed or expire, the Fund recognizes a realized gain or loss equal to the difference between the proceeds from, or cost of, the closing transaction and the Fund’s basis in the contract. The net realized gain (loss) and the change in unrealized gain (loss) on futures contracts held during the period is included on the Statement of Operations. The primary risks associated with futures contracts are market risk and the absence of a liquid secondary market. If the Fund were unable to liquidate a futures contract and/or enter into an offsetting closing transaction, the Fund would continue to be subject to market risk with respect to the value of the contracts and continue to be required to maintain the margin deposits on the futures contracts. Futures contracts have minimal counterparty risk since the exchange’s clearinghouse, as counterparty to all exchange-traded futures, guarantees the futures against default. Risks may exceed amounts recognized in the Statement of Assets and Liabilities. |
| J. | Other Risks — The Funds may invest in obligations issued by agencies and instrumentalities of the U.S. Government that may vary in the level of support they receive from the government. The government may choose not to provide financial support to government sponsored agencies or instrumentalities if it is not legally obligated to do so. In this case, if the issuer defaulted, the underlying fund holding securities of such issuer might not be able to recover its investment from the U.S. Government. Many securities purchased by the Fund are not guaranteed by the U.S. Government. |
| K. | Collateral — To the extent the Fund has designated or segregated a security as collateral and that security is subsequently sold, it is the Fund’s practice to replace such collateral no later than the next business day. |
16 Invesco U.S. Mortgage Fund
NOTE 2—Advisory Fees and Other Fees Paid to Affiliates
The Trust has entered into a master investment advisory agreement with Invesco Advisers, Inc. (the “Adviser” or “Invesco”). Under the terms of the investment advisory agreement, the Fund pays an advisory fee to the Adviser based on the annual rate of the Fund’s average daily net assets as follows:
| Average Daily Net Assets | Rate | |||||
First $1 billion | 0 | .47% | ||||
Next $500 million | 0 | .445% | ||||
Next $500 million | 0 | .42% | ||||
Next $500 million | 0 | .395% | ||||
Next $2.5 billion | 0 | .37% | ||||
Next $2.5 billion | 0 | .345% | ||||
Next $2.5 billion | 0 | .32% | ||||
Next $2.5 billion | 0 | .295% | ||||
Over $12.5 billion | 0 | .27% | ||||
Under the terms of a master sub-advisory agreement between the Adviser and each of Invesco Asset Management Deutschland GmbH, Invesco Asset Management Limited, Invesco Asset Management (Japan) Limited, Invesco Australia Limited, Invesco Hong Kong Limited, Invesco Senior Secured Management, Inc. and Invesco Canada Ltd. (collectively, the “Affiliated Sub-Advisers”) the Adviser, not the Fund, may pay 40% of the fees paid to the Adviser to any such Affiliated Sub-Adviser(s) that provide(s) discretionary investment management services to the Fund based on the percentage of assets allocated to such Sub-Adviser(s).
Effective July 1, 2012, the Adviser has contractually agreed, through at least June 30, 2013, to waive advisory fees and/or reimburse expenses of all shares to the extent necessary to limit total annual fund operating expenses after fee waiver and/or expense reimbursement (excluding certain items discussed below) of Class A, Class B, Class C, Class Y and Class R5 shares to 1.50%, 2.25%, 2.25%, 1.25% and 1.25%, respectively, of average daily net assets. Prior to July 1, 2012, the Adviser had contractually agreed to waive advisory fees and/or reimburse expenses of all shares to the extent necessary to limit total annual fund operating expenses after fee waiver and/or expense reimbursement (excluding certain items discussed below) of Class A, Class B, Class C, Class Y and Class R5 shares to 0.96%, 1.71%, 1.71%, 0.71% and 0.71%, respectively, of average daily net assets. In determining the Adviser’s obligation to waive advisory fees and/or reimburse expenses, the following expenses are not taken into account, and could cause the total annual fund operating expenses after fee waiver and/or expense reimbursement to exceed the numbers reflected above: (1) interest; (2) taxes; (3) dividend expense on short sales; (4) extraordinary or non-routine items, including litigation expenses; and (5) expenses that the Fund has incurred but did not actually pay because of an expense offset arrangement. Unless the Board of Trustees and Invesco mutually agree to amend or continue the fee waiver agreement, it will terminate on June 30, 2013. The Adviser did not waive fees and/or reimburse expenses during the period under the expense limitation.
Further, the Adviser has contractually agreed, through at least June 30, 2013, to waive the advisory fee payable by the Fund in an amount equal to 100% of the net advisory fees the Adviser receives from the affiliated money market funds on investments by the Fund of uninvested cash in such affiliated money market funds.
For the year ended December 31, 2012, the Adviser waived advisory fees of $9,869.
The Trust has entered into a master administrative services agreement with Invesco pursuant to which the Fund has agreed to pay Invesco for certain administrative costs incurred in providing accounting services to the Fund. For the year ended December 31, 2012, expenses incurred under the agreement are shown in the Statement of Operations as Administrative services fees.
The Trust has entered into a transfer agency and service agreement with Invesco Investment Services, Inc. (“IIS”) pursuant to which the Fund has agreed to pay IIS a fee for providing transfer agency and shareholder services to the Fund and reimburse IIS for certain expenses incurred by IIS in the course of providing such services. IIS may make payments to intermediaries that provide omnibus account services, sub-accounting services and/or networking services. All fees payable by IIS to intermediaries that provide omnibus account services or sub-accounting are charged back to the Fund, subject to certain limitations approved by the Trust’s Board of Trustees. For the year ended December 31, 2012, expenses incurred under the agreement are shown in the Statement of Operations as Transfer agent fees.
Shares of the Fund are distributed by Invesco Distributors, Inc. (“IDI”). The Fund has adopted a distribution plan pursuant to Rule 12b-1 under the 1940 Act, and a service plan (collectively, the “Plans”) for Class A shares, Class B shares and Class C shares to compensate IDI for the sale, distribution, shareholder servicing and maintenance of shareholder accounts for these shares. Under the Plans, the Fund will incur annual fees of up to 0.25% of Class A average daily net assets and up to 1.00% each of Class B and Class C average daily net assets.
With respect to Class B and Class C shares, the Fund is authorized to reimburse in future years any distribution related expenses that exceed the maximum annual reimbursement rate for such class, so long as such reimbursement does not cause the Fund to exceed the Class B and Class C maximum annual reimbursement rate, respectively. With respect to Class A shares, distribution related expenses that exceed the maximum annual reimbursement rate for such class are not carried forward to future years and the Fund will not reimburse IDI for any such expenses.
For the year ended December 31, 2012, expenses incurred under these agreements are shown in the Statement of Operations as Distribution fees.
Front-end sales commissions and CDSC (collectively, the “sales charges”) are not recorded as expenses of the Fund. Front-end sales commissions are deducted from proceeds from the sales of Fund shares prior to investment in Class A shares of the Fund. CDSC are deducted from redemption proceeds prior to remittance to the shareholder. During the year ended December 31, 2012, IDI advised the Fund that IDI retained $21,234 in front-end sales commissions from the sale of Class A shares and $369, $11,094 and $365 from Class A, Class B and Class C shares, respectively, for CDSC imposed on redemptions by shareholders.
Certain officers and trustees of the Trust are officers and directors of the Adviser, IIS and/or IDI.
17 Invesco U.S. Mortgage Fund
NOTE 3—Additional Valuation Information
GAAP defines fair value as the price that would be received to sell an asset or paid to transfer a liability in an orderly transaction between market participants at the measurement date, under current market conditions. GAAP establishes a hierarchy that prioritizes the inputs to valuation methods giving the highest priority to readily available unadjusted quoted prices in an active market for identical assets (Level 1) and the lowest priority to significant unobservable inputs (Level 3) generally when market prices are not readily available or are unreliable. Based on the valuation inputs, the securities or other investments are tiered into one of three levels. Changes in valuation methods may result in transfers in or out of an investment’s assigned level:
| Level 1 — | Prices are determined using quoted prices in an active market for identical assets. |
| Level 2 — | Prices are determined using other significant observable inputs. Observable inputs are inputs that other market participants may use in pricing a security. These may include quoted prices for similar securities, interest rates, prepayment speeds, credit risk, yield curves, loss severities, default rates, discount rates, volatilities and others. |
| Level 3 — | Prices are determined using significant unobservable inputs. In situations where quoted prices or observable inputs are unavailable (for example, when there is little or no market activity for an investment at the end of the period), unobservable inputs may be used. Unobservable inputs reflect the Fund’s own assumptions about the factors market participants would use in determining fair value of the securities or instruments and would be based on the best available information. |
The following is a summary of the tiered valuation input levels, as of December 31, 2012. The level assigned to the securities valuations may not be an indication of the risk or liquidity associated with investing in those securities. Because of the inherent uncertainties of valuation, the values reflected in the financial statements may materially differ from the value received upon actual sale of those investments.
| Level 1 | Level 2 | Level 3 | Total | |||||||||||||
Equity Securities | $ | 9,805,912 | $ | — | $ | — | $ | 9,805,912 | ||||||||
U.S. Treasury Securities | — | 6,116,811 | — | 6,116,811 | ||||||||||||
U.S. Government Sponsored Securities | — | 667,770,924 | — | 667,770,924 | ||||||||||||
Asset-Backed Securities | — | 137,682,836 | — | 137,682,836 | ||||||||||||
| $ | 9,805,912 | $ | 811,570,571 | $ | — | $ | 821,376,483 | |||||||||
Futures* | 461,116 | — | — | 461,116 | ||||||||||||
Total Investments | $ | 10,267,028 | $ | 811,570,571 | $ | — | $ | 821,837,599 | ||||||||
| * | Unrealized appreciation. |
NOTE 4—Derivative Investments
Value of Derivative Instruments at Period-End
The table below summarizes the value of the Fund’s derivative instruments, detailed by primary risk exposure, held as of December 31, 2012:
| Value | ||||||||
| Risk Exposure/Derivative Type | Assets | Liabilities | ||||||
Interest rate risk | ||||||||
Futures contracts(a) | 464,342 | $ | (3,226 | ) | ||||
| (a) | Includes cumulative appreciation (depreciation) of futures contracts. Only current day’s variation margin receivable is reported within the Statement of Assets and Liabilities. |
Effect of Derivative Instruments for the year ended December 31, 2012
The table below summarizes the gains (losses) on derivative instruments, detailed by primary risk exposure, recognized in earnings during the period:
| Location of Gain (Loss) on Statement of Operations | ||||
| Futures* | ||||
Realized Gain (Loss) | ||||
Interest rate risk | $ | (3,580,440 | ) | |
Change in Unrealized Appreciation | ||||
Interest rate risk | $ | 1,506,111 | ||
Total | $ | (2,074,329 | ) | |
| * | The average notional value of futures outstanding during the period was $124,583,917. |
18 Invesco U.S. Mortgage Fund
| Open Futures Contracts | ||||||||||||||||
| Short Contracts | Number of Contracts | Expiration Month | Notional Value | Unrealized Appreciation (Depreciation) | ||||||||||||
U.S. Treasury 2 Year Notes | 182 | March-2013 | $ | (40,125,313 | ) | $ | (3,226 | ) | ||||||||
U.S. Treasury 5 Year Notes | 178 | March-2013 | (22,145,703 | ) | 21,275 | |||||||||||
U.S. Treasury 10 Year Notes | 219 | March-2013 | (29,079,094 | ) | 136,415 | |||||||||||
U.S. Treasury 30 Year Bonds | 67 | March-2013 | (9,882,500 | ) | 171,023 | |||||||||||
Ultra U.S. Treasury Bonds | 43 | March-2013 | (6,991,531 | ) | 135,629 | |||||||||||
Total | $ | 461,116 | ||||||||||||||
NOTE 5—Expense Offset Arrangement(s)
The expense offset arrangement is comprised of transfer agency credits which result from balances in Demand Deposit Accounts (DDA) used by the transfer agent for clearing shareholder transactions. For the year ended December 31, 2012, the Fund received credits from this arrangement, which resulted in the reduction of the Fund’s total expenses of $2,076.
NOTE 6—Trustees’ and Officers’ Fees and Benefits
“Trustees’ and Officers’ Fees and Benefits” include amounts accrued by the Fund to pay remuneration to certain Trustees and Officers of the Fund. Trustees have the option to defer compensation payable by the Fund, and “Trustees’ and Officers’ Fees and Benefits” also include amounts accrued by the Fund to fund such deferred compensation amounts. Those Trustees who defer compensation have the option to select various Invesco Funds in which their deferral accounts shall be deemed to be invested. Finally, certain current Trustees are eligible to participate in a retirement plan that provides for benefits to be paid upon retirement to Trustees over a period of time based on the number of years of service. The Fund may have certain former Trustees who also participate in a retirement plan and receive benefits under such plan. “Trustees’ and Officers’ Fees and Benefits” include amounts accrued by the Fund to fund such retirement benefits. Obligations under the deferred compensation and retirement plans represent unsecured claims against the general assets of the Fund.
NOTE 7—Cash Balances
The Fund may borrow for leveraging in an amount up to 5% of the Fund’s total assets (excluding the amount borrowed) at the time the borrowing is made. In doing so, the Fund is permitted to temporarily carry a negative or overdrawn balance in its account with State Street Bank and Trust Company, the custodian bank. Such balances, if any at period end, are shown in the Statement of Assets and Liabilities under the payable caption Amount due custodian. To compensate the custodian bank for such overdrafts, the overdrawn Fund may either (1) leave funds as a compensating balance in the account so the custodian bank can be compensated by earning the additional interest; or (2) compensate by paying the custodian bank at a rate agreed upon by the custodian bank and Invesco, not to exceed the contractually agreed upon rate. A Fund may not purchase additional securities when any borrowings from banks exceeds 5% of the Fund’s total assets.
NOTE 8—Distributions to Shareholders and Tax Components of Net Assets
Tax Character of Distributions to Shareholders Paid During the Years Ended December 31, 2012 and 2011:
| 2012 | 2011 | |||||||
Ordinary income | $ | 24,092,600 | $ | 30,207,311 | ||||
Tax Components of Net Assets at Period-End:
| 2012 | ||||
Undistributed ordinary income | $ | 359,412 | ||
Net unrealized appreciation — investments | 14,436,417 | |||
Temporary book/tax differences | (47,407 | ) | ||
Capital loss carryforward | (121,781,171 | ) | ||
Shares of beneficial interest | 660,081,227 | |||
Total net assets | $ | 553,048,478 | ||
The difference between book-basis and tax-basis unrealized appreciation (depreciation) is due to differences in the timing of recognition of gains and losses on investments for tax and book purposes. The Fund’s net unrealized appreciation difference is attributable primarily to wash sales, straddles and amortization differences.
The temporary book/tax differences are a result of timing differences between book and tax recognition of income and/or expenses. The Fund’s temporary book/tax differences are the result of the trustee deferral of compensation and retirement plan benefits.
Capital loss carryforward is calculated and reported as of a specific date. Results of transactions and other activity after that date may affect the amount of capital loss carryforward actually available for the Fund to utilize. The Regulated Investment Company Modernization Act of 2010 (the “Act”) eliminated the eight-year carryover period for capital losses that arise in taxable years beginning after its enactment date of December 22, 2010. Consequently, these capital losses can be carried forward for an unlimited period. However, capital losses with an expiration
19 Invesco U.S. Mortgage Fund
period may not be used to offset capital gains until all net capital losses without an expiration date have been utilized. Additionally, post-enactment capital loss carryovers will retain their character as either short-term or long-term capital losses instead of as short-term capital losses as under prior law. The ability to utilize capital loss carryforward in the future may be limited under the Internal Revenue Code and related regulations based on the results of future transactions.
The Fund utilized $6,101,299 of capital loss carryforward in the current period to offset net realized capital gain for federal income tax purposes. The Fund has a capital loss carryforward as of December 31, 2012, which expires as follows:
| Capital Loss Carryforward* | ||||||||||||
| Expiration | Short-Term | Long-Term | Total | |||||||||
December 31, 2014 | $ | 12,228,940 | $ | — | $ | 12,228,940 | ||||||
December 31, 2015 | 18,400,921 | — | 18,400,921 | |||||||||
December 31, 2016 | 91,151,310 | — | 91,151,310 | |||||||||
| $ | 121,781,171 | $ | — | $ | 121,781,171 | |||||||
| * | Capital loss carryforward as of the date listed above is reduced for limitations, if any, to the extent required by the Internal Revenue Code. |
NOTE 9—Investment Securities
The aggregate amount of investment securities (other than short-term securities, U.S. Treasury obligations and money market funds, if any) purchased and sold by the Fund during the year ended December 31, 2012 was $3,754,205,057 and $3,777,245,457, respectively. During the same period, purchases and sales of U.S. Treasury obligations were $32,887,532 and $47,129,352, respectively. Cost of investments on a tax basis includes the adjustments for financial reporting purposes as of the most recently completed federal income tax reporting period-end.
| Unrealized Appreciation (Depreciation) of Investment Securities on a Tax Basis | ||||
Aggregate unrealized appreciation of investment securities | $ | 16,761,644 | ||
Aggregate unrealized (depreciation) of investment securities | (2,325,227 | ) | ||
Net unrealized appreciation of investment securities | $ | 14,436,417 | ||
Cost of investments for tax purposes is $806,940,066.
NOTE 10—Reclassification of Permanent Differences
Primarily as a result of differing book/tax treatment of paydowns and dollar rolls, on December 31, 2012, undistributed net investment income was increased by $10,814,336, undistributed net realized gain (loss) was decreased by $10,786,117 and shares of beneficial interest was decreased by $28,219. This reclassification had no effect on the net assets of the Fund.
20 Invesco U.S. Mortgage Fund
NOTE 11—Share Information
| Summary of Share Activity | ||||||||||||||||
| Years ended December 31, | ||||||||||||||||
| 2012(a) | 2011 | |||||||||||||||
| Shares | Amount | Shares | Amount | |||||||||||||
Sold: | ||||||||||||||||
Class A | 2,288,136 | $ | 29,823,594 | 1,181,560 | $ | 15,642,256 | ||||||||||
Class B | 44,841 | 581,248 | 62,933 | 825,614 | ||||||||||||
Class C | 379,590 | 4,912,241 | 119,135 | 1,549,036 | ||||||||||||
Class Y | 257,700 | 3,370,333 | 48,481 | 634,293 | ||||||||||||
Issued as reinvestment of dividends: | ||||||||||||||||
Class A | 1,271,561 | 16,572,786 | 1,563,145 | 20,469,140 | ||||||||||||
Class B | 15,214 | 197,177 | 26,254 | 341,907 | ||||||||||||
Class C | 19,971 | 258,428 | 22,514 | 292,677 | ||||||||||||
Class Y | 7,390 | 96,732 | 6,210 | 81,604 | ||||||||||||
Automatic conversion of Class B shares to Class A shares: | ||||||||||||||||
Class A | 117,616 | 1,532,967 | 262,472 | 3,423,169 | ||||||||||||
Class B | (118,193 | ) | (1,532,967 | ) | (263,932 | ) | (3,423,169 | ) | ||||||||
Reacquired: | ||||||||||||||||
Class A | (6,333,019 | ) | (82,531,057 | ) | (6,481,123 | ) | (84,704,575 | ) | ||||||||
Class B | (132,927 | ) | (1,721,917 | ) | (242,163 | ) | (3,151,499 | ) | ||||||||
Class C | (192,677 | ) | (2,494,118 | ) | (160,759 | ) | (2,089,122 | ) | ||||||||
Class Y | (109,360 | ) | (1,432,851 | ) | (103,212 | ) | (1,355,511 | ) | ||||||||
Net increase (decrease) in share activity | (2,484,157 | ) | $ | (32,367,404 | ) | (3,958,485 | ) | $ | (51,464,180 | ) | ||||||
| (a) | There are entities that are record owners of more than 5% of the outstanding shares of the Fund and in the aggregate own 19% of the outstanding shares of the Fund. IDI has an agreement with these entities to sell Fund shares. The Fund, Invesco and/or Invesco affiliates may make payments to these entities, which are considered to be related to the Fund, for providing services to the Fund, Invesco and/or Invesco affiliates including but not limited to services such as securities brokerage, distribution, third party record keeping and account servicing. The Fund has no knowledge as to whether all or any portion of the shares owned of record by these entities are also owned beneficially. |
21 Invesco U.S. Mortgage Fund
NOTE 12—Financial Highlights
The following schedule presents financial highlights for a share of the Fund outstanding throughout the periods indicated.
| Net asset value, beginning of period | Net investment income(a) | Net gains (losses) on securities (both realized and unrealized) | Total from investment operations | Dividends from net investment income | Distributions from net realized gains | Total distributions | Net asset value, end of period | Total return | Net assets, end of period (000’s omitted) | Ratio of expenses to average net assets with fee waivers and/or expenses absorbed | Ratio of expenses to average net assets without fee waivers and/or expenses absorbed | Ratio of net investment income to average net assets | Portfolio turnover(b) | |||||||||||||||||||||||||||||||||||||||||||
Class A |
| |||||||||||||||||||||||||||||||||||||||||||||||||||||||
Year ended 12/31/12 | $ | 12.99 | $ | 0.25 | $ | 0.33 | $ | 0.58 | $ | (0.55 | ) | $ | — | $ | (0.55 | ) | $ | 13.02 | 4.54 | %(c) | $ | 531,547 | 0.94 | %(d) | 0.94 | %(d) | 1.88 | %(d) | 451 | % | ||||||||||||||||||||||||||
Year ended 12/31/11 | 13.00 | 0.39 | 0.26 | 0.65 | (0.66 | ) | — | (0.66 | ) | 12.99 | 5.06 | (c) | 564,871 | 0.90 | 0.90 | 2.99 | 395 | |||||||||||||||||||||||||||||||||||||||
Year ended 12/31/10 | 12.75 | 0.40 | 0.28 | 0.68 | (0.43 | ) | — | (0.43 | ) | 13.00 | 5.41 | (c) | 610,214 | 0.91 | 0.91 | 3.07 | 370 | |||||||||||||||||||||||||||||||||||||||
Year ended 12/31/09 | 12.22 | 0.38 | 0.49 | 0.87 | (0.34 | ) | — | (0.34 | ) | 12.75 | 7.19 | (e) | 687,365 | 0.96 | 0.96 | 3.03 | 589 | |||||||||||||||||||||||||||||||||||||||
Year ended 12/31/08 | 13.26 | 0.67 | (0.93 | ) | (0.26 | ) | (0.75 | ) | (0.03 | ) | (0.78 | ) | 12.22 | (1.94 | )(e) | 733,697 | 0.94 | 0.94 | 5.29 | 821 | ||||||||||||||||||||||||||||||||||||
Class B |
| |||||||||||||||||||||||||||||||||||||||||||||||||||||||
Year ended 12/31/12 | 12.93 | 0.15 | 0.32 | 0.47 | (0.45 | ) | — | (0.45 | ) | 12.95 | 3.67 | (c) | 5,729 | 1.69 | (d) | 1.69 | (d) | 1.13 | (d) | 451 | ||||||||||||||||||||||||||||||||||||
Year ended 12/31/11 | 12.92 | 0.29 | 0.27 | 0.56 | (0.55 | ) | — | (0.55 | ) | 12.93 | 4.43 | (c) | 8,186 | 1.66 | 1.66 | 2.23 | 395 | |||||||||||||||||||||||||||||||||||||||
Year ended 12/31/10 | 12.67 | 0.31 | 0.27 | 0.58 | (0.33 | ) | — | (0.33 | ) | 12.92 | 4.64 | (c) | 13,574 | 1.67 | 1.67 | 2.37 | 370 | |||||||||||||||||||||||||||||||||||||||
Year ended 12/31/09 | 12.15 | 0.28 | 0.49 | 0.77 | (0.25 | ) | — | (0.25 | ) | 12.67 | 6.35 | (f) | 22,787 | 1.71 | 1.71 | 2.24 | 589 | |||||||||||||||||||||||||||||||||||||||
Year ended 12/31/08 | 13.19 | 0.58 | (0.94 | ) | (0.36 | ) | (0.66 | ) | (0.02 | ) | (0.68 | ) | 12.15 | (2.70 | )(f) | 30,504 | 1.71 | 1.71 | 4.62 | 821 | ||||||||||||||||||||||||||||||||||||
Class C |
| |||||||||||||||||||||||||||||||||||||||||||||||||||||||
Year ended 12/31/12 | 12.90 | 0.15 | 0.33 | 0.48 | (0.45 | ) | — | (0.45 | ) | 12.93 | 3.75 | (c) | 12,003 | 1.69 | (d) | 1.69 | (d) | 1.13 | (d) | 451 | ||||||||||||||||||||||||||||||||||||
Year ended 12/31/11 | 12.91 | 0.29 | 0.25 | 0.54 | (0.55 | ) | — | (0.55 | ) | 12.90 | 4.27 | (c) | 9,308 | 1.66 | 1.66 | 2.23 | 395 | |||||||||||||||||||||||||||||||||||||||
Year ended 12/31/10 | 12.66 | 0.30 | 0.28 | 0.58 | (0.33 | ) | — | (0.33 | ) | 12.91 | 4.64 | (c) | 9,559 | 1.67 | 1.67 | 2.33 | 370 | |||||||||||||||||||||||||||||||||||||||
Year ended 12/31/09 | 12.14 | 0.28 | 0.49 | 0.77 | (0.25 | ) | — | (0.25 | ) | 12.66 | 6.36 | (g) | 12,159 | 1.71 | 1.71 | 2.26 | 589 | |||||||||||||||||||||||||||||||||||||||
Year ended 12/31/08 | 13.18 | 0.55 | (0.91 | ) | (0.36 | ) | (0.66 | ) | (0.02 | ) | (0.68 | ) | 12.14 | (2.70 | )(g) | 12,715 | 1.71 | 1.71 | 4.44 | 821 | ||||||||||||||||||||||||||||||||||||
Class Y(h) |
| |||||||||||||||||||||||||||||||||||||||||||||||||||||||
Year ended 12/31/12 | 13.04 | 0.28 | 0.33 | 0.61 | (0.58 | ) | — | (0.58 | ) | 13.07 | 4.79 | (c) | 3,759 | 0.69 | (d) | 0.69 | (d) | 2.13 | (d) | 451 | ||||||||||||||||||||||||||||||||||||
Year ended 12/31/11 | 13.04 | 0.42 | 0.27 | 0.69 | (0.69 | ) | — | (0.69 | ) | 13.04 | 5.40 | (c) | 1,721 | 0.66 | 0.66 | 3.23 | 395 | |||||||||||||||||||||||||||||||||||||||
Year ended 12/31/10 | 12.79 | 0.42 | 0.30 | 0.72 | (0.47 | ) | — | (0.47 | ) | 13.04 | 5.65 | (c) | 2,353 | 0.67 | 0.67 | 3.26 | 370 | |||||||||||||||||||||||||||||||||||||||
Year ended 12/31/09 | 12.26 | 0.42 | 0.48 | 0.90 | (0.37 | ) | — | (0.37 | ) | 12.79 | 7.42 | (i) | 23,905 | 0.71 | 0.71 | 3.35 | 589 | |||||||||||||||||||||||||||||||||||||||
Year ended 12/31/08 | 13.26 | 0.74 | (0.93 | ) | (0.19 | ) | (0.78 | ) | (0.03 | ) | (0.81 | ) | 12.26 | (1.38 | )(i) | 14,698 | 0.71 | 0.71 | 5.93 | 821 | ||||||||||||||||||||||||||||||||||||
Class R5 |
| |||||||||||||||||||||||||||||||||||||||||||||||||||||||
Year ended 12/31/12 | 13.03 | 0.28 | 0.33 | 0.61 | (0.58 | ) | — | (0.58 | ) | 13.06 | 4.80 | (c) | 10 | 0.65 | (d) | 0.65 | (d) | 2.17 | (d) | 451 | ||||||||||||||||||||||||||||||||||||
Year ended 12/31/11 | 13.04 | 0.43 | 0.26 | 0.69 | (0.70 | ) | — | (0.70 | ) | 13.03 | 5.38 | (c) | 10 | 0.63 | 0.63 | 3.26 | 395 | |||||||||||||||||||||||||||||||||||||||
Year ended 12/31/10(j) | 13.06 | 0.35 | (0.09 | ) | 0.26 | (0.28 | ) | — | (0.28 | ) | 13.04 | 2.00 | (c) | 10 | 0.59 | (k) | 0.59 | (k) | 4.51 | (k) | 370 | |||||||||||||||||||||||||||||||||||
| (a) | Calculated using average shares outstanding. |
| (b) | Portfolio turnover is calculated at the fund level and is not annualized for periods less than one year, if applicable. |
| (c) | Includes adjustments in accordance with accounting principles generally accepted in the United States of America and as such, the net asset value for financial reporting purposes and the returns based upon those net asset values may differ from the net asset value and returns for shareholder transactions. Does not include sales charges and is not annualized for periods less than one year, if applicable. |
| (d) | Ratios are based on average daily net assets (000’s) of $552,288, $6,864, $10,787, $2,961 and $10 for Class A, Class B, Class C, Class Y and Class R5 shares, respectively. |
| (e) | Assumes reinvestment of all distributions for the period and does not include payment of the maximum sales charge of 4.75% or contingent deferred sales charge (CDSC). On purchases of $1 million or more, a CDSC of 1% may be imposed on certain redemptions made within eighteen months of purchase. If the sales charges were included, total returns would be lower. These returns include combined Rule 12b-1 fees and service fees of up to 0.25% and do not reflect the deduction of taxes that a shareholder would pay on Fund distributions or the redemption of Fund shares. |
| (f) | Assumes reinvestment of all distributions for the period and does not include payment of the maximum CDSC of 4%, charged on certain redemptions made within one year of purchase and declining to 0% after the fifth year. If the sales charge was included, total returns would be lower. These returns include combined Rule 12b-1 fees and service fees of up to 1% and do not reflect the deduction of taxes that a shareholder would pay on Fund distributions or the redemption of Fund shares. |
| (g) | Assumes reinvestment of all distributions for the period and does not include payment of the maximum CDSC of 1%, charged on certain redemptions made within one year of purchase. If the sales charge was included, total returns would be lower. These returns include combined Rule 12b-1 fees and service fees of up to 1% and do not reflect the deduction of taxes that a shareholder would pay on Fund distributions or the redemption of Fund shares. |
| (h) | On June 1, 2010, the Class I shares of the predecessor fund were reorganized into Class Y shares of the Fund. |
| (i) | Assumes reinvestment of all distributions for the period. These returns do not reflect the deduction of taxes that a shareholder would pay on Fund distributions or the redemption on Fund shares. |
| (j) | Commencement date of June 1, 2010. |
| (k) | Annualized. |
22 Invesco U.S. Mortgage Fund
Report of Independent Registered Public Accounting Firm
To the Board of Trustees of AIM Growth Series (Invesco Growth Series)
and Shareholders of Invesco U.S. Mortgage Fund:
In our opinion, the accompanying statement of assets and liabilities, including the schedule of investments, and the related statements of operations and of changes in net assets and the financial highlights present fairly, in all material respects, the financial position of Invesco U.S. Mortgage Fund, (formerly known as Invesco Van Kampen U.S. Mortgage Fund; one of the funds constituting AIM Growth Series (Invesco Growth Series), hereafter referred to as the “Fund”) at December 31, 2012, the results of its operations for the year then ended, the changes in its net assets for each of the two years in the period then ended and the financial highlights for each of the three years in the period then ended, in conformity with accounting principles generally accepted in the United States of America. These financial statements and financial highlights (hereafter referred to as “financial statements”) are the responsibility of the Fund’s management; our responsibility is to express an opinion on these financial statements based on our audits. We conducted our audits of these financial statements in accordance with the standards of the Public Company Accounting Oversight Board (United States). Those standards require that we plan and perform the audit to obtain reasonable assurance about whether the financial statements are free of material misstatement. An audit includes examining, on a test basis, evidence supporting the amounts and disclosures in the financial statements, assessing the accounting principles used and significant estimates made by management, and evaluating the overall financial statement presentation. We believe that our audits, which included confirmation of securities at December 31, 2012 by correspondence with the custodian and brokers, provide a reasonable basis for our opinion. The financial highlights of the Fund for the periods ended December 31, 2009 and prior were audited by another independent registered public accounting firm whose report dated February 19, 2010 expressed an unqualified opinion on those statements.
PRICEWATERHOUSECOOPERS LLP
February 25, 2013
Houston, Texas
23 Invesco U.S. Mortgage Fund
Calculating your ongoing Fund expenses
Example
As a shareholder of the Fund, you incur two types of costs: (1) transaction costs, which may include sales charges (loads) on purchase payments or contingent deferred sales charges on redemptions, and redemption fees, if any; and (2) ongoing costs, including management fees, distribution and/or service (12b-1) fees, and other Fund expenses. This example is intended to help you understand your ongoing costs (in dollars) of investing in the Fund and to compare these costs with ongoing costs of investing in other mutual funds. The example is based on an investment of $1,000 invested at the beginning of the period and held for the entire period July 1, 2012 through December 31, 2012.
Actual expenses
The table below provides information about actual account values and actual expenses. You may use the information in this table, together with the amount you invested, to estimate the expenses that you paid over the period. Simply divide your account value by $1,000 (for example, an $8,600 account value divided by $1,000 = 8.6), then multiply the result by the number in the table under the heading entitled “Actual Expenses Paid During Period” to estimate the expenses you paid on your account during this period.
Hypothetical example for comparison purposes
The table below also provides information about hypothetical account values and hypothetical expenses based on the Fund’s actual expense ratio and an assumed rate of return of 5% per year before expenses, which is not the Fund’s actual return.
The hypothetical account values and expenses may not be used to estimate the actual ending account balance or expenses you paid for the period. You may use this information to compare the ongoing costs of investing in the Fund and other funds. To do so, compare this 5% hypothetical example with the 5% hypothetical examples that appear in the shareholder reports of the other funds.
Please note that the expenses shown in the table are meant to highlight your ongoing costs only and do not reflect any transaction costs, such as sales charges (loads) on purchase payments, contingent deferred sales charges on redemptions, and redemption fees, if any. Therefore, the hypothetical information is useful in comparing ongoing costs only, and will not help you determine the relative total costs of owning different funds. In addition, if these transaction costs were included, your costs would have been higher.
| Class | Beginning Account Value (07/01/12) | ACTUAL | HYPOTHETICAL (5% annual return before expenses) | Annualized Expense Ratio | ||||||||||||||||||||
| Ending Account Value (12/31/12)1 | Expenses Paid During Period2 | Ending Account Value (12/31/12) | Expenses Paid During Period2 | |||||||||||||||||||||
A | $ | 1,000.00 | $ | 1,019.00 | $ | 4.76 | $ | 1,020.42 | $ | 4.76 | 0.94 | % | ||||||||||||
B | 1,000.00 | 1,015.20 | 8.60 | 1,016.60 | 8.61 | 1.70 | ||||||||||||||||||
C | 1,000.00 | 1,015.20 | 8.60 | 1,016.60 | 8.61 | 1.70 | ||||||||||||||||||
Y | 1,000.00 | 1,021.10 | 3.55 | 1,021.63 | 3.55 | 0.70 | ||||||||||||||||||
R5 | 1,000.00 | 1,020.30 | 3.19 | 1,021.98 | 3.19 | 0.63 | ||||||||||||||||||
| 1 | The actual ending account value is based on the actual total return of the Fund for the period July 1, 2012 through December 31, 2012, after actual expenses and will differ from the hypothetical ending account value which is based on the Fund’s expense ratio and a hypothetical annual return of 5% before expenses. |
| 2 | Expenses are equal to the Fund’s annualized expense ratio as indicated above multiplied by the average account value over the period, multiplied by 184/366 to reflect the most recent fiscal half year. |
24 Invesco U.S. Mortgage Fund
Tax Information
Form 1099-DIV, Form 1042-S and other year—end tax information provide shareholders with actual calendar year amounts that should be included in their tax returns. Shareholders should consult their tax advisors.
The following distribution information is being provided as required by the Internal Revenue Code or to meet a specific state’s requirement.
The Fund designates the following amounts or, if subsequently determined to be different, the maximum amount allowable for its fiscal year ended December 31, 2012:
Federal and State Income Tax | ||||
Qualified Dividend Income* | 0 | % | ||
Corporate Dividends Received Deduction* | 0 | % | ||
U.S. Treasury Obligations* | 0.66 | % | ||
| * | The above percentages are based on ordinary income dividends paid to shareholders during the Fund’s fiscal year. |
25 Invesco U.S. Mortgage Fund
Trustees and Officers
The address of each trustee and officer is AIM Growth Series (Invesco Growth Series) (the “Trust”), 11 Greenway Plaza, Suite 1000, Houston, Texas 77046-1173. The trustees serve for the life of the Trust, subject to their earlier death, incapacitation, resignation, retirement or removal as more specifically provided in the Trust’s organizational documents. Each officer serves for a one year term or until their successors are elected and qualified. Column two below includes length of time served with predecessor entities, if any.
| Name, Year of Birth and Position(s) Held with the Trust | Trustee and/ or Officer Since | Principal Occupation(s) During Past 5 Years | Number of Funds in Fund Complex Overseen by Trustee | Other Directorship(s) Held by Trustee During Past 5 Years | ||||
| Interested Persons | ||||||||
| Martin L. Flanagan1 — 1960 Trustee | 2007 | Executive Director, Chief Executive Officer and President, Invesco Ltd. (ultimate parent of Invesco and a global investment management firm); Advisor to the Board, Invesco Advisers, Inc. (formerly known as Invesco Institutional (N.A.), Inc.); Trustee, The Invesco Funds; Vice Chair, Investment Company Institute; and Member of Executive Board, SMU Cox School of Business
Formerly: Chairman and Chief Executive Officer, Invesco Advisers, Inc. (registered investment adviser); Director, Chairman, Chief Executive Officer and President, IVZ Inc. (holding company), INVESCO Group Services, Inc. (service provider) and Invesco North American Holdings, Inc. (holding company); Director, Chief Executive Officer and President, Invesco Holding Company Limited (parent of Invesco and a global investment management firm); Director, Invesco Ltd.; Chairman, Investment Company Institute and President, Co-Chief Executive Officer, Co-President, Chief Operating Officer and Chief Financial Officer, Franklin Resources, Inc. (global investment management organization) | 124 | None | ||||
Philip A. Taylor2 — 1954 Trustee, President and Principal Executive Officer | 2006 | Head of North American Retail and Senior Managing Director, Invesco Ltd.; Director, Co-Chairman, Co-President and Co-Chief Executive Officer, Invesco Advisers, Inc. (formerly known as Invesco Institutional (N.A.), Inc.) (registered investment adviser); Director, Chairman, Chief Executive Officer and President, Invesco Management Group, Inc. (formerly known as Invesco Aim Management Group, Inc.) (financial services holding company); Director and President, INVESCO Funds Group, Inc. (registered investment adviser and registered transfer agent); Director and Chairman, Invesco Investment Services, Inc. (formerly known as Invesco Aim Investment Services, Inc.) (registered transfer agent) and IVZ Distributors, Inc. (formerly known as INVESCO Distributors, Inc.) (registered broker dealer); Director, President and Chairman, Invesco Inc. (holding company) and Invesco Canada Holdings Inc. (holding company); Chief Executive Officer, Invesco Corporate Class Inc. (corporate mutual fund company) and Invesco Canada Fund Inc. (corporate mutual fund company); Director, Chairman and Chief Executive Officer, Invesco Canada Ltd. (formerly known as Invesco Trimark Ltd./Invesco Trimark Ltèe) (registered investment adviser and registered transfer agent); Trustee, President and Principal Executive Officer, The Invesco Funds (other than AIM Treasurer’s Series Trust (Invesco Treasurer’s Series Trust) and Short-Term Investments Trust); Trustee and Executive Vice President, The Invesco Funds (AIM Treasurer’s Series Trust (Invesco Treasurer’s Series Trust) and Short-Term Investments Trust only); Director, Invesco Investment Advisers LLC (formerly known as Van Kampen Asset Management); Director, Chief Executive Officer and President, Van Kampen Exchange Corp.
Formerly: Director and Chairman, Van Kampen Investor Services Inc.: Director, Chief Executive Officer and President, 1371 Preferred Inc. (holding company); and Van Kampen Investments Inc.; Director and President, AIM GP Canada Inc. (general partner for limited partnerships); and Van Kampen Advisors, Inc.; Director and Chief Executive Officer, Invesco Trimark Dealer Inc. (registered broker dealer); Director, Invesco Distributors, Inc. (formerly known as Invesco Aim Distributors, Inc.) (registered broker dealer); Manager, Invesco PowerShares Capital Management LLC; Director, Chief Executive Officer and President, Invesco Advisers, Inc.; Director, Chairman, Chief Executive Officer and President, Invesco Aim Capital Management, Inc.; President, Invesco Trimark Dealer Inc. and Invesco Trimark Ltd./Invesco Trimark Ltèe; Director and President, AIM Trimark Corporate Class Inc. and AIM Trimark Canada Fund Inc.; Senior Managing Director, Invesco Holding Company Limited; Trustee and Executive Vice President, Tax-Free Investments Trust; Director and Chairman, Fund Management Company (former registered broker dealer); President and Principal Executive Officer, The Invesco Funds (AIM Treasurer’s Series Trust (Invesco Treasurer’s Series Trust), Short-Term Investments Trust and Tax-Free Investments Trust only); President, AIM Trimark Global Fund Inc. and AIM Trimark Canada Fund Inc. | 124 | None | ||||
Wayne W. Whalen3 — 1939 Trustee | 2010 | Of Counsel, and prior to 2010, partner in the law firm of Skadden, Arps, Slate, Meagher & Flom LLP, legal counsel to certain funds in the Fund Complex
| 137 | Director of the Mutual Fund Directors Forum, a nonprofit membership organization for investment directors; Chairman and Director of the Abraham Lincoln Presidential Library Foundation; and Director of the Stevenson Center for Democracy |
| 1 | Mr. Flanagan is considered an interested person of the Trust because he is an officer of the adviser to the Trust, and an officer and a director of Invesco Ltd., ultimate parent of the adviser to the Trust. |
| 2 | Mr. Taylor is considered an interested person of the Trust because he is an officer and a director of the adviser to, and a director of the principal underwriter of, the Trust. |
| 3 | Mr. Whalen is considered an “interested person” (within the meaning of Section 2(a)(19) of the 1940 Act) of certain Funds in the Invesco Fund Complex by reason of he and his firm currently providing legal services as legal counsel to such Funds in the Invesco Fund Complex. |
T-1 Invesco U.S. Mortgage Fund
Trustees and Officers—(continued)
| Name, Year of Birth and Position(s) Held with the Trust | Trustee and/ or Officer Since | Principal Occupation(s) During Past 5 Years | Number of Funds in Fund Complex Overseen by Trustee | Other Directorship(s) Held by Trustee During Past 5 Years | ||||
| Independent Trustees | ||||||||
Bruce L. Crockett — 1944 Trustee and Chair | 2001 | Chairman, Crockett Technologies Associates (technology consulting company)
Formerly: Director, Captaris (unified messaging provider); Director, President and Chief Executive Officer COMSAT Corporation; and Chairman, Board of Governors of INTELSAT (international communications company) | 124 | ACE Limited (insurance company); and Investment Company Institute | ||||
David C. Arch — 1945 Trustee | 2010 | Chairman and Chief Executive Officer of Blistex Inc., (consumer health care products manufacturer)
Formerly: Member of the Heartland Alliance Advisory Board, a nonprofit organization serving human needs based in Chicago | 137 | Board member of the Illinois Manufacturers’ Association; Member of the Board of Visitors, Institute for the Humanities, University of Michigan | ||||
Frank S. Bayley — 1939 Trustee | 1985 | Retired
Formerly: Director, Badgley Funds, Inc. (registered investment company) (2 portfolios) and General Partner and Of Counsel, law firm of Baker & McKenzie, LLP | 124 | Director and Chairman, C.D. Stimson Company (a real estate investment company); Trustee and Overseer, The Curtis institute of Music | ||||
James T. Bunch — 1942 Trustee | 2003 | Managing Member, Grumman Hill Group LLC (family office private equity management)
Formerly: Founder, Green, Manning & Bunch Ltd. (investment banking firm)(1988-2010); Executive Committee, United States Golf Association; and Director, Policy Studies, Inc. and Van Gilder Insurance Corporation | 124 | Chairman, Board of Governors, Western Golf Association; Chairman-elect, Evans Scholars Foundation; and Director, Denver Film Society | ||||
Rodney F. Dammeyer — 1940 Trustee | 2010 | Chairman of CAC, LLC, (private company offering capital investment and management advisory services)
Formerly: Prior to 2001, Managing Partner at Equity Group Corporate Investments; Prior to 1995, Vice Chairman of Anixter International; Prior to 1985, experience includes Senior Vice President and Chief Financial Officer of Household International, Inc., Executive Vice President and Chief Financial Officer of Northwest Industries, Inc. and Partner of Arthur Andersen & Co.; From 1987 to 2010, Director/Trustee of investment companies in the Van Kampen Funds complex | 126 | Director of Quidel Corporation and Stericycle, Inc.; Prior to May 2008, Trustee of The Scripps Research Institute; Prior to February 2008, Director of Ventana Medical Systems, Inc.; Prior to April 2007, Director of GATX Corporation; Prior to April 2004, Director of TheraSense, Inc. | ||||
Albert R. Dowden — 1941 Trustee | 2001 | Director of a number of public and private business corporations, including the Boss Group, Ltd. (private investment and management); Reich & Tang Funds (5 portfolios) (registered investment company); and Homeowners of America Holding Corporation/ Homeowners of America Insurance Company (property casualty company)
Formerly: Director, Continental Energy Services, LLC (oil and gas pipeline service); Director, CompuDyne Corporation (provider of product and services to the public security market) and Director, Annuity and Life Re (Holdings), Ltd. (reinsurance company); Director, President and Chief Executive Officer, Volvo Group North America, Inc.; Senior Vice President, AB Volvo; Director of various public and private corporations; Chairman, DHJ Media, Inc.; Director Magellan Insurance Company; and Director, The Hertz Corporation, Genmar Corporation (boat manufacturer), National Media Corporation; Advisory Board of Rotary Power International (designer, manufacturer, and seller of rotary power engines); and Chairman, Cortland Trust, Inc. (registered investment company) | 124 | Director of Nature’s Sunshine Products, Inc. | ||||
Jack M. Fields — 1952 Trustee | 2001 | Chief Executive Officer, Twenty First Century Group, Inc. (government affairs company); Owner and Chief Executive Officer, Dos Angeles Ranch, L.P. (cattle, hunting, corporate entertainment); and Discovery Global Education Fund (non-profit)
Formerly: Chief Executive Officer, Texana Timber LP (sustainable forestry company); Director of Cross Timbers Quail Research Ranch (non-profit); and member of the U.S. House of Representatives | 124 | Insperity, Inc. (formerly known as Administaff) | ||||
Prema Mathai-Davis — 1950 Trustee | 2001 | Retired
Formerly: Chief Executive Officer, YWCA of the U.S.A. | 124 | None | ||||
Larry Soll — 1942 Trustee | 2003 | Retired
Formerly: Chairman, Chief Executive Officer and President, Synergen Corp. (a biotechnology company) | 124 | None | ||||
Hugo F. Sonnenschein — 1940 Trustee | 2010 | Distinguished Service Professor and President Emeritus of the University of Chicago and the Adam Smith Distinguished Service Professor in the Department of Economics at the University of Chicago
Formerly: President of the University of Chicago | 137 | Trustee of the University of Rochester and a member of its investment committee. Member of the National Academy of Sciences, the American Philosophical Society and a fellow of the American Academy of Arts and Sciences |
T-2 Invesco U.S. Mortgage Fund
Trustees and Officers—(continued)
| Name, Year of Birth and Position(s) Held with the Trust | Trustee and/ or Officer Since | Principal Occupation(s) During Past 5 Years | Number of Funds in Fund Complex Overseen by Trustee | Other Directorship(s) Held by Trustee During Past 5 Years | ||||
| Independent Trustees—(continued) | ||||||||
Raymond Stickel, Jr. — 1944 Trustee | 2005 | Retired
Formerly: Director, Mainstay VP Series Funds, Inc. (25 portfolios) and Partner, Deloitte & Touche | 124 | None | ||||
| Other Officers | ||||||||
| Russell C. Burk — 1958 Senior Vice President and Senior Officer | 2005 | Senior Vice President and Senior Officer, The Invesco Funds | N/A | N/A | ||||
| John M. Zerr — 1962 Senior Vice President, Chief Legal Officer and Secretary | 2006 | Director, Senior Vice President, Secretary and General Counsel, Invesco Management Group, Inc. (formerly known as Invesco Aim Management Group, Inc.) and Van Kampen Exchange Corp.; Senior Vice President, Invesco Advisers, Inc. (formerly known as Invesco Institutional (N.A.), Inc.) (registered investment adviser); Senior Vice President and Secretary, Invesco Distributors, Inc. (formerly known as Invesco Aim Distributors, Inc.); Director, Vice President and Secretary, Invesco Investment Services, Inc. (formerly known as Invesco Aim Investment Services, Inc.) and IVZ Distributors, Inc. (formerly known as INVESCO Distributors, Inc.); Director and Vice President, INVESCO Funds Group, Inc.; Senior Vice President, Chief Legal Officer and Secretary, The Invesco Funds; Manager, Invesco PowerShares Capital Management LLC; Director, Secretary and General Counsel, Invesco Investment Advisers LLC (formerly known as Van Kampen Asset Management); Secretary and General Counsel, Van Kampen Funds Inc. and Chief Legal Officer, PowerShares Exchange-Traded Fund Trust, PowerShares Exchange-Traded Fund Trust II, PowerShares India Exchange-Traded Fund Trust and PowerShares Actively Managed Exchange-Traded Fund Trust
Formerly: Director and Vice President, Van Kampen Advisors Inc.; Director, Vice President, Secretary and General Counsel Van Kampen Investor Services Inc.; Director, Invesco Distributors, Inc. (formerly known as Invesco Aim Distributors, Inc.); Director, Senior Vice President, General Counsel and Secretary, Invesco Advisers, Inc. and Van Kampen Investments Inc.; Director, Vice President and Secretary, Fund Management Company; Director, Senior Vice President, Secretary, General Counsel and Vice President, Invesco Aim Capital Management, Inc.; Chief Operating Officer and General Counsel, Liberty Ridge Capital, Inc. (an investment adviser); Vice President and Secretary, PBHG Funds (an investment company) and PBHG Insurance Series Fund (an investment company); Chief Operating Officer, General Counsel and Secretary, Old Mutual Investment Partners (a broker-dealer); General Counsel and Secretary, Old Mutual Fund Services (an administrator) and Old Mutual Shareholder Services (a shareholder servicing center); Executive Vice President, General Counsel and Secretary, Old Mutual Capital, Inc. (an investment adviser); and Vice President and Secretary, Old Mutual Advisors Funds (an investment company) | N/A | N/A | ||||
| Karen Dunn Kelley — 1960 Vice President | 2004 | Head of Invesco’s World Wide Fixed Income and Cash Management Group; Senior Vice President, Invesco Management Group, Inc. (formerly known as Invesco Aim Management Group, Inc.) and Invesco Advisers, Inc. (formerly known as Invesco Institutional (N.A.), Inc.) (registered investment adviser); Executive Vice President, Invesco Distributors, Inc. (formerly known as Invesco Aim Distributors, Inc.); Director, Invesco Mortgage Capital Inc., INVESCO Global Asset Management Limited, Invesco Management Company Limited and INVESCO Management S.A.; Vice President, The Invesco Funds (other than AIM Treasurer’s Series Trust (Invesco Treasurer’s Series Trust) and Short-Term Investments Trust); and President and Principal Executive Officer, The Invesco Funds (AIM Treasurer’s Series Trust (Invesco Treasurer’s Series Trust) and Short-Term Investments Trust only)
Formerly: Senior Vice President, Van Kampen Investments Inc.; Vice President, Invesco Advisers, Inc. (formerly known as Invesco Institutional (N.A.), Inc.); Director of Cash Management and Senior Vice President, Invesco Advisers, Inc. and Invesco Aim Capital Management, Inc.; President and Principal Executive Officer, Tax-Free Investments Trust; Director and President, Fund Management Company; Chief Cash Management Officer, Director of Cash Management, Senior Vice President, and Managing Director, Invesco Aim Capital Management, Inc.; Director of Cash Management, Senior Vice President, and Vice President, Invesco Advisers, Inc. and The Invesco Funds (AIM Treasurer’s Series Trust (Invesco Treasurer’s Series Trust), Short-Term Investments Trust and Tax-Free Investments Trust only) | N/A | N/A | ||||
T-3 Invesco U.S. Mortgage Fund
Trustees and Officers—(continued)
| Name, Year of Birth and Position(s) Held with the Trust | Trustee and/ or Officer Since | Principal Occupation(s) During Past 5 Years | Number of Funds in Fund Complex Overseen by Trustee | Other Directorship(s) Held by Trustee During Past 5 Years | ||||
| Other Officers—(continued) | ||||||||
| Sheri Morris — 1964 Vice President, Treasurer and Principal Financial Officer | 1999 | Vice President, Treasurer and Principal Financial Officer, The Invesco Funds; Vice President, Invesco Advisers, Inc. (formerly known as Invesco Institutional (N.A.), Inc.) (registered investment adviser); and Vice President, PowerShares Exchange-Traded Fund Trust, PowerShares Exchange-Traded Fund Trust II, PowerShares India Exchange-Traded Fund Trust and PowerShares Actively Managed Exchange-Traded Fund Trust
Formerly: Vice President, Invesco Aim Advisers, Inc., Invesco Aim Capital Management, Inc. and Invesco Aim Private Asset Management, Inc.; Assistant Vice President and Assistant Treasurer, The Invesco Funds and Assistant Vice President, Invesco Advisers, Inc., Invesco Aim Capital Management, Inc. and Invesco Aim Private Asset Management, Inc.; and Treasurer, PowerShares Exchange-Traded Fund Trust, PowerShares Exchange-Traded Fund Trust II, PowerShares India Exchange-Traded Fund Trust and PowerShares Actively Managed Exchange-Traded Fund Trust | N/A | N/A | ||||
Yinka Akinsola — 1977 Anti-Money Laundering Compliance Officer | 2011 | Anti-Money Laundering Compliance Officer, Invesco Advisers, Inc. (formerly known as Invesco Institutional (N.A.), Inc.) (registered investment adviser); Invesco Distributors, Inc. (formerly known as Invesco Aim Distributors, Inc.), Invesco Investment Services, Inc. (formerly known as Invesco Aim Investment Services, Inc.), Invesco Management Group, Inc., The Invesco Funds, Invesco Van Kampen Closed-End Funds, Van Kampen Exchange Corp., Van Kampen Funds Inc., PowerShares Exchange-Traded Fund Trust, PowerShares Exchange-Traded Fund Trust II, PowerShares India Exchange-Traded Fund Trust, and PowerShares Actively Managed Exchange-Traded Fund Trust
Formerly: Regulatory Analyst III, Financial Industry Regulatory Authority (FINRA) | N/A | N/A | ||||
| Todd L. Spillane — 1958 Chief Compliance Officer | 2006 | Senior Vice President, Invesco Management Group, Inc. (formerly known as Invesco Aim Management Group, Inc.) and Van Kampen Exchange Corp.; Senior Vice President and Chief Compliance Officer, Invesco Advisers, Inc. (registered investment adviser) (formerly known as Invesco Institutional (N.A.), Inc.); Chief Compliance Officer, The Invesco Funds; Vice President, Invesco Distributors, Inc. (formerly known as Invesco Aim Distributors, Inc.) and Invesco Investment Services, Inc. (formerly known as Invesco Aim Investment Services, Inc.)
Formerly: Chief Compliance Officer, Invesco Van Kampen Closed-End Funds; Senior Vice President, Van Kampen Investments Inc.; Senior Vice President and Chief Compliance Officer, Invesco Aim Advisers, Inc. and Invesco Aim Capital Management, Inc.; Chief Compliance Officer, INVESCO Private Capital Investments, Inc. (holding company), Invesco Private Capital, Inc. (registered investment adviser), Invesco Global Asset Management (N.A.), Inc., Invesco Senior Secured Management, Inc. (registered investment adviser), Van Kampen Investor Services Inc., PowerShares Exchange-Traded Fund Trust, PowerShares Exchange-Traded Fund Trust II, PowerShares India Exchange-Traded Fund Trust and PowerShares Actively Managed Exchange-Traded Fund Trust; and Vice President, Invesco Aim Capital Management, Inc. and Fund Management Company | N/A | N/A |
The Statement of Additional Information of the Trust includes additional information about the Fund’s Trustees and is available upon request, without charge, by calling 1.800.959.4246. Please refer to the Fund’s prospectus for information on the Fund’s sub-advisers.
Office of the Fund 11 Greenway Plaza, Suite 1000 Houston, TX 77046-1173 | Investment Adviser Invesco Advisers, Inc. 1555 Peachtree Street, N.E. Atlanta, GA 30309 | Distributor Invesco Distributors, Inc. 11 Greenway Plaza, Suite 1000 Houston, TX 77046-1173 | Auditors PricewaterhouseCoopers LLP 1201 Louisiana Street, Suite 2900 Houston, TX 77002-5678 | |||
Counsel to the Fund Stradley Ronon Stevens & Young, LLP 2005 Market Street, Suite 2600 Philadelphia, PA 19103-7018 | Counsel to the Independent Trustees Goodwin Procter LLP 901 New York Avenue, N.W. | Transfer Agent Invesco Investment Services, Inc. 11 Greenway Plaza, Suite 1000 Houston, TX 77046-1173 | Custodian State Street Bank and Trust Company 225 Franklin Street Boston, MA 02110-2801 | |||
T-4 Invesco U.S. Mortgage Fund

Invesco mailing information
Send general correspondence to Invesco Investment Services, Inc., P.O. Box 219078, Kansas City, MO 64121-9078.
Invesco privacy policy
You share personal and financial information with us that is necessary for your transactions and your account records. We take very seriously the obligation to keep that information confidential and private.
Invesco collects nonpublic personal information about you from account applications or other forms you complete and from your transactions with us or our affiliates. We do not disclose information about you or our former customers to service providers or other third parties except to the extent necessary to service your account and in other limited circumstances as permitted by law. For example, we use this information to facilitate the delivery of transaction confirmations, financial reports, prospectuses and tax forms.
Even within Invesco, only people involved in the servicing of your accounts and compliance monitoring have access to your information. To ensure the highest level of confidentiality and security, Invesco maintains physical, electronic and procedural safeguards that meet or exceed federal standards. Special measures, such as data encryption and authentication, apply to your communications with us on our website. More detail is available to you at invesco.com/privacy.
Important notice regarding delivery of security holder documents
To reduce Fund expenses, only one copy of most shareholder documents may be mailed to shareholders with multiple accounts at the same address (Householding). Mailing of your shareholder documents may be householded indefinitely unless you instruct us otherwise. If you do not want the mailing of these documents to be combined with those for other members of your household, please contact Invesco Investment Services, Inc. at 800 959 4246 or contact your financial institution. We will begin sending you individual copies for each account within 30 days after receiving your request.
Fund holdings and proxy voting information
The Fund provides a complete list of its holdings four times in each fiscal year, at the quarter-ends. For the second and fourth quarters, the lists appear in the Fund’s semiannual and annual reports to shareholders. For the first and third quarters, the Fund files the lists with the Securities and Exchange Commission (SEC) on Form N-Q. The most recent list of portfolio holdings is available at invesco.com/completeqtrholdings. Shareholders can also look up the Fund’s Forms N-Q on the SEC website at sec.gov. Copies of the Fund’s Forms N-Q may be reviewed and copied at the SEC Public Reference Room in Washington, D.C. You can obtain information on the operation of the Public Reference Room, including information about duplicating fee charges, by calling 202 551 8090 or 800 732 0330, or by electronic request at the following email address: publicinfo@sec.gov. The SEC file numbers for the Fund are shown below.
A description of the policies and procedures that the Fund uses to determine how to vote proxies relating to portfolio securities is available without charge, upon request, from our Client Services department at 800 959 4246 or at invesco.com/proxyguidelines. The information is also available on the SEC website, sec.gov.
Information regarding how the Fund voted proxies related to its portfolio securities during the 12 months ended June 30, 2012, is available at invesco.com/proxysearch. The information is also available on the SEC website, sec.gov. Invesco Advisers, Inc. is an investment adviser; it provides investment advisory services to individual and institutional clients and does not sell securities. Invesco Distributors, Inc. is the US distributor for Invesco Ltd.’s retail mutual funds, exchange-traded funds and institutional money market funds. Both are wholly owned, indirect subsidiaries of Invesco Ltd. |  | |
| SEC file numbers: 811-02699 and 002-57526 VK-USM-AR-1 Invesco Distributors, Inc. | ||
| ITEM 2. | CODE OF ETHICS. |
As of the end of the period covered by this report, the Registrant had adopted a code of ethics (the “Code”) that applies to the Registrant’s principal executive officer (“PEO”) and principal financial officer (“PFO”). There were no amendments to the Code during the period covered by the report. The Registrant did not grant any waivers, including implicit waivers, from any provisions of the Code to the PEO or PFO during the period covered by this report.
| ITEM 3. | AUDIT COMMITTEE FINANCIAL EXPERT. |
The Board of Trustees has determined that the Registrant has at least one audit committee financial expert serving on its Audit Committee. The Audit Committee financial expert is Raymond Stickel, Jr. Mr. Stickel is “independent” within the meaning of that term as used in Form N-CSR.
| ITEM 4. | PRINCIPAL ACCOUNTANT FEES AND SERVICES. |
Fees Billed by PWC Related to the Registrant
PWC billed the Registrant aggregate fees for services rendered to the Registrant for the last two fiscal years as follows:
| Fees Billed for Services Rendered to the Registrant for fiscal year end 2012 | Percentage of Fees Billed Applicable to Non-Audit Services Provided for fiscal year end 2012 Pursuant to Waiver of Pre-Approval Requirement(1) | Fees Billed for Services Rendered to the Registrant for fiscal year end 2011 | Percentage of Fees Billed Applicable to Non-Audit Services Provided for fiscal year end 2011 Pursuant to Waiver of Pre-Approval Requirement(1) | |||||||||||||
Audit Fees | $ | 437,252 | N/A | $ | 370,000 | N/A | ||||||||||
Audit-Related Fees(2) | $ | 0 | 0 | % | $ | 21,250 | 0 | % | ||||||||
Tax Fees(3) | $ | 107,100 | 0 | % | $ | 160,700 | 0 | % | ||||||||
All Other Fees | $ | 0 | 0 | % | $ | 0 | 0 | % | ||||||||
|
|
|
| |||||||||||||
Total Fees | $ | 544,352 | 0 | % | $ | 551,950 | 0 | % | ||||||||
PWC billed the Registrant aggregate non-audit fees of $107,100 for the fiscal year ended 2012, and $181,950 for the fiscal year ended 2011, for non-audit services rendered to the Registrant.
| (1) | With respect to the provision of non-audit services, the pre-approval requirement is waived pursuant to a de minimis exception if (i) such services were not recognized as non-audit services by the Registrant at the time of engagement, (ii) the aggregate amount of all such services provided is no more than 5% of the aggregate audit and non-audit fees paid by the Registrant to PWC during a fiscal year; and (iii) such services are promptly brought to the attention of the Registrant’s Audit Committee and approved by the Registrant’s Audit Committee prior to the completion of the audit. |
| (2) | Audit-Related fees for the fiscal year end December 31, 2011 includes fees billed for agreed upon procedures related to fund mergers. |
| (3) | Tax fees for the fiscal year end December 31, 2012 includes fees billed for reviewing tax returns. Tax fees for fiscal year end December 31, 2011 includes fees billed for reviewing tax returns. |
Fees Billed by PWC Related to Invesco and Invesco Affiliates
PWC billed Invesco Advisers, Inc. (“Invesco”), the Registrant’s adviser, and any entity controlling, controlled by or under common control with Invesco that provides ongoing services to the Registrant (“Invesco Affiliates”) aggregate fees for pre-approved non-audit services rendered to Invesco and Invesco Affiliates for the last two fiscal years as follows:
| Fees Billed for Non- Audit Services Rendered to Invesco and Invesco Affiliates for fiscal year end 2012 That Were Required to be Pre-Approved by the Registrant’s Audit Committee | Percentage of Fees Billed Applicable to Non-Audit Services Provided for fiscal year end 2012 Pursuant to Waiver of Pre- Approval Requirement(1) | Fees Billed for Non- Audit Services Rendered to Invesco and Invesco Affiliates for fiscal year end 2011 That Were Required to be Pre-Approved by the Registrant’s Audit Committee | Percentage of Fees Billed Applicable to Non-Audit Services Provided for fiscal year end 2011 Pursuant to Waiver of Pre- Approval Requirement(1) | |||||||||||||
Audit-Related Fees | $ | 0 | 0 | % | $ | 0 | 0 | % | ||||||||
Tax Fees | $ | 0 | 0 | % | $ | 0 | 0 | % | ||||||||
All Other Fees | $ | 0 | 0 | % | $ | 0 | 0 | % | ||||||||
|
|
|
| |||||||||||||
Total Fees(2) | $ | 0 | 0 | % | $ | 0 | 0 | % | ||||||||
| (1) | With respect to the provision of non-audit services, the pre-approval requirement is waived pursuant to a de minimis exception if (i) such services were not recognized as non-audit services by the Registrant at the time of engagement, (ii) the aggregate amount of all such services provided is no more than 5% of the aggregate audit and non-audit fees paid by the Registrant, Invesco and Invesco Affiliates to PWC during a fiscal year; and (iii) such services are promptly brought to the attention of the Registrant’s Audit Committee and approved by the Registrant’s Audit Committee prior to the completion of the audit. |
| (2) | Including the fees for services not required to be pre-approved by the registrant’s audit committee, PWC billed Invesco and Invesco Affiliates aggregate non-audit fees of $0 for the fiscal year ended 2012, and $0 for the fiscal year ended 2011, for non-audit services rendered to Invesco and Invesco Affiliates. |
The Audit Committee also has considered whether the provision of non-audit services that were rendered to Invesco and Invesco Affiliates that were not required to be pre-approved pursuant to SEC regulations, if any, is compatible with maintaining PWC’s independence.
PRE-APPROVAL OF AUDIT AND NON-AUDIT SERVICES
POLICIES AND PROCEDURES
As adopted by the Audit Committees of
the Invesco Funds (the “Funds”)
Last Amended May 4, 2010
Statement of Principles
Under the Sarbanes-Oxley Act of 2002 and rules adopted by the Securities and Exchange Commission (“SEC”) (“Rules”), the Audit Committees of the Funds’ (the “Audit Committees”) Board of Trustees (the “Board”) are responsible for the appointment, compensation and oversight of the work of independent accountants (an “Auditor”). As part of this responsibility and to assure that the Auditor’s independence is not impaired, the Audit Committees pre-approve the audit and non-audit services provided to the Funds by each Auditor, as well as all non-audit services provided by the Auditor to the Funds’ investment adviser and to affiliates of the adviser that provide ongoing services to the Funds (“Service Affiliates”) if the services directly impact the Funds’ operations or financial reporting. The SEC Rules also specify the types of services that an Auditor may not provide to its audit client. The following policies and procedures comply with the requirements for pre-approval and provide a mechanism by which management of the Funds may request and secure pre-approval of audit and non-audit services in an orderly manner with minimal disruption to normal business operations.
Proposed services either may be pre-approved without consideration of specific case-by-case services by the Audit Committees (“general pre-approval”) or require the specific pre-approval of the Audit Committees (“specific pre-approval”). As set forth in these policies and procedures, unless a type of service has received general pre-approval, it will require specific pre-approval by the Audit Committees. Additionally, any fees exceeding 110% of estimated pre-approved fee levels provided at the time the service was pre-approved will also require specific approval by the Audit Committees before payment is made. The Audit Committees will also consider the impact of additional fees on the Auditor’s independence when determining whether to approve any additional fees for previously pre-approved services.
The Audit Committees will annually review and generally pre-approve the services that may be provided by each Auditor without obtaining specific pre-approval from the Audit Committee generally on an annual basis. The term of any general pre-approval runs from the date of such pre-approval through September 30th of the following year, unless the Audit Committees consider a different period and state otherwise. The Audit Committees will add to or subtract from the list of general pre-approved services from time to time, based on subsequent determinations.
The purpose of these policies and procedures is to set forth the guidelines to assist the Audit Committees in fulfilling their responsibilities.
Delegation
The Audit Committees may from time to time delegate pre-approval authority to one or more of its members who are Independent Trustees. All decisions to pre-approve a service by a delegated member shall be reported to the Audit Committees at the next quarterly meeting.
Audit Services
The annual audit services engagement terms will be subject to specific pre-approval of the Audit Committees. Audit services include the annual financial statement audit and other procedures such as tax provision work that is required to be performed by the independent auditor to be able to form an opinion on the Funds’ financial statements. The Audit Committees will obtain, review and consider sufficient information concerning the proposed Auditor to make a reasonable evaluation of the Auditor’s qualifications and independence.
In addition to the annual Audit services engagement, the Audit Committees may grant either general or specific pre-approval of other audit services, which are those services that only the independent auditor reasonably can provide. Other Audit services may include services such as issuing consents for the inclusion of audited financial statements with SEC registration statements, periodic reports and other documents filed with the SEC or other documents issued in connection with securities offerings.
Non-Audit Services
The Audit Committees may provide either general or specific pre-approval of any non-audit services to the Funds and its Service Affiliates if the Audit Committees believe that the provision of the service will not impair the independence of the Auditor, is consistent with the SEC’s Rules on auditor independence, and otherwise conforms to the Audit Committees’ general principles and policies as set forth herein.
Audit-Related Services
“Audit-related services” are assurance and related services that are reasonably related to the performance of the audit or review of the Fund’s financial statements or that are traditionally performed by the independent auditor. Audit-related services include, among others, accounting consultations related to accounting, financial reporting or disclosure matters not classified as “Audit services”; assistance with understanding and implementing new accounting and financial reporting guidance from rulemaking authorities; and agreed-upon procedures related to mergers, compliance with ratings agency requirements and interfund lending activities.
Tax Services
“Tax services” include, but are not limited to, the review and signing of the Funds’ federal tax returns, the review of required distributions by the Funds and consultations regarding tax matters such as the tax treatment of new investments or the impact of new regulations. The Audit Committees will scrutinize carefully the retention of the Auditor in connection with a transaction initially recommended by the Auditor, the major business purpose of which may be tax avoidance or the tax treatment of which may not be supported in the Internal Revenue Code and related regulations. The Audit Committees will consult with the Funds’ Treasurer (or his or her designee) and may consult with outside counsel or advisors as necessary to ensure the consistency of Tax services rendered by the Auditor with the foregoing policy.
No Auditor shall represent any Fund or any Service Affiliate before a tax court, district court or federal court of claims.
Under rules adopted by the Public Company Accounting Oversight Board and approved by the SEC, in connection with seeking Audit Committees’ pre-approval of permissible Tax services, the Auditor shall:
| 1. | Describe in writing to the Audit Committees, which writing may be in the form of the proposed engagement letter: |
| a. | The scope of the service, the fee structure for the engagement, and any side letter or amendment to the engagement letter, or any other agreement between the Auditor and the Fund, relating to the service; and |
| b. | Any compensation arrangement or other agreement, such as a referral agreement, a referral fee or fee-sharing arrangement, between the Auditor and any person (other than the Fund) with respect to the promoting, marketing, or recommending of a transaction covered by the service; |
| 2. | Discuss with the Audit Committees the potential effects of the services on the independence of the Auditor; and |
| 3. | Document the substance of its discussion with the Audit Committees. |
All Other Auditor Services
The Audit Committees may pre-approve non-audit services classified as “All other services” that are not categorically prohibited by the SEC, as listed in Exhibit 1 to this policy.
Pre-Approval Fee Levels or Established Amounts
Pre-approval of estimated fees or established amounts for services to be provided by the Auditor under general or specific pre-approval policies will be set periodically by the Audit Committees. Any proposed fees exceeding 110% of the maximum estimated pre-approved fees or established amounts for pre-approved audit and non-audit services will be reported to the Audit Committees at the quarterly Audit Committees meeting and will require specific approval by the Audit Committees before payment is made. The Audit Committees will always factor in the overall relationship of fees for audit and non-audit services in determining whether to pre-approve any such services and in determining whether to approve any additional fees exceeding 110% of the maximum pre-approved fees or established amounts for previously pre-approved services.
Procedures
Generally on an annual basis, Invesco Advisers, Inc. (“Invesco”) will submit to the Audit Committees for general pre-approval, a list of non-audit services that the Funds or Service Affiliates of the Funds may request from the Auditor. The list will describe the non-audit services in reasonable detail and will include an estimated range of fees and such other information as the Audit Committee may request.
Each request for services to be provided by the Auditor under the general pre-approval of the Audit Committees will be submitted to the Funds’ Treasurer (or his or her designee) and must include a detailed description of the services to be rendered. The Treasurer or his or her designee will ensure that such services are included within the list of services that have received the general pre-approval of the Audit Committees. The Audit Committees will be informed at the next quarterly scheduled Audit Committees meeting of any such services for which the Auditor rendered an invoice and whether such services and fees had been pre-approved and if so, by what means.
Each request to provide services that require specific approval by the Audit Committees shall be submitted to the Audit Committees jointly by the Fund’s Treasurer or his or her designee and the Auditor, and must include a joint statement that, in their view, such request is consistent with the policies and procedures and the SEC Rules.
Each request to provide tax services under either the general or specific pre-approval of the Audit Committees will describe in writing: (i) the scope of the service, the fee structure for the engagement, and any side letter or amendment to the engagement letter, or any other agreement between the Auditor and the audit client, relating to the service; and (ii) any compensation arrangement or other agreement between the Auditor and any person (other than the audit client) with respect to the promoting, marketing, or recommending of a transaction covered by the service. The Auditor will discuss with the Audit Committees the potential effects of the services on the Auditor’s independence and will document the substance of the discussion.
Non-audit services pursuant to the de minimis exception provided by the SEC Rules will be promptly brought to the attention of the Audit Committees for approval, including documentation that each of the conditions for this exception, as set forth in the SEC Rules, has been satisfied.
On at least an annual basis, the Auditor will prepare a summary of all the services provided to any entity in the investment company complex as defined in section 2-01(f)(14) of Regulation S-X in sufficient detail as to the nature of the engagement and the fees associated with those services.
The Audit Committees have designated the Funds’ Treasurer to monitor the performance of all services provided by the Auditor and to ensure such services are in compliance with these policies and procedures. The Funds’ Treasurer will report to the Audit Committees on a periodic basis as to the results of such monitoring. Both the Funds’ Treasurer and management of Invesco will immediately report to the chairman of the Audit Committees any breach of these policies and procedures that comes to the attention of the Funds’ Treasurer or senior management of Invesco.
Exhibit 1 to Pre-Approval of Audit and Non-Audit Services Policies and Procedures
Conditionally Prohibited Non-Audit Services (not prohibited if the Fund can reasonably conclude that the results of the service would not be subject to audit procedures in connection with the audit of the Fund’s financial statements)
| • | Bookkeeping or other services related to the accounting records or financial statements of the audit client |
| • | Financial information systems design and implementation |
| • | Appraisal or valuation services, fairness opinions, or contribution-in-kind reports |
| • | Actuarial services |
| • | Internal audit outsourcing services |
Categorically Prohibited Non-Audit Services
| • | Management functions |
| • | Human resources |
| • | Broker-dealer, investment adviser, or investment banking services |
| • | Legal services |
| • | Expert services unrelated to the audit |
| • | Any service or product provided for a contingent fee or a commission |
| • | Services related to marketing, planning, or opining in favor of the tax treatment of confidential transactions or aggressive tax position transactions, a significant purpose of which is tax avoidance |
| • | Tax services for persons in financial reporting oversight roles at the Fund |
| • | Any other service that the Public Company Oversight Board determines by regulation is impermissible. |
| ITEM 5. | AUDIT COMMITTEE OF LISTED REGISTRANTS. |
Not applicable.
| ITEM 6. | SCHEDULE OF INVESTMENTS. |
Investments in securities of unaffiliated issuers is included as part of the reports to stockholders filed under Item 1 of this Form.
| ITEM 7. | DISCLOSURE OF PROXY VOTING POLICIES AND PROCEDURES FOR CLOSED-END MANAGEMENT INVESTMENT COMPANIES. |
Not applicable.
| ITEM 8. | PORTFOLIO MANAGERS OF CLOSED-END MANAGEMENT COMPANIES. |
Not applicable.
| ITEM 9. | PURCHASES OF EQUITY SECURITIES BY CLOSED-END MANAGEMENT INVESTMENT COMPANY AND AFFILIATED PURCHASERS. |
Not applicable.
| ITEM 10. | SUBMISSION OF MATTERS TO A VOTE OF SECURITY HOLDERS. |
None
| ITEM 11. | CONTROLS AND PROCEDURES. |
| (a) | As of February 12, 2013, an evaluation was performed under the supervision and with the participation of the officers of the Registrant, including the PEO and PFO, to assess the effectiveness of the Registrant’s disclosure controls and procedures, as that term is defined in Rule 30a-3(c) under the Investment Company Act of 1940 (the “Act”), as amended. Based on that evaluation, the Registrant’s officers, including the PEO and PFO, concluded that, as of February 12, 2013, the Registrant’s disclosure controls and procedures were reasonably designed to ensure: (1) that information required to be disclosed by the Registrant on Form N-CSR is recorded, processed, summarized and reported within the time periods specified by the rules and forms of the Securities and Exchange Commission; and (2) that material information relating to the Registrant is made known to the PEO and PFO as appropriate to allow timely decisions regarding required disclosure. |
| (b) | There have been no changes in the Registrant’s internal control over financial reporting (as defined in Rule 30a-3(d) under the Act) that occurred during the second fiscal quarter of the period covered by this report that have materially affected, or are reasonably likely to materially affect, the Registrant’s internal control over financial reporting. |
| ITEM 12. | EXHIBITS. |
| 12(a) (1) | Code of Ethics. | |
| 12(a) (2) | Certifications of principal executive officer and principal financial officer as required by Rule 30a-2(a) under the Investment Company Act of 1940. | |
| 12(a) (3) | Not applicable. | |
| 12(b) | Certifications of principal executive officer and principal financial officer as required by Rule 30a-2(b) under the Investment Company Act of 1940. | |
SIGNATURES
Pursuant to the requirements of the Securities Exchange Act of 1934 and the Investment Company Act of 1940, the Registrant has duly caused this report to be signed on its behalf by the undersigned, thereunto duly authorized.
Registrant: AIM Growth Series (Invesco Growth Series)
| By: | /s/ Philip A. Taylor | |
| Philip A. Taylor | ||
| Principal Executive Officer | ||
| Date: | March 8, 2013 | |
Pursuant to the requirements of the Securities and Exchange Act of 1934 and the Investment Company Act of 1940, this report has been signed below by the following persons on behalf of the Registrant and in the capacities and on the dates indicated.
| By: | /s/ Philip A. Taylor | |
| Philip A. Taylor | ||
| Principal Executive Officer | ||
| Date: | March 8, 2013 | |
| By: | /s/ Sheri Morris | |
| Sheri Morris | ||
| Principal Financial Officer | ||
| Date: | March 8, 2013 | |
EXHIBIT INDEX
| 12(a) (1) | Code of Ethics. | |
| 12(a) (2) | Certifications of principal executive officer and principal financial officer as required by Rule 30a-2(a) under the Investment Company Act of 1940. | |
| 12(a) (3) | Not applicable. | |
| 12(b) | Certifications of principal executive officer and principal financial officer as required by Rule 30a-2(b) under the Investment Company Act of 1940. | |