OMB APPROVAL | ||||
| OMB Number: | 3235-0570 | |||
| Expires: | January 31, 2014 | |||
| Estimated average burden | ||||
| hours per response: | 20.6 | |||
UNITED STATES
SECURITIES AND EXCHANGE COMMISSION
Washington, D.C. 20549
FORM N-CSR/A
CERTIFIED SHAREHOLDER REPORT OF REGISTERED
MANAGEMENT INVESTMENT COMPANIES
Investment Company Act file number 811-02699
AIM Growth Series (Invesco Growth Series)
(Exact name of registrant as specified in charter)
11 Greenway Plaza, Suite 1000 Houston, Texas 77046
(Address of principal executive offices) (Zip code)
Philip A. Taylor 11 Greenway Plaza, Suite 1000 Houston, Texas 77046
(Name and address of agent for service)
Registrant’s telephone number, including area code: (713) 626-1919
Date of fiscal year end: 12/31
Date of reporting period: 12/31/12
The Registrant is filing this amendment to its Certified Shareholder Report on Form N-CSR for the period ended December 31, 2012, originally filed with the Securities and Exchange Commission on March 8, 2013 (Accession Number 0001193125-13-097768). The purpose of this amendment is to modify certain information in Item 1 “Reports to Stockholders” with respect to Invesco Conservative Allocation Fund (the “Fund”).
Other than the aforementioned revision this Form N-CSR/A does not reflect events occurring after the filing of the original Form N-CSR, or modify or update the disclosures therein in any way.
Item 1. Report to Stockholders.

Invesco Conservative Allocation Fund’s Long-Term Performance
Results of a $10,000 Investment – Oldest Share Class(es) since Inception
Fund data from 4/29/05; index data from 4/30/05
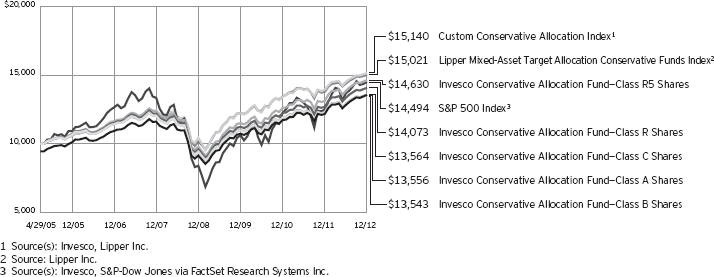
Past performance cannot guarantee comparable future results.
The data shown in the chart include reinvested distributions, applicable sales charges and Fund expenses including management fees. Results for Class B shares are calculated as if a hypothetical
shareholder had liquidated his entire investment in the Fund at the close of the reporting period and paid the contingent deferred sales charges, if applicable. Index results include reinvested dividends, but they do not reflect sales charges. Performance of the peer group,
if applicable, reflects fund expenses and management fees; performance of a market index does not. Performance shown in the chart and table(s) does not reflect deduction of taxes a shareholder would pay on Fund distributions or sale of Fund shares.
| 2 | Invesco Allocation Funds |
Average Annual Total Returns |
| ||||
| As of 12/31/12, including maximum applicable sales charges | |||||
Class A Shares | |||||
Inception (4/29/05) | 4.04% | ||||
5 Years | 1.98 | ||||
1 Year | 5.15 | ||||
Class B Shares | |||||
Inception (4/29/05) | 4.03% | ||||
5 Years | 2.03 | ||||
1 Year | 5.33 | ||||
Class C Shares | |||||
Inception (4/29/05) | 4.05% | ||||
5 Years | 2.39 | ||||
1 Year | 9.31 | ||||
Class R Shares | |||||
Inception (4/29/05) | 4.55% | ||||
5 Years | 2.89 | ||||
1 Year | 10.92 | ||||
Class S Shares | |||||
Inception | 4.83% | ||||
5 Years | 3.16 | ||||
1 Year | 11.27 | ||||
Class Y Shares | |||||
Inception | 4.92% | ||||
5 Years | 3.30 | ||||
1 Year | 11.46 | ||||
Class R5 Shares | |||||
Inception (4/29/05) | 5.08% | ||||
5 Years | 3.40 | ||||
1 Year | 11.56 | ||||
Class S shares incepted on June 6, 2011. Performance shown prior to that date is that of Class A shares and includes the 12b-1 fees applicable to Class A shares. Class A share performance reflects any applicable fee waivers or expense reimbursements.
Class Y shares incepted on October 3, 2008. Performance shown prior to that date is that of Class A shares and includes the 12b-1 fees applicable to Class A shares. Class A share performance reflects any applicable fee waivers or expense reimbursements.
The performance data quoted represent past performance and cannot guarantee comparable future results; current performance may
be lower or higher. Please visit invesco.com/performance for the most recent month-end performance. Performance figures reflect reinvested distributions, changes in net asset value and the effect of the maximum sales charge unless otherwise stated. Investment return and principal value will fluctuate so that you may have a gain or loss when you sell shares.
The total annual Fund operating expense ratio set forth in the most recent Fund prospectus as of the date of this report for Class A, Class B, Class C, Class R, Class S, Class Y and Class R5 shares was 1.17%, 1.92%, 1.92%, 1.42%, 1.07%, 0.92% and 0.85%, respectively.1 The expense ratios presented above may vary from the expense ratios presented in other sections of this report that are based on expenses incurred during the period covered by this report.
Class A share performance reflects the maximum 5.50% sales charge, and Class B and Class C share performance reflects the applicable contingent deferred sales charge (CDSC) for the period involved. The CDSC on Class B shares declines from 5% beginning at the time of purchase to 0% at the beginning of the seventh year. The CDSC on Class C shares is 1% for the first year after purchase. Class R, Class S, Class Y and Class R5 shares do not have a front-end sales charge or a CDSC; therefore, performance is at net asset value.
The performance of the Fund’s share classes will differ primarily due to different sales charge structures and class expenses.
Had the adviser not waived fees and/ or reimbursed expenses in the past, performance would have been lower.
| 1 | The expense ratio includes acquired fund fees and expenses of the underlying funds in which the Fund invests of 0.64% for Invesco Conservative Allocation Fund. |
| 3 | Invesco Allocation Funds |
Invesco Growth Allocation Fund’s Long-Term Performance
Results of a $10,000 Investment – Oldest Share Class(es) since Inception
Fund and index data from 4/30/04
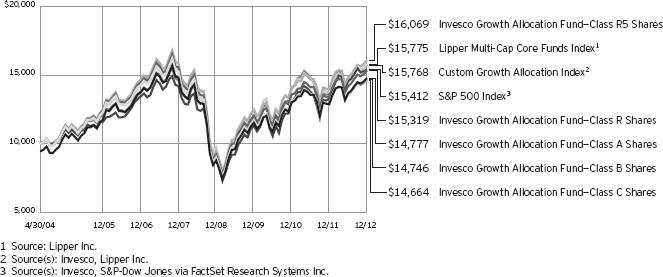
Past performance cannot guarantee comparable future results.
The data shown in the chart include reinvested distributions, applicable sales charges and Fund expenses including management fees. Results for Class B shares are calculated as if a hypothetical
shareholder had liquidated his entire investment in the Fund at the close of the reporting period and paid the contingent deferred sales charges, if applicable. Index results include reinvested dividends, but they do not reflect sales charges. Performance of the peer group,
if applicable, reflects fund expenses and management fees; performance of a market index does not. Performance shown in the chart and table(s) does not reflect deduction of taxes a shareholder would pay on Fund distributions or sale of Fund shares.
| 4 | Invesco Allocation Funds |
Average Annual Total Returns |
| ||||
| As of 12/31/12, including maximum applicable sales charges | |||||
Class A Shares | |||||
Inception (4/30/04) | 4.61% | ||||
5 Years | -1.18 | ||||
1 Year | 8.42 | ||||
Class B Shares | |||||
Inception (4/30/04) | 4.58% | ||||
5 Years | -1.14 | ||||
1 Year | 8.73 | ||||
Class C Shares | |||||
Inception (4/30/04) | 4.51% | ||||
5 Years | -0.79 | ||||
1 Year | 12.73 | ||||
Class R Shares | |||||
Inception (4/30/04) | 5.04% | ||||
5 Years | -0.29 | ||||
1 Year | 14.32 | ||||
Class S Shares | |||||
Inception | 5.33% | ||||
5 Years | 0.02 | ||||
1 Year | 14.70 | ||||
Class Y Shares | |||||
Inception | 5.42% | ||||
5 Years | 0.17 | ||||
1 Year | 14.88 | ||||
Class R5 Shares | |||||
Inception (4/30/04) | 5.62% | ||||
5 Years | 0.27 | ||||
1 Year | 14.95 | ||||
Class S shares incepted on September 25, 2009. Performance shown prior to that date is that of
Class A shares and includes the 12b-1 fees applicable to Class A shares. Class A share performance reflects any applicable fee waivers or expense reimbursements.
Class Y shares incepted on October 3, 2008. Performance shown prior to that date is that of Class A shares and includes the 12b-1 fees applicable to Class A shares. Class A share performance reflects any applicable fee waivers or expense reimbursements.
The performance data quoted represent past performance and cannot guarantee comparable future results; current performance may be lower or higher. Please visit invesco.com/performance for the
most recent month-end performance. Performance figures reflect reinvested distributions, changes in net asset value and the effect of the maximum sales charge unless otherwise stated. Investment return and principal value will fluctuate so that you may have a gain or loss when you sell shares.
The total annual Fund operating expense ratio set forth in the most recent Fund prospectus as of the date of this report for Class A, Class B, Class C, Class R, Class S, Class Y and Class R5 shares was 1.36%, 2.11%, 2.11%, 1.61%, 1.26%, 1.11% and 0.91%, respectively.1 The expense ratios presented above may vary from the expense ratios presented in other sections of this report that are based on expenses incurred during the period covered by this report.
Class A share performance reflects the maximum 5.50% sales charge, and Class B and Class C share performance reflects the applicable contingent deferred sales charge (CDSC) for the period involved. The CDSC on Class B shares declines from 5% beginning at the time of purchase to 0% at the beginning of the seventh year. The CDSC on Class C shares is 1% for the first year after purchase. Class R, Class S, Class Y and Class R5 shares do not have a front-end sales charge or a CDSC; therefore, performance is at net asset value.
The performance of the Fund’s share classes will differ primarily due to different sales charge structures and class expenses.
Had the adviser not waived fees and/ or reimbursed expenses on the Fund’s Class A, B, C, R, S and Y shares in the past, performance would have been lower.
| 1 | The expense ratio includes acquired fund fees and expenses of the underlying funds in which the Fund invests of 0.78% for Invesco Growth Allocation Fund. |
| 5 | Invesco Allocation Funds |
Invesco Moderate Allocation Fund’s Long-Term Performance
Results of a $10,000 Investment – Oldest Share Class(es) since Inception
Fund and index data from 4/30/04
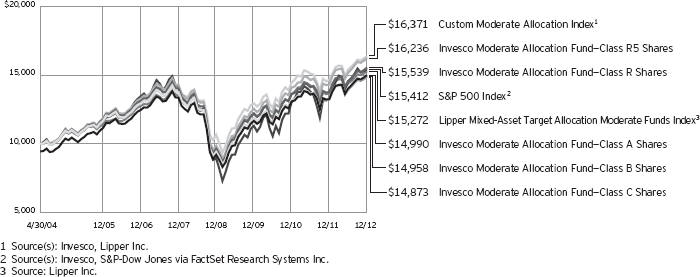
Past performance cannot guarantee comparable future results.
The data shown in the chart include reinvested distributions, applicable sales charges and Fund expenses including management fees. Results for Class B shares are calculated as if a hypothetical
shareholder had liquidated his entire investment in the Fund at the close of the reporting period and paid the contingent deferred sales charges, if applicable. Index results include reinvested dividends, but they do not reflect sales charges. Performance of the peer group,
if applicable, reflects fund expenses and management fees; performance of a market index does not. Performance shown in the chart and table(s) does not reflect deduction of taxes a shareholder would pay on Fund distributions or sale of Fund shares.
| 6 | Invesco Allocation Funds |
| Average Annual Total Returns | |||||
| As of 12/31/12, including maximum applicable sales charges | |||||
Class A Shares | |||||
Inception (4/30/04) | 4.78% | ||||
5 Years | 1.18 | ||||
1 Year | 7.00 | ||||
Class B Shares | |||||
Inception (4/30/04) | 4.75% | ||||
5 Years | 1.24 | ||||
1 Year | 7.37 | ||||
Class C Shares | |||||
Inception (4/30/04) | 4.68% | ||||
5 Years | 1.57 | ||||
1 Year | 11.38 | ||||
Class R Shares | |||||
Inception (4/30/04) | 5.21% | ||||
5 Years | 2.08 | ||||
1 Year | 12.91 | ||||
Class S Shares | |||||
Inception | 5.49% | ||||
5 Years | 2.38 | ||||
1 Year | 13.31 | ||||
Class Y Shares | |||||
Inception | 5.59% | ||||
5 Years | 2.54 | ||||
1 Year | 13.46 | ||||
Class R5 Shares | |||||
Inception (4/30/04) | 5.75% | ||||
5 Years | 2.59 | ||||
1 Year | 13.49 | ||||
Class S shares incepted on September 25, 2009. Performance shown prior to that date is that of Class A shares and includes the 12b-1 fees applicable to Class A
shares. Class A share performance reflects any applicable fee waivers or expense reimbursements.
Class Y shares incepted on October 3, 2008. Performance shown prior to that date is that of Class A shares and includes the 12b-1 fees applicable to Class A shares. Class A share performance reflects any applicable fee waivers or expense reimbursements.
The performance data quoted represent past performance and cannot guarantee comparable future results; current performance may be lower or higher. Please visit invesco.com/performance for the most recent month-end performance. Performance figures reflect reinvested
distributions, changes in net asset value and the effect of the maximum sales charge unless otherwise stated. Investment return and principal value will fluctuate so that you may have a gain or loss when you sell shares.
The total annual Fund operating expense ratio set forth in the most recent Fund prospectus as of the date of this report for Class A, Class B, Class C, Class R, Class S, Class Y and Class R5 shares was 1.23%, 1.98%, 1.98%, 1.48%, 1.13%. 0.98% and 0.82%, respectively.1 The expense ratios presented above may vary from the expense ratios presented in other sections of this report that are based on expenses incurred during the period covered by this report.
Class A share performance reflects the maximum 5.50% sales charge, and Class B and Class C share performance reflects the applicable contingent deferred sales charge (CDSC) for the period involved. The CDSC on Class B shares declines from 5% beginning at the time of purchase to 0% at the beginning of the seventh year. The CDSC on Class C shares is 1% for the first year after purchase. Class R, Class S, Class Y and Class R5 shares do not have a front-end sales charge or a CDSC; therefore, performance is at net asset value.
The performance of the Fund’s share classes will differ primarily due to different sales charge structures and class expenses.
Had the adviser not waived fees and/ or reimbursed expenses on the Fund’s Class A, B, C, R, S and Y shares in the past, performance would have been lower.
| 1 | The expense ratio includes acquired fund fees and expenses of the underlying funds in which the Fund invests of 0.72% for Invesco Moderate Allocation Fund. |
| 7 | Invesco Allocation Funds |
Letters to Shareholders
 | Dear Shareholders: This annual report contains information about your Fund and the factors that affected its performance during the reporting period. Inside, you’ll find a discussion from your portfolio managers about how they managed your Fund, performance data for your Fund, a complete list of your Fund’s investments as of the close of the reporting period and other important information. I hope you find this report of interest. The reporting period covered by this report was challenging. As the year began, investors cheered generally positive economic indicators, and markets generally rose. Soon, however, US economic data turned mixed and investors’ attention shifted to the efforts of eurozone governments to implement new policies intended to reduce debt levels, strengthen the banking system and stimulate economic growth. Later in the year, in the US, mixed economic data, competing proposals on how to reduce the federal budget deficit and a contentious presidential | |
| contest increased investor uncertainty and hindered market performance. Throughout the year, your Fund’s portfolio managers adhered to their long-term investment strategies, and later in this report they explain why your Fund performed as it did during the reporting period. | ||
Adhering to your long-term investment plan can be difficult, particularly during periods of market volatility and economic uncertainty. That’s one reason Invesco suggests investors work with a skilled and trusted financial adviser who is familiar with their financial situation, investment goals and risk tolerance. A good financial adviser can provide insight and perspective when markets are volatile; motivation and reassurance when times are uncertain; and advice and recommendations when your financial situation or investment goals change.
Timely insight and information from many of Invesco’s investment professionals is available at our website, invesco.com/us. We offer in-depth articles, video clips and audio commentaries from many of our portfolio managers and other investment professionals on a wide range of topics of interest to investors. At invesco.com/us, you also can access information about your Invesco account at any time.
What we mean by Intentional Investing
At Invesco, all of our people and all of our resources are dedicated to helping investors achieve their financial objectives. It’s a philosophy we call Intentional Investing®, and it guides the way we:
| ¾ | Manage investments - Our dedicated investment professionals search the world for the best opportunities, and each investment team follows a clear, disciplined process to build portfolios and mitigate risk. |
| ¾ | Provide choices - We offer equity, fixed income, asset allocation and alternative strategies so you and your financial adviser can build an investment portfolio designed for your individual needs and goals. |
| ¾ | Connect with you - We’re committed to giving you the expert insights you need to make informed investing decisions, and we are well-equipped to provide high-quality support for investors and advisers. |
Invesco believes in putting investors first, and that’s why investment management is all we do. Our sole focus on managing your money allows your financial adviser to build a portfolio of Invesco funds appropriate for your investment needs and goals now and when your circumstances change.
Have a question?
If you have a question about your account, please contact an Invesco client services representative at 800 959 4246. If you have an Invesco-related question or comment, feel free to email me directly at phil@invesco.com.
All of us at Invesco look forward to serving your investment management needs for many years to come. Thank you for investing with us.
Sincerely,

Philip Taylor
Senior Managing Director, Invesco Ltd.
| 8 | Invesco Allocation Funds |
| Dear Fellow Shareholders: While short-term challenges for the financial markets regularly come and go, it’s clear that significant and longer term economic obstacles remain both here at home and abroad. There appear to be no easy solutions to many of these issues. As a result, the financial markets have had little conviction to respond to what has been slow, yet noticeable improvement in some economic benchmarks in recent months. No one likes uncertainty, especially financial markets. But even in these uncertain times, it appears that investors are still approaching the market with cautious optimism, with some taking on more risk in order to refocus on their long-term savings goals. Maybe this describes you, or perhaps you have been sitting on the sidelines thinking about getting back into the market, but are still a bit hesitant to act because of market uncertainty. Clearly, risk remains a primary focus for investors of all types. As Trustees of the Invesco Funds, | |
| one of our primary responsibilities is to ensure your fund’s adviser is cognizant of the risks in each of the funds it manages. A thoughtful risk management plan may help investors navigate through market turbulence or an economic downturn. This is why we make risk management a critical element of our annual contract renewal process, like the one we complete with Invesco every year. | ||

To be sure, there will always be risks involved with investing, but you shouldn’t let short-term news or your emotions dictate your investments. Because no one can predict with 100% accuracy the movements of financial markets, I strongly encourage you to speak with a professional financial adviser who can assist you in building an investment portfolio that reflects your individual risk tolerance and is designed to help achieve your individual financial objectives.
You can be sure your Board remains committed to doing its part in helping you along the way. In addition to ensuring that your fund’s adviser is focused on the risks in the funds it manages, we also remain committed to managing fund costs and working with your fund’s adviser to provide a compelling and diversified product offering to potentially meet your investing goals.
In that regard, your Board approved a number of fund mergers and the launch of several new funds, including the first Invesco mutual fund available to US retail investors managed by investment professionals at Invesco Perpetual*, one of the largest independent investment managers in the UK.
Let me close by thanking Carl Frischling upon his retirement from the Invesco Funds Board for his 35 years of distinguished service and unwavering commitment to our funds’ shareholders. As always, please contact me at bruce@brucecrockett.com with any questions or concerns you may have.
On behalf of the Board, we look forward to continuing to represent your interests and serving your investment needs.
Sincerely,

Bruce L. Crockett
Independent Chair
Invesco Funds Board of Trustees
| * | Invesco Perpetual is a business name of Invesco Asset Management Limited (IAML), a registered investment adviser. IAML is a wholly owned, indirect subsidiary of Invesco Ltd. |
| 9 | Invesco Allocation Funds |
Management’s Discussion of Fund Performance
Performance summary – Invesco Conservative Allocation Fund For the year ended December 31, 2012, Invesco Conservative Allocation Fund, at net asset value (NAV), outperformed its custom style-specific benchmark. Positive absolute performance from global developed market equities drove results throughout the year. Commodities declined overall and experienced meaningful volatility. Government bonds produced positive absolute returns serving as safe haven assets during periods of heightened volatility, particularly in April and May of 2012. Your Fund’s long-term performance appears later in this report.
|
| |||
Fund vs. Indexes Total returns, 12/31/11 to 12/31/12, at net asset value (NAV). Performance shown does not include applicable contingent deferred sales charges (CDSC) or front-end sales charges, which would have reduced performance.
|
| |||
| Class A Shares | 11.28 | % | ||
Class B Shares | 10.33 | |||
Class C Shares | 10.31 | |||
Class R Shares | 10.92 | |||
Class S Shares | 11.27 | |||
Class Y Shares | 11.46 | |||
Class R5 Shares* | 11.56 | |||
S&P 500 Index‚(Broad Market Index) | 16.00 | |||
Custom Conservative Allocation Indexn(Style-Specific Index) | 8.65 | |||
Lipper Mixed-Asset Target Allocation Conservative Funds Index¿(Peer Group Index) | 8.92 | |||
Source(s): ‚Invesco, S&P-Dow Jones via FactSet Research Systems Inc.; nInvesco, Lipper Inc.; ¿Lipper Inc. |
| |||
*Effective September 24, 2012, Institutional Class shares were renamed Class R5 shares. |
| |||
How we invest
Invesco Conservative Allocation Fund is intended for investors with a low to moderate risk tolerance. The Fund invests in underlying funds diversified among asset classes (stocks, bonds and alternative asset classes), investment styles (value, blend/core and growth), regions (domestic and international) and market capitalizations (mid and large). The underlying funds include bond funds, which represent approximately 54.50% of the portfolio; stock funds, which represent approximately 30.08% of the portfolio; and alternative funds such as global real estate, balanced-risk allocation and commodity funds that represent approximately
15.42% of the portfolio.
The balanced-risk allocation underlying funds can shift exposures between equities, fixed income and commodities. The commodity underlying fund invests in instruments that provide exposure to the commodities market. They gain exposure to their underlying assets through the use of derivatives, including futures, swap agreements and commodity-linked notes.
While no fund can guarantee positive performance, the broad portfolio diversification strives to provide exposure to areas of the market that may perform well in any given period. It also attempts to limit exposure to any one area of the
market that may be underperforming.
We establish target asset class weightings and underlying fund selections for the Fund and monitor the Fund on an ongoing basis. The underlying funds are actively managed by their respective management teams based on individual fund objectives, investment strategies and management techniques.
While the weightings of various underlying funds in the portfolio may vary from their targets during the year due to market movements, we rebalance the portfolio quarterly to maintain its target asset class allocations. There are also additional triggers in place to rebalance intra-quarter if allocations stray from a specified range.
Market conditions and your Fund
The year began with the advance of equities and commodities driven by indications of improving economic data and continued stimulus from global monetary authorities. Most sovereign bond markets fell during the first quarter of 2012 on signs of improving economic conditions, reduced economic strains in Europe and declining expectations for further Treasury bond purchase programs.
During April and May, risky asset gains from earlier in the year were eroded as a result of renewed fears arising from the ongoing European crisis coupled with weakening economic data in key markets. Government bonds once again fulfilled their role as safe haven assets as yields contracted in response to the weakness in risky assets.
In the third quarter, equity, fixed income and commodity markets all posted impressive results. Riskier assets, especially commodities, were able to
| Portfolio Composition | ||||
Asset Class | Target Allocation Range | % of Total Net Assets as of 12/31/12 | ||
Intermediate Term Taxable Investment Grade | 24.52% | 24.35% | ||
Taxable Non-Investment Grade | 14.36 | 14.39 | ||
Balanced-Risk | 13.50 | 13.09 | ||
Large-Cap Value | 8.78 | 8.83 | ||
International/Global Blend | 4.00 | 4.26 | ||
Large-Cap Growth | 3.86 | 3.76 | ||
International/Global Growth | 3.68 | 3.76 | ||
Emerging Markets Fixed Income | 3.27 | 3.34 | ||
Emerging Markets | 3.20 | 3.31 | ||
Large-Cap Blend | 2.72 | 2.73 | ||
Mid-Cap Blend | 2.08 | 2.15 | ||
Global Real Estate | 1.92 | 2.02 | ||
Small-Cap Blend | 1.76 | 1.79 | ||
Cash Equivalents Plus Other Assets Less Liabilities | 12.35 | 12.22 |
Total Net Assets | $337.2 million |
Fund Nasdaq Symbols | ||
Class A Shares | CAAMX | |
Class B Shares | CMBAX | |
Class C Shares | CACMX | |
Class R Shares | CMARX | |
Class S Shares | CMASX | |
Class Y Shares | CAAYX | |
Class R5 Shares | CMAIX | |
| 10 | Invesco Allocation Funds |
stage a bounce back on expectations for additional monetary easing and hope that Europe would be able to finally make headway on its lingering economic issues. Bond yields spiked twice during the third quarter, but managed to settle down as markets see-sawed between concerns over inflation and the continuing weakness in Europe.
The year ended with a lift in equities offset by declines in bonds and commodities. Investors had a host of political issues to navigate, including elections in the US, China and Japan; “fiscal cliff” negotiations in the US; and continuing concerns over European and Chinese economic growth. Equities were the lone bright spot while commodity markets were weighed down by concerns over falling demand and an improvement in crop yields. Government bond yields ultimately made their way higher as the market experienced both rallies and sell-offs.
Invesco Core Plus Bond Fund, Invesco Balanced-Risk Allocation Fund and Invesco High Yield Fund were the top contributors to absolute Fund performance for the reporting period. There were no absolute detractors from overall Fund performance. Relative to the Fund’s custom style-specific index, Invesco International Core Equity Fund, PowerShares 1-30 Laddered Treasury Portfolio and Invesco American Franchise Fund were the largest detractors from performance.
Please note that some of the underlying funds – which include, but are not limited to, Invesco Balanced-Risk Allocation Fund, Invesco Balanced-Risk Commodity Strategy Fund and Invesco Core Plus Bond Fund – may be primarily implemented with derivatives, which may create economic leverage in the underlying funds. Please note that our strategy is principally implemented with derivative instruments that include futures and total return swaps. Therefore, all or most of the performance of the strategy, both positive and negative, can be attributed to these instruments. Derivatives can be a more liquid and cost-effective way to gain exposure to asset classes. Additionally, the leverage used in the strategy is inherent in these instruments.
Finally, we thank you for your continued commitment to Invesco Conservative Allocation Fund.
The views and opinions expressed in management’s discussion of Fund performance are those of Invesco Advisers, Inc. These views and opinions are subject to change at any time based on factors such as market and economic conditions. These views and opinions may not be relied upon as investment advice or recommendations, or as an offer for a particular security. The information is not a complete analysis of every aspect of any market, country, industry, security or the Fund. Statements of fact are from sources considered reliable, but Invesco Advisers, Inc. makes no representation or warranty as to their completeness or accuracy. Although historical performance is no guarantee of future results, these insights may help you understand our investment management philosophy.
See important Fund and, if applicable, index disclosures later in this report.
 | Mark Ahnrud Chartered Financial Analyst, portfolio manager, is manager of Invesco Conservative Allocation Fund. He joined Invesco in 2000. | |
Mr. Ahnrud earned a BS in finance and investments from Babson College and an MBA from Duke University Fuqua School of Business.
| ||
 | Chris Devine Chartered Financial Analyst, portfolio manager, is manager of Invesco Conservative Allocation Fund. He joined Invesco in 1998. | |
Mr. Devine earned a BA in economics from Wake Forest University and an MBA from the University of Georgia.
| ||
 | Scott Hixon Chartered Financial Analyst, portfolio manager, is manager of Invesco Conservative Allocation Fund. He joined Invesco in 1994. | |
Mr. Hixon earned a BBA in finance from Georgia Southern University and an MBA in finance from Georgia State University.
| ||
 | Christian Ulrich Chartered Financial Analyst, portfolio manager, is manager of Invesco Conservative Allocation Fund. He joined Invesco in 2000. | |
Mr. Ulrich earned the equivalent of a BBA from the KV Zurich Business School in Zurich, Switzerland.
| ||
 | Scott Wolle Chartered Financial Analyst, portfolio manager, is manager of Invesco Conservative Allocation Fund. He joined Invesco in 1999. | |
| Mr. Wolle earned a BS in finance from Virginia Polytechnic Institute and State University and an MBA from Duke University Fuqua School of Business. | ||
| Assisted by the Global Asset Allocation Team | ||
| 11 | Invesco Allocation Funds |
Management’s Discussion of Fund Performance
Performance summary – Invesco Growth Allocation Fund For the year ended December 31, 2012, Invesco Growth Allocation Fund, at net asset value (NAV), performed in line with its custom style-specific benchmark. Positive absolute performance from global developed market equities drove results throughout the year. Commodities declined overall and experienced meaningful volatility. Government bonds produced positive absolute returns serving as safe haven assets during periods of heightened volatility, particularly in April and May of 2012. Your Fund’s long-term performance appears later in this report.
|
| |||
Fund vs. Indexes Total returns, 12/31/11 to 12/31/12, at net asset value (NAV). Performance shown does not include applicable contingent deferred sales charges (CDSC) or front-end sales charges, which would have reduced performance. |
| |||
Class A Shares | 14.68 | % | ||
Class B Shares | 13.73 | |||
Class C Shares | 13.73 | |||
Class R Shares | 14.32 | |||
Class S Shares | 14.70 | |||
Class Y Shares | 14.88 | |||
Class R5 Shares* | 14.95 | |||
S&P 500 Index‚ (Broad Market Index) | 16.00 | |||
Custom Growth Allocation Indexn(Style-Specific Index) | 14.35 | |||
Lipper Multi-Cap Core Funds Index¿(Peer Group Index) | 16.15 | |||
Source(s): ‚Invesco, S&P-Dow Jones via FactSet Research Systems Inc.; nInvesco, Lipper Inc.;¿Lipper Inc. |
| |||
*Effective September 24, 2012, Institutional Class shares were renamed Class R5 shares. |
| |||
How we invest
Invesco Growth Allocation Fund is intended for investors with a relatively high risk tolerance. The Fund invests in underlying funds diversified among asset classes (stocks, bonds and alternative asset classes), investment styles (value, blend/ core and growth), regions (domestic and international) and market capitalizations (small, mid and large). These underlying funds include stock funds, which represent approximately 66.74% of the portfolio; alternative funds such as global real estate, balanced-risk allocation and commodity funds that which represent approximately 26.26% of the portfolio; and one bond fund, which represents
approximately 7% of the portfolio.
The balanced-risk allocation and underlying funds can shift exposures between equities, fixed income and commodities. The commodity underlying fund invests in instruments that provide exposure to the commodities market. They gain exposure to their underlying assets through the use of derivatives, including futures, swap agreements and commodity-linked notes.
While no fund can guarantee positive performance, the broad portfolio diversification strives to provide exposure to areas of the market that may perform well in any given period. It also attempts to limit exposure to any one area of the
market that may be underperforming.
We establish target asset class weightings and underlying fund selections for the Fund and monitor the Fund on an ongoing basis. The underlying funds are actively managed by their respective management teams based on individual fund objectives, investment strategies and management techniques.
While the weightings of various underlying funds in the portfolio may vary from their targets during the year due to market movements, we rebalance the portfolio quarterly to maintain its target asset class allocations. There are also additional triggers in place to rebalance intra-quarter if allocations stray from a specified range.
Market conditions and your Fund
The year began with the advance of equities and commodities driven by indications of improving economic data and continued stimulus from global monetary authorities. Most sovereign bond markets fell during the first quarter of 2012 on signs of improving economic conditions, reduced economic strains in Europe and declining expectations for further Treasury bond purchase programs.
During April and May, risky asset gains from earlier in the year were eroded as a result of renewed fears arising from the ongoing European crisis coupled with weakening economic data in key markets. Government bonds once again fulfilled their role as safe haven assets as yields contracted in response to the weakness in risky assets.
In the third quarter, equity, fixed income and commodity markets all posted impressive results. Riskier assets, especially commodities, were able to stage a bounce back on expectations for
| Portfolio Composition | ||||||||||
Asset Class | Target Allocation Range* | % of Total Net Assets as of 12/31/12 | ||||||||
Balanced-Risk | 22.00% | 21.15% | ||||||||
Large-Cap Value | 19.48 | 19.41 | ||||||||
International/Global Blend | 8.88 | 9.37 | ||||||||
International/Global Growth | 8.17 | 8.29 | ||||||||
Large-Cap Growth | 8.57 | 8.27 | ||||||||
Emerging Markets | 7.10 | 7.29 | ||||||||
Taxable Non-Investment Grade | 7.00 | 6.85 | ||||||||
Large-Cap Blend | 6.03 | 5.98 | ||||||||
Mid-Cap Blend | 4.62 | 4.75 | ||||||||
Global Real Estate | 4.26 | 4.43 | ||||||||
Small-Cap Blend | 3.91 | 3.93 | ||||||||
Cash Equivalents Plus Other Assets Less Liabilities | 0.00 | 0.28 | ||||||||
* Total may not equal 100% due to rounding.
| 12 | Invesco Allocation Funds |
Total Net Assets | $ | 883.1 million |
| Fund Nasdaq Symbols | ||||
Class A Shares | AADAX | |||
Class B Shares | AAEBX | |||
Class C Shares | AADCX | |||
Class R Shares | AADRX | |||
Class S Shares | AADSX | |||
Class Y Shares | AADYX | |||
Class R5 Shares | AADIX |
additional monetary easing and hope that Europe would be able to finally make headway on its lingering economic issues. Bond yields spiked twice during the third quarter, but managed to settle down as markets see-sawed between concerns over inflation and the continuing weakness in Europe.
The year ended with a lift in equities offset by declines in bonds and commodities. Investors had a host of political issues to navigate, including elections in the US, China and Japan; “fiscal cliff” negotiations in the US; and continuing concerns over European and Chinese economic growth. Equities were the lone bright spot while commodity markets were weighed down by concerns over falling demand and an improvement in crop yields. Government bond yields ultimately made their way higher as the market experienced both rallies and sell-offs.
Invesco Balanced-Risk Allocation Fund, Invesco Diversified Dividend Fund and Invesco Developing Markets Fund were the top contributors to absolute Fund performance for the reporting period. There were no absolute detractors from overall Fund performance. Relative to the Fund’s custom style-specific index, Invesco International Core Equity Fund, Invesco American Franchise Fund and Invesco International Growth Fund were the largest detractors from performance.
Please note that some of the underlying funds – which include, but are not limited to, Invesco Balanced-Risk Allocation Fund and Invesco Balanced-Risk Commodity Strategy Fund – may be primarily implemented with derivatives, which may create economic leverage in the underlying funds. Please note that our strategy is principally implemented with derivative instruments that include futures and total return swaps. Therefore, all or most of the performance of the strategy, both positive and negative, can be attributed to these instruments. Derivatives can be a more liquid and cost-effective way to
gain exposure to asset classes. Additionally, the leverage used in the strategy is inherent in these instruments.
Finally, we thank you for your continued commitment to Invesco Growth Allocation Fund.
The views and opinions expressed in management’s discussion of Fund performance are those of Invesco Advisers, Inc. These views and opinions are subject to change at any time based on factors such as market and economic conditions. These views and opinions may not be relied upon as investment advice or recommendations, or as an offer for a particular security. The information is not a complete analysis of every aspect of any market, country, industry, security or the Fund. Statements of fact are from sources considered reliable, but Invesco Advisers, Inc. makes no representation or warranty as to their completeness or accuracy. Although historical performance is no guarantee of future results, these insights may help you understand our investment management philosophy.
See important Fund and, if applicable, index disclosures later in this report.
| Mark Ahnrud Chartered Financial Analyst, portfolio manager, is manager of Invesco Growth Allocation Fund. He joined Invesco in 2000. | |
Mr. Ahnrud earned a BS in finance and investments from Babson College and an MBA from Duke University Fuqua School of Business.
| ||
| Chris Devine Chartered Financial Analyst, portfolio manager, is manager of Invesco Growth Allocation Fund. He joined Invesco in 1998. | |
Mr. Devine earned a BA in economics from Wake Forest University and an MBA from the University of Georgia.
| ||
| Scott Hixon Chartered Financial Analyst, portfolio manager, is manager of Invesco Growth Allocation Fund. He joined Invesco in 1994. | |
Mr. Hixon earned a BBA in finance from Georgia Southern University and an MBA in finance from Georgia State University.
| ||
| Christian Ulrich Chartered Financial Analyst, portfolio manager, is manager of Invesco Growth Allocation Fund. He joined Invesco in 2000. | |
Mr. Ulrich earned the equivalent of a BBA from the KV Zurich Business School in Zurich, Switzerland.
| ||
| Scott Wolle Chartered Financial Analyst, portfolio manager, is manager of Invesco Growth Allocation Fund. He joined Invesco in 1999. | |
| Mr. Wolle earned a BS in finance from Virginia Polytechnic Institute and State University and an MBA from Duke University Fuqua School of Business. | ||
| Assisted by the Global Asset Allocation Team | ||
| 13 | Invesco Allocation Funds |
Management’s Discussion of Fund Performance
Performance summary – Invesco Moderate Allocation Fund For the year ended December 31, 2012, Invesco Moderate Allocation Fund, at net asset value (NAV), outperformed its custom style-specific benchmark. Positive absolute performance from global developed market equities drove results throughout the year. Commodities declined overall and experienced meaningful volatility. Government bonds produced positive absolute returns serving as safe haven during periods of heightened volatility, particularly in April and May of 2012. Your Fund’s long-term performance appears later in this report.
|
| |||
Fund vs. Indexes Total returns, 12/31/11 to 12/31/12, at net asset value (NAV). Performance shown does not include applicable contingent deferred sales charges (CDSC) or front-end sales charges, which would have reduced performance. |
| |||
Class A Shares | 13.18 | % | ||
Class B Shares | 12.37 | |||
Class C Shares | 12.38 | |||
Class R Shares | 12.91 | |||
Class S Shares | 13.31 | |||
Class Y Shares | 13.46 | |||
Class R5 Shares* | 13.49 | |||
S&P 500 Index‚ (Broad Market Index) | 16.00 | |||
Custom Moderate Allocation Indexn(Style-Specific Index) | 11.84 | |||
Lipper Mixed-Asset Target Allocation Moderate Funds Index¿(Peer Group Index) | 11.74 | |||
Source(s): ‚Invesco, S&P-Dow Jones via FactSet Research Systems Inc.; nInvesco, Lipper Inc.;¿Lipper Inc. |
| |||
*Effective September 24, 2012, Institutional Class shares were renamed Class R5 shares. |
| |||
How we invest
Invesco Moderate Allocation Fund is intended for investors with moderate risk tolerance. The Fund invests in underlying funds diversified among asset classes (stocks, bonds and alternative asset classes), investment styles (value, blend/ core and growth), regions (domestic and international) and market capitalizations (small, mid and large). These underlying funds include stock funds, which represent approximately 48.88% of the portfolio; bond funds, which represent approximately 30.50% of the portfolio; and alternative funds such as global real estate, balanced-risk allocation and commodity funds that represent approximately
20.62% of the portfolio.
The balanced-risk allocation underlying funds can shift exposures between equities, fixed income and commodities. The commodity underlying fund invests in instruments that provide exposure to the commodities market. They gain exposure to their underlying assets through the use of derivatives, including futures, swap agreements and commodity-linked notes.
While no fund can guarantee positive performance, the broad portfolio diversification strives to provide exposure to areas of the market that may perform well in any given period. It also attempts to limit exposure to any one area of the market that may be underperforming.
We establish target asset class weightings and underlying fund selections for the Fund and monitor the Fund on an ongoing basis. The underlying funds are actively managed by their respective management teams based on individual fund objectives, investment strategies and management techniques.
While the weightings of various underlying funds in the portfolio may vary from their targets during the year due to market movements, we rebalance the portfolio quarterly to maintain its target asset class allocations. There are also additional triggers in place to rebalance intra-quarter if allocations stray from a specified range.
Market conditions and your Fund
The year began with the advance of equities and commodities driven by indications of improving economic data and continued stimulus from global monetary authorities. Most sovereign bond markets fell during the first quarter of 2012 on signs of improving economic conditions, reduced economic strains in Europe and declining expectations for further Treasury bond purchase programs.
During April and May, risky asset gains from earlier in the year were eroded as a result of renewed fears arising from the ongoing European crisis coupled with weakening economic data in key markets. Government bonds once again fulfilled their role as safe haven assets as yields contracted in response to the weakness in risky assets.
In the third quarter, equity, fixed income and commodity markets all posted impressive results. Riskier assets, especially commodities, were able to stage a bounce back on expectations for additional monetary easing and hope
| Portfolio Composition | ||||||||||
Asset Class | Target Allocation Range* | % of Total Net Assets as of 12/31/12 | ||||||||
Balanced-Risk | 17.50% | 16.91% | ||||||||
Large-Cap Value | 14.28 | 14.29 | ||||||||
Taxable Non-Investment Grade | 12.71 | 12.65 | ||||||||
Intermediate Term Taxable Investment Grade | 9.15 | 9.06 | ||||||||
International/Global Blend | 6.50 | 6.90 | ||||||||
International/Global Growth | 5.98 | 6.11 | ||||||||
Large-Cap Growth | 6.27 | 6.10 | ||||||||
Emerging Markets | 5.20 | 5.36 | ||||||||
Large-Cap Blend | 4.41 | 4.39 | ||||||||
Mid-Cap Blend | 3.38 | 3.50 | ||||||||
Global Real Estate | 3.12 | 3.25 | ||||||||
Small-Cap Blend | 2.86 | 2.90 | ||||||||
Emerging Markets Fixed Income | 2.44 | 2.48 | ||||||||
Cash Equivalents Plus Other Assets Less Liabilities | 6.20 | 6.10 | ||||||||
| 14 | Invesco Allocation Funds |
Total Net Assets | $ | 802.3 million |
| Fund Nasdaq Symbols | ||||
Class A Shares | AMKAX | |||
Class B Shares | AMKBX | |||
Class C Shares | AMKCX | |||
Class R Shares | AMKRX | |||
Class S Shares | AMKSX | |||
Class Y Shares | ABKYX | |||
Class R5 Shares | AMLIX |
that Europe would be able to finally make headway on its lingering economic issues. Bond yields spiked twice during the third quarter, but managed to settle down as markets see-sawed between concerns over inflation and the continuing weakness in Europe.
The year ended with a lift in equities offset by declines in bonds and commodities. Investors had a host of political issues to navigate, including elections in the US, China and Japan; “fiscal cliff” negotiations in the US; and continuing concerns over European and Chinese economic growth. Equities were the lone bright spot while commodity markets were weighed down by concerns over falling demand and an improvement in crop yields. Government bond yields ultimately made their way higher as the market experienced both rallies and sell-offs.
Invesco Balanced-Risk Allocation Fund, Invesco Diversified Dividend Fund and Invesco Developing Markets Fund were the top contributors to absolute Fund performance for the reporting period. There were no absolute detractors from overall Fund performance. Relative to the Fund’s custom style-specific index, Invesco International Core Equity Fund, Invesco American Franchise Fund and Invesco International Growth Fund were the largest detractors from performance.
Please note that some of the underlying funds – which include, but are not limited to, Invesco Balanced-Risk Allocation Fund, Invesco Balanced-Risk Commodity Strategy Fund and Invesco Core Plus Bond Fund – may be primarily implemented with derivatives, which may create economic leverage in the underlying funds. Please note that our strategy is principally implemented with derivative instruments that include futures and
total return swaps. Therefore, all or most of the performance of the strategy, both positive and negative, can be attributed to these instruments. Derivatives can be a more liquid and cost-effective way to gain exposure to asset classes. Additionally, the leverage used in the strategy is inherent in these instruments.
Finally, we thank you for your continued commitment to Invesco Moderate Allocation Fund.
The views and opinions expressed in management’s discussion of Fund performance are those of Invesco Advisers, Inc. These views and opinions are subject to change at any time based on factors such as market and economic conditions. These views and opinions may not be relied upon as investment advice or recommendations, or as an offer for a particular security. The information is not a complete analysis of every aspect of any market, country, industry, security or the Fund. Statements of fact are from sources considered reliable, but Invesco Advisers, Inc. makes no representation or warranty as to their completeness or accuracy. Although historical performance is no guarantee of future results, these insights may help you understand our investment management philosophy.
See important Fund and, if applicable, index disclosures later in this report.
| Mark Ahnrud Chartered Financial Analyst, portfolio manager, is manager of Invesco Moderate Allocation Fund. He joined Invesco in 2000. | |
| Mr. Ahnrud earned a BS in finance and investments from Babson College and an MBA from Duke University Fuqua School of Business. | ||
| Chris Devine Chartered Financial Analyst, portfolio manager, is manager of Invesco Moderate Allocation Fund. He joined Invesco in 1998. | |
| Mr. Devine earned a BA in economics from Wake Forest University and an MBA from the University of Georgia. | ||
| Scott Hixon Chartered Financial Analyst, portfolio manager, is manager of Invesco Moderate Allocation Fund. He joined Invesco in 1994. | |
| Mr. Hixon earned a BBA in finance from Georgia Southern University and an MBA in finance from Georgia State University. | ||
| Christian Ulrich Chartered Financial Analyst, portfolio manager, is manager of Invesco Moderate Allocation Fund. He joined Invesco in 2000. | |
| Mr. Ulrich earned the equivalent of a BBA from the KV Zurich Business School in Zurich, Switzerland. | ||
| Scott Wolle Chartered Financial Analyst, portfolio manager, is manager of Invesco Moderate Allocation Fund. He joined Invesco in 1999. | |
| Mr. Wolle earned a BS in finance from Virginia Polytechnic Institute and State University and an MBA from Duke University Fuqua School of Business. | ||
| Assisted by the Global Asset Allocation Team | ||
| 15 | Invesco Allocation Funds |
Invesco Conservative Allocation Fund’s investment objective is total return consistent with a lower level of risk relative to the broad stock market.
Invesco Growth Allocation Fund’s investment objective is long-term growth of capital consistent with a higher level of risk relative to the broad stock market.
Invesco Moderate Allocation Fund’s investment objective is total return consistent with a moderate level of risk relative to the broad stock market.
| ¾ | Unless otherwise stated, information presented in this report is as of December 31, 2012, and is based on total net assets. |
| ¾ | Unless otherwise noted, all data provided by Invesco. |
| ¾ | To access your Fund’s reports/prospectus, visit invesco.com/fundreports. |
About share classes
| ¾ | Class B shares may not be purchased for new or additional investments. Please see the prospectus for more information. |
| ¾ | Class R shares are generally available only to employer sponsored retirement and benefit plans. Please see the prospectus for more information. |
| ¾ | Class S shares and Class Y shares are available only to certain investors. Please see the prospectus for more information. |
| ¾ | Class R5 shares are primarily intended for employer sponsored retirement and benefit plans that meet certain standards and for institutional investors. On September 24, 2012, Institutional Class shares were renamed Class R5 shares. Please see the prospectus for more information. |
Principal risks of investing in the Funds
| ||||||
Invesco Conservative Allocation Fund | Invesco Growth Allocation Fund | Invesco Moderate Allocation Fund | ||||
Call risk | X | X | ||||
Commodity-linked notes risk | X | X | X | |||
Commodity risk | X | X | X | |||
Concentration risk | X | X | X | |||
Convertible securities risk | X | |||||
Counterparty risk | X | X | X | |||
Credit risk | X | X | X | |||
Currency/exchange rate risk | X | X | X | |||
Debt securities risk | X | |||||
Derivatives risk | X | X | X | |||
Developing/emerging markets securities risk | X | X | X | |||
Dollar roll transactions risk | X | X | ||||
Exchange-traded funds risk | X | X | X | |||
Exchange-traded notes risk | X | X | X | |||
Financial institutions risk | X | |||||
Foreign securities risk | X | X | X | |||
Fund of funds risk | X | X | X | |||
Geographic focus risk | X | |||||
Growth investing risk | X | |||||
High yield bond (junk bond) risk | X | X | X | |||
Indexing risk | X | |||||
Investing in the European Union risk | X | |||||
Interest rate risk | X | X | X | |||
Issuer-specific changes risk | X | |||||
Large investor risk | X | |||||
Leverage risk | X | X | X | |||
Liquidity risk | X | X | X | |||
Management risk | X | X | X | |||
Market risk | X | X | X | |||
Market Trading risk | X | |||||
Mortgage- and asset-backed securities risk | X | X | X | |||
| 16 | Invesco Allocation Funds |
Invesco Conservative Allocation Fund | Invesco Growth Allocation Fund | Invesco Moderate Allocation Fund | ||||
Non-correlation risk | X | X | ||||
Non-diversification risk | X | X | X | |||
Preferred securities risk | X | |||||
Reinvestment risk | X | X | X | |||
REIT risk/real estate risk | X | |||||
Small- and mid-capitalization risk | X | |||||
Subsidiary risk | X | X | X | |||
Synthetic securities risk | X | X | ||||
Tax risk | X | X | X | |||
US government obligations risk | X | X | X | |||
Value investing style risk | X |
Principal risks defined ¾Call risk. If interest rates fall, it is possible that issuers of debt securities with high interest rates will prepay or call their securities before their maturity dates. In this event, the proceeds from the called securities would likely be reinvested by an underlying fund in securities bearing the new, lower interest rates, resulting in a possible decline in an underlying funds income and distributions to shareholders. ¾Commodity-linked notes risk. An underlying fund’s investments in commodity-linked notes may involve substantial risks, including risk of loss of a significant portion of their principal value. In addition to risks associated with the underlying commodities, they may be subject to additional special risks, such as the lack of a secondary trading market and temporary price distortions due to speculators and/or the continuous rolling over of futures contracts underlying the notes. Commodity-linked notes are also subject to counterparty risk, which is the risk that the other party to the contract will not fulfill its contractual obligation to complete the transaction with an underlying Fund. ¾Commodity risk. Certain of the underlying fund’s and Invesco Cayman Commodity Fund I Ltd. or Invesco Cayman Commodity Fund III Ltd., each a wholly-owned subsidiary of certain underlying funds organized under the laws of Cayman Islands (each a Subsidiary) investment exposure to the commodities markets and/or a particular sector of the commodities markets, may subject the underlying fund and | the Subsidiary to greater volatility than investments in traditional securities, such as stocks and bonds. The commodities markets may fluctuate widely based on a variety of factors, including changes in overall market movements, domestic and foreign political and economic events and policies, war, acts of terrorism, changes in domestic or foreign interest rates and/or investor expectations concerning interest rates, domestic and foreign inflation rates and investment and trading activities of mutual funds, hedge funds and commodities funds. Prices of various commodities may also be affected by factors such as drought, floods, weather, livestock disease, embargoes, tariffs and other regulatory developments. The prices of commodities can also fluctuate widely due to supply and demand disruptions in major producing or consuming regions. Because certain of the underlying fund’s and the Subsidiary’s performance are linked to the performance of potentially volatile commodities, investors should be willing to assume the risks of potentially significant fluctuations in the value of the underlying fund’s shares. ¾Concentration risk. To the extent, an underlying fund invests a greater amount in any one sector or industry, an underlying fund’s performance will depend to a greater extent on the overall condition of the sector or industry, and there is increased risk to an underlying fund if conditions adversely affect that sector or industry. ¾Convertible securities risk. An underlying fund may own convertible securities, the value of which may be affected | by market interest rates, the risk that the issuer will default, the value of the underlying stock or the right of the issuer to buy back the convertible securities. ¾Counterparty risk. Counterparty risk is the risk that the other party to the contract will not fulfill its contractual obligations, which may cause losses or additional costs to an underlying fund. ¾Credit risk. The issuer of instruments in which the underlying fund invests may be unable to meet interest and/or principal payments, thereby causing its instruments to decrease in value and lowering the issuer’s credit rating. ¾Currency/exchange rate risk. The dollar value of an underlying fund’s foreign investments will be affected by changes in the exchange rates between the dollar and the currencies in which those investments are traded. ¾Debt securities risk. An underlying fund may invest in debt securities that are affected by changing interest rates and changes in their effective maturities and credit quality. ¾Derivatives risk. The performance of derivative instruments is tied to the performance of an underlying currency, security, index or other instrument. In addition to risks relating to their underlying instruments, the use of derivatives may include other, possibly greater, risks. Derivatives involve costs, may be volatile, and may involve a small initial investment relative to the risk assumed. Risks associated with the use of derivatives include counterparty,leverage, correlation, liquidity, tax, market, interest rate and management risks. Derivatives may also be more difficult to purchase, sell or value than other investments. The Fund may lose more than the cash amount invested on investments in derivatives. Investors should bear in mind that, while the Fund intends to use derivative | ||
This report must be accompanied or preceded by a currently effective Fund prospectus, which contains more complete information, including sales charges and expenses. Investors should read it carefully before investing. | ||||
| NOT FDIC INSURED | MAY LOSE VALUE | NO BANK GUARANTEE |
| continued on page 18 |
| 17 | Invesco Allocation Funds |
continued from page 17
| strategies, it is not obligated to actively engage in these transactions, generally or in any particular kind of derivative, if the investment manager elects not to do so due to availability, cost, market conditions or other factors. |
| ¾ | Developing/emerging markets securities risk. Securities issued by foreign companies and governments located in developing/emerging countries may be affected more negatively by inflation, devaluation of their currencies, higher transaction costs, delays in settlement, adverse political developments, the introduction of capital controls, withholding taxes, nationalization of private assets, expropriation, social unrest, war or lack of timely information than those in developed countries |
| ¾ | Dollar roll transactions risk. Dollar roll transactions involve the risk that the market value and yield of the securities retained by an underlying fund may decline below the price of the mortgage-related securities sold by the underlying fund that it is obligated to repurchase. |
| ¾ | Exchange-traded funds (ETFs) risk. An investment by the Fund or underlying fund in ETFs generally presents the same primary risks as an investment in a mutual fund. In addition, an ETF may be subject to the following: (1) a discount of the exchange-traded fund’s shares to its net asset value; (2) failure to develop an active trading market for the exchange-traded fund’s shares; (3) the listing exchange halting trading of the exchange-traded fund’s shares; (4) failure of the exchange-traded fund’s shares to track the referenced index; and (5) holding troubled securities in the referenced index. ETFs may involve duplication of management fees and certain other expenses, as the Fund or underlying fund indirectly bears its proportionate share of any expenses paid by the ETFs in which it invests. Further, certain of the ETFs in which the Fund or underlying fund may invest are leveraged. The more the Fund or underlying fund invests in such leveraged ETFs, the more this leverage will magnify any losses on those investments. |
| ¾ | Exchange-traded notes (ETNs) risk. ETNs are subject to credit risk, including the credit risk of the issuer, and the value of the ETN may drop due to a downgrade in the issuer’s credit rating, despite the underlying market benchmark or strategy remaining unchanged. The value of an ETN may also be influenced by time to maturity, level of supply and demand for the ETN, volatility and lack of liquidity in the |
| underlying market, changes in the applicable interest rates, changes in the issuer’s credit rating, and economic, legal, political, or geographic events that affect the referenced underlying market or strategy. ETNs are also subject to counterparty risk. |
| ¾ | Financial institutions risk. Investments in financial institutions may be subject to certain risks, including, but not limited to, the risk of regulatory actions, changes in interest rates and concentration of loan portfolios in an industry or sector. Financial institutions are highly regulated and may suffer setbacks should regulatory rules and interpretations under which they operate change. Likewise, there is a high level of competition among financial institutions which could adversely affect the viability of an institution. |
| ¾ | Foreign securities risk. An underlying fund’s foreign investments may be affected by changes in a foreign country’s exchange rates, political and social instability; changes in economic or taxation policies, difficulties when enforcing obligations, decreased liquidity, and increased volatility. Foreign companies may be subject to less regulation resulting in less publicly available information about the companies. |
| ¾ | Fund of funds risk. The Fund’s performance depends on the underlying funds in which it invests, and it is subject to the risks of the underlying funds. Market fluctuations may change the target weightings in the underlying funds. The underlying funds may change their investment objectives, policies or practices and may not achieve their investment objectives, all of which may cause the Fund to withdraw its investments therein at a disadvantageous time. |
| ¾ | Geographic focus risk. From time to time an underlying fund may invest a substantial amount of its assets in securities of issuers located in a single country or a limited number of countries. If an underlying fund focuses its investments in this manner, it assumes the risk that economic, political and social conditions in those countries will have a significant impact on its investment performance. An underlying fund’s investment performance may also be more volatile if it focuses its investments in certain countries, especially emerging market countries. |
| ¾ | Growth investing risk. Growth stocks tend to be more expensive relative to their earnings or assets compared with other types of stock. As a result they tend to be more sensitive to changes in their earnings and can be more volatile. |
| ¾ | High yield bond (junk bond) risk. Junk bonds involve a greater risk of default or price changes due to changes in the credit quality of the issuer. The values of junk bonds fluctuate more than those of high-quality bonds in response to company, political, regulatory or economic developments. Values of junk bonds can decline significantly over short periods of time. |
| ¾ | Indexing risk. Unlike many investment companies, an underlying fund does not utilize an investing strategy that seeks returns in excess of the underlying index. Therefore, it would not necessarily sell a security unless that security is removed from the underlying index. |
| ¾ | Interest rate risk. Interest rate risk refers to the risk that bond prices generally fall as interest rates rise; conversely, bond prices generally rise as interest rates fall. Specific bonds differ in their sensitivity to changes in interest rates depending on their individual characteristics, including duration. |
| ¾ | Investing in the European Union risk. Many countries in the European Union are susceptible to high economic risks associated with high levels of debt, notably due to investments in sovereign debts of European countries such as Greece, Italy and Spain. One or more member states might exit the European Union, placing its currency and banking system in jeopardy. The European Union faces major issues involving its membership, structure, procedures and policies, including the adoption, abandonment or adjustment of the new constitutional treaty, the European Union’s enlargement to the south and east, and resolution of the European Union’s problematic fiscal and democratic accountability. Efforts of the member states to further unify their economic and monetary policies may increase the potential for the downward movement of one member state’s market to cause a similar effect on other member states’ markets. European countries that are part of the European Economic and Monetary Union may be significantly affected by the tight fiscal and monetary controls that the union seeks to impose on its members. |
| ¾ | Issuer-specific changes risk. The value of an individual security or particular type of security can be more volatile than the market as a whole and can perform differently from the value of the market as a whole. |
| ¾ | Large investor risk. An underlying fund may accept investments from funds of funds, as well as from similar investment |
| 18 | Invesco Allocation Funds |
| vehicles, such as 529 Plans. From time to time, an underlying fund may experience large investments or redemptions due to allocations or rebalancings by these funds of funds and/or similar investment vehicles. While it is impossible to predict the overall impact of these transactions over time, there could be adverse effects on portfolio management. For example, an underlying fund may be required to sell securities or invest cash at times when it would not otherwise do so. These transactions could also have tax consequences if sales of securities result in gains, and could also increase transaction costs or portfolio turnover. |
| ¾ | Leverage risk. Leverage exists when an underlying fund purchases or sells an instrument or enters into a transaction without investing cash in an amount equal to the full economic exposure of the instrument or transaction and the underlying fund could lose more than it invested. Leverage created from borrowing or certain types of transactions or instruments may impair an underlying fund’s liquidity, cause it to liquidate positions at an unfavorable time, increase volatility or otherwise not achieve its intended objective. |
| ¾ | Liquidity risk. An underlying fund may hold illiquid securities that it is unable to sell at the preferred time or price and could lose its entire investment in such securities. |
| ¾ | Management risk. The investment techniques and risk analysis used by the Fund’s and the underlying funds’ portfolio managers may not produce the desired results. |
| ¾ | Market risk. The prices of and the income generated by an underlying fund’s securities may decline in response to, among other things, investor sentiment, general economic and market conditions, regional or global instability, and currency and interest rate fluctuations. |
| ¾ | Market trading risk. Risk is inherent in all investing. An investment in an underlying fund involves risks similar to those of investing in any underlying fund of equity or fixed-income securities traded on exchanges. You should anticipate that the value of the shares will decline, more or less, in correlation with any decline in value of the underlying index of certain underlying exchange-traded funds. |
| ¾ | Mortgage-and asset-backed securities risk. Certain of the underlying funds may invest in mortgage and asset-backed securities that are subject to |
| prepayment or call risk, which is the risk that the borrower’s payments may be received earlier or later than expected due to changes in prepayment rates on underlying loans. Faster prepayments often happen when interest rates are falling. As a result, an underlying fund may reinvest these early payments at lower interest rates, thereby reducing the underlying fund’s income. Conversely, when interest rates rise, prepayments may happen more slowly, causing the security to lengthen in duration. Longer duration securities tend to be more volatile. Securities may be prepaid at a price less than the original purchase value. An unexpectedly high rate of defaults on the mortgages held by a mortgage pool may adversely affect the value of mortgage-backed securities and could result in losses to an underlying fund. The risk of such defaults is generally higher in the case of mortgage pools that include subprime mortgages. Subprime mortgages refer to loans made to borrowers with weakened credit histories or with lower capacity to make timely payments on their mortgages. |
| ¾ | Non-correlation risk. An underlying fund’s return may not match the return of the underlying index of certain underlying exchange-traded funds for a number of reasons. For example, the Fund incurs operating expenses not applicable to the underlying index, and incurs costs in buying and selling securities, especially when rebalancing an underlying fund’s securities holdings to reflect changes in the composition of an underlying index of certain underlying exchange-traded funds. In addition, the performance of an underlying fund and an underlying index of certain underlying exchange-traded funds may vary due to asset valuation differences and differences between an underlying fund’s portfolio and the underlying index of certain underlying exchange-traded funds resulting from legal restrictions, cost or liquidity constraints. |
| ¾ | Non-diversification risk. Certain of the underlying funds are non-diversified and can invest a greater portion of their assets in a single issuer. A change in the value of the issuer could affect the value of an underlying fund more than if it was a diversified fund. |
| ¾ | Preferred securities risk. There are special risks associated with investing in preferred securities. Preferred securities may include provisions that permit the issuer, in its discretion, to defer or omit distributions for a certain period of |
| time. If an underlying fund owns a security that is deferring or omitting its distributions, an underlying fund may be required to report the distribution on its tax returns, even though it may not have received this income. Further, preferred securities may lose substantial value due to the omission or deferment of dividend payments. |
| ¾ | Reinvestment risk. Reinvestment risk is the risk that a bond’s cash flows (coupon income and principal repayment) will be reinvested at an interest rate below that on the original bond. |
| ¾ | REIT risk/real estate risk. Investments in real-estate related instruments may be affected by economic, legal, cultural, environmental or technological factors that affect property values, rents or occupancies of real estate related to and underlying fund’s holdings. Real estate companies, including REITs or similar structures, tend to be small and mid cap companies, and their shares may be more volatile and less liquid. The value of investments in real estate related companies may be affected by the quality of management, the ability to repay loans, the utilization of leverage and financial covenants related thereto, whether the company carries adequate insurance and environmental factors. If a real estate related company defaults, an underlying fund may own real estate directly, which involves the following additional risks: environmental liabilities, difficulty in valuing and selling the real estate, and economic or regulatory changes. |
| ¾ | Small-and mid-capitalization risk. Stocks of small and mid-sized companies tend to be more vulnerable to adverse developments in the above factors and may have little or no operating history or track record of success, and limited product lines, markets, management and financial resources. The securities of small and mid-sized companies may be more volatile due to less market interest and less publicly available information about the issuer. They also may be illiquid or restricted as to resale, or may trade less frequently and in smaller volumes, all of which may cause difficulty when establishing or closing a position at a desirable price. |
| ¾ | Subsidiary risk. By investing in the Subsidiary, an underlying fund is indirectly exposed to risks associated with the Subsidiary’s investments. The Subsidiary is not registered under the Investment Company Act of 1940 (1940 Act), and except as otherwise noted in this prospectus, is not subject |
continued on page 20
| 19 | Invesco Allocation Funds |
continued from page 19
| to the investor protections of the 1940 Act. Changes in the laws of the United States and/or the Cayman Islands, under which the underlying fund and the Subsidiary, respectively, are organized, could result in the inability of the underlying fund and/or the Subsidiary to operate as described in the underlying fund prospectus and SAI and could negatively affect the underlying fund and its shareholders. |
| ¾ | Synthetic securities risk. Fluctuations in the values of synthetic securities may not correlate perfectly with the instruments they are designed to replicate. Synthetic securities may be subject to interest rate changes, market price fluctuations, counterparty risk and liquidity risk. |
| ¾ | Tax risk. The tax treatment of commodity-linked derivative instruments may be adversely affected by changes in legislation, regulations or other legally binding authority. If, as a result of any such adverse action, the income of Invesco Balanced-Risk Allocation Fund, an underlying fund, from certain commodity-linked derivatives was treated as non-qualifying income, Invesco Balanced-Risk Allocation Fund might fail to qualify as a regulated investment company and be subject to federal income tax at the fund level. Invesco Balanced-Risk Allocation Fund has received private letter rulings from the Internal Revenue Service confirming that income derived from its investments in the Subsidiary and a form of commodity-linked note constitutes qualifying income to Invesco Balanced-Risk Allocation Fund. However, the Internal Revenue Service has suspended issuance of any further private letter rulings pending a review of its position. Should the Internal Revenue Service issue guidance, or Congress enact legislation, that adversely affects the tax treatment of Invesco Balanced-Risk Allocation Fund’s use of commodity-linked notes, or the Subsidiary, it could limit its ability to pursue its investment strategy. In this event, Invesco Balanced-Risk Allocation Fund’s Board of Trustees may authorize a significant change in investment strategy or Fund liquidation. Invesco Balanced-Risk Allocation Fund also may incur transaction and other costs to comply with any new or additional guidance from the Internal Revenue Service. |
| ¾ | US government obligations risk. The Fund may invest in obligations issued by US government agencies and instrumentalities that may receive varying |
| levels of support from the government, which could affect an underlying fund’s ability to recover should they default. |
| ¾ | Value investing risk. Certain underlying funds emphasize a value style of investing, which focuses on undervalued companies with characteristics for improved valuations. This style of investing is subject to the risk that the valuations never improve or that the returns on value equity securities are less than returns on other styles of investing or the overall stock market. Value stocks also may decline in price, even though in theory they are already underpriced. |
About indexes used in this report
| ¾ | The S&P 500® Index is an unmanaged index considered representative of the US stock market. |
| ¾ | The Custom Conservative Allocation Index, created by Invesco to serve as a benchmark for Invesco Conservative Allocation Fund, is composed of the S&P 500, the MSCI EAFE® and the Barclays U.S. Aggregate indexes. The composition of the index may change from time to time based on the target asset allocation of the Fund. Therefore, the current composition of the index does not reflect its historical composition and will likely be altered in the future to better reflect the objective of the Fund. |
| ¾ | The Lipper Mixed-Asset Target Allocation Conservative Funds Index is an unmanaged index considered representative of mixed-asset target allocation conservative funds tracked by Lipper. |
| ¾ | The MSCI EAFE® Index is an unmanaged index considered representative of stocks of Europe, Australasia and the Far East. |
| ¾ | The Barclays U.S. Aggregate Index is an unmanaged index considered representative of the US investment-grade, fixed-rate bond market. |
| ¾ | The Custom Growth Allocation Index, created by Invesco to serve as a benchmark for Invesco Growth Allocation Fund, comprises the S&P 500, MSCI EAFE and Barclays U.S. Aggregate indexes. The composition of the index may change from time to time based on the Fund’s target asset allocation. Therefore, the current composition of the index does not reflect its historical composition and will likely be altered in the future to better reflect the objective of the Fund. |
| ¾ | The Lipper Multi-Cap Core Funds Index is an unmanaged index considered representative of multicap core |
| funds tracked by Lipper. |
| ¾ | The Custom Moderate Allocation Index, created by Invesco to serve as a benchmark for Invesco Moderate Allocation Fund, comprises the S&P 500, MSCI EAFE and Barclays U.S. Aggregate indexes. The composition of the index may change from time to time based on the Fund’s target asset allocation. Therefore, the current composition of the index does not reflect its historical composition and will likely be altered in the future to better reflect the objective of the Fund. |
| ¾ | The Lipper Mixed-Asset Target Allocation Moderate Funds Index is an unmanaged index considered representative of mixed-asset target allocation moderate funds tracked by Lipper. |
| ¾ | The Fund is not managed to track the performance of any particular index, including the index(es) defined here, and consequently, the performance of the Fund may deviate significantly from the performance of the index(es). |
| ¾ | A direct investment cannot be made in an index. Unless otherwise indicated, index results include reinvested dividends, and they do not reflect sales charges. Performance of the peer group, if applicable, reflects fund expenses; performance of a market index does not. |
Other information
| ¾ | The returns shown in management’s discussion of Fund performance are based on net asset values calculated for shareholder transactions. Generally accepted accounting principles require adjustments to be made to the net assets of the Fund at period end for financial reporting purposes, and as such, the net asset values for shareholder transactions and the returns based on those net asset values may differ from the net asset values and returns reported in the Financial Highlights. |
| ¾ | Invesco Distributors, Inc. is the distributor of the PowerShares Exchange-Traded Fund Trust II. Invesco PowerShares Capital Management LLC and Invesco Distributors, Inc. are indirect, wholly owned subsidiaries of Invesco Ltd. Shares of PowerShares 1-30 Laddered Treasury Portfolio are not individually redeemable, and owners of the Shares may acquire those Shares from the Fund and tender those Shares for redemption to the Fund in Creation Units only, typically consisting of aggregations of 50,000 shares. |
| 20 | Invesco Allocation Funds |
Schedule of Investments
December 31, 2012
Invesco Conservative Allocation Fund
Schedule of Investments in Affiliated Issuers–100.09%(a)
| % of Net Assets 12/31/12 | Value 12/31/11 | Purchases at Cost | Proceeds from Sales | Change in Unrealized Appreciation (Depreciation) | Realized Gain (Loss) | Dividend Income | Shares 12/31/12 | Value 12/31/12 | ||||||||||||||||||||||||||||
Asset Allocation Funds–13.09% |
| |||||||||||||||||||||||||||||||||||
Invesco Balanced-Risk Allocation Fund | 9.40 | % | $ | 27,965,029 | $ | 2,886,615 | $ | (682,846 | ) | $ | 1,458,931 | $ | 907,114 | $ | 754,130 | 2,529,316 | $ | 31,692,331 | ||||||||||||||||||
Invesco Balanced-Risk Commodity Strategy Fund | 3.69 | % | 11,782,064 | 1,961,322 | (1,570,198 | ) | 189,212 | 96,090 | 262,561 | 1,208,389 | 12,458,490 | |||||||||||||||||||||||||
Total Asset Allocation Funds | 39,747,093 | 4,847,937 | (2,253,044 | ) | 1,648,143 | 1,003,204 | 1,016,691 | 44,150,821 | ||||||||||||||||||||||||||||
Domestic Equity Funds–19.26% |
| |||||||||||||||||||||||||||||||||||
Invesco American Franchise Fund | 3.76 | % | 11,477,896 | 1,596,055 | (2,007,414 | ) | 1,445,978 | 180,140 | 49,889 | 1,001,788 | 12,692,655 | |||||||||||||||||||||||||
Invesco Charter Fund | 2.73 | % | 8,160,396 | 729,587 | (680,573 | ) | 930,615 | 67,464 | 136,111 | 498,780 | 9,207,489 | |||||||||||||||||||||||||
Invesco Comstock Fund | 2.54 | % | 7,633,540 | 742,835 | (1,111,732 | ) | 1,174,514 | 136,966 | 159,413 | 481,805 | 8,576,123 | |||||||||||||||||||||||||
Invesco Diversified Dividend Fund | 4.18 | % | 12,590,644 | 1,020,751 | (1,216,052 | ) | 1,562,406 | 336,210 | 296,279 | 1,045,436 | 14,082,019 | |||||||||||||||||||||||||
Invesco Endeavor Fund | 2.15 | % | 6,326,491 | 1,360,444 | (976,743 | ) | 376,612 | 814,038 | 29,570 | 409,541 | 7,260,880 | |||||||||||||||||||||||||
Invesco Growth and Income Fund | 2.11 | % | 6,504,384 | 443,290 | (687,263 | ) | 753,440 | 84,635 | 139,306 | 338,507 | 7,098,486 | |||||||||||||||||||||||||
Invesco Small Cap Equity Fund | 1.79 | % | 5,342,125 | 775,614 | (621,103 | ) | 440,824 | 345,971 | — | 434,007 | 6,041,379 | |||||||||||||||||||||||||
Total Domestic Equity Funds | 58,035,476 | 6,668,576 | (7,300,880 | ) | 6,684,389 | 1,965,424 | 810,568 | 64,959,031 | ||||||||||||||||||||||||||||
Fixed-Income Funds–54.07% |
| |||||||||||||||||||||||||||||||||||
Invesco Core Plus Bond Fund | 24.35 | % | 75,409,626 | 8,878,419 | (5,254,812 | ) | 3,168,143 | (91,432 | ) | 3,163,460 | 7,471,332 | 82,109,944 | ||||||||||||||||||||||||
Invesco Emerging Market Local Currency Debt Fund | 3.34 | % | 8,963,952 | 2,269,796 | (1,181,232 | ) | 1,312,529 | (53,874 | ) | 368,184 | 1,112,674 | 11,260,263 | ||||||||||||||||||||||||
Invesco Floating Rate Fund | 5.45 | % | 16,740,960 | 1,780,774 | (934,505 | ) | 838,908 | (31,785 | ) | 933,843 | 2,337,275 | 18,394,352 | ||||||||||||||||||||||||
Invesco High Yield Fund | 4.99 | % | 15,168,622 | 1,216,859 | (1,165,838 | ) | 1,638,183 | (32,201 | ) | 992,296 | 3,798,110 | 16,825,625 | ||||||||||||||||||||||||
Invesco Premium Income Fund | 3.95 | % | 12,346,639 | 1,682,493 | (1,462,334 | ) | 723,456 | 215,507 | 690,134 | 1,245,569 | 13,315,136 | |||||||||||||||||||||||||
PowerShares 1-30 Laddered Treasury Portfolio–ETF | 11.99 | % | 38,158,744 | 7,123,870 | (5,107,191 | ) | (139,359 | ) | 528,916 | 816,967 | 1,240,400 | 40,437,040 | ||||||||||||||||||||||||
Total Fixed-Income Funds | 166,788,543 | 22,952,211 | (15,105,912 | ) | 7,541,860 | 535,131 | 6,964,884 | 182,342,360 | ||||||||||||||||||||||||||||
Foreign Equity Funds–11.33% |
| |||||||||||||||||||||||||||||||||||
Invesco Developing Markets Fund | 3.31 | % | 9,261,273 | 1,454,290 | (1,420,281 | ) | 1,822,666 | 38,971 | 127,825 | 329,794 | 11,156,919 | |||||||||||||||||||||||||
Invesco International Core Equity Fund | 4.26 | % | 11,474,001 | 3,016,868 | (1,742,534 | ) | 1,924,544 | (304,837 | ) | 346,432 | 1,388,217 | 14,368,042 | ||||||||||||||||||||||||
Invesco International Growth Fund | 3.76 | % | 10,830,312 | 1,543,500 | (1,309,725 | ) | 1,630,734 | 6,460 | 166,010 | 434,975 | 12,701,281 | |||||||||||||||||||||||||
Total Foreign Equity Funds | 31,565,586 | 6,014,658 | (4,472,540 | ) | 5,377,944 | (259,406 | ) | 640,267 | 38,226,242 | |||||||||||||||||||||||||||
Real Estate Funds–2.02% |
| |||||||||||||||||||||||||||||||||||
Invesco Global Real Estate Fund | 2.02 | % | 5,799,801 | 640,166 | (940,385 | ) | 1,236,806 | 65,565 | 289,716 | 582,858 | 6,801,953 | |||||||||||||||||||||||||
Money Market Funds–0.32% |
| |||||||||||||||||||||||||||||||||||
Liquid Assets Portfolio–Institutional Class | 0.16 | % | 1,443,743 | 16,285,665 | (17,199,143 | ) | — | — | 1,149 | 530,265 | 530,265 | |||||||||||||||||||||||||
Premier Portfolio–Institutional Class | 0.16 | % | 1,443,744 | 16,285,665 | (17,199,143 | ) | — | — | 876 | 530,266 | 530,266 | |||||||||||||||||||||||||
Total Money Market Funds | 2,887,487 | 32,571,330 | (34,398,286 | ) | — | — | 2,025 | 1,060,531 | ||||||||||||||||||||||||||||
TOTAL INVESTMENTS IN AFFILIATED ISSUERS | 100.09 | % | $ | 304,823,986 | $ | 73,694,878 | $ | (64,471,047 | ) | $ | 22,489,142 | (b) | $ | 3,309,918 | (c) | $ | 9,724,151 | $ | 337,540,938 | |||||||||||||||||
OTHER ASSETS LESS LIABILITIES | (0.09 | )% | (300,244 | ) | ||||||||||||||||||||||||||||||||
NET ASSETS | 100.00 | % | $ | 337,240,694 | ||||||||||||||||||||||||||||||||
Investment Abbreviations:
ETF – Exchange-Traded Fund
Notes to Schedule of Investments:
| (a) | Each underlying fund and the Fund are affiliated by either having the same investment adviser or an investment adviser under common control with the Fund’s investment adviser. Effective September 24, 2012, the Fund began investing in Class R6 shares. The Fund invests in Class R6 shares of the mutual funds listed and the Fund shares of the exchange-traded fund. |
| (b) | Includes $29,481 and $126,064 of return of capital from Invesco Emerging Market Local Currency Debt Fund and PowerShares 1-30 Laddered Treasury Portfolio—ETF. |
| (c) | Includes $842,512, $211,940, $639,962, $242,052, $21,427, $190,625 and $1,876 of capital gains from Invesco Balanced-Risk Allocation Fund, Invesco Diversified Dividend Fund, Invesco Endeavor Fund, Invesco Small Cap Equity Fund, Invesco Emerging Market Local Currency Debt Fund, Invesco Premium Income Fund and PowerShares 1-30 Laddered Treasury Portfolio—ETF, respectively. |
See accompanying Notes to Financial Statements which are an integral part of the financial statements.
21 Invesco Allocation Funds
Schedule of Investments—(continued)
December 31, 2012
Invesco Growth Allocation Fund
Schedule of Investments in Affiliated Issuers–100.09%(a)
| % of Net Assets 12/31/12 | Value 12/31/11 | Purchases at Cost | Proceeds from Sales | Change in Unrealized Appreciation (Depreciation) | Realized Gain (Loss) | Dividend Income | Shares 12/31/12 | Value 12/31/12 | ||||||||||||||||||||||||||||
Asset Allocation Funds–21.15% |
| |||||||||||||||||||||||||||||||||||
Invesco Balanced-Risk Allocation Fund | 15.67 | % | $ | 133,958,847 | $ | 17,809,893 | $ | (20,500,421 | ) | $ | 5,951,785 | $ | 4,837,097 | $ | 3,309,081 | 11,042,323 | $ | 138,360,305 | ||||||||||||||||||
Invesco Balanced-Risk Commodity Strategy Fund | 5.48 | % | 50,290,060 | 4,914,456 | (7,960,222 | ) | 641,776 | 507,889 | 1,025,154 | 4,693,886 | 48,393,959 | |||||||||||||||||||||||||
Total Asset Allocation Funds | 184,248,907 | 22,724,349 | (28,460,643 | ) | 6,593,561 | 5,344,986 | 4,334,235 | 186,754,264 | ||||||||||||||||||||||||||||
Domestic Equity Funds–42.34% |
| |||||||||||||||||||||||||||||||||||
Invesco American Franchise Fund | 8.27 | % | 72,433,403 | 5,777,968 | (14,933,235 | ) | 8,775,751 | 1,001,234 | 288,605 | 5,765,992 | 73,055,121 | |||||||||||||||||||||||||
Invesco Charter Fund | 5.98 | % | 51,321,889 | 1,826,036 | (6,293,648 | ) | 5,182,541 | 769,757 | 784,567 | 2,860,595 | 52,806,575 | |||||||||||||||||||||||||
Invesco Comstock Fund | 5.59 | % | 48,104,724 | 1,983,141 | (8,478,326 | ) | 6,643,761 | 1,122,852 | 948,786 | 2,773,941 | 49,376,152 | |||||||||||||||||||||||||
Invesco Diversified Dividend Fund | 9.19 | % | 79,218,917 | 5,485,848 | (13,569,137 | ) | 8,776,558 | 2,522,875 | 1,761,743 | 6,028,708 | 81,206,700 | |||||||||||||||||||||||||
Invesco Endeavor Fund | 4.75 | % | 40,037,226 | 7,053,412 | (8,469,338 | ) | 2,035,417 | 4,989,445 | 170,765 | 2,365,104 | 41,931,648 | |||||||||||||||||||||||||
Invesco Growth and Income Fund | 4.63 | % | 40,946,214 | 1,643,150 | (6,696,302 | ) | 4,304,204 | 664,042 | 826,854 | 1,948,560 | 40,861,308 | |||||||||||||||||||||||||
Invesco Small Cap Equity Fund | 3.93 | % | 33,816,007 | 2,577,329 | (4,902,274 | ) | 2,405,654 | 2,203,271 | — | 2,493,003 | 34,702,602 | |||||||||||||||||||||||||
Total Domestic Equity Funds | 365,878,380 | 26,346,884 | (63,342,260 | ) | 38,123,886 | 13,273,476 | 4,781,320 | 373,940,106 | ||||||||||||||||||||||||||||
Fixed-Income Funds–6.85% |
| |||||||||||||||||||||||||||||||||||
Invesco Premium Income Fund | 6.85 | % | 61,312,860 | 13,574,639 | (18,010,532 | ) | 3,322,576 | 1,128,228 | 3,267,533 | 5,655,551 | 60,457,841 | |||||||||||||||||||||||||
Foreign Equity Funds–24.95% |
| |||||||||||||||||||||||||||||||||||
Invesco Developing Markets Fund | 7.29 | % | 58,468,477 | 4,985,803 | (10,034,499 | ) | 10,715,419 | 234,518 | 741,216 | 1,902,741 | 64,369,718 | |||||||||||||||||||||||||
Invesco International Core Equity Fund | 9.37 | % | 72,485,244 | 12,935,968 | (11,832,035 | ) | 12,627,358 | (3,396,565 | ) | 2,006,965 | 8,001,929 | 82,819,970 | ||||||||||||||||||||||||
Invesco International Growth Fund | 8.29 | % | 68,448,471 | 3,536,439 | (8,345,501 | ) | 10,503,227 | (951,778 | ) | 961,469 | 2,506,536 | 73,190,858 | ||||||||||||||||||||||||
Total Foreign Equity Funds | 199,402,192 | 21,458,210 | (30,212,035 | ) | 33,846,004 | (4,113,825 | ) | 3,709,650 | 220,380,546 | |||||||||||||||||||||||||||
Real Estate Funds–4.43% |
| |||||||||||||||||||||||||||||||||||
Invesco Global Real Estate Fund | 4.43 | % | 36,517,161 | 3,086,267 | (8,228,502 | ) | 9,343,902 | (1,632,926 | ) | 1,695,531 | 3,349,263 | 39,085,902 | ||||||||||||||||||||||||
Money Market Funds–0.37% |
| |||||||||||||||||||||||||||||||||||
Liquid Assets Portfolio–Institutional Class | 0.18 | % | 91,912 | 50,716,958 | (49,181,313 | ) | — | — | 1,655 | 1,627,557 | 1,627,557 | |||||||||||||||||||||||||
Premier Portfolio–Institutional Class | 0.19 | % | 91,912 | 50,716,958 | (49,181,313 | ) | — | — | 1,276 | 1,627,557 | 1,627,557 | |||||||||||||||||||||||||
Total Money Market Funds | 183,824 | 101,433,916 | (98,362,626 | ) | — | — | 2,931 | 3,255,114 | ||||||||||||||||||||||||||||
TOTAL INVESTMENTS IN AFFILIATED ISSUERS | 100.09 | % | $ | 847,543,324 | $ | 188,624,265 | $ | (246,616,598 | ) | $ | 91,229,929 | $ | 13,999,939 | (b) | $ | 17,791,200 | $ | 883,873,773 | ||||||||||||||||||
OTHER ASSETS LESS LIABILITIES | (0.09 | )% | (756,965 | ) | ||||||||||||||||||||||||||||||||
NET ASSETS | 100.00 | % | $ | 883,116,808 | ||||||||||||||||||||||||||||||||
Notes to Schedule of Investments:
| (a) | Each underlying fund and the Fund are affiliated by either having the same investment adviser or an investment adviser under common control with the Fund’s investment adviser. Effective September 24, 2012, the Fund began investing in Class R6 shares. The Fund invests in Class R6 shares of the mutual funds listed. |
| (b) | Includes $3,696,896, $1,228,361, $3,714,514, $1,397,385 and $869,930 of capital gains from Invesco Balanced-Risk Allocation Fund, Invesco Diversified Dividend Fund, Invesco Endeavor Fund, Invesco Small Cap Equity Fund and Invesco Premium Income Fund, respectively. |
See accompanying Notes to Financial Statements which are an integral part of the financial statements.
22 Invesco Allocation Funds
Schedule of Investments—(continued)
December 31, 2012
Invesco Moderate Allocation Fund
Schedule of Investments in Affiliated Issuers–100.07%(a)
| % of Net Assets 12/31/12 | Value 12/31/11 | Purchases at Cost | Proceeds from Sales | Change in Unrealized Appreciation | Realized Gain (Loss) | Dividend Income | Shares 12/31/12 | Value 12/31/12 | ||||||||||||||||||||||||||||
Asset Allocation Funds–16.91% |
| |||||||||||||||||||||||||||||||||||
Invesco Balanced-Risk Allocation Fund | 12.31 | % | $ | 90,965,195 | $ | 9,855,535 | $ | (6,943,185 | ) | $ | 4,446,787 | $ | 3,083,118 | $ | 2,350,538 | 7,883,594 | $ | 98,781,435 | ||||||||||||||||||
Invesco Balanced-Risk Commodity Strategy Fund | 4.60 | % | 36,423,983 | 4,326,590 | (4,756,793 | ) | 488,947 | 376,467 | 776,802 | 3,575,091 | 36,859,194 | |||||||||||||||||||||||||
Total Asset Allocation Funds | 127,389,178 | 14,182,125 | (11,699,978 | ) | 4,935,734 | 3,459,585 | 3,127,340 | 135,640,629 | ||||||||||||||||||||||||||||
Domestic Equity Funds–31.18% |
| |||||||||||||||||||||||||||||||||||
Invesco American Franchise Fund | 6.10 | % | 46,008,953 | 4,153,009 | (7,588,596 | ) | 5,559,220 | 799,143 | 192,334 | 3,862,015 | 48,931,729 | |||||||||||||||||||||||||
Invesco Charter Fund | 4.39 | % | 32,627,618 | 1,420,745 | (2,741,930 | ) | 3,570,767 | 329,153 | 520,443 | 1,907,170 | 35,206,353 | |||||||||||||||||||||||||
Invesco Comstock Fund | 4.10 | % | 30,551,932 | 1,909,951 | (4,668,401 | ) | 4,512,638 | 600,768 | 622,423 | 1,848,702 | 32,906,888 | |||||||||||||||||||||||||
Invesco Diversified Dividend Fund | 6.78 | % | 50,588,914 | 2,787,147 | (5,533,065 | ) | 6,049,568 | 1,382,049 | 1,159,998 | 4,042,691 | 54,455,042 | |||||||||||||||||||||||||
Invesco Endeavor Fund | 3.50 | % | 25,597,083 | 4,422,546 | (4,104,199 | ) | 1,353,220 | 3,264,160 | 114,272 | 1,582,672 | 28,059,676 | |||||||||||||||||||||||||
Invesco Growth and Income Fund | 3.41 | % | 26,138,729 | 814,148 | (2,841,759 | ) | 2,946,466 | 314,259 | 543,722 | 1,305,286 | 27,371,843 | |||||||||||||||||||||||||
Invesco Small Cap Equity Fund | 2.90 | % | 21,467,814 | 1,973,234 | (2,308,720 | ) | 1,693,994 | 1,359,974 | — | 1,670,588 | 23,254,585 | |||||||||||||||||||||||||
Total Domestic Equity Funds | 232,981,043 | 17,480,780 | (29,786,670 | ) | 25,685,873 | 8,049,506 | 3,153,192 | 250,186,116 | ||||||||||||||||||||||||||||
Fixed-Income Funds–30.20% |
| |||||||||||||||||||||||||||||||||||
Invesco Core Plus Bond Fund | 9.06 | % | 69,521,152 | 10,141,320 | (9,763,508 | ) | 3,104,287 | (334,958 | ) | 2,857,579 | 6,612,220 | 72,668,293 | ||||||||||||||||||||||||
Invesco Emerging Market Local Currency Debt Fund | 2.48 | % | 16,551,421 | 3,496,310 | (2,292,857 | ) | 2,336,741 | (102,742 | ) | 665,455 | 1,966,114 | 19,897,071 | ||||||||||||||||||||||||
Invesco Floating Rate Fund | 3.03 | % | 23,179,690 | 2,937,278 | (2,861,399 | ) | 1,383,393 | (295,207 | ) | 1,261,891 | 3,093,234 | 24,343,755 | ||||||||||||||||||||||||
Invesco High Yield Fund | 3.71 | % | 27,968,433 | 2,660,728 | (3,731,244 | ) | 2,908,930 | (27,180 | ) | 1,789,788 | 6,722,272 | 29,779,667 | ||||||||||||||||||||||||
Invesco Premium Income Fund | 5.91 | % | 45,762,303 | 8,263,683 | (9,354,137 | ) | 2,581,394 | 809,867 | 2,500,558 | 4,432,622 | 47,384,733 | |||||||||||||||||||||||||
PowerShares 1-30 Laddered Treasury Portfolio–ETF | 6.01 | % | 47,302,296 | 9,562,136 | (9,017,883 | ) | (301,229 | ) | 988,354 | 806,404 | 1,478,300 | 48,192,580 | ||||||||||||||||||||||||
Total Fixed-Income Funds | 230,285,295 | 37,061,455 | (37,021,028 | ) | 12,013,516 | 1,038,134 | 9,881,675 | 242,266,099 | ||||||||||||||||||||||||||||
Foreign Equity Funds–18.37% |
| |||||||||||||||||||||||||||||||||||
Invesco Developing Markets Fund | 5.36 | % | 37,218,374 | 4,093,847 | (5,541,899 | ) | 7,073,343 | 147,586 | 492,553 | 1,270,803 | 42,991,251 | |||||||||||||||||||||||||
Invesco International Core Equity Fund | 6.90 | % | 46,110,088 | 9,410,645 | (6,297,354 | ) | 7,644,978 | (1,453,819 | ) | 1,336,117 | 5,354,062 | 55,414,538 | ||||||||||||||||||||||||
Invesco International Growth Fund | 6.11 | % | 43,598,173 | 3,796,704 | (4,726,717 | ) | 6,293,226 | 56,924 | 640,687 | 1,678,709 | 49,018,310 | |||||||||||||||||||||||||
Total Foreign Equity Funds | 126,926,635 | 17,301,196 | (16,565,970 | ) | 21,011,547 | (1,249,309 | ) | 2,469,357 | 147,424,099 | |||||||||||||||||||||||||||
Real Estate Funds–3.25% |
| |||||||||||||||||||||||||||||||||||
Invesco Global Real Estate Fund | 3.25 | % | 23,306,754 | 1,779,644 | (4,044,999 | ) | 4,813,561 | 264,530 | 1,121,116 | 2,238,174 | 26,119,490 | |||||||||||||||||||||||||
Money Market Funds–0.16% |
| |||||||||||||||||||||||||||||||||||
Liquid Assets Portfolio–Institutional Class | 0.08 | % | 2,845,384 | 37,111,517 | (39,320,860 | ) | — | — | 1,978 | 636,041 | 636,041 | |||||||||||||||||||||||||
Premier Portfolio–Institutional Class | 0.08 | % | 2,845,384 | 37,111,517 | (39,320,860 | ) | — | — | 1,511 | 636,041 | 636,041 | |||||||||||||||||||||||||
Total Money Market Funds | 5,690,768 | 74,223,034 | (78,641,720 | ) | — | — | 3,489 | 1,272,082 | ||||||||||||||||||||||||||||
TOTAL INVESTMENTS IN AFFILIATED ISSUERS | 100.07 | % | $ | 746,579,673 | $ | 162,028,234 | $ | (177,760,365 | ) | $ | 68,460,231 | (b) | $ | 11,562,446 | (c) | $ | 19,756,169 | $ | 802,908,515 | |||||||||||||||||
OTHER ASSETS LESS LIABILITIES | (0.07 | )% | (591,719 | ) | ||||||||||||||||||||||||||||||||
NET ASSETS | 100.00 | % | $ | 802,316,796 | ||||||||||||||||||||||||||||||||
Investment Abbreviations:
ETF – Exchange-Traded Fund
Notes to Schedule of Investments:
| (a) | Each underlying fund and the Fund are affiliated by either having the same investment adviser or an investment adviser under common control with the Fund’s investment adviser. Effective September 24, 2012, the Fund began investing in Class R6 shares. The Fund invests in Class R6 shares of the mutual funds listed and the Fund shares of the exchange-traded fund. |
| (b) | Includes $53,481 and $338,768 of return of capital from Invesco Emerging Market Local Currency Debt Fund and PowerShares 1-30 Laddered Treasury Portfolio—ETF. |
| (c) | Includes $2,626,015, $819,571, $2,473,134, $931,711, $38,321, $678,377 and $2,326 of capital gains from Invesco Balanced-Risk Allocation Fund, Invesco Diversified Dividend Fund, Invesco Endeavor Fund, Invesco Small Cap Equity Fund, Invesco Emerging Market Local Currency Debt Fund, Invesco Premium Income Fund and PowerShares 1-30 Laddered Treasury Portfolio—ETF, respectively. |
See accompanying Notes to Financial Statements which are an integral part of the financial statements.
23 Invesco Allocation Funds
Statement of Assets and Liabilities
December 31, 2012
| Invesco Conservative Allocation Fund | Invesco Growth Allocation Fund | Invesco Moderate Allocation Fund | ||||||||||||||||
Assets: | ||||||||||||||||||
Investments in affiliated underlying funds, at value | $ | 337,540,938 | $ | 883,873,773 | $ | 802,908,515 | ||||||||||||
Receivable for: | ||||||||||||||||||
Fund shares sold | 605,114 | 1,253,793 | 1,246,040 | |||||||||||||||
Dividends — affiliated underlying funds | 371 | 389 | 556 | |||||||||||||||
Investment for trustee deferred compensation and retirement plans | 41,903 | 51,481 | 36,835 | |||||||||||||||
Other assets | 70,394 | 27,050 | 30,268 | |||||||||||||||
Total assets | 338,258,720 | 885,206,486 | 804,222,214 | |||||||||||||||
Liabilities: | ||||||||||||||||||
Payable for: | ||||||||||||||||||
Fund shares reacquired | 712,229 | 1,174,270 | 1,161,544 | |||||||||||||||
Accrued fees to affiliates | 234,789 | 689,461 | 541,149 | |||||||||||||||
Accrued operating expenses | — | 78,093 | 85,120 | |||||||||||||||
Trustee deferred compensation and retirement plans | 71,008 | 147,854 | 117,605 | |||||||||||||||
Total liabilities | 1,018,026 | 2,089,678 | 1,905,418 | |||||||||||||||
Net assets applicable to shares outstanding | $ | 337,240,694 | $ | 883,116,808 | $ | 802,316,796 | ||||||||||||
Net assets consist of: | ||||||||||||||||||
Shares of beneficial interest | $ | 334,069,853 | $ | 994,252,942 | $ | 809,729,060 | ||||||||||||
Undistributed net investment income | 380,600 | 736,234 | 489,056 | |||||||||||||||
Undistributed net realized gain (loss) | (31,806,886 | ) | (226,374,982 | ) | (103,520,946 | ) | ||||||||||||
Unrealized appreciation | 34,597,127 | 114,502,614 | 95,619,626 | |||||||||||||||
| $ | 337,240,694 | $ | 883,116,808 | $ | 802,316,796 | |||||||||||||
Net Assets: |
| |||||||||||||||||
Class A | $ | 228,512,421 | $ | 597,879,316 | $ | 537,812,361 | ||||||||||||
Class B | $ | 31,089,934 | $ | 96,851,637 | $ | 80,028,802 | ||||||||||||
Class C | $ | 62,919,242 | $ | 131,069,040 | $ | 123,504,775 | ||||||||||||
Class R | $ | 8,845,202 | $ | 22,750,983 | $ | 20,557,379 | ||||||||||||
Class S | $ | 2,863,657 | $ | 31,802,635 | $ | 36,650,702 | ||||||||||||
Class Y | $ | 2,987,137 | $ | 2,552,674 | $ | 3,319,222 | ||||||||||||
Class R5 | $ | 23,101 | $ | 210,523 | $ | 443,555 | ||||||||||||
Shares outstanding, $0.01 par value per share, | ||||||||||||||||||
Class A | 21,365,173 | 49,913,768 | 47,501,445 | |||||||||||||||
Class B | 2,931,816 | 8,157,939 | 7,093,590 | |||||||||||||||
Class C | 5,921,772 | 11,038,741 | 10,953,891 | |||||||||||||||
Class R | 828,807 | 1,903,509 | 1,817,393 | |||||||||||||||
Class S | 267,549 | 2,657,072 | 3,239,752 | |||||||||||||||
Class Y | 279,957 | 213,457 | 293,115 | |||||||||||||||
Class R5 | 2,152 | 17,510 | 39,075 | |||||||||||||||
Class A: | ||||||||||||||||||
Net asset value per share | $ | 10.70 | $ | 11.98 | $ | 11.32 | ||||||||||||
Maximum offering price per share | $ | 11.32 | $ | 12.68 | $ | 11.98 | ||||||||||||
Class B: | $ | 10.60 | $ | 11.87 | $ | 11.28 | ||||||||||||
Class C: | $ | 10.63 | $ | 11.87 | $ | 11.27 | ||||||||||||
Class R: | $ | 10.67 | $ | 11.95 | $ | 11.31 | ||||||||||||
Class S: | $ | 10.70 | $ | 11.97 | $ | 11.31 | ||||||||||||
Class Y: | $ | 10.67 | $ | 11.96 | $ | 11.32 | ||||||||||||
Class R5: | $ | 10.73 | $ | 12.02 | $ | 11.35 | ||||||||||||
Cost of Investments in affiliated underlying funds | $ | 302,943,811 | $ | 769,371,159 | $ | 707,288,889 | ||||||||||||
See accompanying Notes to Financial Statements which are an integral part of the financial statements.
24 Invesco Allocation Funds
Statement of Operations
For the year ended December 31, 2012
| Invesco Conservative Allocation Fund | Invesco Growth Allocation Fund | Invesco Moderate Allocation Fund | ||||||||||||||||
Investment income: | ||||||||||||||||||
Dividends from affiliated underlying funds | $ | 9,724,151 | $ | 17,592,508 | $ | 19,756,169 | ||||||||||||
Other Income | 1,026 | 1,212 | 894 | |||||||||||||||
Total investment income | 9,725,177 | 17,593,720 | 19,757,063 | |||||||||||||||
Expenses: | ||||||||||||||||||
Administrative services fees | 119,301 | 246,253 | 224,674 | |||||||||||||||
Custodian fees | 9,319 | 13,399 | 10,372 | |||||||||||||||
Distribution fees: | ||||||||||||||||||
Class A | 537,698 | 1,455,674 | 1,282,519 | |||||||||||||||
Class B | 335,930 | 1,058,156 | 887,886 | |||||||||||||||
Class C | 605,301 | 1,295,087 | 1,199,391 | |||||||||||||||
Class R | 45,569 | 117,744 | 98,107 | |||||||||||||||
Class S | 4,119 | 47,378 | 54,496 | |||||||||||||||
Transfer agent fees — A, B, C, R, S and Y | 430,711 | 1,970,450 | 1,266,130 | |||||||||||||||
Transfer agent fees — R5 | 60 | 72 | 541 | |||||||||||||||
Trustees’ and officers’ fees and benefits | 33,080 | 54,657 | 50,506 | |||||||||||||||
Other | 194,283 | 329,572 | 269,325 | |||||||||||||||
Total expenses | 2,315,371 | 6,588,442 | 5,343,947 | |||||||||||||||
Less: Expenses reimbursed and expense offset arrangement(s) | (110,703 | ) | (801,856 | ) | (428,961 | ) | ||||||||||||
Net expenses | 2,204,668 | 5,786,586 | 4,914,986 | |||||||||||||||
Net investment income | 7,520,509 | 11,807,134 | 14,842,077 | |||||||||||||||
Realized and unrealized gain from: | ||||||||||||||||||
Net realized gain on sales of affiliated fund shares | 1,159,524 | 3,092,853 | 3,992,991 | |||||||||||||||
Net realized gain from distributions of affiliated underlying fund shares | 2,150,394 | 11,105,778 | 7,569,455 | |||||||||||||||
Net realized gain from affiliated underlying fund shares | 3,309,918 | 14,198,631 | 11,562,446 | |||||||||||||||
Change in net unrealized appreciation of affiliated underlying fund shares | 22,489,142 | 91,229,929 | 68,460,231 | |||||||||||||||
Net increase in net assets resulting from operations | $ | 33,319,569 | $ | 117,235,694 | $ | 94,864,754 | ||||||||||||
See accompanying Notes to Financial Statements which are an integral part of the financial statements.
25 Invesco Allocation Funds
Statement of Changes In Net Assets
For the years ended December 31, 2012 and 2011
| Invesco Conservative Allocation Fund | Invesco Growth Allocation Fund | Invesco Moderate Allocation Fund | ||||||||||||||||||||||||||||
| 2012 | 2011 | 2012 | 2011 | 2012 | 2011 | |||||||||||||||||||||||||
Operations: | ||||||||||||||||||||||||||||||
Net investment income | $ | 7,520,509 | $ | 6,275,091 | $ | 11,807,134 | $ | 9,670,429 | $ | 14,842,077 | $ | 14,239,218 | ||||||||||||||||||
Net realized gain | 3,309,918 | 2,354,717 | 14,198,631 | 17,042,847 | 11,562,446 | 14,564,545 | ||||||||||||||||||||||||
Change in net unrealized appreciation (depreciation) | 22,489,142 | (6,149,232 | ) | 91,229,929 | (54,918,979 | ) | 68,460,231 | (29,172,683 | ) | |||||||||||||||||||||
Net increase (decrease) in net assets resulting from operations | 33,319,569 | 2,480,576 | 117,235,694 | (28,205,703 | ) | 94,864,754 | (368,920 | ) | ||||||||||||||||||||||
Distributions to shareholders from net investment income: | ||||||||||||||||||||||||||||||
Class A | (7,648,747 | ) | (3,949,970 | ) | (15,644,861 | ) | (8,164,889 | ) | (19,979,574 | ) | (8,716,847 | ) | ||||||||||||||||||
Class B | (836,442 | ) | (528,279 | ) | (1,864,476 | ) | (592,500 | ) | (2,442,144 | ) | (1,196,956 | ) | ||||||||||||||||||
Class C | (1,668,782 | ) | (863,491 | ) | (2,484,578 | ) | (666,849 | ) | (3,692,988 | ) | (1,628,311 | ) | ||||||||||||||||||
Class R | (280,424 | ) | (180,559 | ) | (537,111 | ) | (291,565 | ) | (706,003 | ) | (416,441 | ) | ||||||||||||||||||
Class S | (99,121 | ) | (38,574 | ) | (867,434 | ) | (773,390 | ) | (1,394,591 | ) | (857,582 | ) | ||||||||||||||||||
Class Y | (107,199 | ) | (23,544 | ) | (73,643 | ) | (45,849 | ) | (132,600 | ) | (37,130 | ) | ||||||||||||||||||
Class R5 | (865 | ) | (1,930 | ) | (5,804 | ) | (2,518 | ) | (17,292 | ) | (26,850 | ) | ||||||||||||||||||
Total distributions from net investment income | (10,641,580 | ) | (5,586,347 | ) | (21,477,907 | ) | (10,537,560 | ) | (28,365,192 | ) | (12,880,117 | ) | ||||||||||||||||||
Share transactions-net: | ||||||||||||||||||||||||||||||
Class A | 12,270,308 | 156,273,954 | (21,918,931 | ) | 296,919,058 | 13,170,268 | 156,492,890 | |||||||||||||||||||||||
Class B | (6,263,467 | ) | 26,232,202 | (25,202,878 | ) | 45,628,236 | (21,080,133 | ) | 15,676,330 | |||||||||||||||||||||
Class C | 2,354,652 | 42,466,775 | (7,864,664 | ) | 56,467,542 | (1,731,268 | ) | 12,730,289 | ||||||||||||||||||||||
Class R | (5,973 | ) | 5,009,412 | (1,745,700 | ) | 8,051,908 | 980,867 | (3,488,100 | ) | |||||||||||||||||||||
Class S | 111,476 | 2,593,994 | (2,090,121 | ) | (802,298 | ) | (1,706,327 | ) | 843,959 | |||||||||||||||||||||
Class Y | 1,696,669 | 1,148,631 | (323,419 | ) | 1,436,360 | 1,283,454 | 798,323 | |||||||||||||||||||||||
Class R5 | (59,424 | ) | 45,736 | 162,813 | (70,694 | ) | (771,577 | ) | 59,937 | |||||||||||||||||||||
Net increase (decrease) in net assets resulting from share transactions | 10,104,241 | 233,770,704 | (58,982,900 | ) | 407,630,112 | (9,854,716 | ) | 183,113,628 | ||||||||||||||||||||||
Net increase in net assets | 32,782,230 | 230,664,933 | 36,774,887 | 368,886,849 | 56,644,846 | 169,864,591 | ||||||||||||||||||||||||
Net assets: | ||||||||||||||||||||||||||||||
Beginning of year | 304,458,464 | 73,793,531 | 846,341,921 | 477,455,072 | 745,671,950 | 575,807,359 | ||||||||||||||||||||||||
End of year* | $ | 337,240,694 | $ | 304,458,464 | $ | 883,116,808 | $ | 846,341,921 | $ | 802,316,796 | $ | 745,671,950 | ||||||||||||||||||
* Includes accumulated undistributed net investment income | $ | 380,600 | $ | 2,510,769 | $ | 736,234 | $ | 5,549,613 | $ | 489,056 | $ | 10,605,439 | ||||||||||||||||||
Notes to Financial Statements
December 31, 2012
NOTE 1—Significant Accounting Policies
AIM Growth Series (Invesco Growth Series) (the “Trust”) is organized as a Delaware statutory trust and is registered under the Investment Company Act of 1940, as amended (the “1940 Act”), as an open-end series management investment company consisting of sixteen separate series portfolios (each constituting a “Fund”), each authorized to issue an unlimited number of shares of beneficial interest. The Funds covered in this report, each a series portfolio of the Trust, are Invesco Conservative Allocation Fund, Invesco Growth Allocation Fund and Invesco Moderate Allocation Fund (collectively, the “Funds”). The assets, liabilities and operations of each portfolio are accounted for separately. Information presented in these financial statements pertains only to the Fund. Matters affecting each portfolio or class will be voted on exclusively by the shareholders of such portfolio or class.
The investment objectives of the Funds are: to provide total return consistent with a lower level of risk relative to the broad stock market for Invesco Conservative Allocation Fund, to provide long-term growth of capital consistent with a higher level of risk relative to the broad stock market for Invesco Growth Allocation Fund, and to provide total return consistent with a moderate level of risk relative to the broad stock market for Invesco Moderate Allocation Fund.
Each Fund is a “fund of funds,” in that it invests in other mutual funds (“underlying funds”) advised by Invesco Advisers, Inc. (“Invesco”) or exchange-traded funds advised by Invesco Powershares Capital Management LLC (“PowerShares Capital”), an affiliate of Invesco. Invesco and
26 Invesco Allocation Funds
PowerShares Capital are affiliates of each other as they are indirect wholly-owned subsidiaries of Invesco Ltd. Invesco may change each Fund’s asset class allocations, the underlying funds or target weightings in the underlying funds without shareholder approval. The underlying funds may engage in a number of investment techniques and practices, which involve certain risks. Each underlying fund’s accounting policies are outlined in the underlying fund’s financial statements and are available upon request.
Each Fund currently consists of seven different classes of shares: Class A, Class B, Class C, Class R, Class S, Class Y and Class R5. On September 24, 2012, Institutional Class shares were renamed Class R5 shares. Class A shares are sold with a front-end sales charge unless certain waiver criteria are met and under certain circumstances load waived shares may be subject to contingent deferred sales charges (“CDSC”). Class C shares are sold with a CDSC. Class R, Class S, Class Y and Class R5 shares are sold at net asset value. Effective November 30, 2010, new or additional investments in Class B shares are no longer permitted. Existing shareholders of Class B shares may continue to reinvest dividends and capital gains distributions in Class B shares until they convert to Class A shares. Also, shareholders in Class B shares will be able to exchange those shares for Class B shares of other Invesco Funds offering such shares until they convert to Class A shares. Generally, Class B shares will automatically convert to Class A shares on or about the month-end, which is at least eight years after the date of purchase. Redemption of Class B shares prior to the conversion date will be subject to a CDSC.
The following is a summary of the significant accounting policies followed by the Funds in the preparation of their financial statements.
| A. | Security Valuations — Securities of investment companies that trade on an exchange are valued at the last sales price or official closing price as of the close of the customary trading session on the exchange where the security is principally traded. Investments in shares of funds that are not traded on an exchange are valued at the end of day net asset value per share of such fund. Securities in the underlying funds, including restricted securities, are valued in accordance with the valuation policy of such fund. The policies of the underlying funds affiliated with the funds as a result of having the same investment adviser are set forth below. |
A security listed or traded on an exchange (except convertible bonds) is valued at its last sales price or official closing price as of the close of the customary trading session on the exchange where the security is principally traded, or lacking any sales or official closing price on a particular day, the security may be valued at the closing bid price on that day. Securities traded in the over-the-counter market are valued based on prices furnished by independent pricing services or market makers. When such securities are valued by an independent pricing service they may be considered fair valued. Futures contracts are valued at the final settlement price set by an exchange on which they are principally traded. Listed options are valued at the mean between the last bid and ask prices from the exchange on which they are principally traded. Options not listed on an exchange are valued by an independent source at the mean between the last bid and ask prices. For purposes of determining net asset value per share, futures and option contracts generally are valued 15 minutes after the close of the customary trading session of the New York Stock Exchange (“NYSE”).
Senior secured floating rate loans and senior secured floating rate debt securities are fair valued using an evaluated quote provided by an independent pricing service. Evaluated quotes provided by the pricing service may reflect appropriate factors such as ratings, tranche type, industry, company performance, spread, individual trading characteristics, institution-size trading in similar groups of securities and other market data.
Investments in open-end and closed-end registered investment companies that do not trade on an exchange are valued at the end of day net asset value per share. Investments in open-end and closed-end registered investment companies that trade on an exchange are valued at the last sales price or official closing price as of the close of the customary trading session on the exchange where the security is principally traded.
Debt obligations (including convertible bonds) and unlisted equities are fair valued using an evaluated quote provided by an independent pricing service. Evaluated quotes provided by the pricing service may be determined without exclusive reliance on quoted prices, and may reflect appropriate factors such as institution-size trading in similar groups of securities, developments related to specific securities, dividend rate (for unlisted equities), yield (for debt obligations), quality, type of issue, coupon rate (for debt obligations), maturity (for debt obligations), individual trading characteristics and other market data. Debt obligations are subject to interest rate and credit risks. In addition, all debt obligations involve some risk of default with respect to interest and/or principal payments.
Swap agreements are fair valued using an evaluated quote provided by an independent pricing service. Evaluated quotes provided by the pricing service are valued based on a model which may include end of day net present values, spreads, ratings, industry, and company performance.
Foreign securities’ (including foreign exchange contracts) prices are converted into U.S. dollar amounts using the applicable exchange rates as of the close of the NYSE. If market quotations are available and reliable for foreign exchange-traded equity securities, the securities will be valued at the market quotations. Because trading hours for certain foreign securities end before the close of the NYSE, closing market quotations may become unreliable. If between the time trading ends on a particular security and the close of the customary trading session on the NYSE, events occur that the Adviser determines are significant and make the closing price unreliable, the Fund may fair value the security. If the event is likely to have affected the closing price of the security, the security will be valued at fair value in good faith using procedures approved by the Board of Trustees. Adjustments to closing prices to reflect fair value may also be based on a screening process of an independent pricing service to indicate the degree of certainty, based on historical data, that the closing price in the principal market where a foreign security trade is not the current value as of the close of the NYSE. Foreign securities’ prices meeting the approved degree of certainty that the price is not reflective of current value will be priced at the indication of fair value from the independent pricing service. Multiple factors may be considered by the independent pricing service in determining adjustments to reflect fair value and may include information relating to sector indices, American Depositary Receipts and domestic and foreign index futures. Foreign securities may have additional risks including exchange rate changes, potential for sharply devalued currencies and high inflation, political and economic upheaval, the relative lack of issuer information, relatively low market liquidity and the potential lack of strict financial and accounting controls and standards.
Securities for which market prices are not provided by any of the above methods may be valued based upon quotes furnished by independent sources. The last bid price may be used to value equity securities. The mean between the last bid and asked prices is used to value debt obligations, including corporate loans.
Securities for which market quotations are not readily available or became unreliable are valued at fair value as determined in good faith by or under the supervision of the Trust’s officers following procedures approved by the Board of Trustees. Issuer specific events, market trends, bid/ask quotes of brokers and information providers and other market data may be reviewed in the course of making a good faith determination of a security’s fair value.
27 Invesco Allocation Funds
Valuations change in response to many factors including the historical and prospective earnings of the issuer, the value of the issuer’s assets, general economic conditions, interest rates, investor perceptions and market liquidity. Because of the inherent uncertainties of valuation, the values reflected in the financial statements may materially differ from the value received upon actual sale of those investments.
| B. | Securities Transactions and Investment Income — Securities transactions are accounted for on a trade date basis. Realized gains or losses on sales are computed on the basis of specific identification of the securities sold. Distributions from ordinary income from underlying funds, if any, are recorded as dividend income on ex-dividend date. Distributions from gains from underlying funds, if any, are recorded as realized gains on the ex-dividend date. The following policies are followed by the underlying funds: Interest income is recorded on the accrual basis from settlement date. Bond premiums and discounts are amortized and/or accreted for financial reporting purposes. Paydown gains and losses on mortgage and asset-backed securities are recorded as adjustments to interest income. |
The Fund allocates income and realized and unrealized capital gains and losses to a class based on the relative net assets of each class.
| C. | Distributions — Distributions from income and net realized capital gain, if any, are generally declared and paid annually and recorded on the ex-dividend date. The Funds may elect to treat a portion of the proceeds from redemptions as distributions for federal tax purposes. |
| D. | Federal Income Taxes — The Funds intend to comply with the requirements of Subchapter M of the Internal Revenue Code necessary to qualify as a regulated investment company and to distribute substantially all of the Funds’ taxable earnings to shareholders. As such, the Funds will not be subject to federal income taxes on otherwise taxable income (including net realized capital gain) that is distributed to shareholders. Therefore, no provision for federal income taxes is recorded in the financial statements. |
Each Fund files tax returns in the U.S. Federal jurisdiction and certain other jurisdictions. Generally, each Fund is subject to examinations by such taxing authorities for up to three years after the filing of the return for the tax period.
| E. | Expenses — Expenses included in the accompanying financial statements reflect the expenses of the Funds and do not include any expenses of the underlying funds. The effects of the underlying funds expenses are included in the realized and unrealized gain/loss on the investments in the underlying funds. |
Fees provided for under the Rule 12b-1 plan of a particular class of each Fund and which are directly attributable to that class are charged to the operations of such class. Transfer agency fees and expenses and other shareholder recordkeeping fees and expenses attributable to Class R5 are charged to such class. Transfer agency fees and expenses and other shareholder recordkeeping fees and expenses relating to all other classes are allocated among those classes based on relative net assets. All other expenses are allocated among the classes based on relative net assets.
| F. | Accounting Estimates — The preparation of financial statements in conformity with accounting principles generally accepted in the United States of America (“GAAP”) requires management to make estimates and assumptions that affect the reported amounts of assets and liabilities at the date of the financial statements and the reported amounts of revenues and expenses during the reporting period including estimates and assumptions related to taxation. Actual results could differ from those estimates by a significant amount. In addition, the Fund monitors for material events or transactions that may occur or become known after the period-end date and before the date the financial statements are released to print. |
| G. | Indemnifications — Under the Trust’s organizational documents, each Trustee, officer, employee or other agent of the Trust is indemnified against certain liabilities that may arise out of the performance of their duties to the Funds. Additionally, in the normal course of business, the Funds enter into contracts, including each Funds’ servicing agreements, that contain a variety of indemnification clauses. Each Fund’s maximum exposure under these arrangements is unknown as this would involve future claims that may be made against such Fund that have not yet occurred. The risk of material loss as a result of such indemnification claims is considered remote. |
NOTE 2—Advisory Fees and Other Fees Paid to Affiliates
The Trust has entered into a master investment advisory agreement with Invesco. Under the terms of the investment advisory agreement, the Funds do not pay an advisory fee. However, each Fund pays advisory fees to Invesco indirectly as a shareholder of the underlying funds.
Under the terms of a master sub-advisory agreement between the Adviser and each of Invesco Asset Management Deutschland GmbH, Invesco Asset Management Limited, Invesco Asset Management (Japan) Limited, Invesco Australia Limited, Invesco Hong Kong Limited, Invesco Senior Secured Management, Inc. and Invesco Canada Ltd. (collectively, the “Affiliated Sub-Advisers”) the Adviser, not the Funds, may pay 40% of the fees paid to the Adviser to any such Affiliated Sub-Adviser(s) that provide discretionary investment management services to each Fund or underlying funds based on the percentage of assets allocated to such Sub-Adviser(s).
Effective July 1, 2012, Invesco has contractually agreed, through June 30, 2013, to reimburse expenses to the extent necessary to limit total annual fund operating expenses after expense reimbursement (excluding certain items discussed below) of Class A, Class B, Class C, Class R, Class S, Class Y and Class R5 shares for each Fund as shown in the following table:
| Class A | Class B | Class C | Class R | Class S | Class Y | Class R5 | ||||||||||||||||||||||
Invesco Conservative Allocation Fund | 1.50 | % | 2.25 | % | 2.25 | % | 1.75 | % | 1.40 | % | 1.25 | % | 1.25 | % | ||||||||||||||
Invesco Growth Allocation Fund | 2.00 | % | 2.75 | % | 2.75 | % | 2.25 | % | 1.90 | % | 1.75 | % | 1.75 | % | ||||||||||||||
Invesco Moderate Allocation Fund | 1.50 | % | 2.25 | % | 2.25 | % | 1.75 | % | 1.40 | % | 1.25 | % | 1.25 | % | ||||||||||||||
Prior to July 1, 2012, Invesco had contractually agreed to reimburse expenses to the extent necessary to limit total annual fund operating expenses after expense reimbursement (excluding certain items discussed below) of Class A, Class B, Class C, Class R, Class S, Class Y and Class R5 shares for each Fund as shown in the following table:
| Class A | Class B | Class C | Class R | Class S | Class Y | Class R5 | ||||||||||||||||||||||
Invesco Conservative Allocation Fund | 0.39 | % | 1.14 | % | 1.14 | % | 0.64 | % | 0.29 | % | 0.14 | % | 0.14 | % | ||||||||||||||
Invesco Growth Allocation Fund | 0.37 | % | 1.12 | % | 1.12 | % | 0.62 | % | 0.27 | % | 0.12 | % | 0.12 | % | ||||||||||||||
Invesco Moderate Allocation Fund | 0.37 | % | 1.12 | % | 1.12 | % | 0.62 | % | 0.27 | % | 0.12 | % | 0.12 | % | ||||||||||||||
28 Invesco Allocation Funds
In determining Invesco’s obligation to reimburse expenses, the following expenses are not taken into account, and could cause the total annual fund operating expenses after expense reimbursement to exceed the numbers reflected above: (1) interest; (2) taxes; (3) dividend expense on short sales; (4) extraordinary or non-routine items, including litigation expenses; and (5) expenses that the Fund has incurred but did not actually pay because of an expense offset arrangement. Acquired Fund Fees and Expenses are not fees and expenses incurred by the Funds directly but are fees and expenses, including management fees, of the investment companies in which the Funds invest. As a result, total annual fund operating expenses after expense reimbursement may exceed the expense limits above. You incur these expenses indirectly through the valuation of each Fund’s investment in those investment companies. The impact of the Acquired Fund Fees and Expenses are included in the total return of the Funds. Unless the Board of Trustees and Invesco mutually agree to amend or continue the fee waiver agreement, it will terminate on June 30, 2013.
For the year ended December 31, 2012, Invesco reimbursed the following expenses:
| Class A | Class B | Class C | Class R | Class S | Class Y | Class R5 | ||||||||||||||||||||||
Invesco Conservative Allocation Fund | $ | 72,825 | $ | 11,374 | $ | 20,495 | $ | 3,086 | $ | 930 | $ | 773 | $ | 22 | ||||||||||||||
Invesco Growth Allocation Fund | 529,346 | 96,198 | 117,738 | 21,408 | 28,714 | 2,331 | 10 | |||||||||||||||||||||
Invesco Moderate Allocation Fund | 279,656 | 48,401 | 65,383 | 10,696 | 19,805 | 1,595 | — | |||||||||||||||||||||
The Trust has entered into a master administrative services agreement with Invesco pursuant to which each Fund has agreed to pay Invesco for certain administrative costs incurred in providing accounting services to such Fund. For the year ended December 31, 2012, expenses incurred under the agreement are shown in the Statement of Operations as Administrative services fees.
The Trust has entered into a transfer agency and service agreement with Invesco Investment Services, Inc. (“IIS”) pursuant to which each Fund has agreed to pay IIS a fee for providing transfer agency and shareholder services to the Fund and reimburse IIS for certain expenses incurred by IIS in the course of providing such services. IIS may make payments to intermediaries that provide omnibus account services, sub-accounting services and/or networking services. All fees payable by IIS to intermediaries that provide omnibus account services or sub-accounting are charged back to each Fund, subject to certain limitations approved by the Trust’s Board of Trustees. For the year ended December 31, 2012, expenses incurred under the agreement are shown in the Statement of Operations as Transfer agent fees.
The Trust has entered into master distribution agreements with Invesco Distributors, Inc. (“IDI”) to serve as the distributor for the Class A, Class B, Class C, Class R, Class S, Class Y and Class R5 shares of each Fund. The Trust has adopted plans pursuant to Rule 12b-1 under the 1940 Act with respect to each Fund’s Class A, Class B, Class C, Class R and Class S shares (collectively, the “Plans”). Each Fund, pursuant to the Plans, pays IDI compensation at the annual rate of 0.25% of each Fund’s average daily net assets of Class A shares, 1.00% of the average daily net assets of Class B and Class C shares, 0.50% of the average daily net assets of Class R shares and 0.15% of the average daily net assets of Class S shares. Of the Plan payments, up to 0.25% of the average daily net assets of Class A, Class B, Class C and Class R shares and 0.15% of the average daily net assets of Class S shares may be paid to furnish continuing personal shareholder services to customers who purchase and own shares of such classes. Any amounts not paid as a service fee under the Plans would constitute an asset-based sales charge. Rules of the Financial Industry Regulatory Authority (“FINRA”) impose a cap on the total sales charges, including asset-based sales charges, that may be paid by any class of shares of the Fund. For the year ended December 31, 2012, expenses incurred under the Plans are shown in the Statement of Operations as Distribution fees.
Front-end sales commissions and CDSC (collectively, the “sales charges”) are not recorded as expenses of the Funds. Front-end sales commissions are deducted from proceeds from the sales of Fund shares prior to investment in Class A shares of the Funds. CDSC are deducted from redemption proceeds prior to remittance to the shareholder. During the year ended December 31, 2012, IDI advised the Funds that IDI retained the following in front-end sales commissions from the sale of Class A shares and received the following in CDCS imposed on redemptions by shareholders:
| Front End Sales Charges | Contingent Deferred Sales Charges | |||||||||||||||
| Class A | Class A | Class B | Class C | |||||||||||||
Invesco Conservative Allocation Fund | $ | 105,524 | $ | 49 | $ | 33,313 | $ | 4,482 | ||||||||
Invesco Growth Allocation Fund | 252,201 | 368 | 131,903 | 9,674 | ||||||||||||
Invesco Moderate Allocation Fund | 238,904 | 658 | 99,285 | 7,191 | ||||||||||||
The underlying Invesco Funds pay no distribution fees for Class R5 and Class R6 shares and the Funds pay no sales loads or other similar compensation to IDI for acquiring the underlying fund shares.
Certain officers and trustees of the Trust are officers and directors of the Adviser, IIS and/or IDI.
NOTE 3—Additional Valuation Information
GAAP defines fair value as the price that would be received to sell an asset or paid to transfer a liability in an orderly transaction between market participants at the measurement date, under current market conditions. GAAP establishes a hierarchy that prioritizes the inputs to valuation methods giving the highest priority to readily available unadjusted quoted prices in an active market for identical assets (Level 1) and the lowest priority to significant unobservable inputs (Level 3) generally when market prices are not readily available or are unreliable. Based on the valuation inputs, the securities or other investments are tiered into one of three levels. Changes in valuation methods may result in transfers in or out of an investment’s assigned level:
| Level 1 — | Prices are determined using quoted prices in an active market for identical assets. |
| Level 2 — | Prices are determined using other significant observable inputs. Observable inputs are inputs that other market participants may use in pricing a security. These may include quoted prices for similar securities, interest rates, prepayment speeds, credit risk, yield curves, loss severities, default rates, discount rates, volatilities and others. |
| Level 3 — | Prices are determined using significant unobservable inputs. In situations where quoted prices or observable inputs are unavailable (for example, when there is little or no market activity for an investment at the end of the period), unobservable inputs may be used. Unobservable inputs reflect the Fund’s own assumptions about the factors market participants would use in determining fair value of the securities or instruments and would be based on the best available information. |
29 Invesco Allocation Funds
The following is a summary of the tiered valuation input levels, as of December 31, 2012. The level assigned to the securities valuations may not be an indication of the risk or liquidity associated with investing in those securities.
| Equity Securities | ||||||||||||||||
| Fund Name | Level 1 | Level 2 | Level 3 | Total | ||||||||||||
Invesco Conservative Allocation Fund | $ | 337,540,938 | $ | — | $ | — | $ | 337,540,938 | ||||||||
Invesco Growth Allocation Fund | 883,873,773 | — | — | 883,873,773 | ||||||||||||
Invesco Moderate Allocation Fund | 802,908,515 | — | — | 802,908,515 | ||||||||||||
NOTE 4—Expense Offset Arrangement(s)
The expense offset arrangement is comprised of transfer agency credits which result from balances in Demand Deposit Accounts (DDA) used by the transfer agent for clearing shareholder transactions. For the year ended December 31, 2012, the Funds received credits from this arrangement, which resulted in the reduction of the Funds’ total expenses of:
| Transfer Agent Credits | ||||
Invesco Conservative Allocation Fund | $ | 1,198 | ||
Invesco Growth Allocation Fund | 6,111 | |||
Invesco Moderate Allocation Fund | 3,425 | |||
NOTE 5—Trustees’ and Officers’ Fees and Benefits
“Trustees’ and Officers’ Fees and Benefits” include amounts accrued by each Fund to pay remuneration to certain Trustees and Officers of such Fund. Trustees have the option to defer compensation payable by the Funds, and “Trustees’ and Officers’ Fees and Benefits” also include amounts accrued by each Fund to fund such deferred compensation amounts. Those Trustees who defer compensation have the option to select various Invesco Funds in which their deferral accounts shall be deemed to be invested. Finally, certain current Trustees are eligible to participate in a retirement plan that provides for benefits to be paid upon retirement to Trustees over a period of time based on the number of years of service. The Funds may have certain former Trustees who also participate in a retirement plan and receive benefits under such plan. “Trustees’ and Officers’ Fees and Benefits” include amounts accrued by each Fund to fund such retirement benefits. Obligations under the deferred compensation and retirement plans represent unsecured claims against the general assets of the Funds.
NOTE 6—Cash Balances
The Funds are permitted to temporarily carry a negative or overdrawn balance in their account with State Street Bank and Trust Company, the custodian bank. Such balances, if any at period end, are shown in the Statement of Assets and Liabilities under the payable caption Amount due custodian. To compensate the custodian bank for such overdrafts, the overdrawn Fund may either (1) leave funds as a compensating balance in the account so the custodian bank can be compensated by earning the additional interest; or (2) compensate by paying the custodian bank at a rate agreed upon by the custodian bank and Invesco, not to exceed the contractually agreed upon rate.
NOTE 7—Distributions to Shareholders and Tax Components of Net Assets
Tax Character of Distributions to Shareholders Paid During the Years Ended December 31, 2012 and 2011:
| 2012 | 2011 | |||||||
| Ordinary Income | Ordinary Income | |||||||
Invesco Conservative Allocation Fund | $ | 10,641,580 | $ | 5,586,347 | ||||
Invesco Growth Allocation Fund | 21,477,907 | 10,537,560 | ||||||
Invesco Moderate Allocation Fund | 28,365,192 | 12,880,117 | ||||||
Tax Components of Net Assets at Period-End:
| Undistributed Ordinary Income | Net Unrealized Appreciation Investments | Temporary Book/Tax Differences | Capital Loss Carryforward | Post- October Deferrals | Shares of Beneficial Interest | Total Net Assets | ||||||||||||||||||||||
Invesco Conservative Allocation Fund | $ | 446,615 | $ | 26,225,104 | $ | (66,015 | ) | $ | (23,434,863 | ) | $ | — | $ | 334,069,853 | $ | 337,240,694 | ||||||||||||
Invesco Growth Allocation Fund | 877,954 | 99,674,113 | (141,720 | ) | (211,546,481 | ) | — | 994,252,942 | 883,116,808 | |||||||||||||||||||
Invesco Moderate Allocation Fund | 602,273 | 83,627,721 | (113,217 | ) | (91,515,754 | ) | (13,287 | ) | 809,729,060 | 802,316,796 | ||||||||||||||||||
The difference between book-basis and tax-basis unrealized appreciation (depreciation) is due to differences in the timing of recognition of gains and losses on investments for tax and book purposes. The Funds net unrealized appreciation (depreciation) differences are attributable primarily to wash sales.
The temporary book/tax differences are a result of timing differences between book and tax recognition of income and/or expenses. The Funds temporary book/tax differences are the result of the trustee deferral of compensation and retirement plan benefits.
Capital loss carryforward is calculated and reported as of a specific date. Results of transactions and other activity after that date may affect the amount of capital loss carryforward actually available for the Fund to utilize. The Regulated Investment Company Modernization Act of 2010
30 Invesco Allocation Funds
(the “Act”) eliminated the eight-year carryover period for capital losses that arise in taxable years beginning after its enactment date of December 22, 2010. Consequently, these capital losses can be carried forward for an unlimited period. However, capital losses with an expiration period may not be used to offset capital gains until all net capital losses without an expiration date have been utilized. Additionally, post-enactment capital loss carryovers will retain their character as either short-term or long-term capital losses instead of as short-term capital losses as under prior law. The ability to utilize capital loss carryforward in the future may be limited under the Internal Revenue Code and related regulations based on the results of future transactions.
The Funds capital loss carryforward limitations and amounts utilized in the current period to offset net realized capital gain for federal income tax purposes as follows:
| Capital Loss Carryforward Utilized | ||||
Invesco Conservative Allocation Fund | $ | 2,233,098 | ||
Invesco Growth Allocation Fund | 10,966,407 | |||
Invesco Moderate Allocation Fund | 8,972,601 | |||
The Funds have a capital loss carryforward as of December 31, 2012 which expires as follows:
| Invesco Conservative Allocation Fund | Invesco Growth Allocation Fund | Invesco Moderate Allocation Fund | ||||||||||||||||||||||||||||||||||
| Expiration* | Short-Term | Long-Term | Total | Short-Term | Long-Term | Total | Short-Term | Long-Term | Total | |||||||||||||||||||||||||||
December 31, 2015 | $ | — | $ | — | $ | — | $ | 1,230,807 | $ | — | $ | 1,230,807 | $ | — | $ | — | $ | — | ||||||||||||||||||
December 31, 2016 | 6,775,642 | — | 6,775,642 | 40,303,777 | — | 40,303,777 | 3,194,686 | — | 3,194,686 | |||||||||||||||||||||||||||
December 31, 2017 | 7,575,122 | 7,575,122 | 102,584,789 | — | 102,584,789 | 36,934,284 | — | 36,934,284 | ||||||||||||||||||||||||||||
December 31, 2018 | 9,084,099 | 9,084,099 | 67,427,108 | — | 67,427,108 | 51,386,784 | — | 51,386,784 | ||||||||||||||||||||||||||||
| * | Capital loss carryforward as of the date listed above is reduced for limitations, if any, to the extent required by the Internal Revenue Code. |
To the extent that unrealized gains as of June 6, 2011, the date of reorganization of Invesco Conservative Allocation Fund and Invesco Van Kampen Asset Allocation Conservative Fund into Invesco Conservative Allocation Fund (formerly Invesco Moderately Conservative Allocation Fund); Invesco Moderate Growth Allocation Fund and Invesco Van Kampen Asset Allocation Growth Fund into Invesco Growth Allocation Fund; Invesco Van Kampen Asset Allocation Moderate Fund into Invesco Moderate Allocation Fund and realized on securities held in each fund at such date of reorganization, the capital loss carryforward may be further limited for up to five years from the date of the reorganization.
NOTE 8—Investment Securities
The aggregate amount of investment securities purchased and sold by each Fund and aggregate cost and the net unrealized appreciation (depreciation) of investments for tax purposes are as follows:
| For the year ended December 31, 2012* | At December 31, 2012 | |||||||||||||||||||||||
| Federal Tax Cost** | Unrealized Appreciation | Unrealized (Depreciation) | Net Unrealized Appreciation | |||||||||||||||||||||
| Purchases | Sales | |||||||||||||||||||||||
Invesco Conservative Allocation Fund | $ | 41,123,548 | $ | 30,072,761 | $ | 311,315,834 | $ | 26,225,104 | $ | — | $ | 26,225,104 | ||||||||||||
Invesco Growth Allocation Fund | 87,190,349 | 148,253,972 | 784,199,660 | 106,012,496 | (6,338,383 | ) | 99,674,113 | |||||||||||||||||
Invesco Moderate Allocation Fund | 87,805,200 | 99,118,645 | 719,280,794 | 83,627,721 | — | 83,627,721 | ||||||||||||||||||
| * | Excludes U.S. Treasury obligations and money market funds, if any. |
| ** | Cost of investments on a tax basis includes the adjustments for financial reporting purposes as of the most recently completed federal income tax reporting period end. |
NOTE 9—Reclassification of Permanent Differences
Primarily as a result of differing book/tax treatment of capital gain distributions and expired capital loss carryforwards, on December 31, 2012. These reclassifications had no effect on the net assets of each Fund.
| Undistributed Net Investment Income | Undistributed Net Realized Gain (Loss) | Shares of Beneficial Interest | ||||||||||
Invesco Conservative Allocation Fund | $ | 990,902 | $ | (990,902 | ) | $ | — | |||||
Invesco Growth Allocation Fund | 4,857,394 | (4,857,394 | ) | – | ||||||||
Invesco Moderate Allocation Fund | 3,406,732 | (3,406,732 | ) | — | ||||||||
31 Invesco Allocation Funds
NOTE 10—Share Information
Invesco Conservative Allocation Fund
| Summary of Share Activity | ||||||||||||||||
| Years ended December 31, | ||||||||||||||||
| 2012(a) | 2011 | |||||||||||||||
| Shares | Amount | Shares | Amount | |||||||||||||
Sold: | ||||||||||||||||
Class A | 4,546,179 | $ | 48,358,668 | 2,842,578 | $ | 28,227,636 | ||||||||||
Class B | 294,544 | 3,098,376 | 293,861 | 2,934,017 | ||||||||||||
Class C | 1,346,787 | 14,120,355 | 980,179 | 9,773,192 | ||||||||||||
Class R | 249,040 | 2,616,894 | 221,162 | 2,202,445 | ||||||||||||
Class S (b) | 23,341 | 247,431 | 13,999 | 138,407 | ||||||||||||
Class Y | 274,424 | 2,884,676 | 19,778 | 196,924 | ||||||||||||
Issued as reinvestment of dividends: | ||||||||||||||||
Class A | 674,967 | 7,188,400 | 379,837 | 3,740,611 | ||||||||||||
Class B | 73,932 | 781,467 | 51,237 | 501,320 | ||||||||||||
Class C | 149,106 | 1,579,029 | 84,243 | 825,598 | ||||||||||||
Class R | 26,381 | 280,424 | 18,221 | 179,393 | ||||||||||||
Class S | 9,109 | 97,103 | 3,924 | 38,574 | ||||||||||||
Class Y | 9,660 | 102,692 | 2,288 | 22,492 | ||||||||||||
Class R5 | — | — | 36 | 357 | ||||||||||||
Issued in connection with acquisitions:(c) | ||||||||||||||||
Class A | — | — | 15,693,414 | 158,362,801 | ||||||||||||
Class B | — | — | 3,063,252 | 30,634,616 | ||||||||||||
Class C | — | — | 4,310,753 | 43,190,035 | ||||||||||||
Class R | — | — | 483,740 | 4,871,247 | ||||||||||||
Class S | — | — | 273,335 | 2,759,080 | ||||||||||||
Class Y | — | — | 108,312 | 1,091,637 | ||||||||||||
Class R5 | — | — | 4,482 | 45,379 | ||||||||||||
Automatic conversion of Class B shares to Class A shares: | ||||||||||||||||
Class A | 373,574 | 3,972,822 | 323,362 | 3,218,391 | ||||||||||||
Class B | (378,561 | ) | (3,972,822 | ) | (326,569 | ) | (3,218,391 | ) | ||||||||
Reacquired: | ||||||||||||||||
Class A | (4,459,184 | ) | (47,249,582 | ) | (3,734,223 | ) | (37,275,485 | ) | ||||||||
Class B | (587,622 | ) | (6,170,488 | ) | (466,665 | ) | (4,619,360 | ) | ||||||||
Class C | (1,270,437 | ) | (13,344,732 | ) | (1,142,515 | ) | (11,322,050 | ) | ||||||||
Class R | (272,058 | ) | (2,903,291 | ) | (224,326 | ) | (2,243,673 | ) | ||||||||
Class S | (21,973 | ) | (233,058 | ) | (34,186 | ) | (342,067 | ) | ||||||||
Class Y | (122,267 | ) | (1,290,699 | ) | (16,380 | ) | (162,422 | ) | ||||||||
Class R5 | (5,540 | ) | (59,424 | ) | — | — | ||||||||||
Net increase in share activity | 933,402 | $ | 10,104,241 | 23,227,129 | $ | 233,770,704 | ||||||||||
| (a) | There are entities that are record owners of more than 5% of the outstanding shares of the Fund and in the aggregate own 29% of the outstanding shares of the Fund. IDI has an agreement with these entities to sell Fund shares. The Fund, Invesco and/or Invesco affiliates may make payments to these entities, which are considered to be related to the Fund, for providing services to the Fund, Invesco and/or Invesco affiliates including but not limited to services such as securities brokerage, distribution, third party record keeping and account servicing. The Fund has no knowledge as to whether all or any portion of the shares owned of record by these entities are also owned beneficially. |
| (b) | Commencement date of June 6, 2011. |
| (c) | As of the opening of business on June 6, 2011, the Fund acquired all the net assets of Invesco Conservative Allocation Fund and Invesco Van Kampen Asset Allocation Conservative Fund (the “Target Funds”) pursuant to a plan of reorganization approved by the Trustees of the Fund on November 10, 2010 and by the shareholders of the Target Funds, respectively, on April 1, 2011. The acquisition was accomplished by a tax-free exchange of 23,937,288 shares of the Fund for 12,402,187 and 11,504,197 shares outstanding of the Target Funds, respectively, as of the close of business on June 3, 2011. Each class of the Target Funds were exchanged for the like class of shares of the Fund based on the relative net asset value of the Target Funds to the net asset value of the Fund on the close of business, June 3, 2011. The Target Funds’ net assets at that date of $122,348,797, including $7,190,686 of unrealized appreciation and $118,605,998, including $8,304,310 of unrealized appreciation, respectively, were combined with those of the Fund. The net assets of the Fund immediately before the acquisition were $76,970,136. The net assets immediately after the acquisition were $317,924,931. |
| The pro forma results of operations for the year ended December 31, 2011 assuming the reorganization had been completed on January 1, 2011, the beginning of the annual reporting period are as follows: |
Net investment income | $ | 8,687,847 | ||
Net realized/unrealized gains | 2,290,649 | |||
Change in net assets resulting from operations | $ | 10,978,496 |
| The combined investment portfolios have been managed as a single integrated portfolio since the acquisition was completed, it is not practicable to separate the amounts of revenue and earnings of the Target Funds that have been included in the Fund’s Statement of Operations since June 6, 2011. |
32 Invesco Allocation Funds
NOTE 10—Share Information—(continued)
Invesco Growth Allocation Fund
| Summary of Share Activity | ||||||||||||||||
| Years ended December 31, | ||||||||||||||||
| 2012(a) | 2011 | |||||||||||||||
| Shares | Amount | Shares | Amount | |||||||||||||
Sold: | ||||||||||||||||
Class A | 5,825,149 | $ | 67,963,557 | 5,058,931 | $ | 55,125,806 | ||||||||||
Class B | 145,644 | 1,672,825 | 247,038 | 2,949,156 | ||||||||||||
Class C | 1,450,212 | 16,663,075 | 1,362,854 | 15,177,107 | ||||||||||||
Class R | 412,240 | 4,779,583 | 426,363 | 4,685,929 | ||||||||||||
Class S | 211,191 | 2,456,852 | 349,743 | 3,892,607 | ||||||||||||
Class Y | 32,751 | 382,804 | 32,046 | 349,648 | ||||||||||||
Class R5 | 13,954 | 167,418 | — | — | ||||||||||||
Issued as reinvestment of dividends: | ||||||||||||||||
Class A | 1,286,839 | 15,261,907 | 733,010 | 7,989,669 | ||||||||||||
Class B | 154,395 | 1,815,684 | 52,064 | 579,341 | ||||||||||||
Class C | 204,610 | 2,406,212 | 58,294 | 648,661 | ||||||||||||
Class R | 45,402 | 537,103 | 26,572 | 291,560 | ||||||||||||
Class S | 73,201 | 867,434 | 70,167 | 773,073 | ||||||||||||
Class Y | 5,751 | 68,084 | 4,111 | 44,659 | ||||||||||||
Class R5 | 460 | 5,474 | 190 | 2,143 | ||||||||||||
Issued in connection with acquisitions:(b) | ||||||||||||||||
Class A | — | — | 29,215,586 | 331,306,545 | ||||||||||||
Class B | — | — | 6,166,274 | 69,168,046 | ||||||||||||
Class C | — | — | 6,307,493 | 70,764,522 | ||||||||||||
Class R | — | — | 731,849 | 8,278,649 | ||||||||||||
Class Y | — | — | 153,598 | 1,740,211 | ||||||||||||
Class R5 | — | — | 1,325 | 15,103 | ||||||||||||
Automatic conversion of Class B shares to Class A shares: | ||||||||||||||||
Class A | 1,007,572 | 11,805,258 | 789,522 | 8,697,642 | ||||||||||||
Class B | (1,019,345 | ) | (11,805,258 | ) | (800,021 | ) | (8,697,642 | ) | ||||||||
Reacquired: | ||||||||||||||||
Class A | (10,043,962 | ) | (116,949,653 | ) | (9,656,208 | ) | (106,200,604 | ) | ||||||||
Class B | (1,474,978 | ) | (16,886,129 | ) | (1,693,528 | ) | (18,370,665 | ) | ||||||||
Class C | (2,344,256 | ) | (26,933,951 | ) | (2,780,105 | ) | (30,122,748 | ) | ||||||||
Class R | (600,190 | ) | (7,062,386 | ) | (474,351 | ) | (5,204,230 | ) | ||||||||
Class S | (463,403 | ) | (5,414,407 | ) | (494,552 | ) | (5,467,978 | ) | ||||||||
Class Y | (66,207 | ) | (774,307 | ) | (63,701 | ) | (698,158 | ) | ||||||||
Class R5 | (858 | ) | (10,079 | ) | (7,555 | ) | (87,940 | ) | ||||||||
Net increase (decrease) in share activity | (5,143,828 | ) | $ | (58,982,900 | ) | 35,817,009 | $ | 407,630,112 | ||||||||
| (a) | There is an entity that is a record owner of more than 5% of the outstanding shares of the Fund and owns 9% of the outstanding shares of the Fund. IDI has an agreement with this entity to sell Fund shares. The Fund, Invesco and/or Invesco affiliates may make payments to this entity, which is considered to be related to the Fund, for providing services to the Fund, Invesco and/or Invesco affiliates including but not limited to services such as, securities brokerage, distribution, third party record keeping and account servicing. The Fund has no knowledge as to whether all or any portion of the shares owned of record by this entity are also owned beneficially. |
| (b) | As of the opening of business on June 6, 2011, the Fund acquired all the net assets of Invesco Moderate Growth Allocation Fund and Invesco Van Kampen Asset Allocation Growth Fund (the “Target Funds”) pursuant to a plan of reorganization approved by the Trustees of the Fund on November 10, 2010 and by the shareholders of the Target Funds, respectively, on April 1, 2011. The acquisition was accomplished by a tax-free exchange of 42,576,125 shares of the Fund for 27,865,526 and 16,606,461 shares outstanding of the Target Funds, respectively, as of the close of business on June 3, 2011. Each class of the Target Funds were exchanged for the like class of shares of the Fund based on the relative net asset value of the Target Funds to the net asset value of the Fund at the close of business on June 3, 2011. The Target Funds’ net assets at that date of $303,431,404, including $27,415,367 of unrealized appreciation and $177,841,672, including $24,150,979 of unrealized appreciation, respectively, were combined with those of the Fund. The net assets of the Fund immediately before the acquisition were $476,394,521. The net assets immediately after the acquisition were $957,667,597. |
| The pro forma results of operations for the year ended December 31, 2011 assuming the reorganization had been completed on January 1, 2011, the beginning of the annual reporting period are as follows: |
Net investment income | $ | 10,016,112 | ||
Net realized/unrealized gains (losses) | (20,195,677 | ) | ||
Change in net assets resulting from operations | $ | (10,179,565 | ) |
| The combined investment portfolios have been managed as a single integrated portfolio since the acquisition was completed, it is not practicable to separate the amounts of revenue and earnings of the Target Funds that have been included in the Fund’s Statement of Operations since June 6, 2011. |
33 Invesco Allocation Funds
NOTE 10—Share Information—(continued)
Invesco Moderate Allocation Fund
| Summary of Share Activity | ||||||||||||||||
| Years ended December 31, | ||||||||||||||||
| 2012(a) | 2011 | |||||||||||||||
| Shares | Amount | Shares | Amount | |||||||||||||
Sold: | ||||||||||||||||
Class A | 7,481,234 | $ | 83,710,897 | 5,261,451 | $ | 55,308,292 | ||||||||||
Class B | 317,478 | 3,502,321 | 505,266 | 5,353,606 | ||||||||||||
Class C | 1,581,941 | 17,538,747 | 1,492,000 | 15,627,390 | ||||||||||||
Class R | 413,876 | 4,581,033 | 447,188 | 4,693,422 | ||||||||||||
Class S | 257,468 | 2,878,725 | 418,454 | 4,429,517 | ||||||||||||
Class Y | 184,207 | 2,055,080 | 57,482 | 605,983 | ||||||||||||
Class R5 | 41,661 | 461,630 | 49,937 | 513,629 | ||||||||||||
Issued as reinvestment of dividends: | ||||||||||||||||
Class A | 1,701,207 | 19,121,562 | 804,669 | 8,400,853 | ||||||||||||
Class B | 211,217 | 2,367,746 | 109,777 | 1,158,448 | ||||||||||||
Class C | 317,485 | 3,555,835 | 148,973 | 1,572,150 | ||||||||||||
Class R | 62,042 | 696,735 | 38,766 | 407,314 | ||||||||||||
Class S | 124,086 | 1,393,489 | 81,871 | 856,256 | ||||||||||||
Class Y | 8,331 | 93,639 | 2,609 | 27,260 | ||||||||||||
Class R5 | 1,489 | 16,777 | 2,535 | 26,557 | ||||||||||||
Issued in connection with acquisitions:(b) | ||||||||||||||||
Class A | — | — | 16,832,386 | 180,773,828 | ||||||||||||
Class B | — | — | 3,338,667 | 35,632,035 | ||||||||||||
Class C | — | — | 2,338,455 | 24,925,814 | ||||||||||||
Class Y | — | — | 70,405 | 756,957 | ||||||||||||
Automatic conversion of Class B shares to Class A shares: | ||||||||||||||||
Class A | 1,070,655 | 12,038,704 | 859,288 | 9,061,670 | ||||||||||||
Class B | (1,078,355 | ) | (12,038,704 | ) | (865,188 | ) | (9,061,670 | ) | ||||||||
Reacquired: | ||||||||||||||||
Class A | (9,101,222 | ) | (101,700,895 | ) | (9,229,493 | ) | (97,051,753 | ) | ||||||||
Class B | (1,346,797 | ) | (14,911,496 | ) | (1,665,014 | ) | (17,406,089 | ) | ||||||||
Class C | (2,066,188 | ) | (22,825,850 | ) | (2,809,346 | ) | (29,395,065 | ) | ||||||||
Class R | (383,832 | ) | (4,296,901 | ) | (823,690 | ) | (8,588,836 | ) | ||||||||
Class S | (535,835 | ) | (5,978,541 | ) | (418,638 | ) | (4,441,814 | ) | ||||||||
Class Y | (77,617 | ) | (865,265 | ) | (55,647 | ) | (591,877 | ) | ||||||||
Class R5 | (110,631 | ) | (1,249,984 | ) | (46,682 | ) | (480,249 | ) | ||||||||
Net increase (decrease) in share activity | (926,100 | ) | $ | (9,854,716 | ) | 16,946,481 | $ | 183,113,628 | ||||||||
| (a) | There are entities that are record owners of more than 5% of the outstanding shares of the Fund and in the aggregate own 23% of the outstanding shares of the Fund. IDI has an agreement with these entities to sell Fund shares. The Fund, Invesco and/or Invesco affiliates may make payments to these entities, which are considered to be related to the Fund, for providing services to the Fund, Invesco and/or Invesco affiliates including but not limited to services such as securities brokerage, distribution, third party record keeping and account servicing. The Fund has no knowledge as to whether all or any portion of the shares owned of record by these entities are also owned beneficially. |
| (b) | As of the opening of business on June 6, 2011, the Fund acquired all the net assets of Invesco Van Kampen Asset Allocation Moderate Fund (the “Target Fund”) pursuant to a plan of reorganization approved by the Trustees of the Fund on November 10, 2010 and by the shareholders of the Target Fund on April 1, 2011. The acquisition was accomplished by a tax-free exchange of 22,579,913 shares of the Fund for 22,958,488 shares outstanding of the Target Fund as of the close of business on June 3, 2011. Each class of the Target Fund was exchanged for the like class of shares of the Fund based on the relative net asset value of the Target Fund to the net asset value of the Fund at the close of business on June 3, 2011. The Target Fund’s net assets at that date of $242,088,634, including $24,912,434 of unrealized appreciation, were combined with those of the Fund. The net assets of the Fund immediately before the acquisition were $573,476,672. The net assets immediately after the acquisition were $815,565,306. |
| The pro forma results of operations for the year ended December 31, 2011 assuming the reorganization had been completed on January 1, 2011, the beginning of the annual reporting period are as follows: |
Net investment income | $ | 15,769,020 | ||
Net realized/unrealized gains (losses) | (6,703,618 | ) | ||
Change in net assets resulting from operations | $ | 9,065,402 |
| The combined investment portfolios have been managed as a single integrated portfolio since the acquisition was completed, it is not practicable to separate the amounts of revenue and earnings of the Target Funds that have been included in the Fund’s Statement of Operations since June 6, 2011. |
34 Invesco Allocation Funds
NOTE 11—Financial Highlights
The following schedule presents financial highlights for a share of each Fund outstanding throughout the periods indicated.
Invesco Conservative Allocation Fund
| Net asset value, beginning of period | Net investment income(a) | Net gains (losses) on securities (both realized and unrealized) | Total from investment operations | Dividends from net investment income | Distributions from net realized gains | Total distributions | Net asset value, end of period | Total return(b) | Net assets, end of period (000s omitted) | Ratio of expenses to average net assets with fee waivers and/or expense reimbursements(c) | Ratio of expenses to average net assets without fee waivers and/or expense reimbursements | Ratio of net investment income to average net assets | Portfolio turnover(d) | |||||||||||||||||||||||||||||||||||||||||||
Class A |
| |||||||||||||||||||||||||||||||||||||||||||||||||||||||
Year ended 12/31/12 | $ | 9.95 | $ | 0.27 | $ | 0.85 | $ | 1.12 | $ | (0.37 | ) | $ | — | $ | (0.37 | ) | $ | 10.70 | 11.28 | % | $ | 228,512 | 0.46 | %(e) | 0.49 | %(e) | 2.55 | %(e) | 9 | % | ||||||||||||||||||||||||||
Year ended 12/31/11 | 9.94 | 0.33 | 0.04 | 0.37 | (0.36 | ) | — | (0.36 | ) | 9.95 | 3.77 | 201,299 | 0.39 | 0.53 | 3.26 | 27 | ||||||||||||||||||||||||||||||||||||||||
Year ended 12/31/10 | 9.35 | 0.29 | 0.58 | 0.87 | (0.28 | ) | — | (0.28 | ) | 9.94 | 9.33 | 46,954 | 0.39 | 0.73 | 3.04 | 70 | ||||||||||||||||||||||||||||||||||||||||
Year ended 12/31/09 | 8.35 | 0.32 | 1.12 | 1.44 | (0.44 | ) | — | (0.44 | ) | 9.35 | 17.28 | 41,152 | 0.39 | 0.71 | 3.66 | 26 | ||||||||||||||||||||||||||||||||||||||||
Year ended 12/31/08 | 11.24 | 0.46 | (2.84 | ) | (2.38 | ) | (0.40 | ) | (0.11 | ) | (0.51 | ) | 8.35 | (21.20 | ) | 58,819 | 0.39 | 0.63 | 4.45 | 28 | ||||||||||||||||||||||||||||||||||||
Class B |
| |||||||||||||||||||||||||||||||||||||||||||||||||||||||
Year ended 12/31/12 | 9.87 | 0.19 | 0.83 | 1.02 | (0.29 | ) | — | (0.29 | ) | 10.60 | 10.33 | 31,090 | 1.21 | (e) | 1.24 | (e) | 1.80 | (e) | 9 | |||||||||||||||||||||||||||||||||||||
Year ended 12/31/11 | 9.88 | 0.25 | 0.05 | 0.30 | (0.31 | ) | — | (0.31 | ) | 9.87 | 3.06 | 34,832 | 1.14 | 1.28 | 2.51 | 27 | ||||||||||||||||||||||||||||||||||||||||
Year ended 12/31/10 | 9.30 | 0.22 | 0.56 | 0.78 | (0.20 | ) | — | (0.20 | ) | 9.88 | 8.45 | 9,032 | 1.14 | 1.48 | 2.29 | 70 | ||||||||||||||||||||||||||||||||||||||||
Year ended 12/31/09 | 8.31 | 0.26 | 1.11 | 1.37 | (0.38 | ) | — | (0.38 | ) | 9.30 | 16.46 | 9,129 | 1.14 | 1.46 | 2.91 | 26 | ||||||||||||||||||||||||||||||||||||||||
Year ended 12/31/08 | 11.16 | 0.38 | (2.80 | ) | (2.42 | ) | (0.32 | ) | (0.11 | ) | (0.43 | ) | 8.31 | (21.69 | ) | 8,897 | 1.14 | 1.38 | 3.70 | 28 | ||||||||||||||||||||||||||||||||||||
Class C |
| |||||||||||||||||||||||||||||||||||||||||||||||||||||||
Year ended 12/31/12 | 9.89 | 0.19 | 0.84 | 1.03 | (0.29 | ) | – | (0.29 | ) | 10.63 | 10.41 | 62,919 | 1.21 | (e) | 1.24 | (e) | 1.80 | (e) | 9 | |||||||||||||||||||||||||||||||||||||
Year ended 12/31/11 | 9.90 | 0.25 | 0.05 | 0.30 | (0.31 | ) | — | (0.31 | ) | 9.89 | 3.05 | 56,322 | 1.14 | 1.28 | 2.51 | 27 | ||||||||||||||||||||||||||||||||||||||||
Year ended 12/31/10 | 9.32 | 0.22 | 0.56 | 0.78 | (0.20 | ) | — | (0.20 | ) | 9.90 | 8.43 | 14,494 | 1.14 | 1.48 | 2.29 | 70 | ||||||||||||||||||||||||||||||||||||||||
Year ended 12/31/09 | 8.33 | 0.26 | 1.11 | 1.37 | (0.38 | ) | — | (0.38 | ) | 9.32 | 16.42 | 14,731 | 1.14 | 1.46 | 2.91 | 26 | ||||||||||||||||||||||||||||||||||||||||
Year ended 12/31/08 | 11.17 | 0.37 | (2.78 | ) | (2.41 | ) | (0.32 | ) | (0.11 | ) | (0.43 | ) | 8.33 | (21.57 | ) | 13,118 | 1.14 | 1.38 | 3.70 | 28 | ||||||||||||||||||||||||||||||||||||
Class R |
| |||||||||||||||||||||||||||||||||||||||||||||||||||||||
Year ended 12/31/12 | 9.93 | 0.24 | 0.84 | 1.08 | (0.34 | ) | — | (0.34 | ) | 10.67 | 10.92 | 8,845 | 0.71 | (e) | 0.74 | (e) | 2.30 | (e) | 9 | |||||||||||||||||||||||||||||||||||||
Year ended 12/31/11 | 9.92 | 0.30 | 0.05 | 0.35 | (0.34 | ) | — | (0.34 | ) | 9.93 | 3.60 | 8,197 | 0.64 | 0.78 | 3.01 | 27 | ||||||||||||||||||||||||||||||||||||||||
Year ended 12/31/10 | 9.34 | 0.27 | 0.56 | 0.83 | (0.25 | ) | — | (0.25 | ) | 9.92 | 8.96 | 3,241 | 0.64 | 0.98 | 2.79 | 70 | ||||||||||||||||||||||||||||||||||||||||
Year ended 12/31/09 | 8.34 | 0.30 | 1.12 | 1.42 | (0.42 | ) | — | (0.42 | ) | 9.34 | 17.05 | 2,580 | 0.64 | 0.96 | 3.41 | 26 | ||||||||||||||||||||||||||||||||||||||||
Year ended 12/31/08 | 11.21 | 0.42 | (2.81 | ) | (2.39 | ) | (0.37 | ) | (0.11 | ) | (0.48 | ) | 8.34 | (21.31 | ) | 1,552 | 0.64 | 0.88 | 4.20 | 28 | ||||||||||||||||||||||||||||||||||||
Class S |
| |||||||||||||||||||||||||||||||||||||||||||||||||||||||
Year ended 12/31/12 | 9.96 | 0.28 | 0.84 | 1.12 | (0.38 | ) | — | (0.38 | ) | 10.70 | 11.27 | 2,864 | 0.36 | (e) | 0.39 | (e) | 2.65 | (e) | 9 | |||||||||||||||||||||||||||||||||||||
Year ended 12/31/11(f) | 10.09 | 0.19 | (0.17 | ) | 0.02 | (0.15 | ) | — | (0.15 | ) | 9.96 | 0.24 | 2,560 | 0.29 | (g) | 0.43 | (g) | 3.36 | (g) | 27 | ||||||||||||||||||||||||||||||||||||
Class Y |
| |||||||||||||||||||||||||||||||||||||||||||||||||||||||
Year ended 12/31/12 | 9.93 | 0.30 | 0.84 | 1.14 | (0.40 | ) | — | (0.40 | ) | 10.67 | 11.46 | 2,987 | 0.21 | (e) | 0.24 | (e) | 2.80 | (e) | 9 | |||||||||||||||||||||||||||||||||||||
Year ended 12/31/11 | 9.92 | 0.35 | 0.04 | 0.39 | (0.38 | ) | — | (0.38 | ) | 9.93 | 3.94 | 1,173 | 0.14 | 0.28 | 3.51 | 27 | ||||||||||||||||||||||||||||||||||||||||
Year ended 12/31/10 | 9.34 | 0.32 | 0.56 | 0.88 | (0.30 | ) | — | (0.30 | ) | 9.92 | 9.49 | 41 | 0.14 | 0.48 | 3.29 | 70 | ||||||||||||||||||||||||||||||||||||||||
Year ended 12/31/09 | 8.35 | 0.35 | 1.11 | 1.46 | (0.47 | ) | — | (0.47 | ) | 9.34 | 17.54 | 70 | 0.14 | 0.46 | 3.91 | 26 | ||||||||||||||||||||||||||||||||||||||||
Year ended 12/31/08(f) | 9.59 | 0.10 | (0.83 | ) | (0.73 | ) | (0.40 | ) | (0.11 | ) | (0.51 | ) | 8.35 | (7.56 | ) | 31 | 0.14 | (g) | 0.42 | (g) | 4.70 | (g) | 28 | |||||||||||||||||||||||||||||||||
Class R5 |
| |||||||||||||||||||||||||||||||||||||||||||||||||||||||
Year ended 12/31/12 | 9.98 | 0.30 | 0.85 | 1.15 | (0.40 | ) | — | (0.40 | ) | 10.73 | 11.56 | 23 | 0.17 | (e) | 0.21 | (e) | 2.83 | (e) | 9 | |||||||||||||||||||||||||||||||||||||
Year ended 12/31/11 | 9.96 | 0.35 | 0.05 | 0.40 | (0.38 | ) | — | (0.38 | ) | 9.98 | 4.03 | 77 | 0.14 | 0.21 | 3.51 | 27 | ||||||||||||||||||||||||||||||||||||||||
Year ended 12/31/10 | 9.37 | 0.32 | 0.57 | 0.89 | (0.30 | ) | — | (0.30 | ) | 9.96 | 9.57 | 32 | 0.14 | 0.36 | 3.29 | 70 | ||||||||||||||||||||||||||||||||||||||||
Year ended 12/31/09 | 8.38 | 0.35 | 1.11 | 1.46 | (0.47 | ) | — | (0.47 | ) | 9.37 | 17.48 | 29 | 0.14 | 0.32 | 3.91 | 26 | ||||||||||||||||||||||||||||||||||||||||
Year ended 12/31/08 | 11.27 | 0.48 | (2.83 | ) | (2.35 | ) | (0.43 | ) | (0.11 | ) | (0.54 | ) | 8.38 | (20.88 | ) | 25 | 0.14 | 0.27 | 4.70 | 28 | ||||||||||||||||||||||||||||||||||||
| (a) | Calculated using average shares outstanding. |
| (b) | Includes adjustments in accordance with accounting principles generally accepted in the United States of America and as such, the net asset value for financial reporting purposes and the returns based upon those net asset values may differ from the net asset value and returns for shareholder transactions. Does not include sales charges and is not annualized for periods less than one year, if applicable. |
| (c) | In addition to the fees and expenses which the Fund bears directly; the Fund indirectly bears a pro rata share of the fees and expenses of the underlying funds in which the Fund invests. Because the underlying funds have varied expenses and fee levels and the Fund may own different proportions at different times, the amount of fees and expenses incurred indirectly by the Fund will vary. Estimated underlying fund expenses are not expenses that are incurred directly by your Fund. They are expenses that are incurred directly by the underlying funds and are deducted from the value of the funds your Fund invests in. The effect of the estimated underlying fund expenses that you bear indirectly is included in your Fund’s total return. Estimated acquired fund fees from underlying funds were 0.64%, 0.64%, 0.64%, 0.67% and 0.69% for the years ended December 31, 2012, December 31, 2011, December 31, 2010, December 31, 2009 and December 31, 2008, respectively. |
| (d) | Portfolio turnover is calculated at the fund level and is not annualized for periods less than one year, if applicable. For the period ending December 31, 2011, the portfolio turnover calculation excludes the value of securities purchased of $226,619,088 and sold of $49,277,466 in the effort to realign the Fund’s portfolio holdings after the reorganization of Invesco Conservative Allocation Fund and Invesco Van Kampen Asset Allocation Conservative Fund into the Fund. |
| (e) | Ratios are annualized and based on average daily net assets (000’s omitted) of $215,079, $33,593, $60,530, $9,114, $2,746, $2,283 and $61 for Class A, Class B, Class C, Class R, Class S, Class Y and Class R5 shares, respectively. |
| (f) | Commencement date of June 6, 2011 for Class S shares and October 3, 2008 for Class Y shares. |
| (g) | Annualized. |
35 Invesco Allocation Funds
NOTE 11—Financial Highlights—(continued)
Invesco Growth Allocation Fund
| Net asset value, beginning of period | Net investment income(a) | Net gains (losses) on securities (both realized and unrealized) | Total from investment operations | Dividends from net investment income | Distributions from net realized gains | Total distributions | Net asset value, end of period | Total return(b) | Net assets, end of period (000s omitted) | Ratio of expenses to average net assets with fee waivers and/or expense reimbursements(c) | Ratio of expenses to average net assets without fee waivers and/or expense reimbursements | Ratio of net investment income to average net assets | Portfolio turnover(d) | |||||||||||||||||||||||||||||||||||||||||||
Class A |
| |||||||||||||||||||||||||||||||||||||||||||||||||||||||
Year ended 12/31/12 | $ | 10.73 | $ | 0.18 | $ | 1.39 | $ | 1.57 | $ | (0.32 | ) | $ | — | $ | (0.32 | ) | $ | 11.98 | 14.68 | % | $ | 597,879 | 0.46 | %(e) | 0.55 | %(e) | 1.55 | %(e) | 10 | % | ||||||||||||||||||||||||||
Year ended 12/31/11 | 11.10 | 0.17 | (0.29 | ) | (0.12 | ) | (0.25 | ) | — | (0.25 | ) | 10.73 | (1.13 | ) | 556,456 | 0.40 | 0.58 | 1.58 | 28 | |||||||||||||||||||||||||||||||||||||
Year ended 12/31/10 | 10.02 | 0.17 | 1.12 | 1.29 | (0.21 | ) | — | (0.21 | ) | 11.10 | 12.91 | 285,192 | 0.46 | 0.61 | 1.69 | 73 | ||||||||||||||||||||||||||||||||||||||||
Year ended 12/31/09 | 7.76 | 0.18 | 2.24 | 2.42 | (0.16 | ) | — | (0.16 | ) | 10.02 | 31.22 | 269,062 | 0.46 | 0.68 | 2.13 | 28 | ||||||||||||||||||||||||||||||||||||||||
Year ended 12/31/08 | 14.21 | 0.14 | (5.91 | ) | (5.77 | ) | (0.01 | ) | (0.67 | ) | (0.68 | ) | 7.76 | (40.62 | ) | 258,136 | 0.46 | 0.59 | 1.16 | 16 | ||||||||||||||||||||||||||||||||||||
Class B |
| |||||||||||||||||||||||||||||||||||||||||||||||||||||||
Year ended 12/31/12 | 10.64 | 0.09 | 1.37 | 1.46 | (0.23 | ) | — | (0.23 | ) | 11.87 | 13.73 | 96,852 | 1.21 | (e) | 1.30 | (e) | 0.80 | (e) | 10 | |||||||||||||||||||||||||||||||||||||
Year ended 12/31/11 | 10.93 | 0.09 | (0.28 | ) | (0.19 | ) | (0.10 | ) | — | (0.10 | ) | 10.64 | (1.79 | ) | 110,133 | 1.15 | 1.33 | 0.83 | 28 | |||||||||||||||||||||||||||||||||||||
Year ended 12/31/10 | 9.88 | 0.10 | 1.09 | 1.19 | (0.14 | ) | — | (0.14 | ) | 10.93 | 12.02 | 69,723 | 1.21 | 1.36 | 0.94 | 73 | ||||||||||||||||||||||||||||||||||||||||
Year ended 12/31/09 | 7.64 | 0.12 | 2.19 | 2.31 | (0.07 | ) | — | (0.07 | ) | 9.88 | 30.20 | 73,887 | 1.21 | 1.43 | 1.38 | 28 | ||||||||||||||||||||||||||||||||||||||||
Year ended 12/31/08 | 14.10 | 0.05 | (5.83 | ) | (5.78 | ) | (0.01 | ) | (0.67 | ) | (0.68 | ) | 7.64 | (41.00 | ) | 65,395 | 1.21 | 1.34 | 0.41 | 16 | ||||||||||||||||||||||||||||||||||||
Class C |
| |||||||||||||||||||||||||||||||||||||||||||||||||||||||
Year ended 12/31/12 | 10.64 | 0.09 | 1.37 | 1.46 | (0.23 | ) | — | (0.23 | ) | 11.87 | 13.73 | 131,069 | 1.21 | (e) | 1.30 | (e) | 0.80 | (e) | 10 | |||||||||||||||||||||||||||||||||||||
Year ended 12/31/11 | 10.93 | 0.09 | (0.28 | ) | (0.19 | ) | (0.10 | ) | — | (0.10 | ) | 10.64 | (1.79 | ) | 124,789 | 1.15 | 1.33 | 0.83 | 28 | |||||||||||||||||||||||||||||||||||||
Year ended 12/31/10 | 9.88 | 0.10 | 1.09 | 1.19 | (0.14 | ) | — | (0.14 | ) | 10.93 | 12.02 | 74,096 | 1.21 | 1.36 | 0.94 | 73 | ||||||||||||||||||||||||||||||||||||||||
Year ended 12/31/09 | 7.64 | 0.12 | 2.19 | 2.31 | (0.07 | ) | — | (0.07 | ) | 9.88 | 30.20 | 72,462 | 1.21 | 1.43 | 1.38 | 28 | ||||||||||||||||||||||||||||||||||||||||
Year ended 12/31/08 | 14.10 | 0.05 | (5.83 | ) | (5.78 | ) | (0.01 | ) | (0.67 | ) | (0.68 | ) | 7.64 | (41.00 | ) | 59,190 | 1.21 | 1.34 | 0.41 | 16 | ||||||||||||||||||||||||||||||||||||
Class R |
| |||||||||||||||||||||||||||||||||||||||||||||||||||||||
Year ended 12/31/12 | 10.71 | 0.15 | 1.38 | 1.53 | (0.29 | ) | — | (0.29 | ) | 11.95 | 14.32 | 22,751 | 0.71 | (e) | 0.80 | (e) | 1.30 | (e) | 10 | |||||||||||||||||||||||||||||||||||||
Year ended 12/31/11 | 11.05 | 0.15 | (0.29 | ) | (0.14 | ) | (0.20 | ) | — | (0.20 | ) | 10.71 | (1.32 | ) | 21,917 | 0.65 | 0.83 | 1.33 | 28 | |||||||||||||||||||||||||||||||||||||
Year ended 12/31/10 | 9.98 | 0.15 | 1.11 | 1.26 | (0.19 | ) | — | (0.19 | ) | 11.05 | 12.61 | 14,761 | 0.71 | 0.86 | 1.44 | 73 | ||||||||||||||||||||||||||||||||||||||||
Year ended 12/31/09 | 7.73 | 0.16 | 2.22 | 2.38 | (0.13 | ) | — | (0.13 | ) | 9.98 | 30.81 | 13,034 | 0.71 | 0.93 | 1.88 | 28 | ||||||||||||||||||||||||||||||||||||||||
Year ended 12/31/08 | 14.18 | 0.11 | (5.88 | ) | (5.77 | ) | (0.01 | ) | (0.67 | ) | (0.68 | ) | 7.73 | (40.70 | ) | 8,386 | 0.71 | 0.84 | 0.91 | 16 | ||||||||||||||||||||||||||||||||||||
Class S |
| |||||||||||||||||||||||||||||||||||||||||||||||||||||||
Year ended 12/31/12 | 10.73 | 0.19 | 1.38 | 1.57 | (0.33 | ) | — | (0.33 | ) | 11.97 | 14.70 | 31,803 | 0.36 | (e) | 0.45 | (e) | 1.65 | (e) | 10 | |||||||||||||||||||||||||||||||||||||
Year ended 12/31/11 | 11.10 | 0.19 | (0.29 | ) | (0.10 | ) | (0.27 | ) | — | (0.27 | ) | 10.73 | (0.96 | ) | 30,420 | 0.30 | 0.48 | 1.68 | 28 | |||||||||||||||||||||||||||||||||||||
Year ended 12/31/10 | 10.02 | 0.18 | 1.12 | 1.30 | (0.22 | ) | — | (0.22 | ) | 11.10 | 13.02 | 32,295 | 0.36 | 0.51 | 1.79 | 73 | ||||||||||||||||||||||||||||||||||||||||
Year ended 12/31/09(f) | 9.61 | 0.06 | 0.51 | 0.57 | (0.16 | ) | — | (0.16 | ) | 10.02 | 6.00 | 15,961 | 0.36 | (g) | 0.47 | (g) | 2.23 | (g) | 28 | |||||||||||||||||||||||||||||||||||||
Class Y |
| |||||||||||||||||||||||||||||||||||||||||||||||||||||||
Year ended 12/31/12 | 10.72 | 0.21 | 1.38 | 1.59 | (0.35 | ) | — | (0.35 | ) | 11.96 | 14.88 | 2,553 | 0.21 | (e) | 0.30 | (e) | 1.80 | (e) | 10 | |||||||||||||||||||||||||||||||||||||
Year ended 12/31/11 | 11.10 | 0.20 | (0.28 | ) | (0.08 | ) | (0.30 | ) | — | (0.30 | ) | 10.72 | (0.79 | ) | 2,585 | 0.15 | 0.33 | 1.83 | 28 | |||||||||||||||||||||||||||||||||||||
Year ended 12/31/10 | 10.02 | 0.20 | 1.12 | 1.32 | (0.24 | ) | — | (0.24 | ) | 11.10 | 13.17 | 1,278 | 0.21 | 0.36 | 1.94 | 73 | ||||||||||||||||||||||||||||||||||||||||
Year ended 12/31/09 | 7.77 | 0.21 | 2.23 | 2.44 | (0.19 | ) | — | (0.19 | ) | 10.02 | 31.50 | 1,386 | 0.21 | 0.43 | 2.38 | 28 | ||||||||||||||||||||||||||||||||||||||||
Year ended 12/31/08(f) | 10.26 | 0.03 | (1.84 | ) | (1.81 | ) | (0.01 | ) | (0.67 | ) | (0.68 | ) | 7.77 | (17.65 | ) | 658 | 0.21 | (g) | 0.46 | (g) | 1.42 | (g) | 16 | |||||||||||||||||||||||||||||||||
Class R5 |
| |||||||||||||||||||||||||||||||||||||||||||||||||||||||
Year ended 12/31/12 | 10.78 | 0.23 | 1.38 | 1.61 | (0.37 | ) | — | (0.37 | ) | 12.02 | 14.95 | 211 | 0.15 | (e) | 0.16 | (e) | 1.86 | (e) | 10 | |||||||||||||||||||||||||||||||||||||
Year ended 12/31/11 | 11.17 | 0.21 | (0.29 | ) | (0.08 | ) | (0.31 | ) | — | (0.31 | ) | 10.78 | (0.78 | ) | 43 | 0.13 | 0.13 | 1.85 | 28 | |||||||||||||||||||||||||||||||||||||
Year ended 12/31/10 | 10.08 | 0.21 | 1.12 | 1.33 | (0.24 | ) | — | (0.24 | ) | 11.17 | 13.24 | 112 | 0.13 | 0.13 | 2.02 | 73 | ||||||||||||||||||||||||||||||||||||||||
Year ended 12/31/09 | 7.82 | 0.21 | 2.26 | 2.47 | (0.21 | ) | — | (0.21 | ) | 10.08 | 31.59 | 100 | 0.16 | 0.16 | 2.43 | 28 | ||||||||||||||||||||||||||||||||||||||||
Year ended 12/31/08 | 14.25 | 0.18 | (5.93 | ) | (5.75 | ) | (0.01 | ) | (0.67 | ) | (0.68 | ) | 7.82 | (40.36 | ) | 63 | 0.12 | 0.12 | 1.50 | 16 | ||||||||||||||||||||||||||||||||||||
| (a) | Calculated using average shares outstanding. |
| (b) | Includes adjustments in accordance with accounting principles generally accepted in the United States of America and as such, the net asset value for financial reporting purposes and the returns based upon those net asset values may differ from the net asset value and returns for shareholder transactions. Does not include sales charges and is not annualized for periods less than one year, if applicable. |
| (c) | In addition to the fees and expenses which the Fund bears directly; the Fund indirectly bears a pro rata share of the fees and expenses of the underlying funds in which the Fund invests. Because the underlying funds have varied expenses and fee levels and the Fund may own different proportions at different times, the amount of fees and expenses incurred indirectly by the Fund will vary. Estimated underlying fund expenses are not expenses that are incurred directly by your Fund. They are expenses that are incurred directly by the underlying funds and are deducted from the value of the funds your Fund invests in. The effect of the estimated underlying fund expenses that you bear indirectly is included in your Fund’s total return. Estimated acquired fund fees from underlying funds were 0.78%, 0.78%, 0.77%, 0.82% and 0.80% for the years ended December 31, 2012, December 31, 2011, December 31, 2010, December 31, 2009 and December 31, 2008, respectively. |
| (d) | Portfolio turnover is calculated at the fund level and is not annualized for periods less than one year, if applicable. For the period ending December 31, 2011, the portfolio turnover calculation excludes the value of securities purchased of $430,512,343 and sold of $117,636,196 in the effort to realign the Fund’s portfolio holdings after the reorganization of Invesco Moderate Growth Fund and Invesco Van Kampen Asset Allocation Growth Fund into the Fund. |
| (e) | Ratios are annualized and based on average daily net assets (000’s omitted) of $582,269, $105,816, $129,509, $23,549, $31,585, $2,564 and $80 for Class A, Class B, Class C, Class R, Class S, Class Y and Class R5 shares, respectively. |
| (f) | Commencement date of September 25, 2009 for Class S shares and October 3, 2008 for Class Y shares. |
| (g) | Annualized. |
36 Invesco Allocation Funds
NOTE 11—Financial Highlights—(continued)
Invesco Moderate Allocation Fund
| Net asset value, beginning of period | Net investment income(a) | Net gains (losses) on securities (both realized and unrealized) | Total from investment operations | Dividends from net investment income | Distributions from net realized gains | Total distributions | Net asset value, end of period | Total return(b) | Net assets, end of period (000s omitted) | Ratio of expenses to average net assets with fee waivers and/or expense reimbursements(c) | Ratio of expenses to average net assets without fee waivers and/or expense reimbursements | Ratio of net investment income to average net assets | Portfolio turnover(d) | |||||||||||||||||||||||||||||||||||||||||||
Class A |
| |||||||||||||||||||||||||||||||||||||||||||||||||||||||
Year ended 12/31/12 | $ | 10.39 | $ | 0.24 | $ | 1.13 | $ | 1.37 | $ | (0.44 | ) | $ | — | $ | (0.44 | ) | $ | 11.32 | 13.18 | % | $ | 537,812 | 0.43 | %(e) | 0.48 | %(e) | 2.10 | %(e) | 11 | % | ||||||||||||||||||||||||||
Year ended 12/31/11 | 10.50 | 0.24 | (0.11 | ) | 0.13 | (0.24 | ) | — | (0.24 | ) | 10.39 | 1.26 | 481,483 | 0.37 | 0.51 | 2.30 | 26 | |||||||||||||||||||||||||||||||||||||||
Year ended 12/31/10 | 9.63 | 0.29 | 0.86 | 1.15 | (0.28 | ) | — | (0.28 | ) | 10.50 | 12.03 | 334,067 | 0.37 | 0.52 | 2.87 | 69 | ||||||||||||||||||||||||||||||||||||||||
Year ended 12/31/09 | 7.87 | 0.31 | 1.80 | 2.11 | (0.35 | ) | — | (0.35 | ) | 9.63 | 26.86 | 312,736 | 0.37 | 0.57 | 3.64 | 21 | ||||||||||||||||||||||||||||||||||||||||
Year ended 12/31/08 | 12.35 | 0.40 | (4.25 | ) | (3.85 | ) | (0.30 | ) | (0.33 | ) | (0.63 | ) | 7.87 | (31.11 | ) | 294,668 | 0.37 | 0.52 | 3.76 | 13 | ||||||||||||||||||||||||||||||||||||
Class B |
| |||||||||||||||||||||||||||||||||||||||||||||||||||||||
Year ended 12/31/12 | 10.35 | 0.15 | 1.13 | 1.28 | (0.35 | ) | — | (0.35 | ) | 11.28 | 12.37 | 80,029 | 1.18 | (e) | 1.23 | (e) | 1.35 | (e) | 11 | |||||||||||||||||||||||||||||||||||||
Year ended 12/31/11 | 10.46 | 0.16 | (0.10 | ) | 0.06 | (0.17 | ) | — | (0.17 | ) | 10.35 | 0.52 | 93,053 | 1.12 | 1.26 | 1.55 | 26 | |||||||||||||||||||||||||||||||||||||||
Year ended 12/31/10 | 9.59 | 0.21 | 0.87 | 1.08 | (0.21 | ) | — | (0.21 | ) | 10.46 | 11.25 | 79,150 | 1.12 | 1.27 | 2.12 | 69 | ||||||||||||||||||||||||||||||||||||||||
Year ended 12/31/09 | 7.85 | 0.25 | 1.77 | 2.02 | (0.28 | ) | — | (0.28 | ) | 9.59 | 25.80 | 85,714 | 1.12 | 1.32 | 2.89 | 21 | ||||||||||||||||||||||||||||||||||||||||
Year ended 12/31/08 | 12.27 | 0.32 | (4.20 | ) | (3.88 | ) | (0.21 | ) | (0.33 | ) | (0.54 | ) | 7.85 | (31.57 | ) | 85,928 | 1.12 | 1.27 | 3.01 | 13 | ||||||||||||||||||||||||||||||||||||
Class C |
| |||||||||||||||||||||||||||||||||||||||||||||||||||||||
Year ended 12/31/12 | 10.34 | 0.15 | 1.13 | 1.28 | (0.35 | ) | — | (0.35 | ) | 11.27 | 12.38 | 123,505 | 1.18 | (e) | 1.23 | (e) | 1.35 | (e) | 11 | |||||||||||||||||||||||||||||||||||||
Year ended 12/31/11 | 10.46 | 0.16 | (0.11 | ) | 0.05 | (0.17 | ) | — | (0.17 | ) | 10.34 | 0.42 | 115,040 | 1.12 | 1.26 | 1.55 | 26 | |||||||||||||||||||||||||||||||||||||||
Year ended 12/31/10 | 9.59 | 0.21 | 0.87 | 1.08 | (0.21 | ) | — | (0.21 | ) | 10.46 | 11.26 | 104,060 | 1.12 | 1.27 | 2.12 | 69 | ||||||||||||||||||||||||||||||||||||||||
Year ended 12/31/09 | 7.85 | 0.25 | 1.77 | 2.02 | (0.28 | ) | — | (0.28 | ) | 9.59 | 25.80 | 99,807 | 1.12 | 1.32 | 2.89 | 21 | ||||||||||||||||||||||||||||||||||||||||
Year ended 12/31/08 | 12.27 | 0.32 | (4.20 | ) | (3.88 | ) | (0.21 | ) | (0.33 | ) | (0.54 | ) | 7.85 | (31.57 | ) | 88,392 | 1.12 | 1.27 | 3.01 | 13 | ||||||||||||||||||||||||||||||||||||
Class R |
| |||||||||||||||||||||||||||||||||||||||||||||||||||||||
Year ended 12/31/12 | 10.38 | 0.21 | 1.13 | 1.34 | (0.41 | ) | — | (0.41 | ) | 11.31 | 12.91 | 20,557 | 0.68 | (e) | 0.73 | (e) | 1.85 | (e) | 11 | |||||||||||||||||||||||||||||||||||||
Year ended 12/31/11 | 10.49 | 0.22 | (0.11 | ) | 0.11 | (0.22 | ) | — | (0.22 | ) | 10.38 | 1.01 | 17,906 | 0.62 | 0.76 | 2.05 | 26 | |||||||||||||||||||||||||||||||||||||||
Year ended 12/31/10 | 9.62 | 0.26 | 0.87 | 1.13 | (0.26 | ) | — | (0.26 | ) | 10.49 | 11.77 | 21,639 | 0.62 | 0.77 | 2.62 | 69 | ||||||||||||||||||||||||||||||||||||||||
Year ended 12/31/09 | 7.87 | 0.29 | 1.79 | 2.08 | (0.33 | ) | — | (0.33 | ) | 9.62 | 26.44 | 18,886 | 0.62 | 0.82 | 3.39 | 21 | ||||||||||||||||||||||||||||||||||||||||
Year ended 12/31/08 | 12.33 | 0.37 | (4.23 | ) | (3.86 | ) | (0.27 | ) | (0.33 | ) | (0.60 | ) | 7.87 | (31.24 | ) | 14,176 | 0.62 | 0.77 | 3.51 | 13 | ||||||||||||||||||||||||||||||||||||
Class S |
| |||||||||||||||||||||||||||||||||||||||||||||||||||||||
Year ended 12/31/12 | 10.38 | 0.25 | 1.13 | 1.38 | (0.45 | ) | — | (0.45 | ) | 11.31 | 13.31 | 36,651 | 0.33 | (e) | 0.38 | (e) | 2.20 | (e) | 11 | |||||||||||||||||||||||||||||||||||||
Year ended 12/31/11 | 10.49 | 0.25 | (0.11 | ) | 0.14 | (0.25 | ) | — | (0.25 | ) | 10.38 | 1.35 | 35,229 | 0.27 | 0.41 | 2.40 | 26 | |||||||||||||||||||||||||||||||||||||||
Year ended 12/31/10 | 9.62 | 0.30 | 0.86 | 1.16 | (0.29 | ) | — | (0.29 | ) | 10.49 | 12.15 | 34,746 | 0.27 | 0.42 | 2.97 | 69 | ||||||||||||||||||||||||||||||||||||||||
Year ended 12/31/09(f) | 9.48 | 0.10 | 0.39 | 0.49 | (0.35 | ) | — | (0.35 | ) | 9.62 | 5.23 | 18,006 | 0.27 | (g) | 0.40 | (g) | 3.74 | (g) | 21 | |||||||||||||||||||||||||||||||||||||
Class Y |
| |||||||||||||||||||||||||||||||||||||||||||||||||||||||
Year ended 12/31/12 | 10.39 | 0.27 | 1.13 | 1.40 | (0.47 | ) | — | (0.47 | ) | 11.32 | 13.46 | 3,319 | 0.18 | (e) | 0.23 | (e) | 2.35 | (e) | 11 | |||||||||||||||||||||||||||||||||||||
Year ended 12/31/11 | 10.50 | 0.27 | (0.11 | ) | 0.16 | (0.27 | ) | — | (0.27 | ) | 10.39 | 1.49 | 1,851 | 0.12 | 0.26 | 2.55 | 26 | |||||||||||||||||||||||||||||||||||||||
Year ended 12/31/10 | 9.62 | 0.31 | 0.88 | 1.19 | (0.31 | ) | — | (0.31 | ) | 10.50 | 12.42 | 1,085 | 0.12 | 0.27 | 3.12 | 69 | ||||||||||||||||||||||||||||||||||||||||
Year ended 12/31/09 | 7.87 | 0.34 | 1.78 | 2.12 | (0.37 | ) | — | (0.37 | ) | 9.62 | 27.02 | 1,131 | 0.12 | 0.32 | 3.89 | 21 | ||||||||||||||||||||||||||||||||||||||||
Year ended 12/31/08(f) | 9.77 | 0.08 | (1.34 | ) | (1.26 | ) | (0.31 | ) | (0.33 | ) | (0.64 | ) | 7.87 | (12.84 | ) | 680 | 0.12 | (g) | 0.33 | (g) | 4.01 | (g) | 13 | |||||||||||||||||||||||||||||||||
Class R5 |
| |||||||||||||||||||||||||||||||||||||||||||||||||||||||
Year ended 12/31/12 | 10.42 | 0.27 | 1.13 | 1.40 | (0.47 | ) | — | (0.47 | ) | 11.35 | 13.49 | 444 | 0.13 | (e) | 0.13 | (e) | 2.40 | (e) | 11 | |||||||||||||||||||||||||||||||||||||
Year ended 12/31/11 | 10.53 | 0.27 | (0.11 | ) | 0.16 | (0.27 | ) | — | (0.27 | ) | 10.42 | 1.50 | 1,110 | 0.10 | 0.10 | 2.57 | 26 | |||||||||||||||||||||||||||||||||||||||
Year ended 12/31/10 | 9.66 | 0.32 | 0.86 | 1.18 | (0.31 | ) | — | (0.31 | ) | 10.53 | 12.28 | 1,061 | 0.11 | 0.11 | 3.13 | 69 | ||||||||||||||||||||||||||||||||||||||||
Year ended 12/31/09 | 7.89 | 0.34 | 1.80 | 2.14 | (0.37 | ) | — | (0.37 | ) | 9.66 | 27.21 | 11 | 0.13 | 0.19 | 3.88 | 21 | ||||||||||||||||||||||||||||||||||||||||
Year ended 12/31/08 | 12.39 | 0.43 | (4.27 | ) | (3.84 | ) | (0.33 | ) | (0.33 | ) | (0.66 | ) | 7.89 | (30.92 | ) | 8 | 0.13 | 0.17 | 4.00 | 13 | ||||||||||||||||||||||||||||||||||||
| (a) | Calculated using average shares outstanding. |
| (b) | Includes adjustments in accordance with accounting principles generally accepted in the United States of America and as such, the net asset value for financial reporting purposes and the returns based upon those net asset values may differ from the net asset value and returns for shareholder transactions. Does not include sales charges and is not annualized for periods less than one year, if applicable. |
| (c) | In addition to the fees and expenses which the Fund bears directly; the Fund indirectly bears a pro rata share of the fees and expenses of the underlying funds in which the Fund invests. Because the underlying funds have varied expenses and fee levels and the Fund may own different proportions at different times, the amount of fees and expenses incurred indirectly by the Fund will vary. Estimated underlying fund expenses are not expenses that are incurred directly by your Fund. They are expenses that are incurred directly by the underlying funds and are deducted from the value of the funds your Fund invests in. The effect of the estimated underlying fund expenses that you bear indirectly is included in your Fund’s total return. Estimated acquired fund fees from underlying funds were 0.72%, 0.72%, 0.71%, 0.72% and 0.75% for the years ended December 31, 2012, December 31, 2011, December 31, 2010, December 31, 2009 and December 31, 2008, respectively. |
| (d) | Portfolio turnover is calculated at the fund level and is not annualized for periods less than one year, if applicable. For the period ending December 31, 2011, the portfolio turnover calculation excludes the value of securities purchased of $218,592,415 and sold of $61,446,608 in the effort to realign the Fund’s portfolio holdings after the reorganization of Invesco Van Kampen Asset Allocation Moderate Fund into the Fund. |
| (e) | Ratios are annualized and based on average daily net assets (000’s omitted) of $513,008, $88,789, $119,939, $19,621, $36,331, $2,926 and $933 for Class A, Class B, Class C, Class R, Class S, Class Y and Class R5 shares, respectively. |
| (f) | Commencement date of September 25, 2009 for Class S shares and October 3, 2008 for Class Y shares. |
| (g) | Annualized. |
NOTE 12—Significant Event
The Board of Trustees unanimously approved an Agreement and Plan of Reorganization (the “Agreement”) pursuant to which Invesco Growth Allocation Fund (the “Acquiring Fund”) would acquire all of the assets and liabilities of Invesco Leaders Fund (the “Target Fund”) in exchange for shares of the Acquiring Fund (the “Reorganization”).
The Agreement requires approval of the Target Fund’s shareholders and will be submitted to the shareholders for their consideration at a meeting to be held in or around April 2013. Upon closing of the Reorganization, shareholders of the Target Fund will receive a corresponding class of shares of the Acquiring Fund in exchange for their shares of the Target Fund and the Target Fund will liquidate and cease operations.
37 Invesco Allocation Funds
Report of Independent Registered Public Accounting Firm
To the Board of Trustees of AIM Growth Series (Invesco Growth Series)
and Shareholders of Invesco Conservative Allocation Fund,
Invesco Growth Allocation Fund
and Invesco Moderate Allocation Fund:
In our opinion, the accompanying statements of assets and liabilities, including the schedules of investments, and the related statements of operations and of changes in net assets and the financial highlights present fairly, in all material respects, the financial position of Invesco Conservative Allocation Fund, Invesco Growth Allocation Fund and Invesco Moderate Allocation Fund (three of the funds constituting AIM Growth Series (Invesco Growth Series), hereafter referred to as the “Funds”) at December 31, 2012, the results of each of their operations for the year then ended, the changes in each of their net assets for each of the two years in the period then ended and each of their financial highlights for each of the five years in the period then ended, in conformity with accounting principles generally accepted in the United States of America. These financial statements and financial highlights (hereafter referred to as “financial statements”) are the responsibility of the Funds’ management; our responsibility is to express an opinion on these financial statements based on our audits. We conducted our audits of these financial statements in accordance with the standards of the Public Company Accounting Oversight Board (United States). Those standards require that we plan and perform the audit to obtain reasonable assurance about whether the financial statements are free of material misstatement. An audit includes examining, on a test basis, evidence supporting the amounts and disclosures in the financial statements, assessing the accounting principles used and significant estimates made by management, and evaluating the overall financial statement presentation. We believe that our audits, which included confirmation of securities at December 31, 2012 by correspondence with the custodian and transfer agent, provide a reasonable basis for our opinion.
PRICEWATERHOUSECOOPERS LLP
February 25, 2013
Houston, Texas
38 Invesco Allocation Funds
Calculating your ongoing Fund expenses
Example
As a shareholder of the Fund, you incur two types of costs: (1) transaction costs, which may include sales charges (loads) on purchase payments or contingent deferred sales charges on redemptions, and redemption fees, if any; and (2) ongoing costs, including distribution and/or service (12b-1) fees, and other Fund expenses. This example is intended to help you understand your ongoing costs (in dollars) of investing in the Fund and to compare these costs with ongoing costs of investing in other mutual funds. The example is based on an investment of $1,000 invested at the beginning of the period and held for the entire period July 1, 2012, through December 31, 2012.
In addition to the fees and expenses which the Fund bears directly, the Fund indirectly bears a pro rata share of the fees and expenses of the underlying funds in which your Fund invests. The amount of fees and expenses incurred indirectly by your Fund will vary because the underlying funds have varied expenses and fee levels and the Fund may own different proportions of the underlying funds at different times. Estimated underlying fund expenses are not expenses that are incurred directly by your Fund. They are expenses that are incurred directly by the underlying funds and are deducted from the value of the underlying funds your Fund invests in. The effect of the estimated underlying fund expenses that you bear indirectly are included in your Fund’s total return.
Actual expenses
The table below provides information about actual account values and actual expenses. You may use the information in this table, together with the amount you invested, to estimate the expenses that you paid over the period. Simply divide your account value by $1,000 (for example, an $8,600 account value divided by $1,000 = 8.6), then multiply the result by the number in the table under the heading entitled “Actual Expenses Paid During Period” to estimate the expenses you paid on your account during this period.
Hypothetical example for comparison purposes
The table below also provides information about hypothetical account values and hypothetical expenses based on the Fund’s actual expense ratio and an assumed rate of return of 5% per year before expenses, which is not the Fund’s actual return.
The hypothetical account values and expenses may not be used to estimate the actual ending account balance or expenses you paid for the period. You may use this information to compare the ongoing costs of investing in the Fund and other funds. To do so, compare this 5% hypothetical example with the 5% hypothetical examples that appear in the shareholder reports of the other funds.
Please note that the expenses shown in the table are meant to highlight your ongoing costs only and do not reflect any transaction costs, such as sales charges (loads) on purchase payments, contingent deferred sales charges on redemptions, and redemption fees, if any. Therefore, the hypothetical information is useful in comparing ongoing costs only, and will not help you determine the relative total costs of owning different funds. In addition, expenses shown in the table do not include the expenses of the underlying funds, which are borne indirectly by the Fund. If transaction costs and indirect expenses were included, your costs would have been higher.
Invesco Conservative Allocation Fund
| Class | Beginning Account Value (07/01/12) | ACTUAL | HYPOTHETICAL (5% annual return before expenses) | Annualized Expense Ratio | ||||||||||||||||||||
| Ending Account Value (12/31/12)1 | Expenses Paid During Period2 | Ending Account Value (12/31/12) | Expenses Paid During Period2 | |||||||||||||||||||||
| A | $ | 1,000.00 | $ | 1,056.50 | $ | 2.69 | $ | 1,022.52 | $ | 2.64 | 0.52 | % | ||||||||||||
| B | 1,000.00 | 1,051.10 | 6.55 | 1,018.75 | 6.44 | 1.27 | ||||||||||||||||||
| C | 1,000.00 | 1,051.00 | 6.55 | 1,018.75 | 6.44 | 1.27 | ||||||||||||||||||
| R | 1,000.00 | 1,054.00 | 3.98 | 1,021.27 | 3.91 | 0.77 | ||||||||||||||||||
| S | 1,000.00 | 1,055.50 | 2.17 | 1,023.03 | 2.14 | 0.42 | ||||||||||||||||||
| Y | 1,000.00 | 1,057.10 | 1.40 | 1,023.78 | 1.37 | 0.27 | ||||||||||||||||||
| R5 | 1,000.00 | 1,057.30 | 1.14 | 1,024.03 | 1.12 | 0.22 | ||||||||||||||||||
39 Invesco Allocation Funds
Invesco Growth Allocation Fund
| Class | Beginning Account Value (07/01/12) | ACTUAL | HYPOTHETICAL (5% annual return before expenses) | Annualized Expense Ratio | ||||||||||||||||||||
| Ending Account Value (12/31/12)1 | Expenses Paid During Period2 | Ending Account Value (12/31/12) | Expenses Paid During Period2 | |||||||||||||||||||||
| A | $ | 1,000.00 | $ | 1,081.30 | $ | 2.83 | $ | 1,022.42 | $ | 2.75 | 0.54 | % | ||||||||||||
| B | 1,000.00 | 1,076.60 | 6.73 | 1,018.65 | 6.55 | 1.29 | ||||||||||||||||||
| C | 1,000.00 | 1,076.60 | 6.73 | 1,018.65 | 6.55 | 1.29 | ||||||||||||||||||
| R | 1,000.00 | 1,079.70 | 4.13 | 1,021.17 | 4.01 | 0.79 | ||||||||||||||||||
| S | 1,000.00 | 1,081.50 | 2.30 | 1,022.92 | 2.24 | 0.44 | ||||||||||||||||||
| Y | 1,000.00 | 1,082.20 | 1.52 | 1,023.68 | 1.48 | 0.29 | ||||||||||||||||||
| R5 | 1,000.00 | 1,083.20 | 0.84 | 1,024.33 | 0.81 | 0.16 | ||||||||||||||||||
Invesco Moderate Allocation Fund
| Class | Beginning Account Value (07/01/12) | ACTUAL | HYPOTHETICAL (5% annual return before expenses) | Annualized Expense Ratio | ||||||||||||||||||||
| Ending Account Value (12/31/12)1 | Expenses Paid During Period2 | Ending Account Value (12/31/12) | Expenses Paid During Period2 | |||||||||||||||||||||
| A | $ | 1,000.00 | $ | 1,070.00 | $ | 2.50 | $ | 1,022.72 | $ | 2.44 | 0.48 | % | ||||||||||||
| B | 1,000.00 | 1,066.00 | 6.39 | 1,018.95 | 6.24 | 1.23 | ||||||||||||||||||
| C | 1,000.00 | 1,066.10 | 6.39 | 1,018.95 | 6.24 | 1.23 | ||||||||||||||||||
| R | 1,000.00 | 1,068.40 | 3.80 | 1,021.47 | 3.71 | 0.73 | ||||||||||||||||||
| S | 1,000.00 | 1,070.20 | 1.98 | 1,023.23 | 1.93 | 0.38 | ||||||||||||||||||
| Y | 1,000.00 | 1,070.70 | 1.20 | 1,023.98 | 1.17 | 0.23 | ||||||||||||||||||
| R5 | 1,000.00 | 1,071.10 | 0.89 | 1,024.28 | 0.87 | 0.17 | ||||||||||||||||||
| 1 | The actual ending account value is based on the actual total return of the Funds for the period July 1, 2012, through December 31, 2012, after actual expenses and will differ from the hypothetical ending account value which is based on each Fund’s expense ratio and a hypothetical annual return of 5% before expenses. |
| 2 | Expenses are equal to each Fund’s annualized expense ratio as indicated above multiplied by the average account value over the period, multiplied by 184/366 to reflect the most recent fiscal half year. |
40 Invesco Allocation Funds
Tax Information
Form 1099-DIV, Form 1042-S and other year–end tax information provide shareholders with actual calendar year amounts that should be included in their tax returns. Shareholders should consult their tax advisors.
The following distribution information is being provided as required by the Internal Revenue Code or to meet a specific state’s requirement.
The Funds designate the following amounts or, if subsequently determined to be different, the maximum amount allowable for its fiscal year ended December 31, 2012:
Federal and State Income Tax | ||||||||||||||||
| Long Term Capital Gain Distributions | Qualified Dividend Income* | Corporate Dividends Received Deduction* | U.S. Treasury Obligations* | |||||||||||||
Invesco Conservative Allocation Fund | $ | — | 18.75 | % | 9.76 | % | 10.41 | % | ||||||||
Invesco Growth Allocation Fund | — | 63.00 | % | 32.00 | % | 1.25 | % | |||||||||
Invesco Moderate Allocation Fund | — | 34.77 | % | 17.71 | % | 5.88 | % | |||||||||
| * | The above percentages are based on ordinary income dividends paid to shareholders during the Fund’s fiscal year. |
41 Invesco Allocation Funds
Trustees and Officers
The address of each trustee and officer is AIM Growth Series (Invesco Growth Series) (the “Trust”), 11 Greenway Plaza, Suite 1000, Houston, Texas 77046-1173. The trustees serve for the life of the Trust, subject to their earlier death, incapacitation, resignation, retirement or removal as more specifically provided in the Trust’s organizational documents. Each officer serves for a one year term or until their successors are elected and qualified. Column two below includes length of time served with predecessor entities, if any.
| Name, Year of Birth and Position(s) Held with the Trust | Trustee and/ or Officer Since | Principal Occupation(s) During Past 5 Years | Number of Funds in Fund Complex Overseen by Trustee | Other Directorship(s) Held by Trustee During Past 5 Years | ||||
| Interested Persons | ||||||||
| Martin L. Flanagan1 — 1960 Trustee | 2007 | Executive Director, Chief Executive Officer and President, Invesco Ltd. (ultimate parent of Invesco and a global investment management firm); Advisor to the Board, Invesco Advisers, Inc. (formerly known as Invesco Institutional (N.A.), Inc.); Trustee, The Invesco Funds; Vice Chair, Investment Company Institute; and Member of Executive Board, SMU Cox School of Business
Formerly: Chairman and Chief Executive Officer, Invesco Advisers, Inc. (registered investment adviser); Director, Chairman, Chief Executive Officer and President, IVZ Inc. (holding company), INVESCO Group Services, Inc. (service provider) and Invesco North American Holdings, Inc. (holding company); Director, Chief Executive Officer and President, Invesco Holding Company Limited (parent of Invesco and a global investment management firm); Director, Invesco Ltd.; Chairman, Investment Company Institute and President, Co-Chief Executive Officer, Co-President, Chief Operating Officer and Chief Financial Officer, Franklin Resources, Inc. (global investment management organization) | 124 | None | ||||
Philip A. Taylor2 — 1954 Trustee, President and Principal Executive Officer | 2006 | Head of North American Retail and Senior Managing Director, Invesco Ltd.; Director, Co-Chairman, Co-President and Co-Chief Executive Officer, Invesco Advisers, Inc. (formerly known as Invesco Institutional (N.A.), Inc.) (registered investment adviser); Director, Chairman, Chief Executive Officer and President, Invesco Management Group, Inc. (formerly known as Invesco Aim Management Group, Inc.) (financial services holding company); Director and President, INVESCO Funds Group, Inc. (registered investment adviser and registered transfer agent); Director and Chairman, Invesco Investment Services, Inc. (formerly known as Invesco Aim Investment Services, Inc.) (registered transfer agent) and IVZ Distributors, Inc. (formerly known as INVESCO Distributors, Inc.) (registered broker dealer); Director, President and Chairman, Invesco Inc. (holding company) and Invesco Canada Holdings Inc. (holding company); Chief Executive Officer, Invesco Corporate Class Inc. (corporate mutual fund company) and Invesco Canada Fund Inc. (corporate mutual fund company); Director, Chairman and Chief Executive Officer, Invesco Canada Ltd. (formerly known as Invesco Trimark Ltd./Invesco Trimark Ltèe) (registered investment adviser and registered transfer agent); Trustee, President and Principal Executive Officer, The Invesco Funds (other than AIM Treasurer’s Series Trust (Invesco Treasurer’s Series Trust) and Short-Term Investments Trust); Trustee and Executive Vice President, The Invesco Funds (AIM Treasurer’s Series Trust (Invesco Treasurer’s Series Trust) and Short-Term Investments Trust only); Director, Invesco Investment Advisers LLC (formerly known as Van Kampen Asset Management); Director, Chief Executive Officer and President, Van Kampen Exchange Corp.
Formerly: Director and Chairman, Van Kampen Investor Services Inc.: Director, Chief Executive Officer and President, 1371 Preferred Inc. (holding company); and Van Kampen Investments Inc.; Director and President, AIM GP Canada Inc. (general partner for limited partnerships); and Van Kampen Advisors, Inc.; Director and Chief Executive Officer, Invesco Trimark Dealer Inc. (registered broker dealer); Director, Invesco Distributors, Inc. (formerly known as Invesco Aim Distributors, Inc.) (registered broker dealer); Manager, Invesco PowerShares Capital Management LLC; Director, Chief Executive Officer and President, Invesco Advisers, Inc.; Director, Chairman, Chief Executive Officer and President, Invesco Aim Capital Management, Inc.; President, Invesco Trimark Dealer Inc. and Invesco Trimark Ltd./Invesco Trimark Ltèe; Director and President, AIM Trimark Corporate Class Inc. and AIM Trimark Canada Fund Inc.; Senior Managing Director, Invesco Holding Company Limited; Trustee and Executive Vice President, Tax-Free Investments Trust; Director and Chairman, Fund Management Company (former registered broker dealer); President and Principal Executive Officer, The Invesco Funds (AIM Treasurer’s Series Trust (Invesco Treasurer’s Series Trust), Short-Term Investments Trust and Tax-Free Investments Trust only); President, AIM Trimark Global Fund Inc. and AIM Trimark Canada Fund Inc. | 124 | None | ||||
Wayne W. Whalen3 — 1939 Trustee | 2010 | Of Counsel, and prior to 2010, partner in the law firm of Skadden, Arps, Slate, Meagher & Flom LLP, legal counsel to certain funds in the Fund Complex
| 137 | Director of the Mutual Fund Directors Forum, a nonprofit membership organization for investment directors; Chairman and Director of the Abraham Lincoln Presidential Library Foundation; and Director of the Stevenson Center for Democracy |
| 1 | Mr. Flanagan is considered an interested person of the Trust because he is an officer of the adviser to the Trust, and an officer and a director of Invesco Ltd., ultimate parent of the adviser to the Trust. |
| 2 | Mr. Taylor is considered an interested person of the Trust because he is an officer and a director of the adviser to, and a director of the principal underwriter of, the Trust. |
| 3 | Mr. Whalen is considered an “interested person” (within the meaning of Section 2(a)(19) of the 1940 Act) of certain Funds in the Invesco Fund Complex by reason of he and his firm currently providing legal services as legal counsel to such Funds in the Invesco Fund Complex. |
T-1 Invesco Allocation Funds
Trustees and Officers—(continued)
| Name, Year of Birth and Position(s) Held with the Trust | Trustee and/ or Officer Since | Principal Occupation(s) During Past 5 Years | Number of Funds in Fund Complex Overseen by Trustee | Other Directorship(s) Held by Trustee During Past 5 Years | ||||
| Independent Trustees | ||||||||
Bruce L. Crockett — 1944 Trustee and Chair | 2001 | Chairman, Crockett Technologies Associates (technology consulting company)
Formerly: Director, Captaris (unified messaging provider); Director, President and Chief Executive Officer COMSAT Corporation; and Chairman, Board of Governors of INTELSAT (international communications company) | 124 | ACE Limited (insurance company); and Investment Company Institute | ||||
David C. Arch — 1945 Trustee | 2010 | Chairman and Chief Executive Officer of Blistex Inc., (consumer health care products manufacturer)
Formerly: Member of the Heartland Alliance Advisory Board, a nonprofit organization serving human needs based in Chicago | 137 | Board member of the Illinois Manufacturers’ Association; Member of the Board of Visitors, Institute for the Humanities, University of Michigan | ||||
Frank S. Bayley — 1939 Trustee | 1985 | Retired
Formerly: Director, Badgley Funds, Inc. (registered investment company) (2 portfolios) and General Partner and Of Counsel, law firm of Baker & McKenzie, LLP | 124 | Director and Chairman, C.D. Stimson Company (a real estate investment company); Trustee and Overseer, The Curtis institute of Music | ||||
James T. Bunch — 1942 Trustee | 2003 | Managing Member, Grumman Hill Group LLC (family office private equity management)
Formerly: Founder, Green, Manning & Bunch Ltd. (investment banking firm) (1988-2010); Executive Committee, United States Golf Association; and Director, Policy Studies, Inc. and Van Gilder Insurance Corporation | 124 | Chairman, Board of Governors, Western Golf Association; Chairman-elect, Evans Scholars Foundation; and Director, Denver Film Society | ||||
Rodney F. Dammeyer — 1940 Trustee | 2010 | Chairman of CAC, LLC, (private company offering capital investment and management advisory services)
Formerly: Prior to 2001, Managing Partner at Equity Group Corporate Investments; Prior to 1995, Vice Chairman of Anixter International; Prior to 1985, experience includes Senior Vice President and Chief Financial Officer of Household International, Inc., Executive Vice President and Chief Financial Officer of Northwest Industries, Inc. and Partner of Arthur Andersen & Co.; From 1987 to 2010, Director/Trustee of investment companies in the Van Kampen Funds complex | 126 | Director of Quidel Corporation and Stericycle, Inc.; Prior to May 2008, Trustee of The Scripps Research Institute; Prior to February 2008, Director of Ventana Medical Systems, Inc.; Prior to April 2007, Director of GATX Corporation; Prior to April 2004, Director of TheraSense, Inc. | ||||
Albert R. Dowden — 1941 Trustee | 2001 | Director of a number of public and private business corporations, including the Boss Group, Ltd. (private investment and management); Reich & Tang Funds (5 portfolios) (registered investment company); and Homeowners of America Holding Corporation/ Homeowners of America Insurance Company (property casualty company)
Formerly: Director, Continental Energy Services, LLC (oil and gas pipeline service); Director, CompuDyne Corporation (provider of product and services to the public security market) and Director, Annuity and Life Re (Holdings), Ltd. (reinsurance company); Director, President and Chief Executive Officer, Volvo Group North America, Inc.; Senior Vice President, AB Volvo; Director of various public and private corporations; Chairman, DHJ Media, Inc.; Director Magellan Insurance Company; and Director, The Hertz Corporation, Genmar Corporation (boat manufacturer), National Media Corporation; Advisory Board of Rotary Power International (designer, manufacturer, and seller of rotary power engines); and Chairman, Cortland Trust, Inc. (registered investment company) | 124 | Director of Nature’s Sunshine Products, Inc. | ||||
Jack M. Fields — 1952 Trustee | 2001 | Chief Executive Officer, Twenty First Century Group, Inc. (government affairs company); Owner and Chief Executive Officer, Dos Angeles Ranch, L.P. (cattle, hunting, corporate entertainment); and Discovery Global Education Fund (non-profit)
Formerly: Chief Executive Officer, Texana Timber LP (sustainable forestry company); Director of Cross Timbers Quail Research Ranch (non-profit); and member of the U.S. House of Representatives | 124 | Insperity, Inc. (formerly known as Administaff) | ||||
Prema Mathai-Davis — 1950 Trustee | 2001 | Retired
Formerly: Chief Executive Officer, YWCA of the U.S.A. | 124 | None | ||||
Larry Soll — 1942 Trustee | 2003 | Retired
Formerly: Chairman, Chief Executive Officer and President, Synergen Corp. (a biotechnology company) | 124 | None | ||||
Hugo F. Sonnenschein — 1940 Trustee | 2010 | Distinguished Service Professor and President Emeritus of the University of Chicago and the Adam Smith Distinguished Service Professor in the Department of Economics at the University of Chicago
Formerly: President of the University of Chicago | 137 | Trustee of the University of Rochester and a member of its investment committee. Member of the National Academy of Sciences, the American Philosophical Society and a fellow of the American Academy of Arts and Sciences |
T-2 Invesco Allocation Funds
Trustees and Officers—(continued)
| Name, Year of Birth and Position(s) Held with the Trust | Trustee and/ or Officer Since | Principal Occupation(s) During Past 5 Years | Number of Funds in Fund Complex Overseen by Trustee | Other Directorship(s) Held by Trustee During Past 5 Years | ||||
| Independent Trustees—(continued) | ||||||||
Raymond Stickel, Jr. — 1944 Trustee | 2005 | Retired
Formerly: Director, Mainstay VP Series Funds, Inc. (25 portfolios) and Partner, Deloitte & Touche | 124 | None | ||||
| Other Officers | ||||||||
| Russell C. Burk — 1958 Senior Vice President and Senior Officer | 2005 | Senior Vice President and Senior Officer, The Invesco Funds | N/A | N/A | ||||
| John M. Zerr — 1962 Senior Vice President, Chief Legal Officer and Secretary | 2006 | Director, Senior Vice President, Secretary and General Counsel, Invesco Management Group, Inc. (formerly known as Invesco Aim Management Group, Inc.) and Van Kampen Exchange Corp.; Senior Vice President, Invesco Advisers, Inc. (formerly known as Invesco Institutional (N.A.), Inc.) (registered investment adviser); Senior Vice President and Secretary, Invesco Distributors, Inc. (formerly known as Invesco Aim Distributors, Inc.); Director, Vice President and Secretary, Invesco Investment Services, Inc. (formerly known as Invesco Aim Investment Services, Inc.) and IVZ Distributors, Inc. (formerly known as INVESCO Distributors, Inc.); Director and Vice President, INVESCO Funds Group, Inc.; Senior Vice President, Chief Legal Officer and Secretary, The Invesco Funds; Manager, Invesco PowerShares Capital Management LLC; Director, Secretary and General Counsel, Invesco Investment Advisers LLC (formerly known as Van Kampen Asset Management); Secretary and General Counsel, Van Kampen Funds Inc. and Chief Legal Officer, PowerShares Exchange-Traded Fund Trust, PowerShares Exchange-Traded Fund Trust II, PowerShares India Exchange-Traded Fund Trust and PowerShares Actively Managed Exchange-Traded Fund Trust
Formerly: Director and Vice President, Van Kampen Advisors Inc.; Director, Vice President, Secretary and General Counsel Van Kampen Investor Services Inc.; Director, Invesco Distributors, Inc. (formerly known as Invesco Aim Distributors, Inc.); Director, Senior Vice President, General Counsel and Secretary, Invesco Advisers, Inc. and Van Kampen Investments Inc.; Director, Vice President and Secretary, Fund Management Company; Director, Senior Vice President, Secretary, General Counsel and Vice President, Invesco Aim Capital Management, Inc.; Chief Operating Officer and General Counsel, Liberty Ridge Capital, Inc. (an investment adviser); Vice President and Secretary, PBHG Funds (an investment company) and PBHG Insurance Series Fund (an investment company); Chief Operating Officer, General Counsel and Secretary, Old Mutual Investment Partners (a broker-dealer); General Counsel and Secretary, Old Mutual Fund Services (an administrator) and Old Mutual Shareholder Services (a shareholder servicing center); Executive Vice President, General Counsel and Secretary, Old Mutual Capital, Inc. (an investment adviser); and Vice President and Secretary, Old Mutual Advisors Funds (an investment company) | N/A | N/A | ||||
| Karen Dunn Kelley — 1960 Vice President | 2004 | Head of Invesco’s World Wide Fixed Income and Cash Management Group; Senior Vice President, Invesco Management Group, Inc. (formerly known as Invesco Aim Management Group, Inc.) and Invesco Advisers, Inc. (formerly known as Invesco Institutional (N.A.), Inc.) (registered investment adviser); Executive Vice President, Invesco Distributors, Inc. (formerly known as Invesco Aim Distributors, Inc.); Director, Invesco Mortgage Capital Inc., INVESCO Global Asset Management Limited, Invesco Management Company Limited and INVESCO Management S.A.; Vice President, The Invesco Funds (other than AIM Treasurer’s Series Trust (Invesco Treasurer’s Series Trust) and Short-Term Investments Trust); and President and Principal Executive Officer, The Invesco Funds (AIM Treasurer’s Series Trust (Invesco Treasurer’s Series Trust) and Short-Term Investments Trust only)
Formerly: Senior Vice President, Van Kampen Investments Inc.; Vice President, Invesco Advisers, Inc. (formerly known as Invesco Institutional (N.A.), Inc.); Director of Cash Management and Senior Vice President, Invesco Advisers, Inc. and Invesco Aim Capital Management, Inc.; President and Principal Executive Officer, Tax-Free Investments Trust; Director and President, Fund Management Company; Chief Cash Management Officer, Director of Cash Management, Senior Vice President, and Managing Director, Invesco Aim Capital Management, Inc.; Director of Cash Management, Senior Vice President, and Vice President, Invesco Advisers, Inc. and The Invesco Funds (AIM Treasurer’s Series Trust (Invesco Treasurer’s Series Trust), Short-Term Investments Trust and Tax-Free Investments Trust only) | N/A | N/A | ||||
T-3 Invesco Allocation Funds
Trustees and Officers—(continued)
| Name, Year of Birth and Position(s) Held with the Trust | Trustee and/ or Officer Since | Principal Occupation(s) During Past 5 Years | Number of Funds in Fund Complex Overseen by Trustee | Other Directorship(s) Held by Trustee During Past 5 Years | ||||
| Other Officers—(continued) | ||||||||
| Sheri Morris — 1964 Vice President, Treasurer and Principal Financial Officer | 1999 | Vice President, Treasurer and Principal Financial Officer, The Invesco Funds; Vice President, Invesco Advisers, Inc. (formerly known as Invesco Institutional (N.A.), Inc.) (registered investment adviser); and Vice President, PowerShares Exchange-Traded Fund Trust, PowerShares Exchange-Traded Fund Trust II, PowerShares India Exchange-Traded Fund Trust and PowerShares Actively Managed Exchange-Traded Fund Trust
Formerly: Vice President, Invesco Aim Advisers, Inc., Invesco Aim Capital Management, Inc. and Invesco Aim Private Asset Management, Inc.; Assistant Vice President and Assistant Treasurer, The Invesco Funds and Assistant Vice President, Invesco Advisers, Inc., Invesco Aim Capital Management, Inc. and Invesco Aim Private Asset Management, Inc.; and Treasurer, PowerShares Exchange-Traded Fund Trust, PowerShares Exchange-Traded Fund Trust II, PowerShares India Exchange-Traded Fund Trust and PowerShares Actively Managed Exchange-Traded Fund Trust | N/A | N/A | ||||
Yinka Akinsola — 1977 Anti-Money Laundering Compliance Officer | 2011 | Anti-Money Laundering Compliance Officer, Invesco Advisers, Inc. (formerly known as Invesco Institutional (N.A.), Inc.) (registered investment adviser); Invesco Distributors, Inc. (formerly known as Invesco Aim Distributors, Inc.), Invesco Investment Services, Inc. (formerly known as Invesco Aim Investment Services, Inc.), Invesco Management Group, Inc., The Invesco Funds, Invesco Van Kampen Closed-End Funds, Van Kampen Exchange Corp., Van Kampen Funds Inc., PowerShares Exchange-Traded Fund Trust, PowerShares Exchange-Traded Fund Trust II, PowerShares India Exchange-Traded Fund Trust, and PowerShares Actively Managed Exchange-Traded Fund Trust
Formerly: Regulatory Analyst III, Financial Industry Regulatory Authority (FINRA) | N/A | N/A | ||||
| Todd L. Spillane — 1958 Chief Compliance Officer | 2006 | Senior Vice President, Invesco Management Group, Inc. (formerly known as Invesco Aim Management Group, Inc.) and Van Kampen Exchange Corp.; Senior Vice President and Chief Compliance Officer, Invesco Advisers, Inc. (registered investment adviser) (formerly known as Invesco Institutional (N.A.), Inc.); Chief Compliance Officer, The Invesco Funds; Vice President, Invesco Distributors, Inc. (formerly known as Invesco Aim Distributors, Inc.) and Invesco Investment Services, Inc. (formerly known as Invesco Aim Investment Services, Inc.)
Formerly: Chief Compliance Officer, Invesco Van Kampen Closed-End Funds; Senior Vice President, Van Kampen Investments Inc.; Senior Vice President and Chief Compliance Officer, Invesco Aim Advisers, Inc. and Invesco Aim Capital Management, Inc.; Chief Compliance Officer, INVESCO Private Capital Investments, Inc. (holding company), Invesco Private Capital, Inc. (registered investment adviser), Invesco Global Asset Management (N.A.), Inc., Invesco Senior Secured Management, Inc. (registered investment adviser), Van Kampen Investor Services Inc., PowerShares Exchange-Traded Fund Trust, PowerShares Exchange-Traded Fund Trust II, PowerShares India Exchange-Traded Fund Trust and PowerShares Actively Managed Exchange-Traded Fund Trust; and Vice President, Invesco Aim Capital Management, Inc. and Fund Management Company | N/A | N/A |
The Statement of Additional Information of the Trust includes additional information about the Fund’s Trustees and is available upon request, without charge, by calling 1.800.959.4246. Please refer to the Fund’s prospectus for information on the Fund’s sub-advisers.
Office of the Fund 11 Greenway Plaza, Suite 1000 Houston, TX 77046-1173 | Investment Adviser Invesco Advisers, Inc. 1555 Peachtree Street, N.E. Atlanta, GA 30309 | Distributor Invesco Distributors, Inc. 11 Greenway Plaza, Suite 1000 Houston, TX 77046-1173 | Auditors PricewaterhouseCoopers LLP 1201 Louisiana Street, Suite 2900 Houston, TX 77002-5678 | |||
Counsel to the Fund Stradley Ronon Stevens & Young, LLP 2005 Market Street, Suite 2600 Philadelphia, PA 19103-7018 | Counsel to the Independent Trustees Goodwin Procter LLP 901 New York Avenue, N.W. | Transfer Agent Invesco Investment Services, Inc. 11 Greenway Plaza, Suite 1000 Houston, TX 77046-1173 | Custodian State Street Bank and Trust Company 225 Franklin Street Boston, MA 02110-2801 | |||
T-4 Invesco Allocation Funds

Invesco mailing information
Send general correspondence to Invesco Investment Services, Inc., P.O. Box 219078, Kansas City, MO 64121-9078.
Invesco privacy policy
You share personal and financial information with us that is necessary for your transactions and your account records. We take very seriously the obligation to keep that information confidential and private.
Invesco collects nonpublic personal information about you from account applications or other forms you complete and from your transactions with us or our affiliates. We do not disclose information about you or our former customers to service providers or other third parties except to the extent necessary to service your account and in other limited circumstances as permitted by law. For example, we use this information to facilitate the delivery of transaction confirmations, financial reports, prospectuses and tax forms.
Even within Invesco, only people involved in the servicing of your accounts and compliance monitoring have access to your information. To ensure the highest level of confidentiality and security, Invesco maintains physical, electronic and procedural safeguards that meet or exceed federal standards. Special measures, such as data encryption and authentication, apply to your communications with us on our website. More detail is available to you at invesco.com/privacy.
Important notice regarding delivery of security holder documents
To reduce Fund expenses, only one copy of most shareholder documents may be mailed to shareholders with multiple accounts at the same address (Householding). Mailing of your shareholder documents may be householded indefinitely unless you instruct us otherwise. If you do not want the mailing of these documents to be combined with those for other members of your household, please contact Invesco Investment Services, Inc. at 800 959 4246 or contact your financial institution. We will begin sending you individual copies for each account within 30 days after receiving your request.
Fund holdings and proxy voting information
The Fund provides a complete list of its holdings four times in each fiscal year, at the quarter-ends. For the second and fourth quarters, the lists appear in the Fund’s semiannual and annual reports to shareholders. For the first and third quarters, the Fund files the lists with the Securities and Exchange Commission (SEC) on Form N-Q. The most recent list of portfolio holdings is available at invesco.com/completeqtrholdings. Shareholders can also look up the Fund’s Forms N-Q on the SEC website at sec.gov. Copies of the Fund’s Forms N-Q may be reviewed and copied at the SEC Public Reference Room in Washington, D.C. You can obtain information on the operation of the Public Reference Room, including information about duplicating fee charges, by calling 202 551 8090 or 800 732 0330, or by electronic request at the following email address: publicinfo@sec.gov. The SEC file numbers for the Fund are shown below.
A description of the policies and procedures that the Fund uses to determine how to vote proxies relating to portfolio securities is available without charge, upon request, from our Client Services department at 800 959 4246 or at invesco.com/proxyguidelines. The information is also available on the SEC website, sec.gov.
Information regarding how the Fund voted proxies related to its portfolio securities during the 12 months ended June 30, 2012, is available at invesco.com/proxysearch. The information is also available on the SEC website, sec.gov.
Invesco Advisers, Inc. is an investment adviser; it provides investment advisory services to individual and institutional clients and does not sell securities. Invesco Distributors, Inc. is the US distributor for Invesco Ltd.’s retail mutual funds, exchange-traded funds and institutional money market funds. Both are wholly owned, indirect subsidiaries of Invesco Ltd. |  | |
| SEC file numbers: 811-02699 and 002-57526 AAS-AR-1 Invesco Distributors, Inc. | ||
| ITEM 2. | CODE OF ETHICS. |
As of the end of the period covered by this report, the Registrant had adopted a code of ethics (the “Code”) that applies to the Registrant’s principal executive officer (“PEO”) and principal financial officer (“PFO”). There were no amendments to the Code during the period covered by the report. The Registrant did not grant any waivers, including implicit waivers, from any provisions of the Code to the PEO or PFO during the period covered by this report.
| ITEM 3. | AUDIT COMMITTEE FINANCIAL EXPERT. |
The Board of Trustees has determined that the Registrant has at least one audit committee financial expert serving on its Audit Committee. The Audit Committee financial expert is Raymond Stickel, Jr. Mr. Stickel is “independent” within the meaning of that term as used in Form N-CSR.
| ITEM 4. | PRINCIPAL ACCOUNTANT FEES AND SERVICES. |
Fees Billed by PWC Related to the Registrant
PWC billed the Registrant aggregate fees for services rendered to the Registrant for the last two fiscal years as follows:
| Fees Billed for Services Rendered to the Registrant for fiscal year end 2012 | Percentage of Fees Billed Applicable to Non-Audit Services Provided for fiscal year end 2012 Pursuant to Waiver of Pre-Approval Requirement(1) | Fees Billed for Services Rendered to the Registrant for fiscal year end 2011 | Percentage of Fees Billed Applicable to Non-Audit Services Provided for fiscal year end 2011 Pursuant to Waiver of Pre-Approval Requirement(1) | |||||||||||||
Audit Fees | $ | 437,252 | N/A | $ | 370,000 | N/A | ||||||||||
Audit-Related Fees(2) | $ | 0 | 0 | % | $ | 21,250 | 0 | % | ||||||||
Tax Fees(3) | $ | 107,100 | 0 | % | $ | 160,700 | 0 | % | ||||||||
All Other Fees | $ | 0 | 0 | % | $ | 0 | 0 | % | ||||||||
|
|
|
| |||||||||||||
Total Fees | $ | 544,352 | 0 | % | $ | 551,950 | 0 | % | ||||||||
PWC billed the Registrant aggregate non-audit fees of $107,100 for the fiscal year ended 2012, and $181,950 for the fiscal year ended 2011, for non-audit services rendered to the Registrant.
| (1) | With respect to the provision of non-audit services, the pre-approval requirement is waived pursuant to a de minimis exception if (i) such services were not recognized as non-audit services by the Registrant at the time of engagement, (ii) the aggregate amount of all such services provided is no more than 5% of the aggregate audit and non-audit fees paid by the Registrant to PWC during a fiscal year; and (iii) such services are promptly brought to the attention of the Registrant’s Audit Committee and approved by the Registrant’s Audit Committee prior to the completion of the audit. |
| (2) | Audit-Related fees for the fiscal year end December 31, 2011 includes fees billed for agreed upon procedures related to fund mergers. |
| (3) | Tax fees for the fiscal year end December 31, 2012 includes fees billed for reviewing tax returns. Tax fees for fiscal year end December 31, 2011 includes fees billed for reviewing tax returns. |
Fees Billed by PWC Related to Invesco and Invesco Affiliates
PWC billed Invesco Advisers, Inc. (“Invesco”), the Registrant’s adviser, and any entity controlling, controlled by or under common control with Invesco that provides ongoing services to the Registrant (“Invesco Affiliates”) aggregate fees for pre-approved non-audit services rendered to Invesco and Invesco Affiliates for the last two fiscal years as follows:
| Fees Billed for Non-Audit Services Rendered to Invesco and Invesco Affiliates for fiscal year end 2012 That Were Required to be Pre-Approved by the Registrant’s Audit Committee | Percentage of Fees Billed Applicable to Non-Audit Services Provided for fiscal year end 2012 Pursuant to Waiver of Pre-Approval Requirement(1) | Fees Billed for Non-Audit Services Rendered to Invesco and Invesco Affiliates for fiscal year end 2011 That Were Required to be Pre-Approved by the Registrant’s Audit Committee | Percentage of Fees Billed Applicable to Non-Audit Services Provided for fiscal year end 2011 Pursuant to Waiver of Pre-Approval Requirement(1) | |||||||||||||
Audit-Related Fees | $ | 0 | 0 | % | $ | 0 | 0 | % | ||||||||
Tax Fees | $ | 0 | 0 | % | $ | 0 | 0 | % | ||||||||
All Other Fees | $ | 0 | 0 | % | $ | 0 | 0 | % | ||||||||
|
|
|
| |||||||||||||
Total Fees(2) | $ | 0 | 0 | % | $ | 0 | 0 | % | ||||||||
| (1) | With respect to the provision of non-audit services, the pre-approval requirement is waived pursuant to a de minimis exception if (i) such services were not recognized as non-audit services by the Registrant at the time of engagement, (ii) the aggregate amount of all such services provided is no more than 5% of the aggregate audit and non-audit fees paid by the Registrant, Invesco and Invesco Affiliates to PWC during a fiscal year; and (iii) such services are promptly brought to the attention of the Registrant’s Audit Committee and approved by the Registrant’s Audit Committee prior to the completion of the audit. |
| (2) | Including the fees for services not required to be pre-approved by the registrant’s audit committee, PWC billed Invesco and Invesco Affiliates aggregate non-audit fees of $0 for the fiscal year ended 2012, and $0 for the fiscal year ended 2011, for non-audit services rendered to Invesco and Invesco Affiliates. |
The Audit Committee also has considered whether the provision of non-audit services that were rendered to Invesco and Invesco Affiliates that were not required to be pre-approved pursuant to SEC regulations, if any, is compatible with maintaining PWC’s independence.
PRE-APPROVAL OF AUDIT AND NON-AUDIT SERVICES
POLICIES AND PROCEDURES
As adopted by the Audit Committees of
the Invesco Funds (the “Funds”)
Last Amended May 4, 2010
Statement of Principles
Under the Sarbanes-Oxley Act of 2002 and rules adopted by the Securities and Exchange Commission (“SEC”) (“Rules”), the Audit Committees of the Funds’ (the “Audit Committees”) Board of Trustees (the “Board”) are responsible for the appointment, compensation and oversight of the work of independent accountants (an “Auditor”). As part of this responsibility and to assure that the Auditor’s independence is not impaired, the Audit Committees pre-approve the audit and non-audit services provided to the Funds by each Auditor, as well as all non-audit services provided by the Auditor to the Funds’ investment adviser and to affiliates of the adviser that provide ongoing services to the Funds (“Service Affiliates”) if the services directly impact the Funds’ operations or financial reporting. The SEC Rules also specify the types of services that an Auditor may not provide to its audit client. The following policies and procedures comply with the requirements for pre-approval and provide a mechanism by which management of the Funds may request and secure pre-approval of audit and non-audit services in an orderly manner with minimal disruption to normal business operations.
Proposed services either may be pre-approved without consideration of specific case-by-case services by the Audit Committees (“general pre-approval”) or require the specific pre-approval of the Audit Committees (“specific pre-approval”). As set forth in these policies and procedures, unless a type of service has received general pre-approval, it will require specific pre-approval by the Audit Committees. Additionally, any fees exceeding 110% of estimated pre-approved fee levels provided at the time the service was pre-approved will also require specific approval by the Audit Committees before payment is made. The Audit Committees will also consider the impact of additional fees on the Auditor’s independence when determining whether to approve any additional fees for previously pre-approved services.
The Audit Committees will annually review and generally pre-approve the services that may be provided by each Auditor without obtaining specific pre-approval from the Audit Committee generally on an annual basis. The term of any general pre-approval runs from the date of such pre-approval through September 30th of the following year, unless the Audit Committees consider a different period and state otherwise. The Audit Committees will add to or subtract from the list of general pre-approved services from time to time, based on subsequent determinations.
The purpose of these policies and procedures is to set forth the guidelines to assist the Audit Committees in fulfilling their responsibilities.
Delegation
The Audit Committees may from time to time delegate pre-approval authority to one or more of its members who are Independent Trustees. All decisions to pre-approve a service by a delegated member shall be reported to the Audit Committees at the next quarterly meeting.
Audit Services
The annual audit services engagement terms will be subject to specific pre-approval of the Audit Committees. Audit services include the annual financial statement audit and other procedures such as tax provision work that is required to be performed by the independent auditor to be able to form an opinion on the Funds’ financial statements. The Audit Committees will obtain, review and consider sufficient information concerning the proposed Auditor to make a reasonable evaluation of the Auditor’s qualifications and independence.
In addition to the annual Audit services engagement, the Audit Committees may grant either general or specific pre-approval of other audit services, which are those services that only the independent auditor reasonably can provide. Other Audit services may include services such as issuing consents for the inclusion of audited financial statements with SEC registration statements, periodic reports and other documents filed with the SEC or other documents issued in connection with securities offerings.
Non-Audit Services
The Audit Committees may provide either general or specific pre-approval of any non-audit services to the Funds and its Service Affiliates if the Audit Committees believe that the provision of the service will not impair the independence of the Auditor, is consistent with the SEC’s Rules on auditor independence, and otherwise conforms to the Audit Committees’ general principles and policies as set forth herein.
Audit-Related Services
“Audit-related services” are assurance and related services that are reasonably related to the performance of the audit or review of the Fund’s financial statements or that are traditionally performed by the independent auditor. Audit-related services include, among others, accounting consultations related to accounting, financial reporting or disclosure matters not classified as “Audit services”; assistance with understanding and implementing new accounting and financial reporting guidance from rulemaking authorities; and agreed-upon procedures related to mergers, compliance with ratings agency requirements and interfund lending activities.
Tax Services
“Tax services” include, but are not limited to, the review and signing of the Funds’ federal tax returns, the review of required distributions by the Funds and consultations regarding tax matters such as the tax treatment of new investments or the impact of new regulations. The Audit Committees will scrutinize carefully the retention of the Auditor in connection with a transaction initially recommended by the Auditor, the major business purpose of which may be tax avoidance or the tax treatment of which may not be supported in the Internal Revenue Code and related regulations. The Audit Committees will consult with the Funds’ Treasurer (or his or her designee) and may consult with outside counsel or advisors as necessary to ensure the consistency of Tax services rendered by the Auditor with the foregoing policy.
No Auditor shall represent any Fund or any Service Affiliate before a tax court, district court or federal court of claims.
Under rules adopted by the Public Company Accounting Oversight Board and approved by the SEC, in connection with seeking Audit Committees’ pre-approval of permissible Tax services, the Auditor shall:
| 1. | Describe in writing to the Audit Committees, which writing may be in the form of the proposed engagement letter: |
| a. | The scope of the service, the fee structure for the engagement, and any side letter or amendment to the engagement letter, or any other agreement between the Auditor and the Fund, relating to the service; and |
| b. | Any compensation arrangement or other agreement, such as a referral agreement, a referral fee or fee-sharing arrangement, between the Auditor and any person (other than the Fund) with respect to the promoting, marketing, or recommending of a transaction covered by the service; |
| 2. | Discuss with the Audit Committees the potential effects of the services on the independence of the Auditor; and |
| 3. | Document the substance of its discussion with the Audit Committees. |
All Other Auditor Services
The Audit Committees may pre-approve non-audit services classified as “All other services” that are not categorically prohibited by the SEC, as listed in Exhibit 1 to this policy.
Pre-Approval Fee Levels or Established Amounts
Pre-approval of estimated fees or established amounts for services to be provided by the Auditor under general or specific pre-approval policies will be set periodically by the Audit Committees. Any proposed fees exceeding 110% of the maximum estimated pre-approved fees or established amounts for pre-approved audit and non-audit services will be reported to the Audit Committees at the quarterly Audit Committees meeting and will require specific approval by the Audit Committees before payment is made. The Audit Committees will always factor in the overall relationship of fees for audit and non-audit services in determining whether to pre-approve any such services and in determining whether to approve any additional fees exceeding 110% of the maximum pre-approved fees or established amounts for previously pre-approved services.
Procedures
Generally on an annual basis, Invesco Advisers, Inc. (“Invesco”) will submit to the Audit Committees for general pre-approval, a list of non-audit services that the Funds or Service Affiliates of the Funds may request from the Auditor. The list will describe the non-audit services in reasonable detail and will include an estimated range of fees and such other information as the Audit Committee may request.
Each request for services to be provided by the Auditor under the general pre-approval of the Audit Committees will be submitted to the Funds’ Treasurer (or his or her designee) and must include a detailed description of the services to be rendered. The Treasurer or his or her designee will ensure that such services are included within the list of services that have received the general pre-approval of the Audit Committees. The Audit Committees will be informed at the next quarterly scheduled Audit Committees meeting of any such services for which the Auditor rendered an invoice and whether such services and fees had been pre-approved and if so, by what means.
Each request to provide services that require specific approval by the Audit Committees shall be submitted to the Audit Committees jointly by the Fund’s Treasurer or his or her designee and the Auditor, and must include a joint statement that, in their view, such request is consistent with the policies and procedures and the SEC Rules.
Each request to provide tax services under either the general or specific pre-approval of the Audit Committees will describe in writing: (i) the scope of the service, the fee structure for the engagement, and any side letter or amendment to the engagement letter, or any other agreement between the Auditor and the audit client, relating to the service; and (ii) any compensation arrangement or other agreement between the Auditor and any person (other than the audit client) with respect to the promoting, marketing, or recommending of a transaction covered by the service. The Auditor will discuss with the Audit Committees the potential effects of the services on the Auditor’s independence and will document the substance of the discussion.
Non-audit services pursuant to the de minimis exception provided by the SEC Rules will be promptly brought to the attention of the Audit Committees for approval, including documentation that each of the conditions for this exception, as set forth in the SEC Rules, has been satisfied.
On at least an annual basis, the Auditor will prepare a summary of all the services provided to any entity in the investment company complex as defined in section 2-01(f)(14) of Regulation S-X in sufficient detail as to the nature of the engagement and the fees associated with those services.
The Audit Committees have designated the Funds’ Treasurer to monitor the performance of all services provided by the Auditor and to ensure such services are in compliance with these policies and procedures. The Funds’ Treasurer will report to the Audit Committees on a periodic basis as to the results of such monitoring. Both the Funds’ Treasurer and management of Invesco will immediately report to the chairman of the Audit Committees any breach of these policies and procedures that comes to the attention of the Funds’ Treasurer or senior management of Invesco.
Exhibit 1 to Pre-Approval of Audit and Non-Audit Services Policies and Procedures
Conditionally Prohibited Non-Audit Services (not prohibited if the Fund can reasonably conclude that the results of the service would not be subject to audit procedures in connection with the audit of the Fund’s financial statements)
| • | Bookkeeping or other services related to the accounting records or financial statements of the audit client |
| • | Financial information systems design and implementation |
| • | Appraisal or valuation services, fairness opinions, or contribution-in-kind reports |
| • | Actuarial services |
| • | Internal audit outsourcing services |
Categorically Prohibited Non-Audit Services
| • | Management functions |
| • | Human resources |
| • | Broker-dealer, investment adviser, or investment banking services |
| • | Legal services |
| • | Expert services unrelated to the audit |
| • | Any service or product provided for a contingent fee or a commission |
| • | Services related to marketing, planning, or opining in favor of the tax treatment of confidential transactions or aggressive tax position transactions, a significant purpose of which is tax avoidance |
| • | Tax services for persons in financial reporting oversight roles at the Fund |
| • | Any other service that the Public Company Oversight Board determines by regulation is impermissible. |
| ITEM 5. | AUDIT COMMITTEE OF LISTED REGISTRANTS. |
Not applicable.
| ITEM 6. | SCHEDULE OF INVESTMENTS. |
Investments in securities of unaffiliated issuers is included as part of the reports to stockholders filed under Item 1 of this Form.
| ITEM 7. | DISCLOSURE OF PROXY VOTING POLICIES AND PROCEDURES FOR CLOSED-END MANAGEMENT INVESTMENT COMPANIES. |
Not applicable.
| ITEM 8. | PORTFOLIO MANAGERS OF CLOSED-END MANAGEMENT COMPANIES. |
Not applicable.
| ITEM 9. | PURCHASES OF EQUITY SECURITIES BY CLOSED-END MANAGEMENT INVESTMENT COMPANY AND AFFILIATED PURCHASERS. |
Not applicable.
| ITEM 10. | SUBMISSION OF MATTERS TO A VOTE OF SECURITY HOLDERS. |
None
| ITEM 11. | CONTROLS AND PROCEDURES. |
| (a) | As of May 23, 2013, an evaluation was performed under the supervision and with the participation of the officers of the Registrant, including the PEO and PFO, to assess the effectiveness of the Registrant’s disclosure controls and procedures, as that term is defined in Rule 30a-3(c) under the Investment Company Act of 1940 (the “Act”), as amended. Based on that evaluation, the Registrant’s officers, including the PEO and PFO, concluded that, as of May 23, 2013, the Registrant’s disclosure controls and procedures were reasonably designed to ensure: (1) that information required to be disclosed by the Registrant on Form N-CSR is recorded, processed, summarized and reported within the time periods specified by the rules and forms of the Securities and Exchange Commission; and (2) that material information relating to the Registrant is made known to the PEO and PFO as appropriate to allow timely decisions regarding required disclosure. |
| (b) | There have been no changes in the Registrant’s internal control over financial reporting (as defined in Rule 30a-3(d) under the Act) that occurred during the second fiscal quarter of the period covered by this report that have materially affected, or are reasonably likely to materially affect, the Registrant’s internal control over financial reporting. |
| ITEM 12. | EXHIBITS. |
| 12(a) (1) | Code of Ethics. | |
| 12(a) (2) | Certifications of principal executive officer and principal financial officer as required by Rule 30a-2(a) under the Investment Company Act of 1940. | |
| 12(a) (3) | Not applicable. | |
| 12(b) | Certifications of principal executive officer and principal financial officer as required by Rule 30a-2(b) under the Investment Company Act of 1940. | |
SIGNATURES
Pursuant to the requirements of the Securities Exchange Act of 1934 and the Investment Company Act of 1940, the Registrant has duly caused this report to be signed on its behalf by the undersigned, thereunto duly authorized.
Registrant: AIM Growth Series (Invesco Growth Series)
| By: | /s/ Philip A. Taylor | |
| Philip A. Taylor | ||
| Principal Executive Officer | ||
| Date: | July 5, 2013 | |
Pursuant to the requirements of the Securities and Exchange Act of 1934 and the Investment Company Act of 1940, this report has been signed below by the following persons on behalf of the Registrant and in the capacities and on the dates indicated.
| By: | /s/ Philip A. Taylor | |
| Philip A. Taylor | ||
| Principal Executive Officer | ||
| Date: | July 5, 2013 | |
| By: | /s/ Sheri Morris | |
| Sheri Morris | ||
| Principal Financial Officer | ||
| Date: | July 5, 2013 | |
EXHIBIT INDEX
| 12(a) (1) | Code of Ethics. | |
| 12(a) (2) | Certifications of principal executive officer and principal financial officer as required by Rule 30a-2(a) under the Investment Company Act of 1940. | |
| 12(a) (3) | Not applicable. | |
| 12(b) | Certifications of principal executive officer and principal financial officer as required by Rule 30a-2(b) under the Investment Company Act of 1940. | |