UNITED STATES
SECURITIES AND EXCHANGE COMMISSION
Washington, D.C. 20549
FORM N-CSR
CERTIFIED SHAREHOLDER REPORT OF REGISTERED
MANAGEMENT INVESTMENT COMPANIES
Investment Company Act file number | 811-02699 |
AIM Growth Series (Invesco Growth Series)
(Exact name of registrant as specified in charter)
11 Greenway Plaza, Suite 1000 Houston, Texas 77046
(Address of principal executive offices) (Zip code)
Sheri Morris 11 Greenway Plaza, Suite 1000 Houston, Texas 77046
(Name and address of agent for service)
Registrant’s telephone number, including area code: (713) 626-1919
Date of fiscal year end: 12/31
Date of reporting period: 12/31/22
| ITEM 1. | REPORTS TO STOCKHOLDERS. |
(a) The Registrant’s annual report transmitted to shareholders pursuant to Rule 30e-1 under the Investment Company Act of 1940 is as follows:
(b) Not applicable.

| Annual Report to Shareholders | December 31, 2022 |
Invesco Active Allocation Fund
Nasdaq:
A: OAAAX ∎ C: OAACX ∎ R: OAANX ∎ Y: OAAYX ∎ R5: PAAJX ∎ R6: PAAQX
Management’s Discussion of Fund Performance
|
| |||
For the fiscal year ended December 31, 2022, Class A shares of Invesco Active Allocation Fund (the Fund), at net asset value (NAV), underperformed the Custom Invesco Active Allocation Index. Your Fund’s long-term performance appears later in this report.
|
| |||
Fund vs. Indexes | ||||
Total returns, 12/31/21 to 12/31/22, at net asset value (NAV). Performance shown does not include applicable contingent deferred sales charges (CDSC) or front-end sales charges, which would have reduced performance.
|
| |||
Class A Shares | -19.32 | % | ||
Class C Shares | -19.93 | |||
Class R Shares | -19.56 | |||
Class Y Shares | -19.15 | |||
Class R5 Shares | -19.08 | |||
Class R6 Shares | -19.14 | |||
Bloomberg Global Aggregate USD Hedged Index▼ | -11.22 | |||
Custom Invesco Active Allocation Index∎ | -16.75 | |||
MSCI All Country World Index▼ | -18.36 | |||
Source(s): ▼RIMES Technologies Corp.; ∎Invesco, RIMES Technologies Corp. | ||||
Market conditions and your Fund
Global equity markets declined in the first half of 2022 amid volatility sparked by Russia’s invasion of Ukraine, rising commodity prices, rampant global inflation and central banks shifting toward tighter monetary policy. Russia’s invasion exacerbated inflationary pressures, disrupting already strained supply chains, and increasing shortages of oil, gas and raw materials, with the price of oil rising sharply.
Inflation headwinds continued into the third quarter of 2022. The US Federal Reserve (the Fed), the European Central Bank and the Bank of England all raised interest rates. In contrast, the People’s Bank of China lowered its policy rate and the Bank of Japan kept rates the same. Emerging market equities, hampered by the strong US dollar, underperformed developed market equities.
Global equity markets posted gains for the fourth quarter of 2022, after better inflation data sparked a rally in October and November. However, investor sentiment worsened in December after central banks signaled continued interest rate hikes into 2023 as inflation remained above target levels. International stocks outperformed US stocks in the fourth quarter, led by results in Europe and the UK. Emerging market equities also posted gains for the fourth quarter of 2022, boosted by China, which eased its zero-COVID-19 policy and started to reopen even as COVID-19 infections surged.
Despite the rebound in the fourth quarter of 2022, at the end of the fiscal year ended December 31, 2022, trailing one-year returns for developed market equities and emerging market equities were both in negative territory.
Strategic asset class exposures in the Fund are obtained through underlying representative mutual funds and exchange-traded funds
targeting pre-defined risk levels. The Fund may also implement a tactical overlay strategy using futures contracts on a percentage of the underlying assets under management. From an absolute performance perspective, an allocation to US Value style-specific equities was slightly additive to Fund performance during the fiscal year and the leading contributor to absolute return. The remaining allocations to equity, fixed income and alternative assets were mainly detractors from absolute performance as the portfolio produced a negative return for the fiscal year.
From a relative performance perspective, the portfolio underperformed its custom benchmark during the fiscal year. Underperformance was driven mainly by manager selection within the equity allocations. Within the equity allocation, the Invesco Global Fund and Invesco Discovery Mid Cap Growth Fund were the primary detractors. The tactical overlay strategy using futures contracts also slightly detracted for the fiscal year.
Conversely, allocations to other fixed income funds and allocations to style-specific equities were the leading contributors to relative performance during the fiscal year. Within the allocations, the Invesco S&P 500 Low Volatility ETF, Invesco Russell 1000 Dynamic Multi-Factor ETF and Invesco Value Opportunities Fund were the leading contributors to relative performance.
Please note that some of the Fund’s underlying funds use derivatives, including futures and total return swaps, which may create economic leverage in the underlying funds. Therefore, some of the performance of the strategy, both positive and negative, can be attributed to these instruments. Derivatives can be a cost-effective way to gain exposure to asset classes. However, derivatives may amplify traditional investment risks through the creation of leverage and may be less liquid than traditional securities.
Thank you for your continued investment in the Invesco Active Allocation Fund.
Portfolio manager(s):
Jeffrey Bennett
Jacob Borbidge
Alessio de Longis
Duy Nguyen
The views and opinions expressed in management’s discussion of Fund performance are those of Invesco Advisers, Inc. and its affiliates. These views and opinions are subject to change at any time based on factors such as market and economic conditions. These views and opinions may not be relied upon as investment advice or recommendations, or as an offer for a particular security. The information is not a complete analysis of every aspect of any market, country, industry, security or the Fund. Statements of fact are from sources considered reliable, but Invesco Advisers, Inc. makes no representation or warranty as to their completeness or accuracy. Although historical performance is no guarantee of future results, these insights may help you understand our investment management philosophy.
See important Fund and, if applicable, index disclosures later in this report.
2 Invesco Active Allocation Fund
Your Fund’s Long-Term Performance
Results of a $10,000 Investment – Oldest Share Class(es)
Fund and index data from 12/31/12
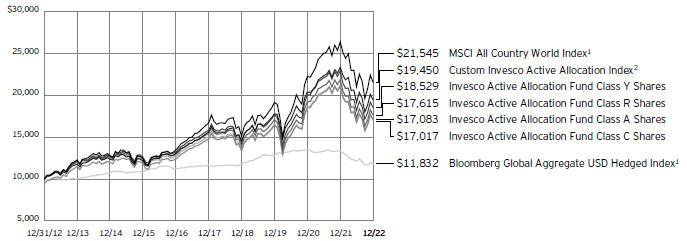
| 1 | Source: RIMES Technologies Corp. |
| 2 | Source: Invesco, RIMES Technologies Corp. |
Past performance cannot guarantee future results.
The data shown in the chart include reinvested distributions, applicable sales charges and Fund expenses including management
fees. Index results include reinvested dividends, but they do not reflect sales charges. Performance of the peer group, if applicable, reflects fund expenses and management fees;
performance of a market index does not. Performance shown in the chart does not reflect deduction of taxes a shareholder would pay on Fund distributions or sale of Fund shares.
3 Invesco Active Allocation Fund
Average Annual Total Returns |
| |||
As of 12/31/22, including maximum applicable sales charges |
| |||
Class A Shares | ||||
Inception (4/5/05) | 4.20 | % | ||
10 Years | 5.50 | |||
5 Years | 1.80 | |||
1 Year | -23.77 | |||
Class C Shares | ||||
Inception (4/5/05) | 4.18 | % | ||
10 Years | 5.46 | |||
5 Years | 2.18 | |||
1 Year | -20.70 | |||
Class R Shares | ||||
Inception (4/5/05) | 4.29 | % | ||
10 Years | 5.83 | |||
5 Years | 2.69 | |||
1 Year | -19.56 | |||
Class Y Shares | ||||
Inception (4/5/05) | 4.85 | % | ||
10 Years | 6.36 | |||
5 Years | 3.21 | |||
1 Year | -19.15 | |||
Class R5 Shares | ||||
10 Years | 6.21 | % | ||
5 Years | 3.16 | |||
1 Year | -19.08 | |||
Class R6 Shares | ||||
10 Years | 6.21 | % | ||
5 Years | 3.17 | |||
1 Year | -19.14 | |||
Effective May 24, 2019, Class A, Class C, Class R, and Class Y shares of the Oppenheimer Portfolio Series: Active Allocation Fund, (the predecessor fund), were reorganized into Class A, Class C, Class R and Class Y shares, respectively, of the Invesco Active Allocation Fund. Returns shown above, for periods ending on or prior to May 24, 2019, for Class A, Class C, Class R and Class Y shares are those for Class A, Class C, Class R and Class Y shares of the predecessor fund. Share class returns will differ from the predecessor fund because of different expenses.
Class R5 shares incepted on May 24, 2019. Performance shown on or prior to that date is that of the predecessor fund’s Class A shares at net asset value and includes the 12b-1 fees applicable to Class A shares.
Class R6 shares incepted on May 24, 2019. Performance shown on or prior to that date is that of the predecessor fund’s Class A shares at net asset value and includes the 12b-1 fees applicable to Class A shares.
The performance data quoted represent past performance and cannot guarantee future results; current performance may be lower or higher. Please visit invesco.com/ performance for the most recent month-end performance. Performance figures
reflect reinvested distributions, changes in
net asset value and the effect of the maximum sales charge unless otherwise stated. Performance figures do not reflect deduction of taxes a shareholder would pay on Fund distributions or sale of Fund shares. Investment return and principal value will fluctuate so that you may have a gain or loss when you sell shares.
Class A share performance reflects the maximum 5.50% sales charge, and Class C share performance reflects the applicable contingent deferred sales charge (CDSC) for the period involved. The CDSC on Class C shares is 1% for the first year after purchase. Class R, Class Y, Class R5 and Class R6 shares do not have a front-end sales charge or a CDSC; therefore, performance is at net asset value.
The performance of the Fund’s share classes will differ primarily due to different sales charge structures and class expenses.
Fund performance reflects any applicable fee waivers and/or expense reimbursements. Had the adviser not waived fees and/or reimbursed expenses currently or in the past, returns would have been lower. See current prospectus for more information.
4 Invesco Active Allocation Fund
Invesco Active Allocation Fund’s investment objective is to seek total return.
| ∎ | Unless otherwise stated, information presented in this report is as of December 31, 2022, and is based on total net assets. |
| ∎ | Unless otherwise noted, all data is provided by Invesco. |
| ∎ | To access your Fund’s reports/prospectus, visit invesco.com/fundreports. |
About indexes used in this report
| ∎ | The Bloomberg Global Aggregate USD Hedged Index tracks fixed-income performance of regions around the world while hedging the currency back to the US dollar. |
| ∎ | The Custom Invesco Active Allocation Index is composed of 80% MSCI All Country World Index and 20% Bloomberg Global Aggregate USD Hedged Index. |
| ∎ | The MSCI All Country World Index is an unmanaged index considered representative of large- and mid-cap stocks across developed and emerging markets. The index is computed using the net return, which withholds applicable taxes for non-resident investors. |
| ∎ | The Fund is not managed to track the performance of any particular index, including the index(es) described here, and consequently, the performance of the Fund may deviate significantly from the performance of the index(es). |
| ∎ | A direct investment cannot be made in an index. Unless otherwise indicated, index results include reinvested dividends, and they do not reflect sales charges. Performance of the peer group, if applicable, reflects fund expenses; performance of a market index does not. |
This report must be accompanied or preceded by a currently effective Fund prospectus, which contains more complete information, including sales charges and expenses. Investors should read it carefully before investing.
|
NOT FDIC INSURED | MAY LOSE VALUE | NO BANK GUARANTEE |
5 Invesco Active Allocation Fund
Fund Information
Portfolio Composition*
| By fund type | % of total investments | |
| Equity Funds | 76.97% | |
| Fixed Income Funds | 17.31 | |
| Alternative Funds | 4.91 | |
| Money Market Funds | 0.81 |
| * | Based on the Schedule of Investments, which classifies each underlying fund and other investments into broad asset classes based on their predominant investments. |
The Fund’s holdings are subject to change, and there is no assurance that the Fund will continue to hold any particular security. Data presented here are as of December 31, 2022.
6 Invesco Active Allocation Fund
December 31, 2022
Invesco Active Allocation Fund
Schedule of Investments in Affiliated Issuers–99.27%(a)
| % of | Change in | |||||||||||||||||||||||||||||||||||||
| Net | Unrealized | |||||||||||||||||||||||||||||||||||||
| Assets | Value | Purchases | Proceeds | Appreciation | Realized | Dividend | Shares | Value | ||||||||||||||||||||||||||||||
| 12/31/22 | 12/31/21 | at Cost | from Sales | (Depreciation) | Gain (Loss) | Income | 12/31/22 | 12/31/22 | ||||||||||||||||||||||||||||||
Alternative Funds–4.89% |
| |||||||||||||||||||||||||||||||||||||
Invesco Global Real Estate Income Fund, Class R6(b) | 2.39% | $ | 52,999,438 | $ | 2,891,140 | $ | – | $ | (11,941,623 | ) | $ | – | $ | 728,523 | 5,617,802 | $ | 43,481,788 | |||||||||||||||||||||
Invesco Macro Allocation Strategy Fund, Class R6(c) |
| 2.50% | 77,928,029 | – | (24,697,871 | ) | (4,932,915 | ) | (2,759,405 | ) | – | 6,055,564 | 45,537,838 | |||||||||||||||||||||||||
Total Alternative Funds | 130,927,467 | 2,891,140 | (24,697,871 | ) | (16,874,538 | ) | (2,759,405 | ) | 728,523 | 89,019,626 | ||||||||||||||||||||||||||||
Domestic Equity Funds–43.76% |
| |||||||||||||||||||||||||||||||||||||
Invesco Discovery Mid Cap Growth Fund, Class R6(c) | 5.87% | 209,641,660 | 21,890,265 | (64,851,528 | ) | (50,162,522 | ) | (9,582,216 | ) | – | 4,225,036 | 106,935,659 | ||||||||||||||||||||||||||
Invesco Main Street Small Cap Fund, Class R6 | 6.08% | 202,769,725 | 676,225 | (65,128,170 | ) | (40,470,723 | ) | 12,786,630 | 676,225 | 6,184,108 | 110,633,687 | |||||||||||||||||||||||||||
Invesco Russell 1000® Dynamic Multifactor ETF | 11.84% | 178,872,541 | 84,055,648 | (11,288,206 | ) | (35,193,374 | ) | (1,027,278 | ) | 3,205,343 | 5,016,752 | 215,419,331 | ||||||||||||||||||||||||||
Invesco S&P 500® Low Volatility ETF | 8.18% | 171,006,263 | 15,434,121 | (25,098,708 | ) | (15,112,039 | ) | 2,603,240 | 3,199,258 | 2,329,153 | 148,832,877 | |||||||||||||||||||||||||||
Invesco S&P 500® Pure Growth ETF | 5.27% | 122,178,412 | 13,710,990 | (4,014,009 | ) | (35,689,594 | ) | (184,376 | ) | 716,339 | 633,213 | 96,001,423 | ||||||||||||||||||||||||||
Invesco S&P SmallCap Low Volatility ETF | 3.49% | 182,237,438 | – | (98,798,430 | ) | (46,594,093 | ) | 26,674,902 | 2,197,216 | 1,422,457 | 63,519,817 | |||||||||||||||||||||||||||
Invesco Value Opportunities Fund, Class R6 | 3.03% | – | 66,769,676 | (7,280,360 | ) | (4,348,545 | ) | 4,447,191 | 562,733 | 3,449,076 | 55,116,230 | |||||||||||||||||||||||||||
Total Domestic Equity Funds | 1,066,706,039 | 202,536,925 | (276,459,411 | ) | (227,570,890 | ) | 35,718,093 | 10,557,114 | 796,459,024 | |||||||||||||||||||||||||||||
Fixed Income Funds–17.26% |
| |||||||||||||||||||||||||||||||||||||
Invesco 1-30 Laddered Treasury ETF | 1.92% | 48,568,059 | – | (3,383,045 | ) | (9,665,606 | ) | (509,720 | ) | 708,357 | 1,218,576 | 35,009,688 | ||||||||||||||||||||||||||
Invesco Core Plus Bond Fund, Class R6 | 7.68% | 179,831,649 | 6,869,952 | (17,142,464 | ) | (27,574,391 | ) | (2,251,209 | ) | 5,255,066 | 15,338,477 | 139,733,537 | ||||||||||||||||||||||||||
Invesco Income Fund, Class R6 | 1.08% | 42,124,979 | 934,136 | (19,765,055 | ) | (3,890,186 | ) | 180,390 | 934,137 | 2,859,017 | 19,584,264 | |||||||||||||||||||||||||||
Invesco Master Loan Fund, Class R6 | 0.77% | – | 16,441,535 | (1,583,248 | ) | (781,621 | ) | (72,541 | ) | 794,217 | 924,060 | 14,004,125 | ||||||||||||||||||||||||||
Invesco Senior Floating Rate Fund, Class R6 | 1.13% | – | 22,242,805 | – | (1,620,698 | ) | – | 1,398,284 | 3,167,758 | 20,622,107 | ||||||||||||||||||||||||||||
Invesco Taxable Municipal Bond ETF(d) | 3.67% | 89,858,749 | 3,665,377 | (7,750,952 | ) | (18,143,539 | ) | (881,976 | ) | 2,295,823 | 2,596,175 | 66,747,659 | ||||||||||||||||||||||||||
Invesco Variable Rate Investment Grade ETF | 1.01% | 23,885,363 | – | (5,135,303 | ) | (289,711 | ) | (18,584 | ) | 452,915 | 746,328 | 18,441,765 | ||||||||||||||||||||||||||
Total Fixed Income Funds | 384,268,799 | 50,153,805 | (54,760,067 | ) | (61,965,752 | ) | (3,553,640 | ) | 11,838,799 | 314,143,145 | ||||||||||||||||||||||||||||
Foreign Equity Funds–32.98% |
| |||||||||||||||||||||||||||||||||||||
Invesco EQV Emerging Markets All Cap Fund, Class R6(e) | 3.53% | 69,306,630 | 11,356,340 | (3,025,948 | ) | (11,909,756 | ) | (1,458,646 | ) | 1,026,601 | 2,077,873 | 64,268,620 | ||||||||||||||||||||||||||
Invesco Developing Markets Fund, Class R6 | 3.72% | 108,765,465 | 788,160 | (14,823,066 | ) | (19,906,170 | ) | (7,057,917 | ) | 788,160 | 1,940,621 | 67,766,472 | ||||||||||||||||||||||||||
Invesco Global Fund, Class R6 | 10.54% | 259,017,765 | 48,238,644 | (7,018,833 | ) | (105,896,504 | ) | 21,124,209 | – | 2,533,712 | 191,852,708 | |||||||||||||||||||||||||||
Invesco Global Infrastructure Fund, Class R6 | 1.02% | 16,367,471 | 4,358,362 | – | (2,161,184 | ) | – | 362,772 | 1,597,646 | 18,564,649 | ||||||||||||||||||||||||||||
Invesco International Select Equity Fund, Class R6 | 1.72% | 67,646,310 | 13,800,469 | (32,518,954 | ) | (11,056,082 | ) | (6,490,612 | ) | 313,915 | 3,463,701 | 31,381,131 | ||||||||||||||||||||||||||
Invesco International Small-Mid Company Fund, Class R6 | 3.40% | 88,140,852 | 1,518,950 | – | (27,847,896 | ) | 171,367 | 263,968 | 1,582,891 | 61,811,906 | ||||||||||||||||||||||||||||
Invesco RAFI™ Strategic Developed ex-US ETF | 4.37% | 69,642,948 | 25,337,460 | (5,399,826 | ) | (9,905,456 | ) | (173,474 | ) | 2,516,886 | 2,959,853 | 79,501,652 | ||||||||||||||||||||||||||
Invesco S&P Emerging Markets Low Volatility ETF | 3.69% | 54,913,593 | 26,329,828 | (7,594,814 | ) | (7,338,885 | ) | 747,539 | 2,172,544 | 2,914,266 | 67,057,261 | |||||||||||||||||||||||||||
Invesco S&P International Developed Low Volatility ETF | 0.99% | 73,482,713 | – | (50,725,679 | ) | (9,252,023 | ) | 4,480,973 | 1,191,896 | 671,620 | 17,985,984 | |||||||||||||||||||||||||||
Total Foreign Equity Funds | 807,283,747 | 131,728,213 | (121,107,120 | ) | (205,273,956 | ) | 11,343,439 | 8,636,742 | 600,190,383 | |||||||||||||||||||||||||||||
See accompanying Notes to Financial Statements which are an integral part of the financial statements.
7 Invesco Active Allocation Fund
Invesco Active Allocation Fund (continued)
Schedule of Investments in Affiliated Issuers–99.27%(a)
| % of | Change in | |||||||||||||||||||||||||||||||||||||
| Net | Unrealized | |||||||||||||||||||||||||||||||||||||
| Assets | Value | Purchases | Proceeds | Appreciation | Realized | Dividend | Shares | Value | ||||||||||||||||||||||||||||||
| 12/31/22 | 12/31/21 | at Cost | from Sales | (Depreciation) | Gain (Loss) | Income | 12/31/22 | 12/31/22 | ||||||||||||||||||||||||||||||
Money Market Funds–0.38% |
| |||||||||||||||||||||||||||||||||||||
Invesco Government & Agency Portfolio, Institutional Class, 4.22%(f) | 0.13 | % | $ | 4,221,702 | $ | 72,807,253 | $ | (74,608,068 | ) | $ | – | $ | – | $ | 41,150 | 2,420,887 | $ | 2,420,887 | ||||||||||||||||||||
Invesco Liquid Assets Portfolio, Institutional Class, 4.42%(f) |
| 0.10 | % | 3,015,499 | 52,005,180 | (53,290,782 | ) | 164 | 3 | 39,624 | 1,729,545 | 1,730,064 | ||||||||||||||||||||||||||
Invesco Treasury Portfolio, Institutional Class, 4.20%(f) | 0.15 | % | 4,824,802 | 83,208,289 | (85,266,363 | ) | – | – | 60,625 | 2,766,728 | 2,766,728 | |||||||||||||||||||||||||||
Total Money Market Funds | 12,062,003 | 208,020,722 | (213,165,213 | ) | 164 | 3 | 141,399 | 6,917,679 | ||||||||||||||||||||||||||||||
TOTAL INVESTMENTS IN AFFILIATED ISSUERS (excluding investments purchased with cash collateral from securities on loan) | 99.27 | % | 2,401,248,055 | 595,330,805 | (690,189,682 | ) | (511,684,972 | ) | 40,748,490 | 31,902,577 | 1,806,729,857 | |||||||||||||||||||||||||||
Investments Purchased with Cash Collateral from Securities on Loan | ||||||||||||||||||||||||||||||||||||||
Money Market Funds–0.43% |
| |||||||||||||||||||||||||||||||||||||
Invesco Private Government Fund, 4.28%(f)(g) | 0.12 | % | – | 99,456,756 | (97,264,856 | ) | – | – | 52,178 | (h) | 2,191,900 | 2,191,900 | ||||||||||||||||||||||||||
Invesco Private Prime Fund, 4.46%(f)(g) | 0.31 | % | – | 233,714,612 | (228,083,458 | ) | 248 | 4,911 | 142,721 | (h) | 5,634,623 | 5,636,313 | ||||||||||||||||||||||||||
Total Investments Purchased with Cash Collateral from Securities on Loan | 0.43 | % | – | 333,171,368 | (325,348,314 | ) | 248 | 4,911 | 194,899 | 7,828,213 | ||||||||||||||||||||||||||||
TOTAL INVESTMENTS IN AFFILIATED ISSUERS | 99.70 | % | $ | 2,401,248,055 | $ | 928,502,173 | $ | (1,015,537,996 | ) | $ | (511,684,724 | ) | $ | 40,753,401 | (i) | $ | 32,097,476 | $ | 1,814,558,070 | |||||||||||||||||||
OTHER ASSETS LESS LIABILITIES | 0.30 | % | 5,394,122 | |||||||||||||||||||||||||||||||||||
NET ASSETS | 100.00 | % | $ | 1,819,952,192 | ||||||||||||||||||||||||||||||||||
Investment Abbreviations:
ETF - Exchange-Traded Fund
Notes to Schedule of Investments:
| (a) | Each underlying fund and the Fund are affiliated by either having the same investment adviser or an investment adviser under common control with the Fund’s investment adviser. |
| (b) | Amounts include a return of capital distribution reclassification which reduces dividend income and increases realized gain (loss) and/or change in unrealized appreciation (depreciation). |
| (c) | Non-income producing security. |
| (d) | All or a portion of this security was out on loan at December 31, 2022. |
| (e) | Effective February 28, 2022, the underlying fund’s name changed. |
| (f) | The rate shown is the 7-day SEC standardized yield as of December 31, 2022. |
| (g) | The security has been segregated to satisfy the commitment to return the cash collateral received in securities lending transactions upon the borrower’s return of the securities loaned. See Note 1I. |
| (h) | Represents the income earned on the investment of cash collateral, which is included in securities lending income on the Statement of Operations. Does not include rebates and fees paid to lending agent or premiums received from borrowers, if any. |
| (i) | Includes capital gains distributions from affiliated underlying funds as follows: |
| Fund Name | Capital Gain | |||
Invesco Global Fund | $23,612,573 | |||
Invesco International Small-Mid Company Fund | 171,367 | |||
Invesco Value Opportunities Fund | 4,471,732 | |||
See accompanying Notes to Financial Statements which are an integral part of the financial statements.
8 Invesco Active Allocation Fund
| Open Futures Contracts(a) | ||||||||||||||||||||
| ||||||||||||||||||||
| Long Futures Contracts | Number of Contracts | Expiration Month | Notional Value | Value | Unrealized Appreciation (Depreciation) | |||||||||||||||
| ||||||||||||||||||||
Equity Risk | ||||||||||||||||||||
| ||||||||||||||||||||
MSCI Emerging Markets Index | 429 | March-2023 | $ | 20,579,130 | $ | (358,002 | ) | $ | (358,002 | ) | ||||||||||
| ||||||||||||||||||||
Nikkei 225 Index | 17 | March-2023 | 3,378,238 | (187,811 | ) | (187,811 | ) | |||||||||||||
| ||||||||||||||||||||
S&P/TSX 60 Index | 13 | March-2023 | 2,246,484 | (77,482 | ) | (77,482 | ) | |||||||||||||
| ||||||||||||||||||||
SPI 200 Index | 18 | March-2023 | 2,142,227 | (50,695 | ) | (50,695 | ) | |||||||||||||
| ||||||||||||||||||||
STOXX Europe 600 Index | 437 | March-2023 | 9,919,411 | (296,256 | ) | (296,256 | ) | |||||||||||||
| ||||||||||||||||||||
Subtotal | (970,246 | ) | (970,246 | ) | ||||||||||||||||
| ||||||||||||||||||||
Interest Rate Risk | ||||||||||||||||||||
| ||||||||||||||||||||
U.S. Treasury 10 Year Notes | 263 | March-2023 | 29,534,078 | (147,938 | ) | (147,938 | ) | |||||||||||||
| ||||||||||||||||||||
Subtotal - Long Futures Contracts | (1,118,184 | ) | (1,118,184 | ) | ||||||||||||||||
| ||||||||||||||||||||
Short Futures Contracts | ||||||||||||||||||||
| ||||||||||||||||||||
Equity Risk | ||||||||||||||||||||
| ||||||||||||||||||||
E-Mini S&P 500 Index | 24 | March-2023 | (4,633,200 | ) | 128,651 | 128,651 | ||||||||||||||
| ||||||||||||||||||||
Total Futures Contracts | $ | (989,533 | ) | $ | (989,533 | ) | ||||||||||||||
| ||||||||||||||||||||
| (a) | Futures contracts collateralized by $5,143,577 cash held with Merrill Lynch, the futures commission merchant. |
| Open Forward Foreign Currency Contracts | ||||||||||||||||||||||
| ||||||||||||||||||||||
Settlement Date | Contract to | Unrealized Appreciation | ||||||||||||||||||||
| Counterparty | Deliver | Receive | ||||||||||||||||||||
| ||||||||||||||||||||||
Currency Risk | ||||||||||||||||||||||
| ||||||||||||||||||||||
03/15/2023 | Bank of America, N.A. | CAD | 6,880,000 | USD | 5,106,815 | $ | 22,727 | |||||||||||||||
| ||||||||||||||||||||||
03/15/2023 | Bank of America, N.A. | INR | 498,000,000 | USD | 6,002,170 | 10,223 | ||||||||||||||||
| ||||||||||||||||||||||
03/15/2023 | Bank of America, N.A. | USD | 768,049 | CHF | 715,000 | 11,124 | ||||||||||||||||
| ||||||||||||||||||||||
03/15/2023 | Bank of America, N.A. | USD | 3,253,880 | DKK | 22,850,000 | 53,105 | ||||||||||||||||
| ||||||||||||||||||||||
03/15/2023 | Bank of America, N.A. | USD | 5,213,699 | NOK | 51,400,000 | 48,717 | ||||||||||||||||
| ||||||||||||||||||||||
03/15/2023 | Barclays Bank PLC | USD | 4,608,475 | HKD | 36,000,000 | 9,805 | ||||||||||||||||
| ||||||||||||||||||||||
03/15/2023 | Barclays Bank PLC | USD | 8,934,703 | SGD | 12,100,000 | 109,313 | ||||||||||||||||
| ||||||||||||||||||||||
03/02/2023 | Citibank N.A. | USD | 8,657,378 | BRL | 46,665,000 | 88,323 | ||||||||||||||||
| ||||||||||||||||||||||
03/15/2023 | Citibank N.A. | TWD | 261,000,000 | USD | 8,723,874 | 169,103 | ||||||||||||||||
| ||||||||||||||||||||||
03/15/2023 | Citibank N.A. | USD | 9,425,490 | IDR | 147,245,000,000 | 78,395 | ||||||||||||||||
| ||||||||||||||||||||||
03/16/2023 | Citibank N.A. | USD | 5,433,654 | HUF | 2,187,900,000 | 314,991 | ||||||||||||||||
| ||||||||||||||||||||||
03/15/2023 | Deutsche Bank AG | USD | 71,023 | CZK | 1,650,000 | 1,715 | ||||||||||||||||
| ||||||||||||||||||||||
03/15/2023 | Deutsche Bank AG | USD | 5,770,451 | JPY | 777,820,000 | 211,813 | ||||||||||||||||
| ||||||||||||||||||||||
03/15/2023 | Deutsche Bank AG | USD | 5,668,123 | PLN | 25,680,000 | 158,508 | ||||||||||||||||
| ||||||||||||||||||||||
03/15/2023 | Deutsche Bank AG | USD | 4,318,446 | ZAR | 76,080,000 | 132,510 | ||||||||||||||||
| ||||||||||||||||||||||
03/15/2023 | JP Morgan Chase Bank, N.A. | USD | 3,231,755 | CAD | 4,380,000 | 4,917 | ||||||||||||||||
| ||||||||||||||||||||||
03/15/2023 | Morgan Stanley and Co. International PLC | USD | 14,100,400 | EUR | 13,465,000 | 382,335 | ||||||||||||||||
| ||||||||||||||||||||||
03/15/2023 | Morgan Stanley and Co. International PLC | USD | 2,671,082 | GBP | 2,220,000 | 17,456 | ||||||||||||||||
| ||||||||||||||||||||||
03/15/2023 | Morgan Stanley and Co. International PLC | USD | 206,360 | MXN | 4,135,000 | 3,144 | ||||||||||||||||
| ||||||||||||||||||||||
Subtotal-Appreciation |
| 1,828,224 | ||||||||||||||||||||
| ||||||||||||||||||||||
Currency Risk | ||||||||||||||||||||||
03/15/2023 | Bank of America, N.A. | AUD | 4,390,000 | USD | 2,960,337 | (37,033 | ) | |||||||||||||||
| ||||||||||||||||||||||
03/15/2023 | Bank of America, N.A. | CLP | 205,000,000 | USD | 229,563 | (9,935 | ) | |||||||||||||||
| ||||||||||||||||||||||
03/15/2023 | Bank of America, N.A. | KRW | 8,256,310,000 | USD | 6,350,306 | (216,439 | ) | |||||||||||||||
| ||||||||||||||||||||||
03/15/2023 | Bank of America, N.A. | SGD | 4,345,000 | USD | 3,166,007 | (81,617 | ) | |||||||||||||||
| ||||||||||||||||||||||
03/15/2023 | Bank of America, N.A. | USD | 4,602,461 | INR | 381,590,000 | (11,161 | ) | |||||||||||||||
| ||||||||||||||||||||||
03/15/2023 | Barclays Bank PLC | ZAR | 83,315,000 | USD | 4,778,606 | (95,623 | ) | |||||||||||||||
| ||||||||||||||||||||||
03/15/2023 | BNP Paribas S.A. | IDR | 67,670,000,000 | USD | 4,344,951 | (22,789 | ) | |||||||||||||||
| ||||||||||||||||||||||
03/02/2023 | Citibank N.A. | BRL | 20,000,000 | USD | 3,737,905 | (10,386 | ) | |||||||||||||||
| ||||||||||||||||||||||
See accompanying Notes to Financial Statements which are an integral part of the financial statements.
9 Invesco Active Allocation Fund
| Open Forward Foreign Currency Contracts–(continued) | ||||||||||||||||||||||
| ||||||||||||||||||||||
Settlement Date | Contract to | Unrealized Appreciation | ||||||||||||||||||||
| Counterparty | Deliver | Receive | ||||||||||||||||||||
| ||||||||||||||||||||||
03/15/2023 | Citibank N.A. | THB | 185,930,000 | USD | 5,368,657 | $ | (36,150 | ) | ||||||||||||||
| ||||||||||||||||||||||
03/15/2023 | Deutsche Bank AG | CHF | 3,780,000 | USD | 4,028,776 | (90,491 | ) | |||||||||||||||
| ||||||||||||||||||||||
03/15/2023 | Goldman Sachs International | USD | 1,827,311 | TWD | 55,225,000 | (17,207 | ) | |||||||||||||||
| ||||||||||||||||||||||
03/15/2023 | JP Morgan Chase Bank, N.A. | CNY | 5,300,000 | USD | 765,587 | (4,556 | ) | |||||||||||||||
| ||||||||||||||||||||||
03/15/2023 | JP Morgan Chase Bank, N.A. | DKK | 17,250,000 | USD | 2,429,444 | (67,076 | ) | |||||||||||||||
| ||||||||||||||||||||||
03/15/2023 | JP Morgan Chase Bank, N.A. | PHP | 277,080,000 | USD | 4,901,035 | (64,882 | ) | |||||||||||||||
| ||||||||||||||||||||||
03/15/2023 | JP Morgan Chase Bank, N.A. | USD | 5,167,163 | COP | 25,146,000,000 | (49,480 | ) | |||||||||||||||
| ||||||||||||||||||||||
03/15/2023 | Morgan Stanley and Co. International PLC | CNY | 31,175,000 | USD | 4,392,936 | (137,099 | ) | |||||||||||||||
| ||||||||||||||||||||||
03/15/2023 | Morgan Stanley and Co. International PLC | JPY | 729,200,000 | USD | 5,410,856 | (197,469 | ) | |||||||||||||||
| ||||||||||||||||||||||
03/15/2023 | Morgan Stanley and Co. International PLC | USD | 6,101,472 | GBP | 4,990,000 | (58,318 | ) | |||||||||||||||
| ||||||||||||||||||||||
03/15/2023 | Morgan Stanley and Co. International PLC | USD | 4,859,942 | SEK | 49,950,000 | (53,986 | ) | |||||||||||||||
| ||||||||||||||||||||||
03/15/2023 | UBS AG | NZD | 8,885,000 | USD | 5,555,426 | (90,144 | ) | |||||||||||||||
| ||||||||||||||||||||||
Subtotal - Depreciation | (1,351,841 | ) | ||||||||||||||||||||
| ||||||||||||||||||||||
Total Forward Foreign Currency Contracts | $ | 476,383 | ||||||||||||||||||||
| ||||||||||||||||||||||
| Open Centrally Cleared Credit Default Swap Agreements(a) | ||||||||||||||||||||||||||||||||||||||||
| ||||||||||||||||||||||||||||||||||||||||
| Reference Entity | Buy/Sell Protection | (Pay)/ Receive Fixed Rate | Payment Frequency | Maturity Date | Implied Credit Spread(b) | Notional Value | Upfront Payments Paid (Received) | Value | Unrealized (Depreciation) | |||||||||||||||||||||||||||||||
| ||||||||||||||||||||||||||||||||||||||||
Credit Risk | ||||||||||||||||||||||||||||||||||||||||
| ||||||||||||||||||||||||||||||||||||||||
Markit CDX Emerging Markets Index, Series 38, Version 1 | Sell | 1.00% | Quarterly | 12/20/2027 | 2.3878 | % | USD | 40,850,000 | $ | (2,535,568 | ) | $ | (2,389,970 | ) | $145,598 | |||||||||||||||||||||||||
| ||||||||||||||||||||||||||||||||||||||||
Markit CDX North America High Yield Index, Series 39, Version 1 | Sell | 5.00 | Quarterly | 12/20/2027 | 4.8491 | % | USD | 35,430,000 | 106,137 | 218,178 | 112,041 | |||||||||||||||||||||||||||||
| ||||||||||||||||||||||||||||||||||||||||
Subtotal - Appreciation | (2,429,431 | ) | (2,171,792 | ) | 257,639 | |||||||||||||||||||||||||||||||||||
| ||||||||||||||||||||||||||||||||||||||||
Credit Risk | ||||||||||||||||||||||||||||||||||||||||
| ||||||||||||||||||||||||||||||||||||||||
Markit CDX North America Investment Grade Index, Series 39, Version 1 | Buy | (1.00) | Quarterly | 12/20/2027 | 0.8188 | % | USD | 96,120,000 | (695,137 | ) | (768,576 | ) | (73,439) | |||||||||||||||||||||||||||
| ||||||||||||||||||||||||||||||||||||||||
Total Centrally Cleared Credit Default Swap Agreements |
| $ | (3,124,568 | ) | $ | (2,940,368 | ) | $184,200 | ||||||||||||||||||||||||||||||||
| ||||||||||||||||||||||||||||||||||||||||
| (a) | Centrally cleared swap agreements collateralized by $7,200,666 cash held with J.P. Morgan Chase Bank, N.A.. |
| (b) | Implied credit spreads represent the current level, as of December 31, 2022, at which protection could be bought or sold given the terms of the existing credit default swap agreement and serve as an indicator of the current status of the payment/performance risk of the credit default swap agreement. An implied credit spread that has widened or increased since entry into the initial agreement may indicate a deteriorating credit profile and increased risk of default for the reference entity. A declining or narrowing spread may indicate an improving credit profile or decreased risk of default for the reference entity. Alternatively, credit spreads may increase or decrease reflecting the general tolerance for risk in the credit markets generally. |
See accompanying Notes to Financial Statements which are an integral part of the financial statements.
10 Invesco Active Allocation Fund
Abbreviations:
| AUD | –Australian Dollar | |
| BRL | –Brazilian Real | |
| CAD | –Canadian Dollar | |
| CHF | –Swiss Franc | |
| CLP | –Chile Peso | |
| CNY | –Chinese Yuan Renminbi | |
| COP | –Colombia Peso | |
| CZK | –Czech Koruna | |
| DKK | –Danish Krone | |
| EUR | –Euro | |
| GBP | –British Pound Sterling | |
| HKD | –Hong Kong Dollar | |
| HUF | –Hungarian Forint | |
| IDR | –Indonesian Rupiah | |
| INR | –Indian Rupee | |
| JPY | –Japanese Yen | |
| KRW | –South Korean Won | |
| MXN | –Mexican Peso | |
| NOK | –Norwegian Krone | |
| NZD | –New Zealand Dollar | |
| PHP | –Philippines Peso | |
| PLN | –Polish Zloty | |
| SEK | –Swedish Krona | |
| SGD | –Singapore Dollar | |
| THB | –Thai Baht | |
| TWD | –New Taiwan Dollar | |
| USD | –U.S. Dollar | |
| ZAR | –South African Rand |
See accompanying Notes to Financial Statements which are an integral part of the financial statements.
11 Invesco Active Allocation Fund
Statement of Assets and Liabilities
December 31, 2022
Assets: | ||||
Investments in affiliated underlying funds, at value | $ | 1,814,558,070 | ||
| ||||
Other investments: | ||||
Variation margin receivable – futures contracts | 354,200 | |||
| ||||
Variation margin receivable – centrally cleared swap agreements | 8,580 | |||
| ||||
Unrealized appreciation on forward foreign currency contracts outstanding | 1,828,224 | |||
| ||||
Deposits with brokers: | ||||
Cash collateral – exchange-traded futures contracts | 5,143,577 | |||
| ||||
Cash collateral – centrally cleared swap agreements | 7,200,666 | |||
| ||||
Cash collateral – OTC Derivatives | 810,000 | |||
| ||||
Cash | 314,480 | |||
| ||||
Receivable for: | ||||
Fund shares sold | 958,775 | |||
| ||||
Dividends - affiliated underlying funds | 1,789,799 | |||
| ||||
Investment for trustee deferred compensation and retirement plans | 111,656 | |||
| ||||
Other assets | 64,852 | |||
| ||||
Total assets | 1,833,142,879 | |||
| ||||
Liabilities: | ||||
Other investments: | ||||
Unrealized depreciation on forward foreign currency contracts outstanding | 1,351,841 | |||
| ||||
Payable for: | ||||
Investments purchased - affiliated underlying funds | 1,747,256 | |||
| ||||
Fund shares reacquired | 1,179,749 | |||
| ||||
Collateral upon return of securities loaned | 7,827,965 | |||
| ||||
Accrued fees to affiliates | 826,747 | |||
| ||||
Accrued trustees’ and officers’ fees and benefits | 48,792 | |||
| ||||
Accrued other operating expenses | 96,681 | |||
| ||||
Trustee deferred compensation and retirement plans | 111,656 | |||
| ||||
Total liabilities | 13,190,687 | |||
| ||||
Net assets applicable to shares outstanding | $ | 1,819,952,192 | ||
| ||||
Net assets consist of: | ||||
Shares of beneficial interest | $ | 1,762,599,700 | ||
Distributable earnings | 57,352,492 | |||
| ||||
| $ | 1,819,952,192 | |||
| ||||
Net Assets: | ||||
Class A | $ | 1,498,860,952 | ||
| ||||
Class C | $ | 167,991,385 | ||
| ||||
Class R | $ | 127,967,547 | ||
| ||||
Class Y | $ | 25,095,402 | ||
| ||||
Class R5 | $ | 9,618 | ||
| ||||
Class R6 | $ | 27,288 | ||
| ||||
Shares outstanding, no par value, with an unlimited number of shares authorized: |
| |||
Class A | 126,091,576 | |||
| ||||
Class C | 14,519,856 | |||
| ||||
Class R | 10,841,483 | |||
| ||||
Class Y | 2,072,280 | |||
| ||||
Class R5 | 810 | |||
| ||||
Class R6 | 2,301 | |||
| ||||
Class A: | ||||
Net asset value per share | $ | 11.89 | ||
| ||||
Maximum offering price per share | $ | 12.58 | ||
| ||||
Class C: | ||||
Net asset value and offering price per share | $ | 11.57 | ||
| ||||
Class R: | ||||
Net asset value and offering price per share | $ | 11.80 | ||
| ||||
Class Y: | ||||
Net asset value and offering price per share | $ | 12.11 | ||
| ||||
Class R5: | ||||
Net asset value and offering price per share | $ | 11.87 | ||
| ||||
Class R6: | ||||
Net asset value and offering price per share | $ | 11.86 | ||
| ||||
| * | At December 31, 2022, security with a value of $7,617,873 was on loan to brokers. |
See accompanying Notes to Financial Statements which are an integral part of the financial statements.
12 Invesco Active Allocation Fund
Statement of Operations
For the year ended December 31, 2022
Investment income: | ||||
Dividends from affiliated underlying funds (includes net securities lending income of $ 159,979) | $ | 32,062,556 | ||
| ||||
Interest | 547,587 | |||
| ||||
Total investment income | 32,610,143 | |||
| ||||
Expenses: | ||||
Advisory fees | 1,688,038 | |||
| ||||
Administrative services fees | 284,118 | |||
| ||||
Custodian fees | 135,953 | |||
| ||||
Distribution fees: | ||||
Class A | 3,904,111 | |||
| ||||
Class C | 1,917,657 | |||
| ||||
Class R | 684,174 | |||
| ||||
Transfer agent fees – A, C, R and Y | 2,031,072 | |||
| ||||
Transfer agent fees – R5 | 4 | |||
| ||||
Transfer agent fees – R6 | 17 | |||
| ||||
Trustees’ and officers’ fees and benefits | 39,301 | |||
| ||||
Registration and filing fees | 148,321 | |||
| ||||
Reports to shareholders | 177,072 | |||
| ||||
Professional services fees | 37,323 | |||
| ||||
Other | 20,886 | |||
| ||||
Total expenses | 11,068,047 | |||
| ||||
Less: Fees waived and/or expense offset arrangement(s) | (32,428 | ) | ||
| ||||
Net expenses | 11,035,619 | |||
| ||||
Net investment income | 21,574,524 | |||
| ||||
Realized and unrealized gain (loss) from: | ||||
Net realized gain (loss) from: | ||||
Affiliated underlying fund shares | 12,497,729 | |||
| ||||
Foreign currencies | 1 | |||
| ||||
Forward foreign currency contracts | 2,209,404 | |||
| ||||
Futures contracts | (10,740,763 | ) | ||
| ||||
Swap agreements | (4,016,375 | ) | ||
| ||||
Capital gain distributions from affiliated underlying fund shares | 28,255,672 | |||
| ||||
| 28,205,668 | ||||
| ||||
Change in net unrealized appreciation (depreciation) of: | ||||
Affiliated underlying fund shares | (511,684,724 | ) | ||
| ||||
Foreign currencies | 509,552 | |||
| ||||
Forward foreign currency contracts | 949,565 | |||
| ||||
Futures contracts | (2,504,560 | ) | ||
| ||||
Swap agreements | (264,003 | ) | ||
| ||||
| (512,994,170 | ) | |||
| ||||
Net realized and unrealized gain (loss) | (484,788,502 | ) | ||
| ||||
Net increase (decrease) in net assets resulting from operations | $ | (463,213,978 | ) | |
| ||||
See accompanying Notes to Financial Statements which are an integral part of the financial statements.
13 Invesco Active Allocation Fund
Statement of Changes in Net Assets
For the years ended December 31, 2022 and 2021
| 2022 | 2021 | |||||||
| ||||||||
Operations: | ||||||||
Net investment income | $ | 21,574,524 | $ | 13,254,181 | ||||
| ||||||||
Net realized gain | 28,205,668 | 200,051,488 | ||||||
| ||||||||
Change in net unrealized appreciation (depreciation) | (512,994,170 | ) | 106,402,626 | |||||
| ||||||||
Net increase (decrease) in net assets resulting from operations | (463,213,978 | ) | 319,708,295 | |||||
| ||||||||
Distributions to shareholders from distributable earnings: | ||||||||
Class A | (66,983,477 | ) | (153,175,119 | ) | ||||
| ||||||||
Class C | (6,373,062 | ) | (18,154,278 | ) | ||||
| ||||||||
Class R | (5,367,820 | ) | (12,616,970 | ) | ||||
| ||||||||
Class Y | (1,201,353 | ) | (2,531,897 | ) | ||||
| ||||||||
Class R5 | (477 | ) | (943 | ) | ||||
| ||||||||
Class R6 | (1,311 | ) | (1,184 | ) | ||||
| ||||||||
Total distributions from distributable earnings | (79,927,500 | ) | (186,480,391 | ) | ||||
| ||||||||
Share transactions–net: | ||||||||
Class A | (30,892,240 | ) | (109,520,434 | ) | ||||
| ||||||||
Class C | (25,738,511 | ) | (29,604,925 | ) | ||||
| ||||||||
Class R | (1,315,735 | ) | 11,774,429 | |||||
| ||||||||
Class Y | 553,590 | 2,145,797 | ||||||
| ||||||||
Class R5 | 1,497 | – | ||||||
| ||||||||
Class R6 | 17,817 | 3,174 | ||||||
| ||||||||
Net increase (decrease) in net assets resulting from share transactions | (57,373,582 | ) | (125,201,959 | ) | ||||
| ||||||||
Net increase (decrease) in net assets | (600,515,060 | ) | 8,025,945 | |||||
| ||||||||
Net assets: | ||||||||
Beginning of year | 2,420,467,252 | 2,412,441,307 | ||||||
| ||||||||
End of year | $ | 1,819,952,192 | $ | 2,420,467,252 | ||||
| ||||||||
See accompanying Notes to Financial Statements which are an integral part of the financial statements.
14 Invesco Active Allocation Fund
The following schedule presents financial highlights for a share of the Fund outstanding throughout the periods indicated.
| Net asset value, beginning of period | Net investment income (loss)(a) | Net gains (losses) on securities (both realized and unrealized) | Total from investment operations | Dividends from net investment income | Distributions from net realized gains | Total distributions | Net asset value, end of period | Total return(b) | Net assets, end of period (000’s omitted) | Ratio of fee waivers | Ratio of expenses to average net assets without fee waivers and/or expenses absorbed(d) | Ratio of net investment income (loss) to average net assets | Portfolio turnover (e) | |||||||||||||||||||||||||||||||||||||||||||||||||||||||||
Class A | ||||||||||||||||||||||||||||||||||||||||||||||||||||||||||||||||||||||
Year ended 12/31/22 | $ | 15.42 | $ | 0.15 | $ | (3.12 | ) | $ | (2.97 | ) | $ | (0.17 | ) | $ | (0.39 | ) | $ | (0.56 | ) | $ | 11.89 | (19.32 | )%(f) | $ | 1,498,861 | 0.47 | %(f) | 0.47 | %(f) | 1.18 | %(f) | 20 | % | |||||||||||||||||||||||||||||||||||||
Year ended 12/31/21 | 14.70 | 0.10 | 1.92 | 2.02 | (0.32 | ) | (0.98 | ) | (1.30 | ) | 15.42 | 13.92 | (f) | 1,973,745 | 0.45 | (f) | 0.47 | (f) | 0.64 | (f) | 16 | |||||||||||||||||||||||||||||||||||||||||||||||||
Year ended 12/31/20 | 14.66 | 0.13 | 1.76 | 1.89 | (0.14 | ) | (1.71 | ) | (1.85 | ) | 14.70 | 13.04 | (f) | 1,973,119 | 0.44 | (f) | 0.48 | (f) | 0.94 | (f) | 70 | |||||||||||||||||||||||||||||||||||||||||||||||||
Eleven months ended 12/31/19 | 13.89 | 0.21 | 1.85 | 2.06 | (0.44 | ) | (0.85 | ) | (1.29 | ) | 14.66 | 14.84 | 1,867,751 | 0.52 | (g) | 0.56 | (g) | 1.52 | (g) | 24 | ||||||||||||||||||||||||||||||||||||||||||||||||||
Year ended 01/31/19 | 15.25 | 0.15 | (1.27 | ) | (1.12 | ) | (0.24 | ) | – | (0.24 | ) | 13.89 | (7.22 | ) | 1,636,759 | 0.53 | 0.57 | 1.04 | 38 | |||||||||||||||||||||||||||||||||||||||||||||||||||
Year ended 01/31/18 | 12.68 | 0.10 | 2.63 | 2.73 | (0.16 | ) | – | (0.16 | ) | 15.25 | 21.62 | 1,888,596 | 0.53 | 0.59 | 0.75 | 9 | ||||||||||||||||||||||||||||||||||||||||||||||||||||||
Class C | ||||||||||||||||||||||||||||||||||||||||||||||||||||||||||||||||||||||
Year ended 12/31/22 | 15.01 | 0.05 | (3.03 | ) | (2.98 | ) | (0.07 | ) | (0.39 | ) | (0.46 | ) | 11.57 | (19.93 | ) | 167,991 | 1.23 | 1.23 | 0.42 | 20 | ||||||||||||||||||||||||||||||||||||||||||||||||||
Year ended 12/31/21 | 14.34 | (0.02 | ) | 1.86 | 1.84 | (0.19 | ) | (0.98 | ) | (1.17 | ) | 15.01 | 13.01 | 247,857 | 1.21 | 1.23 | (0.12 | ) | 16 | |||||||||||||||||||||||||||||||||||||||||||||||||||
Year ended 12/31/20 | 14.35 | 0.02 | 1.70 | 1.72 | (0.02 | ) | (1.71 | ) | (1.73 | ) | 14.34 | 12.18 | 263,343 | 1.20 | 1.24 | 0.18 | 70 | |||||||||||||||||||||||||||||||||||||||||||||||||||||
Eleven months ended 12/31/19 | 13.60 | 0.10 | 1.81 | 1.91 | (0.31 | ) | (0.85 | ) | (1.16 | ) | 14.35 | 14.09 | 342,957 | 1.28 | (g) | 1.32 | (g) | 0.76 | (g) | 24 | ||||||||||||||||||||||||||||||||||||||||||||||||||
Year ended 01/31/19 | 14.92 | 0.04 | (1.23 | ) | (1.19 | ) | (0.13 | ) | – | (0.13 | ) | 13.60 | (7.92 | ) | 489,474 | 1.28 | 1.32 | 0.28 | 38 | |||||||||||||||||||||||||||||||||||||||||||||||||||
Year ended 01/31/18 | 12.41 | (0.00 | ) | 2.57 | 2.57 | (0.06 | ) | – | (0.06 | ) | 14.92 | 20.72 | 579,999 | 1.28 | 1.34 | (0.03 | ) | 9 | ||||||||||||||||||||||||||||||||||||||||||||||||||||
Class R | ||||||||||||||||||||||||||||||||||||||||||||||||||||||||||||||||||||||
Year ended 12/31/22 | 15.31 | 0.12 | (3.11 | ) | (2.99 | ) | (0.13 | ) | (0.39 | ) | (0.52 | ) | 11.80 | (19.56 | ) | 127,968 | 0.73 | 0.73 | 0.92 | 20 | ||||||||||||||||||||||||||||||||||||||||||||||||||
Year ended 12/31/21 | 14.60 | 0.06 | 1.91 | 1.97 | (0.28 | ) | (0.98 | ) | (1.26 | ) | 15.31 | 13.64 | 166,900 | 0.71 | 0.73 | 0.38 | 16 | |||||||||||||||||||||||||||||||||||||||||||||||||||||
Year ended 12/31/20 | 14.58 | 0.09 | 1.74 | 1.83 | (0.10 | ) | (1.71 | ) | (1.81 | ) | 14.60 | 12.70 | 147,675 | 0.70 | 0.74 | 0.68 | 70 | |||||||||||||||||||||||||||||||||||||||||||||||||||||
Eleven months ended 12/31/19 | 13.82 | 0.17 | 1.83 | 2.00 | (0.39 | ) | (0.85 | ) | (1.24 | ) | 14.58 | 14.54 | 139,693 | 0.77 | (g) | 0.81 | (g) | 1.27 | (g) | 24 | ||||||||||||||||||||||||||||||||||||||||||||||||||
Year ended 01/31/19 | 15.17 | 0.11 | (1.26 | ) | (1.15 | ) | (0.20 | ) | – | (0.20 | ) | 13.82 | (7.44 | ) | 125,162 | 0.78 | 0.82 | 0.78 | 38 | |||||||||||||||||||||||||||||||||||||||||||||||||||
Year ended 01/31/18 | 12.62 | 0.07 | 2.61 | 2.68 | (0.13 | ) | – | (0.13 | ) | 15.17 | 21.28 | 134,457 | 0.78 | 0.84 | 0.49 | 9 | ||||||||||||||||||||||||||||||||||||||||||||||||||||||
Class Y | ||||||||||||||||||||||||||||||||||||||||||||||||||||||||||||||||||||||
Year ended 12/31/22 | 15.70 | 0.19 | (3.19 | ) | (3.00 | ) | (0.20 | ) | (0.39 | ) | (0.59 | ) | 12.11 | (19.15 | ) | 25,095 | 0.23 | 0.23 | 1.42 | 20 | ||||||||||||||||||||||||||||||||||||||||||||||||||
Year ended 12/31/21 | 14.94 | 0.14 | 1.96 | 2.10 | (0.36 | ) | (0.98 | ) | (1.34 | ) | 15.70 | 14.24 | 31,941 | 0.21 | 0.23 | 0.88 | 16 | |||||||||||||||||||||||||||||||||||||||||||||||||||||
Year ended 12/31/20 | 14.88 | 0.17 | 1.77 | 1.94 | (0.17 | ) | (1.71 | ) | (1.88 | ) | 14.94 | 13.22 | 28,284 | 0.20 | 0.24 | 1.18 | 70 | |||||||||||||||||||||||||||||||||||||||||||||||||||||
Eleven months ended 12/31/19 | 14.08 | 0.24 | 1.88 | 2.12 | (0.47 | ) | (0.85 | ) | (1.32 | ) | 14.88 | 15.11 | 26,168 | 0.28 | (g) | 0.32 | (g) | 1.76 | (g) | 24 | ||||||||||||||||||||||||||||||||||||||||||||||||||
Year ended 01/31/19 | 15.42 | 0.19 | (1.29 | ) | (1.10 | ) | (0.24 | ) | – | (0.24 | ) | 14.08 | (7.00 | ) | 24,190 | 0.29 | 0.33 | 1.28 | 38 | |||||||||||||||||||||||||||||||||||||||||||||||||||
Year ended 01/31/18 | 12.81 | 0.13 | 2.68 | 2.81 | (0.20 | ) | – | (0.20 | ) | 15.42 | 21.98 | 63,523 | 0.28 | 0.34 | 0.90 | 9 | ||||||||||||||||||||||||||||||||||||||||||||||||||||||
Class R5 | ||||||||||||||||||||||||||||||||||||||||||||||||||||||||||||||||||||||
Year ended 12/31/22 | 15.39 | 0.19 | (3.12 | ) | (2.93 | ) | (0.20 | ) | (0.39 | ) | (0.59 | ) | 11.87 | (19.08 | ) | 10 | 0.17 | 0.17 | 1.48 | 20 | ||||||||||||||||||||||||||||||||||||||||||||||||||
Year ended 12/31/21 | 14.68 | 0.14 | 1.92 | 2.06 | (0.37 | ) | (0.98 | ) | (1.35 | ) | 15.39 | 14.19 | 11 | 0.19 | 0.21 | 0.90 | 16 | |||||||||||||||||||||||||||||||||||||||||||||||||||||
Year ended 12/31/20 | 14.65 | 0.17 | 1.75 | 1.92 | (0.18 | ) | (1.71 | ) | (1.89 | ) | 14.68 | 13.29 | 10 | 0.18 | 0.22 | 1.20 | 70 | |||||||||||||||||||||||||||||||||||||||||||||||||||||
Period ended 12/31/19(h) | 14.28 | 0.16 | 1.54 | 1.70 | (0.48 | ) | (0.85 | ) | (1.33 | ) | 14.65 | 11.94 | 10 | 0.22 | (g) | 0.26 | (g) | 1.82 | (g) | 24 | ||||||||||||||||||||||||||||||||||||||||||||||||||
Class R6 | ||||||||||||||||||||||||||||||||||||||||||||||||||||||||||||||||||||||
Year ended 12/31/22 | 15.39 | 0.18 | (3.12 | ) | (2.94 | ) | (0.20 | ) | (0.39 | ) | (0.59 | ) | 11.86 | (19.14 | ) | 27 | 0.23 | 0.23 | 1.42 | 20 | ||||||||||||||||||||||||||||||||||||||||||||||||||
Year ended 12/31/21 | 14.67 | 0.14 | 1.93 | 2.07 | (0.37 | ) | (0.98 | ) | (1.35 | ) | 15.39 | 14.29 | 14 | 0.19 | 0.21 | 0.90 | 16 | |||||||||||||||||||||||||||||||||||||||||||||||||||||
Year ended 12/31/20 | 14.65 | 0.17 | 1.75 | 1.92 | (0.19 | ) | (1.71 | ) | (1.90 | ) | 14.67 | 13.25 | 10 | 0.17 | 0.22 | 1.21 | 70 | |||||||||||||||||||||||||||||||||||||||||||||||||||||
Period ended 12/31/19(h) | 14.28 | 0.17 | 1.54 | 1.71 | (0.49 | ) | (0.85 | ) | (1.34 | ) | 14.65 | 12.02 | 10 | 0.14 | (g) | 0.18 | (g) | 1.90 | (g) | 24 | ||||||||||||||||||||||||||||||||||||||||||||||||||
| (a) | Calculated using average shares outstanding. |
| (b) | Includes adjustments in accordance with accounting principles generally accepted in the United States of America and as such, the net asset value for financial reporting purposes and the returns based upon those net asset values may differ from the net asset value and returns for shareholder transactions. Does not include sales charges and is not annualized for periods less than one year, if applicable. |
| (c) | In addition to the fees and expenses which the Fund bears directly, the Fund indirectly bears a pro rata share of the fees and expenses of the underlying funds in which the Fund invests. Because the underlying funds have varied expenses and fee levels and the Fund may own different proportions at different times, the amount of fees and expenses incurred indirectly by the Fund will vary. Estimated underlying fund expenses are not expenses that are incurred directly by the Fund. They are expenses that are incurred directly by the underlying funds and are deducted from the value of the funds the Fund invests in. The effect of the estimated underlying fund expenses that the Fund bears indirectly is included in the Fund’s total return. Estimated acquired fund fees from underlying funds was 0.49%, 0.53% and 0.63% for the years ended December 31, 2022, 2021 and 2020, respectively. |
| (d) | Does not include indirect expenses from affiliated fund fees and expenses of 0.62%, 0.63% and 0.63% for the eleven months ended December 31, 2019, and for the years ended January 31, 2019 and 2018, respectively. |
| (e) | Portfolio turnover is calculated at the fund level and is not annualized for periods less than one year, if applicable. |
| (f) | The total return, ratio of expenses to average net assets and ratio of net investment income to average net assets reflect actual 12b-1 fees of 0.24% for the years ended December 31, 2022, 2021 and 2020. |
| (g) | Annualized. |
| (h) | Commencement date after the close of business on May 24, 2019. |
See accompanying Notes to Financial Statements which are an integral part of the financial statements.
15 Invesco Active Allocation Fund
December 31, 2022
NOTE 1–Significant Accounting Policies
Invesco Active Allocation Fund (the “Fund”) is a series portfolio of AIM Growth Series (Invesco Growth Series) (the “Trust”). The Trust is a Delaware statutory trust registered under the Investment Company Act of 1940, as amended (the “1940 Act”), as an open-end series management investment company authorized to issue an unlimited number of shares of beneficial interest. Information presented in these financial statements pertains only to the Fund. Matters affecting the Fund or each class will be voted on exclusively by the shareholders of the Fund or each class.
The Fund’s investment objective is to seek total return.
The Fund is a “fund of funds”, in that it invests in other mutual funds (“underlying funds”) advised by Invesco Advisers, Inc. (the “Adviser” or “Invesco”) and exchange-traded funds advised by Invesco Capital Management LLC (“Invesco Capital”). Invesco and Invesco Capital are affiliates of each other as they are indirect, wholly-owned subsidiaries of Invesco Ltd. Invesco may change the Fund’s asset class allocations, the underlying funds or the target weightings in the underlying funds without shareholder approval. The underlying funds may engage in a number of investment techniques and practices, which involve certain risks. Each underlying fund’s accounting policies are outlined in the underlying fund’s financial statements and are publicly available.
The Fund currently consists of six different classes of shares: Class A, Class C, Class R, Class Y, Class R5 and Class R6. Class Y shares are available only to certain investors. Class A shares are sold with a front-end sales charge unless certain waiver criteria are met. Under certain circumstances, load waived shares may be subject to contingent deferred sales charges (“CDSC”). Class C shares are sold with a CDSC. Class R, Class Y, Class R5 and Class R6 shares are sold at net asset value. Class C shares held for eight years after purchase are eligible for automatic conversion into Class A shares of the same Fund (the “Conversion Feature”). The automatic conversion pursuant to the Conversion Feature will generally occur at the end of the month following the eighth anniversary after a purchase of Class C shares.
The Fund is an investment company and accordingly follows the investment company accounting and reporting guidance in accordance with Financial Accounting Standards Board Accounting Standards Codification Topic 946, Financial Services – Investment Companies.
The following is a summary of the significant accounting policies followed by the Fund in the preparation of its financial statements.
| A. | Security Valuations – Securities of investment companies listed or traded on an exchange are generally valued at the trade price or official closing price that day as of the close of the exchange where the security is principally traded, or lacking any trades or official closing price on a particular day, the security may be valued at the closing bid price on that day. Securities of investment companies that are not exchange-traded (e.g., open-end mutual funds) are valued using such company’s end-of-business-day net asset value per share. Securities in the underlying funds, including restricted securities, are valued in accordance with the valuation policy of such fund. The policies of the underlying funds affiliated with the Fund, as a result of having the same investment adviser, are set forth below. |
A security listed or traded on an exchange is generally valued at its trade price or official closing price that day as of the close of the exchange where the security is principally traded, or lacking any trades or official closing price on a particular day, the security may be valued at the closing bid price on that day. Securities traded in the over-the-counter market are valued based on prices furnished by independent pricing services or market makers. When such securities are valued using prices provided by an independent pricing service they may be considered fair valued. Futures contracts are valued at the daily settlement price set by an exchange on which they are principally traded. U.S. exchange-traded options are valued at the mean between the last bid and asked prices from the exchange on which they are principally traded. Non-U.S. exchange-traded options are valued at the final settlement price set by the exchange on which they trade. Options not listed on an exchange and swaps generally are valued using pricing provided from independent pricing services.
Variable rate senior loan interests are fair valued using quotes provided by an independent pricing service. Quotes provided by the pricing service may reflect appropriate factors such as ratings, tranche type, industry, company performance, spread, individual trading characteristics, institution-size trading in similar groups of securities and other market data.
Securities of investment companies that are not exchange-traded (e.g., open-end mutual funds) are valued using such company’s end-of-business-day net asset value per share.
Deposits, other obligations of U.S. and non-U.S. banks and financial institutions are valued at their daily account value.
Fixed income securities (including convertible debt securities) generally are valued on the basis of prices provided by independent pricing services. Prices provided by the pricing service may be determined without exclusive reliance on quoted prices, and may reflect appropriate factors such as institution-size trading in similar groups of securities, developments related to specific securities, dividend rate (for unlisted equities), yield (for debt obligations), quality, type of issue, coupon rate (for debt obligations), maturity (for debt obligations), individual trading characteristics and other market data. Pricing services generally value debt obligations assuming orderly transactions of institutional round lot size, but a fund may hold or transact in the same securities in smaller, odd lot sizes. Odd lots often trade at lower prices than institutional round lots, and their value may be adjusted accordingly. Debt obligations are subject to interest rate and credit risks. In addition, all debt obligations involve some risk of default with respect to interest and/or principal payments.
Swap agreements are fair valued using an evaluated quote, if available, provided by an independent pricing service. Evaluated quotes provided by the pricing service are valued based on a model which may include end-of-day net present values, spreads, ratings, industry, company performance and returns of referenced assets. Centrally cleared swap agreements are valued at the daily settlement price determined by the relevant exchange or clearinghouse.
Foreign securities’ (including foreign exchange contracts) prices are converted into U.S. dollar amounts using the applicable exchange rates as of the close of the New York Stock Exchange (“NYSE”). If market quotations are available and reliable for foreign exchange-traded equity securities, the securities will be valued at the market quotations. The Adviser may use various pricing services to obtain market quotations as well as fair value prices. Because trading hours for certain foreign securities end before the close of the NYSE, closing market quotations may become not representative of market value in the Adviser’s judgment (“unreliable”). If, between the time trading ends on a particular security and the close of the customary trading session on the NYSE, a significant event occurs that makes the closing price of the security unreliable, the Adviser may fair value the security. If the event is likely to have affected the closing price of the security, the security will be valued at fair value in good faith in accordance with Board- approved policies and related Adviser procedures (“Valuation Procedures”). Adjustments to closing prices to reflect fair value may also be based on a screening process of an independent pricing service to indicate the degree of certainty, based on historical data, that the closing price in the principal market where a foreign security trades is not the current value as of the close of the NYSE. Foreign securities’ prices meeting the degree of certainty that the price is not reflective of current value will be priced at the indication of fair value from the independent pricing service. Multiple factors may be considered by the independent pricing service in determining adjustments to reflect fair value and may include information relating to sector indices, American Depositary Receipts and domestic and foreign index futures. Foreign securities may have additional risks including exchange rate changes, potential for sharply devalued currencies and high inflation, political and economic upheaval, the relative lack of issuer information, relatively low market liquidity and the potential lack of strict financial and accounting controls and standards.
Unlisted securities will be valued using prices provided by independent pricing services or by another method that the Adviser, in its judgment, believes better reflects the security’s fair value in accordance with the Valuation Procedures.
Securities for which market prices are not provided by any of the above methods may be valued based upon quotes furnished by independent sources. The last bid price may be used to value equity securities. The mean between the last bid and asked prices may be used to value debt obligations, including corporate loans.
16 Invesco Active Allocation Fund
Securities for which market quotations are not readily available are fair valued by the Adviser in accordance with the Valuation Procedures. If a fair value price provided by a pricing service is unreliable, the Adviser will fair value the security using the Valuation Procedures. Issuer specific events, market trends, bid/asked quotes of brokers and information providers and other market data may be reviewed in the course of making a good faith determination of a security’s fair value.
The Fund may invest in securities that are subject to interest rate risk, meaning the risk that the prices will generally fall as interest rates rise and, conversely, the prices will generally rise as interest rates fall. Specific securities differ in their sensitivity to changes in interest rates depending on their individual characteristics. Changes in interest rates may result in increased market volatility, which may affect the value and/or liquidity of certain Fund investments.
Valuations change in response to many factors including the historical and prospective earnings of the issuer, the value of the issuer’s assets, general market conditions which are not specifically related to the particular issuer, such as real or perceived adverse economic conditions, changes in the general outlook for revenues or corporate earnings, changes in interest or currency rates, regional or global instability, natural or environmental disasters, widespread disease or other public health issues, war, acts of terrorism, significant governmental actions or adverse investor sentiment generally and market liquidity. Because of the inherent uncertainties of valuation, the values reflected in the financial statements may materially differ from the value received upon actual sale of those investments.
The price the Fund could receive upon the sale of any investment may differ from the Adviser’s valuation of the investment, particularly for securities that are valued using a fair valuation technique. When fair valuation techniques are applied, the Adviser uses available information, including both observable and unobservable inputs and assumptions, to determine a methodology that will result in a valuation that the Adviser believes approximates market value. Fund securities that are fair valued may be subject to greater fluctuation in their value from one day to the next than would be the case if market quotations were used. Because of the inherent uncertainties of valuation, and the degree of subjectivity in such decisions, the Fund could realize a greater or lesser than expected gain or loss upon the sale of the investment.
| B. | Securities Transactions and Investment Income – Securities transactions are accounted for on a trade date basis. Realized gains or losses on sales are computed on the basis of specific identification of the securities sold. Distributions from ordinary income from underlying funds, if any, are recorded as dividend income on the ex-dividend date. Distributions from gains from underlying funds, if any, are recorded as realized gains on the ex-dividend date. The following policies are followed by the underlying funds: Interest income (net of withholding tax, if any) is recorded on an accrual basis from settlement date and includes coupon interest and amortization of premium and accretion of discount on debt securities as applicable. Pay-in-kind interest income and non-cash dividend income received in the form of securities in-lieu of cash are recorded at the fair value of the securities received. Paydown gains and losses on mortgage and asset-backed securities are recorded as adjustments to interest income. |
The Fund may periodically participate in litigation related to the Fund’s investments. As such, the Fund may receive proceeds from litigation settlements. Any proceeds received are included in the Statement of Operations as realized gain (loss) for investments no longer held and as unrealized gain (loss) for investments still held.
The Fund allocates income and realized and unrealized capital gains and losses to a class based on the relative net assets of each class.
| C. | Country Determination – For the purposes of making investment selection decisions and presentation in the Schedule of Investments, the investment adviser may determine the country in which an issuer is located and/or credit risk exposure based on various factors. These factors include the laws of the country under which the issuer is organized, where the issuer maintains a principal office, the country in which the issuer derives 50% or more of its total revenues, the country that has the primary market for the issuer’s securities and its “country of risk” as determined by a third party service provider, as well as other criteria. Among the other criteria that may be evaluated for making this determination are the country in which the issuer maintains 50% or more of its assets, the type of security, financial guarantees and enhancements, the nature of the collateral and the sponsor organization. Country of issuer and/or credit risk exposure has been determined to be the United States of America, unless otherwise noted. |
| D. | Distributions – Distributions from net investment income and net realized capital gain, if any, are generally declared and paid annually and recorded on the ex-dividend date. The Fund may elect to treat a portion of the proceeds from redemptions as distributions for federal income tax purposes. |
| E. | Federal Income Taxes – The Fund intends to comply with the requirements of Subchapter M of the Internal Revenue Code of 1986, as amended (the “Internal Revenue Code”), necessary to qualify as a regulated investment company and to distribute substantially all of the Fund’s taxable earnings to shareholders. As such, the Fund will not be subject to federal income taxes on otherwise taxable income (including net realized capital gain) that is distributed to shareholders. Therefore, no provision for federal income taxes is recorded in the financial statements. |
The Fund recognizes the tax benefits of uncertain tax positions only when the position is more likely than not to be sustained. Management has analyzed the Fund’s uncertain tax positions and concluded that no liability for unrecognized tax benefits should be recorded related to uncertain tax positions. Management is not aware of any tax positions for which it is reasonably possible that the total amounts of unrecognized tax benefits will change materially in the next 12 months.
The Fund files tax returns in the U.S. Federal jurisdiction and certain other jurisdictions. Generally, the Fund is subject to examinations by such taxing authorities for up to three years after the filing of the return for the tax period.
| F. | Expenses – Expenses included in the accompanying financial statements reflect the expenses of the Fund and do not include any expenses of the underlying funds. The effects of the underlying funds expenses are included in the realized and unrealized gain/loss on the investments in the underlying funds. Estimated expenses of the underlying funds are discussed further within the Financial Highlights. |
Fees provided for under the Rule 12b-1 plan of a particular class of the Fund and which are directly attributable to that class are charged to the operations of such class. Transfer agency fees and expenses and other shareholder recordkeeping fees and expenses attributable to Class R5 and Class R6 are allocated based on relative net assets of Class R5 and Class R6. Transfer agency fees and expenses and other shareholder recordkeeping fees and expenses relating to all other classes are allocated among those classes based on relative net assets. All other expenses are allocated among the classes based on relative net assets.
| G. | Accounting Estimates – The preparation of financial statements in conformity with accounting principles generally accepted in the United States of America (“GAAP”) requires management to make estimates and assumptions that affect the reported amounts of assets and liabilities at the date of the financial statements and the reported amounts of revenues and expenses during the reporting period including estimates and assumptions related to taxation. Actual results could differ from those estimates by a significant amount. In addition, the Fund monitors for material events or transactions that may occur or become known after the period-end date and before the date the financial statements are released to print. |
| H. | Indemnifications – Under the Trust’s organizational documents, each Trustee, officer, employee or other agent of the Trust is indemnified against certain liabilities that may arise out of the performance of their duties to the Fund. Additionally, in the normal course of business, the Fund enters into contracts, including the Fund’s servicing agreements, that contain a variety of indemnification clauses. The Fund’s maximum exposure under these arrangements is unknown as this would involve future claims that may be made against the Fund that have not yet occurred. The risk of material loss as a result of such indemnification claims is considered remote. |
| I. | Securities Lending – The Fund may lend portfolio securities having a market value up to one-third of the Fund’s total assets. Such loans are secured by collateral equal to no less than the market value of the loaned securities determined daily by the securities lending provider. Such collateral will be cash or debt securities issued or guaranteed by the U.S. Government or any of its sponsored agencies. Cash collateral received in connection with these loans is invested in short-term money market instruments or affiliated, unregistered investment companies that comply with Rule 2a-7 under the 1940 Act and money market funds (collectively, “affiliated money market funds”) and is shown as such on the Schedule of Investments. The Fund bears the risk of loss with respect to the investment of collateral. It is the Fund’s policy to obtain additional collateral from or return excess collateral to the borrower by the end of the next business day, following the valuation date of the securities loaned. Therefore, the value of the collateral held may be temporarily less than the value of the securities on loan. When loaning securities, the Fund retains certain benefits of owning the securities, including the economic equivalent of dividends or interest generated by the |
17 Invesco Active Allocation Fund
| security. Lending securities entails a risk of loss to the Fund if, and to the extent that, the market value of the securities loaned were to increase and the borrower did not increase the collateral accordingly, and the borrower failed to return the securities. The securities loaned are subject to termination at the option of the borrower or the Fund. Upon termination, the borrower will return to the Fund the securities loaned and the Fund will return the collateral. Upon the failure of the borrower to return the securities, collateral may be liquidated and the securities may be purchased on the open market to replace the loaned securities. The Fund could experience delays and costs in gaining access to the collateral and the securities may lose value during the delay which could result in potential losses to the Fund. Some of these losses may be indemnified by the lending agent. The Fund bears the risk of any deficiency in the amount of the collateral available for return to the borrower due to any loss on the collateral invested. Dividends received on cash collateral investments for securities lending transactions, which are net of compensation to counterparties, are included in Dividends from affiliated underlying funds on the Statement of Operations. The aggregate value of securities out on loan, if any, is shown as a footnote on the Statement of Assets and Liabilities. |
The Adviser serves as an affiliated securities lending agent for the Fund. The Bank of New York Mellon also serves as a lending agent. To the extent the Fund utilizes the Adviser as an affiliated securities lending agent, the Fund conducts its securities lending in accordance with, and in reliance upon, no-action letters issued by the SEC staff that provide guidance on how an affiliate may act as a direct agent lender and receive compensation for those services in a manner consistent with the federal securities laws. For the year ended December 31, 2022, the Fund paid the Adviser $12,029 in fees for securities lending agent services. Fees paid to the Adviser for securities lending agent services, if any, are included in Dividends from affiliated underlying funds on the Statement of Operations.
| J. | Foreign Currency Translations – Foreign currency is valued at the close of the NYSE based on quotations posted by banks and major currency dealers. Portfolio securities and other assets and liabilities denominated in foreign currencies are translated into U.S. dollar amounts at the date of valuation. Purchases and sales of portfolio securities (net of foreign taxes withheld on disposition) and income items denominated in foreign currencies are translated into U.S. dollar amounts on the respective dates of such transactions. The Fund does not separately account for the portion of the results of operations resulting from changes in foreign exchange rates on investments and the fluctuations arising from changes in market prices of securities held. The combined results of changes in foreign exchange rates and the fluctuation of market prices on investments (net of estimated foreign tax withholding) are included with the net realized and unrealized gain or loss from investments in the Statement of Operations. Reported net realized foreign currency gains or losses arise from (1) sales of foreign currencies, (2) currency gains or losses realized between the trade and settlement dates on securities transactions, and (3) the difference between the amounts of dividends, interest, and foreign withholding taxes recorded on the Fund’s books and the U.S. dollar equivalent of the amounts actually received or paid. Net unrealized foreign currency gains and losses arise from changes in the fair values of assets and liabilities, other than investments in securities at fiscal period end, resulting from changes in exchange rates. |
The Fund may invest in foreign securities, which may be subject to foreign taxes on income, gains on investments or currency repatriation, a portion of which may be recoverable. Foreign taxes, if any, are recorded based on the tax regulations and rates that exist in the foreign markets in which the Fund invests and are shown in the Statement of Operations.
| K. | Forward Foreign Currency Contracts – The Fund may engage in foreign currency transactions either on a spot (i.e. for prompt delivery and settlement) basis, or through forward foreign currency contracts, to manage or minimize currency or exchange rate risk. |
The Fund may also enter into forward foreign currency contracts for the purchase or sale of a security denominated in a foreign currency in order to “lock in” the U.S. dollar price of that security, or the Fund may also enter into forward foreign currency contracts that do not provide for physical exchange of the two currencies on the settlement date, but instead are settled by a single cash payment calculated as the difference between the agreed upon exchange rate and the spot rate at settlement based upon an agreed upon notional amount (non-deliverable forwards).
A forward foreign currency contract is an obligation between two parties (“Counterparties”) to purchase or sell a specific currency for an agreed-upon price at a future date. The use of forward foreign currency contracts for hedging does not eliminate fluctuations in the price of the underlying securities the Fund owns or intends to acquire but establishes a rate of exchange in advance. Fluctuations in the value of these contracts are measured by the difference in the contract date and reporting date exchange rates and are recorded as unrealized appreciation (depreciation) until the contracts are closed. When the contracts are closed, realized gains (losses) are recorded. Realized and unrealized gains (losses) on the contracts are included in the Statement of Operations. The primary risks associated with forward foreign currency contracts include failure of the Counterparty to meet the terms of the contract and the value of the foreign currency changing unfavorably. These risks may be in excess of the amounts reflected in the Statement of Assets and Liabilities.
| L. | Futures Contracts – The Fund may enter into futures contracts to manage exposure to interest rate, equity and market price movements and/or currency risks. A futures contract is an agreement between Counterparties to purchase or sell a specified underlying security, currency or commodity (or delivery of a cash settlement price, in the case of an index future) for a fixed price at a future date. The Fund currently invests only in exchange-traded futures and they are standardized as to maturity date and underlying financial instrument. Initial margin deposits required upon entering into futures contracts are satisfied by the segregation of specific securities or cash as collateral at the futures commission merchant (broker). During the period the futures contracts are open, changes in the value of the contracts are recognized as unrealized gains or losses by recalculating the value of the contracts on a daily basis. Subsequent or variation margin payments are received or made depending upon whether unrealized gains or losses are incurred. These amounts are reflected as receivables or payables on the Statement of Assets and Liabilities. When the contracts are closed or expire, the Fund recognizes a realized gain or loss equal to the difference between the proceeds from, or cost of, the closing transaction and the Fund’s basis in the contract. The net realized gain (loss) and the change in unrealized gain (loss) on futures contracts held during the period is included on the Statement of Operations. The primary risks associated with futures contracts are market risk and the absence of a liquid secondary market. If the Fund were unable to liquidate a futures contract and/or enter into an offsetting closing transaction, the Fund would continue to be subject to market risk with respect to the value of the contracts and continue to be required to maintain the margin deposits on the futures contracts. Futures contracts have minimal Counterparty risk since the exchange’s clearinghouse, as Counterparty to all exchange-traded futures, guarantees the futures against default. Risks may exceed amounts recognized in the Statement of Assets and Liabilities. |
| M. | Swap Agreements – The Fund may enter into various swap transactions, including interest rate, total return, index, currency and credit default swap contracts (“CDS”) for investment purposes or to manage interest rate, currency or credit risk. Such transactions are agreements between Counterparties. A swap agreement may be negotiated bilaterally and traded over-the-counter (“OTC”) between two parties (“uncleared/ OTC”) or, in some instances, must be transacted through a future commission merchant (“FCM”) and cleared through a clearinghouse that serves as a central Counterparty (“centrally cleared swap”). These agreements may contain among other conditions, events of default and termination events, and various covenants and representations such as provisions that require the Fund to maintain a pre-determined level of net assets, and/ or provide limits regarding the decline of the Fund’s net asset value (“NAV”) per share over specific periods of time. If the Fund were to trigger such provisions and have open derivative positions at that time, the Counterparty may be able to terminate such agreement and request immediate payment in an amount equal to the net liability positions, if any. |
Interest rate, total return, index, and currency swap agreements are two-party contracts entered into primarily to exchange the returns (or differentials in rates of returns) earned or realized on particular predetermined investments or instruments. The gross returns to be exchanged or “swapped” between the parties are calculated with respect to a notional amount, i.e., the return on or increase in value of a particular dollar amount invested at a particular interest rate or return of an underlying asset, in a particular foreign currency, or in a “basket” of securities representing a particular index.
In a centrally cleared swap, the Fund’s ultimate Counterparty is a central clearinghouse. The Fund initially will enter into centrally cleared swaps through an executing broker. When a fund enters into a centrally cleared swap, it must deliver to the central Counterparty (via the FCM) an amount referred to as “initial margin.” Initial margin requirements are determined by the central Counterparty, but an FCM may require additional initial margin above the amount required by the central Counterparty. Initial margin deposits required upon entering into centrally cleared swaps are satisfied by cash or securities as collateral at the FCM.
18 Invesco Active Allocation Fund
Securities deposited as initial margin are designated on the Schedule of Investments and cash deposited is recorded on the Statement of Assets and Liabilities. During the term of a cleared swap agreement, a “variation margin” amount may be required to be paid by the Fund or may be received by the Fund, based on the daily change in price of the underlying reference instrument subject to the swap agreement and is recorded as a receivable or payable for variation margin in the Statement of Assets and Liabilities until the centrally cleared swap is terminated at which time a realized gain or loss is recorded.
A CDS is an agreement between Counterparties to exchange the credit risk of an issuer. A buyer of a CDS is said to buy protection by paying a fixed payment over the life of the agreement and in some situations an upfront payment to the seller of the CDS. If a defined credit event occurs (such as payment default or bankruptcy), the Fund as a protection buyer would cease paying its fixed payment, the Fund would deliver eligible bonds issued by the reference entity to the seller, and the seller would pay the full notional value, or the “par value”, of the referenced obligation to the Fund. A seller of a CDS is said to sell protection and thus would receive a fixed payment over the life of the agreement and an upfront payment, if applicable. If a credit event occurs, the Fund as a protection seller would cease to receive the fixed payment stream, the Fund would pay the buyer “par value” or the full notional value of the referenced obligation, and the Fund would receive the eligible bonds issued by the reference entity. In turn, these bonds may be sold in order to realize a recovery value. Alternatively, the seller of the CDS and its Counterparty may agree to net the notional amount and the market value of the bonds and make a cash payment equal to the difference to the buyer of protection. If no credit event occurs, the Fund receives the fixed payment over the life of the agreement. As the seller, the Fund would effectively add leverage to its portfolio because, in addition to its total net assets, the Fund would be subject to investment exposure on the notional amount of the CDS. In connection with these agreements, cash and securities may be identified as collateral in accordance with the terms of the respective swap agreements to provide assets of value and recourse in the event of default under the swap agreement or bankruptcy/insolvency of a party to the swap agreement. If a Counterparty becomes bankrupt or otherwise fails to perform its obligations due to financial difficulties, the Fund may experience significant delays in obtaining any recovery in a bankruptcy or other reorganization proceeding. The Fund may obtain only limited recovery or may obtain no recovery in such circumstances. The Fund’s maximum risk of loss from Counterparty risk, either as the protection seller or as the protection buyer, is the value of the contract. The risk may be mitigated by having a master netting arrangement between the Fund and the Counterparty and by the designation of collateral by the Counterparty to cover the Fund’s exposure to the Counterparty.
Implied credit spreads represent the current level at which protection could be bought or sold given the terms of the existing CDS contract and serve as an indicator of the current status of the payment/performance risk of the CDS. An implied spread that has widened or increased since entry into the initial contract may indicate a deteriorating credit profile and increased risk of default for the reference entity. A declining or narrowing spread may indicate an improving credit profile or decreased risk of default for the reference entity. Alternatively, credit spreads may increase or decrease reflecting the general tolerance for risk in the credit markets.
An interest rate swap is an agreement between Counterparties pursuant to which the parties exchange a floating rate payment for a fixed rate payment based on a specified notional amount.
Changes in the value of centrally cleared and OTC swap agreements are recognized as unrealized gains (losses) in the Statement of Operations by “marking to market” on a daily basis to reflect the value of the swap agreement at the end of each trading day. Payments received or paid at the beginning of the agreement are reflected as such on the Statement of Assets and Liabilities and may be referred to as upfront payments. The Fund accrues for the fixed payment stream and amortizes upfront payments, if any, on swap agreements on a daily basis with the net amount, recorded as a component of realized gain (loss) on the Statement of Operations. A liquidation payment received or made at the termination of a swap agreement is recorded as realized gain (loss) on the Statement of Operations. Cash held as collateral is recorded as deposits with brokers on the Statement of Assets and Liabilities. Entering into these agreements involves, to varying degrees, lack of liquidity and elements of credit, market, and Counterparty risk in excess of amounts recognized on the Statement of Assets and Liabilities. Such risks involve the possibility that a swap is difficult to sell or liquidate; the Counterparty does not honor its obligations under the agreement and unfavorable interest rates and market fluctuations. It is possible that developments in the swaps market, including potential government regulation, could adversely affect the Fund’s ability to terminate existing swap agreements or to realize amounts to be received under such agreements. Additionally, an International Swaps and Derivatives Association Master Agreement (“ISDA Master Agreement”) includes credit related contingent features which allow Counterparties to OTC derivatives to terminate derivative contracts prior to maturity in the event that, for example, the Fund’s net assets decline by a stated percentage or the Fund fails to meet the terms of its ISDA Master Agreement, which would cause the Fund to accelerate payment of any net liability owed to the Counterparty. A short position in a security poses more risk than holding the same security long. As there is no limit on how much the price of the security can increase, the Fund’s exposure is unlimited.
Notional amounts of each individual credit default swap agreement outstanding as of December 31, 2022, if any, for which the Fund is the seller of protection are disclosed in the open swap agreements table. These potential amounts would be partially offset by any recovery values of the respective referenced obligations, upfront payments received upon entering into the agreement, or net amounts received from the settlement of buy protection credit default swap agreements entered into by the Fund for the same referenced entity or entities.
| N. | Leverage Risk – Leverage exists when the Fund can lose more than it originally invests because it purchases or sells an instrument or enters into a transaction without investing an amount equal to the full economic exposure of the instrument or transaction. |
| O. | Collateral – To the extent the Fund has designated or segregated a security as collateral and that security is subsequently sold, it is the Fund’s practice to replace such collateral no later than the next business day. |
| P. | COVID-19 Risk – The COVID-19 strain of coronavirus has resulted in instances of market closures and dislocations, extreme volatility, liquidity constraints and increased trading costs. Efforts to contain its spread have resulted in travel restrictions, disruptions of healthcare systems, business operations (including business closures) and supply chains, layoffs, lower consumer demand and employee availability, and defaults and credit downgrades, among other significant economic impacts that have disrupted global economic activity across many industries. Such economic impacts may exacerbate other pre-existing political, social and economic risks locally or globally and cause general concern and uncertainty. The full economic impact and ongoing effects of COVID-19 (or other future epidemics or pandemics) at the macro-level and on individual businesses are unpredictable and may result in significant and prolonged effects on the Fund’s performance. |
NOTE 2–Advisory Fees and Other Fees Paid to Affiliates
The Trust has entered into a master investment advisory agreement with the Adviser. Under the terms of the investment advisory agreement, the Fund accrues daily and pays monthly an advisory fee to the Adviser based on the annual rate of the Fund’s average daily net assets as follows:
| Average Daily Net Assets | Rate* | |||
| First $3 billion | 0.100% | |||
| Over $3 billion | 0.080% | |||
| * | The advisory fee paid by the Fund shall be reduced by any amounts paid by the Fund under the administrative services agreement with the Adviser. |
For the year ended December 31, 2022, the effective advisory fee rate incurred by the Fund was 0.09%.
Under the terms of a master sub-advisory agreement between the Adviser and each of Invesco Asset Management Deutschland GmbH, Invesco Asset Management Limited, Invesco Asset Management (Japan) Limited, Invesco Hong Kong Limited, Invesco Senior Secured Management, Inc. and Invesco Canada Ltd. and separate sub-advisory agreements with Invesco Capital Management LLC and Invesco Asset Management (India) Private Limited (collectively, the “Affiliated Sub-Advisers”) the
19 Invesco Active Allocation Fund
Adviser, not the Fund, will pay 40% of the fees paid to the Adviser to any such Affiliated Sub-Adviser(s) that provide(s) discretionary investment management services to the Fund based on the percentage of assets allocated to such Affiliated Sub-Adviser(s). Invesco has also entered into a sub-advisory agreement with OppenheimerFunds, Inc. to provide discretionary management services to the Fund.
The Adviser has contractually agreed, through at least June 30, 2023, to waive advisory fees and/or reimburse expenses to the extent necessary to limit total annual fund operating expenses after fee waiver and/or expense reimbursement (excluding certain items discussed below) of Class A, Class C, Class R, Class Y, Class R5 and Class R6 to 1.50%, 2.25%, 1.75%, 1.25%, 1.25% and 1.25%, respectively, of the Fund’s average daily net assets (the “expense limits”). In determining the Adviser’s obligation to waive advisory fees and/or reimburse expenses, the following expenses are not taken into account, and could cause the total annual fund operating expenses after fee waiver and/or reimbursement to exceed the numbers reflected above: (1) interest; (2) taxes; (3) dividend expense on short sales; (4) extraordinary or non-routine items, including litigation expenses; and (5) expenses that the Fund has incurred but did not actually pay because of an expense offset arrangement. Unless Invesco continues the fee waiver agreement, it will terminate on June 30, 2023. During its term, the fee waiver agreement cannot be terminated or amended to increase the expense limits or reduce the advisory fee waivers without approval of the Board of Trustees. The Adviser did not waive fees and/or reimburse expenses during the period under this expense limit.
For the year ended December 31, 2022, the Adviser waived advisory fees of $6,920.
The Trust has entered into a master administrative services agreement with Invesco pursuant to which the Fund has agreed to pay Invesco for certain administrative costs incurred in providing accounting services to the Fund. For the year ended December 31, 2022, expenses incurred under the agreement are shown in the Statement of Operations as Administrative services fees. Invesco has entered into a sub-administration agreement whereby State Street Bank and Trust Company (“SSB”) serves as fund accountant and provides certain administrative services to the Fund. Pursuant to a custody agreement with the Trust on behalf of the Fund, SSB also serves as the Fund’s custodian.
The Trust has entered into a transfer agency and service agreement with Invesco Investment Services, Inc. (“IIS”) pursuant to which the Fund has agreed to pay IIS a fee for providing transfer agency and shareholder services to the Fund and reimburse IIS for certain expenses incurred by IIS in the course of providing such services. IIS may make payments to intermediaries that provide omnibus account services, sub-accounting services and/or networking services. All fees payable by IIS to intermediaries that provide omnibus account services or sub-accounting services are charged back to the Fund, subject to certain limitations approved by the Trust’s Board of Trustees. For the year ended December 31, 2022, expenses incurred under the agreement are shown in the Statement of Operations as Transfer agent fees.
The Trust has entered into master distribution agreements with Invesco Distributors, Inc. (“IDI”) to serve as the distributor for the Class A, Class C, Class R, Class Y, Class R5 and Class R6 shares of the Fund. The Trust has adopted plans pursuant to Rule 12b-1 under the 1940 Act with respect to the Fund’s Class A, Class C and Class R shares (collectively, the “Plans”). The Fund, pursuant to the Class A Plan, reimburses IDI for its allocated share of expenses incurred for the period, up to a maximum annual rate of 0.25% of the average daily net assets of Class A shares. The Fund, pursuant to the Class C and Class R Plans, pays IDI compensation at the annual rate of 1.00% of the average daily net assets of Class C shares and 0.50% of the average daily net assets of Class R shares. The fees are accrued daily and paid monthly. Of the Plan payments, up to 0.25% of the average daily net assets of each class of shares may be paid to furnish continuing personal shareholder services to customers who purchase and own shares of such classes. Any amounts not paid as a service fee under the Plans would constitute an asset-based sales charge. Rules of the Financial Industry Regulatory Authority (“FINRA”) impose a cap on the total sales charges, including asset-based sales charges, that may be paid by any class of shares of the Fund. For the year ended December 31, 2022, expenses incurred under the Plans are shown in the Statement of Operations as Distribution fees.
Front-end sales commissions and CDSC (collectively, the “sales charges”) are not recorded as expenses of the Fund. Front-end sales commissions are deducted from proceeds from the sales of Fund shares prior to investment in Class A shares of the Fund. CDSC are deducted from redemption proceeds prior to remittance to the shareholder. During the year ended December 31, 2022, IDI advised the Fund that IDI retained $217,464 in front-end sales commissions from the sale of Class A shares and $11,854 and $6,245 from Class A and Class C shares, respectively, for CDSC imposed upon redemptions by shareholders.
The underlying Invesco Funds pay no distribution fees for Class R6 shares and the Funds pay no sales loads or other similar compensation to IDI for acquiring underlying fund shares.
Certain officers and trustees of the Trust are officers and directors of the Adviser, IIS and/or IDI.
NOTE 3–Additional Valuation Information
GAAP defines fair value as the price that would be received to sell an asset or paid to transfer a liability in an orderly transaction between market participants at the measurement date, under current market conditions. GAAP establishes a hierarchy that prioritizes the inputs to valuation methods, giving the highest priority to readily available unadjusted quoted prices in an active market for identical assets (Level 1) and the lowest priority to significant unobservable inputs (Level 3), generally when market prices are not readily available. Based on the valuation inputs, the securities or other investments are tiered into one of three levels. Changes in valuation methods may result in transfers in or out of an investment’s assigned level:
| Level 1 - | Prices are determined using quoted prices in an active market for identical assets. | |||
| Level 2 - | Prices are determined using other significant observable inputs. Observable inputs are inputs that other market participants may use in pricing a security. These may include quoted prices for similar securities, interest rates, prepayment speeds, credit risk, yield curves, loss severities, default rates, discount rates, volatilities and others. | |||
| Level 3 - | Prices are determined using significant unobservable inputs. In situations where quoted prices or observable inputs are unavailable (for example, when there is little or no market activity for an investment at the end of the period), unobservable inputs may be used. Unobservable inputs reflect the Adviser’s assumptions about the factors market participants would use in determining fair value of the securities or instruments and would be based on the best available information. |
The following is a summary of the tiered valuation input levels, as of December 31, 2022. The level assigned to the securities valuations may not be an indication of the risk or liquidity associated with investing in those securities. Because of the inherent uncertainties of valuation, the values reflected in the financial statements may materially differ from the value received upon actual sale of those investments.
| Level 1 | Level 2 | Level 3 | Total | |||||||||||||||||
Investments in Securities | ||||||||||||||||||||
Affiliated Issuers | $ | 1,799,812,178 | $ | – | $ | – | $ | 1,799,812,178 | ||||||||||||
Money Market Funds | 6,917,679 | 7,828,213 | – | 14,745,892 | ||||||||||||||||
Total Investments in Securities | 1,806,729,857 | 7,828,213 | – | 1,814,558,070 | ||||||||||||||||
Other Investments - Assets* | ||||||||||||||||||||
Futures Contracts | 128,651 | – | – | 128,651 | ||||||||||||||||
Forward Foreign Currency Contracts | – | 1,828,224 | – | 1,828,224 | ||||||||||||||||
Swap Agreements | – | 257,639 | – | 257,639 | ||||||||||||||||
| 128,651 | 2,085,863 | – | 2,214,514 | |||||||||||||||||
20 Invesco Active Allocation Fund
| Level 1 | Level 2 | Level 3 | Total | |||||||||||||
| ||||||||||||||||
Other Investments - Liabilities* | ||||||||||||||||
| ||||||||||||||||
Futures Contracts | $ | (1,118,184 | ) | $ | – | $– | $ | (1,118,184 | ) | |||||||
| ||||||||||||||||
Forward Foreign Currency Contracts | – | (1,351,841 | ) | – | (1,351,841 | ) | ||||||||||
| ||||||||||||||||
Swap Agreements | – | (73,439 | ) | – | (73,439 | ) | ||||||||||
| ||||||||||||||||
| (1,118,184 | ) | (1,425,280 | ) | – | (2,543,464 | ) | ||||||||||
| ||||||||||||||||
Total Other Investments | (989,533 | ) | 660,583 | – | (328,950 | ) | ||||||||||
| ||||||||||||||||
Total Investments | $ | 1,805,740,324 | $ | 8,488,796 | $– | $ | 1,814,229,120 | |||||||||
| ||||||||||||||||
| * | Unrealized appreciation (depreciation). |
NOTE 4–Derivative Investments
The Fund may enter into an International Swaps and Derivatives Association Master Agreement (“ISDA Master Agreement”) under which a fund may trade OTC derivatives. An OTC transaction entered into under an ISDA Master Agreement typically involves a collateral posting arrangement, payment netting provisions and close-out netting provisions. These netting provisions allow for reduction of credit risk through netting of contractual obligations. The enforceability of the netting provisions of the ISDA Master Agreement depends on the governing law of the ISDA Master Agreement, among other factors.
For financial reporting purposes, the Fund does not offset OTC derivative assets or liabilities that are subject to ISDA Master Agreements in the Statement of Assets and Liabilities.
Value of Derivative Investments at Period-End
The table below summarizes the value of the Fund’s derivative investments, detailed by primary risk exposure, held as of December 31, 2022:
| Value | ||||||||||||||||
| Credit | Currency | Equity | ||||||||||||||
| Derivative Assets | Risk | Risk | Risk | Total | ||||||||||||
| ||||||||||||||||
Unrealized appreciation on futures contracts – Exchange-Traded(a) | $ | – | $ | – | $ | 128,651 | $ | 128,651 | ||||||||
| ||||||||||||||||
Unrealized appreciation on swap agreements – Centrally Cleared(a) | 257,639 | – | – | 257,639 | ||||||||||||
| ||||||||||||||||
Unrealized appreciation on forward foreign currency contracts outstanding | – | 1,828,224 | – | 1,828,224 | ||||||||||||
| ||||||||||||||||
Total Derivative Assets | 257,639 | 1,828,224 | 128,651 | 2,214,514 | ||||||||||||
| ||||||||||||||||
Derivatives not subject to master netting agreements | (257,639 | ) | – | (128,651 | ) | (386,290 | ) | |||||||||
| ||||||||||||||||
Total Derivative Assets subject to master netting agreements | $ | – | $ | 1,828,224 | $ | – | $ | 1,828,224 | ||||||||
| ||||||||||||||||
| Value | ||||||||||||||||||||
| Credit | Currency | Equity | Interest | |||||||||||||||||
| Derivative Liabilities | Risk | Risk | Risk | Rate Risk | Total | |||||||||||||||
| ||||||||||||||||||||
Unrealized depreciation on futures contracts – Exchange-Traded(a) | $ | – | $ | – | $ | (970,246 | ) | $ | (147,938 | ) | $ | (1,118,184 | ) | |||||||
| ||||||||||||||||||||
Unrealized depreciation on swap agreements – Centrally Cleared(a) | (73,439 | ) | – | – | – | (73,439 | ) | |||||||||||||
| ||||||||||||||||||||
Unrealized depreciation on forward foreign currency contracts outstanding | – | (1,351,841 | ) | – | – | (1,351,841 | ) | |||||||||||||
| ||||||||||||||||||||
Total Derivative Liabilities | (73,439 | ) | (1,351,841 | ) | (970,246 | ) | (147,938 | ) | (2,543,464 | ) | ||||||||||
| ||||||||||||||||||||
Derivatives not subject to master netting agreements | 73,439 | – | 970,246 | 147,938 | 1,191,623 | |||||||||||||||
| ||||||||||||||||||||
Total Derivative Liabilities subject to master netting agreements | $ | – | $ | (1,351,841 | ) | $ | – | $ | – | $ | (1,351,841 | ) | ||||||||
| ||||||||||||||||||||
| (a) | The daily variation margin receivable (payable) at period-end is recorded in the Statement of Assets and Liabilities. |
Offsetting Assets and Liabilities
The table below reflects the Fund’s exposure to Counterparties subject to either an ISDA Master Agreement or other agreement for OTC derivative transactions as of December 31, 2022.
| Financial | Financial | |||||||||||||||||||
| Derivative | Derivative | Collateral | ||||||||||||||||||
| Assets | Liabilities | (Received)/Pledged | ||||||||||||||||||
| Forward Foreign | Forward Foreign | Net Value of | Net | |||||||||||||||||
| Counterparty | Currency Contracts | Currency Contracts | Derivatives | Non-Cash | Cash | Amount | ||||||||||||||
| ||||||||||||||||||||
Bank of America, N.A. | $ 145,896 | $ | (356,185) | $(210,289) | $– | $– | $(210,289 | ) | ||||||||||||
| ||||||||||||||||||||
Barclays Bank PLC | 119,118 | (95,623) | 23,495 | – | – | 23,495 | ||||||||||||||
| ||||||||||||||||||||
BNP Paribas S.A. | – | (22,789) | (22,789 | ) | – | – | (22,789 | ) | ||||||||||||
| ||||||||||||||||||||
Citibank N.A. | 650,812 | (46,536) | 604,276 | – | – | 604,276 | ||||||||||||||
| ||||||||||||||||||||
Deutsche Bank AG | 504,546 | (90,491) | 414,055 | – | – | 414,055 | ||||||||||||||
| ||||||||||||||||||||
Goldman Sachs International | – | (17,207) | (17,207 | ) | – | – | (17,207 | ) | ||||||||||||
| ||||||||||||||||||||
JP Morgan Chase Bank, N.A. | 4,917 | (185,994) | (181,077 | ) | – | – | (181,077 | ) | ||||||||||||
| ||||||||||||||||||||
Morgan Stanley and Co. International PLC | 402,935 | (446,872) | (43,937 | ) | – | – | (43,937 | ) | ||||||||||||
| ||||||||||||||||||||
UBS AG | – | (90,144) | (90,144 | ) | – | – | (90,144 | ) | ||||||||||||
| ||||||||||||||||||||
Total | $1,828,224 | $ | (1,351,841) | $ 476,383 | $– | $– | $ 476,383 | |||||||||||||
| ||||||||||||||||||||
21 Invesco Active Allocation Fund
Effect of Derivative Investments for the year ended December 31, 2022
The table below summarizes the gains (losses) on derivative investments, detailed by primary risk exposure, recognized in earnings during the period:
| Location of Gain (Loss) on | ||||||||||||||||||||
| Statement of Operations | ||||||||||||||||||||
| Credit | Currency | Equity | Interest | |||||||||||||||||
| Risk | Risk | Risk | Rate Risk | Total | ||||||||||||||||
| ||||||||||||||||||||
Realized Gain (Loss): | ||||||||||||||||||||
| ||||||||||||||||||||
Forward foreign currency contracts | $ | – | $ | 2,209,404 | $ | – | $ | – | $ | 2,209,404 | ||||||||||
| ||||||||||||||||||||
Futures contracts | – | – | (4,532,759 | ) | (6,208,004 | ) | (10,740,763 | ) | ||||||||||||
| ||||||||||||||||||||
Swap agreements | (4,016,375 | ) | – | – | – | (4,016,375 | ) | |||||||||||||
| ||||||||||||||||||||
Change in Net Unrealized Appreciation | ||||||||||||||||||||
(Depreciation): | ||||||||||||||||||||
Forward foreign currency contracts | – | 949,565 | – | – | 949,565 | |||||||||||||||
| ||||||||||||||||||||
Futures contracts | – | – | (1,674,149 | ) | (830,411 | ) | (2,504,560 | ) | ||||||||||||
| ||||||||||||||||||||
Swap agreements | (264,003 | ) | – | – | – | (264,003 | ) | |||||||||||||
| ||||||||||||||||||||
Total | $ | (4,280,378 | ) | $ | 3,158,969 | $ | (6,206,908 | ) | $ | (7,038,415 | ) | $ | (14,366,732 | ) | ||||||
| ||||||||||||||||||||
The table below summarizes the average notional value of derivatives held during the period.
| Forward | ||||||||||||
| Foreign Currency | Futures | Swap | ||||||||||
| Contracts | Contracts | Agreements | ||||||||||
| ||||||||||||
Average notional value | $224,072,553 | $79,152,522 | $94,033,333 | |||||||||
| ||||||||||||
NOTE 5–Expense Offset Arrangement(s)
The expense offset arrangement is comprised of transfer agency credits which result from balances in demand deposit accounts used by the transfer agent for clearing shareholder transactions. For the year ended December 31, 2022, the Fund received credits from this arrangement, which resulted in the reduction of the Fund’s total expenses of $25,508.
NOTE 6–Trustees’ and Officers’ Fees and Benefits
Trustees’ and Officers’ Fees and Benefits include amounts accrued by the Fund to pay remuneration to certain Trustees and Officers of the Fund. Trustees have the option to defer compensation payable by the Fund, and Trustees’ and Officers’ Fees and Benefits also include amounts accrued by the Fund to fund such deferred compensation amounts. Those Trustees who defer compensation have the option to select various Invesco Funds in which their deferral accounts shall be deemed to be invested. Finally, certain current Trustees were eligible to participate in a retirement plan that provided for benefits to be paid upon retirement to Trustees over a period of time based on the number of years of service. The Fund may have certain former Trustees who also participate in a retirement plan and receive benefits under such plan. Trustees’ and Officers’ Fees and Benefits include amounts accrued by the Fund to fund such retirement benefits. Obligations under the deferred compensation and retirement plans represent unsecured claims against the general assets of the Fund.
NOTE 7–Cash Balances
The Fund is permitted to temporarily carry a negative or overdrawn balance in its account with SSB, the custodian bank. Such balances, if any at period-end, are shown in the Statement of Assets and Liabilities under the payable caption Amount due custodian. To compensate the custodian bank for such overdrafts, the overdrawn Fund may either (1) leave funds as a compensating balance in the account so the custodian bank can be compensated by earning the additional interest; or (2) compensate by paying the custodian bank at a rate agreed upon by the custodian bank and Invesco, not to exceed the contractually agreed upon rate. The Fund may not purchase additional securities when any borrowings from banks or broker-dealers exceed 5% of the Fund’s total assets, or when any borrowings from an Invesco Fund are outstanding.
NOTE 8–Distributions to Shareholders and Tax Components of Net Assets
Tax Character of Distributions to Shareholders Paid During the Fiscal Years Ended December 31, 2022 and 2021:
| 2022 | 2021 | |||||||||||
| ||||||||||||
Ordinary income* | $ | 22,960,352 | $ | 122,061,476 | ||||||||
| ||||||||||||
Long-term capital gain | 56,967,148 | 64,418,915 | ||||||||||
| ||||||||||||
Total distributions | $ | 79,927,500 | $ | 186,480,391 | ||||||||
| ||||||||||||
| * | Includes short-term capital gain distributions, if any. |
22 Invesco Active Allocation Fund
Tax Components of Net Assets at Period-End:
| 2022 | ||||
| ||||
Undistributed long-term capital gain | $ | 25,900,149 | ||
| ||||
Net unrealized appreciation – investments | 30,891,749 | |||
| ||||
Net unrealized appreciation – foreign currencies | 713,547 | |||
| ||||
Temporary book/tax differences | (152,953 | ) | ||
| ||||
Shares of beneficial interest | 1,762,599,700 | |||
| ||||
Total net assets | $ | 1,819,952,192 | ||
| ||||
The difference between book-basis and tax-basis unrealized appreciation (depreciation) is due to differences in the timing of recognition of gains and losses on investments for tax and book purposes. The Fund’s net unrealized appreciation (depreciation) difference is attributable primarily to wash sales, derivative instruments and partnerships.
The temporary book/tax differences are a result of timing differences between book and tax recognition of income and/or expenses. The Fund’s temporary book/tax differences are the result of the trustee deferral of compensation and retirement plan benefits.
Capital loss carryforward is calculated and reported as of a specific date. Results of transactions and other activity after that date may affect the amount of capital loss carryforward actually available for the Fund to utilize. The ability to utilize capital loss carryforward in the future may be limited under the Internal Revenue Code and related regulations based on the results of future transactions.
The Fund does not have a capital loss carryforward as of December 31, 2022.
NOTE 9–Investment Transactions
The aggregate amount of investment securities (other than short-term securities, U.S. Government obligations and money market funds, if any) purchased and sold by the Fund during the year ended December 31, 2022 was $387,310,083 and $477,024,469, respectively. Cost of investments, including any derivatives, on a tax basis includes the adjustments for financial reporting purposes as of the most recently completed federal income tax reporting period-end.
Unrealized Appreciation (Depreciation) of Investments on a Tax Basis | ||||
Aggregate unrealized appreciation of investments | $ | 153,032,153 | ||
| ||||
Aggregate unrealized (depreciation) of investments | (122,140,404 | ) | ||
| ||||
Net unrealized appreciation of investments | $ | 30,891,749 | ||
| ||||
Cost of investments for tax purposes is $1,783,337,371.
NOTE 10–Reclassification of Permanent Differences
Primarily as a result of differing book/tax treatment of distributions, derivative instruments, partnerships and equalization, on December 31, 2022, undistributed net investment income was increased by $1,861,498, undistributed net realized gain was decreased by $13,920,624 and shares of beneficial interest was increased by $12,059,126. This reclassification had no effect on the net assets of the Fund.
NOTE 11–Share Information
| Summary of Share Activity | ||||||||||||||||
| ||||||||||||||||
| Year ended | Year ended | |||||||||||||||
| December 31, 2022 | December 31, 2021 | |||||||||||||||
| Shares | Amount | Shares | Amount | |||||||||||||
| ||||||||||||||||
Sold: | ||||||||||||||||
Class A | 7,552,885 | $ | 99,240,838 | 8,832,942 | $ | 140,484,176 | ||||||||||
| ||||||||||||||||
Class C | 1,929,933 | 24,470,488 | 2,197,410 | 33,956,657 | ||||||||||||
| ||||||||||||||||
Class R | 1,394,339 | 17,925,314 | 1,489,640 | 23,441,103 | ||||||||||||
| ||||||||||||||||
Class Y | 754,937 | 10,078,225 | 694,604 | 11,234,495 | ||||||||||||
| ||||||||||||||||
Class R5 | 110 | 1,497 | – | – | ||||||||||||
| ||||||||||||||||
Class R6 | 1,352 | 17,169 | 187 | 3,084 | ||||||||||||
| ||||||||||||||||
Issued as reinvestment of dividends: | ||||||||||||||||
Class A | 5,483,458 | 65,691,442 | 9,938,765 | 150,174,792 | ||||||||||||
| ||||||||||||||||
Class C | 543,671 | 6,339,766 | 1,224,066 | 18,017,957 | ||||||||||||
| ||||||||||||||||
Class R | 450,191 | 5,357,270 | 839,744 | 12,604,545 | ||||||||||||
| ||||||||||||||||
Class Y | 79,245 | 967,583 | 137,354 | 2,112,494 | ||||||||||||
| ||||||||||||||||
Class R6 | 75 | 899 | 16 | 239 | ||||||||||||
| ||||||||||||||||
Automatic conversion of Class C shares to Class A shares: | ||||||||||||||||
Class A | 1,919,489 | 24,854,209 | 1,918,277 | 30,399,976 | ||||||||||||
| ||||||||||||||||
Class C | (1,977,621 | ) | (24,854,209 | ) | (1,973,199 | ) | (30,399,976 | ) | ||||||||
| ||||||||||||||||
23 Invesco Active Allocation Fund
| Summary of Share Activity | ||||||||||||||||
| ||||||||||||||||
| Year ended | Year ended | |||||||||||||||
| December 31, 2022 | December 31, 2021 | |||||||||||||||
|
|
|
| |||||||||||||
| Shares | Amount | Shares | Amount | |||||||||||||
| ||||||||||||||||
Reacquired: | ||||||||||||||||
Class A | (16,857,896 | ) | $(220,678,729 | ) | (26,939,310 | ) | $(430,579,378 | ) | ||||||||
| ||||||||||||||||
Class C | (2,485,525 | ) | (31,694,556 | ) | (3,308,921 | ) | (51,179,563 | ) | ||||||||
| ||||||||||||||||
Class R | (1,902,271 | ) | (24,598,319 | ) | (1,542,987 | ) | (24,271,219 | ) | ||||||||
| ||||||||||||||||
Class Y | (796,572 | ) | (10,492,218 | ) | (690,148 | ) | (11,201,192 | ) | ||||||||
| ||||||||||||||||
Class R6 | (20 | ) | (251 | ) | (9 | ) | (149 | ) | ||||||||
| ||||||||||||||||
Net increase (decrease) in share activity | (3,910,220 | ) | $ (57,373,582) | (7,181,569 | ) | $(125,201,959 | ) | |||||||||
| ||||||||||||||||
24 Invesco Active Allocation Fund
Report of Independent Registered Public Accounting Firm
To the Board of Trustees of AIM Growth Series (Invesco Growth Series) and Shareholders of Invesco Active Allocation Fund
Opinion on the Financial Statements
We have audited the accompanying statement of assets and liabilities, including the schedule of investments, of Invesco Active Allocation Fund (one of the funds constituting AIM Growth Series (Invesco Growth Series), referred to hereafter as the “Fund”) as of December 31, 2022, the related statement of operations for the year ended December 31, 2022, the statement of changes in net assets for each of the two years in the period ended December 31, 2022, including the related notes, and the financial highlights for each of the periods indicated in the table below (collectively referred to as the “financial statements”). In our opinion, the financial statements present fairly, in all material respects, the financial position of the Fund as of December 31, 2022, the results of its operations for the year then ended, the changes in its net assets for each of the two years in the period ended December 31, 2022 and the financial highlights for each of the periods indicated in the table below, in conformity with accounting principles generally accepted in the United States of America.
| Financial Highlights |
| For each of the three years in the period ended December 31, 2022 and the eleven months ended December 31, 2019 for Class A, Class C, Class R and Class Y. |
| For each of the three years in the period ended December 31, 2022 and the period May 24, 2019 (commencement of operations) through December 31, 2019 for Class R5 and Class R6. |
The financial statements of Oppenheimer Portfolio Series: Active Allocation Fund (subsequently renamed Invesco Active Allocation Fund) as of and for the year ended January 31, 2019 and the financial highlights for each of the periods ended on or prior to January 31, 2019 (not presented herein, other than the financial highlights) were audited by other auditors whose report dated March 25, 2019 expressed an unqualified opinion on those financial statements and financial highlights.
Basis for Opinion
These financial statements are the responsibility of the Fund’s management. Our responsibility is to express an opinion on the Fund’s financial statements based on our audits. We are a public accounting firm registered with the Public Company Accounting Oversight Board (United States) (PCAOB) and are required to be independent with respect to the Fund in accordance with the U.S. federal securities laws and the applicable rules and regulations of the Securities and Exchange Commission and the PCAOB.
We conducted our audits of these financial statements in accordance with the standards of the PCAOB. Those standards require that we plan and perform the audit to obtain reasonable assurance about whether the financial statements are free of material misstatement, whether due to error or fraud.
Our audits included performing procedures to assess the risks of material misstatement of the financial statements, whether due to error or fraud, and performing procedures that respond to those risks. Such procedures included examining, on a test basis, evidence regarding the amounts and disclosures in the financial statements. Our audits also included evaluating the accounting principles used and significant estimates made by management, as well as evaluating the overall presentation of the financial statements. Our procedures included confirmation of securities owned as of December 31, 2022 by correspondence with the custodian, transfer agent and brokers; when replies were not received from brokers, we performed other auditing procedures. We believe that our audits provide a reasonable basis for our opinion.
/s/PricewaterhouseCoopers LLP
Houston, Texas
February 22, 2023
We have served as the auditor of one or more of the investment companies in the Invesco group of investment companies since at least 1995. We have not been able to determine the specific year we began serving as auditor.
25 Invesco Active Allocation Fund
Calculating your ongoing Fund expenses
Example
As a shareholder of the Fund, you incur two types of costs: (1) transaction costs, which may include sales charges (loads) on purchase payments or contingent deferred sales charges on redemptions, if any; and (2) ongoing costs, including management fees, distribution and/or service (12b-1) fees, and other Fund expenses. This example is intended to help you understand your ongoing costs (in dollars) of investing in the Fund and to compare these costs with ongoing costs of investing in other mutual funds. The example is based on an investment of $1,000 invested at the beginning of the period and held for the entire period July 1, 2022 through December 31, 2022.
In addition to the fees and expenses which the Fund bears directly, the Fund indirectly bears a pro-rata share of the fees and expenses of the underlying funds in which the Fund invests. The amount of fees and expenses incurred indirectly by the Fund will vary because the underlying funds have varied expenses and fee levels and the Fund may own different proportions of the underlying funds at different times. Estimated underlying fund expenses are not expenses that are incurred directly by the Fund. They are expenses that are incurred directly by the underlying funds and are deducted from the value of the underlying funds the Fund invests in. The effect of the estimated underlying fund expenses that the Fund bears indirectly are included in the Fund’s total return.
Actual expenses
The table below provides information about actual account values and actual expenses. You may use the information in this table, together with the amount you invested, to estimate the expenses that you paid over the period. Simply divide your account value by $1,000 (for example, an $8,600 account value divided by $1,000 = 8.6), then multiply the result by the number in the table under the heading entitled “Actual Expenses Paid During Period” to estimate the expenses you paid on your account during this period.
Hypothetical example for comparison purposes
The table below also provides information about hypothetical account values and hypothetical expenses based on the Fund’s actual expense ratio and an assumed rate of return of 5% per year before expenses, which is not the Fund’s actual return.
The hypothetical account values and expenses may not be used to estimate the actual ending account balance or expenses you paid for the period. You may use this information to compare the ongoing costs of investing in the Fund and other funds. To do so, compare this 5% hypothetical example with the 5% hypothetical examples that appear in the shareholder reports of the other funds.
Please note that the expenses shown in the table are meant to highlight your ongoing costs only and do not reflect any transaction costs, such as sales charges (loads) on purchase payments or contingent deferred sales charges on redemptions, if any. Therefore, the hypothetical information is useful in comparing ongoing costs only, and will not help you determine the relative total costs of owning different funds. In addition, if these transaction costs were included, your costs would have been higher.
| ACTUAL | HYPOTHETICAL (5% annual return before expenses) | |||||||||||||||||||||||
| Beginning Account Value (07/01/22) | Ending Account Value (12/31/22)1 | Expenses Paid During Period2,3 | Ending Account Value (12/31/22) | Expenses Paid During Period2,4 | Annualized Expense Ratio2 | |||||||||||||||||||
| Class A | $1,000.00 | $1,016.40 | $2.44 | $1,022.79 | $2.45 | 0.48% | ||||||||||||||||||
| Class C | 1,000.00 | 1,012.50 | 6.29 | 1,018.95 | 6.31 | 1.24 | ||||||||||||||||||
| Class R | 1,000.00 | 1,014.50 | 3.76 | 1,021.48 | 3.77 | 0.74 | ||||||||||||||||||
| Class Y | 1,000.00 | 1,017.90 | 1.22 | 1,024.00 | 1.22 | 0.24 | ||||||||||||||||||
| Class R5 | 1,000.00 | 1,017.50 | 1.22 | 1,024.00 | 1.22 | 0.24 | ||||||||||||||||||
| Class R6 | 1,000.00 | 1,018.40 | 1.22 | 1,024.00 | 1.22 | 0.24 | ||||||||||||||||||
| 1 | The actual ending account value is based on the actual total return of the Fund for the period July 1, 2022 through December 31, 2022, after actual expenses and will differ from the hypothetical ending account value which is based on the Fund’s expense ratio and a hypothetical annual return of 5% before expenses. |
| 2 | Expenses are equal to the Fund’s annualized expense ratio as indicated above multiplied by the average account value over the period, multiplied by 184/365 to reflect the most recent fiscal half year. Effective June 1, 2022, the Adviser has contractually agreed to waive advisory fees and/or reimburse expenses to the extent necessary to limit total annual fund operating expenses of Class A, Class C, Class R, Class Y, Class R5 and Class R6 shares to 1.50%, 2.25%, 1.75%, 1.25%, 1.25% and 1.25% of average daily net assets, respectively. The annualized expense ratios restated as if these agreements had been in effect throughout the entire most recent fiscal half year are to 0.48%, 1.24%, 0.74%, 0.24%, 0.18% and 0.17% for of Class A, Class C, Class R, Class Y, Class R5 and Class R6 shares, respectively |
| 3 | The actual expenses paid restated as if the changes discussed above had been in effect throughout the entire most recent half year are $2.44, $6.29, $3.76, $1.22, $0.92 and $0.86 for of Class A, Class C, Class R, Class Y, Class R5 and Class R6 shares, respectively. |
| 4 | The hypothetical expenses paid restated as if the changes discussed above had been in effect throughout the entire most recent half year are $2.45, $6.31, $3.77, $1.22, $0.92 and $0.87 for of Class A, Class C, Class R, Class Y, Class R5 and Class R6 shares, respectively. |
26 Invesco Active Allocation Fund
Form 1099-DIV, Form 1042-S and other year–end tax information provide shareholders with actual calendar year amounts that should be included in their tax returns. Shareholders should consult their tax advisers.
The following distribution information is being provided as required by the Internal Revenue Code or to meet a specific state’s requirement.
The Fund designates the following amounts or, if subsequently determined to be different, the maximum amount allowable for its fiscal year ended December 31, 2022:
| Federal and State Income Tax | ||||||
Long-Term Capital Gain Distributions | $ | 56,967,148 | ||||
Qualified Dividend Income* | 71.25% | |||||
Corporate Dividends Received Deduction* | 43.94% | |||||
U.S. Treasury Obligations* | 5.40% | |||||
Qualified Business Income* | 3.88% | |||||
Business Interest Income* | 28.10% | |||||
* The above percentages are based on ordinary income dividends paid to shareholders during the Fund’s fiscal year. | ||||||
27 Invesco Active Allocation Fund
The address of each trustee and officer is AIM Growth Series (Invesco Growth Series) (the “Trust”), 11 Greenway Plaza, Suite 1000, Houston, Texas 77046-1173. The trustees serve for the life of the Trust, subject to their earlier death, incapacitation, resignation, retirement or removal as more specifically provided in the Trust’s organizational documents. Each officer serves for a one year term or until their successors are elected and qualified. Column two below includes length of time served with predecessor entities, if any.
Name, Year of Birth and Held with the Trust | Trustee and/or Officer Since | Principal Occupation(s) During Past 5 Years | Number of Fund Complex Overseen by | Other Directorship(s) Held by Trustee During Past 5 Years | ||||
Interested Trustee | ||||||||
Martin L. Flanagan1 – 1960 Trustee and Vice Chair | 2007 | Executive Director, Chief Executive Officer and President, Invesco Ltd. (ultimate parent of Invesco and a global investment management firm); Trustee and Vice Chair, The Invesco Funds; Vice Chair, Investment Company Institute; and Member of Executive Board, SMU Cox School of Business
Formerly: Advisor to the Board, Invesco Advisers, Inc. (formerly known as Invesco Institutional (N.A.), Inc.); Chairman and Chief Executive Officer, Invesco Advisers, Inc. (registered investment adviser); Director, Chairman, Chief Executive Officer and President, Invesco Holding Company (US), Inc. (formerly IVZ Inc.) (holding company), Invesco Group Services, Inc. (service provider) and Invesco North American Holdings, Inc. (holding company); Director, Chief Executive Officer and President, Invesco Holding Company Limited (parent of Invesco and a global investment management firm); Director, Invesco Ltd.; Chairman, Investment Company Institute and President, Co-Chief Executive Officer, Co-President, Chief Operating Officer and Chief Financial Officer, Franklin Resources, Inc. (global investment management organization) | 189 | None |
| 1 | Mr. Flanagan is considered an interested person (within the meaning of Section 2(a)(19) of the 1940 Act) of the Trust because he is an officer of the Adviser to the Trust, and an officer and a director of Invesco Ltd., ultimate parent of the Adviser. |
Name, Year of Birth and Position(s) Held with the Trust | Trustee and/or Officer Since | Principal Occupation(s) During Past 5 Years | Number of Fund Complex | Other Directorship(s) Held by Trustee During Past 5 Years | ||||
Independent Trustees | ||||||||
Beth Ann Brown – 1968 Trustee (2019) and Chair (August 2022) | 2019 | Independent Consultant
Formerly: Head of Intermediary Distribution, Managing Director, Strategic Relations, Managing Director, Head of National Accounts, Senior Vice President, National Account Manager and Senior Vice President, Key Account Manager, Columbia Management Investment Advisers LLC; Vice President, Key Account Manager, Liberty Funds Distributor, Inc.; and Trustee of certain Oppenheimer Funds | 189 | Director, Board of Directors of Caron Engineering Inc.; Advisor, Board of Advisors of Caron Engineering Inc.; President and Director, Acton Shapleigh Youth Conservation Corps (non-profit) Formerly: President and Director Director of Grahamtastic Connection (non-profit) | ||||
Cynthia Hostetler –1962 Trustee | 2017 | Non-Executive Director and Trustee of a number of public and private business corporations
Formerly: Director, Aberdeen Investment Funds (4 portfolios); Director, Artio Global Investment LLC (mutual fund complex); Director, Edgen Group, Inc. (specialized energy and infrastructure products distributor); Director, Genesee & Wyoming, Inc. (railroads); Head of Investment Funds and Private Equity, Overseas Private Investment Corporation; President, First Manhattan Bancorporation, Inc.; and Attorney, Simpson Thacher & Bartlett LLP | 189 | Resideo Technologies, Inc. (smart home technology); Vulcan Materials Company (construction materials company); Trilinc Global Impact Fund; Textainer Group Holdings, (shipping container leasing company); Investment Company Institute (professional organization); and Independent Directors Council (professional organization) | ||||
Eli Jones – 1961 Trustee | 2016 | Professor and Dean Emeritus, Mays Business School - Texas A&M University
Formerly: Dean of Mays Business School-Texas A&M University; Professor and Dean, Walton College of Business, University of Arkansas and E.J. Ourso College of Business, Louisiana State University; and Director, Arvest Bank | 189 | Insperity, Inc. (formerly known as Administaff) (human resources provider); and Member of Regional Board of Directors and Board of Directors, First Financial Bancorp (regional bank) | ||||
T-1 Invesco Active Allocation Fund
Trustees and Officers–(continued)
Name, Year of Birth and Position(s) Held with the Trust | Trustee and/or Officer Since | Principal Occupation(s) During Past 5 Years | Number of Fund Complex | Other Directorship(s) Held by Trustee During Past 5 Years | ||||
Independent Trustees–(continued) | ||||||||
Elizabeth Krentzman – 1959 Trustee | 2019 | Formerly: Principal and Chief Regulatory Advisor for Asset Management Services and U.S. Mutual Fund Leader of Deloitte & Touche LLP; General Counsel of the Investment Company Institute (trade association); National Director of the Investment Management Regulatory Consulting Practice, Principal, Director and Senior Manager of Deloitte & Touche LLP; Assistant Director of the Division of Investment Management - Office of Disclosure and Investment Adviser Regulation of the U.S. Securities and Exchange Commission and various positions with the Division of Investment Management – Office of Regulatory Policy of the U.S. Securities and Exchange Commission; Associate at Ropes & Gray LLP; and Trustee of certain Oppenheimer Funds | 189 | Formerly: Member of the Cartica Funds Board of Directors (private investment fund); Trustee of the University of Florida National Board Foundation; and Member of the University of Florida Law Center Association, Inc. Board of Trustees, Audit Committee and Membership Committee | ||||
Anthony J. LaCava, Jr. – 1956 Trustee | 2019 | Formerly: Director and Member of the Audit Committee, Blue Hills Bank (publicly traded financial institution) and Managing Partner, KPMG LLP | 189 | Blue Hills Bank; Chairman, Bentley University; Member, Business School Advisory Council; and Nominating Committee, KPMG LLP | ||||
Prema Mathai-Davis – 1950 Trustee | 2001 | Retired
Formerly: Co-Founder & Partner of Quantalytics Research, LLC, (a FinTech Investment Research Platform for the Self-Directed Investor); Trustee of YWCA Retirement Fund; CEO of YWCA of the USA; Board member of the NY Metropolitan Transportation Authority; Commissioner of the NYC Department of Aging; and Board member of Johns Hopkins Bioethics Institute | 189 | Member of Board of Positive Planet US (non-profit) and HealthCare Chaplaincy Network (non-profit) | ||||
Joel W. Motley – 1952 Trustee | 2019 | Director of Office of Finance, Federal Home Loan Bank System; Managing Director of Carmona Motley Inc. (privately held financial advisor); Member of the Council on Foreign Relations and its Finance and Budget Committee; Chairman Emeritus of Board of Human Rights Watch and Member of its Investment Committee; and Member of Investment Committee Board of Historic Hudson Valley (non-profit cultural organization); Member of the Board, Blue Ocean Acquisition Corp.; and Member of the Vestry and the Investment Committee of Trinity Church Wall Street.
Formerly: Managing Director of Public Capital Advisors, LLC (privately held financial advisor); Managing Director of Carmona Motley Hoffman, Inc. (privately held financial advisor); Trustee of certain Oppenheimer Funds; and Director of Columbia Equity Financial Corp. (privately held financial advisor) | 189 | Member of Board of Trust for Mutual Understanding (non-profit promoting the arts and environment); Member of Board of Greenwall Foundation (bioethics research foundation) and its Investment Committee; Member of Board of Friends of the LRC (non- profit legal advocacy); and Board Member and Investment Committee Member of Pulitzer Center for Crisis Reporting (non-profit journalism) | ||||
Teresa M. Ressel – 1962 Trustee | 2017 | Non-executive director and trustee of a number of public and private business corporations
Formerly: Chief Executive Officer, UBS Securities LLC (investment banking); Chief Operating Officer, UBS AG Americas (investment banking); Sr. Management Team Olayan America, The Olayan Group (international investor/commercial/industrial); Assistant Secretary for Management & Budget and Designated Chief Financial Officer, U.S. Department of Treasury and Director, ON Semiconductor Corporation (semiconductor manufacturing) | 189 | None | ||||
Robert C. Troccoli – 1949 Trustee | 2016 | Retired
Formerly: Adjunct Professor, University of Denver – Daniels College of Business; and Managing Partner, KPMG LLP | 189 | None | ||||
Daniel S. Vandivort – 1954 Trustee | 2019 | President, Flyway Advisory Services LLC (consulting and property management)
Formerly: President and Chief Investment Officer, previously Head of Fixed Income, Weiss Peck and Greer/Robeco Investment Management; Trustee and Chair, Weiss Peck and Greer Funds Board; and various capacities at CS First Boston including Head of Fixed Income at First Boston Asset Management. | 189 | Formerly: Trustee and Governance Chair, Oppenheimer Funds; Treasurer, Chairman of the Audit and Finance Committee, Huntington Disease Foundation of America | ||||
T-2 Invesco Active Allocation Fund
Trustees and Officers–(continued)
Name, Year of Birth and Position(s) Held with the Trust | Trustee and/or Officer Since | Principal Occupation(s) During Past 5 Years | Number of Fund Complex | Other Directorship(s) Held by Trustee During Past 5 Years | ||||
Officers | ||||||||
Sheri Morris – 1964 President and Principal Executive Officer | 1999 | Director, Invesco Trust Company; Head of Global Fund Services, Invesco Ltd.; President and Principal Executive Officer, The Invesco Funds; Vice President, Invesco Exchange-Traded Fund Trust, Invesco Exchange-Traded Fund Trust II, Invesco India Exchange-Traded Fund Trust, Invesco Actively Managed Exchange-Traded Fund Trust, Invesco Actively Managed Exchange-Traded Commodity Fund Trust and Invesco Exchange-Traded Self-Indexed Fund Trust; and Vice President, OppenheimerFunds, Inc. | N/A | N/A | ||||
| Formerly: Vice President, Treasurer and Principal Financial Officer, The Invesco Funds; Vice President, Invesco AIM Advisers, Inc., Invesco AIM Capital Management, Inc. and Invesco AIM Private Asset Management, Inc.; Assistant Vice President and Assistant Treasurer, The Invesco Funds; Vice President and Assistant Vice President, Invesco Advisers, Inc.; Assistant Vice President, Invesco AIM Capital Management, Inc. and Invesco AIM Private Asset Management, Inc.; Treasurer, Invesco Exchange-Traded Fund Trust, Invesco Exchange-Traded Fund Trust II, Invesco India Exchange-Traded Fund Trust and Invesco Actively Managed Exchange-Traded Fund Trust; and Senior Vice President, Invesco Advisers, Inc. (formerly known as Invesco Institutional (N.A.), Inc.) (registered investment adviser) | ||||||||
Jeffrey H. Kupor – 1968 Senior Vice President, Chief Legal Officer and Secretary | 2018 | Head of Legal of the Americas, Invesco Ltd.; Senior Vice President and Secretary, Invesco Advisers, Inc. (formerly known as Invesco Institutional (N.A.), Inc.) (registered investment adviser); Secretary, Invesco Distributors, Inc. (formerly known as Invesco AIM Distributors, Inc.); Vice President and Secretary, Invesco Investment Services, Inc. (formerly known as Invesco AIM Investment Services, Inc.); Senior Vice President, Chief Legal Officer and Secretary, The Invesco Funds; Secretary and General Counsel, Invesco Investment Advisers LLC (formerly known as Van Kampen Asset Management); Secretary and General Counsel, Invesco Capital Markets, Inc. (formerly known as Van Kampen Funds Inc.); Chief Legal Officer, Invesco Exchange-Traded Fund Trust, Invesco Exchange-Traded Fund Trust II, Invesco India Exchange-Traded Fund Trust, Invesco Actively Managed Exchange-Traded Fund Trust, Invesco Actively Managed Exchange-Traded Commodity Fund Trust and Invesco Exchange-Traded Self-Indexed Fund Trust;; Secretary and Vice President, Harbourview Asset Management Corporation; Secretary and Vice President, OppenheimerFunds, Inc. and Invesco Managed Accounts, LLC; Secretary and Senior Vice President, OFI Global Institutional, Inc.; Secretary and Vice President, OFI SteelPath, Inc.; Secretary and Vice President, Oppenheimer Acquisition Corp.; Secretary and Vice President, Shareholder Services, Inc.; and Secretary and Vice President, Trinity Investment Management Corporation | N/A | N/A | ||||
| Formerly: Senior Vice President, Invesco Distributors, Inc.; Secretary and Vice President, Jemstep, Inc.; Head of Legal, Worldwide Institutional, Invesco Ltd.; Secretary and General Counsel, INVESCO Private Capital Investments, Inc.; Senior Vice President, Secretary and General Counsel, Invesco Management Group, Inc. (formerly known as Invesco AIM Management Group, Inc.); Assistant Secretary, INVESCO Asset Management (Bermuda) Ltd.; Secretary and General Counsel, Invesco Private Capital, Inc.;Assistant Secretary and General Counsel, INVESCO Realty, Inc.; Secretary and General Counsel, Invesco Senior Secured Management, Inc.; Secretary, Sovereign G./P. Holdings Inc.; Secretary, Invesco Indexing LLC; and Secretary, W.L. Ross & Co., LLC | ||||||||
Andrew R. Schlossberg – 1974 Senior Vice President | 2019 | Senior Vice President, Invesco Group Services, Inc.; Head of the Americas and Senior Managing Director, Invesco Ltd.; Director and Senior Vice President, Invesco Advisers, Inc. (formerly known as Invesco Institutional (N.A.), Inc.) (registered investment adviser); Director and Chairman, Invesco Investment Services, Inc. (formerly known as Invesco AIM Investment Services, Inc.) (registered transfer agent); Senior Vice President, The Invesco Funds; and Director, Invesco Investment Advisers LLC (formerly known as Van Kampen Asset Management)
Formerly: Director, President and Chairman, Invesco Insurance Agency, Inc.; Director, Invesco UK Limited; Director and Chief Executive, Invesco Asset Management Limited and Invesco Fund Managers Limited; Assistant Vice President, The Invesco Funds; Senior Vice President, Invesco Advisers, Inc. (formerly known as Invesco Institutional (N.A.), Inc.) (registered investment adviser); Director and Chief Executive, Invesco Administration Services Limited and Invesco Global Investment Funds Limited; Director, Invesco Distributors, Inc.; Head of EMEA, Invesco Ltd.; President, Invesco Actively Managed Exchange-Traded Commodity Fund Trust, Invesco Actively Managed Exchange-Traded Fund Trust, Invesco Exchange-Traded Fund Trust, Invesco Exchange-Traded Fund Trust II and Invesco India Exchange-Traded Fund Trust; and Managing Director and Principal Executive Officer, Invesco Capital Management LLC | N/A | N/A | ||||
T-3 Invesco Active Allocation Fund
Trustees and Officers–(continued)
Name, Year of Birth and Position(s) Held with the Trust | Trustee and/or Officer Since | Principal Occupation(s) During Past 5 Years | Number of Fund Complex | Other Directorship(s) Held by Trustee During Past 5 Years | ||||
Officers–(continued) | ||||||||
John M. Zerr – 1962 Senior Vice President | 2006 | Chief Operating Officer of the Americas; Senior Vice President, Invesco Advisers, Inc. (formerly known as Invesco Institutional (N.A.), Inc.) (registered investment adviser); Senior Vice President, Invesco Distributors, Inc. (formerly known as Invesco AIM Distributors, Inc.); Director and Vice President, Invesco Investment Services, Inc. (formerly known as Invesco AIM Investment Services, Inc.) Senior Vice President, The Invesco Funds; Managing Director, Invesco Capital Management LLC; Director, Invesco Investment Advisers LLC (formerly known as Van Kampen Asset Management); Senior Vice President, Invesco Capital Markets, Inc. (formerly known as Van Kampen Funds Inc.); Manager, Invesco Indexing LLC; Manager, Invesco Specialized Products, LLC; Member, Invesco Canada Funds Advisory Board; Director, President and Chief Executive Officer, Invesco Corporate Class Inc. (corporate mutual fund company); and Director, Chairman, President and Chief Executive Officer, Invesco Canada Ltd. (formerly known as Invesco Trimark Ltd./Invesco Trimark Ltèe) (registered investment adviser and registered transfer agent); President, Invesco, Inc.; President, Invesco Global Direct Real Estate Feeder GP Ltd.; President, Invesco IP Holdings (Canada) Ltd; President, Invesco Global Direct Real Estate GP Ltd.; President, Invesco Financial Services Ltd. / Services Financiers Invesco Ltée; and Director and Chairman, Invesco Trust Company | N/A | N/A | ||||
| Formerly: President, Trimark Investments Ltd/Services Financiers Invesco Ltee; Director and Senior Vice President, Invesco Insurance Agency, Inc.; Director and Senior Vice President, Invesco Management Group, Inc. (formerly known as Invesco AIM Management Group, Inc.); Secretary and General Counsel, Invesco Management Group, Inc. (formerly known as Invesco AIM Management Group, Inc.); Secretary, Invesco Investment Services, Inc. (formerly known as Invesco AIM Investment Services, Inc.); Chief Legal Officer and Secretary, The Invesco Funds; Secretary and General Counsel, Invesco Investment Advisers LLC (formerly known as Van Kampen Asset Management); Secretary and General Counsel, Invesco Capital Markets, Inc. (formerly known as Van Kampen Funds Inc.); Chief Legal Officer, Invesco Exchange-Traded Fund Trust, Invesco Exchange-Traded Fund Trust II, Invesco India Exchange-Traded Fund Trust, Invesco Actively Managed Exchange-Traded Fund Trust, Invesco Actively Managed Exchange-Traded Commodity Fund Trust and Invesco Exchange-Traded Self-Indexed Fund Trust; Secretary, Invesco Indexing LLC; Director, Secretary, General Counsel and Senior Vice President, Van Kampen Exchange Corp.; Director, Vice President and Secretary, IVZ Distributors, Inc. (formerly known as INVESCO Distributors, Inc.); Director and Vice President, INVESCO Funds Group, Inc.; Director and Vice President, Van Kampen Advisors Inc.; Director, Vice President, Secretary and General Counsel, Van Kampen Investor Services Inc.; Director and Secretary, Invesco Distributors, Inc. (formerly known as Invesco AIM Distributors, Inc.); Director, Senior Vice President, General Counsel and Secretary, Invesco AIM Advisers, Inc. and Van Kampen Investments Inc.; Director, Vice President and Secretary, Fund Management Company; Director, Senior Vice President, Secretary, General Counsel and Vice President, Invesco AIM Capital Management, Inc.; and Chief Operating Officer and General Counsel, Liberty Ridge Capital, Inc. (an investment adviser) | ||||||||
Gregory G. McGreevey – 1962 Senior Vice President | 2012 | Senior Managing Director, Invesco Ltd.; Director, Chairman, President, and Chief Executive Officer, Invesco Advisers, Inc. (formerly known as Invesco Institutional (N.A.), Inc.) (registered investment adviser); Director, Invesco Mortgage Capital, Inc. and Invesco Senior Secured Management, Inc.; Senior Vice President, The Invesco Funds; President, SNW Asset Management Corporation and Invesco Managed Accounts, LLC; Chairman and Director, Invesco Private Capital, Inc.; Chairman and Director, INVESCO Private Capital Investments, Inc.; Chairman and Director, INVESCO Realty, Inc.; and Senior Vice President, Invesco Group Services, Inc.
Formerly: Senior Vice President, Invesco Management Group, Inc. and Invesco Advisers, Inc.; Assistant Vice President, The Invesco Funds | N/A | N/A | ||||
Adrien Deberghes – 1967 Principal Financial Officer, Treasurer and Vice President | 2020 | Head of the Fund Office of the CFO and Fund Administration; Vice President, Invesco Advisers, Inc.; Principal Financial Officer, Treasurer and Vice President, The Invesco Funds; Vice President, Invesco Exchange-Traded Fund Trust, Invesco Exchange-Traded Fund Trust II, Invesco India Exchange-Traded Fund Trust, Invesco Actively Managed Exchange-Traded Fund Trust, Invesco Actively Managed Exchange-Traded Commodity Fund Trust and Invesco Exchange-Traded Self-Indexed Fund Trust
Formerly: Senior Vice President and Treasurer, Fidelity Investments | N/A | N/A | ||||
Crissie M. Wisdom – 1969 Anti-Money Laundering Compliance Officer | 2013 | Anti-Money Laundering and OFAC Compliance Officer for Invesco U.S. entities including: Invesco Advisers, Inc. and its affiliates, Invesco Capital Markets, Inc., Invesco Distributors, Inc., Invesco Investment Services, Inc., The Invesco Funds, Invesco Capital Management, LLC, Invesco Trust Company; and Fraud Prevention Manager for Invesco Investment Services, Inc. | N/A | N/A | ||||
T-4 Invesco Active Allocation Fund
Trustees and Officers–(continued)
Name, Year of Birth and Position(s) Held with the Trust | Trustee and/or Officer Since | Principal Occupation(s) During Past 5 Years | Number of Fund Complex | Other Directorship(s) Held by Trustee During Past 5 Years | ||||
Officers–(continued) | ||||||||
Todd F. Kuehl – 1969 Chief Compliance Officer and Senior Vice President | 2020 | Chief Compliance Officer, Invesco Advisers, Inc. (registered investment adviser); and Chief Compliance Officer and Senior Vice President, The Invesco Funds
Formerly: Managing Director and Chief Compliance Officer, Legg Mason (Mutual Funds); Chief Compliance Officer, Legg Mason Private Portfolio Group (registered investment adviser) | N/A | N/A | ||||
James Bordewick, Jr. – 1959 Senior Vice President and Senior Officer | 2022 | Senior Vice President and Senior Officer, The Invesco Funds
Formerly: Chief Legal Officer, KingsCrowd, Inc. (research and analytical platform for investment in private capital markets); Chief Operating Officer and Head of Legal and Regulatory, Netcapital (private capital investment platform); Managing Director, General Counsel of asset management and Chief Compliance Officer for asset management and private banking, Bank of America Corporation; Chief Legal Officer, Columbia Funds and BofA Funds;
Senior Vice President and Associate General Counsel, MFS Investment Management; Chief Legal Officer, MFS Funds; Associate, Ropes & Gray; and Associate, Gaston Snow & Ely Bartlett | N/A | N/A | ||||
The Statement of Additional Information of the Trust includes additional information about the Fund’s Trustees and is available upon request, without charge, by calling 1.800.959.4246. Please refer to the Fund’s Statement of Additional Information for information on the Fund’s sub-advisers.
| Office of the Fund | Investment Adviser | Distributor | Auditors | |||
| 11 Greenway Plaza, Suite 1000 | Invesco Advisers, Inc. | Invesco Distributors, Inc. | PricewaterhouseCoopers LLP | |||
| Houston, TX 77046-1173 | 1555 Peachtree Street, N.E. | 11 Greenway Plaza, Suite 1000 | 1000 Louisiana Street, Suite 5800 | |||
| Atlanta, GA 30309 | Houston, TX 77046-1173 | Houston, TX 77002-5021 | ||||
| Counsel to the Fund | Counsel to the Independent Trustees | Transfer Agent | Custodian | |||
| Stradley Ronon Stevens & Young, LLP | Sidley Austin LLP | Invesco Investment Services, Inc. | State Street Bank and Trust Company | |||
| 2005 Market Street, Suite 2600 | 787 Seventh Avenue | 11 Greenway Plaza, Suite 1000 | 225 Franklin Street | |||
| Philadelphia, PA 19103-7018 | New York, NY 10019 | Houston, TX 77046-1173 | Boston, MA 02110-2801 | |||
T-5 Invesco Active Allocation Fund
(This page intentionally left blank)
(This page intentionally left blank)
(This page intentionally left blank)

Go paperless with eDelivery
Visit invesco.com/edelivery to enjoy the convenience and security of anytime electronic access to your investment documents.
With eDelivery, you can elect to have any or all of the following materials delivered straight to your inbox to download, save and print from your own computer:
∎ Fund reports and prospectuses
∎ Quarterly statements
∎ Daily confirmations
∎ Tax forms
Invesco mailing information
Send general correspondence to Invesco Investment Services, Inc., P.O. Box 219078, Kansas City, MO 64121-9078.
Important notice regarding delivery of security holder documents
To reduce Fund expenses, only one copy of most shareholder documents may be mailed to shareholders with multiple accounts at the same address (Householding). Mailing of your shareholder documents may be householded indefinitely unless you instruct us otherwise. If you do not want the mailing of these documents to be combined with those for other members of your household, please contact Invesco Investment Services, Inc. at 800 959 4246 or contact your financial institution. We will begin sending you individual copies for each account within 30 days after receiving your request.
Fund holdings and proxy voting information
The Fund provides a complete list of its portfolio holdings four times each year, at the end of each fiscal quarter. For the second and fourth quarters, the list appears, respectively, in the Fund’s semiannual and annual reports to shareholders. For the first and third quarters, the Fund files the list with the Securities and Exchange Commission (SEC) as an exhibit to its reports on Form N-PORT. The most recent list of portfolio holdings is available at invesco.com/completeqtrholdings. Shareholders can also look up the Fund’s Form N-PORT filings on the SEC website, sec.gov. The SEC file numbers for the Fund are shown below.
A description of the policies and procedures that the Fund uses to determine how to vote proxies relating to portfolio securities is available without charge, upon request, from our Client Services department at 800 959 4246, or at invesco.com/ corporate/about-us/esg. The information is also available on the SEC website, sec.gov.
Information regarding how the Fund voted proxies related to its portfolio securities during the most recent 12-month period ended June 30 is available at invesco.com/proxysearch. This information is also available on the SEC website, sec.gov.
Invesco Advisers, Inc. is an investment adviser; it provides investment advisory services to individual and institutional clients and does not sell securities. Invesco Distributors, Inc. is the US distributor for Invesco Ltd.’s retail mutual funds, exchange-traded funds and institutional money market funds. Both are wholly owned, indirect subsidiaries of Invesco Ltd.
| SEC file number(s): 811-02699 and 002-57526 | Invesco Distributors, Inc. | O-OPSAA-AR-1 |

| Annual Report to Shareholders | December 31, 2022 | |
Invesco Convertible Securities Fund
Nasdaq:
A: CNSAX ∎ C: CNSCX ∎ Y: CNSDX ∎ R5: CNSIX ∎ R6: CNSFX
Management’s Discussion of Fund Performance
| ||||
For the fiscal year ended December 31, 2022, Class A shares of Invesco Convertible Securities Fund (the Fund), at net asset value (NAV), outperformed the ICE BofA U.S. Convertible Index, the Fund’s broad market/style-specific benchmark. |
| |||
Your Fund’s long-term performance appears later in this report. |
| |||
Fund vs. Indexes |
| |||
Total returns, 12/31/21 to 12/31/22, at net asset value (NAV). Performance shown does not include applicable contingent deferred sales charges (CDSC) or front-end sales charges, which would have reduced performance. |
| |||
Class A Shares | -15.72 | % | ||
Class C Shares | -16.35 | |||
Class Y Shares | -15.51 | |||
Class R5 Shares | -15.51 | |||
Class R6 Shares | -15.45 | |||
ICE BofA U.S. Convertible Index▼ (Broad Market/Style-Specific Index) | -18.63 | |||
Lipper Convertible Securities Funds Index∎ (Peer Group Index) | -17.06 | |||
Source(s): ▼RIMES Technologies Corp.; ∎Lipper Inc. | ||||
Market conditions and your Fund Equity markets declined in the first quarter of 2022 amid volatility sparked by Russia’s invasion of Ukraine, rising commodity prices, rampant global inflation and the US Federal Reserve’s (the Fed) shift toward tighter monetary policy. Russia’s invasion exacerbated inflation pressures, disrupting already strained supply chains and increasing shortages of oil, gas and raw materials. The price of oil rose sharply, with crude prices reaching their highest price per barrel since 2008.1 Inflation continued to be a top concern for consumers, investors and the Fed. To combat inflation, the Fed raised the federal funds rate by one-quarter percentage point in March and indicated it would “taper” its asset purchase program quickly.2 As the war in Ukraine continued and corporate earnings in high-profile names like Netflix reported slowing growth and profits, the equity markets sold off for much of April 2022. The downward direction of the equity markets continued into the second quarter of 2022 amid substantial inflation, rising interest rates and an increasing likelihood of a US recession. Driven by higher food and energy prices, the consumer price index rose by yet another 40-year high to 8.6% for the twelve months ended May 2022.3 Oil prices peaked near $122 per barrel in early June, resulting in skyrocketing gasoline prices; the national average price reached a record high, above $5 per gallon in early June.1 In an effort to tame inflation, the Fed raised the benchmark federal funds rate three more times, by 0.50% in May, by 0.75% in June and another 0.75% in July, which were the largest increases in nearly 30 years.2 US equity markets rose in July and August until Fed chairman Jerome Powell’s hawkish comments at an economic policy symposium held in Jackson Hole, which sparked a sharp selloff at month-end. The Fed reiterated that it would continue taking aggressive action to curb | inflation, even though such measures could “bring pain to households and businesses,” and the Fed raised the benchmark federal funds rate by another 0.75% in September.2 After experiencing a sharp drop in September 2022, US equity markets rebounded in October and November, 4 despite mixed data on the economy and corporate earnings. However, the Fed’s message of continued rate hikes until data shows inflation meaningfully declining, sent markets lower in December.4 As energy prices declined,1 the rate of inflation slowed modestly in the fourth quarter.3 Corporate earnings generally met expectations, though companies provided cautious future guidance. With inflation still at multi-decade highs and little evidence of a slowing economy, the Fed raised its target rate by 0.75% in November and by 0.50% in December, marking its highest level in over a decade.2 In this environment, US stocks had negative double-digit returns for the fiscal year of -18.11%, as measured by the S&P 500 Index.4 Convertible securities (as represented by the ICE BofA U.S. Convertible Index) experienced a difficult fiscal year due to rising interest rates and a sharp sell-off in convertible underlying equities. Convertibles returned -18.63% in 2022, the index’s worst annual return since 2008.5 Within the convertibles index, only energy and utilities sectors had positive returns, while media and consumer discretionary sectors had the largest declines. Amid the market volatility, new US convertible issuance experienced a steep drop from 2021. US convertible issuance totaled just $28.6 billion in 2022, down from $84.3 billion in 2021, marking the weakest year for issuance in a decade.6 Security selection in the technology sector was the largest contributor to the Fund’s relative performance, with KBR as a strong individual contributor. The company provides scientific, technology and engineering solutions |
with a focus on government solutions and sustainable technology. KBR benefited from an increase in defense spending in the US and abroad, as well as the recently passed Inflation Reduction Act, which provided incentives for sustainability projects. Additionally, the Fund’s lack of exposure to some of the weaker names within the sector contributed to relative outperformance for the fiscal year.
Issue selection in the energy sector also contributed to the Fund’s relative return, due in large part to EQT and Pioneer Natural Resources, which benefited from higher oil and natural gas prices. Another contributor was Enphase Energy, which sells solar home energy solutions. The company is expected to benefit from the Inflation Reduction Act which provides significant incentives for clean energy development. We maintained our positions in these securities at fiscal year-end.
Security selection in the media sector also helped the Fund’s relative performance. Media was among the worst performing sectors for the fiscal year and the Fund’s underweight in Snapchat app developer Snap, was a significant relative contributor during the fiscal year.
Similarly, issue selection in the consumer discretionary sector also benefited the Fund, largely due to the avoidance of some weaker issues within the sector. The Fund’s lack of exposure to Opendoor Technologies and American Eagle Outfitters (not Fund’s holdings) and underweight in Wayfair contributed to relative returns. We eliminated our position in Wayfair during the fiscal year.
The Fund’s cash position, while less than 4% on average, also aided relative performance in the difficult market environment.
Issue selection in the financials sector was the largest detractor from the Fund’s relative performance during the fiscal year, due primarily to alternative asset manager KKR. The company’s stock and convertible issue declined amid a weakening environment for private equity. We maintained our position at fiscal year-end, as we believe it should benefit from growth in Asia and the trend toward higher allocations to alternatives among institutional and high net worth investors.
Security selection and an underweight in the health care sector also detracted from the Fund’s relative performance. A key detractor was Avantor, a chemicals and materials company. The firm reported better-than-expected earnings but inflation and supply-chain issues weighed on the stock and convertibles. We eliminated this position during the fiscal year. The Fund’s lack of exposure to Global Blood Therapeutics (not Fund’s holding) also hurt relative performance. Shares of the underlying stock rose sharply in August after Pfizer and Johnson and Johnson (not Fund holdings) initiated a bidding war for the firm, which specializes in sickle cell disease.
During the fiscal year, we sold or exchanged higher priced convertibles where
| 2 | Invesco Convertible Securities Fund |
applicable and redeployed those assets into more attractively priced trading closer to par value. From a sector standpoint, we reduced the Fund’s exposure to technology, consumer discretionary and media sectors and added to the health care, industrials and utilities sectors. The Fund’s largest absolute sector exposures at fiscal year-end were to the technology and health care sectors. The Fund’s largest overweight positions relative to the benchmark were in the industrials and utilities sectors, while the largest underweight positions were in the consumer discretionary and technology sectors.
The convertibles market had a challenging 2022 and we believe volatility may continue into 2023. Regardless of the market environment, we seek to avoid issue-specific underperformers and we continue to seek companies with healthy balance sheets and reasonable valuations that can benefit from the current economic environment.
Thank you for your continued investment in Invesco Convertible Securities Fund and for sharing our commitment to a long-term investment horizon.
| 1 | Source: Bloomberg LP |
| 2 | Source: US Federal Reserve |
| 3 | Source: US Bureau of Labor Statistics |
| 4 | Source: Lipper Inc. |
| 5 | Source: BofA Global Research, ICE Data Indices, LLC |
| 6 | Source: BofA Global Research |
Portfolio manager(s):
Ellen Gold - Lead
Ramez Nashed
The views and opinions expressed in management’s discussion of Fund performance are those of Invesco Advisers, Inc. and its affiliates. These views and opinions are subject to change at any time based on factors such as market and economic conditions. These views and opinions may not be relied upon as investment advice or recommendations, or as an offer for a particular security. The information is not a complete analysis of every aspect of any market, country, industry, security or the Fund. Statements of fact are from sources considered reliable, but Invesco Advisers, Inc. makes no representation or warranty as to their completeness or accuracy. Although historical performance is no guarantee of future results, these insights may help you understand our investment management philosophy.
See important Fund and, if applicable, index disclosures later in this report.
| 3 | Invesco Convertible Securities Fund |
Your Fund’s Long-Term Performance
Results of a $10,000 Investment – Oldest Share Class(es)
Fund and index data from 12/31/12
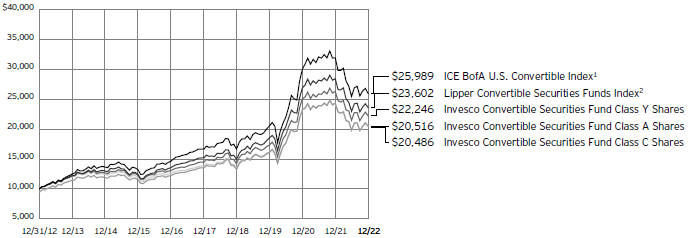
1 Source: RIMES Technologies Corp.
2 Source: Lipper Inc.
Past performance cannot guarantee future results.
The data shown in the chart include reinvested distributions, applicable sales charges and Fund expenses including management
fees. Index results include reinvested dividends, but they do not reflect sales charges. Performance of the peer group, if applicable, reflects fund expenses and management fees;
performance of a market index does not. Performance shown in the chart does not reflect deduction of taxes a shareholder would pay on Fund distributions or sale of Fund shares.
| 4 | Invesco Convertible Securities Fund |
Average Annual Total Returns |
| |||
As of 12/31/22, including maximum applicable sales charges |
| |||
Class A Shares | ||||
Inception (7/28/97) | 6.76 | % | ||
10 Years | 7.45 | |||
5 Years | 7.51 | |||
1 Year | -20.36 | |||
Class C Shares | ||||
Inception (7/28/97) | 6.74 | % | ||
10 Years | 7.43 | |||
5 Years | 7.92 | |||
1 Year | -17.17 | |||
Class Y Shares | ||||
Inception (7/28/97) | 7.26 | % | ||
10 Years | 8.32 | |||
5 Years | 8.99 | |||
1 Year | -15.51 | |||
Class R5 Shares | ||||
Inception (5/23/11) | 7.44 | % | ||
10 Years | 8.36 | |||
5 Years | 9.01 | |||
1 Year | -15.51 | |||
Class R6 Shares | ||||
Inception (9/24/12) | 8.34 | % | ||
10 Years | 8.45 | |||
5 Years | 9.10 | |||
1 Year | -15.45 | |||
Effective June 1, 2010, Class A, Class C and Class I shares of the predecessor fund, Morgan Stanley Convertible Securities Trust, advised by Morgan Stanley Investment Advisors Inc. were reorganized into Class A, Class C and Class Y shares, respectively, of Invesco Convertible Securities Fund. Returns shown above, prior to June 1, 2010, for Class A, Class C and Class Y shares are those for Class A, Class C and Class I shares of the predecessor fund. Share class returns will differ from the predecessor fund because of different expenses.
The performance data quoted represent past performance and cannot guarantee future results; current performance may be lower or higher. Please visit invesco.com/performance for the most recent month-end performance. Performance figures reflect reinvested distributions, changes in net asset value and the effect of the maximum sales charge unless otherwise stated. Performance figures do not reflect deduction of taxes a shareholder would pay on Fund distributions or sale of Fund shares. Investment return and principal value will fluctuate so that you may have a gain or loss when you sell shares.
Class A share performance reflects the maximum 5.50% sales charge, and Class C share performance reflects the applicable contingent deferred sales charge (CDSC) for the period involved. The CDSC on Class C shares is 1% for the first year after purchase. Class Y, Class R5 and Class R6
shares do not have a front-end sales charge or a CDSC; therefore, performance is at net asset value.
The performance of the Fund’s share classes will differ primarily due to different sales charge structures and class expenses.
Fund performance reflects any applicable fee waivers and/or expense reimbursements. Had the adviser not waived fees and/or reimbursed expenses currently or in the past, returns would have been lower. See current prospectus for more information.
| 5 | Invesco Convertible Securities Fund |
Invesco Convertible Securities Fund’s investment objective is total return through growth of capital and current income.
| ∎ | Unless otherwise stated, information presented in this report is as of December 31, 2022, and is based on total net assets. |
| ∎ | Unless otherwise noted, all data is provided by Invesco. |
| ∎ | To access your Fund’s reports/prospectus, visit invesco.com/fundreports. |
About indexes used in this report
| ∎ | The ICE BofA U.S. Convertible Index tracks the performance of US-dollar-denominated convertible securities that are not currently in bankruptcy and have total market values of more than $50 million at issuance. |
| ∎ | The Lipper Convertible Securities Funds Index is an unmanaged index considered representative of convertible securities funds tracked by Lipper. |
| ∎ | The Fund is not managed to track the performance of any particular index, including the index(es) described here, and consequently, the performance of the Fund may deviate significantly from the performance of the index(es). |
| ∎ | A direct investment cannot be made in an index. Unless otherwise indicated, index results include reinvested dividends, and they do not reflect sales charges. Performance of the peer group, if applicable, reflects fund expenses; performance of a market index does not. |
This report must be accompanied or preceded by a currently effective Fund prospectus, which contains more complete information, including sales charges and expenses. Investors should read it carefully before investing. |
| NOT FDIC INSURED | MAY LOSE VALUE | NO BANK GUARANTEE |
| 6 | Invesco Convertible Securities Fund |
Fund Information
Portfolio Composition
| By sector | % of total net assets | ||||
Information Technology | 26.92 | % | |||
Health Care | 19.70 | ||||
Consumer Discretionary | 10.94 | ||||
Utilities | 8.74 | ||||
Industrials | 8.44 | ||||
Communication Services | 7.55 | ||||
Financials | 7.27 | ||||
Energy | 4.47 | ||||
Other Sectors, Each Less than 2% of Net Assets | 2.60 | ||||
Money Market Funds Plus Other Assets Less Liabilities | 3.37 | ||||
Top Five Debt Issuers*
| % of total net assets | |||||||
| 1. | Microchip Technology Inc. | 2.36 | % | ||||
| 2. | Dexcom, Inc. | 1.92 | |||||
| 3. | NiSource, Inc. | 1.75 | |||||
| 4. | Ford Motor Co. | 1.71 | |||||
| 5. | American Electric Power Co., Inc. | 1.70 | |||||
The Fund’s holdings are subject to change, and there is no assurance that the Fund will continue to hold any particular security.
| * | Excluding money market fund holdings, if any. |
Data presented here are as of December 31, 2022.
| 7 | Invesco Convertible Securities Fund |
December 31, 2022
| Principal Amount | Value | |||||||
| ||||||||
U.S. Dollar Denominated Bonds & Notes–79.38% |
| |||||||
Aerospace & Defense–1.60% | ||||||||
Axon Enterprise, Inc., Conv., 0.50%, 12/15/2027(b) | $ | 6,000,000 | $ | 5,976,000 | ||||
| ||||||||
Parsons Corp., Conv., 0.25%, 08/15/2025 | 9,000,000 | 10,273,500 | ||||||
| ||||||||
| 16,249,500 | ||||||||
| ||||||||
Airlines–1.03% | ||||||||
American Airlines Group, Inc., Conv., 6.50%, 07/01/2025 | 4,568,000 | 4,837,512 | ||||||
| ||||||||
Southwest Airlines Co., Conv., 1.25%, 05/01/2025 | 4,731,000 | 5,699,672 | ||||||
| ||||||||
| 10,537,184 | ||||||||
| ||||||||
Apparel Retail–0.95% | ||||||||
Burlington Stores, Inc., Conv., 2.25%, 04/15/2025 | 8,410,000 | 9,713,550 | ||||||
| ||||||||
Application Software–9.92% | ||||||||
Bentley Systems, Inc., Conv., 0.13%, 01/15/2026 | 7,674,000 | 7,037,058 | ||||||
| ||||||||
Bill.com Holdings, Inc., Conv., 0.00%, 04/01/2027(c) | 15,831,000 | 12,593,560 | ||||||
| ||||||||
Blackline, Inc., Conv., 0.00%, 03/15/2026(c) | 2,721,000 | 2,331,557 | ||||||
| ||||||||
Box, Inc., Conv., 0.00%, 01/15/2026(c) | 3,000,000 | 3,949,500 | ||||||
| ||||||||
Coupa Software, Inc., Conv., 0.38%, 06/15/2026 | 11,030,000 | 10,660,495 | ||||||
| ||||||||
Datadog, Inc., Conv., 0.13%, 06/15/2025 | 2,479,000 | 2,717,604 | ||||||
| ||||||||
Dropbox, Inc., Conv., 0.00%, 03/01/2026(c) | 9,383,000 | 8,519,764 | ||||||
| ||||||||
Five9, Inc., Conv., 0.50%, 06/01/2025 | 10,701,000 | 9,828,868 | ||||||
| ||||||||
Nice Ltd. (Israel), Conv., 0.00%, 09/15/2025(c) | 9,925,000 | 9,403,938 | ||||||
| ||||||||
RingCentral, Inc., Conv., 0.00%, 03/01/2025(c) | 7,750,000 | 6,694,063 | ||||||
| ||||||||
Splunk, Inc., Conv., 1.13%, 06/15/2027 | 14,793,000 | 12,556,298 | ||||||
| ||||||||
Tyler Technologies, Inc., Conv., 0.25%, 03/15/2026 | 12,415,000 | 11,595,610 | ||||||
| ||||||||
Workiva, Inc., Conv., 1.13%, 08/15/2026 | 2,500,000 | 3,095,000 | ||||||
| ||||||||
| 100,983,315 | ||||||||
| ||||||||
Asset Management & Custody Banks–1.10% |
| |||||||
Ares Capital Corp., Conv., 4.63%, 03/01/2024 | 10,500,000 | 11,189,063 | ||||||
| ||||||||
Automobile Manufacturers–1.71% |
| |||||||
Ford Motor Co., Conv., 0.00%, 03/15/2026(c) | 18,372,000 | 17,425,842 | ||||||
| ||||||||
Biotechnology–6.59% | ||||||||
Alnylam Pharmaceuticals, Inc., Conv., 1.00%, 09/15/2027(b) | 7,770,000 | 8,449,875 | ||||||
| ||||||||
BioMarin Pharmaceutical, Inc., Conv., 1.25%, 05/15/2027 | 8,800,000 | 9,500,135 | ||||||
| ||||||||
| Principal Amount | Value | |||||||
| ||||||||
Biotechnology–(continued) | ||||||||
Cerevel Therapeutics Holdings, Inc., Conv., 2.50%, 08/15/2027(b) | $ | 2,500,000 | $ | 2,496,250 | ||||
| ||||||||
Exact Sciences Corp., Conv., 0.38%, 03/15/2027 | 6,371,000 | 5,287,930 | ||||||
| ||||||||
Halozyme Therapeutics, Inc., Conv., | 3,900,000 | 3,795,187 | ||||||
| ||||||||
1.00%, 08/15/2028(b) | 4,079,000 | 4,825,967 | ||||||
| ||||||||
Insmed, Inc., | ||||||||
1.75%, 01/15/2025 | 3,283,000 | 3,094,228 | ||||||
| ||||||||
0.75%, 06/01/2028 | 5,000,000 | 4,150,000 | ||||||
| ||||||||
Jazz Investments I Ltd., Conv., 2.00%, 06/15/2026 | 11,700,000 | 13,966,875 | ||||||
| ||||||||
Sarepta Therapeutics, Inc., Conv., 1.25%, 09/15/2027(b) | 10,000,000 | 11,575,000 | ||||||
| ||||||||
| 67,141,447 | ||||||||
| ||||||||
Cable & Satellite–1.97% | ||||||||
Cable One, Inc., Conv., 1.13%, 03/15/2028 | 5,500,000 | 4,114,000 | ||||||
| ||||||||
DISH Network Corp., Conv., 0.00%, 12/15/2025(c) | 5,300,000 | 3,407,900 | ||||||
| ||||||||
Liberty Broadband Corp., | ||||||||
Conv., | ||||||||
1.25%, 10/05/2023(b)(d) | 5,290,000 | 5,131,300 | ||||||
| ||||||||
2.75%, 10/05/2023(b)(d) | 7,575,000 | 7,396,622 | ||||||
| ||||||||
| 20,049,822 | ||||||||
| ||||||||
Coal & Consumable Fuels–0.46% |
| |||||||
Peabody Energy Corp., Conv., 3.25%, 03/01/2028(b) | 3,000,000 | 4,720,500 | ||||||
| ||||||||
Communications Equipment–0.64% |
| |||||||
Lumentum Holdings, Inc., Conv., 0.50%, 12/15/2026 | 7,550,000 | 6,511,875 | ||||||
| ||||||||
Construction Machinery & Heavy Trucks–1.13% |
| |||||||
Greenbrier Cos., Inc. (The), Conv., 2.88%, 04/15/2028 | 13,000,000 | 11,524,500 | ||||||
| ||||||||
Data Processing & Outsourced Services–1.47% |
| |||||||
Block, Inc., | ||||||||
Conv., | 2,000,000 | 1,912,500 | ||||||
| ||||||||
0.00%, 05/01/2026(c) | 7,653,000 | 6,233,369 | ||||||
| ||||||||
Shift4 Payments, Inc., Conv., 0.00%, 12/15/2025(c) | 6,815,000 | 6,785,184 | ||||||
| ||||||||
| 14,931,053 | ||||||||
| ||||||||
Distillers & Vintners–0.50% | ||||||||
MGP Ingredients, Inc., Conv., 1.88%, 11/15/2026(d) | 4,000,000 | 5,055,200 | ||||||
| ||||||||
Diversified Metals & Mining–0.15% |
| |||||||
Lithium Americas Corp. (Canada), Conv., 1.75%, 01/15/2027 | 2,000,000 | 1,568,000 | ||||||
| ||||||||
Education Services–0.44% | ||||||||
Stride, Inc., Conv., 1.13%, 09/01/2027 | 5,000,000 | 4,478,000 | ||||||
| ||||||||
See accompanying Notes to Financial Statements which are an integral part of the financial statements.
| 8 | Invesco Convertible Securities Fund |
| Principal Amount | Value | |||||||
| ||||||||
Electric Utilities–1.70% | ||||||||
American Electric Power Co., Inc., Conv. Investment Units, 6.13%, 08/15/2023 | $ | 335,900 | $ | 17,325,722 | ||||
| ||||||||
Gas Utilities–0.55% | ||||||||
UGI Corp., Conv. Investment Units, 7.25%, 06/01/2024 | 64,300 | 5,557,128 | ||||||
| ||||||||
Health Care Equipment–4.96% |
| |||||||
CONMED Corp., Conv., 2.25%, 06/15/2027(b) | 10,000,000 | 9,160,000 | ||||||
| ||||||||
DexCom, Inc., Conv., 0.25%, 11/15/2025 | 17,880,000 | 19,533,900 | ||||||
| ||||||||
Insulet Corp., Conv., 0.38%, 09/01/2026 | 11,300,000 | 16,012,100 | ||||||
| ||||||||
Integra LifeSciences Holdings Corp., Conv., 0.50%, 08/15/2025 | 6,000,000 | 5,847,000 | ||||||
| ||||||||
| 50,553,000 | ||||||||
| ||||||||
Health Care Supplies–0.42% | ||||||||
Lantheus Holdings, Inc., Conv., 2.63%, 12/15/2027(b) | 4,270,000 | 4,320,813 | ||||||
| ||||||||
Health Care Technology–0.26% |
| |||||||
NextGen Healthcare, Inc., Conv., 3.75%, 11/15/2027(b) | 2,500,000 | 2,613,114 | ||||||
| ||||||||
Hotel & Resort REITs–0.64% |
| |||||||
Pebblebrook Hotel Trust, Conv., 1.75%, 12/15/2026 | 7,876,000 | 6,517,390 | ||||||
| ||||||||
Hotels, Resorts & Cruise Lines–5.49% |
| |||||||
Airbnb, Inc., Conv., 0.00%, 03/15/2026(c) | 10,450,000 | 8,626,475 | ||||||
| ||||||||
Booking Holdings, Inc., Conv., 0.75%, 05/01/2025 | 11,004,000 | 14,711,292 | ||||||
| ||||||||
Expedia Group, Inc., Conv., 0.00%, 02/15/2026(c) | 13,034,000 | 11,416,853 | ||||||
| ||||||||
Marriott Vacations Worldwide Corp., Conv., 3.25%, 12/15/2027(b) | 9,000,000 | 8,910,000 | ||||||
| ||||||||
Royal Caribbean Cruises Ltd., Conv., | 4,346,000 | 4,334,056 | ||||||
| ||||||||
6.00%, 08/15/2025(b) | 6,300,000 | 7,944,300 | ||||||
| ||||||||
| 55,942,976 | ||||||||
| ||||||||
Interactive Home Entertainment–0.40% |
| |||||||
Spotify USA, Inc., Conv., | 5,000,000 | 4,050,000 | ||||||
| ||||||||
Interactive Media & Services–0.76% |
| |||||||
Snap, Inc., Conv., 0.00%, 05/01/2027(c) | 11,000,000 | 7,738,500 | ||||||
| ||||||||
Internet & Direct Marketing Retail–0.85% |
| |||||||
Etsy, Inc., Conv., 0.13%, 09/01/2027 | 4,778,000 | 4,789,945 | ||||||
0.25%, 06/15/2028 | 4,450,000 | 3,832,785 | ||||||
| ||||||||
| 8,622,730 | ||||||||
| ||||||||
| Principal Amount | Value | |||||||
| ||||||||
Internet Services & Infrastructure–4.17% |
| |||||||
Akamai Technologies, Inc., | ||||||||
Conv., | ||||||||
0.13%, 05/01/2025 | $ | 6,600,000 | $ | 6,963,000 | ||||
| ||||||||
0.38%, 09/01/2027 | 3,500,000 | 3,388,000 | ||||||
| ||||||||
Cloudflare, Inc., Conv., 0.00%, 08/15/2026(c) | 12,560,000 | 10,299,200 | ||||||
| ||||||||
Okta, Inc., Conv., 0.38%, 06/15/2026 | 8,582,000 | 7,251,790 | ||||||
| ||||||||
Shopify, Inc. (Canada), Conv., 0.13%, 11/01/2025 | 9,000,000 | 7,728,750 | ||||||
| ||||||||
Wix.com Ltd. (Israel), Conv., 0.00%, 07/01/2023(c) | 7,000,000 | 6,834,100 | ||||||
| ||||||||
| 42,464,840 | ||||||||
| ||||||||
Investment Banking & Brokerage–1.24% |
| |||||||
JPMorgan Chase Financial Co. LLC,Conv., | ||||||||
0.25%, 05/01/2023(b) | 12,378,000 | 12,656,505 | ||||||
| ||||||||
Leisure Facilities–0.85% | ||||||||
Vail Resorts, Inc., Conv., 0.00%, 01/01/2026(c) | 9,262,000 | 8,636,815 | ||||||
| ||||||||
Life Sciences Tools & Services–1.23% |
| |||||||
Illumina, Inc., Conv., 0.00%, 08/15/2023(c) | 10,000,000 | 9,709,757 | ||||||
| ||||||||
NeoGenomics, Inc., Conv., 0.25%, 01/15/2028 | 4,275,000 | 2,805,683 | ||||||
| ||||||||
| 12,515,440 | ||||||||
| ||||||||
Movies & Entertainment–2.80% |
| |||||||
IMAX Corp., Conv., 0.50%, 04/01/2026 | 5,260,000 | 4,462,647 | ||||||
| ||||||||
Liberty Media Corp., Conv., 0.50%, 09/01/2024(b)(d) | 13,300,000 | 13,296,757 | ||||||
| ||||||||
Liberty Media Corp.-Liberty Formula One, Conv., 2.25%, 08/15/2027(b) | 11,200,000 | 10,757,600 | ||||||
| ||||||||
| 28,517,004 | ||||||||
| ||||||||
Multi-Utilities–1.75% | ||||||||
NiSource, Inc., Conv. Investment Units, 7.75%, 03/01/2024 | 172,700 | 17,833,002 | ||||||
| ||||||||
Oil & Gas Exploration & Production–4.01% |
| |||||||
EQT Corp., Conv., 1.75%, 05/01/2026 | 5,584,000 | 12,993,968 | ||||||
| ||||||||
Northern Oil and Gas, Inc., Conv., 3.63%, 04/15/2029(b) | 10,857,000 | 11,725,560 | ||||||
| ||||||||
Pioneer Natural Resources Co., Conv., 0.25%, 05/15/2025 | 6,878,000 | 16,073,886 | ||||||
| ||||||||
| 40,793,414 | ||||||||
| ||||||||
Packaged Foods & Meats–1.31% |
| |||||||
Post Holdings, Inc., Conv., 2.50%, 08/15/2027(b) | 12,670,000 | 13,369,384 | ||||||
| ||||||||
Pharmaceuticals–0.74% | ||||||||
Pacira BioSciences, Inc., Conv., 0.75%, 08/01/2025 | 8,300,000 | 7,516,688 | ||||||
| ||||||||
Renewable Electricity–1.38% | ||||||||
NextEra Energy Partners L.P., Conv., 2.50%, 06/15/2026(b) | 12,000,000 | 11,256,000 | ||||||
| ||||||||
See accompanying Notes to Financial Statements which are an integral part of the financial statements.
| 9 | Invesco Convertible Securities Fund |
| Principal Amount | Value | |||||||
| ||||||||
Renewable Electricity–(continued) |
| |||||||
Sunnova Energy International, Inc., Conv., 2.63%, 02/15/2028(b) | $ | 3,500,000 | $ | 2,843,750 | ||||
| ||||||||
| 14,099,750 | ||||||||
| ||||||||
Research & Consulting Services–1.33% |
| |||||||
KBR, Inc., Conv., 2.50%, 11/01/2023 | 6,430,000 | 13,589,805 | ||||||
| ||||||||
Restaurants–0.65% | ||||||||
Cheesecake Factory, Inc. (The), Conv., 0.38%, 06/15/2026 | 7,998,000 | 6,593,351 | ||||||
| ||||||||
Semiconductor Equipment–1.69% |
| |||||||
Enphase Energy, Inc., Conv., 0.00%, 03/01/2028(c) | 11,450,000 | 13,446,880 | ||||||
| ||||||||
SolarEdge Technologies, Inc., Conv., 0.00%, 09/15/2025(c) | 3,000,000 | 3,739,500 | ||||||
| ||||||||
| 17,186,380 | ||||||||
| ||||||||
Semiconductors–6.00% | ||||||||
Impinj, Inc., Conv., 1.13%, 05/15/2027 | 5,200,000 | 6,266,000 | ||||||
| ||||||||
MACOM Technology Solutions Holdings, Inc., Conv., 0.25%, 03/15/2026 | 7,200,000 | 7,160,400 | ||||||
| ||||||||
Microchip Technology, Inc., Conv., 0.13%, 11/15/2024 | 22,324,000 | 24,054,110 | ||||||
| ||||||||
ON Semiconductor Corp., Conv., 0.00%, 05/01/2027(c) | 4,000,000 | 5,320,000 | ||||||
| ||||||||
Silicon Laboratories, Inc., Conv., 0.63%, 06/15/2025 | 4,275,000 | 5,362,560 | ||||||
| ||||||||
Wolfspeed, Inc., | ||||||||
Conv., | ||||||||
0.25%, 02/15/2028(b) | 4,200,000 | 3,641,400 | ||||||
| ||||||||
1.88%, 12/01/2029(b) | 10,231,000 | 9,264,170 | ||||||
| ||||||||
| 61,068,640 | ||||||||
| ||||||||
Systems Software–1.83% | ||||||||
Palo Alto Networks, Inc., Conv., 0.38%, 06/01/2025 | 9,000,000 | 13,333,500 | ||||||
| ||||||||
Rapid7, Inc., Conv., 0.25%, 03/15/2027 | 6,775,000 | 5,325,107 | ||||||
| ||||||||
| 18,658,607 | ||||||||
| ||||||||
Technology Hardware, Storage & Peripherals–1.20% |
| |||||||
Western Digital Corp., Conv., 1.50%, 02/01/2024 | 12,800,000 | 12,256,000 | ||||||
| ||||||||
Trucking–1.51% | ||||||||
Lyft, Inc., Conv., 1.50%, 05/15/2025 | 2,650,000 | 2,346,468 | ||||||
| ||||||||
Uber Technologies, Inc., Conv., 0.00%, 12/15/2025(c) | 15,350,000 | 13,005,385 | ||||||
| ||||||||
| 15,351,853 | ||||||||
| ||||||||
Total U.S. Dollar Denominated Bonds & Notes |
| 808,427,702 | ||||||
| ||||||||
Abbreviations:
| Conv. | – Convertible | |
| Pfd. | – Preferred | |
| REIT | – Real Estate Investment Trust |
Shares | Value | |||||||
| ||||||||
Preferred Stocks–17.25% | ||||||||
Asset Management & Custody Banks–0.51% |
| |||||||
KKR & Co., Inc., 6.00%, Series C, Conv. Pfd. | 91,213 | $ | 5,221,944 | |||||
| ||||||||
Diversified Banks–4.42% | ||||||||
Bank of America Corp., 7.25%, Series L, Conv. Pfd. | 19,500 | 22,620,000 | ||||||
| ||||||||
Wells Fargo & Co., 7.50%, Class A, Series L, Conv. Pfd. | 18,900 | 22,396,500 | ||||||
| ||||||||
| 45,016,500 | ||||||||
| ||||||||
Electric Utilities–2.36% | ||||||||
NextEra Energy, Inc., 6.93%, Conv. Pfd. | 479,400 | 24,061,086 | ||||||
| ||||||||
Health Care Equipment–3.85% | ||||||||
Becton, Dickinson and Co., 6.00%, Series B, Conv. Pfd. | 403,014 | 20,182,941 | ||||||
| ||||||||
Boston Scientific Corp., 5.50%, Series A, Conv. Pfd. | 165,481 | 19,000,529 | ||||||
| ||||||||
| 39,183,470 | ||||||||
| ||||||||
Independent Power Producers & Energy Traders–1.00% |
| |||||||
AES Corp. (The), 6.88%, Conv. Pfd. | 100,000 | 10,201,000 | ||||||
| ||||||||
Industrial Machinery–1.84% | ||||||||
Chart Industries, Inc., 6.75%, Series B, Conv. Pfd. | 100,000 | 5,064,000 | ||||||
| ||||||||
RBC Bearings, Inc., 5.00%, Series A, Conv. Pfd. | 133,044 | 13,647,653 | ||||||
| ||||||||
| 18,711,653 | ||||||||
| ||||||||
Life Sciences Tools & Services–1.65% |
| |||||||
Danaher Corp., 5.00%, Series B, Conv. Pfd. | 12,400 | 16,821,220 | ||||||
| ||||||||
Wireless Telecommunication Services–1.62% |
| |||||||
2020 Cash Mandatory Exchangeable Trust, 5.25%, Conv. Pfd.(b) | 14,340 | 16,441,097 | ||||||
| ||||||||
Total Preferred Stocks (Cost $175,741,274) |
| 175,657,970 | ||||||
| ||||||||
Money Market Funds–3.37% | ||||||||
Invesco Government & Agency Portfolio, Institutional Class, 4.22%(e)(f) | 11,854,025 | 11,854,025 | ||||||
| ||||||||
Invesco Liquid Assets Portfolio, Institutional Class, 4.42%(e)(f) | 8,901,510 | 8,904,180 | ||||||
| ||||||||
Invesco Treasury Portfolio, Institutional Class, 4.20%(e)(f) | 13,547,457 | 13,547,457 | ||||||
| ||||||||
Total Money Market Funds (Cost $34,301,910) |
| 34,305,662 | ||||||
| ||||||||
TOTAL INVESTMENTS IN SECURITIES-100.00% |
| 1,018,391,334 | ||||||
| ||||||||
OTHER ASSETS LESS LIABILITIES-0.00% |
| 43,633 | ||||||
| ||||||||
NET ASSETS–100.00% | $ | 1,018,434,967 | ||||||
| ||||||||
See accompanying Notes to Financial Statements which are an integral part of the financial statements.
| 10 | Invesco Convertible Securities Fund |
Notes to Schedule of Investments:
| (a) | Industry and/or sector classifications used in this report are generally according to the Global Industry Classification Standard, which was developed by and is the exclusive property and a service mark of MSCI Inc. and Standard & Poor’s. |
| (b) | Security purchased or received in a transaction exempt from registration under the Securities Act of 1933, as amended (the “1933 Act”). The security may be resold pursuant to an exemption from registration under the 1933 Act, typically to qualified institutional buyers. The aggregate value of these securities at December 31, 2022 was $188,771,964, which represented 18.54% of the Fund’s Net Assets. |
| (c) | Zero coupon bond issued at a discount. |
| (d) | Security has an irrevocable call by the issuer or mandatory put by the holder. Maturity date reflects such call or put. |
| (e) | Affiliated issuer. The issuer and/or the Fund is a wholly-owned subsidiary of Invesco Ltd., or is affiliated by having an investment adviser that is under common control of Invesco Ltd. The table below shows the Fund’s transactions in, and earnings from, its investments in affiliates for the fiscal year ended December 31, 2022. |
Value December 31, 2021 | Purchases at Cost | Proceeds from Sales | Change in Unrealized Appreciation | Realized Gain | Value December 31, 2022 | Dividend Income | ||||||||||||||||||||||
| Investments in Affiliated Money Market Funds: | ||||||||||||||||||||||||||||
Invesco Government & Agency Portfolio, Institutional Class | $ 9,593,320 | $122,513,990 | $(120,253,285 | ) | $ | - | $ | - | $11,854,025 | $332,562 | ||||||||||||||||||
Invesco Liquid Assets Portfolio, Institutional Class | 7,285,927 | 87,509,993 | (85,895,204 | ) | 2,767 | 697 | 8,904,180 | 251,234 | ||||||||||||||||||||
Invesco Treasury Portfolio, Institutional Class | 10,963,794 | 140,015,989 | (137,432,326 | ) | - | - | 13,547,457 | 371,235 | ||||||||||||||||||||
Total | $27,843,041 | $350,039,972 | $(343,580,815 | ) | $ | 2,767 | $ | 697 | $34,305,662 | $955,031 | ||||||||||||||||||
| (f) | The rate shown is the 7-day SEC standardized yield as of December 31, 2022. |
See accompanying Notes to Financial Statements which are an integral part of the financial statements.
| 11 | Invesco Convertible Securities Fund |
Statement of Assets and Liabilities
December 31, 2022
Assets: | ||||
Investments in unaffiliated securities, at value | $ | 984,085,672 | ||
| ||||
Investments in affiliated money market funds, at value | 34,305,662 | |||
| ||||
Receivable for: | ||||
Fund shares sold | 328,191 | |||
| ||||
Dividends | 839,259 | |||
| ||||
Interest | 1,675,796 | |||
| ||||
Investment for trustee deferred compensation and retirement plans | 91,434 | |||
| ||||
Other assets | 52,675 | |||
| ||||
Total assets | 1,021,378,689 | |||
| ||||
Liabilities: | ||||
Payable for: | ||||
Fund shares reacquired | 2,227,663 | |||
| ||||
Amount due custodian | 21,564 | |||
| ||||
Accrued fees to affiliates | 475,046 | |||
| ||||
Accrued trustees’ and officers’ fees and benefits | 4,057 | |||
| ||||
Accrued other operating expenses | 71,810 | |||
| ||||
Trustee deferred compensation and retirement plans | 143,582 | |||
| ||||
Total liabilities | 2,943,722 | |||
| ||||
Net assets applicable to shares outstanding | $ | 1,018,434,967 | ||
| ||||
Net assets consist of: | ||||
Shares of beneficial interest | $ | 1,049,840,712 | ||
| ||||
Distributable earnings (loss) | (31,405,745 | ) | ||
| ||||
| $ | 1,018,434,967 | |||
| ||||
Net Assets: | ||||
Class A | $ | 492,448,105 | ||
| ||||
Class C | $ | 21,914,575 | ||
| ||||
Class Y | $ | 345,452,810 | ||
| ||||
Class R5 | $ | 555,990 | ||
| ||||
Class R6 | $ | 158,063,487 | ||
| ||||
Shares outstanding, no par value, with an unlimited number of shares authorized: |
| |||
Class A | 23,353,207 | |||
| ||||
Class C | 1,048,084 | |||
| ||||
Class Y | 16,350,292 | |||
| ||||
Class R5 | 26,370 | |||
| ||||
Class R6 | 7,493,061 | |||
| ||||
Class A: | ||||
Net asset value per share | $ | 21.09 | ||
| ||||
Maximum offering price per share | $ | 22.32 | ||
| ||||
Class C: | ||||
Net asset value and offering price per share | $ | 20.91 | ||
| ||||
Class Y: | ||||
Net asset value and offering price per share | $ | 21.13 | ||
| ||||
Class R5: | ||||
Net asset value and offering price per share | $ | 21.08 | ||
| ||||
Class R6: | ||||
Net asset value and offering price per share | $ | 21.09 | ||
| ||||
See accompanying Notes to Financial Statements which are an integral part of the financial statements.
| 12 | Invesco Convertible Securities Fund |
Statement of Operations
For the year ended December 31, 2022
Investment income: | ||||
Interest | $ | 8,714,597 | ||
| ||||
Dividends | 10,166,291 | |||
| ||||
Dividends from affiliated money market funds | 955,031 | |||
| ||||
Total investment income | 19,835,919 | |||
| ||||
Expenses: | ||||
Advisory fees | 5,504,917 | |||
| ||||
Administrative services fees | 157,595 | |||
| ||||
Custodian fees | 10,235 | |||
| ||||
Distribution fees: | ||||
Class A | 1,377,947 | |||
| ||||
Class C | 297,388 | |||
| ||||
Transfer agent fees – A, C and Y | 1,455,584 | |||
| ||||
Transfer agent fees – R5 | 595 | |||
| ||||
Transfer agent fees – R6 | 27,445 | |||
| ||||
Trustees’ and officers’ fees and benefits | 28,276 | |||
| ||||
Registration and filing fees | 109,143 | |||
| ||||
Reports to shareholders | 35,889 | |||
| ||||
Professional services fees | 59,982 | |||
| ||||
Other | 21,748 | |||
| ||||
Total expenses | 9,086,744 | |||
| ||||
Less: Fees waived and/or expense offset arrangement(s) | (56,970 | ) | ||
| ||||
Net expenses | 9,029,774 | |||
| ||||
Net investment income | 10,806,145 | |||
| ||||
Realized and unrealized gain (loss) from: | ||||
Net realized gain from: | ||||
Unaffiliated investment securities | 3,485,371 | |||
| ||||
Affiliated investment securities | 697 | |||
| ||||
| 3,486,068 | ||||
| ||||
Change in net unrealized appreciation (depreciation) of: | ||||
Unaffiliated investment securities | (216,572,399 | ) | ||
| ||||
Affiliated investment securities | 2,767 | |||
| ||||
| (216,569,632 | ) | |||
| ||||
Net realized and unrealized gain (loss) | (213,083,564 | ) | ||
| ||||
Net increase (decrease) in net assets resulting from operations | $ | (202,277,419 | ) | |
| ||||
See accompanying Notes to Financial Statements which are an integral part of the financial statements.
| 13 | Invesco Convertible Securities Fund |
Statement of Changes in Net Assets
For the years ended December 31, 2022 and 2021
| 2022 | 2021 | |||||||
| ||||||||
Operations: | ||||||||
Net investment income | $ | 10,806,145 | $ | 7,385,681 | ||||
| ||||||||
Net realized gain | 3,486,068 | 308,607,088 | ||||||
| ||||||||
Change in net unrealized appreciation (depreciation) | (216,569,632 | ) | (250,679,173 | ) | ||||
| ||||||||
Net increase (decrease) in net assets resulting from operations | (202,277,419 | ) | 65,313,596 | |||||
| ||||||||
Distributions to shareholders from distributable earnings: | ||||||||
Class A | (18,142,854 | ) | (151,866,092 | ) | ||||
| ||||||||
Class C | (644,843 | ) | (10,126,673 | ) | ||||
| ||||||||
Class Y | (14,432,013 | ) | (133,876,860 | ) | ||||
| ||||||||
Class R5 | (22,202 | ) | (163,041 | ) | ||||
| ||||||||
Class R6 | (5,880,841 | ) | (11,990,219 | ) | ||||
| ||||||||
Total distributions from distributable earnings | (39,122,753 | ) | (308,022,885 | ) | ||||
| ||||||||
Share transactions-net: | ||||||||
Class A | (53,910,378 | ) | 113,132,118 | |||||
| ||||||||
Class C | (15,661,262 | ) | (8,545,267 | ) | ||||
| ||||||||
Class Y | (120,239,335 | ) | 18,943,866 | |||||
| ||||||||
Class R5 | (3,856 | ) | (1,040,071 | ) | ||||
| ||||||||
Class R6 | 123,442,993 | 5,015,733 | ||||||
| ||||||||
Net increase (decrease) in net assets resulting from share transactions | (66,371,838 | ) | 127,506,379 | |||||
| ||||||||
Net increase (decrease) in net assets | (307,772,010 | ) | (115,202,910 | ) | ||||
| ||||||||
Net assets: | ||||||||
Beginning of year | 1,326,206,977 | 1,441,409,887 | ||||||
| ||||||||
End of year | $ | 1,018,434,967 | $ | 1,326,206,977 | ||||
| ||||||||
See accompanying Notes to Financial Statements which are an integral part of the financial statements.
| 14 | Invesco Convertible Securities Fund |
The following schedule presents financial highlights for a share of the Fund outstanding throughout the periods indicated.
Net asset value, beginning of period | Net investment income (loss)(a) | Net gains (losses) on securities (both realized and unrealized) | Total from investment operations | Dividends from net investment income | Distributions from net realized gains | Total distributions | Net asset value, end of period | Total return (b) | Net assets, end of period (000’s omitted) | Ratio of expenses to average net assets with fee waivers and/or expenses absorbed | Ratio of expenses to average net assets without fee waivers and/or expenses absorbed | Ratio of net investment income (loss) to average net assets | Portfolio turnover (c) | |||||||||||||||||||||||||||||||||||||||||||
Class A | ||||||||||||||||||||||||||||||||||||||||||||||||||||||||
Year ended 12/31/22 | $25.93 | $0.20 | $(4.26 | ) | $(4.06 | ) | $(0.19 | ) | $(0.59 | ) | $(0.78 | ) | $21.09 | (15.72 | )% | $492,448 | 0.93 | % | 0.93 | % | 0.86 | % | 45 | % | ||||||||||||||||||||||||||||||||
Year ended 12/31/21 | 31.91 | 0.14 | 1.17 | 1.31 | (0.23 | ) | (7.06 | ) | (7.29 | ) | 25.93 | 4.68 | 666,916 | 0.88 | 0.88 | 0.43 | 61 | |||||||||||||||||||||||||||||||||||||||
Year ended 12/31/20 | 24.64 | 0.23 | 10.47 | 10.70 | (0.37 | ) | (3.06 | ) | (3.43 | ) | 31.91 | 44.35 | 675,347 | 0.91 | 0.91 | 0.84 | 65 | |||||||||||||||||||||||||||||||||||||||
Year ended 12/31/19 | 21.42 | 0.28 | 4.28 | 4.56 | (0.36 | ) | (0.98 | ) | (1.34 | ) | 24.64 | 21.42 | (d) | 473,599 | 0.90 | (d) | 0.90 | (d) | 1.13 | (d) | 57 | |||||||||||||||||||||||||||||||||||
Year ended 12/31/18 | 24.41 | 0.28 | (0.62 | ) | (0.34 | ) | (0.57 | ) | (2.08 | ) | (2.65 | ) | 21.42 | (1.71 | )(e) | 407,548 | 0.90 | (e) | 0.90 | (e) | 1.09 | (e) | 62 | |||||||||||||||||||||||||||||||||
Class C | ||||||||||||||||||||||||||||||||||||||||||||||||||||||||
Year ended 12/31/22 | 25.72 | 0.03 | (4.22 | ) | (4.19 | ) | (0.03 | ) | (0.59 | ) | (0.62 | ) | 20.91 | (16.35 | )(f) | 21,915 | 1.66 | (f) | 1.66 | (f) | 0.13 | (f) | 45 | |||||||||||||||||||||||||||||||||
Year ended 12/31/21 | 31.73 | (0.09 | ) | 1.16 | 1.07 | (0.02 | ) | (7.06 | ) | (7.08 | ) | 25.72 | 3.94 | (g) | 44,798 | 1.60 | (g) | 1.60 | (g) | (0.29 | )(g) | 61 | ||||||||||||||||||||||||||||||||||
Year ended 12/31/20 | 24.51 | 0.03 | 10.41 | 10.44 | (0.16 | ) | (3.06 | ) | (3.22 | ) | 31.73 | 43.25 | 61,221 | 1.66 | 1.66 | 0.09 | 65 | |||||||||||||||||||||||||||||||||||||||
Year ended 12/31/19 | 21.31 | 0.10 | 4.26 | 4.36 | (0.18 | ) | (0.98 | ) | (1.16 | ) | 24.51 | 20.54 | (d) | 65,607 | 1.63 | (d) | 1.63 | (d) | 0.40 | (d) | 57 | |||||||||||||||||||||||||||||||||||
Year ended 12/31/18 | 24.30 | 0.08 | (0.62 | ) | (0.54 | ) | (0.37 | ) | (2.08 | ) | (2.45 | ) | 21.31 | (2.48 | )(e) | 81,529 | 1.66 | (e) | 1.66 | (e) | 0.33 | (e) | 62 | |||||||||||||||||||||||||||||||||
Class Y | ||||||||||||||||||||||||||||||||||||||||||||||||||||||||
Year ended 12/31/22 | 25.98 | 0.26 | (4.27 | ) | (4.01 | ) | (0.25 | ) | (0.59 | ) | (0.84 | ) | 21.13 | (15.51 | ) | 345,453 | 0.68 | 0.68 | 1.11 | 45 | ||||||||||||||||||||||||||||||||||||
Year ended 12/31/21 | 31.96 | 0.22 | 1.17 | 1.39 | (0.31 | ) | (7.06 | ) | (7.37 | ) | 25.98 | 4.93 | 562,488 | 0.63 | 0.63 | 0.68 | 61 | |||||||||||||||||||||||||||||||||||||||
Year ended 12/31/20 | 24.68 | 0.30 | 10.48 | 10.78 | (0.44 | ) | (3.06 | ) | (3.50 | ) | 31.96 | 44.69 | 647,484 | 0.66 | 0.66 | 1.09 | 65 | |||||||||||||||||||||||||||||||||||||||
Year ended 12/31/19 | 21.44 | 0.33 | 4.30 | 4.63 | (0.41 | ) | (0.98 | ) | (1.39 | ) | 24.68 | 21.73 | 582,112 | 0.67 | 0.67 | 1.36 | 57 | |||||||||||||||||||||||||||||||||||||||
Year ended 12/31/18 | 24.44 | 0.33 | (0.62 | ) | (0.29 | ) | (0.63 | ) | (2.08 | ) | (2.71 | ) | 21.44 | (1.51 | ) | 583,289 | 0.66 | 0.66 | 1.33 | 62 | ||||||||||||||||||||||||||||||||||||
Class R5 | ||||||||||||||||||||||||||||||||||||||||||||||||||||||||
Year ended 12/31/22 | 25.93 | 0.26 | (4.26 | ) | (4.00 | ) | (0.26 | ) | (0.59 | ) | (0.85 | ) | 21.08 | (15.51 | ) | 556 | 0.64 | 0.64 | 1.15 | 45 | ||||||||||||||||||||||||||||||||||||
Year ended 12/31/21 | 31.91 | 0.23 | 1.17 | 1.40 | (0.32 | ) | (7.06 | ) | (7.38 | ) | 25.93 | 4.96 | 688 | 0.60 | 0.60 | 0.71 | 61 | |||||||||||||||||||||||||||||||||||||||
Year ended 12/31/20 | 24.65 | 0.31 | 10.46 | 10.77 | (0.45 | ) | (3.06 | ) | (3.51 | ) | 31.91 | 44.70 | 1,773 | 0.64 | 0.64 | 1.11 | 65 | |||||||||||||||||||||||||||||||||||||||
Year ended 12/31/19 | 21.43 | 0.34 | 4.29 | 4.63 | (0.43 | ) | (0.98 | ) | (1.41 | ) | 24.65 | 21.74 | 1,334 | 0.64 | 0.64 | 1.39 | 57 | |||||||||||||||||||||||||||||||||||||||
Year ended 12/31/18 | 24.43 | 0.34 | (0.62 | ) | (0.28 | ) | (0.64 | ) | (2.08 | ) | (2.72 | ) | 21.43 | (1.49 | ) | 1,081 | 0.64 | 0.64 | 1.35 | 62 | ||||||||||||||||||||||||||||||||||||
Class R6 | ||||||||||||||||||||||||||||||||||||||||||||||||||||||||
Year ended 12/31/22 | 25.94 | 0.27 | (4.26 | ) | (3.99 | ) | (0.27 | ) | (0.59 | ) | (0.86 | ) | 21.09 | (15.45 | ) | 158,063 | 0.57 | 0.57 | 1.22 | 45 | ||||||||||||||||||||||||||||||||||||
Year ended 12/31/21 | 31.92 | 0.25 | 1.17 | 1.42 | (0.34 | ) | (7.06 | ) | (7.40 | ) | 25.94 | 5.06 | 51,316 | 0.52 | 0.52 | 0.79 | 61 | |||||||||||||||||||||||||||||||||||||||
Year ended 12/31/20 | 24.65 | 0.33 | 10.47 | 10.80 | (0.47 | ) | (3.06 | ) | (3.53 | ) | 31.92 | 44.86 | 55,585 | 0.56 | 0.56 | 1.19 | 65 | |||||||||||||||||||||||||||||||||||||||
Year ended 12/31/19 | 21.43 | 0.36 | 4.29 | 4.65 | (0.45 | ) | (0.98 | ) | (1.43 | ) | 24.65 | 21.82 | 42,492 | 0.56 | 0.56 | 1.47 | 57 | |||||||||||||||||||||||||||||||||||||||
Year ended 12/31/18 | 24.43 | 0.36 | (0.62 | ) | (0.26 | ) | (0.66 | ) | (2.08 | ) | (2.74 | ) | 21.43 | (1.41 | ) | 47,908 | 0.56 | 0.56 | 1.43 | 62 | ||||||||||||||||||||||||||||||||||||
| (a) | Calculated using average shares outstanding. |
| (b) | Includes adjustments in accordance with accounting principles generally accepted in the United States of America and as such, the net asset value for financial reporting purposes and the returns based upon those net asset values may differ from the net asset value and returns for shareholder transactions. Does not include sales charges and is not annualized for periods less than one year, if applicable. |
| (c) | Portfolio turnover is calculated at the fund level and is not annualized for periods less than one year, if applicable. |
| (d) | The total return, ratio of expenses to average net assets and ratio of net investment income to average net assets reflect actual 12b-1 fees of 0.23% and 0.96% for Class A and Class C shares, respectively. |
| (e) | The total return, ratio of expenses to average net assets and ratio of net investment income to average net assets reflect actual 12b-1 fees of 0.24% and 1.00% for Class A and Class C shares, respectively. |
| (f) | The total return, ratio of expenses to average net assets and ratio of net investment income to average net assets reflect actual 12b-1 fees of 0.98% for Class C shares. |
| (g) | The total return, ratio of expenses to average net assets and ratio of net investment income to average net assets reflect actual 12b-1 fees of 0.97% for Class C shares. |
See accompanying Notes to Financial Statements which are an integral part of the financial statements.
| 15 | Invesco Convertible Securities Fund |
December 31, 2022
NOTE 1–Significant Accounting Policies
Invesco Convertible Securities Fund (the “Fund”) is a series portfolio of AIM Growth Series (Invesco Growth Series) (the “Trust”). The Trust is a Delaware statutory trust registered under the Investment Company Act of 1940, as amended (the “1940 Act”), as an open-end series management investment company authorized to issue an unlimited number of shares of beneficial interest. Information presented in these financial statements pertains only to the Fund. Matters affecting the Fund or each class will be voted on exclusively by the shareholders of the Fund or each class.
The Fund’s investment objective is total return through growth of capital and current income.
The Fund currently consists of five different classes of shares: Class A, Class C, Class Y, Class R5 and Class R6. Class Y shares are available only to certain investors. Class A shares are sold with a front-end sales charge unless certain waiver criteria are met. Under certain circumstances, load waived shares may be subject to contingent deferred sales charges (“CDSC”). Class C shares are sold with a CDSC. Class Y, Class R5 and Class R6 shares are sold at net asset value. Class C shares held for eight years after purchase are eligible for automatic conversion into Class A shares of the same Fund (the “Conversion Feature”). The automatic conversion pursuant to the Conversion Feature will generally occur at the end of the month following the eighth anniversary after a purchase of Class C shares.
The Fund is an investment company and accordingly follows the investment company accounting and reporting guidance in accordance with Financial Accounting Standards Board Accounting Standards Codification Topic 946, Financial Services – Investment Companies.
The following is a summary of the significant accounting policies followed by the Fund in the preparation of its financial statements.
| A. | Security Valuations – Securities, including restricted securities, are valued according to the following policy. |
Fixed income securities (including convertible debt securities) generally are valued on the basis of prices provided by independent pricing services. Prices provided by the pricing service may be determined without exclusive reliance on quoted prices, and may reflect appropriate factors such as institution-size trading in similar groups of securities, developments related to specific securities, dividend rate (for unlisted equities), yield (for debt obligations), quality, type of issue, coupon rate (for debt obligations), maturity (for debt obligations), individual trading characteristics and other market data. Pricing services generally value debt obligations assuming orderly transactions of institutional round lot size, but a fund may hold or transact in the same securities in smaller, odd lot sizes. Odd lots often trade at lower prices than institutional round lots, and their value may be adjusted accordingly. Debt obligations are subject to interest rate and credit risks. In addition, all debt obligations involve some risk of default with respect to interest and/or principal payments.
A security listed or traded on an exchange is generally valued at its trade price or official closing price that day as of the close of the exchange where the security is principally traded, or lacking any trades or official closing price on a particular day, the security may be valued at the closing bid price on that day. Securities traded in the over-the-counter market are valued based on prices furnished by independent pricing services or market makers. When such securities are valued using prices provided by an independent pricing service they may be considered fair valued.
Securities of investment companies that are not exchange-traded (e.g., open-end mutual funds) are valued using such company’s end-of-business-day net asset value per share.
Deposits, other obligations of U.S. and non-U.S. banks and financial institutions are valued at their daily account value.
Foreign securities’ (including foreign exchange contracts) prices are converted into U.S. dollar amounts using the applicable exchange rates as of the close of the New York Stock Exchange (“NYSE”). If market quotations are available and reliable for foreign exchange-traded equity securities, the securities will be valued at the market quotations. Invesco Advisers, Inc. (the “Adviser” or “Invesco”) may use various pricing services to obtain market quotations as well as fair value prices. Because trading hours for certain foreign securities end before the close of the NYSE, closing market quotations may become not representative of market value in the Adviser’s judgment (“unreliable”). If, between the time trading ends on a particular security and the close of the customary trading session on the NYSE, a significant event occurs that makes the closing price of the security unreliable, the Adviser may fair value the security. If the event is likely to have affected the closing price of the security, the security will be valued at fair value in good faith in accordance with Board- approved policies and related Adviser procedures (“Valuation Procedures”). Adjustments to closing prices to reflect fair value may also be based on a screening process of an independent pricing service to indicate the degree of certainty, based on historical data, that the closing price in the principal market where a foreign security trades is not the current value as of the close of the NYSE. Foreign securities’ prices meeting the degree of certainty that the price is not reflective of current value will be priced at the indication of fair value from the independent pricing service. Multiple factors may be considered by the independent pricing service in determining adjustments to reflect fair value and may include information relating to sector indices, American Depositary Receipts and domestic and foreign index futures. Foreign securities may have additional risks including exchange rate changes, potential for sharply devalued currencies and high inflation, political and economic upheaval, the relative lack of issuer information, relatively low market liquidity and the potential lack of strict financial and accounting controls and standards.
Unlisted securities will be valued using prices provided by independent pricing services or by another method that the Adviser, in its judgment, believes better reflects the security’s fair value in accordance with the Valuation Procedures.
Securities for which market prices are not provided by any of the above methods may be valued based upon quotes furnished by independent sources. The last bid price may be used to value equity securities. The mean between the last bid and asked prices may be used to value debt obligations, including corporate loans.
Securities for which market quotations are not readily available are fair valued by the Adviser in accordance with the Valuation Procedures. If a fair value price provided by a pricing service is unreliable, the Adviser will fair value the security using the Valuation Procedures. Issuer specific events, market trends, bid/asked quotes of brokers and information providers and other market data may be reviewed in the course of making a good faith determination of a security’s fair value.
The Fund may invest in securities that are subject to interest rate risk, meaning the risk that the prices will generally fall as interest rates rise and, conversely, the prices will generally rise as interest rates fall. Specific securities differ in their sensitivity to changes in interest rates depending on their individual characteristics. Changes in interest rates may result in increased market volatility, which may affect the value and/or liquidity of certain Fund investments.
Valuations change in response to many factors including the historical and prospective earnings of the issuer, the value of the issuer’s assets, general market conditions which are not specifically related to the particular issuer, such as real or perceived adverse economic conditions, changes in the general outlook for revenues or corporate earnings, changes in interest or currency rates, regional or global instability, natural or environmental disasters, widespread disease or other public health issues, war, acts of terrorism, significant governmental actions or adverse investor sentiment generally and market liquidity. Because of the inherent uncertainties of valuation, the values reflected in the financial statements may materially differ from the value received upon actual sale of those investments.
The price the Fund could receive upon the sale of any investment may differ from the Adviser’s valuation of the investment, particularly for securities that are valued using a fair valuation technique. When fair valuation techniques are applied, the Adviser uses available information, including both observable and unobservable inputs and assumptions, to determine a methodology that will result in a valuation that the Adviser believes approximates market value. Fund securities that are fair valued may be subject to greater fluctuation in their value from one day to the next than would be the case if market quotations were used. Because of the inherent uncertainties of valuation, and the degree of subjectivity in such decisions, the Fund could realize a greater or lesser than expected gain or loss upon the sale of the investment.
| B. | Securities Transactions and Investment Income – Securities transactions are accounted for on a trade date basis. Realized gains or losses on sales are computed on the basis of specific identification of the securities sold. Interest income (net of withholding tax, if any) is recorded on an accrual basis from settlement date and includes coupon interest and amortization of premium and accretion of discount on debt securities as applicable. Pay-in-kind interest income |
| 16 | Invesco Convertible Securities Fund |
| and non-cash dividend income received in the form of securities in-lieu of cash are recorded at the fair value of the securities received. Paydown gains and losses on mortgage and asset-backed securities are recorded as adjustments to interest income. Dividend income (net of withholding tax, if any) is recorded on the ex-dividend date. |
The Fund may periodically participate in litigation related to Fund investments. As such, the Fund may receive proceeds from litigation settlements. Any proceeds received are included in the Statement of Operations as realized gain (loss) for investments no longer held and as unrealized gain (loss) for investments still held.
Brokerage commissions and mark ups are considered transaction costs and are recorded as an increase to the cost basis of securities purchased and/or a reduction of proceeds on a sale of securities. Such transaction costs are included in the determination of net realized and unrealized gain (loss) from investment securities reported in the Statement of Operations and the Statement of Changes in Net Assets and the net realized and unrealized gains (losses) on securities per share in the Financial Highlights. Transaction costs are included in the calculation of the Fund’s net asset value and, accordingly, they reduce the Fund’s total returns. These transaction costs are not considered operating expenses and are not reflected in net investment income reported in the Statement of Operations and the Statement of Changes in Net Assets, or the net investment income per share and the ratios of expenses and net investment income reported in the Financial Highlights, nor are they limited by any expense limitation arrangements between the Fund and the investment adviser.
The Fund allocates income and realized and unrealized capital gains and losses to a class based on the relative net assets of each class.
| C. | Country Determination — For the purposes of making investment selection decisions and presentation in the Schedule of Investments, the investment adviser may determine the country in which an issuer is located and/or credit risk exposure based on various factors. These factors include the laws of the country under which the issuer is organized, where the issuer maintains a principal office, the country in which the issuer derives 50% or more of its total revenues, the country that has the primary market for the issuer’s securities and its “country of risk” as determined by a third party service provider, as well as other criteria. Among the other criteria that may be evaluated for making this determination are the country in which the issuer maintains 50% or more of its assets, the type of security, financial guarantees and enhancements, the nature of the collateral and the sponsor organization. Country of issuer and/or credit risk exposure has been determined to be the United States of America, unless otherwise noted. |
| D. | Distributions - Distributions from net investment income, if any, are declared and paid quarterly and are recorded on the ex-dividend date. Distributions from net realized capital gain, if any, are generally declared and paid annually and recorded on the ex-dividend date. The Fund may elect to treat a portion of the proceeds from redemptions as distributions for federal income tax purposes. |
| E. | Federal Income Taxes – The Fund intends to comply with the requirements of Subchapter M of the Internal Revenue Code of 1986, as amended (the “Internal Revenue Code”), necessary to qualify as a regulated investment company and to distribute substantially all of the Fund’s taxable earnings to shareholders. As such, the Fund will not be subject to federal income taxes on otherwise taxable income (including net realized capital gain) that is distributed to shareholders. Therefore, no provision for federal income taxes is recorded in the financial statements. |
The Fund recognizes the tax benefits of uncertain tax positions only when the position is more likely than not to be sustained. Management has analyzed the Fund’s uncertain tax positions and concluded that no liability for unrecognized tax benefits should be recorded related to uncertain tax positions. Management is not aware of any tax positions for which it is reasonably possible that the total amounts of unrecognized tax benefits will change materially in the next 12 months.
The Fund files tax returns in the U.S. Federal jurisdiction and certain other jurisdictions. Generally, the Fund is subject to examinations by such taxing authorities for up to three years after the filing of the return for the tax period.
| F. | Expenses – Fees provided for under the Rule 12b-1 plan of a particular class of the Fund are charged to the operations of such class. Transfer agency fees and expenses and other shareholder recordkeeping fees and expenses attributable to Class R5 and Class R6 are allocated based on relative net assets of Class R5 and Class R6. Sub-accounting fees attributable to Class R5 are charged to the operations of the class. Transfer agency fees and expenses and other shareholder recordkeeping fees and expenses relating to all other classes are allocated among those classes based on relative net assets. All other expenses are allocated among the classes based on relative net assets. |
| G. | Accounting Estimates – The preparation of financial statements in conformity with accounting principles generally accepted in the United States of America (“GAAP”) requires management to make estimates and assumptions that affect the reported amounts of assets and liabilities at the date of the financial statements and the reported amounts of revenues and expenses during the reporting period including estimates and assumptions related to taxation. Actual results could differ from those estimates by a significant amount. In addition, the Fund monitors for material events or transactions that may occur or become known after the period-end date and before the date the financial statements are released to print. |
| H. | Indemnifications – Under the Trust’s organizational documents, each Trustee, officer, employee or other agent of the Trust is indemnified against certain liabilities that may arise out of the performance of their duties to the Fund. Additionally, in the normal course of business, the Fund enters into contracts, including the Fund’s servicing agreements, that contain a variety of indemnification clauses. The Fund’s maximum exposure under these arrangements is unknown as this would involve future claims that may be made against the Fund that have not yet occurred. The risk of material loss as a result of such indemnification claims is considered remote. |
| I. | Other Risks - During the period, the Fund experienced a low interest rate environment created in part by the Federal Reserve Board (FRB) and certain foreign central banks keeping the federal funds and equivalent foreign rates near historical lows. Increases in the federal funds and equivalent foreign rates may expose fixed income markets to heightened volatility and reduced liquidity for certain fixed income investments, particularly those with longer maturities. In addition, decreases in fixed income dealer market-making capacity may also potentially lead to heightened volatility and reduced liquidity in the fixed income markets. As a result, the value of the Fund’s investments and share price may decline. Changes in central bank policies could also result in higher than normal shareholder redemptions, which could potentially increase portfolio turnover and the Fund’s transaction costs. |
The market values of convertible securities are affected by market interest rates, the risk of actual issuer default on interest or principal payments and the value of the underlying common stock into which the convertible security may be converted. Additionally, a convertible security is subject to the same types of market and issuer risks as apply to the underlying common stock. In addition, certain convertible securities are subject to involuntary conversions and may undergo principal write-downs upon the occurrence of certain triggering events, and, as a result, are subject to an increased risk of loss. Convertible securities may be rated below investment grade.
Preferred securities are subject to issuer-specific and market risks applicable generally to equity securities. Preferred securities also may be subordinated to bonds or other debt instruments, subjecting them to a greater risk of non-payment, may be less liquid than many other securities, such as common stocks, and generally offer no voting rights with respect to the issuer.
| J. | COVID-19 Risk - The COVID-19 strain of coronavirus has resulted in instances of market closures and dislocations, extreme volatility, liquidity constraints and increased trading costs. Efforts to contain its spread have resulted in travel restrictions, disruptions of healthcare systems, business operations (including business closures) and supply chains, layoffs, lower consumer demand and employee availability, and defaults and credit downgrades, among other significant economic impacts that have disrupted global economic activity across many industries. Such economic impacts may exacerbate other pre-existing political, social and economic risks locally or globally and cause general concern and uncertainty. The full economic impact and ongoing effects of COVID-19 (or other future epidemics or pandemics) at the macro-level and on individual businesses are unpredictable and may result in significant and prolonged effects on the Fund’s performance. |
| 17 | Invesco Convertible Securities Fund |
NOTE 2–Advisory Fees and Other Fees Paid to Affiliates
The Trust has entered into a master investment advisory agreement with the Adviser. Under the terms of the investment advisory agreement, the Fund accrues daily and pays monthly an advisory fee to the Adviser based on the annual rate of the Fund’s average daily net assets as follows:
| Average Daily Net Assets | Rate | |||||
| ||||||
First $750 million | 0.520% | |||||
| ||||||
Next $250 million | 0.470% | |||||
| ||||||
Next $500 million | 0.420% | |||||
| ||||||
Next $500 million | 0.395% | |||||
| ||||||
Next $1 billion | 0.370% | |||||
| ||||||
Over $3 billion | 0.345% | |||||
| ||||||
For the year ended December 31, 2022, the effective advisory fee rate incurred by the Fund was 0.50%.
Under the terms of a master sub-advisory agreement between the Adviser and each of Invesco Asset Management Deutschland GmbH, Invesco Asset Management Limited, Invesco Asset Management (Japan) Limited, Invesco Hong Kong Limited, Invesco Senior Secured Management, Inc. and Invesco Canada Ltd. and separate sub-advisory agreements with Invesco Capital Management LLC and Invesco Asset Management (India) Private Limited (collectively, the “Affiliated Sub-Advisers”) the Adviser, not the Fund, will pay 40% of the fees paid to the Adviser to any such Affiliated Sub-Adviser(s) that provide(s) discretionary investment management services to the Fund based on the percentage of assets allocated to such Affiliated Sub-Adviser(s).
The Adviser has contractually agreed, through at least June 30, 2023, to waive advisory fees and/or reimburse expenses of all shares to the extent necessary to limit total annual fund operating expenses after fee waiver and/or expense reimbursement (excluding certain items discussed below) of Class A, Class C, Class Y, Class R5 and Class R6 shares to 1.50%, 2.25%, 1.25%, 1.25% and 1.25%, respectively, of the Fund’s average daily net assets (the “expense limits”). In determining the Adviser’s obligation to waive advisory fees and/or reimburse expenses, the following expenses are not taken into account, and could cause the total annual fund operating expenses after fee waiver and/or expense reimbursement to exceed the numbers reflected above: (1) interest; (2) taxes; (3) dividend expense on short sales; (4) extraordinary or non-routine items, including litigation expenses; and (5) expenses that the Fund has incurred but did not actually pay because of an expense offset arrangement. Unless Invesco continues the fee waiver agreement, it will terminate on June 30, 2023. During its term, the fee waiver agreement cannot be terminated or amended to increase the expense limits or reduce the advisory fee waiver without approval of the Board of Trustees. The Adviser did not waive fees and/or reimburse expenses during the period under these expense limits.
Further, the Adviser has contractually agreed, through at least June 30, 2024, to waive the advisory fee payable by the Fund in an amount equal to 100% of the net advisory fees the Adviser receives from the affiliated money market funds on investments by the Fund of uninvested cash in such affiliated money market funds.
For the year ended December 31, 2022, the Adviser waived advisory fees of $54,108.
The Trust has entered into a master administrative services agreement with Invesco pursuant to which the Fund has agreed to pay Invesco for certain administrative costs incurred in providing accounting services to the Fund. For the year ended December 31, 2022, expenses incurred under the agreement are shown in the Statement of Operations as Administrative services fees. Invesco has entered into a sub-administration agreement whereby State Street Bank and Trust Company (“SSB”) serves as fund accountant and provides certain administrative services to the Fund. Pursuant to a custody agreement with the Trust on behalf of the Fund, SSB also serves as the Fund’s custodian.
The Trust has entered into a transfer agency and service agreement with Invesco Investment Services, Inc. (“IIS”) pursuant to which the Fund has agreed to pay IIS a fee for providing transfer agency and shareholder services to the Fund and reimburse IIS for certain expenses incurred by IIS in the course of providing such services. IIS may make payments to intermediaries that provide omnibus account services, sub-accounting services and/or networking services. All fees payable by IIS to intermediaries that provide omnibus account services or sub-accounting services are charged back to the Fund, subject to certain limitations approved by the Trust’s Board of Trustees. For the year ended December 31, 2022, expenses incurred under the agreement are shown in the Statement of Operations as Transfer agent fees.
Shares of the Fund are distributed by Invesco Distributors, Inc. (“IDI”), an affiliate of the Adviser. The Fund has adopted a Plan of Distribution (the “Plan”) pursuant to Rule 12b-1 under the 1940 Act. The Plan provides that the Fund will reimburse IDI for distribution related expenses that IDI incurs up to a maximum of the following annual rates: (1) Class A – up to 0.25% of the average daily net assets of Class A shares; and (2) Class C – up to 1.00% of the average daily net assets of Class C shares. The fees are accrued daily and paid monthly.
For the year ended December 31, 2022, expenses incurred under these agreements are shown in the Statement of Operations as Distribution fees.
Front-end sales commissions and CDSC (collectively, the “sales charges”) are not recorded as expenses of the Fund. Front-end sales commissions are deducted from proceeds from the sales of Fund shares prior to investment in Class A shares of the Fund. CDSC are deducted from redemption proceeds prior to remittance to the shareholder. During the year ended December 31, 2022, IDI advised the Fund that IDI retained $52,279 in front-end sales commissions from the sale of Class A shares and $7,569 and $1,146 from Class A and Class C shares, respectively, for CDSC imposed upon redemptions by shareholders.
Certain officers and trustees of the Trust are officers and directors of the Adviser, IIS and/or IDI.
NOTE 3–Additional Valuation Information
GAAP defines fair value as the price that would be received to sell an asset or paid to transfer a liability in an orderly transaction between market participants at the measurement date, under current market conditions. GAAP establishes a hierarchy that prioritizes the inputs to valuation methods, giving the highest priority to readily available unadjusted quoted prices in an active market for identical assets (Level 1) and the lowest priority to significant unobservable inputs (Level 3), generally when market prices are not readily available. Based on the valuation inputs, the securities or other investments are tiered into one of three levels. Changes in valuation methods may result in transfers in or out of an investment’s assigned level:
| Level 1 - | Prices are determined using quoted prices in an active market for identical assets. | |
| Level 2 - | Prices are determined using other significant observable inputs. Observable inputs are inputs that other market participants may use in pricing a security. These may include quoted prices for similar securities, interest rates, prepayment speeds, credit risk, yield curves, loss severities, default rates, discount rates, volatilities and others. | |
| Level 3 - | Prices are determined using significant unobservable inputs. In situations where quoted prices or observable inputs are unavailable (for example, when there is little or no market activity for an investment at the end of the period), unobservable inputs may be used. Unobservable inputs reflect the Adviser’s assumptions about the factors market participants would use in determining fair value of the securities or instruments and would be based on the best available information. |
The following is a summary of the tiered valuation input levels, as of December 31, 2022. The level assigned to the securities valuations may not be an indication of the risk or liquidity associated with investing in those securities. Because of the inherent uncertainties of valuation, the values reflected in the financial statements may materially differ from the value received upon actual sale of those investments.
| 18 | Invesco Convertible Securities Fund |
| Level 1 | Level 2 | Level 3 | Total | |||||||||||||||||||||||
| ||||||||||||||||||||||||||
Investments in Securities | ||||||||||||||||||||||||||
| ||||||||||||||||||||||||||
U.S. Dollar Denominated Bonds & Notes | $ – | $ | 808,427,702 | $– | $ | 808,427,702 | ||||||||||||||||||||
| ||||||||||||||||||||||||||
Preferred Stocks | 175,657,970 | – | – | 175,657,970 | ||||||||||||||||||||||
| ||||||||||||||||||||||||||
Money Market Funds | 34,305,662 | – | – | 34,305,662 | ||||||||||||||||||||||
| ||||||||||||||||||||||||||
Total Investments | $209,963,632 | $ | 808,427,702 | $– | $ | 1,018,391,334 | ||||||||||||||||||||
| ||||||||||||||||||||||||||
NOTE 4–Expense Offset Arrangement(s)
The expense offset arrangement is comprised of transfer agency credits which result from balances in demand deposit accounts used by the transfer agent for clearing shareholder transactions. For the year ended December 31, 2022, the Fund received credits from this arrangement, which resulted in the reduction of the Fund’s total expenses of $2,862.
NOTE 5–Trustees’ and Officers’ Fees and Benefits
Trustees’ and Officers’ Fees and Benefits include amounts accrued by the Fund to pay remuneration to certain Trustees and Officers of the Fund. Trustees have the option to defer compensation payable by the Fund, and Trustees’ and Officers’ Fees and Benefits also include amounts accrued by the Fund to fund such deferred compensation amounts. Those Trustees who defer compensation have the option to select various Invesco Funds in which their deferral accounts shall be deemed to be invested. Finally, certain current Trustees were eligible to participate in a retirement plan that provided for benefits to be paid upon retirement to Trustees over a period of time based on the number of years of service. The Fund may have certain former Trustees who also participate in a retirement plan and receive benefits under such plan. Trustees’ and Officers’ Fees and Benefits include amounts accrued by the Fund to fund such retirement benefits. Obligations under the deferred compensation and retirement plans represent unsecured claims against the general assets of the Fund.
NOTE 6–Cash Balances
The Fund is permitted to temporarily carry a negative or overdrawn balance in its account with SSB, the custodian bank. Such balances, if any at period-end, are shown in the Statement of Assets and Liabilities under the payable caption Amount due custodian. To compensate the custodian bank for such overdrafts, the overdrawn Fund may either (1) leave funds as a compensating balance in the account so the custodian bank can be compensated by earning the additional interest; or (2) compensate by paying the custodian bank at a rate agreed upon by the custodian bank and Invesco, not to exceed the contractually agreed upon rate. The Fund may not purchase additional securities when any borrowings from banks or broker-dealers exceed 5% of the Fund’s total assets, or when any borrowings from an Invesco Fund are outstanding.
NOTE 7–Distributions to Shareholders and Tax Components of Net Assets
Tax Character of Distributions to Shareholders Paid During the Fiscal Years Ended December 31, 2022 and 2021:
| 2022 | 2021 | |||||||||||
| ||||||||||||
Ordinary income* | $ | 12,728,268 | $ | 70,309,654 | ||||||||
| ||||||||||||
Long-term capital gain | 26,394,485 | 237,713,231 | ||||||||||
| ||||||||||||
Total distributions | $ | 39,122,753 | $ | 308,022,885 | ||||||||
| ||||||||||||
| * | Includes short-term capital gain distributions, if any. |
Tax Components of Net Assets at Period-End:
| 2022 | ||||
| ||||
Undistributed ordinary income | $ | 8,440,184 | ||
| ||||
Net unrealized appreciation (depreciation) – investments | (39,726,355 | ) | ||
| ||||
Temporary book/tax differences | (119,574 | ) | ||
| ||||
Shares of beneficial interest | 1,049,840,712 | |||
| ||||
Total net assets | $ | 1,018,434,967 | ||
| ||||
The difference between book-basis and tax-basis unrealized appreciation (depreciation) is due to differences in the timing of recognition of gains and losses on investments for tax and book purposes. The Fund’s net unrealized appreciation (depreciation) difference is attributable primarily to amortization and accretion on debt securities, convertible securities and deemed dividends.
The temporary book/tax differences are a result of timing differences between book and tax recognition of income and/or expenses. The Fund’s temporary book/tax differences are the result of the trustee deferral of compensation and retirement plan benefits.
Capital loss carryforward is calculated and reported as of a specific date. Results of transactions and other activity after that date may affect the amount of capital loss carryforward actually available for the Fund to utilize. The ability to utilize capital loss carryforward in the future may be limited under the Internal Revenue Code and related regulations based on the results of future transactions.
The Fund does not have a capital loss carryforward as of December 31, 2022.
| 19 | Invesco Convertible Securities Fund |
NOTE 8–Investment Transactions
The aggregate amount of investment securities (other than short-term securities, U.S. Government obligations and money market funds, if any) purchased and sold by the Fund during the year ended December 31, 2022 was $476,585,832 and $599,995,371, respectively. Cost of investments, including any derivatives, on a tax basis includes the adjustments for financial reporting purposes as of the most recently completed federal income tax reporting period-end.
Unrealized Appreciation (Depreciation) of Investments on a Tax Basis | ||||
Aggregate unrealized appreciation of investments | $ 45,884,658 | |||
| ||||
Aggregate unrealized (depreciation) of investments | (85,611,013 | ) | ||
| ||||
Net unrealized appreciation (depreciation) of investments | $(39,726,355 | ) | ||
| ||||
Cost of investments for tax purposes is $1,058,117,689.
NOTE 9–Reclassification of Permanent Differences
Primarily as a result of differing book/tax treatment of amortization and accretion on debt securities, amortizing notes, contingent payment debt instruments, deemed dividends and distributions, on December 31, 2022, undistributed net investment income was increased by $178,119 and undistributed net realized gain (loss) was decreased by $178,119. This reclassification had no effect on the net assets or the distributable earnings (loss) of the Fund.
NOTE 10–Share Information
| Summary of Share Activity | ||||||||||||||||
| ||||||||||||||||
| Year ended | Year ended | |||||||||||||||
| December 31, 2022(a) | December 31, 2021 | |||||||||||||||
| Shares | Amount | Shares | Amount | |||||||||||||
| ||||||||||||||||
Sold: | ||||||||||||||||
Class A | 1,247,434 | $ | 28,648,289 | 2,225,201 | $ | 71,875,399 | ||||||||||
| ||||||||||||||||
Class C | 96,634 | 2,193,782 | 253,145 | 8,233,496 | ||||||||||||
| ||||||||||||||||
Class Y | 4,114,601 | 94,372,792 | 3,594,448 | 115,396,099 | ||||||||||||
| ||||||||||||||||
Class R5 | 518 | 11,755 | 3,002 | 97,564 | ||||||||||||
| ||||||||||||||||
Class R6 | 6,365,089 | 142,204,287 | 243,871 | 7,971,409 | ||||||||||||
| ||||||||||||||||
Issued as reinvestment of dividends: | ||||||||||||||||
Class A | 716,823 | 15,556,769 | 5,045,961 | 128,254,323 | ||||||||||||
| ||||||||||||||||
Class C | 27,741 | 594,742 | 364,490 | 9,148,278 | ||||||||||||
| ||||||||||||||||
Class Y | 499,435 | 10,874,856 | 4,066,152 | 103,633,142 | ||||||||||||
| ||||||||||||||||
Class R5 | 927 | 20,114 | 6,184 | 159,008 | ||||||||||||
| ||||||||||||||||
Class R6 | 257,346 | 5,569,262 | 394,754 | 10,058,666 | ||||||||||||
| ||||||||||||||||
Automatic conversion of Class C shares to Class A shares: | ||||||||||||||||
Class A | 359,355 | 8,145,807 | 440,478 | 14,352,361 | ||||||||||||
| ||||||||||||||||
Class C | (362,500 | ) | (8,145,807 | ) | (443,296 | ) | (14,352,361 | ) | ||||||||
| ||||||||||||||||
Reacquired: | ||||||||||||||||
Class A | (4,688,973 | ) | (106,261,243 | ) | (3,159,375 | ) | (101,349,965 | ) | ||||||||
| ||||||||||||||||
Class C | (455,541 | ) | (10,303,979 | ) | (362,087 | ) | (11,574,680 | ) | ||||||||
| ||||||||||||||||
Class Y | (9,912,476 | ) | (225,486,983 | ) | (6,272,312 | ) | (200,085,375 | ) | ||||||||
| ||||||||||||||||
Class R5 | (1,626 | ) | (35,725 | ) | (38,183 | ) | (1,296,643 | ) | ||||||||
| ||||||||||||||||
Class R6 | (1,107,651 | ) | (24,330,556 | ) | (401,808 | ) | (13,014,342 | ) | ||||||||
| ||||||||||||||||
Net increase (decrease) in share activity | (2,842,864 | ) | $ | (66,371,838 | ) | 5,960,625 | $ | 127,506,379 | ||||||||
| ||||||||||||||||
| (a) | There are entities that are record owners of more than 5% of the outstanding shares of the Fund and in the aggregate own 48% of the outstanding shares of the Fund. IDI has an agreement with these entities to sell Fund shares. The Fund, Invesco and/or Invesco affiliates may make payments to these entities, which are considered to be related to the Fund, for providing services to the Fund, Invesco and/or Invesco affiliates including but not limited to services such as securities brokerage, distribution, third party record keeping and account servicing. The Fund has no knowledge as to whether all or any portion of the shares owned of record by these entities are also owned beneficially. |
| 20 | Invesco Convertible Securities Fund |
Report of Independent Registered Public Accounting Firm
To the Board of Trustees of AIM Growth Series (Invesco Growth Series) and Shareholders of Invesco Convertible Securities Fund
Opinion on the Financial Statements
We have audited the accompanying statement of assets and liabilities, including the schedule of investments, of Invesco Convertible Securities Fund (one of the funds constituting AIM Growth Series (Invesco Growth Series), referred to hereafter as the “Fund”) as of December 31, 2022, the related statement of operations for the year ended December 31, 2022, the statement of changes in net assets for each of the two years in the period ended December 31, 2022, including the related notes, and the financial highlights for each of the five years in the period ended December 31, 2022 (collectively referred to as the “financial statements”). In our opinion, the financial statements present fairly, in all material respects, the financial position of the Fund as of December 31, 2022, the results of its operations for the year then ended, the changes in its net assets for each of the two years in the period ended December 31, 2022 and the financial highlights for each of the five years in the period ended December 31, 2022 in conformity with accounting principles generally accepted in the United States of America.
Basis for Opinion
These financial statements are the responsibility of the Fund’s management. Our responsibility is to express an opinion on the Fund’s financial statements based on our audits. We are a public accounting firm registered with the Public Company Accounting Oversight Board (United States) (PCAOB) and are required to be independent with respect to the Fund in accordance with the U.S. federal securities laws and the applicable rules and regulations of the Securities and Exchange Commission and the PCAOB.
We conducted our audits of these financial statements in accordance with the standards of the PCAOB. Those standards require that we plan and perform the audit to obtain reasonable assurance about whether the financial statements are free of material misstatement, whether due to error or fraud.
Our audits included performing procedures to assess the risks of material misstatement of the financial statements, whether due to error or fraud, and performing procedures that respond to those risks. Such procedures included examining, on a test basis, evidence regarding the amounts and disclosures in the financial statements. Our audits also included evaluating the accounting principles used and significant estimates made by management, as well as evaluating the overall presentation of the financial statements. Our procedures included confirmation of securities owned as of December 31, 2022 by correspondence with the custodian and transfer agent. We believe that our audits provide a reasonable basis for our opinion.
/s/PricewaterhouseCoopers LLP
Houston, Texas
February 22, 2023
We have served as the auditor of one or more of the investment companies in the Invesco group of investment companies since at least 1995. We have not been able to determine the specific year we began serving as auditor.
| 21 | Invesco Convertible Securities Fund |
Calculating your ongoing Fund expenses
Example
As a shareholder of the Fund, you incur two types of costs: (1) transaction costs, which may include sales charges (loads) on purchase payments or contingent deferred sales charges on redemptions, if any; and (2) ongoing costs, including management fees, distribution and/or service (12b-1) fees, and other Fund expenses. This example is intended to help you understand your ongoing costs (in dollars) of investing in the Fund and to compare these costs with ongoing costs of investing in other mutual funds. The example is based on an investment of $1,000 invested at the beginning of the period and held for the entire period July 1, 2022 through December 31, 2022.
Actual expenses
The table below provides information about actual account values and actual expenses. You may use the information in this table, together with the amount you invested, to estimate the expenses that you paid over the period. Simply divide your account value by $1,000 (for example, an $8,600 account value divided by $1,000 = 8.6), then multiply the result by the number in the table under the heading entitled “Actual Expenses Paid During Period” to estimate the expenses you paid on your account during this period.
Hypothetical example for comparison purposes
The table below also provides information about hypothetical account values and hypothetical expenses based on the Fund’s actual expense ratio and an assumed rate of return of 5% per year before expenses, which is not the Fund’s actual return.
The hypothetical account values and expenses may not be used to estimate the actual ending account balance or expenses you paid for the period. You may use this information to compare the ongoing costs of investing in the Fund and other funds. To do so, compare this 5% hypothetical example with the 5% hypothetical examples that appear in the shareholder reports of the other funds.
Please note that the expenses shown in the table are meant to highlight your ongoing costs only and do not reflect any transaction costs, such as sales charges (loads) on purchase payments or contingent deferred sales charges on redemptions, if any. Therefore, the hypothetical information is useful in comparing ongoing costs only, and will not help you determine the relative total costs of owning different funds. In addition, if these transaction costs were included, your costs would have been higher.
ACTUAL | HYPOTHETICAL (5% annual return before expenses) | |||||||||||
| Beginning Account Value (07/01/22) | Ending Account Value (12/31/22)1 | Expenses Paid During Period2 | Ending Account Value (12/31/22) | Expenses Paid During Period2 | Annualized Ratio | |||||||
Class A | $1,000.00 | $1,033.80 | $4.77 | $1,020.52 | $4.74 | 0.93% | ||||||
Class C | 1,000.00 | 1,029.80 | 8.49 | 1,016.84 | 8.44 | 1.66 | ||||||
Class Y | 1,000.00 | 1,035.10 | 3.49 | 1,021.78 | 3.47 | 0.68 | ||||||
Class R5 | 1,000.00 | 1,034.90 | 3.23 | 1,022.03 | 3.21 | 0.63 | ||||||
Class R6 | 1,000.00 | 1,035.30 | 2.82 | 1,022.43 | 2.80 | 0.55 | ||||||
| 1 | The actual ending account value is based on the actual total return of the Fund for the period July 1, 2022 through December 31, 2022, after actual expenses and will differ from the hypothetical ending account value which is based on the Fund’s expense ratio and a hypothetical annual return of 5% before expenses. |
| 2 | Expenses are equal to the Fund’s annualized expense ratio as indicated above multiplied by the average account value over the period, multiplied by 184/365 to reflect the most recent fiscal half year. |
| 22 | Invesco Convertible Securities Fund |
Form 1099-DIV, Form 1042-S and other year–end tax information provide shareholders with actual calendar year amounts that should be included in their tax returns. Shareholders should consult their tax advisers.
The following distribution information is being provided as required by the Internal Revenue Code or to meet a specific state’s requirement.
The Fund designates the following amounts or, if subsequently determined to be different, the maximum amount allowable for its fiscal year ended December 31, 2022:
Federal and State Income Tax | ||||||||
Long-Term Capital Gain Distributions | $26,394,485 | |||||||
Qualified Dividend Income* | 57.59 | % | ||||||
Corporate Dividends Received Deduction* | 57.59 | % | ||||||
U.S. Treasury Obligations* | 0.00 | % | ||||||
Qualified Business Income* | 0.00 | % | ||||||
Business Interest Income* | 18.46 | % | ||||||
* The above percentages are based on ordinary income dividends paid to shareholders during the Fund’s fiscal year. |
| |||||||
| 23 | Invesco Convertible Securities Fund |
The address of each trustee and officer is AIM Growth Series (Invesco Growth Series) (the “Trust”), 11 Greenway Plaza, Suite 1000, Houston, Texas 77046-1173. The trustees serve for the life of the Trust, subject to their earlier death, incapacitation, resignation, retirement or removal as more specifically provided in the Trust’s organizational documents. Each officer serves for a one year term or until their successors are elected and qualified. Column two below includes length of time served with predecessor entities, if any.
Name, Year of Birth and Position(s) Held with the Trust | Trustee and/or Officer Since | Principal Occupation(s) During Past 5 Years | Number of Funds in Fund Complex | Other Directorship(s) Held by Trustee During Past 5 Years | ||||
| Interested Trustee | ||||||||
Martin L. Flanagan1 - 1960 Trustee and Vice Chair | 2007 | Executive Director, Chief Executive Officer and President, Invesco Ltd. (ultimate parent of Invesco and a global investment management firm); Trustee and Vice Chair, The Invesco Funds; Vice Chair, Investment Company Institute; and Member of Executive Board, SMU Cox School of Business
Formerly: Advisor to the Board, Invesco Advisers, Inc. (formerly known as Invesco Institutional (N.A.), Inc.); Chairman and Chief Executive Officer, Invesco Advisers, Inc. (registered investment adviser); Director, Chairman, Chief Executive Officer and President, Invesco Holding Company (US), Inc. (formerly IVZ Inc.) (holding company), Invesco Group Services, Inc. (service provider) and Invesco North American Holdings, Inc. (holding company); Director, Chief Executive Officer and President, Invesco Holding Company Limited (parent of Invesco and a global investment management firm); Director, Invesco Ltd.; Chairman, Investment Company Institute and President, Co-Chief Executive Officer, Co-President, Chief Operating Officer and Chief Financial Officer, Franklin Resources, Inc. (global investment management organization) | 189 | None |
| 1 | Mr. Flanagan is considered an interested person (within the meaning of Section 2(a)(19) of the 1940 Act) of the Trust because he is an officer of the Adviser to the Trust, and an officer and a director of Invesco Ltd., ultimate parent of the Adviser. |
| T-1 | Invesco Convertible Securities Fund |
Trustees and Officers–(continued)
Name, Year of Birth and Position(s) Held with the Trust | Trustee and/or Officer Since | Principal Occupation(s) During Past 5 Years | Number of Funds in Fund Complex Trustee | Other Directorship(s) Held by Trustee During Past 5 Years | ||||
| Independent Trustees | ||||||||
Beth Ann Brown - 1968 Trustee (2019) and Chair (August 2022) | 2019 | Independent Consultant
Formerly: Head of Intermediary Distribution, Managing Director, Strategic Relations, Managing Director, Head of National Accounts, Senior Vice President, National Account Manager and Senior Vice President, Key Account Manager, Columbia Management Investment Advisers LLC; Vice President, Key Account Manager, Liberty Funds Distributor, Inc.; and Trustee of certain Oppenheimer Funds | 189 | Director, Board of Directors of Caron Engineering Inc.; Advisor, Board of Advisors of Caron Engineering Inc.; President and Director, Acton Shapleigh Youth Conservation Corps (non-profit) Formerly: President and Director Director of Grahamtastic Connection (non-profit) | ||||
Cynthia Hostetler - 1962 Trustee | 2017 | Non-Executive Director and Trustee of a number of public and private business corporations
Formerly: Director, Aberdeen Investment Funds (4 portfolios); Director, Artio Global Investment LLC (mutual fund complex); Director, Edgen Group, Inc. (specialized energy and infrastructure products distributor); Director, Genesee & Wyoming, Inc. (railroads); Head of Investment Funds and Private Equity, Overseas Private Investment Corporation; President, First Manhattan Bancorporation, Inc.; and Attorney, Simpson Thacher & Bartlett LLP | 189 | Resideo Technologies, Inc. (smart home technology); Vulcan Materials Company (construction materials company); Trilinc Global Impact Fund; Textainer Group Holdings, (shipping container leasing company); Investment Company Institute (professional organization); and Independent Directors Council (professional organization) | ||||
Eli Jones - 1961 Trustee | 2016 | Professor and Dean Emeritus, Mays Business School - Texas A&M University
Formerly: Dean of Mays Business School-Texas A&M University; Professor and Dean, Walton College of Business, University of Arkansas and E.J. Ourso College of Business, Louisiana State University; and Director, Arvest Bank | 189 | Insperity, Inc. (formerly known as Administaff) (human resources provider); and Member of Regional Board of Directors and Board of Directors, First Financial Bancorp (regional bank) | ||||
Elizabeth Krentzman - 1959 Trustee | 2019 | Formerly: Principal and Chief Regulatory Advisor for Asset Management Services and U.S. Mutual Fund Leader of Deloitte & Touche LLP; General Counsel of the Investment Company Institute (trade association); National Director of the Investment Management Regulatory Consulting Practice, Principal, Director and Senior Manager of Deloitte & Touche LLP; Assistant Director of the Division of Investment Management - Office of Disclosure and Investment Adviser Regulation of the U.S. Securities and Exchange Commission and various positions with the Division of Investment Management – Office of Regulatory Policy of the U.S. Securities and Exchange Commission; Associate at Ropes & Gray LLP; and Trustee of certain Oppenheimer Funds | 189 | Formerly: Member of the Cartica Funds Board of Directors (private investment fund); Trustee of the University of Florida National Board Foundation; and Member of the University of Florida Law Center Association, Inc. Board of Trustees, Audit Committee and Membership Committee | ||||
Anthony J. LaCava, Jr. - 1956 Trustee | 2019 | Formerly: Director and Member of the Audit Committee, Blue Hills Bank (publicly traded financial institution) and Managing Partner, KPMG LLP | 189 | Blue Hills Bank; Chairman, Bentley University; Member, Business School Advisory Council; and Nominating Committee, KPMG LLP | ||||
Prema Mathai-Davis - 1950 Trustee | 2001 | Retired
Formerly: Co-Founder & Partner of Quantalytics Research, LLC, (a FinTech Investment Research Platform for the Self-Directed Investor); Trustee of YWCA Retirement Fund; CEO of YWCA of the USA; Board member of the NY Metropolitan Transportation Authority; Commissioner of the NYC Department of Aging; and Board member of Johns Hopkins Bioethics Institute | 189 | Member of Board of Positive Planet US (non-profit) and HealthCare Chaplaincy Network (non-profit) |
| T-2 | Invesco Convertible Securities Fund |
Trustees and Officers–(continued)
Name, Year of Birth and Position(s) Held with the Trust | Trustee and/or Officer Since | Principal Occupation(s) During Past 5 Years | Number of Funds in Fund Complex Trustee | Other Directorship(s) Held by Trustee During Past 5 Years | ||||
| Independent Trustees–(continued) | ||||||||
Joel W. Motley - 1952 Trustee | 2019 | Director of Office of Finance, Federal Home Loan Bank System; Managing Director of Carmona Motley Inc. (privately held financial advisor); Member of the Council on Foreign Relations and its Finance and Budget Committee; Chairman Emeritus of Board of Human Rights Watch and Member of its Investment Committee; and Member of Investment Committee Board of Historic Hudson Valley (non-profit cultural organization); Member of the Board, Blue Ocean Acquisition Corp.; and Member of the Vestry and the Investment Committee of Trinity Church Wall Street.
Formerly: Managing Director of Public Capital Advisors, LLC (privately held financial advisor); Managing Director of Carmona Motley Hoffman, Inc. (privately held financial advisor); Trustee of certain Oppenheimer Funds; and Director of Columbia Equity Financial Corp. (privately held financial advisor) | 189 | Member of Board of Trust for Mutual Understanding (non-profit promoting the arts and environment); Member of Board of Greenwall Foundation (bioethics research foundation) and its Investment Committee; Member of Board of Friends of the LRC (non-profit legal advocacy); and Board Member and Investment Committee Member of Pulitzer Center for Crisis Reporting (non-profit journalism) | ||||
Teresa M. Ressel - 1962 Trustee | 2017 | Non-executive director and trustee of a number of public and private business corporations
Formerly: Chief Executive Officer, UBS Securities LLC (investment banking); Chief Operating Officer, UBS AG Americas (investment banking); Sr. Management Team Olayan America, The Olayan Group (international investor/commercial/industrial); Assistant Secretary for Management & Budget and Designated Chief Financial Officer, U.S. Department of Treasury and Director, ON Semiconductor Corporation (semiconductor manufacturing) | 189 | None | ||||
Robert C. Troccoli - 1949 Trustee | 2016 | Retired
Formerly: Adjunct Professor, University of Denver – Daniels College of Business; and Managing Partner, KPMG LLP | 189 | None | ||||
Daniel S. Vandivort - 1954 Trustee | 2019 | President, Flyway Advisory Services LLC (consulting and property management)
Formerly: President and Chief Investment Officer, previously Head of Fixed Income, Weiss Peck and Greer/Robeco Investment Management; Trustee and Chair, Weiss Peck and Greer Funds Board; and various capacities at CS First Boston including Head of Fixed Income at First Boston Asset Management. | 189 | Formerly: Trustee and Governance Chair, Oppenheimer Funds; Treasurer, Chairman of the Audit and Finance Committee, Huntington Disease Foundation of America | ||||
| T-3 | Invesco Convertible Securities Fund |
Trustees and Officers–(continued)
Name, Year of Birth and Position(s) Held with the Trust | Trustee and/or Officer Since | Principal Occupation(s) During Past 5 Years | Number of Funds in Fund Complex Trustee | Other Directorship(s) Held by Trustee During Past 5 Years | ||||
| Officers | ||||||||
Sheri Morris - 1964 President and Principal Executive Officer | 1999 | Director, Invesco Trust Company; Head of Global Fund Services, Invesco Ltd.; President and Principal Executive Officer, The Invesco Funds; Vice President, Invesco Exchange-Traded Fund Trust, Invesco Exchange-Traded Fund Trust II, Invesco India Exchange-Traded Fund Trust, Invesco Actively Managed Exchange-Traded Fund Trust, Invesco Actively Managed Exchange-Traded Commodity Fund Trust and Invesco Exchange-Traded Self-Indexed Fund Trust; and Vice President, OppenheimerFunds, Inc.
Formerly: Vice President, Treasurer and Principal Financial Officer, The Invesco Funds; Vice President, Invesco AIM Advisers, Inc., Invesco AIM Capital Management, Inc. and Invesco AIM Private Asset Management, Inc.; Assistant Vice President and Assistant Treasurer, The Invesco Funds; Vice President and Assistant Vice President, Invesco Advisers, Inc.; Assistant Vice President, Invesco AIM Capital Management, Inc. and Invesco AIM Private Asset Management, Inc.; Treasurer, Invesco Exchange-Traded Fund Trust, Invesco Exchange-Traded Fund Trust II, Invesco India Exchange-Traded Fund Trust and Invesco Actively Managed Exchange-Traded Fund Trust; and Senior Vice President, Invesco Advisers, Inc. (formerly known as Invesco Institutional (N.A.), Inc.) (registered investment adviser) | N/A | N/A | ||||
Jeffrey H. Kupor - 1968 Senior Vice President, Chief Legal Officer and Secretary | 2018 | Head of Legal of the Americas, Invesco Ltd.; Senior Vice President and Secretary, Invesco Advisers, Inc. (formerly known as Invesco Institutional (N.A.), Inc.) (registered investment adviser); Secretary, Invesco Distributors, Inc. (formerly known as Invesco AIM Distributors, Inc.); Vice President and Secretary, Invesco Investment Services, Inc. (formerly known as Invesco AIM Investment Services, Inc.); Senior Vice President, Chief Legal Officer and Secretary, The Invesco Funds; Secretary and General Counsel, Invesco Investment Advisers LLC (formerly known as Van Kampen Asset Management); Secretary and General Counsel, Invesco Capital Markets, Inc. (formerly known as Van Kampen Funds Inc.); Chief Legal Officer, Invesco Exchange-Traded Fund Trust, Invesco Exchange-Traded Fund Trust II, Invesco India Exchange-Traded Fund Trust, Invesco Actively Managed Exchange-Traded Fund Trust, Invesco Actively Managed Exchange-Traded Commodity Fund Trust and Invesco Exchange-Traded Self-Indexed Fund Trust;; Secretary and Vice President, Harbourview Asset Management Corporation; Secretary and Vice President, OppenheimerFunds, Inc. and Invesco Managed Accounts, LLC; Secretary and Senior Vice President, OFI Global Institutional, Inc.; Secretary and Vice President, OFI SteelPath, Inc.; Secretary and Vice President, Oppenheimer Acquisition Corp.; Secretary and Vice President, Shareholder Services, Inc.; and Secretary and Vice President, Trinity Investment Management Corporation
Formerly: Senior Vice President, Invesco Distributors, Inc.; Secretary and Vice President, Jemstep, Inc.; Head of Legal, Worldwide Institutional, Invesco Ltd.; Secretary and General Counsel, INVESCO Private Capital Investments, Inc.; Senior Vice President, Secretary and General Counsel, Invesco Management Group, Inc. (formerly known as Invesco AIM Management Group, Inc.); Assistant Secretary, INVESCO Asset Management (Bermuda) Ltd.; Secretary and General Counsel, Invesco Private Capital, Inc.; Assistant Secretary and General Counsel, INVESCO Realty, Inc.; Secretary and General Counsel, Invesco Senior Secured Management, Inc.; Secretary, Sovereign G./P. Holdings Inc.; Secretary, Invesco Indexing LLC; and Secretary, W.L. Ross & Co., LLC | N/A | N/A | ||||
Andrew R. Schlossberg - 1974 Senior Vice President | 2019 | Senior Vice President, Invesco Group Services, Inc.; Head of the Americas and Senior Managing Director, Invesco Ltd.; Director and Senior Vice President, Invesco Advisers, Inc. (formerly known as Invesco Institutional (N.A.), Inc.) (registered investment adviser); Director and Chairman, Invesco Investment Services, Inc. (formerly known as Invesco AIM Investment Services, Inc.) (registered transfer agent); Senior Vice President, The Invesco Funds; and Director, Invesco Investment Advisers LLC (formerly known as Van Kampen Asset Management)
Formerly: Director, President and Chairman, Invesco Insurance Agency, Inc.; Director, Invesco UK Limited; Director and Chief Executive, Invesco Asset Management Limited and Invesco Fund Managers Limited; Assistant Vice President, The Invesco Funds; Senior Vice President, Invesco Advisers, Inc. (formerly known as Invesco Institutional (N.A.), Inc.) (registered investment adviser); Director and Chief Executive, Invesco Administration Services Limited and Invesco Global Investment Funds Limited; Director, Invesco Distributors, Inc.; Head of EMEA, Invesco Ltd.; President, Invesco Actively Managed Exchange-Traded Commodity Fund Trust, Invesco Actively Managed Exchange-Traded Fund Trust, Invesco Exchange-Traded Fund Trust, Invesco Exchange-Traded Fund Trust II and Invesco India Exchange-Traded Fund Trust; and Managing Director and Principal Executive Officer, Invesco Capital Management LLC | N/A | N/A |
| T-4 | Invesco Convertible Securities Fund |
Trustees and Officers–(continued)
Name, Year of Birth and Position(s) Held with the Trust | Trustee and/or Officer Since | Principal Occupation(s) During Past 5 Years | Number of Funds in Fund Complex Trustee | Other Directorship(s) Held by Trustee During Past 5 Years | ||||
| Officers–(continued) | ||||||||
John M. Zerr - 1962 Senior Vice President | 2006 | Chief Operating Officer of the Americas; Senior Vice President, Invesco Advisers, Inc. (formerly known as Invesco Institutional (N.A.), Inc.) (registered investment adviser); Senior Vice President, Invesco Distributors, Inc. (formerly known as Invesco AIM Distributors, Inc.); Director and Vice President, Invesco Investment Services, Inc. (formerly known as Invesco AIM Investment Services, Inc.) Senior Vice President, The Invesco Funds; Managing Director, Invesco Capital Management LLC; Director, Invesco Investment Advisers LLC (formerly known as Van Kampen Asset Management); Senior Vice President, Invesco Capital Markets, Inc. (formerly known as Van Kampen Funds Inc.); Manager, Invesco Indexing LLC; Manager, Invesco Specialized Products, LLC; Member, Invesco Canada Funds Advisory Board; Director, President and Chief Executive Officer, Invesco Corporate Class Inc. (corporate mutual fund company); and Director, Chairman, President and Chief Executive Officer, Invesco Canada Ltd. (formerly known as Invesco Trimark Ltd./Invesco Trimark Ltèe) (registered investment adviser and registered transfer agent); President, Invesco, Inc.; President, Invesco Global Direct Real Estate Feeder GP Ltd.; President, Invesco IP Holdings (Canada) Ltd; President, Invesco Global Direct Real Estate GP Ltd.; President, Invesco Financial Services Ltd. / Services Financiers Invesco Ltée; and Director and Chairman, Invesco Trust Company
Formerly: President, Trimark Investments Ltd/Services Financiers Invesco Ltee; Director and Senior Vice President, Invesco Insurance Agency, Inc.; Director and Senior Vice President, Invesco Management Group, Inc. (formerly known as Invesco AIM Management Group, Inc.); Secretary and General Counsel, Invesco Management Group, Inc. (formerly known as Invesco AIM Management Group, Inc.); Secretary, Invesco Investment Services, Inc. (formerly known as Invesco AIM Investment Services, Inc.); Chief Legal Officer and Secretary, The Invesco Funds; Secretary and General Counsel, Invesco Investment Advisers LLC (formerly known as Van Kampen Asset Management); Secretary and General Counsel, Invesco Capital Markets, Inc. (formerly known as Van Kampen Funds Inc.); Chief Legal Officer, Invesco Exchange-Traded Fund Trust, Invesco Exchange-Traded Fund Trust II, Invesco India Exchange-Traded Fund Trust, Invesco Actively Managed Exchange-Traded Fund Trust, Invesco Actively Managed Exchange-Traded Commodity Fund Trust and Invesco Exchange-Traded Self-Indexed Fund Trust; Secretary, Invesco Indexing LLC; Director, Secretary, General Counsel and Senior Vice President, Van Kampen Exchange Corp.; Director, Vice President and Secretary, IVZ Distributors, Inc. (formerly known as INVESCO Distributors, Inc.); Director and Vice President, INVESCO Funds Group, Inc.; Director and Vice President, Van Kampen Advisors Inc.; Director, Vice President, Secretary and General Counsel, Van Kampen Investor Services Inc.; Director and Secretary, Invesco Distributors, Inc. (formerly known as Invesco AIM Distributors, Inc.); Director, Senior Vice President, General Counsel and Secretary, Invesco AIM Advisers, Inc. and Van Kampen Investments Inc.; Director, Vice President and Secretary, Fund Management Company; Director, Senior Vice President, Secretary, General Counsel and Vice President, Invesco AIM Capital Management, Inc.; and Chief Operating Officer and General Counsel, Liberty Ridge Capital, Inc. (an investment adviser) | N/A | N/A | ||||
Gregory G. McGreevey - 1962 Senior Vice President | 2012 | Senior Managing Director, Invesco Ltd.; Director, Chairman, President, and Chief Executive Officer, Invesco Advisers, Inc. (formerly known as Invesco Institutional (N.A.), Inc.) (registered investment adviser); Director, Invesco Mortgage Capital, Inc. and Invesco Senior Secured Management, Inc.; Senior Vice President, The Invesco Funds; President, SNW Asset Management Corporation and Invesco Managed Accounts, LLC; Chairman and Director, Invesco Private Capital, Inc.; Chairman and Director, INVESCO Private Capital Investments, Inc.; Chairman and Director, INVESCO Realty, Inc.; and Senior Vice President, Invesco Group Services, Inc.
Formerly: Senior Vice President, Invesco Management Group, Inc. and Invesco Advisers, Inc.; Assistant Vice President, The Invesco Funds | N/A | N/A | ||||
Adrien Deberghes - 1967 Principal Financial Officer, Treasurer and Vice President | 2020 | Head of the Fund Office of the CFO and Fund Administration; Vice President, Invesco Advisers, Inc.; Principal Financial Officer, Treasurer and Vice President, The Invesco Funds; Vice President, Invesco Exchange-Traded Fund Trust, Invesco Exchange-Traded Fund Trust II, Invesco India Exchange-Traded Fund Trust, Invesco Actively Managed Exchange-Traded Fund Trust, Invesco Actively Managed Exchange-Traded Commodity Fund Trust and Invesco Exchange-Traded Self-Indexed Fund Trust
Formerly: Senior Vice President and Treasurer, Fidelity Investments | N/A | N/A | ||||
Crissie M. Wisdom - 1969 Anti-Money Laundering Compliance Officer | 2013 | Anti-Money Laundering and OFAC Compliance Officer for Invesco U.S. entities including: Invesco Advisers, Inc. and its affiliates, Invesco Capital Markets, Inc., Invesco Distributors, Inc., Invesco Investment Services, Inc., The Invesco Funds, Invesco Capital Management, LLC, Invesco Trust Company; and Fraud Prevention Manager for Invesco Investment Services, Inc. | N/A | N/A |
| T-5 | Invesco Convertible Securities Fund |
Trustees and Officers–(continued)
Name, Year of Birth and Position(s) Held with the Trust | Trustee and/or Officer Since | Principal Occupation(s) During Past 5 Years | Number of Funds in Fund Complex Trustee | Other Directorship(s) Held by Trustee During Past 5 Years | ||||
| Officers–(continued) | ||||||||
Todd F. Kuehl - 1969 Chief Compliance Officer and Senior Vice President | 2020 | Chief Compliance Officer, Invesco Advisers, Inc. (registered investment adviser); and Chief Compliance Officer and Senior Vice President, The Invesco Funds
Formerly: Managing Director and Chief Compliance Officer, Legg Mason (Mutual Funds); Chief Compliance Officer, Legg Mason Private Portfolio Group (registered investment adviser) | N/A | N/A | ||||
James Bordewick, Jr. - 1959 Senior Vice President and Senior Officer | 2022 | Senior Vice President and Senior Officer, The Invesco Funds
Formerly: Chief Legal Officer, KingsCrowd, Inc. (research and analytical platform for investment in private capital markets); Chief Operating Officer and Head of Legal and Regulatory, Netcapital (private capital investment platform); Managing Director, General Counsel of asset management and Chief Compliance Officer for asset management and private banking, Bank of America Corporation; Chief Legal Officer, Columbia Funds and BofA Funds;
Senior Vice President and Associate General Counsel, MFS Investment Management; Chief Legal Officer, MFS Funds; Associate, Ropes & Gray; and Associate, Gaston Snow & Ely Bartlett | N/A | N/A |
The Statement of Additional Information of the Trust includes additional information about the Fund’s Trustees and is available upon request, without charge, by calling 1.800.959.4246. Please refer to the Fund’s Statement of Additional Information for information on the Fund’s sub-advisers.
| Office of the Fund | Investment Adviser | Distributor | Auditors | |||
| 11 Greenway Plaza, Suite 1000 | Invesco Advisers, Inc. | Invesco Distributors, Inc. | PricewaterhouseCoopers LLP | |||
| Houston, TX 77046-1173 | 1555 Peachtree Street, N.E. | 11 Greenway Plaza, Suite 1000 | 1000 Louisiana Street, Suite 5800 | |||
| Atlanta, GA 30309 | Houston, TX 77046-1173 | Houston, TX 77002-5021 | ||||
| Counsel to the Fund | Counsel to the Independent Trustees | Transfer Agent | Custodian | |||
| Stradley Ronon Stevens & Young, LLP | Sidley Austin LLP | Invesco Investment Services, Inc. | State Street Bank and Trust Company | |||
| 2005 Market Street, Suite 2600 | 787 Seventh Avenue | 11 Greenway Plaza, Suite 1000 | 225 Franklin Street | |||
| Philadelphia, PA 19103-7018 | New York, NY 10019 | Houston, TX 77046-1173 | Boston, MA 02110-2801 | |||
| T-6 | Invesco Convertible Securities Fund |
(This page intentionally left blank)
(This page intentionally left blank)

Go paperless with eDelivery
Visit invesco.com/edelivery to enjoy the convenience and security of anytime electronic access to your investment documents.
With eDelivery, you can elect to have any or all of the following materials delivered straight to your inbox to download, save and print from your own computer:
∎ Fund reports and prospectuses
∎ Quarterly statements
∎ Daily confirmations
∎ Tax forms
Invesco mailing information
Send general correspondence to Invesco Investment Services, Inc., P.O. Box 219078, Kansas City, MO 64121-9078.
Important notice regarding delivery of security holder documents
To reduce Fund expenses, only one copy of most shareholder documents may be mailed to shareholders with multiple accounts at the same address (Householding). Mailing of your shareholder documents may be householded indefinitely unless you instruct us otherwise. If you do not want the mailing of these documents to be combined with those for other members of your household, please contact Invesco Investment Services, Inc. at 800 959 4246 or contact your financial institution. We will begin sending you individual copies for each account within 30 days after receiving your request.
Fund holdings and proxy voting information
The Fund provides a complete list of its portfolio holdings four times each year, at the end of each fiscal quarter. For the second and fourth quarters, the list appears, respectively, in the Fund’s semiannual and annual reports to shareholders. For the first and third quarters, the Fund files the list with the Securities and Exchange Commission (SEC) as an exhibit to its reports on Form N-PORT. The most recent list of portfolio holdings is available at invesco.com/completeqtrholdings. Shareholders can also look up the Fund’s Form N-PORT filings on the SEC website, sec.gov. The SEC file numbers for the Fund are shown below.
A description of the policies and procedures that the Fund uses to determine how to vote proxies relating to portfolio securities is available without charge, upon request, from our Client Services department at 800 959 4246, or at invesco.com/corporate/about-us/esg. The information is also available on the SEC website, sec.gov.
Information regarding how the Fund voted proxies related to its portfolio securities during the most recent 12-month period ended June 30 is available at invesco.com/proxysearch. This information is also available on the SEC website, sec.gov.
Invesco Advisers, Inc. is an investment adviser; it provides investment advisory services to individual and institutional clients and does not sell securities. Invesco Distributors, Inc. is the US distributor for Invesco Ltd.’s retail mutual funds, exchange-traded funds and institutional money market funds. Both are wholly owned, indirect subsidiaries of Invesco Ltd.

| SEC file number(s): 811-02699 and 002-57526 | Invesco Distributors, Inc. | MS-CSEC-AR-1 |

Annual Report to Shareholders |
December 31, 2022 |
Invesco Income Advantage International Fund
Nasdaq:
A: GTNDX ∎ C: GNDCX ∎ R: GTNRX ∎ Y: GTNYX ∎ R5: GNDIX ∎ R6:GNDSX
Management’s Discussion of Fund Performance
For the fiscal year ended December 31, 2022, Class A shares of Invesco Income Advantage International Fund (the Fund), at net asset value (NAV), outperformed the MSCI All Country World ex USA Index, the Fund’s broad market/style-specific benchmark. Your Fund’s long-term performance appears later in this report.
|
Fund vs. Indexes Total returns, 12/31/21 to 12/31/22, at net asset value (NAV). Performance shown does not include applicable contingent deferred sales charges (CDSC) or front-end sales charges, which would have reduced performance. |
Class A Shares | -12.16 | % | ||
Class C Shares | -12.72 | |||
Class R Shares | -12.28 | |||
Class Y Shares | -11.90 | |||
Class R5 Shares | -11.87 | |||
Class R6 Shares | -11.89 | |||
MSCI All Country World ex USA Indexq (Broad Market/Style-Specific Index) | -16.00 | |||
Lipper Global Equity Income Funds Index∎ (Peer Group Index) | -10.06 | |||
Source(s): qRIMES Technologies Corp.; ∎Lipper Inc.
| ||||
Market conditions and your Fund
Global equity markets declined in the first half of 2022 amid volatility sparked by Russia’s invasion of Ukraine, rising commodity prices, rampant global inflation and central banks shifting toward tighter monetary policy. Russia’s invasion exacerbated inflationary pressures, disrupting already strained supply chains, and increasing shortages of oil, gas and raw materials, with the price of oil rising sharply.
Inflation headwinds continued into the third quarter of 2022. The US Federal Reserve (the Fed), the European Central Bank and the Bank of England all raised interest rates. In contrast, the People’s Bank of China lowered its policy rate and the Bank of Japan kept rates the same. Emerging market equities, hampered by the strong US dollar, underper-formed developed market equities.
Global equity markets posted gains for the fourth quarter of 2022, after better inflation data sparked a rally in October and Novem-ber. However, investor sentiment worsened in December after central banks signaled continued interest rate hikes into 2023 as inflation remained above target levels. International stocks outperformed US stocks in the fourth quarter, led by results in Europe and the UK. Emerging market equities also posted gains for the fourth quarter of 2022, boosted by China, which eased its zero-COVID-19 policy and started to reopen even as COVID-19 infections surged.
Despite the rebound in the fourth quarter of 2022, at the end of the fiscal year ended December 31, 2022, trailing one-year returns for developed market equities and emerging market equities were both in negative territory.
The end of this fiscal year marked the Fund’s first full year under the new portfolio management team (the “team”) and with the
new investment strategy. The team’s investment strategy seeks to generate high income from diversified exposure to international equity markets, while providing some downside protection in the event of broad equity market downturns and also providing equity market upside participation. The team seeks to achieve the investment objectives by investing in two sub-portfolios: 1) a diversified portfolio of international stocks determined by their exposures to what the team believes to be historically rewarded factors, including momentum, value, quality and low volatility; and 2) a portfolio of equity-linked notes (ELNs), which the team customizes in an effort to provide high-income and defensive exposure to broad international equity markets.
For the fiscal year ended December 31, 2022, the Fund outperformed the MSCI All Country World ex USA Index with performance behavior that was in-line with the team’s expectations for the Fund. With more sustained volatility returning to equity markets, the value of the Fund’s structural downside risk mitigation was realized. Consistent with the overall direction of broad equity market performance, the Fund’s sub-portfolio of diversified, factor-oriented international stocks detracted in absolute terms while the Fund’s outperformance over the fiscal year was largely driven by the sub-portfolio of customized ELNs. The team’s customized ELNs are structured to include a pre-defined downside buffer relative to a reference broad-based equity security index or an exchange-traded fund that passively tracks such an index. We believe the Fund’s ELN sub-portfolio helped reduce downside impact to Fund performance, relative to the Fund’s benchmark, during the periods of market drawdowns. In addition to the downside performance buffer, we believe the ELN sub-portfolio also aided results by delivering a
high level of income, which was higher than the dividend yield of the benchmark index.
Thank you for investing in Invesco Income Advantage International Fund.
Portfolio manager(s):
Mark Ahnrud
John Burrello
Chris Devine
Scott Hixon
Christian Ulrich
Scott Wolle - Lead
The views and opinions expressed in management’s discussion of Fund performance are those of Invesco Advisers, Inc. and its affiliates. These views and opinions are subject to change at any time based on factors such as market and economic conditions. These views and opinions may not be relied upon as investment advice or recommendations, or as an offer for a particular security. The information is not a complete analysis of every aspect of any market, country, industry, security or the Fund. Statements of fact are from sources considered reliable, but Invesco Advisers, Inc. makes no representation or warranty as to their completeness or accuracy. Although historical performance is no guarantee of future results, these insights may help you understand our investment management philosophy.
See important Fund and, if applicable, index disclosures later in this report.
| 2 Invesco Income Advantage International Fund |
Your Fund’s Long-Term Performance
Results of a $10,000 Investment – Oldest Share Class(es)
Fund and index data from 12/31/12
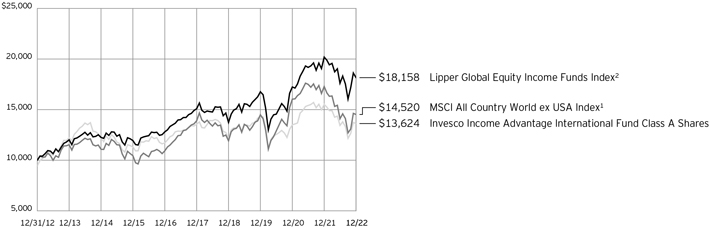
| 1 | Source: RIMES Technologies Corp. |
| 2 | Source: Lipper Inc. |
Past performance cannot guarantee future results.
The data shown in the chart include reinvested distributions, applicable sales charges and Fund expenses including management
fees. Index results include reinvested dividends, but they do not reflect sales charges. Performance of the peer group, if applicable, reflects fund expenses and management fees;
performance of a market index does not. Performance shown in the chart does not reflect deduction of taxes a shareholder would pay on Fund distributions or sale of Fund shares.
| 3 Invesco Income Advantage International Fund |
Average Annual Total Returns |
| |||
As of 12/31/22, including maximum applicable sales charges |
| |||
Class A Shares | ||||
Inception (9/15/97) | 4.57% | |||
10 Years | 3.14 | |||
5 Years | -1.04 | |||
1 Year | -17.01 | |||
Class C Shares | ||||
Inception (1/2/98) | 4.81% | |||
10 Years | 3.11 | |||
5 Years | -0.65 | |||
1 Year | -13.54 | |||
Class R Shares | ||||
Inception (10/31/05) | 2.91% | |||
10 Years | 3.47 | |||
5 Years | -0.14 | |||
1 Year | -12.28 | |||
Class Y Shares | ||||
Inception (10/3/08) | 4.53% | |||
10 Years | 3.99 | |||
5 Years | 0.35 | |||
1 Year | -11.90 | |||
Class R5 Shares | ||||
Inception (4/30/04) | 4.45% | |||
10 Years | 4.14 | |||
5 Years | 0.46 | |||
1 Year | -11.87 | |||
Class R6 Shares | ||||
10 Years | 3.94% | |||
5 Years | 0.45 | |||
1 Year | -11.89 | |||
Class R6 shares incepted on April 4, 2017. Performance shown prior to that date is that of Class A shares at net asset value and includes the 12b-1 fees applicable to Class A shares.
The performance data quoted represent past performance and cannot guarantee future results; current performance may be lower or higher. Please visit invesco.com/ performance for the most recent month-end performance. Performance figures reflect reinvested distributions, changes in net asset value and the effect of the maximum sales charge unless otherwise stated. Performance figures do not reflect deduction of taxes a shareholder would pay on Fund distributions or sale of Fund shares. Investment return and principal value will fluctuate so that you may have a gain or loss when you sell shares.
Class A share performance reflects the maximum 5.50% sales charge, and Class C share performance reflects the applicable contingent deferred sales charge (CDSC) for the period involved. The CDSC on Class C shares is 1% for the first year after purchase. Class R, Class Y, Class R5 and Class R6 shares do not have a front-end sales charge or a CDSC; therefore, performance is at net asset value.
The performance of the Fund’s share classes will differ primarily due to different sales charge structures and class expenses.
Fund performance reflects any applicable fee waivers and/or expense reimbursements. Had the adviser not waived fees and/or reimbursed expenses currently or in the past, returns would have been lower. See current prospectus for more information.
| 4 Invesco Income Advantage International Fund |
Invesco Income Advantage International Fund’s investment objective is income and long-term growth of capital.
| ∎ | Unless otherwise stated, information presented in this report is as of December 31, 2022, and is based on total net assets. |
| ∎ | Unless otherwise noted, all data is provided by Invesco. |
| ∎ | To access your Fund’s reports/prospectus, visit invesco.com/fundreports. |
About indexes used in this report
| ∎ | The MSCI All Country World ex USA® Index is an index considered repre-sentative of developed and emerging stock markets, excluding the US. The index is computed using the net return, which withholds applicable taxes for non-resident investors. |
| ∎ | The Lipper Global Equity Income Funds Index is an unmanaged Index considered representative of global equity income funds tracked by Lipper. |
| ∎ | The Fund is not managed to track the performance of any particular index, including the index(es) described here, and consequently, the performance of the Fund may deviate significantly from the performance of the index(es). |
| ∎ | A direct investment cannot be made in an index. Unless otherwise indicated, index results include reinvested dividends, and they do not reflect sales charges. Performance of the peer group, if applicable, reflects fund expenses; performance of a market index does not. |
| This report must be accompanied or preceded by a currently effective Fund prospectus, which contains more complete information, including sales charges and expenses. Investors should read it carefully before investing. | ||||
NOT FDIC INSURED | MAY LOSE VALUE | NO BANK GUARANTEE | ||||
| 5 Invesco Income Advantage International Fund |
Fund Information
Portfolio Composition
| By sector | % of total net assets | |||
Financials | 35.26 | % | ||
Industrials | 7.51 | |||
Health Care | 6.74 | |||
Consumer Staples | 5.31 | |||
Information Technology | 4.89 | |||
Materials | 4.73 | |||
Consumer Discretionary | 4.35 | |||
Communication Services | 4.33 | |||
Energy | 4.10 | |||
Other Sectors, Each Less than 2% of Net Assets | 2.29 | |||
Money Market Funds Plus Other Assets Less Liabilities | 20.49 | |||
Top 10 Equity Holdings*
| % of total net assets | |||||||
1. | Roche Holding AG | 1.38 | % | ||||
2. | Novo Nordisk A/S, Class B | 1.20 | |||||
3. | Nestle S.A. | 0.94 | |||||
4. | Novartis AG | 0.86 | |||||
5. | Taiwan Semiconductor Manufacturing Co. Ltd. | 0.80 | |||||
6. | AstraZeneca PLC | 0.78 | |||||
7. | ASML Holding N.V. | 0.70 | |||||
8. | Resona Holdings, Inc. | 0.63 | |||||
9. | Unilever PLC | 0.58 | |||||
10. | Sanofi | 0.57 | |||||
The Fund’s holdings are subject to change, and there is no assurance that the Fund will continue to hold any particular security.
| * | Excluding money market fund holdings, if any. |
Data presented here are as of December 31, 2022.
6 Invesco Income Advantage International Fund
December 31, 2022
| Shares | Value | |||||
Common Stocks & Other Equity Interests–52.45% | ||||||
Australia–2.88% | ||||||
Ampol Ltd. | 487 | $ 9,348 | ||||
APA Group | 2,821 | 20,654 | ||||
Aurizon Holdings Ltd. | 11,403 | 28,762 | ||||
BHP Group Ltd. | 10,536 | 326,207 | ||||
BlueScope Steel Ltd. | 814 | 9,278 | ||||
Brambles Ltd. | 5,575 | 45,787 | ||||
Coles Group Ltd. | 1,492 | 16,897 | ||||
CSL Ltd. | 672 | 131,034 | ||||
Endeavour Group Ltd. | 809 | 3,513 | ||||
Flutter Entertainment PLC(a) | 158 | 21,596 | ||||
Fortescue Metals Group Ltd. | 2,490 | 34,714 | ||||
Glencore PLC | 17,800 | 119,025 | ||||
Macquarie Group Ltd. | 697 | 79,127 | ||||
Mineral Resources Ltd. | 104 | 5,471 | ||||
Rio Tinto Ltd. | 1,834 | 144,538 | ||||
Rio Tinto PLC | 4,485 | 314,695 | ||||
Santos Ltd. | 948 | 4,648 | ||||
Sonic Healthcare Ltd. | 537 | 10,949 | ||||
South32 Ltd. | 18,268 | 49,450 | ||||
Telstra Group Ltd. | 32,121 | 87,226 | ||||
Wesfarmers Ltd. | 3,535 | 110,383 | ||||
WiseTech Global Ltd. | 326 | 11,242 | ||||
Woodside Energy Group Ltd. | 1,972 | 47,713 | ||||
Woolworths Group Ltd. | 1,167 | 26,650 | ||||
| 1,658,907 | ||||||
Belgium–0.46% | ||||||
Groupe Bruxelles Lambert N.V. | 3,162 | 253,285 | ||||
UCB S.A. | 159 | 12,524 | ||||
| 265,809 | ||||||
Brazil–1.33% | ||||||
Ambev S.A. | 6,209 | 17,073 | ||||
B3 S.A. - Brasil, Bolsa, Balcao | 18,879 | 47,209 | ||||
Banco BTG Pactual S.A. | 7,876 | 35,681 | ||||
Centrais Eletricas Brasileiras S.A. | 1,431 | 11,416 | ||||
Cia de Saneamento Basico do Estado de Sao Paulo | 826 | 8,836 | ||||
Localiza Rent a Car S.A. | 1,368 | 13,777 | ||||
Localiza Rent a Car S.A., Rts., expiring 1/31/23(a) | 5 | 10 | ||||
M Dias Branco S.A. | 1,283 | 8,740 | ||||
Petroleo Brasileiro S.A., Preference Shares | 46,881 | 219,437 | ||||
Rumo S.A. | 4,232 | 14,903 | ||||
Telefonica Brasil S.A. | 2,641 | 19,002 | ||||
TIM S.A. | 15,463 | 36,178 | ||||
Vale S.A. | 17,947 | 304,825 | ||||
WEG S.A. | 3,029 | 22,061 | ||||
Yara International ASA | 129 | 5,672 | ||||
| 764,820 | ||||||
Canada–5.30% | ||||||
Alimentation Couche-Tard, Inc. | 797 | 35,023 | ||||
ARC Resources Ltd. | 1,457 | 19,638 | ||||
| Shares | Value | |||||
Canada–(continued) | ||||||
BCE, Inc. | 1,355 | $ 59,534 | ||||
Brookfield Corp. | 2,299 | 72,298 | ||||
Canadian National Railway Co. | 2,445 | 290,439 | ||||
Canadian Natural Resources Ltd. | 2,324 | 129,056 | ||||
Canadian Pacific Railway Ltd. | 1,921 | 143,224 | ||||
CCL Industries, Inc., Class B | 1,195 | 51,048 | ||||
Cenovus Energy, Inc. | 1,644 | 31,897 | ||||
CGI, Inc., Class A(a) | 517 | 44,564 | ||||
Constellation Software, Inc. | 77 | 120,218 | ||||
Dollarama, Inc. | 1,043 | 61,001 | ||||
Emera, Inc. | 124 | 4,739 | ||||
Enbridge, Inc. | 2,985 | 116,666 | ||||
Fairfax Financial Holdings Ltd. | 81 | 47,982 | ||||
Fortis, Inc. | 1,552 | 62,103 | ||||
Franco-Nevada Corp. | 40 | 5,453 | ||||
George Weston Ltd. | 167 | 20,720 | ||||
Hydro One Ltd.(b) | 1,569 | 42,029 | ||||
Imperial Oil Ltd. | 922 | 44,908 | ||||
Intact Financial Corp. | 548 | 78,885 | ||||
Loblaw Cos. Ltd. | 961 | 84,971 | ||||
Magna International, Inc. | 927 | 52,074 | ||||
Manulife Financial Corp. | 18,094 | 322,725 | ||||
Metro, Inc. | 531 | 29,401 | ||||
Nutrien Ltd. | 1,729 | 126,227 | ||||
Open Text Corp. | 1,738 | 51,498 | ||||
Pembina Pipeline Corp. | 171 | 5,804 | ||||
Power Corp. of Canada | 3,696 | 86,941 | ||||
Quebecor, Inc., Class B | 1,055 | 23,531 | ||||
Ritchie Bros. Auctioneers, Inc. | 91 | 5,256 | ||||
Rogers Communications, Inc., Class B | 1,146 | 53,635 | ||||
Saputo, Inc. | 444 | 10,992 | ||||
Shaw Communications, Inc., Class B | 2,096 | 60,388 | ||||
Sun Life Financial, Inc. | 2,286 | 106,112 | ||||
Suncor Energy, Inc. | 5,891 | 186,867 | ||||
TC Energy Corp. | 1,344 | 53,581 | ||||
Teck Resources Ltd., Class B | 2,102 | 79,438 | ||||
TELUS Corp. | 1,082 | 20,881 | ||||
TFI International, Inc. | 378 | 37,859 | ||||
Thomson Reuters Corp. | 331 | 37,759 | ||||
Tourmaline Oil Corp. | 1,456 | 73,467 | ||||
West Fraser Timber Co. Ltd. | 788 | 56,900 | ||||
WSP Global, Inc. | 49 | 5,685 | ||||
| 3,053,417 | ||||||
Chile–0.03% | ||||||
Antofagasta PLC | 100 | 1,857 | ||||
Sociedad Quimica y Minera de Chile S.A., Class B, Preference Shares | 192 | 15,527 | ||||
| 17,384 | ||||||
China–2.85% | ||||||
Alibaba Group Holding Ltd.(a) | 14,720 | 162,526 | ||||
ANTA Sports Products Ltd. | 1,235 | 16,192 | ||||
Autohome, Inc., ADR | 246 | 7,528 | ||||
China Coal Energy Co. Ltd., H Shares | 15,818 | 12,803 | ||||
See accompanying Notes to Financial Statements which are an integral part of the financial statements.
| 7 Invesco Income Advantage International Fund |
| Shares | Value | |||||
China–(continued) | ||||||
China Feihe Ltd.(b) | 16,147 | $ 13,601 | ||||
China Hongqiao Group Ltd. | 19,882 | 18,615 | ||||
China Life Insurance Co. Ltd., H Shares | 89,440 | 153,578 | ||||
China National Building Material Co. Ltd., H Shares | 29,415 | 24,163 | ||||
China Petroleum & Chemical Corp., H Shares | 249,893 | 120,772 | ||||
China Shenhua Energy Co. Ltd., H Shares | 8,491 | 24,443 | ||||
China Tower Corp. Ltd., H Shares(b) | 372,908 | 40,137 | ||||
CITIC Ltd. | 79,912 | 84,372 | ||||
COSCO SHIPPING Holdings Co. Ltd., H Shares | 32,458 | 33,107 | ||||
CSPC Pharmaceutical Group Ltd. | 5,663 | 5,950 | ||||
Daqo New Energy Corp., ADR(a) | 378 | 14,595 | ||||
Dongfeng Motor Group Co. Ltd., H Shares | 84,221 | 48,347 | ||||
ENN Energy Holdings Ltd. | 1,236 | 17,243 | ||||
Fufeng Group Ltd. | 17,300 | 10,492 | ||||
Haichang Ocean Park Holdings | 6,080 | 1,243 | ||||
JD.com, Inc., A Shares | 1,980 | 55,658 | ||||
Kingboard Holdings Ltd. | 8,271 | 26,336 | ||||
Koolearn Technology Holding | 2,152 | 14,408 | ||||
Kunlun Energy Co. Ltd. | 37,958 | 26,921 | ||||
Lenovo Group Ltd. | 33,927 | 27,868 | ||||
Lufax Holding Ltd., ADR | 13,622 | 26,427 | ||||
NetEase, Inc. | 3,220 | 46,936 | ||||
New Oriental Education & Technology Group, Inc., ADR(a) | 433 | 15,077 | ||||
Nongfu Spring Co. Ltd., H Shares(b) | 5,899 | 33,335 | ||||
NXP Semiconductors N.V. | 255 | 40,298 | ||||
People’s Insurance Co. Group of China Ltd. (The), H Shares | 161,382 | 53,556 | ||||
PetroChina Co. Ltd., H Shares | 203,775 | 93,283 | ||||
PICC Property & Casualty Co. Ltd., H Shares | 49,020 | 46,399 | ||||
Pinduoduo, Inc., ADR(a) | 1,715 | 139,858 | ||||
Ping An Insurance (Group) Co. of China Ltd., H Shares | 16,482 | 108,784 | ||||
Shanghai Fudan Microelectronics Group Co. Ltd., H Shares | 1,902 | 7,205 | ||||
Sino Biopharmaceutical Ltd. | 23,742 | 13,903 | ||||
Tencent Music Entertainment Group, ADR(a) | 1,883 | 15,591 | ||||
Yangzijiang Shipbuilding Holdings Ltd. | 20,789 | 21,023 | ||||
Yankuang Energy Group Co. Ltd., H Shares | 3,996 | 12,114 | ||||
Yum China Holdings, Inc. | 153 | 8,361 | ||||
| 1,643,048 | ||||||
Denmark–1.56% | ||||||
AP Moller - Maersk A/S, Class B | 82 | 184,177 | ||||
Carlsberg A/S, Class B | 23 | 3,045 | ||||
Novo Nordisk A/S, Class B | 5,114 | 692,435 | ||||
Tryg A/S | 876 | 20,778 | ||||
| 900,435 | ||||||
Finland–0.29% | ||||||
Kone OYJ, Class B | 356 | 18,440 | ||||
Neste OYJ | 175 | 8,083 | ||||
Sampo OYJ, Class A | 767 | 40,105 | ||||
UPM-Kymmene OYJ | 2,626 | 98,438 | ||||
| 165,066 | ||||||
France–4.26% | ||||||
Air Liquide S.A. | 987 | 140,390 | ||||
Arkema S.A. | 7 | 631 | ||||
| Shares | Value | |||||
France–(continued) | ||||||
AXA S.A. | 5,341 | $ 148,858 | ||||
Bollore SE | 7,512 | 42,097 | ||||
Bouygues S.A. | 1,813 | 54,390 | ||||
Capgemini SE | 103 | 17,274 | ||||
Carrefour S.A. | 1,975 | 33,046 | ||||
Cie Generale des Etablissements Michelin S.C.A. | 559 | 15,544 | ||||
Danone S.A. | 1,951 | 102,786 | ||||
Dassault Systemes SE | 670 | 24,165 | ||||
Edenred | 186 | 10,121 | ||||
Eiffage S.A. | 173 | 17,059 | ||||
ENGIE S.A. | 4,415 | 63,241 | ||||
EssilorLuxottica S.A. | 255 | 46,434 | ||||
Hermes International | 26 | 40,122 | ||||
Kering S.A. | 105 | 53,737 | ||||
Legrand S.A. | 558 | 44,929 | ||||
L’Oreal S.A. | 520 | 186,546 | ||||
LVMH Moet Hennessy Louis Vuitton SE | 303 | 220,113 | ||||
Orange S.A. | 10,059 | 100,021 | ||||
Pernod Ricard S.A. | 315 | 61,916 | ||||
Publicis Groupe S.A. | 620 | 39,370 | ||||
Renault S.A. | 692 | 23,056 | ||||
Safran S.A. | 472 | 58,983 | ||||
Sanofi | 3,384 | 327,438 | ||||
Sartorius Stedim Biotech | 2 | 652 | ||||
Schneider Electric SE | 791 | 111,246 | ||||
SCOR SE | 929 | 21,331 | ||||
TotalEnergies SE | 3,319 | 207,156 | ||||
Vinci S.A. | 1,387 | 138,527 | ||||
Vivendi SE | 10,186 | 97,471 | ||||
Worldline S.A.(a)(b) | 103 | 4,019 | ||||
| 2,452,669 | ||||||
Germany–2.60% | ||||||
Allianz SE | 957 | 205,780 | ||||
Aroundtown S.A. | 7,158 | 16,710 | ||||
BASF SE | 1,029 | 51,084 | ||||
Bayer AG | 153 | 7,900 | ||||
Bayerische Motoren Werke AG | 1,091 | 97,377 | ||||
Daimler Truck Holding AG(a) | 1,087 | 33,679 | ||||
Deutsche Bank AG | 6,404 | 72,586 | ||||
Deutsche Boerse AG | 446 | 76,953 | ||||
Deutsche Post AG | 1,727 | 65,008 | ||||
Deutsche Telekom AG | 3,690 | 73,603 | ||||
Fresenius Medical Care AG & Co. KGaA | 496 | 16,223 | ||||
Fresenius SE & Co. KGaA | 1,713 | 48,195 | ||||
Hannover Rueck SE | 37 | 7,355 | ||||
HeidelbergCement AG | 256 | 14,601 | ||||
Knorr-Bremse AG | 127 | 6,940 | ||||
LEG Immobilien SE | 74 | 4,822 | ||||
Mercedes-Benz Group AG | 1,914 | 125,604 | ||||
Merck KGaA | 211 | 40,862 | ||||
Muenchener Rueckversicherungs-Gesellschaft AG in Muenchen, Class R | 231 | 75,113 | ||||
Porsche Automobil Holding SE, Preference Shares | 396 | 21,725 | ||||
Rheinmetall AG | 51 | 10,158 | ||||
RWE AG | 979 | 43,533 | ||||
SAP SE | 1,421 | 146,646 | ||||
See accompanying Notes to Financial Statements which are an integral part of the financial statements.
| 8 Invesco Income Advantage International Fund |
| Shares | Value | |||||
Germany–(continued) | ||||||
Siemens AG | 267 | $ 37,058 | ||||
thyssenkrupp AG(a) | 317 | 1,934 | ||||
Volkswagen AG, Preference Shares | 1,517 | 189,077 | ||||
Vonovia SE | 221 | 5,208 | ||||
| 1,495,734 | ||||||
Greece–0.20% | ||||||
Hellenic Telecommunications Organization S.A. | 5,720 | 89,334 | ||||
JUMBO S.A. | 1,441 | 24,599 | ||||
| 113,933 | ||||||
Hong Kong–0.84% | ||||||
AIA Group Ltd. | 5,142 | 56,649 | ||||
CK Asset Holdings Ltd. | 9,490 | 58,428 | ||||
CK Hutchison Holdings Ltd. | 17,023 | 102,195 | ||||
Henderson Land Development Co. Ltd. | 2,635 | 9,200 | ||||
Hong Kong Exchanges & Clearing Ltd. | 498 | 21,521 | ||||
Jardine Matheson Holdings Ltd. | 1,061 | 53,950 | ||||
Kerry Properties Ltd. | 11,487 | 25,022 | ||||
MTR Corp. Ltd. | 3,996 | 21,172 | ||||
New World Development Co. Ltd. | 2,890 | 8,147 | ||||
Sun Hung Kai Properties Ltd. | 6,992 | 95,683 | ||||
Swire Pacific Ltd., Class A | 3,272 | 28,697 | ||||
WH Group Ltd. | 9,251 | 5,382 | ||||
| 486,046 | ||||||
Hungary–0.09% | ||||||
MOL Hungarian Oil & Gas PLC | 7,735 | 54,029 | ||||
India–0.46% | ||||||
Adani Enterprises Ltd. | 942 | 43,797 | ||||
Dr. Reddy’s Laboratories Ltd., ADR | 180 | 9,315 | ||||
Infosys Ltd., ADR | 5,143 | 92,626 | ||||
Piramal Enterprises Ltd. | 2,245 | 22,411 | ||||
SBI Cards & Payment Services Ltd. | 7,747 | 74,332 | ||||
Tata Steel Ltd. | 14,893 | 20,203 | ||||
| 262,684 | ||||||
Indonesia–0.22% | ||||||
PT Adaro Energy Indonesia Tbk | 107,777 | 26,586 | ||||
PT Astra International Tbk | 118,824 | 43,290 | ||||
PT Telkom Indonesia (Persero) Tbk | 225,337 | 54,286 | ||||
| 124,162 | ||||||
Ireland–0.33% | ||||||
CRH PLC | 2,917 | 115,491 | ||||
Kerry Group PLC, Class A | 846 | 76,341 | ||||
| 191,832 | ||||||
Israel–0.18% | ||||||
Check Point Software Technologies Ltd.(a) | 410 | 51,725 | ||||
Elbit Systems Ltd. | 119 | 19,365 | ||||
Nice Ltd.(a) | 156 | 30,241 | ||||
| 101,331 | ||||||
Italy–0.25% | ||||||
Enel S.p.A. | 3,220 | 17,318 | ||||
Eni S.p.A. | 3,613 | 51,609 | ||||
Ferrari N.V. | 178 | 38,084 | ||||
Poste Italiane S.p.A.(b) | 1,489 | 14,521 | ||||
| Shares | Value | |||||
Italy–(continued) | ||||||
Prysmian S.p.A. | 321 | $ 11,883 | ||||
Snam S.p.A. | 2,211 | 10,735 | ||||
| 144,150 | ||||||
Japan–8.61% | ||||||
Ajinomoto Co., Inc. | 899 | 27,412 | ||||
Astellas Pharma, Inc. | 1,698 | 25,761 | ||||
Bridgestone Corp. | 1,230 | 43,790 | ||||
Brother Industries Ltd. | 1,335 | 20,201 | ||||
Canon, Inc. | 3,595 | 77,735 | ||||
Central Japan Railway Co. | 355 | 43,673 | ||||
Chugai Pharmaceutical Co. Ltd. | 300 | 7,623 | ||||
Dai Nippon Printing Co. Ltd. | 810 | 16,239 | ||||
Dai-ichi Life Holdings, Inc. | 1,219 | 27,682 | ||||
Daiichi Sankyo Co. Ltd. | 5,213 | 167,064 | ||||
Daito Trust Construction Co. Ltd. | 59 | 6,064 | ||||
Daiwa House Industry Co. Ltd. | 816 | 18,724 | ||||
Denso Corp. | 245 | 12,010 | ||||
East Japan Railway Co. | 515 | 29,384 | ||||
Ebara Corp. | 448 | 16,069 | ||||
Eisai Co. Ltd. | 240 | 15,720 | ||||
ENEOS Holdings, Inc. | 14,222 | 48,424 | ||||
FANUC Corp. | 343 | 51,190 | ||||
FUJIFILM Holdings Corp. | 1,335 | 67,355 | ||||
Fujitsu Ltd. | 78 | 10,329 | ||||
Hankyu Hanshin Holdings, Inc. | 772 | 22,951 | ||||
Hitachi Ltd. | 1,055 | 53,093 | ||||
Honda Motor Co. Ltd. | 6,493 | 148,457 | ||||
Hoya Corp. | 366 | 35,412 | ||||
Idemitsu Kosan Co. Ltd. | 346 | 8,097 | ||||
IHI Corp. | 393 | 11,411 | ||||
Inpex Corp. | 3,611 | 38,531 | ||||
ITOCHU Corp. | 2,613 | 81,700 | ||||
Japan Post Holdings Co. Ltd. | 26,271 | 221,479 | ||||
Japan Tobacco, Inc. | 3,202 | 64,745 | ||||
Kao Corp. | 59 | 2,362 | ||||
KDDI Corp. | 5,913 | 178,715 | ||||
Keyence Corp. | 212 | 82,999 | ||||
Kintetsu Group Holdings Co. Ltd. | 166 | 5,502 | ||||
Komatsu Ltd. | 2,422 | 52,546 | ||||
Konami Group Corp. | 105 | 4,775 | ||||
Kubota Corp. | 2,283 | 31,449 | ||||
Kyocera Corp. | 890 | 44,415 | ||||
Marubeni Corp. | 1,926 | 22,010 | ||||
Marui Group Co. Ltd. | 4,559 | 75,740 | ||||
MEIJI Holdings Co. Ltd. | 89 | 4,570 | ||||
Mitsubishi Chemical Group Corp. | 2,445 | 12,632 | ||||
Mitsubishi Corp. | 3,281 | 106,146 | ||||
Mitsubishi Electric Corp. | 4,818 | 47,694 | ||||
Mitsubishi Estate Co. Ltd. | 2,398 | 31,032 | ||||
Mitsubishi Heavy Industries Ltd. | 1,276 | 50,495 | ||||
Mitsui & Co. Ltd. | 4,549 | 132,273 | ||||
Mitsui Fudosan Co. Ltd. | 1,286 | 23,494 | ||||
Mitsui OSK Lines Ltd. | 1,628 | 40,798 | ||||
MS&AD Insurance Group Holdings, Inc. | 1,062 | 33,990 | ||||
Murata Manufacturing Co. Ltd. | 553 | 27,744 | ||||
NEC Corp. | 538 | 18,823 | ||||
Nexon Co. Ltd. | 481 | 10,729 | ||||
See accompanying Notes to Financial Statements which are an integral part of the financial statements.
| 9 Invesco Income Advantage International Fund |
| Shares | Value | |||||
Japan–(continued) | ||||||
NGK Insulators Ltd. | 3,176 | $ 40,505 | ||||
Nintendo Co. Ltd. | 2,297 | 96,188 | ||||
Nippon Steel Corp. | 1,698 | 29,564 | ||||
Nippon Telegraph & Telephone Corp. | 9,090 | 259,466 | ||||
Nippon Yusen K.K.(c) | 2,578 | 61,074 | ||||
Nissan Motor Co. Ltd. | 4,461 | 14,035 | ||||
Nomura Holdings, Inc. | 21,634 | 80,524 | ||||
Nomura Research Institute Ltd. | 406 | 9,652 | ||||
Oji Holdings Corp. | 22,375 | 90,511 | ||||
Olympus Corp. | 1,621 | 28,652 | ||||
Oriental Land Co. Ltd. | 102 | 14,860 | ||||
ORIX Corp. | 5,647 | 91,057 | ||||
Otsuka Holdings Co. Ltd. | 102 | 3,321 | ||||
Pan Pacific International Holdings Corp. | 591 | 10,971 | ||||
Recruit Holdings Co. Ltd. | 2,292 | 72,894 | ||||
Resona Holdings, Inc. | 66,421 | 364,885 | ||||
Ricoh Co. Ltd. | 1,229 | 9,427 | ||||
SBI Holdings, Inc. | 2,397 | 45,957 | ||||
Secom Co. Ltd. | 300 | 17,114 | ||||
Seiko Epson Corp. | 1,411 | 20,481 | ||||
Seven & i Holdings Co. Ltd. | 699 | 29,902 | ||||
Shin-Etsu Chemical Co. Ltd. | 400 | 48,734 | ||||
SMC Corp. | 132 | 55,866 | ||||
SoftBank Corp. | 11,278 | 127,518 | ||||
SoftBank Group Corp. | 1,175 | 49,759 | ||||
Sompo Holdings, Inc. | 798 | 35,433 | ||||
Sony Group Corp. | 417 | 31,799 | ||||
Sumitomo Chemical Co. Ltd. | 202 | 723 | ||||
Sumitomo Corp. | 1,898 | 31,473 | ||||
Taisei Corp. | 64 | 2,062 | ||||
Takeda Pharmaceutical Co. Ltd. | 6,793 | 212,173 | ||||
Tokio Marine Holdings, Inc. | 5,026 | 107,589 | ||||
Tokyo Electric Power Co. Holdings, Inc.(a) | 1,299 | 4,690 | ||||
Tokyo Electron Ltd. | 160 | 47,530 | ||||
Tokyo Gas Co. Ltd. | 274 | 5,387 | ||||
Tokyu Corp. | 1,572 | 19,799 | ||||
Toppan, Inc. | 1,459 | 21,539 | ||||
Toshiba Corp. | 334 | 11,708 | ||||
Tosoh Corp. | 7 | 83 | ||||
Toyota Industries Corp. | 1,303 | 71,041 | ||||
Toyota Motor Corp. | 14,765 | 201,795 | ||||
Trend Micro, Inc. | 168 | 7,856 | ||||
Unicharm Corp. | 170 | 6,519 | ||||
Yakult Honsha Co. Ltd. | 52 | 3,391 | ||||
| 4,954,765 | ||||||
Kuwait–0.15% | ||||||
Mobile Telecommunications Co. KSCP | 46,580 | 85,840 | ||||
Luxembourg–0.17% | ||||||
ArcelorMittal S.A. | 3,719 | 97,237 | ||||
Malaysia–0.15% | ||||||
IHH Healthcare Bhd. | 20,319 | 28,628 | ||||
Tenaga Nasional Bhd. | 27,473 | 60,053 | ||||
| 88,681 | ||||||
Mexico–0.15% | ||||||
Grupo Bimbo S.A.B. de C.V., Series A | 3,796 | 16,044 | ||||
| Shares | Value | |||||
Mexico–(continued) | ||||||
Wal-Mart de Mexico S.A.B. de C.V., Series V | 20,658 | $ 72,713 | ||||
| 88,757 | ||||||
Netherlands–1.96% | ||||||
Argenx SE(a) | 42 | 15,659 | ||||
ASML Holding N.V. | 739 | 400,023 | ||||
ASR Nederland N.V. | 564 | 26,741 | ||||
EXOR N.V.(a) | 1,304 | 95,188 | ||||
Heineken Holding N.V. | 551 | 42,427 | ||||
Heineken N.V. | 482 | 45,285 | ||||
Koninklijke Ahold Delhaize N.V. | 4,693 | 134,848 | ||||
Koninklijke DSM N.V. | 51 | 6,252 | ||||
Koninklijke KPN N.V. | 781 | 2,416 | ||||
Koninklijke Philips N.V. | 5,763 | 86,498 | ||||
OCI N.V. | 265 | 9,457 | ||||
Randstad N.V. | 63 | 3,847 | ||||
Shell PLC | 6,247 | 177,526 | ||||
Universal Music Group N.V. | 1,199 | 28,943 | ||||
Wolters Kluwer N.V. | 517 | 54,005 | ||||
| 1,129,115 | ||||||
New Zealand–0.02% | ||||||
Spark New Zealand Ltd. | 4,068 | 13,944 | ||||
Norway–0.32% | ||||||
Aker BP ASA | 364 | 11,346 | ||||
Equinor ASA | 3,827 | 137,268 | ||||
Gjensidige Forsikring ASA | 1,698 | 33,321 | ||||
Schibsted ASA, Class A | 28 | 528 | ||||
Telenor ASA | 268 | 2,506 | ||||
| 184,969 | ||||||
Philippines–0.08% | ||||||
SM Prime Holdings, Inc. | 73,886 | 46,805 | ||||
Poland–0.04% | ||||||
Polski Koncern Naftowy ORLEN S.A. | 1,390 | 20,329 | ||||
Portugal–0.01% | ||||||
Jeronimo Martins SGPS S.A. | 134 | 2,897 | ||||
Qatar–0.36% | ||||||
Barwa Real Estate Co. | 174,709 | 138,031 | ||||
Ooredoo Q.P.S.C. | 27,491 | 69,440 | ||||
| 207,471 | ||||||
Russia–0.00% | ||||||
Tatneft PJSC, ADR(d) | 576 | 0 | ||||
X5 Retail Group N.V., GDR(b)(d) | 422 | 0 | ||||
| 0 | ||||||
Singapore–0.00% | ||||||
Jardine Cycle & Carriage Ltd. | 83 | 1,773 | ||||
South Africa–0.76% | ||||||
Anglo American PLC | 3,349 | 130,988 | ||||
Aspen Pharmacare Holdings Ltd. | 69 | 554 | ||||
Exxaro Resources Ltd. | 1,007 | 12,837 | ||||
FirstRand Ltd. | 16,183 | 59,108 | ||||
Impala Platinum Holdings Ltd. | 485 | 6,064 | ||||
Investec Ltd. | 7,213 | 45,629 | ||||
Naspers Ltd., Class N | 152 | 25,057 | ||||
See accompanying Notes to Financial Statements which are an integral part of the financial statements.
| 10 Invesco Income Advantage International Fund |
| Shares | Value | |||||
South Africa–(continued) | ||||||
Old Mutual Ltd. | 51,834 | $ 31,863 | ||||
Remgro Ltd. | 5,767 | 45,122 | ||||
Sappi Ltd.(a) | 4,355 | 12,603 | ||||
Sasol Ltd. | 1,505 | 23,805 | ||||
Shoprite Holdings Ltd. | 747 | 9,938 | ||||
Sibanye Stillwater Ltd. | 2,741 | 7,277 | ||||
Thungela Resources Ltd. | 576 | 9,738 | ||||
Woolworths Holdings Ltd. | 4,724 | 18,443 | ||||
| 439,026 | ||||||
South Korea–1.40% | ||||||
E-MART, Inc. | 159 | 12,388 | ||||
GS Holdings Corp. | 820 | 28,528 | ||||
HMM Co. Ltd. | 2,502 | 39,018 | ||||
Hyundai Mobis Co. Ltd. | 122 | 19,449 | ||||
Hyundai Motor Co. | 2 | 240 | ||||
Hyundai Steel Co. | 280 | 6,835 | ||||
Kia Corp. | 441 | 20,800 | ||||
KT Corp. | 837 | 22,433 | ||||
KT&G Corp. | 633 | 45,771 | ||||
Kumho Petrochemical Co. Ltd. | 56 | 5,616 | ||||
LG Chem Ltd. | 15 | 7,176 | ||||
LG Corp. | 697 | 43,287 | ||||
LG Display Co. Ltd. | 2,643 | 26,245 | ||||
LG Energy Solution Ltd.(a) | 44 | 15,246 | ||||
LG Uplus Corp. | 52 | 456 | ||||
NAVER Corp. | 346 | 49,142 | ||||
POSCO Chemical Co. Ltd. | 9 | 1,292 | ||||
POSCO Holdings, Inc. | 214 | 47,103 | ||||
Samsung Biologics Co. Ltd.(a)(b) | 8 | 5,160 | ||||
Samsung C&T Corp. | 451 | 40,733 | ||||
Samsung Electro-Mechanics Co. Ltd. | 69 | 7,190 | ||||
Samsung Electronics Co. Ltd. | 4,092 | 180,449 | ||||
Samsung SDI Co. Ltd. | 48 | 22,618 | ||||
SK Hynix, Inc. | 2,015 | 121,287 | ||||
SK Telecom Co. Ltd. | 1,028 | 38,460 | ||||
| 806,922 | ||||||
Spain–1.13% | ||||||
ACS Actividades de Construccion y Servicios S.A. | 2,378 | 68,135 | ||||
Cellnex Telecom S.A.(b) | 457 | 15,198 | ||||
Ferrovial S.A. | 1,498 | 39,187 | ||||
Iberdrola S.A. | 20,099 | 235,108 | ||||
Industria de Diseno Textil S.A. | 752 | 20,024 | ||||
Red Electrica Corp. S.A. | 805 | 13,984 | ||||
Repsol S.A. | 5,765 | 91,902 | ||||
Telefonica S.A. | 46,205 | 167,339 | ||||
| 650,877 | ||||||
Sweden–0.80% | ||||||
Atlas Copco AB, Class A | 2,463 | 29,160 | ||||
Industrivarden AB, Class C | 2,293 | 55,791 | ||||
Investor AB, Class B | 11,128 | 201,832 | ||||
L E Lundbergforetagen AB, Class B | 766 | 32,653 | ||||
Telefonaktiebolaget LM Ericsson, Class B | 9,830 | 57,568 | ||||
Volvo AB, Class B | 4,439 | 80,375 | ||||
| 457,379 | ||||||
| Shares | Value | |||||
Switzerland–1.32% | ||||||
ABB Ltd. | 1,093 | $ 33,290 | ||||
Julius Baer Group Ltd. | 83 | 4,824 | ||||
Novartis AG | 5,442 | 492,944 | ||||
Partners Group Holding AG | 54 | 48,000 | ||||
Schindler Holding AG, PC | 79 | 14,834 | ||||
UBS Group AG | 6,345 | 118,268 | ||||
Zurich Insurance Group AG | 103 | 49,221 | ||||
| 761,381 | ||||||
Taiwan–1.83% | ||||||
ASE Technology Holding Co. Ltd. | 980 | 2,991 | ||||
Asustek Computer, Inc. | 4,994 | 43,599 | ||||
AUO Corp. | 49,468 | 24,126 | ||||
Catcher Technology Co. Ltd. | 2,957 | 16,253 | ||||
Cathay Financial Holding Co. Ltd. | 24,596 | 31,992 | ||||
Chailease Holding Co. Ltd. | 804 | 5,671 | ||||
Chunghwa Telecom Co. Ltd. | 13,788 | 50,680 | ||||
Delta Electronics, Inc. | 2,413 | 22,479 | ||||
E Ink Holdings, Inc. | 618 | 3,234 | ||||
Evergreen Marine Corp. Taiwan Ltd. | 4,166 | 21,732 | ||||
Far Eastern New Century Corp. | 11,053 | 11,467 | ||||
Far EasTone Telecommunications Co. Ltd. | 8,177 | 17,528 | ||||
Formosa Chemicals & Fibre Corp. | 6,992 | 15,993 | ||||
Formosa Plastics Corp. | 7,991 | 22,560 | ||||
Fubon Financial Holding Co. Ltd. | 19,071 | 34,916 | ||||
Hon Hai Precision Industry Co. Ltd. | 18,836 | 61,196 | ||||
Innolux Corp. | 80,217 | 28,821 | ||||
Inventec Corp. | 2,277 | 1,945 | ||||
Lite-On Technology Corp. | 999 | 2,073 | ||||
Novatek Microelectronics Corp. | 1,309 | 13,425 | ||||
Pegatron Corp. | 19,978 | 41,254 | ||||
Taiwan Mobile Co. Ltd. | 8,425 | 25,954 | ||||
Taiwan Semiconductor Manufacturing Co. Ltd. | 31,438 | 458,198 | ||||
Uni-President Enterprises Corp. | 19,493 | 42,225 | ||||
Wan Hai Lines Ltd. | 7,908 | 20,590 | ||||
Yang Ming Marine Transport Corp. | 14,997 | 31,930 | ||||
| 1,052,832 | ||||||
Thailand–0.20% | ||||||
Advanced Info Service PCL, NVDR | 5,993 | 33,703 | ||||
Airports of Thailand PCL, NVDR | 3,824 | 8,281 | ||||
Delta Electronics Thailand PCL, NVDR | 805 | 19,298 | ||||
PTT Exploration & Production PCL, NVDR | 3,553 | 18,122 | ||||
PTT PCL, NVDR | 38,785 | 37,270 | ||||
| 116,674 | ||||||
Turkey–0.30% | ||||||
BIM Birlesik Magazalar A.S. | 3,363 | 24,619 | ||||
KOC Holding A.S. | 12,056 | 53,949 | ||||
Turk Hava Yollari AO(a) | 4,972 | 37,418 | ||||
Turkiye Petrol Rafinerileri A.S.(a) | 710 | 20,123 | ||||
Turkiye Sise ve Cam Fabrikalari A.S. | 14,908 | 34,235 | ||||
| 170,344 | ||||||
United Arab Emirates–0.47% | ||||||
Emaar Properties PJSC | 26,259 | 41,798 | ||||
International Holding Co. PJSC(a) | 1,881 | 209,952 | ||||
Multiply Group PJSC(a) | 13,592 | 17,110 | ||||
| 268,860 | ||||||
See accompanying Notes to Financial Statements which are an integral part of the financial statements.
| 11 Invesco Income Advantage International Fund |
| Shares | Value | |||||
United Kingdom–4.77% | ||||||
3i Group PLC | 5,685 | $ 92,305 | ||||
AstraZeneca PLC | 3,325 | 451,254 | ||||
AVEVA Group PLC | 276 | 10,720 | ||||
Aviva PLC | 15,117 | 80,576 | ||||
BAE Systems PLC | 6,244 | 64,533 | ||||
BP PLC | 30,396 | 176,760 | ||||
British American Tobacco PLC | 6,738 | 267,328 | ||||
BT Group PLC | 11,712 | 15,903 | ||||
CNH Industrial N.V. | 2,770 | 44,487 | ||||
Coca-Cola Europacific Partners PLC | 283 | 15,656 | ||||
Compass Group PLC(a) | 248 | 5,730 | ||||
Diageo PLC | 5,650 | 249,500 | ||||
Experian PLC | 210 | 7,149 | ||||
Imperial Brands PLC | 2,322 | 58,014 | ||||
International Distributions Services PLC | 6,484 | 16,715 | ||||
J Sainsbury PLC | 11,778 | 30,917 | ||||
Johnson Matthey PLC | 209 | 5,380 | ||||
Legal & General Group PLC | 4,524 | 13,663 | ||||
London Stock Exchange Group PLC | 510 | 44,005 | ||||
M&G PLC | 14,855 | 33,766 | ||||
Man Group PLC | 12,152 | 31,401 | ||||
Marks & Spencer Group PLC | 217 | 322 | ||||
National Grid PLC | 5,684 | 68,273 | ||||
Pearson PLC | 2,512 | 28,473 | ||||
Phoenix Group Holdings PLC | 746 | 5,494 | ||||
Reckitt Benckiser Group PLC | 1,583 | 110,128 | ||||
RELX PLC | 3,675 | 101,819 | ||||
Rentokil Initial PLC | 1,714 | 10,535 | ||||
Rightmove PLC | 756 | 4,680 | ||||
Sage Group PLC (The) | 2,992 | 26,871 | ||||
Smiths Group PLC | 1,290 | 24,870 | ||||
Spirax-Sarco Engineering PLC | 101 | 12,978 | ||||
SSE PLC | 2,358 | 48,636 | ||||
Tesco PLC | 32,208 | 87,324 | ||||
Unilever PLC | 6,624 | 334,174 | ||||
United Utilities Group PLC | 202 | 2,422 | ||||
Vodafone Group PLC | 130,220 | 132,000 | ||||
Wise PLC, Class A(a) | 342 | 2,313 | ||||
WPP PLC | 2,790 | 27,699 | ||||
| 2,744,773 | ||||||
United States–3.32% | ||||||
Atlassian Corp., Class A(a) | 291 | 37,446 | ||||
Computershare Ltd. | 387 | 6,904 | ||||
Ferguson PLC | 312 | 39,419 | ||||
GSK PLC | 8,688 | 151,083 | ||||
JBS S.A. | 4,199 | 17,717 | ||||
Nestle S.A. | 4,660 | 538,162 | ||||
Prosus N.V. | 2,163 | 148,502 | ||||
Roche Holding AG | 2,519 | 791,626 | ||||
Signify N.V. | 328 | 11,043 | ||||
Stellantis N.V. | 9,939 | 140,785 | ||||
Swiss Re AG | 274 | 25,704 | ||||
| 1,908,391 | ||||||
Total Common Stocks & Other Equity Interests |
| 30,195,498 | ||||
| Principal Amount | Value | |||||
Equity Linked Notes–27.06% |
| |||||
Canada–9.87% | ||||||
Bank of Montreal (MSCI EAFE Index), 19.88%, 01/09/2023(b) | $ | 1,179,000 | $ 1,184,024 | |||
Bank of Montreal (MSCI EAFE Index), 20.31%, 01/09/2023(b) | 1,189,000 | 1,198,013 | ||||
Canadian Imperial Bank of Commerce (MSCI EAFE Index), 20.50%, 01/20/2023(b) | 1,185,000 | 1,161,026 | ||||
Canadian Imperial Bank of Commerce (MSCI EAFE Index), 23.00%, 02/03/2023(b) | 1,174,000 | 1,154,447 | ||||
Royal Bank of Canada (MSCI Emerging Markets Index), 24.31%, 01/18/2023(b) | 1,012,000 | 986,519 | ||||
| 5,684,029 | ||||||
France–5.97% | ||||||
BNP Paribas Issuance B.V. (MSCI EAFE Index), 18.64%, 01/13/2023(b) | 1,176,000 | 1,170,529 | ||||
BNP Paribas S.A. (MSCI EAFE Index), 19.17%, 01/23/2023(b) | 1,180,000 | 1,162,306 | ||||
Societe Generale S.A. (MSCI EAFE Index), 19.35%, 01/30/2023(b) | 1,167,000 | 1,101,830 | ||||
| 3,434,665 | ||||||
Switzerland–3.84% | ||||||
Credit Suisse AG (MSCI Emerging Markets Index), 21.60%, 01/10/2023(b) | 1,034,000 | 1,042,908 | ||||
Credit Suisse Group AG (MSCI EAFE Index), 23.30%, 01/06/2023(b) | 1,172,000 | 1,169,108 | ||||
| 2,212,016 | ||||||
United Kingdom–1.71% | ||||||
HSBC Bank PLC (MSCI Emerging Markets Index), 21.68%, 01/31/2023(b) | 1,006,000 | 984,783 | ||||
United States–5.67% | ||||||
Citigroup, Inc. (MSCI EAFE Index), 25.20%, 02/06/2023(b) | 1,162,000 | 1,133,288 | ||||
J.P. Morgan Structured Products B.V. (MSCI EAFE Index), 20.59%, 01/27/2023(b) | 1,185,000 | 1,132,838 | ||||
JPMorgan Chase & Co. (MSCI Emerging Markets Index), 21.53%, 01/24/2023(b) | 1,015,000 | 997,538 | ||||
| 3,263,664 | ||||||
Total Equity Linked Notes |
| 15,579,157 | ||||
| Shares | ||||||
Money Market Funds–19.48% |
| |||||
Invesco Government & Agency Portfolio, Institutional Class, 4.22%(e)(f) | 3,926,442 | 3,926,442 | ||||
Invesco Liquid Assets Portfolio, Institutional Class, 4.42%(e)(f) | 2,795,724 | 2,796,563 | ||||
Invesco Treasury Portfolio, Institutional Class, 4.20%(e)(f) | 4,487,362 | 4,487,362 | ||||
Total Money Market Funds |
| 11,210,367 | ||||
TOTAL INVESTMENTS IN SECURITIES (excluding Investments purchased with cash collateral from securities on loan)-98.99% (Cost $57,604,867) |
| 56,985,022 | ||||
See accompanying Notes to Financial Statements which are an integral part of the financial statements.
| 12 Invesco Income Advantage International Fund |
| Shares | Value | |||||||
Investments Purchased with Cash Collateral from Securities on Loan |
| |||||||
Money Market Funds–0.10% | ||||||||
Invesco Private Government Fund, | 17,120 | $ | 17,120 | |||||
Invesco Private Prime Fund, | 41,728 | 41,740 | ||||||
Total Investments Purchased with Cash Collateral from Securities on Loan (Cost $58,853) |
| 58,860 | ||||||
TOTAL INVESTMENTS IN SECURITIES–99.09% | 57,043,882 | |||||||
OTHER ASSETS LESS LIABILITIES–0.91% |
| 525,778 | ||||||
NET ASSETS–100.00% | $ | 57,569,660 | ||||||
| Investment Abbreviations: | ||
| ADR | – American Depositary Receipt | |
| GDR | – Global Depositary Receipt | |
| NVDR | – Non-Voting Depositary Receipt | |
| PC | – Participation Certificate | |
| Rts. | – Rights | |
Notes to Schedule of Investments:
| (a) | Non-income producing security. |
| (b) | Security purchased or received in a transaction exempt from registration under the Securities Act of 1933, as amended (the “1933 Act”). The security may be resold pursuant to an exemption from registration under the 1933 Act, typically to qualified institutional buyers. The aggregate value of these securities at December 31, 2022 was $15,762,808, which represented 27.38% of the Fund’s Net Assets. |
| (c) | All or a portion of this security was out on loan at December 31, 2022. |
| (d) | Security valued using significant unobservable inputs (Level 3). See Note 3. |
| (e) | Affiliated issuer. The issuer and/or the Fund is a wholly-owned subsidiary of Invesco Ltd., or is affiliated by having an investment adviser that is under common control of Invesco Ltd. The table below shows the Fund’s transactions in, and earnings from, its investments in affiliates for the fiscal year ended December 31, 2022. |
| Value December 31, 2021 | Purchases at Cost | Proceeds from Sales | Change in Unrealized Appreciation | Realized Gain (Loss) | Value December 31, 2022 | Dividend Income | ||||||||||||||||||||||
| Investments in Affiliated Money Market Funds: | ||||||||||||||||||||||||||||
Invesco Government & Agency Portfolio, Institutional Class | $5,444,739 | $ | 53,961,415 | $ | (55,479,712) | $ - | $ | - | $3,926,442 | $64,628 | ||||||||||||||||||
Invesco Liquid Assets Portfolio, Institutional Class | 3,881,117 | 38,543,867 | (39,628,365) | 1,508 | (1,564) | 2,796,563 | 47,792 | |||||||||||||||||||||
Invesco Treasury Portfolio, Institutional Class | 6,222,558 | 61,670,188 | (63,405,384) | - | - | 4,487,362 | 71,746 | |||||||||||||||||||||
| Investments Purchased with Cash Collateral from Securities on Loan: | ||||||||||||||||||||||||||||
Invesco Private Government Fund | - | 97,418 | (80,298) | - | - | 17,120 | 176* | |||||||||||||||||||||
Invesco Private Prime Fund | - | 203,987 | (162,261) | 7 | 7 | 41,740 | 480* | |||||||||||||||||||||
Total | $15,548,414 | $ | 154,476,875 | $ | (158,756,020) | $1,515 | $ | (1,557) | $11,269,227 | $184,822 | ||||||||||||||||||
| * | Represents the income earned on the investment of cash collateral, which is included in securities lending income on the Statement of Operations. Does not include rebates and fees paid to lending agent or premiums received from borrowers, if any. |
| (f) | The rate shown is the 7-day SEC standardized yield as of December 31, 2022. |
| (g) | The security has been segregated to satisfy the commitment to return the cash collateral received in securities lending transactions upon the borrower’s return of the securities loaned. See Note 1J. |
Open Futures Contracts(a) | ||||||||||||||||||
| Long Futures Contracts | Number of Contracts | Expiration Month | Notional Value | Value | Unrealized Appreciation | |||||||||||||
Equity Risk | ||||||||||||||||||
MSCI Emerging Markets Index | 18 | March-2023 | $ | 863,460 | $ | (2,552 | ) | $(2,552) | ||||||||||
| (a) | Futures contracts collateralized by $38,856 cash held with Merill Lynch, the futures commission merchant. |
| See accompanying | Notes to Financial Statements which are an integral part of the financial statements. |
| 13 Invesco Income Advantage International Fund |
Statement of Assets and Liabilities
December 31, 2022
Assets: | ||||
Investments in unaffiliated securities, at value | $ | 45,774,655 | ||
| ||||
Investments in affiliated money market funds, at value | 11,269,227 | |||
| ||||
Deposits with brokers: | ||||
Cash collateral – exchange-traded futures contracts | 38,856 | |||
| ||||
Cash | 1,162,000 | |||
| ||||
Foreign currencies, at value (Cost $169,942) | 172,069 | |||
| ||||
Receivable for: | ||||
Investments sold | 394 | |||
| ||||
Fund shares sold | 12,734 | |||
| ||||
Dividends | 225,399 | |||
| ||||
Interest | 194,738 | |||
| ||||
Investment for trustee deferred compensation and retirement plans | 50,199 | |||
| ||||
Other assets | 41,824 | |||
| ||||
Total assets | 58,942,095 | |||
| ||||
Liabilities: | ||||
Other investments: | ||||
Variation margin payable – futures contracts | 2,525 | |||
Payable for: | ||||
Investments purchased | 1,162,000 | |||
Fund shares reacquired | 7,422 | |||
Accrued foreign taxes | 168 | |||
Collateral upon return of securities loaned | 58,853 | |||
Accrued fees to affiliates | 35,714 | |||
Accrued trustees’ and officers’ fees and benefits | 2,799 | |||
Accrued other operating expenses | 46,275 | |||
Trustee deferred compensation and retirement plans | 56,679 | |||
| ||||
Total liabilities | 1,372,435 | |||
| ||||
Net assets applicable to shares outstanding | $ | 57,569,660 | ||
| ||||
Net assets consist of: | ||||
Shares of beneficial interest | $ | 70,631,807 | ||
| ||||
Distributable earnings (loss) | (13,062,147 | ) | ||
| ||||
| $ | 57,569,660 | |||
| ||||
Net Assets: | ||||
Class A | $ | 50,825,558 | ||
Class C | $ | 939,235 | ||
Class R | $ | 1,595,451 | ||
Class Y | $ | 3,678,993 | ||
Class R5 | $ | 513,791 | ||
Class R6 | $ | 16,632 | ||
Shares outstanding, no par value, with an unlimited number of shares authorized: |
| |||
Class A | 4,273,291 | |||
Class C | 83,500 | |||
Class R | 133,863 | |||
Class Y | 308,588 | |||
Class R5 | 42,708 | |||
Class R6 | 1,384 | |||
Class A: | ||||
Net asset value per share | $ | 11.89 | ||
Maximum offering price per share | $ | 12.58 | ||
Class C: | ||||
Net asset value and offering price per share | $ | 11.25 | ||
Class R: | ||||
Net asset value and offering price per share | $ | 11.92 | ||
Class Y: | ||||
Net asset value and offering price per share | $ | 11.92 | ||
Class R5: | ||||
Net asset value and offering price per share | $ | 12.03 | ||
Class R6: | ||||
Net asset value and offering price per share | $ | 12.02 | ||
| * | At December 31, 2022, security with a value of $56,569 was on loan to brokers. |
See accompanying Notes to Financial Statements which are an integral part of the financial statements.
| 14 Invesco Income Advantage International Fund |
Statement of Operations
For the year ended December 31, 2022
Investment income: | ||||
Interest (net of foreign withholding taxes of $7,663) | $ | 3,654,521 | ||
| ||||
Dividends (net of foreign withholding taxes of $142,869) | 1,386,570 | |||
| ||||
Dividends from affiliated money market funds (includes net securities lending income of $47) | 184,213 | |||
| ||||
Total investment income | 5,225,304 | |||
| ||||
Expenses: | ||||
Advisory fees | 463,299 | |||
| ||||
Administrative services fees | 9,031 | |||
| ||||
Custodian fees | 18,447 | |||
| ||||
Distribution fees: | ||||
Class A | 137,883 | |||
| ||||
Class C | 10,228 | |||
| ||||
Class R | 7,971 | |||
| ||||
Transfer agent fees – A, C, R and Y | 124,475 | |||
| ||||
Transfer agent fees – R5 | 526 | |||
| ||||
Transfer agent fees – R6 | 8 | |||
| ||||
Trustees’ and officers’ fees and benefits | 17,785 | |||
| ||||
Registration and filing fees | 74,856 | |||
| ||||
Reports to shareholders | 14,062 | |||
| ||||
Professional services fees | 68,638 | |||
| ||||
Other | 35,559 | |||
| ||||
Total expenses | 982,768 | |||
| ||||
Less: Fees waived, expenses reimbursed and/or expense offset arrangement(s) | (232,519 | ) | ||
| ||||
Net expenses | 750,249 | |||
| ||||
Net investment income | 4,475,055 | |||
| ||||
Realized and unrealized gain (loss) from: | ||||
Net realized gain (loss) from: | ||||
Unaffiliated investment securities (net of foreign taxes of $879) | (11,429,122 | ) | ||
| ||||
Affiliated investment securities | (1,557 | ) | ||
| ||||
Foreign currencies | (31,118 | ) | ||
| ||||
Forward foreign currency contracts | (825 | ) | ||
| ||||
Futures contracts | (264,290 | ) | ||
| ||||
| (11,726,912 | ) | |||
| ||||
Change in net unrealized appreciation (depreciation) of: | (1,312,448 | ) | ||
| ||||
Affiliated investment securities | 1,515 | |||
| ||||
Foreign currencies | (853 | ) | ||
| ||||
Futures contracts | (2,552 | ) | ||
| ||||
| (1,314,338 | ) | |||
| ||||
Net realized and unrealized gain (loss) | (13,041,250 | ) | ||
| ||||
Net increase (decrease) in net assets resulting from operations | $ | (8,566,195 | ) | |
| ||||
See accompanying Notes to Financial Statements which are an integral part of the financial statements.
| 15 Invesco Income Advantage International Fund |
Statement of Changes in Net Assets
For the years ended December 31, 2022 and 2021
| 2022 | 2021 | |||||||
| ||||||||
Operations: | ||||||||
Net investment income | $ | 4,475,055 | $ | 2,376,165 | ||||
| ||||||||
Net realized gain (loss) | (11,726,912 | ) | 12,802,155 | |||||
| ||||||||
Change in net unrealized appreciation (depreciation) | (1,314,338 | ) | (5,418,178 | ) | ||||
| ||||||||
Net increase (decrease) in net assets resulting from operations | (8,566,195 | ) | 9,760,142 | |||||
| ||||||||
Distributions to shareholders from distributable earnings: | ||||||||
Class A | (3,964,473 | ) | (1,752,390 | ) | ||||
| ||||||||
Class C | (66,117 | ) | (23,528 | ) | ||||
| ||||||||
Class R | (109,626 | ) | (38,642 | ) | ||||
| ||||||||
Class Y | (264,840 | ) | (62,439 | ) | ||||
| ||||||||
Class R5 | (43,278 | ) | (19,570 | ) | ||||
| ||||||||
Class R6 | (1,381 | ) | (646 | ) | ||||
| ||||||||
Total distributions from distributable earnings | (4,449,715 | ) | (1,897,215 | ) | ||||
| ||||||||
Share transactions–net: | ||||||||
Class A | (1,617,317 | ) | (5,302,795 | ) | ||||
| ||||||||
Class C | (16,632 | ) | (274,092 | ) | ||||
| ||||||||
Class R | 268,141 | 188,580 | ||||||
| ||||||||
Class Y | 2,015,756 | 122,744 | ||||||
| ||||||||
Class R5 | (42,742 | ) | 57,382 | |||||
| ||||||||
Class R6 | (1,077 | ) | 205 | |||||
| ||||||||
Net increase (decrease) in net assets resulting from share transactions | 606,129 | (5,207,976 | ) | |||||
| ||||||||
Net increase (decrease) in net assets | (12,409,781 | ) | 2,654,951 | |||||
| ||||||||
Net assets: | ||||||||
Beginning of year | 69,979,441 | 67,324,490 | ||||||
| ||||||||
End of year | $ | 57,569,660 | $ | 69,979,441 | ||||
| ||||||||
See accompanying Notes to Financial Statements which are an integral part of the financial statements.
| 16 Invesco Income Advantage International Fund |
The following schedule presents financial highlights for a share of the Fund outstanding throughout the periods indicated.
| Net asset value, beginning of period | Net investment income(a) | Net gains (losses) on securities (both realized and unrealized) | Total from investment operations | Dividends from net investment income | Return of capital | Total distributions | Net asset value, end | Total return (b) | Net assets, end of period (000’s omitted) | Ratio of to average net assets | Ratio of expenses to average net assets without fee waivers and/or expenses absorbed | Ratio of net to average | Portfolio turnover (c) | |||||||||||||||||||||||||||||||||||||||||||||||||||||||||
Class A | ||||||||||||||||||||||||||||||||||||||||||||||||||||||||||||||||||||||
Year ended 12/31/22 | $ | 14.56 | $ | 0.92 | $ | (2.68 | ) | $ | (1.76 | ) | $ | (0.91 | ) | $ | – | $ | (0.91 | ) | $ | 11.89 | (12.16 | )% | $ | 50,826 | 1.21 | % | 1.59 | % | 7.25 | % | 97 | % | ||||||||||||||||||||||||||||||||||||||
Year ended 12/31/21 | 13.02 | 0.48 | 1.45 | 1.93 | (0.39 | ) | – | (0.39 | ) | 14.56 | 14.84 | 64,112 | 1.43 | 1.55 | 3.33 | 115 | ||||||||||||||||||||||||||||||||||||||||||||||||||||||
Year ended 12/31/20 | 14.04 | 0.19 | �� | (0.95 | ) | (0.76 | ) | (0.21 | ) | (0.05 | ) | (0.26 | ) | 13.02 | (5.16 | ) | 62,139 | 1.55 | 1.55 | 1.54 | 71 | |||||||||||||||||||||||||||||||||||||||||||||||||
Year ended 12/31/19 | 12.23 | 0.29 | 1.81 | 2.10 | (0.29 | ) | – | (0.29 | ) | 14.04 | 17.26 | 74,917 | 1.59 | 1.59 | 2.19 | 103 | ||||||||||||||||||||||||||||||||||||||||||||||||||||||
Year ended 12/31/18 | 13.89 | 0.28 | (d) | (1.70 | ) | (1.42 | ) | (0.24 | ) | – | (0.24 | ) | 12.23 | (10.39 | ) | 70,104 | 1.59 | 1.59 | 2.07 | (d) | 111 | |||||||||||||||||||||||||||||||||||||||||||||||||
Class C | ||||||||||||||||||||||||||||||||||||||||||||||||||||||||||||||||||||||
Year ended 12/31/22 | 13.76 | 0.78 | (2.52 | ) | (1.74 | ) | (0.77 | ) | – | (0.77 | ) | 11.25 | (12.72 | ) | 939 | 1.96 | 2.34 | 6.50 | 97 | |||||||||||||||||||||||||||||||||||||||||||||||||||
Year ended 12/31/21 | 12.32 | 0.35 | 1.36 | 1.71 | (0.27 | ) | – | (0.27 | ) | 13.76 | 13.86 | 1,176 | 2.18 | 2.30 | 2.58 | 115 | ||||||||||||||||||||||||||||||||||||||||||||||||||||||
Year ended 12/31/20 | 13.27 | 0.09 | (0.88 | ) | (0.79 | ) | (0.13 | ) | (0.03 | ) | (0.16 | ) | 12.32 | (5.82 | ) | 1,302 | 2.30 | 2.30 | 0.79 | 71 | ||||||||||||||||||||||||||||||||||||||||||||||||||
Year ended 12/31/19 | 11.56 | 0.18 | 1.71 | 1.89 | (0.18 | ) | – | (0.18 | ) | 13.27 | 16.40 | 2,781 | 2.34 | 2.34 | 1.44 | 103 | ||||||||||||||||||||||||||||||||||||||||||||||||||||||
Year ended 12/31/18 | 13.13 | 0.17 | (d) | (1.61 | ) | (1.44 | ) | (0.13 | ) | – | (0.13 | ) | 11.56 | (11.08 | ) | 6,782 | 2.34 | 2.34 | 1.32 | (d) | 111 | |||||||||||||||||||||||||||||||||||||||||||||||||
Class R | ||||||||||||||||||||||||||||||||||||||||||||||||||||||||||||||||||||||
Year ended 12/31/22 | 14.58 | 0.88 | (2.66 | ) | (1.78 | ) | (0.88 | ) | – | (0.88 | ) | 11.92 | (12.28 | ) | 1,595 | 1.46 | 1.84 | 7.00 | 97 | |||||||||||||||||||||||||||||||||||||||||||||||||||
Year ended 12/31/21 | 13.04 | 0.45 | 1.44 | 1.89 | (0.35 | ) | – | (0.35 | ) | 14.58 | 14.55 | 1,655 | 1.68 | 1.80 | 3.08 | 115 | ||||||||||||||||||||||||||||||||||||||||||||||||||||||
Year ended 12/31/20 | 14.06 | 0.16 | (0.95 | ) | (0.79 | ) | (0.18 | ) | (0.05 | ) | (0.23 | ) | 13.04 | (5.41 | ) | 1,307 | 1.80 | 1.80 | 1.29 | 71 | ||||||||||||||||||||||||||||||||||||||||||||||||||
Year ended 12/31/19 | 12.25 | 0.26 | 1.81 | 2.07 | (0.26 | ) | – | (0.26 | ) | 14.06 | 16.95 | 1,818 | 1.84 | 1.84 | 1.94 | 103 | ||||||||||||||||||||||||||||||||||||||||||||||||||||||
Year ended 12/31/18 | 13.91 | 0.25 | (d) | (1.71 | ) | (1.46 | ) | (0.20 | ) | – | (0.20 | ) | 12.25 | (10.60 | ) | 1,253 | 1.84 | 1.84 | 1.82 | (d) | 111 | |||||||||||||||||||||||||||||||||||||||||||||||||
Class Y | ||||||||||||||||||||||||||||||||||||||||||||||||||||||||||||||||||||||
Year ended 12/31/22 | 14.59 | 0.94 | (2.66 | ) | (1.72 | ) | (0.95 | ) | – | (0.95 | ) | 11.92 | (11.90 | ) | 3,679 | 0.96 | 1.34 | 7.50 | 97 | |||||||||||||||||||||||||||||||||||||||||||||||||||
Year ended 12/31/21 | 13.05 | 0.52 | 1.45 | 1.97 | (0.43 | ) | – | (0.43 | ) | 14.59 | 15.10 | 2,335 | 1.18 | 1.30 | 3.58 | 115 | ||||||||||||||||||||||||||||||||||||||||||||||||||||||
Year ended 12/31/20 | 14.07 | 0.23 | (0.96 | ) | (0.73 | ) | (0.23 | ) | (0.06 | ) | (0.29 | ) | 13.05 | (4.89 | ) | 2,001 | 1.30 | 1.30 | 1.79 | 71 | ||||||||||||||||||||||||||||||||||||||||||||||||||
Year ended 12/31/19 | 12.26 | 0.33 | 1.80 | 2.13 | (0.32 | ) | – | (0.32 | ) | 14.07 | 17.52 | 2,910 | 1.34 | 1.34 | 2.44 | 103 | ||||||||||||||||||||||||||||||||||||||||||||||||||||||
Year ended 12/31/18 | 13.93 | 0.32 | (d) | (1.72 | ) | (1.40 | ) | (0.27 | ) | – | (0.27 | ) | 12.26 | (10.21 | ) | 2,168 | 1.34 | 1.34 | 2.32 | (d) | 111 | |||||||||||||||||||||||||||||||||||||||||||||||||
Class R5 | ||||||||||||||||||||||||||||||||||||||||||||||||||||||||||||||||||||||
Year ended 12/31/22 | 14.72 | 0.96 | (2.69 | ) | (1.73 | ) | (0.96 | ) | – | (0.96 | ) | 12.03 | (11.87 | ) | 514 | 0.96 | 1.23 | 7.50 | 97 | |||||||||||||||||||||||||||||||||||||||||||||||||||
Year ended 12/31/21 | 13.17 | 0.53 | 1.46 | 1.99 | (0.44 | ) | – | (0.44 | ) | 14.72 | 15.15 | 679 | 1.10 | 1.16 | 3.66 | 115 | ||||||||||||||||||||||||||||||||||||||||||||||||||||||
Year ended 12/31/20 | 14.20 | 0.25 | (0.97 | ) | (0.72 | ) | (0.25 | ) | (0.06 | ) | (0.31 | ) | 13.17 | (4.74 | ) | 557 | 1.16 | 1.16 | 1.93 | 71 | ||||||||||||||||||||||||||||||||||||||||||||||||||
Year ended 12/31/19 | 12.38 | 0.35 | 1.83 | 2.18 | (0.36 | ) | – | (0.36 | ) | 14.20 | 17.69 | 594 | 1.17 | 1.17 | 2.61 | 103 | ||||||||||||||||||||||||||||||||||||||||||||||||||||||
Year ended 12/31/18 | 14.06 | 0.34 | (d) | (1.73 | ) | (1.39 | ) | (0.29 | ) | – | (0.29 | ) | 12.38 | (10.05 | ) | 502 | 1.21 | 1.21 | 2.45 | (d) | 111 | |||||||||||||||||||||||||||||||||||||||||||||||||
Class R6 | ||||||||||||||||||||||||||||||||||||||||||||||||||||||||||||||||||||||
Year ended 12/31/22 | 14.71 | 0.96 | (2.69 | ) | (1.73 | ) | (0.96 | ) | – | (0.96 | ) | 12.02 | (11.89 | ) | 17 | 0.96 | 1.18 | 7.50 | 97 | |||||||||||||||||||||||||||||||||||||||||||||||||||
Year ended 12/31/21 | 13.16 | 0.53 | 1.46 | 1.99 | (0.44 | ) | – | (0.44 | ) | 14.71 | 15.16 | 22 | 1.10 | 1.15 | 3.66 | 115 | ||||||||||||||||||||||||||||||||||||||||||||||||||||||
Year ended 12/31/20 | 14.21 | 0.24 | (0.98 | ) | (0.74 | ) | (0.25 | ) | (0.06 | ) | (0.31 | ) | 13.16 | (4.88 | ) | 19 | 1.16 | 1.16 | 1.93 | 71 | ||||||||||||||||||||||||||||||||||||||||||||||||||
Year ended 12/31/19 | 12.38 | 0.35 | 1.84 | 2.19 | (0.36 | ) | – | (0.36 | ) | 14.21 | 17.77 | 1,494 | 1.17 | 1.17 | 2.61 | 103 | ||||||||||||||||||||||||||||||||||||||||||||||||||||||
Year ended 12/31/18 | 14.06 | 0.34 | (d) | (1.73 | ) | (1.39 | ) | (0.29 | ) | – | (0.29 | ) | 12.38 | (10.03 | ) | 1,483 | 1.20 | 1.20 | 2.46 | (d) | 111 | |||||||||||||||||||||||||||||||||||||||||||||||||
| (a) | Calculated using average shares outstanding. |
| (b) | Includes adjustments in accordance with accounting principles generally accepted in the United States of America and as such, the net asset value for financial reporting purposes and the returns based upon those net asset values may differ from the net asset value and returns for shareholder transactions. Does not include sales charges and is not annualized for periods less than one year, if applicable. |
| (c) | Portfolio turnover is calculated at the fund level and is not annualized for periods less than one year, if applicable. |
| (d) | Net investment income per share and the ratio of net investment income to average net assets includes significant dividends received during the year ended December 31, 2018. Net investment income per share and the ratio of net investment income to average net assets excluding the significant dividends are $0.23 and 1.73%, $0.12 and 0.98%, $0.20 and 1.48%, $0.27 and 1.98%, $0.29 and 2.11% and $0.29 and 2.12% for Class A, Class C, Class R, Class Y, Class R5 and Class R6 shares, respectively. |
See accompanying Notes to Financial Statements which are an integral part of the financial statements.
| 17 Invesco Income Advantage International Fund |
December 31, 2022
NOTE 1–Significant Accounting Policies
Invesco Income Advantage International Fund (the “Fund”) is a series portfolio of AIM Growth Series (Invesco Growth Series) (the “Trust”). The Trust is a Delaware statutory trust registered under the Investment Company Act of 1940, as amended (the “1940 Act”), as an open-end series management investment company authorized to issue an unlimited number of shares of beneficial interest. Information presented in these financial statements pertains only to the Fund. Matters affecting the Fund or each class will be voted on exclusively by the shareholders of the Fund or each class.
The Fund’s investment objective is income and long-term growth of capital.
The Fund currently consists of six different classes of shares: Class A, Class C, Class R, Class Y, Class R5 and Class R6. Class Y shares are available only to certain investors. Class A shares are sold with a front-end sales charge unless certain waiver criteria are met. Under certain circumstances, load waived shares may be subject to contingent deferred sales charges (“CDSC”). Class C shares are sold with a CDSC. Class R, Class Y, Class R5 and Class R6 shares are sold at net asset value. Class C shares held for eight years after purchase are eligible for automatic conversion into Class A shares of the same Fund (the “Conversion Feature”). The automatic conversion pursuant to the Conversion Feature will generally occur at the end of the month following the eighth anniversary after a purchase of Class C shares.
The Fund is an investment company and accordingly follows the investment company accounting and reporting guidance in accordance with Financial Accounting Standards Board Accounting Standards Codification Topic 946, Financial Services – Investment Companies.
The following is a summary of the significant accounting policies followed by the Fund in the preparation of its financial statements.
| A. | Security Valuations – Securities, including restricted securities, are valued according to the following policy. |
A security listed or traded on an exchange is generally valued at its trade price or official closing price that day as of the close of the exchange where the security is principally traded, or lacking any trades or official closing price on a particular day, the security may be valued at the closing bid price on that day. Securities traded in the over-the-counter market are valued based on prices furnished by independent pricing services or market makers. When such securities are valued using prices provided by an independent pricing service they may be considered fair valued. Futures contracts are valued at the daily settlement price set by an exchange on which they are principally traded. U.S. exchange-traded options are valued at the mean between the last bid and asked prices from the exchange on which they are principally traded. Non-U.S. exchange-traded options are valued at the final settlement price set by the exchange on which they trade. Options not listed on an exchange and swaps generally are valued using pricing provided from independent pricing services.
Securities of investment companies that are not exchange-traded (e.g., open-end mutual funds) are valued using such company’s end-of-business-day net asset value per share.
Deposits, other obligations of U.S. and non-U.S. banks and financial institutions are valued at their daily account value.
Fixed income securities (including convertible debt securities) generally are valued on the basis of prices provided by independent pricing services. Prices provided by the pricing service may be determined without exclusive reliance on quoted prices, and may reflect appropriate factors such as institution-size trading in similar groups of securities, developments related to specific securities, dividend rate (for unlisted equities), yield (for debt obligations), quality, type of issue, coupon rate (for debt obligations), maturity (for debt obligations), individual trading characteristics and other market data. Pricing services generally value debt obligations assuming orderly transactions of institutional round lot size, but a fund may hold or transact in the same securities in smaller, odd lot sizes. Odd lots often trade at lower prices than institutional round lots, and their value may be adjusted accordingly. Debt obligations are subject to interest rate and credit risks. In addition, all debt obligations involve some risk of default with respect to interest and/or principal payments.
Foreign securities’ (including foreign exchange contracts) prices are converted into U.S. dollar amounts using the applicable exchange rates as of the close of the New York Stock Exchange (“NYSE”). If market quotations are available and reliable for foreign exchange-traded equity securities, the securities will be valued at the market quotations. Invesco Advisers, Inc. (the “Adviser” or “Invesco”) may use various pricing services to obtain market quotations as well as fair value prices. Because trading hours for certain foreign securities end before the close of the NYSE, closing market quotations may become not representative of market value in the Adviser’s judgment (“unreliable”). If, between the time trading ends on a particular security and the close of the customary trading session on the NYSE, a significant event occurs that makes the closing price of the security unreliable, the Adviser may fair value the security. If the event is likely to have affected the closing price of the security, the security will be valued at fair value in good faith in accordance with Board- approved policies and related Adviser procedures (“Valuation Procedures”). Adjustments to closing prices to reflect fair value may also be based on a screening process of an independent pricing service to indicate the degree of certainty, based on historical data, that the closing price in the principal market where a foreign security trades is not the current value as of the close of the NYSE. Foreign securities’ prices meeting the degree of certainty that the price is not reflective of current value will be priced at the indication of fair value from the independent pricing service. Multiple factors may be considered by the independent pricing service in determining adjustments to reflect fair value and may include information relating to sector indices, American Depositary Receipts and domestic and foreign index futures. Foreign securities may have additional risks including exchange rate changes, potential for sharply devalued currencies and high inflation, political and economic upheaval, the relative lack of issuer information, relatively low market liquidity and the potential lack of strict financial and accounting controls and standards.
Unlisted securities will be valued using prices provided by independent pricing services or by another method that the Adviser, in its judgment, believes better reflects the security’s fair value in accordance with the Valuation Procedures.
Securities for which market prices are not provided by any of the above methods may be valued based upon quotes furnished by independent sources. The last bid price may be used to value equity securities. The mean between the last bid and asked prices may be used to value debt obligations, including corporate loans.
Securities for which market quotations are not readily available are fair valued by the Adviser in accordance with the Valuation Procedures. If a fair value price provided by a pricing service is unreliable, the Adviser will fair value the security using the Valuation Procedures. Issuer specific events, market trends, bid/asked quotes of brokers and information providers and other market data may be reviewed in the course of making a good faith determination of a security’s fair value.
The Fund may invest in securities that are subject to interest rate risk, meaning the risk that the prices will generally fall as interest rates rise and, conversely, the prices will generally rise as interest rates fall. Specific securities differ in their sensitivity to changes in interest rates depending on their individual characteristics. Changes in interest rates may result in increased market volatility, which may affect the value and/or liquidity of certain Fund investments.
Valuations change in response to many factors including the historical and prospective earnings of the issuer, the value of the issuer’s assets, general market conditions which are not specifically related to the particular issuer, such as real or perceived adverse economic conditions, changes in the general outlook for revenues or corporate earnings, changes in interest or currency rates, regional or global instability, natural or environmental disasters, widespread disease or other public health issues, war, acts of terrorism, significant governmental actions or adverse investor sentiment generally and market liquidity. Because of the inherent uncertainties of valuation, the values reflected in the financial statements may materially differ from the value received upon actual sale of those investments.
The price the Fund could receive upon the sale of any investment may differ from the Adviser’s valuation of the investment, particularly for securities that are valued using a fair valuation technique. When fair valuation techniques are applied, the Adviser uses available information, including both observable and unobservable inputs and assumptions, to determine a methodology that will result in a valuation that the Adviser believes approximates market value. Fund securities that are fair valued may be subject to greater fluctuation in their value from one day to the next than would be the case if market quotations were used. Because of the inherent uncertainties of valuation, and the degree of subjectivity in such decisions, the Fund could realize a greater or lesser than expected gain or loss upon the sale of the investment.
| 18 Invesco Income Advantage International Fund |
| B. | Securities Transactions and Investment Income – Securities transactions are accounted for on a trade date basis. Realized gains or losses on sales are computed on the basis of specific identification of the securities sold. Interest income (net of withholding tax, if any) is recorded on an accrual basis from settlement date and includes coupon interest and amortization of premium and accretion of discount on debt securities as applicable. Dividend income (net of withholding tax, if any) is recorded on the ex-dividend date. |
The Fund may periodically participate in litigation related to Fund investments. As such, the Fund may receive proceeds from litigation settlements.Any proceeds received are included in the Statement of Operations as realized gain (loss) for investments no longer held and as unrealized gain (loss) for investments still held.
Brokerage commissions and mark ups are considered transaction costs and are recorded as an increase to the cost basis of securities purchased and/or a reduction of proceeds on a sale of securities. Such transaction costs are included in the determination of net realized and unrealized gain (loss) from investment securities reported in the Statement of Operations and the Statement of Changes in Net Assets and the net realized and unrealized gains (losses) on securities per share in the Financial Highlights. Transaction costs are included in the calculation of the Fund’s net asset value and, accordingly, they reduce the Fund’s total returns. These transaction costs are not considered operating expenses and are not reflected in net investment income reported in the Statement of Operations and the Statement of Changes in Net Assets, or the net investment income per share and the ratios of expenses and net investment income reported in the Financial Highlights, nor are they limited by any expense limitation arrangements between the Fund and the investment adviser.
The Fund allocates income and realized and unrealized capital gains and losses to a class based on the relative net assets of each class.
| C. | Country Determination – For the purposes of making investment selection decisions and presentation in the Schedule of Investments, the investment adviser may determine the country in which an issuer is located and/or credit risk exposure based on various factors. These factors include the laws of the country under which the issuer is organized, where the issuer maintains a principal office, the country in which the issuer derives 50% or more of its total revenues, the country that has the primary market for the issuer’s securities and its “country of risk” as determined by a third party service provider, as well as other criteria. Among the other criteria that may be evaluated for making this determination are the country in which the issuer maintains 50% or more of its assets, the type of security, financial guarantees and enhancements, the nature of the collateral and the sponsor organization. Country of issuer and/or credit risk exposure has been determined to be the United States of America, unless otherwise noted. |
| D. | Distributions – Distributions from net investment income, if any, are declared and paid monthly. Distributions from net realized capital gain, if any, are generally declared and paid annually and recorded on the ex-dividend date. The Fund may elect to treat a portion of the proceeds from redemptions as distributions for federal income tax purposes. |
| E. | Federal Income Taxes – The Fund intends to comply with the requirements of Subchapter M of the Internal Revenue Code of 1986, as amended (the “Internal Revenue Code”), necessary to qualify as a regulated investment company and to distribute substantially all of the Fund’s taxable earnings to shareholders. As such, the Fund will not be subject to federal income taxes on otherwise taxable income (including net realized capital gain) that is distributed to shareholders. Therefore, no provision for federal income taxes is recorded in the financial statements. |
The Fund recognizes the tax benefits of uncertain tax positions only when the position is more likely than not to be sustained. Management has analyzed the Fund’s uncertain tax positions and concluded that no liability for unrecognized tax benefits should be recorded related to uncertain tax positions. Management is not aware of any tax positions for which it is reasonably possible that the total amounts of unrecognized tax benefits will change materially in the next 12 months.
The Fund files tax returns in the U.S. Federal jurisdiction and certain other jurisdictions. Generally, the Fund is subject to examinations by such taxing authorities for up to three years after the filing of the return for the tax period.
| F. | Expenses – Fees provided for under the Rule 12b-1 plan of a particular class of the Fund are charged to the operations of such class. Transfer agency fees and expenses and other shareholder recordkeeping fees and expenses attributable to Class R5 and Class R6 are allocated based on relative net assets of Class R5 and Class R6. Sub-accounting fees attributable to Class R5 are charged to the operations of the class. Transfer agency fees and expenses and other shareholder recordkeeping fees and expenses relating to all other classes are allocated among those classes based on relative net assets. All other expenses are allocated among the classes based on relative net assets. |
| G. | Accounting Estimates – The preparation of financial statements in conformity with accounting principles generally accepted in the United States of America (“GAAP”) requires management to make estimates and assumptions that affect the reported amounts of assets and liabilities at the date of the financial statements and the reported amounts of revenues and expenses during the reporting period including estimates and assumptions related to taxation. Actual results could differ from those estimates by a significant amount. In addition, the Fund monitors for material events or transactions that may occur or become known after the period-end date and before the date the financial statements are released to print. |
| H. | Indemnifications – Under the Trust’s organizational documents, each Trustee, officer, employee or other agent of the Trust is indemnified against certain liabilities that may arise out of the performance of their duties to the Fund. Additionally, in the normal course of business, the Fund enters into contracts, including the Fund’s servicing agreements, that contain a variety of indemnification clauses. The Fund’s maximum exposure under these arrangements is unknown as this would involve future claims that may be made against the Fund that have not yet occurred. The risk of material loss as a result of such indemnification claims is considered remote. |
| I. | Equity-Linked Notes – The Fund may invest in Equity-Linked Notes (ELNs). ELNs are hybrid derivative-type instruments, in a single note form, that are specially designed to combine the characteristics of one or more reference securities (such as a single stock, an exchange traded fund, exchange-traded note, or an index or basket of securities (underlying securities)) and a related equity derivative, such as a put or call option. Generally, when purchasing an ELN, the Fund pays the counterparty the current value of the underlying securities plus a commission. Upon the maturity of the note, the Fund generally receives the par value of the note plus a return based on the appreciation of the underlying securities. Investments in ELNs possess the risks associated with the underlying securities, such as management risk, market risk and, as applicable, foreign securities and currency risks. In addition, as a note, ELNs are also subject to certain debt securities risks, such as interest rate and credit risk. An investment in an ELN also bears the risk that the ELN issuer will default or become bankrupt. In such an event, the Fund may have difficulty being repaid, or fail to be repaid, the principal amount of, or income from, its investment. As the holder of an ELN, the Fund generally has no rights to the underlying securities, including no voting rights or rights to receive dividends. Should the prices of the underlying securities move in an unexpected manner, the Fund may not achieve the anticipated benefits of its ELN investments, and it may realize losses, which could be significant and could include the Fund’s entire principal investment. |
| J. | Securities Lending – The Fund may lend portfolio securities having a market value up to one-third of the Fund’s total assets. Such loans are secured by collateral equal to no less than the market value of the loaned securities determined daily by the securities lending provider. Such collateral will be cash or debt securities issued or guaranteed by the U.S. Government or any of its sponsored agencies. Cash collateral received in connection with these loans is invested in short-term money market instruments or affiliated, unregistered investment companies that comply with Rule 2a-7 under the 1940 Act and money market funds (collectively, “affiliated money market funds”) and is shown as such on the Schedule of Investments. The Fund bears the risk of loss with respect to the investment of collateral. It is the Fund’s policy to obtain additional collateral from or return excess collateral to the borrower by the end of the next business day, following the valuation date of the securities loaned. Therefore, the value of the collateral held may be temporarily less than the value of the securities on loan. When loaning securities, the Fund retains certain benefits of owning the securities, including the economic equivalent of dividends or interest generated by the security. Lending securities entails a risk of loss to the Fund if, and to the extent that, the market value of the securities loaned were to increase and the borrower did not increase the collateral accordingly, and the borrower failed to return the securities. The securities loaned are subject to termination at the option of the borrower or the Fund. Upon termination, the borrower will return to the Fund the securities loaned and the Fund will return the collateral. Upon the failure of the borrower to return the securities, collateral may be liquidated and the securities may be purchased on the open market to replace the loaned securities. The Fund |
| 19 Invesco Income Advantage International Fund |
could experience delays and costs in gaining access to the collateral and the securities may lose value during the delay which could result in potential losses to the Fund. Some of these losses may be indemnified by the lending agent. The Fund bears the risk of any deficiency in the amount of the collateral available for return to the borrower due to any loss on the collateral invested. Dividends received on cash collateral investments for securities lending transactions, which are net of compensation to counterparties, are included in Dividends from affiliated money market funds on the Statement of Operations. The aggregate value of securities out on loan, if any, is shown as a footnote on the Statement of Assets and Liabilities. |
The Adviser serves as an affiliated securities lending agent for the Fund. The Bank of New York Mellon also serves as a lending agent. To the extent the Fund utilizes the Adviser as an affiliated securities lending agent, the Fund conducts its securities lending in accordance with, and in reliance upon, no-action letters issued by the SEC staff that provide guidance on how an affiliate may act as a direct agent lender and receive compensation for those services in a manner consistent with the federal securities laws. For the year ended December 31, 2022, fees paid to the Adviser were less than $500. Fees paid to the Adviser for securities lending agent services, if any, are included in Dividends from affiliated money market funds on the Statement of Operations.
| K. | Foreign Currency Translations – Foreign currency is valued at the close of the NYSE based on quotations posted by banks and major currency dealers. Portfolio securities and other assets and liabilities denominated in foreign currencies are translated into U.S. dollar amounts at the date of valuation. Purchases and sales of portfolio securities (net of foreign taxes withheld on disposition) and income items denominated in foreign currencies are translated into U.S. dollar amounts on the respective dates of such transactions. The Fund does not separately account for the portion of the results of operations resulting from changes in foreign exchange rates on investments and the fluctuations arising from changes in market prices of securities held. The combined results of changes in foreign exchange rates and the fluctuation of market prices on investments (net of estimated foreign tax withholding) are included with the net realized and unrealized gain or loss from investments in the Statement of Operations. Reported net realized foreign currency gains or losses arise from (1) sales of foreign currencies, (2) currency gains or losses realized between the trade and settlement dates on securities transactions, and (3) the difference between the amounts of dividends, interest, and foreign withholding taxes recorded on the Fund’s books and the U.S. dollar equivalent of the amounts actually received or paid. Net unrealized foreign currency gains and losses arise from changes in the fair values of assets and liabilities, other than investments in securities at fiscal period end, resulting from changes in exchange rates. |
The Fund may invest in foreign securities, which may be subject to foreign taxes on income, gains on investments or currency repatriation, a portion of which may be recoverable. Foreign taxes, if any, are recorded based on the tax regulations and rates that exist in the foreign markets in which the Fund invests and are shown in the Statement of Operations.
| L. | Forward Foreign Currency Contracts – The Fund may engage in foreign currency transactions either on a spot (i.e. for prompt delivery and settlement) basis, or through forward foreign currency contracts, to manage or minimize currency or exchange rate risk. |
The Fund may also enter into forward foreign currency contracts for the purchase or sale of a security denominated in a foreign currency in order to “lock in” the U.S. dollar price of that security, or the Fund may also enter into forward foreign currency contracts that do not provide for physical exchange of the two currencies on the settlement date, but instead are settled by a single cash payment calculated as the difference between the agreed upon exchange rate and the spot rate at settlement based upon an agreed upon notional amount (non-deliverable forwards).
A forward foreign currency contract is an obligation between two parties (“Counterparties”) to purchase or sell a specific currency for an agreed-upon price at a future date. The use of forward foreign currency contracts for hedging does not eliminate fluctuations in the price of the underlying securities the Fund owns or intends to acquire but establishes a rate of exchange in advance. Fluctuations in the value of these contracts are measured by the difference in the contract date and reporting date exchange rates and are recorded as unrealized appreciation (depreciation) until the contracts are closed. When the contracts are closed, realized gains (losses) are recorded. Realized and unrealized gains (losses) on the contracts are included in the Statement of Operations. The primary risks associated with forward foreign currency contracts include failure of the Counterparty to meet the terms of the contract and the value of the foreign currency changing unfavorably. These risks may be in excess of the amounts reflected in the Statement of Assets and Liabilities.
| M. | Futures Contracts – The Fund may enter into futures contracts to manage exposure to interest rate, equity and market price movements and/or currency risks. A futures contract is an agreement between Counterparties to purchase or sell a specified underlying security, currency or commodity (or delivery of a cash settlement price, in the case of an index future) for a fixed price at a future date. The Fund currently invests only in exchange-traded futures and they are standardized as to maturity date and underlying financial instrument. Initial margin deposits required upon entering into futures contracts are satisfied by the segregation of specific securities or cash as collateral at the futures commission merchant (broker). During the period the futures contracts are open, changes in the value of the contracts are recognized as unrealized gains or losses by recalculating the value of the contracts on a daily basis. Subsequent or variation margin payments are received or made depending upon whether unrealized gains or losses are incurred. These amounts are reflected as receivables or payables on the Statement of Assets and Liabilities. When the contracts are closed or expire, the Fund recognizes a realized gain or loss equal to the difference between the proceeds from, or cost of, the closing transaction and the Fund’s basis in the contract. The net realized gain (loss) and the change in unrealized gain (loss) on futures contracts held during the period is included on the Statement of Operations. The primary risks associated with futures contracts are market risk and the absence of a liquid secondary market. If the Fund were unable to liquidate a futures contract and/or enter into an offsetting closing transaction, the Fund would continue to be subject to market risk with respect to the value of the contracts and continue to be required to maintain the margin deposits on the futures contracts. Futures contracts have minimal Counterparty risk since the exchange’s clearinghouse, as Counterparty to all exchange-traded futures, guarantees the futures against default. Risks may exceed amounts recognized in the Statement of Assets and Liabilities. |
| N. | COVID-19 Risk - The COVID-19 strain of coronavirus has resulted in instances of market closures and dislocations, extreme volatility, liquidity constraints and increased trading costs. Efforts to contain its spread have resulted in travel restrictions, disruptions of healthcare systems, business operations (including business closures) and supply chains, layoffs, lower consumer demand and employee availability, and defaults and credit downgrades, among other significant economic impacts that have disrupted global economic activity across many industries. Such economic impacts may exacerbate other pre-existing political, social and economic risks locally or globally and cause general concern and uncertainty. The full economic impact and ongoing effects of COVID-19 (or other future epidemics or pandemics) at the macro-level and on individual businesses are unpredictable and may result in significant and prolonged effects on the Fund’s performance. |
| 20 Invesco Income Advantage International Fund |
NOTE 2–Advisory Fees and Other Fees Paid to Affiliates
The Trust has entered into a master investment advisory agreement with the Adviser. Under the terms of the investment advisory agreement, the Fund accrues daily and pays monthly an advisory fee to the Adviser based on the annual rate of the Fund’s average daily net assets as follows:
Average Daily Net Assets | Rate | |
First $ 250 million | 0.750% | |
Next $250 million | 0.730% | |
Next $500 million | 0.710% | |
Next $1.5 billion | 0.690% | |
Next $2.5 billion | 0.670% | |
Next $2.5 billion | 0.650% | |
Next $2.5 billion | 0.630% | |
Over $10 billion | 0.610% |
For the year ended December 31, 2022, the effective advisory fee rate incurred by the Fund was 0.75%.
Under the terms of a master sub-advisory agreement between the Adviser and each of Invesco Asset Management Deutschland GmbH, Invesco Asset Management Limited, Invesco Asset Management (Japan) Limited, Invesco Hong Kong Limited, Invesco Senior Secured Management, Inc. and Invesco Canada Ltd. (collectively, the “Affiliated Sub-Advisers”) the Adviser, not the Fund, will pay 40% of the fees paid to the Adviser to any such Affiliated Sub-Adviser(s) that provide(s) discretionary investment management services to the Fund based on the percentage of assets allocated to such Affiliated Sub-Adviser(s).
The Adviser has contractually agreed, through at least April 30, 2024, to waive advisory fees and/or reimburse expenses of all shares to the extent necessary to limit total annual fund operating expenses after fee waiver and/or expense reimbursement (excluding certain items discussed below) of Class A, Class C, Class R, Class Y, Class R5 and Class R6 shares to shares to 1.23%, 1.98%, 1.48%, 0.98%, 0.98% and 0.98% respectively, of the Fund’s average daily net assets (the “expense limits”). In determining the Adviser’s obligation to waive advisory fees and/or reimburse expenses, the following expenses are not taken into account, and could cause the total annual fund operating expenses after fee waiver and/or expense reimbursement to exceed the numbers reflected above: (1) interest; (2) taxes; (3) dividend expense on short sales; (4) extraordinary or non-routine items, including litigation expenses; and (5) expenses that the Fund has incurred but did not actually pay because of an expense offset arrangement. Unless Invesco continues the fee waiver agreement, it will terminate on April 30, 2024. During its term, the fee waiver agreement cannot be terminated or amended to increase the expense limits or reduce the advisory fee waiver without approval of the Board of Trustees.
Further, the Adviser has contractually agreed, through at least June 30, 2024, to waive the advisory fee payable by the Fund in an amount equal to 100% of the net advisory fees the Adviser receives from the affiliated money market funds on investments by the Fund of uninvested cash (excluding investments of cash collateral from securities lending) in such affiliated money market funds.
For the year ended December 31, 2022, the Adviser waived advisory fees of $106,168 and reimbursed class level expenses of $112,200, $2,080, $3,249, $6,945, $526 and $8 of Class A, Class C, Class R, Class Y, Class R5 and Class R6 shares, respectively.
The Trust has entered into a master administrative services agreement with Invesco pursuant to which the Fund has agreed to pay Invesco for certain administrative costs incurred in providing accounting services to the Fund. For the year ended December 31, 2022, expenses incurred under the agreement are shown in the Statement of Operations as Administrative services fees. Invesco has entered into a sub-administration agreement whereby State Street Bank and Trust Company (“SSB”) serves as fund accountant and provides certain administrative services to the Fund. Pursuant to a custody agreement with the Trust on behalf of the Fund, SSB also serves as the Fund’s custodian.
The Trust has entered into a transfer agency and service agreement with Invesco Investment Services, Inc. (“IIS”) pursuant to which the Fund has agreed to pay IIS a fee for providing transfer agency and shareholder services to the Fund and reimburse IIS for certain expenses incurred by IIS in the course of providing such services. IIS may make payments to intermediaries that provide omnibus account services, sub-accounting services and/or networking services. All fees payable by IIS to intermediaries that provide omnibus account services or sub-accounting services are charged back to the Fund, subject to certain limitations approved by the Trust’s Board of Trustees. For the year ended December 31, 2022, expenses incurred under the agreement are shown in the Statement of Operations as Transfer agent fees.
The Trust has entered into master distribution agreements with Invesco Distributors, Inc. (“IDI”) to serve as the distributor for the Class A, Class C, Class R, Class Y, Class R5 and Class R6 shares of the Fund. The Trust has adopted plans pursuant to Rule 12b-1 under the 1940 Act with respect to the Fund’s Class A, Class C and Class R shares (collectively, the “Plans”). The Fund, pursuant to the Plans, pays IDI compensation at the annual rate of 0.25% of the Fund’s average daily net assets of Class A shares, 1.00% of the average daily net assets of Class C shares and 0.50% of the average daily net assets of Class R shares. The fees are accrued daily and paid monthly. Of the Plan payments, up to 0.25% of the average daily net assets of each class of shares may be paid to furnish continuing personal shareholder services to customers who purchase and own shares of such classes. Any amounts not paid as a service fee under the Plans would constitute an asset-based sales charge. Rules of the Financial Industry Regulatory Authority (“FINRA”) impose a cap on the total sales charges, including asset-based sales charges, that may be paid by any class of shares of the Fund. For the year ended December 31, 2022, expenses incurred under the Plans are shown in the Statement of Operations as Distribution fees.
Front-end sales commissions and CDSC (collectively, the “sales charges”) are not recorded as expenses of the Fund. Front-end sales commissions are deducted from proceeds from the sales of Fund shares prior to investment in Class A shares of the Fund. CDSC are deducted from redemption proceeds prior to remittance to the shareholder. During the year ended December 31, 2022, IDI advised the Fund that IDI retained $2,474 in front-end sales commissions from the sale of Class A shares and $10 and $94 from Class A and Class C shares, respectively, for CDSC imposed upon redemptions by shareholders.
Certain officers and trustees of the Trust are officers and directors of the Adviser, IIS and/or IDI.
NOTE 3–Additional Valuation Information
GAAP defines fair value as the price that would be received to sell an asset or paid to transfer a liability in an orderly transaction between market participants at the measurement date, under current market conditions. GAAP establishes a hierarchy that prioritizes the inputs to valuation methods, giving the highest priority to readily available unadjusted quoted prices in an active market for identical assets (Level 1) and the lowest priority to significant unobservable inputs (Level 3), generally when market prices are not readily available. Based on the valuation inputs, the securities or other investments are tiered into one of three levels. Changes in valuation methods may result in transfers in or out of an investment’s assigned level:
| Level 1 | – | Prices are determined using quoted prices in an active market for identical assets. | ||
| Level 2 | – | Prices are determined using other significant observable inputs. Observable inputs are inputs that other market participants may use in pricing a security. These may include quoted prices for similar securities, interest rates, prepayment speeds, credit risk, yield curves, loss severities, default rates, discount rates, volatilities and others. | ||
| Level 3 | – | Prices are determined using significant unobservable inputs. In situations where quoted prices or observable inputs are unavailable (for example, when there is little or no market activity for an investment at the end of the period), unobservable inputs may be used. Unobservable inputs reflect the Adviser’s assumptions about the factors market participants would use in determining fair value of the securities or instruments and would be based on the best available information. |
| 21 Invesco Income Advantage International Fund |
The following is a summary of the tiered valuation input levels, as of December 31, 2022. The level assigned to the securities valuations may not be an indication of the risk or liquidity associated with investing in those securities. Because of the inherent uncertainties of valuation, the values reflected in the financial statements may materially differ from the value received upon actual sale of those investments.
| Level 1 | Level 2 | Level 3 | Total | |||||
Investments in Securities | ||||||||
Australia | $ – | $ 1,658,907 | $– | $ 1,658,907 | ||||
Belgium | – | 265,809 | – | 265,809 | ||||
Brazil | 10 | 764,810 | – | 764,820 | ||||
Canada | 3,053,417 | 5,684,029 | – | 8,737,446 | ||||
Chile | 15,527 | 1,857 | – | 17,384 | ||||
China | 267,735 | 1,375,313 | – | 1,643,048 | ||||
Denmark | – | 900,435 | – | 900,435 | ||||
Finland | – | 165,066 | – | 165,066 | ||||
France | – | 5,887,334 | – | 5,887,334 | ||||
Germany | – | 1,495,734 | – | 1,495,734 | ||||
Greece | – | 113,933 | – | 113,933 | ||||
Hong Kong | – | 486,046 | – | 486,046 | ||||
Hungary | – | 54,029 | – | 54,029 | ||||
India | 101,941 | 160,743 | – | 262,684 | ||||
Indonesia | – | 124,162 | – | 124,162 | ||||
Ireland | – | 191,832 | – | 191,832 | ||||
Israel | 51,725 | 49,606 | – | 101,331 | ||||
Italy | – | 144,150 | – | 144,150 | ||||
Japan | – | 4,954,765 | – | 4,954,765 | ||||
Kuwait | – | 85,840 | – | 85,840 | ||||
Luxembourg | – | 97,237 | – | 97,237 | ||||
Malaysia | – | 88,681 | – | 88,681 | ||||
Mexico | 88,757 | – | – | 88,757 | ||||
Netherlands | 15,659 | 1,113,456 | – | 1,129,115 | ||||
New Zealand | – | 13,944 | – | 13,944 | ||||
Norway | – | 184,969 | – | 184,969 | ||||
Philippines | – | 46,805 | – | 46,805 | ||||
Poland | – | 20,329 | – | 20,329 | ||||
Portugal | – | 2,897 | – | 2,897 | ||||
Qatar | – | 207,471 | – | 207,471 | ||||
Russia | – – | 0 | 0 | |||||
Singapore | – | 1,773 | – | 1,773 | ||||
South Africa | – | 439,026 | – | 439,026 | ||||
South Korea | – | 806,922 | – | 806,922 | ||||
Spain | – | 650,877 | – | 650,877 | ||||
Sweden | – | 457,379 | – | 457,379 | ||||
Switzerland | – | 2,973,397 | – | 2,973,397 | ||||
Taiwan | – | 1,052,832 | – | 1,052,832 | ||||
Thailand | – | 116,674 | – | 116,674 | ||||
Turkey | – | 170,344 | – | 170,344 | ||||
United Arab Emirates | – | 268,860 | – | 268,860 | ||||
United Kingdom | 15,656 | 3,713,900 | – | 3,729,556 | ||||
United States | 37,446 | 5,134,609 | – | 5,172,055 | ||||
Money Market Funds | 11,210,367 | 58,860 | – | 11,269,227 | ||||
Total Investments in Securities | 14,858,240 | 42,185,642 | 0 | 57,043,882 | ||||
Other Investments - Liabilities* | ||||||||
Futures Contracts | (2,552) | – | – | (2,552) | ||||
Total Investments | $14,855,688 | $42,185,642 | $0 | $57,041,330 |
| * | Unrealized appreciation (depreciation). |
NOTE 4–Derivative Investments
The Fund may enter into an International Swaps and Derivatives Association Master Agreement (“ISDA Master Agreement”) under which a fund may trade OTC derivatives. An OTC transaction entered into under an ISDA Master Agreement typically involves a collateral posting arrangement, payment netting provisions and close-out netting provisions. These netting provisions allow for reduction of credit risk through netting of contractual obligations. The enforceability of the netting provisions of the ISDA Master Agreement depends on the governing law of the ISDA Master Agreement, among other factors.
For financial reporting purposes, the Fund does not offset OTC derivative assets or liabilities that are subject to ISDA Master Agreements in the Statement of Assets and Liabilities.
| 22 Invesco Income Advantage International Fund |
Value of Derivative Investments at Period-End
The table below summarizes the value of the Fund’s derivative investments, detailed by primary risk exposure, held as of December 31, 2022:
| Value | ||||
| Derivative Liabilities | Equity Risk | |||
Unrealized depreciation on futures contracts – Exchange-Traded(a) | $ | (2,552 | ) | |
Derivatives not subject to master netting agreements | 2,552 | |||
Total Derivative Liabilities subject to master netting agreements | $ | – | ||
| (a) | The daily variation margin receivable (payable) at period end is recorded in the Statement of Assets and Liabilities. |
Effect of Derivative Investments for the year ended December 31, 2022
The table below summarizes the gains (losses) on derivative investments, detailed by primary risk exposure, recognized in earnings during the period:
| Location of Gain (Loss) on Statement of Operations | ||||||||||||
| Currency Risk | Equity Risk | Total | ||||||||||
| ||||||||||||
Realized Gain (Loss): | ||||||||||||
Forward foreign currency contracts | $(825) | $ | - | $ | (825 | ) | ||||||
| ||||||||||||
Futures contracts | - | (264,290 | ) | (264,290 | ) | |||||||
| ||||||||||||
Change in Net Unrealized Appreciation (Depreciation): | ||||||||||||
Futures contracts | - | (2,552 | ) | (2,552 | ) | |||||||
| ||||||||||||
Total | $(825) | $ | (266,842 | ) | $ | (267,667 | ) | |||||
| ||||||||||||
The table below summarizes the average notional value of derivatives held during the period.
| Forward Foreign Currency Contracts | Futures Contracts | |||||
Average notional value | $52,821 | $1,526,720 | ||||
NOTE 5–Expense Offset Arrangement(s)
The expense offset arrangement is comprised of transfer agency credits which result from balances in demand deposit accounts used by the transfer agent for clearing shareholder transactions. For the year ended December 31, 2022, the Fund received credits from this arrangement, which resulted in the reduction of the Fund’s total expenses of $1,343.
NOTE 6–Trustees’ and Officers’ Fees and Benefits
Trustees’ and Officers’ Fees and Benefits include amounts accrued by the Fund to pay remuneration to certain Trustees and Officers of the Fund. Trustees have the option to defer compensation payable by the Fund, and Trustees’ and Officers’ Fees and Benefits also include amounts accrued by the Fund to fund such deferred compensation amounts. Those Trustees who defer compensation have the option to select various Invesco Funds in which their deferral accounts shall be deemed to be invested. Finally, certain current Trustees were eligible to participate in a retirement plan that provided for benefits to be paid upon retirement to Trustees over a period of time based on the number of years of service. The Fund may have certain former Trustees who also participate in a retirement plan and receive benefits under such plan. Trustees’ and Officers’ Fees and Benefits include amounts accrued by the Fund to fund such retirement benefits. Obligations under the deferred compensation and retirement plans represent unsecured claims against the general assets of the Fund.
NOTE 7–Cash Balances
The Fund is permitted to temporarily carry a negative or overdrawn balance in its account with SSB, the custodian bank. Such balances, if any at period-end, are shown in the Statement of Assets and Liabilities under the payable caption Amount due custodian. To compensate the custodian bank for such overdrafts, the overdrawn Fund may either (1) leave funds as a compensating balance in the account so the custodian bank can be compensated by earning the additional interest; or (2) compensate by paying the custodian bank at a rate agreed upon by the custodian bank and Invesco, not to exceed the contractually agreed upon rate. The Fund may not purchase additional securities when any borrowings from banks or broker-dealers exceed 5% of the Fund’s total assets, or when any borrowings from an Invesco Fund are outstanding.
NOTE 8–Distributions to Shareholders and Tax Components of Net Assets
Tax Character of Distributions to Shareholders Paid During the Fiscal Years Ended December 31, 2022 and 2021:
| 2022 | 2021 | |||||||
Ordinary income* | $ | 4,449,715 | $ | 1,897,215 | ||||
* Includes short-term capital gain distributions, if any. | ||||||||
| 23 Invesco Income Advantage International Fund |
Tax Components of Net Assets at Period-End:
| 2022 | ||||
| ||||
Undistributed ordinary income | $ | 440,903 | ||
| ||||
Net unrealized appreciation (depreciation) – investments | (1,423,952 | ) | ||
| ||||
Net unrealized appreciation (depreciation) – foreign currencies | (1,550 | ) | ||
| ||||
Temporary book/tax differences | (42,808 | ) | ||
| ||||
Capital loss carryforward | (12,034,740 | ) | ||
| ||||
Shares of beneficial interest | 70,631,807 | |||
| ||||
Total net assets | $ | 57,569,660 | ||
| ||||
The difference between book-basis and tax-basis unrealized appreciation (depreciation) is due to differences in the timing of recognition of gains and losses on investments for tax and book purposes. The Fund’s net unrealized appreciation (depreciation) difference is attributable primarily to wash sales and passive foreign investment companies.
The temporary book/tax differences are a result of timing differences between book and tax recognition of income and/or expenses. The Fund’s temporary book/tax differences are the result of the trustee deferral of compensation and retirement plan benefits.
Capital loss carryforward is calculated and reported as of a specific date. Results of transactions and other activity after that date may affect the amount of capital loss carryforward actually available for the Fund to utilize. The ability to utilize capital loss carryforward in the future may be limited under the Internal Revenue Code and related regulations based on the results of future transactions.
The Fund has a capital loss carryforward as of December 31, 2022, as follows:
Capital Loss Carryforward* | ||||||||||
| ||||||||||
| Expiration | Short-Term | Long-Term | Total | |||||||
| ||||||||||
Not subject to expiration | $ | 10,779,572 | $1,255,168 | $ | 12,034,740 | |||||
| ||||||||||
| * | Capital loss carryforward is reduced for limitations, if any, to the extent required by the Internal Revenue Code and may be further limited depending upon a variety of factors, including the realization of net unrealized gains or losses as of the date of any reorganization. |
NOTE 9–Investment Transactions
The aggregate amount of investment securities (other than short-term securities, U.S. Government obligations and money market funds, if any) purchased and sold by the Fund during the year ended December 31, 2022 was $31,624,487 and $31,938,314, respectively. Cost of investments, including any derivatives, on a tax basis includes the adjustments for financial reporting purposes as of the most recently completed federal income tax reporting period-end.
| Unrealized Appreciation (Depreciation) of Investments on a Tax Basis | ||||
| ||||
Aggregate unrealized appreciation of investments | $ | 1,871,426 | ||
| ||||
Aggregate unrealized (depreciation) of investments | (3,295,378 | ) | ||
| ||||
Net unrealized appreciation (depreciation) of investments | $ | (1,423,952 | ) | |
| ||||
Cost of investments for tax purposes is $58,465,282.
NOTE 10–Reclassification of Permanent Differences
Primarily as a result of differing book/tax treatment of passive foreign investment companies and foreign currency transactions, on December 31, 2022, undistributed net investment income was decreased by $272,043 and undistributed net realized gain (loss) was increased by $272,043. This reclassification had no effect on the net assets or the distributable earnings (loss) of the Fund.
NOTE 11–Share Information
| Summary of Share Activity | ||||||||||||||||
| ||||||||||||||||
| Year ended | Year ended | |||||||||||||||
| December 31, 2022(a) | December 31, 2021 | |||||||||||||||
| Shares | Amount | Shares | Amount | |||||||||||||
| ||||||||||||||||
Sold: | ||||||||||||||||
Class A | 112,648 | $ | 1,482,722 | 269,293 | $ | 3,817,303 | ||||||||||
| ||||||||||||||||
Class C | 15,946 | 190,876 | 22,642 | 303,273 | ||||||||||||
| ||||||||||||||||
Class R | 19,730 | 262,615 | 23,072 | 327,618 | ||||||||||||
| ||||||||||||||||
Class Y | 159,553 | 2,150,970 | 49,164 | 719,534 | ||||||||||||
| ||||||||||||||||
Class R5 | 2,853 | 35,376 | 4,310 | 63,093 | ||||||||||||
| ||||||||||||||||
Issued as reinvestment of dividends: | ||||||||||||||||
Class A | 288,224 | 3,605,512 | 109,388 | 1,593,558 | ||||||||||||
| ||||||||||||||||
Class C | 5,157 | 60,985 | 1,590 | 21,914 | ||||||||||||
| ||||||||||||||||
Class R | 8,788 | 109,606 | 2,646 | 38,642 | ||||||||||||
| ||||||||||||||||
Class Y | 19,956 | 246,887 | 3,828 | 55,912 | ||||||||||||
| ||||||||||||||||
Class R5 | 3,418 | 43,278 | 1,328 | 19,571 | ||||||||||||
| ||||||||||||||||
Class R6 | 4 | 58 | 14 | 205 | ||||||||||||
| ||||||||||||||||
| 24 Invesco Income Advantage International Fund |
| Summary of Share Activity | ||||||||
| ||||||||
| Year ended | Year ended | |||||||||||||||
| December 31, 2022(a) | December 31, 2021 | |||||||||||||||
| Shares | Amount | Shares | Amount | |||||||||||||
| ||||||||||||||||
Automatic conversion of Class C shares to Class A shares: | ||||||||||||||||
Class A | 11,730 | $ | 144,450 | 22,389 | $ | 313,468 | ||||||||||
| ||||||||||||||||
Class C | (12,403 | ) | (144,450 | ) | (23,693 | ) | (313,468 | ) | ||||||||
| ||||||||||||||||
Reacquired: | ||||||||||||||||
Class A | (543,804 | ) | (6,850,001 | ) | (767,767 | ) | (11,027,124 | ) | ||||||||
| ||||||||||||||||
Class C | (10,617 | ) | (124,043 | ) | (20,837 | ) | (285,811 | ) | ||||||||
| ||||||||||||||||
Class R | (8,171 | ) | (104,080 | ) | (12,393 | ) | (177,680 | ) | ||||||||
| ||||||||||||||||
Class Y | (30,933 | ) | (382,101 | ) | (46,278 | ) | (652,702 | ) | ||||||||
| ||||||||||||||||
Class R5 | (9,713 | ) | (121,396 | ) | (1,763 | ) | (25,282 | ) | ||||||||
| ||||||||||||||||
Class R6 | (95 | ) | (1,135 | ) | - | - | ||||||||||
| ||||||||||||||||
Net increase (decrease) in share activity | 32,271 | $ | 606,129 | (363,067 | ) | $ | (5,207,976 | ) | ||||||||
| ||||||||||||||||
| (a) | There are entities that are record owners of more than 5% of the outstanding shares of the Fund and in the aggregate own 14% of the outstanding shares of the Fund. IDI has an agreement with these entities to sell Fund shares. The Fund, Invesco and/or Invesco affiliates may make payments to these entities, which are considered to be related to the Fund, for providing services to the Fund, Invesco and/or Invesco affiliates including but not limited to services such as securities brokerage, distribution, third party record keeping and account servicing. The Fund has no knowledge as to whether all or any portion of the shares owned of record by these entities are also owned beneficially. |
| 25 Invesco Income Advantage International Fund |
Report of Independent Registered Public Accounting Firm
To the Board of Trustees of AIM Growth Series (Invesco Growth Series) and Shareholders of Invesco Income Advantage International Fund
Opinion on the Financial Statements
We have audited the accompanying statement of assets and liabilities, including the schedule of investments, of Invesco Income Advantage International Fund (one of the funds constituting AIM Growth Series (Invesco Growth Series), referred to hereafter as the “Fund”) as of December 31, 2022, the related statement of operations for the year ended December 31, 2022, the statement of changes in net assets for each of the two years in the period ended December 31, 2022, including the related notes, and the financial highlights for each of the five years in the period ended December 31, 2022 (collectively referred to as the “financial statements”). In our opinion, the financial statements present fairly, in all material respects, the financial position of the Fund as of December 31, 2022, the results of its operations for the year then ended, the changes in its net assets for each of the two years in the period ended December 31, 2022 and the financial highlights for each of the five years in the period ended December 31, 2022 in conformity with accounting principles generally accepted in the United States of America.
Basis for Opinion
These financial statements are the responsibility of the Fund’s management. Our responsibility is to express an opinion on the Fund’s financial statements based on our audits. We are a public accounting firm registered with the Public Company Accounting Oversight Board (United States) (PCAOB) and are required to be independent with respect to the Fund in accordance with the U.S. federal securities laws and the applicable rules and regulations of the Securities and Exchange Commission and the PCAOB.
We conducted our audits of these financial statements in accordance with the standards of the PCAOB. Those standards require that we plan and perform the audit to obtain reasonable assurance about whether the financial statements are free of material misstatement, whether due to error or fraud.
Our audits included performing procedures to assess the risks of material misstatement of the financial statements, whether due to error or fraud, and performing procedures that respond to those risks. Such procedures included examining, on a test basis, evidence regarding the amounts and disclosures in the financial statements. Our audits also included evaluating the accounting principles used and significant estimates made by management, as well as evaluating the overall presentation of the financial statements. Our procedures included confirmation of securities owned as of December 31, 2022 by correspondence with the custodian, transfer agent and brokers; when replies were not received from brokers, we performed other auditing procedures. We believe that our audits provide a reasonable basis for our opinion.
/s/PricewaterhouseCoopers LLP
Houston, Texas
February 22, 2023
We have served as the auditor of one or more of the investment companies in the Invesco group of investment companies since at least 1995. We have not been able to determine the specific year we began serving as auditor.
| 26 Invesco Income Advantage International Fund |
Calculating your ongoing Fund expenses
Example
As a shareholder of the Fund, you incur two types of costs: (1) transaction costs, which may include sales charges (loads) on purchase payments or contingent deferred sales charges on redemptions, if any; and (2) ongoing costs, including management fees, distribution and/or service (12b-1) fees, and other Fund expenses. This example is intended to help you understand your ongoing costs (in dollars) of investing in the Fund and to compare these costs with ongoing costs of investing in other mutual funds. The example is based on an investment of $1,000 invested at the beginning of the period and held for the entire period July 1, 2022 through December 31, 2022.
Actual expenses
The table below provides information about actual account values and actual expenses. You may use the information in this table, together with the amount you invested, to estimate the expenses that you paid over the period. Simply divide your account value by $1,000 (for example, an $8,600 account value divided by $1,000 = 8.6), then multiply the result by the number in the table under the heading entitled “Actual Expenses Paid During Period” to estimate the expenses you paid on your account during this period.
Hypothetical example for comparison purposes
The table below also provides information about hypothetical account values and hypothetical expenses based on the Fund’s actual expense ratio and an assumed rate of return of 5% per year before expenses, which is not the Fund’s actual return.
The hypothetical account values and expenses may not be used to estimate the actual ending account balance or expenses you paid for the period. You may use this information to compare the ongoing costs of investing in the Fund and other funds. To do so, compare this 5% hypothetical example with the 5% hypothetical examples that appear in the shareholder reports of the other funds.
Please note that the expenses shown in the table are meant to highlight your ongoing costs only and do not reflect any transaction costs, such as sales charges (loads) on purchase payments or contingent deferred sales charges on redemptions, if any. Therefore, the hypothetical information is useful in comparing ongoing costs only, and will not help you determine the relative total costs of owning different funds. In addition, if these transaction costs were included, your costs would have been higher.
| ACTUAL | HYPOTHETICAL (5% annual return before expenses) | |||||||||||||||||||
| Beginning Account Value (07/01/22) | Ending Account Value (12/31/22)1 | Expenses Paid During Period2 | Ending Account Value (12/31/22) | Expenses Paid During Period2 | Annualized Expense Ratio | |||||||||||||||
| Class A | $1,000.00 | $1,013.30 | $6.14 | $1,019.11 | $6.16 | 1.21% | ||||||||||||||
| Class C | 1,000.00 | 1,009.80 | 9.93 | 1,015.32 | 9.96 | 1.96 | ||||||||||||||
| Class R | 1,000.00 | 1,012.90 | 7.41 | 1,017.85 | 7.43 | 1.46 | ||||||||||||||
| Class Y | 1,000.00 | 1,014.60 | 4.87 | 1,020.37 | 4.89 | 0.96 | ||||||||||||||
| Class R5 | 1,000.00 | 1,014.90 | 4.88 | 1,020.37 | 4.89 | 0.96 | ||||||||||||||
| Class R6 | 1,000.00 | 1,014.90 | 4.88 | 1,020.37 | 4.89 | 0.96 | ||||||||||||||
| 1 | The actual ending account value is based on the actual total return of the Fund for the period July 1, 2022 through December 31, 2022, after actual expenses and will differ from the hypothetical ending account value which is based on the Fund’s expense ratio and a hypothetical annual return of 5% before expenses. |
| 2 | Expenses are equal to the Fund’s annualized expense ratio as indicated above multiplied by the average account value over the period, multiplied by 184/365 to reflect the most recent fiscal half year. |
| 27 Invesco Income Advantage International Fund |
Form 1099-DIV, Form 1042-S and other year–end tax information provide shareholders with actual calendar year amounts that should be included in their tax returns. Shareholders should consult their tax advisers.
The following distribution information is being provided as required by the Internal Revenue Code or to meet a specific state’s requirement.
The Fund designates the following amounts or, if subsequently determined to be different, the maximum amount allowable for its fiscal year ended December 31, 2022:
| Federal and State Income Tax |
| |||||
| Qualified Dividend Income* | 32.80% | |||||
| Corporate Dividends Received Deduction* | 1.14% | |||||
| U.S. Treasury Obligations* | 0.00% | |||||
| Qualified Business Income* | 0.00% | |||||
| Business Interest Income* | 26.32% | |||||
* The above percentages are based on ordinary income dividends paid to shareholders during the Fund’s fiscal year. | ||||||
| 28 Invesco Income Advantage International Fund |
The address of each trustee and officer is AIM Growth Series (Invesco Growth Series) (the “Trust”), 11 Greenway Plaza, Suite 1000, Houston, Texas 77046-1173. The trustees serve for the life of the Trust, subject to their earlier death, incapacitation, resignation, retirement or removal as more specifically provided in the Trust’s organizational documents. Each officer serves for a one year term or until their successors are elected and qualified. Column two below includes length of time served with predecessor entities, if any.
| Name, Year of Birth and Position(s) Held with the Trust | Trustee and/or Officer Since | Principal Occupation(s) During Past 5 Years | Number of Funds in Fund Complex Overseen by Trustee | Other Directorship(s) Held by Trustee During Past 5 Years | ||||
| Interested Trustee | ||||||||
| Martin L. Flanagan1 – 1960 Trustee and Vice Chair | 2007 | Executive Director, Chief Executive Officer and President, Invesco Ltd. (ultimate parent of Invesco and a global investment management firm); Trustee and Vice Chair, The Invesco Funds; Vice Chair, Investment Company Institute; and Member of Executive Board, SMU Cox School of Business
Formerly: Advisor to the Board, Invesco Advisers, Inc. (formerly known as Invesco Institutional (N.A.), Inc.); Chairman and Chief Executive Officer, Invesco Advisers, Inc. (registered investment adviser); Director, Chairman, Chief Executive Officer and President, Invesco Holding Company (US), Inc. (formerly IVZ Inc.) (holding company), Invesco Group Services, Inc. (service provider) and Invesco North American Holdings, Inc. (holding company); Director, Chief Executive Officer and President, Invesco Holding Company Limited (parent of Invesco and a global investment management firm); Director, Invesco Ltd.; Chairman, Investment Company Institute and President, Co-Chief Executive Officer, Co-President, Chief Operating Officer and Chief Financial Officer, Franklin Resources, Inc. (global investment management organization) | 189 | None | ||||
| 1 | Mr. Flanagan is considered an interested person (within the meaning of Section 2(a)(19) of the 1940 Act) of the Trust because he is an officer of the Adviser to the Trust, and an officer and a director of Invesco Ltd., ultimate parent of the Adviser. |
| T-1 Invesco Income Advantage International Fund |
Trustees and Officers–(continued)
| Name, Year of Birth and Position(s) Held with the Trust | Trustee and/or Officer Since | Principal Occupation(s) During Past 5 Years | Number of Funds in Fund Complex Overseen by Trustee | Other Directorship(s) Years | ||||
| Independent Trustees | ||||||||
Beth Ann Brown – 1968 Trustee (2019) and Chair (August 2022) | 2019 | Independent Consultant
Formerly: Head of Intermediary Distribution, Managing Director, Strategic Relations, Managing Director, Head of National Accounts, Senior Vice President, National Account Manager and Senior Vice President, Key Account Manager, Columbia Management Investment Advisers LLC; Vice President, Key Account Manager, Liberty Funds Distributor, Inc.; and Trustee of certain Oppenheimer Funds | 189 | Director, Board of Directors of Caron Engineering Inc.; Advisor, Board of Advisors of Caron Engineering Inc.; President and Director, Acton Shapleigh Youth Conservation Corps (non-profit) Formerly: President and Director Director of Grahamtastic Connection (non-profit) | ||||
| Cynthia Hostetler –1962 Trustee | 2017 | Non-Executive Director and Trustee of a number of public and private business corporations
Formerly: Director, Aberdeen Investment Funds (4 portfolios); Director, Artio Global Investment LLC (mutual fund complex); Director, Edgen Group, Inc. (specialized energy and infrastructure products distributor); Director, Genesee & Wyoming, Inc. (railroads); Head of Investment Funds and Private Equity, Overseas Private Investment Corporation; President, First Manhattan Bancorporation, Inc.; and Attorney, Simpson Thacher & Bartlett LLP | 189 | Resideo Technologies, Inc. (smart home technology); Vulcan Materials Company (construction materials company); Trilinc Global Impact Fund; Textainer Group Holdings, (shipping container leasing company); Investment Company Institute (professional organization); and Independent Directors Council (professional organization) | ||||
Eli Jones – 1961 Trustee | 2016 | Professor and Dean Emeritus, Mays Business School - Texas A&M University
Formerly: Dean of Mays Business School-Texas A&M University; Professor and Dean, Walton College of Business, University of Arkansas and E.J. Ourso College of Business, Louisiana State University; and Director, Arvest Bank | 189 | Insperity, Inc. (formerly known as Administaff) (human resources provider); and Member of Regional Board of Directors and Board of Directors, First Financial Bancorp (regional bank) | ||||
Elizabeth Krentzman – 1959 Trustee | 2019 | Formerly: Principal and Chief Regulatory Advisor for Asset Management Services and U.S. Mutual Fund Leader of Deloitte & Touche LLP; General Counsel of the Investment Company Institute (trade association); National Director of the Investment Management Regulatory Consulting Practice, Principal, Director and Senior Manager of Deloitte & Touche LLP; Assistant Director of the Division of Investment Management - Office of Disclosure and Investment Adviser Regulation of the U.S. Securities and Exchange Commission and various positions with the Division of Investment Management - Office of Regulatory Policy of the U.S. Securities and Exchange Commission; Associate at Ropes & Gray LLP; and Trustee of certain Oppenheimer Funds | 189 | Formerly: Member of the Cartica Funds Board of Directors (private investment fund); Trustee of the University of Florida National Board Foundation; and Member of the University of Florida Law Center Association, Inc. Board of Trustees, Audit Committee and Membership Committee | ||||
Anthony J. LaCava, Jr. –1956 Trustee | 2019 | Formerly: Director and Member of the Audit Committee, Blue Hills Bank (publicly traded financial institution) and Managing Partner, KPMG LLP | 189 | Blue Hills Bank; Chairman, Bentley University; Member, Business School Advisory Council; and Nominating Committee, KPMG LLP | ||||
Prema Mathai-Davis – 1950 Trustee | 2001 | Retired
Formerly: Co-Founder & Partner of Quantalytics Research, LLC, (a FinTech Investment Research Platform for the Self-Directed Investor); Trustee of YWCA Retirement Fund; CEO of YWCA of the USA; Board member of the NY Metropolitan Transportation Authority; Commissioner of the NYC Department of Aging; and Board member of Johns Hopkins Bioethics Institute | 189 | Member of Board of Positive Planet US (non-profit) and HealthCare Chaplaincy Network (non-profit) | ||||
T-2 Invesco Income Advantage International Fund
Trustees and Officers–(continued)
| Name, Year of Birth and Position(s) Held with the Trust | Trustee and/or Officer Since | Principal Occupation(s) During Past 5 Years | Number of Funds in Fund Complex Overseen by Trustee | Other Directorship(s) Years | ||||
| Independent Trustees–(continued) | ||||||||
Joel W. Motley – 1952 Trustee | 2019 | Director of Office of Finance, Federal Home Loan Bank System; Managing Director of Carmona Motley Inc. (privately held financial advisor); Member of the Council on Foreign Relations and its Finance and Budget Committee; Chairman Emeritus of Board of Human Rights Watch and Member of its Investment Committee; and Member of Investment Committee Board of Historic Hudson Valley (non-profit cultural organization); Member of the Board, Blue Ocean Acquisition Corp.; and Member of the Vestry and the Investment Committee of Trinity Church Wall Street.
Formerly: Managing Director of Public Capital Advisors, LLC (privately held financial advisor); Managing Director of Carmona Motley Hoffman, Inc. (privately held financial advisor); Trustee of certain Oppenheimer Funds; and Director of Columbia Equity Financial Corp. (privately held financial advisor) | 189 | Member of Board of Trust for Mutual Understanding (non-profit promoting the arts and environment); Member of Board of Greenwall Foundation (bioethics research foundation) and its Investment Committee; Member of Board of Friends of the LRC (non-profit legal advocacy); and Board Member and Investment Committee Member of Pulitzer Center for Crisis Reporting (non-profit journalism) | ||||
Teresa M. Ressel – 1962 Trustee | 2017 | Non-executive director and trustee of a number of public and private business corporations
Formerly: Chief Executive Officer, UBS Securities LLC (investment banking); Chief Operating Officer, UBS AG Americas (investment banking); Sr. Management Team Olayan America, The Olayan Group (international investor/commercial/industrial); Assistant Secretary for Management & Budget and Designated Chief Financial Officer, U.S. Department of Treasury and Director, ON Semiconductor Corporation (semiconductor manufacturing) | 189 | None | ||||
Robert C. Troccoli – 1949 Trustee | 2016 | Retired
Formerly: Adjunct Professor, University of Denver – Daniels College of Business; and Managing Partner, KPMG LLP | 189 | None | ||||
Daniel S. Vandivort – 1954 Trustee | 2019 | President, Flyway Advisory Services LLC (consulting and property management)
Formerly: President and Chief Investment Officer, previously Head of Fixed Income, Weiss Peck and Greer/Robeco Investment Management; Trustee and Chair, Weiss Peck and Greer Funds Board; and various capacities at CS First Boston including Head of Fixed Income at First Boston Asset Management. | 189 | Formerly: Trustee and Governance Chair, Oppenheimer Funds; Treasurer, Chairman of the Audit and Finance Committee, Huntington Disease Foundation of America | ||||
T-3 Invesco Income Advantage International Fund
Trustees and Officers–(continued)
Name, Year of Birth and Position(s) Held with the Trust | Trustee and/or Officer Since | Principal Occupation(s) During Past 5 Years | Number of Funds in Fund Complex Overseen by Trustee | Other Directorship(s) Held by Trustee During Past 5 Years | ||||
| Officers | ||||||||
Sheri Morris – 1964 President and Principal Executive Officer | 1999 | Director, Invesco Trust Company; Head of Global Fund Services, Invesco Ltd.; President and Principal Executive Officer, The Invesco Funds; Vice President, Invesco Exchange-Traded Fund Trust, Invesco Exchange-Traded Fund Trust II, Invesco India Exchange-Traded Fund Trust, Invesco Actively Managed Exchange-Traded Fund Trust, Invesco Actively Managed Exchange-Traded Commodity Fund Trust and Invesco Exchange-Traded Self-Indexed Fund Trust; and Vice President, OppenheimerFunds, Inc.
Formerly: Vice President, Treasurer and Principal Financial Officer, The Invesco Funds; Vice President, Invesco AIM Advisers, Inc., Invesco AIM Capital Management, Inc. and Invesco AIM Private Asset Management, Inc.; Assistant Vice President and Assistant Treasurer, The Invesco Funds; Vice President and Assistant Vice President, Invesco Advisers, Inc.; Assistant Vice President, Invesco AIM Capital Management, Inc. and Invesco AIM Private Asset Management, Inc.; Treasurer, Invesco Exchange-Traded Fund Trust, Invesco Exchange-Traded Fund Trust II, Invesco India Exchange-Traded Fund Trust and Invesco Actively Managed Exchange-Traded Fund Trust; and Senior Vice President, Invesco Advisers, Inc. (formerly known as Invesco Institutional (N.A.), Inc.) (registered investment adviser) | N/A | N/A | ||||
Jeffrey H. Kupor – 1968 Senior Vice President, Chief Legal Officer and Secretary | 2018 | Head of Legal of the Americas, Invesco Ltd.; Senior Vice President and Secretary, Invesco Advisers, Inc. (formerly known as Invesco Institutional (N.A.), Inc.) (registered investment adviser); Secretary, Invesco Distributors, Inc. (formerly known as Invesco AIM Distributors, Inc.); Vice President and Secretary, Invesco Investment Services, Inc. (formerly known as Invesco AIM Investment Services, Inc.); Senior Vice President, Chief Legal Officer and Secretary, The Invesco Funds; Secretary and General Counsel, Invesco Investment Advisers LLC (formerly known as Van Kampen Asset Management); Secretary and General Counsel, Invesco Capital Markets, Inc. (formerly known as Van Kampen Funds Inc.); Chief Legal Officer, Invesco Exchange-Traded Fund Trust, Invesco Exchange-Traded Fund Trust II, Invesco India Exchange-Traded Fund Trust, Invesco Actively Managed Exchange-Traded Fund Trust, Invesco Actively Managed Exchange-Traded Commodity Fund Trust and Invesco Exchange-Traded Self-Indexed Fund Trust;; Secretary and Vice President, Harbourview Asset Management Corporation; Secretary and Vice President, OppenheimerFunds, Inc. and Invesco Managed Accounts, LLC; Secretary and Senior Vice President, OFI Global Institutional, Inc.; Secretary and Vice President, OFI SteelPath, Inc.; Secretary and Vice President, Oppenheimer Acquisition Corp.; Secretary and Vice President, Shareholder Services, Inc.; and Secretary and Vice President, Trinity Investment Management Corporation
Formerly: Senior Vice President, Invesco Distributors, Inc.; Secretary and Vice President, Jemstep, Inc.; Head of Legal, Worldwide Institutional, Invesco Ltd.; Secretary and General Counsel, INVESCO Private Capital Investments, Inc.; Senior Vice President, Secretary and General Counsel, Invesco Management Group, Inc. (formerly known as Invesco AIM Management Group, Inc.); Assistant Secretary, INVESCO Asset Management (Bermuda) Ltd.; Secretary and General Counsel, Invesco Private Capital, Inc.;Assistant Secretary and General Counsel, INVESCO Realty, Inc.; Secretary and General Counsel, Invesco Senior Secured Management, Inc.; Secretary, Sovereign G./P. Holdings Inc.; Secretary, Invesco Indexing LLC; and Secretary, W.L. Ross & Co., LLC | N/A | N/A | ||||
Andrew R. Schlossberg –1974 Senior Vice President | 2019 | Senior Vice President, Invesco Group Services, Inc.; Head of the Americas and Senior Managing Director, Invesco Ltd.; Director and Senior Vice President, Invesco Advisers, Inc. (formerly known as Invesco Institutional (N.A.), Inc.) (registered investment adviser); Director and Chairman, Invesco Investment Services, Inc. (formerly known as Invesco AIM Investment Services, Inc.) (registered transfer agent); Senior Vice President, The Invesco Funds; and Director, Invesco Investment Advisers LLC (formerly known as Van Kampen Asset Management)
Formerly: Director, President and Chairman, Invesco Insurance Agency, Inc.; Director, Invesco UK Limited; Director and Chief Executive, Invesco Asset Management Limited and Invesco Fund Managers Limited; Assistant Vice President, The Invesco Funds; Senior Vice President, Invesco Advisers, Inc. (formerly known as Invesco Institutional (N.A.), Inc.) (registered investment adviser); Director and Chief Executive, Invesco Administration Services Limited and Invesco Global Investment Funds Limited; Director, Invesco Distributors, Inc.; Head of EMEA, Invesco Ltd.; President, Invesco Actively Managed Exchange-Traded Commodity Fund Trust, Invesco Actively Managed Exchange-Traded Fund Trust, Invesco Exchange-Traded Fund Trust, Invesco Exchange-Traded Fund Trust II and Invesco India Exchange-Traded Fund Trust; and Managing Director and Principal Executive Officer, Invesco Capital Management LLC | N/A | N/A |
T-4 Invesco Income Advantage International Fund
Trustees and Officers–(continued)
Name, Year of Birth and Position(s) Held with the Trust | Trustee and/or Officer Since | Principal Occupation(s) During Past 5 Years | Number of Funds in Fund Complex Overseen by Trustee | Other Directorship(s) Held by Trustee During Past 5 Years | ||||
| Officers–(continued) | ||||||||
John M. Zerr – 1962 Senior Vice President | 2006 | Chief Operating Officer of the Americas; Senior Vice President, Invesco Advisers, Inc. (formerly known as Invesco Institutional (N.A.), Inc.) (registered investment adviser); Senior Vice President, Invesco Distributors, Inc. (formerly known as Invesco AIM Distributors, Inc.); Director and Vice President, Invesco Investment Services, Inc. (formerly known as Invesco AIM Investment Services, Inc.) Senior Vice President, The Invesco Funds; Managing Director, Invesco Capital Management LLC; Director, Invesco Investment Advisers LLC (formerly known as Van Kampen Asset Management); Senior Vice President, Invesco Capital Markets, Inc. (formerly known as Van Kampen Funds Inc.); Manager, Invesco Indexing LLC; Manager, Invesco Specialized Products, LLC; Member, Invesco Canada Funds Advisory Board; Director, President and Chief Executive Officer, Invesco Corporate Class Inc. (corporate mutual fund company); and Director, Chairman, President and Chief Executive Officer, Invesco Canada Ltd. (formerly known as Invesco Trimark Ltd./Invesco Trimark Ltèe) (registered investment adviser and registered transfer agent); President, Invesco, Inc.; President, Invesco Global Direct Real Estate Feeder GP Ltd.; President, Invesco IP Holdings (Canada) Ltd; President, Invesco Global Direct Real Estate GP Ltd.; President, Invesco Financial Services Ltd. / Services Financiers Invesco Ltée; and Director and Chairman, Invesco Trust Company
Formerly: President, Trimark Investments Ltd/Services Financiers Invesco Ltee; Director and Senior Vice President, Invesco Insurance Agency, Inc.; Director and Senior Vice President, Invesco Management Group, Inc. (formerly known as Invesco AIM Management Group, Inc.); Secretary and General Counsel, Invesco Management Group, Inc. (formerly known as Invesco AIM Management Group, Inc.); Secretary, Invesco Investment Services, Inc. (formerly known as Invesco AIM Investment Services, Inc.); Chief Legal Officer and Secretary, The Invesco Funds; Secretary and General Counsel, Invesco Investment Advisers LLC (formerly known as Van Kampen Asset Management); Secretary and General Counsel, Invesco Capital Markets, Inc. (formerly known as Van Kampen Funds Inc.); Chief Legal Officer, Invesco Exchange-Traded Fund Trust, Invesco Exchange-Traded Fund Trust II, Invesco India Exchange-Traded Fund Trust, Invesco Actively Managed Exchange-Traded Fund Trust, Invesco Actively Managed Exchange-Traded Commodity Fund Trust and Invesco Exchange-Traded Self-Indexed Fund Trust; Secretary, Invesco Indexing LLC; Director, Secretary, General Counsel and Senior Vice President, Van Kampen Exchange Corp.; Director, Vice President and Secretary, IVZ Distributors, Inc. (formerly known as INVESCO Distributors, Inc.); Director and Vice President, INVESCO Funds Group, Inc.; Director and Vice President, Van Kampen Advisors Inc.; Director, Vice President, Secretary and General Counsel, Van Kampen Investor Services Inc.;Director and Secretary, Invesco Distributors, Inc. (formerly known as Invesco AIM Distributors, Inc.); Director, Senior Vice President, General Counsel and Secretary, Invesco AIM Advisers, Inc. and Van Kampen Investments Inc.; Director, Vice President and Secretary, Fund Management Company; Director, Senior Vice President, Secretary, General Counsel and Vice President, Invesco AIM Capital Management, Inc.; and Chief Operating Officer and General Counsel, Liberty Ridge Capital, Inc. (an investment adviser) | N/A | N/A | ||||
Gregory G. McGreevey - 1962 Senior Vice President | 2012 | Senior Managing Director, Invesco Ltd.; Director, Chairman, President, and Chief Executive Officer, Invesco Advisers, Inc. (formerly known as Invesco Institutional (N.A.), Inc.) (registered investment adviser); Director, Invesco Mortgage Capital, Inc. and Invesco Senior Secured Management, Inc.; Senior Vice President, The Invesco Funds; President, SNW Asset Management Corporation and Invesco Managed Accounts, LLC; Chairman and Director, Invesco Private Capital, Inc.; Chairman and Director, INVESCO Private Capital Investments, Inc.; Chairman and Director, INVESCO Realty, Inc.; and Senior Vice President, Invesco Group Services, Inc.
Formerly: Senior Vice President, Invesco Management Group, Inc. and Invesco Advisers, Inc.; Assistant Vice President, The Invesco Funds | N/A | N/A | ||||
Adrien Deberghes- 1967 Principal Financial Officer, Treasurer and Vice President | 2020 | Head of the Fund Office of the CFO and Fund Administration; Vice President, Invesco Advisers, Inc.; Principal Financial Officer, Treasurer and Vice President, The Invesco Funds; Vice President, Invesco Exchange-Traded Fund Trust, Invesco Exchange-Traded Fund Trust II, Invesco India Exchange-Traded Fund Trust, Invesco Actively Managed Exchange-Traded Fund Trust, Invesco Actively Managed Exchange-Traded Commodity Fund Trust and Invesco Exchange-Traded Self-Indexed Fund Trust
Formerly: Senior Vice President and Treasurer, Fidelity Investments | N/A | N/A | ||||
Crissie M. Wisdom – 1969 Anti-Money Laundering Compliance Officer | 2013 | Anti-Money Laundering and OFAC Compliance Officer for Invesco U.S. entities including: Invesco Advisers, Inc. and its affiliates, Invesco Capital Markets, Inc., Invesco Distributors, Inc., Invesco Investment Services, Inc., The Invesco Funds, Invesco Capital Management, LLC, Invesco Trust Company; and Fraud Prevention Manager for Invesco Investment Services, Inc. | N/A | N/A |
T-5 Invesco Income Advantage International Fund
Trustees and Officers–(continued)
Name, Year of Birth and Position(s) Held with the Trust | Trustee and/or Officer Since | Principal Occupation(s) During Past 5 Years | Number of Funds in Fund Complex Overseen by Trustee | Other Directorship(s) Held by Trustee During Past 5 Years | ||||
| Officers–(continued) | ||||||||
Todd F. Kuehl – 1969 Chief Compliance Officer and Senior Vice President | 2020 | Chief Compliance Officer, Invesco Advisers, Inc. (registered investment adviser); and Chief Compliance Officer and Senior Vice President, The Invesco Funds
Formerly: Managing Director and Chief Compliance Officer, Legg Mason (Mutual Funds); Chief Compliance Officer, Legg Mason Private Portfolio Group (registered investment adviser) | N/A | N/A | ||||
James Bordewick, Jr. – 1959 Senior Vice President and Senior Officer | 2022 | Senior Vice President and Senior Officer, The Invesco Funds
Formerly: Chief Legal Officer, KingsCrowd, Inc. (research and analytical platform for investment in private capital markets); Chief Operating Officer and Head of Legal and Regulatory, Netcapital (private capital investment platform); Managing Director, General Counsel of asset management and Chief Compliance Officer for asset management and private banking, Bank of America Corporation; Chief Legal Officer, Columbia Funds and BofA Funds;
Senior Vice President and Associate General Counsel, MFS Investment Management; Chief Legal Officer, MFS Funds; Associate, Ropes & Gray; and Associate, Gaston Snow & Ely Bartlett | N/A | N/A |
| Office of the Fund | Investment Adviser | Distributor | Auditors | |||
| 11 Greenway Plaza, Suite 1000 | Invesco Advisers, Inc. | Invesco Distributors, Inc. | PricewaterhouseCoopers LLP | |||
| Houston, TX 77046-1173 | 1555 Peachtree Street, N.E. | 11 Greenway Plaza, Suite 1000 | 1000 Louisiana Street, Suite 5800 | |||
| Atlanta, GA 30309 | Houston, TX 77046-1173 | Houston, TX 77002-5021 | ||||
| Counsel to the Fund | Counsel to the Independent Trustees | Transfer Agent | Custodian | |||
| Stradley Ronon Stevens & Young, LLP | Sidley Austin LLP | Invesco Investment Services, Inc. | State Street Bank and Trust Company | |||
| 2005 Market Street, Suite 2600 | 787 Seventh Avenue | 11 Greenway Plaza, Suite 1000 | 225 Franklin Street | |||
| Philadelphia, PA 19103-7018 | New York, NY 10019 | Houston, TX 77046-1173 | Boston, MA 02110-2801 | |||
T-6 Invesco Income Advantage International Fund
(This page intentionally left blank)

Go paperless with eDelivery
Visit invesco.com/edelivery to enjoy the convenience and security of anytime electronic access to your investment documents.
With eDelivery, you can elect to have any or all of the following materials delivered straight to your inbox to download, save and print from your own computer:
∎ Fund reports and prospectuses
∎ Quarterly statements
∎ Daily confirmations
∎ Tax forms
Invesco mailing information
Send general correspondence to Invesco Investment Services, Inc., P.O. Box 219078, Kansas City, MO 64121-9078.
Important notice regarding delivery of security holder documents
To reduce Fund expenses, only one copy of most shareholder documents may be mailed to shareholders with multiple accounts at the same address (Householding). Mailing of your shareholder documents may be householded indefinitely unless you instruct us otherwise. If you do not want the mailing of these documents to be combined with those for other members of your household, please contact Invesco Investment Services, Inc. at 800 959 4246 or contact your financial institution. We will begin sending you individual copies for each account within 30 days after receiving your request.
Fund holdings and proxy voting information
The Fund provides a complete list of its portfolio holdings four times each year, at the end of each fiscal quarter. For the second and fourth quarters, the list appears, respectively, in the Fund’s semiannual and annual reports to shareholders. For the first and third quarters, the Fund files the list with the Securities and Exchange Commission (SEC) as an exhibit to its reports on Form N-PORT. The most recent list of portfolio holdings is available at invesco.com/completeqtrholdings. Shareholders can also look up the Fund’s Form N-PORT filings on the SEC website, sec.gov. The SEC file numbers for the Fund are shown below.
A description of the policies and procedures that the Fund uses to determine how to vote proxies relating to portfolio securities is available without charge, upon request, from our Client Services department at 800 959 4246, or at invesco.com/ corporate/about-us/esg. The information is also available on the SEC website, sec.gov.
Information regarding how the Fund voted proxies related to its portfolio securities during the most recent 12-month period ended June 30 is available at invesco.com/proxysearch. This information is also available on the SEC website, sec.gov.
Invesco Advisers, Inc. is an investment adviser; it provides investment advisory services to individual and institutional clients and does not sell securities. Invesco Distributors, Inc. is the US distributor for Invesco Ltd.’s retail mutual funds, exchange-traded funds and institutional money market funds. Both are wholly owned, indirect subsidiaries of Invesco Ltd.
SEC file number(s): 811-02699 and 002-57526 | Invesco Distributors, Inc. | GLVEY-AR-1 |

| Annual Report to Shareholders | December 31, 2022 |
Invesco Income Allocation Fund
Nasdaq:
A: ALAAX ∎ C: CLIAX ∎ R: RLIAX ∎ Y: ALAYX ∎ R5: ILAAX ∎ R6: IIASX
2 | ||||
2 | ||||
3 | ||||
5 | ||||
7 | ||||
9 | ||||
12 | ||||
13 | ||||
18 | ||||
19 | ||||
20 | ||||
T-1 | ||||
Management’s Discussion of Fund Performance
For the fiscal year ended December 31, 2022, Class A shares of Invesco Income Allocation Fund (the Fund), at net asset value (NAV), outperformed the Custom Invesco Income Allocation Index, the Fund’s style-specific benchmark. Your Fund’s long-term performance appears later in this report.
Fund vs. Indexes |
Total returns, 12/31/21 to 12/31/22, at net asset value (NAV). Performance shown does |
Class A Shares | -11.78 | % | ||
Class C Shares | -12.43 | |||
Class R Shares | -11.91 | |||
Class Y Shares | -11.48 | |||
Class R5 Shares | -11.55 | |||
Class R6 Shares | -11.51 | |||
S&P 500 Indexq (Broad Market Index) | -18.11 | |||
Custom Invesco Income Allocation Index∎ (Style-Specific Index) | -14.62 | |||
Lipper Mixed-Asset Target Allocation Conservative Funds Index¨ (Peer Group Index) | -12.70 | |||
Source(s): qRIMES Technologies Corp.; ∎ Invesco, RIMES Technologies Corp.; ¨Lipper Inc.
|
Market conditions and your Fund
Global equity markets declined in the first half of 2022 amid volatility sparked by Russia’s invasion of Ukraine, rising commodity prices, rampant global inflation and central banks shifting toward tighter monetary policy. Russia’s invasion exacerbated inflationary pressures, disrupting already strained supply chains, and increasing shortages of oil, gas and raw materials, with the price of oil rising sharply.
Inflation headwinds continued into the third quarter of 2022. The US Federal Reserve (the Fed), the European Central Bank and the Bank of England all raised interest rates. In contrast, the People’s Bank of China lowered its policy rate and the Bank of Japan kept rates the same. Emerging market equities, hampered by the strong US dollar, underperformed developed market equities.
Global equity markets posted gains for the fourth quarter of 2022, after better inflation data sparked a rally in October and November. However, investor sentiment worsened in December after central banks signaled continued interest rate hikes into 2023 as inflation remained above target levels. International stocks outperformed US stocks in the fourth quarter, led by results in Europe and the UK. Emerging market equities also posted gains for the fourth quarter of 2022, boosted by China, which eased its zero-COVID-19 policy and started to reopen even as COVID-19 infections surged.
Despite the rebound in the fourth quarter of 2022, at the end of the fiscal year ended December 31, 2022, trailing one-year returns for developed market equities and emerging market equities were both in negative territory.
Strategic asset class exposures in the Fund are obtained through underlying representative
mutual funds and exchange-traded funds that seeks to provide a high level of current income with a secondary objective of providing capital growth. From an absolute performance perspective, the portfolio’s allocation to dividend paying equities was the leading contributor to positive performance. The remaining allocations to equity, fixed income and alternative assets were all detractors from absolute performance as the portfolio produced a negative return for the fiscal year.
From a relative Fund performance perspective, the portfolio outperformed its custom benchmark during the fiscal year. Outperformance was driven mainly by style selection within the US equity allocation. Within the allocation, the Invesco S&P 500 High Dividend Low Volatility ETF and Invesco Dividend Income Fund were the primary contributors.
Conversely, allocations to other fixed income funds were the leading detractors to relative performance during the fiscal year. Within the allocation, the Invesco Taxable Municipal Bond ETF and Invesco 1-30 Laddered Treasury ETF were the leading detractors.
Please note that some of the Fund’s underlying funds use derivatives, including futures and total return swaps, which may create economic leverage in the underlying funds. Therefore, we believe some of the performance of the strategy, both positive and negative, can be attributed to these instruments. We believe derivatives can be a cost-effective way to gain exposure to asset classes. However, derivatives may amplify traditional investment risks through the creation of leverage and may be less liquid than traditional securities.
Thank you for your continued investment in the Invesco Income Allocation Fund.
Portfolio manager(s):
Jeffrey Bennett
Jacob Borbidge
Duy Nguyen
The views and opinions expressed in management’s discussion of Fund performance are those of Invesco Advisers, Inc. and its affiliates. These views and opinions are subject to change at any time based on factors such as market and economic conditions. These views and opinions may not be relied upon as investment advice or recommendations, or as an offer for a particular security. The information is not a complete analysis of every aspect of any market, country, industry, security or the Fund. Statements of fact are from sources considered reliable, but Invesco Advisers, Inc. makes no representation or warranty as to their completeness or accuracy. Although historical performance is no guarantee of future results, these insights may help you understand our investment management philosophy.
See important Fund and, if applicable, index disclosures later in this report.
| 2 Invesco Income Allocation Fund |
Your Fund’s Long-Term Performance
Results of a $10,000 Investment — Oldest Share Class(es)
Fund and index data from 12/31/12
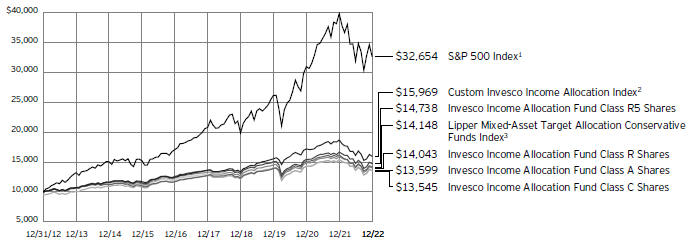
| 1 | Source: RIMES Technologies Corp. |
| 2 | Source: Invesco, RIMES Technologies Corp. |
| 3 | Source: Lipper, Inc. |
Past performance cannot guarantee future results.
The data shown in the chart include reinvested distributions, applicable sales charges and Fund expenses including management
fees. Index results include reinvested dividends, but they do not reflect sales charges. Performance of the peer group, if applicable, reflects fund expenses and management fees;
performance of a market index does not. Performance shown in the chart does not reflect deduction of taxes a shareholder would pay on Fund distributions or sale of Fund shares.
| 3 Invesco Income Allocation Fund |
Average Annual Total Returns |
| |||
| As of 12/31/22, including maximum applicable sales charges |
| |||
Class A Shares | ||||
Inception (10/31/05) | 4.13 | % | ||
10 Years | 3.12 | |||
5 Years | 0.18 | |||
1 Year | -16.64 | |||
Class C Shares | ||||
Inception (10/31/05) | 4.11 | % | ||
10 Years | 3.08 | |||
5 Years | 0.57 | |||
1 Year | -13.29 | |||
Class R Shares | ||||
Inception (10/31/05) | 4.21 | % | ||
10 Years | 3.45 | |||
5 Years | 1.09 | |||
1 Year | -11.91 | |||
Class Y Shares | ||||
Inception (10/3/08) | 5.29 | % | ||
10 Years | 3.96 | |||
5 Years | 1.58 | |||
1 Year | -11.48 | |||
Class R5 Shares | ||||
Inception (10/31/05) | 4.73 | % | ||
10 Years | 3.96 | |||
5 Years | 1.56 | |||
1 Year | -11.55 | |||
Class R6 Shares | ||||
10 Years | 3.84 | % | ||
5 Years | 1.57 | |||
1 Year | -11.51 | |||
Class R6 shares incepted on April 4, 2017. Performance shown prior to that date is that of Class A shares at net asset value and includes the 12b-1 fees applicable to Class A shares.
The performance data quoted represent past performance and cannot guarantee future results; current performance may be lower or higher. Please visit invesco.com/ performance for the most recent month-end performance. Performance figures reflect reinvested distributions, changes in net asset value and the effect of the maximum sales charge unless otherwise stated. Performance figures do not reflect deduction of taxes a shareholder would pay on Fund distributions or sale of Fund shares. Investment return and principal value will fluctuate so that you may have a gain or loss when you sell shares.
Class A share performance reflects the maximum 5.50% sales charge, and Class C share performance reflects the applicable contingent deferred sales charge (CDSC) for the period involved. The CDSC on Class C shares is 1% for the first year after purchase. Class R, Class Y, Class R5 and Class R6 shares do not have a front-end sales charge or a CDSC; therefore, performance is at net asset value.
The performance of the Fund’s share classes will differ primarily due to different sales charge structures and class expenses.
Fund performance reflects any applicable fee waivers and/or expense reimbursements. Had the adviser not waived fees and/or reimbursed expenses currently or in the past, returns would have been lower. See current prospectus for more information.
| 4 Invesco Income Allocation Fund |
Invesco Income Allocation Fund’s investment objective is current income and, secondarily, growth of capital.
| ∎ | Unless otherwise stated, information presented in this report is as of December 31, 2022, and is based on total net assets. |
| ∎ | Unless otherwise noted, all data is provided by Invesco. |
| ∎ | To access your Fund’s reports/prospectus, visit invesco.com/fundreports. |
About indexes used in this report
| ∎ | The S&P 500® Index is an unmanaged index considered representative of the US stock market. |
| ∎ | The Custom Invesco Income Allocation Index is composed of the following indexes: S&P 500®, MSCI EAFE®, FTSE NAREIT Equity REITs and Bloomberg U.S. Universal. The composition of the index may change based on the fund’s target asset allocation. Therefore, the current composition of the index does not reflect its historical composition and will likely be altered in the future to better reflect the fund’s objective. The MSCI EAFE Index is considered representative of stocks of Europe, Australasia and the Far East and is computed using the net return, which withholds applicable taxes for non-resident investors. The FTSE NAREIT Equity REITs Index is considered representative of US real estate investment trusts (REITs). The Bloomberg U.S. Universal Index is considered representative of USD-denominated, taxable bonds that are rated either investment grade or below investment grade. |
| ∎ | The Lipper Mixed-Asset Target Allocation Conservative Funds Index is an unmanaged index considered representative of mixed-asset target allocation conservative funds tracked by Lipper. |
| ∎ | The Fund is not managed to track the performance of any particular index, including the index(es) described here, and consequently, the performance of the Fund may deviate significantly from the performance of the index(es). |
| ∎ | A direct investment cannot be made in an index. Unless otherwise indicated, index results include reinvested dividends, and they do not reflect sales charges. Performance of the peer group, if applicable, reflects fund expenses; performance of a market index does not. |
This report must be accompanied or preceded by a currently effective Fund prospectus, which contains more complete information, including sales charges and expenses. Investors should read it carefully before investing. | ||||
| NOT FDIC INSURED | MAY LOSE VALUE | NO BANK GUARANTEE | ||||
| 5 Invesco Income Allocation Fund |
Fund Information
Portfolio Composition*
| By fund type | % of total investments | ||||
Fixed Income Funds | 53.02 | % | |||
Equity Funds | 28.29 | ||||
Alternative Funds | 16.99 | ||||
Money Market Funds | 1.70 | ||||
| * | Based on the Schedule of Investments, which classifies each underlying fund and other investments into broad asset classes based on their predominant investments. |
The Fund’s holdings are subject to change, and there is no assurance that the Fund will continue to hold any particular security. Data presented here are as of December 31, 2022.
6 Invesco Income Allocation Fund
December 31, 2022
Invesco Income Allocation Fund
Schedule of Investments in Affiliated Issuers–99.92%(a)
| %of Net Assets 12/31/22 | Value 12/31/21 | Purchases at Cost | Proceeds from Sales | Change in Unrealized Appreciation (Depreciation) | Realized Gain (Loss) | Dividend Income | Shares 12/31/22 | Value 12/31/22 | ||||||||||||||||||||||||||||
| ||||||||||||||||||||||||||||||||||||
Alternative Funds–17.27% | ||||||||||||||||||||||||||||||||||||
Invesco Global Real Estate Income Fund, Class R6(b) | 7.29 | % | $ | 41,034,793 | $ | 3,016,166 | $ | (3,818,633 | ) | $ | (8,749,389 | ) | $ | 44,730 $ | 528,604 | 4,027,300 | $ | 31,171,300 | ||||||||||||||||||
| ||||||||||||||||||||||||||||||||||||
Invesco Multi-Asset Income Fund, Class R6 | 9.98 | % | 55,614,278 | 4,679,454 | (5,066,754 | ) | (10,971,156 | ) | (1,530,814 | ) | 3,234,130 | 5,643,990 | 42,725,008 | |||||||||||||||||||||||
| ||||||||||||||||||||||||||||||||||||
Total Alternative Funds | 96,649,071 | 7,695,620 | (8,885,387 | ) | (19,720,545 | ) | (1,486,084 | ) | 3,762,734 | 73,896,308 | ||||||||||||||||||||||||||
| ||||||||||||||||||||||||||||||||||||
Domestic Equity Funds–18.49% | ||||||||||||||||||||||||||||||||||||
Invesco Dividend Income Fund, Class R6 | 5.78 | % | 31,946,296 | 2,120,434 | (7,987,615 | ) | (2,988,761 | ) | 2,591,817 | 585,235 | 1,013,976 | 24,720,742 | ||||||||||||||||||||||||
| ||||||||||||||||||||||||||||||||||||
Invesco S&P 500® Enhanced Value ETF | 5.74 | % | 27,368,941 | 7,154,526 | (7,842,546 | ) | (2,417,024 | ) | 306,942 | 637,452 | 600,754 | 24,570,839 | ||||||||||||||||||||||||
| ||||||||||||||||||||||||||||||||||||
Invesco S&P 500® High Dividend Low Volatility ETF | 6.97 | % | 35,582,790 | 4,347,019 | (9,019,224 | ) | (1,705,471 | ) | 650,304 | 1,243,798 | 681,164 | 29,855,418 | ||||||||||||||||||||||||
| ||||||||||||||||||||||||||||||||||||
Total Domestic Equity Funds | 94,898,027 | 13,621,979 | (24,849,385 | ) | (7,111,256 | ) | 3,549,063 | 2,466,485 | 79,146,999 | |||||||||||||||||||||||||||
| ||||||||||||||||||||||||||||||||||||
Fixed Income Funds–53.89% | ||||||||||||||||||||||||||||||||||||
Invesco 1-30 Laddered Treasury ETF | 9.53 | % | - | 52,714,364 | (6,354,751 | ) | (5,210,195 | ) | (382,841 | ) | 657,444 | 1,418,955 | 40,766,577 | |||||||||||||||||||||||
| ||||||||||||||||||||||||||||||||||||
Invesco Core Plus Bond Fund, Class R6 | 10.04 | % | 68,716,297 | 4,377,336 | (19,043,308 | ) | (9,044,625 | ) | (2,038,213 | ) | 1,796,741 | 4,716,519 | 42,967,487 | |||||||||||||||||||||||
| ||||||||||||||||||||||||||||||||||||
Invesco Corporate Bond Fund, Class R6 | 7.25 | % | 13,871,716 | 26,506,906 | (4,200,255 | ) | (4,506,227 | ) | (643,337 | ) | 1,152,554 | 5,070,066 | 31,028,803 | |||||||||||||||||||||||
| ||||||||||||||||||||||||||||||||||||
Invesco Fundamental High Yield® Corporate Bond ETF(c) | 6.96 | % | 37,307,510 | 2,060,829 | (5,076,367 | ) | (3,845,265 | ) | (655,271 | ) | 1,140,196 | 1,740,154 | 29,791,436 | |||||||||||||||||||||||
| ||||||||||||||||||||||||||||||||||||
Invesco Income Fund, Class R6 | 6.25 | % | 32,883,295 | 3,369,605 | (5,309,303 | ) | (3,900,607 | ) | (286,607 | ) | 1,088,301 | 3,906,041 | 26,756,383 | |||||||||||||||||||||||
| ||||||||||||||||||||||||||||||||||||
Invesco International Bond Fund, Class R6(b) | 2.98 | % | 30,762,705 | 812,813 | (14,899,070 | ) | (1,190,260 | ) | (2,164,885 | ) | 87,625 | 2,966,301 | 12,755,094 | |||||||||||||||||||||||
| ||||||||||||||||||||||||||||||||||||
Invesco Master Loan Fund, Class R6 | 5.67 | % | 49,377,632 | 2,069,247 | (25,530,655 | ) | (2,861,158 | ) | 1,193,345 | 2,068,707 | 1,600,027 | 24,248,411 | ||||||||||||||||||||||||
| ||||||||||||||||||||||||||||||||||||
Invesco Taxable Municipal Bond ETF(c) | 5.21 | % | 65,514,262 | 3,618,959 | (35,489,699 | ) | (6,141,547 | ) | (5,189,654 | ) | 1,028,737 | 867,846 | 22,312,321 | |||||||||||||||||||||||
| ||||||||||||||||||||||||||||||||||||
Invesco Variable Rate Preferred ETF | - | 24,787,866 | - | (23,133,312 | ) | (3,005,973 | ) | 1,351,419 | 273,412 | - | - | |||||||||||||||||||||||||
| ||||||||||||||||||||||||||||||||||||
Total Fixed Income Funds | 323,221,283 | 95,530,059 | (139,036,720 | ) | (39,705,857 | ) | (8,816,044 | ) | 9,293,717 | 230,626,512 | ||||||||||||||||||||||||||
| ||||||||||||||||||||||||||||||||||||
Foreign Equity Funds–10.27% | ||||||||||||||||||||||||||||||||||||
Invesco RAFI™ Strategic Developed ex-US ETF | 4.99 | % | - | 28,672,301 | (5,014,612 | ) | (1,799,990 | ) | (487,453 | ) | 538,403 | 795,616 | 21,370,246 | |||||||||||||||||||||||
| ||||||||||||||||||||||||||||||||||||
Invesco S&P International Developed Low Volatility ETF | 5.28 | % | 38,793,366 | 479,651 | (11,917,593 | ) | (4,644,891 | ) | (140,456 | ) | 1,170,699 | 842,796 | 22,570,077 | |||||||||||||||||||||||
| ||||||||||||||||||||||||||||||||||||
Total Foreign Equity Funds | 38,793,366 | 29,151,952 | (16,932,205 | ) | (6,444,881 | ) | (627,909 | ) | 1,709,102 | 43,940,323 | ||||||||||||||||||||||||||
| ||||||||||||||||||||||||||||||||||||
Money Market Funds–0.00% | ||||||||||||||||||||||||||||||||||||
Invesco Government & Agency Portfolio, Institutional Class, 4.22%(d) | 0.00 | 1,707,412 | 31,025,955 | (32,733,356 | ) | - | - | 6,522 | 11 | 11 | ||||||||||||||||||||||||||
| ||||||||||||||||||||||||||||||||||||
Invesco Liquid Assets Portfolio, Institutional Class, 4.42%(d) | - | 1,249,536 | 22,161,397 | (23,411,382 | ) | (30 | ) | 479 | 5,746 | - | - | |||||||||||||||||||||||||
| ||||||||||||||||||||||||||||||||||||
Invesco Treasury Portfolio, Institutional Class, 4.20%(d) | 0.00 | 1,951,328 | 35,458,235 | (37,409,551 | ) | - | - | 8,498 | 12 | 12 | ||||||||||||||||||||||||||
| ||||||||||||||||||||||||||||||||||||
Total Money Market Funds | 4,908,276 | 88,645,587 | (93,554,289 | ) | (30 | ) | 479 | 20,766 | 23 | |||||||||||||||||||||||||||
| ||||||||||||||||||||||||||||||||||||
TOTAL INVESTMENTS IN AFFILIATED ISSUERS (excluding investments purchased with cash collateral from securities on loan) (Cost $443,569,980) | 99.92 | % | 558,470,023 | 234,645,197 | (283,257,986 | ) | (72,982,569 | ) | (7,380,495 | ) | 17,252,804 | 427,610,165 | ||||||||||||||||||||||||
| ||||||||||||||||||||||||||||||||||||
Investments Purchased with Cash Collateral from Securities on Loan | ||||||||||||||||||||||||||||||||||||
Money Market Funds–1.73% | ||||||||||||||||||||||||||||||||||||
Invesco Private Government Fund, 4.28%(d)(e) | 0.48 | % | 1,554,594 | 118,118,687 | (117,600,176 | ) | - | - | 34,091 | (f) | 2,073,105 | 2,073,105 | ||||||||||||||||||||||||
| ||||||||||||||||||||||||||||||||||||
Invesco Private Prime Fund, 4.46%(d)(e) | 1.25 | % | 3,627,386 | 272,230,305 | (270,528,952 | ) | 454 | 1,649 | 94,371 | (f) | 5,329,243 | 5,330,842 | ||||||||||||||||||||||||
| ||||||||||||||||||||||||||||||||||||
Total Investments Purchased with Cash Collateral from Securities on Loan (Cost $7,403,493) | 1.73 | % | 5,181,980 | 390,348,992 | (388,129,128 | ) | 454 | 1,649 | 128,462 | 7,403,947 | ||||||||||||||||||||||||||
| ||||||||||||||||||||||||||||||||||||
TOTAL INVESTMENTS IN AFFILIATED ISSUERS (Cost $450,973,473) | 101.65 | % | $ | 563,652,003 | $ | 624,994,189 | $(671,387,114) | $ | (72,982,115 | ) | $ | (7,378,846 | )(g)(h) | $ | 17,381,266 | (g) | $ | 435,014,112 | ||||||||||||||||||
| ||||||||||||||||||||||||||||||||||||
OTHER ASSETS LESS LIABILITIES | (1.65 | )% | (7,045,423 | ) | ||||||||||||||||||||||||||||||||
| ||||||||||||||||||||||||||||||||||||
NET ASSETS | 100.00 | % | $ | 427,968,689 | ||||||||||||||||||||||||||||||||
| ||||||||||||||||||||||||||||||||||||
Investment Abbreviations:
ETF - Exchange-Traded Fund
See accompanying Notes to Financial Statements which are an integral part of the financial statements.
| 7 Invesco Income Allocation Fund |
Notes to Schedule of Investments:
| (a) | Each underlying fund and the Fund are affiliated by either having the same investment adviser or an investment adviser under common control with the Fund’s investment adviser. |
| (b) | Amounts include a return of capital distribution reclassification which reduces dividend income and increases realized gain (loss) and/or change in unrealized appreciation (depreciation). |
| (c) | All or a portion of this security was out on loan at December 31, 2022. |
| (d) | The rate shown is the 7-day SEC standardized yield as of December 31, 2022. |
| (e) | The security has been segregated to satisfy the commitment to return the cash collateral received in securities lending transactions upon the borrower’s return of the securities loaned. See Note 1H. |
| (f) | Represents the income earned on the investment of cash collateral, which is included in securities lending income on the Statement of Operations. Does not include rebates and fees paid to lending agent or premiums received from borrowers, if any. |
| (g) | Amounts exclude return of capital received from previously held underlying funds due to the timing of the determination of the character of dividends received. |
| (h) | Includes capital gains distributions from affiliated underlying funds as follows: |
| Fund Name | Capital Gain | |||
Invesco Dividend Income Fund | $961,429 | |||
See accompanying Notes to Financial Statements which are an integral part of the financial statements.
| 8 Invesco Income Allocation Fund |
Statement of Assets and Liabilities
December 31, 2022
Assets: |
| |||
Investments in affiliated underlying funds, at value | $ | 435,014,112 | ||
Cash | 745,278 | |||
Receivable for: | ||||
Investments sold - affiliated underlying funds | 410,776 | |||
Fund shares sold | 488,511 | |||
Dividends - affiliated underlying funds | 785,096 | |||
Investment for trustee deferred compensation and retirement plans | 31,638 | |||
Other assets | 63,147 | |||
Total assets | 437,538,558 | |||
Liabilities: |
| |||
Payable for: | ||||
Investments purchased - affiliated underlying funds | 756,186 | |||
Fund shares reacquired | 1,085,363 | |||
Collateral upon return of securities loaned | 7,403,493 | |||
Accrued fees to affiliates | 230,011 | |||
Accrued trustees’ and officers’ fees and benefits | 3,336 | |||
Accrued other operating expenses | 53,001 | |||
Trustee deferred compensation and retirement plans | 38,479 | |||
Total liabilities | 9,569,869 | |||
Net assets applicable to shares outstanding | $ | 427,968,689 | ||
Net assets consist of: |
| |||
Shares of beneficial interest | $ | 477,106,459 | ||
Distributable earnings (loss) | (49,137,770 | ) | ||
| $ | 427,968,689 | |||
Net Assets: |
| |||
Class A | $ | 366,254,097 | ||
Class C | $ | 29,588,191 | ||
Class R | $ | 3,469,765 | ||
Class Y | $ | 28,226,564 | ||
Class R5 | $ | 92,951 | ||
Class R6 | $ | 337,121 | ||
Shares outstanding, no par value, with an unlimited number of shares authorized:
|
| |||
Class A | 36,268,555 | |||
Class C | 2,926,339 | |||
Class R | 343,370 | |||
Class Y | 2,795,514 | |||
Class R5 | 9,209 | |||
Class R6 | 33,397 | |||
Class A: | $ | 10.10 | ||
Maximum offering price per share | $ | 10.69 | ||
Class C: | $ | 10.11 | ||
Class R: | $ | 10.11 | ||
Class Y: | $ | 10.10 | ||
Class R5: | $ | 10.09 | ||
Class R6: | $ | 10.09 | ||
| * | At December 31, 2022, securities with an aggregate value of $7,219,662 were on loan to brokers. |
See accompanying Notes to Financial Statements which are an integral part of the financial statements.
9 Invesco Income Allocation Fund
Statement of Operations
For the year ended December 31, 2022
Investment income: | ||||
Dividends from affiliated underlying funds (includes net securities lending income of $ 180,748) | $ 17,425,314 | |||
Interest | 199,973 | |||
Total investment income | 17,625,287 | |||
Expenses: | ||||
Administrative services fees | 72,214 | |||
Custodian fees | 3,949 | |||
Distribution fees: | ||||
Class A | 1,021,267 | |||
Class C | 377,432 | |||
Class R | 21,091 | |||
Transfer agent fees – A, C, R and Y | 591,710 | |||
Transfer agent fees – R5 | 116 | |||
Transfer agent fees – R6 | 41 | |||
Trustees’ and officers’ fees and benefits | 20,834 | |||
Registration and filing fees | 108,368 | |||
Reports to shareholders | 18,347 | |||
Professional services fees | 34,412 | |||
Other | 17,182 | |||
Total expenses | 2,286,963 | |||
Less: Expenses reimbursed and/or expense offset arrangement(s) | (299,021 | ) | ||
Net expenses | 1,987,942 | |||
Net investment income | 15,637,345 | |||
Realized and unrealized gain (loss) from: | ||||
Net realized gain (loss) from: | ||||
Affiliated underlying fund shares | (8,333,880 | ) | ||
Capital gain distributions from affiliated underlying fund shares | 961,429 | |||
| (7,372,451 | ) | |||
Change in net unrealized appreciation (depreciation) of affiliated underlying fund shares | (72,982,115 | ) | ||
Net realized and unrealized gain (loss) | (80,354,566 | ) | ||
Net increase (decrease) in net assets resulting from operations | $(64,717,221) | |||
See accompanying Notes to Financial Statements which are an integral part of the financial statements.
10 Invesco Income Allocation Fund
Statement of Changes in Net Assets
For the years ended December 31, 2022 and 2021
| 2022 | 2021 | |||||||
| ||||||||
Operations: | ||||||||
Net investment income | $ | 15,637,345 | $ | 15,416,986 | ||||
Net realized gain (loss) | (7,372,451 | ) | 4,345,968 | |||||
Change in net unrealized appreciation (depreciation) | (72,982,115 | ) | 18,902,149 | |||||
Net increase (decrease) in net assets resulting from operations | (64,717,221 | ) | 38,665,103 | |||||
Distributions to shareholders from distributable earnings: | ||||||||
Class A | (13,588,812 | ) | (14,112,419 | ) | ||||
Class C | (966,467 | ) | (1,270,478 | ) | ||||
Class R | (130,234 | ) | (155,989 | ) | ||||
Class Y | (1,287,015 | ) | (1,678,129 | ) | ||||
Class R5 | (4,154 | ) | (9,997 | ) | ||||
Class R6 | (5,592 | ) | (357 | ) | ||||
Total distributions from distributable earnings | (15,982,274 | ) | (17,227,369 | ) | ||||
Share transactions–net: | ||||||||
Class A | (24,462,024 | ) | 26,195,598 | |||||
Class C | (10,376,817 | ) | (13,200,059 | ) | ||||
Class R | (929,219 | ) | �� | (71,581 | ) | |||
Class Y | (13,917,530 | ) | (3,018,631 | ) | ||||
Class R5 | (21,428 | ) | (241,468 | ) | ||||
Class R6 | 220,424 | 129,006 | ||||||
Net increase (decrease) in net assets resulting from share transactions | (49,486,594 | ) | 9,792,865 | |||||
Net increase (decrease) in net assets | (130,186,089 | ) | 31,230,599 | |||||
Net assets: | ||||||||
Beginning of year | 558,154,778 | 526,924,179 | ||||||
End of year | $ | 427,968,689 | $ | 558,154,778 | ||||
See accompanying Notes to Financial Statements which are an integral part of the financial statements.
11 Invesco Income Allocation Fund |
The following schedule presents financial highlights for a share of the Fund outstanding throughout the periods indicated.
| Net asset value, beginning of period | Net investment income(a) | Net gains (losses) on securities (both realized and unrealized) | Total from investment operations | Dividends from net investment income | Distributions from net realized gains | Total distributions | Net asset value, end | Total return (b) | Net assets, end of period (000’s omitted) | Ratio of to average net assets | Ratio of expenses to average net assets without fee waivers and/or expenses absorbed | Ratio of net to average | Portfolio turnover (d) | |||||||||||||||||||||||||||||||||||||||||||
Class A |
| |||||||||||||||||||||||||||||||||||||||||||||||||||||||
Year ended 12/31/22 | $ | 11.84 | $ | 0.35 | $ | (1.73 | ) | $ | (1.38 | ) | $ | (0.36 | ) | $ | – | $ | (0.36 | ) | $ | 10.10 | (11.78 | )% | $ | 366,254 | 0.37 | % | 0.43 | % | 3.25 | % | 30 | % | ||||||||||||||||||||||||
Year ended 12/31/21 | 11.37 | 0.34 | 0.51 | 0.85 | (0.38 | ) | – | (0.38 | ) | 11.84 | 7.56 | 458,085 | 0.25 | 0.42 | 2.90 | 16 | ||||||||||||||||||||||||||||||||||||||||
Year ended 12/31/20 | 11.60 | 0.40 | (0.17 | ) | 0.23 | (0.46 | ) | (0.00 | ) | (0.46 | ) | 11.37 | 2.33 | 414,703 | 0.25 | 0.43 | 3.65 | 66 | ||||||||||||||||||||||||||||||||||||||
Year ended 12/31/19 | 10.76 | 0.49 | 1.12 | 1.61 | (0.53 | ) | (0.24 | ) | (0.77 | ) | 11.60 | 15.19 | 434,337 | 0.25 | 0.44 | 4.28 | 14 | |||||||||||||||||||||||||||||||||||||||
Year ended 12/31/18 | 11.70 | 0.44 | (0.96 | ) | (0.52 | ) | (0.42 | ) | – | (0.42 | ) | 10.76 | (4.53 | ) | 323,945 | 0.25 | 0.45 | 3.86 | 20 | |||||||||||||||||||||||||||||||||||||
Class C |
| |||||||||||||||||||||||||||||||||||||||||||||||||||||||
Year ended 12/31/22 | 11.85 | 0.27 | (1.73 | ) | (1.46 | ) | (0.28 | ) | – | (0.28 | ) | 10.11 | (12.43 | ) | 29,588 | 1.12 | 1.18 | 2.50 | 30 | |||||||||||||||||||||||||||||||||||||
Year ended 12/31/21 | 11.38 | 0.25 | 0.51 | 0.76 | (0.29 | ) | – | (0.29 | ) | 11.85 | 6.76 | 46,368 | 1.00 | 1.17 | 2.15 | 16 | ||||||||||||||||||||||||||||||||||||||||
Year ended 12/31/20 | 11.61 | 0.31 | (0.16 | ) | 0.15 | (0.38 | ) | (0.00 | ) | (0.38 | ) | 11.38 | 1.56 | 57,434 | 1.00 | 1.18 | 2.90 | 66 | ||||||||||||||||||||||||||||||||||||||
Year ended 12/31/19 | 10.78 | 0.41 | 1.10 | 1.51 | (0.44 | ) | (0.24 | ) | (0.68 | ) | 11.61 | 14.22 | 78,374 | 1.00 | 1.19 | 3.53 | 14 | |||||||||||||||||||||||||||||||||||||||
Year ended 12/31/18 | 11.71 | 0.35 | (0.94 | ) | (0.59 | ) | (0.34 | ) | – | (0.34 | ) | 10.78 | (5.15 | ) | 110,370 | 1.00 | 1.20 | 3.11 | 20 | |||||||||||||||||||||||||||||||||||||
Class R |
| |||||||||||||||||||||||||||||||||||||||||||||||||||||||
Year ended 12/31/22 | 11.84 | 0.32 | (1.72 | ) | (1.40 | ) | (0.33 | ) | – | (0.33 | ) | 10.11 | (11.91 | ) | 3,470 | 0.62 | 0.68 | 3.00 | 30 | |||||||||||||||||||||||||||||||||||||
Year ended 12/31/21 | 11.38 | 0.31 | 0.50 | 0.81 | (0.35 | ) | – | (0.35 | ) | 11.84 | 7.20 | 5,115 | 0.50 | 0.67 | 2.65 | 16 | ||||||||||||||||||||||||||||||||||||||||
Year ended 12/31/20 | 11.60 | 0.37 | (0.16 | ) | 0.21 | (0.43 | ) | (0.00 | ) | (0.43 | ) | 11.38 | 2.17 | 4,975 | 0.50 | 0.68 | 3.40 | 66 | ||||||||||||||||||||||||||||||||||||||
Year ended 12/31/19 | 10.77 | 0.46 | 1.11 | 1.57 | (0.50 | ) | (0.24 | ) | (0.74 | ) | 11.60 | 14.80 | 6,847 | 0.50 | 0.69 | 4.03 | 14 | |||||||||||||||||||||||||||||||||||||||
Year ended 12/31/18 | 11.70 | 0.40 | (0.94 | ) | (0.54 | ) | (0.39 | ) | – | (0.39 | ) | 10.77 | (4.68 | ) | 8,601 | 0.50 | 0.70 | 3.61 | 20 | |||||||||||||||||||||||||||||||||||||
Class Y |
| |||||||||||||||||||||||||||||||||||||||||||||||||||||||
Year ended 12/31/22 | 11.83 | 0.38 | (1.73 | ) | (1.35 | ) | (0.38 | ) | – | (0.38 | ) | 10.10 | (11.48 | ) | 28,227 | 0.12 | 0.18 | 3.50 | 30 | |||||||||||||||||||||||||||||||||||||
Year ended 12/31/21 | 11.37 | 0.37 | 0.50 | 0.87 | (0.41 | ) | – | (0.41 | ) | 11.83 | 7.74 | 48,311 | 0.00 | 0.17 | 3.15 | 16 | ||||||||||||||||||||||||||||||||||||||||
Year ended 12/31/20 | 11.60 | 0.42 | (0.16 | ) | 0.26 | (0.49 | ) | (0.00 | ) | (0.49 | ) | 11.37 | 2.59 | 49,435 | 0.00 | 0.18 | 3.90 | 66 | ||||||||||||||||||||||||||||||||||||||
Year ended 12/31/19 | 10.76 | 0.52 | 1.11 | 1.63 | (0.55 | ) | (0.24 | ) | (0.79 | ) | 11.60 | 15.48 | 70,139 | 0.00 | 0.19 | 4.53 | 14 | |||||||||||||||||||||||||||||||||||||||
Year ended 12/31/18 | 11.70 | 0.47 | (0.96 | ) | (0.49 | ) | (0.45 | ) | – | (0.45 | ) | 10.76 | (4.29 | ) | 57,009 | 0.00 | 0.20 | 4.11 | 20 | |||||||||||||||||||||||||||||||||||||
Class R5 |
| |||||||||||||||||||||||||||||||||||||||||||||||||||||||
Year ended 12/31/22 | 11.83 | 0.38 | (1.73 | ) | (1.35 | ) | (0.39 | ) | – | (0.39 | ) | 10.09 | (11.55 | ) | 93 | 0.11 | 0.16 | 3.51 | 30 | |||||||||||||||||||||||||||||||||||||
Year ended 12/31/21 | 11.37 | 0.37 | 0.50 | 0.87 | (0.41 | ) | – | (0.41 | ) | 11.83 | 7.74 | 136 | 0.00 | 0.16 | 3.15 | 16 | ||||||||||||||||||||||||||||||||||||||||
Year ended 12/31/20 | 11.60 | 0.42 | (0.16 | ) | 0.26 | (0.49 | ) | (0.00 | ) | (0.49 | ) | 11.37 | 2.59 | 367 | 0.00 | 0.16 | 3.90 | 66 | ||||||||||||||||||||||||||||||||||||||
Year ended 12/31/19 | 10.77 | 0.52 | 1.10 | 1.62 | (0.55 | ) | (0.24 | ) | (0.79 | ) | 11.60 | 15.37 | 1,712 | 0.00 | 0.16 | 4.53 | 14 | |||||||||||||||||||||||||||||||||||||||
Year ended 12/31/18 | 11.70 | 0.47 | (0.95 | ) | (0.48 | ) | (0.45 | ) | – | (0.45 | ) | 10.77 | (4.20 | ) | 1,807 | 0.00 | 0.18 | 4.11 | 20 | |||||||||||||||||||||||||||||||||||||
Class R6 |
| |||||||||||||||||||||||||||||||||||||||||||||||||||||||
Year ended 12/31/22 | 11.83 | 0.38 | (1.73 | ) | (1.35 | ) | (0.39 | ) | – | (0.39 | ) | 10.09 | (11.51 | ) | 337 | 0.06 | 0.09 | 3.56 | 30 | |||||||||||||||||||||||||||||||||||||
Year ended 12/31/21 | 11.36 | 0.37 | 0.51 | 0.88 | (0.41 | ) | – | (0.41 | ) | 11.83 | 7.83 | 139 | 0.00 | 0.12 | 3.15 | 16 | ||||||||||||||||||||||||||||||||||||||||
Year ended 12/31/20 | 11.60 | 0.45 | (0.20 | ) | 0.25 | (0.49 | ) | (0.00 | ) | (0.49 | ) | 11.36 | 2.50 | 10 | 0.00 | 0.14 | 3.90 | 66 | ||||||||||||||||||||||||||||||||||||||
Year ended 12/31/19 | 10.77 | 0.53 | 1.09 | 1.62 | (0.55 | ) | (0.24 | ) | (0.79 | ) | 11.60 | 15.37 | 187 | 0.00 | 0.13 | 4.53 | 14 | |||||||||||||||||||||||||||||||||||||||
Year ended 12/31/18 | 11.70 | 0.47 | (0.95 | ) | (0.48 | ) | (0.45 | ) | – | (0.45 | ) | 10.77 | (4.20 | ) | 145 | 0.00 | 0.15 | 4.11 | 20 | |||||||||||||||||||||||||||||||||||||
| (a) | Calculated using average shares outstanding. |
| (b) | Includes adjustments in accordance with accounting principles generally accepted in the United States of America and as such, the net asset value for financial reporting purposes and the returns based upon those net asset values may differ from the net asset value and returns for shareholder transactions. Does not include sales charges and is not annualized for periods less than one year, if applicable. |
| (c) | In addition to the fees and expenses which the Fund bears directly; the Fund indirectly bears a pro rata share of the fees and expenses of the underlying funds in which the Fund invests. Because the underlying funds have varied expenses and fee levels and the Fund may own different proportions at different times, the amount of fees and expenses incurred indirectly by the Fund will vary. Estimated underlying fund expenses are not expenses that are incurred directly by your Fund. They are expenses that are incurred directly by the underlying funds and are deducted from the value of the funds your Fund invests in. The effect of the estimated underlying fund expenses that you bear indirectly is included in your Fund’s total return. Estimated acquired fund fees from underlying funds were 0.42%, 0.45%, 0.51%, 0.52% and 0.56% for the years ended December 31, 2022, 2021, 2020, 2019 and 2018, respectively. |
| (d) | Portfolio turnover is calculated at the fund level and is not annualized for periods less than one year, if applicable. |
See accompanying Notes to Financial Statements which are an integral part of the financial statements.
| 12 Invesco Income Allocation Fund |
December 31, 2022
NOTE 1–Significant Accounting Policies
Invesco Income Allocation Fund (the “Fund”) is a series portfolio of AIM Growth Series (Invesco Growth Series) (the “Trust”). The Trust is a Delaware statutory trust registered under the Investment Company Act of 1940, as amended (the “1940 Act”), as an open-end series management investment company authorized to issue an unlimited number of shares of beneficial interest. Information presented in these financial statements pertains only to the Fund. Matters affecting the Fund or each class will be voted on exclusively by the shareholders of the Fund or each class.
The Fund’s investment objective is current income and, secondarily, growth of capital.
The Fund is a “fund of funds”, in that it invests in other mutual funds (“underlying funds”) advised by Invesco Advisers, Inc. (the “Adviser” or “Invesco”) and exchange-traded funds advised by Invesco Capital Management LLC (“Invesco Capital”), an affiliate of Invesco. Invesco and Invesco Capital are affiliates of each other as they are indirect, wholly-owned subsidiaries of Invesco Ltd. Invesco may change the Fund’s asset class allocations, the underlying funds or the target weightings in the underlying funds without shareholder approval. The underlying funds may engage in a number of investment techniques and practices, which involve certain risks. Each underlying fund’s accounting policies are outlined in the underlying fund’s financial statements and are publicly available.
The Fund currently consists of six different classes of shares: Class A, Class C, Class R, Class Y, Class R5 and Class R6. Class Y shares are available only to certain investors. Class A shares are sold with a front-end sales charge unless certain waiver criteria are met. Under certain circumstances, load waived shares may be subject to contingent deferred sales charges (“CDSC”). Class C shares are sold with a CDSC. Class R, Class Y, Class R5 and Class R6 shares are sold at net asset value. Class C shares held for eight years after purchase are eligible for automatic conversion into Class A shares of the same Fund (the “Conversion Feature”). The automatic conversion pursuant to the Conversion Feature will generally occur at the end of the month following the eighth anniversary after a purchase of Class C shares.
The Fund is an investment company and accordingly follows the investment company accounting and reporting guidance in accordance with Financial Accounting Standards Board Accounting Standards Codification Topic 946, Financial Services – Investment Companies.
The following is a summary of the significant accounting policies followed by the Fund in the preparation of its financial statements.
| A. | Security Valuations – Securities of investment companies listed or traded on an exchange are generally valued at the trade price or official closing price that day as of the close of the exchange where the security is principally traded, or lacking any trades or official closing price on a particular day, the security may be valued at the closing bid price on that day. Securities of investment companies that are not exchange-traded (e.g., open-end mutual funds) are valued using such company’s end-of-business-day net asset value per share. Securities in the underlying funds, including restricted securities, are valued in accordance with the valuation policy of such fund. The policies of the underlying funds affiliated with the Fund, as a result of having the same investment adviser, are set forth below. |
A security listed or traded on an exchange is generally valued at its trade price or official closing price that day as of the close of the exchange where the security is principally traded, or lacking any trades or official closing price on a particular day, the security may be valued at the closing bid price on that day. Securities traded in the over-the-counter market are valued based on prices furnished by independent pricing services or market makers. When such securities are valued using prices provided by an independent pricing service they may be considered fair valued. Futures contracts are valued at the daily settlement price set by an exchange on which they are principally traded. U.S. exchange-traded options are valued at the mean between the last bid and asked prices from the exchange on which they are principally traded. Non-U.S. exchange-traded options are valued at the final settlement price set by the exchange on which they trade. Options not listed on an exchange and swaps generally are valued using pricing provided from independent pricing services.
Variable rate senior loan interests are fair valued using quotes provided by an independent pricing service. Quotes provided by the pricing service may reflect appropriate factors such as ratings, tranche type, industry, company performance, spread, individual trading characteristics, institution-size trading in similar groups of securities and other market data.
Securities of investment companies that are not exchange-traded (e.g., open-end mutual funds) are valued using such company’s end-of-business-day net asset value per share.
Deposits, other obligations of U.S. and non-U.S. banks and financial institutions are valued at their daily account value.
Fixed income securities (including convertible debt securities) generally are valued on the basis of prices provided by independent pricing services. Prices provided by the pricing service may be determined without exclusive reliance on quoted prices, and may reflect appropriate factors such as institution-size trading in similar groups of securities, developments related to specific securities, dividend rate (for unlisted equities), yield (for debt obligations), quality, type of issue, coupon rate (for debt obligations), maturity (for debt obligations), individual trading characteristics and other market data. Pricing services generally value debt obligations assuming orderly transactions of institutional round lot size, but a fund may hold or transact in the same securities in smaller, odd lot sizes. Odd lots often trade at lower prices than institutional round lots, and their value may be adjusted accordingly. Debt obligations are subject to interest rate and credit risks. In addition, all debt obligations involve some risk of default with respect to interest and/or principal payments.
Swap agreements are fair valued using an evaluated quote, if available, provided by an independent pricing service. Evaluated quotes provided by the pricing service are valued based on a model which may include end-of-day net present values, spreads, ratings, industry, company performance and returns of referenced assets. Centrally cleared swap agreements are valued at the daily settlement price determined by the relevant exchange or clearinghouse.
Foreign securities’ (including foreign exchange contracts) prices are converted into U.S. dollar amounts using the applicable exchange rates as of the close of the New York Stock Exchange (“NYSE”). If market quotations are available and reliable for foreign exchange-traded equity securities, the securities will be valued at the market quotations. The Adviser may use various pricing services to obtain market quotations as well as fair value prices. Because trading hours for certain foreign securities end before the close of the NYSE, closing market quotations may become not representative of market value in the Adviser’s judgment (“unreliable”). If, between the time trading ends on a particular security and the close of the customary trading session on the NYSE, a significant event occurs that makes the closing price of the security unreliable, the Adviser may fair value the security. If the event is likely to have affected the closing price of the security, the security will be valued at fair value in good faith in accordance with Board- approved policies and related Adviser procedures (“Valuation Procedures”). Adjustments to closing prices to reflect fair value may also be based on a screening process of an independent pricing service to indicate the degree of certainty, based on historical data, that the closing price in the principal market where a foreign security trades is not the current value as of the close of the NYSE. Foreign securities’ prices meeting the degree of certainty that the price is not reflective of current value will be priced at the indication of fair value from the independent pricing service. Multiple factors may be considered by the independent pricing service in determining adjustments to reflect fair value and may include information relating to sector indices, American Depositary Receipts and domestic and foreign index futures. Foreign securities may have additional risks including exchange rate changes, potential for sharply devalued currencies and high inflation, political and economic upheaval, the relative lack of issuer information, relatively low market liquidity and the potential lack of strict financial and accounting controls and standards.
Unlisted securities will be valued using prices provided by independent pricing services or by another method that the Adviser, in its judgment, believes better reflects the security’s fair value in accordance with the Valuation Procedures.
Securities for which market prices are not provided by any of the above methods may be valued based upon quotes furnished by independent sources. The last bid price may be used to value equity securities. The mean between the last bid and asked prices may be used to value debt obligations, including corporate loans.
| 13 Invesco Income Allocation Fund |
Securities for which market quotations are not readily available are fair valued by the Adviser in accordance with the Valuation Procedures. If a fair value price provided by a pricing service is unreliable, the Adviser will fair value the security using the Valuation Procedures. Issuer specific events, market trends, bid/asked quotes of brokers and information providers and other market data may be reviewed in the course of making a good faith determination of a security’s fair value.
The Fund may invest in securities that are subject to interest rate risk, meaning the risk that the prices will generally fall as interest rates rise and, conversely, the prices will generally rise as interest rates fall. Specific securities differ in their sensitivity to changes in interest rates depending on their individual characteristics. Changes in interest rates may result in increased market volatility, which may affect the value and/or liquidity of certain Fund investments.
Valuations change in response to many factors including the historical and prospective earnings of the issuer, the value of the issuer’s assets, general market conditions which are not specifically related to the particular issuer, such as real or perceived adverse economic conditions, changes in the general outlook for revenues or corporate earnings, changes in interest or currency rates, regional or global instability, natural or environmental disasters, widespread disease or other public health issues, war, acts of terrorism, significant governmental actions or adverse investor sentiment generally and market liquidity. Because of the inherent uncertainties of valuation, the values reflected in the financial statements may materially differ from the value received upon actual sale of those investments.
The price the Fund could receive upon the sale of any investment may differ from the Adviser’s valuation of the investment, particularly for securities that are valued using a fair valuation technique. When fair valuation techniques are applied, the Adviser uses available information, including both observable and unobservable inputs and assumptions, to determine a methodology that will result in a valuation that the Adviser believes approximates market value. Fund securities that are fair valued may be subject to greater fluctuation in their value from one day to the next than would be the case if market quotations were used. Because of the inherent uncertainties of valuation, and the degree of subjectivity in such decisions, the Fund could realize a greater or lesser than expected gain or loss upon the sale of the investment.
| B. | Securities Transactions and Investment Income – Securities transactions are accounted for on a trade date basis. Realized gains or losses on sales are computed on the basis of specific identification of the securities sold. Distributions from ordinary income from underlying funds, if any, are recorded as dividend income on the ex-dividend date. Distributions from gains from underlying funds, if any, are recorded as realized gains on the ex-dividend date. The following policies are followed by the underlying funds: Interest income (net of withholding tax, if any) is recorded on an accrual basis from settlement date and includes coupon interest and amortization of premium and accretion of discount on debt securities as applicable. Pay-in-kind interest income and non-cash dividend income received in the form of securities in-lieu of cash are recorded at the fair value of the securities received. Paydown gains and losses on mortgage and asset-backed securities are recorded as adjustments to interest income. |
The Fund may periodically participate in litigation related to the Fund’s investments. As such, the Fund may receive proceeds from litigation settlements. Any proceeds received are included in the Statement of Operations as realized gain (loss) for investments no longer held and as unrealized gain (loss) for investments still held.
The Fund allocates income and realized and unrealized capital gains and losses to a class based on the relative net assets of each class.
| C. | Distributions – Distributions from net investment income, if any, are declared and paid monthly. Distributions from net realized capital gain, if any, are generally declared and paid annually and recorded on the ex-dividend date. The Fund may elect to treat a portion of the proceeds from redemptions as distributions for federal income tax purposes. |
| D. | Federal Income Taxes – The Fund intends to comply with the requirements of Subchapter M of the Internal Revenue Code of 1986, as amended (the “Internal Revenue Code”), necessary to qualify as a regulated investment company and to distribute substantially all of the Fund’s taxable earnings to shareholders. As such, the Fund will not be subject to federal income taxes on otherwise taxable income (including net realized capital gain) that is distributed to shareholders. Therefore, no provision for federal income taxes is recorded in the financial statements. |
The Fund recognizes the tax benefits of uncertain tax positions only when the position is more likely than not to be sustained. Management has analyzed the Fund’s uncertain tax positions and concluded that no liability for unrecognized tax benefits should be recorded related to uncertain tax positions. Management is not aware of any tax positions for which it is reasonably possible that the total amounts of unrecognized tax benefits will change materially in the next 12 months.
The Fund files tax returns in the U.S. Federal jurisdiction and certain other jurisdictions. Generally, the Fund is subject to examinations by such taxing authorities for up to three years after the filing of the return for the tax period.
| E. | Expenses – Expenses included in the accompanying financial statements reflect the expenses of the Fund and do not include any expenses of the underlying funds. The effects of the underlying funds expenses are included in the realized and unrealized gain/loss on the investments in the underlying funds. Estimated expenses of the underlying funds are discussed further within the Financial Highlights. |
Fees provided for under the Rule 12b-1 plan of a particular class of the Fund and which are directly attributable to that class are charged to the operations of such class. Transfer agency fees and expenses and other shareholder recordkeeping fees and expenses attributable to Class R5 and Class R6 are allocated based on relative net assets of Class R5 and Class R6. Transfer agency fees and expenses and other shareholder recordkeeping fees and expenses relating to all other classes are allocated among those classes based on relative net assets. All other expenses are allocated among the classes based on relative net assets.
| F. | Accounting Estimates – The preparation of financial statements in conformity with accounting principles generally accepted in the United States of America (“GAAP”) requires management to make estimates and assumptions that affect the reported amounts of assets and liabilities at the date of the financial statements and the reported amounts of revenues and expenses during the reporting period including estimates and assumptions related to taxation. Actual results could differ from those estimates by a significant amount. In addition, the Fund monitors for material events or transactions that may occur or become known after the period-end date and before the date the financial statements are released to print. |
| G. | Indemnifications – Under the Trust’s organizational documents, each Trustee, officer, employee or other agent of the Trust is indemnified against certain liabilities that may arise out of the performance of their duties to the Fund. Additionally, in the normal course of business, the Fund enters into contracts, including the Fund’s servicing agreements, that contain a variety of indemnification clauses. The Fund’s maximum exposure under these arrangements is unknown as this would involve future claims that may be made against the Fund that have not yet occurred. The risk of material loss as a result of such indemnification claims is considered remote. |
| H. | Securities Lending – The Fund may lend portfolio securities having a market value up to one-third of the Fund’s total assets. Such loans are secured by collateral equal to no less than the market value of the loaned securities determined daily by the securities lending provider. Such collateral will be cash or debt securities issued or guaranteed by the U.S. Government or any of its sponsored agencies. Cash collateral received in connection with these loans is invested in short-term money market instruments or affiliated, unregistered investment companies that comply with Rule 2a-7 under the 1940 Act and money market funds (collectively, “affiliated money market funds”) and is shown as such on the Schedule of Investments. The Fund bears the risk of loss with respect to the investment of collateral. It is the Fund’s policy to obtain additional collateral from or return excess collateral to the borrower by the end of the next business day, following the valuation date of the securities loaned. Therefore, the value of the collateral held may be temporarily less than the value of the securities on loan. When loaning securities, the Fund retains certain benefits of owning the securities, including the economic equivalent of dividends or interest generated by the security. Lending securities entails a risk of loss to the Fund if, and to the extent that, the market value of the securities loaned were to increase and the borrower did not increase the collateral accordingly, and the borrower failed to return the securities. The securities loaned are subject to termination at the option of the borrower or the Fund. Upon termination, the borrower will return to the Fund the securities loaned and the Fund will return the collateral. Upon the failure of the borrower to return the securities, collateral may be liquidated and the securities may be purchased on the open market to replace the loaned securities. The Fund could experience delays and costs in gaining access to the collateral and the securities may lose value during the delay which could result in potential losses to the Fund. Some of these losses may be indemnified by the lending agent. The Fund bears the risk of any deficiency in the amount of the collateral available for |
| 14 Invesco Income Allocation Fund |
return to the borrower due to any loss on the collateral invested. Dividends received on cash collateral investments for securities lending transactions, which are net of compensation to counterparties, are included in Dividends from affiliated underlying funds on the Statement of Operations. The aggregate value of securities out on loan, if any, is shown as a footnote on the Statement of Assets and Liabilities.
The Adviser serves as an affiliated securities lending agent for the Fund. The Bank of New York Mellon also serves as a lending agent. To the extent the Fund utilizes the Adviser as an affiliated securities lending agent, the Fund conducts its securities lending in accordance with, and in reliance upon, no-action letters issued by the SEC staff that provide guidance on how an affiliate may act as a direct agent lender and receive compensation for those services in a manner consistent with the federal securities laws. For the year ended December 31, 2022, the Fund paid the Adviser $8,632 in fees for securities lending agent services. Fees paid to the Adviser for securities lending agent services, if any, are included in Dividends from affiliated underlying funds on the Statement of Operations.
| I. | Other Risks - Investments in ETFs generally present the same primary risks as an investment in a conventional mutual fund that has the same investment objective, strategy and policies. Investments in ETFs further involve the same risks associated with a direct investment in the types of securities, commodities and/or currencies included in the indices the ETFs are designed to replicate. In addition, shares of an ETF may trade at a market price that is higher or lower than their net asset value and an active trading market in such shares may not develop or continue. Moreover, trading of an ETF’s shares may be halted if the listing exchange’s officials deem such action to be appropriate, the shares are de-listed from the exchange, or the activation of market-wide “circuit breakers” (which are tied to large decreases in stock prices) halts stock trading generally. |
| J. | COVID-19 Risk - The COVID-19 strain of coronavirus has resulted in instances of market closures and dislocations, extreme volatility, liquidity constraints and increased trading costs. Efforts to contain its spread have resulted in travel restrictions, disruptions of healthcare systems, business operations (including business closures) and supply chains, layoffs, lower consumer demand and employee availability, and defaults and credit downgrades, among other significant economic impacts that have disrupted global economic activity across many industries. Such economic impacts may exacerbate other pre-existing political, social and economic risks locally or globally and cause general concern and uncertainty. The full economic impact and ongoing effects of COVID-19 (or other future epidemics or pandemics) at the macro-level and on individual businesses are unpredictable and may result in significant and prolonged effects on the Fund’s performance. |
NOTE 2–Advisory Fees and Other Fees Paid to Affiliates
The Trust has entered into a master investment advisory agreement with the Adviser. Under the terms of the investment advisory agreement, the Fund does not pay an advisory fee. However, the Fund pays advisory fees to the Adviser indirectly as a shareholder of the underlying funds.
Under the terms of a master sub-advisory agreement between the Adviser and each of Invesco Asset Management Deutschland GmbH, Invesco Asset Management Limited, Invesco Asset Management (Japan) Limited, Invesco Hong Kong Limited, Invesco Senior Secured Management, Inc. and Invesco Canada Ltd. (collectively, the “Affiliated Sub-Advisers”) the Adviser, not the Fund, will pay 40% of the fees paid to the Adviser to any such Affiliated Sub-Adviser(s) that provide(s) discretionary investment management services to the Fund based on the percentage of assets allocated to such Affiliated Sub-Adviser(s).
Effective May 1, 2022, the Adviser has contractually agreed, through at least June 30, 2023, to reimburse expenses to the extent necessary to limit total annual fund operating expenses after expense reimbursement (excluding certain items discussed below) of Class A, Class C, Class R, Class Y, Class R5 and Class R6 shares to 1.50%, 2.25%, 1.75%, 1.25%, 1.25% and 1.25%, respectively, of the Fund’s average daily net assets (the “expense limits”). Prior to May 1, 2022, the Adviser had contractually agreed, through April 30, 2022, to reimburse expenses to the extent necessary to limit total annual fund operating expenses after expense reimbursement (excluding certain items discussed below) of Class A, Class C, Class R, Class Y, Class R5 and Class R6 shares to 0.25%, 1.00%, 0.50%, 0.00%, 0.00% and 0.00%, respectively, of the Fund’s average daily net assets. In determining the Adviser’s obligation to reimburse expenses, the following expenses are not taken into account, and could cause the total annual fund operating expenses after expense reimbursement to exceed the numbers reflected above: (1) interest; (2) taxes; (3) dividend expense on short sales; (4) extraordinary or non-routine items, including litigation expenses; and (5) expenses that the Fund has incurred but did not actually pay because of an expense offset arrangement. Acquired Fund Fees and Expenses are not operating expenses of the Fund directly, but are fees and expenses, including management fees of the investment companies in which the Fund invests. As a result, the total annual fund operating expenses after expense reimbursement may exceed the expense limits above. Unless Invesco continues the expense reimbursement agreement, it will terminate on June 30, 2023. During its term, the expense reimbursement agreement cannot be terminated or amended to increase the expense limits or reduce the expense reimbursement without approval of the Board of Trustees.
For the year ended December 31, 2022, the Adviser reimbursed class level expenses of $246,272, $24,333, $2,627, $24,481, $59 and $39 of Class A, Class C, Class R, Class Y, Class R5 and Class R6 shares, respectively.
The Trust has entered into a master administrative services agreement with Invesco pursuant to which the Fund has agreed to pay Invesco for certain administrative costs incurred in providing accounting services to the Fund. For the year ended
December 31, 2022, expenses incurred under the agreement are shown in the Statement of Operations as Administrative services fees. Invesco has entered into a sub-administration agreement whereby State Street Bank and Trust Company (“SSB”) serves as fund accountant and provides certain administrative services to the Fund. Pursuant to a custody agreement with the Trust on behalf of the Fund, SSB also serves as the Fund’s custodian.
The Trust has entered into a transfer agency and service agreement with Invesco Investment Services, Inc. (“IIS”) pursuant to which the Fund has agreed to pay IIS a fee for providing transfer agency and shareholder services to the Fund and reimburse IIS for certain expenses incurred by IIS in the course of providing such services. IIS may make payments to intermediaries that provide omnibus account services, sub-accounting services and/or networking services. All fees payable by IIS to intermediaries that provide omnibus account services or sub-accounting services are charged back to the Fund, subject to certain limitations approved by the Trust’s Board of Trustees. For the year ended December 31, 2022, expenses incurred under the agreement are shown in the Statement of Operations as Transfer agent fees.
The Trust has entered into master distribution agreements with Invesco Distributors, Inc. (“IDI”) to serve as the distributor for the Class A, Class C, Class R, Class Y, Class R5 and Class R6 shares of the Fund. The Trust has adopted plans pursuant to Rule 12b-1 under the 1940 Act with respect to the Fund’s Class A, Class C and Class R shares (collectively, the “Plans”). The Fund, pursuant to the Plans, pays IDI compensation at the annual rate of 0.25% of the Fund’s average daily net assets of Class A shares, 1.00% of the average daily net assets of Class C shares and 0.50% of the average daily net assets of Class R shares. The fees are accrued daily and paid monthly. Of the Plan payments, up to 0.25% of the average daily net assets of each class of shares may be paid to furnish continuing personal shareholder services to customers who purchase and own shares of such classes. Any amounts not paid as a service fee under the Plans would constitute an asset-based sales charge. Rules of the Financial Industry Regulatory Authority (“FINRA”) impose a cap on the total sales charges, including asset-based sales charges, that may be paid by any class of shares of the Fund. For the year ended December 31, 2022, expenses incurred under the Plans are shown in the Statement of Operations as Distribution fees.
Front-end sales commissions and CDSC (collectively, the “sales charges”) are not recorded as expenses of the Fund. Front-end sales commissions are deducted from proceeds from the sales of Fund shares prior to investment in Class A shares of the Fund. CDSC are deducted from redemption proceeds prior to remittance to the shareholder. During the year ended December 31, 2022, IDI advised the Fund that IDI retained $26,397 in front-end sales commissions from the sale of Class A shares and $71,881 and $235 from Class A and Class C shares, respectively, for CDSC imposed upon redemptions by shareholders.
The underlying Invesco Funds pay no distribution fees for Class R6 shares and the Funds pay no sales loads or other similar compensation to IDI for acquiring underlying fund shares.
Certain officers and trustees of the Trust are officers and directors of the Adviser, IIS and/or IDI.
| 15 Invesco Income Allocation Fund |
NOTE 3–Additional Valuation Information
GAAP defines fair value as the price that would be received to sell an asset or paid to transfer a liability in an orderly transaction between market participants at the measurement date, under current market conditions. GAAP establishes a hierarchy that prioritizes the inputs to valuation methods, giving the highest priority to readily available unadjusted quoted prices in an active market for identical assets (Level 1) and the lowest priority to significant unobservable inputs (Level 3), generally when market prices are not readily available. Based on the valuation inputs, the securities or other investments are tiered into one of three levels. Changes in valuation methods may result in transfers in or out of an investment’s assigned level:
Level 1 – | Prices are determined using quoted prices in an active market for identical assets. | |
Level 2 – | Prices are determined using other significant observable inputs. Observable inputs are inputs that other market participants may use in pricing a security. These may include quoted prices for similar securities, interest rates, prepayment speeds, credit risk, yield curves, loss severities, default rates, discount rates, volatilities and others. | |
Level 3 – | Prices are determined using significant unobservable inputs. In situations where quoted prices or observable inputs are unavailable (for example, when there is little or no market activity for an investment at the end of the period), unobservable inputs may be used. Unobservable inputs reflect the Adviser’s assumptions about the factors market participants would use in determining fair value of the securities or instruments and would be based on the best available information. |
The following is a summary of the tiered valuation input levels, as of December 31, 2022. The level assigned to the securities valuations may not be an indication of the ri’sk or liquidity associated with investing in those securities. Because of the inherent uncertainties of valuation, the values reflected in the financial statements may materially differ from the value received upon actual sale of those investments.
| Level 1 | Level 2 | Level 3 | Total | |||||||||||
| ||||||||||||||
Investments in Securities |
| |||||||||||||
Affiliated Issuers | $ | 427,610,142 | $ | – | $– | $ | 427,610,142 | |||||||
| ||||||||||||||
Money Market Funds | 23 | 7,403,947 | – | 7,403,970 | ||||||||||
Total Investments | $ | 427,610,165 | $ | 7,403,947 | $– | $ | 435,014,112 | |||||||
NOTE 4–Expense Offset Arrangement(s)
The expense offset arrangement is comprised of transfer agency credits which result from balances in demand deposit accounts used by the transfer agent for clearing shareholder transactions. For the year ended December 31, 2022, the Fund received credits from this arrangement, which resulted in the reduction of the Fund’s total expenses of $1,210.
NOTE 5–Trustees’ and Officers’ Fees and Benefits
Trustees’ and Officers’ Fees and Benefits include amounts accrued by the Fund to pay remuneration to certain Trustees and Officers of the Fund. Trustees have the option to defer compensation payable by the Fund, and Trustees’ and Officers’ Fees and Benefits also include amounts accrued by the Fund to fund such deferred compensation amounts. Those Trustees who defer compensation have the option to select various Invesco Funds in which their deferral accounts shall be deemed to be invested. Finally, certain current Trustees were eligible to participate in a retirement plan that provided for benefits to be paid upon retirement to Trustees over a period of time based on the number of years of service. The Fund may have certain former Trustees who also participate in a retirement plan and receive benefits under such plan. Trustees’ and Officers’ Fees and Benefits include amounts accrued by the Fund to fund such retirement benefits. Obligations under the deferred compensation and retirement plans represent unsecured claims against the general assets of the Fund.
NOTE 6–Cash Balances
The Fund is permitted to temporarily carry a negative or overdrawn balance in its account with SSB, the custodian bank. Such balances, if any at period-end, are shown in the Statement of Assets and Liabilities under the payable caption Amount due custodian. To compensate the custodian bank for such overdrafts, the overdrawn Fund may either (1) leave funds as a compensating balance in the account so the custodian bank can be compensated by earning the additional interest; or (2) compensate by paying the custodian bank at a rate agreed upon by the custodian bank and Invesco, not to exceed the contractually agreed upon rate. The Fund may not purchase additional securities when any borrowings from banks or broker-dealers exceed 5% of the Fund’s total assets, or when any borrowings from an Invesco Fund are outstanding.
NOTE 7–Distributions to Shareholders and Tax Components of Net Assets
Tax Character of Distributions to Shareholders Paid During the Fiscal Years Ended December 31, 2022 and 2021:
| 2022 | 2021 | |||||||
| ||||||||
Ordinary income* | $ | 15,982,274 | $ | 17,227,369 | ||||
| * | Includes short-term capital gain distributions, if any. |
Tax Components of Net Assets at Period-End:
| 2022 | ||||||||
Net unrealized appreciation (depreciation) – investments | $ | (24,581,551 | ) | |||||
Temporary book/tax differences | (33,067 | ) | ||||||
Capital loss carryforward | (24,523,152 | ) | ||||||
Shares of beneficial interest | 477,106,459 | |||||||
Total net assets | $ | 427,968,689 | ||||||
The difference between book-basis and tax-basis unrealized appreciation (depreciation) is due to differences in the timing of recognition of gains and losses on investments for tax and book purposes. The Fund’s net unrealized appreciation (depreciation) difference is attributable primarily to wash sales and partnerships.
The temporary book/tax differences are a result of timing differences between book and tax recognition of income and/or expenses. The Fund’s temporary book/tax differences are the result of the trustee deferral of compensation and retirement plan benefits.
| 16 Invesco Income Allocation Fund |
Capital loss carryforward is calculated and reported as of a specific date. Results of transactions and other activity after that date may affect the amount of capital loss carryforward actually available for the Fund to utilize. The ability to utilize capital loss carryforward in the future may be limited under the Internal Revenue Code and related regulations based on the results of future transactions.
The Fund has a capital loss carryforward as of December 31, 2022, as follows:
| Capital Loss Carryforward* | ||||||||||||
| Expiration | Short-Term | Long-Term | Total | |||||||||
Not subject to expiration | $ | 6,822,310 | $ | 17,700,842 | $ | 24,523,152 | ||||||
| * | Capital loss carryforward is reduced for limitations, if any, to the extent required by the Internal Revenue Code and may be further limited depending upon a variety of factors, including the realization of net unrealized gains or losses as of the date of any reorganization. |
NOTE 8–Investment Transactions
The aggregate amount of investment securities (other than short-term securities, U.S. Government obligations and money market funds, if any) purchased and sold by the Fund during the year ended December 31, 2022 was $145,999,610 and $189,703,698, respectively. Cost of investments, including any derivatives, on a tax basis includes the adjustments for financial reporting purposes as of the most recently completed federal income tax reporting period-end.
| Unrealized Appreciation (Depreciation) of Investments on a Tax Basis | ||||||||
Aggregate unrealized appreciation of investments |
| $ | 23,316,988 | |||||
Aggregate unrealized (depreciation) of investments |
| (47,898,539 | ) | |||||
Net unrealized appreciation (depreciation) of investments | $ | (24,581,551 | ) | |||||
Cost of investments for tax purposes is $459,595,663.
NOTE 9–Reclassification of Permanent Differences
Primarily as a result of differing book/tax treatment of partnerships, on December 31, 2022, undistributed net investment income was increased by $1,413,142, undistributed net realized gain (loss) was decreased by $1,488,200 and shares of beneficial interest was increased by $75,058. This reclassification had no effect on the net assets of the Fund.
NOTE 10–Share Information
| Summary of Share Activity | ||||||||||||||||
| Year ended | Year ended | |||||||||||||||
| December 31, 2022(a) | December 31, 2021 | |||||||||||||||
|
|
|
| |||||||||||||
| Shares | Amount | Shares | Amount | |||||||||||||
Sold: | ||||||||||||||||
Class A | 7,103,803 | $ | 76,464,730 | 9,211,409 | $ | 107,654,588 | ||||||||||
Class C | 222,019 | 2,404,896 | 245,475 | 2,872,403 | ||||||||||||
Class R | 100,775 | 1,094,491 | 133,067 | 1,548,725 | ||||||||||||
Class Y | 625,101 | 6,744,550 | 1,272,294 | 14,840,514 | ||||||||||||
Class R5 | 6,743 | 77,809 | 6,857 | 79,769 | ||||||||||||
Class R6 | 28,699 | 292,417 | 10,905 | 129,006 | ||||||||||||
Issued as reinvestment of dividends: | ||||||||||||||||
Class A | 1,054,439 | 11,167,729 | 997,757 | 11,646,372 | ||||||||||||
Class C | 73,472 | 780,705 | 88,026 | 1,027,923 | ||||||||||||
Class R | 11,994 | 127,241 | 13,347 | 155,849 | ||||||||||||
Class Y | 70,588 | 752,844 | 92,095 | 1,074,528 | ||||||||||||
Class R5 | 348 | 3,713 | 817 | 9,524 | ||||||||||||
Class R6 | 500 | 5,250 | - | - | ||||||||||||
Automatic conversion of Class C shares to Class A shares: | ||||||||||||||||
Class A | 247,882 | 2,658,020 | 286,043 | 3,335,367 | ||||||||||||
Class C | (247,606 | ) | (2,658,020 | ) | (285,644 | ) | (3,335,367 | ) | ||||||||
Reacquired: | ||||||||||||||||
Class A | (10,839,541 | ) | (114,752,503 | ) | (8,270,318 | ) | (96,440,729 | ) | ||||||||
Class C | (1,034,470 | ) | (10,904,398 | ) | (1,180,531 | ) | (13,765,018 | ) | ||||||||
Class R | (201,243 | ) | (2,150,951 | ) | (151,892 | ) | (1,776,155 | ) | ||||||||
Class Y | (1,982,322 | ) | (21,414,924 | ) | (1,630,879 | ) | (18,933,673 | ) | ||||||||
Class R5 | (9,343 | ) | (102,950 | ) | (28,467 | ) | (330,761 | ) | ||||||||
Class R6 | (7,583 | ) | (77,243 | ) | - | - | ||||||||||
Net increase (decrease) in share activity | (4,775,745 | ) | $ | (49,486,594 | ) | 810,361 | $ | 9,792,865 | ||||||||
| (a) | There are entities that are record owners of more than 5% of the outstanding shares of the Fund and in the aggregate own 60% of the outstanding shares of the Fund. IDI has an agreement with these entities to sell Fund shares. The Fund, Invesco and/or Invesco affiliates may make payments to these entities, which are considered to be related to the Fund, for providing services to the Fund, Invesco and/or Invesco affiliates including but not limited to services such as securities brokerage, distribution, third party record keeping and account servicing. The Fund has no knowledge as to whether all or any portion of the shares owned of record by these entities are also owned beneficially. |
| 17 Invesco Income Allocation Fund |
Report of Independent Registered Public Accounting Firm
To the Board of Trustees of AIM Growth Series (Invesco Growth Series) and Shareholders of Invesco Income Allocation Fund
Opinion on the Financial Statements
We have audited the accompanying statement of assets and liabilities, including the schedule of investments, of Invesco Income Allocation Fund (one of the funds constituting AIM Growth Series (Invesco Growth Series), referred to hereafter as the “Fund”) as of December 31, 2022, the related statement of operations for the year ended December 31, 2022, the statement of changes in net assets for each of the two years in the period ended December 31, 2022, including the related notes, and the financial highlights for each of the five years in the period ended December 31, 2022 (collectively referred to as the “financial statements”). In our opinion, the financial statements present fairly, in all material respects, the financial position of the Fund as of December 31, 2022, the results of its operations for the year then ended, the changes in its net assets for each of the two years in the period ended December 31, 2022 and the financial highlights for each of the five years in the period ended December 31, 2022 in conformity with accounting principles generally accepted in the United States of America.
Basis for Opinion
These financial statements are the responsibility of the Fund’s management. Our responsibility is to express an opinion on the Fund’s financial statements based on our audits. We are a public accounting firm registered with the Public Company Accounting Oversight Board (United States) (PCAOB) and are required to be independent with respect to the Fund in accordance with the U.S. federal securities laws and the applicable rules and regulations of the Securities and Exchange Commission and the PCAOB.
We conducted our audits of these financial statements in accordance with the standards of the PCAOB. Those standards require that we plan and perform the audit to obtain reasonable assurance about whether the financial statements are free of material misstatement, whether due to error or fraud.
Our audits included performing procedures to assess the risks of material misstatement of the financial statements, whether due to error or fraud, and performing procedures that respond to those risks. Such procedures included examining, on a test basis, evidence regarding the amounts and disclosures in the financial statements. Our audits also included evaluating the accounting principles used and significant estimates made by management, as well as evaluating the overall presentation of the financial statements. Our procedures included confirmation of securities owned as of December 31, 2022 by correspondence with the custodian, transfer agent and broker; when replies were not received from the broker, we performed other auditing procedures. We believe that our audits provide a reasonable basis for our opinion.
/s/PricewaterhouseCoopers LLP
Houston, Texas
February 22, 2023
We have served as the auditor of one or more of the investment companies in the Invesco group of investment companies since at least 1995. We have not been able to determine the specific year we began serving as auditor.
| 18 Invesco Income Allocation Fund |
Calculating your ongoing Fund expenses
Example
As a shareholder of the Fund, you incur two types of costs: (1) transaction costs, which may include sales charges (loads) on purchase payments or contingent deferred sales charges on redemptions, if any; and (2) ongoing costs, including management fees, distribution and/or service (12b-1) fees, and other Fund expenses. This example is intended to help you understand your ongoing costs (in dollars) of investing in the Fund and to compare these costs with ongoing costs of investing in other mutual funds. The example is based on an investment of $1,000 invested at the beginning of the period and held for the entire period July 1, 2022 through December 31, 2022.
Actual expenses
The table below provides information about actual account values and actual expenses. You may use the information in this table, together with the amount you invested, to estimate the expenses that you paid over the period. Simply divide your account value by $1,000 (for example, an $8,600 account value divided by $1,000 = 8.6), then multiply the result by the number in the table under the heading entitled “Actual Expenses Paid During Period” to estimate the expenses you paid on your account during this period.
Hypothetical example for comparison purposes
The table below also provides information about hypothetical account values and hypothetical expenses based on the Fund’s actual expense ratio and an assumed rate of return of 5% per year before expenses, which is not the Fund’s actual return.
The hypothetical account values and expenses may not be used to estimate the actual ending account balance or expenses you paid for the period. You may use this information to compare the ongoing costs of investing in the Fund and other funds. To do so, compare this 5% hypothetical example with the 5% hypothetical examples that appear in the shareholder reports of the other funds.
Please note that the expenses shown in the table are meant to highlight your ongoing costs only and do not reflect any transaction costs, such as sales charges (loads) on purchase payments or contingent deferred sales charges on redemptions, if any. Therefore, the hypothetical information is useful in comparing ongoing costs only, and will not help you determine the relative total costs of owning different funds. In addition, if these transaction costs were included, your costs would have been higher.
| ACTUAL | HYPOTHETICAL (5% annual return before | Annualized | ||||||||||
| Beginning Account Value (07/01/22) | Ending Account Value (12/31/22)1 | Expenses Paid During Period2 | Ending Account Value (12/31/22) | Expenses Paid During Period2 | ||||||||
Class A | $1,000.00 | $995.90 | $2.21 | $1,022.99 | $2.24 | 0.44% | ||||||
Class C | 1,000.00 | 992.20 | 5.98 | 1,019.21 | 6.06 | 1.19 | ||||||
Class R | 1,000.00 | 994.70 | 3.47 | 1,021.73 | 3.52 | 0.69 | ||||||
Class Y | 1,000.00 | 997.10 | 0.96 | 1,024.25 | 0.97 | 0.19 | ||||||
Class R5 | 1,000.00 | 996.30 | 0.96 | 1,024.25 | 0.97 | 0.19 | ||||||
Class R6 | 1,000.00 | 997.60 | 0.45 | 1,024.75 | 0.46 | 0.09 | ||||||
| 1 | The actual ending account value is based on the actual total return of the Fund for the period July 1, 2022 through December 31, 2022, after actual expenses and will differ from the hypothetical ending account value which is based on the Fund’s expense ratio and a hypothetical annual return of 5% before expenses. |
| 2 | Expenses are equal to the Fund’s annualized expense ratio as indicated above multiplied by the average account value over the period, multiplied by 184/365 to reflect the most recent fiscal half year. |
| 19 Invesco Income Allocation Fund |
Form 1099-DIV, Form 1042-S and other year–end tax information provide shareholders with actual calendar year amounts that should be included in their tax returns. Shareholders should consult their tax advisers.
The following distribution information is being provided as required by the Internal Revenue Code or to meet a specific state’s requirement.
The Fund designates the following amounts or, if subsequently determined to be different, the maximum amount allowable for its fiscal year ended December 31, 2022:
Federal and State Income Tax | ||||||||
Qualified Dividend Income* | 25.36 | % | ||||||
Corporate Dividends Received Deduction* | 17.32 | % | ||||||
U.S. Treasury Obligations* | 6.77 | % | ||||||
Qualified Business Income* | 2.19 | % | ||||||
Business Interest Income* | 46.15 | % | ||||||
| * | The above percentages are based on ordinary income dividends paid to shareholders during the Fund’s fiscal year. |
| 20 Invesco Income Allocation Fund |
The address of each trustee and officer is AIM Growth Series (Invesco Growth Series) (the “Trust”), 11 Greenway Plaza, Suite 1000, Houston, Texas 77046-1173. The trustees serve for the life of the Trust, subject to their earlier death, incapacitation, resignation, retirement or removal as more specifically provided in the Trust’s organizational documents. Each officer serves for a one year term or until their successors are elected and qualified. Column two below includes length of time served with predecessor entities, if any.
Name, Year of Birth and Held with the Trust | Trustee and/or Officer Since | Principal Occupation(s) During Past 5 Years | Number of Funds in Fund Complex | Other Directorship(s) Held by Trustee During Past 5 Years | ||||
| Interested Trustee | ||||||||
| Martin L. Flanagan1 - 1960 Trustee and Vice Chair | 2007 | Executive Director, Chief Executive Officer and President, Invesco Ltd. (ultimate parent of Invesco and a global investment management firm); Trustee and Vice Chair, The Invesco Funds; Vice Chair, Investment Company Institute; and Member of Executive Board, SMU Cox School of Business
Formerly: Advisor to the Board, Invesco Advisers, Inc. (formerly known as Invesco Institutional (N.A.), Inc.); Chairman and Chief Executive Officer, Invesco Advisers, Inc. (registered investment adviser); Director, Chairman, Chief Executive Officer and President, Invesco Holding Company (US), Inc. (formerly IVZ Inc.) (holding company), Invesco Group Services, Inc. (service provider) and Invesco North American Holdings, Inc. (holding company); Director, Chief Executive Officer and President, Invesco Holding Company Limited (parent of Invesco and a global investment management firm); Director, Invesco Ltd.; Chairman, Investment Company Institute and President, Co-Chief Executive Officer, Co-President, Chief Operating Officer and Chief Financial Officer, Franklin Resources, Inc. (global investment management organization) | 189 | None | ||||
| 1 | Mr. Flanagan is considered an interested person (within the meaning of Section 2(a)(19) of the 1940 Act) of the Trust because he is an officer of the Adviser to the Trust, and an officer and a director of Invesco Ltd., ultimate parent of the Adviser. |
| T-1 Invesco Income Allocation Fund |
Trustees and Officers–(continued)
Name, Year of Birth and Held with the Trust | Trustee and/or Officer Since | Principal Occupation(s) During Past 5 Years | Number of Fund Complex | Other Directorship(s) Held by Trustee During Past 5 Years | ||||
| Independent Trustees | ||||||||
| Beth Ann Brown - 1968 Trustee (2019) and Chair (August 2022) | 2019 | Independent Consultant
Formerly: Head of Intermediary Distribution, Managing Director, Strategic Relations, Managing Director, Head of National Accounts, Senior Vice President, National Account Manager and Senior Vice President, Key Account Manager, Columbia Management Investment Advisers LLC; Vice President, Key Account Manager, Liberty Funds Distributor, Inc.; and Trustee of certain Oppenheimer Funds | 189 | Director, Board of Directors of Caron Engineering Inc.; Advisor, Board of Advisors of Caron Engineering Inc.; President and Director, Acton Shapleigh Youth Conservation Corps (non-profit) Formerly: President and Director Director of Grahamtastic Connection (non-profit) | ||||
| Cynthia Hostetler - 1962 Trustee | 2017 | Non-Executive Director and Trustee of a number of public and private business corporations
Formerly: Director, Aberdeen Investment Funds (4 portfolios); Director, Artio Global Investment LLC (mutual fund complex); Director, Edgen Group, Inc. (specialized energy and infrastructure products distributor); Director, Genesee & Wyoming, Inc. (railroads); Head of Investment Funds and Private Equity, Overseas Private Investment Corporation; President, First Manhattan Bancorporation, Inc.; and Attorney, Simpson Thacher & Bartlett LLP | 189 | Resideo Technologies, Inc. (smart home technology); Vulcan Materials Company (construction materials company); Trilinc Global Impact Fund; Textainer Group Holdings, (shipping container leasing company); Investment Company Institute (professional organization); and Independent Directors Council (professional organization) | ||||
Eli Jones - 1961 Trustee | 2016 | Professor and Dean Emeritus, Mays Business School-Texas A&M University
Formerly: Dean of Mays Business School-Texas A&M University; Professor and Dean, Walton College of Business, University of Arkansas and E.J. Ourso College of Business, Louisiana State University; and Director, Arvest Bank | 189 | Insperity, Inc. (formerly known as Administaff) (human resources provider); and Member of Regional Board of Directors and Board of Directors, First Financial Bancorp (regional bank) | ||||
| Elizabeth Krentzman - 1959 Trustee | 2019 | Formerly: Principal and Chief Regulatory Advisor for Asset Management Services and U.S. Mutual Fund Leader of Deloitte & Touche LLP; General Counsel of the Investment Company Institute (trade association); National Director of the Investment Management Regulatory Consulting Practice, Principal, Director and Senior Manager of Deloitte & Touche LLP; Assistant Director of the Division of Investment Management-Office of Disclosure and Investment Adviser Regulation of the U.S. Securities and Exchange Commission and various positions with the Division of Investment Management – Office of Regulatory Policy of the U.S. Securities and Exchange Commission; Associate at Ropes & Gray LLP; and Trustee of certain Oppenheimer Funds | 189 | Formerly: Member of the Cartica Funds Board of Directors (private investment fund); Trustee of the University of Florida National Board Foundation; and Member of the University of Florida Law Center Association, Inc. Board of Trustees, Audit Committee and Membership Committee | ||||
| Anthony J. LaCava, Jr. - 1956 Trustee | 2019 | Formerly: Director and Member of the Audit Committee, Blue Hills Bank (publicly traded financial institution) and Managing Partner, KPMG LLP | 189 | Blue Hills Bank; Chairman, Bentley University; Member, Business School Advisory Council; and Nominating Committee, KPMG LLP | ||||
| Prema Mathai-Davis - 1950 Trustee | 2001 | Retired
Formerly: Co-Founder & Partner of Quantalytics Research, LLC, (a FinTech Investment Research Platform for the Self-Directed Investor); Trustee of YWCA Retirement Fund; CEO of YWCA of the USA; Board member of the NY Metropolitan Transportation Authority; Commissioner of the NYC Department of Aging; and Board member of Johns Hopkins Bioethics Institute | 189 | Member of Board of Positive Planet US (non-profit) and HealthCare Chaplaincy Network (non-profit) | ||||
T-2 Invesco Income Allocation Fund
Trustees and Officers–(continued)
Name, Year of Birth and Held with the Trust | Trustee and/or Officer Since | Principal Occupation(s) During Past 5 Years | Number of Funds in Fund Complex Overseen by Trustee | Other Directorship(s) Held by Trustee During Past 5 Years | ||||
| Independent Trustees–(continued) | ||||||||
Joel W. Motley - 1952 Trustee | 2019 | Director of Office of Finance, Federal Home Loan Bank System; Managing Director of Carmona Motley Inc. (privately held financial advisor); Member of the Council on Foreign Relations and its Finance and Budget Committee; Chairman Emeritus of Board of Human Rights Watch and Member of its Investment Committee; and Member of Investment Committee Board of Historic Hudson Valley (non-profit cultural organization); Member of the Board, Blue Ocean Acquisition Corp.; and Member of the Vestry and the Investment Committee of Trinity Church Wall Street.
Formerly: Managing Director of Public Capital Advisors, LLC (privately held financial advisor); Managing Director of Carmona Motley Hoffman, Inc. (privately held financial advisor); Trustee of certain Oppenheimer Funds; and Director of Columbia Equity Financial Corp. (privately held financial advisor) | 189 | Member of Board of Trust for Mutual Understanding (non-profit promoting the arts and environment); Member of Board of Greenwall Foundation (bioethics research foundation) and its Investment Committee; Member of Board of Friends of the LRC (non-profit legal advocacy); and Board Member and Investment Committee Member of Pulitzer Center for Crisis Reporting (non-profit journalism) | ||||
| Teresa M. Ressel - 1962 Trustee | 2017 | Non-executive director and trustee of a number of public and private business corporations
Formerly: Chief Executive Officer, UBS Securities LLC (investment banking); Chief Operating Officer, UBS AG Americas (investment banking); Sr. Management Team Olayan America, The Olayan Group (international investor/commercial/industrial); Assistant Secretary for Management & Budget and Designated Chief Financial Officer, U.S. Department of Treasury and Director, ON Semiconductor Corporation (semiconductor manufacturing) | 189 | None | ||||
Robert C. Troccoli - 1949 Trustee | 2016 | Retired
Formerly: Adjunct Professor, University of Denver – Daniels College of Business; and Managing Partner, KPMG LLP | 189 | None | ||||
| Daniel S. Vandivort - 1954 Trustee | 2019 | President, Flyway Advisory Services LLC (consulting and property management)
Formerly: President and Chief Investment Officer, previously Head of Fixed Income, Weiss Peck and Greer/Robeco Investment Management; Trustee and Chair, Weiss Peck and Greer Funds Board; and various capacities at CS First Boston including Head of Fixed Income at First Boston Asset Management. | 189 | Formerly: Trustee and Governance Chair, Oppenheimer Funds; Treasurer, Chairman of the Audit and Finance Committee, Huntington Disease Foundation of America | ||||
T-3 Invesco Income Allocation Fund
Trustees and Officers–(continued)
Name, Year of Birth and Position(s) Held with the Trust | Trustee and/or Officer Since | Principal Occupation(s) During Past 5 Years | Number of Funds in Fund Complex Overseen by Trustee | Other Directorship(s) Years | ||||
| Officers | ||||||||
Sheri Morris - 1964 President and Principal Executive Officer | 1999 | Director, Invesco Trust Company; Head of Global Fund Services, Invesco Ltd.; President and Principal Executive Officer, The Invesco Funds; Vice President, Invesco Exchange-Traded Fund Trust, Invesco Exchange-Traded Fund Trust II, Invesco India Exchange-Traded Fund Trust, Invesco Actively Managed Exchange-Traded Fund Trust, Invesco Actively Managed Exchange-Traded Commodity Fund Trust and Invesco Exchange-Traded Self-Indexed Fund Trust; and Vice President, OppenheimerFunds, Inc.
Formerly: Vice President, Treasurer and Principal Financial Officer, The Invesco Funds; Vice President, Invesco AIM Advisers, Inc., Invesco AIM Capital Management, Inc. and Invesco AIM Private Asset Management, Inc.; Assistant Vice President and Assistant Treasurer, The Invesco Funds; Vice President and Assistant Vice President, Invesco Advisers, Inc.; Assistant Vice President, Invesco AIM Capital Management, Inc. and Invesco AIM Private Asset Management, Inc.; Treasurer, Invesco Exchange-Traded Fund Trust, Invesco Exchange-Traded Fund Trust II, Invesco India Exchange-Traded Fund Trust and Invesco Actively Managed Exchange-Traded Fund Trust; and Senior Vice President, Invesco Advisers, Inc. (formerly known as Invesco Institutional (N.A.), Inc.) (registered investment adviser) | N/A | N/A | ||||
Jeffrey H. Kupor - 1968 Senior Vice President, Chief Legal Officer and Secretary | 2018 | Head of Legal of the Americas, Invesco Ltd.; Senior Vice President and Secretary, Invesco Advisers, Inc. (formerly known as Invesco Institutional (N.A.), Inc.) (registered investment adviser); Secretary, Invesco Distributors, Inc. (formerly known as Invesco AIM Distributors, Inc.); Vice President and Secretary, Invesco Investment Services, Inc. (formerly known as Invesco AIM Investment Services, Inc.); Senior Vice President, Chief Legal Officer and Secretary, The Invesco Funds; Secretary and General Counsel, Invesco Investment Advisers LLC (formerly known as Van Kampen Asset Management); Secretary and General Counsel, Invesco Capital Markets, Inc. (formerly known as Van Kampen Funds Inc.); Chief Legal Officer, Invesco Exchange-Traded Fund Trust, Invesco Exchange-Traded Fund Trust II, Invesco India Exchange-Traded Fund Trust, Invesco Actively Managed Exchange-Traded Fund Trust, Invesco Actively Managed Exchange-Traded Commodity Fund Trust and Invesco Exchange-Traded Self-Indexed Fund Trust;; Secretary and Vice President, Harbourview Asset Management Corporation; Secretary and Vice President, OppenheimerFunds, Inc. and Invesco Managed Accounts, LLC; Secretary and Senior Vice President, OFI Global Institutional, Inc.; Secretary and Vice President, OFI SteelPath, Inc.; Secretary and Vice President, Oppenheimer Acquisition Corp.; Secretary and Vice President, Shareholder Services, Inc.; and Secretary and Vice President, Trinity Investment Management Corporation
Formerly: Senior Vice President, Invesco Distributors, Inc.; Secretary and Vice President, Jemstep, Inc.; Head of Legal, Worldwide Institutional, Invesco Ltd.; Secretary and General Counsel, INVESCO Private Capital Investments, Inc.; Senior Vice President, Secretary and General Counsel, Invesco Management Group, Inc. (formerly known as Invesco AIM Management Group, Inc.); Assistant Secretary, INVESCO Asset Management (Bermuda) Ltd.; Secretary and General Counsel, Invesco Private Capital, Inc.;Assistant Secretary and General Counsel, INVESCO Realty, Inc.; Secretary and General Counsel, Invesco Senior Secured Management, Inc.; Secretary, Sovereign G./P. Holdings Inc.; Secretary, Invesco Indexing LLC; and Secretary, W.L. Ross & Co., LLC | N/A | N/A | ||||
| Andrew R. Schlossberg - 1974 Senior Vice President | 2019 | Senior Vice President, Invesco Group Services, Inc.; Head of the Americas and Senior Managing Director, Invesco Ltd.; Director and Senior Vice President, Invesco Advisers, Inc. (formerly known as Invesco Institutional (N.A.), Inc.) (registered investment adviser); Director and Chairman, Invesco Investment Services, Inc. (formerly known as Invesco AIM Investment Services, Inc.) (registered transfer agent); Senior Vice President, The Invesco Funds; and Director, Invesco Investment Advisers LLC (formerly known as Van Kampen Asset Management)
Formerly: Director, President and Chairman, Invesco Insurance Agency, Inc.; Director, Invesco UK Limited; Director and Chief Executive, Invesco Asset Management Limited and Invesco Fund Managers Limited; Assistant Vice President, The Invesco Funds; Senior Vice President, Invesco Advisers, Inc. (formerly known as Invesco Institutional (N.A.), Inc.) (registered investment adviser); Director and Chief Executive, Invesco Administration Services Limited and Invesco Global Investment Funds Limited; Director, Invesco Distributors, Inc.; Head of EMEA, Invesco Ltd.; President, Invesco Actively Managed Exchange-Traded Commodity Fund Trust, Invesco Actively Managed Exchange-Traded Fund Trust, Invesco Exchange-Traded Fund Trust, Invesco Exchange-Traded Fund Trust II and Invesco India Exchange-Traded Fund Trust; and Managing Director and Principal Executive Officer, Invesco Capital Management LLC | N/A | N/A | ||||
T-4 Invesco Income Allocation Fund
Trustees and Officers–(continued)
Name, Year of Birth and Position(s) Held with the Trust | Trustee and/or Officer Since | Principal Occupation(s) During Past 5 Years | Number of Funds in Fund Complex Overseen by Trustee | Other Directorship(s) Years | ||||
| Officers–(continued) | ||||||||
John M. Zerr - 1962 Senior Vice President | 2006 | Chief Operating Officer of the Americas; Senior Vice President, Invesco Advisers, Inc. (formerly known as Invesco Institutional (N.A.), Inc.) (registered investment adviser); Senior Vice President, Invesco Distributors, Inc. (formerly known as Invesco AIM Distributors, Inc.); Director and Vice President, Invesco Investment Services, Inc. (formerly known as Invesco AIM Investment Services, Inc.) Senior Vice President, The Invesco Funds; Managing Director, Invesco Capital Management LLC; Director, Invesco Investment Advisers LLC (formerly known as Van Kampen Asset Management); Senior Vice President, Invesco Capital Markets, Inc. (formerly known as Van Kampen Funds Inc.); Manager, Invesco Indexing LLC; Manager, Invesco Specialized Products, LLC; Member, Invesco Canada Funds Advisory Board; Director, President and Chief Executive Officer, Invesco Corporate Class Inc. (corporate mutual fund company); and Director, Chairman, President and Chief Executive Officer, Invesco Canada Ltd. (formerly known as Invesco Trimark Ltd./Invesco Trimark Ltèe) (registered investment adviser and registered transfer agent); President, Invesco, Inc.; President, Invesco Global Direct Real Estate Feeder GP Ltd.; President, Invesco IP Holdings (Canada) Ltd; President, Invesco Global Direct Real Estate GP Ltd.; President, Invesco Financial Services Ltd. / Services Financiers Invesco Ltée; and Director and Chairman, Invesco Trust Company
Formerly: President, Trimark Investments Ltd/Services Financiers Invesco Ltee; Director and Senior Vice President, Invesco Insurance Agency, Inc.; Director and Senior Vice President, Invesco Management Group, Inc. (formerly known as Invesco AIM Management Group, Inc.); Secretary and General Counsel, Invesco Management Group, Inc. (formerly known as Invesco AIM Management Group, Inc.); Secretary, Invesco Investment Services, Inc. (formerly known as Invesco AIM Investment Services, Inc.); Chief Legal Officer and Secretary, The Invesco Funds; Secretary and General Counsel, Invesco Investment Advisers LLC (formerly known as Van Kampen Asset Management); Secretary and General Counsel, Invesco Capital Markets, Inc. (formerly known as Van Kampen Funds Inc.); Chief Legal Officer, Invesco Exchange-Traded Fund Trust, Invesco Exchange-Traded Fund Trust II, Invesco India Exchange-Traded Fund Trust, Invesco Actively Managed Exchange-Traded Fund Trust, Invesco Actively Managed Exchange-Traded Commodity Fund Trust and Invesco Exchange-Traded Self-Indexed Fund Trust; Secretary, Invesco Indexing LLC; Director, Secretary, General Counsel and Senior Vice President, Van Kampen Exchange Corp.; Director, Vice President and Secretary, IVZ Distributors, Inc. (formerly known as INVESCO Distributors, Inc.); Director and Vice President, INVESCO Funds Group, Inc.; Director and Vice President, Van Kampen Advisors Inc.; Director, Vice President, Secretary and General Counsel, Van Kampen Investor Services Inc.;Director and Secretary, Invesco Distributors, Inc. (formerly known as Invesco AIM Distributors, Inc.); Director, Senior Vice President, General Counsel and Secretary, Invesco AIM Advisers, Inc. and Van Kampen Investments Inc.; Director, Vice President and Secretary, Fund Management Company; Director, Senior Vice President, Secretary, General Counsel and Vice President, Invesco AIM Capital Management, Inc.; and Chief Operating Officer and General Counsel, Liberty Ridge Capital, Inc. (an investment adviser) | N/A | N/A | ||||
Gregory G. McGreevey - 1962 Senior Vice President | 2012 | Senior Managing Director, Invesco Ltd.; Director, Chairman, President, and Chief Executive Officer, Invesco Advisers, Inc. (formerly known as Invesco Institutional (N.A.), Inc.) (registered investment adviser); Director, Invesco Mortgage Capital, Inc. and Invesco Senior Secured Management, Inc.; Senior Vice President, The Invesco Funds; President, SNW Asset Management Corporation and Invesco Managed Accounts, LLC; Chairman and Director, Invesco Private Capital, Inc.; Chairman and Director, INVESCO Private Capital Investments, Inc.; Chairman and Director, INVESCO Realty, Inc.; and Senior Vice President, Invesco Group Services, Inc.
Formerly: Senior Vice President, Invesco Management Group, Inc. and Invesco Advisers, Inc.; Assistant Vice President, The Invesco Funds | N/A | N/A | ||||
| Adrien Deberghes - 1967 Principal Financial Officer, Treasurer and Vice President | 2020 | Head of the Fund Office of the CFO and Fund Administration; Vice President, Invesco Advisers, Inc.; Principal Financial Officer, Treasurer and Vice President, The Invesco Funds; Vice President, Invesco Exchange-Traded Fund Trust, Invesco Exchange-Traded Fund Trust II, Invesco India Exchange-Traded Fund Trust, Invesco Actively Managed Exchange-Traded Fund Trust, Invesco Actively Managed Exchange-Traded Commodity Fund Trust and Invesco Exchange-Traded Self-Indexed Fund Trust
Formerly: Senior Vice President and Treasurer, Fidelity Investments | N/A | N/A | ||||
| Crissie M. Wisdom - 1969 Anti-Money Laundering Compliance Officer | 2013 | Anti-Money Laundering and OFAC Compliance Officer for Invesco U.S. entities including: Invesco Advisers, Inc. and its affiliates, Invesco Capital Markets, Inc., Invesco Distributors, Inc., Invesco Investment Services, Inc., The Invesco Funds, Invesco Capital Management, LLC, Invesco Trust Company; and Fraud Prevention Manager for Invesco Investment Services, Inc. | N/A | N/A | ||||
T-5 Invesco Income Allocation Fund
Trustees and Officers–(continued)
Name, Year of Birth and Position(s) Held with the Trust | Trustee and/or Officer Since | Principal Occupation(s) During Past 5 Years | Number of Funds in Fund Complex Overseen by Trustee | Other Directorship(s) Years | ||||
| Officers–(continued) | ||||||||
| Todd F. Kuehl - 1969 Chief Compliance Officer and Senior Vice President | 2020 | Chief Compliance Officer, Invesco Advisers, Inc. (registered investment adviser); and Chief Compliance Officer and Senior Vice President, The Invesco Funds
Formerly: Managing Director and Chief Compliance Officer, Legg Mason (Mutual Funds); Chief Compliance Officer, Legg Mason Private Portfolio Group (registered investment adviser) | N/A | N/A | ||||
| James Bordewick, Jr. - 1959 Senior Vice President and Senior Officer | 2022 | Senior Vice President and Senior Officer, The Invesco Funds
Formerly: Chief Legal Officer, KingsCrowd, Inc. (research and analytical platform for investment in private capital markets); Chief Operating Officer and Head of Legal and Regulatory, Netcapital (private capital investment platform); Managing Director, General Counsel of asset management and Chief Compliance Officer for asset management and private banking, Bank of America Corporation; Chief Legal Officer, Columbia Funds and BofA Funds;
Senior Vice President and Associate General Counsel, MFS Investment Management; Chief Legal Officer, MFS Funds; Associate, Ropes & Gray; and Associate, Gaston Snow & Ely Bartlett | N/A | N/A | ||||
The Statement of Additional Information of the Trust includes additional information about the Fund’s Trustees and is available upon request, without charge, by calling 1.800.959.4246. Please refer to the Fund’s Statement of Additional Information for information on the Fund’s sub-advisers.
| Office of the Fund | Investment Adviser | Distributor | Auditors | |||
| 11 Greenway Plaza, Suite 1000 | Invesco Advisers, Inc. | Invesco Distributors, Inc. | PricewaterhouseCoopers LLP | |||
| Houston, TX 77046-1173 | 1555 Peachtree Street, N.E. | 11 Greenway Plaza, Suite 1000 | 1000 Louisiana Street, Suite 5800 | |||
| Atlanta, GA 30309 | Houston, TX 77046-1173 | Houston, TX 77002-5021 | ||||
| Counsel to the Fund | Counsel to the Independent Trustees | Transfer Agent | Custodian | |||
| Stradley Ronon Stevens & Young, LLP | Sidley Austin LLP | Invesco Investment Services, Inc. | State Street Bank and Trust Company | |||
| 2005 Market Street, Suite 2600 | 787 Seventh Avenue | 11 Greenway Plaza, Suite 1000 | 225 Franklin Street | |||
| Philadelphia, PA 19103-7018 | New York, NY 10019 | Houston, TX 77046-1173 | Boston, MA 02110-2801 | |||
T-6 Invesco Income Allocation Fund
(This page intentionally left blank)

Go paperless with eDelivery
Visit invesco.com/edelivery to enjoy the convenience and security of anytime electronic access to your investment documents.
With eDelivery, you can elect to have any or all of the following materials delivered straight to your inbox to download, save and print from your own computer:
∎ Fund reports and prospectuses
∎ Quarterly statements
∎ Daily confirmations
∎ Tax forms
Invesco mailing information
Send general correspondence to Invesco Investment Services, Inc., P.O. Box 219078, Kansas City, MO 64121-9078.
Important notice regarding delivery of security holder documents
To reduce Fund expenses, only one copy of most shareholder documents may be mailed to shareholders with multiple accounts at the same address (Householding). Mailing of your shareholder documents may be householded indefinitely unless you instruct us otherwise. If you do not want the mailing of these documents to be combined with those for other members of your household, please contact Invesco Investment Services, Inc. at 800 959 4246 or contact your financial institution. We will begin sending you individual copies for each account within 30 days after receiving your request.
Fund holdings and proxy voting information
The Fund provides a complete list of its portfolio holdings four times each year, at the end of each fiscal quarter. For the second and fourth quarters, the list appears, respectively, in the Fund’s semiannual and annual reports to shareholders. For the first and third quarters, the Fund files the list with the Securities and Exchange Commission (SEC) as an exhibit to its reports on Form N-PORT. The most recent list of portfolio holdings is available at invesco.com/completeqtrholdings. Shareholders can also look up the Fund’s Form N-PORT filings on the SEC website, sec.gov. The SEC file numbers for the Fund are shown below.
A description of the policies and procedures that the Fund uses to determine how to vote proxies relating to portfolio securities is available without charge, upon request, from our Client Services department at 800 959 4246, or at invesco.com/ corporate/about-us/esg. The information is also available on the SEC website, sec.gov.
Information regarding how the Fund voted proxies related to its portfolio securities during the most recent 12-month period ended June 30 is available at invesco.com/proxysearch. This information is also available on the SEC website, sec.gov.
Invesco Advisers, Inc. is an investment adviser; it provides investment advisory services to individual and institutional clients and does not sell securities. Invesco Distributors, Inc. is the US distributor for Invesco Ltd.’s retail mutual funds, exchange-traded funds and institutional money market funds. Both are wholly owned, indirect subsidiaries of Invesco Ltd.
| SEC file number(s): 811-02699 and 002-57526 | Invesco Distributors, Inc. | INCAL-AR-1 |

| Annual Report to Shareholders | December 31, 2022 |
Invesco International Diversified Fund
Nasdaq:
A: OIDAX ∎ C: OIDCX ∎ R: OIDNX ∎ Y: OIDYX ∎ R5: INDFX ∎ R6: OIDIX
| 2 | ||||
| 2 | ||||
| 3 | ||||
| 5 | ||||
| 7 | ||||
| 8 | ||||
| 11 | ||||
| 12 | ||||
| 17 | ||||
| 18 | ||||
| 19 | ||||
| T-1 | ||||
Management’s Discussion of Fund Performance
| Performance summary |
| For the fiscal year ended December 31, 2022, Class A shares of Invesco International Diversified Fund (the Fund), at net asset value (NAV), underperformed the MSCI All Country World ex USA Index. |
Your Fund’s long-term performance appears later in this report.
|
| Fund vs. Indexes |
| Total returns, 12/31/21 to 12/31/22, at net asset value (NAV). Performance shown does not include applicable contingent deferred sales charges (CDSC) or front-end sales charges, which would have reduced performance. |
Class A Shares | -25.32 | % | ||
Class C Shares | -25.88 | |||
Class R Shares | -25.52 | |||
Class Y Shares | -25.15 | |||
Class R5 Shares | -25.09 | |||
Class R6 Shares | -25.02 | |||
MSCI All Country World ex USA Indexq | -16.00 | |||
Source(s): qRIMES Technologies Corp.
|
Market conditions and your Fund
Global equity markets declined in the first half of 2022 amid volatility sparked by Russia’s invasion of Ukraine, rising commodity prices, rampant global inflation and central banks shifting toward tighter monetary policy. Russia’s invasion exacerbated inflationary pressures, disrupting already strained supply chains, and increasing shortages of oil, gas and raw materials, with the price of oil rising sharply.
Inflation headwinds continued into the third quarter of 2022. The US Federal Reserve (the Fed), the European Central Bank and the Bank of England all raised interest rates. In contrast, the People’s Bank of China lowered its policy rate and the Bank of Japan kept rates the same. Emerging market equities, hampered by the strong US dollar, underperformed developed market equities.
Global equity markets posted gains for the fourth quarter of 2022, after better inflation data sparked a rally in October and November. However, investor sentiment worsened in December after central banks signaled continued interest rate hikes into 2023 as inflation remained above target levels. International stocks outperformed US stocks in the fourth quarter, led by results in Europe and the UK. Emerging market equities also posted gains for the fourth quarter of 2022, boosted by China, which eased its zero-COVID-19 policy and started to reopen even as COVID-19 infections surged.
Despite the rebound in the fourth quarter of 2022, at the end of the fiscal year ended December 31, 2022, trailing one-year returns for developed market equities and emerging market equities were both in negative territory.
During the fiscal year, the Fund’s portfolio consisted of four underlying mutual funds: In-vesco Oppenheimer International Growth Fund, Invesco Developing Markets Fund, Invesco International Small-Mid Company Fund
and Invesco International Equity Fund. For the one-year period ended December 31, 2022, the four underlying funds produced the following absolute returns at NAV: Invesco International Small-Mid Company Fund returned -31.19%, followed by Invesco Oppenheimer International Growth Fund which returned -27.31%, followed by Invesco International Equity Fund which returned -19.60% and finally the Invesco Developing Markets Fund returned -25.16%.
International Diversified Fund’s relative underperformance compared to the MSCI All Country World ex USA Index for the fiscal year was driven most by stock selection in the industrials, financials and energy sectors. The Fund’s underweight allocation to financials and underweight to energy also contributed negatively. The Fund’s relative performance during the fiscal year was hurt by stock selection in the United Kingdom and Japan. Exposure to Russian stocks also hurt relative performance during the fiscal year. Stock selection in the consumer discretionary sector was the largest contributor to the Fund’s relative performance. An underweight allocation to real estate also contributed positively. Geographically, stock selection and an underweight allocation in China and South Korea were contributors to relative Fund performance. An overweight allocation to Denmark also contributed positively.
The Fund is designed to offer investors broad-based exposure to non-US equities with a single portfolio by combining four that have varied individual mandates.
We thank you for your continued investment in Invesco International Diversified Fund.
Portfolio manager(s):
George R. Evans
The views and opinions expressed in management’s discussion of Fund performance are those of Invesco Advisers, Inc. and its affiliates. These views
and opinions are subject to change at any time based on factors such as market and economic conditions. These views and opinions may not be relied upon as investment advice or recommendations, or as an offer for a particular security. The information is not a complete analysis of every aspect of any market, country, industry, security or the Fund. Statements of fact are from sources considered reliable, but Invesco Advisers, Inc. makes no representation or warranty as to their completeness or accuracy. Although historical performance is no guarantee of future results, these insights may help you understand our investment management philosophy.
See important Fund and, if applicable, index disclosures later in this report.
| 2 Invesco International Diversified Fund |
Your Fund’s Long-Term Performance
Results of a $10,000 Investment – Oldest Share Class(es)
| Fund and | index data from 12/31/12 |
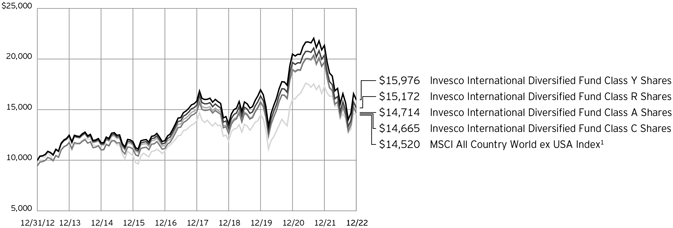
| 1 | Source: RIMES Technologies Corp. |
Past performance cannot guarantee future results.
The data shown in the chart include reinvested distributions, applicable sales charges and Fund expenses including management
fees. Index results include reinvested dividends, but they do not reflect sales charges. Performance of the peer group, if applicable, reflects fund expenses and management fees;
performance of a market index does not. Performance shown in the chart does not reflect deduction of taxes a shareholder would pay on Fund distributions or sale of Fund shares.
| 3 Invesco International Diversified Fund |
Average Annual Total Returns |
| |||
| As of 12/31/22, including maximum applicable sales charges |
| |||
Class A Shares | ||||
Inception (9/27/05) | 4.74 | % | ||
10 Years | 3.94 | |||
5 Years | -1.22 | |||
1 Year | -29.42 | |||
Class C Shares | ||||
Inception (9/27/05) | 4.72 | % | ||
10 Years | 3.90 | |||
5 Years | -0.84 | |||
1 Year | -26.52 | |||
Class R Shares | ||||
Inception (9/27/05) | 4.79 | % | ||
10 Years | 4.26 | |||
5 Years | -0.35 | |||
1 Year | -25.52 | |||
Class Y Shares | ||||
Inception (9/27/05) | 5.39 | % | ||
10 Years | 4.80 | |||
5 Years | 0.16 | |||
1 Year | -25.15 | |||
Class R5 Shares | ||||
10 Years | 4.66 | % | ||
5 Years | 0.17 | |||
1 Year | -25.09 | |||
Class R6 Shares | ||||
Inception (8/28/12) | 5.86 | % | ||
10 Years | 5.01 | |||
5 Years | 0.31 | |||
1 Year | -25.02 | |||
Effective May 24, 2019, Class A, Class C, Class R, Class Y and Class I shares of the Oppenheimer International Diversified Fund, (the predecessor fund), were reorganized into Class A, Class C, Class R, Class Y and Class R6 shares, respectively, of the Invesco Oppenheimer International Diversified Fund. The Fund was subsequently renamed the Invesco International Diversified Fund (the Fund). Returns shown above, for periods ending on or prior to May 24, 2019, for Class A, Class C, Class R, Class Y and Class R6 shares are those for Class A, Class C, Class R, Class Y and Class I shares of the predecessor fund. Share class returns will differ from the predecessor fund because of different expenses.
Class R5 shares incepted on May 24, 2019. Performance shown on or prior to that date is that of the predecessor fund’s Class A shares at net asset value and includes the 12b-1 fees applicable to Class A shares.
The performance data quoted represent past performance and cannot guarantee future results; current performance may be lower or higher. Please visit invesco.com/ performance for the most recent month-end performance. Performance figures reflect reinvested distributions, changes in net asset value and the effect of the
maximum sales charge unless otherwise stated. Performance figures do not reflect deduction of taxes a shareholder would pay on Fund distributions or sale of Fund shares. Investment return and principal value will fluctuate so that you may have a gain or loss when you sell shares.
Class A share performance reflects the maximum 5.50% sales charge, and Class C share performance reflects the applicable contingent deferred sales charge (CDSC) for the period involved. The CDSC on Class C shares is 1% for the first year after purchase. Class R, Class Y, Class R5 and Class R6 shares do not have a front-end sales charge or a CDSC; therefore, performance is at net asset value.
The performance of the Fund’s share classes will differ primarily due to different sales charge structures and class expenses.
Fund performance reflects any applicable fee waivers and/or expense reimbursements. Had the adviser not waived fees and/or reimbursed expenses currently or in the past, returns would have been lower. See current prospectus for more information.
| 4 Invesco International Diversified Fund |
Invesco International Diversified Fund’s investment objective is to seek capital appreciation.
| ∎ | Unless otherwise stated, information presented in this report is as of December 31, 2022, and is based on total net assets. |
| ∎ | Unless otherwise noted, all data is provided by Invesco. |
| ∎ | To access your Fund’s reports/prospectus, visit invesco.com/fundreports. |
About indexes used in this report
| ∎ | The MSCI All Country World ex USA® Index is an index considered representative of developed and emerging stock markets, excluding the US. The index is computed using the net return, which withholds applicable taxes for non-resident investors. |
| ∎ | The Fund is not managed to track the performance of any particular index, including the index(es) described here, and consequently, the performance of the Fund may deviate significantly from the performance of the index(es). |
| ∎ | A direct investment cannot be made in an index. Unless otherwise indicated, index results include reinvested dividends, and they do not reflect sales charges. Performance of the peer group, if applicable, reflects fund expenses; performance of a market index does not. |
| This report must be accompanied or preceded by a currently effective Fund prospectus, which contains more complete information, including sales charges and expenses. Investors should read it carefully before investing. | ||||||
| NOT FDIC INSURED | MAY LOSE VALUE | NO BANK GUARANTEE | ||||
5 Invesco International Diversified Fund
Fund Information
Portfolio Composition
| % of total investments | ||||
Invesco International Small-Mid Company Fund, Class R6 | 30.23 | % | ||
Invesco International Equity Fund, Class R6 | 24.93 | |||
Invesco Oppenheimer International Growth Fund, Class R6 | 24.90 | |||
Invesco Developing Markets Fund, Class R6 | 19.94 | |||
The Fund’s holdings are subject to change, and there is no assurance that the Fund will continue to hold any particular security.
Data presented here are as of December 31, 2022.
6 Invesco International Diversified Fund
December 31, 2022
Invesco International Diversified Fund
Schedule of Investments in Affiliated Issuers–99.85%(a)
| %of Net Assets 12/31/22 | Value 12/31/21 | Purchases at Cost | Proceeds from Sales | Change in Unrealized Appreciation (Depreciation) | Realized Gain (Loss) | Dividend Income | Shares 12/31/22 | Value 12/31/22 | ||||||||||||||||||||||||||
| ||||||||||||||||||||||||||||||||||
Foreign Equity Funds–99.85% |
| |||||||||||||||||||||||||||||||||
Invesco Developing Markets Fund, Class R6 | 19.90% | $ | 1,160,009,926 | $ | 119,217,949 | $ | (519,666,499 | ) | $ | (210,586,816 | ) | $ | (82,301,286 | ) | $ | 5,640,300 | 13,364,069 | $ 466,673,274 | ||||||||||||||||
| ||||||||||||||||||||||||||||||||||
Invesco International Equity Fund, Class R6 | 24.89% | 1,064,587,231 | 38,554,562 | (323,318,313 | ) | (203,756,240 | ) | 7,450,090 | 10,960,434 | 29,847,434 | 583,517,330 | |||||||||||||||||||||||
| ||||||||||||||||||||||||||||||||||
Invesco International Small-Mid Company Fund, Class R6 | 30.19% | 1,188,096,083 | 156,458,090 | (270,399,493 | ) | (330,976,652 | ) | (33,383,215 | ) | 3,148,234 | 18,124,225 | 707,750,993 | ||||||||||||||||||||||
| ||||||||||||||||||||||||||||||||||
Invesco Oppenheimer International Growth Fund, Class R6 | 24.87% | 858,534,089 | 146,129,358 | (201,094,165 | ) | (200,911,830 | ) | (19,645,062 | ) | 1,517,594 | 17,645,653 | 583,012,390 | ||||||||||||||||||||||
| ||||||||||||||||||||||||||||||||||
TOTAL INVESTMENTS IN AFFILIATED ISSUERS | 99.85% | $ | 4,271,227,329 | $ | 460,359,959 | $ | (1,314,478,470 | ) | $ | (946,231,538 | ) | $ | (127,879,473 | )(b) | $ | 21,266,562 | $ 2,340,953,987 | |||||||||||||||||
| ||||||||||||||||||||||||||||||||||
OTHER ASSETS LESS LIABILITIES | 0.15% | 3,624,859 | ||||||||||||||||||||||||||||||||
| ||||||||||||||||||||||||||||||||||
NET ASSETS | 100.00% | $ 2,344,578,846 | ||||||||||||||||||||||||||||||||
| ||||||||||||||||||||||||||||||||||
Notes to Schedule of Investments:
| (a) | Each underlying fund and the Fund are affiliated by either having the same investment adviser or an investment adviser under common control with the Fund’s investment adviser. |
| (b) | Includes capital gains distributions from affiliated underlying funds as follows: |
| Fund Name | Capital Gain | ||||
Invesco International Small-Mid Company Fund | $ | 2,043,820 | |||
See accompanying Notes to Financial Statements which are an integral part of the financial statements.
7 Invesco International Diversified Fund
Statement of Assets and Liabilities
December 31, 2022
Assets: |
| |||
Investments in affiliated underlying funds, at value | $ | 2,340,953,987 | ||
Cash | 16,184,567 | |||
Receivable for: | ||||
Interest | 60 | |||
Fund shares sold | 1,515,469 | |||
Investment for trustee deferred compensation and retirement plans | 155,859 | |||
Other assets | 70,845 | |||
Total assets | 2,358,880,787 | |||
Liabilities: |
| |||
Payable for: | ||||
Fund shares reacquired | 12,608,504 | |||
Accrued fees to affiliates | 1,283,912 | |||
Accrued trustees’ and officers’ fees and benefits | 32,470 | |||
Accrued other operating expenses | 201,929 | |||
Trustee deferred compensation and retirement plans | 175,126 | |||
Total liabilities | 14,301,941 | |||
Net assets applicable to shares outstanding | $ | 2,344,578,846 | ||
Net assets consist of: |
| |||
Shares of beneficial interest | $ | 2,042,321,037 | ||
Distributable earnings | 302,257,809 | |||
| $ | 2,344,578,846 | |||
Net Assets: |
| |||
Class A | $ | 838,140,922 | ||
Class C | $ | 82,627,944 | ||
Class R | $ | 123,942,893 | ||
Class Y | $ | 871,553,992 | ||
Class R5 | $ | 27,785 | ||
Class R6 | $ | 428,285,310 | ||
Shares outstanding, no par value, with an unlimited number of shares authorized: |
| |||
Class A | 59,774,493 | |||
Class C | 6,291,379 | |||
Class R | 9,057,022 | |||
Class Y | 61,164,775 | |||
Class R5 | 1,973 | |||
Class R6 | 29,889,051 | |||
Class A: | ||||
Net asset value per share | $ | 14.02 | ||
Maximum offering price per share | $ | 14.84 | ||
Class C: | ||||
Net asset value and offering price per share | $ | 13.13 | ||
Class R: | ||||
Net asset value and offering price per share | $ | 13.68 | ||
Class Y: | ||||
Net asset value and offering price per share | $ | 14.25 | ||
Class R5: | ||||
Net asset value and offering price per share | $ | 14.08 | ||
Class R6: | ||||
Net asset value and offering price per share | $ | 14.33 | ||
See accompanying Notes to Financial Statements which are an integral part of the financial statements.
8 Invesco International Diversified Fund
Statement of Operations
For the year ended December 31, 2022
Investment income: |
| |||
Dividends from affiliated underlying funds | $ | 21,266,562 | ||
| ||||
Expenses: | ||||
Distribution fees: | ||||
Class A | 2,430,160 | |||
| ||||
Class C | 1,114,779 | |||
| ||||
Class R | 684,040 | |||
| ||||
Transfer agent fees – A, C, R and Y | 4,312,615 | |||
| ||||
Transfer agent fees – R5 | 35 | |||
| ||||
Transfer agent fees – R6 | 198,456 | |||
| ||||
Trustees’ and officers’ fees and benefits | 45,373 | |||
| ||||
Registration and filing fees | 143,471 | |||
| ||||
Reports to shareholders | 187,024 | |||
| ||||
Professional services fees | 47,119 | |||
| ||||
Other | (15,140 | ) | ||
| ||||
Total expenses | 9,147,932 | |||
| ||||
Less: Expense offset arrangement(s) | (18,547 | ) | ||
| ||||
Net expenses | 9,129,385 | |||
| ||||
Net investment income | 12,137,177 | |||
| ||||
Realized and unrealized gain (loss) from: |
| |||
Net realized gain (loss) from: | ||||
Affiliated underlying fund shares | (129,923,293 | ) | ||
| ||||
Capital gain distributions from affiliated underlying fund shares | 2,043,820 | |||
| ||||
| (127,879,473) | ||||
| ||||
Change in net unrealized appreciation (depreciation) of affiliated underlying fund shares | (946,231,538 | ) | ||
| ||||
Net realized and unrealized gain (loss) | (1,074,111,011 | ) | ||
| ||||
Net increase (decrease) in net assets resulting from operations | $ | (1,061,973,834 | ) | |
| ||||
See accompanying Notes to Financial Statements which are an integral part of the financial statements.
9 Invesco International Diversified Fund
Statement of Changes in Net Assets
For the years ended December 31, 2022 and 2021
| 2022 | 2021 | |||||||
| ||||||||
Operations: | ||||||||
Net investment income | $ | 12,137,177 | $ | 18,730,205 | ||||
| ||||||||
Net realized gain (loss) | (127,879,473 | ) | 423,490,627 | |||||
| ||||||||
Change in net unrealized appreciation (depreciation) | (946,231,538 | ) | (251,343,538 | ) | ||||
| ||||||||
Net increase (decrease) in net assets resulting from operations | (1,061,973,834 | ) | 190,877,294 | |||||
| ||||||||
Distributions to shareholders from distributable earnings: | ||||||||
Class A | (109,807,177 | ) | (98,881,156 | ) | ||||
| ||||||||
Class C | (11,734,501 | ) | (12,098,183 | ) | ||||
| ||||||||
Class R | (16,350,183 | ) | (12,997,978 | ) | ||||
| ||||||||
Class Y | (116,865,722 | ) | (139,158,428 | ) | ||||
| ||||||||
Class R5 | (3,778 | ) | (6,642 | ) | ||||
| ||||||||
Class R6 | (57,455,724 | ) | (62,654,259 | ) | ||||
| ||||||||
Total distributions from distributable earnings | (312,217,085 | ) | (325,796,646 | ) | ||||
| ||||||||
Share transactions–net: | ||||||||
Class A | (55,551,595 | ) | (21,470,401 | ) | ||||
| ||||||||
Class C | (29,672,442 | ) | (41,045,225 | ) | ||||
| ||||||||
Class R | 6,282,249 | (10,935,118 | ) | |||||
| ||||||||
Class Y | (393,070,728 | ) | (142,025,694 | ) | ||||
| ||||||||
Class R5 | (25,327 | ) | 54,174 | |||||
| ||||||||
Class R6 | (126,965,668 | ) | (5,182,975 | ) | ||||
| ||||||||
Net increase (decrease) in net assets resulting from share transactions | (599,003,511 | ) | (220,605,239 | ) | ||||
| ||||||||
Net increase (decrease) in net assets | (1,973,194,430 | ) | (355,524,591 | ) | ||||
| ||||||||
Net assets: | ||||||||
Beginning of year | 4,317,773,276 | 4,673,297,867 | ||||||
| ||||||||
End of year | $ | 2,344,578,846 | $ | 4,317,773,276 | ||||
| ||||||||
See accompanying Notes to Financial Statements which are an integral part of the financial statements.
10 Invesco International Diversified Fund
The following schedule presents financial highlights for a share of the Fund outstanding throughout the periods indicated.
| Net asset value, beginning of period | Net investment income loss(a) | Net gains (losses) on securities (both realized and unrealized) | Total from investment operations | Dividends from net investment income | Distributions from net realized gains | Total distributions | Net asset value, end | Total return(b) | Net assets, end of period (000’s omitted) | Ratio of to average net assets fee waivers | Ratio of expenses to average net assets without fee waivers and/or expenses absorbed(d) | Ratio of net (loss) to average | Portfolio turnover (e) | |||||||||||||||||||||||||||||||||||||||||||||||||||||||||
Class A |
| |||||||||||||||||||||||||||||||||||||||||||||||||||||||||||||||||||||
Year ended 12/31/22 | $ | 21.53 | $ | 0.05 | $ | (5.49 | ) | $ | (5.44 | ) | $ | (0.06 | ) | $ | (2.01 | ) | $ | (2.07 | ) | $ | 14.02 | (25.32 | )% | $ | 838,141 | 0.44 | % | 0.44 | % | 0.26 | % | 15 | % | |||||||||||||||||||||||||||||||||||||
Year ended 12/31/21 | 22.41 | 0.06 | 0.77 | 0.83 | (0.11 | ) | (1.60 | ) | (1.71 | ) | 21.53 | 3.89 | 1,337,605 | 0.42 | 0.42 | 0.26 | 20 | |||||||||||||||||||||||||||||||||||||||||||||||||||||
Year ended 12/31/20 | 18.88 | (0.01 | ) | 3.79 | 3.78 | (0.19 | ) | (0.06 | ) | (0.25 | ) | 22.41 | 20.56 | 1,403,095 | 0.44 | 0.44 | (0.04 | ) | 12 | |||||||||||||||||||||||||||||||||||||||||||||||||||
Eight months ended 12/31/19 | 18.00 | 0.14 | 1.14 | 1.28 | (0.18 | ) | (0.22 | ) | (0.40 | ) | 18.88 | 7.16 | 1,279,901 | 0.44 | (f) | 0.44 | (f) | 1.16 | (f) | 5 | ||||||||||||||||||||||||||||||||||||||||||||||||||
Year ended 04/30/19 | 18.47 | 0.13 | (0.47 | ) | (0.34 | ) | (0.13 | ) | – | (0.13 | ) | 18.00 | (1.73 | ) | 1,226,049 | 0.45 | 0.45 | 0.76 | 7 | |||||||||||||||||||||||||||||||||||||||||||||||||||
Year ended 04/30/18 | 15.75 | 0.08 | 2.71 | 2.79 | (0.07 | ) | – | (0.07 | ) | 18.47 | 17.73 | 1,406,336 | 0.47 | 0.48 | 0.48 | 30 | ||||||||||||||||||||||||||||||||||||||||||||||||||||||
Class C | ||||||||||||||||||||||||||||||||||||||||||||||||||||||||||||||||||||||
Year ended 12/31/22 | 20.49 | (0.08 | ) | (5.21 | ) | (5.29 | ) | (0.06 | ) | (2.01 | ) | (2.07 | ) | 13.13 | (25.88 | ) | 82,628 | 1.19 | 1.19 | (0.49 | ) | 15 | ||||||||||||||||||||||||||||||||||||||||||||||||
Year ended 12/31/21 | 21.46 | (0.11 | ) | 0.74 | 0.63 | – | (1.60 | ) | (1.60 | ) | 20.49 | 3.11 | 164,886 | 1.17 | 1.17 | (0.49 | ) | 20 | ||||||||||||||||||||||||||||||||||||||||||||||||||||
Year ended 12/31/20 | 18.24 | (0.14 | ) | 3.61 | 3.47 | (0.19 | ) | (0.06 | ) | (0.25 | ) | 21.46 | 19.58 | 211,223 | 1.19 | 1.19 | (0.79 | ) | 12 | |||||||||||||||||||||||||||||||||||||||||||||||||||
Eight months ended 12/31/19 | 17.48 | 0.05 | 1.11 | 1.16 | (0.18 | ) | (0.22 | ) | (0.40 | ) | 18.24 | 6.68 | 282,376 | 1.19 | (f) | 1.19 | (f) | 0.40 | (f) | 5 | ||||||||||||||||||||||||||||||||||||||||||||||||||
Year ended 04/30/19 | 17.92 | 0.00 | (0.44 | ) | (0.44 | ) | – | – | – | 17.48 | (2.46 | ) | 417,155 | 1.20 | 1.20 | 0.01 | 7 | |||||||||||||||||||||||||||||||||||||||||||||||||||||
Year ended 04/30/18 | 15.34 | (0.05 | ) | 2.63 | 2.58 | – | – | – | 17.92 | 16.82 | 480,204 | 1.22 | 1.23 | (0.27 | ) | 30 | ||||||||||||||||||||||||||||||||||||||||||||||||||||||
Class R | ||||||||||||||||||||||||||||||||||||||||||||||||||||||||||||||||||||||
Year ended 12/31/22 | 21.13 | 0.00 | (5.38 | ) | (5.38 | ) | (0.06 | ) | (2.01 | ) | (2.07 | ) | 13.68 | (25.52 | ) | 123,943 | 0.69 | 0.69 | 0.01 | 15 | ||||||||||||||||||||||||||||||||||||||||||||||||||
Year ended 12/31/21 | 22.02 | 0.00 | 0.76 | 0.76 | (0.05 | ) | (1.60 | ) | (1.65 | ) | 21.13 | 3.62 | 179,362 | 0.67 | 0.67 | 0.01 | 20 | |||||||||||||||||||||||||||||||||||||||||||||||||||||
Year ended 12/31/20 | 18.61 | (0.05 | ) | 3.71 | 3.66 | (0.19 | ) | (0.06 | ) | (0.25 | ) | 22.02 | 20.21 | 196,106 | 0.69 | 0.69 | (0.29 | ) | 12 | |||||||||||||||||||||||||||||||||||||||||||||||||||
Eight months ended 12/31/19 | 17.77 | 0.11 | 1.13 | 1.24 | (0.18 | ) | (0.22 | ) | (0.40 | ) | 18.61 | 7.03 | 187,607 | 0.69 | (f) | 0.69 | (f) | 0.90 | (f) | 5 | ||||||||||||||||||||||||||||||||||||||||||||||||||
Year ended 04/30/19 | 18.23 | 0.09 | (0.46 | ) | (0.37 | ) | (0.09 | ) | – | (0.09 | ) | 17.77 | (1.96 | ) | 200,643 | 0.70 | 0.70 | 0.51 | 7 | |||||||||||||||||||||||||||||||||||||||||||||||||||
Year ended 04/30/18 | 15.56 | 0.04 | 2.66 | 2.70 | (0.03 | ) | – | (0.03 | ) | 18.23 | 17.38 | 215,588 | 0.72 | 0.73 | 0.23 | 30 | ||||||||||||||||||||||||||||||||||||||||||||||||||||||
Class Y | ||||||||||||||||||||||||||||||||||||||||||||||||||||||||||||||||||||||
Year ended 12/31/22 | 21.83 | 0.09 | (5.57 | ) | (5.48 | ) | (0.09 | ) | (2.01 | ) | (2.10 | ) | 14.25 | (25.15 | ) | 871,554 | 0.19 | 0.19 | 0.51 | 15 | ||||||||||||||||||||||||||||||||||||||||||||||||||
Year ended 12/31/21 | 22.71 | 0.12 | 0.78 | 0.90 | (0.18 | ) | (1.60 | ) | (1.78 | ) | 21.83 | 4.17 | 1,823,128 | 0.17 | 0.17 | 0.51 | 20 | |||||||||||||||||||||||||||||||||||||||||||||||||||||
Year ended 12/31/20 | 19.10 | 0.04 | 3.84 | 3.88 | (0.21 | ) | (0.06 | ) | (0.27 | ) | 22.71 | 20.83 | 2,019,871 | 0.19 | 0.19 | 0.21 | 12 | |||||||||||||||||||||||||||||||||||||||||||||||||||||
Eight months ended 12/31/19 | 18.17 | 0.17 | 1.16 | 1.33 | (0.18 | ) | (0.22 | ) | (0.40 | ) | 19.10 | 7.37 | 2,349,592 | 0.17 | (f) | 0.19 | (f) | 1.43 | (f) | 5 | ||||||||||||||||||||||||||||||||||||||||||||||||||
Year ended 04/30/19 | 18.65 | 0.18 | (0.48 | ) | (0.30 | ) | (0.18 | ) | – | (0.18 | ) | 18.17 | (1.41 | ) | 2,386,585 | 0.16 | 0.20 | 1.05 | 7 | |||||||||||||||||||||||||||||||||||||||||||||||||||
Year ended 04/30/18 | 15.91 | 0.13 | 2.73 | 2.86 | (0.12 | ) | – | (0.12 | ) | 18.65 | 18.00 | 1,968,444 | 0.22 | 0.23 | 0.73 | 30 | ||||||||||||||||||||||||||||||||||||||||||||||||||||||
Class R5 | ||||||||||||||||||||||||||||||||||||||||||||||||||||||||||||||||||||||
Year ended 12/31/22 | 21.61 | 0.10 | (5.51 | ) | (5.41 | ) | (0.11 | ) | (2.01 | ) | (2.12 | ) | 14.08 | (25.09 | ) | 28 | 0.10 | 0.10 | 0.60 | 15 | ||||||||||||||||||||||||||||||||||||||||||||||||||
Year ended 12/31/21 | 22.50 | 0.15 | 0.78 | 0.93 | (0.22 | ) | (1.60 | ) | (1.82 | ) | 21.61 | 4.32 | 73 | 0.07 | 0.07 | 0.61 | 20 | |||||||||||||||||||||||||||||||||||||||||||||||||||||
Year ended 12/31/20 | 18.93 | 0.07 | 3.80 | 3.87 | (0.24 | ) | (0.06 | ) | (0.30 | ) | 22.50 | 20.96 | 24 | 0.05 | 0.05 | 0.35 | 12 | |||||||||||||||||||||||||||||||||||||||||||||||||||||
Period ended 12/31/19(g) | 17.05 | 0.16 | 2.12 | 2.28 | (0.18 | ) | (0.22 | ) | (0.40 | ) | 18.93 | 13.42 | 11 | 0.07 | (f) | 0.07 | (f) | 1.52 | (f) | 5 | ||||||||||||||||||||||||||||||||||||||||||||||||||
Class R6 | ||||||||||||||||||||||||||||||||||||||||||||||||||||||||||||||||||||||
Year ended 12/31/22 | 21.94 | 0.11 | (5.58 | ) | (5.47 | ) | (0.13 | ) | (2.01 | ) | (2.14 | ) | 14.33 | (25.02 | ) | 428,285 | 0.04 | 0.04 | 0.66 | 15 | ||||||||||||||||||||||||||||||||||||||||||||||||||
Year ended 12/31/21 | 22.82 | 0.16 | 0.78 | 0.94 | (0.22 | ) | (1.60 | ) | (1.82 | ) | 21.94 | 4.31 | 812,719 | 0.03 | 0.03 | 0.65 | 20 | |||||||||||||||||||||||||||||||||||||||||||||||||||||
Year ended 12/31/20 | 19.19 | 0.07 | 3.86 | 3.93 | (0.24 | ) | (0.06 | ) | (0.30 | ) | 22.82 | 20.99 | 842,979 | 0.04 | 0.04 | 0.36 | 12 | |||||||||||||||||||||||||||||||||||||||||||||||||||||
Eight months ended 12/31/19 | 18.23 | 0.19 | 1.17 | 1.36 | (0.18 | ) | (0.22 | ) | (0.40 | ) | 19.19 | 7.51 | 805,573 | 0.03 | (f) | 0.03 | (f) | 1.57 | (f) | 5 | ||||||||||||||||||||||||||||||||||||||||||||||||||
Year ended 04/30/19 | 18.73 | 0.20 | (0.49 | ) | (0.29 | ) | (0.21 | ) | – | (0.21 | ) | 18.23 | (1.37 | ) | 734,849 | 0.04 | 0.04 | 1.17 | 7 | |||||||||||||||||||||||||||||||||||||||||||||||||||
Year ended 04/30/18 | 15.96 | 0.16 | 2.75 | 2.91 | (0.14 | ) | – | (0.14 | ) | 18.73 | 18.28 | 461,321 | 0.05 | 0.05 | 0.90 | 30 | ||||||||||||||||||||||||||||||||||||||||||||||||||||||
| (a) | Calculated using average shares outstanding. |
| (b) | Includes adjustments in accordance with accounting principles generally accepted in the United States of America and as such, the net asset value for financial reporting purposes and the returns based upon those net asset values may differ from the net asset value and returns for shareholder transactions. Does not include sales charges and is not annualized for periods less than one year, if applicable. |
| (c) | In addition to the fees and expenses which the Fund bears directly, the Fund indirectly bears a pro rata share of the fees and expenses of the underlying funds in which the Fund invests. Because the underlying funds have varied expenses and fee levels and the Fund may own different proportions at different times, the amount of fees and expenses incurred indirectly by the Fund will vary. Estimated underlying fund expenses are not expenses that are incurred directly by the Fund. They are expenses that are incurred directly by the underlying funds and are deducted from the value of the funds the Fund invests in. The effect of the estimated underlying fund expenses that the Fund bears indirectly is included in the Fund’s total return. Estimated acquired fund fees from underlying funds were 0.77 %,0.82% and 0.81% for the year ended December 31, 2022,2021 and 2020, respectively. |
| (d) | Does not include indirect expenses from affiliated fund fees and expenses of 0.80%, 0.83%, 0.83% and 0.70% for the eight months ended December 31, 2019, and the years ended April 30, 2019 and 2018, respectively. |
| (e) | Portfolio turnover is calculated at the fund level and is not annualized for periods less than one year, if applicable. For the year ended ended December 31, 2020, the portfolio turnover calculation excludes the value of securities purchased of $103,226,025 and sold of $86,850,094 in the effort to realign the Fund’s portfolio holdings after the reorganization of Invesco International Allocation Fund into the Fund. |
| (f) | Annualized. |
| (g) | Commencement date after the close of business on May 24, 2019. |
See accompanying Notes to Financial Statements which are an integral part of the financial statements.
11 Invesco International Diversified Fund |
December 31, 2022
NOTE 1–Significant Accounting Policies
Invesco International Diversified Fund (the “Fund”) is a series portfolio of AIM Growth Series (Invesco Growth Series) (the “Trust”). The Trust is a Delaware statutory trust registered under the Investment Company Act of 1940, as amended (the “1940 Act”), as an open-end series management investment company authorized to issue an unlimited number of shares of beneficial interest. Information presented in these financial statements pertains only to the Fund. Matters affecting the Fund or each class will be voted on exclusively by the shareholders of the Fund or each class.
The Fund’s investment objective is to seek capital appreciation.
The Fund is a “fund of funds”, in that it invests in other mutual funds (“underlying funds”) advised by Invesco Advisers, Inc. (the “Adviser” or “Invesco”) and exchange-traded funds advised by Invesco Capital Management LLC (“Invesco Capital”), an affiliate of Invesco, or other unaffiliated advisers. The Adviser may change the Fund’s asset class allocations, the underlying funds or the target weightings in the underlying funds without shareholder approval. The underlying funds may engage in a number of investment techniques and practices, which involve certain risks. Each underlying fund’s accounting policies are outlined in the underlying fund’s financial statements and are publicly available.
The Fund currently consists of six different classes of shares: Class A, Class C, Class R, Class Y, Class R5 and Class R6. Class Y shares are available only to certain investors. Class A shares are sold with a front-end sales charge unless certain waiver criteria are met. Under certain circumstances, load waived shares may be subject to contingent deferred sales charges (“CDSC”). Class C shares are sold with a CDSC. Class R, Class Y, Class R5 and Class R6 shares are sold at net asset value. Class C shares held for eight years after purchase are eligible for automatic conversion into Class A shares of the same Fund (the “Conversion Feature”). The automatic conversion pursuant to the Conversion Feature will generally occur at the end of the month following the eighth anniversary after a purchase of Class C shares.
The Fund is an investment company and accordingly follows the investment company accounting and reporting guidance in accordance with Financial Accounting Standards Board Accounting Standards Codification Topic 946, Financial Services – Investment Companies.
The following is a summary of the significant accounting policies followed by the Fund in the preparation of its financial statements.
| A. | Security Valuations – Securities of investment companies listed or traded on an exchange are generally valued at the trade price or official closing price that day as of the close of the exchange where the security is principally traded, or lacking any trades or official closing price on a particular day, the security may be valued at the closing bid price on that day. Securities of investment companies that are not exchange-traded (e.g., open-end mutual funds) are valued using such company’s end-of-business-day net asset value per share. Securities in the underlying funds, including restricted securities, are valued in accordance with the valuation policy of such fund. The policies of the underlying funds affiliated with the Fund, as a result of having the same investment adviser, are set forth below. |
A security listed or traded on an exchange is generally valued at its trade price or official closing price that day as of the close of the exchange where the security is principally traded, or lacking any trades or official closing price on a particular day, the security may be valued at the closing bid price on that day. Securities traded in the over-the-counter market are valued based on prices furnished by independent pricing services or market makers. When such securities are valued using prices provided by an independent pricing service they may be considered fair valued. Futures contracts are valued at the daily settlement price set by an exchange on which they are principally traded. U.S. exchange-traded options are valued at the mean between the last bid and asked prices from the exchange on which they are principally traded. Non-U.S. exchange-traded options are valued at the final settlement price set by the exchange on which they trade. Options not listed on an exchange and swaps generally are valued using pricing provided from independent pricing services.
Securities of investment companies that are not exchange-traded (e.g., open-end mutual funds) are valued using such company’s end-of-business-day net asset value per share.
Deposits, other obligations of U.S. and non-U.S. banks and financial institutions are valued at their daily account value.
Fixed income securities (including convertible debt securities) generally are valued on the basis of prices provided by independent pricing services. Prices provided by the pricing service may be determined without exclusive reliance on quoted prices, and may reflect appropriate factors such as institution-size trading in similar groups of securities, developments related to specific securities, dividend rate (for unlisted equities), yield (for debt obligations), quality, type of issue, coupon rate (for debt obligations), maturity (for debt obligations), individual trading characteristics and other market data. Pricing services generally value debt obligations assuming orderly transactions of institutional round lot size, but a fund may hold or transact in the same securities in smaller, odd lot sizes. Odd lots often trade at lower prices than institutional round lots, and their value may be adjusted accordingly. Debt obligations are subject to interest rate and credit risks. In addition, all debt obligations involve some risk of default with respect to interest and/or principal payments.
Foreign securities’ (including foreign exchange contracts) prices are converted into U.S. dollar amounts using the applicable exchange rates as of the close of the New York Stock Exchange (“NYSE”). If market quotations are available and reliable for foreign exchange-traded equity securities, the securities will be valued at the market quotations. The Adviser may use various pricing services to obtain market quotations as well as fair value prices. Because trading hours for certain foreign securities end before the close of the NYSE, closing market quotations may become not representative of market value in the Adviser’s judgment (“unreliable”). If, between the time trading ends on a particular security and the close of the customary trading session on the NYSE, a significant event occurs that makes the closing price of the security unreliable, the Adviser may fair value the security. If the event is likely to have affected the closing price of the security, the security will be valued at fair value in good faith in accordance with Board- approved policies and related Adviser procedures (“Valuation Procedures”). Adjustments to closing prices to reflect fair value may also be based on a screening process of an independent pricing service to indicate the degree of certainty, based on historical data, that the closing price in the principal market where a foreign security trades is not the current value as of the close of the NYSE. Foreign securities’ prices meeting the degree of certainty that the price is not reflective of current value will be priced at the indication of fair value from the independent pricing service. Multiple factors may be considered by the independent pricing service in determining adjustments to reflect fair value and may include information relating to sector indices, American Depositary Receipts and domestic and foreign index futures. Foreign securities may have additional risks including exchange rate changes, potential for sharply devalued currencies and high inflation, political and economic upheaval, the relative lack of issuer information, relatively low market liquidity and the potential lack of strict financial and accounting controls and standards.
Unlisted securities will be valued using prices provided by independent pricing services or by another method that the Adviser, in its judgment, believes better reflects the security’s fair value in accordance with the Valuation Procedures.
Securities for which market prices are not provided by any of the above methods may be valued based upon quotes furnished by independent sources. The last bid price may be used to value equity securities. The mean between the last bid and asked prices may be used to value debt obligations, including corporate loans.
Securities for which market quotations are not readily available are fair valued by the Adviser in accordance with the Valuation Procedures. If a fair value price provided by a pricing service is unreliable, the Adviser will fair value the security using the Valuation Procedures. Issuer specific events, market trends, bid/asked quotes of brokers and information providers and other market data may be reviewed in the course of making a good faith determination of a security’s fair value.
The Fund may invest in securities that are subject to interest rate risk, meaning the risk that the prices will generally fall as interest rates rise and, conversely, the prices will generally rise as interest rates fall. Specific securities differ in their sensitivity to changes in interest rates depending on their individual characteristics. Changes in interest rates may result in increased market volatility, which may affect the value and/or liquidity of certain Fund investments.
Valuations change in response to many factors including the historical and prospective earnings of the issuer, the value of the issuer’s assets, general market conditions which are not specifically related to the particular issuer, such as real or perceived adverse economic conditions, changes in the general outlook for
| 12 Invesco International Diversified Fund |
revenues or corporate earnings, changes in interest or currency rates, regional or global instability, natural or environmental disasters, widespread disease or other public health issues, war, acts of terrorism, significant governmental actions or adverse investor sentiment generally and market liquidity. Because of the inherent uncertainties of valuation, the values reflected in the financial statements may materially differ from the value received upon actual sale of those investments.
The price the Fund could receive upon the sale of any investment may differ from the Adviser’s valuation of the investment, particularly for securities that are valued using a fair valuation technique. When fair valuation techniques are applied, the Adviser uses available information, including both observable and unobservable inputs and assumptions, to determine a methodology that will result in a valuation that the Adviser believes approximates market value. Fund securities that are fair valued may be subject to greater fluctuation in their value from one day to the next than would be the case if market quotations were used. Because of the inherent uncertainties of valuation, and the degree of subjectivity in such decisions, the Fund could realize a greater or lesser than expected gain or loss upon the sale of the investment.
| B. | Securities Transactions and Investment Income – Securities transactions are accounted for on a trade date basis. Realized gains or losses on sales are computed on the basis of specific identification of the securities sold. Distributions from ordinary income from underlying funds, if any, are recorded as dividend income on the ex-dividend date. Distributions from gains from underlying funds, if any, are recorded as realized gains on the ex-dividend date. The following policies are followed by the underlying funds: Interest income (net of withholding tax, if any) is recorded on an accrual basis from settlement date and includes coupon interest and amortization of premium and accretion of discount on debt securities as applicable. Pay-in-kind interest income and non-cash dividend income received in the form of securities in-lieu of cash are recorded at the fair value of the securities received. Paydown gains and losses on mortgage and asset-backed securities are recorded as adjustments to interest income. |
The Fund may periodically participate in litigation related to the Fund’s investments. As such, the Fund may receive proceeds from litigation settlements. Any proceeds received are included in the Statement of Operations as realized gain (loss) for investments no longer held and as unrealized gain (loss) for investments still held.
The Fund allocates income and realized and unrealized capital gains and losses to a class based on the relative net assets of each class.
| C. | Country Determination – For the purposes of making investment selection decisions and presentation in the Schedule of Investments, the investment adviser may determine the country in which an issuer is located and/or credit risk exposure based on various factors. These factors include the laws of the country under which the issuer is organized, where the issuer maintains a principal office, the country in which the issuer derives 50% or more of its total revenues, the country that has the primary market for the issuer’s securities and its “country of risk” as determined by a third party service provider, as well as other criteria. Among the other criteria that may be evaluated for making this determination are the country in which the issuer maintains 50% or more of its assets, the type of security, financial guarantees and enhancements, the nature of the collateral and the sponsor organization. Country of issuer and/or credit risk exposure has been determined to be the United States of America, unless otherwise noted. |
| D. | Distributions – Distributions from net investment income and net realized capital gain, if any, are generally declared and paid annually and recorded on the ex-dividend date. The Fund may elect to treat a portion of the proceeds from redemptions as distributions for federal income tax purposes. |
| E. | Federal Income Taxes – The Fund intends to comply with the requirements of Subchapter M of the Internal Revenue Code of 1986, as amended (the “Internal Revenue Code”), necessary to qualify as a regulated investment company and to distribute substantially all of the Fund’s taxable earnings to shareholders. As such, the Fund will not be subject to federal income taxes on otherwise taxable income (including net realized capital gain) that is distributed to shareholders. |
Therefore, no provision for federal income taxes is recorded in the financial statements.
The Fund recognizes the tax benefits of uncertain tax positions only when the position is more likely than not to be sustained. Management has analyzed the Fund’s uncertain tax positions and concluded that no liability for unrecognized tax benefits should be recorded related to uncertain tax positions. Management is not aware of any tax positions for which it is reasonably possible that the total amounts of unrecognized tax benefits will change materially in the next 12 months.
The Fund files tax returns in the U.S. Federal jurisdiction and certain other jurisdictions. Generally, the Fund is subject to examinations by such taxing authorities for up to three years after the filing of the return for the tax period.
| F. | Expenses – Expenses included in the accompanying financial statements reflect the expenses of the Fund and do not include any expenses of the underlying funds. The effects of the underlying funds expenses are included in the realized and unrealized gain/loss on the investments in the underlying funds. Estimated expenses of the underlying funds are discussed further within the Financial Highlights. |
Fees provided for under the Rule 12b-1 plan of a particular class of the Fund and which are directly attributable to that class are charged to the operations of such class. Transfer agency fees and expenses and other shareholder recordkeeping fees and expenses attributable to Class R5 and Class R6 are allocated based on relative net assets of Class R5 and Class R6. Transfer agency fees and expenses and other shareholder recordkeeping fees and expenses relating to all other classes are allocated among those classes based on relative net assets. All other expenses are allocated among the classes based on relative net assets.
| G. | Accounting Estimates – The preparation of financial statements in conformity with accounting principles generally accepted in the United States of America (“GAAP”) requires management to make estimates and assumptions that affect the reported amounts of assets and liabilities at the date of the financial statements and the reported amounts of revenues and expenses during the reporting period including estimates and assumptions related to taxation. Actual results could differ from those estimates by a significant amount. In addition, the Fund monitors for material events or transactions that may occur or become known after the period-end date and before the date the financial statements are released to print. |
| H. | Indemnifications – Under the Trust’s organizational documents, each Trustee, officer, employee or other agent of the Trust is indemnified against certain liabilities that may arise out of the performance of their duties to the Fund. Additionally, in the normal course of business, the Fund enters into contracts, including the Fund’s servicing agreements, that contain a variety of indemnification clauses. The Fund’s maximum exposure under these arrangements is unknown as this would involve future claims that may be made against the Fund that have not yet occurred. The risk of material loss as a result of such indemnification claims is considered remote. |
| I. | Other Risks - Emerging markets (also referred to as developing markets) are generally subject to greater market volatility, political, social and economic instability, uncertainty regarding the existence of trading markets and more governmental limitations on foreign investment than more developed markets. In addition, companies operating in emerging markets may be subject to lower trading volume and greater price fluctuations than companies in more developed markets. Securities law in many emerging market countries is relatively new and unsettled. Therefore, laws regarding foreign investment in emerging market securities, securities regulation, title to securities, and shareholder rights may change quickly and unpredictably. In addition, the enforcement of systems of taxation at federal, regional and local levels in emerging market countries may be inconsistent, and subject to sudden change. Other risks of investing in emerging markets securities may include additional transaction costs, delays in settlement procedures, and lack of timely information. |
| J. | COVID-19 Risk - The COVID-19 strain of coronavirus has resulted in instances of market closures and dislocations, extreme volatility, liquidity constraints and increased trading costs. Efforts to contain its spread have resulted in travel restrictions, disruptions of healthcare systems, business operations (including business closures) and supply chains, layoffs, lower consumer demand and employee availability, and defaults and credit downgrades, among other significant economic impacts that have disrupted global economic activity across many industries. Such economic impacts may exacerbate other pre-existing political, social and economic risks locally or globally and cause general concern and uncertainty. The full economic impact and ongoing effects of COVID-19 (or other future epidemics or pandemics) at the macro-level and on individual businesses are unpredictable and may result in significant and prolonged effects on the Fund’s performance. |
| 13 Invesco International Diversified Fund |
NOTE 2–Advisory Fees and Other Fees Paid to Affiliates
The Trust has entered into a master investment advisory agreement with the Adviser. Under the terms of the investment advisory agreement, the Fund does not pay an advisory fee. However, the Fund pays advisory fees to the Adviser indirectly as a shareholder of the underlying funds.
Under the terms of a master sub-advisory agreement between the Adviser and each of Invesco Asset Management Deutschland GmbH, Invesco Asset Management Limited, Invesco Asset Management (Japan) Limited, Invesco Hong Kong Limited, Invesco Senior Secured Management, Inc. and Invesco Canada Ltd. and separate sub-advisory agreements with Invesco Capital Management LLC and Invesco Asset Management (India) Private Limited (collectively, the “Affiliated Sub-Advisers”) the Adviser, not the Fund, will pay 40% of the fees paid to the Adviser to any such Affiliated Sub-Adviser(s) that provide(s) discretionary investment management services to the Fund based on the percentage of assets allocated to such Affiliated Sub-Adviser(s). Invesco has also entered into a sub-advisory agreement with OppenheimerFunds, Inc. to provide discretionary management services to the Fund.
The Adviser has contractually agreed, through at least June 30, 2023, to reimburse expenses to the extent necessary to limit total annual fund operating expenses after expense reimbursement (excluding certain items discussed below) of Class A, Class C, Class R, Class Y, Class R5 and Class R6 shares to 2.25%, 3.00%, 2.50%, 2.00%, 2.00% and 2.00%, respectively, of the Fund’s average daily net assets (the “expense limits”). In determining the Adviser’s obligation to reimburse expenses, the following expenses are not taken into account, and could cause the total annual fund operating expenses after expense reimbursement to exceed the numbers reflected above: (1) interest; (2) taxes; (3) dividend expense on short sales; (4) extraordinary or non-routine items, including litigation expenses; and (5) expenses that the Fund has incurred but did not actually pay because of an expense offset arrangement. Unless Invesco continues the expense reimbursement agreement, it will terminate on June 30, 2023. During its term, the expense reimbursement agreement cannot be terminated or amended to increase the expense limits or reduce the expense reimbursement without approval of the Board of Trustees. The Adviser did not reimburse expenses during the period under these limits.
The Trust has entered into a master administrative services agreement with Invesco pursuant to which the Fund has agreed to pay Invesco for certain administrative costs incurred in providing accounting services to the Fund. For the year ended December 31, 2022, expenses incurred under the agreement are shown in the Statement of Operations as Administrative services fees. Invesco has entered into a sub-administration agreement whereby State Street Bank and Trust Company (“SSB”) serves as fund accountant and provides certain administrative services to the Fund. Pursuant to a custody agreement with the Trust on behalf of the Fund, SSB also serves as the Fund’s custodian.
The Trust has entered into a transfer agency and service agreement with Invesco Investment Services, Inc. (“IIS”) pursuant to which the Fund has agreed to pay IIS a fee for providing transfer agency and shareholder services to the Fund and reimburse IIS for certain expenses incurred by IIS in the course of providing such services. IIS may make payments to intermediaries that provide omnibus account services, sub-accounting services and/or networking services. All fees payable by IIS to intermediaries that provide omnibus account services or sub-accounting services are charged back to the Fund, subject to certain limitations approved by the Trust’s Board of Trustees. For the year ended December 31, 2022, expenses incurred under the agreement are shown in the Statement of Operations as Transfer agent fees.
The Trust has entered into master distribution agreements with Invesco Distributors, Inc. (“IDI”) to serve as the distributor for the Class A, Class C, Class R, Class Y, Class R5 and Class R6 shares of the Fund. The Trust has adopted plans pursuant to Rule 12b-1 under the 1940 Act with respect to the Fund’s Class A, Class C and Class R shares (collectively, the “Plans”). The Fund, pursuant to the Class A Plan, reimburses IDI for its allocated share of expenses incurred for the period, up to a maximum annual rate of 0.25% of the average daily net assets of Class A shares. The Fund, pursuant to the Class C and Class R Plans, pays IDI compensation at the annual rate of 1.00% of the average daily net assets of Class C shares and 0.50% of the average daily net assets of Class R shares. The fees are accrued daily and paid monthly. Of the Plan payments, up to 0.25% of the average daily net assets of each class of shares may be paid to furnish continuing personal shareholder services to customers who purchase and own shares of such classes. Any amounts not paid as a service fee under the Plans would constitute an asset-based sales charge. Rules of the Financial Industry Regulatory Authority (“FINRA”) impose a cap on the total sales charges, including asset-based sales charges, that may be paid by any class of shares of the Fund. For the year ended December 31, 2022, expenses incurred under the Plans are shown in the Statement of Operations as Distribution fees.
Front-end sales commissions and CDSC (collectively, the “sales charges”) are not recorded as expenses of the Fund. Front-end sales commissions are deducted from proceeds from the sales of Fund shares prior to investment in Class A shares of the Fund. CDSC are deducted from redemption proceeds prior to remittance to the shareholder. During the year ended December 31, 2022, IDI advised the Fund that IDI retained $89,955 in front-end sales commissions from the sale of Class A shares and $8,145 and $5,321 from Class A and Class C shares, respectively, for CDSC imposed upon redemptions by shareholders.
Certain officers and trustees of the Trust are officers and directors of the Adviser, IIS and/or IDI.
NOTE 3–Additional Valuation Information
GAAP defines fair value as the price that would be received to sell an asset or paid to transfer a liability in an orderly transaction between market participants at the measurement date, under current market conditions. GAAP establishes a hierarchy that prioritizes the inputs to valuation methods, giving the highest priority to readily available unadjusted quoted prices in an active market for identical assets (Level 1) and the lowest priority to significant unobservable inputs (Level 3), generally when market prices are not readily available. Based on the valuation inputs, the securities or other investments are tiered into one of three levels. Changes in valuation methods may result in transfers in or out of an investment’s assigned level:
Level 1 – | Prices are determined using quoted prices in an active market for identical assets. | |
Level 2 – | Prices are determined using other significant observable inputs. Observable inputs are inputs that other market participants may use in pricing a security. These may include quoted prices for similar securities, interest rates, prepayment speeds, credit risk, yield curves, loss severities, default rates, discount rates, volatilities and others. | |
Level 3 – | Prices are determined using significant unobservable inputs. In situations where quoted prices or observable inputs are unavailable (for example, when there is little or no market activity for an investment at the end of the period), unobservable inputs may be used. Unobservable inputs reflect the Adviser’s assumptions about the factors market participants would use in determining fair value of the securities or instruments and would be based on the best available information. |
As of December 31, 2022, all of the securities in this Fund were valued based on Level 1 inputs (see the Schedule of Investments for security categories). The level assigned to the securities valuations may not be an indication of the risk or liquidity associated with investing in those securities. Because of the inherent uncertainties of valuation, the values reflected in the financial statements may materially differ from the value received upon actual sale of those investments.
NOTE 4–Expense Offset Arrangement(s)
The expense offset arrangement is comprised of transfer agency credits which result from balances in demand deposit accounts used by the transfer agent for clearing shareholder transactions. For the year ended December 31, 2022, the Fund received credits from this arrangement, which resulted in the reduction of the Fund’s total expenses of $18,547.
NOTE 5–Trustees’ and Officers’ Fees and Benefits
Trustees’ and Officers’ Fees and Benefits include amounts accrued by the Fund to pay remuneration to certain Trustees and Officers of the Fund. Trustees have the option to defer compensation payable by the Fund, and Trustees’ and Officers’ Fees and Benefits also include amounts accrued by the Fund to fund such deferred compensation amounts. Those Trustees who defer compensation have the option to select various Invesco Funds in which their deferral accounts shall be deemed to be
| 14 Invesco International Diversified Fund |
invested. Finally, certain current Trustees were eligible to participate in a retirement plan that provided for benefits to be paid upon retirement to Trustees over a period of time based on the number of years of service. The Fund may have certain former Trustees who also participate in a retirement plan and receive benefits under such plan. Trustees’ and Officers’ Fees and Benefits include amounts accrued by the Fund to fund such retirement benefits. Obligations under the deferred compensation and retirement plans represent unsecured claims against the general assets of the Fund.
NOTE 6–Cash Balances
The Fund is permitted to temporarily carry a negative or overdrawn balance in its account with SSB, the custodian bank. Such balances, if any at period-end, are shown in the Statement of Assets and Liabilities under the payable caption Amount due custodian. To compensate the custodian bank for such overdrafts, the overdrawn Fund may either (1) leave funds as a compensating balance in the account so the custodian bank can be compensated by earning the additional interest; or (2) compensate by paying the custodian bank at a rate agreed upon by the custodian bank and Invesco, not to exceed the contractually agreed upon rate. The Fund may not purchase additional securities when any borrowings from banks or broker-dealers exceed 5% of the Fund’s total assets, or when any borrowings from an Invesco Fund are outstanding.
NOTE 7–Distributions to Shareholders and Tax Components of Net Assets
Tax Character of Distributions to Shareholders Paid During the Fiscal Years Ended December 31, 2022 and 2021:
| 2022 | 2021 | |||||||
| ||||||||
Ordinary income* | $ | 18,397,437 | $ | 55,500,292 | ||||
Long-term capital gain | 293,819,648 | 270,296,354 | ||||||
Total distributions | $ | 312,217,085 | $ | 325,796,646 | ||||
| * | Includes short-term capital gain distributions, if any. |
Tax Components of Net Assets at Period-End:
| 2022 | ||||||||
Undistributed ordinary income | $ | 8,067,025 | ||||||
Net unrealized appreciation - investments | 452,659,694 | |||||||
Temporary book/tax differences | (188,892 | ) | ||||||
Capital loss carryforward | (158,280,018 | ) | ||||||
Shares of beneficial interest | 2,042,321,037 | |||||||
Total net assets | $ | 2,344,578,846 | ||||||
The difference between book-basis and tax-basis unrealized appreciation (depreciation) is due to differences in the timing of recognition of gains and losses on investments for tax and book purposes. The Fund’s net unrealized appreciation (depreciation) difference is attributable primarily to wash sales.
The temporary book/tax differences are a result of timing differences between book and tax recognition of income and/or expenses. The Fund’s temporary book/tax differences are the result of the trustee deferral of compensation and retirement plan benefits.
Capital loss carryforward is calculated and reported as of a specific date. Results of transactions and other activity after that date may affect the amount of capital loss carryforward actually available for the Fund to utilize. The ability to utilize capital loss carryforward in the future may be limited under the Internal Revenue Code and related regulations based on the results of future transactions.
The Fund has a capital loss carryforward as of December 31, 2022, as follows:
| Capital Loss Carryforward* | ||||||||||||
| Expiration | Short-Term | Long-Term | Total | |||||||||
Not subject to expiration | $ | 76,234,771 | $ | 82,045,247 | $ | 158,280,018 | ||||||
| * | Capital loss carryforward is reduced for limitations, if any, to the extent required by the Internal Revenue Code and may be further limited depending upon a variety of factors, including the realization of net unrealized gains or losses as of the date of any reorganization. |
NOTE 8–Investment Transactions
The aggregate amount of investment securities (other than short-term securities, U.S. Government obligations and money market funds, if any) purchased and sold by the Fund during the year ended December 31, 2022 was $460,359,959 and $1,314,478,469, respectively. Cost of investments, including any derivatives,on a tax basis includes the adjustments for financial reporting purposes as of the most recently completed federal income tax reporting period-end.
| Unrealized Appreciation (Depreciation) of Investments on a Tax Basis | ||||||
Aggregate unrealized appreciation of investments | $ | 452,659,694 | ||||
Aggregate unrealized (depreciation) of investments | — | |||||
Net unrealized appreciation of investments | $ | 452,659,694 | ||||
Cost of investments for tax purposes is $1,888,294,293.
NOTE 9–Reclassification of Permanent Differences
Primarily as a result of differing book/tax treatment of distributions, on December 31, 2022, undistributed net investment income was decreased by $534,420 and undistributed net realized gain (loss) was increased by $534,420. This reclassification had no effect on the net assets or the distributable earnings of the Fund.
| 15 Invesco International Diversified Fund |
NOTE 10–Share Information
| Summary of Share Activity | ||||||||||||||||
| ||||||||||||||||
| Year ended | Year ended | |||||||||||||||
| December 31, 2022(a) | December 31, 2021 | |||||||||||||||
|
|
|
| |||||||||||||
| Shares | Amount | Shares | Amount | |||||||||||||
| ||||||||||||||||
Sold: | ||||||||||||||||
Class A | 4,166,805 | $ | 71,384,490 | 4,683,543 | $ | 108,807,493 | ||||||||||
| ||||||||||||||||
Class C | 552,171 | 8,898,630 | 775,949 | 17,195,667 | ||||||||||||
| ||||||||||||||||
Class R | 1,131,838 | 18,910,093 | 1,025,896 | 23,339,785 | ||||||||||||
| ||||||||||||||||
Class Y | 12,035,575 | 207,644,155 | 12,819,441 | 301,468,306 | ||||||||||||
| ||||||||||||||||
Class R5 | - | - | 3,177 | 73,511 | ||||||||||||
| ||||||||||||||||
Class R6 | 7,117,851 | 123,909,430 | 6,933,043 | 164,001,791 | ||||||||||||
| ||||||||||||||||
Issued as reinvestment of dividends: | ||||||||||||||||
Class A | 7,240,485 | 102,241,217 | 4,363,527 | 91,459,528 | ||||||||||||
| ||||||||||||||||
Class C | 833,265 | 11,024,367 | 569,107 | 11,359,379 | ||||||||||||
| ||||||||||||||||
Class R | 1,181,096 | 16,275,523 | 630,030 | 12,966,001 | ||||||||||||
| ||||||||||||||||
Class Y | 6,779,405 | 97,284,462 | 5,260,400 | 111,783,493 | ||||||||||||
| ||||||||||||||||
Class R5 | 193 | 2,742 | 102 | 2,155 | ||||||||||||
| ||||||||||||||||
Class R6 | 3,874,365 | 55,907,084 | 2,817,949 | 60,191,392 | ||||||||||||
| ||||||||||||||||
Automatic conversion of Class C shares to Class A shares: | ||||||||||||||||
Class A | 903,229 | 15,202,129 | 1,330,763 | 30,886,743 | ||||||||||||
| ||||||||||||||||
Class C | (952,903 | ) | (15,202,129 | ) | (1,394,034 | ) | (30,886,743 | ) | ||||||||
| ||||||||||||||||
Reacquired: | ||||||||||||||||
Class A | (14,657,386 | ) | (244,379,431 | ) | (10,866,190 | ) | (252,624,165 | ) | ||||||||
| ||||||||||||||||
Class C | (2,186,473 | ) | (34,393,310 | ) | (1,746,279 | ) | (38,713,528 | ) | ||||||||
| ||||||||||||||||
Class R | (1,742,819 | ) | (28,903,367 | ) | (2,073,729 | ) | (47,240,904 | ) | ||||||||
| ||||||||||||||||
Class Y | (41,183,465 | ) | (697,999,345 | ) | (23,489,537 | ) | (555,277,493 | ) | ||||||||
| ||||||||||||||||
Class R5 | (1,608 | ) | (28,069 | ) | (939 | ) | (21,492 | ) | ||||||||
| ||||||||||||||||
Class R6 | (18,142,862 | ) | (306,782,182 | ) | (9,644,707 | ) | (229,376,158 | ) | ||||||||
| ||||||||||||||||
Net increase (decrease) in share activity | (33,051,238 | ) | $ | (599,003,511 | ) | (8,002,488 | ) | $ | (220,605,239 | ) | ||||||
| ||||||||||||||||
| (a) | There are entities that are record owners of more than 5% of the outstanding shares of the Fund and in the aggregate own 35% of the outstanding shares of the Fund. IDI has an agreement with these entities to sell Fund shares. The Fund, Invesco and/or Invesco affiliates may make payments to these entities, which are considered to be related to the Fund, for providing services to the Fund, Invesco and/or Invesco affiliates including but not limited to services such as securities brokerage, distribution, third party record keeping and account servicing. The Fund has no knowledge as to whether all or any portion of the shares owned of record by these entities are also owned beneficially. |
| 16 Invesco International Diversified Fund |
Report of Independent Registered Public Accounting Firm
To the Board of Trustees of AIM Growth Series (Invesco Growth Series) and Shareholders of Invesco International Diversified Fund
Opinion on the Financial Statements
We have audited the accompanying statement of assets and liabilities, including the schedule of investments, of Invesco International Diversified Fund (one of the funds constituting AIM Growth Series (Invesco Growth Series), referred to hereafter as the “Fund”) as of December 31, 2022, the related statement of operations for the year ended December 31, 2022, the statement of changes in net assets for each of the two years in the period ended December 31, 2022, including the related notes, and the financial highlights for each of the periods indicated in the table below (collectively referred to as the “financial statements”). In our opinion, the financial statements present fairly, in all material respects, the financial position of the Fund as of December 31, 2022, the results of its operations for the year then ended, the changes in its net assets for each of the two years in the period ended December 31, 2022 and the financial highlights for each of the periods indicated in the table below, in conformity with accounting principles generally accepted in the United States of America.
Financial Highlights |
For each of the three years in the period ended December 31, 2022 and the eight months ended December 31, 2019 for Class A, Class C, Class R, Class Y and Class R6. For each of the three years in the period ended December 31, 2022 and the period May 24, 2019 (commencement of operations) through December 31, 2019 for Class R5. |
The financial statements of Oppenheimer International Diversified Fund (subsequently renamed Invesco International Diversified Fund) as of and for the year ended April 30, 2019 and the financial highlights for each of the periods ended on or prior to April 30, 2019 (not presented herein, other than the financial highlights) were audited by other auditors whose report dated June 25, 2019 expressed an unqualified opinion on those financial statements and financial highlights.
Basis for Opinion
These financial statements are the responsibility of the Fund’s management. Our responsibility is to express an opinion on the Fund’s financial statements based on our audits. We are a public accounting firm registered with the Public Company Accounting Oversight Board (United States) (PCAOB) and are required to be independent with respect to the Fund in accordance with the U.S. federal securities laws and the applicable rules and regulations of the Securities and Exchange Commission and the PCAOB.
We conducted our audits of these financial statements in accordance with the standards of the PCAOB. Those standards require that we plan and perform the audit to obtain reasonable assurance about whether the financial statements are free of material misstatement, whether due to error or fraud.
Our audits included performing procedures to assess the risks of material misstatement of the financial statements, whether due to error or fraud, and performing procedures that respond to those risks. Such procedures included examining, on a test basis, evidence regarding the amounts and disclosures in the financial statements. Our audits also included evaluating the accounting principles used and significant estimates made by management, as well as evaluating the overall presentation of the financial statements. Our procedures included confirmation of securities owned as of December 31, 2022 by correspondence with the transfer agent. We believe that our audits provide a reasonable basis for our opinion.
/s/PricewaterhouseCoopers LLP
Houston, Texas
February 22, 2023
We have served as the auditor of one or more of the investment companies in the Invesco group of investment companies since at least 1995. We have not been able to determine the specific year we began serving as auditor.
| 17 Invesco International Diversified Fund |
Calculating your ongoing Fund expenses
Example
As a shareholder of the Fund, you incur two types of costs: (1) transaction costs, which may include sales charges (loads) on purchase payments or contingent deferred sales charges on redemptions, if any; and (2) ongoing costs, including management fees, distribution and/or service (12b-1) fees, and other Fund expenses. This example is intended to help you understand your ongoing costs (in dollars) of investing in the Fund and to compare these costs with ongoing costs of investing in other mutual funds. The example is based on an investment of $1,000 invested at the beginning of the period and held for the entire period July 1, 2022 through December 31, 2022.
In addition to the fees and expenses which the Fund bears directly, the Fund indirectly bears a pro-rata share of the fees and expenses of the underlying funds in which the Fund invests. The amount of fees and expenses incurred indirectly by the Fund will vary because the underlying funds have varied expenses and fee levels and the Fund may own different proportions of the underlying funds at different times. Estimated underlying fund expenses are not expenses that are incurred directly by the Fund. They are expenses that are incurred directly by the underlying funds and are deducted from the value of the underlying funds the Fund invests in. The effect of the estimated underlying fund expenses that the Fund bears indirectly are included in the Fund’s total return.
Actual expenses
The table below provides information about actual account values and actual expenses. You may use the information in this table, together with the amount you invested, to estimate the expenses that you paid over the period. Simply divide your account value by $1,000 (for example, an $8,600 account value divided by $1,000 = 8.6), then multiply the result by the number in the table under the heading entitled “Actual Expenses Paid During Period” to estimate the expenses you paid on your account during this period.
Hypothetical example for comparison purposes
The table below also provides information about hypothetical account values and hypothetical expenses based on the Fund’s actual expense ratio and an assumed rate of return of 5% per year before expenses, which is not the Fund’s actual return.
The hypothetical account values and expenses may not be used to estimate the actual ending account balance or expenses you paid for the period. You may use this information to compare the ongoing costs of investing in the Fund and other funds. To do so, compare this 5% hypothetical example with the 5% hypothetical examples that appear in the shareholder reports of the other funds.
Please note that the expenses shown in the table are meant to highlight your ongoing costs only and do not reflect any transaction costs, such as sales charges (loads) on purchase payments or contingent deferred sales charges on redemptions, if any. Therefore, the hypothetical information is useful in comparing ongoing costs only, and will not help you determine the relative total costs of owning different funds. In addition, expenses shown in the table do not include the expenses of the underlying funds, which are borne indirectly by the Fund. If transaction costs and indirect expenses were included, your costs would have been higher.
ACTUAL | HYPOTHETICAL (5% annual return before expenses) | Annualized Ratio | ||||||||||
Beginning Account Value | Ending Account Value | Expenses Paid During | Ending Account Value | Expenses Paid During Period2 | ||||||||
Class A | $1,000.00 | $1,025.40 | $2.30 | $1,022.94 | $2.29 | 0.45% | ||||||
Class C | 1,000.00 | 1,021.30 | 6.11 | 1,019.16 | 6.11 | 1.20 | ||||||
Class R | 1,000.00 | 1,023.90 | 3.57 | 1,021.68 | 3.57 | 0.70 | ||||||
Class Y | 1,000.00 | 1,026.40 | 1.02 | 1,024.20 | 1.02 | 0.20 | ||||||
Class R5 | 1,000.00 | 1,026.50 | 0.56 | 1,024.65 | 0.56 | 0.11 | ||||||
Class R6 | 1,000.00 | 1,027.60 | 0.26 | 1,024.95 | 0.26 | 0.05 | ||||||
| 1 | The actual ending account value is based on the actual total return of the Fund for the period July 1, 2022 through December 31, 2022, after actual expenses and will differ from the hypothetical ending account value which is based on the Fund’s expense ratio and a hypothetical annual return of 5% before expenses. |
| 2 | Expenses are equal to the Fund’s annualized expense ratio as indicated above multiplied by the average account value over the period, multiplied by 184/365 to reflect the most recent fiscal half year. |
| 18 Invesco International Diversified Fund |
Form 1099-DIV, Form 1042-S and other year–end tax information provide shareholders with actual calendar year amounts that should be included in their tax returns. Shareholders should consult their tax advisers.
The following distribution information is being provided as required by the Internal Revenue Code or to meet a specific state’s requirement.
The Fund designates the following amounts or, if subsequently determined to be different, the maximum amount allowable for its fiscal year ended December 31, 2022:
Federal and State Income Tax | ||||||||
Long-Term Capital Gain Distributions | $ | 293,819,648 | ||||||
Qualified Dividend Income* | 78.01 | % | ||||||
Corporate Dividends Received Deduction* | 2.13 | % | ||||||
U.S. Treasury Obligations* | 0.00 | % | ||||||
Qualified Business Income* | 0.00 | % | ||||||
Business Interest Income* | 0.00 | % | ||||||
| * | The above percentages are based on ordinary income dividends paid to shareholders during the Fund’s fiscal year. |
Non-Resident Alien Shareholders | ||||||||
Short-Term Capital Gain Distributions | $ | 5,095,658 | ||||||
| 19 Invesco International Diversified Fund |
The address of each trustee and officer is AIM Growth Series (Invesco Growth Series) (the “Trust”), 11 Greenway Plaza, Suite 1000, Houston, Texas 77046-1173. The trustees serve for the life of the Trust, subject to their earlier death, incapacitation, resignation, retirement or removal as more specifically provided in the Trust’s organizational documents. Each officer serves for a one year term or until their successors are elected and qualified. Column two below includes length of time served with predecessor entities, if any.
| Name, Year of Birth and Position(s) Held with the Trust | Trustee and/or Officer Since | Principal Occupation(s) During Past 5 Years | Number of Funds in Fund Complex Overseen by Trustee | Other Directorship(s) Held by Trustee During Past 5 Years | ||||
| Interested Trustee | ||||||||
Martin L. Flanagan1 – 1960 Trustee and Vice Chair | 2007 | Executive Director, Chief Executive Officer and President, Invesco Ltd. (ultimate parent of Invesco and a global investment management firm); Trustee and Vice Chair, The Invesco Funds; Vice Chair, Investment Company Institute; and Member of Executive Board, SMU Cox School of Business
Formerly: Advisor to the Board, Invesco Advisers, Inc. (formerly known as Invesco Institutional (N.A.), Inc.); Chairman and Chief Executive Officer, Invesco Advisers, Inc. (registered investment adviser); Director, Chairman, Chief Executive Officer and President, Invesco Holding Company (US), Inc. (formerly IVZ Inc.) (holding company), Invesco Group Services, Inc. (service provider) and Invesco North American Holdings, Inc. (holding company); Director, Chief Executive Officer and President, Invesco Holding Company Limited (parent of Invesco and a global investment management firm); Director, Invesco Ltd.; Chairman, Investment Company Institute and President, Co-Chief Executive Officer, Co-President, Chief Operating Officer and Chief Financial Officer, Franklin Resources, Inc. (global investment management organization) | 189 | None | ||||
| 1 | Mr. Flanagan is considered an interested person (within the meaning of Section 2(a)(19) of the 1940 Act) of the Trust because he is an officer of the Adviser to the Trust, and an officer and a director of Invesco Ltd., ultimate parent of the Adviser. |
| T-1 Invesco International Diversified Fund |
Trustees and Officers–(continued)
| Name, Year of Birth and Position(s) Held with the Trust | Trustee and/or Officer Since | Principal Occupation(s) During Past 5 Years | Number of Funds in Fund Complex Overseen by Trustee | Other Directorship(s) Years | ||||
| Independent Trustees | ||||||||
Beth Ann Brown – 1968 Trustee (2019) and Chair (August 2022) | 2019 | Independent Consultant
Formerly: Head of Intermediary Distribution, Managing Director, Strategic Relations, Managing Director, Head of National Accounts, Senior Vice President, National Account Manager and Senior Vice President, Key Account Manager, Columbia Management Investment Advisers LLC; Vice President, Key Account Manager, Liberty Funds Distributor, Inc.; and Trustee of certain Oppenheimer Funds | 189 | Director, Board of Directors of Caron Engineering Inc.; Advisor, Board of Advisors of Caron Engineering Inc.; President and Director, Acton Shapleigh Youth Conservation Corps (non-profit) Formerly: President and Director Director of Grahamtastic Connection (non-profit) | ||||
Cynthia Hostetler –1962 Trustee | 2017 | Non-Executive Director and Trustee of a number of public and private business corporations
Formerly: Director, Aberdeen Investment Funds (4 portfolios); Director, Artio Global Investment LLC (mutual fund complex); Director, Edgen Group, Inc. (specialized energy and infrastructure products distributor); Director, Genesee & Wyoming, Inc. (railroads); Head of Investment Funds and Private Equity, Overseas Private Investment Corporation; President, First Manhattan Bancorporation, Inc.; and Attorney, Simpson Thacher & Bartlett LLP | 189 | Resideo Technologies, Inc. (smart home technology); Vulcan Materials Company (construction materials company); Trilinc Global Impact Fund; Textainer Group Holdings, (shipping container leasing company); Investment Company Institute (professional organization); and Independent Directors Council (professional organization) | ||||
Eli Jones – 1961 Trustee | 2016 | Professor and Dean Emeritus, Mays Business School - Texas A&M University
Formerly: Dean of Mays Business School-Texas A&M University; Professor and Dean, Walton College of Business, University of Arkansas and E.J. Ourso College of Business, Louisiana State University; and Director, Arvest Bank | 189 | Insperity, Inc. (formerly known as Administaff) (human resources provider); and Member of Regional Board of Directors and Board of Directors, First Financial Bancorp (regional bank) | ||||
Elizabeth Krentzman – 1959 Trustee | 2019 | Formerly: Principal and Chief Regulatory Advisor for Asset Management Services and U.S. Mutual Fund Leader of Deloitte & Touche LLP; General Counsel of the Investment Company Institute (trade association); National Director of the Investment Management Regulatory Consulting Practice, Principal, Director and Senior Manager of Deloitte & Touche LLP; Assistant Director of the Division of Investment Management - Office of Disclosure and Investment Adviser Regulation of the U.S. Securities and Exchange Commission and various positions with the Division of Investment Management - Office of Regulatory Policy of the U.S. Securities and Exchange Commission; Associate at Ropes & Gray LLP; and Trustee of certain Oppenheimer Funds | 189 | Formerly: Member of the Cartica Funds Board of Directors (private investment fund); Trustee of the University of Florida National Board Foundation; and Member of the University of Florida Law Center Association, Inc. Board of Trustees, Audit Committee and Membership Committee | ||||
Anthony J. LaCava, Jr. – 1956 Trustee | 2019 | Formerly: Director and Member of the Audit Committee, Blue Hills Bank (publicly traded financial institution) and Managing Partner, KPMG LLP | 189 | Blue Hills Bank; Chairman, Bentley University; Member, Business School Advisory Council; and Nominating Committee, KPMG LLP | ||||
Prema Mathai-Davis – 1950 Trustee | 2001 | Retired
Formerly: Co-Founder & Partner of Quantalytics Research, LLC, (a FinTech Investment Research Platform for the Self-Directed Investor); Trustee of YWCA Retirement Fund; CEO of YWCA of the USA; Board member of the NY Metropolitan Transportation Authority; Commissioner of the NYC Department of Aging; and Board member of Johns Hopkins Bioethics Institute | 189 | Member of Board of Positive Planet US (non-profit) and HealthCare Chaplaincy Network (non-profit) | ||||
T-2 Invesco International Diversified Fund
Trustees and Officers–(continued)
| Name, Year of Birth and Position(s) Held with the Trust | Trustee and/or Officer Since | Principal Occupation(s) During Past 5 Years | Number of Funds in Fund Complex Overseen by Trustee | Other Directorship(s) Years | ||||
| Independent Trustees–(continued) | ||||||||
Joel W. Motley – 1952 Trustee | 2019 | Director of Office of Finance, Federal Home Loan Bank System; Managing Director of Carmona Motley Inc. (privately held financial advisor); Member of the Council on Foreign Relations and its Finance and Budget Committee; Chairman Emeritus of Board of Human Rights Watch and Member of its Investment Committee; and Member of Investment Committee Board of Historic Hudson Valley (non-profit cultural organization); Member of the Board, Blue Ocean Acquisition Corp.; and Member of the Vestry and the Investment Committee of Trinity Church Wall Street.
Formerly: Managing Director of Public Capital Advisors, LLC (privately held financial advisor); Managing Director of Carmona Motley Hoffman, Inc. (privately held financial advisor); Trustee of certain Oppenheimer Funds; and Director of Columbia Equity Financial Corp. (privately held financial advisor) | 189 | Member of Board of Trust for Mutual Understanding (non-profit promoting the arts and environment); Member of Board of Greenwall Foundation (bioethics research foundation) and its Investment Committee; Member of Board of Friends of the LRC (non-profit legal advocacy); and Board Member and Investment Committee Member of Pulitzer Center for Crisis Reporting (non-profit journalism) | ||||
Teresa M. Ressel – 1962 Trustee | 2017 | Non-executive director and trustee of a number of public and private business corporations
Formerly: Chief Executive Officer, UBS Securities LLC (investment banking); Chief Operating Officer, UBS AG Americas (investment banking); Sr. Management Team Olayan America, The Olayan Group (international investor/commercial/industrial); Assistant Secretary for Management & Budget and Designated Chief Financial Officer, U.S. Department of Treasury and Director, ON Semiconductor Corporation (semiconductor manufacturing) | 189 | None | ||||
Robert C. Troccoli – 1949 Trustee | 2016 | Retired
Formerly: Adjunct Professor, University of Denver - Daniels College of Business; and Managing Partner, KPMG LLP | 189 | None | ||||
Daniel S. Vandivort – 1954 Trustee | 2019 | President, Flyway Advisory Services LLC (consulting and property management)
Formerly: President and Chief Investment Officer, previously Head of Fixed Income, Weiss Peck and Greer/Robeco Investment Management; Trustee and Chair, Weiss Peck and Greer Funds Board; and various capacities at CS First Boston including Head of Fixed Income at First Boston Asset Management. | 189 | Formerly: Trustee and Governance Chair, Oppenheimer Funds; Treasurer, Chairman of the Audit and Finance Committee, Huntington Disease Foundation of America | ||||
T-3 Invesco International Diversified Fund
Trustees and Officers–(continued)
Name, Year of Birth and Position(s) Held with the Trust | Trustee and/or Officer Since | Principal Occupation(s) During Past 5 Years | Number of Funds in Fund Complex Overseen by Trustee | Other Directorship(s) Held by Trustee During Past 5 Years | ||||
| Officers | ||||||||
Sheri Morris – 1964 President and Principal Executive Officer | 1999 | Director, Invesco Trust Company; Head of Global Fund Services, Invesco Ltd.; President and Principal Executive Officer, The Invesco Funds; Vice President, Invesco Exchange-Traded Fund Trust, Invesco Exchange-Traded Fund Trust II, Invesco India Exchange-Traded Fund Trust, Invesco Actively Managed Exchange-Traded Fund Trust, Invesco Actively Managed Exchange-Traded Commodity Fund Trust and Invesco Exchange-Traded Self-Indexed Fund Trust; and Vice President, OppenheimerFunds, Inc.
Formerly: Vice President, Treasurer and Principal Financial Officer, The Invesco Funds; Vice President, Invesco AIM Advisers, Inc., Invesco AIM Capital Management, Inc. and Invesco AIM Private Asset Management, Inc.; Assistant Vice President and Assistant Treasurer, The Invesco Funds; Vice President and Assistant Vice President, Invesco Advisers, Inc.; Assistant Vice President, Invesco AIM Capital Management, Inc. and Invesco AIM Private Asset Management, Inc.; Treasurer, Invesco Exchange-Traded Fund Trust, Invesco Exchange-Traded Fund Trust II, Invesco India Exchange-Traded Fund Trust and Invesco Actively Managed Exchange-Traded Fund Trust; and Senior Vice President, Invesco Advisers, Inc. (formerly known as Invesco Institutional (N.A.), Inc.) (registered investment adviser) | N/A | N/A | ||||
Jeffrey H. Kupor – 1968 Senior Vice President, Chief Legal Officer and Secretary | 2018 | Head of Legal of the Americas, Invesco Ltd.; Senior Vice President and Secretary, Invesco Advisers, Inc. (formerly known as Invesco Institutional (N.A.), Inc.) (registered investment adviser); Secretary, Invesco Distributors, Inc. (formerly known as Invesco AIM Distributors, Inc.); Vice President and Secretary, Invesco Investment Services, Inc. (formerly known as Invesco AIM Investment Services, Inc.); Senior Vice President, Chief Legal Officer and Secretary, The Invesco Funds; Secretary and General Counsel, Invesco Investment Advisers LLC (formerly known as Van Kampen Asset Management); Secretary and General Counsel, Invesco Capital Markets, Inc. (formerly known as Van Kampen Funds Inc.); Chief Legal Officer, Invesco Exchange-Traded Fund Trust, Invesco Exchange-Traded Fund Trust II, Invesco India Exchange-Traded Fund Trust, Invesco Actively Managed Exchange-Traded Fund Trust, Invesco Actively Managed Exchange-Traded Commodity Fund Trust and Invesco Exchange-Traded Self-Indexed Fund Trust;; Secretary and Vice President, Harbourview Asset Management Corporation; Secretary and Vice President, OppenheimerFunds, Inc. and Invesco Managed Accounts, LLC; Secretary and Senior Vice President, OFI Global Institutional, Inc.; Secretary and Vice President, OFI SteelPath, Inc.; Secretary and Vice President, Oppenheimer Acquisition Corp.; Secretary and Vice President, Shareholder Services, Inc.; and Secretary and Vice President, Trinity Investment Management Corporation
Formerly: Senior Vice President, Invesco Distributors, Inc.; Secretary and Vice President, Jemstep, Inc.; Head of Legal, Worldwide Institutional, Invesco Ltd.; Secretary and General Counsel, INVESCO Private Capital Investments, Inc.; Senior Vice President, Secretary and General Counsel, Invesco Management Group, Inc. (formerly known as Invesco AIM Management Group, Inc.); Assistant Secretary, INVESCO Asset Management (Bermuda) Ltd.; Secretary and General Counsel, Invesco Private Capital, Inc.;Assistant Secretary and General Counsel, INVESCO Realty, Inc.; Secretary and General Counsel, Invesco Senior Secured Management, Inc.; Secretary, Sovereign G./P. Holdings Inc.; Secretary, Invesco Indexing LLC; and Secretary, W.L. Ross & Co., LLC | N/A | N/A | ||||
Andrew R. Schlossberg –1974 Senior Vice President | 2019 | Senior Vice President, Invesco Group Services, Inc.; Head of the Americas and Senior Managing Director, Invesco Ltd.; Director and Senior Vice President, Invesco Advisers, Inc. (formerly known as Invesco Institutional (N.A.), Inc.) (registered investment adviser); Director and Chairman, Invesco Investment Services, Inc. (formerly known as Invesco AIM Investment Services, Inc.) (registered transfer agent); Senior Vice President, The Invesco Funds; and Director, Invesco Investment Advisers LLC (formerly known as Van Kampen Asset Management)
Formerly: Director, President and Chairman, Invesco Insurance Agency, Inc.; Director, Invesco UK Limited; Director and Chief Executive, Invesco Asset Management Limited and Invesco Fund Managers Limited; Assistant Vice President, The Invesco Funds; Senior Vice President, Invesco Advisers, Inc. (formerly known as Invesco Institutional (N.A.), Inc.) (registered investment adviser); Director and Chief Executive, Invesco Administration Services Limited and Invesco Global Investment Funds Limited; Director, Invesco Distributors, Inc.; Head of EMEA, Invesco Ltd.; President, Invesco Actively Managed Exchange-Traded Commodity Fund Trust, Invesco Actively Managed Exchange-Traded Fund Trust, Invesco Exchange-Traded Fund Trust, Invesco Exchange-Traded Fund Trust II and Invesco India Exchange-Traded Fund Trust; and Managing Director and Principal Executive Officer, Invesco Capital Management LLC | N/A | N/A |
T-4 Invesco International Diversified Fund
Trustees and Officers–(continued)
Name, Year of Birth and Position(s) Held with the Trust | Trustee and/or Officer Since | Principal Occupation(s) During Past 5 Years | Number of Funds in Fund Complex Overseen by Trustee | Other Directorship(s) Held by Trustee During Past 5 Years | ||||
| Officers–(continued) | ||||||||
John M. Zerr – 1962 Senior Vice President | 2006 | Chief Operating Officer of the Americas; Senior Vice President, Invesco Advisers, Inc. (formerly known as Invesco Institutional (N.A.), Inc.) (registered investment adviser); Senior Vice President, Invesco Distributors, Inc. (formerly known as Invesco AIM Distributors, Inc.); Director and Vice President, Invesco Investment Services, Inc. (formerly known as Invesco AIM Investment Services, Inc.) Senior Vice President, The Invesco Funds; Managing Director, Invesco Capital Management LLC; Director, Invesco Investment Advisers LLC (formerly known as Van Kampen Asset Management); Senior Vice President, Invesco Capital Markets, Inc. (formerly known as Van Kampen Funds Inc.); Manager, Invesco Indexing LLC; Manager, Invesco Specialized Products, LLC; Member, Invesco Canada Funds Advisory Board; Director, President and Chief Executive Officer, Invesco Corporate Class Inc. (corporate mutual fund company); and Director, Chairman, President and Chief Executive Officer, Invesco Canada Ltd. (formerly known as Invesco Trimark Ltd./Invesco Trimark Ltèe) (registered investment adviser and registered transfer agent); President, Invesco, Inc.; President, Invesco Global Direct Real Estate Feeder GP Ltd.; President, Invesco IP Holdings (Canada) Ltd; President, Invesco Global Direct Real Estate GP Ltd.; President, Invesco Financial Services Ltd. / Services Financiers Invesco Ltée; and Director and Chairman, Invesco Trust Company
Formerly: President, Trimark Investments Ltd/Services Financiers Invesco Ltee; Director and Senior Vice President, Invesco Insurance Agency, Inc.; Director and Senior Vice President, Invesco Management Group, Inc. (formerly known as Invesco AIM Management Group, Inc.); Secretary and General Counsel, Invesco Management Group, Inc. (formerly known as Invesco AIM Management Group, Inc.); Secretary, Invesco Investment Services, Inc. (formerly known as Invesco AIM Investment Services, Inc.); Chief Legal Officer and Secretary, The Invesco Funds; Secretary and General Counsel, Invesco Investment Advisers LLC (formerly known as Van Kampen Asset Management); Secretary and General Counsel, Invesco Capital Markets, Inc. (formerly known as Van Kampen Funds Inc.); Chief Legal Officer, Invesco Exchange-Traded Fund Trust, Invesco Exchange-Traded Fund Trust II, Invesco India Exchange-Traded Fund Trust, Invesco Actively Managed Exchange-Traded Fund Trust, Invesco Actively Managed Exchange-Traded Commodity Fund Trust and Invesco Exchange-Traded Self-Indexed Fund Trust; Secretary, Invesco Indexing LLC; Director, Secretary, General Counsel and Senior Vice President, Van Kampen Exchange Corp.; Director, Vice President and Secretary, IVZ Distributors, Inc. (formerly known as INVESCO Distributors, Inc.); Director and Vice President, INVESCO Funds Group, Inc.; Director and Vice President, Van Kampen Advisors Inc.; Director, Vice President, Secretary and General Counsel, Van Kampen Investor Services Inc.;Director and Secretary, Invesco Distributors, Inc. (formerly known as Invesco AIM Distributors, Inc.); Director, Senior Vice President, General Counsel and Secretary, Invesco AIM Advisers, Inc. and Van Kampen Investments Inc.; Director, Vice President and Secretary, Fund Management Company; Director, Senior Vice President, Secretary, General Counsel and Vice President, Invesco AIM Capital Management, Inc.; and Chief Operating Officer and General Counsel, Liberty Ridge Capital, Inc. (an investment adviser) | N/A | N/A | ||||
Gregory G. McGreevey - 1962 Senior Vice President | 2012 | Senior Managing Director, Invesco Ltd.; Director, Chairman, President, and Chief Executive Officer, Invesco Advisers, Inc. (formerly known as Invesco Institutional (N.A.), Inc.) (registered investment adviser); Director, Invesco Mortgage Capital, Inc. and Invesco Senior Secured Management, Inc.; Senior Vice President, The Invesco Funds; President, SNW Asset Management Corporation and Invesco Managed Accounts, LLC; Chairman and Director, Invesco Private Capital, Inc.; Chairman and Director, INVESCO Private Capital Investments, Inc.; Chairman and Director, INVESCO Realty, Inc.; and Senior Vice President, Invesco Group Services, Inc.
Formerly: Senior Vice President, Invesco Management Group, Inc. and Invesco Advisers, Inc.; Assistant Vice President, The Invesco Funds | N/A | N/A | ||||
Adrien Deberghes- 1967 Principal Financial Officer, Treasurer and Vice President | 2020 | Head of the Fund Office of the CFO and Fund Administration; Vice President, Invesco Advisers, Inc.; Principal Financial Officer, Treasurer and Vice President, The Invesco Funds; Vice President, Invesco Exchange-Traded Fund Trust, Invesco Exchange-Traded Fund Trust II, Invesco India Exchange-Traded Fund Trust, Invesco Actively Managed Exchange-Traded Fund Trust, Invesco Actively Managed Exchange-Traded Commodity Fund Trust and Invesco Exchange-Traded Self-Indexed Fund Trust
Formerly: Senior Vice President and Treasurer, Fidelity Investments | N/A | N/A | ||||
Crissie M. Wisdom – 1969 Anti-Money Laundering Compliance Officer | 2013 | Anti-Money Laundering and OFAC Compliance Officer for Invesco U.S. entities including: Invesco Advisers, Inc. and its affiliates, Invesco Capital Markets, Inc., Invesco Distributors, Inc., Invesco Investment Services, Inc., The Invesco Funds, Invesco Capital Management, LLC, Invesco Trust Company; and Fraud Prevention Manager for Invesco Investment Services, Inc. | N/A | N/A |
T-5 Invesco International Diversified Fund
Trustees and Officers–(continued)
Name, Year of Birth and Position(s) Held with the Trust | Trustee and/or Officer Since | Principal Occupation(s) During Past 5 Years | Number of Funds in Fund Complex Overseen by Trustee | Other Directorship(s) Held by Trustee During Past 5 Years | ||||
| Officers–(continued) | ||||||||
Todd F. Kuehl – 1969 Chief Compliance Officer and Senior Vice President | 2020 | Chief Compliance Officer, Invesco Advisers, Inc. (registered investment adviser); and Chief Compliance Officer and Senior Vice President, The Invesco Funds
Formerly: Managing Director and Chief Compliance Officer, Legg Mason (Mutual Funds); Chief Compliance Officer, Legg Mason Private Portfolio Group (registered investment adviser) | N/A | N/A | ||||
James Bordewick, Jr. – 1959 Senior Vice President and | 2022 | Senior Vice President and Senior Officer, The Invesco Funds
Formerly: Chief Legal Officer, KingsCrowd, Inc. (research and analytical platform for investment in private capital markets); Chief Operating Officer and Head of Legal and Regulatory, Netcapital (private capital investment platform); Managing Director, General Counsel of asset management and Chief Compliance Officer for asset management and private banking, Bank of America Corporation; Chief Legal Officer, Columbia Funds and BofA Funds;
Senior Vice President and Associate General Counsel, MFS Investment Management; Chief Legal Officer, MFS Funds; Associate, Ropes & Gray; and Associate, Gaston Snow & Ely Bartlett | N/A | N/A |
The Statement of Additional Information of the Trust includes additional information about the Fund’s Trustees and is available upon request, without charge, by calling 1.800.959.4246. Please refer to the Fund’s Statement of Additional Information for information on the Fund’s sub-advisers.
| Office of the Fund | Investment Adviser | Distributor | Auditors | |||
| 11 Greenway Plaza, Suite 1000 | Invesco Advisers, Inc. | Invesco Distributors, Inc. | PricewaterhouseCoopers LLP | |||
| Houston, TX 77046-1173 | 1555 Peachtree Street, N.E. | 11 Greenway Plaza, Suite 1000 | 1000 Louisiana Street, Suite 5800 | |||
| Atlanta, GA 30309 | Houston, TX 77046-1173 | Houston, TX 77002-5021 | ||||
| Counsel to the Fund | Counsel to the Independent Trustees | Transfer Agent | Custodian | |||
| Stradley Ronon Stevens & Young, LLP | Sidley Austin LLP | Invesco Investment Services, Inc. | State Street Bank and Trust Company | |||
| 2005 Market Street, Suite 2600 | 787 Seventh Avenue | 11 Greenway Plaza, Suite 1000 | 225 Franklin Street | |||
| Philadelphia, PA 19103-7018 | New York, NY 10019 | Houston, TX 77046-1173 | Boston, MA 02110-2801 | |||
T-6 Invesco International Diversified Fund
(This page intentionally left blank)
(This page intentionally left blank)

Go paperless with eDelivery
Visit invesco.com/edelivery to enjoy the convenience and security of anytime electronic access to your investment documents.
With eDelivery, you can elect to have any or all of the following materials delivered straight to your inbox to download, save and print from your own computer:
∎ Fund reports and prospectuses
∎ Quarterly statements
∎ Daily confirmations
∎ Tax forms
Invesco mailing information
Send general correspondence to Invesco Investment Services, Inc., P.O. Box 219078, Kansas City, MO 64121-9078.
Important notice regarding delivery of security holder documents
To reduce Fund expenses, only one copy of most shareholder documents may be mailed to shareholders with multiple accounts at the same address (Householding). Mailing of your shareholder documents may be householded indefinitely unless you instruct us otherwise. If you do not want the mailing of these documents to be combined with those for other members of your household, please contact Invesco Investment Services, Inc. at 800 959 4246 or contact your financial institution. We will begin sending you individual copies for each account within 30 days after receiving your request.
Fund holdings and proxy voting information
The Fund provides a complete list of its portfolio holdings four times each year, at the end of each fiscal quarter. For the second and fourth quarters, the list appears, respectively, in the Fund’s semiannual and annual reports to shareholders. For the first and third quarters, the Fund files the list with the Securities and Exchange Commission (SEC) as an exhibit to its reports on Form N-PORT. The most recent list of portfolio holdings is available at invesco.com/completeqtrholdings. Shareholders can also look up the Fund’s Form N-PORT filings on the SEC website, sec.gov. The SEC file numbers for the Fund are shown below.
A description of the policies and procedures that the Fund uses to determine how to vote proxies relating to portfolio securities is available without charge, upon request, from our Client Services department at 800 959 4246, or at invesco.com/ corporate/about-us/esg. The information is also available on the SEC website, sec.gov.
Information regarding how the Fund voted proxies related to its portfolio securities during the most recent 12-month period ended June 30 is available at invesco.com/proxysearch. This information is also available on the SEC website, sec.gov.
Invesco Advisers, Inc. is an investment adviser; it provides investment advisory services to individual and institutional clients and does not sell securities. Invesco Distributors, Inc. is the US distributor for Invesco Ltd.’s retail mutual funds, exchange-traded funds and institutional money market funds. Both are wholly owned, indirect subsidiaries of Invesco Ltd.
SEC file number(s): 811-02699 and 002-57526 | Invesco Distributors, Inc. | O-IDIV-AR-1 |

Annual Report to Shareholders | December 31, 2022 |
Invesco Main Street Mid Cap Fund®
Nasdaq:
A: OPMSX ∎ C: OPMCX ∎ R: OPMNX ∎ Y: OPMYX ∎ R5: MSMJX ∎ R6: OPMIX
Management’s Discussion of Fund Performance
|
For the fiscal year ended December 31, 2022, Class A shares of Invesco Main Street Mid Cap Fund® (the Fund), at net asset value (NAV), outperformed the Russell Midcap Index. |
Your Fund’s long-term performance appears later in this report.
|
Fund vs. Indexes |
Total returns, 12/31/21 to 12/31/22, at net asset value (NAV). Performance shown does not include applicable contingent deferred sales charges (CDSC) or front-end sales charges, which would have reduced performance. |
Class A Shares | -14.35 | % | ||
Class C Shares | -14.95 | |||
Class R Shares | -14.53 | |||
Class Y Shares | -14.10 | |||
Class R5 Shares | -14.06 | |||
Class R6 Shares | -14.00 | |||
Russell Midcap Index▼ | -17.32 | |||
Source(s): ▼RIMES Technologies Corp. |
Market conditions and your Fund
Equity markets declined in the first quarter of 2022 amid volatility sparked by Russia’s invasion of Ukraine, rising commodity prices, rampant global inflation and the US Federal Reserve’s (the Fed) shift toward tighter monetary policy. Russia’s invasion exacerbated inflation pressures, disrupting already strained supply chains and increasing shortages of oil, gas and raw materials. The price of oil rose sharply, with crude prices reaching their highest price per barrel since 2008.1 Inflation continued to be a top concern for consumers, investors and the Fed. To combat inflation, the Fed raised the federal funds rate by one-quarter percentage point in March and indicated it would “taper” its asset purchase program quickly.2
As the war in Ukraine continued and corporate earnings in high-profile names like Netflix reported slowing growth and profits, the equity markets sold off for much of April 2022. The downward direction of the equity markets continued into the second quarter of 2022 amid substantial inflation, rising interest rates and an increasing likelihood of a US recession. Driven by higher food and energy prices, the consumer price index rose by yet another 40-year high to 8.6% for the twelve months ended May 2022.3 Oil prices peaked near $122 per barrel in early June, resulting in skyrocketing gasoline prices; the national average price reached a record high, above $5 per gallon in early June.1 In an effort to tame inflation, the Fed raised the benchmark federal funds rate three more times, by 0.50% in May, by 0.75% in June and another 0.75% in July, which were the largest increases in nearly 30 years.2 US equity markets rose in July and August until Fed chairman Jerome Powell’s hawkish comments at an economic policy symposium held in Jackson Hole, which sparked a sharp selloff at month-end. The Fed reiterated that it would continue taking aggressive action to curb
inflation, even though such measures could “bring pain to households and businesses,” and the Fed raised the benchmark federal funds rate by another 0.75% in September.2
After experiencing a sharp drop in September 2022, US equity markets rebounded in October and November,4 despite mixed data on the economy and corporate earnings. However, the Fed’s message of continued rate hikes until data shows inflation meaningfully declining, sent markets lower in December.4 As energy prices declined,1 the rate of inflation slowed modestly in the fourth quarter.3 Corporate earnings generally met expectations, though companies provided cautious future guidance. With inflation still at multi-decade highs and little evidence of a slowing economy, the Fed raised its target rate by 0.75% in November and by 0.50% in December, marking its highest level in over a decade.2
In this environment, US stocks had negative double-digit returns for the fiscal year of -18.11%, as measured by the S&P 500 Index.4
During the fiscal year, stock selection in the information technology, communication services and industrials sectors were the largest contributors to the Fund’s relative performance versus its benchmark, the Russell Mid-cap Index. This was offset by weaker stock selection in the energy and consumer staples sectors and an overweight exposure to the consumer discretionary sector.
The largest individual contributors to the Fund’s performance relative to the benchmark during the fiscal year included Chesapeake Energy, Schlumberger and Acadia Healthcare. Chesapeake Energy, an exploration and production company focused on oil and natural gas, benefited from the general outperformance of the energy sector.
Schlumberger, an oil and gas services company, also benefited from the outperformance of the energy sector. We exited our position in the holding during the fiscal year.
Acadia Healthcare, a provider of behavioral health care services, continued to see strong demand for mental health services and favorable pricing.
The largest individual detractors from the Fund’s performance relative to the benchmark during the fiscal year included Expedia Group, MKS Instruments and Block. Expedia Group underperformed as investors grew increasingly worried that a weakening US economy would impact leisure travel. Well-publicized airline capacity issues, flight delays/ cancellations and generally high airfare and hotel prices also raised concerns about the sustainability of the travel recovery.
MKS Instruments, a provider of semiconductor equipment, came under pressure due to a weaker demand backdrop as a result of macro concerns including inflation and a rising rate environment.
Block was under pressure due to concerns surrounding the cryptocurrency market and the company’s exposure to Bitcoin. We have exited our holding during the fiscal year.
We continue to maintain our discipline around valuation and focus on companies which we believe have competitive advantages and skilled management teams that are outexecuting peers. We believe this disciplined approach is essential to generating attractive long-term performance.
We thank you for your continued investment in Invesco Main Street Mid Cap Fund®.
| 1 | Source: Bloomberg LP |
| 2 | Source: US Federal Reserve |
| 3 | Source: US Bureau of Labor Statistics |
| 4 | Source: Lipper Inc. |
Portfolio manager(s):
Joy Budzinski
Belinda Cavazos - Lead
Magnus Krantz
Raman Vardharaj
Adam Weiner - Lead
Matthew Ziehl - Lead
The views and opinions expressed in management’s discussion of Fund performance are those of Invesco Advisers, Inc. and its affiliates. These views and opinions are subject to change at any time based on factors such as market and economic conditions. These views and opinions may not be relied upon as investment advice or recommendations, or as an offer for a particular security. The information is not a complete analysis of every aspect of any market, country, industry, security or the Fund. Statements of fact are from sources considered reliable, but Invesco Advisers, Inc. makes no representation or warranty as to their completeness or accuracy. Although historical performance is no guarantee of future results, these insights may help you understand our investment management philosophy.
See important Fund and, if applicable, index disclosures later in this report.
| 2 Invesco Main Street Mid Cap Fund® |
Your Fund’s Long-Term Performance
Results of a $10,000 Investment – Oldest Share Class(es)
Fund and index data from 12/31/12
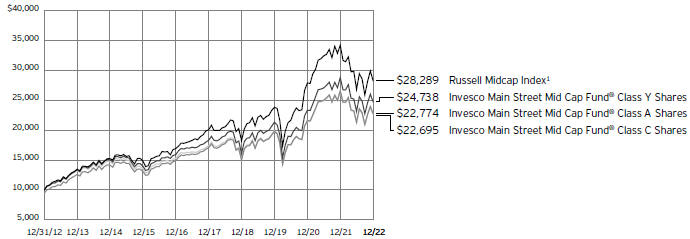
| 1 | Source: RIMES Technologies Corp. |
Past performance cannot guarantee future results.
The data shown in the chart include reinvested distributions, applicable sales charges and Fund expenses including management
fees. Index results include reinvested dividends, but they do not reflect sales charges. Performance of the peer group, if applicable, reflects fund expenses and management fees;
performance of a market index does not. Performance shown in the chart does not reflect deduction of taxes a shareholder would pay on Fund distributions or sale of Fund shares.
| 3 Invesco Main Street Mid Cap Fund® |
Average Annual Total Returns |
| |||
As of 12/31/22, including maximum applicable sales charges |
| |||
Class A Shares | ||||
Inception (8/2/99) | 9.20% | |||
10 Years | 8.58 | |||
5 Years | 4.73 | |||
1 Year | -19.07 | |||
Class C Shares | ||||
Inception (8/2/99) | 9.19% | |||
10 Years | 8.54 | |||
5 Years | 5.14 | |||
1 Year | -15.75 | |||
Class R Shares | ||||
Inception (3/1/01) | 8.08% | |||
10 Years | 8.92 | |||
5 Years | 5.68 | |||
1 Year | -14.53 | |||
Class Y Shares | ||||
Inception (8/2/99) | 9.86% | |||
10 Years | 9.48 | |||
5 Years | 6.20 | |||
1 Year | -14.10 | |||
Class R5 Shares | ||||
10 Years | 9.34% | |||
5 Years | 6.19 | |||
1 Year | -14.06 | |||
Class R6 Shares | ||||
Inception (10/26/12) | 9.99% | |||
10 Years | 9.66 | |||
5 Years | 6.37 | |||
1 Year | -14.00 | |||
Effective May 24, 2019, Class A, Class C, Class R, Class Y and Class I shares of the Oppenheimer Main Street Mid Cap Fund, (the predecessor fund), were reorganized into Class A, Class C, Class R, Class Y and Class R6 shares, respectively, of the Invesco Oppenheimer Main Street Mid Cap Fund®. The Fund was subsequently renamed the Invesco Main Street Mid Cap Fund (the Fund). Returns shown above, for periods ending on or prior to May 24, 2019, for Class A, Class C, Class R, Class Y and Class R6 shares are those for Class A, Class C, Class R, Class Y and Class I shares of the predecessor fund. Share class returns will differ from the predecessor fund because of different expenses.
Class R5 shares incepted on May 24, 2019. Performance shown on or prior to that date is that of the predecessor fund’s Class A shares at net asset value and includes the 12b-1 fees applicable to Class A shares.
The performance data quoted represent past performance and cannot guarantee future results; current performance may be lower or higher. Please visit invesco.com/performance for the most recent month-end performance. Performance figures reflect reinvested distributions, changes in net asset value and the effect of the maximum sales charge unless otherwise stated.
Performance figures do not reflect deduction of taxes a shareholder would pay on Fund distributions or sale of Fund shares. Investment return and principal value will fluctuate so that you may have a gain or loss when you sell shares.
Class A share performance reflects the maximum 5.50% sales charge, and Class C share performance reflects the applicable contingent deferred sales charge (CDSC) for the period involved. The CDSC on Class C shares is 1% for the first year after purchase. Class R, Class Y, Class R5 and Class R6 shares do not have a front-end sales charge or a CDSC; therefore, performance is at net asset value.
The performance of the Fund’s share classes will differ primarily due to different sales charge structures and class expenses.
Fund performance reflects any applicable fee waivers and/or expense reimbursements. Had the adviser not waived fees and/or reimbursed expenses currently or in the past, returns would have been lower. See current prospectus for more information.
| 4 Invesco Main Street Mid Cap Fund® |
Invesco Main Street Mid Cap Fund’s® investment objective is to seek capital appreciation.
| ∎ | Unless otherwise stated, information presented in this report is as of December 31, 2022, and is based on total net assets. |
| ∎ | Unless otherwise noted, all data is provided by Invesco. |
| ∎ | To access your Fund’s reports/prospectus, visit invesco.com/fundreports. |
About indexes used in this report
| ∎ | The Russell Midcap® Index is an unmanaged index considered representative of mid-cap stocks. The Russell Midcap Index is a trademark/service mark of the Frank Russell Co. Russell® is a trademark of the Frank Russell Co. |
| ∎ | The Fund is not managed to track the performance of any particular index, including the index(es) described here, and consequently, the performance of the Fund may deviate significantly from the performance of the index(es). |
| ∎ | A direct investment cannot be made in an index. Unless otherwise indicated, index results include reinvested dividends, and they do not reflect sales charges. Performance of the peer group, if applicable, reflects fund expenses; performance of a market index does not. |
| This report must be accompanied or preceded by a currently effective Fund prospectus, which contains more complete information, including sales charges and expenses. Investors should read it carefully before investing. | ||||
NOT FDIC INSURED | MAY LOSE VALUE | NO BANK GUARANTEE
| ||||
| 5 Invesco Main Street Mid Cap Fund® |
Fund Information
Portfolio Composition
| By sector | % of total net assets | |
Industrials | 18.49% | |
Financials | 14.96 | |
Consumer Discretionary | 13.40 | |
Information Technology | 13.02 | |
Health Care | 8.92 | |
Real Estate | 6.65 | |
Materials | 5.46 | |
Energy | 5.22 | |
Utilities | 4.77 | |
Consumer Staples | 4.34 | |
Communication Services | 4.29 | |
Money Market Funds Plus Other Assets Less Liabilities | 0.48 |
Top 10 Equity Holdings*
| % of total net assets | ||||
1. | Synopsys, Inc. | 1.98% | ||
2. | Keysight Technologies, Inc. | 1.91 | ||
3. | Carrier Global Corp. | 1.71 | ||
4. | Raymond James Financial, Inc. | 1.69 | ||
5. | D.R. Horton, Inc. | 1.69 | ||
6. | APA Corp. | 1.64 | ||
7. | Republic Services, Inc. | 1.62 | ||
8. | Otis Worldwide Corp. | 1.60 | ||
9. | Curtiss-Wright Corp. | 1.59 | ||
10. | Acadia Healthcare Co., Inc. | 1.48 |
The Fund’s holdings are subject to change, and there is no assurance that the Fund will continue to hold any particular security.
| * | Excluding money market fund holdings, if any. |
Data presented here are as of December 31, 2022.
| 6 Invesco Main Street Mid Cap Fund® |
December 31, 2022
| Shares | Value | |||||||
| ||||||||
Common Stocks & Other Equity Interests–99.52% |
| |||||||
Advertising–1.17% | ||||||||
Interpublic Group of Cos., Inc. (The) | 817,933 | $ | 27,245,348 | |||||
| ||||||||
Aerospace & Defense–2.88% | ||||||||
Curtiss-Wright Corp. | 222,490 | 37,153,605 | ||||||
| ||||||||
Howmet Aerospace, Inc. | 766,903 | 30,223,647 | ||||||
| ||||||||
| 67,377,252 | ||||||||
| ||||||||
Application Software–5.79% | ||||||||
Manhattan Associates, Inc.(b) | 272,252 | 33,051,393 | ||||||
| ||||||||
Paylocity Holding Corp.(b) | 126,300 | 24,535,038 | ||||||
| ||||||||
Synopsys, Inc.(b)(c) | 144,970 | 46,287,471 | ||||||
| ||||||||
Tyler Technologies, Inc.(b) | 97,705 | 31,501,069 | ||||||
| ||||||||
| 135,374,971 | ||||||||
| ||||||||
Asset Management & Custody Banks–1.97% |
| |||||||
Federated Hermes, Inc., Class B | 615,184 | 22,337,331 | ||||||
| ||||||||
Northern Trust Corp.(c) | 267,836 | 23,700,808 | ||||||
| ||||||||
| 46,038,139 | ||||||||
| ||||||||
Auto Parts & Equipment–2.79% | ||||||||
Aptiv PLC(b) | 359,418 | 33,472,599 | ||||||
| ||||||||
Mobileye Global, Inc., Class A | 166,784 | 5,847,447 | ||||||
| ||||||||
Visteon Corp.(b) | 197,416 | 25,827,935 | ||||||
| ||||||||
| 65,147,981 | ||||||||
| ||||||||
Automotive Retail–1.31% | ||||||||
O’Reilly Automotive, Inc.(b) | 36,242 | 30,589,335 | ||||||
| ||||||||
Biotechnology–0.90% | ||||||||
Seagen, Inc.(b) | 163,790 | 21,048,653 | ||||||
| ||||||||
Building Products–1.71% | ||||||||
Carrier Global Corp. | 969,365 | 39,986,306 | ||||||
| ||||||||
Casinos & Gaming–0.81% | ||||||||
Boyd Gaming Corp. | 348,890 | 19,024,972 | ||||||
| ||||||||
Communications Equipment–1.46% | ||||||||
Motorola Solutions, Inc. | 132,208 | 34,071,324 | ||||||
| ||||||||
Construction & Engineering–1.08% | ||||||||
Valmont Industries, Inc. | 76,580 | 25,322,708 | ||||||
| ||||||||
Construction Materials–1.99% | ||||||||
Summit Materials, Inc., Class A(b)(c) | 699,519 | 19,859,333 | ||||||
| ||||||||
Vulcan Materials Co. | 152,610 | 26,723,537 | ||||||
| ||||||||
| 46,582,870 | ||||||||
| ||||||||
Distillers & Vintners–1.00% | ||||||||
Constellation Brands, Inc., Class A | 100,278 | 23,239,426 | ||||||
| ||||||||
Distributors–0.90% | ||||||||
LKQ Corp. | 393,076 | 20,994,189 | ||||||
| ||||||||
Electric Utilities–1.22% | ||||||||
American Electric Power Co., Inc.(c) | 299,031 | 28,392,993 | ||||||
| ||||||||
Electrical Components & Equipment–3.76% |
| |||||||
Generac Holdings, Inc.(b) | 201,724 | 20,305,538 | ||||||
| ||||||||
Hubbell, Inc.(c) | 144,321 | 33,869,252 | ||||||
| ||||||||
| Shares | Value | |||||||
| ||||||||
Electrical Components & Equipment–(continued) |
| |||||||
Rockwell Automation, Inc. | 130,933 | $ | 33,724,413 | |||||
| ||||||||
| 87,899,203 | ||||||||
| ||||||||
Electronic Equipment & Instruments–1.91% |
| |||||||
Keysight Technologies, Inc.(b) | 260,823 | 44,618,991 | ||||||
| ||||||||
Environmental & Facilities Services–1.61% |
| |||||||
Republic Services, Inc. | 292,307 | 37,704,680 | ||||||
| ||||||||
Fertilizers & Agricultural Chemicals–1.28% |
| |||||||
Mosaic Co. (The) | 682,897 | 29,958,691 | ||||||
| ||||||||
Financial Exchanges & Data–1.25% | ||||||||
Cboe Global Markets, Inc. | 231,749 | 29,077,547 | ||||||
| ||||||||
Food Distributors–0.88% | ||||||||
Sysco Corp. | 267,237 | 20,430,269 | ||||||
| ||||||||
Gas Utilities–1.14% | ||||||||
Atmos Energy Corp.(c) | 238,298 | 26,706,057 | ||||||
| ||||||||
General Merchandise Stores–0.74% | ||||||||
Dollar General Corp. | 70,483 | 17,356,439 | ||||||
| ||||||||
Health Care Equipment–1.23% | ||||||||
DexCom, Inc.(b) | 253,513 | 28,707,812 | ||||||
| ||||||||
Health Care Facilities–2.57% | ||||||||
Acadia Healthcare Co., Inc.(b)(c) | 419,122 | 34,502,123 | ||||||
| ||||||||
Tenet Healthcare Corp.(c) | 524,528 | 25,591,721 | ||||||
| ||||||||
| 60,093,844 | ||||||||
| ||||||||
Health Care Supplies–1.33% | ||||||||
Cooper Cos., Inc. (The) | 94,139 | 31,128,943 | ||||||
| ||||||||
Homebuilding–2.50% | ||||||||
D.R. Horton, Inc. | 442,391 | 39,434,734 | ||||||
| ||||||||
TopBuild Corp.(b) | 120,432 | 18,846,403 | ||||||
| ||||||||
| 58,281,137 | ||||||||
| ||||||||
Hotels, Resorts & Cruise Lines–2.31% |
| |||||||
Choice Hotels International, Inc. | 243,094 | 27,382,108 | ||||||
| ||||||||
Expedia Group, Inc.(b) | 302,154 | 26,468,690 | ||||||
| ||||||||
| 53,850,798 | ||||||||
| ||||||||
Household Products–1.24% | ||||||||
Church & Dwight Co., Inc. | 360,018 | 29,021,051 | ||||||
| ||||||||
Human Resource & Employment Services–1.97% |
| |||||||
ASGN, Inc.(b)(c) | 264,961 | 21,589,022 | ||||||
| ||||||||
Korn Ferry | 483,374 | 24,468,392 | ||||||
| ||||||||
| 46,057,414 | ||||||||
| ||||||||
Hypermarkets & Super Centers–1.23% |
| |||||||
BJ’s Wholesale Club Holdings, Inc.(b) | 433,473 | 28,678,574 | ||||||
| ||||||||
Industrial Machinery–3.30% | ||||||||
Evoqua Water Technologies Corp.(b) | 653,671 | 25,885,372 | ||||||
| ||||||||
Lincoln Electric Holdings, Inc. | 96,741 | 13,978,107 | ||||||
| ||||||||
Otis Worldwide Corp. | 476,362 | 37,303,908 | ||||||
| ||||||||
| 77,167,387 | ||||||||
| ||||||||
See accompanying Notes to Financial Statements which are an integral part of the financial statements.
| 7 Invesco Main Street Mid Cap Fund® |
| Shares | Value | |||||||
| ||||||||
Industrial REITs–1.10% | ||||||||
First Industrial Realty Trust, Inc. | 533,261 | $ | 25,735,176 | |||||
| ||||||||
Insurance Brokers–1.41% | ||||||||
Arthur J. Gallagher & Co. | 175,113 | 33,015,805 | ||||||
| ||||||||
Interactive Home Entertainment–1.32% |
| |||||||
Electronic Arts, Inc. | 252,172 | 30,810,375 | ||||||
| ||||||||
Interactive Media & Services–0.89% |
| |||||||
Pinterest, Inc., Class A(b) | 858,876 | 20,853,509 | ||||||
| ||||||||
Internet Services & Infrastructure–0.96% |
| |||||||
MongoDB, Inc.(b)(c) | 113,424 | 22,326,380 | ||||||
| ||||||||
Investment Banking & Brokerage–1.69% |
| |||||||
Raymond James Financial, Inc. | 369,758 | 39,508,642 | ||||||
| ||||||||
Life Sciences Tools & Services–0.45% |
| |||||||
Illumina, Inc.(b) | 52,293 | 10,573,645 | ||||||
| ||||||||
Managed Health Care–1.41% | ||||||||
Centene Corp.(b) | 401,397 | 32,918,568 | ||||||
| ||||||||
Metal & Glass Containers–2.20% | ||||||||
Crown Holdings, Inc. | 270,008 | 22,197,358 | ||||||
| ||||||||
Silgan Holdings, Inc.(c) | 560,885 | 29,076,278 | ||||||
| ||||||||
| 51,273,636 | ||||||||
| ||||||||
Movies & Entertainment–0.91% | ||||||||
Endeavor Group Holdings, Inc., Class A(b)(c) | 943,842 | 21,274,199 | ||||||
| ||||||||
Multi-line Insurance–1.31% | ||||||||
Hartford Financial Services Group, Inc. (The) | 402,013 | 30,484,646 | ||||||
| ||||||||
Multi-Utilities–2.42% | ||||||||
CMS Energy Corp. | 447,478 | 28,338,782 | ||||||
| ||||||||
WEC Energy Group, Inc. | 299,638 | 28,094,059 | ||||||
| ||||||||
| 56,432,841 | ||||||||
| ||||||||
Oil & Gas Exploration & Production–4.00% |
| |||||||
APA Corp. | 821,456 | 38,345,566 | ||||||
| ||||||||
Chesapeake Energy Corp.(c) | 334,319 | 31,549,684 | ||||||
| ||||||||
Marathon Oil Corp. | 871,497 | 23,591,424 | ||||||
| ||||||||
| 93,486,674 | ||||||||
| ||||||||
Oil & Gas Storage & Transportation–1.22% |
| |||||||
Cheniere Energy, Inc. | 190,576 | 28,578,777 | ||||||
| ||||||||
Other Diversified Financial Services–1.29% |
| |||||||
Equitable Holdings, Inc. | 1,048,335 | 30,087,214 | ||||||
| ||||||||
Pharmaceuticals–1.02% | ||||||||
Catalent, Inc.(b) | 531,153 | 23,907,196 | ||||||
| ||||||||
Property & Casualty Insurance–1.41% |
| |||||||
Allstate Corp. (The) | 242,078 | 32,825,777 | ||||||
| ||||||||
Regional Banks–4.63% | ||||||||
Comerica, Inc. | 448,590 | 29,988,241 | ||||||
| ||||||||
First Citizens BancShares, Inc., Class A(c) | 32,317 | 24,507,920 | ||||||
| ||||||||
SVB Financial Group(b) | 102,313 | 23,546,314 | ||||||
| ||||||||
Webster Financial Corp.(c) | 638,211 | 30,212,909 | ||||||
| ||||||||
| 108,255,384 | ||||||||
| ||||||||
| Shares | Value | |||||||
| ||||||||
Research & Consulting Services–2.18% |
| |||||||
CACI International, Inc., Class A(b) | 105,932 | $ | 31,842,100 | |||||
| ||||||||
TransUnion | 334,917 | 19,006,540 | ||||||
| ||||||||
| 50,848,640 | ||||||||
| ||||||||
Residential REITs–1.41% | ||||||||
American Homes 4 Rent, Class A(c) | 1,093,246 | 32,950,434 | ||||||
| ||||||||
Retail REITs–1.40% | ||||||||
Kimco Realty Corp. | 1,538,354 | 32,582,338 | ||||||
| ||||||||
Semiconductor Equipment–2.02% |
| |||||||
KLA Corp. | 64,912 | 24,473,772 | ||||||
| ||||||||
MKS Instruments, Inc. | 268,125 | 22,718,231 | ||||||
| ||||||||
| 47,192,003 | ||||||||
| ||||||||
Semiconductors–0.87% | ||||||||
Marvell Technology, Inc. | 550,590 | 20,393,854 | ||||||
| ||||||||
Specialized REITs–2.73% | ||||||||
Lamar Advertising Co., Class A | 276,824 | 26,132,185 | ||||||
| ||||||||
National Storage Affiliates Trust | 508,155 | 18,354,559 | ||||||
| ||||||||
SBA Communications Corp., Class A | 69,122 | 19,375,588 | ||||||
| ||||||||
| 63,862,332 | ||||||||
| ||||||||
Specialty Stores–2.04% | ||||||||
Bath & Body Works, Inc. | 396,624 | 16,713,735 | ||||||
| ||||||||
Tractor Supply Co. | 137,686 | 30,975,220 | ||||||
| ||||||||
| 47,688,955 | ||||||||
| ||||||||
Total Common Stocks & Other Equity Interests |
| 2,325,042,304 | ||||||
| ||||||||
Money Market Funds–0.48% |
| |||||||
Invesco Government & Agency Portfolio, Institutional Class, 4.22%(d)(e) | 3,887,964 | 3,887,964 | ||||||
| ||||||||
Invesco Liquid Assets Portfolio, Institutional Class, 4.42%(d)(e) | 2,776,400 | 2,777,233 | ||||||
| ||||||||
Invesco Treasury Portfolio, Institutional Class, 4.20%(d)(e) | 4,443,388 | 4,443,388 | ||||||
| ||||||||
Total Money Market Funds |
| 11,108,585 | ||||||
| ||||||||
TOTAL INVESTMENTS IN SECURITIES (excluding investments purchased with cash collateral from securities on loan)-100.00% |
| 2,336,150,889 | ||||||
| ||||||||
Investments Purchased with Cash Collateral from Securities on Loan |
| |||||||
Money Market Funds–5.57% |
| |||||||
Invesco Private Government Fund, 4.28%(d)(e)(f) | 36,445,618 | 36,445,618 | ||||||
| ||||||||
Invesco Private Prime Fund, 4.46%(d)(e)(f) | 93,689,198 | 93,717,304 | ||||||
| ||||||||
Total Investments Purchased with Cash Collateral from Securities on Loan |
| 130,162,922 | ||||||
| ||||||||
TOTAL INVESTMENTS IN SECURITIES–105.57% |
| 2,466,313,811 | ||||||
| ||||||||
OTHER ASSETS LESS LIABILITIES–(5.57)% |
| (130,035,218 | ) | |||||
| ||||||||
NET ASSETS–100.00% | $ | 2,336,278,593 | ||||||
| ||||||||
See accompanying Notes to Financial Statements which are an integral part of the financial statements.
| 8 Invesco Main Street Mid Cap Fund® |
Investment Abbreviations:
REIT – Real Estate Investment Trust
Notes to Schedule of Investments:
| (a) | Industry and/or sector classifications used in this report are generally according to the Global Industry Classification Standard, which was developed by and is the exclusive property and a service mark of MSCI Inc. and Standard & Poor’s. |
| (b) | Non-income producing security. |
| (c) | All or a portion of this security was out on loan at December 31, 2022. |
| (d) | Affiliated issuer. The issuer and/or the Fund is a wholly-owned subsidiary of Invesco Ltd., or is affiliated by having an investment adviser that is under common control of Invesco Ltd. The table below shows the Fund’s transactions in, and earnings from, its investments in affiliates for the fiscal year ended December 31, 2022. |
Value December 31, 2021 | Purchases at Cost | Proceeds from Sales | Change in Unrealized Appreciation | Realized Gain (Loss) | Value December 31, 2022 | Dividend Income | |||||||||||||||||||||||||||||
| Investments in Affiliated Money Market Funds: | |||||||||||||||||||||||||||||||||||
Invesco Government & Agency Portfolio, Institutional Class | $ | 3,295,302 | $ | 164,302,931 | $ | (163,710,269) | $ | - | $ | - | $ | 3,887,964 | $ | 47,981 | |||||||||||||||||||||
Invesco Liquid Assets Portfolio, Institutional Class | 2,353,787 | 117,359,237 | (116,936,299) | - | 508 | 2,777,233 | 68,076 | ||||||||||||||||||||||||||||
Invesco Treasury Portfolio, Institutional Class | 6,164,818 | 187,774,779 | (189,496,209) | - | - | 4,443,388 | 79,917 | ||||||||||||||||||||||||||||
| Investments Purchased with Cash Collateral from Securities on Loan: | |||||||||||||||||||||||||||||||||||
Invesco Private Government Fund | 76,977,397 | 475,080,329 | (515,612,108) | - | - | 36,445,618 | 596,798* | ||||||||||||||||||||||||||||
Invesco Private Prime Fund | 179,613,921 | 1,026,307,924 | (1,112,212,231) | 9,854 | (2,164) | 93,717,304 | 1,650,314* | ||||||||||||||||||||||||||||
Total | $ | 268,405,225 | $ | 1,970,825,200 | $ | (2,097,967,116) | $ | 9,854 | $ | (1,656) | $ | 141,271,507 | $ | 2,443,086 | |||||||||||||||||||||
| * | Represents the income earned on the investment of cash collateral, which is included in securities lending income on the Statement of Operations. Does not include rebates and fees paid to lending agent or premiums received from borrowers, if any. |
| (e) | The rate shown is the 7-day SEC standardized yield as of December 31, 2022. |
| (f) | The security has been segregated to satisfy the commitment to return the cash collateral received in securities lending transactions upon the borrower’s return of the securities loaned. See Note 1K. |
See accompanying Notes to Financial Statements which are an integral part of the financial statements.
| 9 Invesco Main Street Mid Cap Fund® |
Statement of Assets and Liabilities
December 31, 2022
Assets: | ||||
Investments in unaffiliated securities, at value (Cost $2,028,203,787)* | $2,325,042,304 | |||
| ||||
Investments in affiliated money market funds, at value (Cost $ 141,264,670) | 141,271,507 | |||
| ||||
Cash | 4,514,144 | |||
| ||||
Receivable for: | ||||
Fund shares sold | 878,582 | |||
| ||||
Dividends | 2,061,609 | |||
| ||||
Investment for trustee deferred compensation and retirement plans | 565,852 | |||
| ||||
Other assets | 71,979 | |||
| ||||
Total assets | 2,474,405,977 | |||
| ||||
Liabilities: | ||||
Payable for: | ||||
Fund shares reacquired | 5,675,844 | |||
| ||||
Collateral upon return of securities loaned | 130,156,085 | |||
| ||||
Accrued fees to affiliates | 1,465,930 | |||
| ||||
Accrued trustees’ and officers’ fees and benefits | 5,926 | |||
| ||||
Accrued other operating expenses | 222,411 | |||
| ||||
Trustee deferred compensation and retirement plans | 601,188 | |||
| ||||
Total liabilities | 138,127,384 | |||
| ||||
Net assets applicable to shares outstanding | $2,336,278,593 | |||
| ||||
Net assets consist of: | ||||
Shares of beneficial interest | $2,103,884,629 | |||
| ||||
Distributable earnings | 232,393,964 | |||
| ||||
| $2,336,278,593 | ||||
| ||||
Net Assets: | ||||
Class A | $ | 1,723,024,211 | ||
| ||||
Class C | $ | 67,259,229 | ||
| ||||
Class R | $ | 140,983,027 | ||
| ||||
Class Y | $ | 310,823,410 | ||
| ||||
Class R5 | $ | 13,794,722 | ||
| ||||
Class R6 | $ | 80,393,994 | ||
| ||||
Shares outstanding, no par value, with an unlimited number of shares authorized: |
| |||
Class A | 73,807,028 | |||
| ||||
Class C | 4,103,590 | |||
| ||||
Class R | 6,629,554 | |||
| ||||
Class Y | 11,775,588 | |||
| ||||
Class R5 | 586,205 | |||
| ||||
Class R6 | 3,047,070 | |||
| ||||
Class A: | ||||
Net asset value per share | $ | 23.34 | ||
| ||||
Maximum offering price per share | $ | 24.70 | ||
| ||||
Class C: | ||||
Net asset value and offering price per share | $ | 16.39 | ||
| ||||
Class R: | ||||
Net asset value and offering price per share | $ | 21.27 | ||
| ||||
Class Y: | ||||
Net asset value and offering price per share | $ | 26.40 | ||
| ||||
Class R5: | ||||
Net asset value and offering price per share | $ | 23.53 | ||
| ||||
Class R6: | ||||
Net asset value and offering price per share | $ | 26.38 | ||
| ||||
| * | At December 31, 2022, securities with an aggregate value of $122,755,805 were on loan to brokers. |
See accompanying Notes to Financial Statements which are an integral part of the financial statements.
| 10 Invesco Main Street Mid Cap Fund® |
Statement of Operations
For the year ended December 31, 2022
Investment income: | ||||
Dividends (net of foreign withholding taxes of $48,518) | $ | 35,564,580 | ||
| ||||
Dividends from affiliated money market funds (includes net securities lending income of $169,662) | 365,636 | |||
| ||||
Total investment income | 35,930,216 | |||
| ||||
Expenses: | ||||
Advisory fees | 15,704,705 | |||
| ||||
Administrative services fees | 365,957 | |||
| ||||
Custodian fees | 26,339 | |||
| ||||
Distribution fees: | ||||
Class A | 4,553,143 | |||
| ||||
Class C | 770,384 | |||
| ||||
Class R | 769,088 | |||
| ||||
Transfer agent fees – A, C, R and Y | 4,180,919 | |||
| ||||
Transfer agent fees – R5 | 14,365 | |||
| ||||
Transfer agent fees – R6 | 24,340 | |||
| ||||
Trustees’ and officers’ fees and benefits | 35,638 | |||
| ||||
Registration and filing fees | 173,509 | |||
| ||||
Reports to shareholders | 160,718 | |||
| ||||
Professional services fees | 78,265 | |||
| ||||
Other | 24,203 | |||
| ||||
Total expenses | 26,881,573 | |||
| ||||
Less: Fees waived and/or expense offset arrangement(s) | (38,017 | ) | ||
| ||||
Net expenses | 26,843,556 | |||
| ||||
Net investment income | 9,086,660 | |||
| ||||
Realized and unrealized gain (loss) from: | ||||
Net realized gain (loss) from: | ||||
Unaffiliated investment securities | (9,909,915 | ) | ||
| ||||
Affiliated investment securities | (1,656 | ) | ||
| ||||
| (9,911,571 | ) | |||
| ||||
Change in net unrealized appreciation (depreciation) of: | ||||
Unaffiliated investment securities | (427,623,592 | ) | ||
| ||||
Affiliated investment securities | 9,854 | |||
| ||||
Foreign currencies | (428 | ) | ||
| ||||
| (427,614,166 | ) | |||
| ||||
Net realized and unrealized gain (loss) | (437,525,737 | ) | ||
| ||||
Net increase (decrease) in net assets resulting from operations | $ | (428,439,077 | ) | |
| ||||
See accompanying Notes to Financial Statements which are an integral part of the financial statements.
| 11 Invesco Main Street Mid Cap Fund® |
Statement of Changes in Net Assets
For the years ended December 31, 2022 and 2021
| 2022 | 2021 | |||||||
| ||||||||
Operations: | ||||||||
Net investment income (loss) | $ | 9,086,660 | $ | (3,532,891 | ) | |||
| ||||||||
Net realized gain (loss) | (9,911,571 | ) | 547,870,236 | |||||
| ||||||||
Change in net unrealized appreciation (depreciation) | (427,614,166 | ) | 54,443,043 | |||||
| ||||||||
Net increase (decrease) in net assets resulting from operations | (428,439,077 | ) | 598,780,388 | |||||
| ||||||||
Distributions to shareholders from distributable earnings: | ||||||||
Class A | (63,970,132 | ) | (355,543,435 | ) | ||||
| ||||||||
Class C | (3,394,552 | ) | (20,334,419 | ) | ||||
| ||||||||
Class R | (5,534,162 | ) | (31,376,253 | ) | ||||
| ||||||||
Class Y | (11,211,195 | ) | (64,993,563 | ) | ||||
| ||||||||
Class R5 | (559,132 | ) | (2,762,491 | ) | ||||
| ||||||||
Class R6 | (2,974,376 | ) | (13,642,606 | ) | ||||
| ||||||||
Total distributions from distributable earnings | (87,643,549 | ) | (488,652,767 | ) | ||||
| ||||||||
Share transactions–net: | ||||||||
Class A | (117,153,382 | ) | 193,467,001 | |||||
| ||||||||
Class C | (12,709,797 | ) | 8,056,833 | |||||
| ||||||||
Class R | (11,468,950 | ) | 16,826,232 | |||||
| ||||||||
Class Y | (54,503,086 | ) | 18,436,527 | |||||
| ||||||||
Class R5 | (575,616 | ) | 2,020,487 | |||||
| ||||||||
Class R6 | 2,965,885 | (58,471 | ) | |||||
| ||||||||
Net increase (decrease) in net assets resulting from share transactions | (193,444,946 | ) | 238,748,609 | |||||
| ||||||||
Net increase (decrease) in net assets | (709,527,572 | ) | 348,876,230 | |||||
| ||||||||
Net assets: | ||||||||
Beginning of year | 3,045,806,165 | 2,696,929,935 | ||||||
| ||||||||
End of year | $ | 2,336,278,593 | $ | 3,045,806,165 | ||||
| ||||||||
See accompanying Notes to Financial Statements which are an integral part of the financial statements.
| 12 Invesco Main Street Mid Cap Fund® |
The following schedule presents financial highlights for a share of the Fund outstanding throughout the periods indicated.
Net asset value, beginning of period | Net investment income (loss)(a) | Net gains (losses) on securities (both realized and unrealized) | Total from investment operations | Dividends from net investment income | Distributions from net realized gains | Total distributions | Net asset value, end of period | Total return(b) | Net assets, end of period (000’s omitted) | Ratio of expenses to average net assets with fee waivers and/or expenses absorbed | Ratio of expenses to average net assets without fee waivers and/or expenses absorbed(c) | Ratio of net investment income (loss) to average net assets | Portfolio turnover (d) | |||||||||||||||||||||||||||||||||||||||||||
Class A | ||||||||||||||||||||||||||||||||||||||||||||||||||||||||
Year ended 12/31/22 | $28.30 | $0.09 | $(4.16 | ) | $(4.07 | ) | $(0.03 | ) | $(0.86 | ) | $(0.89 | ) | $23.34 | (14.35 | )%(e) | $1,723,024 | 1.06 | %(e) | 1.06 | %(e) | 0.35 | %(e) | 54 | % | ||||||||||||||||||||||||||||||||
Year ended 12/31/21 | 27.52 | (0.04 | ) | 6.20 | 6.16 | (0.07 | ) | (5.31 | ) | (5.38 | ) | 28.30 | 23.02 | 2,217,085 | 1.06 | 1.06 | (0.13 | ) | 65 | |||||||||||||||||||||||||||||||||||||
Year ended 12/31/20 | 26.13 | 0.06 | 2.06 | 2.12 | – | (0.73 | ) | (0.73 | ) | 27.52 | 9.13 | (e) | 1,946,102 | 1.10 | (e) | 1.11 | (e) | 0.27 | (e) | 76 | ||||||||||||||||||||||||||||||||||||
Six months ended 12/31/19 | 25.18 | 0.07 | 2.18 | 2.25 | – | (1.30 | ) | (1.30 | ) | 26.13 | 8.95 | 1,326,188 | 1.10 | (f) | 1.12 | (f) | 0.51 | (f) | 27 | |||||||||||||||||||||||||||||||||||||
Year ended 06/30/19 | 27.59 | 0.08 | 0.25 | 0.33 | – | (2.74 | ) | (2.74 | ) | 25.18 | 2.50 | 1,364,726 | 1.09 | 1.09 | 0.30 | 59 | ||||||||||||||||||||||||||||||||||||||||
Year ended 06/30/18 | 28.59 | 0.02 | 2.84 | 2.86 | (0.12 | ) | (3.74 | ) | (3.86 | ) | 27.59 | 10.67 | 1,383,592 | 1.09 | 1.10 | 0.08 | 60 | |||||||||||||||||||||||||||||||||||||||
Class C | ||||||||||||||||||||||||||||||||||||||||||||||||||||||||
Year ended 12/31/22 | 20.29 | (0.07 | ) | (2.97 | ) | (3.04 | ) | – | (0.86 | ) | (0.86 | ) | 16.39 | (14.95 | ) | 67,259 | 1.82 | 1.82 | (0.41 | ) | 54 | |||||||||||||||||||||||||||||||||||
Year ended 12/31/21 | 21.11 | (0.21 | ) | 4.70 | 4.49 | – | (5.31 | ) | (5.31 | ) | 20.29 | 22.08 | 97,388 | 1.81 | 1.81 | (0.88 | ) | 65 | ||||||||||||||||||||||||||||||||||||||
Year ended 12/31/20 | 20.41 | (0.09 | ) | 1.52 | 1.43 | – | (0.73 | ) | (0.73 | ) | 21.11 | 8.29 | 90,764 | 1.84 | 1.87 | (0.47 | ) | 76 | ||||||||||||||||||||||||||||||||||||||
Six months ended 12/31/19 | 20.00 | (0.02 | ) | 1.73 | 1.71 | – | (1.30 | ) | (1.30 | ) | 20.41 | 8.56 | 111,246 | 1.84 | (f) | 1.88 | (f) | (0.23 | )(f) | 27 | ||||||||||||||||||||||||||||||||||||
Year ended 06/30/19 | 22.69 | (0.09 | ) | 0.14 | 0.05 | – | (2.74 | ) | (2.74 | ) | 20.00 | 1.75 | 123,764 | 1.84 | 1.85 | (0.46 | ) | 59 | ||||||||||||||||||||||||||||||||||||||
Year ended 06/30/18 | 24.22 | (0.16 | ) | 2.37 | 2.21 | – | (3.74 | ) | (3.74 | ) | 22.69 | 9.84 | 269,651 | 1.84 | 1.85 | (0.68 | ) | 60 | ||||||||||||||||||||||||||||||||||||||
Class R | ||||||||||||||||||||||||||||||||||||||||||||||||||||||||
Year ended 12/31/22 | 25.90 | 0.02 | (3.79 | ) | (3.77 | ) | – | (0.86 | ) | (0.86 | ) | 21.27 | (14.53 | ) | 140,983 | 1.32 | 1.32 | 0.09 | 54 | |||||||||||||||||||||||||||||||||||||
Year ended 12/31/21 | 25.58 | (0.11 | ) | 5.75 | 5.64 | (0.01 | ) | (5.31 | ) | (5.32 | ) | 25.90 | 22.73 | 184,312 | 1.31 | 1.31 | (0.38 | ) | 65 | |||||||||||||||||||||||||||||||||||||
Year ended 12/31/20 | 24.41 | 0.01 | 1.89 | 1.90 | – | (0.73 | ) | (0.73 | ) | 25.58 | 8.87 | 163,178 | 1.34 | 1.37 | 0.03 | 76 | ||||||||||||||||||||||||||||||||||||||||
Six months ended 12/31/19 | 23.63 | 0.03 | 2.05 | 2.08 | – | (1.30 | ) | (1.30 | ) | 24.41 | 8.81 | 145,346 | 1.34 | (f) | 1.38 | (f) | 0.27 | (f) | 27 | |||||||||||||||||||||||||||||||||||||
Year ended 06/30/19 | 26.13 | 0.01 | 0.23 | 0.24 | – | (2.74 | ) | (2.74 | ) | 23.63 | 2.28 | 152,799 | 1.34 | 1.35 | 0.05 | 59 | ||||||||||||||||||||||||||||||||||||||||
Year ended 06/30/18 | 27.28 | (0.05 | ) | 2.69 | 2.64 | (0.05 | ) | (3.74 | ) | (3.79 | ) | 26.13 | 10.37 | 171,923 | 1.34 | 1.35 | (0.18 | ) | 60 | |||||||||||||||||||||||||||||||||||||
Class Y | ||||||||||||||||||||||||||||||||||||||||||||||||||||||||
Year ended 12/31/22 | 31.87 | 0.17 | (4.67 | ) | (4.50 | ) | (0.11 | ) | (0.86 | ) | (0.97 | ) | 26.40 | (14.10 | ) | 310,823 | 0.82 | 0.82 | 0.59 | 54 | ||||||||||||||||||||||||||||||||||||
Year ended 12/31/21 | 30.40 | 0.04 | 6.87 | 6.91 | (0.13 | ) | (5.31 | ) | (5.44 | ) | 31.87 | 23.31 | 436,518 | 0.81 | 0.81 | 0.12 | 65 | |||||||||||||||||||||||||||||||||||||||
Year ended 12/31/20 | 28.69 | 0.14 | 2.30 | 2.44 | – | (0.73 | ) | (0.73 | ) | 30.40 | 9.44 | 395,290 | 0.84 | 0.87 | 0.53 | 76 | ||||||||||||||||||||||||||||||||||||||||
Six months ended 12/31/19 | 27.49 | 0.11 | 2.39 | 2.50 | – | (1.30 | ) | (1.30 | ) | 28.69 | 9.11 | 458,670 | 0.84 | (f) | 0.88 | (f) | 0.77 | (f) | 27 | |||||||||||||||||||||||||||||||||||||
Year ended 06/30/19 | 29.84 | 0.15 | 0.30 | 0.45 | (0.06 | ) | (2.74 | ) | (2.80 | ) | 27.49 | 2.73 | 477,999 | 0.84 | 0.85 | 0.55 | 59 | |||||||||||||||||||||||||||||||||||||||
Year ended 06/30/18 | 30.62 | 0.10 | 3.05 | 3.15 | (0.19 | ) | (3.74 | ) | (3.93 | ) | 29.84 | 10.96 | 596,309 | 0.84 | 0.85 | 0.32 | 60 | |||||||||||||||||||||||||||||||||||||||
Class R5 | ||||||||||||||||||||||||||||||||||||||||||||||||||||||||
Year ended 12/31/22 | 28.54 | 0.17 | (4.19 | ) | (4.02 | ) | (0.13 | ) | (0.86 | ) | (0.99 | ) | 23.53 | (14.06 | ) | 13,795 | 0.75 | 0.75 | 0.66 | 54 | ||||||||||||||||||||||||||||||||||||
Year ended 12/31/21 | 27.70 | 0.06 | 6.25 | 6.31 | (0.16 | ) | (5.31 | ) | (5.47 | ) | 28.54 | 23.41 | 17,284 | 0.74 | 0.74 | 0.19 | 65 | |||||||||||||||||||||||||||||||||||||||
Year ended 12/31/20 | 26.19 | 0.16 | 2.08 | 2.24 | – | (0.73 | ) | (0.73 | ) | 27.70 | 9.58 | 14,535 | 0.72 | 0.72 | 0.65 | 76 | ||||||||||||||||||||||||||||||||||||||||
Six months ended 12/31/19 | 25.18 | 0.11 | 2.20 | 2.31 | – | (1.30 | ) | (1.30 | ) | 26.19 | 9.19 | 11 | 0.72 | (f) | 0.72 | (f) | 0.88 | (f) | 27 | |||||||||||||||||||||||||||||||||||||
Period ended 06/30/19(g) | 23.91 | 0.02 | 1.25 | 1.27 | – | – | – | 25.18 | 5.31 | 11 | 0.72 | (f) | 0.74 | (f) | 0.66 | (f) | 59 | |||||||||||||||||||||||||||||||||||||||
Class R6 | ||||||||||||||||||||||||||||||||||||||||||||||||||||||||
Year ended 12/31/22 | 31.86 | 0.21 | (4.68 | ) | (4.47 | ) | (0.15 | ) | (0.86 | ) | (1.01 | ) | 26.38 | (14.00 | ) | 80,394 | 0.68 | 0.68 | 0.73 | 54 | ||||||||||||||||||||||||||||||||||||
Year ended 12/31/21 | 30.38 | 0.09 | 6.87 | 6.96 | (0.17 | ) | (5.31 | ) | (5.48 | ) | 31.86 | 23.50 | 93,221 | 0.67 | 0.68 | 0.26 | 65 | |||||||||||||||||||||||||||||||||||||||
Year ended 12/31/20 | 28.63 | 0.18 | 2.30 | 2.48 | – | (0.73 | ) | (0.73 | ) | 30.38 | 9.60 | 87,060 | 0.67 | 0.69 | 0.70 | 76 | ||||||||||||||||||||||||||||||||||||||||
Six months ended 12/31/19 | 27.41 | 0.13 | 2.39 | 2.52 | – | (1.30 | ) | (1.30 | ) | 28.63 | 9.21 | 65,001 | 0.67 | (f) | 0.69 | (f) | 0.94 | (f) | 27 | |||||||||||||||||||||||||||||||||||||
Year ended 06/30/19 | 29.77 | 0.20 | 0.29 | 0.49 | (0.11 | ) | (2.74 | ) | (2.85 | ) | 27.41 | 2.92 | 123,716 | 0.67 | 0.68 | 0.71 | 59 | |||||||||||||||||||||||||||||||||||||||
Year ended 06/30/18 | 30.57 | 0.15 | 3.03 | 3.18 | (0.24 | ) | (3.74 | ) | (3.98 | ) | 29.77 | 11.11 | 337,300 | 0.67 | 0.67 | 0.49 | 60 | |||||||||||||||||||||||||||||||||||||||
| (a) | Calculated using average shares outstanding. |
| (b) | Includes adjustments in accordance with accounting principles generally accepted in the United States of America and as such, the net asset value for financial reporting purposes and the returns based upon those net asset values may differ from the net asset value and returns for shareholder transactions. Does not include sales charges and is not annualized for periods less than one year, if applicable. |
| (c) | Does not include indirect expenses from affiliated fund fees and expenses of 0.00% for the six months ended December 31, 2019 and the years ended June 30, 2019 and 2018, respectively. |
| (d) | Portfolio turnover is calculated at the fund level and is not annualized for periods less than one year, if applicable. For the year ended December 31, 2021, the portfolio turnover calculation excludes the value of securities purchased of $96,615,194 in connection with the acquisition of Invesco Endeavor Fund into the Fund. For the year ended December 31, 2020, the portfolio turnover calculation excludes the value of securities purchased of $654,478,527 in connection with the acquisition of Invesco Mid Cap Core Equity Fund into the Fund. |
| (e) | The total return, ratio of expenses to average net assets and ratio of net investment income to average net assets reflect actual 12b-1 fees of 0.24% for the year ended December 31, 2022 and 2020. |
| (f) | Annualized. |
| (g) | Commencement date after the close of business on May 24, 2019. |
See accompanying Notes to Financial Statements which are an integral part of the financial statements.
| 13 Invesco Main Street Mid Cap Fund® |
December 31, 2022
NOTE 1–Significant Accounting Policies
Invesco Main Street Mid Cap Fund® (the “Fund”) is a series portfolio of AIM Growth Series (Invesco Growth Series) (the “Trust”). The Trust is a Delaware statutory trust registered under the Investment Company Act of 1940, as amended (the “1940 Act”), as an open-end series management investment company authorized to issue an unlimited number of shares of beneficial interest. Information presented in these financial statements pertains only to the Fund. Matters affecting the Fund or each class will be voted on exclusively by the shareholders of the Fund or each class.
The Fund’s investment objective is to seek capital appreciation.
The Fund currently consists of six different classes of shares: Class A, Class C, Class R, Class Y, Class R5 and Class R6. Class Y shares are available only to certain investors. Class A shares are sold with a front-end sales charge unless certain waiver criteria are met. Under certain circumstances, load waived shares may be subject to contingent deferred sales charges (“CDSC”). Class C shares are sold with a CDSC. Class R, Class Y, Class R5 and Class R6 shares are sold at net asset value. Class C shares held for eight years after purchase are eligible for automatic conversion into Class A shares of the same Fund (the “Conversion Feature”). The automatic conversion pursuant to the Conversion Feature will generally occur at the end of the month following the eighth anniversary after a purchase of Class C shares.
The Fund is an investment company and accordingly follows the investment company accounting and reporting guidance in accordance with Financial Accounting Standards Board Accounting Standards Codification Topic 946, Financial Services – Investment Companies.
The following is a summary of the significant accounting policies followed by the Fund in the preparation of its financial statements.
| A. | Security Valuations – Securities, including restricted securities, are valued according to the following policy. |
A security listed or traded on an exchange is generally valued at its trade price or official closing price that day as of the close of the exchange where the security is principally traded, or lacking any trades or official closing price on a particular day, the security may be valued at the closing bid price on that day. Securities traded in the over-the-counter market are valued based on prices furnished by independent pricing services or market makers. When such securities are valued using prices provided by an independent pricing service they may be considered fair valued. Futures contracts are valued at the daily settlement price set by an exchange on which they are principally traded. U.S. exchange-traded options are valued at the mean between the last bid and asked prices from the exchange on which they are principally traded. Non-U.S. exchange-traded options are valued at the final settlement price set by the exchange on which they trade. Options not listed on an exchange and swaps generally are valued using pricing provided from independent pricing services.
Securities of investment companies that are not exchange-traded (e.g., open-end mutual funds) are valued using such company’s end-of-business-day net asset value per share.
Deposits, other obligations of U.S. and non-U.S. banks and financial institutions are valued at their daily account value.
Fixed income securities (including convertible debt securities) generally are valued on the basis of prices provided by independent pricing services. Prices provided by the pricing service may be determined without exclusive reliance on quoted prices, and may reflect appropriate factors such as institution-size trading in similar groups of securities, developments related to specific securities, dividend rate (for unlisted equities), yield (for debt obligations), quality, type of issue, coupon rate (for debt obligations), maturity (for debt obligations), individual trading characteristics and other market data. Pricing services generally value debt obligations assuming orderly transactions of institutional round lot size, but a fund may hold or transact in the same securities in smaller, odd lot sizes. Odd lots often trade at lower prices than institutional round lots, and their value may be adjusted accordingly. Debt obligations are subject to interest rate and credit risks. In addition, all debt obligations involve some risk of default with respect to interest and/or principal payments.
Foreign securities’ (including foreign exchange contracts) prices are converted into U.S. dollar amounts using the applicable exchange rates as of the close of the New York Stock Exchange (“NYSE”). If market quotations are available and reliable for foreign exchange-traded equity securities, the securities will be valued at the market quotations. Invesco Advisers, Inc. (the “Adviser” or “Invesco”) may use various pricing services to obtain market quotations as well as fair value prices. Because trading hours for certain foreign securities end before the close of the NYSE, closing market quotations may become not representative of market value in the Adviser’s judgment (“unreliable”). If, between the time trading ends on a particular security and the close of the customary trading session on the NYSE, a significant event occurs that makes the closing price of the security unreliable, the Adviser may fair value the security. If the event is likely to have affected the closing price of the security, the security will be valued at fair value in good faith in accordance with Board- approved policies and related Adviser procedures (“Valuation Procedures”). Adjustments to closing prices to reflect fair value may also be based on a screening process of an independent pricing service to indicate the degree of certainty, based on historical data, that the closing price in the principal market where a foreign security trades is not the current value as of the close of the NYSE. Foreign securities’ prices meeting the degree of certainty that the price is not reflective of current value will be priced at the indication of fair value from the independent pricing service. Multiple factors may be considered by the independent pricing service in determining adjustments to reflect fair value and may include information relating to sector indices, American Depositary Receipts and domestic and foreign index futures. Foreign securities may have additional risks including exchange rate changes, potential for sharply devalued currencies and high inflation, political and economic upheaval, the relative lack of issuer information, relatively low market liquidity and the potential lack of strict financial and accounting controls and standards.
Unlisted securities will be valued using prices provided by independent pricing services or by another method that the Adviser, in its judgment, believes better reflects the security’s fair value in accordance with the Valuation Procedures.
Securities for which market prices are not provided by any of the above methods may be valued based upon quotes furnished by independent sources. The last bid price may be used to value equity securities. The mean between the last bid and asked prices may be used to value debt obligations, including corporate loans.
Securities for which market quotations are not readily available are fair valued by the Adviser in accordance with the Valuation Procedures. If a fair value price provided by a pricing service is unreliable, the Adviser will fair value the security using the Valuation Procedures. Issuer specific events, market trends, bid/asked quotes of brokers and information providers and other market data may be reviewed in the course of making a good faith determination of a security’s fair value.
The Fund may invest in securities that are subject to interest rate risk, meaning the risk that the prices will generally fall as interest rates rise and, conversely, the prices will generally rise as interest rates fall. Specific securities differ in their sensitivity to changes in interest rates depending on their individual characteristics. Changes in interest rates may result in increased market volatility, which may affect the value and/or liquidity of certain Fund investments.
Valuations change in response to many factors including the historical and prospective earnings of the issuer, the value of the issuer’s assets, general market conditions which are not specifically related to the particular issuer, such as real or perceived adverse economic conditions, changes in the general outlook for revenues or corporate earnings, changes in interest or currency rates, regional or global instability, natural or environmental disasters, widespread disease or other public health issues, war, acts of terrorism, significant governmental actions or adverse investor sentiment generally and market liquidity. Because of the inherent uncertainties of valuation, the values reflected in the financial statements may materially differ from the value received upon actual sale of those investments.
The price the Fund could receive upon the sale of any investment may differ from the Adviser’s valuation of the investment, particularly for securities that are valued using a fair valuation technique. When fair valuation techniques are applied, the Adviser uses available information, including both observable and unobservable inputs and assumptions, to determine a methodology that will result in a valuation that the Adviser believes approximates market value. Fund securities that are fair valued may be subject to greater fluctuation in their value from one day to the next than would be the case if market quotations were used. Because of the inherent uncertainties of valuation, and the degree of subjectivity in such decisions, the Fund could realize a greater or lesser than expected gain or loss upon the sale of the investment.
| 14 Invesco Main Street Mid Cap Fund® |
| B. | Securities Transactions and Investment Income – Securities transactions are accounted for on a trade date basis. Realized gains or losses on sales are computed on the basis of specific identification of the securities sold. Interest income (net of withholding tax, if any) is recorded on an accrual basis from settlement date and includes coupon interest and amortization of premium and accretion of discount on debt securities as applicable. Dividend income (net of withholding tax, if any) is recorded on the ex-dividend date. |
The Fund may periodically participate in litigation related to Fund investments. As such, the Fund may receive proceeds from litigation settlements. Any proceeds received are included in the Statement of Operations as realized gain (loss) for investments no longer held and as unrealized gain (loss) for investments still held.
Brokerage commissions and mark ups are considered transaction costs and are recorded as an increase to the cost basis of securities purchased and/or a reduction of proceeds on a sale of securities. Such transaction costs are included in the determination of net realized and unrealized gain (loss) from investment securities reported in the Statement of Operations and the Statement of Changes in Net Assets and the net realized and unrealized gains (losses) on securities per share in the Financial Highlights. Transaction costs are included in the calculation of the Fund’s net asset value and, accordingly, they reduce the Fund’s total returns. These transaction costs are not considered operating expenses and are not reflected in net investment income reported in the Statement of Operations and the Statement of Changes in Net Assets, or the net investment income per share and the ratios of expenses and net investment income reported in the Financial Highlights, nor are they limited by any expense limitation arrangements between the Fund and the investment adviser.
The Fund allocates income and realized and unrealized capital gains and losses to a class based on the relative net assets of each class.
The Fund recharacterizes distributions received from REIT investments based on information provided by the REIT into the following categories: ordinary income, long-term and short-term capital gains, and return of capital. If information is not available on a timely basis from the REIT, the recharacterization will be based on available information which may include the previous year’s allocation. If new or additional information becomes available from the REIT at a later date, a recharacterization will be made in the following year. The Fund records as dividend income the amount recharacterized as ordinary income and as realized gain the amount recharacterized as capital gain in the Statement of Operations, and the amount recharacterized as return of capital as a reduction of the cost of the related investment. These recharacterizations are reflected in the accompanying financial statements.
| C. | Country Determination – For the purposes of making investment selection decisions and presentation in the Schedule of Investments, the investment adviser may determine the country in which an issuer is located and/or credit risk exposure based on various factors. These factors include the laws of the country under which the issuer is organized, where the issuer maintains a principal office, the country in which the issuer derives 50% or more of its total revenues, the country that has the primary market for the issuer’s securities and its “country of risk” as determined by a third party service provider, as well as other criteria. Among the other criteria that may be evaluated for making this determination are the country in which the issuer maintains 50% or more of its assets, the type of security, financial guarantees and enhancements, the nature of the collateral and the sponsor organization. Country of issuer and/or credit risk exposure has been determined to be the United States of America, unless otherwise noted. |
| D. | Distributions – Distributions from net investment income and net realized capital gain, if any, are generally declared and paid annually and recorded on the ex-dividend date. The Fund may elect to treat a portion of the proceeds from redemptions as distributions for federal income tax purposes. |
| E. | Master Limited Partnerships – The Fund invests in Master Limited Partnerships (“MLPs”). MLPs are publicly traded partnerships and limited liability companies taxed as partnerships under the Internal Revenue Code of 1986, as amended (the “Internal Revenue Code”). The Fund invests in MLPs engaged in, among other things, the transportation, storage, processing, refining, marketing, exploration, production and mining of minerals and natural resources. The Fund is a partner in each MLP; accordingly, the Fund is required to take into account the Fund’s allocable share of income, gains, losses, deductions, expenses, and tax credits recognized by each MLP. |
MLP’s may be less liquid and subject to more abrupt or erratic price movements than conventional publicly traded securities.
| F. | Return of Capital – Distributions received from the Fund’s investments in MLPs generally are comprised of income and return of capital. The Fund records investment income and return of capital based on estimates made at the time such distributions are received. The return of capital portion of the distribution is a reduction to investment income that results in an equivalent reduction in the cost basis of the associated investments and increases net realized gains (losses) and change in unrealized appreciation (depreciation). Such estimates are based on historical information available from each MLP and other industry sources. These estimates will subsequently be revised and may materially differ primarily based on information received from the MLPs after their tax reporting periods are concluded. |
| G. | Federal Income Taxes – The Fund intends to comply with the requirements of Subchapter M of the Internal Revenue Code of 1986, as amended (the “Internal Revenue Code”), necessary to qualify as a regulated investment company and to distribute substantially all of the Fund’s taxable earnings to shareholders. As such, the Fund will not be subject to federal income taxes on otherwise taxable income (including net realized capital gain) that is distributed to shareholders. |
Therefore, no provision for federal income taxes is recorded in the financial statements.
The Fund recognizes the tax benefits of uncertain tax positions only when the position is more likely than not to be sustained. Management has analyzed the Fund’s uncertain tax positions and concluded that no liability for unrecognized tax benefits should be recorded related to uncertain tax positions. Management is not aware of any tax positions for which it is reasonably possible that the total amounts of unrecognized tax benefits will change materially in the next 12 months.
The Fund files tax returns in the U.S. Federal jurisdiction and certain other jurisdictions. Generally, the Fund is subject to examinations by such taxing authorities for up to three years after the filing of the return for the tax period.
| H. | Expenses – Fees provided for under the Rule 12b-1 plan of a particular class of the Fund are charged to the operations of such class. Transfer agency fees and expenses and other shareholder recordkeeping fees and expenses attributable to Class R5 and Class R6 are allocated based on relative net assets of Class R5 and Class R6. Sub-accounting fees attributable to Class R5 are charged to the operations of the class. Transfer agency fees and expenses and other shareholder recordkeeping fees and expenses relating to all other classes are allocated among those classes based on relative net assets. All other expenses are allocated among the classes based on relative net assets. |
| I. | Accounting Estimates – The preparation of financial statements in conformity with accounting principles generally accepted in the United States of America (“GAAP”) requires management to make estimates and assumptions that affect the reported amounts of assets and liabilities at the date of the financial statements and the reported amounts of revenues and expenses during the reporting period including estimates and assumptions related to taxation. Actual results could differ from those estimates by a significant amount. In addition, the Fund monitors for material events or transactions that may occur or become known after the period-end date and before the date the financial statements are released to print. |
| J. | Indemnifications – Under the Trust’s organizational documents, each Trustee, officer, employee or other agent of the Trust is indemnified against certain liabilities that may arise out of the performance of their duties to the Fund. Additionally, in the normal course of business, the Fund enters into contracts, including the Fund’s servicing agreements, that contain a variety of indemnification clauses. The Fund’s maximum exposure under these arrangements is unknown as this would involve future claims that may be made against the Fund that have not yet occurred. The risk of material loss as a result of such indemnification claims is considered remote. |
| K. | Securities Lending – The Fund may lend portfolio securities having a market value up to one-third of the Fund’s total assets. Such loans are secured by collateral equal to no less than the market value of the loaned securities determined daily by the securities lending provider. Such collateral will be cash or debt securities issued or guaranteed by the U.S. Government or any of its sponsored agencies. Cash collateral received in connection with these loans is invested in short-term money market instruments or affiliated, unregistered investment companies that comply with Rule 2a-7 under the 1940 Act and money market funds (collectively, “affiliated money market funds”) and is shown as such on the Schedule of Investments. The Fund bears the risk of loss with respect to the investment of collateral. It is the Fund’s policy to obtain additional collateral from or return excess collateral to the borrower by the end of the next business day, |
| 15 Invesco Main Street Mid Cap Fund® |
following the valuation date of the securities loaned. Therefore, the value of the collateral held may be temporarily less than the value of the securities on loan. When loaning securities, the Fund retains certain benefits of owning the securities, including the economic equivalent of dividends or interest generated by the security. Lending securities entails a risk of loss to the Fund if, and to the extent that, the market value of the securities loaned were to increase and the borrower did not increase the collateral accordingly, and the borrower failed to return the securities. The securities loaned are subject to termination at the option of the borrower or the Fund. Upon termination, the borrower will return to the Fund the securities loaned and the Fund will return the collateral. Upon the failure of the borrower to return the securities, collateral may be liquidated and the securities may be purchased on the open market to replace the loaned securities. The Fund could experience delays and costs in gaining access to the collateral and the securities may lose value during the delay which could result in potential losses to the Fund. Some of these losses may be indemnified by the lending agent. The Fund bears the risk of any deficiency in the amount of the collateral available for return to the borrower due to any loss on the collateral invested. Dividends received on cash collateral investments for securities lending transactions, which are net of compensation to counterparties, are included in Dividends from affiliated money market funds on the Statement of Operations. The aggregate value of securities out on loan, if any, is shown as a footnote on the Statement of Assets and Liabilities.
The Adviser serves as an affiliated securities lending agent for the Fund. The Bank of New York Mellon also serves as a lending agent. To the extent the Fund utilizes the Adviser as an affiliated securities lending agent, the Fund conducts its securities lending in accordance with, and in reliance upon, no-action letters issued by the SEC staff that provide guidance on how an affiliate may act as a direct agent lender and receive compensation for those services in a manner consistent with the federal securities laws. For the year ended December 31, 2022, the Fund paid the Adviser $7,275 in fees for securities lending agent services. Fees paid to the Adviser for securities lending agent services, if any, are included in Dividends from affiliated money market funds on the Statement of Operations.
| L. | Foreign Currency Translations – Foreign currency is valued at the close of the NYSE based on quotations posted by banks and major currency dealers. Portfolio securities and other assets and liabilities denominated in foreign currencies are translated into U.S. dollar amounts at the date of valuation. Purchases and sales of portfolio securities (net of foreign taxes withheld on disposition) and income items denominated in foreign currencies are translated into U.S. dollar amounts on the respective dates of such transactions. The Fund does not separately account for the portion of the results of operations resulting from changes in foreign exchange rates on investments and the fluctuations arising from changes in market prices of securities held. The combined results of changes in foreign exchange rates and the fluctuation of market prices on investments (net of estimated foreign tax withholding) are included with the net realized and unrealized gain or loss from investments in the Statement of Operations. Reported net realized foreign currency gains or losses arise from (1) sales of foreign currencies, (2) currency gains or losses realized between the trade and settlement dates on securities transactions, and (3) the difference between the amounts of dividends, interest, and foreign withholding taxes recorded on the Fund’s books and the U.S. dollar equivalent of the amounts actually received or paid. Net unrealized foreign currency gains and losses arise from changes in the fair values of assets and liabilities, other than investments in securities at fiscal period end, resulting from changes in exchange rates. |
The Fund may invest in foreign securities, which may be subject to foreign taxes on income, gains on investments or currency repatriation, a portion of which may be recoverable. Foreign taxes, if any, are recorded based on the tax regulations and rates that exist in the foreign markets in which the Fund invests and are shown in the Statement of Operations.
| M. | Forward Foreign Currency Contracts – The Fund may engage in foreign currency transactions either on a spot (i.e. for prompt delivery and settlement) basis, or through forward foreign currency contracts, to manage or minimize currency or exchange rate risk. |
The Fund may also enter into forward foreign currency contracts for the purchase or sale of a security denominated in a foreign currency in order to “lock in” the U.S. dollar price of that security, or the Fund may also enter into forward foreign currency contracts that do not provide for physical exchange of the two currencies on the settlement date, but instead are settled by a single cash payment calculated as the difference between the agreed upon exchange rate and the spot rate at settlement based upon an agreed upon notional amount (non-deliverable forwards).
A forward foreign currency contract is an obligation between two parties (“Counterparties”) to purchase or sell a specific currency for an agreed-upon price at a future date. The use of forward foreign currency contracts for hedging does not eliminate fluctuations in the price of the underlying securities the Fund owns or intends to acquire but establishes a rate of exchange in advance. Fluctuations in the value of these contracts are measured by the difference in the contract date and reporting date exchange rates and are recorded as unrealized appreciation (depreciation) until the contracts are closed. When the contracts are closed, realized gains (losses) are recorded. Realized and unrealized gains (losses) on the contracts are included in the Statement of Operations. The primary risks associated with forward foreign currency contracts include failure of the Counterparty to meet the terms of the contract and the value of the foreign currency changing unfavorably. These risks may be in excess of the amounts reflected in the Statement of Assets and Liabilities.
| N. | COVID-19 Risk – The COVID-19 strain of coronavirus has resulted in instances of market closures and dislocations, extreme volatility, liquidity constraints and increased trading costs. Efforts to contain its spread have resulted in travel restrictions, disruptions of healthcare systems, business operations (including business closures) and supply chains, layoffs, lower consumer demand and employee availability, and defaults and credit downgrades, among other significant economic impacts that have disrupted global economic activity across many industries. Such economic impacts may exacerbate other pre-existing political, social and economic risks locally or globally and cause general concern and uncertainty. The full economic impact and ongoing effects of COVID-19 (or other future epidemics or pandemics) at the macro-level and on individual businesses are unpredictable and may result in significant and prolonged effects on the Fund’s performance. |
NOTE 2–Advisory Fees and Other Fees Paid to Affiliates
The Trust has entered into a master investment advisory agreement with the Adviser. Under the terms of the investment advisory agreement, the Fund accrues daily and pays monthly an advisory fee to the Adviser based on the annual rate of the Fund’s average daily net assets as follows:
| Average Daily Net Assets | Rate* | |
First $ 200 million | 0.735% | |
Next $200 million | 0.730% | |
Next $200 million | 0.690% | |
Next $200 million | 0.660% | |
Next $4.2 billion | 0.600% | |
Over $5 billion | 0.580% |
| * | The advisory fee paid by the Fund shall be reduced by any amounts paid by the Fund under the administrative services agreement with the Adviser. |
For the year ended December 31, 2022, the effective advisory fee rate incurred by the Fund was 0.62%.
Under the terms of a master sub-advisory agreement between the Adviser and each of Invesco Asset Management Deutschland GmbH, Invesco Asset Management Limited, Invesco Asset Management (Japan) Limited, Invesco Hong Kong Limited, Invesco Senior Secured Management, Inc. and Invesco Canada Ltd. and separate sub-advisory agreements with Invesco Capital Management LLC and Invesco Asset Management (India) Private Limited (collectively, the “Affiliated Sub-Advisers”) the Adviser, not the Fund, will pay 40% of the fees paid to the Adviser to any such Affiliated Sub-Adviser(s) that provide(s) discretionary investment management services
| 16 Invesco Main Street Mid Cap Fund® |
to the Fund based on the percentage of assets allocated to such Affiliated Sub-Adviser(s). Invesco has also entered into a sub-advisory agreement with OppenheimerFunds, Inc. to provide discretionary management services to the Fund.
The Adviser has contractually agreed, through at least June 30, 2023, to waive advisory fees and/or reimburse expenses of all shares to the extent necessary to limit total annual fund operating expenses after fee waiver and/or expense reimbursement (excluding certain items discussed below) of Class A, Class C, Class R, Class Y, Class R5 and Class R6 shares to 2.00%, 2.75%, 2.25%, 1.75%, 1.75% and 1.75%, respectively, of the Fund’s average daily net assets (the “expense limits”). In determining the Adviser’s obligation to waive advisory fees and/or reimburse expenses, the following expenses are not taken into account, and could cause the total annual fund operating expenses after fee waiver and/or reimbursement to exceed the numbers reflected above: (1) interest; (2) taxes; (3) dividend expense on short sales; (4) extraordinary or non-routine items, including litigation expenses; and (5) expenses that the Fund has incurred but did not actually pay because of an expense offset arrangement. Unless Invesco continues the fee waiver agreement, it will terminate on June 30, 2023. During its term, the fee waiver agreement cannot be terminated or amended to increase the expense limits or reduce the advisory fee waivers without approval of the Board of Trustees. The Adviser did not waive fees and/or reimburse expenses during the period under these expense limits.
Further, the Adviser has contractually agreed, through at least June 30, 2024, to waive the advisory fee payable by the Fund in an amount equal to 100% of the net advisory fees the Adviser receives from the affiliated money market funds on investments by the Fund of uninvested cash (excluding investments of cash collateral from securities lending) in such affiliated money market funds.
For the year ended December 31, 2022, the Adviser waived advisory fees of $10,143.
The Trust has entered into a master administrative services agreement with Invesco pursuant to which the Fund has agreed to pay Invesco for certain administrative costs incurred in providing accounting services to the Fund. For the year ended December 31, 2022, expenses incurred under the agreement are shown in the Statement of Operations as Administrative services fees. Invesco has entered into a sub-administration agreement whereby State Street Bank and Trust Company (“SSB”) serves as fund accountant and provides certain administrative services to the Fund. Pursuant to a custody agreement with the Trust on behalf of the Fund, SSB also serves as the Fund’s custodian.
The Trust has entered into a transfer agency and service agreement with Invesco Investment Services, Inc. (“IIS”) pursuant to which the Fund has agreed to pay IIS a fee for providing transfer agency and shareholder services to the Fund and reimburse IIS for certain expenses incurred by IIS in the course of providing such services. IIS may make payments to intermediaries that provide omnibus account services, sub-accounting services and/or networking services. All fees payable by IIS to intermediaries that provide omnibus account services or sub-accounting services are charged back to the Fund, subject to certain limitations approved by the Trust’s Board of Trustees. For the year ended December 31, 2022, expenses incurred under the agreement are shown in the Statement of Operations as Transfer agent fees.
The Trust has entered into master distribution agreements with Invesco Distributors, Inc. (“IDI”) to serve as the distributor for the Class A, Class C, Class R, Class Y, Class R5 and Class R6 shares of the Fund. The Trust has adopted plans pursuant to Rule 12b-1 under the 1940 Act with respect to the Fund’s Class A, Class C and Class R shares (collectively, the “Plans”). The Fund, pursuant to the Class A Plan, reimburses IDI for its allocated share of expenses incurred for the period, up to a maximum annual rate of 0.25% of the average daily net assets of Class A shares. The Fund, pursuant to the Class C and Class R Plans, pays IDI compensation at the annual rate of 1.00% of the average daily net assets of Class C shares and 0.50% of the average daily net assets of Class R shares. The fees are accrued daily and paid monthly. Of the Plan payments, up to 0.25% of the average daily net assets of each class of shares may be paid to furnish continuing personal shareholder services to customers who purchase and own shares of such classes. Any amounts not paid as a service fee under the Plans would constitute an asset-based sales charge. Rules of the Financial Industry Regulatory Authority (“FINRA”) impose a cap on the total sales charges, including asset-based sales charges, that may be paid by any class of shares of the Fund. For the year ended December 31, 2022, expenses incurred under the Plans are shown in the Statement of Operations as Distribution fees.
Front-end sales commissions and CDSC (collectively, the “sales charges”) are not recorded as expenses of the Fund. Front-end sales commissions are deducted from proceeds from the sales of Fund shares prior to investment in Class A shares of the Fund. CDSC are deducted from redemption proceeds prior to remittance to the shareholder. During the year ended December 31, 2022, IDI advised the Fund that IDI retained $121,274 in front-end sales commissions from the sale of Class A shares and $6,943 and $1,138 from Class A and Class C shares, respectively, for CDSC imposed upon redemptions by shareholders.
For the year ended December 31, 2022, the Fund incurred $21,401 in brokerage commissions with Invesco Capital Markets, Inc., an affiliate of the Adviser and IDI, for portfolio transactions executed on behalf of the Fund.
Certain officers and trustees of the Trust are officers and directors of the Adviser, IIS and/or IDI.
NOTE 3–Additional Valuation Information
GAAP defines fair value as the price that would be received to sell an asset or paid to transfer a liability in an orderly transaction between market participants at the measurement date, under current market conditions. GAAP establishes a hierarchy that prioritizes the inputs to valuation methods, giving the highest priority to readily available unadjusted quoted prices in an active market for identical assets (Level 1) and the lowest priority to significant unobservable inputs (Level 3), generally when market prices are not readily available. Based on the valuation inputs, the securities or other investments are tiered into one of three levels. Changes in valuation methods may result in transfers in or out of an investment’s assigned level:
| Level 1 - | Prices are determined using quoted prices in an active market for identical assets. | |
| Level 2 - | Prices are determined using other significant observable inputs. Observable inputs are inputs that other market participants may use in pricing a security. These may include quoted prices for similar securities, interest rates, prepayment speeds, credit risk, yield curves, loss severities, default rates, discount rates, volatilities and others. | |
| Level 3 - | Prices are determined using significant unobservable inputs. In situations where quoted prices or observable inputs are unavailable (for example, when there is little or no market activity for an investment at the end of the period), unobservable inputs may be used. Unobservable inputs reflect the Adviser’s assumptions about the factors market participants would use in determining fair value of the securities or instruments and would be based on the best available information. |
The following is a summary of the tiered valuation input levels, as of December 31, 2022. The level assigned to the securities valuations may not be an indication of the risk or liquidity associated with investing in those securities. Because of the inherent uncertainties of valuation, the values reflected in the financial statements may materially differ from the value received upon actual sale of those investments.
| Level 1 | Level 2 | Level 3 | Total | |||||||||||
Investments in Securities | ||||||||||||||
Common Stocks & Other Equity Interests | $2,325,042,304 | $ – | $– | $2,325,042,304 | ||||||||||
Money Market Funds | 11,108,585 | 130,162,922 | – | 141,271,507 | ||||||||||
Total Investments | $2,336,150,889 | $130,162,922 | $– | $2,466,313,811 | ||||||||||
NOTE 4–Security Transactions with Affiliated Funds
The Fund is permitted to purchase securities from or sell securities to certain other affiliated funds under specified conditions outlined in procedures adopted by the Board of Trustees of the Trust. The procedures have been designed to ensure that any purchase or sale of securities by the Fund from or to another fund that is or
| 17 Invesco Main Street Mid Cap Fund® |
could be considered an “affiliated person” by virtue of having a common investment adviser (or affiliated investment advisers), common Trustees and/or common officers is made in reliance on Rule 17a-7 of the 1940 Act and, to the extent applicable, related SEC staff positions. Each such transaction is effected at the security’s “current market price”, as provided for in these procedures and Rule 17a-7. Pursuant to these procedures, for the year ended December 31, 2022, the Fund engaged in securities purchases of $5,242,609.
NOTE 5–Expense Offset Arrangement(s)
The expense offset arrangement is comprised of transfer agency credits which result from balances in demand deposit accounts used by the transfer agent for clearing shareholder transactions. For the year ended December 31, 2022, the Fund received credits from this arrangement, which resulted in the reduction of the Fund’s total expenses of $27,874.
NOTE 6–Trustees’ and Officers’ Fees and Benefits
Trustees’ and Officers’ Fees and Benefits include amounts accrued by the Fund to pay remuneration to certain Trustees and Officers of the Fund. Trustees have the option to defer compensation payable by the Fund, and Trustees’ and Officers’ Fees and Benefits also include amounts accrued by the Fund to fund such deferred compensation amounts. Those Trustees who defer compensation have the option to select various Invesco Funds in which their deferral accounts shall be deemed to be invested. Finally, certain current Trustees were eligible to participate in a retirement plan that provided for benefits to be paid upon retirement to Trustees over a period of time based on the number of years of service. The Fund may have certain former Trustees who also participate in a retirement plan and receive benefits under such plan. Trustees’ and Officers’ Fees and Benefits include amounts accrued by the Fund to fund such retirement benefits. Obligations under the deferred compensation and retirement plans represent unsecured claims against the general assets of the Fund.
NOTE 7–Cash Balances
The Fund is permitted to temporarily carry a negative or overdrawn balance in its account with SSB, the custodian bank. Such balances, if any at period-end, are shown in the Statement of Assets and Liabilities under the payable caption Amount due custodian. To compensate the custodian bank for such overdrafts, the overdrawn Fund may either (1) leave funds as a compensating balance in the account so the custodian bank can be compensated by earning the additional interest; or (2) compensate by paying the custodian bank at a rate agreed upon by the custodian bank and Invesco, not to exceed the contractually agreed upon rate. The Fund may not purchase additional securities when any borrowings from banks or broker-dealers exceed 5% of the Fund’s total assets, or when any borrowings from an Invesco Fund are outstanding.
NOTE 8–Distributions to Shareholders and Tax Components of Net Assets
Tax Character of Distributions to Shareholders Paid During the Fiscal Years Ended December 31, 2022 and 2021:
| 2022 | 2021 | |||||||||
Ordinary income* | $ | 15,601,433 | $172,815,707 | |||||||
Long-term capital gain | 72,042,116 | 315,837,060 | ||||||||
Total distributions | $ | 87,643,549 | $488,652,767 | |||||||
| * | Includes short-term capital gain distributions, if any. |
Tax Components of Net Assets at Period-End:
| 2022 | ||||
| ||||
Undistributed ordinary income | $ | 1,797,519 | ||
| ||||
Net unrealized appreciation – investments | 296,780,729 | |||
| ||||
Temporary book/tax differences | (477,150 | ) | ||
| ||||
Capital loss carryforward | (65,707,134 | ) | ||
| ||||
Shares of beneficial interest | 2,103,884,629 | |||
| ||||
Total net assets | $ | 2,336,278,593 | ||
| ||||
The difference between book-basis and tax-basis unrealized appreciation (depreciation) is due to differences in the timing of recognition of gains and losses on investments for tax and book purposes. The Fund’s net unrealized appreciation (depreciation) difference is attributable primarily to wash sales.
The temporary book/tax differences are a result of timing differences between book and tax recognition of income and/or expenses. The Fund’s temporary book/tax differences are the result of the trustee deferral of compensation and retirement plan benefits.
Capital loss carryforward is calculated and reported as of a specific date. Results of transactions and other activity after that date may affect the amount of capital loss carryforward actually available for the Fund to utilize. The ability to utilize capital loss carryforward in the future may be limited under the Internal Revenue Code and related regulations based on the results of future transactions.
The Fund has a capital loss carryforward as of December 31, 2022, as follows:
| Capital Loss Carryforward* | ||||||||||
| ||||||||||
| Expiration | Short-Term | Long-Term | Total | |||||||
| ||||||||||
Not subject to expiration | $ | 65,707,134 | $– | $ | 65,707,134 | |||||
| ||||||||||
| * | Capital loss carryforward is reduced for limitations, if any, to the extent required by the Internal Revenue Code and may be further limited depending upon a variety of factors, including the realization of net unrealized gains or losses as of the date of any reorganization. |
| 18 Invesco Main Street Mid Cap Fund® |
NOTE 9–Investment Transactions
The aggregate amount of investment securities (other than short-term securities, U.S. Government obligations and money market funds, if any) purchased and sold by the Fund during the year ended December 31, 2022 was $1,363,398,829 and $1,633,550,744, respectively. Cost of investments, including any derivatives, on a tax basis includes the adjustments for financial reporting purposes as of the most recently completed federal income tax reporting period-end.
Unrealized Appreciation (Depreciation) of Investments on a Tax Basis | ||||
Aggregate unrealized appreciation of investments | $ | 427,957,040 | ||
| ||||
Aggregate unrealized (depreciation) of investments | (131,176,311 | ) | ||
| ||||
Net unrealized appreciation of investments | $ | 296,780,729 | ||
| ||||
Cost of investments for tax purposes is $2,169,533,082.
NOTE 10–Reclassification of Permanent Differences
Primarily as a result of differing book/tax treatment of partnerships, on December 31, 2022, undistributed net investment income was increased by $22,216,800, undistributed net realized gain (loss) was decreased by $18,448,952 and shares of beneficial interest was decreased by $3,767,848. Further, as a result of tax deferrals acquired in the reorganization of Invesco Mid Cap Core Equity Fund into the Fund, and. These reclassifications had no effect on the net assets of the Fund.
NOTE 11–Share Information
| Summary of Share Activity | ||||||||||||||||
| ||||||||||||||||
| Year ended | Year ended | |||||||||||||||
| December 31, 2022(a) | December 31, 2021 | |||||||||||||||
| Shares | Amount | Shares | Amount | |||||||||||||
| ||||||||||||||||
Sold: | ||||||||||||||||
Class A | 3,724,323 | $ | 92,878,240 | 3,421,801 | $ | 105,800,038 | ||||||||||
| ||||||||||||||||
Class C | 513,421 | 9,128,755 | 506,268 | 11,911,844 | ||||||||||||
| ||||||||||||||||
Class R | 754,696 | 17,214,956 | 896,841 | 25,697,898 | ||||||||||||
| ||||||||||||||||
Class Y | 1,309,201 | 36,854,972 | 1,590,184 | 54,444,030 | ||||||||||||
| ||||||||||||||||
Class R5 | 83,613 | 2,067,184 | 77,474 | 2,381,041 | ||||||||||||
| ||||||||||||||||
Class R6 | 611,788 | 17,039,515 | 845,789 | 28,855,197 | ||||||||||||
| ||||||||||||||||
Issued as reinvestment of dividends: | ||||||||||||||||
Class A | 2,654,164 | 61,683,358 | 12,497,060 | 342,419,420 | ||||||||||||
| ||||||||||||||||
Class C | 205,887 | 3,359,828 | 1,018,476 | 20,023,231 | ||||||||||||
| ||||||||||||||||
Class R | 260,901 | 5,522,448 | 1,248,067 | 31,301,522 | ||||||||||||
| ||||||||||||||||
Class Y | 370,664 | 9,741,062 | 1,811,130 | 55,873,364 | ||||||||||||
| ||||||||||||||||
Class R5 | 23,834 | 558,441 | 99,808 | 2,758,684 | ||||||||||||
| ||||||||||||||||
Class R6 | 109,305 | 2,870,348 | 423,479 | 13,060,088 | ||||||||||||
| ||||||||||||||||
Automatic conversion of Class C shares to Class A shares: | ||||||||||||||||
Class A | 383,621 | 9,494,074 | 372,438 | 11,488,958 | ||||||||||||
| ||||||||||||||||
Class C | (537,395 | ) | (9,494,074 | ) | (489,453 | ) | (11,488,958 | ) | ||||||||
| ||||||||||||||||
Issued in connection with acquisitions:(b) | ||||||||||||||||
Class A | - | - | 2,902,068 | 91,827,245 | ||||||||||||
| ||||||||||||||||
Class C | - | - | 306,598 | 7,425,168 | ||||||||||||
| ||||||||||||||||
Class R | - | - | 171,554 | 5,042,873 | ||||||||||||
| ||||||||||||||||
Class Y | - | - | 242,109 | 8,468,470 | ||||||||||||
| ||||||||||||||||
Class R5 | - | - | 79,110 | 2,522,481 | ||||||||||||
| ||||||||||||||||
Class R6 | - | - | 32,587 | 1,139,863 | ||||||||||||
| ||||||||||||||||
| 19 Invesco Main Street Mid Cap Fund® |
| Summary of Share Activity | ||||||||||||||||
| ||||||||||||||||
| Year ended | Year ended | |||||||||||||||
| December 31, 2022(a) | December 31, 2021 | |||||||||||||||
| Shares | Amount | Shares | Amount | |||||||||||||
| ||||||||||||||||
Reacquired: | ||||||||||||||||
Class A | (11,305,114 | ) | $ | (281,209,054 | ) | (11,562,288 | ) | $ | (358,068,660 | ) | ||||||
| ||||||||||||||||
Class C | (877,003 | ) | (15,704,306 | ) | (842,550 | ) | (19,814,452 | ) | ||||||||
| ||||||||||||||||
Class R | (1,502,386 | ) | (34,206,354 | ) | (1,578,093 | ) | (45,216,061 | ) | ||||||||
| ||||||||||||||||
Class Y | (3,602,287 | ) | (101,099,120 | ) | (2,950,214 | ) | (100,349,337 | ) | ||||||||
| ||||||||||||||||
Class R5 | (126,864 | ) | (3,201,241 | ) | (175,522 | ) | (5,641,719 | ) | ||||||||
| ||||||||||||||||
Class R6 | (599,972 | ) | (16,943,978 | ) | (1,241,578 | ) | (43,113,619 | ) | ||||||||
| ||||||||||||||||
Net increase (decrease) in share activity | (7,545,603 | ) | $ | (193,444,946 | ) | 9,703,143 | $ | 238,748,609 | ||||||||
| ||||||||||||||||
| (a) | There are entities that are record owners of more than 5% of the outstanding shares of the Fund and in the aggregate own 17% of the outstanding shares of the Fund. IDI has an agreement with these entities to sell Fund shares. The Fund, Invesco and/or Invesco affiliates may make payments to these entities, which are considered to be related to the Fund, for providing services to the Fund, Invesco and/or Invesco affiliates including but not limited to services such as securities brokerage, distribution, third party record keeping and account servicing. The Fund has no knowledge as to whether all or any portion of the shares owned of record by these entities are also owned beneficially. |
| (b) | After the close of business on April 23, 2021, the Fund acquired all the net assets of Invesco Endeavor Fund (the “Target Fund”) pursuant to a plan of reorganization approved by the Board of Trustees of the Fund on January 22, 2021. The reorganization was executed in order to reduce overlap and increase efficiencies in the Adviser’s product line. The acquisition was accomplished by a tax-free exchange of 3,734,026 shares of the Fund for 7,018,765 shares outstanding of the Target Fund as of the close of business on April 23, 2021. Shares of the Target Fund were exchanged for the like class of shares of the Fund, based on the relative net asset value of the Target Fund to the net asset value of the Fund on the close of business, April 23, 2021. The Target Fund’s net assets as of the close of business on April 23, 2021 of $116,426,100, including $20,639,418 of unrealized appreciation, were combined with those of the Fund. The net assets of the Fund immediately before the acquisition were $2,979,176,587 and $3,095,602,688 immediately after the acquisition. |
The pro forma results of operations for the year ended December 31, 2021 assuming the reorganization had been completed on January 1, 2021, the beginning of the annual reporting period are as follows:
Net investment income (loss) | $ | (3,735,493 | ) | |
| ||||
Net realized/unrealized gains | 618,157,011 | |||
| ||||
Change in net assets resulting from operations | $ | 614,421,518 | ||
| ||||
As the combined investment portfolios have been managed as a single integrated portfolio since the acquisition was completed, it is not practicable to separate the amounts of revenue and earnings of the Target Fund that has been included in the Fund’s Statement of Operations since April 24, 2021.
| 20 Invesco Main Street Mid Cap Fund® |
Report of Independent Registered Public Accounting Firm
To the Board of Trustees of AIM Growth Series (Invesco Growth Series) and Shareholders of Invesco Main Street Mid Cap Fund®
Opinion on the Financial Statements
We have audited the accompanying statement of assets and liabilities, including the schedule of investments, of Invesco Main Street Mid Cap Fund® (one of the funds constituting AIM Growth Series (Invesco Growth Series), referred to hereafter as the “Fund”) as of December 31, 2022, the related statement of operations for the year ended December 31, 2022, the statement of changes in net assets for each of the two years in the period ended December 31, 2022, including the related notes, and the financial highlights for each of the periods indicated in the table below (collectively referred to as the “financial statements”). In our opinion, the financial statements present fairly, in all material respects, the financial position of the Fund as of December 31, 2022, the results of its operations for the year then ended, the changes in its net assets for each of the two years in the period ended December 31, 2022 and the financial highlights for each of the periods indicated in the table below, in conformity with accounting principles generally accepted in the United States of America.
Financial Highlights |
For each of the three years in the period ended December 31, 2022, the six months ended December 31, 2019 and the year ended June 30, 2019 for Class A, Class C, Class R, Class Y and Class R6. |
For each of the three years in the period ended December 31, 2022, the six months ended December 31, 2019 and the period May 24, 2019 (commencement of operations) through June 30, 2019 for Class R5. |
The financial statements of Oppenheimer Main Street Mid Cap Fund® (subsequently renamed Invesco Main Street Mid Cap Fund®) as of and for the year ended June 30, 2018 and the financial highlights for the year ended June 30, 2018 (not presented herein, other than the financial highlights) were audited by other auditors whose report dated August 24, 2018 expressed an unqualified opinion on those financial statements and financial highlights.
Basis for Opinion
These financial statements are the responsibility of the Fund’s management. Our responsibility is to express an opinion on the Fund’s financial statements based on our audits. We are a public accounting firm registered with the Public Company Accounting Oversight Board (United States) (PCAOB) and are required to be independent with respect to the Fund in accordance with the U.S. federal securities laws and the applicable rules and regulations of the Securities and Exchange Commission and the PCAOB.
We conducted our audits of these financial statements in accordance with the standards of the PCAOB. Those standards require that we plan and perform the audit to obtain reasonable assurance about whether the financial statements are free of material misstatement, whether due to error or fraud.
Our audits included performing procedures to assess the risks of material misstatement of the financial statements, whether due to error or fraud, and performing procedures that respond to those risks. Such procedures included examining, on a test basis, evidence regarding the amounts and disclosures in the financial statements. Our audits also included evaluating the accounting principles used and significant estimates made by management, as well as evaluating the overall presentation of the financial statements. Our procedures included confirmation of securities owned as of December 31, 2022 by correspondence with the custodian, transfer agent and broker. We believe that our audits provide a reasonable basis for our opinion.
/s/PricewaterhouseCoopers LLP
Houston, Texas
February 22, 2023
We have served as the auditor of one or more of the investment companies in the Invesco group of investment companies since at least 1995. We have not been able to determine the specific year we began serving as auditor.
| 21 Invesco Main Street Mid Cap Fund® |
Calculating your ongoing Fund expenses
Example
As a shareholder of the Fund, you incur two types of costs: (1) transaction costs, which may include sales charges (loads) on purchase payments or contingent deferred sales charges on redemptions, if any; and (2) ongoing costs, including management fees, distribution and/or service (12b-1) fees, and other Fund expenses. This example is intended to help you understand your ongoing costs (in dollars) of investing in the Fund and to compare these costs with ongoing costs of investing in other mutual funds. The example is based on an investment of $1,000 invested at the beginning of the period and held for the entire period July 1, 2022 through December 31, 2022.
Actual expenses
The table below provides information about actual account values and actual expenses. You may use the information in this table, together with the amount you invested, to estimate the expenses that you paid over the period. Simply divide your account value by $1,000 (for example, an $8,600 account value divided by $1,000 = 8.6), then multiply the result by the number in the table under the heading entitled “Actual Expenses Paid During Period” to estimate the expenses you paid on your account during this period.
Hypothetical example for comparison purposes
The table below also provides information about hypothetical account values and hypothetical expenses based on the Fund’s actual expense ratio and an assumed rate of return of 5% per year before expenses, which is not the Fund’s actual return.
The hypothetical account values and expenses may not be used to estimate the actual ending account balance or expenses you paid for the period. You may use this information to compare the ongoing costs of investing in the Fund and other funds. To do so, compare this 5% hypothetical example with the 5% hypothetical examples that appear in the shareholder reports of the other funds.
Please note that the expenses shown in the table are meant to highlight your ongoing costs only and do not reflect any transaction costs, such as sales charges (loads) on purchase payments or contingent deferred sales charges on redemptions, if any. Therefore, the hypothetical information is useful in comparing ongoing costs only, and will not help you determine the relative total costs of owning different funds. In addition, if these transaction costs were included, your costs would have been higher.
| ACTUAL | HYPOTHETICAL (5% annual return before expenses) | |||||||||||
Beginning Account Value (07/01/22) | Ending Account Value (12/31/22)1 | Expenses Paid During Period2 | Ending Account Value (12/31/22) | Expenses Paid During Period2 | Annualized Expense Ratio | |||||||
Class A | $1,000.00 | $1,067.30 | $5.63 | $1,019.76 | $5.50 | 1.08% | ||||||
Class C | 1,000.00 | 1,063.30 | 9.57 | 1,015.93 | 9.35 | 1.84 | ||||||
Class R | 1,000.00 | 1,066.40 | 6.98 | 1,018.45 | 6.82 | 1.34 | ||||||
Class Y | 1,000.00 | 1,068.90 | 4.38 | 1,020.97 | 4.28 | 0.84 | ||||||
Class R5 | 1,000.00 | 1,069.20 | 3.96 | 1,021.37 | 3.87 | 0.76 | ||||||
Class R6 | 1,000.00 | 1,069.40 | 3.60 | 1,021.73 | 3.52 | 0.69 | ||||||
| 1 | The actual ending account value is based on the actual total return of the Fund for the period July 1, 2022 through December 31, 2022, after actual expenses and will differ from the hypothetical ending account value which is based on the Fund’s expense ratio and a hypothetical annual return of 5% before expenses. |
| 2 | Expenses are equal to the Fund’s annualized expense ratio as indicated above multiplied by the average account value over the period, multiplied by 184/365 to reflect the most recent fiscal half year. |
| 22 Invesco Main Street Mid Cap Fund® |
Form 1099-DIV, Form 1042-S and other year–end tax information provide shareholders with actual calendar year amounts that should be included in their tax returns. Shareholders should consult their tax advisers.
The following distribution information is being provided as required by the Internal Revenue Code or to meet a specific state’s requirement.
The Fund designates the following amounts or, if subsequently determined to be different, the maximum amount allowable for its fiscal year ended December 31, 2022:
Federal and State Income Tax | |
|
| |||||
Long-Term Capital Gain Distributions | $ | 72,042,116 | ||||||
Qualified Dividend Income* | 16.20 | % | ||||||
Corporate Dividends Received Deduction* | 15.93 | % | ||||||
U.S. Treasury Obligations* | 0.00 | % | ||||||
Qualified Business Income* | 1.67 | % | ||||||
Business Interest Income* | 0.00 | % |
* The above percentages are based on ordinary income dividends paid to shareholders during the Fund’s fiscal year.
Non-Resident Alien Shareholders | ||||||||
Short-Term Capital Gain Distributions | $ | 11,393,255 |
| 23 Invesco Main Street Mid Cap Fund® |
The address of each trustee and officer is AIM Growth Series (Invesco Growth Series) (the “Trust”), 11 Greenway Plaza, Suite 1000, Houston, Texas 77046-1173. The trustees serve for the life of the Trust, subject to their earlier death, incapacitation, resignation, retirement or removal as more specifically provided in the Trust’s organizational documents. Each officer serves for a one year term or until their successors are elected and qualified. Column two below includes length of time served with predecessor entities, if any.
Name, Year of Birth and Position(s) Held with the Trust | Trustee and/or Officer Since | Principal Occupation(s) During Past 5 Years | Number of Funds in Fund Complex Overseen by Trustee | Other Directorship(s) Held by Trustee During Past 5 Years | ||||
| Interested Trustee | ||||||||
Martin L. Flanagan1 - 1960 Trustee and Vice Chair | 2007 | Executive Director, Chief Executive Officer and President, Invesco Ltd. (ultimate parent of Invesco and a global investment management firm); Trustee and Vice Chair, The Invesco Funds; Vice Chair, Investment Company Institute; and Member of Executive Board, SMU Cox School of Business
Formerly: Advisor to the Board, Invesco Advisers, Inc. (formerly known as Invesco Institutional (N.A.), Inc.); Chairman and Chief Executive Officer, Invesco Advisers, Inc. (registered investment adviser); Director, Chairman, Chief Executive Officer and President, Invesco Holding Company (US), Inc. (formerly IVZ Inc.) (holding company), Invesco Group Services, Inc. (service provider) and Invesco North American Holdings, Inc. (holding company); Director, Chief Executive Officer and President, Invesco Holding Company Limited (parent of Invesco and a global investment management firm); Director, Invesco Ltd.; Chairman, Investment Company Institute and President, Co-Chief Executive Officer, Co-President, Chief Operating Officer and Chief Financial Officer, Franklin Resources, Inc. (global investment management organization) | 189 | None |
| 1 | Mr. Flanagan is considered an interested person (within the meaning of Section 2(a)(19) of the 1940 Act) of the Trust because he is an officer of the Adviser to the Trust, and an officer and a director of Invesco Ltd., ultimate parent of the Adviser. |
| T-1 Invesco Main Street Mid Cap Fund® |
Trustees and Officers–(continued)
Name, Year of Birth and Position(s) Held with the Trust | Trustee and/or Officer Since | Principal Occupation(s) During Past 5 Years | Number of Funds in Fund Complex Overseen by Trustee | Other Directorship(s) Held by Trustee During Past 5 Years | ||||
| Independent Trustees | ||||||||
Beth Ann Brown - 1968 Trustee (2019) and Chair (August 2022) | 2019 | Independent Consultant
Formerly: Head of Intermediary Distribution, Managing Director, Strategic Relations, Managing Director, Head of National Accounts, Senior Vice President, National Account Manager and Senior Vice President, Key Account Manager, Columbia Management Investment Advisers LLC; Vice President, Key Account Manager, Liberty Funds Distributor, Inc.; and Trustee of certain Oppenheimer Funds | 189 | Director, Board of Directors of Caron Engineering Inc.; Advisor, Board of Advisors of Caron Engineering Inc.; President and Director, Acton Shapleigh Youth Conservation Corps (non-profit) Formerly: President and Director Director of Grahamtastic Connection (non-profit) | ||||
Cynthia Hostetler - 1962 Trustee | 2017 | Non-Executive Director and Trustee of a number of public and private business corporations
Formerly: Director, Aberdeen Investment Funds (4 portfolios); Director, Artio Global Investment LLC (mutual fund complex); Director, Edgen Group, Inc. (specialized energy and infrastructure products distributor); Director, Genesee & Wyoming, Inc. (railroads); Head of Investment Funds and Private Equity, Overseas Private Investment Corporation; President, First Manhattan Bancorporation, Inc.; and Attorney, Simpson Thacher & Bartlett LLP | 189 | Resideo Technologies, Inc. (smart home technology); Vulcan Materials Company (construction materials company); Trilinc Global Impact Fund; Textainer Group Holdings, (shipping container leasing company); Investment Company Institute (professional organization); and Independent Directors Council (professional organization) | ||||
Eli Jones - 1961 Trustee | 2016 | Professor and Dean Emeritus, Mays Business School - Texas A&M University
Formerly: Dean of Mays Business School-Texas A&M University; Professor and Dean, Walton College of Business, University of Arkansas and E.J. Ourso College of Business, Louisiana State University; and Director, Arvest Bank | 189 | Insperity, Inc. (formerly known as Administaff) (human resources provider); and Member of Regional Board of Directors and Board of Directors, First Financial Bancorp (regional bank) | ||||
Elizabeth Krentzman - 1959 Trustee | 2019 | Formerly: Principal and Chief Regulatory Advisor for Asset Management Services and U.S. Mutual Fund Leader of Deloitte & Touche LLP; General Counsel of the Investment Company Institute (trade association); National Director of the Investment Management Regulatory Consulting Practice, Principal, Director and Senior Manager of Deloitte & Touche LLP; Assistant Director of the Division of Investment Management - Office of Disclosure and Investment Adviser Regulation of the U.S. Securities and Exchange Commission and various positions with the Division of Investment Management – Office of Regulatory Policy of the U.S. Securities and Exchange Commission; Associate at Ropes & Gray LLP; and Trustee of certain Oppenheimer Funds | 189 | Formerly: Member of the Cartica Funds Board of Directors (private investment fund); Trustee of the University of Florida National Board Foundation; and Member of the University of Florida Law Center Association, Inc. Board of Trustees, Audit Committee and Membership Committee | ||||
Anthony J. LaCava, Jr. - 1956 Trustee | 2019 | Formerly: Director and Member of the Audit Committee, Blue Hills Bank (publicly traded financial institution) and Managing Partner, KPMG LLP | 189 | Blue Hills Bank; Chairman, Bentley University; Member, Business School Advisory Council; and Nominating Committee, KPMG LLP | ||||
Prema Mathai-Davis - 1950 Trustee | 2001 | Retired
Formerly: Co-Founder & Partner of Quantalytics Research, LLC, (a FinTech Investment Research Platform for the Self-Directed Investor); Trustee of YWCA Retirement Fund; CEO of YWCA of the USA; Board member of the NY Metropolitan Transportation Authority; Commissioner of the NYC Department of Aging; and Board member of Johns Hopkins Bioethics Institute | 189 | Member of Board of Positive Planet US (non-profit) and HealthCare Chaplaincy Network (non-profit) |
| T-2 Invesco Main Street Mid Cap Fund® |
Trustees and Officers–(continued)
Name, Year of Birth and Position(s) Held with the Trust | Trustee and/or Officer Since | Principal Occupation(s) During Past 5 Years | Number of Funds in Fund Complex Overseen by Trustee | Other Directorship(s) Held by Trustee During Past 5 Years | ||||
| Independent Trustees–(continued) | ||||||||
| Joel W. Motley - 1952 Trustee | 2019 | Director of Office of Finance, Federal Home Loan Bank System; Managing Director of Carmona Motley Inc. (privately held financial advisor); Member of the Council on Foreign Relations and its Finance and Budget Committee; Chairman Emeritus of Board of Human Rights Watch and Member of its Investment Committee; and Member of Investment Committee Board of Historic Hudson Valley (non-profit cultural organization); Member of the Board, Blue Ocean Acquisition Corp.; and Member of the Vestry and the Investment Committee of Trinity Church Wall Street.
Formerly: Managing Director of Public Capital Advisors, LLC (privately held financial advisor); Managing Director of Carmona Motley Hoffman, Inc. (privately held financial advisor); Trustee of certain Oppenheimer Funds; and Director of Columbia Equity Financial Corp. (privately held financial advisor) | 189 | Member of Board of Trust for Mutual Understanding (non-profit promoting the arts and environment); Member of Board of Greenwall Foundation (bioethics research foundation) and its Investment Committee; Member of Board of Friends of the LRC (non-profit legal advocacy); and Board Member and Investment Committee Member of Pulitzer Center for Crisis Reporting (non-profit journalism) | ||||
| Teresa M. Ressel - 1962 Trustee | 2017 | Non-executive director and trustee of a number of public and private business corporations
Formerly: Chief Executive Officer, UBS Securities LLC (investment banking); Chief Operating Officer, UBS AG Americas (investment banking); Sr. Management Team Olayan America, The Olayan Group (international investor/commercial/industrial); Assistant Secretary for Management & Budget and Designated Chief Financial Officer, U.S. Department of Treasury and Director, ON Semiconductor Corporation (semiconductor manufacturing) | 189 | None | ||||
| Robert C. Troccoli - 1949 Trustee | 2016 | Retired
Formerly: Adjunct Professor, University of Denver – Daniels College of Business; and Managing Partner, KPMG LLP | 189 | None | ||||
| Daniel S. Vandivort - 1954 Trustee | 2019 | President, Flyway Advisory Services LLC (consulting and property management)
Formerly: President and Chief Investment Officer, previously Head of Fixed Income, Weiss Peck and Greer/Robeco Investment Management; Trustee and Chair, Weiss Peck and Greer Funds Board; and various capacities at CS First Boston including Head of Fixed Income at First Boston Asset Management. | 189 | Formerly: Trustee and Governance Chair, Oppenheimer Funds; Treasurer, Chairman of the Audit and Finance Committee, Huntington Disease Foundation of America | ||||
| T-3 Invesco Main Street Mid Cap Fund® |
Trustees and Officers–(continued)
Name, Year of Birth and Position(s) Held with the Trust | Trustee and/or Officer Since | Principal Occupation(s) During Past 5 Years | Number of Funds in Fund Complex Overseen by Trustee | Other Directorship(s) Held by Trustee During Past 5 Years | ||||
| Officers | ||||||||
| Sheri Morris - 1964 President and Principal Executive Officer | 1999 | Director, Invesco Trust Company; Head of Global Fund Services, Invesco Ltd.; President and Principal Executive Officer, The Invesco Funds; Vice President, Invesco Exchange-Traded Fund Trust, Invesco Exchange-Traded Fund Trust II, Invesco India Exchange-Traded Fund Trust, Invesco Actively Managed Exchange-Traded Fund Trust, Invesco Actively Managed Exchange-Traded Commodity Fund Trust and Invesco Exchange-Traded Self-Indexed Fund Trust; and Vice President, OppenheimerFunds, Inc.
Formerly: Vice President, Treasurer and Principal Financial Officer, The Invesco Funds; Vice President, Invesco AIM Advisers, Inc., Invesco AIM Capital Management, Inc. and Invesco AIM Private Asset Management, Inc.; Assistant Vice President and Assistant Treasurer, The Invesco Funds; Vice President and Assistant Vice President, Invesco Advisers, Inc.; Assistant Vice President, Invesco AIM Capital Management, Inc. and Invesco AIM Private Asset Management, Inc.; Treasurer, Invesco Exchange-Traded Fund Trust, Invesco Exchange-Traded Fund Trust II, Invesco India Exchange-Traded Fund Trust and Invesco Actively Managed Exchange-Traded Fund Trust; and Senior Vice President, Invesco Advisers, Inc. (formerly known as Invesco Institutional (N.A.), Inc.) (registered investment adviser) | N/A | N/A | ||||
| Jeffrey H. Kupor - 1968 Senior Vice President, Chief Legal Officer and Secretary | 2018 | Head of Legal of the Americas, Invesco Ltd.; Senior Vice President and Secretary, Invesco Advisers, Inc. (formerly known as Invesco Institutional (N.A.), Inc.) (registered investment adviser); Secretary, Invesco Distributors, Inc. (formerly known as Invesco AIM Distributors, Inc.); Vice President and Secretary, Invesco Investment Services, Inc. (formerly known as Invesco AIM Investment Services, Inc.); Senior Vice President, Chief Legal Officer and Secretary, The Invesco Funds; Secretary and General Counsel, Invesco Investment Advisers LLC (formerly known as Van Kampen Asset Management); Secretary and General Counsel, Invesco Capital Markets, Inc. (formerly known as Van Kampen Funds Inc.); Chief Legal Officer, Invesco Exchange-Traded Fund Trust, Invesco Exchange-Traded Fund Trust II, Invesco India Exchange-Traded Fund Trust, Invesco Actively Managed Exchange-Traded Fund Trust, Invesco Actively Managed Exchange-Traded Commodity Fund Trust and Invesco Exchange-Traded Self-Indexed Fund Trust;; Secretary and Vice President, Harbourview Asset Management Corporation; Secretary and Vice President, OppenheimerFunds, Inc. and Invesco Managed Accounts, LLC; Secretary and Senior Vice President, OFI Global Institutional, Inc.; Secretary and Vice President, OFI SteelPath, Inc.; Secretary and Vice President, Oppenheimer Acquisition Corp.; Secretary and Vice President, Shareholder Services, Inc.; and Secretary and Vice President, Trinity Investment Management Corporation
Formerly: Senior Vice President, Invesco Distributors, Inc.; Secretary and Vice President, Jemstep, Inc.; Head of Legal, Worldwide Institutional, Invesco Ltd.; Secretary and General Counsel, INVESCO Private Capital Investments, Inc.; Senior Vice President, Secretary and General Counsel, Invesco Management Group, Inc. (formerly known as Invesco AIM Management Group, Inc.); Assistant Secretary, INVESCO Asset Management (Bermuda) Ltd.; Secretary and General Counsel, Invesco Private Capital, Inc.; Assistant Secretary and General Counsel, INVESCO Realty, Inc.; Secretary and General Counsel, Invesco Senior Secured Management, Inc.; Secretary, Sovereign G./P. Holdings Inc.; Secretary, Invesco Indexing LLC; and Secretary, W.L. Ross & Co., LLC | N/A | N/A | ||||
| Andrew R. Schlossberg - 1974 Senior Vice President | 2019 | Senior Vice President, Invesco Group Services, Inc.; Head of the Americas and Senior Managing Director, Invesco Ltd.; Director and Senior Vice President, Invesco Advisers, Inc. (formerly known as Invesco Institutional (N.A.), Inc.) (registered investment adviser); Director and Chairman, Invesco Investment Services, Inc. (formerly known as Invesco AIM Investment Services, Inc.) (registered transfer agent); Senior Vice President, The Invesco Funds; and Director, Invesco Investment Advisers LLC (formerly known as Van Kampen Asset Management)
Formerly: Director, President and Chairman, Invesco Insurance Agency, Inc.; Director, Invesco UK Limited; Director and Chief Executive, Invesco Asset Management Limited and Invesco Fund Managers Limited; Assistant Vice President, The Invesco Funds; Senior Vice President, Invesco Advisers, Inc. (formerly known as Invesco Institutional (N.A.), Inc.) (registered investment adviser); Director and Chief Executive, Invesco Administration Services Limited and Invesco Global Investment Funds Limited; Director, Invesco Distributors, Inc.; Head of EMEA, Invesco Ltd.; President, Invesco Actively Managed Exchange-Traded Commodity Fund Trust, Invesco Actively Managed Exchange-Traded Fund Trust, Invesco Exchange-Traded Fund Trust, Invesco Exchange-Traded Fund Trust II and Invesco India Exchange-Traded Fund Trust; and Managing Director and Principal Executive Officer, Invesco Capital Management LLC | N/A | N/A |
| T-4 Invesco Main Street Mid Cap Fund® |
Trustees and Officers–(continued)
Name, Year of Birth and Position(s) Held with the Trust | Trustee and/or Officer Since | Principal Occupation(s) During Past 5 Years | Number of Funds in Fund Complex Overseen by Trustee | Other Directorship(s) Held by Trustee During Past 5 Years | ||||
| Officers–(continued) | ||||||||
| John M. Zerr - 1962 Senior Vice President | 2006 | Chief Operating Officer of the Americas; Senior Vice President, Invesco Advisers, Inc. (formerly known as Invesco Institutional (N.A.), Inc.) (registered investment adviser); Senior Vice President, Invesco Distributors, Inc. (formerly known as Invesco AIM Distributors, Inc.); Director and Vice President, Invesco Investment Services, Inc. (formerly known as Invesco AIM Investment Services, Inc.) Senior Vice President, The Invesco Funds; Managing Director, Invesco Capital Management LLC; Director, Invesco Investment Advisers LLC (formerly known as Van Kampen Asset Management); Senior Vice President, Invesco Capital Markets, Inc. (formerly known as Van Kampen Funds Inc.); Manager, Invesco Indexing LLC; Manager, Invesco Specialized Products, LLC; Member, Invesco Canada Funds Advisory Board; Director, President and Chief Executive Officer, Invesco Corporate Class Inc. (corporate mutual fund company); and Director, Chairman, President and Chief Executive Officer, Invesco Canada Ltd. (formerly known as Invesco Trimark Ltd./Invesco Trimark Ltèe) (registered investment adviser and registered transfer agent); President, Invesco, Inc.; President, Invesco Global Direct Real Estate Feeder GP Ltd.; President, Invesco IP Holdings (Canada) Ltd; President, Invesco Global Direct Real Estate GP Ltd.; President, Invesco Financial Services Ltd. / Services Financiers Invesco Ltée; and Director and Chairman, Invesco Trust Company
Formerly: President, Trimark Investments Ltd/Services Financiers Invesco Ltee; Director and Senior Vice President, Invesco Insurance Agency, Inc.; Director and Senior Vice President, Invesco Management Group, Inc. (formerly known as Invesco AIM Management Group, Inc.); Secretary and General Counsel, Invesco Management Group, Inc. (formerly known as Invesco AIM Management Group, Inc.); Secretary, Invesco Investment Services, Inc. (formerly known as Invesco AIM Investment Services, Inc.); Chief Legal Officer and Secretary, The Invesco Funds; Secretary and General Counsel, Invesco Investment Advisers LLC (formerly known as Van Kampen Asset Management); Secretary and General Counsel, Invesco Capital Markets, Inc. (formerly known as Van Kampen Funds Inc.); Chief Legal Officer, Invesco Exchange-Traded Fund Trust, Invesco Exchange-Traded Fund Trust II, Invesco India Exchange-Traded Fund Trust, Invesco Actively Managed Exchange-Traded Fund Trust, Invesco Actively Managed Exchange-Traded Commodity Fund Trust and Invesco Exchange-Traded Self-Indexed Fund Trust; Secretary, Invesco Indexing LLC; Director, Secretary, General Counsel and Senior Vice President, Van Kampen Exchange Corp.; Director, Vice President and Secretary, IVZ Distributors, Inc. (formerly known as INVESCO Distributors, Inc.); Director and Vice President, INVESCO Funds Group, Inc.; Director and Vice President, Van Kampen Advisors Inc.; Director, Vice President, Secretary and General Counsel, Van Kampen Investor Services Inc.; Director and Secretary, Invesco Distributors, Inc. (formerly known as Invesco AIM Distributors, Inc.); Director, Senior Vice President, General Counsel and Secretary, Invesco AIM Advisers, Inc. and Van Kampen Investments Inc.; Director, Vice President and Secretary, Fund Management Company; Director, Senior Vice President, Secretary, General Counsel and Vice President, Invesco AIM Capital Management, Inc.; and Chief Operating Officer and General Counsel, Liberty Ridge Capital, Inc. (an investment adviser) | N/A | N/A | ||||
| Gregory G. McGreevey - 1962 Senior Vice President | 2012 | Senior Managing Director, Invesco Ltd.; Director, Chairman, President, and Chief Executive Officer, Invesco Advisers, Inc. (formerly known as Invesco Institutional (N.A.), Inc.) (registered investment adviser); Director, Invesco Mortgage Capital, Inc. and Invesco Senior Secured Management, Inc.; Senior Vice President, The Invesco Funds; President, SNW Asset Management Corporation and Invesco Managed Accounts, LLC; Chairman and Director, Invesco Private Capital, Inc.; Chairman and Director, INVESCO Private Capital Investments, Inc.; Chairman and Director, INVESCO Realty, Inc.; and Senior Vice President, Invesco Group Services, Inc.
Formerly: Senior Vice President, Invesco Management Group, Inc. and Invesco Advisers, Inc.; Assistant Vice President, The Invesco Funds | N/A | N/A | ||||
| Adrien Deberghes - 1967 Principal Financial Officer, Treasurer and Vice President | 2020 | Head of the Fund Office of the CFO and Fund Administration; Vice President, Invesco Advisers, Inc.; Principal Financial Officer, Treasurer and Vice President, The Invesco Funds; Vice President, Invesco Exchange-Traded Fund Trust, Invesco Exchange-Traded Fund Trust II, Invesco India Exchange-Traded Fund Trust, Invesco Actively Managed Exchange-Traded Fund Trust, Invesco Actively Managed Exchange-Traded Commodity Fund Trust and Invesco Exchange-Traded Self-Indexed Fund Trust
Formerly: Senior Vice President and Treasurer, Fidelity Investments | N/A | N/A | ||||
| Crissie M. Wisdom - 1969 Anti-Money Laundering Compliance Officer | 2013 | Anti-Money Laundering and OFAC Compliance Officer for Invesco U.S. entities including: Invesco Advisers, Inc. and its affiliates, Invesco Capital Markets, Inc., Invesco Distributors, Inc., Invesco Investment Services, Inc., The Invesco Funds, Invesco Capital Management, LLC, Invesco Trust Company; and Fraud Prevention Manager for Invesco Investment Services, Inc. | N/A | N/A |
| T-5 Invesco Main Street Mid Cap Fund® |
Trustees and Officers–(continued)
Name, Year of Birth and Position(s) Held with the Trust | Trustee and/or Officer Since | Principal Occupation(s) During Past 5 Years | Number of Funds in Fund Complex Overseen by Trustee | Other Directorship(s) Held by Trustee During Past 5 Years | ||||
| Officers–(continued) | ||||||||
| Todd F. Kuehl - 1969 Chief Compliance Officer and Senior Vice President | 2020 | Chief Compliance Officer, Invesco Advisers, Inc. (registered investment adviser); and Chief Compliance Officer and Senior Vice President, The Invesco Funds
Formerly: Managing Director and Chief Compliance Officer, Legg Mason (Mutual Funds); Chief Compliance Officer, Legg Mason Private Portfolio Group (registered investment adviser) | N/A | N/A | ||||
| James Bordewick, Jr. - 1959 Senior Vice President and Senior Officer | 2022 | Senior Vice President and Senior Officer, The Invesco Funds
Formerly: Chief Legal Officer, KingsCrowd, Inc. (research and analytical platform for investment in private capital markets); Chief Operating Officer and Head of Legal and Regulatory, Netcapital (private capital investment platform); Managing Director, General Counsel of asset management and Chief Compliance Officer for asset management and private banking, Bank of America Corporation; Chief Legal Officer, Columbia Funds and BofA Funds;
Senior Vice President and Associate General Counsel, MFS Investment Management; Chief Legal Officer, MFS Funds; Associate, Ropes & Gray; and Associate, Gaston Snow & Ely Bartlett | N/A | N/A |
The Statement of Additional Information of the Trust includes additional information about the Fund’s Trustees and is available upon request, without charge, by calling 1.800.959.4246. Please refer to the Fund’s Statement of Additional Information for information on the Fund’s sub-advisers.
| Office of the Fund | Investment Adviser | Distributor | Auditors | |||
| 11 Greenway Plaza, Suite 1000 | Invesco Advisers, Inc. | Invesco Distributors, Inc. | PricewaterhouseCoopers LLP | |||
| Houston, TX 77046-1173 | 1555 Peachtree Street, N.E. | 11 Greenway Plaza, Suite 1000 | 1000 Louisiana Street, Suite 5800 | |||
| Atlanta, GA 30309 | Houston, TX 77046-1173 | Houston, TX 77002-5021 | ||||
| Counsel to the Fund | Counsel to the Independent Trustees | Transfer Agent | Custodian | |||
| Stradley Ronon Stevens & Young, LLP | Sidley Austin LLP | Invesco Investment Services, Inc. | State Street Bank and Trust Company | |||
| 2005 Market Street, Suite 2600 | 787 Seventh Avenue | 11 Greenway Plaza, Suite 1000 | 225 Franklin Street | |||
| Philadelphia, PA 19103-7018 | New York, NY 10019 | Houston, TX 77046-1173 | Boston, MA 02110-2801 | |||
| T-6 Invesco Main Street Mid Cap Fund® |
(This page intentionally left blank)
(This page intentionally left blank)

Go paperless with eDelivery
Visit invesco.com/edelivery to enjoy the convenience and security of anytime electronic access to your investment documents.
With eDelivery, you can elect to have any or all of the following materials delivered straight to your inbox to download, save and print from your own computer:
∎ Fund reports and prospectuses
∎ Quarterly statements
∎ Daily confirmations
∎ Tax forms
Invesco mailing information
Send general correspondence to Invesco Investment Services, Inc., P.O. Box 219078, Kansas City, MO 64121-9078.
Important notice regarding delivery of security holder documents
To reduce Fund expenses, only one copy of most shareholder documents may be mailed to shareholders with multiple accounts at the same address (Householding). Mailing of your shareholder documents may be householded indefinitely unless you instruct us otherwise. If you do not want the mailing of these documents to be combined with those for other members of your household, please contact Invesco Investment Services, Inc. at 800 959 4246 or contact your financial institution. We will begin sending you individual copies for each account within 30 days after receiving your request.
Fund holdings and proxy voting information
The Fund provides a complete list of its portfolio holdings four times each year, at the end of each fiscal quarter. For the second and fourth quarters, the list appears, respectively, in the Fund’s semiannual and annual reports to shareholders. For the first and third quarters, the Fund files the list with the Securities and Exchange Commission (SEC) as an exhibit to its reports on Form N-PORT. The most recent list of portfolio holdings is available at invesco.com/completeqtrholdings. Shareholders can also look up the Fund’s Form N-PORT filings on the SEC website, sec.gov. The SEC file numbers for the Fund are shown below.
A description of the policies and procedures that the Fund uses to determine how to vote proxies relating to portfolio securities is available without charge, upon request, from our Client Services department at 800 959 4246, or at invesco.com/corporate/about-us/esg. The information is also available on the SEC website, sec.gov.
Information regarding how the Fund voted proxies related to its portfolio securities during the most recent 12-month period ended June 30 is available at invesco.com/proxysearch. This information is also available on the SEC website, sec.gov.
Invesco Advisers, Inc. is an investment adviser; it provides investment advisory services to individual and institutional clients and does not sell securities. Invesco Distributors, Inc. is the US distributor for Invesco Ltd.’s retail mutual funds, exchange-traded funds and institutional money market funds. Both are wholly owned, indirect subsidiaries of Invesco Ltd.
| SEC file number(s): 811-02699 and 002-57526 | Invesco Distributors, Inc. | O-MSM-AR-1 |

| ||||
Annual Report to Shareholders |
|
December 31, 2022 |
| |
Invesco Main Street Small Cap Fund®
Nasdaq:
A: OSCAX ∎ C: OSCCX ∎ R: OSCNX ∎ Y: OSCYX ∎ R5: MNSQX ∎ R6: OSSIX
Management’s Discussion of Fund Performance
For the fiscal year ended December 31, 2022, Class A shares of Invesco Main Street Small Cap Fund® (the Fund), at net asset value (NAV), outperformed the Russell 2000 Index. Your Fund’s long-term performance appears later in this report.
Fund vs. Indexes |
Total returns, 12/31/21 to 12/31/22, at net asset value (NAV). Performance shown does not include applicable contingent deferred sales charges (CDSC) or front-end sales charges, which would have reduced performance. |
Class A Shares | -16.09 | % | ||
Class C Shares | -16.72 | |||
Class R Shares | -16.26 | |||
Class Y Shares | -15.87 | |||
Class R5 Shares | -15.78 | |||
Class R6 Shares | -15.75 | |||
Russell 2000 Indexq | -20.44 | |||
Source(s): qRIMES Technologies Corp.
| ||||
Market conditions and your Fund
Equity markets declined in the first quarter of 2022 amid volatility sparked by Russia’s invasion of Ukraine, rising commodity prices, rampant global inflation and the US Federal Reserve’s (the Fed) shift toward tighter monetary policy. Russia’s invasion exacerbated inflation pressures, disrupting already strained supply chains and increasing shortages of oil, gas and raw materials. The price of oil rose sharply, with crude prices reaching their highest price per barrel since 2008.1 Inflation continued to be a top concern for consumers, investors and the Fed. To combat inflation, the Fed raised the federal funds rate by one-quarter percentage point in March and indicated it would “taper” its asset purchase program quickly.2
As the war in Ukraine continued and corporate earnings in high-profile names like Netflix reported slowing growth and profits, the equity markets sold off for much of April 2022. The downward direction of the equity markets continued into the second quarter of 2022 amid substantial inflation, rising interest rates and an increasing likelihood of a US recession. Driven by higher food and energy prices, the consumer price index rose by yet another 40-year high to 8.6% for the twelve months ended May 2022.3 Oil prices peaked near $122 per barrel in early June, resulting in skyrocketing gasoline prices; the national average price reached a record high, above $5 per gallon in early June.1 In an effort to tame inflation, the Fed raised the benchmark federal funds rate three more times, by 0.50% in May, by 0.75% in June and another 0.75% in July, which were the largest increases in nearly 30 years.2 US equity markets rose in July and August until Fed chairman Jerome Powell’s hawkish comments at an economic policy symposium held in Jackson Hole, which sparked a sharp selloff at month-end. The Fed reiterated that it would continue taking aggressive action to curb
inflation, even though such measures could “bring pain to households and businesses,” and the Fed raised the benchmark federal funds rate by another 0.75% in September.2
After experiencing a sharp drop in September 2022, US equity markets rebounded in October and November,4 despite mixed data on the economy and corporate earnings. However, the Fed’s message of continued rate hikes until data shows inflation meaningfully declining, sent markets lower in December.4 As energy prices declined,1 the rate of inflation slowed modestly in the fourth quarter.3 Corporate earnings generally met expectations, though companies provided cautious future guidance. With inflation still at multidecade highs and little evidence of a slowing economy, the Fed raised its target rate by 0.75% in November and by 0.50% in December, marking its highest level in over a decade.2
In this environment, US stocks had negative double-digit returns for the fiscal year of -18.11%, as measured by the S&P 500 Index.4
During the fiscal year, stock selection in the industrials, consumer discretionary and communication services sectors were the largest contributors to the Fund’s relative performance versus its benchmark, the Russell 2000 Index. This was partially offset by weaker stock selection in the energy and materials sectors and a moderate underweight allocation to the energy sector.
The largest individual contributors to the Fund’s performance relative to the benchmark during the fiscal year included Acadia Healthcare, Chesapeake Energy and Valmont. Acadia Healthcare, a provider of behavioral health care services, continued to show strong management execution and saw accelerated revenue growth due to strong demand for mental health services and favorable pricing.
Chesapeake Energy, an exploration and production company mainly focused on natural
gas production, benefited from a rise in natural gas prices and the general outperformance of the energy sector.
Valmont, a manufacturer of engineered fabricated metal products, benefited from strong infrastructure spending.
The largest individual detractors from the Fund’s performance relative to the benchmark during the fiscal year included Q2 Holdings, Tandem Diabetes and Cryoport. Q2 Holdings, a provider of digital banking solutions, was negatively impacted by the sharp sell-off in growth related stocks driven by macro factors which were made worse by company specific headwinds as budgets for back-office software solutions were deprioritized during 2022. We exited our position in the holding during the fiscal year.
Tandem Diabetes underperformed given competitive concerns after speculation of a merger between two key peers which could have negative implications for Tandem Dia-bates. The position was exited during the fiscal year.
Cryoport, a provider of logistics solutions to the life sciences industry, experienced a fire at one of its facilities that negatively impacted sales while the facility was not operating at full production. The company also faced headwinds due to temporary supply-chain constraints. The position was exited during the fiscal year.
We continue to maintain our discipline around valuation and focus on companies which we believe have skilled management teams that are outexecuting peers. We believe this disciplined approach is essential to generating attractive long-term performance.
We thank you for your continued investment in Invesco Main Street Small Cap Fund®.
1 Source: Bloomberg LP
2 Source: US Federal Reserve
3 Source: US Bureau of Labor Statistics
4 Source: Lipper Inc.
| 2 | Invesco Main Street Small Cap Fund® |
Portfolio manager(s):
Joy Budzinski
Magnus Krantz
Raman Vardharaj
Adam Weiner - Lead
Matthew Ziehl - Lead
The views and opinions expressed in management’s discussion of Fund performance are those of Invesco Advisers, Inc. and its affiliates. These views and opinions are subject to change at any time based on factors such as market and economic conditions. These views and opinions may not be relied upon as investment advice or recommendations, or as an offer for a particular security. The information is not a complete analysis of every aspect of any market, country, industry, security or the Fund. Statements of fact are from sources considered reliable, but Invesco Advisers, Inc. makes no representation or warranty as to their completeness or accuracy. Although historical performance is no guarantee of future results, these insights may help you understand our investment management philosophy.
See important Fund and, if applicable, index disclosures later in this report.
| 3 | Invesco Main Street Small Cap Fund® |
Your Fund’s Long-Term Performance
Results of a $10,000 Investment — Oldest Share Class(es)
Fund and index data from 5/17/13
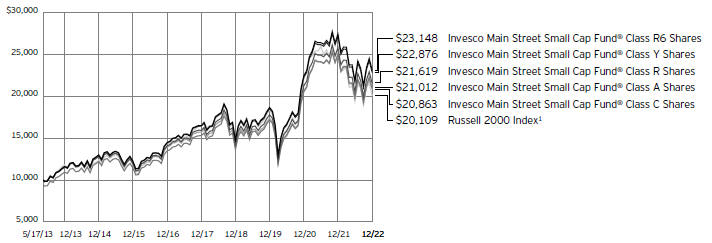
| 1 | Source: RIMES Technologies Corp. |
Past performance cannot guarantee future results.
The data shown in the chart include reinvested distributions, applicable sales charges and Fund expenses including management
fees. Index results include reinvested dividends, but they do not reflect sales charges. Performance of the peer group, if applicable, reflects fund expenses and management fees;
performance of a market index does not. Performance shown in the chart does not reflect deduction of taxes a shareholder would pay on Fund distributions or sale of Fund shares.
| 4 | Invesco Main Street Small Cap Fund® |
Average Annual Total Returns |
| |||
As of 12/31/22, including maximum applicable sales charges |
| |||
Class A Shares | ||||
Inception (5/17/13) | 8.02 | % | ||
5 Years | 5.35 | |||
1 Year | -20.72 | |||
Class C Shares | ||||
Inception (5/17/13) | 7.94 | % | ||
5 Years | 5.74 | |||
1 Year | -17.55 | |||
Class R Shares | ||||
Inception (5/17/13) | 8.34 | % | ||
5 Years | 6.27 | |||
1 Year | -16.26 | |||
Class Y Shares | ||||
Inception (5/17/13) | 8.98 | % | ||
5 Years | 6.84 | |||
1 Year | -15.87 | |||
Class R5 Shares | ||||
Inception | 8.80 | % | ||
5 Years | 6.82 | |||
1 Year | -15.78 | |||
Class R6 Shares | ||||
Inception (5/17/13) | 9.11 | % | ||
5 Years | 6.98 | |||
1 Year | -15.75 | |||
Effective May 24, 2019, Class A, Class C, Class R, Class Y and Class I shares of the Oppenheimer Main Street Small Cap Fund®, (the predecessor fund), were reorganized into Class A, Class C, Class R, Class Y and Class R6 shares, respectively, of the Invesco Oppenheimer Main Street Small Cap Fund®. The Fund was subsequently renamed the Invesco Main Street Small Cap Fund® (the Fund). Returns shown above, for periods ending on or prior to May 24, 2019, for Class A, Class C, Class R, Class Y and Class R6 shares are those for Class A, Class C, Class R, Class Y and Class I shares of the predecessor fund. Share class returns will differ from the predecessor fund because of different expenses.
Class R5 shares incepted on May 24, 2019. Performance shown on or prior to that date is that of the predecessor fund’s Class A shares at net asset value and includes the 12b-1 fees applicable to Class A shares.
The performance data quoted represent past performance and cannot guarantee future results; current performance may be lower or higher. Please visit invesco.com/ performance for the most recent month-end performance. Performance figures reflect reinvested distributions, changes in net asset value and the effect of the maximum sales charge unless otherwise stated. Performance figures do not reflect deduction of taxes a shareholder would pay on Fund distributions or sale of Fund shares. Investment return and principal value will
fluctuate so that you may have a gain or loss when you sell shares.
Class A share performance reflects the maximum 5.50% sales charge, and Class C share performance reflects the applicable contingent deferred sales charge (CDSC) for the period involved. The CDSC on Class C shares is 1% for the first year after purchase. Class R, Class Y, Class R5 and Class R6 shares do not have a front-end sales charge or a CDSC; therefore, performance is at net asset value.
The performance of the Fund’s share classes will differ primarily due to different sales charge structures and class expenses.
Fund performance reflects any applicable fee waivers and/or expense reimbursements. Had the adviser not waived fees and/or reimbursed expenses currently or in the past, returns would have been lower. See current prospectus for more information.
| 5 | Invesco Main Street Small Cap Fund® |
Invesco Main Street Small Cap Fund’s® investment objective is to seek capital appreciation.
| ∎ | Unless otherwise stated, information presented in this report is as of December 31, 2022, and is based on total net assets. |
| ∎ | Unless otherwise noted, all data is provided by Invesco. |
| ∎ | To access your Fund’s reports/prospectus, visit invesco.com/fundreports. |
About indexes used in this report
| ∎ | The Russell 2000® Index is an unmanaged index considered representative of small-cap stocks. The Russell 2000 Index is a trademark/service mark of the Frank Russell Co. Russell® is a trademark of the Frank Russell Co. |
| ∎ | The Fund is not managed to track the performance of any particular index, including the index(es) described here, and consequently, the performance of the Fund may deviate significantly from the performance of the index(es). |
| ∎ | A direct investment cannot be made in an index. Unless otherwise indicated, index results include reinvested dividends, and they do not reflect sales charges. Performance of the peer group, if applicable, reflects fund expenses; performance of a market index does not. |
| This report must be accompanied or preceded by a currently effective Fund prospectus, which contains more complete information, including sales charges and expenses. Investors should read it carefully before investing. | ||||
NOT FDIC INSURED | MAY LOSE VALUE | NO BANK GUARANTEE | ||||
| 6 | Invesco Main Street Small Cap Fund® |
Fund Information
Portfolio Composition
| By sector | % of total net assets | |
Industrials | 20.92% | |
Financials | 15.77 | |
Health Care | 15.21 | |
Information Technology | 12.60 | |
Consumer Discretionary | 9.99 | |
Energy | 5.56 | |
Materials | 5.29 | |
Consumer Staples | 4.36 | |
Real Estate | 4.26 | |
Utilities | 2.79 | |
Communication Services | 1.85 | |
Money Market Funds Plus Other Assets Less Liabilities | 1.40 | |
Top 10 Equity Holdings*
| % of total net assets | ||||
| 1. | Acadia Healthcare Co., Inc. | 2.33% | ||
| 2. | Inspire Medical Systems, Inc. | 2.29 | ||
| 3. | AutoNation, Inc. | 2.02 | ||
| 4. | Ziff Davis, Inc. | 1.85 | ||
| 5. | Curtiss-Wright Corp. | 1.79 | ||
| 6. | KBR, Inc. | 1.75 | ||
| 7. | CACI International, Inc., Class A | 1.73 | ||
| 8. | Stifel Financial Corp. | 1.71 | ||
| 9. | Four Corners Property Trust, Inc. | 1.69 | ||
| 10. | BJ’s Wholesale Club Holdings, Inc. | 1.60 | ||
The Fund’s holdings are subject to change, and there is no assurance that the Fund will continue to hold any particular security.
| * | Excluding money market fund holdings, if any. |
Data presented here are as of December 31, 2022.
| 7 | Invesco Main Street Small Cap Fund® |
December 31, 2022
| Shares | Value | |||||||
Common Stocks & Other Equity Interests–98.60% |
| |||||||
Aerospace & Defense–2.64% | ||||||||
BWX Technologies, Inc. | 208,191 | $ | 12,091,733 | |||||
Curtiss-Wright Corp. | 152,929 | 25,537,614 | ||||||
| 37,629,347 | ||||||||
Air Freight & Logistics–1.01% | ||||||||
Hub Group, Inc., Class A(b) | 180,619 | 14,357,404 | ||||||
Aluminum–0.94% | ||||||||
Kaiser Aluminum Corp.(c) | 175,759 | 13,350,654 | ||||||
Application Software–4.72% | ||||||||
Consensus Cloud Solutions, Inc.(b) | 169,877 | 9,132,588 | ||||||
Coupa Software, Inc.(b) | 107,535 | 8,513,546 | ||||||
Envestnet, Inc.(b)(c) | 190,429 | 11,749,469 | ||||||
HashiCorp, Inc., Class A(b)(c) | 245,239 | 6,704,834 | ||||||
Paycor HCM, Inc.(b)(c) | 792,481 | 19,392,010 | ||||||
Sprout Social, Inc., Class A(b)(c) | 208,179 | 11,753,786 | ||||||
| 67,246,233 | ||||||||
Asset Management & Custody Banks–2.39% |
| |||||||
Federated Hermes, Inc., Class B | 407,741 | 14,805,076 | ||||||
Focus Financial Partners, Inc., | ||||||||
Class A(b)(c) | 515,496 | 19,212,536 | ||||||
| 34,017,612 | ||||||||
Auto Parts & Equipment–2.59% |
| |||||||
Dorman Products, Inc.(b)(c) | 219,460 | 17,747,730 | ||||||
Visteon Corp.(b) | 146,887 | 19,217,226 | ||||||
| 36,964,956 | ||||||||
Automotive Retail–2.02% | ||||||||
AutoNation, Inc.(b)(c) | 268,346 | 28,793,526 | ||||||
Biotechnology–1.92% | ||||||||
ADMA Biologics, Inc.(b)(c) | 2,107,522 | 8,177,186 | ||||||
Avid Bioservices, Inc.(b)(c) | 770,164 | 10,605,158 | ||||||
Prometheus Biosciences, Inc.(b)(c) | 78,315 | 8,614,650 | ||||||
| 27,396,994 | ||||||||
Building Products–1.05% |
| |||||||
Zurn Elkay Water Solutions Corp. | 710,749 | 15,032,341 | ||||||
Casinos & Gaming–0.89% | ||||||||
Boyd Gaming Corp. | 231,308 | 12,613,225 | ||||||
Construction & Engineering–1.51% |
| |||||||
Valmont Industries, Inc. | 64,882 | 21,454,531 | ||||||
Construction Machinery & Heavy Trucks–1.03% |
| |||||||
Allison Transmission Holdings, Inc. | 352,459 | 14,662,294 | ||||||
Construction Materials–1.54% |
| |||||||
Summit Materials, Inc., Class A(b) | 773,299 | 21,953,969 | ||||||
Data Processing & Outsourced Services–1.31% |
| |||||||
Paya Holdings, Inc., Class A(b) | 1,135,148 | 8,933,615 | ||||||
Payoneer Global, Inc.(b) | 1,771,651 | 9,690,931 | ||||||
| 18,624,546 | ||||||||
| Shares | Value | |||||||
Diversified Banks–0.53% |
| |||||||
Bank of NT Butterfield & Son Ltd. (The) (Bermuda) | 252,931 | $ | 7,539,873 | |||||
Diversified Metals & Mining–0.90% |
| |||||||
Compass Minerals International, Inc. | 313,923 | 12,870,843 | ||||||
Electrical Components & Equipment–3.26% |
| |||||||
Atkore, Inc.(b)(c) | 193,550 | 21,952,441 | ||||||
Regal Rexnord Corp. | 126,478 | 15,174,830 | ||||||
Vertiv Holdings Co. | 679,615 | 9,283,541 | ||||||
| 46,410,812 | ||||||||
Electronic Components–1.37% |
| |||||||
Belden, Inc. | 171,771 | 12,350,335 | ||||||
Vishay Intertechnology, Inc. | 330,050 | 7,119,178 | ||||||
| 19,469,513 | ||||||||
Electronic Equipment & Instruments–0.80% |
| |||||||
Itron, Inc.(b) | 224,936 | 11,393,008 | ||||||
Environmental & Facilities Services–0.92% |
| |||||||
Casella Waste Systems, Inc., Class A(b) | 165,110 | 13,094,874 | ||||||
Gas Utilities–2.80% |
| |||||||
National Fuel Gas Co. | 342,681 | 21,691,707 | ||||||
Northwest Natural Holding Co. | 339,471 | 16,155,425 | ||||||
Suburban Propane Partners L.P. | 131,731 | 1,999,677 | ||||||
| 39,846,809 | ||||||||
Health Care Equipment–3.76% |
| |||||||
AtriCure, Inc.(b)(c) | 333,955 | 14,820,923 | ||||||
Inspire Medical Systems, Inc.(b) | 129,462 | 32,608,889 | ||||||
TransMedics Group, Inc.(b)(c) | 100,617 | 6,210,081 | ||||||
| 53,639,893 | ||||||||
Health Care Facilities–3.49% |
| |||||||
Acadia Healthcare Co., Inc.(b) | 403,446 | 33,211,675 | ||||||
Tenet Healthcare Corp. | 338,040 | 16,492,971 | ||||||
| 49,704,646 | ||||||||
Health Care Services–2.45% | ||||||||
Addus HomeCare Corp.(b)(c) | 213,923 | 21,283,199 | ||||||
Guardant Health, Inc.(b) | 124,611 | 3,389,419 | ||||||
Option Care Health, Inc.(b) | 338,559 | 10,187,241 | ||||||
| 34,859,859 | ||||||||
Home Furnishings–0.69% | ||||||||
Tempur Sealy International, Inc.(c) | 288,371 | 9,899,776 | ||||||
Homebuilding–1.87% | ||||||||
Skyline Champion Corp.(b)(c) | 160,812 | 8,283,426 | ||||||
TopBuild Corp.(b) | 117,695 | 18,418,091 | ||||||
| 26,701,517 | ||||||||
Hotel & Resort REITs–1.27% | ||||||||
DiamondRock Hospitality Co. | 2,213,941 | 18,132,177 | ||||||
Human Resource & Employment Services–2.40% |
| |||||||
ASGN, Inc.(b) | 226,810 | 18,480,479 | ||||||
See accompanying Notes to Financial Statements which are an integral part of the financial statements.
| 8 | Invesco Main Street Small Cap Fund® |
| Shares | Value | |||||||
Human Resource & Employment Services–(continued) |
| |||||||
Korn Ferry | 310,617 | $ | 15,723,432 | |||||
| 34,203,911 | ||||||||
Hypermarkets & Super Centers–1.59% |
| |||||||
BJ’s Wholesale Club Holdings, | 343,250 | 22,709,420 | ||||||
Industrial Machinery–3.61% | ||||||||
EnPro Industries, Inc. | 204,625 | 22,240,691 | ||||||
Esab Corp. | 178,418 | 8,371,373 | ||||||
Evoqua Water Technologies | 525,344 | 20,803,622 | ||||||
| 51,415,686 | ||||||||
Interactive Media & Services–1.85% |
| |||||||
Ziff Davis, Inc.(b)(c) | 332,455 | 26,297,191 | ||||||
Investment Banking & Brokerage–1.70% |
| |||||||
Stifel Financial Corp. | 415,965 | 24,279,877 | ||||||
Leisure Products–0.58% | ||||||||
Topgolf Callaway Brands Corp.(b)(c) | 422,212 | 8,338,687 | ||||||
Life Sciences Tools & Services–2.03% |
| |||||||
Azenta, Inc.(c) | 250,225 | 14,568,100 | ||||||
BioLife Solutions, Inc.(b)(c) | 345,213 | 6,282,877 | ||||||
CryoPort, Inc.(b)(c) | 466,221 | 8,088,934 | ||||||
| 28,939,911 | ||||||||
Metal & Glass Containers–1.23% |
| |||||||
Silgan Holdings, Inc. | 337,710 | 17,506,886 | ||||||
Oil & Gas Drilling–1.20% | ||||||||
Helmerich & Payne, Inc. | 346,382 | 17,170,156 | ||||||
Oil & Gas Equipment & Services��1.07% |
| |||||||
NOV, Inc. | 732,990 | 15,312,161 | ||||||
Oil & Gas Exploration & Production–2.71% |
| |||||||
Chesapeake Energy Corp.(c) | 195,452 | 18,444,805 | ||||||
CNX Resources Corp.(b)(c) | 1,196,683 | 20,152,142 | ||||||
| 38,596,947 | ||||||||
Oil & Gas Storage & Transportation–0.58% |
| |||||||
Equitrans Midstream Corp. | 1,228,694 | 8,232,250 | ||||||
Packaged Foods & Meats–0.69% |
| |||||||
Lancaster Colony Corp. | 49,797 | 9,824,948 | ||||||
Personal Products–1.43% | ||||||||
BellRing Brands, Inc.(b) | 795,580 | 20,398,671 | ||||||
Pharmaceuticals–1.57% | ||||||||
Collegium Pharmaceutical, Inc.(b) | 443,082 | 10,279,502 | ||||||
Intra-Cellular Therapies, Inc.(b) | 228,593 | 12,097,142 | ||||||
| 22,376,644 | ||||||||
Property & Casualty Insurance–1.48% |
| |||||||
Definity Financial Corp. (Canada) | 740,576 | 21,046,798 | ||||||
Regional Banks–8.80% | ||||||||
BankUnited, Inc.(c) | 535,216 | 18,181,287 | ||||||
Berkshire Hills Bancorp, Inc.(c) | 450,954 | 13,483,525 | ||||||
Cathay General Bancorp | 448,038 | 18,275,470 | ||||||
Columbia Banking System, Inc.(c) | 660,032 | 19,886,764 | ||||||
Heritage Financial Corp. | 405,890 | 12,436,470 | ||||||
OceanFirst Financial Corp. | 535,097 | 11,370,811 | ||||||
| Shares | Value | |||||||
Regional Banks–(continued) |
| |||||||
Pacific Premier Bancorp, Inc. | 557,125 | $ | 17,582,865 | |||||
Webster Financial Corp. | 297,815 | 14,098,562 | ||||||
| 125,315,754 | ||||||||
Research & Consulting Services–3.49% |
| |||||||
CACI International, Inc., Class A(b) | 82,169 | 24,699,180 | ||||||
KBR, Inc. | 473,008 | 24,974,822 | ||||||
| 49,674,002 | ||||||||
Restaurants–1.33% | ||||||||
Texas Roadhouse, Inc.(c) | 208,124 | 18,928,878 | ||||||
Semiconductor Equipment–0.80% |
| |||||||
MKS Instruments, Inc. | 134,485 | 11,394,914 | ||||||
Semiconductors–2.56% | ||||||||
Allegro MicroSystems, Inc. | 463,397 | 13,911,178 | ||||||
Ambarella, Inc.(b)(c) | 132,732 | 10,914,552 | ||||||
MACOM Technology Solutions Holdings, Inc.(b) | 184,570 | 11,624,219 | ||||||
| 36,449,949 | ||||||||
Soft Drinks–0.65% | ||||||||
Coca-Cola Consolidated, Inc.(c) | 18,139 | 9,293,698 | ||||||
Specialized REITs–2.99% | ||||||||
Four Corners Property Trust, Inc. | 926,490 | 24,023,886 | ||||||
National Storage Affiliates Trust | 514,266 | 18,575,288 | ||||||
| 42,599,174 | ||||||||
Specialty Chemicals–0.68% | ||||||||
NewMarket Corp. | 30,941 | 9,626,055 | ||||||
Systems Software–1.04% | ||||||||
Gitlab, Inc., Class A(b)(c) | 101,161 | 4,596,756 | ||||||
Progress Software Corp. | 202,282 | 10,205,127 | ||||||
| 14,801,883 | ||||||||
Thrifts & Mortgage Finance–0.87% |
| |||||||
WSFS Financial Corp. | 274,604 | 12,450,545 | ||||||
Total Common Stocks & Other Equity Interests | 1,404,846,228 | |||||||
Money Market Funds–1.16% |
| |||||||
Invesco Government & Agency Portfolio, Institutional Class, 4.22%(d)(e) | 6,219,757 | 6,219,757 | ||||||
Invesco Liquid Assets Portfolio, Institutional Class, 4.42%(d)(e) | 3,204,077 | 3,205,039 | ||||||
Invesco Treasury Portfolio, Institutional Class, 4.20%(d)(e) | 7,108,294 | 7,108,293 | ||||||
Total Money Market Funds | 16,533,089 | |||||||
TOTAL INVESTMENTS IN SECURITIES (excluding investments purchased with cash collateral from securities on loan)-99.76% (Cost $1,103,815,306) | 1,421,379,317 | |||||||
Investments Purchased with Cash Collateral from Securities on Loan |
| |||||||
Money Market Funds–15.83% |
| |||||||
Invesco Private Government Fund, 4.28%(d)(e)(f) | 63,136,710 | 63,136,710 | ||||||
See accompanying Notes to Financial Statements which are an integral part of the financial statements.
| 9 | Invesco Main Street Small Cap Fund® |
| Shares | Value | |||||||
Money Market Funds–(continued) |
| |||||||
Invesco Private Prime Fund, 4.46%(d)(e)(f) | 162,302,848 | $ | 162,351,537 | |||||
| ||||||||
Total Investments Purchased with Cash Collateral from Securities on Loan |
| 225,488,247 | ||||||
| ||||||||
TOTAL INVESTMENTS IN SECURITIES–115.59% |
| 1,646,867,564 | ||||||
| ||||||||
OTHER ASSETS LESS LIABILITIES–(15.59)% |
| (222,167,028 | ) | |||||
| ||||||||
NET ASSETS–100.00% | $ | 1,424,700,536 | ||||||
| ||||||||
Investment Abbreviations:
REIT – Real Estate Investment Trust
Notes to Schedule of Investments:
| (a) | Industry and/or sector classifications used in this report are generally according to the Global Industry Classification Standard, which was developed by and is the exclusive property and a service mark of MSCI Inc. and Standard & Poor’s. |
| (b) | Non-income producing security. |
| (c) | All or a portion of this security was out on loan at December 31, 2022. |
| (d) | Affiliated issuer. The issuer and/or the Fund is a wholly-owned subsidiary of Invesco Ltd., or is affiliated by having an investment adviser that is under common control of Invesco Ltd. The table below shows the Fund’s transactions in, and earnings from, its investments in affiliates for the fiscal year ended December 31, 2022. |
| Value December 31, 2021 | Purchases at Cost | Proceeds from Sales | Change in Unrealized Appreciation | Realized Gain (Loss) | Value December 31, 2022 | Dividend Income | ||||||||||||||||||||||
| Investments in Affiliated Money Market Funds: | ||||||||||||||||||||||||||||
Invesco Government & Agency Portfolio, Institutional Class | $ 9,178,802 | $ | 139,841,628 | $ | (142,800,673 | ) | $ - | $ | - | $ | 6,219,757 | $162,291 | ||||||||||||||||
Invesco Liquid Assets Portfolio, Institutional Class | 5,021,706 | 99,886,877 | (101,704,963 | ) | 1,403 | 16 | 3,205,039 | 99,418 | ||||||||||||||||||||
Invesco Treasury Portfolio, Institutional Class | 10,490,060 | 159,819,003 | (163,200,770 | ) | - | - | 7,108,293 | 181,171 | ||||||||||||||||||||
| Investments Purchased with Cash Collateral from Securities on Loan: | ||||||||||||||||||||||||||||
Invesco Private Government Fund | 56,111,634 | 408,461,987 | (401,436,911 | ) | - | - | 63,136,710 | 1,054,819* | ||||||||||||||||||||
Invesco Private Prime Fund | 130,927,142 | 895,606,183 | (864,193,406 | ) | 26,922 | (15,304 | ) | 162,351,537 | 2,871,509* | |||||||||||||||||||
Total | $211,729,344 | $ | 1,703,615,678 | $ | (1,673,336,723 | ) | $28,325 | $ | (15,288 | ) | $ | 242,021,336 | $4,369,208 | |||||||||||||||
| * | Represents the income earned on the investment of cash collateral, which is included in securities lending income on the Statement of Operations. Does not include rebates and fees paid to lending agent or premiums received from borrowers, if any. |
| (e) | The rate shown is the 7-day SEC standardized yield as of December 31, 2022. |
| (f) | The security has been segregated to satisfy the commitment to return the cash collateral received in securities lending transactions upon the borrower’s return of the securities loaned. See Note 1K. |
See accompanying Notes to Financial Statements which are an integral part of the financial statements.
| 10 | Invesco Main Street Small Cap Fund® |
Statement of Assets and Liabilities
December 31, 2022
Assets: | ||||
Investments in unaffiliated securities, at value (Cost $1,087,283,620)* | $ | 1,404,846,228 | ||
| ||||
Investments in affiliated money market funds, at value (Cost $242,001,692) | 242,021,336 | |||
| ||||
Cash | 489,147 | |||
| ||||
Foreign currencies, at value (Cost $57,614) | 57,522 | |||
| ||||
Receivable for: |
| |||
Investments sold | 5,106,892 | |||
| ||||
Fund shares sold | 751,774 | |||
| ||||
Dividends | 1,042,188 | |||
| ||||
Investment for trustee deferred compensation and retirement plans | 133,000 | |||
| ||||
Other assets | 62,163 | |||
| ||||
Total assets | 1,654,510,250 | |||
| ||||
Liabilities: |
| |||
Payable for: |
| |||
Investments purchased | 2,151,262 | |||
| ||||
Fund shares reacquired | 1,286,126 | |||
| ||||
Collateral upon return of securities loaned | 225,470,006 | |||
| ||||
Accrued fees to affiliates | 592,467 | |||
| ||||
Accrued trustees’ and officers’ fees and benefits | 4,503 | |||
| ||||
Accrued other operating expenses | 163,968 | |||
| ||||
Trustee deferred compensation and retirement plans | 141,382 | |||
| ||||
Total liabilities | 229,809,714 | |||
| ||||
Net assets applicable to shares outstanding | $ | 1,424,700,536 | ||
| ||||
Net assets consist of: |
| |||
Shares of beneficial interest | $ | 1,219,896,104 | ||
| ||||
Distributable earnings | 204,804,432 | |||
| ||||
| $ | 1,424,700,536 | |||
| ||||
Net Assets: |
| |||
Class A | $ | 320,729,919 | ||
| ||||
Class C | $ | 31,022,402 | ||
| ||||
Class R | $ | 48,875,304 | ||
| ||||
Class Y | $ | 533,098,412 | ||
| ||||
Class R5 | $ | 7,886,746 | ||
| ||||
Class R6 | $ | 483,087,753 | ||
| ||||
Shares outstanding, no par value, with an unlimited number of shares authorized: |
| |||
Class A | 18,153,216 | |||
| ||||
Class C | 1,892,968 | |||
| ||||
Class R | 2,834,115 | |||
| ||||
Class Y | 29,885,418 | |||
| ||||
Class R5 | 444,518 | |||
| ||||
Class R6 | 27,011,008 | |||
| ||||
Class A: |
| |||
Net asset value per share | $ | 17.67 | ||
| ||||
Maximum offering price per share | $ | 18.70 | ||
| ||||
Class C: |
| |||
Net asset value and offering price per share | $ | 16.39 | ||
| ||||
Class R: |
| |||
Net asset value and offering price per share | $ | 17.25 | ||
| ||||
Class Y: |
| |||
Net asset value and offering price per share | $ | 17.84 | ||
| ||||
Class R5: |
| |||
Net asset value and offering price per share | $ | 17.74 | ||
| ||||
Class R6: |
| |||
Net asset value and offering price per share | $ | 17.88 | ||
| ||||
| * | At December 31, 2022, securities with an aggregate value of $220,088,960 were on loan to brokers. |
See accompanying Notes to Financial Statements which are an integral part of the financial statements.
| 11 | Invesco Main Street Small Cap Fund® |
Statement of Operations
For the year ended December 31, 2022
Investment income: |
| |||
Dividends (net of foreign withholding taxes of $44,469) | $ | 18,123,210 | ||
| ||||
Dividends from affiliated money market funds (includes net securities lending income of $275,750) | 718,630 | |||
| ||||
Total investment income | 18,841,840 | |||
| ||||
Expenses: |
| |||
Advisory fees | 9,839,797 | |||
| ||||
Administrative services fees | 221,407 | |||
| ||||
Custodian fees | 25,577 | |||
| ||||
Distribution fees: |
| |||
Class A | 849,477 | |||
| ||||
Class C | 341,214 | |||
| ||||
Class R | 248,829 | |||
| ||||
Transfer agent fees – A, C, R and Y | 1,700,662 | |||
| ||||
Transfer agent fees – R5 | 4,591 | |||
| ||||
Transfer agent fees – R6 | 168,715 | |||
| ||||
Trustees’ and officers’ fees and benefits | 29,150 | |||
| ||||
Registration and filing fees | 137,669 | |||
| ||||
Reports to shareholders | 123,059 | |||
| ||||
Professional services fees | 60,310 | |||
| ||||
Other | 21,339 | |||
| ||||
Total expenses | 13,771,796 | |||
| ||||
Less: Fees waived and/or expense offset arrangement(s) | (32,265 | ) | ||
| ||||
Net expenses | 13,739,531 | |||
| ||||
Net investment income | 5,102,309 | |||
| ||||
Realized and unrealized gain (loss) from: |
| |||
Net realized gain (loss) from: |
| |||
Unaffiliated investment securities | (80,218,626 | ) | ||
| ||||
Affiliated investment securities | (15,288 | ) | ||
| ||||
Foreign currencies | (57 | ) | ||
| ||||
| (80,233,971 | ) | |||
| ||||
Change in net unrealized appreciation (depreciation) of: |
| |||
Unaffiliated investment securities | (205,122,963 | ) | ||
| ||||
Affiliated investment securities | 28,325 | |||
| ||||
Foreign currencies | (92 | ) | ||
| ||||
| (205,094,730 | ) | |||
| ||||
Net realized and unrealized gain (loss) | (285,328,701 | ) | ||
| ||||
Net increase (decrease) in net assets resulting from operations | $ | (280,226,392 | ) | |
| ||||
See accompanying Notes to Financial Statements which are an integral part of the financial statements.
| 12 | Invesco Main Street Small Cap Fund® |
Statement of Changes in Net Assets
For the years ended December 31, 2022 and 2021
| 2022 | 2021 | |||||||
| ||||||||
Operations: |
| |||||||
Net investment income (loss) | $ | 5,102,309 | $ | (737,233 | ) | |||
| ||||||||
Net realized gain (loss) | (80,233,971 | ) | 124,601,278 | |||||
| ||||||||
Change in net unrealized appreciation (depreciation) | (205,094,730 | ) | 136,088,245 | |||||
| ||||||||
Net increase (decrease) in net assets resulting from operations | (280,226,392 | ) | 259,952,290 | |||||
| ||||||||
| Distributions to shareholders from distributable earnings: |
| |||||||
Class A | (144,712 | ) | (27,017,539 | ) | ||||
| ||||||||
Class C | – | (3,266,415 | ) | |||||
| ||||||||
Class R | – | (4,024,137 | ) | |||||
| ||||||||
Class Y | (1,456,560 | ) | (38,612,277 | ) | ||||
| ||||||||
Class R5 | (31,462 | ) | (555,583 | ) | ||||
| ||||||||
Class R6 | (2,534,347 | ) | (51,598,150 | ) | ||||
| ||||||||
Total distributions from distributable earnings | (4,167,081 | ) | (125,074,101 | ) | ||||
| ||||||||
| Return of capital: |
| |||||||
Class A | (26,386 | ) | — | |||||
| ||||||||
Class Y | (265,577 | ) | — | |||||
| ||||||||
Class R5 | (5,736 | ) | — | |||||
| ||||||||
Class R6 | (462,092 | ) | — | |||||
| ||||||||
Total return of capital | (759,791 | ) | — | |||||
| ||||||||
Total distributions | (4,926,872 | ) | (125,074,101 | ) | ||||
| ||||||||
Share transactions–net: | ||||||||
Class A | (22,451,163 | ) | 234,669,141 | |||||
| ||||||||
Class C | (4,501,468 | ) | 3,929,515 | |||||
| ||||||||
Class R | 698,301 | 20,256,163 | ||||||
| ||||||||
Class Y | 58,197,893 | 273,706,951 | ||||||
| ||||||||
Class R5 | 344,297 | 9,486,247 | ||||||
| ||||||||
Class R6 | (151,172,732 | ) | (46,718,953 | ) | ||||
| ||||||||
Net increase (decrease) in net assets resulting from share transactions | (118,884,872 | ) | 495,329,064 | |||||
| ||||||||
Net increase (decrease) in net assets | (404,038,136 | ) | 630,207,253 | |||||
| ||||||||
Net assets: |
| |||||||
Beginning of year | 1,828,738,672 | 1,198,531,419 | ||||||
| ||||||||
End of year | $ | 1,424,700,536 | $ | 1,828,738,672 | ||||
| ||||||||
See accompanying Notes to Financial Statements which are an integral part of the financial statements.
| 13 | Invesco Main Street Small Cap Fund® |
The following schedule presents financial highlights for a share of the Fund outstanding throughout the periods indicated.
Net asset value, beginning of period | Net investment income | Net gains (losses) on securities (both realized and unrealized) | Total from investment operations | Dividends from net investment income | Distributions from net realized gains | Return of capital | Total distributions | Net asset value, end of period | Total return(b) | Net assets, end of period (000’s omitted) | Ratio of expenses to average net assets with fee waivers and/or expenses absorbed | Ratio of expenses to average net assets without fee waivers and/or expenses absorbed(c) | Ratio of net investment income to average net assets | Portfolio turnover (d) | |||||||||||||||||||||||||||||||||||||||||||||||||||||||||||||
Class A | |||||||||||||||||||||||||||||||||||||||||||||||||||||||||||||||||||||||||||
Year ended 12/31/22 | $ | 21.07 | $ | 0.02 | $ | (3.41 | ) | $ | (3.39 | ) | $ | (0.01 | ) | $ | – | $ | (0.00 | ) | $ | (0.01 | ) | $ | 17.67 | (16.09 | )% | $ | 320,730 | 1.11 | % | 1.11 | % | 0.12 | % | 36 | % | ||||||||||||||||||||||||||||||||||||||||
Year ended 12/31/21 | 18.71 | (0.06 | ) | 4.06 | 4.00 | (0.01 | ) | (1.63 | ) | – | (1.64 | ) | 21.07 | 21.73 | 408,430 | 1.11 | 1.11 | (0.28 | ) | 58 | |||||||||||||||||||||||||||||||||||||||||||||||||||||||
Year ended 12/31/20 | 15.68 | 0.01 | 3.10 | 3.11 | – | (0.08 | ) | – | (0.08 | ) | 18.71 | 19.82 | (e) | 158,769 | 1.20 | (e) | 1.23 | (e) | 0.03 | (e) | 43 | ||||||||||||||||||||||||||||||||||||||||||||||||||||||
Eight months ended 12/31/19 | 14.62 | 0.01 | 1.10 | 1.11 | – | (0.05 | ) | – | (0.05 | ) | 15.68 | 7.58 | 141,880 | 1.20 | (f) | 1.25 | (f) | 0.09 | (f) | 19 | |||||||||||||||||||||||||||||||||||||||||||||||||||||||
Year ended 04/30/19 | 15.09 | 0.00 | 0.58 | 0.58 | – | (1.05 | ) | – | (1.05 | ) | 14.62 | 4.46 | 140,651 | 1.17 | 1.17 | 0.01 | 46 | ||||||||||||||||||||||||||||||||||||||||||||||||||||||||||
Year ended 04/30/18 | 14.87 | (0.01 | ) | 1.08 | 1.07 | (0.04 | ) | (0.81 | ) | – | (0.85 | ) | 15.09 | 7.08 | 112,937 | 1.20 | 1.21 | (0.06 | ) | 52 | |||||||||||||||||||||||||||||||||||||||||||||||||||||||
Class C | |||||||||||||||||||||||||||||||||||||||||||||||||||||||||||||||||||||||||||
Year ended 12/31/22 | 19.68 | (0.11 | ) | (3.18 | ) | (3.29 | ) | – | – | – | – | 16.39 | (16.72 | ) | 31,022 | 1.86 | 1.86 | (0.63 | ) | 36 | |||||||||||||||||||||||||||||||||||||||||||||||||||||||
Year ended 12/31/21 | 17.70 | (0.21 | ) | 3.83 | 3.62 | (0.01 | ) | (1.63 | ) | – | (1.64 | ) | 19.68 | 20.81 | 42,392 | 1.86 | 1.86 | (1.03 | ) | 58 | |||||||||||||||||||||||||||||||||||||||||||||||||||||||
Year ended 12/31/20 | 14.95 | (0.10 | ) | 2.93 | 2.83 | – | (0.08 | ) | – | (0.08 | ) | 17.70 | 18.92 | 34,635 | 1.94 | 1.99 | (0.71 | ) | 43 | ||||||||||||||||||||||||||||||||||||||||||||||||||||||||
Eight months ended 12/31/19 | 14.01 | (0.06 | ) | 1.05 | 0.99 | – | (0.05 | ) | – | (0.05 | ) | 14.95 | 7.06 | 37,488 | 1.94 | (f) | 2.01 | (f) | (0.66 | )(f) | 19 | ||||||||||||||||||||||||||||||||||||||||||||||||||||||
Year ended 04/30/19 | 14.62 | (0.11 | ) | 0.55 | 0.44 | – | (1.05 | ) | – | (1.05 | ) | 14.01 | 3.62 | 44,391 | 1.93 | 1.93 | (0.74 | ) | 46 | ||||||||||||||||||||||||||||||||||||||||||||||||||||||||
Year ended 04/30/18 | 14.50 | (0.12 | ) | 1.05 | 0.93 | – | (0.81 | ) | – | (0.81 | ) | 14.62 | 6.31 | 38,424 | 1.95 | 1.96 | (0.83 | ) | 52 | ||||||||||||||||||||||||||||||||||||||||||||||||||||||||
Class R | |||||||||||||||||||||||||||||||||||||||||||||||||||||||||||||||||||||||||||
Year ended 12/31/22 | 20.60 | (0.02 | ) | (3.33 | ) | (3.35 | ) | – | – | – | – | 17.25 | (16.26 | ) | 48,875 | 1.36 | 1.36 | (0.13 | ) | 36 | |||||||||||||||||||||||||||||||||||||||||||||||||||||||
Year ended 12/31/21 | 18.37 | (0.11 | ) | 3.98 | 3.87 | (0.01 | ) | (1.63 | ) | – | (1.64 | ) | 20.60 | 21.42 | 57,441 | 1.36 | 1.36 | (0.53 | ) | 58 | |||||||||||||||||||||||||||||||||||||||||||||||||||||||
Year ended 12/31/20 | 15.45 | (0.03 | ) | 3.03 | 3.00 | – | (0.08 | ) | – | (0.08 | ) | 18.37 | 19.40 | 33,457 | 1.45 | 1.49 | (0.22 | ) | 43 | ||||||||||||||||||||||||||||||||||||||||||||||||||||||||
Eight months ended 12/31/19 | 14.43 | (0.02 | ) | 1.09 | 1.07 | – | (0.05 | ) | – | (0.05 | ) | 15.45 | 7.41 | 26,910 | 1.45 | (f) | 1.51 | (f) | (0.16 | )(f) | 19 | ||||||||||||||||||||||||||||||||||||||||||||||||||||||
Year ended 04/30/19 | 14.95 | (0.04 | ) | 0.57 | 0.53 | – | (1.05 | ) | – | (1.05 | ) | 14.43 | 4.16 | 24,188 | 1.43 | 1.43 | (0.24 | ) | 46 | ||||||||||||||||||||||||||||||||||||||||||||||||||||||||
Year ended 04/30/18 | 14.75 | (0.05 | ) | 1.08 | 1.03 | (0.02 | ) | (0.81 | ) | – | (0.83 | ) | 14.95 | 6.79 | 18,749 | 1.45 | 1.46 | (0.35 | ) | 52 | |||||||||||||||||||||||||||||||||||||||||||||||||||||||
Class Y | |||||||||||||||||||||||||||||||||||||||||||||||||||||||||||||||||||||||||||
Year ended 12/31/22 | 21.27 | 0.07 | (3.44 | ) | (3.37 | ) | (0.05 | ) | – | (0.01 | ) | (0.06 | ) | 17.84 | (15.87 | ) | 533,098 | 0.86 | 0.86 | 0.37 | 36 | ||||||||||||||||||||||||||||||||||||||||||||||||||||||
Year ended 12/31/21 | 18.83 | (0.01 | ) | 4.09 | 4.08 | (0.01 | ) | (1.63 | ) | – | (1.64 | ) | 21.27 | 22.03 | 566,299 | 0.86 | 0.86 | (0.03 | ) | 58 | |||||||||||||||||||||||||||||||||||||||||||||||||||||||
Year ended 12/31/20 | 15.79 | 0.05 | 3.13 | 3.18 | (0.06 | ) | (0.08 | ) | – | (0.14 | ) | 18.83 | 20.13 | 266,951 | 0.90 | 0.99 | 0.33 | 43 | |||||||||||||||||||||||||||||||||||||||||||||||||||||||||
Eight months ended 12/31/19 | 14.69 | 0.04 | 1.11 | 1.15 | – | (0.05 | ) | – | (0.05 | ) | 15.79 | 7.82 | 152,406 | 0.90 | (f) | 1.01 | (f) | 0.38 | (f) | 19 | |||||||||||||||||||||||||||||||||||||||||||||||||||||||
Year ended 04/30/19 | 15.16 | 0.04 | 0.58 | 0.62 | (0.04 | ) | (1.05 | ) | – | (1.09 | ) | 14.69 | 4.73 | 169,801 | 0.90 | 0.93 | 0.28 | 46 | |||||||||||||||||||||||||||||||||||||||||||||||||||||||||
Year ended 04/30/18 | 14.93 | 0.03 | 1.09 | 1.12 | (0.08 | ) | (0.81 | ) | – | (0.89 | ) | 15.16 | 7.35 | 149,641 | 0.90 | 0.96 | 0.18 | 52 | |||||||||||||||||||||||||||||||||||||||||||||||||||||||||
Class R5 | |||||||||||||||||||||||||||||||||||||||||||||||||||||||||||||||||||||||||||
Year ended 12/31/22 | 21.16 | 0.09 | (3.43 | ) | (3.34 | ) | (0.07 | ) | – | (0.01 | ) | (0.08 | ) | 17.74 | (15.78 | ) | 7,887 | 0.74 | 0.74 | 0.49 | 36 | ||||||||||||||||||||||||||||||||||||||||||||||||||||||
Year ended 12/31/21 | 18.74 | 0.01 | 4.06 | 4.07 | (0.02 | ) | (1.63 | ) | – | (1.65 | ) | 21.16 | 22.08 | 9,028 | 0.77 | 0.77 | 0.06 | 58 | |||||||||||||||||||||||||||||||||||||||||||||||||||||||||
Year ended 12/31/20 | 15.71 | 0.07 | 3.12 | 3.19 | (0.08 | ) | (0.08 | ) | – | (0.16 | ) | 18.74 | 20.30 | 13 | 0.77 | 0.77 | 0.46 | 43 | |||||||||||||||||||||||||||||||||||||||||||||||||||||||||
Period ended 12/31/19(g) | 13.89 | 0.04 | 1.83 | 1.87 | – | (0.05 | ) | – | �� | (0.05 | ) | 15.71 | 13.45 | 11 | 0.82 | (f) | 0.82 | (f) | 0.47 | (f) | 19 | ||||||||||||||||||||||||||||||||||||||||||||||||||||||
Class R6 | |||||||||||||||||||||||||||||||||||||||||||||||||||||||||||||||||||||||||||
Year ended 12/31/22 | 21.36 | 0.10 | (3.47 | ) | (3.37 | ) | (0.09 | ) | – | (0.02 | ) | (0.11 | ) | 17.88 | (15.79 | ) | 483,088 | 0.71 | 0.71 | 0.52 | 36 | ||||||||||||||||||||||||||||||||||||||||||||||||||||||
Year ended 12/31/21 | 18.88 | 0.03 | 4.10 | 4.13 | (0.02 | ) | (1.63 | ) | – | (1.65 | ) | 21.36 | 22.23 | 745,149 | 0.68 | 0.68 | 0.15 | 58 | |||||||||||||||||||||||||||||||||||||||||||||||||||||||||
Year ended 12/31/20 | 15.83 | 0.07 | 3.15 | 3.22 | (0.09 | ) | (0.08 | ) | – | (0.17 | ) | 18.88 | 20.31 | 704,706 | 0.77 | 0.77 | 0.46 | 43 | |||||||||||||||||||||||||||||||||||||||||||||||||||||||||
Eight months ended 12/31/19 | 14.72 | 0.05 | 1.11 | 1.16 | – | (0.05 | ) | – | (0.05 | ) | 15.83 | 7.87 | 271,711 | 0.77 | (f) | 0.78 | (f) | 0.52 | (f) | 19 | |||||||||||||||||||||||||||||||||||||||||||||||||||||||
Year ended 04/30/19 | 15.19 | 0.07 | 0.57 | 0.64 | (0.06 | ) | (1.05 | ) | – | (1.11 | ) | 14.72 | 4.85 | 287,799 | 0.76 | 0.76 | 0.43 | 46 | |||||||||||||||||||||||||||||||||||||||||||||||||||||||||
Year ended 04/30/18 | 14.95 | 0.06 | 1.08 | 1.14 | (0.09 | ) | (0.81 | ) | – | (0.90 | ) | 15.19 | 7.58 | 256,221 | 0.77 | 0.77 | 0.38 | 52 | |||||||||||||||||||||||||||||||||||||||||||||||||||||||||
| (a) | Calculated using average shares outstanding. |
| (b) | Includes adjustments in accordance with accounting principles generally accepted in the United States of America and as such, the net asset value for financial reporting purposes and the returns based upon those net asset values may differ from the net asset value and returns for shareholder transactions. Does not include sales charges and is not annualized for periods less than one year, if applicable. |
| (c) | Does not include indirect expenses from affiliated fund fees and expenses of 0.00% for the eight months ended December 31, 2019 and the years ended April 30, 2019 and 2018, respectively. |
| (d) | Portfolio turnover is calculated at the fund level and is not annualized for periods less than one year, if applicable. For the year ended December 31, 2021, the portfolio turnover calculation excludes the value of securities purchased of $205,907,350 in connection with the acquisition of Invesco Select Companies Fund into the Fund. |
| (e) | The total return, ratio of expenses to average net assets and ratio of net investment income to average net assets reflect actual 12b-1 fees of 0.24% for the year ended December 31, 2020. |
| (f) | Annualized. |
| (g) | Commencement date after the close of business on May 24, 2019. |
See accompanying Notes to Financial Statements which are an integral part of the financial statements.
| 14 | Invesco Main Street Small Cap Fund® |
December 31, 2022
NOTE 1–Significant Accounting Policies
Invesco Main Street Small Cap Fund® (the “Fund”) is a series portfolio of AIM Growth Series (Invesco Growth Series) (the “Trust”). The Trust is a Delaware statutory trust registered under the Investment Company Act of 1940, as amended (the “1940 Act”), as an open-end series management investment company authorized to issue an unlimited number of shares of beneficial interest. Information presented in these financial statements pertains only to the Fund. Matters affecting the Fund or each class will be voted on exclusively by the shareholders of the Fund or each class.
The Fund’s investment objective is to seek capital appreciation.
The Fund currently consists of six different classes of shares: Class A, Class C, Class R, Class Y, Class R5 and Class R6. Class Y shares are available only to certain investors. Class A shares are sold with a front-end sales charge unless certain waiver criteria are met. Under certain circumstances, load waived shares may be subject to contingent deferred sales charges (“CDSC”). Class C shares are sold with a CDSC. Class R, Class Y, Class R5 and Class R6 shares are sold at net asset value. Class C shares held for eight years after purchase are eligible for automatic conversion into Class A shares of the same Fund (the “Conversion Feature”). The automatic conversion pursuant to the Conversion Feature will generally occur at the end of the month following the eighth anniversary after a purchase of Class C shares.
The Fund is an investment company and accordingly follows the investment company accounting and reporting guidance in accordance with Financial Accounting Standards Board Accounting Standards Codification Topic 946, Financial Services – Investment Companies.
The following is a summary of the significant accounting policies followed by the Fund in the preparation of its financial statements.
| A. | Security Valuations – Securities, including restricted securities, are valued according to the following policy. |
A security listed or traded on an exchange is generally valued at its trade price or official closing price that day as of the close of the exchange where the security is principally traded, or lacking any trades or official closing price on a particular day, the security may be valued at the closing bid price on that day. Securities traded in the over-the-counter market are valued based on prices furnished by independent pricing services or market makers. When such securities are valued using prices provided by an independent pricing service they may be considered fair valued. Futures contracts are valued at the daily settlement price set by an exchange on which they are principally traded. U.S. exchange-traded options are valued at the mean between the last bid and asked prices from the exchange on which they are principally traded. Non-U.S. exchange-traded options are valued at the final settlement price set by the exchange on which they trade. Options not listed on an exchange and swaps generally are valued using pricing provided from independent pricing services.
Securities of investment companies that are not exchange-traded (e.g., open-end mutual funds) are valued using such company’s end-of-business-day net asset value per share.
Deposits, other obligations of U.S. and non-U.S. banks and financial institutions are valued at their daily account value.
Fixed income securities (including convertible debt securities) generally are valued on the basis of prices provided by independent pricing services. Prices provided by the pricing service may be determined without exclusive reliance on quoted prices, and may reflect appropriate factors such as institution-size trading in similar groups of securities, developments related to specific securities, dividend rate (for unlisted equities), yield (for debt obligations), quality, type of issue, coupon rate (for debt obligations), maturity (for debt obligations), individual trading characteristics and other market data. Pricing services generally value debt obligations assuming orderly transactions of institutional round lot size, but a fund may hold or transact in the same securities in smaller, odd lot sizes. Odd lots often trade at lower prices than institutional round lots, and their value may be adjusted accordingly. Debt obligations are subject to interest rate and credit risks. In addition, all debt obligations involve some risk of default with respect to interest and/or principal payments.
Foreign securities’ (including foreign exchange contracts) prices are converted into U.S. dollar amounts using the applicable exchange rates as of the close of the New York Stock Exchange (“NYSE”). If market quotations are available and reliable for foreign exchange-traded equity securities, the securities will be valued at the market quotations. Invesco Advisers, Inc. (the “Adviser” or “Invesco”) may use various pricing services to obtain market quotations as well as fair value prices. Because trading hours for certain foreign securities end before the close of the NYSE, closing market quotations may become not representative of market value in the Adviser’s judgment (“unreliable”). If, between the time trading ends on a particular security and the close of the customary trading session on the NYSE, a significant event occurs that makes the closing price of the security unreliable, the Adviser may fair value the security. If the event is likely to have affected the closing price of the security, the security will be valued at fair value in good faith in accordance with Board- approved policies and related Adviser procedures (“Valuation Procedures”). Adjustments to closing prices to reflect fair value may also be based on a screening process of an independent pricing service to indicate the degree of certainty, based on historical data, that the closing price in the principal market where a foreign security trades is not the current value as of the close of the NYSE. Foreign securities’ prices meeting the degree of certainty that the price is not reflective of current value will be priced at the indication of fair value from the independent pricing service. Multiple factors may be considered by the independent pricing service in determining adjustments to reflect fair value and may include information relating to sector indices, American Depositary Receipts and domestic and foreign index futures. Foreign securities may have additional risks including exchange rate changes, potential for sharply devalued currencies and high inflation, political and economic upheaval, the relative lack of issuer information, relatively low market liquidity and the potential lack of strict financial and accounting controls and standards.
Unlisted securities will be valued using prices provided by independent pricing services or by another method that the Adviser, in its judgment, believes better reflects the security’s fair value in accordance with the Valuation Procedures.
Securities for which market prices are not provided by any of the above methods may be valued based upon quotes furnished by independent sources. The last bid price may be used to value equity securities. The mean between the last bid and asked prices may be used to value debt obligations, including corporate loans.
Securities for which market quotations are not readily available are fair valued by the Adviser in accordance with the Valuation Procedures. If a fair value price provided by a pricing service is unreliable, the Adviser will fair value the security using the Valuation Procedures. Issuer specific events, market trends, bid/asked quotes of brokers and information providers and other market data may be reviewed in the course of making a good faith determination of a security’s fair value.
The Fund may invest in securities that are subject to interest rate risk, meaning the risk that the prices will generally fall as interest rates rise and, conversely, the prices will generally rise as interest rates fall. Specific securities differ in their sensitivity to changes in interest rates depending on their individual characteristics. Changes in interest rates may result in increased market volatility, which may affect the value and/or liquidity of certain Fund investments.
Valuations change in response to many factors including the historical and prospective earnings of the issuer, the value of the issuer’s assets, general market conditions which are not specifically related to the particular issuer, such as real or perceived adverse economic conditions, changes in the general outlook for revenues or corporate earnings, changes in interest or currency rates, regional or global instability, natural or environmental disasters, widespread disease or other public health issues, war, acts of terrorism, significant governmental actions or adverse investor sentiment generally and market liquidity. Because of the inherent uncertainties of valuation, the values reflected in the financial statements may materially differ from the value received upon actual sale of those investments.
The price the Fund could receive upon the sale of any investment may differ from the Adviser’s valuation of the investment, particularly for securities that are valued using a fair valuation technique. When fair valuation techniques are applied, the Adviser uses available information, including both observable and unobservable inputs and assumptions, to determine a methodology that will result in a valuation that the Adviser believes approximates market value. Fund securities that are fair valued may be subject to greater fluctuation in their value from one day to the next than would be the case if market quotations were used. Because of the inherent uncertainties of valuation, and the degree of subjectivity in such decisions, the Fund could realize a greater or lesser than expected gain or loss upon the sale of the investment.
| 15 | Invesco Main Street Small Cap Fund® |
| B. | Securities Transactions and Investment Income – Securities transactions are accounted for on a trade date basis. Realized gains or losses on sales are computed on the basis of specific identification of the securities sold. Interest income (net of withholding tax, if any) is recorded on an accrual basis from settlement date and includes coupon interest and amortization of premium and accretion of discount on debt securities as applicable. Dividend income (net of withholding tax, if any) is recorded on the ex-dividend date. |
The Fund may periodically participate in litigation related to Fund investments. As such, the Fund may receive proceeds from litigation settlements. Any proceeds received are included in the Statement of Operations as realized gain (loss) for investments no longer held and as unrealized gain (loss) for investments still held.
Brokerage commissions and mark ups are considered transaction costs and are recorded as an increase to the cost basis of securities purchased and/or a reduction of proceeds on a sale of securities. Such transaction costs are included in the determination of net realized and unrealized gain (loss) from investment securities reported in the Statement of Operations and the Statement of Changes in Net Assets and the net realized and unrealized gains (losses) on securities per share in the Financial Highlights. Transaction costs are included in the calculation of the Fund’s net asset value and, accordingly, they reduce the Fund’s total returns. These transaction costs are not considered operating expenses and are not reflected in net investment income reported in the Statement of Operations and the Statement of Changes in Net Assets, or the net investment income per share and the ratios of expenses and net investment income reported in the Financial Highlights, nor are they limited by any expense limitation arrangements between the Fund and the investment adviser.
The Fund allocates income and realized and unrealized capital gains and losses to a class based on the relative net assets of each class.
The Fund recharacterizes distributions received from REIT investments based on information provided by the REIT into the following categories: ordinary income, long-term and short-term capital gains, and return of capital. If information is not available on a timely basis from the REIT, the recharacterization will be based on available information which may include the previous year’s allocation. If new or additional information becomes available from the REIT at a later date, a recharacterization will be made in the following year. The Fund records as dividend income the amount recharacterized as ordinary income and as realized gain the amount recharacterized as capital gain in the Statement of Operations, and the amount recharacterized as return of capital as a reduction of the cost of the related investment. These recharacterizations are reflected in the accompanying financial statements.
| C. | Country Determination – For the purposes of making investment selection decisions and presentation in the Schedule of Investments, the investment adviser may determine the country in which an issuer is located and/or credit risk exposure based on various factors. These factors include the laws of the country under which the issuer is organized, where the issuer maintains a principal office, the country in which the issuer derives 50% or more of its total revenues, the country that has the primary market for the issuer’s securities and its “country of risk” as determined by a third party service provider, as well as other criteria. Among the other criteria that may be evaluated for making this determination are the country in which the issuer maintains 50% or more of its assets, the type of security, financial guarantees and enhancements, the nature of the collateral and the sponsor organization. Country of issuer and/or credit risk exposure has been determined to be the United States of America, unless otherwise noted. |
| D. | Distributions – Distributions from net investment income and net realized capital gain, if any, are generally declared and paid annually and recorded on the ex-dividend date. The Fund may elect to treat a portion of the proceeds from redemptions as distributions for federal income tax purposes. |
| E. | Master Limited Partnerships – The Fund invests in Master Limited Partnerships (“MLPs”). MLPs are publicly traded partnerships and limited liability companies taxed as partnerships under the Internal Revenue Code of 1986, as amended (the “Internal Revenue Code”). The Fund invests in MLPs engaged in, among other things, the transportation, storage, processing, refining, marketing, exploration, production and mining of minerals and natural resources. The Fund is a partner in each MLP; accordingly, the Fund is required to take into account the Fund’s allocable share of income, gains, losses, deductions, expenses, and tax credits recognized by each MLP. |
MLP’s may be less liquid and subject to more abrupt or erratic price movements than conventional publicly traded securities.
| F. | Return of Capital – Distributions received from the Fund’s investments in MLPs generally are comprised of income and return of capital. The Fund records investment income and return of capital based on estimates made at the time such distributions are received. The return of capital portion of the distribution is a reduction to investment income that results in an equivalent reduction in the cost basis of the associated investments and increases net realized gains (losses) and change in unrealized appreciation (depreciation). Such estimates are based on historical information available from each MLP and other industry sources. These estimates will subsequently be revised and may materially differ primarily based on information received from the MLPs after their tax reporting periods are concluded. |
| G. | Federal Income Taxes – The Fund intends to comply with the requirements of Subchapter M of the Internal Revenue Code of 1986, as amended (the “Internal Revenue Code”), necessary to qualify as a regulated investment company and to distribute substantially all of the Fund’s taxable earnings to shareholders. As such, the Fund will not be subject to federal income taxes on otherwise taxable income (including net realized capital gain) that is distributed to shareholders. Therefore, no provision for federal income taxes is recorded in the financial statements. |
The Fund recognizes the tax benefits of uncertain tax positions only when the position is more likely than not to be sustained. Management has analyzed the Fund’s uncertain tax positions and concluded that no liability for unrecognized tax benefits should be recorded related to uncertain tax positions. Management is not aware of any tax positions for which it is reasonably possible that the total amounts of unrecognized tax benefits will change materially in the next 12 months.
The Fund files tax returns in the U.S. Federal jurisdiction and certain other jurisdictions. Generally, the Fund is subject to examinations by such taxing authorities for up to three years after the filing of the return for the tax period.
| H. | Expenses – Fees provided for under the Rule 12b-1 plan of a particular class of the Fund are charged to the operations of such class. Transfer agency fees and expenses and other shareholder recordkeeping fees and expenses attributable to Class R5 and Class R6 are allocated based on relative net assets of Class R5 and Class R6. Sub-accounting fees attributable to Class R5 are charged to the operations of the class. Transfer agency fees and expenses and other shareholder recordkeeping fees and expenses relating to all other classes are allocated among those classes based on relative net assets. All other expenses are allocated among the classes based on relative net assets. |
| I. | Accounting Estimates – The preparation of financial statements in conformity with accounting principles generally accepted in the United States of America (“GAAP”) requires management to make estimates and assumptions that affect the reported amounts of assets and liabilities at the date of the financial statements and the reported amounts of revenues and expenses during the reporting period including estimates and assumptions related to taxation. Actual results could differ from those estimates by a significant amount. In addition, the Fund monitors for material events or transactions that may occur or become known after the period-end date and before the date the financial statements are released to print. |
| J. | Indemnifications – Under the Trust’s organizational documents, each Trustee, officer, employee or other agent of the Trust is indemnified against certain liabilities that may arise out of the performance of their duties to the Fund. Additionally, in the normal course of business, the Fund enters into contracts, including the Fund’s servicing agreements, that contain a variety of indemnification clauses. The Fund’s maximum exposure under these arrangements is unknown as this would involve future claims that may be made against the Fund that have not yet occurred. The risk of material loss as a result of such indemnification claims is considered remote. |
| K. | Securities Lending – The Fund may lend portfolio securities having a market value up to one-third of the Fund’s total assets. Such loans are secured by collateral equal to no less than the market value of the loaned securities determined daily by the securities lending provider. Such collateral will be cash or debt securities issued or guaranteed by the U.S. Government or any of its sponsored agencies. Cash collateral received in connection with these loans is invested in short-term money market instruments or affiliated, unregistered investment companies that comply with Rule 2a-7 under the 1940 Act and money market funds (collectively, “affiliated money market funds”) and is shown as such on the Schedule of Investments. The Fund bears the risk of loss with respect to the investment of collateral. It is the Fund’s policy to obtain additional collateral from or return excess collateral to the borrower by the end of the next business day, |
| 16 | Invesco Main Street Small Cap Fund® |
| following the valuation date of the securities loaned. Therefore, the value of the collateral held may be temporarily less than the value of the securities on loan. When loaning securities, the Fund retains certain benefits of owning the securities, including the economic equivalent of dividends or interest generated by the security. Lending securities entails a risk of loss to the Fund if, and to the extent that, the market value of the securities loaned were to increase and the borrower did not increase the collateral accordingly, and the borrower failed to return the securities. The securities loaned are subject to termination at the option of the borrower or the Fund. Upon termination, the borrower will return to the Fund the securities loaned and the Fund will return the collateral. Upon the failure of the borrower to return the securities, collateral may be liquidated and the securities may be purchased on the open market to replace the loaned securities. The Fund could experience delays and costs in gaining access to the collateral and the securities may lose value during the delay which could result in potential losses to the Fund. Some of these losses may be indemnified by the lending agent. The Fund bears the risk of any deficiency in the amount of the collateral available for return to the borrower due to any loss on the collateral invested. Dividends received on cash collateral investments for securities lending transactions, which are net of compensation to counterparties, are included in Dividends from affiliated money market funds on the Statement of Operations. The aggregate value of securities out on loan, if any, is shown as a footnote on the Statement of Assets and Liabilities. |
The Adviser serves as an affiliated securities lending agent for the Fund. The Bank of New York Mellon also serves as a lending agent. To the extent the Fund utilizes the Adviser as an affiliated securities lending agent, the Fund conducts its securities lending in accordance with, and in reliance upon, no-action letters issued by the SEC staff that provide guidance on how an affiliate may act as a direct agent lender and receive compensation for those services in a manner consistent with the federal securities laws. For the year ended December 31, 2022, the Fund paid the Adviser $13,705 in fees for securities lending agent services. Fees paid to the Adviser for securities lending agent services, if any, are included in Dividends from affiliated money market funds on the Statement of Operations.
| L. | Foreign Currency Translations – Foreign currency is valued at the close of the NYSE based on quotations posted by banks and major currency dealers. Portfolio securities and other assets and liabilities denominated in foreign currencies are translated into U.S. dollar amounts at the date of valuation. Purchases and sales of portfolio securities (net of foreign taxes withheld on disposition) and income items denominated in foreign currencies are translated into U.S. dollar amounts on the respective dates of such transactions. The Fund does not separately account for the portion of the results of operations resulting from changes in foreign exchange rates on investments and the fluctuations arising from changes in market prices of securities held. The combined results of changes in foreign exchange rates and the fluctuation of market prices on investments (net of estimated foreign tax withholding) are included with the net realized and unrealized gain or loss from investments in the Statement of Operations. Reported net realized foreign currency gains or losses arise from (1) sales of foreign currencies, (2) currency gains or losses realized between the trade and settlement dates on securities transactions, and (3) the difference between the amounts of dividends, interest, and foreign withholding taxes recorded on the Fund’s books and the U.S. dollar equivalent of the amounts actually received or paid. Net unrealized foreign currency gains and losses arise from changes in the fair values of assets and liabilities, other than investments in securities at fiscal period end, resulting from changes in exchange rates. |
The Fund may invest in foreign securities, which may be subject to foreign taxes on income, gains on investments or currency repatriation, a portion of which may be recoverable. Foreign taxes, if any, are recorded based on the tax regulations and rates that exist in the foreign markets in which the Fund invests and are shown in the Statement of Operations.
| M. | Forward Foreign Currency Contracts – The Fund may engage in foreign currency transactions either on a spot (i.e. for prompt delivery and settlement) basis, or through forward foreign currency contracts, to manage or minimize currency or exchange rate risk. |
The Fund may also enter into forward foreign currency contracts for the purchase or sale of a security denominated in a foreign currency in order to “lock in” the U.S. dollar price of that security, or the Fund may also enter into forward foreign currency contracts that do not provide for physical exchange of the two currencies on the settlement date, but instead are settled by a single cash payment calculated as the difference between the agreed upon exchange rate and the spot rate at settlement based upon an agreed upon notional amount (non-deliverable forwards).
A forward foreign currency contract is an obligation between two parties (“Counterparties”) to purchase or sell a specific currency for an agreed-upon price at a future date. The use of forward foreign currency contracts for hedging does not eliminate fluctuations in the price of the underlying securities the Fund owns or intends to acquire but establishes a rate of exchange in advance. Fluctuations in the value of these contracts are measured by the difference in the contract date and reporting date exchange rates and are recorded as unrealized appreciation (depreciation) until the contracts are closed. When the contracts are closed, realized gains (losses) are recorded. Realized and unrealized gains (losses) on the contracts are included in the Statement of Operations. The primary risks associated with forward foreign currency contracts include failure of the Counterparty to meet the terms of the contract and the value of the foreign currency changing unfavorably. These risks may be in excess of the amounts reflected in the Statement of Assets and Liabilities.
| N. | COVID-19 Risk – The COVID-19 strain of coronavirus has resulted in instances of market closures and dislocations, extreme volatility, liquidity constraints and increased trading costs. Efforts to contain its spread have resulted in travel restrictions, disruptions of healthcare systems, business operations (including business closures) and supply chains, layoffs, lower consumer demand and employee availability, and defaults and credit downgrades, among other significant economic impacts that have disrupted global economic activity across many industries. Such economic impacts may exacerbate other pre-existing political, social and economic risks locally or globally and cause general concern and uncertainty. The full economic impact and ongoing effects of COVID-19 (or other future epidemics or pandemics) at the macro-level and on individual businesses are unpredictable and may result in significant and prolonged effects on the Fund’s performance. |
NOTE 2–Advisory Fees and Other Fees Paid to Affiliates
The Trust has entered into a master investment advisory agreement with the Adviser. Under the terms of the investment advisory agreement, the Fund accrues daily and pays monthly an advisory fee to the Adviser based on the annual rate of the Fund’s average daily net assets as follows:
| Average Daily Net Assets | Rate* | |||||
First $ 200 million | 0.750 | % | ||||
Next $200 million | 0.720 | % | ||||
Next $200 million | 0.690 | % | ||||
Next $200 million | 0.660 | % | ||||
Next $4.2 billion | 0.600 | % | ||||
Over $5 billion | 0.580 | % | ||||
| * | The advisory fee paid by the Fund shall be reduced by any amounts paid by the Fund under the administrative services agreement with the Adviser. |
For the year ended December 31, 2022, the effective advisory fee rate incurred by the Fund was 0.64%.
Under the terms of a master sub-advisory agreement between the Adviser and each of Invesco Asset Management Deutschland GmbH, Invesco Asset Management Limited, Invesco Asset Management (Japan) Limited, Invesco Hong Kong Limited, Invesco Senior Secured Management, Inc. and Invesco Canada Ltd. and separate sub-advisory agreements with Invesco Capital Management LLC and Invesco Asset Management (India) Private Limited (collectively, the “Affiliated Sub-Advisers”) the Adviser, not the Fund, will pay 40% of the fees paid to the Adviser to any such Affiliated Sub-Adviser(s) that provide(s) discretionary investment management services
| 17 | Invesco Main Street Small Cap Fund® |
to the Fund based on the percentage of assets allocated to such Affiliated Sub-Adviser(s). Invesco has also entered into a sub-advisory agreement with OppenheimerFunds, Inc. to provide discretionary management services to the Fund.
Effective May 1, 2022, the Adviser has contractually agreed, through at least June 30, 2023, to waive advisory fees and/or reimburse expenses of all shares to the extent necessary to limit total annual fund operating expenses after fee waiver and/or expense reimbursement (excluding certain items discussed below) of Class A, Class C, Class R, Class Y, Class R5 and Class R6 shares to 2.00%, 2.75%, 2.25%, 1.75%, 1.75% and 1.75%, respectively, of the Fund’s average daily net assets (the “expense limits”). Prior to May 1, 2022, the Adviser had contractually agreed to waive advisory fees and/or reimburse expenses of all shares to the extent necessary to limit total annual fund operating expenses after fee waiver and/or expense reimbursement (excluding certain items discussed below) of Class A, Class C, Class R, Class Y, Class R5 and Class R6 shares to 1.20%, 1.94%, 1.45%, 0.90%, 0.82% and 0.77%, respectively, of the Fund’s average daily net assets. In determining the Adviser’s obligation to waive advisory fees and/or reimburse expenses, the following expenses are not taken into account, and could cause the total annual fund operating expenses after fee waiver and/or reimbursement to exceed the numbers reflected above: (1) interest; (2) taxes; (3) dividend expense on short sales; (4) extraordinary or non-routine items, including litigation expenses; and (5) expenses that the Fund has incurred but did not actually pay because of an expense offset arrangement. Unless Invesco continues the fee waiver agreement, it will terminate on June 30, 2023. During its term, the fee waiver agreement cannot be terminated or amended to increase the expense limits or reduce the advisory fee waivers without approval of the Board of Trustees. The Adviser did not waive fees and/or reimburse expenses during the period under these expense limits.
Further, the Adviser has contractually agreed, through at least June 30, 2024, to waive the advisory fee payable by the Fund in an amount equal to 100% of the net advisory fees the Adviser receives from the affiliated money market funds on investments by the Fund of uninvested cash (excluding investments of cash collateral from securities lending) in such affiliated money market funds.
For the year ended December 31, 2022, the Adviser waived advisory fees of $23,112.
The Trust has entered into a master administrative services agreement with Invesco pursuant to which the Fund has agreed to pay Invesco for certain administrative costs incurred in providing accounting services to the Fund. For the year ended December 31, 2022, expenses incurred under the agreement are shown in the Statement of Operations as Administrative services fees. Invesco has entered into a sub-administration agreement whereby State Street Bank and Trust Company (“SSB”) serves as fund accountant and provides certain administrative services to the Fund. Pursuant to a custody agreement with the Trust on behalf of the Fund, SSB also serves as the Fund’s custodian.
The Trust has entered into a transfer agency and service agreement with Invesco Investment Services, Inc. (“IIS”) pursuant to which the Fund has agreed to pay IIS a fee for providing transfer agency and shareholder services to the Fund and reimburse IIS for certain expenses incurred by IIS in the course of providing such services. IIS may make payments to intermediaries that provide omnibus account services, sub-accounting services and/or networking services. All fees payable by IIS to intermediaries that provide omnibus account services or sub-accounting services are charged back to the Fund, subject to certain limitations approved by the Trust’s Board of Trustees. For the year ended December 31, 2022, expenses incurred under the agreement are shown in the Statement of Operations as Transfer agent fees.
The Trust has entered into master distribution agreements with Invesco Distributors, Inc. (“IDI”) to serve as the distributor for the Class A, Class C, Class R, Class Y, Class R5 and Class R6 shares of the Fund. The Trust has adopted plans pursuant to Rule 12b-1 under the 1940 Act with respect to the Fund’s Class A, Class C and Class R shares (collectively, the “Plans”). The Fund, pursuant to the Class A Plan, reimburses IDI for its allocated share of expenses incurred for the period, up to a maximum annual rate of 0.25% of the average daily net assets of Class A shares. The Fund, pursuant to the Class C and Class R Plans, pays IDI compensation at the annual rate of 1.00% of the average daily net assets of Class C shares and 0.50% of the average daily net assets of Class R shares. The fees are accrued daily and paid monthly. Of the Plan payments, up to 0.25% of the average daily net assets of each class of shares may be paid to furnish continuing personal shareholder services to customers who purchase and own shares of such classes. Any amounts not paid as a service fee under the Plans would constitute an asset-based sales charge. Rules of the Financial Industry Regulatory Authority (“FINRA”) impose a cap on the total sales charges, including asset-based sales charges, that may be paid by any class of shares of the Fund. For the year ended December 31, 2022, expenses incurred under the Plans are shown in the Statement of Operations as Distribution fees.
Front-end sales commissions and CDSC (collectively, the “sales charges”) are not recorded as expenses of the Fund. Front-end sales commissions are deducted from proceeds from the sales of Fund shares prior to investment in Class A shares of the Fund. CDSC are deducted from redemption proceeds prior to remittance to the shareholder. During the year ended December 31, 2022, IDI advised the Fund that IDI retained $ 77,607 in front-end sales commissions from the sale of Class A shares and $795 and $1,160 from Class A and Class C shares, respectively, for CDSC imposed upon redemptions by shareholders.
For the year ended December 31, 2022, the Fund incurred $1,665 in brokerage commissions with Invesco Capital Markets, Inc., an affiliate of the Adviser and IDI, for portfolio transactions executed on behalf of the Fund.
Certain officers and trustees of the Trust are officers and directors of the Adviser, IIS and/or IDI.
NOTE 3–Additional Valuation Information
GAAP defines fair value as the price that would be received to sell an asset or paid to transfer a liability in an orderly transaction between market participants at the measurement date, under current market conditions. GAAP establishes a hierarchy that prioritizes the inputs to valuation methods, giving the highest priority to readily available unadjusted quoted prices in an active market for identical assets (Level 1) and the lowest priority to significant unobservable inputs (Level 3), generally when market prices are not readily available. Based on the valuation inputs, the securities or other investments are tiered into one of three levels. Changes in valuation methods may result in transfers in or out of an investment’s assigned level:
| Level 1 – | Prices are determined using quoted prices in an active market for identical assets. | |
| Level 2 – | Prices are determined using other significant observable inputs. Observable inputs are inputs that other market participants may use in pricing a security. These may include quoted prices for similar securities, interest rates, prepayment speeds, credit risk, yield curves, loss severities, default rates, discount rates, volatilities and others. | |
| Level 3 – | Prices are determined using significant unobservable inputs. In situations where quoted prices or observable inputs are unavailable (for example, when there is little or no market activity for an investment at the end of the period), unobservable inputs may be used. Unobservable inputs reflect the Adviser’s assumptions about the factors market participants would use in determining fair value of the securities or instruments and would be based on the best available information. |
The following is a summary of the tiered valuation input levels, as of December 31, 2022. The level assigned to the securities valuations may not be an indication of the risk or liquidity associated with investing in those securities. Because of the inherent uncertainties of valuation, the values reflected in the financial statements may materially differ from the value received upon actual sale of those investments.
| Level 1 | Level 2 | Level 3 | Total | |||||||||||||
| ||||||||||||||||
Investments in Securities | ||||||||||||||||
| ||||||||||||||||
Common Stocks & Other Equity Interests | $ | 1,404,846,228 | $ | – | $– | $ | 1,404,846,228 | |||||||||
| ||||||||||||||||
Money Market Funds | 16,533,089 | 225,488,247 | – | 242,021,336 | ||||||||||||
| ||||||||||||||||
Total Investments | $ | 1,421,379,317 | $ | 225,488,247 | $– | $ | 1,646,867,564 | |||||||||
| ||||||||||||||||
| 18 | Invesco Main Street Small Cap Fund® |
NOTE 4–Expense Offset Arrangement(s)
The expense offset arrangement is comprised of transfer agency credits which result from balances in demand deposit accounts used by the transfer agent for clearing shareholder transactions. For the year ended December 31, 2022, the Fund received credits from this arrangement, which resulted in the reduction of the Fund’s total expenses of $9,153.
NOTE 5–Trustees’ and Officers’ Fees and Benefits
Trustees’ and Officers’ Fees and Benefits include amounts accrued by the Fund to pay remuneration to certain Trustees and Officers of the Fund. Trustees have the option to defer compensation payable by the Fund, and Trustees’ and Officers’ Fees and Benefits also include amounts accrued by the Fund to fund such deferred compensation amounts. Those Trustees who defer compensation have the option to select various Invesco Funds in which their deferral accounts shall be deemed to be invested. Finally, certain current Trustees were eligible to participate in a retirement plan that provided for benefits to be paid upon retirement to Trustees over a period of time based on the number of years of service. The Fund may have certain former Trustees who also participate in a retirement plan and receive benefits under such plan. Trustees’ and Officers’ Fees and Benefits include amounts accrued by the Fund to fund such retirement benefits. Obligations under the deferred compensation and retirement plans represent unsecured claims against the general assets of the Fund.
NOTE 6–Cash Balances
The Fund is permitted to temporarily carry a negative or overdrawn balance in its account with SSB, the custodian bank. Such balances, if any at period-end, are shown in the Statement of Assets and Liabilities under the payable caption Amount due custodian. To compensate the custodian bank for such overdrafts, the overdrawn Fund may either (1) leave funds as a compensating balance in the account so the custodian bank can be compensated by earning the additional interest; or (2) compensate by paying the custodian bank at a rate agreed upon by the custodian bank and Invesco, not to exceed the contractually agreed upon rate. The Fund may not purchase additional securities when any borrowings from banks or broker-dealers exceed 5% of the Fund’s total assets, or when any borrowings from an Invesco Fund are outstanding.
NOTE 7–Distributions to Shareholders and Tax Components of Net Assets
Tax Character of Distributions to Shareholders Paid During the Fiscal Years Ended December 31, 2022 and 2021:
| ||||||
| 2022 | 2021 | |||||
| ||||||
Ordinary income* | $ | 4,167,081 | $ 70,469,063 | |||
| ||||||
Long-term capital gain | – | 54,605,038 | ||||
| ||||||
Return of capital | 759,791 | – | ||||
Total distributions | $ | 4,926,872 | $125,074,101 | |||
| * | Includes short-term capital gain distributions, if any. |
Tax Components of Net Assets at Period-End:
| 2022 | ||||
| ||||
Net unrealized appreciation – investments | $ | 301,109,251 | ||
| ||||
Net unrealized appreciation (depreciation) – foreign currencies | (92 | ) | ||
| ||||
Temporary book/tax differences | (7,502,937 | ) | ||
| ||||
Capital loss carryforward | (88,801,790 | ) | ||
| ||||
Shares of beneficial interest | 1,219,896,104 | |||
| ||||
Total net assets | $ | 1,424,700,536 | ||
| ||||
The difference between book-basis and tax-basis unrealized appreciation (depreciation) is due to differences in the timing of recognition of gains and losses on investments for tax and book purposes. The Fund’s net unrealized appreciation (depreciation) difference is attributable primarily to wash sales and partnerships.
The temporary book/tax differences are a result of timing differences between book and tax recognition of income and/or expenses. The Fund’s temporary book/tax differences are the result of the trustee deferral of compensation and retirement plan benefits.
Capital loss carryforward is calculated and reported as of a specific date. Results of transactions and other activity after that date may affect the amount of capital loss carryforward actually available for the Fund to utilize. The ability to utilize capital loss carryforward in the future may be limited under the Internal Revenue Code and related regulations based on the results of future transactions.
The Fund has a capital loss carryforward as of December 31, 2022, as follows:
| Capital Loss Carryforward* | ||||||||||||
| Expiration | Short-Term | Long-Term | Total | |||||||||
Not subject to expiration | $ | 48,246,091 | $ | 40,555,699 | $ | 88,801,790 | ||||||
| * | Capital loss carryforward is reduced for limitations, if any, to the extent required by the Internal Revenue Code and may be further limited depending upon a variety of factors, including the realization of net unrealized gains or losses as of the date of any reorganization. |
| 19 | Invesco Main Street Small Cap Fund® |
NOTE 8–Investment Transactions
The aggregate amount of investment securities (other than short-term securities, U.S. Government obligations and money market funds, if any) purchased and sold by the Fund during the year ended December 31, 2022 was $535,342,394 and $648,102,862, respectively. Cost of investments, including any derivatives, on a tax basis includes the adjustments for financial reporting purposes as of the most recently completed federal income tax reporting period-end.
| Unrealized Appreciation (Depreciation) of Investments on a Tax Basis | ||||||||
| ||||||||
Aggregate unrealized appreciation of investments | $ | 349,341,793 | ||||||
| ||||||||
Aggregate unrealized (depreciation) of investments | (48,232,542 | ) | ||||||
| ||||||||
Net unrealized appreciation of investments | $ | 301,109,251 | ||||||
| ||||||||
Cost of investments for tax purposes is $1,345,758,313.
NOTE 9–Reclassification of Permanent Differences
Primarily as a result of differing book/tax treatment of partnerships, on December 31, 2022, undistributed net investment income was decreased by $7,700,907, undistributed net realized gain (loss) was increased by $8,689,526 and shares of beneficial interest was decreased by $988,619. This reclassification had no effect on the net assets of the Fund.
NOTE 10–Share Information
| Summary of Share Activity | ||||||||||||||||
| ||||||||||||||||
| Year ended | Year ended | |||||||||||||||
| December 31, 2022(a) | December 31, 2021 | |||||||||||||||
| Shares | Amount | Shares | Amount | |||||||||||||
| ||||||||||||||||
Sold: | ||||||||||||||||
Class A | 2,219,819 | $ | 41,006,882 | 2,905,027 | $ | 62,049,295 | ||||||||||
| ||||||||||||||||
Class C | 330,840 | 5,673,120 | 418,569 | 8,454,536 | ||||||||||||
| ||||||||||||||||
Class R | 614,480 | 11,038,254 | 731,812 | 15,373,505 | ||||||||||||
| ||||||||||||||||
Class Y | 13,356,772 | 245,585,442 | 17,684,044 | 391,590,406 | ||||||||||||
| ||||||||||||||||
Class R5 | 64,975 | 1,215,021 | 355,448 | 7,756,867 | ||||||||||||
| ||||||||||||||||
Class R6 | 2,580,112 | 51,618,286 | 10,003,137 | 224,483,238 | ||||||||||||
| ||||||||||||||||
Issued as reinvestment of dividends: | ||||||||||||||||
Class��A | 8,483 | 154,815 | 1,286,142 | 26,189,851 | ||||||||||||
| ||||||||||||||||
Class C | - | - | 166,709 | 3,189,249 | ||||||||||||
| ||||||||||||||||
Class R | - | - | 201,440 | 4,022,839 | ||||||||||||
| ||||||||||||||||
Class Y | 84,262 | 1,552,097 | 1,795,962 | 36,988,599 | ||||||||||||
| ||||||||||||||||
Class R5 | 2,017 | 36,956 | 27,237 | 554,263 | ||||||||||||
| ||||||||||||||||
Class R6 | 153,034 | 2,826,543 | 2,413,107 | 49,922,746 | ||||||||||||
| ||||||||||||||||
Automatic conversion of Class C shares to Class A shares: | ||||||||||||||||
Class A | 165,697 | 3,055,056 | 164,128 | 3,496,397 | ||||||||||||
| ||||||||||||||||
Class C | (177,972 | ) | (3,055,056 | ) | (174,253 | ) | (3,496,397 | ) | ||||||||
| ||||||||||||||||
Issued in connection with acquisitions:(b) | ||||||||||||||||
Class A | - | - | 9,626,098 | 209,056,866 | ||||||||||||
| ||||||||||||||||
Class C | - | - | 246,598 | 5,051,190 | ||||||||||||
| ||||||||||||||||
Class R | - | - | 564,254 | 12,023,732 | ||||||||||||
| ||||||||||||||||
Class Y | - | - | 2,013,436 | 44,060,733 | ||||||||||||
| ||||||||||||||||
Class R5 | - | - | 793,761 | 17,290,581 | ||||||||||||
| ||||||||||||||||
Class R6 | - | - | 76,583 | 1,680,846 | ||||||||||||
| ||||||||||||||||
| 20 | Invesco Main Street Small Cap Fund® |
| Summary of Share Activity | ||||||||||||||||
| ||||||||||||||||
| Year ended | Year ended | |||||||||||||||
| December 31, 2022(a) | December 31, 2021 | |||||||||||||||
| Shares | Amount | Shares | Amount | |||||||||||||
| ||||||||||||||||
Reacquired: | ||||||||||||||||
Class A | (3,627,922 | ) | $ | (66,667,916 | ) | (3,082,179 | ) | $ | (66,123,268 | ) | ||||||
| ||||||||||||||||
Class C | (414,068 | ) | (7,119,532 | ) | (460,267 | ) | (9,269,063 | ) | ||||||||
| ||||||||||||||||
Class R | (568,184 | ) | (10,339,953 | ) | (530,697 | ) | (11,163,913 | ) | ||||||||
| ||||||||||||||||
Class Y | (10,178,306 | ) | (188,939,646 | ) | (9,046,657 | ) | (198,932,787 | ) | ||||||||
| ||||||||||||||||
Class R5 | (49,055 | ) | (907,680 | ) | (750,585 | ) | (16,115,464 | ) | ||||||||
| ||||||||||||||||
Class R6 | (10,613,106 | ) | (205,617,561 | ) | (14,935,086 | ) | (322,805,783 | ) | ||||||||
| ||||||||||||||||
Net increase (decrease) in share activity | (6,048,122 | ) | $ | (118,884,872 | ) | 22,493,768 | $ | 495,329,064 | ||||||||
| ||||||||||||||||
| (a) | There are entities that are record owners of more than 5% of the outstanding shares of the Fund and in the aggregate own 40% of the outstanding shares of the Fund. IDI has an agreement with these entities to sell Fund shares. The Fund, Invesco and/or Invesco affiliates may make payments to these entities, which are considered to be related to the Fund, for providing services to the Fund, Invesco and/or Invesco affiliates including but not limited to services such as securities brokerage, distribution, third party record keeping and account servicing. The Fund has no knowledge as to whether all or any portion of the shares owned of record by these entities are also owned beneficially. |
In addition, 20% of the outstanding shares of the Fund are owned by the Adviser or an affiliate of the Adviser.
| (b) | After the close of business on April 23, 2021, the Fund acquired all the net assets of Invesco Select Companies Fund (the “Target Fund”) pursuant to a plan of reorganization approved by the Board of Trustees of the Fund on January 22, 2021. The reorganization was executed in order to reduce overlap and increase efficiencies in the Adviser’s product line. The acquisition was accomplished by a tax-free exchange of 13,320,730 shares of the Fund for 17,970,769 shares outstanding of the Target Fund as of the close of business on April 23, 2021. Shares of the Target Fund were exchanged for the like class of shares of the Fund, based on the relative net asset value of the Target Fund to the net asset value of the Fund on the close of business, April 23, 2021. The Target Fund’s net assets as of the close of business on April 23, 2021 of $289,163,948, including $79,421,792 of unrealized appreciation (depreciation), were combined with those of the Fund. The net assets of the Fund immediately before the acquisition were $1,250,800,438 and $1,539,964,385 immediately after the acquisition. |
The pro forma results of operations for the year ended December 31, 2021 assuming the reorganization had been completed on January 1, 2021, the beginning of the annual reporting period are as follows:
Net investment income (loss) | $ | (1,351,555) | ||
| ||||
Net realized/unrealized gains | 308,010,119 | |||
| ||||
Change in net assets resulting from operations | $ | 306,658,564 | ||
| ||||
As the combined investment portfolios have been managed as a single integrated portfolio since the acquisition was completed, it is not practicable to separate the amounts of revenue and earnings of the Target Fund that has been included in the Fund’s Statement of Operations since April 24, 2021.
| 21 | Invesco Main Street Small Cap Fund® |
Report of Independent Registered Public Accounting Firm
To the Board of Trustees of AIM Growth Series (Invesco Growth Series) and Shareholders of Invesco Main Street Small Cap Fund®
Opinion on the Financial Statements
We have audited the accompanying statement of assets and liabilities, including the schedule of investments, of Invesco Main Street Small Cap Fund® (one of the funds constituting AIM Growth Series (Invesco Growth Series), referred to hereafter as the “Fund”) as of December 31, 2022, the related statement of operations for the year ended December 31, 2022, the statement of changes in net assets for each of the two years in the period ended December 31, 2022, including the related notes, and the financial highlights for each of the periods indicated in the table below (collectively referred to as the “financial statements”). In our opinion, the financial statements present fairly, in all material respects, the financial position of the Fund as of December 31, 2022, the results of its operations for the year then ended, the changes in its net assets for each of the two years in the period ended December 31, 2022 and the financial highlights for each of the periods indicated in the table below, in conformity with accounting principles generally accepted in the United States of America.
| Financial Highlights |
For each of the three years in the period ended December 31, 2022 and the eight months ended December 31, 2019 for Class A, Class C, Class R, Class Y and Class R6. For each of the three years in the period ended December 31, 2022 and the period May 24, 2019 (commencement of operations) through December 31, 2019 for Class R5. |
The financial statements of Invesco Oppenheimer Main Street Small Cap Fund® (subsequently renamed Invesco Main Street Small Cap Fund®) as of and for the year ended April 30, 2019 and the financial highlights for each of the periods ended on or prior to April 30, 2019 (not presented herein, other than the financial highlights) were audited by other auditors whose report dated June 25, 2019 expressed an unqualified opinion on those financial statements and financial highlights.
Basis for Opinion
These financial statements are the responsibility of the Fund’s management. Our responsibility is to express an opinion on the Fund’s financial statements based on our audits. We are a public accounting firm registered with the Public Company Accounting Oversight Board (United States) (PCAOB) and are required to be independent with respect to the Fund in accordance with the U.S. federal securities laws and the applicable rules and regulations of the Securities and Exchange Commission and the PCAOB.
We conducted our audits of these financial statements in accordance with the standards of the PCAOB. Those standards require that we plan and perform the audit to obtain reasonable assurance about whether the financial statements are free of material misstatement, whether due to error or fraud.
Our audits included performing procedures to assess the risks of material misstatement of the financial statements, whether due to error or fraud, and performing procedures that respond to those risks. Such procedures included examining, on a test basis, evidence regarding the amounts and disclosures in the financial statements. Our audits also included evaluating the accounting principles used and significant estimates made by management, as well as evaluating the overall presentation of the financial statements. Our procedures included confirmation of securities owned as of December 31, 2022 by correspondence with the custodian, transfer agent and brokers; when replies were not received from brokers, we performed other auditing procedures. We believe that our audits provide a reasonable basis for our opinion.
/s/PricewaterhouseCoopers LLP
Houston, Texas
February 22, 2023
We have served as the auditor of one or more of the investment companies in the Invesco group of investment companies since at least 1995. We have not been able to determine the specific year we began serving as auditor.
| 22 | Invesco Main Street Small Cap Fund® |
Calculating your ongoing Fund expenses
Example
As a shareholder of the Fund, you incur two types of costs: (1) transaction costs, which may include sales charges (loads) on purchase payments or contingent deferred sales charges on redemptions, if any; and (2) ongoing costs, including management fees, distribution and/or service (12b-1) fees, and other Fund expenses. This example is intended to help you understand your ongoing costs (in dollars) of investing in the Fund and to compare these costs with ongoing costs of investing in other mutual funds. The example is based on an investment of $1,000 invested at the beginning of the period and held for the entire period July 1, 2022 through December 31, 2022.
Actual expenses
The table below provides information about actual account values and actual expenses. You may use the information in this table, together with the amount you invested, to estimate the expenses that you paid over the period. Simply divide your account value by $1,000 (for example, an $8,600 account value divided by $1,000 = 8.6), then multiply the result by the number in the table under the heading entitled “Actual Expenses Paid During Period” to estimate the expenses you paid on your account during this period.
Hypothetical example for comparison purposes
The table below also provides information about hypothetical account values and hypothetical expenses based on the Fund’s actual expense ratio and an assumed rate of return of 5% per year before expenses, which is not the Fund’s actual return.
The hypothetical account values and expenses may not be used to estimate the actual ending account balance or expenses you paid for the period. You may use this information to compare the ongoing costs of investing in the Fund and other funds. To do so, compare this 5% hypothetical example with the 5% hypothetical examples that appear in the shareholder reports of the other funds.
Please note that the expenses shown in the table are meant to highlight your ongoing costs only and do not reflect any transaction costs, such as sales charges (loads) on purchase payments or contingent deferred sales charges on redemptions, if any. Therefore, the hypothetical information is useful in comparing ongoing costs only, and will not help you determine the relative total costs of owning different funds. In addition, if these transaction costs were included, your costs would have been higher.
ACTUAL | HYPOTHETICAL (5% annual return before expenses) | |||||||||||
| Beginning Account Value (07/01/22) | Ending Account Value (12/31/22)1 | Expenses Paid During Period2 | Ending Account Value (12/31/22) | Expenses Paid During Period2 | Annualized Ratio | |||||||
Class A | $1,000.00 | $1,053.60 | $5.75 | $1,019.61 | $5.65 | 1.11% | ||||||
Class C | 1,000.00 | 1,049.30 | 9.66 | 1,015.78 | 9.50 | 1.87 | ||||||
Class R | 1,000.00 | 1,051.80 | 7.09 | 1,018.30 | 6.97 | 1.37 | ||||||
Class Y | 1,000.00 | 1,054.50 | 4.51 | 1,020.82 | 4.43 | 0.87 | ||||||
Class R5 | 1,000.00 | 1,055.20 | 3.83 | 1,021.48 | 3.77 | 0.74 | ||||||
Class R6 | 1,000.00 | 1,056.10 | 3.58 | 1,021.73 | 3.52 | 0.69 | ||||||
| 1 | The actual ending account value is based on the actual total return of the Fund for the period July 1, 2022 through December 31, 2022, after actual expenses and will differ from the hypothetical ending account value which is based on the Fund’s expense ratio and a hypothetical annual return of 5% before expenses. |
| 2 | Expenses are equal to the Fund’s annualized expense ratio as indicated above multiplied by the average account value over the period, multiplied by 184/365 to reflect the most recent fiscal half year. |
| 23 | Invesco Main Street Small Cap Fund® |
Form 1099-DIV, Form 1042-S and other year–end tax information provide shareholders with actual calendar year amounts that should be included in their tax returns. Shareholders should consult their tax advisers.
The following distribution information is being provided as required by the Internal Revenue Code or to meet a specific state’s requirement.
The Fund designates the following amounts or, if subsequently determined to be different, the maximum amount allowable for its fiscal year ended December 31, 2022:
Federal and State Income Tax | ||||||||
Qualified Dividend Income* | 87.80 | % | ||||||
Corporate Dividends Received Deduction* | 87.82 | % | ||||||
U.S. Treasury Obligations* | 0.00 | % | ||||||
Qualified Business Income* | 10.57 | % | ||||||
Business Interest Income* | 0.00 | % |
| * | The above percentages are based on ordinary income dividends paid to shareholders during the Fund’s fiscal year. |
| 24 | Invesco Main Street Small Cap Fund® |
The address of each trustee and officer is AIM Growth Series (Invesco Growth Series) (the “Trust”), 11 Greenway Plaza, Suite 1000, Houston, Texas 77046-1173. The trustees serve for the life of the Trust, subject to their earlier death, incapacitation, resignation, retirement or removal as more specifically provided in the Trust’s organizational documents. Each officer serves for a one year term or until their successors are elected and qualified. Column two below includes length of time served with predecessor entities, if any.
Name, Year of Birth and Position(s) Held with the Trust | Trustee Officer Since | Principal Occupation(s) During Past 5 Years | Number of Funds in Fund Complex Overseen by Trustee | Other Directorship(s) Held by Trustee During Past 5 Years | ||||
| Interested Trustee | ||||||||
Martin L. Flanagan1 - 1960 Trustee and Vice Chair | 2007 | Executive Director, Chief Executive Officer and President, Invesco Ltd. (ultimate parent of Invesco and a global investment management firm); Trustee and Vice Chair, The Invesco Funds; Vice Chair, Investment Company Institute; and Member of Executive Board, SMU Cox School of Business
Formerly: Advisor to the Board, Invesco Advisers, Inc. (formerly known as Invesco Institutional (N.A.), Inc.); Chairman and Chief Executive Officer, Invesco Advisers, Inc. (registered investment adviser); Director, Chairman, Chief Executive Officer and President, Invesco Holding Company (US), Inc. (formerly IVZ Inc.) (holding company), Invesco Group Services, Inc. (service provider) and Invesco North American Holdings, Inc. (holding company); Director, Chief Executive Officer and President, Invesco Holding Company Limited (parent of Invesco and a global investment management firm); Director, Invesco Ltd.; Chairman, Investment Company Institute and President, Co-Chief Executive Officer, Co-President, Chief Operating Officer and Chief Financial Officer, Franklin Resources, Inc. (global investment management organization) | 189 | None | ||||
| 1 | Mr. Flanagan is considered an interested person (within the meaning of Section 2(a)(19) of the 1940 Act) of the Trust because he is an officer of the Adviser to the Trust, and an officer and a director of Invesco Ltd., ultimate parent of the Adviser. |
| T-1 | Invesco Main Street Small Cap Fund® |
Trustees and Officers–(continued)
Name, Year of Birth and Position(s) Held with the Trust | Trustee and/or Officer Since | Principal Occupation(s) During Past 5 Years | Number of Funds in Fund Complex Overseen by Trustee | Other Directorship(s) Held by Trustee During Past 5 Years | ||||
| Independent Trustees | ||||||||
Beth Ann Brown - 1968 Trustee (2019) and Chair (August 2022) | 2019 | Independent Consultant
Formerly: Head of Intermediary Distribution, Managing Director, Strategic Relations, Managing Director, Head of National Accounts, Senior Vice President, National Account Manager and Senior Vice President, Key Account Manager, Columbia Management Investment Advisers LLC; Vice President, Key Account Manager, Liberty Funds Distributor, Inc.; and Trustee of certain Oppenheimer Funds | 189 | Director, Board of Directors of Caron Engineering Inc.; Advisor, Board of Advisors of Caron Engineering Inc.; President and Director, Acton Shapleigh Youth Conservation Corps (non-profit) Formerly: President and Director Director of Grahamtastic Connection (non-profit) | ||||
Cynthia Hostetler - 1962 Trustee | 2017 | Non-Executive Director and Trustee of a number of public and private business corporations
Formerly: Director, Aberdeen Investment Funds (4 portfolios); Director, Artio Global Investment LLC (mutual fund complex); Director, Edgen Group, Inc. (specialized energy and infrastructure products distributor); Director, Genesee & Wyoming, Inc. (railroads); Head of Investment Funds and Private Equity, Overseas Private Investment Corporation; President, First Manhattan Bancorporation, Inc.; and Attorney, Simpson Thacher & Bartlett LLP | 189 | Resideo Technologies, Inc. (smart home technology); Vulcan Materials Company (construction materials company); Trilinc Global Impact Fund; Textainer Group Holdings, (shipping container leasing company); Investment Company Institute (professional organization); and Independent Directors Council (professional organization) | ||||
Eli Jones - 1961 Trustee | 2016 | Professor and Dean Emeritus, Mays Business School - Texas A&M University
Formerly: Dean of Mays Business School-Texas A&M University; Professor and Dean, Walton College of Business, University of Arkansas and E.J. Ourso College of Business, Louisiana State University; and Director, Arvest Bank | 189 | Insperity, Inc. (formerly known as Administaff) (human resources provider); and Member of Regional Board of Directors and Board of Directors, First Financial Bancorp (regional bank) | ||||
Elizabeth Krentzman - 1959 Trustee | 2019 | Formerly: Principal and Chief Regulatory Advisor for Asset Management Services and U.S. Mutual Fund Leader of Deloitte & Touche LLP; General Counsel of the Investment Company Institute (trade association); National Director of the Investment Management Regulatory Consulting Practice, Principal, Director and Senior Manager of Deloitte & Touche LLP; Assistant Director of the Division of Investment Management - Office of Disclosure and Investment Adviser Regulation of the U.S. Securities and Exchange Commission and various positions with the Division of Investment Management – Office of Regulatory Policy of the U.S. Securities and Exchange Commission; Associate at Ropes & Gray LLP; and Trustee of certain Oppenheimer Funds | 189 | Formerly: Member of the Cartica Funds Board of Directors (private investment fund); Trustee of the University of Florida National Board Foundation; and Member of the University of Florida Law Center Association, Inc. Board of Trustees, Audit Committee and Membership Committee | ||||
Anthony J. LaCava, Jr. - 1956 Trustee | 2019 | Formerly: Director and Member of the Audit Committee, Blue Hills Bank (publicly traded financial institution) and Managing Partner, KPMG LLP | 189 | Blue Hills Bank; Chairman, Bentley University; Member, Business School Advisory Council; and Nominating Committee, KPMG LLP | ||||
Prema Mathai-Davis - 1950 Trustee | 2001 | Retired
Formerly: Co-Founder & Partner of Quantalytics Research, LLC, (a FinTech Investment Research Platform for the Self-Directed Investor); Trustee of YWCA Retirement Fund; CEO of YWCA of the USA; Board member of the NY Metropolitan Transportation Authority; Commissioner of the NYC Department of Aging; and Board member of Johns Hopkins Bioethics Institute | 189 | Member of Board of Positive Planet US (non-profit) and HealthCare Chaplaincy Network (non-profit) | ||||
| T-2 | Invesco Main Street Small Cap Fund® |
Trustees and Officers–(continued)
Name, Year of Birth and Position(s) Held with the Trust | Trustee and/or Officer Since | Principal Occupation(s) During Past 5 Years | Number of Funds in Fund Complex Overseen by Trustee | Other Directorship(s) Held by Trustee During Past 5 Years | ||||
| Independent Trustees—(continued) | ||||||||
Joel W. Motley - 1952 Trustee | 2019 | Director of Office of Finance, Federal Home Loan Bank System; Managing Director of Carmona Motley Inc. (privately held financial advisor); Member of the Council on Foreign Relations and its Finance and Budget Committee; Chairman Emeritus of Board of Human Rights Watch and Member of its Investment Committee; and Member of Investment Committee Board of Historic Hudson Valley (non-profit cultural organization); Member of the Board, Blue Ocean Acquisition Corp.; and Member of the Vestry and the Investment Committee of Trinity Church Wall Street.
Formerly: Managing Director of Public Capital Advisors, LLC (privately held financial advisor); Managing Director of Carmona Motley Hoffman, Inc. (privately held financial advisor); Trustee of certain Oppenheimer Funds; and Director of Columbia Equity Financial Corp. (privately held financial advisor) | 189 | Member of Board of Trust for Mutual Understanding (non-profit promoting the arts and environment); Member of Board of Greenwall Foundation (bioethics research foundation) and its Investment Committee; Member of Board of Friends of the LRC (non-profit legal advocacy); and Board Member and Investment Committee Member of Pulitzer Center for Crisis Reporting (non-profit journalism) | ||||
Teresa M. Ressel - 1962 Trustee | 2017 | Non-executive director and trustee of a number of public and private business corporations
Formerly: Chief Executive Officer, UBS Securities LLC (investment banking); Chief Operating Officer, UBS AG Americas (investment banking); Sr. Management Team Olayan America, The Olayan Group (international investor/commercial/industrial); Assistant Secretary for Management & Budget and Designated Chief Financial Officer, U.S. Department of Treasury and Director, ON Semiconductor Corporation (semiconductor manufacturing) | 189 | None | ||||
Robert C. Troccoli - 1949 Trustee | 2016 | Retired
Formerly: Adjunct Professor, University of Denver – Daniels College of Business; and Managing Partner, KPMG LLP | 189 | None | ||||
Daniel S. Vandivort - 1954 Trustee | 2019 | President, Flyway Advisory Services LLC (consulting and property management)
Formerly: President and Chief Investment Officer, previously Head of Fixed Income, Weiss Peck and Greer/Robeco Investment Management; Trustee and Chair, Weiss Peck and Greer Funds Board; and various capacities at CS First Boston including Head of Fixed Income at First Boston Asset Management. | 189 | Formerly: Trustee and Governance Chair, Oppenheimer Funds; Treasurer, Chairman of the Audit and Finance Committee, Huntington Disease Foundation of America | ||||
| T-3 | Invesco Main Street Small Cap Fund® |
Trustees and Officers–(continued)
Name, Year of Birth and Position(s) Held with the Trust | Trustee and/or Officer Since | Principal Occupation(s) During Past 5 Years | Number of Funds in Fund Complex Overseen by Trustee | Other Directorship(s) Held by Trustee During Past 5 Years | ||||
| Officers | ||||||||
Sheri Morris - 1964 President and Principal Executive Officer | 1999 | Director, Invesco Trust Company; Head of Global Fund Services, Invesco Ltd.; President and Principal Executive Officer, The Invesco Funds; Vice President, Invesco Exchange-Traded Fund Trust, Invesco Exchange-Traded Fund Trust II, Invesco India Exchange-Traded Fund Trust, Invesco Actively Managed Exchange-Traded Fund Trust, Invesco Actively Managed Exchange-Traded Commodity Fund Trust and Invesco Exchange-Traded Self-Indexed Fund Trust; and Vice President, OppenheimerFunds, Inc.
Formerly: Vice President, Treasurer and Principal Financial Officer, The Invesco Funds; Vice President, Invesco AIM Advisers, Inc., Invesco AIM Capital Management, Inc. and Invesco AIM Private Asset Management, Inc.; Assistant Vice President and Assistant Treasurer, The Invesco Funds; Vice President and Assistant Vice President, Invesco Advisers, Inc.; Assistant Vice President, Invesco AIM Capital Management, Inc. and Invesco AIM Private Asset Management, Inc.; Treasurer, Invesco Exchange-Traded Fund Trust, Invesco Exchange-Traded Fund Trust II, Invesco India Exchange-Traded Fund Trust and Invesco Actively Managed Exchange-Traded Fund Trust; and Senior Vice President, Invesco Advisers, Inc. (formerly known as Invesco Institutional (N.A.), Inc.) (registered investment adviser) | N/A | N/A | ||||
Jeffrey H. Kupor - 1968 Senior Vice President, Chief Legal Officer and Secretary | 2018 | Head of Legal of the Americas, Invesco Ltd.; Senior Vice President and Secretary, Invesco Advisers, Inc. (formerly known as Invesco Institutional (N.A.), Inc.) (registered investment adviser); Secretary, Invesco Distributors, Inc. (formerly known as Invesco AIM Distributors, Inc.); Vice President and Secretary, Invesco Investment Services, Inc. (formerly known as Invesco AIM Investment Services, Inc.); Senior Vice President, Chief Legal Officer and Secretary, The Invesco Funds; Secretary and General Counsel, Invesco Investment Advisers LLC (formerly known as Van Kampen Asset Management); Secretary and General Counsel, Invesco Capital Markets, Inc. (formerly known as Van Kampen Funds Inc.); Chief Legal Officer, Invesco Exchange-Traded Fund Trust, Invesco Exchange-Traded Fund Trust II, Invesco India Exchange-Traded Fund Trust, Invesco Actively Managed Exchange-Traded Fund Trust, Invesco Actively Managed Exchange-Traded Commodity Fund Trust and Invesco Exchange-Traded Self-Indexed Fund Trust;; Secretary and Vice President, Harbourview Asset Management Corporation; Secretary and Vice President, OppenheimerFunds, Inc. and Invesco Managed Accounts, LLC; Secretary and Senior Vice President, OFI Global Institutional, Inc.; Secretary and Vice President, OFI SteelPath, Inc.; Secretary and Vice President, Oppenheimer Acquisition Corp.; Secretary and Vice President, Shareholder Services, Inc.; and Secretary and Vice President, Trinity Investment Management Corporation
Formerly: Senior Vice President, Invesco Distributors, Inc.; Secretary and Vice President, Jemstep, Inc.; Head of Legal, Worldwide Institutional, Invesco Ltd.; Secretary and General Counsel, INVESCO Private Capital Investments, Inc.; Senior Vice President, Secretary and General Counsel, Invesco Management Group, Inc. (formerly known as Invesco AIM Management Group, Inc.); Assistant Secretary, INVESCO Asset Management (Bermuda) Ltd.; Secretary and General Counsel, Invesco Private Capital, Inc.;Assistant Secretary and General Counsel, INVESCO Realty, Inc.; Secretary and General Counsel, Invesco Senior Secured Management, Inc.; Secretary, Sovereign G./P. Holdings Inc.; Secretary, Invesco Indexing LLC; and Secretary, W.L. Ross & Co., LLC | N/A | N/A | ||||
Andrew R. Schlossberg - 1974 Senior Vice President | 2019 | Senior Vice President, Invesco Group Services, Inc.; Head of the Americas and Senior Managing Director, Invesco Ltd.; Director and Senior Vice President, Invesco Advisers, Inc. (formerly known as Invesco Institutional (N.A.), Inc.) (registered investment adviser); Director and Chairman, Invesco Investment Services, Inc. (formerly known as Invesco AIM Investment Services, Inc.) (registered transfer agent); Senior Vice President, The Invesco Funds; and Director, Invesco Investment Advisers LLC (formerly known as Van Kampen Asset Management)
Formerly: Director, President and Chairman, Invesco Insurance Agency, Inc.; Director, Invesco UK Limited; Director and Chief Executive, Invesco Asset Management Limited and Invesco Fund Managers Limited; Assistant Vice President, The Invesco Funds; Senior Vice President, Invesco Advisers, Inc. (formerly known as Invesco Institutional (N.A.), Inc.) (registered investment adviser); Director and Chief Executive, Invesco Administration Services Limited and Invesco Global Investment Funds Limited; Director, Invesco Distributors, Inc.; Head of EMEA, Invesco Ltd.; President, Invesco Actively Managed Exchange-Traded Commodity Fund Trust, Invesco Actively Managed Exchange-Traded Fund Trust, Invesco Exchange-Traded Fund Trust, Invesco Exchange-Traded Fund Trust II and Invesco India Exchange-Traded Fund Trust; and Managing Director and Principal Executive Officer, Invesco Capital Management LLC | N/A | N/A | ||||
| T-4 | Invesco Main Street Small Cap Fund® |
Trustees and Officers–(continued)
Name, Year of Birth and Position(s) Held with the Trust | Trustee and/or Officer Since | Principal Occupation(s) During Past 5 Years | Number of Funds in Fund Complex Overseen by Trustee | Other Directorship(s) Held by Trustee During Past 5 Years | ||||
| Officers—(continued) | ||||||||
John M. Zerr - 1962 Senior Vice President | 2006 | Chief Operating Officer of the Americas; Senior Vice President, Invesco Advisers, Inc. (formerly known as Invesco Institutional (N.A.), Inc.) (registered investment adviser); Senior Vice President, Invesco Distributors, Inc. (formerly known as Invesco AIM Distributors, Inc.); Director and Vice President, Invesco Investment Services, Inc. (formerly known as Invesco AIM Investment Services, Inc.) Senior Vice President, The Invesco Funds; Managing Director, Invesco Capital Management LLC; Director, Invesco Investment Advisers LLC (formerly known as Van Kampen Asset Management); Senior Vice President, Invesco Capital Markets, Inc. (formerly known as Van Kampen Funds Inc.); Manager, Invesco Indexing LLC; Manager, Invesco Specialized Products, LLC; Member, Invesco Canada Funds Advisory Board; Director, President and Chief Executive Officer, Invesco Corporate Class Inc. (corporate mutual fund company); and Director, Chairman, President and Chief Executive Officer, Invesco Canada Ltd. (formerly known as Invesco Trimark Ltd./Invesco Trimark Ltèe) (registered investment adviser and registered transfer agent); President, Invesco, Inc.; President, Invesco Global Direct Real Estate Feeder GP Ltd.; President, Invesco IP Holdings (Canada) Ltd; President, Invesco Global Direct Real Estate GP Ltd.; President, Invesco Financial Services Ltd. / Services Financiers Invesco Ltée; and Director and Chairman, Invesco Trust Company
Formerly: President, Trimark Investments Ltd/Services Financiers Invesco Ltee; Director and Senior Vice President, Invesco Insurance Agency, Inc.; Director and Senior Vice President, Invesco Management Group, Inc. (formerly known as Invesco AIM Management Group, Inc.); Secretary and General Counsel, Invesco Management Group, Inc. (formerly known as Invesco AIM Management Group, Inc.); Secretary, Invesco Investment Services, Inc. (formerly known as Invesco AIM Investment Services, Inc.); Chief Legal Officer and Secretary, The Invesco Funds; Secretary and General Counsel, Invesco Investment Advisers LLC (formerly known as Van Kampen Asset Management); Secretary and General Counsel, Invesco Capital Markets, Inc. (formerly known as Van Kampen Funds Inc.); Chief Legal Officer, Invesco Exchange-Traded Fund Trust, Invesco Exchange-Traded Fund Trust II, Invesco India Exchange-Traded Fund Trust, Invesco Actively Managed Exchange-Traded Fund Trust, Invesco Actively Managed Exchange-Traded Commodity Fund Trust and Invesco Exchange-Traded Self-Indexed Fund Trust; Secretary, Invesco Indexing LLC; Director, Secretary, General Counsel and Senior Vice President, Van Kampen Exchange Corp.; Director, Vice President and Secretary, IVZ Distributors, Inc. (formerly known as INVESCO Distributors, Inc.); Director and Vice President, INVESCO Funds Group, Inc.; Director and Vice President, Van Kampen Advisors Inc.; Director, Vice President, Secretary and General Counsel, Van Kampen Investor Services Inc.;Director and Secretary, Invesco Distributors, Inc. (formerly known as Invesco AIM Distributors, Inc.); Director, Senior Vice President, General Counsel and Secretary, Invesco AIM Advisers, Inc. and Van Kampen Investments Inc.; Director, Vice President and Secretary, Fund Management Company; Director, Senior Vice President, Secretary, General Counsel and Vice President, Invesco AIM Capital Management, Inc.; and Chief Operating Officer and General Counsel, Liberty Ridge Capital, Inc. (an investment adviser) | N/A | N/A | ||||
Gregory G. McGreevey -1962 Senior Vice President | 2012 | Senior Managing Director, Invesco Ltd.; Director, Chairman, President, and Chief Executive Officer, Invesco Advisers, Inc. (formerly known as Invesco Institutional (N.A.), Inc.) (registered investment adviser); Director, Invesco Mortgage Capital, Inc. and Invesco Senior Secured Management, Inc.; Senior Vice President, The Invesco Funds; President, SNW Asset Management Corporation and Invesco Managed Accounts, LLC; Chairman and Director, Invesco Private Capital, Inc.; Chairman and Director, INVESCO Private Capital Investments, Inc.; Chairman and Director, INVESCO Realty, Inc.; and Senior Vice President, Invesco Group Services, Inc.
Formerly: Senior Vice President, Invesco Management Group, Inc. and Invesco Advisers, Inc.; Assistant Vice President, The Invesco Funds | N/A | N/A | ||||
Adrien Deberghes -1967 Principal Financial Officer, Treasurer and Vice President | 2020 | Head of the Fund Office of the CFO and Fund Administration; Vice President, Invesco Advisers, Inc.; Principal Financial Officer, Treasurer and Vice President, The Invesco Funds; Vice President, Invesco Exchange-Traded Fund Trust, Invesco Exchange-Traded Fund Trust II, Invesco India Exchange-Traded Fund Trust, Invesco Actively Managed Exchange-Traded Fund Trust, Invesco Actively Managed Exchange-Traded Commodity Fund Trust and Invesco Exchange-Traded Self-Indexed Fund Trust
Formerly: Senior Vice President and Treasurer, Fidelity Investments | N/A | N/A | ||||
Crissie M. Wisdom - 1969 Anti-Money Laundering Compliance Officer | 2013 | Anti-Money Laundering and OFAC Compliance Officer for Invesco U.S. entities including: Invesco Advisers, Inc. and its affiliates, Invesco Capital Markets, Inc., Invesco Distributors, Inc., Invesco Investment Services, Inc., The Invesco Funds, Invesco Capital Management, LLC, Invesco Trust Company; and Fraud Prevention Manager for Invesco Investment Services, Inc. | N/A | N/A | ||||
| T-5 | Invesco Main Street Small Cap Fund® |
Trustees and Officers–(continued)
Name, Year of Birth and Position(s) Held with the Trust | Trustee and/or Officer Since | Principal Occupation(s) During Past 5 Years | Number of Funds in Fund Complex Overseen by Trustee | Other Directorship(s) Held by Trustee During Past 5 Years | ||||
| Officers—(continued) | ||||||||
Todd F. Kuehl - 1969 Chief Compliance Officer and Senior Vice President | 2020 | Chief Compliance Officer, Invesco Advisers, Inc. (registered investment adviser); and Chief Compliance Officer and Senior Vice President, The Invesco Funds
Formerly: Managing Director and Chief Compliance Officer, Legg Mason (Mutual Funds); Chief Compliance Officer, Legg Mason Private Portfolio Group (registered investment adviser) | N/A | N/A | ||||
James Bordewick, Jr. - 1959 Senior Vice President and Senior Officer | 2022 | Senior Vice President and Senior Officer, The Invesco Funds Formerly: Chief Legal Officer, KingsCrowd, Inc. (research and analytical platform for investment in private capital markets); Chief Operating Officer and Head of Legal and Regulatory, Netcapital (private capital investment platform); Managing Director, General Counsel of asset management and Chief Compliance Officer for asset management and private banking, Bank of America Corporation; Chief Legal Officer, Columbia Funds and BofA Funds;
Senior Vice President and Associate General Counsel, MFS Investment Management; Chief Legal Officer, MFS Funds; Associate, Ropes & Gray; and Associate, Gaston Snow & Ely Bartlett | N/A | N/A | ||||
| Office of the Fund | Investment Adviser | Distributor | Auditors | |||
| 11 Greenway Plaza, Suite 1000 | Invesco Advisers, Inc. | Invesco Distributors, Inc. | PricewaterhouseCoopers LLP | |||
| Houston, TX 77046-1173 | 1555 Peachtree Street, N.E. | 11 Greenway Plaza, Suite 1000 | 1000 Louisiana Street, Suite 5800 | |||
| Atlanta, GA 30309 | Houston, TX 77046-1173 | Houston, TX 77002-5021 | ||||
| Counsel to the Fund | Counsel to the Independent Trustees | Transfer Agent | Custodian | |||
| Stradley Ronon Stevens & Young, LLP | Sidley Austin LLP | Invesco Investment Services, Inc. | State Street Bank and Trust Company | |||
| 2005 Market Street, Suite 2600 | 787 Seventh Avenue | 11 Greenway Plaza, Suite 1000 | 225 Franklin Street | |||
| Philadelphia, PA 19103-7018 | New York, NY 10019 | Houston, TX 77046-1173 | Boston, MA 02110-2801 | |||
| T-6 | Invesco Main Street Small Cap Fund® |
(This page intentionally left blank)

Go paperless with eDelivery
Visit invesco.com/edelivery to enjoy the convenience and security of anytime electronic access to your investment documents.
With eDelivery, you can elect to have any or all of the following materials delivered straight to your inbox to download, save and print from your own computer:
∎ Fund reports and prospectuses
∎ Quarterly statements
∎ Daily confirmations
∎ Tax forms
Invesco mailing information
Send general correspondence to Invesco Investment Services, Inc., P.O. Box 219078, Kansas City, MO 64121-9078.
Important notice regarding delivery of security holder documents
To reduce Fund expenses, only one copy of most shareholder documents may be mailed to shareholders with multiple accounts at the same address (Householding). Mailing of your shareholder documents may be householded indefinitely unless you instruct us otherwise. If you do not want the mailing of these documents to be combined with those for other members of your household, please contact Invesco Investment Services, Inc. at 800 959 4246 or contact your financial institution. We will begin sending you individual copies for each account within 30 days after receiving your request.
Fund holdings and proxy voting information
The Fund provides a complete list of its portfolio holdings four times each year, at the end of each fiscal quarter. For the second and fourth quarters, the list appears, respectively, in the Fund’s semiannual and annual reports to shareholders. For the first and third quarters, the Fund files the list with the Securities and Exchange Commission (SEC) as an exhibit to its reports on Form N-PORT. The most recent list of portfolio holdings is available at invesco.com/completeqtrholdings. Shareholders can also look up the Fund’s Form N-PORT filings on the SEC website, sec.gov. The SEC file numbers for the Fund are shown below.
A description of the policies and procedures that the Fund uses to determine how to vote proxies relating to portfolio securities is available without charge, upon request, from our Client Services department at 800 959 4246, or at invesco.com/ corporate/about-us/esg. The information is also available on the SEC website, sec.gov.
Information regarding how the Fund voted proxies related to its portfolio securities during the most recent 12-month period ended June 30 is available at invesco.com/proxysearch. This information is also available on the SEC website, sec.gov.
Invesco Advisers, Inc. is an investment adviser; it provides investment advisory services to individual and institutional clients and does not sell securities. Invesco Distributors, Inc. is the US distributor for Invesco Ltd.’s retail mutual funds, exchange-traded funds and institutional money market funds. Both are wholly owned, indirect subsidiaries of Invesco Ltd.

| SEC file number(s): 811-02699 and 002-57526 | Invesco Distributors, Inc. | O-MSS-AR-1 |
| ||||
 | Annual Report to Shareholders | December 31, 2022 | ||
Invesco Peak Retirement™ Funds Invesco Peak Retirement™ Destination Fund Invesco Peak Retirement™ 2010 Fund Invesco Peak Retirement™ 2015 Fund Invesco Peak Retirement™ 2020 Fund Invesco Peak Retirement™ 2025 Fund Invesco Peak Retirement™ 2030 Fund Invesco Peak Retirement™ 2035 Fund Invesco Peak Retirement™ 2040 Fund Invesco Peak Retirement™ 2045 Fund Invesco Peak Retirement™ 2050 Fund Invesco Peak Retirement™ 2055 Fund Invesco Peak Retirement™ 2060 Fund Invesco Peak Retirement™ 2065 Fund | ||||
| 4 | ||||
| 4 | ||||
| 17 | ||||
| 43 | ||||
| 45 | ||||
| 71 | ||||
| 87 | ||||
| 100 | ||||
| 116 | ||||
| 117 | ||||
| 122 | ||||
| 123 | ||||
| T-1 | ||||
| 2 |
Market in review
Global equity markets declined in the first half of 2022 amid volatility sparked by Russia’s invasion of Ukraine, rising commodity prices, rampant global inflation and central banks shifting toward tighter monetary policy. Russia’s invasion exacerbated inflationary pressures, disrupting already strained supply chains, and increasing shortages of oil, gas and raw materials, with the price of oil rising sharply.
Inflation headwinds continued into the third quarter of 2022. The US Federal Reserve (the Fed), the European Central Bank and the Bank of England all raised interest rates. In contrast, the People’s Bank of China lowered its policy rate and the Bank of Japan kept rates the same. Emerging market equities, hampered by the strong US dollar, underperformed developed market equities.
Global equity markets posted gains for the fourth quarter of 2022, after better inflation data sparked a rally in October and November. However, investor sentiment worsened in December after central banks signaled continued interest rate hikes into 2023 as inflation remained above target levels. International stocks outperformed US stocks in the fourth quarter, led by results in Europe and the UK. Emerging market equities also posted gains for the fourth quarter of 2022, boosted by China, which eased its zero-COVID-19 policy and started to reopen even as COVID-19 infections surged.
Despite the rebound in the fourth quarter of 2022, at the end of the fiscal year ended December 31, 2022, trailing one-year returns for developed market equities and emerging market equities were both in negative territory.
| 3 | Invesco Peak Retirement™ Funds |
Management’s Discussion of Fund Performance
Market conditions and your Fund
Strategic asset class exposures in the Fund are obtained through underlying representative mutual funds and exchange-traded funds targeting a predefined date of retirement. From an absolute performance perspective, the portfolio’s cash allocation was the leading contributor to positive performance. The remaining allocations to equity, fixed income and alternative assets were all detractors from absolute performance as the portfolio produced a negative return for the fiscal year ended December 31, 2022.
From a relative performance perspective, the portfolio outperformed its style-specific benchmark during the fiscal year. Outperformance was driven mainly by style selection within the US equity allocation. Within the allocation, the Invesco S&P 500 High Dividend Low Volatility ETF and Invesco S&P 500 Enhanced Value ETF were the primary contributors.
Conversely, allocations to alternative assets and fixed income were the leading detractors to relative performance during the fiscal year. Within the allocation, the Invesco Taxable Municipal Bond ETF and Invesco Global Real Estate Income Fund were the leading detractors.
| Fund Nasdaq Symbols | ||||
Class A | PKTSX | |||
Class C | PKTTX | |||
Class R | PKTVX | |||
Class Y | PKTUX | |||
Class R5 | PKTWX | |||
Class R6 | PKTZX |
Please note that some of the Fund’s underlying funds use derivatives, including futures and total return swaps, which may create economic leverage in the underlying funds. Therefore, some of the performance of the strategy, both positive and negative, can be attributed to these instruments. Derivatives can be a cost-effective way to gain exposure to asset classes. However, derivatives may amplify traditional investment risks through the creation of leverage and may be less liquid than traditional securities.
Additionally, after careful consideration, the Board of Trustees approved the liquidation and termination of the Invesco Peak Retirement™ Fund Suite to occur on or about January 23, 2023. Thank you for your investment in the Invesco Peak Retirement™ Destination Fund.
Portfolio manager(s):
Jeffrey Bennett
Jacob Borbidge
Duy Nguyen
The views and opinions expressed in management’s discussion of Fund performance are those of Invesco Advisers, Inc. and its affiliates. These views
and opinions are subject to change at any time based on factors such as market and economic conditions. These views and opinions may not be relied upon as investment advice or recommendations, or as an offer for a particular security. The information is not a complete analysis of every aspect of any market, country, industry, security or the Fund. Statements of fact are from sources considered reliable, but Invesco Advisers, Inc. makes no representation or warranty as to their completeness or accuracy. Although historical performance is no guarantee of future results, these insights may help you understand our investment management philosophy.
See important Fund and, if applicable, index disclosures later in this report.
| 4 | Invesco Peak Retirement™ Funds |
Management’s Discussion of Fund Performance
Performance summary - Invesco Peak Retirement™ 2010 Fund
For the year ended December 31, 2022, Class A shares of Invesco Peak Retirement™ 2010 Fund (the Fund), at net asset value (NAV), outperformed the Custom Invesco Peak Retirement 2010 Benchmark, the Fund’s style-specific benchmark. Your Fund’s long-term performance appears later in this report.
|
| |||
Fund vs. Indexes Total returns, 12/31/21 to 12/31/22, at net asset value (NAV). Performance shown does not include applicable contingent deferred sales charges (CDSC) or front-end sales charges, which would have reduced performance. |
| |||
Class A Shares | -10.54 | % | ||
Class C Shares | -11.25 | |||
Class R Shares | -10.70 | |||
Class Y Shares | -10.34 | |||
Class R5 Shares | -10.34 | |||
Class R6 Shares | -10.34 | |||
Bloomberg U.S. Aggregate Bond Indexq (Broad Market Index) | -13.01 | |||
Custom Invesco Peak Retirement 2010 Benchmark∎ (Style-Specific Index) | -13.86 | |||
Source(s): qRIMES Technologies Corp.; ∎Invesco, RIMES Technologies Corp. | ||||
Market conditions and your Fund
Strategic asset class exposures in the Fund are obtained through underlying representative mutual funds and exchange-traded funds targeting a predefined date of retirement. From an absolute performance perspective, the portfolio’s cash allocation was the leading contributor to positive performance. The remaining allocations to equity, fixed income and alternative assets were all detractors from absolute performance as the portfolio produced a negative return for the fiscal year ended December 31, 2022.
From a relative performance perspective, the portfolio outperformed its style-specific benchmark during the fiscal year. Outperformance was driven mainly by style selection within the US equity allocation. Within the allocation, the Invesco S&P 500 High Dividend Low Volatility ETF and Invesco S&P 500 Enhanced Value ETF were the primary contributors.
Conversely, allocations to alternative assets and fixed income were the leading detractors to relative performance during the fiscal year. Within the allocation, the Invesco Taxable Municipal Bond ETF, Invesco Global Real Estate Income Fund and Invesco Core Plus Bond Fund were the leading detractors.
| Fund Nasdaq Symbols | ||
Class A | PKAFX | |
Class C | PKCFX | |
Class R | PEKRX | |
Class Y | PKYFX | |
Class R5 | PEKMX | |
Class R6 | PEKNX | |
Please note that some of the Fund’s underlying funds use derivatives, including futures and total return swaps, which may create economic leverage in the underlying funds. Therefore, some of the performance of the strategy, both positive and negative, can be attributed to these instruments. Derivatives can be a cost-effective way to gain exposure to asset classes. However, derivatives may amplify traditional investment risks through the creation of leverage and may be less liquid than traditional securities.
Additionally, after careful consideration, the Board of Trustees approved the liquidation and termination of the Invesco Peak Retirement™ Fund Suite to occur on or about January 23, 2023. Thank you for your investment in the Invesco Peak Retirement™ 2010 Fund.
Portfolio manager(s):
Jeffrey Bennett
Jacob Borbidge
Duy Nguyen
The views and opinions expressed in management’s discussion of Fund performance are those of Invesco Advisers, Inc. and its affiliates. These views and opinions are subject to change at any time based on factors such as market and economic conditions. These views and opinions may not be
relied upon as investment advice or recommendations, or as an offer for a particular security. The information is not a complete analysis of every aspect of any market, country, industry, security or the Fund. Statements of fact are from sources considered reliable, but Invesco Advisers, Inc. makes no representation or warranty as to their completeness or accuracy. Although historical performance is no guarantee of future results, these insights may help you understand our investment management philosophy.
See important Fund and, if applicable, index disclosures later in this report.
| 5 | Invesco Peak Retirement™ Funds |
Management’s Discussion of Fund Performance
Performance summary - Invesco Peak Retirement™ 2015 Fund
For the year ended December 31, 2022, Class A shares of Invesco Peak Retirement™ 2015 Fund (the Fund), at net asset value (NAV), outperformed the Custom Invesco Peak Retirement 2015 Benchmark, the Fund’s style-specific benchmark. Your Fund’s long-term performance appears later in this report.
|
| |||
Fund vs. Indexes Total returns, 12/31/21 to 12/31/22, at net asset value (NAV). Performance shown does not include applicable contingent deferred sales charges (CDSC) or front-end sales charges, which would have reduced performance. |
| |||
Class A Shares | -10.55 | % | ||
Class C Shares | -11.26 | |||
Class R Shares | -10.79 | |||
Class Y Shares | -10.28 | |||
Class R5 Shares | -10.28 | |||
Class R6 Shares | -10.28 | |||
Bloomberg U.S. Aggregate Bond Indexq (Broad Market Index) | -13.01 | |||
Custom Invesco Peak Retirement 2015 Benchmark∎ (Style-Specific Index) | -13.95 | |||
Source(s): qRIMES Technologies Corp.; ∎Invesco, RIMES Technologies Corp. | ||||
Market conditions and your Fund
Strategic asset class exposures in the Fund are obtained through underlying representative mutual funds and exchange-traded funds targeting a predefined date of retirement. From an absolute performance perspective, the portfolio’s cash allocation was the leading contributor to positive performance. The remaining allocations to equity, fixed income and alternative assets were all detractors from absolute performance as the portfolio produced a negative return for the fiscal year ended December 31, 2022.
From a relative performance perspective, the portfolio outperformed its style-specific benchmark during the fiscal year. Outperformance was driven mainly by style selection within the US equity allocation. Within the allocation, the Invesco S&P 500 High Dividend Low Volatility ETF and Invesco S&P 500 Enhanced Value ETF were the primary contributors.
Conversely, allocations to alternative assets and fixed income were the leading detractors to relative performance during the fiscal year. Within the allocation, the Invesco Taxable Municipal Bond ETF, Invesco Global Real Estate Income Fund and Invesco Core Plus Bond Fund were the leading detractors.
| Fund Nasdaq Symbols | ||
Class A | PKTMX | |
Class C | PKTNX | |
Class R | PKTPX | |
Class Y | PKTOX | |
Class R5 | PKTQX | |
Class R6 | PKTRX | |
Please note that some of the Fund’s underlying funds use derivatives, including futures and total return swaps, which may create economic leverage in the underlying funds. Therefore, some of the performance of the strategy, both positive and negative, can be attributed to these instruments. Derivatives can be a cost-effective way to gain exposure to asset classes. However, derivatives may amplify traditional investment risks through the creation of leverage and may be less liquid than traditional securities.
Additionally, after careful consideration, the Board of Trustees approved the liquidation and termination of the Invesco Peak Retirement™ Fund Suite to occur on or about January 23, 2023. Thank you for your investment in the Invesco Peak Retirement™ 2015 Fund.
Portfolio manager(s):
Jeffrey Bennett
Jacob Borbidge
Duy Nguyen
The views and opinions expressed in management’s discussion of Fund performance are those of Invesco Advisers, Inc. and its affiliates. These views and opinions are subject to change at any time based on factors such as market and economic conditions. These views and opinions may not be
relied upon as investment advice or recommendations, or as an offer for a particular security. The information is not a complete analysis of every aspect of any market, country, industry, security or the Fund. Statements of fact are from sources considered reliable, but Invesco Advisers, Inc. makes no representation or warranty as to their completeness or accuracy. Although historical performance is no guarantee of future results, these insights may help you understand our investment management philosophy.
See important Fund and, if applicable, index disclosures later in this report.
| 6 | Invesco Peak Retirement™ Funds |
Management’s Discussion of Fund Performance
Performance summary - Invesco Peak Retirement™ 2020 Fund
For the year ended December 31, 2022, Class A shares of Invesco Peak Retirement™ 2020 Fund (the Fund), at net asset value (NAV), outperformed the Custom Invesco Peak Retirement 2020 Benchmark, the Fund’s style-specific benchmark. Your Fund’s long-term performance appears later in this report.
|
| |||
Fund vs. Indexes Total returns, 12/31/21 to 12/31/22, at net asset value (NAV). Performance shown does not include applicable contingent deferred sales charges (CDSC) or front-end sales charges, which would have reduced performance. |
| |||
Class A Shares | -12.65 | % | ||
Class C Shares | -13.32 | |||
Class R Shares | -12.83 | |||
Class Y Shares | -12.50 | |||
Class R5 Shares | -12.41 | |||
Class R6 Shares | -12.41 | |||
Bloomberg U.S. Aggregate Bond Indexq (Broad Market Index) | -13.01 | |||
Custom Invesco Peak Retirement 2020 Benchmark∎ (Style-Specific Index) | -14.25 | |||
Source(s): qRIMES Technologies Corp.; ∎Invesco, RIMES Technologies Corp. | ||||
Market conditions and your Fund
Strategic asset class exposures in the Fund are obtained through underlying representative mutual funds and exchange-traded funds targeting a predefined date of retirement. From an absolute performance perspective, the portfolio’s cash allocation was the leading contributor to positive performance. The remaining allocations to equity, fixed income and alternative assets were all detractors from absolute performance as the portfolio produced a negative return for the fiscal year ended December 31, 2022.
From a relative performance perspective, the portfolio outperformed its style-specific benchmark during the fiscal year. Outperformance was driven mainly by style selection within the US equity allocation. Within the allocation, the Invesco S&P 500 High Dividend Low Volatility ETF, Invesco S&P 500 Enhanced Value ETF and Invesco Russell 1000 Dynamic Multifactor ETF were the primary contributors.
Conversely, the allocations to fixed income and non-US developed equity were the leading detractors to relative performance during the fiscal year. Within the allocations, Invesco Core Plus Bond Fund and Invesco International
| Fund Nasdaq Symbols | ||
Class A | PKTGX | |
Class C | PKTHX | |
Class R | PKTJX | |
Class Y | PKTIX | |
Class R5 | PKTKX | |
Class R6 | PKTLX | |
Small-Mid Company Fund were the leading detractors.
Please note that some of the Fund’s underlying funds use derivatives, including futures and total return swaps, which may create economic leverage in the underlying funds. Therefore, some of the performance of the strategy, both positive and negative, can be attributed to these instruments. Derivatives can be a cost-effective way to gain exposure to asset classes. However, derivatives may amplify traditional investment risks through the creation of leverage and may be less liquid than traditional securities.
Additionally, after careful consideration, the Board of Trustees approved the liquidation and termination of the Invesco Peak Retirement™ Fund Suite to occur on or about January 23, 2023. Thank you for your investment in the Invesco Peak Retirement™ 2020 Fund.
Portfolio manager(s):
Jeffrey Bennett
Jacob Borbidge
Duy Nguyen
The views and opinions expressed in management’s discussion of Fund performance are those of Invesco Advisers, Inc. and its affiliates. These views
and opinions are subject to change at any time based on factors such as market and economic conditions. These views and opinions may not be relied upon as investment advice or recommendations, or as an offer for a particular security. The information is not a complete analysis of every aspect of any market, country, industry, security or the Fund. Statements of fact are from sources considered reliable, but Invesco Advisers, Inc. makes no representation or warranty as to their completeness or accuracy. Although historical performance is no guarantee of future results, these insights may help you understand our investment management philosophy.
See important Fund and, if applicable, index disclosures later in this report.
| 7 | Invesco Peak Retirement™ Funds |
Management’s Discussion of Fund Performance
Performance summary - Invesco Peak Retirement™ 2025 Fund
For the year ended December 31, 2022, Class A shares of Invesco Peak Retirement™ 2025 Fund (the Fund), at net asset value (NAV), outperformed the Custom Invesco Peak Retirement 2025 Benchmark, the Fund’s style-specific benchmark. Your Fund’s long-term performance appears later in this report.
|
| |||
Fund vs. Indexes Total returns, 12/31/21 to 12/31/22, at net asset value (NAV). Performance shown does not include applicable contingent deferred sales charges (CDSC) or front-end sales charges, which would have reduced performance. |
| |||
Class A Shares | -15.13 | % | ||
Class C Shares | -15.80 | |||
Class R Shares | -15.37 | |||
Class Y Shares | -14.94 | |||
Class R5 Shares | -14.88 | |||
Class R6 Shares | -14.87 | |||
Bloomberg U.S. Aggregate Bond Indexq (Broad Market Index) | -13.01 | |||
Custom Invesco Peak Retirement 2025 Benchmark∎ (Style-Specific Index) | -15.34 | |||
Source(s): qRIMES Technologies Corp.; ∎Invesco, RIMES Technologies Corp. | ||||
Market conditions and your Fund
Strategic asset class exposures in the Fund are obtained through underlying representative mutual funds and exchange-traded funds targeting a predefined date of retirement. From an absolute performance perspective, the portfolio’s cash allocation was the leading contributor to positive performance. The remaining allocations to equity, fixed income and alternative assets were all detractors from absolute performance as the portfolio produced a negative return for the fiscal year ended December 31, 2022.
From a relative performance perspective, the portfolio outperformed its style-specific benchmark during the fiscal year. The performance was driven mainly by style selection within the US equity allocation and an allocation to floating rate fixed income. Within the allocations, the Invesco Russell 1000 Dynamic Multifactor ETF and Invesco Variable Rate Investment Grade ETF were the primary contributors.
Conversely, the allocations to taxable municipal fixed income and small- and mid-cap equities were the leading detractors to relative performance during the fiscal year. Within the allocations, Invesco Taxable Municipal Bond ETF and Invesco
| Fund Nasdaq Symbols | ||
Class A | PKTAX | |
Class C | PKTBX | |
Class R | PKTDX | |
Class Y | PKTCX | |
Class R5 | PKTEX | |
Class R6 | PKTFX | |
International Small-Mid Company Fund were the leading detractors.
Please note that some of the Fund’s underlying funds use derivatives, including futures and total return swaps, which may create economic leverage in the underlying funds. Therefore, some of the performance of the strategy, both positive and negative, can be attributed to these instruments. Derivatives can be a cost-effective way to gain exposure to asset classes. However, derivatives may amplify traditional investment risks through the creation of leverage and may be less liquid than traditional securities.
Additionally, after careful consideration, the Board of Trustees approved the liquidation and termination of the Invesco Peak Retirement™ Fund Suite to occur on or about January 23, 2023. Thank you for your investment in the Invesco Peak Retirement™ 2025 Fund.
Portfolio manager(s):
Jeffrey Bennett
Jacob Borbidge
Duy Nguyen
The views and opinions expressed in management’s discussion of Fund performance are those of Invesco Advisers, Inc. and its affiliates. These views
and opinions are subject to change at any time based on factors such as market and economic conditions. These views and opinions may not be relied upon as investment advice or recommendations, or as an offer for a particular security. The information is not a complete analysis of every aspect of any market, country, industry, security or the Fund. Statements of fact are from sources considered reliable, but Invesco Advisers, Inc. makes no representation or warranty as to their completeness or accuracy. Although historical performance is no guarantee of future results, these insights may help you understand our investment management philosophy.
See important Fund and, if applicable, index disclosures later in this report.
| 8 | Invesco Peak Retirement™ Funds |
Management’s Discussion of Fund Performance
Performance summary - Invesco Peak Retirement™ 2030 Fund
For the year ended December 31, 2022, Class A shares of Invesco Peak Retirement™ 2030 Fund (the Fund), at net asset value (NAV), underperformed the Custom Invesco Peak Retirement 2030 Benchmark, the Fund’s style-specific benchmark. Your Fund’s long-term performance appears later in this report.
|
| |||
Fund vs. Indexes Total returns, 12/31/21 to 12/31/22, at net asset value (NAV). Performance shown does not include applicable contingent deferred sales charges (CDSC) or front-end sales charges, which would have reduced performance. |
| |||
Class A Shares | -16.33 | % | ||
Class C Shares | -16.91 | |||
Class R Shares | -16.57 | |||
Class Y Shares | -16.09 | |||
Class R5 Shares | -16.08 | |||
Class R6 Shares | -16.09 | |||
Bloomberg U.S. Aggregate Bond Indexq (Broad Market Index) | -13.01 | |||
Custom Invesco Peak Retirement 2030 Benchmark∎ (Style-Specific Index) | -15.83 | |||
Source(s): qRIMES Technologies Corp.; ∎Invesco, RIMES Technologies Corp. | ||||
Market conditions and your Fund
Strategic asset class exposures in the Fund are obtained through underlying representative mutual funds and exchange-traded funds targeting a predefined date of retirement. From an absolute performance perspective, the portfolio’s cash allocation was the leading contributor to positive performance. The remaining allocations to equity, fixed income and alternative assets were all detractors from absolute performance as the portfolio produced a negative return for the fiscal year ended December 31, 2022.
From a relative performance perspective, the portfolio underperformed its style-specific benchmark during the fiscal year. The allocations to taxable municipal fixed income and small- and mid-cap equities were the leading detractors to relative performance. Within the allocations, Invesco Taxable Municipal Bond ETF and Invesco International Small-Mid Company Fund were the leading detractors.
Conversely, the leading contributors to relative performance were allocations and style selection within the US equity allocation and an allocation to floating rate fixed income during the fiscal year. Within the allocations, the Invesco Russell
| Fund Nasdaq Symbols | ||
Class A | PKKSX | |
Class C | PKKTX | |
Class R | PKKVX | |
Class Y | PKKUX | |
Class R5 | PKKWX | |
Class R6 | PKKZX | |
1000 Dynamic Multifactor ETF and Invesco Variable Rate Investment Grade ETF were the primary contributors.
Please note that some of the Fund’s underlying funds use derivatives, including futures and total return swaps, which may create economic leverage in the underlying funds. Therefore, some of the performance of the strategy, both positive and negative, can be attributed to these instruments. Derivatives can be a cost-effective way to gain exposure to asset classes. However, derivatives may amplify traditional investment risks through the creation of leverage and may be less liquid than traditional securities.
Additionally, after careful consideration, the Board of Trustees approved the liquidation and termination of the Invesco Peak Retirement™ Fund Suite to occur on or about January 23, 2023. Thank you for your investment in the Invesco Peak Retirement™ 2030 Fund.
Portfolio manager(s):
Jeffrey Bennett
Jacob Borbidge
Duy Nguyen
The views and opinions expressed in management’s discussion of Fund performance are those of Invesco Advisers, Inc. and its affiliates. These views and opinions are subject to change at any time based on factors such as market and economic conditions. These views and opinions may not be relied upon as investment advice or recommendations, or as an offer for a particular security. The information is not a complete analysis of every aspect of any market, country, industry, security or the Fund. Statements of fact are from sources considered reliable, but Invesco Advisers, Inc. makes no representation or warranty as to their completeness or accuracy. Although historical performance is no guarantee of future results, these insights may help you understand our investment management philosophy.
See important Fund and, if applicable, index disclosures later in this report.
| 9 | Invesco Peak Retirement™ Funds |
Management’s Discussion of Fund Performance
Performance summary - Invesco Peak Retirement™ 2035 Fund |
| |||
For the year ended December 31, 2022, Class A shares of Invesco Peak Retirement™ 2035 Fund (the Fund), at net asset value (NAV), underperformed the Custom Invesco Peak Retirement 2035 Benchmark, the Fund’s style-specific benchmark. |
| |||
Your Fund’s long-term performance appears later in this report. |
| |||
Fund vs. Indexes | ||||
Total returns, 12/31/21 to 12/31/22, at net asset value (NAV). Performance shown does not include applicable contingent deferred sales charges (CDSC) or front-end sales charges, which would have reduced performance. |
| |||
Class A Shares | -17.39 | % | ||
Class C Shares | -18.02 | |||
Class R Shares | -17.57 | |||
Class Y Shares | -17.19 | |||
Class R5 Shares | -17.13 | |||
Class R6 Shares | -17.19 | |||
Bloomberg U.S. Aggregate Bond Indexq (Broad Market Index) | -13.01 | |||
Custom Invesco Peak Retirement 2035 Benchmark∎ (Style-Specific Index) | -16.35 | |||
Source(s): qRIMES Technologies Corp.; ∎Invesco, RIMES Technologies Corp. | ||||
Market conditions and your Fund
Strategic asset class exposures in the Fund are obtained through underlying representative mutual funds and exchange-traded funds targeting a predefined date of retirement. From an absolute performance perspective, the portfolio’s cash allocation was the leading contributor to positive performance. The remaining allocations to equity, fixed income and alternative assets were all detractors from absolute performance as the portfolio produced a negative return for the fiscal year ended December 31, 2022.
From a relative performance perspective, the portfolio underperformed its style-specific benchmark during the fiscal year. The allocations to taxable municipal fixed income, emerging markets and small- and mid-cap equities were the leading detractors to relative performance. Within the allocations, the Invesco Taxable Municipal Bond ETF, Invesco Developing Markets Fund and Invesco International Small-Mid Company Fund were the leading detractors.
Conversely, the leading contributors to relative performance were allocations and style selection within the US equity allocation and an allocation to floating
| Fund Nasdaq Symbols | ||
Class A | PKKMX | |
Class C | PKKNX | |
Class R | PKKPX | |
Class Y | PKKOX | |
Class R5 | PKKQX | |
Class R6 | PKKRX | |
rate fixed income during the fiscal year. Within the allocations, the Invesco Russell 1000 Dynamic Multifactor ETF and Invesco Variable Rate Investment Grade ETF were the primary contributors.
Please note that some of the Fund’s underlying funds use derivatives, including futures and total return swaps, which may create economic leverage in the underlying funds. Therefore, some of the performance of the strategy, both positive and negative, can be attributed to these instruments. Derivatives can be a cost-effective way to gain exposure to asset classes. However, derivatives may amplify traditional investment risks through the creation of leverage and may be less liquid than traditional securities.
Additionally, after careful consideration, the Board of Trustees approved the liquidation and termination of the Invesco Peak Retirement™ Fund Suite to occur on or about January 23, 2023. Thank you for your investment in the Invesco Peak Retirement™ 2035 Fund.
Portfolio manager(s):
Jeffrey Bennett
Jacob Borbidge
Duy Nguyen
The views and opinions expressed in management’s discussion of Fund performance are those of Invesco Advisers, Inc. and its affiliates. These views and opinions are subject to change at any time based on factors such as market and economic conditions. These views and opinions may not be relied upon as investment advice or recommendations, or as an offer for a particular security. The information is not a complete analysis of every aspect of any market, country, industry, security or the Fund. Statements of fact are from sources considered reliable, but Invesco Advisers, Inc. makes no representation or warranty as to their completeness or accuracy. Although historical performance is no guarantee of future results, these insights may help you understand our investment management philosophy.
See important Fund and, if applicable, index disclosures later in this report.
| 10 | Invesco Peak Retirement™ Funds |
Management’s Discussion of Fund Performance
Performance summary - Invesco Peak Retirement™ 2040 Fund |
| |||
For the year ended December 31, 2022, Class A shares of Invesco Peak Retirement™ 2040 Fund (the Fund), at net asset value (NAV), underperformed the Custom Invesco Peak Retirement 2040 Benchmark, the Fund’s style-specific benchmark. |
| |||
Your Fund’s long-term performance appears later in this report. |
| |||
Fund vs. Indexes |
| |||
Total returns, 12/31/21 to 12/31/22, at net asset value (NAV). Performance shown does not include applicable contingent deferred sales charges (CDSC) or front-end sales charges, which would have reduced performance. |
| |||
Class A Shares | -18.36 | % | ||
Class C Shares | -18.91 | |||
Class R Shares | -18.56 | |||
Class Y Shares | -18.16 | |||
Class R5 Shares | -18.10 | |||
Class R6 Shares | -18.16 | |||
Bloomberg U.S. Aggregate Bond Indexq (Broad Market Index) | -13.01 | |||
Custom Invesco Peak Retirement 2040 Benchmark∎ (Style-Specific Index) | -16.88 | |||
Source(s): qRIMES Technologies Corp.; ∎Invesco, RIMES Technologies Corp. | ||||
Market conditions and your Fund
Strategic asset class exposures in the Fund are obtained through underlying representative mutual funds and exchange-traded funds targeting a predefined date of retirement. From an absolute performance perspective, the portfolio’s cash allocation was the leading contributor to positive performance. The remaining allocations to equity, fixed income and alternative assets were all detractors from absolute performance as the portfolio produced a negative return for the fiscal year ended December 31, 2022.
From a relative performance perspective, the portfolio underperformed its style-specific benchmark during the fiscal year. The allocations to emerging markets and small- and mid-cap equities were the leading detractors to relative performance. Within the allocations, the Invesco Discovery Mid Cap Growth Fund, Invesco Developing Markets Fund and Invesco International Small-Mid Company Fund were the leading detractors.
Conversely, the leading contributors to relative performance were allocations and style selection within the US equity allocation and an allocation to floating rate fixed income during the fiscal year.
| Fund Nasdaq Symbols | ||
Class A | PKKGX | |
Class C | PKKHX | |
Class R | PKKJX | |
Class Y | PKKIX | |
Class R5 | PKKKX | |
Class R6 | PKKLX | |
Within the allocations, the Invesco Russell 1000 Dynamic Multifactor ETF and Invesco Variable Rate Investment Grade ETF were the primary contributors.
Please note that some of the Fund’s underlying funds use derivatives, including futures and total return swaps, which may create economic leverage in the underlying funds. Therefore, some of the performance of the strategy, both positive and negative, can be attributed to these instruments. Derivatives can be a cost-effective way to gain exposure to asset classes. However, derivatives may amplify traditional investment risks through the creation of leverage and may be less liquid than traditional securities.
Additionally, after careful consideration, the Board of Trustees approved the liquidation and termination of the Invesco Peak Retirement™ Fund Suite to occur on or about January 23, 2023. Thank you for your investment in the Invesco Peak Retirement™ 2040 Fund.
Portfolio manager(s):
Jeffrey Bennett
Jacob Borbidge
Duy Nguyen
The views and opinions expressed in management’s discussion of Fund performance are those of Invesco Advisers, Inc. and its affiliates. These views and opinions are subject to change at any time based on factors such as market and economic conditions. These views and opinions may not be relied upon as investment advice or recommendations, or as an offer for a particular security. The information is not a complete analysis of every aspect of any market, country, industry, security or the Fund. Statements of fact are from sources considered reliable, but Invesco Advisers, Inc. makes no representation or warranty as to their completeness or accuracy. Although historical performance is no guarantee of future results, these insights may help you understand our investment management philosophy.
See important Fund and, if applicable, index disclosures later in this report.
| 11 | Invesco Peak Retirement™ Funds |
Management’s Discussion of Fund Performance
Performance summary - Invesco Peak Retirement™ 2045 Fund |
| |||
For the year ended December 31, 2022, Class A shares of Invesco Peak Retirement™ 2045 Fund (the Fund), at net asset value (NAV), underperformed the Custom Invesco Peak Retirement 2045 Benchmark, the Fund’s style-specific benchmark. |
| |||
Your Fund’s long-term performance appears later in this report. |
| |||
Fund vs. Indexes |
| |||
Total returns, 12/31/21 to 12/31/22, at net asset value (NAV). Performance shown does not include applicable contingent deferred sales charges (CDSC) or front-end sales charges, which would have reduced performance. |
| |||
Class A Shares | -18.85 | % | ||
Class C Shares | -19.46 | |||
Class R Shares | -19.06 | |||
Class Y Shares | -18.67 | |||
Class R5 Shares | -18.65 | |||
Class R6 Shares | -18.67 | |||
Russell 3000 Indexq (Broad Market Index) | -19.21 | |||
Custom Invesco Peak Retirement 2045 Benchmark∎ (Style-Specific Index) | -17.15 | |||
Source(s): qRIMES Technologies Corp.; ∎Invesco, RIMES Technologies Corp. | ||||
Market conditions and your Fund
Strategic asset class exposures in the Fund are obtained through underlying representative mutual funds and exchange-traded funds targeting a predefined date of retirement. From an absolute performance perspective, the portfolio’s cash allocation was the leading contributor to positive performance. The remaining allocations to equity, fixed income and alternative assets were all detractors from absolute performance as the portfolio produced a negative return for the fiscal year ended December 31, 2022.
From a relative performance perspective, the portfolio underperformed its style-specific benchmark during the fiscal year. The allocations to emerging markets and small- and mid-cap equities were the leading detractors to relative performance. Within the allocations, the Invesco Discovery Mid Cap Growth Fund, Invesco Developing Markets Fund and Invesco International Small-Mid Company Fund were the leading detractors.
Conversely, the leading contributors to relative performance were allocations and style selection within the US equity allocation and an allocation to floating rate fixed income during the fiscal year.
| Fund Nasdaq Symbols | ||
Class A | PKKAX | |
Class C | PKKBX | |
Class R | PKKDX | |
Class Y | PKKCX | |
Class R5 | PKKEX | |
Class R6 | PKKFX | |
Within the allocations, the Invesco Russell 1000 Dynamic Multifactor ETF and Invesco Variable Rate Investment Grade ETF were the primary contributors.
Please note that some of the Fund’s underlying funds use derivatives, including futures and total return swaps, which may create economic leverage in the underlying funds. Therefore, some of the performance of the strategy, both positive and negative, can be attributed to these instruments. Derivatives can be a cost-effective way to gain exposure to asset classes. However, derivatives may amplify traditional investment risks through the creation of leverage and may be less liquid than traditional securities.
Additionally, after careful consideration, the Board of Trustees approved the liquidation and termination of the Invesco Peak Retirement™ Fund Suite to occur on or about January 23, 2023. Thank you for your investment in the Invesco Peak Retirement™ 2045 Fund.
Portfolio manager(s):
Jeffrey Bennett
Jacob Borbidge
Duy Nguyen
The views and opinions expressed in management’s discussion of Fund performance are those of Invesco Advisers, Inc. and its affiliates. These views and opinions are subject to change at any time based on factors such as market and economic conditions. These views and opinions may not be relied upon as investment advice or recommendations, or as an offer for a particular security. The information is not a complete analysis of every aspect of any market, country, industry, security or the Fund. Statements of fact are from sources considered reliable, but Invesco Advisers, Inc. makes no representation or warranty as to their completeness or accuracy. Although historical performance is no guarantee of future results, these insights may help you understand our investment management philosophy.
See important Fund and, if applicable, index disclosures later in this report.
| 12 | Invesco Peak Retirement™ Funds |
Management’s Discussion of Fund Performance
Performance summary - Invesco Peak Retirement™ 2050 Fund |
| |||
For the year ended December 31, 2022, Class A shares of Invesco Peak Retirement™ 2050 Fund (the Fund), at net asset value (NAV), underperformed the Custom Invesco Peak Retirement 2050 Benchmark, the Fund’s style-specific benchmark. |
| |||
Your Fund’s long-term performance appears later in this report. |
| |||
Fund vs. Indexes |
| |||
Total returns, 12/31/21 to 12/31/22, at net asset value (NAV). Performance shown does not include applicable contingent deferred sales charges (CDSC) or front-end sales charges, which would have reduced performance. |
| |||
Class A Shares | -18.86 | % | ||
Class C Shares | -19.50 | |||
Class R Shares | -18.97 | |||
Class Y Shares | -18.67 | |||
Class R5 Shares | -18.67 | |||
Class R6 Shares | -18.67 | |||
Russell 3000 Indexq (Broad Market Index) | -19.21 | |||
Custom Invesco Peak Retirement 2050 Benchmark∎ (Style-Specific Index) | -17.43 | |||
Source(s): qRIMES Technologies Corp.; ∎Invesco, RIMES Technologies Corp. | ||||
Market conditions and your Fund
Strategic asset class exposures in the Fund are obtained through underlying representative mutual funds and exchange-traded funds targeting a predefined date of retirement. From an absolute performance perspective, the portfolio’s cash allocation was the leading contributor to positive performance. The remaining allocations to equity, fixed income and alternative assets were all detractors from absolute performance as the portfolio produced a negative return for the fiscal year ended December 31, 2022.
From a relative performance perspective, the portfolio underperformed its style-specific benchmark during the fiscal year. The allocations to emerging markets and small- and mid-cap equities were the leading detractors to relative performance. Within the allocations, the Invesco Discovery Mid Cap Growth Fund, Invesco Developing Markets Fund and Invesco International Small-Mid Company Fund were the leading detractors.
Conversely, the leading contributors to relative performance were allocations and style selection within the US equity allocation during the fiscal year. Within the allocation, the Invesco Russell 1000
| Fund Nasdaq Symbols | ||
Class A | PKRSX | |
Class C | PKRTX | |
Class R | PKRVX | |
Class Y | PKRUX | |
Class R5 | PKRWX | |
Class R6 | PKRZX | |
Dynamic Multifactor ETF and Invesco S&P SmallCap Low Volatility ETF were the primary contributors.
Please note that some of the Fund’s underlying funds use derivatives, including futures and total return swaps, which may create economic leverage in the underlying funds. Therefore, some of the performance of the strategy, both positive and negative, can be attributed to these instruments. Derivatives can be a cost-effective way to gain exposure to asset classes. However, derivatives may amplify traditional investment risks through the creation of leverage and may be less liquid than traditional securities.
Additionally, after careful consideration, the Board of Trustees approved the liquidation and termination of the Invesco Peak Retirement™ Fund Suite to occur on or about January 23, 2023. Thank you for your investment in the Invesco Peak Retirement™ 2050 Fund.
Portfolio manager(s):
Jeffrey Bennett
Jacob Borbidge
Duy Nguyen
The views and opinions expressed in management’s discussion of Fund performance are those of Invesco Advisers, Inc. and its affiliates. These views and opinions are subject to change at any time based on factors such as market and economic conditions. These views and opinions may not be relied upon as investment advice or recommendations, or as an offer for a particular security. The information is not a complete analysis of every aspect of any market, country, industry, security or the Fund. Statements of fact are from sources considered reliable, but Invesco Advisers, Inc. makes no representation or warranty as to their completeness or accuracy. Although historical performance is no guarantee of future results, these insights may help you understand our investment management philosophy.
See important Fund and, if applicable, index disclosures later in this report.
| 13 | Invesco Peak Retirement™ Funds |
Management’s Discussion of Fund Performance
Performance summary - Invesco Peak Retirement™ 2055 Fund |
| |||
For the year ended December 31, 2022, Class A shares of Invesco Peak Retirement™ 2055 Fund (the Fund), at net asset value (NAV), underperformed the Custom Invesco Peak Retirement 2055 Benchmark, the Fund’s style-specific benchmark. |
| |||
Your Fund’s long-term performance appears later in this report. |
| |||
Fund vs. Indexes |
| |||
Total returns, 12/31/21 to 12/31/22, at net asset value (NAV). Performance shown does not include applicable contingent deferred sales charges (CDSC) or front-end sales charges, which would have reduced performance. |
| |||
Class A Shares | -18.76 | % | ||
Class C Shares | -19.41 | |||
Class R Shares | -18.88 | |||
Class Y Shares | -18.56 | |||
Class R5 Shares | -18.53 | |||
Class R6 Shares | -18.53 | |||
Russell 3000 Indexq (Broad Market Index) | -19.21 | |||
Custom Invesco Peak Retirement 2055 Benchmark∎ (Style-Specific Index) | -17.43 | |||
Source(s): qRIMES Technologies Corp.; ∎Invesco, RIMES Technologies Corp. | ||||
Market conditions and your Fund
Strategic asset class exposures in the Fund are obtained through underlying representative mutual funds and exchange-traded funds targeting a predefined date of retirement. From an absolute performance perspective, the portfolio’s cash allocation was the leading contributor to positive performance. The remaining allocations to equity, fixed income and alternative assets were all detractors from absolute performance as the portfolio produced a negative return for the fiscal year ended December 31, 2022.
From a relative performance perspective, the portfolio underperformed its style-specific benchmark during the fiscal year. The allocations to emerging markets and small- and mid-cap equities were the leading detractors to relative performance. Within the allocations, the Invesco Discovery Mid Cap Growth Fund, Invesco Developing Markets Fund and Invesco International Small-Mid Company Fund were the leading detractors.
Conversely, the leading contributors to relative performance were allocations and style selection within the US equity allocation during the fiscal year. Within the allocation, the Invesco Russell 1000
| Fund Nasdaq Symbols | ||
Class A | PKRMX | |
Class C | PKRNX | |
Class R | PKRPX | |
Class Y | PKROX | |
Class R5 | PKRQX | |
Class R6 | PKRRX | |
Dynamic Multifactor ETF and Invesco S&P SmallCap Low Volatility ETF were the primary contributors.
Please note that some of the Fund’s underlying funds use derivatives, including futures and total return swaps, which may create economic leverage in the underlying funds. Therefore, some of the performance of the strategy, both positive and negative, can be attributed to these instruments. Derivatives can be a cost-effective way to gain exposure to asset classes. However, derivatives may amplify traditional investment risks through the creation of leverage and may be less liquid than traditional securities.
Additionally, after careful consideration, the Board of Trustees approved the liquidation and termination of the Invesco Peak Retirement™ Fund Suite to occur on or about January 23, 2023. Thank you for your investment in the Invesco Peak Retirement™ 2055 Fund.
Portfolio manager(s):
Jeffrey Bennett
Jacob Borbidge
Duy Nguyen
The views and opinions expressed in management’s discussion of Fund performance are those of Invesco Advisers, Inc. and its affiliates. These views and opinions are subject to change at any time based on factors such as market and economic conditions. These views and opinions may not be relied upon as investment advice or recommendations, or as an offer for a particular security. The information is not a complete analysis of every aspect of any market, country, industry, security or the Fund. Statements of fact are from sources considered reliable, but Invesco Advisers, Inc. makes no representation or warranty as to their completeness or accuracy. Although historical performance is no guarantee of future results, these insights may help you understand our investment management philosophy.
See important Fund and, if applicable, index disclosures later in this report.
| 14 | Invesco Peak Retirement™ Funds |
Management’s Discussion of Fund Performance
Performance summary - Invesco Peak Retirement™ 2060 Fund |
| |||
For the year ended December 31, 2022, Class A shares of Invesco Peak Retirement™ 2060 Fund (the Fund), at net asset value (NAV), underperformed the Custom Invesco Peak Retirement 2060 Benchmark, the Fund’s style-specific benchmark. |
| |||
Your Fund’s long-term performance appears later in this report. |
| |||
Fund vs. Indexes |
| |||
Total returns, 12/31/21 to 12/31/22, at net asset value (NAV). Performance shown does not include applicable contingent deferred sales charges (CDSC) or front-end sales charges, which would have reduced performance. |
| |||
Class A Shares | -18.94 | % | ||
Class C Shares | -19.53 | |||
Class R Shares | -19.14 | |||
Class Y Shares | -18.70 | |||
Class R5 Shares | -18.70 | |||
Class R6 Shares | -18.77 | |||
Russell 3000 Indexq (Broad Market Index) | -19.21 | |||
Custom Invesco Peak Retirement 2060 Benchmark∎ (Style-Specific Index) | -17.43 | |||
Source(s): qRIMES Technologies Corp.; ∎Invesco, RIMES Technologies Corp. | ||||
Market conditions and your Fund
Strategic asset class exposures in the Fund are obtained through underlying representative mutual funds and exchange-traded funds targeting a predefined date of retirement. From an absolute performance perspective, the portfolio’s cash allocation was the leading contributor to positive performance. The remaining allocations to equity, fixed income and alternative assets were all detractors from absolute performance as the portfolio produced a negative return for the fiscal year ended December 31, 2022.
From a relative performance perspective, the portfolio underperformed its style-specific benchmark during the fiscal year. The allocations to emerging markets and small- and mid-cap equities were the leading detractors to relative performance. Within the allocations, the Invesco Discovery Mid Cap Growth Fund, Invesco Developing Markets Fund and Invesco International Small-Mid Company Fund were the leading detractors.
Conversely, the leading contributors to relative performance were allocations and style selection within the US equity allocation during the fiscal year. Within the allocation, the Invesco Russell 1000
| Fund Nasdaq Symbols | ||
Class A | PKRGX | |
Class C | PKRHX | |
Class R | PKRJX | |
Class Y | PKRIX | |
Class R5 | PKRKX | |
Class R6 | PKRLX | |
Dynamic Multifactor ETF and Invesco S&P SmallCap Low Volatility ETF were the primary contributors.
Please note that some of the Fund’s underlying funds use derivatives, including futures and total return swaps, which may create economic leverage in the underlying funds. Therefore, some of the performance of the strategy, both positive and negative, can be attributed to these instruments. Derivatives can be a cost-effective way to gain exposure to asset classes. However, derivatives may amplify traditional investment risks through the creation of leverage and may be less liquid than traditional securities.
Additionally, after careful consideration, the Board of Trustees approved the liquidation and termination of the Invesco Peak Retirement™ Fund Suite to occur on or about January 23, 2023. Thank you for your investment in the Invesco Peak Retirement™ 2060 Fund.
Portfolio manager(s):
Jeffrey Bennett
Jacob Borbidge
Duy Nguyen
The views and opinions expressed in management’s discussion of Fund performance are those of Invesco Advisers, Inc. and its affiliates. These views and opinions are subject to change at any time based on factors such as market and economic conditions. These views and opinions may not be relied upon as investment advice or recommendations, or as an offer for a particular security. The information is not a complete analysis of every aspect of any market, country, industry, security or the Fund. Statements of fact are from sources considered reliable, but Invesco Advisers, Inc. makes no representation or warranty as to their completeness or accuracy. Although historical performance is no guarantee of future results, these insights may help you understand our investment management philosophy.
See important Fund and, if applicable, index disclosures later in this report.
| 15 | Invesco Peak Retirement™ Funds |
Management’s Discussion of Fund Performance
Performance summary - Invesco Peak Retirement™ 2065 Fund |
| |||
For the year ended December 31, 2022, Class A shares of Invesco Peak Retirement™ 2065 Fund (the Fund), at net asset value (NAV), underperformed the Custom Invesco Peak Retirement 2065 Benchmark, the Fund’s style-specific benchmark. |
| |||
Your Fund’s long-term performance appears later in this report. |
| |||
Fund vs. Indexes |
| |||
Total returns, 12/31/21 to 12/31/22, at net asset value (NAV). Performance shown does not include applicable contingent deferred sales charges (CDSC) or front-end sales charges, which would have reduced performance. |
| |||
Class A Shares | -19.04 | % | ||
Class C Shares | -19.54 | |||
Class R Shares | -19.20 | |||
Class Y Shares | -18.80 | |||
Class R5 Shares | -18.80 | |||
Class R6 Shares | -18.80 | |||
Russell 3000 Indexq (Broad Market Index) | -19.21 | |||
Custom Invesco Peak Retirement 2065 Benchmark∎ (Style-Specific Index) | -17.43 | |||
Source(s): qRIMES Technologies Corp.; ∎Invesco, RIMES Technologies Corp. |
| |||
Market conditions and your Fund
Strategic asset class exposures in the Fund are obtained through underlying representative mutual funds and exchange-traded funds targeting a predefined date of retirement. From an absolute performance perspective, the portfolio’s cash allocation was the leading contributor to positive performance. The remaining allocations to equity, fixed income and alternative assets were all detractors from absolute performance as the portfolio produced a negative return for the fiscal year ended December 31, 2022.
From a relative performance perspective, the portfolio underperformed its style-specific benchmark during the fiscal year. The allocations to emerging markets and small- and mid-cap equities were the leading detractors to relative performance. Within the allocations, the Invesco Discovery Mid Cap Growth Fund, Invesco Developing Markets Fund and Invesco International Small-Mid Company Fund were the leading detractors.
Conversely, the leading contributors to relative performance were allocations and style selection within the US equity allocation during the fiscal year. Within the allocation, the Invesco Russell 1000
| Fund Nasdaq Symbols | ||
Class A | PKRAX | |
Class C | PKRBX | |
Class R | PKRDX | |
Class Y | PKRCX | |
Class R5 | PKREX | |
Class R6 | PKRFX | |
Dynamic Multifactor ETF and Invesco S&P SmallCap Low Volatility ETF were the primary contributors.
Please note that some of the Fund’s underlying funds use derivatives, including futures and total return swaps, which may create economic leverage in the underlying funds. Therefore, some of the performance of the strategy, both positive and negative, can be attributed to these instruments. Derivatives can be a cost-effective way to gain exposure to asset classes. However, derivatives may amplify traditional investment risks through the creation of leverage and may be less liquid than traditional securities.
Additionally, after careful consideration, the Board of Trustees approved the liquidation and termination of the Invesco Peak Retirement™ Fund Suite to occur on or about January 23, 2023. Thank you for your investment in the Invesco Peak Retirement™ 2065 Fund.
Portfolio manager(s):
Jeffrey Bennett
Jacob Borbidge
Duy Nguyen
The views and opinions expressed in management’s discussion of Fund performance are those of Invesco Advisers, Inc. and its affiliates. These views and opinions are subject to change at any time based on factors such as market and economic conditions. These views and opinions may not be relied upon as investment advice or recommendations, or as an offer for a particular security. The information is not a complete analysis of every aspect of any market, country, industry, security or the Fund. Statements of fact are from sources considered reliable, but Invesco Advisers, Inc. makes no representation or warranty as to their completeness or accuracy. Although historical performance is no guarantee of future results, these insights may help you understand our investment management philosophy.
See important Fund and, if applicable, index disclosures later in this report.
| 16 | Invesco Peak Retirement™ Funds |
Invesco Peak Retirement™ Destination Fund’s Long-Term Performance
Results of a $10,000 Investment – Oldest Share Class(es)
Fund and index data from 12/29/17
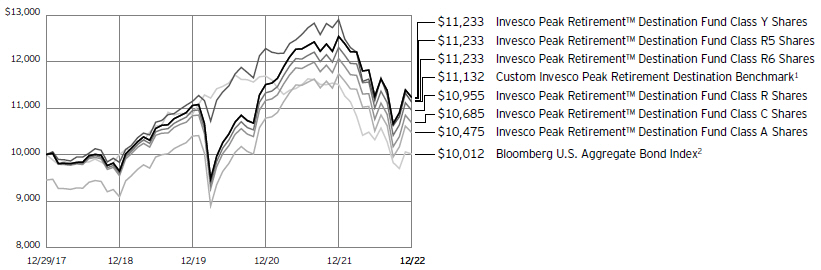
1 Source: Invesco, RIMES Technologies
2 Source: RIMES Technologies Corp.
Past performance cannot guarantee future results.
The data shown in the chart include reinvested distributions, applicable sales charges and Fund expenses including
management fees. Index results include reinvested dividends, but they do not reflect sales charges. Performance of the peer group, if applicable, reflects fund expenses and management fees;
performance of a market index does not. Performance shown in the chart does not reflect deduction of taxes a shareholder would pay on Fund distributions or sale of Fund shares.
| 17 | Invesco Peak Retirement™ Funds |
Average Annual Total Returns |
| |||
As of 12/31/22, including maximum applicable sales charges |
| |||
Class A Shares | ||||
Inception (12/29/17) | 0.93 | % | ||
5 Years | 0.93 | |||
1 Year | -15.67 | |||
Class C Shares | ||||
Inception (12/29/17) | 1.33 | % | ||
5 Years | 1.33 | |||
1 Year | -12.29 | |||
Class R Shares | ||||
Inception (12/29/17) | 1.84 | % | ||
5 Years | 1.84 | |||
1 Year | -10.98 | |||
Class Y Shares | ||||
Inception (12/29/17) | 2.35 | % | ||
5 Years | 2.35 | |||
1 Year | -10.44 | |||
Class R5 Shares | ||||
Inception (12/29/17) | 2.35 | % | ||
5 Years | 2.35 | |||
1 Year | -10.44 | |||
Class R6 Shares | ||||
Inception (12/29/17) | 2.35 | % | ||
5 Years | 2.35 | |||
1 Year | -10.44 | |||
The performance data quoted represent past performance and cannot guarantee future results; current performance may be lower or higher. Please visit invesco.com/performance for the most recent month-end performance. Performance figures reflect reinvested distributions, changes in net asset value and the effect of the maximum sales charge unless otherwise stated. Performance figures do not reflect deduction of taxes a shareholder would pay on Fund distributions or sale of Fund shares. Investment return and principal value will fluctuate so that you may have a gain or loss when you sell shares.
Class A share performance reflects the maximum 5.50% sales charge, and Class C share performance reflects the applicable contingent deferred sales charge (CDSC) for the period involved. The CDSC on Class C shares is 1% for the first year after purchase. Class R, Class Y, Class R5 and Class R6 class shares do not have a front-end sales charge or a CDSC; therefore, performance is at net asset value.
The performance of the Fund’s share classes will differ primarily due to
different sales charge structures and class expenses.
Fund performance reflects any applicable fee waivers and/or expense reimbursements. Had the adviser not waived fees and/or reimbursed expenses currently or in the past, returns would have been lower. See current prospectus for more information.
| 18 | Invesco Peak Retirement™ Funds |
Invesco Peak Retirement™ 2010 Fund’s Long-Term Performance
Results of a $10,000 Investment – Oldest Share Class(es)
Fund and index data from 4/30/21
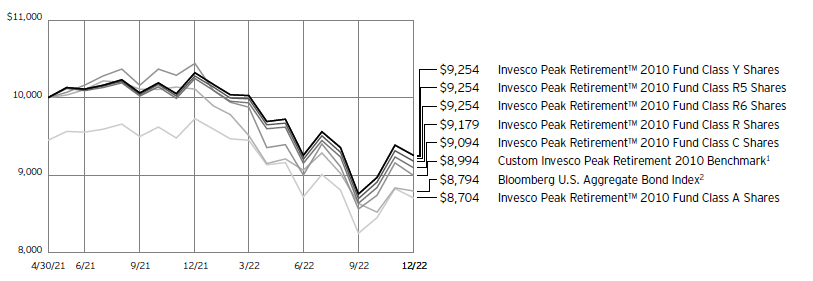
1 Source: Invesco, RIMES Technologies
2 Source: RIMES Technologies Corp.
Past performance cannot guarantee future results.
The data shown in the chart include reinvested distributions, applicable sales charges and Fund expenses including
management fees. Index results include reinvested dividends, but they do not reflect sales charges. Performance of the peer group, if applicable, reflects fund expenses and management fees;
performance of a market index does not. Performance shown in the chart does not reflect deduction of taxes a shareholder would pay on Fund distributions or sale of Fund shares.
| 19 | Invesco Peak Retirement™ Funds |
Average Annual Total Returns |
| |||
As of 12/31/22, including maximum applicable sales charges |
| |||
Class A Shares | ||||
Inception (4/30/21) | -7.97 | % | ||
1 Year | -15.46 | |||
Class C Shares | ||||
Inception (4/30/21) | -5.53 | % | ||
1 Year | -12.09 | |||
Class R Shares | ||||
Inception (4/30/21) | -5.00 | % | ||
1 Year | -10.70 | |||
Class Y Shares | ||||
Inception (4/30/21) | -4.53 | % | ||
1 Year | -10.34 | |||
Class R5 Shares | ||||
Inception (4/30/21) | -4.53 | % | ||
1 Year | -10.34 | |||
Class R6 Shares | ||||
Inception (4/30/21) | -4.53 | % | ||
1 Year | -10.34 | |||
The performance data quoted represent past performance and cannot guarantee future results; current performance may be lower or higher. Please visit invesco.com/performance for the most recent month-end performance. Performance figures reflect reinvested distributions, changes in net asset value and the effect of the maximum sales charge unless otherwise stated. Performance figures do not reflect deduction of taxes a shareholder would pay on Fund distributions or sale of Fund shares. Investment return and principal value will fluctuate so that you may have a gain or loss when you sell shares.
Class A share performance reflects the maximum 5.50% sales charge, and Class C share performance reflects the applicable contingent deferred sales charge (CDSC) for the period involved. The CDSC on Class C shares is 1% for the first year after purchase. Class R, Class Y, Class R5 and Class R6 class shares do not have a front-end sales charge or a CDSC; therefore, performance is at net asset value.
The performance of the Fund’s share classes will differ primarily due to different sales charge structures and class expenses.
Fund performance reflects any applicable fee waivers and/or expense reimbursements. Had the adviser not waived fees and/or reimbursed expenses currently or in the past, returns
would have been lower. See current prospectus for more information.
| 20 | Invesco Peak Retirement™ Funds |
Invesco Peak Retirement™ 2015 Fund’s Long-Term Performance
Results of a $10,000 Investment – Oldest Share Class(es)
Fund and index data from 12/29/17
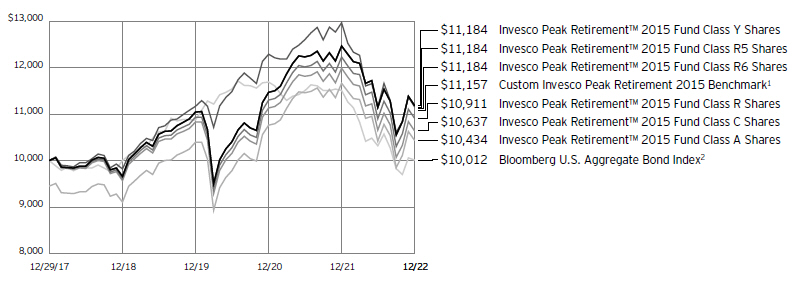
1 Source: Invesco, RIMES Technologies
2 Source: RIMES Technologies Corp.
Past performance cannot guarantee future results.
The data shown in the chart include reinvested distributions, applicable sales charges and Fund expenses including
management fees. Index results include reinvested dividends, but they do not reflect sales charges. Performance of the peer group, if applicable, reflects fund expenses and management fees;
performance of a market index does not. Performance shown in the chart does not reflect deduction of taxes a shareholder would pay on Fund distributions or sale of Fund shares.
| 21 | Invesco Peak Retirement™ Funds |
Average Annual Total Returns |
| |||
As of 12/31/22, including maximum applicable sales charges |
| |||
Class A Shares | ||||
Inception (12/29/17) | 0.85 | % | ||
5 Years | 0.85 | |||
1 Year | -15.46 | |||
Class C Shares | ||||
Inception (12/29/17) | 1.24 | % | ||
5 Years | 1.24 | |||
1 Year | -12.12 | |||
Class R Shares | ||||
Inception (12/29/17) | 1.76 | % | ||
5 Years | 1.76 | |||
1 Year | -10.79 | |||
Class Y Shares | ||||
Inception (12/29/17) | 2.26 | % | ||
5 Years | 2.26 | |||
1 Year | -10.28 | |||
Class R5 Shares | ||||
Inception (12/29/17) | 2.26 | % | ||
5 Years | 2.26 | |||
1 Year | -10.28 | |||
Class R6 Shares | ||||
Inception (12/29/17) | 2.26 | % | ||
5 Years | 2.26 | |||
1 Year | -10.28 | |||
The performance data quoted represent past performance and cannot guarantee future results; current performance may be lower or higher. Please visit invesco.com/performance for the most recent month-end performance. Performance figures reflect reinvested distributions, changes in net asset value and the effect of the maximum sales charge unless otherwise stated. Performance figures do not reflect deduction of taxes a shareholder would pay on Fund distributions or sale of Fund shares. Investment return and principal value will fluctuate so that you may have a gain or loss when you sell shares.
Class A share performance reflects the maximum 5.50% sales charge, and Class C share performance reflects the applicable contingent deferred sales charge (CDSC) for the period involved. The CDSC on Class C shares is 1% for the first year after purchase. Class R, Class Y, Class R5 and Class R6 class shares do not have a front-end sales charge or a CDSC; therefore, performance is at net asset value.
The performance of the Fund’s share classes will differ primarily due to
different sales charge structures and class expenses.
Fund performance reflects any applicable fee waivers and/or expense reimbursements. Had the adviser not waived fees and/or reimbursed expenses currently or in the past, returns would have been lower. See current prospectus for more information.
| 22 | Invesco Peak Retirement™ Funds |
Invesco Peak Retirement™ 2020 Fund’s Long-Term Performance
Results of a $10,000 Investment – Oldest Share Class(es)
Fund and index data from 12/29/17
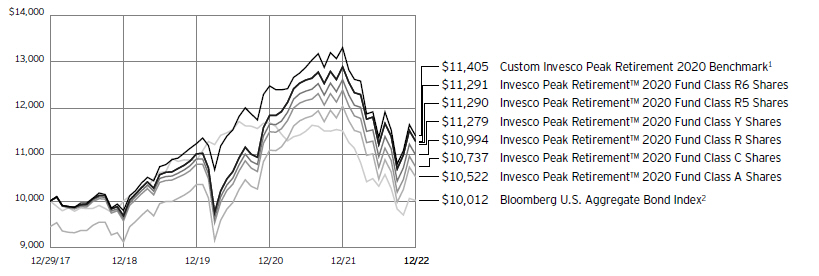
1 Source: Invesco, RIMES Technologies
2 Source: RIMES Technologies Corp.
Past performance cannot guarantee future results.
The data shown in the chart include reinvested distributions, applicable sales charges and Fund expenses including
management fees. Index results include reinvested dividends, but they do not reflect sales charges. Performance of the peer group, if applicable, reflects fund expenses and management fees;
performance of a market index does not. Performance shown in the chart does not reflect deduction of taxes a shareholder would pay on Fund distributions or sale of Fund shares.
| 23 | Invesco Peak Retirement™ Funds |
Average Annual Total Returns |
| |||
As of 12/31/22, including maximum applicable sales charges |
| |||
Class A Shares | ||||
Inception (12/29/17) | 1.02 | % | ||
5 Years | 1.02 | |||
1 Year | -17.46 | |||
Class C Shares | ||||
Inception (12/29/17) | 1.43 | % | ||
5 Years | 1.43 | |||
1 Year | -14.15 | |||
Class R Shares | ||||
Inception (12/29/17) | 1.91 | % | ||
5 Years | 1.91 | |||
1 Year | -12.83 | |||
Class Y Shares | ||||
Inception (12/29/17) | 2.43 | % | ||
5 Years | 2.44 | |||
1 Year | -12.50 | |||
Class R5 Shares | ||||
Inception (12/29/17) | 2.45 | % | ||
5 Years | 2.46 | |||
1 Year | -12.41 | |||
Class R6 Shares | ||||
Inception (12/29/17) | 2.45 | % | ||
5 Years | 2.46 | |||
1 Year | -12.41 | |||
The performance data quoted represent past performance and cannot guarantee future results; current performance may be lower or higher. Please visit invesco.com/performance for the most recent month-end performance. Performance figures reflect reinvested distributions, changes in net asset value and the effect of the maximum sales charge unless otherwise stated. Performance figures do not reflect deduction of taxes a shareholder would pay on Fund distributions or sale of Fund shares. Investment return and principal value will fluctuate so that you may have a gain or loss when you sell shares.
Class A share performance reflects the maximum 5.50% sales charge, and Class C share performance reflects the applicable contingent deferred sales charge (CDSC) for the period involved. The CDSC on Class C shares is 1% for the first year after purchase. Class R, Class Y, Class R5 and Class R6 class shares do not have a front-end sales charge or a CDSC; therefore, performance is at net asset value.
The performance of the Fund’s share classes will differ primarily due to
different sales charge structures and class expenses.
Fund performance reflects any applicable fee waivers and/or expense reimbursements. Had the adviser not waived fees and/or reimbursed expenses currently or in the past, returns would have been lower. See current prospectus for more information.
| 24 | Invesco Peak Retirement™ Funds |
Invesco Peak Retirement™ 2025 Fund’s Long-Term Performance
Results of a $10,000 Investment – Oldest Share Class(es)
Fund and index data from 12/29/17
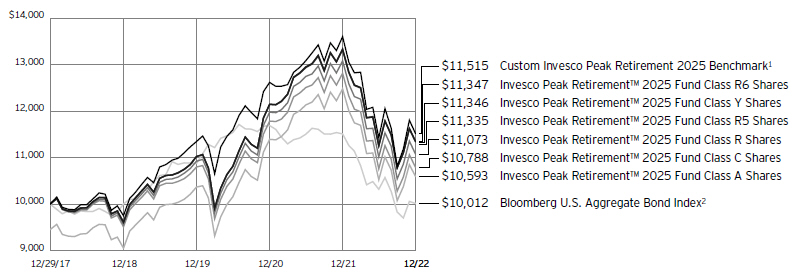
1 Source: Invesco, RIMES Technologies
2 Source: RIMES Technologies Corp.
Past performance cannot guarantee future results.
The data shown in the chart include reinvested distributions, applicable sales charges and Fund expenses including
management fees. Index results include reinvested dividends, but they do not reflect sales charges. Performance of the peer group, if applicable, reflects fund expenses and management fees;
performance of a market index does not. Performance shown in the chart does not reflect deduction of taxes a shareholder would pay on Fund distributions or sale of Fund shares.
| 25 | Invesco Peak Retirement™ Funds |
Average Annual Total Returns |
| |||
As of 12/31/22, including maximum applicable sales charges |
| |||
Class A Shares | ||||
Inception (12/29/17) | 1.16 | % | ||
5 Years | 1.16 | |||
1 Year | -19.77 | |||
Class C Shares | ||||
Inception (12/29/17) | 1.53 | % | ||
5 Years | 1.53 | |||
1 Year | -16.60 | |||
Class R Shares | ||||
Inception (12/29/17) | 2.06 | % | ||
5 Years | 2.06 | |||
1 Year | -15.37 | |||
Class Y Shares | ||||
Inception (12/29/17) | 2.56 | % | ||
5 Years | 2.56 | |||
1 Year | -14.94 | |||
Class R5 Shares | ||||
Inception (12/29/17) | 2.54 | % | ||
5 Years | 2.54 | |||
1 Year | -14.88 | |||
Class R6 Shares | ||||
Inception (12/29/17) | 2.56 | % | ||
5 Years | 2.56 | |||
1 Year | -14.87 | |||
The performance data quoted represent past performance and cannot guarantee future results; current performance may be lower or higher. Please visit invesco.com/performance for the most recent month-end performance. Performance figures reflect reinvested distributions, changes in net asset value and the effect of the maximum sales charge unless otherwise stated. Performance figures do not reflect deduction of taxes a shareholder would pay on Fund distributions or sale of Fund shares. Investment return and principal value will fluctuate so that you may have a gain or loss when you sell shares.
Class A share performance reflects the maximum 5.50% sales charge, and Class C share performance reflects the applicable contingent deferred sales charge (CDSC) for the period involved. The CDSC on Class C shares is 1% for the first year after purchase. Class R, Class Y, Class R5 and Class R6 class shares do not have a front-end sales charge or a CDSC; therefore, performance is at net asset value.
The performance of the Fund’s share classes will differ primarily due to
different sales charge structures and class expenses.
Fund performance reflects any applicable fee waivers and/or expense reimbursements. Had the adviser not waived fees and/or reimbursed expenses currently or in the past, returns would have been lower. See current prospectus for more information.
| 26 | Invesco Peak Retirement™ Funds |
Invesco Peak Retirement™ 2030 Fund’s Long-Term Performance
Results of a $10,000 Investment – Oldest Share Class(es)
Fund and index data from 12/29/17

1 Source: Invesco, RIMES Technologies
2 Source: RIMES Technologies Corp.
Past performance cannot guarantee future results.
The data shown in the chart include reinvested distributions, applicable sales charges and Fund expenses including
management fees. Index results include reinvested dividends, but they do not reflect sales charges. Performance of the peer group, if applicable, reflects fund expenses and management fees;
performance of a market index does not. Performance shown in the chart does not reflect deduction of taxes a shareholder would pay on Fund distributions or sale of Fund shares.
| 27 | Invesco Peak Retirement™ Funds |
Average Annual Total Returns |
| |||
As of 12/31/22, including maximum applicable sales charges |
| |||
Class A Shares | ||||
Inception (12/29/17) | 1.23 | % | ||
5 Years | 1.23 | |||
1 Year | -20.91 | |||
Class C Shares | ||||
Inception (12/29/17) | 1.61 | % | ||
5 Years | 1.61 | |||
1 Year | -17.72 | |||
Class R Shares | ||||
Inception (12/29/17) | 2.10 | % | ||
5 Years | 2.11 | |||
1 Year | -16.57 | |||
Class Y Shares | ||||
Inception (12/29/17) | 2.64 | % | ||
5 Years | 2.64 | |||
1 Year | -16.09 | |||
Class R5 Shares | ||||
Inception (12/29/17) | 2.64 | % | ||
5 Years | 2.64 | |||
1 Year | -16.08 | |||
Class R6 Shares | ||||
Inception (12/29/17) | 2.64 | % | ||
5 Years | 2.64 | |||
1 Year | -16.09 | |||
The performance data quoted represent past performance and cannot guarantee future results; current performance may be lower or higher. Please visit invesco.com/performance for the most recent month-end performance. Performance figures reflect reinvested distributions, changes in net asset value and the effect of the maximum sales charge unless otherwise stated. Performance figures do not reflect deduction of taxes a shareholder would pay on Fund distributions or sale of Fund shares. Investment return and principal value will fluctuate so that you may have a gain or loss when you sell shares.
Class A share performance reflects the maximum 5.50% sales charge, and Class C share performance reflects the applicable contingent deferred sales charge (CDSC) for the period involved. The CDSC on Class C shares is 1% for the first year after purchase. Class R, Class Y, Class R5 and Class R6 class shares do not have a front-end sales charge or a CDSC; therefore, performance is at net asset value.
The performance of the Fund’s share classes will differ primarily due to
different sales charge structures and class expenses.
Fund performance reflects any applicable fee waivers and/or expense reimbursements. Had the adviser not waived fees and/or reimbursed expenses currently or in the past, returns would have been lower. See current prospectus for more information.
| 28 | Invesco Peak Retirement™ Funds |
Invesco Peak Retirement™ 2035 Fund’s Long-Term Performance
Results of a $10,000 Investment – Oldest Share Class(es)
Fund and index data from 12/29/17
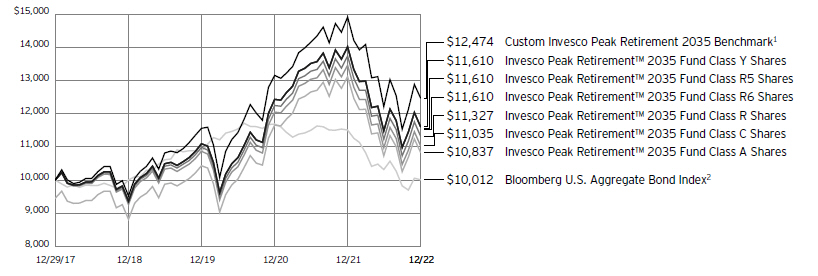
1 Source: Invesco, RIMES Technologies
2 Source: RIMES Technologies Corp.
Past performance cannot guarantee future results.
The data shown in the chart include reinvested distributions, applicable sales charges and Fund expenses including
management fees. Index results include reinvested dividends, but they do not reflect sales charges. Performance of the peer group, if applicable, reflects fund expenses and management fees;
performance of a market index does not. Performance shown in the chart does not reflect deduction of taxes a shareholder would pay on Fund distributions or sale of Fund shares.
| 29 | Invesco Peak Retirement™ Funds |
Average Annual Total Returns |
| |||
As of 12/31/22, including maximum applicable sales charges |
| |||
Class A Shares | ||||
Inception (12/29/17) | 1.62 | % | ||
5 Years | 1.62 | |||
1 Year | -21.94 | |||
Class C Shares | ||||
Inception (12/29/17) | 1.99 | % | ||
5 Years | 1.99 | |||
1 Year | -18.81 | |||
Class R Shares | ||||
Inception (12/29/17) | 2.52 | % | ||
5 Years | 2.52 | |||
1 Year | -17.57 | |||
Class Y Shares | ||||
Inception (12/29/17) | 3.03 | % | ||
5 Years | 3.03 | |||
1 Year | -17.19 | |||
Class R5 Shares | ||||
Inception (12/29/17) | 3.03 | % | ||
5 Years | 3.03 | |||
1 Year | -17.13 | |||
Class R6 Shares | ||||
Inception (12/29/17) | 3.03 | % | ||
5 Years | 3.03 | |||
1 Year | -17.19 | |||
The performance data quoted represent past performance and cannot guarantee future results; current performance may be lower or higher. Please visit invesco.com/performance for the most recent month-end performance. Performance figures reflect reinvested distributions, changes in net asset value and the effect of the maximum sales charge unless otherwise stated. Performance figures do not reflect deduction of taxes a shareholder would pay on Fund distributions or sale of Fund shares. Investment return and principal value will fluctuate so that you may have a gain or loss when you sell shares.
Class A share performance reflects the maximum 5.50% sales charge, and Class C share performance reflects the applicable contingent deferred sales charge (CDSC) for the period involved. The CDSC on Class C shares is 1% for the first year after purchase. Class R, Class Y, Class R5 and Class R6 class shares do not have a front-end sales charge or a CDSC; therefore, performance is at net asset value.
The performance of the Fund’s share classes will differ primarily due to
different sales charge structures and class expenses.
Fund performance reflects any applicable fee waivers and/or expense reimbursements. Had the adviser not waived fees and/or reimbursed expenses currently or in the past, returns would have been lower. See current prospectus for more information.
| 30 | Invesco Peak Retirement™ Funds |
Invesco Peak Retirement™ 2040 Fund’s Long-Term Performance
Results of a $10,000 Investment – Oldest Share Class(es)
Fund and index data from 12/29/17
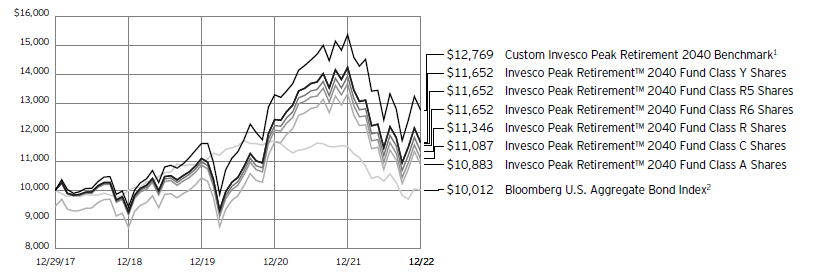
1 Source: Invesco, RIMES Technologies
2 Source: RIMES Technologies Corp.
Past performance cannot guarantee future results.
The data shown in the chart include reinvested distributions, applicable sales charges and Fund expenses including
management fees. Index results include reinvested dividends, but they do not reflect sales charges. Performance of the peer group, if applicable, reflects fund expenses and management fees;
performance of a market index does not. Performance shown in the chart does not reflect deduction of taxes a shareholder would pay on Fund distributions or sale of Fund shares.
| 31 | Invesco Peak Retirement™ Funds |
Average Annual Total Returns |
| |||
As of 12/31/22, including maximum applicable sales charges |
| |||
Class A Shares | ||||
Inception (12/29/17) | 1.70 | % | ||
5 Years | 1.71 | |||
1 Year | -22.85 | |||
Class C Shares | ||||
Inception (12/29/17) | 2.08 | % | ||
5 Years | 2.09 | |||
1 Year | -19.69 | |||
Class R Shares | ||||
Inception (12/29/17) | 2.55 | % | ||
5 Years | 2.56 | |||
1 Year | -18.56 | |||
Class Y Shares | ||||
Inception (12/29/17) | 3.10 | % | ||
5 Years | 3.11 | |||
1 Year | -18.16 | |||
Class R5 Shares | ||||
Inception (12/29/17) | 3.10 | % | ||
5 Years | 3.11 | |||
1 Year | -18.10 | |||
Class R6 Shares | ||||
Inception (12/29/17) | 3.10 | % | ||
5 Years | 3.11 | |||
1 Year | -18.16 | |||
The performance data quoted represent past performance and cannot guarantee future results; current performance may be lower or higher. Please visit invesco.com/performance for the most recent month-end performance. Performance figures reflect reinvested distributions, changes in net asset value and the effect of the maximum sales charge unless otherwise stated. Performance figures do not reflect deduction of taxes a shareholder would pay on Fund distributions or sale of Fund shares. Investment return and principal value will fluctuate so that you may have a gain or loss when you sell shares.
Class A share performance reflects the maximum 5.50% sales charge, and Class C share performance reflects the applicable contingent deferred sales charge (CDSC) for the period involved. The CDSC on Class C shares is 1% for the first year after purchase. Class R, Class Y, Class R5 and Class R6 class shares do not have a front-end sales charge or a CDSC; therefore, performance is at net asset value.
The performance of the Fund’s share classes will differ primarily due to
different sales charge structures and class expenses.
Fund performance reflects any applicable fee waivers and/or expense reimbursements. Had the adviser not waived fees and/or reimbursed expenses currently or in the past, returns would have been lower. See current prospectus for more information.
| 32 | Invesco Peak Retirement™ Funds |
Invesco Peak Retirement™ 2045 Fund’s Long-Term Performance
Results of a $10,000 Investment – Oldest Share Class(es)
Fund and index data from 12/29/17
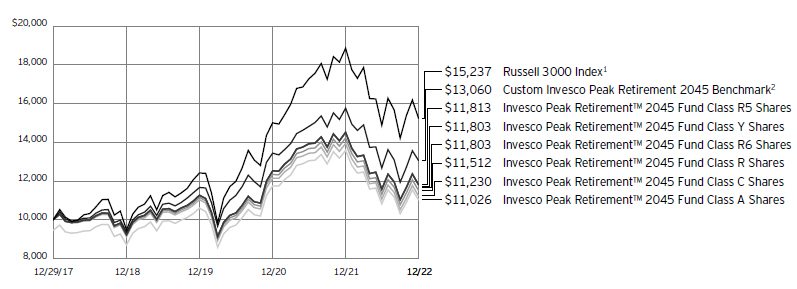
1 Source: RIMES Technologies Corp.
2 Source: Invesco, RIMES Technologies Corp.
Past performance cannot guarantee future results.
The data shown in the chart include reinvested distributions, applicable sales charges and Fund expenses including
management fees. Index results include reinvested dividends, but they do not reflect sales charges. Performance of the peer group, if applicable, reflects fund expenses and management fees;
performance of a market index does not. Performance shown in the chart does not reflect deduction of taxes a shareholder would pay on Fund distributions or sale of Fund shares.
| 33 | Invesco Peak Retirement™ Funds |
Average Annual Total Returns |
| |||
As of 12/31/22, including maximum applicable sales charges |
| |||
Class A Shares | ||||
Inception (12/29/17) | 1.97 | % | ||
5 Years | 1.97 | |||
1 Year | -23.34 | |||
Class C Shares | ||||
Inception (12/29/17) | 2.34 | % | ||
5 Years | 2.35 | |||
1 Year | -20.23 | |||
Class R Shares | ||||
Inception (12/29/17) | 2.85 | % | ||
5 Years | 2.86 | |||
1 Year | -19.06 | |||
Class Y Shares | ||||
Inception (12/29/17) | 3.37 | % | ||
5 Years | 3.37 | |||
1 Year | -18.67 | |||
Class R5 Shares | ||||
Inception (12/29/17) | 3.39 | % | ||
5 Years | 3.39 | |||
1 Year | -18.65 | |||
Class R6 Shares | ||||
Inception (12/29/17) | 3.37 | % | ||
5 Years | 3.37 | |||
1 Year | -18.67 | |||
The performance data quoted represent past performance and cannot guarantee future results; current performance may be lower or higher. Please visit invesco.com/performance for the most recent month-end performance. Performance figures reflect reinvested distributions, changes in net asset value and the effect of the maximum sales charge unless otherwise stated. Performance figures do not reflect deduction of taxes a shareholder would pay on Fund distributions or sale of Fund shares. Investment return and principal value will fluctuate so that you may have a gain or loss when you sell shares.
Class A share performance reflects the maximum 5.50% sales charge, and Class C share performance reflects the applicable contingent deferred sales charge (CDSC) for the period involved. The CDSC on Class C shares is 1% for the first year after purchase. Class R, Class Y, Class R5 and Class R6 class shares do not have a front-end sales charge or a CDSC; therefore, performance is at net asset value.
The performance of the Fund’s share classes will differ primarily due to
different sales charge structures and class expenses.
Fund performance reflects any applicable fee waivers and/or expense reimbursements. Had the adviser not waived fees and/or reimbursed expenses currently or in the past, returns would have been lower. See current prospectus for more information.
| 34 | Invesco Peak Retirement™ Funds |
Invesco Peak Retirement™ 2050 Fund’s Long-Term Performance
Results of a $10,000 Investment – Oldest Share Class(es)
Fund and index data from 12/29/17
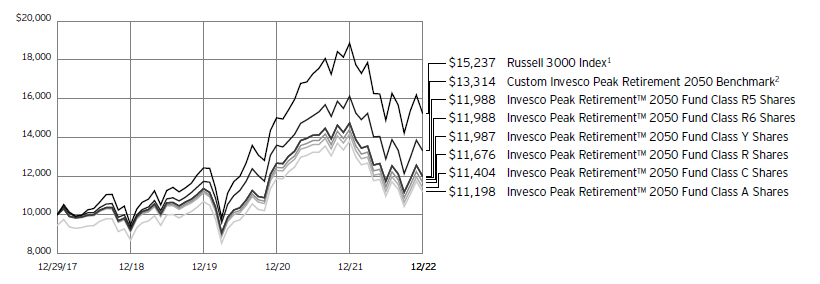
1 Source: RIMES Technologies Corp.
2 Source: Invesco, RIMES Technologies Corp.
Past performance cannot guarantee future results.
The data shown in the chart include reinvested distributions, applicable sales charges and Fund expenses including
management fees. Index results include reinvested dividends, but they do not reflect sales charges. Performance of the peer group, if applicable, reflects fund expenses and management fees;
performance of a market index does not. Performance shown in the chart does not reflect deduction of taxes a shareholder would pay on Fund distributions or sale of Fund shares.
| 35 | Invesco Peak Retirement™ Funds |
Average Annual Total Returns |
| |||
As of 12/31/22, including maximum applicable sales charges |
| |||
Class A Shares | ||||
Inception (12/29/17) | 2.29 | % | ||
5 Years | 2.29 | |||
1 Year | -23.30 | |||
Class C Shares | ||||
Inception (12/29/17) | 2.66 | % | ||
5 Years | 2.66 | |||
1 Year | -20.27 | |||
Class R Shares | ||||
Inception (12/29/17) | 3.14 | % | ||
5 Years | 3.15 | |||
1 Year | -18.97 | |||
Class Y Shares | ||||
Inception (12/29/17) | 3.69 | % | ||
5 Years | 3.69 | |||
1 Year | -18.67 | |||
Class R5 Shares | ||||
Inception (12/29/17) | 3.69 | % | ||
5 Years | 3.69 | |||
1 Year | -18.67 | |||
Class R6 Shares | ||||
Inception (12/29/17) | 3.69 | % | ||
5 Years | 3.69 | |||
1 Year | -18.67 | |||
The performance data quoted represent past performance and cannot guarantee future results; current performance may be lower or higher. Please visit invesco.com/performance for the most recent month-end performance. Performance figures reflect reinvested distributions, changes in net asset value and the effect of the maximum sales charge unless otherwise stated. Performance figures do not reflect deduction of taxes a shareholder would pay on Fund distributions or sale of Fund shares. Investment return and principal value will fluctuate so that you may have a gain or loss when you sell shares.
Class A share performance reflects the maximum 5.50% sales charge, and Class C share performance reflects the applicable contingent deferred sales charge (CDSC) for the period involved. The CDSC on Class C shares is 1% for the first year after purchase. Class R, Class Y, Class R5 and Class R6 class shares do not have a front-end sales charge or a CDSC; therefore, performance is at net asset value.
The performance of the Fund’s share classes will differ primarily due to
different sales charge structures and class expenses.
Fund performance reflects any applicable fee waivers and/or expense reimbursements. Had the adviser not waived fees and/or reimbursed expenses currently or in the past, returns would have been lower. See current prospectus for more information.
| 36 | Invesco Peak Retirement™ Funds |
Invesco Peak Retirement™ 2055 Fund’s Long-Term Performance
Results of a $10,000 Investment – Oldest Share Class(es)
Fund and index data from 12/29/17
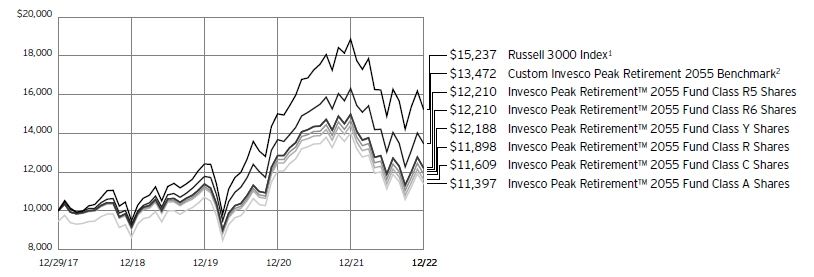
1 Source: RIMES Technologies Corp.
2 Source: Invesco, RIMES Technologies Corp.
Past performance cannot guarantee future results.
The data shown in the chart include reinvested distributions, applicable sales charges and Fund expenses including
management fees. Index results include reinvested dividends, but they do not reflect sales charges. Performance of the peer group, if applicable, reflects fund expenses and management fees;
performance of a market index does not. Performance shown in the chart does not reflect deduction of taxes a shareholder would pay on Fund distributions or sale of Fund shares.
| 37 | Invesco Peak Retirement™ Funds |
Average Annual Total Returns |
| |||
As of 12/31/22, including maximum applicable sales charges |
| |||
Class A Shares | ||||
Inception (12/29/17) | 2.65 | % | ||
5 Years | 2.65 | |||
1 Year | -23.22 | |||
Class C Shares | ||||
Inception (12/29/17) | 3.03 | % | ||
5 Years | 3.03 | |||
1 Year | -20.18 | |||
Class R Shares | ||||
Inception (12/29/17) | 3.53 | % | ||
5 Years | 3.54 | |||
1 Year | -18.88 | |||
Class Y Shares | ||||
Inception (12/29/17) | 4.03 | % | ||
5 Years | 4.04 | |||
1 Year | -18.56 | |||
Class R5 Shares | ||||
Inception (12/29/17) | 4.07 | % | ||
5 Years | 4.07 | |||
1 Year | -18.53 | |||
Class R6 Shares | ||||
Inception (12/29/17) | 4.07 | % | ||
5 Years | 4.07 | |||
1 Year | -18.53 | |||
The performance data quoted represent past performance and cannot guarantee future results; current performance may be lower or higher. Please visit invesco.com/performance for the most recent month-end performance. Performance figures reflect reinvested distributions, changes in net asset value and the effect of the maximum sales charge unless otherwise stated. Performance figures do not reflect deduction of taxes a shareholder would pay on Fund distributions or sale of Fund shares. Investment return and principal value will fluctuate so that you may have a gain or loss when you sell shares.
Class A share performance reflects the maximum 5.50% sales charge, and Class C share performance reflects the applicable contingent deferred sales charge (CDSC) for the period involved. The CDSC on Class C shares is 1% for the first year after purchase. Class R, Class Y, Class R5 and Class R6 class shares do not have a front-end sales charge or a CDSC; therefore, performance is at net asset value.
The performance of the Fund’s share classes will differ primarily due to
different sales charge structures and class expenses.
Fund performance reflects any applicable fee waivers and/or expense reimbursements. Had the adviser not waived fees and/or reimbursed expenses currently or in the past, returns would have been lower. See current prospectus for more information.
| 38 | Invesco Peak Retirement™ Funds |
Invesco Peak Retirement™ 2060 Fund’s Long-Term Performance
Results of a $10,000 Investment – Oldest Share Class(es)
Fund and index data from 12/29/17
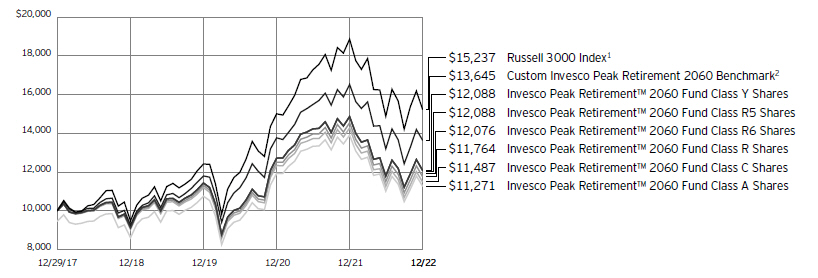
1 Source: RIMES Technologies Corp.
2 Source: Invesco, RIMES Technologies Corp.
Past performance cannot guarantee future results.
The data shown in the chart include reinvested distributions, applicable sales charges and Fund expenses including
management fees. Index results include reinvested dividends, but they do not reflect sales charges. Performance of the peer group, if applicable, reflects fund expenses and management fees;
performance of a market index does not. Performance shown in the chart does not reflect deduction of taxes a shareholder would pay on Fund distributions or sale of Fund shares.
| 39 | Invesco Peak Retirement™ Funds |
Average Annual Total Returns |
| |||
As of 12/31/22, including maximum applicable sales charges |
| |||
Class A Shares | ||||
Inception (12/29/17) | 2.42 | % | ||
5 Years | 2.42 | |||
1 Year | -23.41 | |||
Class C Shares | ||||
Inception (12/29/17) | 2.81 | % | ||
5 Years | 2.81 | |||
1 Year | -20.31 | |||
Class R Shares | ||||
Inception (12/29/17) | 3.30 | % | ||
5 Years | 3.30 | |||
1 Year | -19.14 | |||
Class Y Shares | ||||
Inception (12/29/17) | 3.86 | % | ||
5 Years | 3.87 | |||
1 Year | -18.70 | |||
Class R5 Shares | ||||
Inception (12/29/17) | 3.86 | % | ||
5 Years | 3.86 | |||
1 Year | -18.70 | |||
Class R6 Shares | ||||
Inception (12/29/17) | 3.84 | % | ||
5 Years | 3.85 | |||
1 Year | -18.77 | |||
The performance data quoted represent past performance and cannot guarantee future results; current performance may be lower or higher. Please visit invesco.com/performance for the most recent month-end performance. Performance figures reflect reinvested distributions, changes in net asset value and the effect of the maximum sales charge unless otherwise stated. Performance figures do not reflect deduction of taxes a shareholder would pay on Fund distributions or sale of Fund shares. Investment return and principal value will fluctuate so that you may have a gain or loss when you sell shares.
Class A share performance reflects the maximum 5.50% sales charge, and Class C share performance reflects the applicable contingent deferred sales charge (CDSC) for the period involved. The CDSC on Class C shares is 1% for the first year after purchase. Class R, Class Y, Class R5 and Class R6 class shares do not have a front-end sales charge or a CDSC; therefore, performance is at net asset value.
The performance of the Fund’s share classes will differ primarily due to
different sales charge structures and class expenses.
Fund performance reflects any applicable fee waivers and/or expense reimbursements. Had the adviser not waived fees and/or reimbursed expenses currently or in the past, returns would have been lower. See current prospectus for more information.
| 40 | Invesco Peak Retirement™ Funds |
Invesco Peak Retirement™ 2065 Fund’s Long-Term Performance
Results of a $10,000 Investment – Oldest Share Class(es)
Fund and index data from 12/29/17

1 Source: RIMES Technologies Corp.
2 Source: Invesco, RIMES Technologies Corp.
Past performance cannot guarantee future results.
The data shown in the chart include reinvested distributions, applicable sales charges and Fund expenses including
management fees. Index results include reinvested dividends, but they do not reflect sales charges. Performance of the peer group, if applicable, reflects fund expenses and management fees;
performance of a market index does not. Performance shown in the chart does not reflect deduction of taxes a shareholder would pay on Fund distributions or sale of Fund shares.
| 41 | Invesco Peak Retirement™ Funds |
Average Annual Total Returns |
| |||
As of 12/31/22, including maximum applicable sales charges |
| |||
Class A Shares | ||||
Inception (12/29/17) | 3.01 | % | ||
5 Years | 3.01 | |||
1 Year | -23.48 | |||
Class C Shares | ||||
Inception (12/29/17) | 3.18 | % | ||
5 Years | 3.18 | |||
1 Year | -20.31 | |||
Class R Shares | ||||
Inception (12/29/17) | 3.69 | % | ||
5 Years | 3.69 | |||
1 Year | -19.20 | |||
Class Y Shares | ||||
Inception (12/29/17) | 4.22 | % | ||
5 Years | 4.23 | |||
1 Year | -18.80 | |||
Class R5 Shares | ||||
Inception (12/29/17) | 4.22 | % | ||
5 Years | 4.23 | |||
1 Year | -18.80 | |||
Class R6 Shares | ||||
Inception (12/29/17) | 4.22 | % | ||
5 Years | 4.23 | |||
1 Year | -18.80 | |||
The performance data quoted represent past performance and cannot guarantee future results; current performance may be lower or higher. Please visit invesco.com/performance for the most recent month-end performance. Performance figures reflect reinvested distributions, changes in net asset value and the effect of the maximum sales charge unless otherwise stated. Performance figures do not reflect deduction of taxes a shareholder would pay on Fund distributions or sale of Fund shares. Investment return and principal value will fluctuate so that you may have a gain or loss when you sell shares.
Class A share performance reflects the maximum 5.50% sales charge, and Class C share performance reflects the applicable contingent deferred sales charge (CDSC) for the period involved. The CDSC on Class C shares is 1% for the first year after purchase. Class R, Class Y, Class R5 and Class R6 class shares do not have a front-end sales charge or a CDSC; therefore, performance is at net asset value.
The performance of the Fund’s share classes will differ primarily due to
different sales charge structures and class expenses.
Fund performance reflects any applicable fee waivers and/or expense reimbursements. Had the adviser not waived fees and/or reimbursed expenses currently or in the past, returns would have been lower. See current prospectus for more information.
| 42 | Invesco Peak Retirement™ Funds |
Each of the Peak Retirement Fund’s investment objective is total return over time, consistent with its strategic target allocation.
| ∎ | Unless otherwise stated, information presented in this report is as of December 31, 2022, and is based on total net assets. |
| ∎ | Unless otherwise noted, all data is provided by Invesco. |
| ∎ | To access your Fund’s reports/prospectus, visit invesco.com/fundreports. |
About indexes used in this report
| ∎ | The Bloomberg U.S. Aggregate Bond Index is an unmanaged index considered representative of the US investment-grade, fixed-rate bond market. |
| ∎ | The Russell 3000® Index is an unmanaged index considered representative of the US stock market. The Russell 3000 Index is a trademark/ service mark of the Frank Russell Co. Russell® is a trademark of the Frank Russell Co. |
| ∎ | The Custom Invesco Peak Retirement Destination Benchmark, Custom Invesco Peak Retirement 2010 Benchmark, Custom Invesco Peak Retirement 2015 Benchmark and Custom Invesco Peak Retirement 2020 Benchmark were created by Invesco to serve as style-specific benchmarks for the Invesco Peak RetirementTM Destination Fund, Invesco Peak RetirementTM 2010 Fund, Invesco Peak RetirementTM 2015 Fund and Invesco Peak RetirementTM 2020 Fund, respectively. Each benchmark is composed of the following indexes: Russell 3000 Index, MSCI EAFE Index, Bloomberg U.S. Aggregate Bond Index and the Bloomberg U.S. Treasury Bellwethers (3 Month) Index. |
| ∎ | The Custom Invesco Peak Retirement 2025 Benchmark, Custom Invesco Peak Retirement 2030 Benchmark, Custom Invesco Peak Retirement 2035 Benchmark, Custom Invesco Peak Retirement 2040 Benchmark, Custom Invesco Peak Retirement 2045 Benchmark, Custom Invesco Peak Retirement 2050 Benchmark, Custom Invesco Peak Retirement 2055 Benchmark, Custom Invesco Peak Retirement 2060 Benchmark and Custom Invesco Peak Retirement 2065 Benchmark were created by Invesco to serve as style-specific benchmarks for the |
Invesco Peak RetirementTM 2025 Fund, Invesco Peak RetirementTM 2030 Fund, Invesco Peak RetirementTM 2035 Fund, Invesco Peak RetirementTM 2040 Fund, Invesco Peak RetirementTM 2045 Fund, Invesco Peak RetirementTM 2050 Fund, Invesco Peak RetirementTM 2055 Fund, Invesco Peak RetirementTM 2060 Fund and Invesco Peak RetirementTM 2065 Fund, respectively. Each benchmark is composed of the following indexes: Russell 3000 Index, MSCI EAFE Index and Bloomberg U.S. Aggregate Bond Index. |
| ∎ | The Fund is not managed to track the performance of any particular index, including the index(es) described here, and consequently, the performance of the Fund may deviate significantly from the performance of the index(es). |
| ∎ | A direct investment cannot be made in an index. Unless otherwise indicated, index results include reinvested dividends, and they do not reflect sales charges. Performance of the peer group, if applicable, reflects fund expenses; performance of a market index does not. |
This report must be accompanied or preceded by a currently effective Fund prospectus, which contains more complete information, including sales charges and expenses. Investors should read it carefully before investing.
|
NOT FDIC INSURED | MAY LOSE VALUE | NO BANK GUARANTEE
| 43 | Invesco Peak Retirement™ Funds |
Portfolio Composition*
Invesco Peak Retirement™ Destination Fund |
| ||||
| By fund type, based on total investments | |||||
Money Market Funds | 99.70 | % | |||
Fixed Income Funds | 0.30 | ||||
Invesco Peak Retirement™ 2010 Fund |
| ||||
| By fund type, based on total investments | |||||
Money Market Funds | 99.69 | % | |||
Fixed Income Funds | 0.30 | ||||
Equity Funds | 0.01 | ||||
Invesco Peak Retirement™ 2015 Fund |
| ||||
| By fund type, based on total investments | |||||
Money Market Funds | 99.71 | % | |||
Fixed Income Funds | 0.29 | ||||
Invesco Peak Retirement™ 2020 Fund |
| ||||
| By fund type, based on total investments | |||||
Money Market Funds | 94.14 | % | |||
Equity Funds | 5.56 | ||||
Fixed Income Funds | 0.30 | ||||
Invesco Peak Retirement™ 2025 Fund |
| ||||
| By fund type, based on total investments | |||||
Money Market Funds | 88.36 | % | |||
Equity Funds | 11.38 | ||||
Fixed Income Funds | 0.26 | ||||
Invesco Peak Retirement™ 2030 Fund |
| ||||
| By fund type, based on total investments | |||||
Money Market Funds | 87.14 | % | |||
Equity Funds | 12.77 | ||||
Fixed Income Funds | 0.09 | ||||
Invesco Peak Retirement™ 2035 Fund |
| ||||
| By fund type, based on total investments | |||||
Money Market Funds | 85.73 | % | |||
Equity Funds | 14.17 | ||||
Fixed Income Funds | 0.10 | ||||
Invesco Peak Retirement™ 2040 Fund |
| ||||
| By fund type, based on total investments | |||||
Money Market Funds | 83.51 | % | |||
Equity Funds | 16.43 | ||||
Fixed Income Funds | 0.06 | ||||
Invesco Peak Retirement™ 2045 Fund |
| |||
| By fund type, based on total investments | ||||
Money Market Funds | 84.53 | % | ||
Equity Funds | 15.43 | |||
Fixed Income Funds | 0.04 | |||
Invesco Peak Retirement™ 2050 Fund |
| |||
| By fund type, based on total investments | ||||
Money Market Funds | 85.52 | % | ||
Equity Funds | 14.45 | |||
Fixed Income Funds | 0.03 | |||
Invesco Peak Retirement™ 2055 Fund |
| |||
| By fund type, based on total investments | ||||
Money Market Funds | 87.71 | % | ||
Equity Funds | 12.26 | |||
Fixed Income Funds | 0.03 | |||
Invesco Peak Retirement™ 2060 Fund |
| |||
| By fund type, based on total investments | ||||
Money Market Funds | 86.62 | % | ||
Equity Funds | 13.35 | |||
Fixed Income Funds | 0.03 | |||
Invesco Peak Retirement™ 2065 Fund |
| |||
| By fund type, based on total investments | ||||
Money Market Funds | 86.31 | % | ||
Equity Funds | 13.66 | |||
Fixed Income Funds | 0.03 | |||
| * | Based on the Schedule of Investments, which classifies each underlying fund and other investments into broad asset classes based on their predominant investments. |
The Fund’s holdings are subject to change, and there is no assurance that the Fund will continue to hold any particular security. Data presented here are as of December 31, 2022.
| 44 | Invesco Peak Retirement™ Funds |
December 31, 2022
Invesco Peak Retirement™ Destination Fund
Schedule of Investments in Affiliated Issuers–105.17%(a)
| % of | Change in | |||||||||||||||||||||||||||||||||||
| Net | Unrealized | |||||||||||||||||||||||||||||||||||
| Assets | Value | Purchases | Proceeds | Appreciation | Realized | Dividend | Shares | Value | ||||||||||||||||||||||||||||
| 12/31/22 | 12/31/21 | at Cost | from Sales | (Depreciation) | Gain (Loss) | Income | 12/31/22 | 12/31/22 | ||||||||||||||||||||||||||||
| ||||||||||||||||||||||||||||||||||||
Alternative Funds–0.00% | ||||||||||||||||||||||||||||||||||||
Invesco Global Real Estate Income Fund, Class R6(b) | 0.00 | % | $ | 372,819 | $ | 158,066 | $ | (439,153 | ) | $ | (43,293 | ) | $ | (44,967 | ) | $ | 5,087 | 1 | $ | 8 | ||||||||||||||||
| ||||||||||||||||||||||||||||||||||||
Invesco Multi-Asset Income Fund, Class R6 | - | 201,619 | 69,536 | (222,762 | ) | (3,119 | ) | (45,274 | ) | 12,545 | - | - | ||||||||||||||||||||||||
| ||||||||||||||||||||||||||||||||||||
Total Alternative Funds | 574,438 | 227,602 | (661,915 | ) | (46,412 | ) | (90,241 | ) | 17,632 | 8 | ||||||||||||||||||||||||||
| ||||||||||||||||||||||||||||||||||||
Domestic Equity Funds–0.00% | ||||||||||||||||||||||||||||||||||||
Invesco PureBetaSM MSCI USA ETF | - | - | 186,701 | (162,487 | ) | - | (24,214 | ) | 1,693 | - | - | |||||||||||||||||||||||||
| ||||||||||||||||||||||||||||||||||||
Invesco S&P 500® Enhanced Value ETF | - | 432,173 | 112,201 | (516,453 | ) | (90,077 | ) | 62,156 | 9,089 | - | - | |||||||||||||||||||||||||
| ||||||||||||||||||||||||||||||||||||
Invesco S&P 500® High Dividend Low Volatility ETF | - | 544,492 | 153,321 | (689,173 | ) | (74,156 | ) | 65,516 | 18,742 | - | - | |||||||||||||||||||||||||
| ||||||||||||||||||||||||||||||||||||
Total Domestic Equity Funds | 976,665 | 452,223 | (1,368,113 | ) | (164,233 | ) | 103,458 | 29,524 | - | |||||||||||||||||||||||||||
| ||||||||||||||||||||||||||||||||||||
Fixed Income Funds–0.32% | ||||||||||||||||||||||||||||||||||||
Invesco Core Plus Bond Fund, Class R6 | 0.06 | % | 424,429 | 159,663 | (502,290 | ) | 6,571 | (86,581 | ) | 13,683 | 197 | 1,792 | ||||||||||||||||||||||||
| ||||||||||||||||||||||||||||||||||||
Invesco Floating Rate ESG Fund, Class R6 | 0.15 | % | 300,333 | 73,760 | (344,313 | ) | (8,042 | ) | (16,956 | ) | 17,490 | 720 | 4,782 | |||||||||||||||||||||||
| ||||||||||||||||||||||||||||||||||||
Invesco High Yield Bond Factor ETF(b) | - | 336,808 | 78,340 | (362,405 | ) | 1,257 | (52,766 | ) | 13,812 | - | - | |||||||||||||||||||||||||
| ||||||||||||||||||||||||||||||||||||
Invesco Income Fund, Class R6 | 0.02 | % | 300,088 | 81,145 | (340,575 | ) | (12,122 | ) | (27,760 | ) | 10,118 | 113 | 776 | |||||||||||||||||||||||
| ||||||||||||||||||||||||||||||||||||
Invesco Intermediate Bond Factor Fund, Class R6 | 0.07 | % | 199,563 | 74,466 | (237,969 | ) | (663 | ) | (33,187 | ) | 6,157 | 244 | 2,210 | |||||||||||||||||||||||
| ||||||||||||||||||||||||||||||||||||
Invesco International Bond Fund, Class R6(b) | 0.02 | % | 277,190 | 105,491 | (330,854 | ) | 8,655 | (51,741 | ) | 1,370 | 134 | 576 | ||||||||||||||||||||||||
| ||||||||||||||||||||||||||||||||||||
Invesco Short Duration Inflation Protected Fund, Class R6 | - | 225,495 | 67,841 | (269,052 | ) | (329 | ) | (23,955 | ) | 14,634 | - | - | ||||||||||||||||||||||||
| ||||||||||||||||||||||||||||||||||||
Invesco Taxable Municipal Bond ETF | - | 545,686 | 230,172 | (645,407 | ) | (12,068 | ) | (118,383 | ) | 15,846 | - | - | ||||||||||||||||||||||||
| ||||||||||||||||||||||||||||||||||||
Invesco Variable Rate Preferred ETF | - | 225,763 | 46,648 | (244,600 | ) | (7,769 | ) | (20,042 | ) | 7,976 | - | - | ||||||||||||||||||||||||
| ||||||||||||||||||||||||||||||||||||
Total Fixed Income Funds | 2,835,355 | 917,526 | (3,277,465 | ) | (24,510 | ) | (431,371 | ) | 101,086 | 10,136 | ||||||||||||||||||||||||||
| ||||||||||||||||||||||||||||||||||||
Foreign Equity Funds–0.00% | ||||||||||||||||||||||||||||||||||||
Invesco S&P International Developed Low Volatility ETF | - | 404,075 | 133,344 | (468,018 | ) | (19,394 | ) | (50,007 | ) | 16,222 | - | - | ||||||||||||||||||||||||
| ||||||||||||||||||||||||||||||||||||
Money Market Funds–104.85% | ||||||||||||||||||||||||||||||||||||
Invesco Government & Agency Portfolio, Institutional Class, 4.22%(c) | 52.32 | % | 121,437 | 2,902,937 | (1,363,441 | ) | - | - | 2,573 | 1,660,933 | 1,660,933 | |||||||||||||||||||||||||
| ||||||||||||||||||||||||||||||||||||
Invesco Liquid Assets Portfolio, Institutional Class, 4.42%(c) | 52.53 | % | 135,061 | 2,902,937 | (1,370,234 | ) | (1 | ) | (21 | ) | 2,833 | 1,667,242 | 1,667,742 | |||||||||||||||||||||||
| ||||||||||||||||||||||||||||||||||||
Total Money Market Funds | 256,498 | 5,805,874 | (2,733,675 | ) | (1 | ) | (21 | ) | 5,406 | 3,328,675 | ||||||||||||||||||||||||||
| ||||||||||||||||||||||||||||||||||||
TOTAL INVESTMENTS IN AFFILIATED ISSUERS (excluding investments purchased with cash collateral from securities on loan) (Cost $3,338,823) | 105.17 | % | 5,047,031 | 7,536,569 | (8,509,186 | ) | (254,550 | ) | (468,182 | ) | 169,870 | 3,338,819 | ||||||||||||||||||||||||
| ||||||||||||||||||||||||||||||||||||
Investments Purchased with Cash Collateral from Securities on Loan | ||||||||||||||||||||||||||||||||||||
Money Market Funds–0.00% | ||||||||||||||||||||||||||||||||||||
Invesco Private Government Fund, 4.28%(c) | - | - | 1,413,787 | (1,413,787 | ) | - | - | 149 | (d) | - | - | |||||||||||||||||||||||||
| ||||||||||||||||||||||||||||||||||||
Invesco Private Prime Fund, 4.46%(c) | - | - | 3,311,971 | (3,312,005 | ) | - | 34 | 811 | (d) | - | - | |||||||||||||||||||||||||
| ||||||||||||||||||||||||||||||||||||
Total Investments Purchased with Cash Collateral from Securities on Loan (Cost $0) | 0.00 | % | - | 4,725,758 | (4,725,792 | ) | - | 34 | 960 | - | ||||||||||||||||||||||||||
| ||||||||||||||||||||||||||||||||||||
TOTAL INVESTMENTS IN AFFILIATED ISSUERS (Cost $3,338,823) | 105.17 | % | $ | 5,047,031 | $ | 12,262,327 | $ | (13,234,978 | ) | $ | (254,550 | ) | $ | (468,148 | ) | $ | 170,830 | $ | 3,338,819 | |||||||||||||||||
| ||||||||||||||||||||||||||||||||||||
OTHER ASSETS LESS LIABILITIES | (5.17 | )% | (164,211 | ) | ||||||||||||||||||||||||||||||||
| ||||||||||||||||||||||||||||||||||||
NET ASSETS | 100.00 | % | $ | 3,174,608 | ||||||||||||||||||||||||||||||||
| ||||||||||||||||||||||||||||||||||||
Investment Abbreviations:
ETF - Exchange-Traded Fund
See accompanying Notes to Financial Statements which are an integral part of the financial statements.
| 45 | Invesco Peak Retirement™ Funds |
Schedule of Investments–(continued)
December 31, 2022
Notes to Schedule of Investments:
| (a) | Each underlying fund and the Fund are affiliated by either having the same investment adviser or an investment adviser under common control with the Fund’s investment adviser. |
| (b) | Amounts include a return of capital distribution reclassification which reduces dividend income and increases realized gain (loss) and/or change in unrealized appreciation (depreciation). |
| (c) | The rate shown is the 7-day SEC standardized yield as of December 31, 2022. |
| (d) | Represents the income earned on the investment of cash collateral, which is included in securities lending income on the Statements of Operations. Does not include rebates and fees paid to lending agent or premiums received from borrowers, if any. |
See accompanying Notes to Financial Statements which are an integral part of the financial statements.
| 46 | Invesco Peak Retirement™ Funds |
Schedule of Investments
December 31, 2022
Invesco Peak Retirement™ 2010 Fund
Schedule of Investments in Affiliated Issuers–100.09%(a)
| % of | Change in | |||||||||||||||||||||||||||||||||||
| Net | Unrealized | |||||||||||||||||||||||||||||||||||
| Assets | Value | Purchases | Proceeds | Appreciation | Realized | Dividend | Shares | Value | ||||||||||||||||||||||||||||
| 12/31/22 | 12/31/21 | at Cost | from Sales | (Depreciation) | Gain (Loss) | Income | 12/31/22 | 12/31/22 | ||||||||||||||||||||||||||||
| ||||||||||||||||||||||||||||||||||||
Alternative Funds–0.00% | ||||||||||||||||||||||||||||||||||||
Invesco Global Real Estate Income Fund, Class R6(b) | - | $ | 34,489 | $ | 17,804 | $ | (42,581 | ) | $ | (1,715 | ) | $ | (7,616 | ) | $ | 554 | - | $ | - | |||||||||||||||||
| ||||||||||||||||||||||||||||||||||||
Invesco Multi-Asset Income Fund, Class R6 | - | 16,259 | 10,396 | (21,891 | ) | 83 | (4,847 | ) | 1,264 | - | - | |||||||||||||||||||||||||
| ||||||||||||||||||||||||||||||||||||
Total Alternative Funds | 50,748 | 28,200 | (64,472 | ) | (1,632 | ) | (12,463 | ) | 1,818 | - | ||||||||||||||||||||||||||
| ||||||||||||||||||||||||||||||||||||
Domestic Equity Funds–0.01% | ||||||||||||||||||||||||||||||||||||
Invesco Main Street Small Cap Fund, Class R6 | 0.01 | % | 5,121 | 1,979 | (6,278 | ) | 257 | (1,062 | ) | 22 | 1 | 17 | ||||||||||||||||||||||||
| ||||||||||||||||||||||||||||||||||||
Invesco PureBetaSM MSCI USA ETF | - | - | 19,686 | (17,216 | ) | - | (2,470 | ) | 187 | - | - | |||||||||||||||||||||||||
| ||||||||||||||||||||||||||||||||||||
Invesco S&P 500® Enhanced Value ETF | - | 53,844 | 20,439 | (70,553 | ) | (2,559 | ) | (1,171 | ) | 1,275 | - | - | ||||||||||||||||||||||||
| ||||||||||||||||||||||||||||||||||||
Invesco S&P 500® High Dividend Low Volatility ETF | - | 65,249 | 24,706 | (88,229 | ) | (1,874 | ) | 148 | 2,500 | - | - | |||||||||||||||||||||||||
| ||||||||||||||||||||||||||||||||||||
Total Domestic Equity Funds | 124,214 | 66,810 | (182,276 | ) | (4,176 | ) | (4,555 | ) | 3,984 | 17 | ||||||||||||||||||||||||||
| ||||||||||||||||||||||||||||||||||||
Fixed Income Funds–0.30% | ||||||||||||||||||||||||||||||||||||
Invesco Core Plus Bond Fund, Class R6 | 0.05 | % | 47,477 | 20,758 | (58,182 | ) | 815 | (10,665 | ) | 1,683 | 22 | 203 | ||||||||||||||||||||||||
| ||||||||||||||||||||||||||||||||||||
Invesco Floating Rate ESG Fund, Class R6 | 0.14 | % | 33,672 | 12,850 | (42,975 | ) | 118 | (3,126 | ) | 2,135 | 82 | 539 | ||||||||||||||||||||||||
| ||||||||||||||||||||||||||||||||||||
Invesco High Yield Bond Factor ETF(b) | - | 36,478 | 11,690 | (41,992 | ) | 399 | (6,424 | ) | 1,666 | - | - | |||||||||||||||||||||||||
| ||||||||||||||||||||||||||||||||||||
Invesco Income Fund, Class R6 | 0.02 | % | 30,889 | 11,822 | (37,990 | ) | 345 | (4,986 | ) | 1,167 | 12 | 80 | ||||||||||||||||||||||||
| ||||||||||||||||||||||||||||||||||||
Invesco Intermediate Bond Factor Fund, Class R6 | 0.07 | % | 21,492 | 10,236 | (27,329 | ) | 127 | (4,277 | ) | 740 | 27 | 249 | ||||||||||||||||||||||||
| ||||||||||||||||||||||||||||||||||||
Invesco International Bond Fund, Class R6(b) | 0.02 | % | 28,349 | 12,335 | (34,680 | ) | 988 | (5,976 | ) | 143 | 14 | 62 | ||||||||||||||||||||||||
| ||||||||||||||||||||||||||||||||||||
Invesco Short Duration Inflation Protected Fund, Class R6 | - | 24,406 | 10,757 | (32,041 | ) | 450 | (3,572 | ) | 1,872 | - | - | |||||||||||||||||||||||||
| ||||||||||||||||||||||||||||||||||||
Invesco Taxable Municipal Bond ETF | - | 61,504 | 25,771 | (71,161 | ) | (271 | ) | (15,843 | ) | 1,941 | - | - | ||||||||||||||||||||||||
| ||||||||||||||||||||||||||||||||||||
Invesco Variable Rate Preferred ETF | - | 22,628 | 5,915 | (25,548 | ) | 194 | (3,189 | ) | 927 | - | - | |||||||||||||||||||||||||
| ||||||||||||||||||||||||||||||||||||
Total Fixed Income Funds | 306,895 | 122,134 | (371,898 | ) | 3,165 | (58,058 | ) | 12,274 | 1,133 | |||||||||||||||||||||||||||
| ||||||||||||||||||||||||||||||||||||
Foreign Equity Funds–0.01% | ||||||||||||||||||||||||||||||||||||
Invesco Developing Markets Fund, Class R6 | 0.01 | % | 6,304 | 1,897 | (6,430 | ) | 987 | (2,734 | ) | 56 | 1 | 24 | ||||||||||||||||||||||||
| ||||||||||||||||||||||||||||||||||||
Invesco S&P International Developed Low Volatility ETF | - | 43,954 | 19,634 | (54,755 | ) | (969 | ) | (7,864 | ) | 2,014 | - | - | ||||||||||||||||||||||||
| ||||||||||||||||||||||||||||||||||||
Total Foreign Equity Funds | 50,258 | 21,531 | (61,185 | ) | 18 | (10,598 | ) | 2,070 | 24 | |||||||||||||||||||||||||||
| ||||||||||||||||||||||||||||||||||||
Money Market Funds–99.77% | ||||||||||||||||||||||||||||||||||||
Invesco Government & Agency Portfolio, Institutional Class, 4.22%(c) | 34.92 | % | 10,297 | 252,362 | (131,839 | ) | - | - | 152 | 130,820 | 130,820 | |||||||||||||||||||||||||
| ||||||||||||||||||||||||||||||||||||
Invesco Liquid Assets Portfolio, Institutional Class, 4.42%(c) | 24.94 | % | 7,353 | 180,258 | (94,168 | ) | 1 | (1 | ) | 184 | 93,414 | 93,443 | ||||||||||||||||||||||||
| ||||||||||||||||||||||||||||||||||||
Invesco Treasury Portfolio, Institutional Class, 4.20%(c) | 39.91 | % | 11,768 | 288,413 | (150,673 | ) | - | - | 261 | 149,508 | 149,508 | |||||||||||||||||||||||||
| ||||||||||||||||||||||||||||||||||||
Total Money Market Funds | 29,418 | 721,033 | (376,680 | ) | 1 | (1 | ) | 597 | 373,771 | |||||||||||||||||||||||||||
| ||||||||||||||||||||||||||||||||||||
TOTAL INVESTMENTS IN AFFILIATED ISSUERS (excluding investments purchased with cash collateral from securities on loan) | 100.09 | % | 561,533 | 959,708 | (1,056,511 | ) | (2,624 | ) | (85,675 | ) | 20,743 | 374,945 | ||||||||||||||||||||||||
| ||||||||||||||||||||||||||||||||||||
Investments Purchased with Cash Collateral from Securities on Loan | ||||||||||||||||||||||||||||||||||||
Money Market Funds–0.00% | ||||||||||||||||||||||||||||||||||||
Invesco Private Government Fund, 4.28%(c) | - | - | 23,699 | (23,699 | ) | - | - | 8 | (d) | - | - | |||||||||||||||||||||||||
| ||||||||||||||||||||||||||||||||||||
Invesco Private Prime Fund, 4.46%(c) | - | - | 57,902 | (57,902 | ) | - | - | 21 | (d) | - | - | |||||||||||||||||||||||||
| ||||||||||||||||||||||||||||||||||||
Total Investments Purchased with Cash Collateral from Securities on Loan | 0.00 | % | - | 81,601 | (81,601 | ) | - | - | 29 | - | ||||||||||||||||||||||||||
| ||||||||||||||||||||||||||||||||||||
TOTAL INVESTMENTS IN AFFILIATED ISSUERS (Cost $374,942) | 100.09 | % | $ | 561,533 | $ | 1,041,309 | $ | (1,138,112 | ) | $ | (2,624 | ) | $ | (85,675 | ) | $ | 20,772 | $ | 374,945 | |||||||||||||||||
| ||||||||||||||||||||||||||||||||||||
OTHER ASSETS LESS LIABILITIES | (0.09 | )% | (321 | ) | ||||||||||||||||||||||||||||||||
| ||||||||||||||||||||||||||||||||||||
NET ASSETS | 100.00 | % | $ | 374,624 | ||||||||||||||||||||||||||||||||
| ||||||||||||||||||||||||||||||||||||
Investment Abbreviations:
ETF - Exchange-Traded Fund
See accompanying Notes to Financial Statements which are an integral part of the financial statements.
| 47 | Invesco Peak Retirement™ Funds |
Schedule of Investments–(continued)
December 31, 2022
Notes to Schedule of Investments:
| (a) | Each underlying fund and the Fund are affiliated by either having the same investment adviser or an investment adviser under common control with the Fund’s investment adviser. |
| (b) | Amounts include a return of capital distribution reclassification which reduces dividend income and increases realized gain (loss) and/or change in unrealized appreciation (depreciation). |
| (c) | The rate shown is the 7-day SEC standardized yield as of December 31, 2022. |
| (d) | Represents the income earned on the investment of cash collateral, which is included in securities lending income on the Statements of Operations. Does not include rebates and fees paid to lending agent or premiums received from borrowers, if any. |
See accompanying Notes to Financial Statements which are an integral part of the financial statements.
| 48 | Invesco Peak Retirement™ Funds |
Schedule of Investments
December 31, 2022
Invesco Peak Retirement™ 2015 Fund
Schedule of Investments in Affiliated Issuers–100.16%(a)
| % of | Change in | |||||||||||||||||||||||||||||||||||
| Net | Unrealized | |||||||||||||||||||||||||||||||||||
| Assets | Value | Purchases | Proceeds | Appreciation | Realized | Dividend | Shares | Value | ||||||||||||||||||||||||||||
| 12/31/22 | 12/31/21 | at Cost | from Sales | (Depreciation) | Gain (Loss) | Income | 12/31/22 | 12/31/22 | ||||||||||||||||||||||||||||
| ||||||||||||||||||||||||||||||||||||
Alternative Funds–0.00% | ||||||||||||||||||||||||||||||||||||
Invesco Global Real Estate Income Fund, Class R6(b) | - | $ | 74,415 | $ | 23,874 | $ | (79,383 | ) | $ | (10,675 | ) | $ | (7,475 | ) | $ | 1,023 | - | $ | - | |||||||||||||||||
| ||||||||||||||||||||||||||||||||||||
Invesco Multi-Asset Income Fund, Class R6 | - | 32,671 | 9,989 | (33,964 | ) | (456 | ) | (8,240 | ) | 2,235 | - | - | ||||||||||||||||||||||||
| ||||||||||||||||||||||||||||||||||||
Total Alternative Funds | 107,086 | 33,863 | (113,347 | ) | (11,131 | ) | (15,715 | ) | 3,258 | - | ||||||||||||||||||||||||||
| ||||||||||||||||||||||||||||||||||||
Domestic Equity Funds–0.00% | ||||||||||||||||||||||||||||||||||||
Invesco Main Street Small Cap Fund, Class R6 | - | 54,735 | 12,092 | (58,761 | ) | (279 | ) | (7,787 | ) | 181 | - | - | ||||||||||||||||||||||||
| ||||||||||||||||||||||||||||||||||||
Invesco PureBetaSM MSCI USA ETF | - | - | 41,847 | (36,582 | ) | - | (5,265 | ) | 373 | - | - | |||||||||||||||||||||||||
| ||||||||||||||||||||||||||||||||||||
Invesco S&P 500® Enhanced Value ETF | - | 165,264 | 22,516 | (176,563 | ) | (31,574 | ) | 20,357 | 3,329 | - | - | |||||||||||||||||||||||||
| ||||||||||||||||||||||||||||||||||||
Invesco S&P 500® High Dividend Low Volatility ETF | - | 203,307 | 22,720 | (222,196 | ) | (23,579 | ) | 19,748 | 6,768 | - | - | |||||||||||||||||||||||||
| ||||||||||||||||||||||||||||||||||||
Total Domestic Equity Funds | 423,306 | 99,175 | (494,102 | ) | (55,432 | ) | 27,053 | 10,651 | - | |||||||||||||||||||||||||||
| ||||||||||||||||||||||||||||||||||||
Fixed Income Funds–0.29% | ||||||||||||||||||||||||||||||||||||
Invesco Core Plus Bond Fund, Class R6 | 0.05 | % | 139,327 | 24,942 | (137,734 | ) | 1,814 | (27,852 | ) | 4,335 | 55 | 497 | ||||||||||||||||||||||||
| ||||||||||||||||||||||||||||||||||||
Invesco Floating Rate ESG Fund, Class R6 | 0.14 | % | 99,121 | 14,713 | (104,680 | ) | (1,275 | ) | (6,525 | ) | 5,432 | 198 | 1,354 | |||||||||||||||||||||||
| ||||||||||||||||||||||||||||||||||||
Invesco High Yield Bond Factor ETF(b) | - | 102,530 | 16,268 | (102,244 | ) | 179 | (16,341 | ) | 4,325 | - | - | |||||||||||||||||||||||||
| ||||||||||||||||||||||||||||||||||||
Invesco Income Fund, Class R6 | 0.02 | % | 73,977 | 12,391 | (76,250 | ) | (4,092 | ) | (5,857 | ) | 2,545 | 25 | 169 | |||||||||||||||||||||||
| ||||||||||||||||||||||||||||||||||||
Invesco Intermediate Bond Factor Fund, Class R6 | 0.07 | % | 64,528 | 11,974 | (64,928 | ) | (379 | ) | (10,582 | ) | 1,892 | 68 | 613 | |||||||||||||||||||||||
| ||||||||||||||||||||||||||||||||||||
Invesco International Bond Fund, Class R6(b) | 0.01 | % | 74,264 | 18,017 | (77,809 | ) | 605 | (12,735 | ) | 334 | 31 | 132 | ||||||||||||||||||||||||
| ||||||||||||||||||||||||||||||||||||
Invesco Short Duration Inflation Protected Fund, Class R6 | 0.00 | % | 73,961 | 10,465 | (76,579 | ) | (95 | ) | (7,744 | ) | 4,765 | 1 | 8 | |||||||||||||||||||||||
| ||||||||||||||||||||||||||||||||||||
Invesco Taxable Municipal Bond ETF | - | 180,390 | 40,640 | (178,379 | ) | (4,397 | ) | (38,254 | ) | 5,058 | - | - | ||||||||||||||||||||||||
| ||||||||||||||||||||||||||||||||||||
Invesco Variable Rate Preferred ETF | - | 57,594 | 9,390 | (59,555 | ) | (1,625 | ) | (5,804 | ) | 2,150 | - | - | ||||||||||||||||||||||||
| ||||||||||||||||||||||||||||||||||||
Total Fixed Income Funds | 865,692 | 158,800 | (878,158 | ) | (9,265 | ) | (131,694 | ) | 30,836 | 2,773 | ||||||||||||||||||||||||||
| ||||||||||||||||||||||||||||||||||||
Foreign Equity Funds–0.00% | ||||||||||||||||||||||||||||||||||||
Invesco EQV Emerging Markets All Cap Fund, Class R6(c) | - | 24,681 | 3,336 | (23,999 | ) | 2,615 | (6,633 | ) | 213 | - | - | |||||||||||||||||||||||||
| ||||||||||||||||||||||||||||||||||||
Invesco Developing Markets Fund, Class R6 | - | 24,876 | 5,895 | (24,012 | ) | 2,871 | (9,630 | ) | 183 | - | - | |||||||||||||||||||||||||
| ||||||||||||||||||||||||||||||||||||
Invesco S&P International Developed Low Volatility ETF | - | 124,520 | 22,180 | (124,934 | ) | (5,958 | ) | (15,808 | ) | 4,886 | - | - | ||||||||||||||||||||||||
| ||||||||||||||||||||||||||||||||||||
Total Foreign Equity Funds | 174,077 | 31,411 | (172,945 | ) | (472 | ) | (32,071 | ) | 5,282 | - | ||||||||||||||||||||||||||
| ||||||||||||||||||||||||||||||||||||
Money Market Funds–99.87% | ||||||||||||||||||||||||||||||||||||
Invesco Government & Agency Portfolio, Institutional Class, 4.22%(d) | 49.95 | % | 43,354 | 876,043 | (445,399 | ) | - | - | 769 | 473,998 | 473,998 | |||||||||||||||||||||||||
| ||||||||||||||||||||||||||||||||||||
Invesco Liquid Assets Portfolio, Institutional Class, 4.42%(d) | 49.92 | % | 43,051 | 876,044 | (445,399 | ) | 3 | (7 | ) | 787 | 473,550 | 473,692 | ||||||||||||||||||||||||
| ||||||||||||||||||||||||||||||||||||
Total Money Market Funds | 86,405 | 1,752,087 | (890,798 | ) | 3 | (7 | ) | 1,556 | 947,690 | |||||||||||||||||||||||||||
| ||||||||||||||||||||||||||||||||||||
TOTAL INVESTMENTS IN AFFILIATED ISSUERS (excluding investments purchased with cash collateral from securities on loan) (Cost $950,462) | 100.16 | % | 1,656,566 | 2,075,336 | (2,549,350 | ) | (76,297 | ) | (152,434 | ) | 51,583 | 950,463 | ||||||||||||||||||||||||
| ||||||||||||||||||||||||||||||||||||
Investments Purchased with Cash Collateral from Securities on Loan | ||||||||||||||||||||||||||||||||||||
Money Market Funds–0.00% | ||||||||||||||||||||||||||||||||||||
Invesco Private Government Fund, 4.28%(d) | - | - | 113,566 | (113,566 | ) | - | - | 31 | (e) | - | - | |||||||||||||||||||||||||
| ||||||||||||||||||||||||||||||||||||
Invesco Private Prime Fund, 4.46%(d) | - | - | 256,372 | (256,375 | ) | - | 3 | 86 | (e) | - | - | |||||||||||||||||||||||||
| ||||||||||||||||||||||||||||||||||||
Total Investments Purchased with Cash Collateral from Securities on Loan (Cost $0) | 0.00 | % | - | 369,938 | (369,941 | ) | - | 3 | 117 | - | ||||||||||||||||||||||||||
| ||||||||||||||||||||||||||||||||||||
TOTAL INVESTMENTS IN AFFILIATED ISSUERS (Cost $950,462) | 100.16 | % | $ | 1,656,566 | $ | 2,445,274 | $ | (2,919,291 | ) | $ | (76,297 | ) | $ | (152,431 | ) | $ | 51,700 | $ | 950,463 | |||||||||||||||||
| ||||||||||||||||||||||||||||||||||||
OTHER ASSETS LESS LIABILITIES | (0.16 | )% | (1,544 | ) | ||||||||||||||||||||||||||||||||
| ||||||||||||||||||||||||||||||||||||
NET ASSETS | 100.00 | % | $ | 948,919 | ||||||||||||||||||||||||||||||||
| ||||||||||||||||||||||||||||||||||||
Investment Abbreviations:
ETF - Exchange-Traded Fund
See accompanying Notes to Financial Statements which are an integral part of the financial statements.
| 49 | Invesco Peak Retirement™ Funds |
Schedule of Investments–(continued)
December 31, 2022
Notes to Schedule of Investments:
| (a) | Each underlying fund and the Fund are affiliated by either having the same investment adviser or an investment adviser under common control with the Fund’s investment adviser. |
| (b) | Amounts include a return of capital distribution reclassification which reduces dividend income and increases realized gain (loss) and/or change in unrealized appreciation (depreciation). |
| (c) | Effective February 28, 2022, the underlying fund’s name changed. |
| (d) | The rate shown is the 7-day SEC standardized yield as of December 31, 2022. |
| (e) | Represents the income earned on the investment of cash collateral, which is included in securities lending income on the Statements of Operations. Does not include rebates and fees paid to lending agent or premiums received from borrowers, if any. |
See accompanying Notes to Financial Statements which are an integral part of the financial statements.
| 50 | Invesco Peak Retirement™ Funds |
Schedule of Investments
December 31, 2022
Invesco Peak Retirement™ 2020 Fund
Schedule of Investments in Affiliated Issuers–100.61%(a)
| % of | Change in | |||||||||||||||||||||||||||||||||||
| Net | Unrealized | |||||||||||||||||||||||||||||||||||
| Assets | Value | Purchases | Proceeds | Appreciation | Realized | Dividend | Shares | Value | ||||||||||||||||||||||||||||
| 12/31/22 | 12/31/21 | at Cost | from Sales | (Depreciation) | Gain (Loss) | Income | 12/31/22 | 12/31/22 | ||||||||||||||||||||||||||||
| ||||||||||||||||||||||||||||||||||||
Alternative Funds–0.00% | ||||||||||||||||||||||||||||||||||||
Invesco Global Real Estate Income Fund, Class R6(b) | 0.00 | % | $ | 382,843 | $ | 63,783 | $ | (356,843 | ) | $ | (54,407 | ) | $ | (31,883 | ) | $ | 4,785 | 1 | $ | 5 | ||||||||||||||||
| ||||||||||||||||||||||||||||||||||||
Invesco Macro Allocation Strategy Fund, Class R6(c) | 0.00 | % | 123,136 | - | (111,407 | ) | 4,440 | (16,164 | ) | - | 1 | 5 | ||||||||||||||||||||||||
| ||||||||||||||||||||||||||||||||||||
Invesco Multi-Asset Income Fund, Class R6 | 0.00 | % | 125,351 | 39,551 | (131,834 | ) | (1,050 | ) | (32,013 | ) | 8,349 | 1 | 5 | |||||||||||||||||||||||
| ||||||||||||||||||||||||||||||||||||
Total Alternative Funds | 631,330 | 103,334 | (600,084 | ) | (51,017 | ) | (80,060 | ) | 13,134 | 15 | ||||||||||||||||||||||||||
| ||||||||||||||||||||||||||||||||||||
Domestic Equity Funds–5.59% | ||||||||||||||||||||||||||||||||||||
Invesco Main Street Small Cap Fund, Class R6 | 0.00 | % | 586,764 | 88,068 | (587,338 | ) | (3,043 | ) | (84,438 | ) | 1,912 | 1 | 13 | |||||||||||||||||||||||
| ||||||||||||||||||||||||||||||||||||
Invesco PureBetaSM MSCI USA ETF | - | 624,487 | 365,732 | (845,841 | ) | (138,321 | ) | (6,057 | ) | 8,831 | - | - | ||||||||||||||||||||||||
| ||||||||||||||||||||||||||||||||||||
Invesco Russell 1000® Dynamic Multifactor ETF | - | 821,239 | 55,776 | (778,078 | ) | (158,781 | ) | 59,844 | 7,175 | - | - | |||||||||||||||||||||||||
| ||||||||||||||||||||||||||||||||||||
Invesco S&P 500® Enhanced Value ETF | - | 379,840 | 203,338 | (540,957 | ) | (73,414 | ) | 31,193 | 9,964 | - | - | |||||||||||||||||||||||||
| ||||||||||||||||||||||||||||||||||||
Invesco S&P 500® High Dividend Low Volatility ETF | - | 514,109 | 248,589 | (748,228 | ) | (70,188 | ) | 55,718 | 21,775 | - | - | |||||||||||||||||||||||||
| ||||||||||||||||||||||||||||||||||||
Invesco U.S. Managed Volatility Fund, Class R6 | 5.59 | % | 820,799 | 93,799 | (443,495 | ) | (162,861 | ) | 36,613 | 7,590 | 28,759 | 317,819 | ||||||||||||||||||||||||
| ||||||||||||||||||||||||||||||||||||
Total Domestic Equity Funds | 3,747,238 | 1,055,302 | (3,943,937 | ) | (606,608 | ) | 92,873 | 57,247 | 317,832 | |||||||||||||||||||||||||||
| ||||||||||||||||||||||||||||||||||||
Fixed Income Funds–0.30% | ||||||||||||||||||||||||||||||||||||
Invesco Core Plus Bond Fund, Class R6 | 0.06 | % | 1,060,678 | 156,474 | (1,031,697 | ) | 19,795 | (201,730 | ) | 29,545 | 386 | 3,520 | ||||||||||||||||||||||||
| ||||||||||||||||||||||||||||||||||||
Invesco Floating Rate ESG Fund, Class R6 | 0.14 | % | 628,753 | 95,944 | (669,731 | ) | (15,423 | ) | (31,401 | ) | 32,521 | 1,226 | 8,142 | |||||||||||||||||||||||
| ||||||||||||||||||||||||||||||||||||
Invesco High Yield Bond Factor ETF(b) | - | 749,467 | 56,078 | (692,963 | ) | 1,690 | (111,645 | ) | 29,011 | - | - | |||||||||||||||||||||||||
| ||||||||||||||||||||||||||||||||||||
Invesco Income Fund, Class R6 | 0.01 | % | 186,630 | 99,925 | (255,103 | ) | (16,093 | ) | (14,822 | ) | 7,820 | 78 | 537 | |||||||||||||||||||||||
| ||||||||||||||||||||||||||||||||||||
Invesco Intermediate Bond Factor Fund, Class R6 | 0.08 | % | 493,721 | 76,693 | (489,029 | ) | (2,768 | ) | (74,272 | ) | 13,074 | 480 | 4,345 | |||||||||||||||||||||||
| ||||||||||||||||||||||||||||||||||||
Invesco International Bond Fund, Class R6(b) | 0.01 | % | 375,455 | 94,575 | (396,949 | ) | 2,371 | (64,059 | ) | 1,628 | 157 | 675 | ||||||||||||||||||||||||
| ||||||||||||||||||||||||||||||||||||
Invesco Short Duration Inflation Protected Fund, Class R6 | 0.00 | % | 563,057 | 78,480 | (588,114 | ) | 1,383 | (54,799 | ) | 32,098 | 1 | 7 | ||||||||||||||||||||||||
| ||||||||||||||||||||||||||||||||||||
Invesco Taxable Municipal Bond ETF | - | 1,373,344 | 238,571 | (1,315,355 | ) | (14,357 | ) | (282,203 | ) | 34,638 | - | - | ||||||||||||||||||||||||
| ||||||||||||||||||||||||||||||||||||
Invesco Variable Rate Investment Grade ETF | - | 499,346 | 23,041 | (516,849 | ) | (5,090 | ) | (448 | ) | 7,083 | - | - | ||||||||||||||||||||||||
| ||||||||||||||||||||||||||||||||||||
Invesco Variable Rate Preferred ETF | - | 185,898 | 59,624 | (214,953 | ) | (1,063 | ) | (29,506 | ) | 9,143 | - | - | ||||||||||||||||||||||||
| ||||||||||||||||||||||||||||||||||||
Total Fixed Income Funds | 6,116,349 | 979,405 | (6,170,743 | ) | (29,555 | ) | (864,885 | ) | 196,561 | 17,226 | ||||||||||||||||||||||||||
| ||||||||||||||||||||||||||||||||||||
Foreign Equity Funds–0.00% | ||||||||||||||||||||||||||||||||||||
Invesco EQV Emerging Markets All Cap Fund, Class R6(d) | - | 407,005 | 75,615 | (419,320 | ) | 44,576 | (107,876 | ) | 2,614 | - | - | |||||||||||||||||||||||||
| ||||||||||||||||||||||||||||||||||||
Invesco Developing Markets Fund, Class R6 | - | 409,798 | 66,351 | (389,634 | ) | 48,761 | (135,276 | ) | 1,866 | - | - | |||||||||||||||||||||||||
| ||||||||||||||||||||||||||||||||||||
Invesco International Small-Mid Company Fund, Class R6 | - | 194,395 | �� | 27,162 | (168,292 | ) | (9,859 | ) | (43,157 | ) | 384 | - | - | |||||||||||||||||||||||
| ||||||||||||||||||||||||||||||||||||
Invesco RAFI™ Strategic Developed ex-US ETF | - | 313,297 | 12,365 | (301,793 | ) | (19,262 | ) | (4,607 | ) | 6,476 | - | - | ||||||||||||||||||||||||
| ||||||||||||||||||||||||||||||||||||
Invesco S&P International Developed Low Volatility ETF | - | 187,338 | 174,434 | (308,714 | ) | (10,791 | ) | (42,267 | ) | 11,688 | - | - | ||||||||||||||||||||||||
| ||||||||||||||||||||||||||||||||||||
Total Foreign Equity Funds | 1,511,833 | 355,927 | (1,587,753 | ) | 53,425 | (333,183 | ) | 23,028 | - | |||||||||||||||||||||||||||
| ||||||||||||||||||||||||||||||||||||
Money Market Funds–94.72% | ||||||||||||||||||||||||||||||||||||
Invesco Government & Agency Portfolio, Institutional Class, | 47.15 | % | 319,469 | 5,865,143 | (3,504,597 | ) | - | - | 4,332 | 2,680,015 | 2,680,015 | |||||||||||||||||||||||||
| ||||||||||||||||||||||||||||||||||||
Invesco Liquid Assets Portfolio, Institutional Class, 4.42%(e) | 47.57 | % | 343,753 | 5,865,144 | (3,504,597 | ) | 24 | (97 | ) | 4,857 | 2,703,416 | 2,704,227 | ||||||||||||||||||||||||
| ||||||||||||||||||||||||||||||||||||
Total Money Market Funds | 663,222 | 11,730,287 | (7,009,194 | ) | 24 | (97 | ) | 9,189 | 5,384,242 | |||||||||||||||||||||||||||
| ||||||||||||||||||||||||||||||||||||
TOTAL INVESTMENTS IN AFFILIATED ISSUERS (excluding investments purchased with cash collateral from securities on loan) (Cost $5,756,592) | 100.61 | % | 12,669,972 | 14,224,255 | (19,311,711 | ) | (633,731 | ) | (1,185,352 | ) | 299,159 | 5,719,315 | ||||||||||||||||||||||||
| ||||||||||||||||||||||||||||||||||||
See accompanying Notes to Financial Statements which are an integral part of the financial statements.
| 51 | Invesco Peak Retirement™ Funds |
Schedule of Investments–(continued)
December 31, 2022
Invesco Peak Retirement™ 2020 Fund (continued)
Schedule of Investments in Affiliated Issuers–100.61%(a)
| % of | Change in | |||||||||||||||||||||||||||||||||||
| Net | Unrealized | |||||||||||||||||||||||||||||||||||
| Assets | Value | Purchases | Proceeds | Appreciation | Realized | Dividend | Shares | Value | ||||||||||||||||||||||||||||
| 12/31/22 | 12/31/21 | at Cost | from Sales | (Depreciation) | Gain (Loss) | Income | 12/31/22 | 12/31/22 | ||||||||||||||||||||||||||||
| ||||||||||||||||||||||||||||||||||||
Investments Purchased with Cash Collateral from Securities on Loan | ||||||||||||||||||||||||||||||||||||
Money Market Funds–0.00% | ||||||||||||||||||||||||||||||||||||
Invesco Private Government Fund, 4.28%(e) | - | $ | - | $ | 1,348,420 | $ | (1,348,420 | ) | $ | - | $ | - | $ | 350 | (f) | - | $ | - | ||||||||||||||||||
| ||||||||||||||||||||||||||||||||||||
Invesco Private Prime Fund, 4.46%(e) | - | - | 3,262,539 | (3,262,597 | ) | - | 58 | 977 | (f) | - | - | |||||||||||||||||||||||||
| ||||||||||||||||||||||||||||||||||||
Total Investments Purchased with Cash Collateral from Securities on Loan (Cost $0) | 0.00 | % | - | 4,610,959 | (4,611,017 | ) | - | 58 | 1,327 | - | ||||||||||||||||||||||||||
| ||||||||||||||||||||||||||||||||||||
TOTAL INVESTMENTS IN AFFILIATED ISSUERS (Cost $5,756,592) | 100.61 | % | $ | 12,669,972 | $ | 18,835,214 | $ | (23,922,728 | ) | $ | (633,731 | ) | $ | (1,185,294 | )(g) | $ | 300,486 | $ | 5,719,315 | |||||||||||||||||
| ||||||||||||||||||||||||||||||||||||
OTHER ASSETS LESS LIABILITIES | (0.61 | )% | (34,596 | ) | ||||||||||||||||||||||||||||||||
| ||||||||||||||||||||||||||||||||||||
NET ASSETS | 100.00 | % | $ | 5,684,719 | ||||||||||||||||||||||||||||||||
| ||||||||||||||||||||||||||||||||||||
Investment Abbreviations:
ETF - Exchange-Traded Fund
Notes to Schedule of Investments:
| (a) | Each underlying fund and the Fund are affiliated by either having the same investment adviser or an investment adviser under common control with the Fund’s investment adviser. |
| (b) | Amounts include a return of capital distribution reclassification which reduces dividend income and increases realized gain (loss) and/or change in unrealized appreciation (depreciation). |
| (c) | Non-income producing security. |
| (d) | Effective February 28, 2022, the underlying fund’s name changed. |
| (e) | The rate shown is the 7-day SEC standardized yield as of December 31, 2022. |
| (f) | Represents the income earned on the investment of cash collateral, which is included in securities lending income on the Statements of Operations. Does not include rebates and fees paid to lending agent or premiums received from borrowers, if any. |
| (g) | Includes capital gains distributions from affiliated underlying funds as follows: |
| Fund Name | Capital Gain | |||
| ||||
Invesco International Small-Mid Company Fund | $ | 249 | ||
Invesco U.S. Managed Volatility Fund | 27,036 | |||
| ||||
See accompanying Notes to Financial Statements which are an integral part of the financial statements.
| 52 | Invesco Peak Retirement™ Funds |
Schedule of Investments
December 31, 2022
Invesco Peak Retirement™ 2025 Fund
Schedule of Investments in Affiliated Issuers–100.43%(a)
| % of | Change in | |||||||||||||||||||||||||||||||||||
| Net | Unrealized | |||||||||||||||||||||||||||||||||||
| Assets | Value | Purchases | Proceeds | Appreciation | Realized | Dividend | Shares | Value | ||||||||||||||||||||||||||||
| 12/31/22 | 12/31/21 | at Cost | from Sales | (Depreciation) | Gain (Loss) | Income | 12/31/22 | 12/31/22 | ||||||||||||||||||||||||||||
| ||||||||||||||||||||||||||||||||||||
Alternative Funds–0.00% | ||||||||||||||||||||||||||||||||||||
Invesco Global Real Estate Income Fund, Class R6(b) | - | $ | 740,583 | $ | 121,441 | $ | (683,842 | ) | $ | (115,044 | ) | $ | (56,102 | ) | $ | 9,040 | - | $ | - | |||||||||||||||||
| ||||||||||||||||||||||||||||||||||||
Invesco Macro Allocation Strategy Fund, Class R6(c) | - | 492,821 | 23,268 | (462,227 | ) | 18,940 | (72,802 | ) | - | - | - | |||||||||||||||||||||||||
| ||||||||||||||||||||||||||||||||||||
Invesco Multi-Asset Income Fund, Class R6 | 0.00 | % | - | 55,338 | (44,204 | ) | - | (11,128 | ) | 2,918 | 1 | 6 | ||||||||||||||||||||||||
| ||||||||||||||||||||||||||||||||||||
Total Alternative Funds | 1,233,404 | 200,047 | (1,190,273 | ) | (96,104 | ) | (140,032 | ) | 11,958 | 6 | ||||||||||||||||||||||||||
| ||||||||||||||||||||||||||||||||||||
Domestic Equity Funds–11.43% | ||||||||||||||||||||||||||||||||||||
Invesco Discovery Mid Cap Growth Fund, Class R6(c) | 0.00 | % | 736,567 | 154,845 | ` (680,988 | ) | (30,733 | ) | (179,672 | ) | - | 1 | 19 | |||||||||||||||||||||||
| ||||||||||||||||||||||||||||||||||||
Invesco Main Street Small Cap Fund, Class R6 | 0.00 | % | 1,289,724 | 320,142 | (1,405,811 | ) | 854 | (204,896 | ) | 3,904 | 1 | 13 | ||||||||||||||||||||||||
| ||||||||||||||||||||||||||||||||||||
Invesco PureBetaSM MSCI USA ETF | - | 1,476,437 | 972,180 | (2,061,095 | ) | (372,225 | ) | (15,297 | ) | 24,574 | - | - | ||||||||||||||||||||||||
| ||||||||||||||||||||||||||||||||||||
Invesco Russell 1000® Dynamic Multifactor ETF | - | 2,150,998 | 378,560 | (2,222,294 | ) | (553,060 | ) | 245,796 | 24,409 | - | - | |||||||||||||||||||||||||
| ||||||||||||||||||||||||||||||||||||
Invesco S&P 500® Enhanced Value ETF | - | - | 149,618 | (133,326 | ) | - | (16,292 | ) | 2,826 | - | - | |||||||||||||||||||||||||
| ||||||||||||||||||||||||||||||||||||
Invesco S&P 500® High Dividend Low Volatility ETF | - | - | 199,454 | (192,138 | ) | - | (7,316 | ) | 6,542 | - | - | |||||||||||||||||||||||||
| ||||||||||||||||||||||||||||||||||||
Invesco U.S. Managed Volatility Fund, Class R6 | 11.43 | % | 3,436,423 | 565,969 | (2,286,672 | ) | (634,334 | ) | 50,422 | 30,215 | 92,685 | 1,024,177 | ||||||||||||||||||||||||
| ||||||||||||||||||||||||||||||||||||
Total Domestic Equity Funds | 9,090,149 | 2,740,768 | (8,982,324 | ) | (1,589,498 | ) | (127,255 | ) | 92,470 | 1,024,209 | ||||||||||||||||||||||||||
| ||||||||||||||||||||||||||||||||||||
Fixed Income Funds–0.26% | ||||||||||||||||||||||||||||||||||||
Invesco Core Plus Bond Fund, Class R6 | 0.05 | % | 1,726,190 | 395,137 | (1,778,990 | ) | 27,123 | (364,588 | ) | 53,871 | 535 | 4,872 | ||||||||||||||||||||||||
| ||||||||||||||||||||||||||||||||||||
Invesco Floating Rate ESG Fund, Class R6 | 0.12 | % | 991,922 | 120,761 | (1,022,312 | ) | (45,764 | ) | (33,943 | ) | 53,709 | 1,606 | 10,664 | |||||||||||||||||||||||
| ||||||||||||||||||||||||||||||||||||
Invesco High Yield Bond Factor ETF(b) | - | 1,228,913 | 139,148 | (1,148,769 | ) | 4,340 | (218,337 | ) | 57,378 | - | - | |||||||||||||||||||||||||
| ||||||||||||||||||||||||||||||||||||
Invesco Income Fund, Class R6 | 0.01 | % | 493,541 | 26,032 | (458,416 | ) | (43,759 | ) | (16,616 | ) | 15,060 | 114 | 782 | |||||||||||||||||||||||
| ||||||||||||||||||||||||||||||||||||
Invesco Intermediate Bond Factor Fund, Class R6 | 0.07 | % | 863,932 | 121,673 | (834,259 | ) | (2,913 | ) | (142,133 | ) | 23,387 | 695 | 6,300 | |||||||||||||||||||||||
| ||||||||||||||||||||||||||||||||||||
Invesco International Bond Fund, Class R6(b) | 0.01 | % | 493,458 | 150,016 | (538,062 | ) | (8,744 | ) | (80,189 | ) | 2,073 | 170 | 732 | |||||||||||||||||||||||
| ||||||||||||||||||||||||||||||||||||
Invesco Short Duration Inflation Protected Fund, Class R6 | 0.00 | % | 984,485 | 160,755 | (1,037,007 | ) | 5,512 | (113,736 | ) | 64,093 | 1 | 9 | ||||||||||||||||||||||||
| ||||||||||||||||||||||||||||||||||||
Invesco Taxable Municipal Bond ETF | - | 2,706,477 | 775,561 | (2,837,515 | ) | (33,610 | ) | (610,913 | ) | 74,147 | - | - | ||||||||||||||||||||||||
| ||||||||||||||||||||||||||||||||||||
Invesco Variable Rate Investment Grade ETF | - | 1,107,752 | 65,307 | (1,155,627 | ) | (13,100 | ) | (4,332 | ) | 20,338 | - | - | ||||||||||||||||||||||||
| ||||||||||||||||||||||||||||||||||||
Invesco Variable Rate Preferred ETF | - | - | 78,579 | (67,920 | ) | - | (10,659 | ) | 3,331 | - | - | |||||||||||||||||||||||||
| ||||||||||||||||||||||||||||||||||||
Total Fixed Income Funds | 10,596,670 | 2,032,969 | (10,878,877 | ) | (110,915 | ) | (1,595,446 | ) | 367,387 | 23,359 | ||||||||||||||||||||||||||
| ||||||||||||||||||||||||||||||||||||
Foreign Equity Funds–0.00% | ||||||||||||||||||||||||||||||||||||
Invesco EQV Emerging Markets All Cap Fund, Class R6(d) | 0.00 | % | 985,018 | 137,197 | (940,553 | ) | 112,768 | (294,410 | ) | 5,411 | 1 | 20 | ||||||||||||||||||||||||
| ||||||||||||||||||||||||||||||||||||
Invesco Developing Markets Fund, Class R6 | 0.00 | % | 986,155 | 167,464 | (918,478 | ) | 129,401 | (364,515 | ) | 3,606 | 1 | 27 | ||||||||||||||||||||||||
| ||||||||||||||||||||||||||||||||||||
Invesco International Small-Mid Company Fund, Class R6 | 0.00 | % | 368,952 | 122,313 | (358,586 | ) | (23,441 | ) | (108,681 | ) | 813 | 1 | 30 | |||||||||||||||||||||||
| ||||||||||||||||||||||||||||||||||||
Invesco PureBetaSM FTSE Developed ex-North America ETF | - | 245,879 | 86,960 | (288,924 | ) | (28,085 | ) | (15,830 | ) | 6,679 | - | - | ||||||||||||||||||||||||
| ||||||||||||||||||||||||||||||||||||
Invesco RAFI™ Strategic Developed ex-US ETF | - | 738,383 | 80,141 | (737,229 | ) | (46,254 | ) | (35,041 | ) | 21,068 | - | - | ||||||||||||||||||||||||
| ||||||||||||||||||||||||||||||||||||
Invesco S&P International Developed Low Volatility ETF | - | 369,187 | 20,521 | (325,470 | ) | (26,343 | ) | (37,895 | ) | 14,090 | - | - | ||||||||||||||||||||||||
| ||||||||||||||||||||||||||||||||||||
Total Foreign Equity Funds | 3,693,574 | 614,596 | (3,569,240 | ) | 118,046 | (856,372 | ) | 51,667 | 77 | |||||||||||||||||||||||||||
| ||||||||||||||||||||||||||||||||||||
Money Market Funds–88.74% | ||||||||||||||||||||||||||||||||||||
Invesco Government & Agency Portfolio, Institutional Class, 4.22%(e) | 31.08 | % | 44 | 7,095,866 | (4,311,348 | ) | - | - | 3,210 | 2,784,562 | 2,784,562 | |||||||||||||||||||||||||
| ||||||||||||||||||||||||||||||||||||
Invesco Liquid Assets Portfolio, Institutional Class, 4.42%(e) | 22.15 | % | - | 5,068,476 | (3,083,678 | ) | (16 | ) | 6 | 2,375 | 1,984,192 | 1,984,788 | ||||||||||||||||||||||||
| ||||||||||||||||||||||||||||||||||||
Invesco Treasury Portfolio, Institutional Class, 4.20%(e) | 35.51 | % | 50 | 8,109,561 | (4,927,254 | ) | - | - | 3,626 | 3,182,357 | 3,182,357 | |||||||||||||||||||||||||
| ||||||||||||||||||||||||||||||||||||
Total Money Market Funds | 94 | 20,273,903 | (12,322,280 | ) | (16 | ) | 6 | 9,211 | 7,951,707 | |||||||||||||||||||||||||||
| ||||||||||||||||||||||||||||||||||||
TOTAL INVESTMENTS IN AFFILIATED ISSUERS (excluding investments purchased with cash collateral from securities on loan) (Cost $9,077,665) | 100.43 | % | 24,613,891 | 25,862,283 | (36,942,994 | ) | (1,678,487 | ) | (2,719,099 | ) | 532,693 | 8,999,358 | ||||||||||||||||||||||||
| ||||||||||||||||||||||||||||||||||||
See accompanying Notes to Financial Statements which are an integral part of the financial statements.
| 53 | Invesco Peak Retirement™ Funds |
Schedule of Investments–(continued)
December 31, 2022
Invesco Peak Retirement™ 2025 Fund (continued)
Schedule of Investments in Affiliated Issuers–100.43%(a)
| % of | Change in | |||||||||||||||||||||||||||||||||||
| Net | Unrealized | |||||||||||||||||||||||||||||||||||
| Assets | Value | Purchases | Proceeds | Appreciation | Realized | Dividend | Shares | Value | ||||||||||||||||||||||||||||
| 12/31/22 | 12/31/21 | at Cost | from Sales | (Depreciation) | Gain (Loss) | Income | 12/31/22 | 12/31/22 | ||||||||||||||||||||||||||||
| ||||||||||||||||||||||||||||||||||||
Investments Purchased with Cash Collateral from Securities on Loan | ||||||||||||||||||||||||||||||||||||
Money Market Funds–0.00% | ||||||||||||||||||||||||||||||||||||
Invesco Private Government Fund, 4.28%(e) | - | $ | - | $ | 946,440 | $ | (946,440 | ) | $ | - | $ | - | $ | 130 | (f) | - | $ | - | ||||||||||||||||||
| ||||||||||||||||||||||||||||||||||||
Invesco Private Prime Fund, 4.46%(e) | - | - | 1,789,159 | (1,789,207 | ) | - | 48 | 363 | (f) | - | - | |||||||||||||||||||||||||
| ||||||||||||||||||||||||||||||||||||
Total Investments Purchased with Cash Collateral from Securities on Loan (Cost $0) | 0.00 | % | - | 2,735,599 | (2,735,647 | ) | - | 48 | 493 | - | ||||||||||||||||||||||||||
| ||||||||||||||||||||||||||||||||||||
TOTAL INVESTMENTS IN AFFILIATED ISSUERS (Cost $9,077,665) | 100.43 | % | $ | 24,613,891 | $ | 28,597,882 | $ | (39,678,641 | ) | $ | (1,678,487 | ) | $ | (2,719,051 | )(g) | $ | 533,186 | $ | 8,999,358 | |||||||||||||||||
| ||||||||||||||||||||||||||||||||||||
OTHER ASSETS LESS LIABILITIES | (0.43 | )% | (38,561 | ) | ||||||||||||||||||||||||||||||||
| ||||||||||||||||||||||||||||||||||||
NET ASSETS | 100.00 | % | $ | 8,960,797 | ||||||||||||||||||||||||||||||||
| ||||||||||||||||||||||||||||||||||||
Investment Abbreviations:
ETF - Exchange-Traded Fund
Notes to Schedule of Investments:
| (a) | Each underlying fund and the Fund are affiliated by either having the same investment adviser or an investment adviser under common control with the Fund’s investment adviser. |
| (b) | Amounts include a return of capital distribution reclassification which reduces dividend income and increases realized gain (loss) and/or change in unrealized appreciation (depreciation). |
| (c) | Non-income producing security. |
| (d) | Effective February 28, 2022, the underlying fund’s name changed. |
| (e) | The rate shown is the 7-day SEC standardized yield as of December 31, 2022. |
| (f) | Represents the income earned on the investment of cash collateral, which is included in securities lending income on the Statements of Operations. Does not include rebates and fees paid to lending agent or premiums received from borrowers, if any. |
| (g) | Includes capital gains distributions from affiliated underlying funds as follows: |
| Fund Name | Capital Gain | |||
| ||||
Invesco International Small-Mid Company Fund | $ | 527 | ||
Invesco U.S. Managed Volatility Fund | 107,631 | |||
| ||||
See accompanying Notes to Financial Statements which are an integral part of the financial statements.
| 54 | Invesco Peak Retirement™ Funds |
Schedule of Investments
December 31, 2022
Invesco Peak Retirement™ 2030 Fund
Schedule of Investments in Affiliated Issuers–100.70%(a)
| % of | Change in | |||||||||||||||||||||||||||||||||||
| Net | Unrealized | |||||||||||||||||||||||||||||||||||
| Assets | Value | Purchases | Proceeds | Appreciation | Realized | Dividend | Shares | Value | ||||||||||||||||||||||||||||
| 12/31/22 | 12/31/21 | at Cost | from Sales | (Depreciation) | Gain (Loss) | Income | 12/31/22 | 12/31/22 | ||||||||||||||||||||||||||||
| ||||||||||||||||||||||||||||||||||||
Alternative Funds–0.00% | ||||||||||||||||||||||||||||||||||||
Invesco Global Real Estate Income Fund, Class R6(b) | - | $ | 1,205,879 | $ | 185,713 | $ | (1,094,996 | ) | $ | (179,513 | ) | $ | (106,159 | ) | $ | 16,108 | - | $ | - | |||||||||||||||||
| ||||||||||||||||||||||||||||||||||||
Invesco Macro Allocation Strategy Fund, Class R6(c) | 0.00 | % | 750,559 | 78,817 | (734,323 | ) | 34,343 | (129,392 | ) | - | 1 | 4 | ||||||||||||||||||||||||
| ||||||||||||||||||||||||||||||||||||
Total Alternative Funds | 1,956,438 | 264,530 | (1,829,319 | ) | (145,170 | ) | (235,551 | ) | 16,108 | 4 | ||||||||||||||||||||||||||
| ||||||||||||||||||||||||||||||||||||
Domestic Equity Funds-12.86% | ||||||||||||||||||||||||||||||||||||
Invesco Discovery Mid Cap Growth Fund, Class R6(c) | - | 2,075,781 | 521,109 | (1,944,188 | ) | (211,231 | ) | (441,471 | ) | - | - | - | ||||||||||||||||||||||||
| ||||||||||||||||||||||||||||||||||||
Invesco Main Street Small Cap Fund, Class R6 | 0.00 | % | 2,074,596 | 418,747 | (2,156,005 | ) | (5,255 | ) | (332,071 | ) | 8,190 | 1 | 12 | |||||||||||||||||||||||
| ||||||||||||||||||||||||||||||||||||
Invesco PureBetaSM MSCI USA ETF | - | 2,383,831 | 1,872,683 | (3,586,195 | ) | (560,905 | ) | (109,414 | ) | 44,018 | - | - | ||||||||||||||||||||||||
| ||||||||||||||||||||||||||||||||||||
Invesco Russell 1000® Dynamic Multifactor ETF | - | 4,728,485 | 967,299 | (5,024,437 | ) | (950,752 | ) | 279,405 | 57,104 | - | - | |||||||||||||||||||||||||
| ||||||||||||||||||||||||||||||||||||
Invesco S&P SmallCap Low Volatility ETF | - | 389,373 | 18,049 | (364,921 | ) | (127,720 | ) | 85,219 | 7,547 | - | - | |||||||||||||||||||||||||
| ||||||||||||||||||||||||||||||||||||
Invesco U.S. Managed Volatility Fund, Class R6 | 12.86 | % | 6,249,164 | 1,181,260 | (3,137,880 | ) | (1,342,385 | ) | 134,821 | 76,220 | 254,611 | 2,813,479 | ||||||||||||||||||||||||
| ||||||||||||||||||||||||||||||||||||
Total Domestic Equity Funds | 17,901,230 | 4,979,147 | (16,213,626 | ) | (3,198,248 | ) | (383,511 | ) | 193,079 | 2,813,491 | ||||||||||||||||||||||||||
| ||||||||||||||||||||||||||||||||||||
Fixed Income Funds-0.10% | ||||||||||||||||||||||||||||||||||||
Invesco Core Plus Bond Fund, Class R6 | 0.03 | % | 1,378,230 | 551,802 | (1,613,646 | ) | 15,988 | (326,453 | ) | 51,875 | 650 | 5,921 | ||||||||||||||||||||||||
| ||||||||||||||||||||||||||||||||||||
Invesco Floating Rate ESG Fund, Class R6 | - | 1,146,365 | 245,439 | (1,289,167 | ) | (36,871 | ) | (65,766 | ) | 71,300 | - | - | ||||||||||||||||||||||||
| ||||||||||||||||||||||||||||||||||||
Invesco High Yield Bond Factor ETF(b) | - | 1,570,595 | 322,364 | (1,600,426 | ) | 4,139 | (289,623 | ) | 78,701 | - | - | |||||||||||||||||||||||||
| ||||||||||||||||||||||||||||||||||||
Invesco Income Fund, Class R6 | 0.01 | % | 776,409 | 55,495 | (727,414 | ) | (56,700 | ) | (46,056 | ) | 26,045 | 253 | 1,734 | |||||||||||||||||||||||
| ||||||||||||||||||||||||||||||||||||
Invesco Intermediate Bond Factor Fund, Class R6 | 0.05 | % | 1,188,787 | 203,621 | (1,176,421 | ) | (5,323 | ) | (199,206 | ) | 35,575 | 1,265 | 11,458 | |||||||||||||||||||||||
| ||||||||||||||||||||||||||||||||||||
Invesco International Bond Fund, Class R6(b) | 0.01 | % | 777,511 | 165,773 | (796,578 | ) | 7,473 | (129,651 | ) | 3,510 | 325 | 1,396 | ||||||||||||||||||||||||
| ||||||||||||||||||||||||||||||||||||
Invesco Short Duration Inflation Protected Fund, Class R6 | - | 759,760 | 263,075 | (919,714 | ) | (5,632 | ) | (97,489 | ) | 62,296 | - | - | ||||||||||||||||||||||||
| ||||||||||||||||||||||||||||||||||||
Invesco Taxable Municipal Bond ETF | - | 3,814,823 | 963,223 | (3,845,473 | ) | (52,548 | ) | (880,025 | ) | 110,304 | - | - | ||||||||||||||||||||||||
| ||||||||||||||||||||||||||||||||||||
Invesco Variable Rate Investment Grade ETF | - | 1,551,690 | 90,653 | (1,617,471 | ) | (17,965 | ) | (6,907 | ) | 32,536 | - | - | ||||||||||||||||||||||||
| ||||||||||||||||||||||||||||||||||||
Total Fixed Income Funds | 12,964,170 | 2,861,445 | (13,586,310 | ) | (147,439 | ) | (2,041,176 | ) | 472,142 | 20,509 | ||||||||||||||||||||||||||
| ||||||||||||||||||||||||||||||||||||
Foreign Equity Funds-0.00% | ||||||||||||||||||||||||||||||||||||
Invesco EQV Emerging Markets All Cap Fund, Class R6(d) | 0.00 | % | 1,795,416 | 311,582 | (1,776,192 | ) | 199,532 | (530,307 | ) | 13,603 | 1 | 31 | ||||||||||||||||||||||||
| ||||||||||||||||||||||||||||||||||||
Invesco Developing Markets Fund, Class R6 | 0.00 | % | 1,698,746 | 405,852 | (1,692,228 | ) | 216,184 | (628,520 | ) | 8,892 | 1 | 34 | ||||||||||||||||||||||||
| ||||||||||||||||||||||||||||||||||||
Invesco International Select Equity Fund, Class R6 | - | 793,839 | 74,605 | (714,047 | ) | 147,521 | (301,918 | ) | 2,108 | - | - | |||||||||||||||||||||||||
| ||||||||||||||||||||||||||||||||||||
Invesco International Small-Mid Company Fund, Class R6 | - | 610,297 | 179,984 | (579,652 | ) | (38,788 | ) | (170,705 | ) | 1,749 | - | - | ||||||||||||||||||||||||
| ||||||||||||||||||||||||||||||||||||
Invesco PureBetaSM FTSE Developed ex-North America ETF | - | 384,122 | 292,154 | (581,472 | ) | (44,004 | ) | (50,800 | ) | 15,131 | - | - | ||||||||||||||||||||||||
| ||||||||||||||||||||||||||||||||||||
Invesco RAFI™ Strategic Developed ex-US ETF | - | 1,165,228 | 237,925 | (1,267,382 | ) | (81,491 | ) | (54,280 | ) | 35,665 | - | - | ||||||||||||||||||||||||
| ||||||||||||||||||||||||||||||||||||
Invesco S&P International Developed Low Volatility ETF | - | 581,902 | 91,518 | (567,272 | ) | (40,098 | ) | (66,050 | ) | 23,287 | - | - | ||||||||||||||||||||||||
| ||||||||||||||||||||||||||||||||||||
Total Foreign Equity Funds | 7,029,550 | 1,593,620 | (7,178,245 | ) | 358,856 | (1,802,580 | ) | 100,435 | 65 | |||||||||||||||||||||||||||
| ||||||||||||||||||||||||||||||||||||
Money Market Funds-87.74% | ||||||||||||||||||||||||||||||||||||
Invesco Government & Agency Portfolio, Institutional Class, 4.22%(e) | 30.70 | % | 133,179 | 12,457,023 | (5,872,899 | ) | - | - | 6,707 | 6,717,303 | 6,717,303 | |||||||||||||||||||||||||
| ||||||||||||||||||||||||||||||||||||
Invesco Liquid Assets Portfolio, Institutional Class, 4.42%(e) | 21.95 | % | 112,440 | 8,897,874 | (4,209,122 | ) | 30 | (87 | ) | 5,196 | 4,799,695 | 4,801,135 | ||||||||||||||||||||||||
| ||||||||||||||||||||||||||||||||||||
Invesco Treasury Portfolio, Institutional Class, 4.20%(e) | 35.09 | % | 152,204 | 14,236,598 | (6,711,884 | ) | - | - | 7,620 | 7,676,918 | 7,676,918 | |||||||||||||||||||||||||
| ||||||||||||||||||||||||||||||||||||
Total Money Market Funds | 397,823 | 35,591,495 | (16,793,905 | ) | 30 | (87 | ) | 19,523 | 19,195,356 | |||||||||||||||||||||||||||
| ||||||||||||||||||||||||||||||||||||
TOTAL INVESTMENTS IN AFFILIATED ISSUERS | 100.70 | % | 40,249,211 | 45,290,237 | (55,601,405 | ) | (3,131,971 | ) | (4,462,905 | ) | 801,287 | 22,029,425 | ||||||||||||||||||||||||
| ||||||||||||||||||||||||||||||||||||
See accompanying Notes to Financial Statements which are an integral part of the financial statements.
| 55 | Invesco Peak Retirement™ Funds |
Schedule of Investments–(continued)
December 31, 2022
Invesco Peak Retirement™ 2030 Fund (continued)
Schedule of Investments in Affiliated Issuers–100.70%(a)
| % of | Change in | |||||||||||||||||||||||||||||||||||
| Net | Unrealized | |||||||||||||||||||||||||||||||||||
| Assets | Value | Purchases | Proceeds | Appreciation | Realized | Dividend | Shares | Value | ||||||||||||||||||||||||||||
| 12/31/22 | 12/31/21 | at Cost | from Sales | (Depreciation) | Gain (Loss) | Income | 12/31/22 | 12/31/22 | ||||||||||||||||||||||||||||
| ||||||||||||||||||||||||||||||||||||
Investments Purchased with Cash Collateral from Securities on Loan | ||||||||||||||||||||||||||||||||||||
Money Market Funds–0.00% |
| |||||||||||||||||||||||||||||||||||
Invesco Private Government Fund, 4.28%(e) | - | $ | 2,658 | $ | 866,376 | $ | (869,034 | ) | $ | - | $ | - | $ | 411 | (f) | - | $ | - | ||||||||||||||||||
| ||||||||||||||||||||||||||||||||||||
Invesco Private Prime Fund, 4.46%(e) | - | 6,341 | 2,025,328 | (2,031,694 | ) | - | 25 | 1,142 | (f) | - | - | |||||||||||||||||||||||||
| ||||||||||||||||||||||||||||||||||||
Total Investments Purchased with Cash Collateral from Securities on Loan | 0.00 | % | 8,999 | 2,891,704 | (2,900,728 | ) | - | 25 | 1,553 | - | ||||||||||||||||||||||||||
| ||||||||||||||||||||||||||||||||||||
TOTAL INVESTMENTS IN AFFILIATED ISSUERS | 100.70 | % | $ | 40,258,210 | $ | 48,181,941 | $ | (58,502,133 | ) | $ | (3,131,971 | ) | $ | (4,462,880 | )(g) | $ | 802,840 | $ | 22,029,425 | |||||||||||||||||
| ||||||||||||||||||||||||||||||||||||
OTHER ASSETS LESS LIABILITIES | (0.70 | )% | (152,102 | ) | ||||||||||||||||||||||||||||||||
| ||||||||||||||||||||||||||||||||||||
NET ASSETS | 100.00 | % | $ | 21,877,323 | ||||||||||||||||||||||||||||||||
| ||||||||||||||||||||||||||||||||||||
Investment Abbreviations:
ETF - Exchange-Traded Fund
Notes to Schedule of Investments:
| (a) | Each underlying fund and the Fund are affiliated by either having the same investment adviser or an investment adviser under common control with the Fund’s investment adviser. |
| (b) | Amounts include a return of capital distribution reclassification which reduces dividend income and increases realized gain (loss) and/or change in unrealized appreciation (depreciation). |
| (c) | Non-income producing security. |
| (d) | Effective February 28, 2022, the underlying fund’s name changed. |
| (e) | The rate shown is the 7-day SEC standardized yield as of December 31, 2022. |
| (f) | Represents the income earned on the investment of cash collateral, which is included in securities lending income on the Statements of Operations. Does not include rebates and fees paid to lending agent or premiums received from borrowers, if any. |
| (g) | Includes capital gains distributions from affiliated underlying funds as follows: |
| Fund Name | Capital Gain | |||
| ||||
Invesco International Small-Mid Company Fund | $ | 1,136 | ||
Invesco U.S. Managed Volatility Fund | 271,501 | |||
| ||||
See accompanying Notes to Financial Statements which are an integral part of the financial statements.
| 56 | Invesco Peak Retirement™ Funds |
Schedule of Investments
December 31, 2022
Invesco Peak Retirement™ 2035 Fund
Schedule of Investments in Affiliated Issuers–100.67%(a)
| % of | Change in | |||||||||||||||||||||||||||||||||||
| Net | Unrealized | |||||||||||||||||||||||||||||||||||
| Assets | Value | Purchases | Proceeds | Appreciation | Realized | Dividend | Shares | Value | ||||||||||||||||||||||||||||
| 12/31/22 | 12/31/21 | at Cost | from Sales | (Depreciation) | Gain (Loss) | Income | 12/31/22 | 12/31/22 | ||||||||||||||||||||||||||||
| ||||||||||||||||||||||||||||||||||||
Alternative Funds–0.00% | ||||||||||||||||||||||||||||||||||||
Invesco Global Real Estate Income Fund, Class R6(b) | - | $ | 629,536 | $ | 237,971 | $ | (702,032 | ) | $ | (79,658 | ) | $ | (79,595 | ) | $ | 9,674 | - | $ | - | |||||||||||||||||
| ||||||||||||||||||||||||||||||||||||
Invesco Macro Allocation Strategy Fund, Class R6(c) | - | 430,682 | 70,373 | (447,195 | ) | 21,209 | (75,069 | ) | - | - | - | |||||||||||||||||||||||||
| ||||||||||||||||||||||||||||||||||||
Total Alternative Funds | 1,060,218 | 308,344 | (1,149,227 | ) | (58,449 | ) | (154,664 | ) | 9,674 | - | ||||||||||||||||||||||||||
| ||||||||||||||||||||||||||||||||||||
Domestic Equity Funds–14.27% | ||||||||||||||||||||||||||||||||||||
Invesco Discovery Mid Cap Growth Fund, Class R6(c) | 0.00 | % | 1,433,670 | 690,556 | (1,657,881 | ) | (130,002 | ) | (336,324 | ) | - | 1 | 19 | |||||||||||||||||||||||
| ||||||||||||||||||||||||||||||||||||
Invesco Main Street Small Cap Fund, Class R6 | 0.00 | % | 992,003 | 319,751 | (1,136,653 | ) | (157,648 | ) | (17,439 | ) | 4,760 | 1 | 14 | |||||||||||||||||||||||
| ||||||||||||||||||||||||||||||||||||
Invesco PureBetaSM MSCI USA ETF | - | 1,503,774 | 1,584,294 | (2,647,966 | ) | (322,506 | ) | (117,596 | ) | 30,425 | - | - | ||||||||||||||||||||||||
| ||||||||||||||||||||||||||||||||||||
Invesco Russell 1000® Dynamic Multifactor ETF | - | 2,631,685 | 957,892 | (3,172,159 | ) | (534,305 | ) | 116,887 | 37,029 | - | - | |||||||||||||||||||||||||
| ||||||||||||||||||||||||||||||||||||
Invesco S&P SmallCap Low Volatility ETF | - | 645,395 | 176,286 | (746,388 | ) | (155,110 | ) | 79,817 | 15,281 | - | - | |||||||||||||||||||||||||
| ||||||||||||||||||||||||||||||||||||
Invesco U.S. Managed Volatility Fund, Class R6 | 14.27 | % | 3,842,374 | 1,564,449 | (2,268,526 | ) | (866,755 | ) | 85,127 | 57,189 | 194,835 | 2,152,958 | ||||||||||||||||||||||||
| ||||||||||||||||||||||||||||||||||||
Total Domestic Equity Funds | 11,048,901 | 5,293,228 | (11,629,573 | ) | (2,166,326 | ) | (189,528 | ) | 144,684 | 2,152,991 | ||||||||||||||||||||||||||
| ||||||||||||||||||||||||||||||||||||
Fixed Income Funds–0.10% | ||||||||||||||||||||||||||||||||||||
Invesco Core Plus Bond Fund, Class R6 | 0.02 | % | 643,001 | 227,992 | (738,417 | ) | 9,417 | (139,147 | ) | 22,986 | 312 | 2,846 | ||||||||||||||||||||||||
| ||||||||||||||||||||||||||||||||||||
Invesco Floating Rate ESG Fund, Class R6 | 0.03 | % | 204,005 | 158,878 | (331,745 | ) | (7,079 | ) | (19,174 | ) | 18,529 | 736 | 4,885 | |||||||||||||||||||||||
| ||||||||||||||||||||||||||||||||||||
Invesco High Yield Bond Factor ETF(b) | - | 644,373 | 219,913 | (736,416 | ) | 2,535 | (127,271 | ) | 35,565 | - | - | |||||||||||||||||||||||||
| ||||||||||||||||||||||||||||||||||||
Invesco Income Fund, Class R6 | 0.01 | % | 307,053 | 116,959 | (375,397 | ) | (10,399 | ) | (37,307 | ) | 12,295 | 133 | 909 | |||||||||||||||||||||||
| ||||||||||||||||||||||||||||||||||||
Invesco Intermediate Bond Factor Fund, Class R6 | 0.04 | % | 539,239 | 172,197 | (609,781 | ) | (900 | ) | (94,507 | ) | 18,091 | 690 | 6,248 | |||||||||||||||||||||||
| ||||||||||||||||||||||||||||||||||||
Invesco International Bond Fund, Class R6(b) | 0.00 | % | 310,686 | 140,214 | (385,465 | ) | 5,297 | (59,320 | ) | 1,830 | 171 | 734 | ||||||||||||||||||||||||
| ||||||||||||||||||||||||||||||||||||
Invesco Short Duration Inflation Protected Fund, Class R6 | 0.00 | % | 305,491 | 96,463 | (362,182 | ) | (1,441 | ) | (38,324 | ) | 24,180 | 1 | 7 | |||||||||||||||||||||||
| ||||||||||||||||||||||||||||||||||||
Invesco Taxable Municipal Bond ETF | - | 1,285,374 | 707,131 | (1,634,044 | ) | (7,145 | ) | (351,316 | ) | 44,813 | - | - | ||||||||||||||||||||||||
| ||||||||||||||||||||||||||||||||||||
Invesco Variable Rate Investment Grade ETF | - | 628,079 | 128,842 | (745,985 | ) | (13,885 | ) | 2,949 | 15,497 | - | - | |||||||||||||||||||||||||
| ||||||||||||||||||||||||||||||||||||
Total Fixed Income Funds | 4,867,301 | 1,968,589 | (5,919,432 | ) | (23,600 | ) | (863,417 | ) | 193,786 | 15,629 | ||||||||||||||||||||||||||
| ||||||||||||||||||||||||||||||||||||
Foreign Equity Funds–0.00% | ||||||||||||||||||||||||||||||||||||
Invesco EQV Emerging Markets All Cap Fund, Class R6(d) | 0.00 | % | 1,172,252 | 387,117 | (1,342,025 | ) | 129,393 | (346,718 | ) | 10,075 | 1 | 19 | ||||||||||||||||||||||||
| ||||||||||||||||||||||||||||||||||||
Invesco Developing Markets Fund, Class R6 | - | 1,137,371 | 456,327 | (1,316,813 | ) | 138,478 | (415,363 | ) | 6,765 | - | - | |||||||||||||||||||||||||
| ||||||||||||||||||||||||||||||||||||
Invesco International Select Equity Fund, Class R6 | 0.00 | % | 427,096 | 110,232 | (428,920 | ) | 56,974 | (165,376 | ) | 1,688 | 1 | 6 | ||||||||||||||||||||||||
| ||||||||||||||||||||||||||||||||||||
Invesco International Small-Mid Company Fund, Class R6 | 0.00 | % | 421,070 | 211,189 | (479,820 | ) | (16,145 | ) | (135,362 | ) | 1,391 | 1 | 29 | |||||||||||||||||||||||
| ||||||||||||||||||||||||||||||||||||
Invesco PureBetaSM FTSE Developed ex-North America ETF | - | 212,280 | 337,799 | (487,465 | ) | (23,247 | ) | (39,367 | ) | 11,480 | - | - | ||||||||||||||||||||||||
| ||||||||||||||||||||||||||||||||||||
Invesco RAFI™ Strategic Developed ex-US ETF | - | 630,201 | 216,071 | (768,985 | ) | (33,796 | ) | (43,491 | ) | 20,746 | - | - | ||||||||||||||||||||||||
| ||||||||||||||||||||||||||||||||||||
Invesco S&P International Developed Low Volatility ETF | - | 417,450 | 132,635 | (473,959 | ) | (23,711 | ) | (52,415 | ) | 17,202 | - | - | ||||||||||||||||||||||||
| ||||||||||||||||||||||||||||||||||||
Total Foreign Equity Funds | 4,417,720 | 1,851,370 | (5,297,987 | ) | 227,946 | (1,198,092 | ) | 69,347 | 54 | |||||||||||||||||||||||||||
| ||||||||||||||||||||||||||||||||||||
Money Market Funds–86.30% | ||||||||||||||||||||||||||||||||||||
Invesco Government & Agency Portfolio, Institutional Class, 4.22%(e) | 30.20 | % | 106,048 | 8,474,254 | (4,022,563 | ) | - | - | 4,571 | 4,557,739 | 4,557,739 | |||||||||||||||||||||||||
| ||||||||||||||||||||||||||||||||||||
Invesco Liquid Assets Portfolio, Institutional Class, 4.42%(e) | 21.58 | % | 80,014 | 6,053,038 | (2,876,747 | ) | (3 | ) | (44 | ) | 3,451 | 3,255,281 | 3,256,258 | |||||||||||||||||||||||
| ||||||||||||||||||||||||||||||||||||
Invesco Treasury Portfolio, Institutional Class, 4.20%(e) | 34.52 | % | 121,198 | 9,684,861 | (4,597,215 | ) | - | - | 5,190 | 5,208,844 | 5,208,844 | |||||||||||||||||||||||||
| ||||||||||||||||||||||||||||||||||||
Total Money Market Funds | 307,260 | 24,212,153 | (11,496,525 | ) | (3 | ) | (44 | ) | 13,212 | 13,022,841 | ||||||||||||||||||||||||||
| ||||||||||||||||||||||||||||||||||||
TOTAL INVESTMENTS IN AFFILIATED ISSUERS | 100.67 | % | 21,701,400 | 33,633,684 | (35,492,744 | ) | (2,020,432 | ) | (2,405,745 | ) | 430,703 | 15,191,515 | ||||||||||||||||||||||||
| ||||||||||||||||||||||||||||||||||||
See accompanying Notes to Financial Statements which are an integral part of the financial statements.
| 57 | Invesco Peak Retirement™ Funds |
Schedule of Investments–(continued)
December 31, 2022
Invesco Peak Retirement™ 2035 Fund (continued)
Schedule of Investments in Affiliated Issuers–100.67%(a)
| % of | Change in | |||||||||||||||||||||||||||||||||||
| Net | Unrealized | |||||||||||||||||||||||||||||||||||
| Assets | Value | Purchases | Proceeds | Appreciation | Realized | Dividend | Shares | Value | ||||||||||||||||||||||||||||
| 12/31/22 | 12/31/21 | at Cost | from Sales | (Depreciation) | Gain (Loss) | Income | 12/31/22 | 12/31/22 | ||||||||||||||||||||||||||||
| ||||||||||||||||||||||||||||||||||||
Investments Purchased with Cash Collateral from Securities on Loan | ||||||||||||||||||||||||||||||||||||
Money Market Funds–0.00% |
| |||||||||||||||||||||||||||||||||||
Invesco Private Government Fund, 4.28%(e) | - | $ | - | $ | 2,018,168 | $ | (2,018,168 | ) | $ | - | $ | - | $ | 214 | (f) | - | $ | - | ||||||||||||||||||
| ||||||||||||||||||||||||||||||||||||
Invesco Private Prime Fund, | - | - | 4,728,817 | (4,728,781 | ) | - | (36 | ) | 568 | (f) | - | |||||||||||||||||||||||||
| ||||||||||||||||||||||||||||||||||||
Total Investments Purchased with Cash Collateral from Securities on Loan (Cost $0) | 0.00 | % | - | 6,746,985 | (6,746,949 | ) | - | (36 | ) | 782 | - | |||||||||||||||||||||||||
| ||||||||||||||||||||||||||||||||||||
TOTAL INVESTMENTS IN AFFILIATED ISSUERS | 100.67 | % | $ | 21,701,400 | $ | 40,380,669 | $ | (42,239,693 | ) | $ | (2,020,432 | ) | $ | (2,405,781 | )(g) | $ | 431,485 | $ | 15,191,515 | |||||||||||||||||
| ||||||||||||||||||||||||||||||||||||
OTHER ASSETS LESS LIABILITIES | (0.67 | )% | (100,485 | ) | ||||||||||||||||||||||||||||||||
| ||||||||||||||||||||||||||||||||||||
NET ASSETS | 100.00 | % | $ | 15,091,030 | ||||||||||||||||||||||||||||||||
| ||||||||||||||||||||||||||||||||||||
Investment Abbreviations:
ETF - Exchange-Traded Fund
Notes to Schedule of Investments:
| (a) | Each underlying fund and the Fund are affiliated by either having the same investment adviser or an investment adviser under common control with the Fund’s investment adviser. |
| (b) | Amounts include a return of capital distribution reclassification which reduces dividend income and increases realized gain (loss) and/or change in unrealized appreciation (depreciation). |
| (c) | Non-income producing security. |
| (d) | Effective February 28, 2022, the underlying fund’s name changed. |
| (e) | The rate shown is the 7-day SEC standardized yield as of December 31, 2022. |
| (f) | Represents the income earned on the investment of cash collateral, which is included in securities lending income on the Statements of Operations. Does not include rebates and fees paid to lending agent or premiums received from borrowers, if any. |
| (g) | Includes capital gains distributions from affiliated underlying funds as follows: |
| Fund Name | Capital Gain | |||
| ||||
Invesco International Small-Mid Company Fund | $ | 903 | ||
Invesco U.S. Managed Volatility Fund | 203,711 | |||
| ||||
See accompanying Notes to Financial Statements which are an integral part of the financial statements.
| 58 | Invesco Peak Retirement™ Funds |
Schedule of Investments
December 31, 2022
Invesco Peak Retirement™ 2040 Fund
Schedule of Investments in Affiliated Issuers–100.20%(a)
| % of | Change in | |||||||||||||||||||||||||||||||||||
| Net | Unrealized | |||||||||||||||||||||||||||||||||||
| Assets | Value | Purchases | Proceeds | Appreciation | Realized | Dividend | Shares | Value | ||||||||||||||||||||||||||||
| 12/31/22 | 12/31/21 | at Cost | from Sales | (Depreciation) | Gain (Loss) | Income | 12/31/22 | 12/31/22 | ||||||||||||||||||||||||||||
| ||||||||||||||||||||||||||||||||||||
Alternative Funds–0.00% | ||||||||||||||||||||||||||||||||||||
Invesco Global Real Estate Income Fund, Class R6(b) | - | $ | 504,635 | $ | 169,154 | $ | (536,957 | ) | $ | (78,493 | ) | $ | (53,226 | ) | $ | 7,881 | - | $ | - | |||||||||||||||||
| ||||||||||||||||||||||||||||||||||||
Invesco Macro Allocation Strategy Fund, Class R6(c) | - | - | 101,523 | (90,585 | ) | - | (10,938 | ) | - | - | - | |||||||||||||||||||||||||
| ||||||||||||||||||||||||||||||||||||
Total Alternative Funds | 504,635 | 270,677 | (627,542 | ) | (78,493 | ) | (64,164 | ) | 7,881 | - | ||||||||||||||||||||||||||
| ||||||||||||||||||||||||||||||||||||
Domestic Equity Funds–16.46% | ||||||||||||||||||||||||||||||||||||
Invesco Discovery Mid Cap Growth Fund, Class R6(c) | - | 2,314,564 | 953,023 | (2,528,284 | ) | (113,016 | ) | (626,287 | ) | - | - | - | ||||||||||||||||||||||||
| ||||||||||||||||||||||||||||||||||||
Invesco Main Street Small Cap Fund, Class R6 | 0.00 | % | 1,405,895 | 436,859 | (1,616,759 | ) | (192,601 | ) | (33,382 | ) | 6,107 | 1 | 12 | |||||||||||||||||||||||
| ||||||||||||||||||||||||||||||||||||
Invesco PureBetaSM MSCI USA ETF | - | 2,518,932 | 1,950,560 | (3,807,650 | ) | (487,194 | ) | (174,648 | ) | 44,108 | - | - | ||||||||||||||||||||||||
| ||||||||||||||||||||||||||||||||||||
Invesco Russell 1000® Dynamic Multifactor ETF | - | 3,410,082 | 1,031,148 | (3,926,587 | ) | (706,527 | ) | 191,884 | 43,991 | - | - | |||||||||||||||||||||||||
| ||||||||||||||||||||||||||||||||||||
Invesco S&P SmallCap Low Volatility ETF | - | 746,189 | 180,723 | (823,242 | ) | (172,144 | ) | 68,474 | 19,472 | - | - | |||||||||||||||||||||||||
| ||||||||||||||||||||||||||||||||||||
Invesco U.S. Managed Volatility Fund, Class R6 | 16.46 | % | 4,575,979 | 1,247,885 | (1,931,959 | ) | (1,003,384 | ) | 88,913 | 65,492 | 248,337 | 2,744,143 | ||||||||||||||||||||||||
| ||||||||||||||||||||||||||||||||||||
Total Domestic Equity Funds | 14,971,641 | 5,800,198 | (14,634,481 | ) | (2,674,866 | ) | (485,046 | ) | 179,170 | 2,744,155 | ||||||||||||||||||||||||||
| ||||||||||||||||||||||||||||||||||||
Fixed Income Funds–0.06% | ||||||||||||||||||||||||||||||||||||
Invesco Core Plus Bond Fund, Class R6 | 0.01 | % | 236,716 | 187,352 | (357,531 | ) | 3,406 | (68,504 | ) | 11,360 | 158 | 1,439 | ||||||||||||||||||||||||
| ||||||||||||||||||||||||||||||||||||
Invesco Floating Rate ESG Fund, Class R6 | 0.01 | % | - | 53,957 | (49,062 | ) | - | (4,111 | ) | 2,867 | 118 | 784 | ||||||||||||||||||||||||
| ||||||||||||||||||||||||||||||||||||
Invesco High Yield Bond Factor ETF(b) | - | 485,844 | 150,867 | (538,845 | ) | 1,372 | (96,858 | ) | 26,957 | - | - | |||||||||||||||||||||||||
| ||||||||||||||||||||||||||||||||||||
Invesco Income Fund, Class R6 | 0.00 | % | 235,490 | 58,531 | (257,760 | ) | (16,113 | ) | (19,448 | ) | 9,221 | 102 | 700 | |||||||||||||||||||||||
| ||||||||||||||||||||||||||||||||||||
Invesco Intermediate Bond Factor Fund, Class R6 | 0.04 | % | 616,955 | 112,168 | (616,726 | ) | (2,703 | ) | (102,965 | ) | 19,295 | 743 | 6,729 | |||||||||||||||||||||||
| ||||||||||||||||||||||||||||||||||||
Invesco International Bond Fund, Class R6(b) | 0.00 | % | 250,019 | 88,866 | (288,508 | ) | 8,453 | (50,170 | ) | 1,394 | 132 | 567 | ||||||||||||||||||||||||
| ||||||||||||||||||||||||||||||||||||
Invesco Short Duration Inflation Protected Fund, Class R6 | 0.00 | % | - | 81,296 | (73,384 | ) | - | (7,905 | ) | 4,978 | 1 | 7 | ||||||||||||||||||||||||
| ||||||||||||||||||||||||||||||||||||
Invesco Taxable Municipal Bond ETF | - | 1,251,557 | 482,388 | (1,423,488 | ) | (5,550 | ) | (304,907 | ) | 38,373 | - | - | ||||||||||||||||||||||||
| ||||||||||||||||||||||||||||||||||||
Invesco Variable Rate Investment Grade ETF | - | 635,346 | 122,138 | (747,348 | ) | (14,785 | ) | 4,649 | 14,056 | - | - | |||||||||||||||||||||||||
| ||||||||||||||||||||||||||||||||||||
Total Fixed Income Funds | 3,711,927 | 1,337,563 | (4,352,652 | ) | (25,920 | ) | (650,219 | ) | 128,501 | 10,226 | ||||||||||||||||||||||||||
| ||||||||||||||||||||||||||||||||||||
Foreign Equity Funds–0.00% | ||||||||||||||||||||||||||||||||||||
Invesco EQV Emerging Markets All Cap Fund, Class R6(d) | - | 1,472,347 | 372,177 | (1,576,535 | ) | 166,170 | (434,159 | ) | 12,754 | - | - | |||||||||||||||||||||||||
| ||||||||||||||||||||||||||||||||||||
Invesco Developing Markets Fund, Class R6 | 0.00 | % | 1,481,885 | 344,863 | (1,477,274 | ) | 180,634 | (530,077 | ) | 8,640 | 1 | 31 | ||||||||||||||||||||||||
| ||||||||||||||||||||||||||||||||||||
Invesco International Select Equity Fund, Class R6 | - | 627,575 | 111,769 | (589,255 | ) | 110,561 | (260,650 | ) | 2,255 | - | - | |||||||||||||||||||||||||
| ||||||||||||||||||||||||||||||||||||
Invesco International Small-Mid Company Fund, Class R6 | - | 509,130 | 194,167 | (522,838 | ) | (32,594 | ) | (146,807 | ) | 1,630 | - | - | ||||||||||||||||||||||||
| ||||||||||||||||||||||||||||||||||||
Invesco PureBetaSM FTSE Developed ex-North America ETF | - | 750,491 | 310,448 | (920,151 | ) | (41,631 | ) | (99,157 | ) | 22,135 | - | - | ||||||||||||||||||||||||
| ||||||||||||||||||||||||||||||||||||
Invesco RAFI™ Strategic Developed ex-US ETF | - | 751,329 | 217,594 | (889,412 | ) | (62,731 | ) | (16,780 | ) | 22,840 | - | - | ||||||||||||||||||||||||
| ||||||||||||||||||||||||||||||||||||
Invesco S&P International Developed Low Volatility ETF | - | 490,770 | 125,454 | (533,160 | ) | (28,700 | ) | (54,364 | ) | 19,553 | - | - | ||||||||||||||||||||||||
| ||||||||||||||||||||||||||||||||||||
Total Foreign Equity Funds | 6,083,527 | 1,676,472 | (6,508,625 | ) | 291,709 | (1,541,994 | ) | 89,807 | 31 | |||||||||||||||||||||||||||
| ||||||||||||||||||||||||||||||||||||
Money Market Funds–83.68% | ||||||||||||||||||||||||||||||||||||
Invesco Government & Agency Portfolio, Institutional Class, 4.22%(e) | 29.29 | % | 84,618 | 9,594,729 | (4,796,365 | ) | - | - | 4,881 | 4,882,982 | 4,882,982 | |||||||||||||||||||||||||
| ||||||||||||||||||||||||||||||||||||
Invesco Liquid Assets Portfolio, Institutional Class, 4.42%(e) | 20.92 | % | 43,739 | 6,853,378 | (3,409,257 | ) | (2 | ) | (22 | ) | 3,651 | 3,486,789 | 3,487,836 | |||||||||||||||||||||||
| ||||||||||||||||||||||||||||||||||||
Invesco Treasury Portfolio, Institutional Class, 4.20%(e) | 33.47 | % | 96,706 | 10,965,405 | (5,481,560 | ) | - | - | 5,543 | 5,580,551 | 5,580,551 | |||||||||||||||||||||||||
| ||||||||||||||||||||||||||||||||||||
Total Money Market Funds | 225,063 | 27,413,512 | (13,687,182 | ) | (2 | ) | (22 | ) | 14,075 | 13,951,369 | ||||||||||||||||||||||||||
| ||||||||||||||||||||||||||||||||||||
TOTAL INVESTMENTS IN AFFILIATED ISSUERS | 100.20 | % | 25,496,793 | �� | 36,498,422 | (39,810,482 | ) | (2,487,572 | ) | (2,741,445 | ) | 419,434 | 16,705,781 | |||||||||||||||||||||||
| ||||||||||||||||||||||||||||||||||||
See accompanying Notes to Financial Statements which are an integral part of the financial statements.
| 59 | Invesco Peak Retirement™ Funds |
Schedule of Investments–(continued)
December 31, 2022
Invesco Peak Retirement™ 2040 Fund (continued)
Schedule of Investments in Affiliated Issuers–100.20%(a)
| % of | Change in | |||||||||||||||||||||||||||||||||||
| Net | Unrealized | |||||||||||||||||||||||||||||||||||
| Assets | Value | Purchases | Proceeds | Appreciation | Realized | Dividend | Shares | Value | ||||||||||||||||||||||||||||
| 12/31/22 | 12/31/21 | at Cost | from Sales | (Depreciation) | Gain (Loss) | Income | 12/31/22 | 12/31/22 | ||||||||||||||||||||||||||||
| ||||||||||||||||||||||||||||||||||||
Investments Purchased with Cash Collateral from Securities on Loan | ||||||||||||||||||||||||||||||||||||
Money Market Funds–0.00% |
| |||||||||||||||||||||||||||||||||||
Invesco Private Government Fund, 4.28%(e) | - | $ | - | $ | 1,050,651 | $ | (1,050,651 | ) | $ | - | $ | - | $ | 625 | (f) | - | $ | - | ||||||||||||||||||
| ||||||||||||||||||||||||||||||||||||
Invesco Private Prime Fund, 4.46%(e) | - | - | 2,458,205 | (2,458,238 | ) | - | 33 | �� | 1,720 | (f) | - | - | ||||||||||||||||||||||||
| ||||||||||||||||||||||||||||||||||||
Total Investments Purchased with Cash Collateral from Securities on Loan (Cost $0) | 0.00 | % | - | 3,508,856 | (3,508,889 | ) | - | 33 | 2,345 | - | ||||||||||||||||||||||||||
| ||||||||||||||||||||||||||||||||||||
TOTAL INVESTMENTS IN AFFILIATED ISSUERS | 100.20 | % | $ | 25,496,793 | $ | 40,007,278 | $ | (43,319,371 | ) | $ | (2,487,572 | ) | $ | (2,741,412 | )(g) | $ | 421,779 | $ | 16,705,781 | |||||||||||||||||
| ||||||||||||||||||||||||||||||||||||
OTHER ASSETS LESS LIABILITIES | (0.20 | )% | (33,548 | ) | ||||||||||||||||||||||||||||||||
| ||||||||||||||||||||||||||||||||||||
NET ASSETS | 100.00 | % | $ | 16,672,233 | ||||||||||||||||||||||||||||||||
| ||||||||||||||||||||||||||||||||||||
Investment Abbreviations:
ETF - Exchange-Traded Fund
Notes to Schedule of Investments:
| (a) | Each underlying fund and the Fund are affiliated by either having the same investment adviser or an investment adviser under common control with the Fund’s investment adviser. |
| (b) | Amounts include a return of capital distribution reclassification which reduces dividend income and increases realized gain (loss) and/or change in unrealized appreciation (depreciation). |
| (c) | Non-income producing security. |
| (d) | Effective February 28, 2022, the underlying fund’s name changed. |
| (e) | The rate shown is the 7-day SEC standardized yield as of December 31, 2022. |
| (f) | Represents the income earned on the investment of cash collateral, which is included in securities lending income on the Statements of Operations. Does not include rebates and fees paid to lending agent or premiums received from borrowers, if any. |
| (g) | Includes capital gains distributions from affiliated underlying funds as follows: |
| Fund Name | Capital Gain | |||
| ||||
Invesco International Small-Mid Company Fund | $ | 1,058 | ||
Invesco U.S. Managed Volatility Fund | 233,291 | |||
| ||||
See accompanying Notes to Financial Statements which are an integral part of the financial statements.
| 60 | Invesco Peak Retirement™ Funds |
Schedule of Investments
December 31, 2022
Invesco Peak Retirement™ 2045 Fund
Schedule of Investments in Affiliated Issuers–99.81%(a)
| % of | Change in | |||||||||||||||||||||||||||||||||||
| Net | Unrealized | |||||||||||||||||||||||||||||||||||
| Assets | Value | Purchases | Proceeds | Appreciation | Realized | Dividend | Shares | Value | ||||||||||||||||||||||||||||
| 12/31/22 | 12/31/21 | at Cost | from Sales | (Depreciation) | Gain (Loss) | Income | 12/31/22 | 12/31/22 | ||||||||||||||||||||||||||||
| ||||||||||||||||||||||||||||||||||||
Alternative Funds–0.00% | ||||||||||||||||||||||||||||||||||||
Invesco Global Real Estate Income Fund, Class R6(b) | 0.00 | % | $ | - | $ | 46,841 | $ | (37,087 | ) | $ | - | $ | (9,365 | ) | $ | 598 | 1 | $ | 4 | |||||||||||||||||
| ||||||||||||||||||||||||||||||||||||
Domestic Equity Funds–15.40% | ||||||||||||||||||||||||||||||||||||
Invesco Discovery Mid Cap Growth Fund, Class R6(c) | 0.00 | % | 946,495 | 563,839 | (1,180,539 | ) | (84,514 | ) | (245,265 | ) | - | 1 | 16 | |||||||||||||||||||||||
| ||||||||||||||||||||||||||||||||||||
Invesco Main Street Small Cap Fund, Class R6 | - | 630,619 | 229,084 | (749,447 | ) | (130,036 | ) | 19,780 | 3,087 | - | - | |||||||||||||||||||||||||
| ||||||||||||||||||||||||||||||||||||
Invesco PureBetaSM MSCI USA ETF | - | 1,250,754 | 1,204,936 | (2,101,390 | ) | (294,636 | ) | (59,664 | ) | 23,954 | - | - | ||||||||||||||||||||||||
| ||||||||||||||||||||||||||||||||||||
Invesco Russell 1000® Dynamic Multifactor ETF | - | 1,770,140 | 749,846 | (2,247,572 | ) | (403,881 | ) | 131,467 | 24,756 | - | - | |||||||||||||||||||||||||
| ||||||||||||||||||||||||||||||||||||
Invesco S&P SmallCap Low Volatility ETF | - | 309,988 | 109,545 | (375,603 | ) | (81,303 | ) | 37,373 | 8,685 | - | - | |||||||||||||||||||||||||
| ||||||||||||||||||||||||||||||||||||
Invesco U.S. Managed Volatility Fund, Class R6 | 15.40 | % | 1,767,488 | 796,954 | (860,821 | ) | (429,933 | ) | 47,516 | 28,191 | 110,477 | 1,220,786 | ||||||||||||||||||||||||
| ||||||||||||||||||||||||||||||||||||
Total Domestic Equity Funds | 6,675,484 | 3,654,204 | (7,515,372 | ) | (1,424,303 | ) | (68,793 | ) | 88,673 | 1,220,802 | ||||||||||||||||||||||||||
| ||||||||||||||||||||||||||||||||||||
Fixed Income Funds–0.04% | ||||||||||||||||||||||||||||||||||||
Invesco Core Plus Bond Fund, Class R6 | 0.00 | % | - | 24,812 | (21,090 | ) | - | (3,618 | ) | 704 | 11 | 104 | ||||||||||||||||||||||||
| ||||||||||||||||||||||||||||||||||||
Invesco High Yield Bond Factor ETF(b) | - | 149,695 | 68,535 | (186,745 | ) | 305 | (31,021 | ) | 8,782 | - | - | |||||||||||||||||||||||||
| ||||||||||||||||||||||||||||||||||||
Invesco Income Fund, Class R6 | 0.00 | % | - | 23,787 | (20,923 | ) | - | (2,803 | ) | 736 | 9 | 61 | ||||||||||||||||||||||||
| ||||||||||||||||||||||||||||||||||||
Invesco Intermediate Bond Factor Fund, Class R6 | 0.04 | % | 260,448 | 87,457 | (298,167 | ) | (1,286 | ) | (45,328 | ) | 8,809 | 345 | 3,124 | |||||||||||||||||||||||
| ||||||||||||||||||||||||||||||||||||
Invesco International Bond Fund, Class R6(b) | 0.00 | % | - | 24,736 | (20,970 | ) | 1 | (3,106 | ) | 115 | 12 | 50 | ||||||||||||||||||||||||
| ||||||||||||||||||||||||||||||||||||
Invesco Taxable Municipal Bond ETF | - | 412,461 | 216,472 | (517,854 | ) | (7,098 | ) | (103,981 | ) | 13,957 | - | - | ||||||||||||||||||||||||
| ||||||||||||||||||||||||||||||||||||
Invesco Variable Rate Investment Grade ETF | - | 198,626 | 60,633 | (255,767 | ) | (5,141 | ) | 1,649 | 5,053 | - | - | |||||||||||||||||||||||||
| ||||||||||||||||||||||||||||||||||||
Total Fixed Income Funds | 1,021,230 | 506,432 | (1,321,516 | ) | (13,219 | ) | (188,208 | ) | 38,156 | 3,339 | ||||||||||||||||||||||||||
| ||||||||||||||||||||||||||||||||||||
Foreign Equity Funds–0.00% | ||||||||||||||||||||||||||||||||||||
Invesco EQV Emerging Markets All Cap Fund, Class R6(d) | - | 653,355 | 262,991 | (795,220 | ) | 69,446 | (190,572 | ) | 6,130 | - | - | |||||||||||||||||||||||||
| ||||||||||||||||||||||||||||||||||||
Invesco Developing Markets Fund, Class R6 | 0.00 | % | 645,975 | 295,479 | (777,426 | ) | 77,130 | (241,136 | ) | 4,348 | 1 | 22 | ||||||||||||||||||||||||
| ||||||||||||||||||||||||||||||||||||
Invesco International Select Equity Fund, Class R6 | - | 253,368 | 92,461 | (280,651 | ) | 44,103 | (109,281 | ) | 1,058 | - | - | |||||||||||||||||||||||||
| ||||||||||||||||||||||||||||||||||||
Invesco International Small-Mid Company Fund, Class R6 | 0.00 | % | 198,838 | 130,398 | (251,023 | ) | (18,537 | ) | (59,169 | ) | 739 | 1 | 27 | |||||||||||||||||||||||
| ||||||||||||||||||||||||||||||||||||
Invesco PureBetaSM FTSE Developed ex-North America ETF | - | 404,840 | 206,176 | (526,481 | ) | (27,422 | ) | (57,113 | ) | 13,869 | - | - | ||||||||||||||||||||||||
| ||||||||||||||||||||||||||||||||||||
Invesco RAFI™ Strategic Developed ex-US ETF | - | 312,751 | 122,030 | (398,216 | ) | (23,549 | ) | (13,016 | ) | 10,059 | - | - | ||||||||||||||||||||||||
| ||||||||||||||||||||||||||||||||||||
Invesco S&P International Developed Low Volatility ETF | - | 198,702 | 106,007 | (264,949 | ) | (15,857 | ) | (23,903 | ) | 9,203 | - | - | ||||||||||||||||||||||||
| ||||||||||||||||||||||||||||||||||||
Total Foreign Equity Funds | 2,667,829 | 1,215,542 | (3,293,966 | ) | 105,314 | (694,190 | ) | 45,406 | 49 | |||||||||||||||||||||||||||
| ||||||||||||||||||||||||||||||||||||
Money Market Funds–84.37% | ||||||||||||||||||||||||||||||||||||
Invesco Government & Agency Portfolio, Institutional Class, 4.22%(e) | 29.53 | % | 50,583 | 4,574,830 | (2,284,502 | ) | - | - | 2,168 | 2,340,911 | 2,340,911 | |||||||||||||||||||||||||
| ||||||||||||||||||||||||||||||||||||
Invesco Liquid Assets Portfolio, Institutional Class, 4.42%(e) | 21.09 | % | 36,647 | 3,267,736 | (1,632,291 | ) | 6 | (18 | ) | 1,622 | 1,671,578 | 1,672,080 | ||||||||||||||||||||||||
| ||||||||||||||||||||||||||||||||||||
Invesco Treasury Portfolio, Institutional Class, 4.20%(e) | 33.75 | % | 57,809 | 5,228,377 | (2,610,859 | ) | - | - | 2,461 | 2,675,327 | 2,675,327 | |||||||||||||||||||||||||
| ||||||||||||||||||||||||||||||||||||
Total Money Market Funds | 145,039 | 13,070,943 | (6,527,652 | ) | 6 | (18 | ) | 6,251 | 6,688,318 | |||||||||||||||||||||||||||
| ||||||||||||||||||||||||||||||||||||
TOTAL INVESTMENTS IN AFFILIATED ISSUERS | 99.81 | % | 10,509,582 | 18,493,962 | (18,695,593 | ) | (1,332,202 | ) | (960,574 | ) | 179,084 | 7,912,512 | ||||||||||||||||||||||||
| ||||||||||||||||||||||||||||||||||||
See accompanying Notes to Financial Statements which are an integral part of the financial statements.
| 61 | Invesco Peak Retirement™ Funds |
Schedule of Investments–(continued)
December 31, 2022
Invesco Peak Retirement™ 2045 Fund (continued)
Schedule of Investments in Affiliated Issuers–99.81%(a)
| % of | Change in | |||||||||||||||||||||||||||||||||||
| Net | Unrealized | |||||||||||||||||||||||||||||||||||
| Assets | Value | Purchases | Proceeds | Appreciation | Realized | Dividend | Shares | Value | ||||||||||||||||||||||||||||
| 12/31/22 | 12/31/21 | at Cost | from Sales | (Depreciation) | Gain (Loss) | Income | 12/31/22 | 12/31/22 | ||||||||||||||||||||||||||||
| ||||||||||||||||||||||||||||||||||||
Investments Purchased with Cash Collateral from Securities on Loan | ||||||||||||||||||||||||||||||||||||
Money Market Funds–0.00% |
| |||||||||||||||||||||||||||||||||||
Invesco Private Government Fund, 4.28%(e) | - | $ | - | $ | 1,504,057 | $ | (1,504,057 | ) | $ | - | $ | - | $ | 247 | (f) | - | $ | - | ||||||||||||||||||
| ||||||||||||||||||||||||||||||||||||
Invesco Private Prime Fund, 4.46%(e) | - | - | 3,674,267 | (3,674,267 | ) | - | - | 657 | (f) | - | - | |||||||||||||||||||||||||
| ||||||||||||||||||||||||||||||||||||
Total Investments Purchased with Cash Collateral from Securities on Loan | 0.00 | % | - | 5,178,324 | (5,178,324 | ) | - | - | 904 | - | ||||||||||||||||||||||||||
| ||||||||||||||||||||||||||||||||||||
TOTAL INVESTMENTS IN AFFILIATED ISSUERS | 99.81 | % | $ | 10,509,582 | $ | 23,672,286 | $ | (23,873,917 | ) | $ | (1,332,202 | ) | $ | (960,574 | )(g) | $ | 179,988 | $ | 7,912,512 | |||||||||||||||||
| ||||||||||||||||||||||||||||||||||||
OTHER ASSETS LESS LIABILITIES | 0.19 | % | 15,241 | |||||||||||||||||||||||||||||||||
| ||||||||||||||||||||||||||||||||||||
NET ASSETS | 100.00 | % | $ | 7,927,753 | ||||||||||||||||||||||||||||||||
| ||||||||||||||||||||||||||||||||||||
Investment Abbreviations:
ETF - Exchange-Traded Fund
Notes to Schedule of Investments:
| (a) | Each underlying fund and the Fund are affiliated by either having the same investment adviser or an investment adviser under common control with the Fund’s investment adviser. |
| (b) | Amounts include a return of capital distribution reclassification which reduces dividend income and increases realized gain (loss) and/or change in unrealized appreciation (depreciation). |
| (c) | Non-income producing security. |
| (d) | Effective February 28, 2022, the underlying fund’s name changed. |
| (e) | The rate shown is the 7-day SEC standardized yield as of December 31, 2022. |
| (f) | Represents the income earned on the investment of cash collateral, which is included in securities lending income on the Statements of Operations. Does not include rebates and fees paid to lending agent or premiums received from borrowers, if any. |
| (g) | Includes capital gains distributions from affiliated underlying funds as follows: |
| Fund Name | Capital Gain | |||
| ||||
Invesco International Small-Mid Company Fund | $ | 480 | ||
Invesco U.S. Managed Volatility Fund | 100,418 | |||
| ||||
See accompanying Notes to Financial Statements which are an integral part of the financial statements.
| 62 | Invesco Peak Retirement™ Funds |
Schedule of Investments
December 31, 2022
Invesco Peak Retirement™ 2050 Fund
Schedule of Investments in Affiliated Issuers–99.81%(a)
| % of | Change in | |||||||||||||||||||||||||||||||||||
| Net | Unrealized | |||||||||||||||||||||||||||||||||||
| Assets | Value | Purchases | Proceeds | Appreciation | Realized | Dividend | Shares | Value | ||||||||||||||||||||||||||||
| 12/31/22 | 12/31/21 | at Cost | from Sales | (Depreciation) | Gain (Loss) | Income | 12/31/22 | 12/31/22 | ||||||||||||||||||||||||||||
| ||||||||||||||||||||||||||||||||||||
Domestic Equity Funds–14.43% | ||||||||||||||||||||||||||||||||||||
Invesco Discovery Mid Cap Growth Fund, Class R6(b) | - | $ | 1,504,027 | $ | 660,414 | $ | (1,633,114 | ) | $ | (103,836 | ) | $ | (427,491 | ) | $ | - | - | $ | - | |||||||||||||||||
| ||||||||||||||||||||||||||||||||||||
Invesco Main Street Small Cap Fund, Class R6 | - | 1,156,101 | 291,796 | (1,243,626 | ) | (180,698 | ) | (23,573 | ) | 5,630 | - | - | ||||||||||||||||||||||||
| ||||||||||||||||||||||||||||||||||||
Invesco PureBetaSM MSCI USA ETF | - | 2,784,369 | 1,851,844 | (3,923,720 | ) | (609,262 | ) | (103,231 | ) | 48,522 | - | - | ||||||||||||||||||||||||
| ||||||||||||||||||||||||||||||||||||
Invesco Russell 1000® Dynamic Multifactor ETF | - | 3,526,641 | 926,287 | (3,924,358 | ) | (689,113 | ) | 160,543 | 47,235 | - | - | |||||||||||||||||||||||||
| ||||||||||||||||||||||||||||||||||||
Invesco S&P SmallCap Low Volatility ETF | - | 639,665 | 152,327 | (710,112 | ) | (151,023 | ) | 69,143 | 16,432 | - | - | |||||||||||||||||||||||||
| ||||||||||||||||||||||||||||||||||||
Invesco U.S. Managed Volatility Fund, Class R6 | 14.43 | % | 2,970,457 | 895,885 | (1,112,613 | ) | (718,593 | ) | 93,709 | 45,486 | 177,991 | 1,966,823 | ||||||||||||||||||||||||
| ||||||||||||||||||||||||||||||||||||
Total Domestic Equity Funds | 12,581,260 | 4,778,553 | (12,547,543 | ) | (2,452,525 | ) | (230,900 | ) | 163,305 | 1,966,823 | ||||||||||||||||||||||||||
| ||||||||||||||||||||||||||||||||||||
Fixed Income Funds–0.03% | ||||||||||||||||||||||||||||||||||||
Invesco High Yield Bond Factor ETF(c) | - | - | 60,265 | (50,831 | ) | - | (9,201 | ) | 2,683 | - | - | |||||||||||||||||||||||||
| ||||||||||||||||||||||||||||||||||||
Invesco Intermediate Bond Factor Fund, Class R6 | 0.03 | % | 362,234 | 105,257 | (397,822 | ) | (1,548 | ) | (63,677 | ) | 12,422 | 491 | 4,444 | |||||||||||||||||||||||
| ||||||||||||||||||||||||||||||||||||
Invesco Taxable Municipal Bond ETF | - | 362,197 | 228,330 | (484,693 | ) | (8,787 | ) | (97,047 | ) | 13,227 | - | - | ||||||||||||||||||||||||
| ||||||||||||||||||||||||||||||||||||
Invesco Variable Rate Investment Grade ETF | - | 180,532 | 45,865 | (223,048 | ) | (5,136 | ) | 1,787 | 4,813 | - | - | |||||||||||||||||||||||||
| ||||||||||||||||||||||||||||||||||||
Total Fixed Income Funds | 904,963 | 439,717 | (1,156,394 | ) | (15,471 | ) | (168,138 | ) | 33,145 | 4,444 | ||||||||||||||||||||||||||
| ||||||||||||||||||||||||||||||||||||
Foreign Equity Funds–0.00% | ||||||||||||||||||||||||||||||||||||
Invesco EQV Emerging Markets All Cap Fund, Class R6(d) | 0.00 | % | 1,205,045 | 300,887 | (1,285,143 | ) | 138,512 | (359,280 | ) | 11,364 | 1 | 21 | ||||||||||||||||||||||||
| ||||||||||||||||||||||||||||||||||||
Invesco Developing Markets Fund, Class R6 | - | 1,200,482 | 360,873 | (1,258,494 | ) | 162,203 | (465,064 | ) | 7,726 | - | - | |||||||||||||||||||||||||
| ||||||||||||||||||||||||||||||||||||
Invesco International Select Equity Fund, Class R6 | - | 547,693 | 127,936 | (542,713 | ) | 105,694 | (238,610 | ) | 2,140 | - | - | |||||||||||||||||||||||||
| ||||||||||||||||||||||||||||||||||||
Invesco International Small-Mid Company Fund, Class R6 | - | 403,682 | 189,530 | (440,853 | ) | (30,540 | ) | (120,886 | ) | 1,437 | - | - | ||||||||||||||||||||||||
| ||||||||||||||||||||||||||||||||||||
Invesco PureBetaSM FTSE Developed ex-North America ETF | - | 743,859 | 377,499 | (965,379 | ) | (50,903 | ) | (105,076 | ) | 24,584 | - | - | ||||||||||||||||||||||||
| ||||||||||||||||||||||||||||||||||||
Invesco RAFI™ Strategic Developed ex-US ETF | - | 558,464 | 112,838 | (611,258 | ) | (43,434 | ) | (16,610 | ) | 17,382 | - | - | ||||||||||||||||||||||||
| ||||||||||||||||||||||||||||||||||||
Invesco S&P International Developed Low Volatility ETF | - | 361,813 | 85,692 | (382,392 | ) | (27,602 | ) | (37,511 | ) | 15,261 | - | - | ||||||||||||||||||||||||
| ||||||||||||||||||||||||||||||||||||
Total Foreign Equity Funds | 5,021,038 | 1,555,255 | (5,486,232 | ) | 253,930 | (1,343,037 | ) | 79,894 | 21 | |||||||||||||||||||||||||||
| ||||||||||||||||||||||||||||||||||||
Money Market Funds–85.35% | ||||||||||||||||||||||||||||||||||||
Invesco Government & Agency Portfolio, Institutional Class, | 29.87 | % | 73,058 | 7,412,644 | (3,412,770 | ) | - | - | 3,805 | 4,072,932 | 4,072,932 | |||||||||||||||||||||||||
| ||||||||||||||||||||||||||||||||||||
Invesco Liquid Assets Portfolio, Institutional Class, 4.42%(e) | 21.34 | % | 53,163 | 5,294,746 | (2,438,655 | ) | 9 | (20 | ) | 2,853 | 2,908,371 | 2,909,243 | ||||||||||||||||||||||||
| ||||||||||||||||||||||||||||||||||||
Invesco Treasury Portfolio, Institutional Class, 4.20%(e) | 34.14 | % | 83,494 | 8,471,594 | (3,900,309 | ) | - | - | 4,321 | 4,654,779 | 4,654,779 | |||||||||||||||||||||||||
| ||||||||||||||||||||||||||||||||||||
Total Money Market Funds | 209,715 | 21,178,984 | (9,751,734 | ) | 9 | (20 | ) | 10,979 | 11,636,954 | |||||||||||||||||||||||||||
| ||||||||||||||||||||||||||||||||||||
TOTAL INVESTMENTS IN AFFILIATED ISSUERS | 99.81 | % | 18,716,976 | 27,952,509 | (28,941,903 | ) | (2,214,057 | ) | (1,742,095 | ) | 287,323 | 13,608,242 | ||||||||||||||||||||||||
| ||||||||||||||||||||||||||||||||||||
Investments Purchased with Cash Collateral from Securities on Loan |
| |||||||||||||||||||||||||||||||||||
Money Market Funds–0.00% |
| |||||||||||||||||||||||||||||||||||
Invesco Private Government Fund, | - | 23,637 | 730,397 | (754,034 | ) | - | - | 623 | (f) | - | - | |||||||||||||||||||||||||
| ||||||||||||||||||||||||||||||||||||
Invesco Private Prime Fund, 4.46%(e) | - | 55,153 | 1,725,371 | (1,780,632 | ) | 5 | 103 | 1,698 | (f) | - | - | |||||||||||||||||||||||||
| ||||||||||||||||||||||||||||||||||||
Total Investments Purchased with Cash Collateral from Securities on Loan (Cost $0) | 0.00 | % | 78,790 | 2,455,768 | (2,534,666 | ) | 5 | 103 | 2,321 | - | ||||||||||||||||||||||||||
| ||||||||||||||||||||||||||||||||||||
TOTAL INVESTMENTS IN AFFILIATED ISSUERS (Cost $13,828,733) | 99.81 | % | $ | 18,795,766 | $ | 30,408,277 | $ | (31,476,569 | ) | $ | (2,214,052 | ) | $ | (1,741,992 | )(g) | $ | 289,644 | $ | 13,608,242 | |||||||||||||||||
| ||||||||||||||||||||||||||||||||||||
OTHER ASSETS LESS LIABILITIES | 0.19% | 26,355 | ||||||||||||||||||||||||||||||||||
| ||||||||||||||||||||||||||||||||||||
NET ASSETS | 100.00 | % | $ | 13,634,597 | ||||||||||||||||||||||||||||||||
| ||||||||||||||||||||||||||||||||||||
See accompanying Notes to Financial Statements which are an integral part of the financial statements.
| 63 | Invesco Peak Retirement™ Funds |
Schedule of Investments–(continued)
December 31, 2022
Investment Abbreviations:
ETF - Exchange-Traded Fund
Notes to Schedule of Investments:
| (a) | Each underlying fund and the Fund are affiliated by either having the same investment adviser or an investment adviser under common control with the Fund’s investment adviser. |
| (b) | Non-income producing security. |
| (c) | Amounts include a return of capital distribution reclassification which reduces dividend income and increases realized gain (loss) and/or change in unrealized appreciation (depreciation). |
| (d) | Effective February 28, 2022, the underlying fund’s name changed. |
| (e) | The rate shown is the 7-day SEC standardized yield as of December 31, 2022. |
| (f) | Represents the income earned on the investment of cash collateral, which is included in securities lending income on the Statements of Operations. Does not include rebates and fees paid to lending agent or premiums received from borrowers, if any. |
| (g) | Includes capital gains distributions from affiliated underlying funds as follows: |
| Fund Name | Capital Gain | |||
| ||||
Invesco International Small-Mid Company Fund | $ | 933 | ||
Invesco U.S. Managed Volatility Fund | 162,022 | |||
| ||||
See accompanying Notes to Financial Statements which are an integral part of the financial statements.
| 64 | Invesco Peak Retirement™ Funds |
Schedule of Investments
December 31, 2022
Invesco Peak Retirement™ 2055 Fund
Schedule of Investments in Affiliated Issuers–100.24%(a)
| % of | Change in | |||||||||||||||||||||||||||||||||||
| Net | Unrealized | |||||||||||||||||||||||||||||||||||
| Assets | Value | Purchases | Proceeds | Appreciation | Realized | Dividend | Shares | Value | ||||||||||||||||||||||||||||
| 12/31/22 | 12/31/21 | at Cost | from Sales | (Depreciation) | Gain (Loss) | Income | 12/31/22 | 12/31/22 | ||||||||||||||||||||||||||||
| ||||||||||||||||||||||||||||||||||||
Domestic Equity Funds–12.29% | ||||||||||||||||||||||||||||||||||||
Invesco Discovery Mid Cap Growth Fund, Class R6(b) | - | $ | 477,566 | $ | 298,289 | $ | (603,105 | ) | $ | (54,526 | ) | $ | (118,224 | ) | $ | - | - | $ | - | |||||||||||||||||
| ||||||||||||||||||||||||||||||||||||
Invesco Main Street Small Cap Fund, Class R6 | - | 374,943 | 166,545 | (475,163 | ) | (73,124 | ) | 6,799 | 2,213 | - | - | |||||||||||||||||||||||||
| ||||||||||||||||||||||||||||||||||||
Invesco PureBetaSM MSCI USA ETF | - | 901,330 | 809,617 | (1,452,466 | ) | (225,783 | ) | (32,698 | ) | 18,234 | - | - | ||||||||||||||||||||||||
| ||||||||||||||||||||||||||||||||||||
Invesco Russell 1000® Dynamic Multifactor ETF | - | 1,140,598 | 495,386 | (1,452,728 | ) | (250,995 | ) | 67,739 | 17,733 | - | - | |||||||||||||||||||||||||
| ||||||||||||||||||||||||||||||||||||
Invesco S&P SmallCap Low Volatility ETF | - | 207,839 | 74,625 | (252,170 | ) | (54,720 | ) | 24,426 | 6,100 | - | - | |||||||||||||||||||||||||
| ||||||||||||||||||||||||||||||||||||
Invesco U.S. Managed Volatility Fund, Class R6 | 12.29 | % | 959,066 | 477,126 | (479,520 | ) | (234,783 | ) | 19,937 | 17,907 | 61,356 | 678,036 | ||||||||||||||||||||||||
| ||||||||||||||||||||||||||||||||||||
Total Domestic Equity Funds | 4,061,342 | 2,321,588 | (4,715,152 | ) | (893,931 | ) | (32,021 | ) | 62,187 | 678,036 | ||||||||||||||||||||||||||
| ||||||||||||||||||||||||||||||||||||
Fixed Income Funds–0.03% | ||||||||||||||||||||||||||||||||||||
Invesco Intermediate Bond Factor Fund, Class R6 | 0.03 | % | 119,752 | 43,855 | (140,822 | ) | (391 | ) | (20,722 | ) | 4,308 | 185 | 1,672 | |||||||||||||||||||||||
| ||||||||||||||||||||||||||||||||||||
Invesco Taxable Municipal Bond ETF | - | 116,975 | 53,142 | (140,245 | ) | (2,430 | ) | (27,442 | ) | 3,866 | - | - | ||||||||||||||||||||||||
| ||||||||||||||||||||||||||||||||||||
Invesco Variable Rate Investment Grade ETF | - | 56,084 | 8,177 | (63,363 | ) | (1,453 | ) | 555 | 1,421 | - | - | |||||||||||||||||||||||||
| ||||||||||||||||||||||||||||||||||||
Total Fixed Income Funds | 292,811 | 105,174 | (344,430 | ) | (4,274 | ) | (47,609 | ) | 9,595 | 1,672 | ||||||||||||||||||||||||||
| ||||||||||||||||||||||||||||||||||||
Foreign Equity Funds–0.00% | ||||||||||||||||||||||||||||||||||||
Invesco EQV Emerging Markets All Cap Fund, Class R6(c) | - | 385,532 | 182,591 | (496,423 | ) | 40,969 | (112,669 | ) | 4,753 | - | - | |||||||||||||||||||||||||
| ||||||||||||||||||||||||||||||||||||
Invesco Developing Markets Fund, Class R6 | - | 388,876 | 208,651 | (498,639 | ) | 42,942 | (141,830 | ) | 3,196 | - | - | |||||||||||||||||||||||||
| ||||||||||||||||||||||||||||||||||||
Invesco International Select Equity Fund, Class R6 | 0.00 | % | 179,510 | 85,061 | (218,632 | ) | 21,135 | (67,068 | ) | 898 | 1 | 6 | ||||||||||||||||||||||||
| ||||||||||||||||||||||||||||||||||||
Invesco International Small-Mid Company Fund, Class R6 | - | 132,839 | 90,275 | (170,931 | ) | (13,868 | ) | (37,945 | ) | 569 | - | - | ||||||||||||||||||||||||
| ||||||||||||||||||||||||||||||||||||
Invesco PureBetaSM FTSE Developed ex-North America ETF | - | 235,286 | 176,755 | (359,965 | ) | (24,273 | ) | (27,803 | ) | 8,981 | - | - | ||||||||||||||||||||||||
| ||||||||||||||||||||||||||||||||||||
Invesco RAFI™ Strategic Developed ex-US ETF | - | 177,978 | 78,951 | (235,932 | ) | (19,119 | ) | (1,878 | ) | 6,079 | - | - | ||||||||||||||||||||||||
| ||||||||||||||||||||||||||||||||||||
Invesco S&P International Developed Low Volatility ETF | - | 119,413 | 48,904 | (144,662 | ) | (10,054 | ) | (13,601 | ) | 5,458 | - | - | ||||||||||||||||||||||||
| ||||||||||||||||||||||||||||||||||||
Total Foreign Equity Funds | 1,619,434 | 871,188 | (2,125,184 | ) | 37,732 | (402,794 | ) | 29,934 | 6 | |||||||||||||||||||||||||||
| ||||||||||||||||||||||||||||||||||||
Money Market Funds–87.92% | ||||||||||||||||||||||||||||||||||||
Invesco Government & Agency Portfolio, Institutional Class, 4.22%(d) | 30.77 | % | 33,196 | 2,960,549 | (1,295,306 | ) | - | - | 1,622 | 1,698,439 | 1,698,439 | |||||||||||||||||||||||||
| ||||||||||||||||||||||||||||||||||||
Invesco Liquid Assets Portfolio, Institutional Class, 4.42%(d) | 21.98 | % | 23,712 | 2,114,676 | (925,211 | ) | 2 | (6 | ) | 1,215 | 1,212,810 | 1,213,173 | ||||||||||||||||||||||||
| ||||||||||||||||||||||||||||||||||||
Invesco Treasury Portfolio, Institutional Class, 4.20%(d) | 35.17 | % | 37,939 | 3,383,484 | (1,480,350 | ) | - | - | 1,843 | 1,941,073 | 1,941,073 | |||||||||||||||||||||||||
| ||||||||||||||||||||||||||||||||||||
Total Money Market Funds | 94,847 | 8,458,709 | (3,700,867 | ) | 2 | (6 | ) | 4,680 | 4,852,685 | |||||||||||||||||||||||||||
| ||||||||||||||||||||||||||||||||||||
TOTAL INVESTMENTS IN AFFILIATED ISSUERS | 100.24 | % | 6,068,434 | 11,756,659 | (10,885,633 | ) | (860,471 | ) | (482,430 | ) | 106,396 | 5,532,399 | ||||||||||||||||||||||||
| ||||||||||||||||||||||||||||||||||||
Investments Purchased with Cash Collateral from Securities on Loan | ||||||||||||||||||||||||||||||||||||
Money Market Funds–0.00% |
| |||||||||||||||||||||||||||||||||||
Invesco Private Government Fund, 4.28%(d) | - | - | 1,327,175 | (1,327,175 | ) | - | - | 78 | (e) | - | - | |||||||||||||||||||||||||
| ||||||||||||||||||||||||||||||||||||
Invesco Private Prime Fund, 4.46%(d) | - | - | 3,278,531 | (3,278,632 | ) | - | 101 | 211 | (e) | - | - | |||||||||||||||||||||||||
| ||||||||||||||||||||||||||||||||||||
Total Investments Purchased with Cash Collateral from Securities on Loan | 0.00 | % | - | 4,605,706 | (4,605,807 | ) | - | 101 | 289 | - | ||||||||||||||||||||||||||
| ||||||||||||||||||||||||||||||||||||
TOTAL INVESTMENTS IN AFFILIATED ISSUERS | 100.24 | % | $ | 6,068,434 | $ | 16,362,365 | $ | (15,491,440 | ) | $ | (860,471 | ) | $ | (482,329 | )(f) | $ | 106,685 | $ | 5,532,399 | |||||||||||||||||
| ||||||||||||||||||||||||||||||||||||
OTHER ASSETS LESS LIABILITIES | (0.24)% | (13,180 | ) | |||||||||||||||||||||||||||||||||
| ||||||||||||||||||||||||||||||||||||
NET ASSETS | 100.00 | % | $ | 5,519,219 | ||||||||||||||||||||||||||||||||
| ||||||||||||||||||||||||||||||||||||
Investment Abbreviations:
ETF - Exchange-Traded Fund
See accompanying Notes to Financial Statements which are an integral part of the financial statements.
| 65 | Invesco Peak Retirement™ Funds |
Schedule of Investments–(continued)
December 31, 2022
Notes to Schedule of Investments:
| (a) | Each underlying fund and the Fund are affiliated by either having the same investment adviser or an investment adviser under common control with the Fund’s investment adviser. |
| (b) | Non-income producing security. |
| (c) | Effective February 28, 2022, the underlying fund’s name changed. |
| (d) | The rate shown is the 7-day SEC standardized yield as of December 31, 2022. |
| (e) | Represents the income earned on the investment of cash collateral, which is included in securities lending income on the Statements of Operations. Does not include rebates and fees paid to lending agent or premiums received from borrowers, if any. |
| (f) | Includes capital gains distributions from affiliated underlying funds as follows: |
| Fund Name | Capital Gain | |||
| ||||
Invesco International Small-Mid Company Fund | $ | 370 | ||
Invesco U.S. Managed Volatility Fund | 63,790 | |||
| ||||
See accompanying Notes to Financial Statements which are an integral part of the financial statements.
| 66 | Invesco Peak Retirement™ Funds |
Schedule of Investments
December 31, 2022
Invesco Peak Retirement™ 2060 Fund
Schedule of Investments in Affiliated Issuers–100.05%(a)
| % of | Change in | |||||||||||||||||||||||||||||||||||
| Net | Unrealized | |||||||||||||||||||||||||||||||||||
| Assets | Value | Purchases | Proceeds | Appreciation | Realized | Dividend | Shares | Value | ||||||||||||||||||||||||||||
| 12/31/22 | 12/31/21 | at Cost | from Sales | (Depreciation) | Gain (Loss) | Income | 12/31/22 | 12/31/22 | ||||||||||||||||||||||||||||
| ||||||||||||||||||||||||||||||||||||
Domestic Equity Funds–13.36% | ||||||||||||||||||||||||||||||||||||
Invesco Discovery Mid Cap Growth Fund, Class R6(b) | - | $ | 653,657 | $ | 281,875 | $ | (711,785 | ) | $ | (64,761 | ) | $ | (158,986 | ) | $ | - | - | $ | - | |||||||||||||||||
| ||||||||||||||||||||||||||||||||||||
Invesco Main Street Small Cap Fund, Class R6 | - | 501,079 | 111,822 | (525,840 | ) | (110,820 | ) | 23,759 | 2,391 | - | - | |||||||||||||||||||||||||
| ||||||||||||||||||||||||||||||||||||
Invesco PureBetaSM MSCI USA ETF | - | 1,197,089 | 813,842 | (1,687,152 | ) | (313,061 | ) | (10,718 | ) | 21,885 | - | - | ||||||||||||||||||||||||
| ||||||||||||||||||||||||||||||||||||
Invesco Russell 1000® Dynamic Multifactor ETF | - | 1,504,217 | 404,037 | (1,668,399 | ) | (364,691 | ) | 124,836 | 20,876 | - | - | |||||||||||||||||||||||||
| ||||||||||||||||||||||||||||||||||||
Invesco S&P SmallCap Low Volatility ETF | - | 274,150 | 72,825 | (308,490 | ) | (80,097 | ) | 41,612 | 7,278 | - | - | |||||||||||||||||||||||||
| ||||||||||||||||||||||||||||||||||||
Invesco U.S. Managed Volatility Fund, Class R6 | 13.36 | % | 1,271,352 | 387,794 | (445,325 | ) | (305,248 | ) | 38,583 | 19,537 | 79,417 | 877,564 | ||||||||||||||||||||||||
| ||||||||||||||||||||||||||||||||||||
Total Domestic Equity Funds | 5,401,544 | 2,072,195 | (5,346,991 | ) | (1,238,678 | ) | 59,086 | 71,967 | 877,564 | |||||||||||||||||||||||||||
| ||||||||||||||||||||||||||||||||||||
Fixed Income Funds–0.03% | ||||||||||||||||||||||||||||||||||||
Invesco Intermediate Bond Factor Fund, Class R6 | 0.03 | % | 151,843 | 44,227 | (167,504 | ) | (642 | ) | (26,039 | ) | 5,134 | 208 | 1,885 | |||||||||||||||||||||||
| ||||||||||||||||||||||||||||||||||||
Invesco Taxable Municipal Bond ETF | - | 151,781 | 50,429 | (164,111 | ) | (3,393 | ) | (34,706 | ) | 4,778 | - | - | ||||||||||||||||||||||||
| ||||||||||||||||||||||||||||||||||||
Invesco Variable Rate Investment Grade ETF | - | 75,857 | 7,301 | (81,971 | ) | (750 | ) | (437 | ) | 1,734 | - | - | ||||||||||||||||||||||||
| ||||||||||||||||||||||||||||||||||||
Total Fixed Income Funds | 379,481 | 101,957 | (413,586 | ) | (4,785 | ) | (61,182 | ) | 11,646 | 1,885 | ||||||||||||||||||||||||||
| ||||||||||||||||||||||||||||||||||||
Foreign Equity Funds–0.00% | ||||||||||||||||||||||||||||||||||||
Invesco EQV Emerging Markets All Cap Fund, Class R6(c) | - | 518,140 | 130,835 | (554,860 | ) | 49,717 | (143,832 | ) | 4,872 | - | - | |||||||||||||||||||||||||
| ||||||||||||||||||||||||||||||||||||
Invesco Developing Markets Fund, Class R6 | - | 513,027 | 160,246 | (542,695 | ) | 51,431 | (182,009 | ) | 3,313 | - | - | |||||||||||||||||||||||||
| ||||||||||||||||||||||||||||||||||||
Invesco International Select Equity Fund, Class R6 | 0.00 | % | 238,843 | 57,420 | (236,719 | ) | 34,660 | (94,195 | ) | 944 | 1 | 9 | ||||||||||||||||||||||||
| ||||||||||||||||||||||||||||||||||||
Invesco International Small-Mid Company Fund, Class R6 | 0.00 | % | 169,327 | 94,053 | (198,691 | ) | (18,586 | ) | (45,676 | ) | 606 | 1 | 34 | |||||||||||||||||||||||
| ||||||||||||||||||||||||||||||||||||
Invesco PureBetaSM FTSE Developed ex-North America ETF | - | 310,760 | 164,597 | (408,916 | ) | (30,188 | ) | (36,253 | ) | 10,884 | - | - | ||||||||||||||||||||||||
| ||||||||||||||||||||||||||||||||||||
Invesco RAFI™ Strategic Developed ex-US ETF | - | 237,709 | 60,445 | (271,381 | ) | (30,418 | ) | 3,645 | 7,341 | - | - | |||||||||||||||||||||||||
| ||||||||||||||||||||||||||||||||||||
Invesco S&P International Developed Low Volatility ETF | - | 151,652 | 51,214 | (174,968 | ) | (12,678 | ) | (15,220 | ) | 6,431 | - | - | ||||||||||||||||||||||||
| ||||||||||||||||||||||||||||||||||||
Total Foreign Equity Funds | 2,139,458 | 718,810 | (2,388,230 | ) | 43,938 | (513,540 | ) | 34,391 | 43 | |||||||||||||||||||||||||||
| ||||||||||||||||||||||||||||||||||||
Money Market Funds–86.66% | ||||||||||||||||||||||||||||||||||||
Invesco Government & Agency Portfolio, Institutional Class, | 30.30 | % | 36,215 | 3,105,202 | (1,151,453 | ) | - | - | 1,856 | 1,989,964 | 1,989,964 | |||||||||||||||||||||||||
| ||||||||||||||||||||||||||||||||||||
Invesco Liquid Assets Portfolio, Institutional Class, | 21.73 | % | 23,461 | 2,218,000 | (814,014 | ) | 3 | (10 | ) | 1,489 | 1,427,012 | 1,427,440 | ||||||||||||||||||||||||
| ||||||||||||||||||||||||||||||||||||
Invesco Treasury Portfolio, Institutional Class, | 34.63 | % | 41,389 | 3,548,802 | (1,315,947 | ) | - | - | 2,107 | 2,274,244 | 2,274,244 | |||||||||||||||||||||||||
| ||||||||||||||||||||||||||||||||||||
Total Money Market Funds | 101,065 | 8,872,004 | (3,281,414 | ) | 3 | (10 | ) | 5,452 | 5,691,648 | |||||||||||||||||||||||||||
| ||||||||||||||||||||||||||||||||||||
TOTAL INVESTMENTS IN AFFILIATED ISSUERS | 100.05 | % | 8,021,548 | 11,764,966 | (11,430,221 | ) | (1,199,522 | ) | (515,646 | ) | 123,456 | 6,571,140 | ||||||||||||||||||||||||
| ||||||||||||||||||||||||||||||||||||
Investments Purchased with Cash Collateral from Securities on Loan | ||||||||||||||||||||||||||||||||||||
Money Market Funds–0.00% |
| |||||||||||||||||||||||||||||||||||
Invesco Private Government Fund, 4.28%(d) | - | - | 942,838 | (942,838 | ) | - | - | 38 | (e) | - | ||||||||||||||||||||||||||
| ||||||||||||||||||||||||||||||||||||
Invesco Private Prime Fund, 4.46%(d) | - | - | 2,249,956 | (2,249,956 | ) | - | - | 101 | (e) | - | ||||||||||||||||||||||||||
| ||||||||||||||||||||||||||||||||||||
Total Investments Purchased with Cash Collateral from Securities on Loan | 0.00 | % | - | 3,192,794 | (3,192,794 | ) | - | - | 139 | - | ||||||||||||||||||||||||||
| ||||||||||||||||||||||||||||||||||||
TOTAL INVESTMENTS IN AFFILIATED ISSUERS | 100.05 | % | $ | 8,021,548 | $ | 14,957,760 | $ | (14,623,015 | ) | $ | (1,199,522 | ) | $ | (515,646 | )(f) | $ | 123,595 | $ | 6,571,140 | |||||||||||||||||
| ||||||||||||||||||||||||||||||||||||
OTHER ASSETS LESS LIABILITIES | (0.05 | )% | (3,071 | ) | ||||||||||||||||||||||||||||||||
| ||||||||||||||||||||||||||||||||||||
NET ASSETS | 100.00 | % | $ | 6,568,069 | ||||||||||||||||||||||||||||||||
| ||||||||||||||||||||||||||||||||||||
Investment Abbreviations:
ETF - Exchange-Traded Fund
See accompanying Notes to Financial Statements which are an integral part of the financial statements.
| 67 | Invesco Peak Retirement™ Funds |
Schedule of Investments–(continued)
December 31, 2022
Notes to Schedule of Investments:
| (a) | Each underlying fund and the Fund are affiliated by either having the same investment adviser or an investment adviser under common control with the Fund’s investment adviser. |
| (b) | Non-income producing security. |
| (c) | Effective February 28, 2022, the underlying fund’s name changed. |
| (d) | The rate shown is the 7-day SEC standardized yield as of December 31, 2022. |
| (e) | Represents the income earned on the investment of cash collateral, which is included in securities lending income on the Statements of Operations. Does not include rebates and fees paid to lending agent or premiums received from borrowers, if any. |
| (f) | Includes capital gains distributions from affiliated underlying funds as follows: |
| Fund Name | Capital Gain | |||
| ||||
Invesco International Small-Mid Company Fund | $ | 393 | ||
Invesco U.S. Managed Volatility Fund | 69,592 | |||
| ||||
See accompanying Notes to Financial Statements which are an integral part of the financial statements.
| 68 | Invesco Peak Retirement™ Funds |
Schedule of Investments
December 31, 2022
Invesco Peak Retirement™ 2065 Fund
Schedule of Investments in Affiliated Issuers–102.17%(a)
| %of Net Assets 12/31/22 | Value 12/31/21 | Purchases at Cost | Proceeds from Sales | Change in Unrealized Appreciation (Depreciation) | Realized Gain (Loss) | Dividend Income | Shares 12/31/22 | Value 12/31/22 | ||||||||||||||||||||||||||||
| ||||||||||||||||||||||||||||||||||||
Domestic Equity Funds–13.95% | ||||||||||||||||||||||||||||||||||||
Invesco Discovery Mid Cap Growth Fund, Class R6(b) | 0.00 | % | $ | 468,662 | $ | 272,630 | $ | (566,655 | ) | $ | (47,319 | ) | $ | (127,294 | ) | $ | - | 1 | $ | 24 | ||||||||||||||||
| ||||||||||||||||||||||||||||||||||||
Invesco Main Street Small Cap Fund, Class R6 | 0.00 | % | 366,309 | 160,785 | (455,518 | ) | (70,229 | ) | (1,333 | ) | 1,967 | 1 | 14 | |||||||||||||||||||||||
| ||||||||||||||||||||||||||||||||||||
Invesco PureBetaSM MSCI USA ETF | - | 880,586 | 836,761 | (1,455,829 | ) | (223,991 | ) | (37,527 | ) | 17,710 | - | - | ||||||||||||||||||||||||
| ||||||||||||||||||||||||||||||||||||
Invesco Russell 1000® Dynamic Multifactor ETF | - | 1,114,386 | 475,324 | (1,404,610 | ) | (242,782 | ) | 57,682 | 16,819 | - | - | |||||||||||||||||||||||||
| ||||||||||||||||||||||||||||||||||||
Invesco S&P SmallCap Low Volatility ETF | - | 205,547 | 81,989 | (257,235 | ) | (53,949 | ) | 23,648 | 5,982 | - | - | |||||||||||||||||||||||||
| ||||||||||||||||||||||||||||||||||||
Invesco U.S. Managed Volatility Fund, Class R6 | 13.95 | % | 936,993 | 487,944 | (452,694 | ) | (238,927 | ) | 24,482 | 15,915 | 63,447 | 701,104 | ||||||||||||||||||||||||
| ||||||||||||||||||||||||||||||||||||
Total Domestic Equity Funds | 3,972,483 | 2,315,433 | (4,592,541 | ) | (877,197 | ) | (60,342 | ) | 58,393 | 701,142 | ||||||||||||||||||||||||||
| ||||||||||||||||||||||||||||||||||||
Fixed Income Funds–0.03% | ||||||||||||||||||||||||||||||||||||
Invesco Intermediate Bond Factor Fund, Class R6 | 0.03 | % | 117,773 | 42,458 | (137,066 | ) | (467 | ) | (21,193 | ) | 4,101 | 166 | 1,505 | |||||||||||||||||||||||
| ||||||||||||||||||||||||||||||||||||
Invesco Taxable Municipal Bond ETF | - | 117,404 | 46,708 | (133,746 | ) | (2,484 | ) | (27,882 | ) | 3,804 | - | - | ||||||||||||||||||||||||
| ||||||||||||||||||||||||||||||||||||
Invesco Variable Rate Investment Grade ETF | - | 58,716 | 17,321 | (74,987 | ) | (528 | ) | (522 | ) | 1,439 | - | - | ||||||||||||||||||||||||
| ||||||||||||||||||||||||||||||||||||
Total Fixed Income Funds | 293,893 | 106,487 | (345,799 | ) | (3,479 | ) | (49,597 | ) | 9,344 | 1,505 | ||||||||||||||||||||||||||
| ||||||||||||||||||||||||||||||||||||
Foreign Equity Funds–0.00% | ||||||||||||||||||||||||||||||||||||
Invesco EQV Emerging Markets All Cap Fund, Class R6(c) | 0.00 | % | 381,932 | 185,991 | (491,866 | ) | 38,590 | (114,622 | ) | 4,224 | 1 | 25 | ||||||||||||||||||||||||
| ||||||||||||||||||||||||||||||||||||
Invesco Developing Markets Fund, Class R6 | 0.00 | % | 382,309 | 211,543 | (491,059 | ) | 43,656 | (146,428 | ) | 2,841 | 1 | 21 | ||||||||||||||||||||||||
| ||||||||||||||||||||||||||||||||||||
Invesco International Select Equity Fund, Class R6 | 0.00 | % | 176,022 | 67,921 | (197,783 | ) | 26,280 | (72,435 | ) | 798 | 1 | 5 | ||||||||||||||||||||||||
| ||||||||||||||||||||||||||||||||||||
Invesco International Small-Mid Company Fund, Class R6 | 0.00 | % | 132,031 | 94,062 | (173,577 | ) | (13,166 | ) | (38,994 | ) | 506 | 1 | 28 | |||||||||||||||||||||||
| ||||||||||||||||||||||||||||||||||||
Invesco PureBetaSM FTSE Developed ex-North America ETF | - | 234,640 | 154,197 | (333,986 | ) | (23,171 | ) | (31,680 | ) | 8,995 | - | - | ||||||||||||||||||||||||
| ||||||||||||||||||||||||||||||||||||
Invesco RAFI™ Strategic Developed ex-US ETF | - | 176,159 | 69,570 | (224,539 | ) | (17,871 | ) | (3,319 | ) | 6,047 | - | - | ||||||||||||||||||||||||
| ||||||||||||||||||||||||||||||||||||
Invesco S&P International Developed Low Volatility ETF | - | 117,466 | 46,575 | (141,116 | ) | (9,780 | ) | (13,145 | ) | 5,234 | - | - | ||||||||||||||||||||||||
| ||||||||||||||||||||||||||||||||||||
Total Foreign Equity Funds | 1,600,559 | 829,859 | (2,053,926 | ) | 44,538 | (420,623 | ) | 28,645 | 79 | |||||||||||||||||||||||||||
| ||||||||||||||||||||||||||||||||||||
Money Market Funds–88.19% | ||||||||||||||||||||||||||||||||||||
Invesco Government & Agency Portfolio, Institutional Class, 4.22%(d) | 30.86 | % | - | 2,778,540 | (1,228,294 | ) | - | - | 1,442 | 1,550,246 | 1,550,246 | |||||||||||||||||||||||||
| ||||||||||||||||||||||||||||||||||||
Invesco Liquid Assets Portfolio, Institutional Class, 4.42%(d) | 22.07 | % | 9,691 | 1,984,672 | (885,309 | ) | 2 | (14 | ) | 1,138 | 1,108,709 | 1,109,042 | ||||||||||||||||||||||||
| ||||||||||||||||||||||||||||||||||||
Invesco Treasury Portfolio, Institutional Class, 4.20%(d) | 35.26 | % | - | 3,175,475 | (1,403,766 | ) | - | - | 1,639 | 1,771,709 | 1,771,709 | |||||||||||||||||||||||||
| ||||||||||||||||||||||||||||||||||||
Total Money Market Funds | 9,691 | 7,938,687 | (3,517,369 | ) | 2 | (14 | ) | 4,219 | 4,430,997 | |||||||||||||||||||||||||||
| ||||||||||||||||||||||||||||||||||||
TOTAL INVESTMENTS IN AFFILIATED ISSUERS (excluding investments purchased with cash collateral from securities on loan) | 102.17 | % | 5,876,626 | 11,190,466 | (10,509,635 | ) | (836,136 | ) | (530,576 | ) | 100,601 | 5,133,723 | ||||||||||||||||||||||||
| ||||||||||||||||||||||||||||||||||||
Investments Purchased with Cash Collateral from Securities on Loan | ||||||||||||||||||||||||||||||||||||
Money Market Funds–0.00% | ||||||||||||||||||||||||||||||||||||
Invesco Private Government Fund, 4.28%(d) | - | - | 466,348 | (466,348 | ) | - | - | 4 | (e) | - | - | |||||||||||||||||||||||||
| ||||||||||||||||||||||||||||||||||||
Invesco Private Prime Fund, 4.46%(d) | - | - | 1,088,121 | (1,088,121 | ) | - | - | 10 | (e) | - | - | |||||||||||||||||||||||||
| ||||||||||||||||||||||||||||||||||||
Total Investments Purchased with Cash Collateral from Securities on Loan | 0.00 | % | - | 1,554,469 | (1,554,469 | ) | - | - | 14 | - | ||||||||||||||||||||||||||
| ||||||||||||||||||||||||||||||||||||
TOTAL INVESTMENTS IN AFFILIATED ISSUERS | 102.17 | % | $ | 5,876,626 | $ | 12,744,935 | $ | (12,064,104 | ) | $ | (836,136 | ) | $ | (530,576 | )(f) | $ | 100,615 | $ | 5,133,723 | |||||||||||||||||
| ||||||||||||||||||||||||||||||||||||
OTHER ASSETS LESS LIABILITIES | (2.17 | )% | (109,206 | ) | ||||||||||||||||||||||||||||||||
| ||||||||||||||||||||||||||||||||||||
NET ASSETS | 100.00 | % | $ | 5,024,517 | ||||||||||||||||||||||||||||||||
| ||||||||||||||||||||||||||||||||||||
Investment Abbreviations:
ETF - Exchange-Traded Fund
See accompanying Notes to Financial Statements which are an integral part of the financial statements.
| 69 | Invesco Peak Retirement™ Funds |
Schedule of Investments–(continued)
December 31, 2022
Notes to Schedule of Investments:
| (a) | Each underlying fund and the Fund are affiliated by either having the same investment adviser or an investment adviser under common control with the Fund’s investment adviser. |
| (b) | Non-income producing security. |
| (c) | Effective February 28, 2022, the underlying fund’s name changed. |
| (d) | The rate shown is the 7-day SEC standardized yield as of December 31, 2022. |
| (e) | Represents the income earned on the investment of cash collateral, which is included in securities lending income on the Statements of Operations. Does not include rebates and fees paid to lending agent or premiums received from borrowers, if any. |
| (f) | Includes capital gains distributions from affiliated underlying funds as follows: |
| Fund Name | Capital Gain | |||
Invesco International Small-Mid Company Fund | $ | 328 | ||
Invesco U.S. Managed Volatility Fund | 56,694 | |||
See accompanying Notes to Financial Statements which are an integral part of the financial statements.
| 70 | Invesco Peak Retirement™ Funds |
Statements of Assets and Liabilities
December 31, 2022
| Invesco Peak Retirement™ Destination Fund | Invesco Peak Retirement™ 2010 Fund | Invesco Peak Retirement™ 2015 Fund | Invesco Peak Retirement™ 2020 Fund | Invesco Peak Retirement™ 2025 Fund | Invesco Peak Retirement™ 2030 Fund | |||||||||||||||||||||||||||||||||||||||||||
|
|
|
|
|
|
|
|
|
|
|
|
|
| |||||||||||||||||||||||||||||||||||
Assets: | ||||||||||||||||||||||||||||||||||||||||||||||||
Investments in affiliated underlying funds, at value | $ | 3,338,819 | $ | 374,945 | $ | 950,463 | $ | 5,719,315 | $ | 8,999,358 | $ | 22,029,425 | ||||||||||||||||||||||||||||||||||||
|
|
|
|
|
|
|
|
|
|
|
|
|
| |||||||||||||||||||||||||||||||||||
Cash | 347 | - | - | - | 5 | - | ||||||||||||||||||||||||||||||||||||||||||
|
|
|
|
|
|
|
|
|
|
|
|
|
| |||||||||||||||||||||||||||||||||||
Receivable for: | ||||||||||||||||||||||||||||||||||||||||||||||||
Fund expenses absorbed | - | 10,700 | - | - | - | - | ||||||||||||||||||||||||||||||||||||||||||
|
|
|
|
|
|
|
|
|
|
|
|
|
| |||||||||||||||||||||||||||||||||||
Fund shares sold | 91 | - | - | 1,215 | 35,947 | 17,133 | ||||||||||||||||||||||||||||||||||||||||||
|
|
|
|
|
|
|
|
|
|
|
|
|
| |||||||||||||||||||||||||||||||||||
Dividends - affiliated underlying funds | 12,096 | 1,253 | 3,211 | 20,042 | 27,595 | 32,790 | ||||||||||||||||||||||||||||||||||||||||||
|
|
|
|
|
|
|
|
|
|
|
|
|
| |||||||||||||||||||||||||||||||||||
Investment for trustee deferred compensation and retirement plans | 17,115 | 7,810 | 17,103 | 17,141 | 17,191 | 17,243 | ||||||||||||||||||||||||||||||||||||||||||
|
|
|
|
|
|
|
|
|
|
|
|
|
| |||||||||||||||||||||||||||||||||||
Other assets | 54,564 | 27,479 | 53,761 | 54,014 | 54,586 | 58,479 | ||||||||||||||||||||||||||||||||||||||||||
|
|
|
|
|
|
|
|
|
|
|
|
|
| |||||||||||||||||||||||||||||||||||
Total assets | 3,423,032 | 422,187 | 1,024,538 | 5,811,727 | 9,134,682 | 22,155,070 | ||||||||||||||||||||||||||||||||||||||||||
|
|
|
|
|
|
|
|
|
|
|
|
|
| |||||||||||||||||||||||||||||||||||
Liabilities: | ||||||||||||||||||||||||||||||||||||||||||||||||
Payable for: | ||||||||||||||||||||||||||||||||||||||||||||||||
Investments purchased - affiliated underlying funds | 10,123 | 1,107 | 2,709 | 17,199 | 23,336 | 20,498 | ||||||||||||||||||||||||||||||||||||||||||
|
|
|
|
|
|
|
|
|
|
|
|
|
| |||||||||||||||||||||||||||||||||||
Fund shares reacquired | 162,505 | - | 713 | 27,405 | 91,022 | 131,359 | ||||||||||||||||||||||||||||||||||||||||||
|
|
|
|
|
|
|
|
|
|
|
|
|
| |||||||||||||||||||||||||||||||||||
Amount due custodian | - | - | - | - | - | 58,507 | ||||||||||||||||||||||||||||||||||||||||||
|
|
|
|
|
|
|
|
|
|
|
|
|
| |||||||||||||||||||||||||||||||||||
Accrued fees to affiliates | 22,247 | 295 | 18,810 | 29,747 | 3,958 | 11,541 | ||||||||||||||||||||||||||||||||||||||||||
|
|
|
|
|
|
|
|
|
|
|
|
|
| |||||||||||||||||||||||||||||||||||
Accrued trustees’ and officers’ fees and benefits | 3,318 | 3,756 | 3,229 | 2,744 | 2,753 | 2,761 | ||||||||||||||||||||||||||||||||||||||||||
|
|
|
|
|
|
|
|
|
|
|
|
|
| |||||||||||||||||||||||||||||||||||
Accrued other operating expenses | 33,116 | 34,595 | 33,055 | 32,772 | 35,625 | 35,838 | ||||||||||||||||||||||||||||||||||||||||||
|
|
|
|
|
|
|
|
|
|
|
|
|
| |||||||||||||||||||||||||||||||||||
Trustee deferred compensation and retirement plans | 17,115 | 7,810 | 17,103 | 17,141 | 17,191 | 17,243 | ||||||||||||||||||||||||||||||||||||||||||
|
|
|
|
|
|
|
|
|
|
|
|
|
| |||||||||||||||||||||||||||||||||||
Total liabilities | 248,424 | 47,563 | 75,619 | 127,008 | 173,885 | 277,747 | ||||||||||||||||||||||||||||||||||||||||||
|
|
|
|
|
|
|
|
|
|
|
|
|
| |||||||||||||||||||||||||||||||||||
Net assets applicable to shares outstanding | $ | 3,174,608 | $ | 374,624 | $ | 948,919 | $ | 5,684,719 | $ | 8,960,797 | $ | 21,877,323 | ||||||||||||||||||||||||||||||||||||
|
|
|
|
|
|
|
|
|
|
|
|
|
| |||||||||||||||||||||||||||||||||||
Net assets consist of: | ||||||||||||||||||||||||||||||||||||||||||||||||
Shares of beneficial interest | $ | 3,704,314 | $ | 467,427 | $ | 1,120,693 | $ | 6,960,420 | $ | 11,728,469 | $ | 26,510,946 | ||||||||||||||||||||||||||||||||||||
|
|
|
|
|
|
|
|
|
|
|
|
|
| |||||||||||||||||||||||||||||||||||
Distributable earnings (loss) | (529,706 | ) | (92,803 | ) | (171,774 | ) | (1,275,701 | ) | (2,767,672 | ) | (4,633,623 | ) | ||||||||||||||||||||||||||||||||||||
|
|
|
|
|
|
|
|
|
|
|
|
|
| |||||||||||||||||||||||||||||||||||
| $ | 3,174,608 | $ | 374,624 | $ | 948,919 | $ | 5,684,719 | $ | 8,960,797 | $ | 21,877,323 | |||||||||||||||||||||||||||||||||||||
|
|
|
|
|
|
|
|
|
|
|
|
|
| |||||||||||||||||||||||||||||||||||
See accompanying Notes to Financial Statements which are an integral part of the financial statements.
| 71 | Invesco Peak Retirement™ Funds |
Statements of Assets and Liabilities–(continued)
December 31, 2022
| Invesco Peak Retirement™ Destination Fund | Invesco Peak Retirement™ 2010 Fund | Invesco Peak Retirement™ 2015 Fund | Invesco Peak Retirement™ 2020 Fund | Invesco Peak Retirement™ 2025 Fund | Invesco Peak Retirement™ 2030 Fund | |||||||||||||||||||||||||||||||||||||||||||
|
|
|
|
|
|
|
|
|
|
|
|
|
| |||||||||||||||||||||||||||||||||||
Net Assets: | ||||||||||||||||||||||||||||||||||||||||||||||||
Class A | $ | 2,643,088 | $ | 100,436 | $ | 372,446 | $ | 3,925,026 | $ | 5,997,781 | $ | 14,487,073 | ||||||||||||||||||||||||||||||||||||
|
|
|
|
|
|
|
|
|
|
|
|
|
| |||||||||||||||||||||||||||||||||||
Class C | $ | 24,203 | $ | 8,498 | $ | 10,710 | $ | 476,053 | $ | 1,359,022 | $ | 3,143,068 | ||||||||||||||||||||||||||||||||||||
|
|
|
|
|
|
|
|
|
|
|
|
|
| |||||||||||||||||||||||||||||||||||
Class R | $ | 212,842 | $ | 36,946 | $ | 166,278 | $ | 1,084,380 | $ | 1,385,987 | $ | 4,094,062 | ||||||||||||||||||||||||||||||||||||
|
|
|
|
|
|
|
|
|
|
|
|
|
| |||||||||||||||||||||||||||||||||||
Class Y | $ | 36,453 | $ | 8,479 | $ | 36,327 | $ | 92,509 | $ | 199,645 | $ | 134,511 | ||||||||||||||||||||||||||||||||||||
|
|
|
|
|
|
|
|
|
|
|
|
|
| |||||||||||||||||||||||||||||||||||
Class R5 | $ | 91,119 | $ | 8,480 | $ | 90,802 | $ | 94,774 | $ | 9,494 | $ | 9,623 | ||||||||||||||||||||||||||||||||||||
|
|
|
|
|
|
|
|
|
|
|
|
|
| |||||||||||||||||||||||||||||||||||
Class R6 | $ | 166,903 | $ | 211,785 | $ | 272,356 | $ | 11,977 | $ | 8,868 | $ | 8,986 | ||||||||||||||||||||||||||||||||||||
|
|
|
|
|
|
|
|
|
|
|
|
|
| |||||||||||||||||||||||||||||||||||
Shares outstanding, no par value, with an unlimited number of shares authorized: |
| |||||||||||||||||||||||||||||||||||||||||||||||
Class A | 290,522 | 11,837 | 41,098 | 416,370 | 630,865 | 1,477,904 | ||||||||||||||||||||||||||||||||||||||||||
|
|
|
|
|
|
|
|
|
|
|
|
|
| |||||||||||||||||||||||||||||||||||
Class C | 2,660 | 1,001 | 1,177 | 50,347 | 144,111 | 322,978 | ||||||||||||||||||||||||||||||||||||||||||
|
|
|
|
|
|
|
|
|
|
|
|
|
| |||||||||||||||||||||||||||||||||||
Class R | 23,349 | 4,350 | 18,376 | 115,155 | 145,991 | 419,002 | ||||||||||||||||||||||||||||||||||||||||||
|
|
|
|
|
|
|
|
|
|
|
|
|
| |||||||||||||||||||||||||||||||||||
Class Y | 4,001 | 1,001 | 4,001 | 9,767 | 20,953 | 13,670 | ||||||||||||||||||||||||||||||||||||||||||
|
|
|
|
|
|
|
|
|
|
|
|
|
| |||||||||||||||||||||||||||||||||||
Class R5 | 10,001 | 1,001 | 10,001 | 10,001 | 997 | 978 | ||||||||||||||||||||||||||||||||||||||||||
|
|
|
|
|
|
|
|
|
|
|
|
|
| |||||||||||||||||||||||||||||||||||
Class R6 | 18,319 | 25,001 | 30,001 | 1,264 | 931 | 913 | ||||||||||||||||||||||||||||||||||||||||||
|
|
|
|
|
|
|
|
|
|
|
|
|
| |||||||||||||||||||||||||||||||||||
Class A: | ||||||||||||||||||||||||||||||||||||||||||||||||
Net asset value per share | $ | 9.10 | $ | 8.48 | $ | 9.06 | $ | 9.43 | $ | 9.51 | $ | 9.80 | ||||||||||||||||||||||||||||||||||||
|
|
|
|
|
|
|
|
|
|
|
|
|
| |||||||||||||||||||||||||||||||||||
Maximum offering price per share | $ | 9.63 | $ | 8.97 | $ | 9.59 | $ | 9.98 | $ | 10.06 | $ | 10.37 | ||||||||||||||||||||||||||||||||||||
|
|
|
|
|
|
|
|
|
|
|
|
|
| |||||||||||||||||||||||||||||||||||
Class C: | ||||||||||||||||||||||||||||||||||||||||||||||||
Net asset value and offering price per share | $ | 9.10 | $ | 8.49 | $ | 9.10 | $ | 9.46 | $ | 9.43 | $ | 9.73 | ||||||||||||||||||||||||||||||||||||
|
|
|
|
|
|
|
|
|
|
|
|
|
| |||||||||||||||||||||||||||||||||||
Class R: | ||||||||||||||||||||||||||||||||||||||||||||||||
Net asset value and offering price per share | $ | 9.12 | $ | 8.49 | $ | 9.05 | $ | 9.42 | $ | 9.49 | $ | 9.77 | ||||||||||||||||||||||||||||||||||||
|
|
|
|
|
|
|
|
|
|
|
|
|
| |||||||||||||||||||||||||||||||||||
Class Y: | ||||||||||||||||||||||||||||||||||||||||||||||||
Net asset value and offering price per share | $ | 9.11 | $ | 8.47 | $ | 9.08 | $ | 9.47 | $ | 9.53 | $ | 9.84 | ||||||||||||||||||||||||||||||||||||
|
|
|
|
|
|
|
|
|
|
|
|
|
| |||||||||||||||||||||||||||||||||||
Class R5: | ||||||||||||||||||||||||||||||||||||||||||||||||
Net asset value and offering price per share | $ | 9.11 | $ | 8.47 | $ | 9.08 | $ | 9.48 | $ | 9.52 | $ | 9.84 | ||||||||||||||||||||||||||||||||||||
|
|
|
|
|
|
|
|
|
|
|
|
|
| |||||||||||||||||||||||||||||||||||
Class R6: | ||||||||||||||||||||||||||||||||||||||||||||||||
Net asset value and offering price per share | $ | 9.11 | $ | 8.47 | $ | 9.08 | $ | 9.48 | $ | 9.53 | $ | 9.84 | ||||||||||||||||||||||||||||||||||||
|
|
|
|
|
|
|
|
|
|
|
|
|
| |||||||||||||||||||||||||||||||||||
Cost of Investments in affiliated underlying funds | $ | 3,338,823 | $ | 374,942 | $ | 950,462 | $ | 5,756,592 | $ | 9,077,665 | $ | 22,283,150 | ||||||||||||||||||||||||||||||||||||
|
|
|
|
|
|
|
|
|
|
|
|
|
| |||||||||||||||||||||||||||||||||||
See accompanying Notes to Financial Statements which are an integral part of the financial statements.
| 72 | Invesco Peak Retirement™ Funds |
Statements of Assets and Liabilities-(continued)
December 31, 2022
| Invesco Peak Retirement™ 2035 Fund | Invesco Peak Retirement™ 2040 Fund | Invesco Peak Retirement™ 2045 Fund | Invesco Peak Retirement™ 2050 Fund | Invesco Peak Retirement™ 2055 Fund | Invesco Peak Retirement™ 2060 Fund | |||||||||||||||||||||||||||||||||||||||||||
|
|
|
|
|
|
|
|
|
|
|
|
| ||||||||||||||||||||||||||||||||||||
Assets: | ||||||||||||||||||||||||||||||||||||||||||||||||
Investments in affiliated underlying funds, at value | $ | 15,191,515 | $ | 16,705,781 | $ | 7,912,512 | $ | 13,608,242 | $ | 5,532,399 | $ | 6,571,140 | ||||||||||||||||||||||||||||||||||||
|
|
|
|
|
|
|
|
|
|
|
|
| ||||||||||||||||||||||||||||||||||||
Cash | - | 1,262 | 557 | 1,372 | - | 130 | ||||||||||||||||||||||||||||||||||||||||||
|
|
|
|
|
|
|
|
|
|
|
|
| ||||||||||||||||||||||||||||||||||||
Receivable for: | ||||||||||||||||||||||||||||||||||||||||||||||||
Fund expenses absorbed | - | - | - | - | - | - | ||||||||||||||||||||||||||||||||||||||||||
|
|
|
|
|
|
|
|
|
|
|
|
| ||||||||||||||||||||||||||||||||||||
Fund shares sold | 33,425 | 35,142 | 35,565 | 67,271 | 27,372 | 28,445 | ||||||||||||||||||||||||||||||||||||||||||
|
|
|
|
|
|
|
|
|
|
|
|
| ||||||||||||||||||||||||||||||||||||
Dividends - affiliated underlying funds | 23,606 | 18,903 | 6,998 | 11,137 | 4,683 | 5,536 | ||||||||||||||||||||||||||||||||||||||||||
|
|
|
|
|
|
|
|
|
|
|
|
| ||||||||||||||||||||||||||||||||||||
Investment for trustee deferred compensation and retirement plans | 17,174 | 17,184 | 17,138 | 17,162 | 17,119 | 17,125 | ||||||||||||||||||||||||||||||||||||||||||
|
|
|
|
|
|
|
|
|
|
|
|
| ||||||||||||||||||||||||||||||||||||
Other assets | 56,267 | 56,166 | 54,511 | 54,558 | 54,043 | 54,274 | ||||||||||||||||||||||||||||||||||||||||||
|
|
|
|
|
|
|
|
|
|
|
|
| ||||||||||||||||||||||||||||||||||||
Total assets | 15,321,987 | 16,834,438 | 8,027,281 | 13,759,742 | 5,635,616 | 6,676,650 | ||||||||||||||||||||||||||||||||||||||||||
|
|
|
|
|
|
|
|
|
|
|
|
| ||||||||||||||||||||||||||||||||||||
Liabilities: | ||||||||||||||||||||||||||||||||||||||||||||||||
Payable for: | ||||||||||||||||||||||||||||||||||||||||||||||||
Investments purchased - affiliated underlying funds | 15,604 | 10,201 | 3,319 | 4,442 | 1,664 | 1,876 | ||||||||||||||||||||||||||||||||||||||||||
|
|
|
|
|
|
|
|
|
|
|
|
| ||||||||||||||||||||||||||||||||||||
Fund shares reacquired | 92,708 | 87,726 | 7,488 | 56,591 | 17,643 | 23,607 | ||||||||||||||||||||||||||||||||||||||||||
|
|
|
|
|
|
|
|
|
|
|
|
| ||||||||||||||||||||||||||||||||||||
Amount due custodian | 60,245 | - | - | - | 16,820 | - | ||||||||||||||||||||||||||||||||||||||||||
|
|
|
|
|
|
|
|
|
|
|
|
| ||||||||||||||||||||||||||||||||||||
Accrued fees to affiliates | 6,983 | 8,532 | 35,777 | 8,858 | 26,778 | 28,170 | ||||||||||||||||||||||||||||||||||||||||||
|
|
|
|
|
|
|
|
|
|
|
|
| ||||||||||||||||||||||||||||||||||||
Accrued trustees’ and officers’ fees and benefits | 2,746 | 2,750 | 2,735 | 2,737 | 2,731 | 2,733 | ||||||||||||||||||||||||||||||||||||||||||
|
|
|
|
|
|
|
|
|
|
|
|
| ||||||||||||||||||||||||||||||||||||
Accrued other operating expenses | 35,497 | 35,812 | 33,071 | 35,355 | 33,642 | 35,070 | ||||||||||||||||||||||||||||||||||||||||||
|
|
|
|
|
|
|
|
|
|
|
|
| ||||||||||||||||||||||||||||||||||||
Trustee deferred compensation and retirement plans | 17,174 | 17,184 | 17,138 | 17,162 | 17,119 | 17,125 | ||||||||||||||||||||||||||||||||||||||||||
|
|
|
|
|
|
|
|
|
|
|
|
| ||||||||||||||||||||||||||||||||||||
Total liabilities | 230,957 | 162,205 | 99,528 | 125,145 | 116,397 | 108,581 | ||||||||||||||||||||||||||||||||||||||||||
|
|
|
|
|
|
|
|
|
|
|
|
| ||||||||||||||||||||||||||||||||||||
Net assets applicable to shares outstanding | $ | 15,091,030 | $ | 16,672,233 | $ | 7,927,753 | $ | 13,634,597 | $ | 5,519,219 | $ | 6,568,069 | ||||||||||||||||||||||||||||||||||||
|
|
|
|
|
|
|
|
|
|
|
|
| ||||||||||||||||||||||||||||||||||||
Net assets consist of: | ||||||||||||||||||||||||||||||||||||||||||||||||
Shares of beneficial interest | $ | 17,693,095 | $ | 19,702,357 | $ | 9,035,579 | $ | 15,641,649 | $ | 6,092,164 | $ | 7,190,155 | ||||||||||||||||||||||||||||||||||||
|
|
|
|
|
|
|
|
|
|
|
|
| ||||||||||||||||||||||||||||||||||||
Distributable earnings (loss) | (2,602,065 | ) | (3,030,124 | ) | (1,107,826 | ) | (2,007,052 | ) | (572,945 | ) | (622,086 | ) | ||||||||||||||||||||||||||||||||||||
|
|
|
|
|
|
|
|
|
|
|
|
| ||||||||||||||||||||||||||||||||||||
| $ | 15,091,030 | $ | 16,672,233 | $ | 7,927,753 | $ | 13,634,597 | $ | 5,519,219 | $ | 6,568,069 | |||||||||||||||||||||||||||||||||||||
|
|
|
|
|
|
|
|
|
|
|
|
| ||||||||||||||||||||||||||||||||||||
See accompanying Notes to Financial Statements which are an integral part of the financial statements.
| 73 | Invesco Peak Retirement™ Funds |
Statements of Assets and Liabilities–(continued)
December 31, 2022
| Invesco Peak Retirement™ 2035 Fund | Invesco Peak Retirement™ 2040 Fund | Invesco Peak Retirement™ 2045 Fund | Invesco Peak Retirement™ 2050 Fund | Invesco Peak Retirement™ 2055 Fund | Invesco Peak Retirement™ 2060 Fund | |||||||||||||||||||||||||||||||||||||||||||
|
|
|
|
|
|
|
|
|
|
|
|
| ||||||||||||||||||||||||||||||||||||
Net Assets: | ||||||||||||||||||||||||||||||||||||||||||||||||
Class A | $ | 7,631,470 | $ | 10,692,332 | $ | 4,185,449 | $ | 7,903,398 | $ | 2,979,407 | $ | 3,682,097 | ||||||||||||||||||||||||||||||||||||
|
|
|
|
|
|
|
|
|
|
|
|
| ||||||||||||||||||||||||||||||||||||
Class C | $ | 2,763,215 | $ | 2,171,402 | $ | 1,203,920 | $ | 1,905,119 | $ | 714,587 | $ | 575,089 | ||||||||||||||||||||||||||||||||||||
|
|
|
|
|
|
|
|
|
|
|
|
| ||||||||||||||||||||||||||||||||||||
Class R | $ | 3,982,524 | $ | 3,077,212 | $ | 2,362,602 | $ | 3,579,640 | $ | 1,382,232 | $ | 1,816,286 | ||||||||||||||||||||||||||||||||||||
|
|
|
|
|
|
|
|
|
|
|
|
| ||||||||||||||||||||||||||||||||||||
Class Y | $ | 695,392 | $ | 713,069 | $ | 53,022 | $ | 18,356 | $ | 61,777 | $ | 128,555 | ||||||||||||||||||||||||||||||||||||
|
|
|
|
|
|
|
|
|
|
|
|
| ||||||||||||||||||||||||||||||||||||
Class R5 | $ | 9,573 | $ | 9,479 | $ | 21,669 | $ | 104,342 | $ | 104,590 | $ | 105,868 | ||||||||||||||||||||||||||||||||||||
|
|
|
|
|
|
|
|
|
|
|
|
| ||||||||||||||||||||||||||||||||||||
Class R6 | $ | 8,856 | $ | 8,739 | $ | 101,091 | $ | 123,742 | $ | 276,626 | $ | 260,174 | ||||||||||||||||||||||||||||||||||||
|
|
|
|
|
|
|
|
|
|
|
|
| ||||||||||||||||||||||||||||||||||||
Shares outstanding, no par value, with an unlimited number of shares authorized: |
| |||||||||||||||||||||||||||||||||||||||||||||||
Class A | 756,847 | 1,061,576 | 428,409 | 760,720 | 285,840 | 349,296 | ||||||||||||||||||||||||||||||||||||||||||
|
|
|
|
|
|
|
|
|
|
|
|
| ||||||||||||||||||||||||||||||||||||
Class C | 276,773 | 217,382 | 124,875 | 185,603 | 69,354 | 55,164 | ||||||||||||||||||||||||||||||||||||||||||
|
|
|
|
|
|
|
|
|
|
|
|
| ||||||||||||||||||||||||||||||||||||
Class R | 396,661 | 307,009 | 243,017 | 346,991 | 133,341 | 173,122 | ||||||||||||||||||||||||||||||||||||||||||
|
|
|
|
|
|
|
|
|
|
|
|
| ||||||||||||||||||||||||||||||||||||
Class Y | 68,704 | 70,510 | 5,410 | 1,759 | 5,915 | 12,143 | ||||||||||||||||||||||||||||||||||||||||||
|
|
|
|
|
|
|
|
|
|
|
|
| ||||||||||||||||||||||||||||||||||||
Class R5 | 946 | 938 | 2,209 | 10,001 | 10,001 | 10,001 | ||||||||||||||||||||||||||||||||||||||||||
|
|
|
|
|
|
|
|
|
|
|
|
| ||||||||||||||||||||||||||||||||||||
Class R6 | 875 | 864 | 10,314 | 11,859 | 26,455 | 24,582 | ||||||||||||||||||||||||||||||||||||||||||
|
|
|
|
|
|
|
|
|
|
|
|
| ||||||||||||||||||||||||||||||||||||
Class A: | ||||||||||||||||||||||||||||||||||||||||||||||||
Net asset value per share | $ | 10.08 | $ | 10.07 | $ | 9.77 | $ | 10.39 | $ | 10.42 | $ | 10.54 | ||||||||||||||||||||||||||||||||||||
|
|
|
|
|
|
|
|
|
|
|
|
| ||||||||||||||||||||||||||||||||||||
Maximum offering price per share (Net asset value ÷ 94.50%) | $ | 10.67 | $ | 10.66 | $ | 10.34 | $ | 10.99 | $ | 11.03 | $ | 11.15 | ||||||||||||||||||||||||||||||||||||
|
|
|
|
|
|
|
|
|
|
|
|
| ||||||||||||||||||||||||||||||||||||
Class C: | ||||||||||||||||||||||||||||||||||||||||||||||||
Net asset value and offering price per share | $ | 9.98 | $ | 9.99 | $ | 9.64 | $ | 10.26 | $ | 10.30 | $ | 10.43 | ||||||||||||||||||||||||||||||||||||
|
|
|
|
|
|
|
|
|
|
|
|
| ||||||||||||||||||||||||||||||||||||
Class R: | ||||||||||||||||||||||||||||||||||||||||||||||||
Net asset value and offering price per share | $ | 10.04 | $ | 10.02 | $ | 9.72 | $ | 10.32 | $ | 10.37 | $ | 10.49 | ||||||||||||||||||||||||||||||||||||
|
|
|
|
|
|
|
|
|
|
|
|
| ||||||||||||||||||||||||||||||||||||
Class Y: | ||||||||||||||||||||||||||||||||||||||||||||||||
Net asset value and offering price per share | $ | 10.12 | $ | 10.11 | $ | 9.80 | $ | 10.44 | $ | 10.44 | $ | 10.59 | ||||||||||||||||||||||||||||||||||||
|
|
|
|
|
|
|
|
|
|
|
|
| ||||||||||||||||||||||||||||||||||||
Class R5: | ||||||||||||||||||||||||||||||||||||||||||||||||
Net asset value and offering price per share | $ | 10.12 | $ | 10.11 | $ | 9.81 | $ | 10.43 | $ | 10.46 | $ | 10.59 | ||||||||||||||||||||||||||||||||||||
|
|
|
|
|
|
|
|
|
|
|
|
| ||||||||||||||||||||||||||||||||||||
Class R6: | ||||||||||||||||||||||||||||||||||||||||||||||||
Net asset value and offering price per share | $ | 10.12 | $ | 10.11 | $ | 9.80 | $ | 10.43 | $ | 10.46 | $ | 10.58 | ||||||||||||||||||||||||||||||||||||
|
|
|
|
|
|
|
|
|
|
|
|
| ||||||||||||||||||||||||||||||||||||
Cost of Investments in affiliated underlying funds | $ | 15,438,962 | $ | 16,994,586 | $ | 8,063,164 | $ | 13,828,733 | $ | 5,618,285 | $ | 6,667,411 | ||||||||||||||||||||||||||||||||||||
|
|
|
|
|
|
|
|
|
|
|
|
| ||||||||||||||||||||||||||||||||||||
See accompanying Notes to Financial Statements which are an integral part of the financial statements.
| 74 | Invesco Peak Retirement™ Funds |
Statements of Assets and Liabilities–(continued)
December 31, 2022
| Invesco Peak Retirement™ 2065 Fund | ||||||||
|
|
| ||||||
Assets: | ||||||||
Investments in affiliated underlying funds, at value | $ | 5,133,723 | ||||||
|
|
| ||||||
Cash | 1,172 | |||||||
|
|
| ||||||
Receivable for: | ||||||||
Fund shares sold | 13,521 | |||||||
|
|
| ||||||
Dividends - affiliated underlying funds | 4,272 | |||||||
|
|
| ||||||
Investment for trustee deferred compensation and retirement plans | 17,118 | |||||||
|
|
| ||||||
Other assets | 55,917 | |||||||
|
|
| ||||||
Total assets | 5,225,723 | |||||||
|
|
| ||||||
Liabilities: | ||||||||
Payable for: | ||||||||
Investments purchased - affiliated underlying funds | 1,502 | |||||||
|
|
| ||||||
Fund shares reacquired | 119,108 | |||||||
|
|
| ||||||
Accrued fees to affiliates | 26,658 | |||||||
|
|
| ||||||
Accrued trustees’ and officers’ fees and benefits | 3,326 | |||||||
|
|
| ||||||
Accrued other operating expenses | 33,494 | |||||||
|
|
| ||||||
Trustee deferred compensation and retirement plans | 17,118 | |||||||
|
|
| ||||||
Total liabilities | 201,206 | |||||||
|
|
| ||||||
Net assets applicable to shares outstanding | $ | 5,024,517 | ||||||
|
|
| ||||||
Net assets consist of: | ||||||||
Shares of beneficial interest | $ | 5,651,491 | ||||||
|
|
| ||||||
Distributable earnings (loss) | (626,974 | ) | ||||||
|
|
| ||||||
| $ | 5,024,517 | |||||||
|
|
| ||||||
See accompanying Notes to Financial Statements which are an integral part of the financial statements.
| 75 | Invesco Peak Retirement™ Funds |
Statements of Assets and Liabilities–(continued)
December 31, 2022
| Invesco Peak Retirement™ 2065 Fund | ||||||||
|
|
| ||||||
Net Assets: | ||||||||
Class A | $ | 2,756,912 | ||||||
|
|
| ||||||
Class C | $ | 639,323 | ||||||
|
|
| ||||||
Class R | $ | 939,318 | ||||||
|
|
| ||||||
Class Y | $ | 323,085 | ||||||
|
|
| ||||||
Class R5 | $ | 105,547 | ||||||
|
|
| ||||||
Class R6 | $ | 260,332 | ||||||
|
|
| ||||||
Shares outstanding, no par value, with an unlimited number of shares authorized: | ||||||||
Class A | 258,989 | |||||||
|
|
| ||||||
Class C | 61,616 | |||||||
|
|
| ||||||
Class R | 89,751 | |||||||
|
|
| ||||||
Class Y | 30,613 | |||||||
|
|
| ||||||
Class R5 | 10,001 | |||||||
|
|
| ||||||
Class R6 | 24,671 | |||||||
|
|
| ||||||
Class A: | ||||||||
Net asset value per share | $ | 10.64 | ||||||
|
|
| ||||||
Maximum offering price per share | ||||||||
(Net asset value ÷ 94.50%) | $ | 11.26 | ||||||
|
|
| ||||||
Class C: | ||||||||
Net asset value and offering price per share | $ | 10.38 | ||||||
|
|
| ||||||
Class R: | ||||||||
Net asset value and offering price per share | $ | 10.47 | ||||||
|
|
| ||||||
Class Y: | ||||||||
Net asset value and offering price per share | $ | 10.55 | ||||||
|
|
| ||||||
Class R5: | ||||||||
Net asset value and offering price per share | $ | 10.55 | ||||||
|
|
| ||||||
Class R6: | ||||||||
Net asset value and offering price per share | $ | 10.55 | ||||||
|
|
| ||||||
Cost of Investments in affiliated underlying funds | $ | 5,231,918 | ||||||
|
|
| ||||||
See accompanying Notes to Financial Statements which are an integral part of the financial statements.
| 76 | Invesco Peak Retirement™ Funds |
Statements of Operations
For the year ended December 31, 2022
| Invesco Peak Retirement™ Destination Fund | Invesco Peak Retirement™ 2010 Fund | Invesco Peak Retirement™ 2015 Fund | Invesco Peak Retirement™ 2020 Fund | Invesco Peak Retirement™ 2025 Fund | Invesco Peak Retirement™ 2030 Fund | |||||||||||||||||||||||||||||||||||||||||||
|
|
|
|
|
|
|
|
|
|
|
|
|
| |||||||||||||||||||||||||||||||||||
Investment income: | ||||||||||||||||||||||||||||||||||||||||||||||||
Dividends from affiliated underlying funds | $ | 169,870 | $ | 20,743 | $ | 51,583 | $ | 299,159 | $ | 532,693 | $ | 801,287 | ||||||||||||||||||||||||||||||||||||
|
|
|
|
|
|
|
|
|
|
|
|
|
| |||||||||||||||||||||||||||||||||||
Securities lending income | 4,670 | 128 | 696 | 4,808 | 3,282 | 6,318 | ||||||||||||||||||||||||||||||||||||||||||
|
|
|
|
|
|
|
|
|
|
|
|
|
| |||||||||||||||||||||||||||||||||||
Total investment income | 174,540 | 20,871 | 52,279 | 303,967 | 535,975 | 807,605 | ||||||||||||||||||||||||||||||||||||||||||
|
|
|
|
|
|
|
|
|
|
|
|
|
| |||||||||||||||||||||||||||||||||||
Expenses: | ||||||||||||||||||||||||||||||||||||||||||||||||
Administrative services fees | 728 | 92 | 223 | 1,592 | 3,534 | 5,689 | ||||||||||||||||||||||||||||||||||||||||||
|
|
|
|
|
|
|
|
|
|
|
|
|
| |||||||||||||||||||||||||||||||||||
Custodian fees | 15,801 | 14,825 | 15,369 | 15,616 | 19,996 | 20,003 | ||||||||||||||||||||||||||||||||||||||||||
|
|
|
|
|
|
|
|
|
|
|
|
|
| |||||||||||||||||||||||||||||||||||
Distribution fees: | ||||||||||||||||||||||||||||||||||||||||||||||||
Class A | 10,185 | 653 | 1,941 | 17,702 | 40,817 | 60,282 | ||||||||||||||||||||||||||||||||||||||||||
|
|
|
|
|
|
|
|
|
|
|
|
|
| |||||||||||||||||||||||||||||||||||
Class C | 951 | 328 | 1,438 | 12,335 | 28,193 | 49,603 | ||||||||||||||||||||||||||||||||||||||||||
|
|
|
|
|
|
|
|
|
|
|
|
|
| |||||||||||||||||||||||||||||||||||
Class R | 1,257 | 188 | 808 | 8,781 | 14,775 | 38,174 | ||||||||||||||||||||||||||||||||||||||||||
|
|
|
|
|
|
|
|
|
|
|
|
|
| |||||||||||||||||||||||||||||||||||
Transfer agent fees – A, C, R | 3,284 | – | 1,322 | 10,158 | 19,148 | 45,098 | ||||||||||||||||||||||||||||||||||||||||||
|
|
|
|
|
|
|
|
|
|
|
|
|
| |||||||||||||||||||||||||||||||||||
Transfer agent fees – R5 | 35 | 3 | 34 | 50 | 3 | 3 | ||||||||||||||||||||||||||||||||||||||||||
|
|
|
|
|
|
|
|
|
|
|
|
|
| |||||||||||||||||||||||||||||||||||
Transfer agent fees – R6 | 64 | 63 | 102 | 7 | 3 | 2 | ||||||||||||||||||||||||||||||||||||||||||
|
|
|
|
|
|
|
|
|
|
|
|
|
| |||||||||||||||||||||||||||||||||||
Trustees’ and officers’ fees and benefits | 16,925 | 18,013 | 16,750 | 15,916 | 15,466 | 16,039 | ||||||||||||||||||||||||||||||||||||||||||
|
|
|
|
|
|
|
|
|
|
|
|
|
| |||||||||||||||||||||||||||||||||||
Registration and filing fees | 84,560 | 89,861 | 80,501 | 83,033 | 83,146 | 81,212 | ||||||||||||||||||||||||||||||||||||||||||
|
|
|
|
|
|
|
|
|
|
|
|
|
| |||||||||||||||||||||||||||||||||||
Reports to shareholders | 9,151 | (2,340 | ) | 9,653 | 9,875 | 10,593 | 11,045 | |||||||||||||||||||||||||||||||||||||||||
|
|
|
|
|
|
|
|
|
|
|
|
|
| |||||||||||||||||||||||||||||||||||
Professional services fees | 38,310 | 44,372 | 42,361 | 36,292 | 33,724 | 37,194 | ||||||||||||||||||||||||||||||||||||||||||
|
|
|
|
|
|
|
|
|
|
|
|
|
| |||||||||||||||||||||||||||||||||||
Other | 6,822 | 4,933 | 6,875 | 7,055 | 7,785 | 14,964 | ||||||||||||||||||||||||||||||||||||||||||
|
|
|
|
|
|
|
|
|
|
|
|
|
| |||||||||||||||||||||||||||||||||||
Total expenses | 188,073 | 170,991 | 177,377 | 218,412 | 277,183 | 379,308 | ||||||||||||||||||||||||||||||||||||||||||
|
|
|
|
|
|
|
|
|
|
|
|
|
| |||||||||||||||||||||||||||||||||||
Less: Expenses reimbursed and/or expense offset arrangement(s) | (173,023 | ) | (169,317 | ) | (172,183 | ) | (173,172 | ) | (181,613 | ) | (212,886 | ) | ||||||||||||||||||||||||||||||||||||
|
|
|
|
|
|
|
|
|
|
|
|
|
| |||||||||||||||||||||||||||||||||||
Net expenses | 15,050 | 1,674 | 5,194 | 45,240 | 95,570 | 166,422 | ||||||||||||||||||||||||||||||||||||||||||
|
|
|
|
|
|
|
|
|
|
|
|
|
| |||||||||||||||||||||||||||||||||||
Net investment income | 159,490 | 19,197 | 47,085 | 258,727 | 440,405 | 641,183 | ||||||||||||||||||||||||||||||||||||||||||
|
|
|
|
|
|
|
|
|
|
|
|
|
| |||||||||||||||||||||||||||||||||||
Realized and unrealized gain (loss) from: | ||||||||||||||||||||||||||||||||||||||||||||||||
Net realized gain (loss) from: | ||||||||||||||||||||||||||||||||||||||||||||||||
Affiliated underlying fund shares | (468,148 | ) | (85,675 | ) | (152,431 | ) | (1,212,579 | ) | (2,827,209 | ) | (4,735,517 | ) | ||||||||||||||||||||||||||||||||||||
|
|
|
|
|
|
|
|
|
|
|
|
|
| |||||||||||||||||||||||||||||||||||
Capital gain distributions from affiliated underlying fund shares | – | – | – | 27,285 | 108,158 | 272,637 | ||||||||||||||||||||||||||||||||||||||||||
|
|
|
|
|
|
|
|
|
|
|
|
|
| |||||||||||||||||||||||||||||||||||
| (468,148) | (85,675 | ) | (152,431 | ) | (1,185,294 | ) | (2,719,051 | ) | (4,462,880 | ) | |||||||||||||||||||||||||||||||||||||
Change in net unrealized appreciation (depreciation) of affiliated underlying fund shares | (254,550 | ) | (2,624 | ) | (76,297 | ) | (633,731 | ) | (1,678,487 | ) | (3,131,971 | ) | ||||||||||||||||||||||||||||||||||||
|
|
|
|
|
|
|
|
|
|
|
|
|
| |||||||||||||||||||||||||||||||||||
Net realized and unrealized gain (loss) | (722,698 | ) | (88,299 | ) | (228,728 | ) | (1,819,025 | ) | (4,397,538 | ) | (7,594,851 | ) | ||||||||||||||||||||||||||||||||||||
|
|
|
|
|
|
|
|
|
|
|
|
|
| |||||||||||||||||||||||||||||||||||
Net increase (decrease) in net assets resulting from operations | $ | (563,208 | ) | $ | (69,102 | ) | $ | (181,643 | ) | $ | (1,560,298 | ) | $ | (3,957,133 | ) | $ | (6,953,668 | ) | ||||||||||||||||||||||||||||||
|
|
|
|
|
|
|
|
|
|
|
|
|
| |||||||||||||||||||||||||||||||||||
See accompanying Notes to Financial Statements which are an integral part of the financial statements.
| 77 | Invesco Peak Retirement™ Funds |
Statements of Operations–(continued)
For the year ended December 31, 2022
| Invesco Peak Retirement™ 2035 Fund | Invesco Peak Retirement™ 2040 Fund | Invesco Peak Retirement™ 2045 Fund | Invesco Peak Retirement™ 2050 Fund | Invesco Peak Retirement™ 2055 Fund | Invesco Peak Retirement™ 2060 Fund | |||||||||||||||||||||||||||||||||||||||||||
|
|
|
|
|
|
|
|
|
|
|
|
| ||||||||||||||||||||||||||||||||||||
Investment income: | ||||||||||||||||||||||||||||||||||||||||||||||||
Dividends from affiliated underlying funds | $ | 430,703 | $ | 419,434 | $ | 179,084 | $ | 287,323 | $ | 106,396 | $ | 123,456 | ||||||||||||||||||||||||||||||||||||
|
|
|
|
|
|
|
|
|
|
|
|
| ||||||||||||||||||||||||||||||||||||
Securities lending income | 2,374 | 8,934 | 2,864 | 7,062 | 963 | 533 | ||||||||||||||||||||||||||||||||||||||||||
|
|
|
|
|
|
|
|
|
|
|
|
| ||||||||||||||||||||||||||||||||||||
Total investment income | 433,077 | 428,368 | 181,948 | 294,385 | 107,359 | 123,989 | ||||||||||||||||||||||||||||||||||||||||||
|
|
|
|
|
|
|
|
|
|
|
|
| ||||||||||||||||||||||||||||||||||||
Expenses: | ||||||||||||||||||||||||||||||||||||||||||||||||
Administrative services fees | 3,339 | 3,699 | 1,642 | 2,745 | 964 | 1,183 | ||||||||||||||||||||||||||||||||||||||||||
|
|
|
|
|
|
|
|
|
|
|
|
| ||||||||||||||||||||||||||||||||||||
Custodian fees | 19,703 | 19,832 | 16,281 | 19,333 | 15,997 | 15,802 | ||||||||||||||||||||||||||||||||||||||||||
|
|
|
|
|
|
|
|
|
|
|
|
| ||||||||||||||||||||||||||||||||||||
Distribution fees: | ||||||||||||||||||||||||||||||||||||||||||||||||
Class A | 29,656 | 36,354 | 13,865 | 25,929 | 8,618 | 10,712 | ||||||||||||||||||||||||||||||||||||||||||
|
|
|
|
|
|
|
|
|
|
|
|
| ||||||||||||||||||||||||||||||||||||
Class C | 37,283 | 28,387 | 19,906 | 27,771 | 9,605 | 7,265 | ||||||||||||||||||||||||||||||||||||||||||
|
|
|
|
|
|
|
|
|
|
|
|
| ||||||||||||||||||||||||||||||||||||
Class R | 26,237 | 30,237 | 14,926 | 22,808 | 7,718 | 11,350 | ||||||||||||||||||||||||||||||||||||||||||
|
|
|
|
|
|
|
|
|
|
|
|
| ||||||||||||||||||||||||||||||||||||
Transfer agent fees – A, C, R and Y | 29,669 | 41,203 | 24,589 | 45,978 | 22,374 | 23,924 | ||||||||||||||||||||||||||||||||||||||||||
|
|
|
|
|
|
|
|
|
|
|
|
| ||||||||||||||||||||||||||||||||||||
Transfer agent fees – R5 | 3 | 3 | 7 | 46 | 41 | 42 | ||||||||||||||||||||||||||||||||||||||||||
|
|
|
|
|
|
|
|
|
|
|
|
| ||||||||||||||||||||||||||||||||||||
Transfer agent fees – R6 | 3 | 3 | 35 | 54 | 108 | 102 | ||||||||||||||||||||||||||||||||||||||||||
|
|
|
|
|
|
|
|
|
|
|
|
| ||||||||||||||||||||||||||||||||||||
Trustees’ and officers’ fees and benefits | 15,570 | 15,918 | 16,308 | 15,880 | 16,285 | 16,299 | ||||||||||||||||||||||||||||||||||||||||||
|
|
|
|
|
|
|
|
|
|
|
|
| ||||||||||||||||||||||||||||||||||||
Registration and filing fees | 82,667 | 82,746 | 81,680 | 82,361 | 80,852 | 81,189 | ||||||||||||||||||||||||||||||||||||||||||
|
|
|
|
|
|
|
|
|
|
|
|
| ||||||||||||||||||||||||||||||||||||
Reports to shareholders | 9,933 | 11,232 | 10,367 | 11,322 | 10,775 | 10,872 | ||||||||||||||||||||||||||||||||||||||||||
|
|
|
|
|
|
|
|
|
|
|
|
| ||||||||||||||||||||||||||||||||||||
Professional services fees | 35,290 | 35,280 | 38,039 | 36,991 | 36,549 | 37,827 | ||||||||||||||||||||||||||||||||||||||||||
|
|
|
|
|
|
|
|
|
|
|
|
| ||||||||||||||||||||||||||||||||||||
Other | 8,108 | 7,881 | 7,788 | 8,630 | 7,135 | 8,876 | ||||||||||||||||||||||||||||||||||||||||||
|
|
|
|
|
|
|
|
|
|
|
|
| ||||||||||||||||||||||||||||||||||||
Total expenses | 297,461 | 312,775 | 245,433 | 299,848 | 217,021 | 225,443 | ||||||||||||||||||||||||||||||||||||||||||
|
|
|
|
|
|
|
|
|
|
|
|
| ||||||||||||||||||||||||||||||||||||
Less: Expenses reimbursed and/or expense offset arrangement(s) | (193,290 | ) | (200,892 | ) | (188,042 | ) | (208,773 | ) | (185,435 | ) | (187,856 | ) | ||||||||||||||||||||||||||||||||||||
|
|
|
|
|
|
|
|
|
|
|
|
| ||||||||||||||||||||||||||||||||||||
Net expenses | 104,171 | 111,883 | 57,391 | 91,075 | 31,586 | 37,587 | ||||||||||||||||||||||||||||||||||||||||||
|
|
|
|
|
|
|
|
|
|
|
|
| ||||||||||||||||||||||||||||||||||||
Net investment income | 328,906 | 316,485 | 124,557 | 203,310 | 75,773 | 86,402 | ||||||||||||||||||||||||||||||||||||||||||
|
|
|
|
|
|
|
|
|
|
|
|
| ||||||||||||||||||||||||||||||||||||
Realized and unrealized gain (loss) from: | ||||||||||||||||||||||||||||||||||||||||||||||||
Net realized gain (loss) from: | ||||||||||||||||||||||||||||||||||||||||||||||||
Affiliated underlying fund shares | (2,610,395 | ) | (2,975,761 | ) | (1,061,472 | ) | (1,904,947 | ) | (546,489 | ) | (585,631 | ) | ||||||||||||||||||||||||||||||||||||
|
|
|
|
|
|
|
|
|
|
|
|
| ||||||||||||||||||||||||||||||||||||
Capital gain distributions from affiliated underlying fund shares | 204,614 | 234,349 | 100,898 | 162,955 | 64,160 | 69,985 | ||||||||||||||||||||||||||||||||||||||||||
|
|
|
|
|
|
|
|
|
|
|
|
| ||||||||||||||||||||||||||||||||||||
| (2,405,781 | ) | (2,741,412 | ) | (960,574 | ) | (1,741,992 | ) | (482,329 | ) | (515,646 | ) | ||||||||||||||||||||||||||||||||||||
Change in net unrealized appreciation (depreciation) of affiliated underlying fund shares | (2,020,432 | ) | (2,487,572 | ) | (1,332,202 | ) | (2,214,052 | ) | (860,471 | ) | (1,199,522 | ) | ||||||||||||||||||||||||||||||||||||
|
|
|
|
|
|
|
|
|
|
|
|
| ||||||||||||||||||||||||||||||||||||
Net realized and unrealized gain (loss) | (4,426,213 | ) | (5,228,984 | ) | (2,292,776 | ) | (3,956,044 | ) | (1,342,800 | ) | (1,715,168 | ) | ||||||||||||||||||||||||||||||||||||
|
|
|
|
|
|
|
|
|
|
|
|
| ||||||||||||||||||||||||||||||||||||
Net increase (decrease) in net assets resulting from operations | $ | (4,097,307 | ) | $ | (4,912,499 | ) | $ | (2,168,219 | ) | $ | (3,752,734 | ) | $ | (1,267,027 | ) | $ | (1,628,766 | ) | ||||||||||||||||||||||||||||||
|
|
|
|
|
|
|
|
|
|
|
|
| ||||||||||||||||||||||||||||||||||||
See accompanying Notes to Financial Statements which are an integral part of the financial statements.
| 78 | Invesco Peak Retirement™ Funds |
Statements of Operations–(continued)
For the year ended December 31, 2022
| Invesco Peak Retirement™ 2065 Fund | ||||||||
|
|
| ||||||
Investment income: | ||||||||
Dividends from affiliated underlying funds | $ | 100,601 | ||||||
|
|
| ||||||
Securities lending income | 197 | |||||||
|
|
| ||||||
Total investment income | 100,798 | |||||||
|
|
| ||||||
Expenses: | ||||||||
Administrative services fees | 953 | |||||||
|
|
| ||||||
Custodian fees | 16,104 | |||||||
|
|
| ||||||
Distribution fees: | ||||||||
Class A | 9,448 | |||||||
|
|
| ||||||
Class C | 8,511 | |||||||
|
|
| ||||||
Class R | 4,472 | |||||||
|
|
| ||||||
Transfer agent fees – A, C, R and Y | 20,926 | |||||||
|
|
| ||||||
Transfer agent fees – R5 | 38 | |||||||
|
|
| ||||||
Transfer agent fees – R6 | 94 | |||||||
|
|
| ||||||
Trustees’ and officers’ fees and benefits | 16,957 | |||||||
|
|
| ||||||
Registration and filing fees | 81,457 | |||||||
|
|
| ||||||
Reports to shareholders | 10,799 | |||||||
|
|
| ||||||
Professional services fees | 36,625 | |||||||
|
|
| ||||||
Other | 6,518 | |||||||
|
|
| ||||||
Total expenses | 212,902 | |||||||
|
|
| ||||||
Less: Expenses reimbursed and/or expense offset arrangement(s) | (184,988 | ) | ||||||
|
|
| ||||||
Net expenses | 27,914 | |||||||
|
|
| ||||||
Net investment income | 72,884 | |||||||
|
|
| ||||||
Realized and unrealized gain (loss) from: | ||||||||
Net realized gain (loss) from: | ||||||||
Affiliated underlying fund shares | (587,598 | ) | ||||||
|
|
| ||||||
Capital gain distributions from affiliated underlying fund shares | 57,022 | |||||||
|
|
| ||||||
| (530,576 | ) | |||||||
|
|
| ||||||
Change in net unrealized appreciation (depreciation) of affiliated underlying fund shares | (836,136 | ) | ||||||
|
|
| ||||||
Net realized and unrealized gain (loss) | (1,366,712 | ) | ||||||
|
|
| ||||||
Net increase (decrease) in net assets resulting from operations | $ | (1,293,828 | ) | |||||
|
|
| ||||||
See accompanying Notes to Financial Statements which are an integral part of the financial statements.
| 79 | Invesco Peak Retirement™ Funds |
Statements of Changes in Net Assets
For the years ended December 31, 2022 and 2021
Invesco Peak Retirement™ Destination Fund | Invesco Peak Retirement™ 2010 Fund | |||||||||||||||
|
|
|
| |||||||||||||
| 2022 | 2021 | 2022 | 20211 | |||||||||||||
|
|
|
|
| ||||||||||||
Operations: | ||||||||||||||||
Net investment income | $ | 159,490 | $ | 116,854 | $ | 19,197 | $ | 7,745 | ||||||||
|
|
|
|
| ||||||||||||
Net realized gain (loss) | (468,148 | ) | 99,323 | (85,675 | ) | 1,021 | ||||||||||
|
|
|
|
| ||||||||||||
Change in net unrealized appreciation (depreciation) | (254,550 | ) | 103,691 | (2,624 | ) | 2,627 | ||||||||||
|
|
|
|
| ||||||||||||
Net increase (decrease) in net assets resulting from operations | (563,208 | ) | 319,868 | (69,102 | ) | 11,393 | ||||||||||
|
|
|
|
| ||||||||||||
Distributions to shareholders from distributable earnings: | ||||||||||||||||
Class A | (161,790 | ) | (122,091 | ) | (6,407 | ) | (3,991 | ) | ||||||||
|
|
|
|
| ||||||||||||
Class C | (2,595 | ) | (4,689 | ) | (1,232 | ) | (293 | ) | ||||||||
|
|
|
|
| ||||||||||||
Class R | (11,176 | ) | (4,481 | ) | (2,258 | ) | (147 | ) | ||||||||
|
|
|
|
| ||||||||||||
Class Y | (1,715 | ) | (1,533 | ) | (619 | ) | (170 | ) | ||||||||
|
|
|
|
| ||||||||||||
Class R5 | (4,288 | ) | (3,830 | ) | (619 | ) | (170 | ) | ||||||||
|
|
|
|
| ||||||||||||
Class R6 | (7,856 | ) | (10,099 | ) | (15,456 | ) | (4,234 | ) | ||||||||
|
|
|
|
| ||||||||||||
Total distributions from distributable earnings | (189,420 | ) | (146,723 | ) | (26,591 | ) | (9,005 | ) | ||||||||
|
|
|
|
| ||||||||||||
Return of capital: | ||||||||||||||||
Class A | (9,803 | ) | – | (160 | ) | – | ||||||||||
|
|
|
|
| ||||||||||||
Class C | (167 | ) | – | (31 | ) | – | ||||||||||
|
|
|
|
| ||||||||||||
Class R | (618 | ) | – | (56 | ) | – | ||||||||||
|
|
|
|
| ||||||||||||
Class Y | (102 | ) | – | (15 | ) | – | ||||||||||
|
|
|
|
| ||||||||||||
Class R5 | (255 | ) | – | (15 | ) | – | ||||||||||
|
|
|
|
| ||||||||||||
Class R6 | (466 | ) | – | (385 | ) | – | ||||||||||
|
|
|
|
| ||||||||||||
Total return of capital | (11,411 | ) | – | (662 | ) | – | ||||||||||
|
|
|
|
| ||||||||||||
Total distributions | (200,831 | ) | (146,723 | ) | (27,253 | ) | (9,005 | ) | ||||||||
|
|
|
|
| ||||||||||||
Share transactions–net: | ||||||||||||||||
Class A | (985,867 | ) | 2,200,144 | (111,328 | ) | 255,454 | ||||||||||
|
|
|
|
| ||||||||||||
Class C | (139,281 | ) | 52,186 | (10,209 | ) | 23,677 | ||||||||||
|
|
|
|
| ||||||||||||
Class R | 33,412 | 174,752 | 30,957 | 10,010 | ||||||||||||
|
|
|
|
| ||||||||||||
Class Y | – | – | – | 10,010 | ||||||||||||
|
|
|
|
| ||||||||||||
Class R5 | – | – | – | 10,010 | ||||||||||||
|
|
|
|
| ||||||||||||
Class R6 | – | (125,000 | ) | – | 250,010 | |||||||||||
|
|
|
|
| ||||||||||||
Net increase (decrease) in net assets resulting from share transactions | (1,091,736 | ) | 2,302,082 | (90,580 | ) | 559,171 | ||||||||||
|
|
|
|
| ||||||||||||
Net increase (decrease) in net assets | (1,855,775 | ) | 2,475,227 | (186,935 | ) | 561,559 | ||||||||||
|
|
|
|
| ||||||||||||
Net assets: | ||||||||||||||||
Beginning of year | 5,030,383 | 2,555,156 | 561,559 | – | ||||||||||||
|
|
|
|
| ||||||||||||
End of year | $ | 3,174,608 | $ | 5,030,383 | $ | 374,624 | $ | 561,559 | ||||||||
|
|
|
|
| ||||||||||||
| 1 | For the period April 30, 2021 (commencement date) through December 31, 2021. |
See accompanying Notes to Financial Statements which are an integral part of the financial statements.
| 80 | Invesco Peak Retirement™ Funds |
Statements of Changes in Net Assets–(continued)
For the years ended December 31, 2022 and 2021
Invesco Peak 2015 Fund | Invesco Peak Retirement™ 2020 Fund | |||||||||||||||
|
|
|
| |||||||||||||
| 2022 | 2021 | 2022 | 2021 | |||||||||||||
|
|
|
|
| ||||||||||||
Operations: | ||||||||||||||||
Net investment income | $ | 47,085 | $ | 37,375 | $ | 258,727 | $ | 191,194 | ||||||||
|
|
|
|
| ||||||||||||
Net realized gain (loss) | (152,431 | ) | 55,519 | (1,185,294 | ) | 271,443 | ||||||||||
|
|
|
|
| ||||||||||||
Change in net unrealized appreciation (depreciation) | (76,297 | ) | 19,689 | (633,731 | ) | 337,450 | ||||||||||
|
|
|
|
| ||||||||||||
Net increase (decrease) in net assets resulting from operations | (181,643 | ) | 112,583 | (1,560,298 | ) | 800,087 | ||||||||||
|
|
|
|
| ||||||||||||
Distributions to shareholders from distributable earnings: | ||||||||||||||||
Class A | (19,450 | ) | (42,807 | ) | (294,572 | ) | (213,028 | ) | ||||||||
|
|
|
|
| ||||||||||||
Class C | (1,992 | ) | (4,266 | ) | (22,430 | ) | (31,885 | ) | ||||||||
|
|
|
|
| ||||||||||||
Class R | (8,096 | ) | (7,309 | ) | (62,705 | ) | (49,260 | ) | ||||||||
|
|
|
|
| ||||||||||||
Class Y | (2,162 | ) | (2,263 | ) | (5,948 | ) | (3,278 | ) | ||||||||
|
|
|
|
| ||||||||||||
Class R5 | (5,405 | ) | (5,656 | ) | (6,325 | ) | (3,290 | ) | ||||||||
|
|
|
|
| ||||||||||||
Class R6 | (16,213 | ) | (16,965 | ) | (799 | ) | (415 | ) | ||||||||
|
|
|
|
| ||||||||||||
Total distributions from distributable earnings | (53,318 | ) | (79,266 | ) | (392,779 | ) | (301,156 | ) | ||||||||
|
|
|
|
| ||||||||||||
Return of capital: | ||||||||||||||||
Class A | – | – | (4,041 | ) | – | |||||||||||
|
|
|
|
| ||||||||||||
Class C | – | – | (288 | ) | – | |||||||||||
|
|
|
|
| ||||||||||||
Class R | – | – | (848 | ) | – | |||||||||||
|
|
|
|
| ||||||||||||
Class Y | – | – | (82 | ) | – | |||||||||||
|
|
|
|
| ||||||||||||
Class R5 | – | – | (88 | ) | – | |||||||||||
|
|
|
|
| ||||||||||||
Class R6 | – | – | (11 | ) | – | |||||||||||
|
|
|
|
| ||||||||||||
Total return of capital | – | – | (5,358 | ) | – | |||||||||||
|
|
|
|
| ||||||||||||
Total distributions | (53,318 | ) | (79,266 | ) | (398,137 | ) | (301,156 | ) | ||||||||
|
|
|
|
| ||||||||||||
Share transactions–net: | ||||||||||||||||
Class A | (402,817 | ) | 354,103 | (3,229,527 | ) | 5,145,005 | ||||||||||
|
|
|
|
| ||||||||||||
Class C | (96,633 | ) | 79,853 | (997,171 | ) | 687,349 | ||||||||||
|
|
|
|
| ||||||||||||
Class R | 32,135 | 33,255 | (743,950 | ) | 992,508 | |||||||||||
|
|
|
|
| ||||||||||||
Class Y | – | – | (2,605 | ) | 18,996 | |||||||||||
|
|
|
|
| ||||||||||||
Class R5 | – | – | – | – | ||||||||||||
|
|
|
|
| ||||||||||||
Class R6 | – | – | – | (342,261 | ) | |||||||||||
|
|
|
|
| ||||||||||||
Net increase (decrease) in net assets resulting from share transactions | (467,315 | ) | 467,211 | (4,973,253 | ) | 6,501,597 | ||||||||||
|
|
|
|
| ||||||||||||
Net increase (decrease) in net assets | (702,276 | ) | 500,528 | (6,931,688 | ) | 7,000,528 | ||||||||||
|
|
|
|
| ||||||||||||
Net assets: | ||||||||||||||||
Beginning of year | 1,651,195 | 1,150,667 | 12,616,407 | 5,615,879 | ||||||||||||
|
|
|
|
| ||||||||||||
End of year | $ | 948,919 | $ | 1,651,195 | $ | 5,684,719 | $ | 12,616,407 | ||||||||
|
|
|
|
| ||||||||||||
See accompanying Notes to Financial Statements which are an integral part of the financial statements.
| 81 | Invesco Peak Retirement™ Funds |
Statements of Changes in Net Assets–(continued)
For the years ended December 31, 2022 and 2021
Invesco Peak Retirement™ 2025 Fund | Invesco Peak Retirement™ 2030 Fund | |||||||||||||||
|
|
|
| |||||||||||||
| 2022 | 2021 | 2022 | 2021 | |||||||||||||
|
|
|
|
|
|
|
|
| ||||||||
Operations: | ||||||||||||||||
Net investment income | $ | 440,405 | $ | 337,181 | $ | 641,183 | $ | 461,001 | ||||||||
|
|
|
|
| ||||||||||||
Net realized gain (loss) | (2,719,051 | ) | 600,088 | (4,462,880 | ) | 1,024,157 | ||||||||||
|
|
|
|
| ||||||||||||
Change in net unrealized appreciation (depreciation) | (1,678,487 | ) | 773,451 | (3,131,971 | ) | 1,715,655 | ||||||||||
|
|
|
|
| ||||||||||||
Net increase (decrease) in net assets resulting from operations | (3,957,133 | ) | 1,710,720 | (6,953,668 | ) | 3,200,813 | ||||||||||
|
|
|
|
| ||||||||||||
Distributions to shareholders from distributable earnings: | ||||||||||||||||
Class A | (439,439 | ) | (583,246 | ) | (724,908 | ) | (685,743 | ) | ||||||||
|
|
|
|
| ||||||||||||
Class C | (84,068 | ) | (68,321 | ) | (113,639 | ) | (113,045 | ) | ||||||||
|
|
|
|
| ||||||||||||
Class R | (105,299 | ) | (78,006 | ) | (184,165 | ) | (195,139 | ) | ||||||||
|
|
|
|
| ||||||||||||
Class Y | (14,041 | ) | (5,978 | ) | (12,290 | ) | (8,986 | ) | ||||||||
|
|
|
|
| ||||||||||||
Class R5 | (673 | ) | (400 | ) | (492 | ) | (354 | ) | ||||||||
|
|
|
|
| ||||||||||||
Class R6 | (628 | ) | (373 | ) | (459 | )�� | (330 | ) | ||||||||
|
|
|
|
| ||||||||||||
Total distributions from distributable earnings | (644,148 | ) | (736,324 | ) | (1,035,953 | ) | (1,003,597 | ) | ||||||||
|
|
|
|
| ||||||||||||
Share transactions–net: | ||||||||||||||||
Class A | (9,427,981 | ) | 8,885,404 | (6,437,048 | ) | 10,496,539 | ||||||||||
|
|
|
|
| ||||||||||||
Class C | (880,350 | ) | 620,530 | (1,351,976 | ) | 3,261,560 | ||||||||||
|
|
|
|
| ||||||||||||
Class R | (818,125 | ) | 1,274,847 | (2,422,194 | ) | 5,212,127 | ||||||||||
|
|
|
|
| ||||||||||||
Class Y | 55,048 | 58,095 | (132,705 | ) | 152,458 | |||||||||||
|
|
|
|
| ||||||||||||
Class R5 | – | (11,500 | ) | – | (13,200 | ) | ||||||||||
|
|
|
|
| ||||||||||||
Class R6 | – | (241,000 | ) | – | (247,800 | ) | ||||||||||
|
|
|
|
| ||||||||||||
Net increase (decrease) in net assets resulting from share transactions | (11,071,408 | ) | 10,586,376 | (10,343,923 | ) | 18,861,684 | ||||||||||
|
|
|
|
| ||||||||||||
Net increase (decrease) in net assets | (15,672,689 | ) | 11,560,772 | (18,333,544 | ) | 21,058,900 | ||||||||||
|
|
|
|
| ||||||||||||
Net assets: | ||||||||||||||||
Beginning of year | 24,633,486 | 13,072,714 | 40,210,867 | 19,151,967 | ||||||||||||
|
|
|
|
| ||||||||||||
End of year | $ | 8,960,797 | $ | 24,633,486 | $ | 21,877,323 | $ | 40,210,867 | ||||||||
|
|
|
|
| ||||||||||||
See accompanying Notes to Financial Statements which are an integral part of the financial statements.
| 82 | Invesco Peak Retirement™ Funds |
Statements of Changes in Net Assets–(continued)
For the years ended December 31, 2022 and 2021
Invesco Peak Retirement™ 2035 Fund | Invesco Peak Retirement™ 2040 Fund | |||||||||||||||
|
|
|
| |||||||||||||
| 2022 | 2021 | 2022 | 2021 | |||||||||||||
|
|
|
|
|
|
|
|
| ||||||||
Operations: | ||||||||||||||||
Net investment income | $ | 328,906 | $ | 197,149 | $ | 316,485 | $ | 178,691 | ||||||||
|
|
|
|
| ||||||||||||
Net realized gain (loss) | (2,405,781 | ) | 568,961 | (2,741,412 | ) | 859,336 | ||||||||||
|
|
|
|
| ||||||||||||
Change in net unrealized appreciation (depreciation) | (2,020,432 | ) | 950,355 | (2,487,572 | ) | 1,315,285 | ||||||||||
|
|
|
|
| ||||||||||||
Net increase (decrease) in net assets resulting from operations | (4,097,307 | ) | 1,716,465 | (4,912,499 | ) | 2,353,312 | ||||||||||
|
|
|
|
| ||||||||||||
Distributions to shareholders from distributable earnings: | ||||||||||||||||
Class A | (327,371 | ) | (238,266 | ) | (498,841 | ) | (380,303 | ) | ||||||||
|
|
|
|
| ||||||||||||
Class C | (98,450 | ) | (57,018 | ) | (77,076 | ) | (61,528 | ) | ||||||||
|
|
|
|
| ||||||||||||
Class R | (160,039 | ) | (87,421 | ) | (138,374 | ) | (152,803 | ) | ||||||||
|
|
|
|
| ||||||||||||
Class Y | (30,038 | ) | (22,894 | ) | (32,839 | ) | (20,701 | ) | ||||||||
|
|
|
|
| ||||||||||||
Class R5 | (434 | ) | (279 | ) | (456 | ) | (341 | ) | ||||||||
|
|
|
|
| ||||||||||||
Class R6 | (402 | ) | (258 | ) | (420 | ) | (315 | ) | ||||||||
|
|
|
|
| ||||||||||||
Total distributions from distributable earnings | (616,734 | ) | (406,136 | ) | (748,006 | ) | (615,991 | ) | ||||||||
|
|
|
|
| ||||||||||||
Share transactions–net: | ||||||||||||||||
Class A | (1,548,267 | ) | 6,842,713 | (946,694 | ) | 9,845,398 | ||||||||||
|
|
|
|
| ||||||||||||
Class C | (257,480 | ) | 1,297,132 | (264,427 | ) | 1,690,961 | ||||||||||
|
|
|
|
| ||||||||||||
Class R | 201,084 | 2,778,093 | (2,115,556 | ) | 3,635,819 | |||||||||||
|
|
|
|
| ||||||||||||
Class Y | (123,426 | ) | 181,478 | 124,714 | 148,539 | |||||||||||
|
|
|
|
| ||||||||||||
Class R5 | – | (15,300 | ) | – | (15,800 | ) | ||||||||||
|
|
|
|
| ||||||||||||
Class R6 | – | (255,600 | ) | – | (259,627 | ) | ||||||||||
|
|
|
|
| ||||||||||||
Net increase (decrease) in net assets resulting from share transactions | (1,728,089 | ) | 10,828,516 | (3,201,963 | ) | 15,045,290 | ||||||||||
|
|
|
|
| ||||||||||||
Net increase (decrease) in net assets | (6,442,130 | ) | 12,138,845 | (8,862,468 | ) | 16,782,611 | ||||||||||
|
|
|
|
| ||||||||||||
Net assets: | ||||||||||||||||
Beginning of year | 21,533,160 | 9,394,315 | 25,534,701 | 8,752,090 | ||||||||||||
|
|
|
|
| ||||||||||||
End of year | $ | 15,091,030 | $ | 21,533,160 | $ | 16,672,233 | $ | 25,534,701 | ||||||||
|
|
|
|
| ||||||||||||
See accompanying Notes to Financial Statements which are an integral part of the financial statements.
| 83 | Invesco Peak Retirement™ Funds |
Statements of Changes in Net Assets–(continued)
For the years ended December 31, 2022 and 2021
Invesco Peak Retirement™ 2045 Fund | Invesco Peak Retirement™ 2050 Fund | |||||||||||||||
|
|
|
| |||||||||||||
| 2022 | 2021 | 2022 | 2021 | |||||||||||||
|
|
|
|
|
|
|
|
| ||||||||
Operations: | ||||||||||||||||
Net investment income | $ | 124,557 | $ | 59,353 | $ | 203,310 | $ | 104,818 | ||||||||
|
|
|
|
| ||||||||||||
Net realized gain (loss) | (960,574 | ) | 798,815 | (1,741,992 | ) | 632,926 | ||||||||||
|
|
|
|
| ||||||||||||
Change in net unrealized appreciation (depreciation) | (1,332,202 | ) | 337,220 | (2,214,052 | ) | 1,259,118 | ||||||||||
|
|
|
|
| ||||||||||||
Net increase (decrease) in net assets resulting from operations | (2,168,219 | ) | 1,195,388 | (3,752,734 | ) | 1,996,862 | ||||||||||
|
|
|
|
| ||||||||||||
Distributions to shareholders from distributable earnings: | ||||||||||||||||
Class A | (206,124 | ) | (302,919 | ) | (410,377 | ) | (130,266 | ) | ||||||||
|
|
|
|
| ||||||||||||
Class C | (58,755 | ) | (109,043 | ) | (80,706 | ) | (20,742 | ) | ||||||||
|
|
|
|
| ||||||||||||
Class R | (103,795 | ) | (146,818 | ) | (173,511 | ) | (50,988 | ) | ||||||||
|
|
|
|
| ||||||||||||
Class Y | (2,724 | ) | (9,954 | ) | (9,508 | ) | (3,548 | ) | ||||||||
|
|
|
|
| ||||||||||||
Class R5 | (1,165 | ) | (1,836 | ) | (5,724 | ) | (2,009 | ) | ||||||||
|
|
|
|
| ||||||||||||
Class R6 | (5,438 | ) | (8,574 | ) | (6,787 | ) | (2,383 | ) | ||||||||
|
|
|
|
| ||||||||||||
Total distributions from distributable earnings | (378,001 | ) | (579,144 | ) | (686,613 | ) | (209,936 | ) | ||||||||
|
|
|
|
| ||||||||||||
Share transactions–net: | ||||||||||||||||
Class A | 68,517 | 1,504,835 | 191,190 | 6,370,678 | ||||||||||||
|
|
|
|
| ||||||||||||
Class C | (332,051 | ) | 868,924 | (435,433 | ) | 1,613,084 | ||||||||||
|
|
|
|
| ||||||||||||
Class R | 422,885 | 1,056,939 | (150,520 | ) | 3,198,334 | |||||||||||
|
|
|
|
| ||||||||||||
Class Y | (104,901 | ) | 90,962 | (186,513 | ) | 25,547 | ||||||||||
|
|
|
|
| ||||||||||||
Class R6 | – | (151,323 | ) | – | (252,177 | ) | ||||||||||
|
|
|
|
| ||||||||||||
Net increase (decrease) in net assets resulting from share transactions | 54,450 | 3,370,337 | (581,276 | ) | 10,955,466 | |||||||||||
|
|
|
|
| ||||||||||||
Net increase (decrease) in net assets | (2,491,770 | ) | 3,986,581 | (5,020,623 | ) | 12,742,392 | ||||||||||
|
|
|
|
| ||||||||||||
Net assets: | ||||||||||||||||
Beginning of year | 10,419,523 | 6,432,942 | 18,655,220 | 5,912,828 | ||||||||||||
|
|
|
|
| ||||||||||||
End of year | $ | 7,927,753 | $ | 10,419,523 | $ | 13,634,597 | $ | 18,655,220 | ||||||||
|
|
|
|
| ||||||||||||
See accompanying Notes to Financial Statements which are an integral part of the financial statements.
| 84 | Invesco Peak Retirement™ Funds |
Statements of Changes in Net Assets–(continued)
For the years ended December 31, 2022 and 2021
Invesco Peak Retirement™ 2055 Fund | Invesco Peak Retirement™ 2060 Fund | |||||||||||||||
|
|
|
| |||||||||||||
| 2022 | 2021 | 2022 | 2021 | |||||||||||||
|
|
|
|
|
|
|
|
| ||||||||
Operations: | ||||||||||||||||
Net investment income | $ | 75,773 | $ | 33,473 | $ | 86,402 | $ | 48,523 | ||||||||
|
|
|
|
| ||||||||||||
Net realized gain (loss) | (482,329 | ) | 291,103 | (515,646 | ) | 268,291 | ||||||||||
|
|
|
|
| ||||||||||||
Change in net unrealized appreciation (depreciation) | (860,471 | ) | 316,026 | (1,199,522 | ) | 568,481 | ||||||||||
|
|
|
|
| ||||||||||||
Net increase (decrease) in net assets resulting from operations | (1,267,027 | ) | 640,602 | (1,628,766 | ) | 885,295 | ||||||||||
|
|
|
|
| ||||||||||||
Distributions to shareholders from distributable earnings: | ||||||||||||||||
Class A | (141,409 | ) | (66,088 | ) | (149,478 | ) | (45,493 | ) | ||||||||
|
|
|
|
| ||||||||||||
Class C | (26,708 | ) | (14,818 | ) | (18,680 | ) | (3,877 | ) | ||||||||
|
|
|
|
| ||||||||||||
Class R | (60,495 | ) | (22,001 | ) | (71,071 | ) | (21,456 | ) | ||||||||
|
|
|
|
| ||||||||||||
Class Y | (3,120 | ) | (1,616 | ) | (5,572 | ) | (2,068 | ) | ||||||||
|
|
|
|
| ||||||||||||
Class R5 | (5,358 | ) | (3,165 | ) | (4,723 | ) | (1,789 | ) | ||||||||
|
|
|
|
| ||||||||||||
Class R6 | (14,166 | ) | (8,355 | ) | (11,610 | ) | (4,398 | ) | ||||||||
|
|
|
|
| ||||||||||||
Total distributions from distributable earnings | (251,256 | ) | (116,043 | ) | (261,134 | ) | (79,081 | ) | ||||||||
|
|
|
|
| ||||||||||||
Share transactions–net: | ||||||||||||||||
Class A | 575,166 | 1,380,513 | 494,252 | 1,828,671 | ||||||||||||
|
|
|
|
| ||||||||||||
Class C | (51,354 | ) | 466,789 | 17,402 | 353,917 | |||||||||||
|
|
|
|
| ||||||||||||
Class R | 522,418 | 634,653 | (8,912 | ) | 1,294,374 | |||||||||||
|
|
|
|
| ||||||||||||
Class Y | (8,370 | ) | 24,729 | 4,445 | 50,517 | |||||||||||
|
|
|
|
| ||||||||||||
Class R6 | 618 | (50,468 | ) | – | (75,705 | ) | ||||||||||
|
|
|
|
| ||||||||||||
Net increase (decrease) in net assets resulting from share transactions | 1,038,478 | 2,456,216 | 507,187 | 3,451,774 | ||||||||||||
|
|
|
|
| ||||||||||||
Net increase (decrease) in net assets | (479,805 | ) | 2,980,775 | (1,382,713 | ) | 4,257,988 | ||||||||||
|
|
|
|
| ||||||||||||
Net assets: | ||||||||||||||||
Beginning of year | 5,999,024 | 3,018,249 | 7,950,782 | 3,692,794 | ||||||||||||
|
|
|
|
| ||||||||||||
End of year | $ | 5,519,219 | $ | 5,999,024 | $ | 6,568,069 | $ | 7,950,782 | ||||||||
|
|
|
|
| ||||||||||||
See accompanying Notes to Financial Statements which are an integral part of the financial statements.
| 85 | Invesco Peak Retirement™ Funds |
Statements of Changes in Net Assets–(continued)
For the years ended December 31, 2022 and 2021
Invesco Peak Retirement™ 2065 Fund | ||||||||
|
| |||||||
| 2022 | 2021 | |||||||
|
|
|
|
| ||||
Operations: | ||||||||
Net investment income | $ | 72,884 | $ | 35,826 | ||||
|
|
| ||||||
Net realized gain (loss) | (530,576 | ) | 282,443 | |||||
|
|
| ||||||
Change in net unrealized appreciation (depreciation) | (836,136 | ) | 324,919 | |||||
|
|
| ||||||
Net increase (decrease) in net assets resulting from operations | (1,293,828 | ) | 643,188 | |||||
|
|
| ||||||
Distributions to shareholders from distributable earnings: | ||||||||
Class A | (136,459 | ) | (75,209 | ) | ||||
|
|
| ||||||
Class C | (25,468 | ) | (14,232 | ) | ||||
|
|
| ||||||
Class R | (45,560 | ) | (13,144 | ) | ||||
|
|
| ||||||
Class Y | (17,334 | ) | (8,069 | ) | ||||
|
|
| ||||||
Class R5 | (5,570 | ) | (3,303 | ) | ||||
|
|
| ||||||
Class R6 | (13,739 | ) | (8,149 | ) | ||||
|
|
| ||||||
Total distributions from distributable earnings | (244,130 | ) | (122,106 | ) | ||||
|
|
| ||||||
Share transactions–net: | ||||||||
Class A | 169,929 | 1,672,785 | ||||||
|
|
| ||||||
Class C | (16,160 | ) | 507,429 | |||||
|
|
| ||||||
Class R | 470,083 | 302,528 | ||||||
|
|
| ||||||
Class Y | 9,227 | 172,572 | ||||||
|
|
| ||||||
Class R6 | – | (75,693 | ) | |||||
|
|
| ||||||
Net increase (decrease) in net assets resulting from share transactions | 633,079 | 2,579,621 | ||||||
|
|
| ||||||
Net increase (decrease) in net assets | (904,879 | ) | 3,100,703 | |||||
|
|
| ||||||
Net assets: | ||||||||
Beginning of year | 5,929,396 | 2,828,693 | ||||||
|
|
| ||||||
End of year | $ | 5,024,517 | $ | 5,929,396 | ||||
|
|
| ||||||
See accompanying Notes to Financial Statements which are an integral part of the financial statements.
| 86 | Invesco Peak Retirement™ Funds |
The following schedules present financial highlights for a share of each Fund outstanding throughout the periods indicated.
Invesco Peak Retirement™ Destination Fund
| Net asset value, beginning of period | Net investment income(a)(b) | Net gains on securities | Total from investment operations | Dividends from net investment income | Distributions from net realized gains | Return of capital | Total distributions | Net asset value, end of period | Total return (c) | Net assets, end of period (000’s omitted) | Ratio of to average net assets | Ratio of expenses to average net assets without fee waivers and/or expenses absorbed | Ratio of net to average | Portfolio turnover (e) | |||||||||||||||||||||||||||||||||||||||||||||||||||||||||||||
Class A | |||||||||||||||||||||||||||||||||||||||||||||||||||||||||||||||||||||||||||
Year ended 12/31/22 | $ | 10.67 | $ | 0.33 | $ | (1.47 | ) | $ | (1.14 | ) | $ | (0.33 | ) | $ | (0.08 | ) | $ | (0.02 | ) | $ | (0.43 | ) | $ | 9.10 | (10.77 | )% | $ | 2,643 | 0.31 | % | 3.96 | % | 3.38 | % | 41 | % | |||||||||||||||||||||||||||||||||||||||
Year ended 12/31/21 | 10.14 | 0.29 | 0.60 | 0.89 | (0.31 | ) | (0.05 | ) | – | (0.36 | ) | 10.67 | 8.84 | 4,286 | 0.30 | 3.73 | 2.77 | 48 | |||||||||||||||||||||||||||||||||||||||||||||||||||||||||
Year ended 12/31/20 | 10.17 | 0.30 | 0.05 | 0.35 | (0.37 | ) | (0.01 | ) | – | (0.38 | ) | 10.14 | 3.71 | 1,948 | 0.35 | 11.12 | 3.11 | 130 | |||||||||||||||||||||||||||||||||||||||||||||||||||||||||
Year ended 12/31/19 | 9.27 | 0.40 | 0.93 | 1.33 | (0.37 | ) | (0.06 | ) | – | (0.43 | ) | 10.17 | 14.50 | 486 | 0.37 | 21.66 | 3.97 | 30 | |||||||||||||||||||||||||||||||||||||||||||||||||||||||||
Period ended 12/31/18(f) | 10.00 | 0.34 | (0.72 | ) | (0.38 | ) | (0.35 | ) | – | – | (0.35 | ) | 9.27 | (3.90 | ) | 38 | 0.37 | (g) | 52.02 | (g) | 3.47 | (g) | 4 | ||||||||||||||||||||||||||||||||||||||||||||||||||||
Class C | |||||||||||||||||||||||||||||||||||||||||||||||||||||||||||||||||||||||||||
Year ended 12/31/22 | 10.67 | 0.26 | (1.47 | ) | (1.21 | ) | (0.26 | ) | (0.08 | ) | (0.02 | ) | (0.36 | ) | 9.10 | (11.44 | ) | 24 | 1.06 | 4.71 | 2.63 | 41 | |||||||||||||||||||||||||||||||||||||||||||||||||||||
Year ended 12/31/21 | 10.14 | 0.21 | 0.60 | 0.81 | (0.23 | ) | (0.05 | ) | – | (0.28 | ) | 10.67 | 8.08 | 180 | 1.05 | 4.48 | 2.02 | 48 | |||||||||||||||||||||||||||||||||||||||||||||||||||||||||
Year ended 12/31/20 | 10.16 | 0.23 | 0.06 | 0.29 | (0.30 | ) | (0.01 | ) | – | (0.31 | ) | 10.14 | 3.03 | 119 | 1.10 | 11.87 | 2.36 | 130 | |||||||||||||||||||||||||||||||||||||||||||||||||||||||||
Year ended 12/31/19 | 9.27 | 0.32 | 0.92 | 1.24 | (0.29 | ) | (0.06 | ) | – | (0.35 | ) | 10.16 | 13.53 | 93 | 1.12 | 22.41 | 3.22 | 30 | |||||||||||||||||||||||||||||||||||||||||||||||||||||||||
Period ended 12/31/18(f) | 10.00 | 0.26 | (0.71 | ) | (0.45 | ) | (0.28 | ) | – | – | (0.28 | ) | 9.27 | (4.56 | ) | 9 | 1.12 | (g) | 52.77 | (g) | 2.72 | (g) | 4 | ||||||||||||||||||||||||||||||||||||||||||||||||||||
Class R | |||||||||||||||||||||||||||||||||||||||||||||||||||||||||||||||||||||||||||
Year ended 12/31/22 | 10.68 | 0.30 | (1.45 | ) | (1.15 | ) | (0.31 | ) | (0.08 | ) | (0.02 | ) | (0.41 | ) | 9.12 | (10.88 | ) | 213 | 0.56 | 4.21 | 3.13 | 41 | |||||||||||||||||||||||||||||||||||||||||||||||||||||
Year ended 12/31/21 | 10.14 | 0.27 | 0.59 | 0.86 | (0.27 | ) | (0.05 | ) | – | (0.32 | ) | 10.68 | 8.63 | 219 | 0.55 | 3.98 | 2.52 | 48 | |||||||||||||||||||||||||||||||||||||||||||||||||||||||||
Year ended 12/31/20 | 10.17 | 0.28 | 0.05 | 0.33 | (0.35 | ) | (0.01 | ) | – | (0.36 | ) | 10.14 | 3.45 | 42 | 0.60 | 11.37 | 2.86 | 130 | |||||||||||||||||||||||||||||||||||||||||||||||||||||||||
Year ended 12/31/19 | 9.27 | 0.37 | 0.93 | 1.30 | (0.34 | ) | (0.06 | ) | – | (0.40 | ) | 10.17 | 14.21 | 10 | 0.62 | 21.91 | 3.72 | 30 | |||||||||||||||||||||||||||||||||||||||||||||||||||||||||
Period ended 12/31/18(f) | 10.00 | 0.31 | (0.72 | ) | (0.41 | ) | (0.32 | ) | – | – | (0.32 | ) | 9.27 | (4.12 | ) | 9 | 0.62 | (g) | 52.27 | (g) | 3.22 | (g) | 4 | ||||||||||||||||||||||||||||||||||||||||||||||||||||
Class Y | |||||||||||||||||||||||||||||||||||||||||||||||||||||||||||||||||||||||||||
Year ended 12/31/22 | 10.67 | 0.35 | (1.45 | ) | (1.10 | ) | (0.35 | ) | (0.08 | ) | (0.03 | ) | (0.46 | ) | 9.11 | (10.44 | ) | 36 | 0.06 | 3.71 | 3.63 | 41 | |||||||||||||||||||||||||||||||||||||||||||||||||||||
Year ended 12/31/21 | 10.15 | 0.32 | 0.58 | 0.90 | (0.33 | ) | (0.05 | ) | – | (0.38 | ) | 10.67 | 9.01 | 43 | 0.05 | 3.48 | 3.02 | 48 | |||||||||||||||||||||||||||||||||||||||||||||||||||||||||
Year ended 12/31/20 | 10.17 | 0.32 | 0.06 | 0.38 | (0.39 | ) | (0.01 | ) | – | (0.40 | ) | 10.15 | 4.07 | 41 | 0.10 | 10.87 | 3.36 | 130 | |||||||||||||||||||||||||||||||||||||||||||||||||||||||||
Year ended 12/31/19 | 9.28 | 0.42 | 0.92 | 1.34 | (0.39 | ) | (0.06 | ) | – | (0.45 | ) | 10.17 | 14.66 | 41 | 0.12 | 21.41 | 4.22 | 30 | |||||||||||||||||||||||||||||||||||||||||||||||||||||||||
Period ended 12/31/18(f) | 10.00 | 0.36 | (0.71 | ) | (0.35 | ) | (0.37 | ) | – | – | (0.37 | ) | 9.28 | (3.57 | ) | 37 | 0.12 | (g) | 51.77 | (g) | 3.72 | (g) | 4 | ||||||||||||||||||||||||||||||||||||||||||||||||||||
Class R5 | |||||||||||||||||||||||||||||||||||||||||||||||||||||||||||||||||||||||||||
Year ended 12/31/22 | 10.67 | 0.35 | (1.45 | ) | (1.10 | ) | (0.35 | ) | (0.08 | ) | (0.03 | ) | (0.46 | ) | 9.11 | (10.44 | ) | 91 | 0.06 | 3.67 | 3.63 | 41 | |||||||||||||||||||||||||||||||||||||||||||||||||||||
Year ended 12/31/21 | 10.15 | 0.32 | 0.58 | 0.90 | (0.33 | ) | (0.05 | ) | – | (0.38 | ) | 10.67 | 9.01 | 107 | 0.05 | 3.39 | 3.02 | 48 | |||||||||||||||||||||||||||||||||||||||||||||||||||||||||
Year ended 12/31/20 | 10.17 | 0.32 | 0.06 | 0.38 | (0.39 | ) | (0.01 | ) | – | (0.40 | ) | 10.15 | 4.07 | 101 | 0.10 | 10.73 | 3.36 | 130 | |||||||||||||||||||||||||||||||||||||||||||||||||||||||||
Year ended 12/31/19 | 9.28 | 0.42 | 0.92 | 1.34 | (0.39 | ) | (0.06 | ) | – | (0.45 | ) | 10.17 | 14.66 | 102 | 0.12 | 21.26 | 4.22 | 30 | |||||||||||||||||||||||||||||||||||||||||||||||||||||||||
Period ended 12/31/18(f) | 10.00 | 0.36 | (0.71 | ) | (0.35 | ) | (0.37 | ) | – | – | (0.37 | ) | 9.28 | (3.57 | ) | 93 | 0.12 | (g) | 51.22 | (g) | 3.72 | (g) | 4 | ||||||||||||||||||||||||||||||||||||||||||||||||||||
Class R6 | |||||||||||||||||||||||||||||||||||||||||||||||||||||||||||||||||||||||||||
Year ended 12/31/22 | 10.67 | 0.35 | (1.45 | ) | (1.10 | ) | (0.35 | ) | (0.08 | ) | (0.03 | ) | (0.46 | ) | 9.11 | (10.44 | ) | 167 | 0.06 | 3.67 | 3.63 | 41 | |||||||||||||||||||||||||||||||||||||||||||||||||||||
Year ended 12/31/21 | 10.14 | 0.32 | 0.59 | 0.91 | (0.33 | ) | (0.05 | ) | – | (0.38 | ) | 10.67 | 9.11 | 196 | 0.05 | 3.39 | 3.02 | 48 | |||||||||||||||||||||||||||||||||||||||||||||||||||||||||
Year ended 12/31/20 | 10.17 | 0.32 | 0.05 | 0.37 | (0.39 | ) | (0.01 | ) | – | (0.40 | ) | 10.14 | 3.97 | 304 | 0.10 | 10.73 | 3.45 | 130 | |||||||||||||||||||||||||||||||||||||||||||||||||||||||||
Year ended 12/31/19 | 9.28 | 0.42 | 0.92 | 1.34 | (0.39 | ) | (0.06 | ) | – | (0.45 | ) | 10.17 | 14.66 | 305 | 0.12 | 21.26 | 4.22 | 30 | |||||||||||||||||||||||||||||||||||||||||||||||||||||||||
Period ended 12/31/18(f) | 10.00 | 0.36 | (0.71 | ) | (0.35 | ) | (0.37 | ) | – | – | (0.37 | ) | 9.28 | (3.57 | ) | 278 | 0.12 | (g) | 51.22 | (g) | 3.72 | (g) | 4 | ||||||||||||||||||||||||||||||||||||||||||||||||||||
| (a) | Calculated using average shares outstanding. |
| (b) | Net investment income is affected by the timing of the declaration of dividends by the underlying funds in which the Fund invests. Ratio of net investment income does not include net investment income of the underlying funds in which the Fund invests. |
| (c) | Includes adjustments in accordance with accounting principles generally accepted in the United States of America and as such, the net asset value for financial reporting purposes and the returns based upon those net asset values may differ from the net asset value and returns for shareholder transactions. Does not include sales charges and is not annualized for periods less than one year, if applicable. |
| (d) | In addition to the fees and expenses which the Fund bears directly; the Fund indirectly bears a pro rata share of the fees and expenses of the underlying funds in which the Fund invests. Because the underlying funds have varied expenses and fee levels and the Fund may own different proportions at different times, the amount of fees and expenses incurred indirectly by the Fund will vary. Estimated underlying fund expenses are not expenses that are incurred directly by the Fund. They are expenses that are incurred directly by the underlying funds and are deducted from the value of the funds the Fund invests in. The effect of the estimated underlying fund expenses that the Fund bears indirectly is included in the Fund’s total return. |
Estimated acquired fund fees from underlying funds were 0.42%, 0.46%, 0.50%, 0.47% and 0.44% for the years ended December 31, 2022, 2021, 2020, 2019 and 2018, respectively. |
| (e) | Portfolio turnover is calculated at the fund level and is not annualized for periods less than one year, if applicable. |
| (f) | Commencement date of January 3, 2018. |
| (g) | Annualized. |
See accompanying Notes to Financial Statements which are an integral part of the financial statements.
| 87 | Invesco Peak Retirement™ Funds |
Financial Highlights–(continued)
Invesco Peak Retirement™ 2010 Fund
| Net asset value, beginning of period | Net investment income(a)(b) | Net gains on securities | Total from investment operations | Dividends from net investment income | Distributions from net realized gains | Return of capital | Total distributions | Net asset value, end of period | Total return (c) | Net assets, end of period (000’s omitted) | Ratio of to average net assets | Ratio of expenses to average net assets without fee waivers and/or expenses absorbed | Ratio of net to average | Portfolio turnover (e) | |||||||||||||||||||||||||||||||||||||||||||||||||||||||||||||
Class A | |||||||||||||||||||||||||||||||||||||||||||||||||||||||||||||||||||||||||||
Year ended 12/31/22 | $ | 10.13 | $ | 0.30 | $ | (1.37 | ) | $ | (1.07 | ) | $ | (0.56 | ) | $ | (0.01 | ) | $ | (0.01 | ) | $ | (0.58 | ) | $ | 8.48 | (10.54 | )% | $ | 100 | 0.34 | % | 29.28 | % | 3.23 | % | 46 | % | |||||||||||||||||||||||||||||||||||||||
Period ended 12/31/21(f) | 10.00 | 0.19 | 0.10 | 0.29 | (0.16 | ) | – | – | (0.16 | ) | 10.13 | 2.94 | 254 | 0.35 | (g) | 55.68 | (g) | 2.86 | (g) | 2 | |||||||||||||||||||||||||||||||||||||||||||||||||||||||
Class C | |||||||||||||||||||||||||||||||||||||||||||||||||||||||||||||||||||||||||||
Year ended 12/31/22 | 10.12 | 0.23 | (1.37 | ) | (1.14 | ) | (0.47 | ) | (0.01 | ) | (0.01 | ) | (0.49 | ) | 8.49 | (11.25 | ) | 8 | 1.09 | 30.03 | 2.48 | 46 | |||||||||||||||||||||||||||||||||||||||||||||||||||||
Period ended 12/31/21(f) | 10.00 | 0.14 | 0.11 | 0.25 | (0.13 | ) | – | – | (0.13 | ) | 10.12 | 2.47 | 24 | 1.10 | (g) | 56.43 | (g) | 2.11 | (g) | 2 | |||||||||||||||||||||||||||||||||||||||||||||||||||||||
Class R | |||||||||||||||||||||||||||||||||||||||||||||||||||||||||||||||||||||||||||
Year ended 12/31/22 | 10.13 | 0.27 | (1.35 | ) | (1.08 | ) | (0.54 | ) | (0.01 | ) | (0.01 | ) | (0.56 | ) | 8.49 | (10.70 | ) | 37 | 0.59 | 29.53 | 2.98 | 46 | |||||||||||||||||||||||||||||||||||||||||||||||||||||
Period ended 12/31/21(f) | 10.00 | 0.18 | 0.10 | 0.28 | (0.15 | ) | – | – | (0.15 | ) | 10.13 | 2.78 | 10 | 0.60 | (g) | 55.93 | (g) | 2.61 | (g) | 2 | |||||||||||||||||||||||||||||||||||||||||||||||||||||||
Class Y | |||||||||||||||||||||||||||||||||||||||||||||||||||||||||||||||||||||||||||
Year ended 12/31/22 | 10.15 | 0.33 | (1.38 | ) | (1.05 | ) | (0.60 | ) | (0.01 | ) | (0.02 | ) | (0.63 | ) | 8.47 | (10.34 | ) | 8 | 0.09 | 29.03 | 3.48 | 46 | |||||||||||||||||||||||||||||||||||||||||||||||||||||
Period ended 12/31/21(f) | 10.00 | 0.21 | 0.11 | 0.32 | (0.17 | ) | – | – | (0.17 | ) | 10.15 | 3.21 | 10 | 0.10 | (g) | 55.43 | (g) | 3.11 | (g) | 2 | |||||||||||||||||||||||||||||||||||||||||||||||||||||||
Class R5 | |||||||||||||||||||||||||||||||||||||||||||||||||||||||||||||||||||||||||||
Year ended 12/31/22 | 10.15 | 0.33 | (1.38 | ) | (1.05 | ) | (0.60 | ) | (0.01 | ) | (0.02 | ) | (0.63 | ) | 8.47 | (10.34 | ) | 8 | 0.09 | 29.06 | 3.48 | 46 | |||||||||||||||||||||||||||||||||||||||||||||||||||||
Period ended 12/31/21(f) | 10.00 | 0.21 | 0.11 | 0.32 | (0.17 | ) | – | – | (0.17 | ) | 10.15 | 3.21 | 10 | 0.10 | (g) | 54.32 | (g) | 3.11 | (g) | 2 | |||||||||||||||||||||||||||||||||||||||||||||||||||||||
Class R6 | |||||||||||||||||||||||||||||||||||||||||||||||||||||||||||||||||||||||||||
Year ended 12/31/22 | 10.15 | 0.33 | (1.38 | ) | (1.05 | ) | (0.60 | ) | (0.01 | ) | (0.02 | ) | (0.63 | ) | 8.47 | (10.34 | ) | 212 | 0.09 | 29.06 | 3.48 | 46 | |||||||||||||||||||||||||||||||||||||||||||||||||||||
Period ended 12/31/21(f) | 10.00 | 0.21 | 0.11 | 0.32 | (0.17 | ) | – | – | (0.17 | ) | 10.15 | 3.21 | 254 | 0.10 | (g) | 54.32 | (g) | 3.11 | (g) | 2 | |||||||||||||||||||||||||||||||||||||||||||||||||||||||
| (a) | Calculated using average shares outstanding. |
| (b) | Net investment income is affected by the timing of the declaration of dividends by the underlying funds in which the Fund invests. Ratio of net investment income does not include net investment income of the underlying funds in which the Fund invests. |
| (c) | Includes adjustments in accordance with accounting principles generally accepted in the United States of America and as such, the net asset value for financial reporting purposes and the returns based upon those net asset values may differ from the net asset value and returns for shareholder transactions. Does not include sales charges and is not annualized for periods less than one year, if applicable. |
| (d) | In addition to the fees and expenses, which the Funds bear directly, the Funds indirectly bear a pro rata share of the fees and expenses of the underlying funds in which they invest. Because the underlying funds have varied expenses and fee levels and the Funds may own different proportions at different times, the amount of fees and expenses incurred indirectly by the Funds will vary. Estimated underlying fund expenses are not expenses that are incurred directly by the Funds. They are expenses that are incurred directly by the underlying funds and are deducted from the value of the funds the Funds invests in. The effect of the estimated underlying fund expenses that the Fund bears indirectly is included in the Funds’ total return. Estimated acquired fund fees from underlying funds were 0.42% and 0.39% for the year ended December 31, 2022 and 2021, respectively. |
| (e) | Portfolio turnover is calculated at the fund level and is not annualized for periods less than one year, if applicable. |
| (f) | Commencement date of April 30, 2021. |
| (g) | Annualized. |
See accompanying Notes to Financial Statements which are an integral part of the financial statements.
| 88 | Invesco Peak Retirement™ Funds |
Financial Highlights–(continued)
Invesco Peak Retirement™ 2015 Fund
| Net asset value, beginning of period | Net investment income(a)(b) | Net gains on securities | Total from investment operations | Dividends from net investment income | Distributions from net realized gains | Total distributions | Net asset value, end of period | Total return (c) | Net assets, end of period (000’s omitted) | Ratio of to average net assets | Ratio of expenses to average net assets without fee waivers and/or expenses absorbed | Ratio of net to average | Portfolio turnover (e) | |||||||||||||||||||||||||||||||||||||||||||||||||||||||||
Class A | ||||||||||||||||||||||||||||||||||||||||||||||||||||||||||||||||||||||
Year ended 12/31/22 | $ | 10.68 | $ | 0.31 | $ | (1.43 | ) | $ | (1.12 | ) | $ | (0.47 | ) | $ | (0.03 | ) | $ | (0.50 | ) | $ | 9.06 | (10.55 | )% | $ | 372 | 0.32 | % | 11.69 | % | 3.13 | % | 24 | % | |||||||||||||||||||||||||||||||||||||
Year ended 12/31/21 | 10.36 | 0.27 | 0.59 | 0.86 | (0.30 | ) | (0.24 | ) | (0.54 | ) | 10.68 | 8.37 | 888 | 0.32 | 10.91 | 2.47 | 69 | |||||||||||||||||||||||||||||||||||||||||||||||||||||
Year ended 12/31/20 | 10.30 | 0.31 | 0.05 | 0.36 | (0.30 | ) | (0.00 | ) | (0.30 | ) | 10.36 | 3.53 | 520 | 0.36 | 18.52 | 3.13 | 75 | |||||||||||||||||||||||||||||||||||||||||||||||||||||
Year ended 12/31/19 | 9.35 | 0.36 | 0.98 | 1.34 | (0.33 | ) | (0.06 | ) | (0.39 | ) | 10.30 | 14.25 | 181 | 0.39 | 23.68 | 3.54 | 68 | |||||||||||||||||||||||||||||||||||||||||||||||||||||
Period ended 12/31/18(f) | 10.00 | 0.31 | (0.68 | ) | (0.37 | ) | (0.28 | ) | – | (0.28 | ) | 9.35 | (3.73 | ) | 121 | 0.38 | (g) | 45.25 | (g) | 3.11 | (g) | 5 | ||||||||||||||||||||||||||||||||||||||||||||||||
Class C | ||||||||||||||||||||||||||||||||||||||||||||||||||||||||||||||||||||||
Year ended 12/31/22 | 10.63 | 0.23 | (1.42 | ) | (1.19 | ) | (0.31 | ) | (0.03 | ) | (0.34 | ) | 9.10 | (11.26 | ) | 11 | 1.07 | 12.44 | 2.38 | 24 | ||||||||||||||||||||||||||||||||||||||||||||||||||
Year ended 12/31/21 | 10.29 | 0.19 | 0.60 | 0.79 | (0.21 | ) | (0.24 | ) | (0.45 | ) | 10.63 | 7.68 | 131 | 1.07 | 11.66 | 1.72 | 69 | |||||||||||||||||||||||||||||||||||||||||||||||||||||
Year ended 12/31/20 | 10.28 | 0.23 | 0.05 | 0.28 | (0.27 | ) | (0.00 | ) | (0.27 | ) | 10.29 | 2.81 | 50 | 1.11 | 19.27 | 2.38 | 75 | |||||||||||||||||||||||||||||||||||||||||||||||||||||
Year ended 12/31/19 | 9.30 | 0.27 | 0.97 | 1.24 | (0.20 | ) | (0.06 | ) | (0.26 | ) | 10.28 | 13.29 | 10 | 1.14 | 24.43 | 2.79 | 68 | |||||||||||||||||||||||||||||||||||||||||||||||||||||
Period ended 12/31/18(f) | 10.00 | 0.23 | (0.67 | ) | (0.44 | ) | (0.26 | ) | – | (0.26 | ) | 9.30 | (4.42 | ) | 109 | 1.13 | (g) | 46.00 | (g) | 2.36 | (g) | 5 | ||||||||||||||||||||||||||||||||||||||||||||||||
Class R | ||||||||||||||||||||||||||||||||||||||||||||||||||||||||||||||||||||||
Year ended 12/31/22 | 10.66 | 0.28 | (1.43 | ) | (1.15 | ) | (0.43 | ) | (0.03 | ) | (0.46 | ) | 9.05 | (10.79 | ) | 166 | 0.57 | 11.94 | 2.88 | 24 | ||||||||||||||||||||||||||||||||||||||||||||||||||
Year ended 12/31/21 | 10.33 | 0.24 | 0.60 | 0.84 | (0.27 | ) | (0.24 | ) | (0.51 | ) | 10.66 | 8.20 | 161 | 0.57 | 11.16 | 2.22 | 69 | |||||||||||||||||||||||||||||||||||||||||||||||||||||
Year ended 12/31/20 | 10.28 | 0.29 | 0.05 | 0.34 | (0.29 | ) | (0.00 | ) | (0.29 | ) | 10.33 | 3.37 | 123 | 0.61 | 18.77 | 2.88 | 75 | |||||||||||||||||||||||||||||||||||||||||||||||||||||
Year ended 12/31/19 | 9.34 | 0.33 | 0.96 | 1.29 | (0.29 | ) | (0.06 | ) | (0.35 | ) | 10.28 | 13.78 | 10 | 0.64 | 23.93 | 3.29 | 68 | |||||||||||||||||||||||||||||||||||||||||||||||||||||
Period ended 12/31/18(f) | 10.00 | 0.28 | (0.67 | ) | (0.39 | ) | (0.27 | ) | – | (0.27 | ) | 9.34 | (3.90 | ) | 9 | 0.63 | (g) | 45.50 | (g) | 2.86 | (g) | 5 | ||||||||||||||||||||||||||||||||||||||||||||||||
Class Y | ||||||||||||||||||||||||||||||||||||||||||||||||||||||||||||||||||||||
Year ended 12/31/22 | 10.72 | 0.33 | (1.43 | ) | (1.10 | ) | (0.51 | ) | (0.03 | ) | (0.54 | ) | 9.08 | (10.28 | ) | 36 | 0.07 | 11.44 | 3.38 | 24 | ||||||||||||||||||||||||||||||||||||||||||||||||||
Year ended 12/31/21 | 10.39 | 0.30 | 0.60 | 0.90 | (0.33 | ) | (0.24 | ) | (0.57 | ) | 10.72 | 8.68 | 43 | 0.07 | 10.66 | 2.72 | 69 | |||||||||||||||||||||||||||||||||||||||||||||||||||||
Year ended 12/31/20 | 10.31 | 0.33 | 0.06 | 0.39 | (0.31 | ) | (0.00 | ) | (0.31 | ) | 10.39 | 3.84 | 42 | 0.11 | 18.27 | 3.38 | 75 | |||||||||||||||||||||||||||||||||||||||||||||||||||||
Year ended 12/31/19 | 9.37 | 0.38 | 0.97 | 1.35 | (0.35 | ) | (0.06 | ) | (0.41 | ) | 10.31 | 14.35 | 41 | 0.14 | 23.43 | 3.79 | 68 | |||||||||||||||||||||||||||||||||||||||||||||||||||||
Period ended 12/31/18(f) | 10.00 | 0.33 | (0.67 | ) | (0.34 | ) | (0.29 | ) | – | (0.29 | ) | 9.37 | (3.41 | ) | 37 | 0.13 | (g) | 45.00 | (g) | 3.36 | (g) | 5 | ||||||||||||||||||||||||||||||||||||||||||||||||
Class R5 | ||||||||||||||||||||||||||||||||||||||||||||||||||||||||||||||||||||||
Year ended 12/31/22 | 10.72 | 0.33 | (1.43 | ) | (1.10 | ) | (0.51 | ) | (0.03 | ) | (0.54 | ) | 9.08 | (10.28 | ) | 91 | 0.07 | 11.35 | 3.38 | 24 | ||||||||||||||||||||||||||||||||||||||||||||||||||
Year ended 12/31/21 | 10.39 | 0.30 | 0.60 | 0.90 | (0.33 | ) | (0.24 | ) | (0.57 | ) | 10.72 | 8.68 | 107 | 0.07 | 10.52 | 2.72 | 69 | |||||||||||||||||||||||||||||||||||||||||||||||||||||
Year ended 12/31/20 | 10.31 | 0.33 | 0.06 | 0.39 | (0.31 | ) | (0.00 | ) | (0.31 | ) | 10.39 | 3.84 | 104 | 0.11 | 18.09 | 3.38 | 75 | |||||||||||||||||||||||||||||||||||||||||||||||||||||
Year ended 12/31/19 | 9.37 | 0.38 | 0.97 | 1.35 | (0.35 | ) | (0.06 | ) | (0.41 | ) | 10.31 | 14.35 | 103 | 0.14 | 23.23 | 3.79 | 68 | |||||||||||||||||||||||||||||||||||||||||||||||||||||
Period ended 12/31/18(f) | 10.00 | 0.33 | (0.67 | ) | (0.34 | ) | (0.29 | ) | – | (0.29 | ) | 9.37 | (3.41 | ) | 94 | 0.13 | (g) | 44.65 | (g) | 3.36 | (g) | 5 | ||||||||||||||||||||||||||||||||||||||||||||||||
Class R6 | ||||||||||||||||||||||||||||||||||||||||||||||||||||||||||||||||||||||
Year ended 12/31/22 | 10.72 | 0.33 | (1.43 | ) | (1.10 | ) | (0.51 | ) | (0.03 | ) | (0.54 | ) | 9.08 | (10.28 | ) | 272 | 0.07 | 11.35 | 3.38 | 24 | ||||||||||||||||||||||||||||||||||||||||||||||||||
Year ended 12/31/21 | 10.39 | 0.30 | 0.60 | 0.90 | (0.33 | ) | (0.24 | ) | (0.57 | ) | 10.72 | 8.68 | 322 | 0.07 | 10.52 | 2.72 | 69 | |||||||||||||||||||||||||||||||||||||||||||||||||||||
Year ended 12/31/20 | 10.31 | 0.33 | 0.06 | 0.39 | (0.31 | ) | (0.00 | ) | (0.31 | ) | 10.39 | 3.84 | 312 | 0.11 | 18.09 | 3.38 | 75 | |||||||||||||||||||||||||||||||||||||||||||||||||||||
Year ended 12/31/19 | 9.37 | 0.38 | 0.97 | 1.35 | (0.35 | ) | (0.06 | ) | (0.41 | ) | 10.31 | 14.35 | 309 | 0.14 | 23.23 | 3.79 | 68 | |||||||||||||||||||||||||||||||||||||||||||||||||||||
Period ended 12/31/18(f) | 10.00 | 0.33 | (0.67 | ) | (0.34 | ) | (0.29 | ) | – | (0.29 | ) | 9.37 | (3.41 | ) | 281 | 0.13 | (g) | 44.65 | (g) | 3.36 | (g) | 5 | ||||||||||||||||||||||||||||||||||||||||||||||||
| (a) | Calculated using average shares outstanding. |
| (b) | Net investment income is affected by the timing of the declaration of dividends by the underlying funds in which the Fund invests. Ratio of net investment income does not include net investment income of the underlying funds in which the Fund invests. |
| (c) | Includes adjustments in accordance with accounting principles generally accepted in the United States of America and as such, the net asset value for financial reporting purposes and the returns based upon those net asset values may differ from the net asset value and returns for shareholder transactions. Does not include sales charges and is not annualized for periods less than one year, if applicable. |
| (d) | In addition to the fees and expenses which the Fund bears directly; the Fund indirectly bears a pro rata share of the fees and expenses of the underlying funds in which the Fund invests. Because the underlying funds have varied expenses and fee levels and the Fund may own different proportions at different times, the amount of fees and expenses incurred indirectly by the Fund will vary. Estimated underlying fund expenses are not expenses that are incurred directly by the Fund. They are expenses that are incurred directly by the underlying funds and are deducted from the value of the funds the Fund invests in. The effect of the estimated underlying fund expenses that the Fund bears indirectly is included in the Fund’s total return. Estimated acquired fund fees from underlying funds were 0.42%, 0.43%, 0.47%, 0.46% and 0.41% for the years ended December 31,2022, 2021, 2020, 2019 and 2018, respectively. |
| (e) | Portfolio turnover is calculated at the fund level and is not annualized for periods less than one year, if applicable. |
| (f) | Commencement date of January 3, 2018. |
| (g) | Annualized. |
See accompanying Notes to Financial Statements which are an integral part of the financial statements.
| 89 | Invesco Peak Retirement™ Funds |
Financial Highlights–(continued)
Invesco Peak Retirement™ 2020 Fund
| Net asset value, beginning of period | Net investment income(a)(b) | Net gains on securities | Total from investment operations | Dividends from net investment income | Distributions from net realized gains | Return of capital | Total distributions | Net asset value, end of period | Total return (c) | Net assets, end of period (000’s omitted) | Ratio of to average net assets | Ratio of expenses to average net assets without fee waivers and/or expenses absorbed | Ratio of net to average | Portfolio turnover (e) | |||||||||||||||||||||||||||||||||||||||||||||||||||||||||||||
Class A | |||||||||||||||||||||||||||||||||||||||||||||||||||||||||||||||||||||||||||
Year ended 12/31/22 | $ | 11.48 | $ | 0.28 | $ | (1.73 | ) | $ | (1.45 | ) | $ | (0.41 | ) | $ | (0.18 | ) | $ | (0.01 | ) | $ | (0.60 | ) | $ | 9.43 | (12.65 | )% | $ | 3,925 | 0.31 | % | 1.99 | % | 2.64 | % | 27 | % | |||||||||||||||||||||||||||||||||||||||
Year ended 12/31/21 | 10.86 | 0.22 | 0.70 | 0.92 | (0.24 | ) | (0.06 | ) | – | (0.30 | ) | 11.48 | 8.55 | 8,513 | 0.32 | 1.88 | 1.96 | 51 | |||||||||||||||||||||||||||||||||||||||||||||||||||||||||
Year ended 12/31/20 | 10.35 | 0.25 | 0.48 | 0.73 | (0.20 | ) | (0.02 | ) | – | (0.22 | ) | 10.86 | 7.12 | 3,105 | 0.38 | 6.05 | 2.46 | 78 | |||||||||||||||||||||||||||||||||||||||||||||||||||||||||
Year ended 12/31/19 | 9.39 | 0.36 | 0.92 | 1.28 | (0.23 | ) | (0.09 | ) | – | (0.32 | ) | 10.35 | 13.59 | 757 | 0.40 | 12.58 | 3.44 | 49 | |||||||||||||||||||||||||||||||||||||||||||||||||||||||||
Period ended 12/31/18(f) | 10.00 | 0.27 | (0.62 | ) | (0.35 | ) | (0.25 | ) | (0.01 | ) | – | (0.26 | ) | 9.39 | (3.52 | ) | 227 | 0.40 | (g) | 40.02 | (g) | 2.74 | (g) | 5 | |||||||||||||||||||||||||||||||||||||||||||||||||||
Class C | |||||||||||||||||||||||||||||||||||||||||||||||||||||||||||||||||||||||||||
Year ended 12/31/22 | 11.41 | 0.20 | (1.71 | ) | (1.51 | ) | (0.25 | ) | (0.18 | ) | (0.01 | ) | (0.44 | ) | 9.46 | (13.32 | ) | 476 | 1.06 | 2.74 | 1.89 | 27 | |||||||||||||||||||||||||||||||||||||||||||||||||||||
Year ended 12/31/21 | 10.79 | 0.14 | 0.70 | 0.84 | (0.16 | ) | (0.06 | ) | – | (0.22 | ) | 11.41 | 7.79 | 1,698 | 1.07 | 2.63 | 1.21 | 51 | |||||||||||||||||||||||||||||||||||||||||||||||||||||||||
Year ended 12/31/20 | 10.30 | 0.17 | 0.49 | 0.66 | (0.15 | ) | (0.02 | ) | – | (0.17 | ) | 10.79 | 6.47 | 919 | 1.13 | 6.80 | 1.71 | 78 | |||||||||||||||||||||||||||||||||||||||||||||||||||||||||
Year ended 12/31/19 | 9.38 | 0.27 | 0.92 | 1.19 | (0.18 | ) | (0.09 | ) | – | (0.27 | ) | 10.30 | 12.74 | 302 | 1.15 | 13.33 | 2.69 | 49 | |||||||||||||||||||||||||||||||||||||||||||||||||||||||||
Period ended 12/31/18(f) | 10.00 | 0.19 | (0.62 | ) | (0.43 | ) | (0.18 | ) | (0.01 | ) | – | (0.19 | ) | 9.38 | (4.27 | ) | 115 | 1.15 | (g) | 40.77 | (g) | 1.99 | (g) | 5 | |||||||||||||||||||||||||||||||||||||||||||||||||||
Class R | |||||||||||||||||||||||||||||||||||||||||||||||||||||||||||||||||||||||||||
Year ended 12/31/22 | 11.44 | 0.25 | (1.71 | ) | (1.46 | ) | (0.37 | ) | (0.18 | ) | (0.01 | ) | (0.56 | ) | 9.42 | (12.83 | ) | 1,084 | 0.56 | 2.24 | 2.39 | 27 | |||||||||||||||||||||||||||||||||||||||||||||||||||||
Year ended 12/31/21 | 10.83 | 0.19 | 0.70 | 0.89 | (0.22 | ) | (0.06 | ) | – | (0.28 | ) | 11.44 | 8.21 | 2,158 | 0.57 | 2.13 | 1.71 | 51 | |||||||||||||||||||||||||||||||||||||||||||||||||||||||||
Year ended 12/31/20 | 10.33 | 0.22 | 0.49 | 0.71 | (0.19 | ) | (0.02 | ) | – | (0.21 | ) | 10.83 | 6.88 | 1,063 | 0.63 | 6.30 | 2.21 | 78 | |||||||||||||||||||||||||||||||||||||||||||||||||||||||||
Year ended 12/31/19 | 9.39 | 0.33 | 0.92 | 1.25 | (0.22 | ) | (0.09 | ) | – | (0.31 | ) | 10.33 | 13.29 | 421 | 0.65 | 12.83 | 3.19 | 49 | |||||||||||||||||||||||||||||||||||||||||||||||||||||||||
Period ended 12/31/18(f) | 10.00 | 0.25 | (0.62 | ) | (0.37 | ) | (0.23 | ) | (0.01 | ) | – | (0.24 | ) | 9.39 | (3.75 | ) | 9 | 0.65 | (g) | 40.27 | (g) | 2.49 | (g) | 5 | |||||||||||||||||||||||||||||||||||||||||||||||||||
Class Y | |||||||||||||||||||||||||||||||||||||||||||||||||||||||||||||||||||||||||||
Year ended 12/31/22 | 11.55 | 0.30 | (1.74 | ) | (1.44 | ) | (0.45 | ) | (0.18 | ) | (0.01 | ) | (0.64 | ) | 9.47 | (12.50 | ) | 93 | 0.06 | 1.74 | 2.89 | 27 | |||||||||||||||||||||||||||||||||||||||||||||||||||||
Year ended 12/31/21 | 10.92 | 0.25 | 0.71 | 0.96 | (0.27 | ) | (0.06 | ) | – | (0.33 | ) | 11.55 | 8.82 | 117 | 0.07 | 1.63 | 2.21 | 51 | |||||||||||||||||||||||||||||||||||||||||||||||||||||||||
Year ended 12/31/20 | 10.38 | 0.28 | 0.50 | 0.78 | (0.22 | ) | (0.02 | ) | – | (0.24 | ) | 10.92 | 7.52 | 92 | 0.13 | 5.80 | 2.71 | 78 | |||||||||||||||||||||||||||||||||||||||||||||||||||||||||
Year ended 12/31/19 | 9.41 | 0.38 | 0.92 | 1.30 | (0.24 | ) | (0.09 | ) | – | (0.33 | ) | 10.38 | 13.79 | 42 | 0.15 | 12.33 | 3.69 | 49 | |||||||||||||||||||||||||||||||||||||||||||||||||||||||||
Period ended 12/31/18(f) | 10.00 | 0.30 | (0.61 | ) | (0.31 | ) | (0.27 | ) | (0.01 | ) | – | (0.28 | ) | 9.41 | (3.18 | ) | 38 | 0.15 | (g) | 39.77 | (g) | 2.99 | (g) | 5 | |||||||||||||||||||||||||||||||||||||||||||||||||||
Class R5 | |||||||||||||||||||||||||||||||||||||||||||||||||||||||||||||||||||||||||||
Year ended 12/31/22 | 11.55 | 0.30 | (1.73 | ) | (1.43 | ) | (0.45 | ) | (0.18 | ) | (0.01 | ) | (0.64 | ) | 9.48 | (12.41 | ) | 95 | 0.06 | 1.69 | 2.89 | 27 | |||||||||||||||||||||||||||||||||||||||||||||||||||||
Year ended 12/31/21 | 10.92 | 0.25 | 0.71 | 0.96 | (0.27 | ) | (0.06 | ) | – | (0.33 | ) | 11.55 | 8.82 | 116 | 0.07 | 1.55 | 2.21 | 51 | |||||||||||||||||||||||||||||||||||||||||||||||||||||||||
Year ended 12/31/20 | 10.38 | 0.28 | 0.50 | 0.78 | (0.22 | ) | (0.02 | ) | – | (0.24 | ) | 10.92 | 7.52 | 109 | 0.13 | 5.68 | 2.71 | 78 | |||||||||||||||||||||||||||||||||||||||||||||||||||||||||
Year ended 12/31/19 | 9.41 | 0.38 | 0.92 | 1.30 | (0.24 | ) | (0.09 | ) | – | (0.33 | ) | 10.38 | 13.79 | 104 | 0.15 | 12.21 | 3.69 | 49 | |||||||||||||||||||||||||||||||||||||||||||||||||||||||||
Period ended 12/31/18(f) | 10.00 | 0.30 | (0.61 | ) | (0.31 | ) | (0.27 | ) | (0.01 | ) | – | (0.28 | ) | 9.41 | (3.18 | ) | 94 | 0.15 | (g) | 39.51 | (g) | 2.99 | (g) | 5 | |||||||||||||||||||||||||||||||||||||||||||||||||||
Class R6 | |||||||||||||||||||||||||||||||||||||||||||||||||||||||||||||||||||||||||||
Year ended 12/31/22 | 11.55 | 0.30 | (1.73 | ) | (1.43 | ) | (0.45 | ) | (0.18 | ) | (0.01 | ) | (0.64 | ) | 9.48 | (12.41 | ) | 12 | 0.06 | 1.69 | 2.89 | 27 | |||||||||||||||||||||||||||||||||||||||||||||||||||||
Year ended 12/31/21 | 10.92 | 0.25 | 0.71 | 0.96 | (0.27 | ) | (0.06 | ) | – | (0.33 | ) | 11.55 | 8.82 | 15 | 0.07 | 1.55 | 2.21 | 51 | |||||||||||||||||||||||||||||||||||||||||||||||||||||||||
Year ended 12/31/20 | 10.38 | 0.28 | 0.50 | 0.78 | (0.22 | ) | (0.02 | ) | – | (0.24 | ) | 10.92 | 7.52 | 328 | 0.13 | 5.68 | 2.71 | 78 | |||||||||||||||||||||||||||||||||||||||||||||||||||||||||
Year ended 12/31/19 | 9.41 | 0.38 | 0.92 | 1.30 | (0.24 | ) | (0.09 | ) | – | (0.33 | ) | 10.38 | 13.79 | 311 | 0.15 | 12.21 | 3.69 | 49 | |||||||||||||||||||||||||||||||||||||||||||||||||||||||||
Period ended 12/31/18(f) | 10.00 | 0.30 | (0.61 | ) | (0.31 | ) | (0.27 | ) | (0.01 | ) | – | (0.28 | ) | 9.41 | (3.18 | ) | 282 | 0.15 | (g) | 39.51 | (g) | 2.99 | (g) | 5 | |||||||||||||||||||||||||||||||||||||||||||||||||||
| (a) | Calculated using average shares outstanding. |
| (b) | Net investment income is affected by the timing of the declaration of dividends by the underlying funds in which the Fund invests. Ratio of net investment income does not include net investment income of the underlying funds in which the Fund invests. |
| (c) | Includes adjustments in accordance with accounting principles generally accepted in the United States of America and as such, the net asset value for financial reporting purposes and the returns based upon those net asset values may differ from the net asset value and returns for shareholder transactions. Does not include sales charges and is not annualized for periods less than one year, if applicable. |
| (d) | In addition to the fees and expenses which the Fund bears directly; the Fund indirectly bears a pro rata share of the fees and expenses of the underlying funds in which the Fund invests. Because the underlying funds have varied expenses and fee levels and the Fund may own different proportions at different times, the amount of fees and expenses incurred indirectly by the Fund will vary. Estimated underlying fund expenses are not expenses that are incurred directly by the Fund. They are expenses that are incurred directly by the underlying funds and are deducted from the value of the funds the Fund invests in. The effect of the estimated underlying fund expenses that the Fund bears indirectly is included in the Fund’s total return. Estimated acquired fund fees from underlying funds were 0.42%, 0.44%, 0.46%, 0.44% and 0.41% for the years ended December 31, 2022, 2021, 2020, 2019 and 2018, respectively |
| (e) | Portfolio turnover is calculated at the fund level and is not annualized for periods less than one year, if applicable. |
| (f) | Commencement date of January 3, 2018. |
| (g) | Annualized. |
See accompanying Notes to Financial Statements which are an integral part of the financial statements.
| 90 | Invesco Peak Retirement™ Funds |
Financial Highlights–(continued)
Invesco Peak Retirement™ 2025 Fund
| Net asset value, beginning of period | Net investment income(a)(b) | Net gains on securities | Total from investment operations | Dividends from net investment income | Distributions from net realized gains | Total distributions | Net asset value, end of period | Total return (c) | Net assets, end of period (000’s omitted) | Ratio of to average net assets | Ratio of expenses to average net assets without fee waivers and/or expenses absorbed | Ratio of net to average | Portfolio turnover (e) | |||||||||||||||||||||||||||||||||||||||||||||||||||||||||
Class A | ||||||||||||||||||||||||||||||||||||||||||||||||||||||||||||||||||||||
Year ended 12/31/22 | $ | 11.93 | $ | 0.22 | $ | (2.02 | ) | $ | (1.80 | ) | $ | (0.33 | ) | $ | (0.29 | ) | $ | (0.62 | ) | $ | 9.51 | (15.13 | )% | $ | 5,998 | 0.31 | % | 1.12 | % | 2.09 | % | 27 | % | |||||||||||||||||||||||||||||||||||||
Year ended 12/31/21 | 11.24 | 0.21 | 0.86 | 1.07 | (0.25 | ) | (0.13 | ) | (0.38 | ) | 11.93 | 9.53 | 18,814 | 0.31 | 1.20 | 1.79 | 46 | |||||||||||||||||||||||||||||||||||||||||||||||||||||
Year ended 12/31/20 | 10.46 | 0.25 | 0.79 | 1.04 | (0.23 | ) | (0.03 | ) | (0.26 | ) | 11.24 | 9.91 | 9,224 | 0.37 | 2.27 | 2.34 | 81 | |||||||||||||||||||||||||||||||||||||||||||||||||||||
Year ended 12/31/19 | 9.35 | 0.39 | 0.97 | 1.36 | (0.19 | ) | (0.06 | ) | (0.25 | ) | 10.46 | 14.53 | 3,358 | 0.42 | 7.05 | 3.75 | 42 | |||||||||||||||||||||||||||||||||||||||||||||||||||||
Period ended 12/31/18(f) | 10.00 | 0.25 | (0.68 | ) | (0.43 | ) | (0.22 | ) | – | (0.22 | ) | 9.35 | (4.24 | ) | 375 | 0.40 | (g) | 37.07 | (g) | 2.55 | (g) | 10 | ||||||||||||||||||||||||||||||||||||||||||||||||
Class C | ||||||||||||||||||||||||||||||||||||||||||||||||||||||||||||||||||||||
Year ended 12/31/22 | 11.78 | 0.14 | (1.99 | ) | (1.85 | ) | (0.21 | ) | (0.29 | ) | (0.50 | ) | 9.43 | (15.80 | ) | 1,359 | 1.06 | 1.87 | 1.34 | 27 | ||||||||||||||||||||||||||||||||||||||||||||||||||
Year ended 12/31/21 | �� | 11.11 | 0.12 | 0.84 | 0.96 | (0.16 | ) | (0.13 | ) | (0.29 | ) | 11.78 | 8.72 | 2,836 | 1.06 | 1.95 | 1.04 | 46 | ||||||||||||||||||||||||||||||||||||||||||||||||||||
Year ended 12/31/20 | 10.37 | 0.16 | 0.79 | 0.95 | (0.18 | ) | (0.03 | ) | (0.21 | ) | 11.11 | 9.16 | 2,068 | 1.12 | 3.02 | 1.59 | 81 | |||||||||||||||||||||||||||||||||||||||||||||||||||||
Year ended 12/31/19 | 9.33 | 0.31 | 0.95 | 1.26 | (0.16 | ) | (0.06 | ) | (0.22 | ) | 10.37 | 13.56 | 680 | 1.17 | 7.80 | 3.00 | 42 | |||||||||||||||||||||||||||||||||||||||||||||||||||||
Period ended 12/31/18(f) | 10.00 | 0.18 | (0.67 | ) | (0.49 | ) | (0.18 | ) | – | (0.18 | ) | 9.33 | (4.92 | ) | 91 | 1.15 | (g) | 37.82 | (g) | 1.80 | (g) | 10 | ||||||||||||||||||||||||||||||||||||||||||||||||
Class R | ||||||||||||||||||||||||||||||||||||||||||||||||||||||||||||||||||||||
Year ended 12/31/22 | 11.89 | 0.19 | (2.01 | ) | (1.82 | ) | (0.29 | ) | (0.29 | ) | (0.58 | ) | 9.49 | (15.37 | ) | 1,386 | 0.56 | 1.37 | 1.84 | 27 | ||||||||||||||||||||||||||||||||||||||||||||||||||
Year ended 12/31/21 | 11.21 | 0.18 | 0.85 | 1.03 | (0.22 | ) | (0.13 | ) | (0.35 | ) | 11.89 | 9.24 | 2,776 | 0.56 | 1.45 | 1.54 | 46 | |||||||||||||||||||||||||||||||||||||||||||||||||||||
Year ended 12/31/20 | 10.44 | 0.22 | 0.79 | 1.01 | (0.21 | ) | (0.03 | ) | (0.24 | ) | 11.21 | 9.67 | 1,405 | 0.62 | 2.52 | 2.09 | 81 | |||||||||||||||||||||||||||||||||||||||||||||||||||||
Year ended 12/31/19 | 9.35 | 0.36 | 0.97 | 1.33 | (0.18 | ) | (0.06 | ) | (0.24 | ) | 10.44 | 14.24 | 582 | 0.67 | 7.30 | 3.50 | 42 | |||||||||||||||||||||||||||||||||||||||||||||||||||||
Period ended 12/31/18(f) | 10.00 | 0.23 | (0.67 | ) | (0.44 | ) | (0.21 | ) | – | (0.21 | ) | 9.35 | (4.41 | ) | 9 | 0.65 | (g) | 37.32 | (g) | 2.30 | (g) | 10 | ||||||||||||||||||||||||||||||||||||||||||||||||
Class Y | ||||||||||||||||||||||||||||||||||||||||||||||||||||||||||||||||||||||
Year ended 12/31/22 | 11.99 | 0.25 | (2.03 | ) | (1.78 | ) | (0.39 | ) | (0.29 | ) | (0.68 | ) | 9.53 | (14.94 | ) | 200 | 0.06 | 0.87 | 2.34 | 27 | ||||||||||||||||||||||||||||||||||||||||||||||||||
Year ended 12/31/21 | 11.29 | 0.24 | 0.86 | 1.10 | (0.27 | ) | (0.13 | ) | (0.40 | ) | 11.99 | 9.80 | 184 | 0.06 | 0.95 | 2.04 | 46 | |||||||||||||||||||||||||||||||||||||||||||||||||||||
Year ended 12/31/20 | 10.49 | 0.27 | 0.80 | 1.07 | (0.24 | ) | (0.03 | ) | (0.27 | ) | 11.29 | 10.22 | 116 | 0.12 | 2.02 | 2.59 | 81 | |||||||||||||||||||||||||||||||||||||||||||||||||||||
Year ended 12/31/19 | 9.37 | 0.42 | 0.96 | 1.38 | (0.20 | ) | (0.06 | ) | (0.26 | ) | 10.49 | 14.70 | 58 | 0.17 | 6.80 | 4.00 | 42 | |||||||||||||||||||||||||||||||||||||||||||||||||||||
Period ended 12/31/18(f) | 10.00 | 0.28 | (0.67 | ) | (0.39 | ) | (0.24 | ) | – | (0.24 | ) | 9.37 | (3.91 | ) | 37 | 0.15 | (g) | 36.82 | (g) | 2.80 | (g) | 10 | ||||||||||||||||||||||||||||||||||||||||||||||||
Class R5 | ||||||||||||||||||||||||||||||||||||||||||||||||||||||||||||||||||||||
Year ended 12/31/22 | 11.97 | 0.25 | (2.02 | ) | (1.77 | ) | (0.39 | ) | (0.29 | ) | (0.68 | ) | 9.52 | (14.88 | ) | 9 | 0.06 | 0.81 | 2.34 | 27 | ||||||||||||||||||||||||||||||||||||||||||||||||||
Year ended 12/31/21 | 11.28 | 0.24 | 0.85 | 1.09 | (0.27 | ) | (0.13 | ) | (0.40 | ) | 11.97 | 9.72 | 12 | 0.06 | 0.88 | 2.04 | 46 | |||||||||||||||||||||||||||||||||||||||||||||||||||||
Year ended 12/31/20 | 10.49 | 0.27 | 0.79 | 1.06 | (0.24 | ) | (0.03 | ) | (0.27 | ) | 11.28 | 10.13 | 22 | 0.12 | 1.89 | 2.59 | 81 | |||||||||||||||||||||||||||||||||||||||||||||||||||||
Year ended 12/31/19 | 9.37 | 0.42 | 0.96 | 1.38 | (0.20 | ) | (0.06 | ) | (0.26 | ) | 10.49 | 14.70 | 105 | 0.17 | 6.66 | 4.00 | 42 | |||||||||||||||||||||||||||||||||||||||||||||||||||||
Period ended 12/31/18(f) | 10.00 | 0.28 | (0.67 | ) | (0.39 | ) | (0.24 | ) | – | (0.24 | ) | 9.37 | (3.91 | ) | 94 | 0.15 | (g) | 36.55 | (g) | 2.80 | (g) | 10 | ||||||||||||||||||||||||||||||||||||||||||||||||
Class R6 | ||||||||||||||||||||||||||||||||||||||||||||||||||||||||||||||||||||||
Year ended 12/31/22 | 11.98 | 0.25 | (2.02 | ) | (1.77 | ) | (0.39 | ) | (0.29 | ) | (0.68 | ) | 9.53 | (14.87 | ) | 9 | 0.06 | 0.81 | 2.34 | 27 | ||||||||||||||||||||||||||||||||||||||||||||||||||
Year ended 12/31/21 | 11.29 | 0.24 | 0.85 | 1.09 | (0.27 | ) | (0.13 | ) | (0.40 | ) | 11.98 | 9.71 | 11 | 0.06 | 0.88 | 2.04 | 46 | |||||||||||||||||||||||||||||||||||||||||||||||||||||
Year ended 12/31/20 | 10.49 | 0.27 | 0.80 | 1.07 | (0.24 | ) | (0.03 | ) | (0.27 | ) | 11.29 | 10.22 | 238 | 0.12 | 1.89 | 2.59 | 81 | |||||||||||||||||||||||||||||||||||||||||||||||||||||
Year ended 12/31/19 | 9.37 | 0.42 | 0.96 | 1.38 | (0.20 | ) | (0.06 | ) | (0.26 | ) | 10.49 | 14.70 | 315 | 0.17 | 6.66 | 4.00 | 42 | |||||||||||||||||||||||||||||||||||||||||||||||||||||
Period ended 12/31/18(f) | 10.00 | 0.28 | (0.67 | ) | (0.39 | ) | (0.24 | ) | – | (0.24 | ) | 9.37 | (3.91 | ) | 281 | 0.15 | (g) | 36.55 | (g) | 2.80 | (g) | 10 | ||||||||||||||||||||||||||||||||||||||||||||||||
| (a) | Calculated using average shares outstanding. |
| (b) | Net investment income is affected by the timing of the declaration of dividends by the underlying funds in which the Fund invests. Ratio of net investment income does not include net investment income of the underlying funds in which the Fund invests. |
| (c) | Includes adjustments in accordance with accounting principles generally accepted in the United States of America and as such, the net asset value for financial reporting purposes and the returns based upon those net asset values may differ from the net asset value and returns for shareholder transactions. Does not include sales charges and is not annualized for periods less than one year, if applicable. |
| (d) | In addition to the fees and expenses which the Fund bears directly; the Fund indirectly bears a pro rata share of the fees and expenses of the underlying funds in which the Fund invests. Because the underlying funds have varied expenses and fee levels and the Fund may own different proportions at different times, the amount of fees and expenses incurred indirectly by the Fund will vary. Estimated underlying fund expenses are not expenses that are incurred directly by the Fund. They are expenses that are incurred directly by the underlying funds and are deducted from the value of the funds the Fund invests in. The effect of the estimated underlying fund expenses that the Fund bears indirectly is included in the Fund’s total return. Estimated acquired fund fees from underlying funds were 0.42%, 0.45%, 0.46%, 0.45% and 0.39% for the years ended December 31, 2022, 2021, 2020, 2019 and 2018, respectively. |
| (e) | Portfolio turnover is calculated at the fund level and is not annualized for periods less than one year, if applicable. |
| (f) | Commencement date of January 3, 2018. |
| (g) | Annualized. |
See accompanying Notes to Financial Statements which are an integral part of the financial statements.
| 91 | Invesco Peak Retirement™ Funds |
Financial Highlights–(continued)
Invesco Peak Retirement™ 2030 Fund
| Net asset value, beginning of period | Net investment income(a)(b) | Net gains on securities | Total from investment operations | Dividends from net investment income | Distributions from net realized gains | Total distributions | Net asset value, end of period | Total return (c) | Net assets, end of period (000’s omitted) | Ratio of to average net assets | Ratio of expenses to average net assets without fee waivers and/or expenses absorbed | Ratio of net to average | Portfolio turnover (e) | |||||||||||||||||||||||||||||||||||||||||||||||||||||||||
Class A | ||||||||||||||||||||||||||||||||||||||||||||||||||||||||||||||||||||||
Year ended 12/31/22 | $ | 12.26 | $ | 0.20 | $ | (2.19 | ) | $ | (1.99 | ) | $ | (0.24 | ) | $ | (0.23 | ) | $ | (0.47 | ) | $ | 9.80 | (16.33 | )% | $ | 14,487 | 0.30 | % | 0.87 | % | 1.88 | % | 28 | % | |||||||||||||||||||||||||||||||||||||
Year ended 12/31/21 | 11.37 | 0.18 | 1.05 | 1.23 | (0.23 | ) | (0.11 | ) | (0.34 | ) | 12.26 | 10.82 | 26,085 | 0.30 | 0.88 | 1.52 | 40 | |||||||||||||||||||||||||||||||||||||||||||||||||||||
Year ended 12/31/20 | 10.51 | 0.21 | 0.85 | 1.06 | (0.18 | ) | (0.02 | ) | (0.20 | ) | 11.37 | 10.11 | 14,133 | 0.37 | 2.11 | 2.03 | 55 | |||||||||||||||||||||||||||||||||||||||||||||||||||||
Year ended 12/31/19 | 9.25 | 0.35 | 1.18 | 1.53 | (0.21 | ) | (0.06 | ) | (0.27 | ) | 10.51 | 16.55 | 2,357 | 0.42 | 7.35 | 3.37 | 37 | |||||||||||||||||||||||||||||||||||||||||||||||||||||
Period ended 12/31/18(f) | 10.00 | 0.23 | (0.78 | ) | (0.55 | ) | (0.20 | ) | – | (0.20 | ) | 9.25 | (5.47 | ) | 375 | 0.40 | (g) | 41.47 | (g) | 2.40 | (g) | 5 | ||||||||||||||||||||||||||||||||||||||||||||||||
Class C | ||||||||||||||||||||||||||||||||||||||||||||||||||||||||||||||||||||||
Year ended 12/31/22 | 12.12 | 0.12 | (2.16 | ) | (2.04 | ) | (0.12 | ) | (0.23 | ) | (0.35 | ) | 9.73 | (16.91 | ) | 3,143 | 1.05 | 1.62 | 1.13 | 28 | ||||||||||||||||||||||||||||||||||||||||||||||||||
Year ended 12/31/21 | 11.27 | 0.09 | 1.02 | 1.11 | (0.15 | ) | (0.11 | ) | (0.26 | ) | 12.12 | 9.85 | 5,601 | 1.05 | 1.63 | 0.77 | 40 | |||||||||||||||||||||||||||||||||||||||||||||||||||||
Year ended 12/31/20 | 10.44 | 0.13 | 0.86 | 0.99 | (0.14 | ) | (0.02 | ) | (0.16 | ) | 11.27 | 9.46 | 2,041 | 1.12 | 2.86 | 1.28 | 55 | |||||||||||||||||||||||||||||||||||||||||||||||||||||
Year ended 12/31/19 | 9.24 | 0.27 | 1.17 | 1.44 | (0.18 | ) | (0.06 | ) | (0.24 | ) | 10.44 | 15.62 | 571 | 1.17 | 8.10 | 2.62 | 37 | |||||||||||||||||||||||||||||||||||||||||||||||||||||
Period ended 12/31/18(f) | 10.00 | 0.16 | (0.79 | ) | (0.63 | ) | (0.13 | ) | – | (0.13 | ) | 9.24 | (6.24 | ) | 11 | 1.15 | (g) | 42.22 | (g) | 1.65 | (g) | 5 | ||||||||||||||||||||||||||||||||||||||||||||||||
Class R | ||||||||||||||||||||||||||||||||||||||||||||||||||||||||||||||||||||||
Year ended 12/31/22 | 12.21 | 0.17 | (2.19 | ) | (2.02 | ) | (0.19 | ) | (0.23 | ) | (0.42 | ) | 9.77 | (16.57 | ) | 4,094 | 0.55 | 1.12 | 1.63 | 28 | ||||||||||||||||||||||||||||||||||||||||||||||||||
Year ended 12/31/21 | 11.33 | 0.15 | 1.04 | 1.19 | (0.20 | ) | (0.11 | ) | (0.31 | ) | 12.21 | 10.54 | 8,167 | 0.55 | 1.13 | 1.27 | 40 | |||||||||||||||||||||||||||||||||||||||||||||||||||||
Year ended 12/31/20 | 10.48 | 0.18 | 0.86 | 1.04 | (0.17 | ) | (0.02 | ) | (0.19 | ) | 11.33 | 9.90 | 2,549 | 0.62 | 2.36 | 1.78 | 55 | |||||||||||||||||||||||||||||||||||||||||||||||||||||
Year ended 12/31/19 | 9.25 | 0.32 | 1.17 | 1.49 | (0.20 | ) | (0.06 | ) | (0.26 | ) | 10.48 | 16.14 | 651 | 0.67 | 7.60 | 3.12 | 37 | |||||||||||||||||||||||||||||||||||||||||||||||||||||
Period ended 12/31/18(f) | 10.00 | 0.21 | (0.78 | ) | (0.57 | ) | (0.18 | ) | – | (0.18 | ) | 9.25 | (5.71 | ) | 34 | 0.65 | (g) | 41.72 | (g) | 2.15 | (g) | 5 | ||||||||||||||||||||||||||||||||||||||||||||||||
Class Y | ||||||||||||||||||||||||||||||||||||||||||||||||||||||||||||||||||||||
Year ended 12/31/22 | 12.32 | 0.23 | (2.20 | ) | (1.97 | ) | (0.28 | ) | (0.23 | ) | (0.51 | ) | 9.84 | (16.09 | ) | 135 | 0.05 | 0.62 | 2.13 | 28 | ||||||||||||||||||||||||||||||||||||||||||||||||||
Year ended 12/31/21 | 11.43 | 0.22 | 1.03 | 1.25 | (0.25 | ) | (0.11 | ) | (0.36 | ) | 12.32 | 11.00 | 335 | 0.05 | 0.63 | 1.77 | 40 | |||||||||||||||||||||||||||||||||||||||||||||||||||||
Year ended 12/31/20 | 10.54 | 0.24 | 0.86 | 1.10 | (0.19 | ) | (0.02 | ) | (0.21 | ) | 11.43 | 10.49 | 164 | 0.12 | 1.86 | 2.28 | 55 | |||||||||||||||||||||||||||||||||||||||||||||||||||||
Year ended 12/31/19 | 9.26 | 0.37 | 1.19 | 1.56 | (0.22 | ) | (0.06 | ) | (0.28 | ) | 10.54 | 16.87 | 162 | 0.17 | 7.10 | 3.62 | 37 | |||||||||||||||||||||||||||||||||||||||||||||||||||||
Period ended 12/31/18(f) | 10.00 | 0.26 | (0.79 | ) | (0.53 | ) | (0.21 | ) | – | (0.21 | ) | 9.26 | (5.28 | ) | 37 | 0.15 | (g) | 41.22 | (g) | 2.65 | (g) | 5 | ||||||||||||||||||||||||||||||||||||||||||||||||
Class R5 | ||||||||||||||||||||||||||||||||||||||||||||||||||||||||||||||||||||||
Year ended 12/31/22 | 12.32 | 0.23 | (2.20 | ) | (1.97 | ) | (0.28 | ) | (0.23 | ) | (0.51 | ) | 9.84 | (16.08 | ) | 10 | 0.05 | 0.53 | 2.13 | 28 | ||||||||||||||||||||||||||||||||||||||||||||||||||
Year ended 12/31/21 | 11.43 | 0.21 | 1.04 | 1.25 | (0.25 | ) | (0.11 | ) | (0.36 | ) | 12.32 | 11.00 | 12 | 0.05 | 0.53 | 1.77 | 40 | |||||||||||||||||||||||||||||||||||||||||||||||||||||
Year ended 12/31/20 | 10.54 | 0.24 | 0.86 | 1.10 | (0.19 | ) | (0.02 | ) | (0.21 | ) | 11.43 | 10.49 | 24 | 0.12 | 1.71 | 2.28 | 55 | |||||||||||||||||||||||||||||||||||||||||||||||||||||
Year ended 12/31/19 | 9.26 | 0.37 | 1.19 | 1.56 | (0.22 | ) | (0.06 | ) | (0.28 | ) | 10.54 | 16.87 | 105 | 0.17 | 6.84 | 3.62 | 37 | |||||||||||||||||||||||||||||||||||||||||||||||||||||
Period ended 12/31/18(f) | 10.00 | 0.26 | (0.79 | ) | (0.53 | ) | (0.21 | ) | – | (0.21 | ) | 9.26 | (5.28 | ) | 93 | 0.15 | (g) | 40.89 | (g) | 2.65 | (g) | 5 | ||||||||||||||||||||||||||||||||||||||||||||||||
Class R6 | ||||||||||||||||||||||||||||||||||||||||||||||||||||||||||||||||||||||
Year ended 12/31/22 | 12.32 | 0.23 | (2.20 | ) | (1.97 | ) | (0.28 | ) | (0.23 | ) | (0.51 | ) | 9.84 | (16.09 | ) | 9 | 0.05 | 0.53 | 2.13 | 28 | ||||||||||||||||||||||||||||||||||||||||||||||||||
Year ended 12/31/21 | 11.43 | 0.21 | 1.04 | 1.25 | (0.25 | ) | (0.11 | ) | (0.36 | ) | 12.32 | 11.00 | 11 | 0.05 | 0.53 | 1.77 | 40 | |||||||||||||||||||||||||||||||||||||||||||||||||||||
Year ended 12/31/20 | 10.54 | 0.24 | 0.86 | 1.10 | (0.19 | ) | (0.02 | ) | (0.21 | ) | 11.43 | 10.49 | 242 | 0.12 | 1.71 | 2.28 | 55 | |||||||||||||||||||||||||||||||||||||||||||||||||||||
Year ended 12/31/19 | 9.26 | 0.37 | 1.19 | 1.56 | (0.22 | ) | (0.06 | ) | (0.28 | ) | 10.54 | 16.87 | 316 | 0.17 | 6.84 | 3.62 | 37 | |||||||||||||||||||||||||||||||||||||||||||||||||||||
Period ended 12/31/18(f) | 10.00 | 0.26 | (0.79 | ) | (0.53 | ) | (0.21 | ) | – | (0.21 | ) | 9.26 | (5.28 | ) | 278 | 0.15 | (g) | 40.89 | (g) | 2.65 | (g) | 5 | ||||||||||||||||||||||||||||||||||||||||||||||||
| (a) | Calculated using average shares outstanding. |
| (b) | Net investment income is affected by the timing of the declaration of dividends by the underlying funds in which the Fund invests. Ratio of net investment income does not include net investment income of the underlying funds in which the Fund invests. |
| (c) | Includes adjustments in accordance with accounting principles generally accepted in the United States of America and as such, the net asset value for financial reporting purposes and the returns based upon those net asset values may differ from the net asset value and returns for shareholder transactions. Does not include sales charges and is not annualized for periods less than one year, if applicable. |
| (d) | In addition to the fees and expenses which the Fund bears directly; the Fund indirectly bears a pro rata share of the fees and expenses of the underlying funds in which the Fund invests. Because the underlying funds have varied expenses and fee levels and the Fund may own different proportions at different times, the amount of fees and expenses incurred indirectly by the Fund will vary. Estimated underlying fund expenses are not expenses that are incurred directly by the Fund. They are expenses that are incurred directly by the underlying funds and are deducted from the value of the funds the Fund invests in. The effect of the estimated underlying fund expenses that the Fund bears indirectly is included in the Fund’s total return. Estimated acquired fund fees from underlying funds were 0.42%, 0.46%, 0.45%, 0.45% and 0.39% for the years ended December 31, 2022, 2021, 2020, 2019 and 2018, respectively. |
| (e) | Portfolio turnover is calculated at the fund level and is not annualized for periods less than one year, if applicable. |
| (f) | Commencement date of January 3, 2018. |
| (g) | Annualized. |
See accompanying Notes to Financial Statements which are an integral part of the financial statements.
| 92 | Invesco Peak Retirement™ Funds |
Financial Highlights–(continued)
Invesco Peak Retirement™ 2035 Fund
| Net asset value, beginning of period | Net investment income | Net gains (losses) on securities (both realized and unrealized) (a)(b) | Total from investment operations | Dividends from net investment income | Distributions from net realized gains | Total distributions | Net asset value, end of period | Total return (c) | Net assets, end of period (000’s omitted) | Ratio of to average net assets | Ratio of expenses to average net assets without fee waivers and/or expenses absorbed | Ratio of net to average | Portfolio turnover (e) | |||||||||||||||||||||||||||||||||||||||||||||||||||||||||
Class A | ||||||||||||||||||||||||||||||||||||||||||||||||||||||||||||||||||||||
Year ended 12/31/22 | $ | 12.71 | $ | 0.18 | $ | (2.38 | ) | $ | (2.20 | ) | $ | (0.19 | ) | $ | (0.24 | ) | $ | (0.43 | ) | $ | 10.08 | (17.39 | )% | $ | 7,631 | 0.31 | % | 1.19 | % | 1.67 | % | 46 | % | |||||||||||||||||||||||||||||||||||||
Year ended 12/31/21 | 11.54 | 0.17 | 1.27 | 1.44 | (0.22 | ) | (0.05 | ) | (0.27 | ) | 12.71 | 12.53 | 11,726 | 0.30 | 1.45 | 1.40 | 26 | |||||||||||||||||||||||||||||||||||||||||||||||||||||
Year ended 12/31/20 | 10.53 | 0.17 | 1.06 | 1.23 | (0.18 | ) | (0.04 | ) | (0.22 | ) | 11.54 | 11.72 | 4,187 | 0.39 | 3.04 | 1.63 | 78 | |||||||||||||||||||||||||||||||||||||||||||||||||||||
Year ended 12/31/19 | 9.12 | 0.33 | 1.33 | 1.66 | (0.18 | ) | (0.07 | ) | (0.25 | ) | 10.53 | 18.28 | 1,264 | 0.43 | 9.46 | 3.24 | 34 | |||||||||||||||||||||||||||||||||||||||||||||||||||||
Period ended 12/31/18(f) | 10.00 | 0.21 | (0.87 | ) | (0.66 | ) | (0.21 | ) | (0.01 | ) | (0.22 | ) | 9.12 | (6.66 | ) | 127 | 0.41 | (g) | 47.00 | (g) | 2.09 | (g) | 6 | |||||||||||||||||||||||||||||||||||||||||||||||
Class C | ||||||||||||||||||||||||||||||||||||||||||||||||||||||||||||||||||||||
Year ended 12/31/22 | 12.57 | 0.10 | (2.36 | ) | (2.26 | ) | (0.09 | ) | (0.24 | ) | (0.33 | ) | 9.98 | (18.02 | ) | 2,763 | 1.06 | 1.94 | 0.92 | 46 | ||||||||||||||||||||||||||||||||||||||||||||||||||
Year ended 12/31/21 | 11.43 | 0.08 | 1.25 | 1.33 | (0.14 | ) | (0.05 | ) | (0.19 | ) | 12.57 | 11.71 | 3,849 | 1.05 | 2.20 | 0.65 | 26 | |||||||||||||||||||||||||||||||||||||||||||||||||||||
Year ended 12/31/20 | 10.46 | 0.09 | 1.04 | 1.13 | (0.12 | ) | (0.04 | ) | (0.16 | ) | 11.43 | 10.85 | 2,287 | 1.14 | 3.79 | 0.88 | 78 | |||||||||||||||||||||||||||||||||||||||||||||||||||||
Year ended 12/31/19 | 9.11 | 0.25 | 1.33 | 1.58 | (0.16 | ) | (0.07 | ) | (0.23 | ) | 10.46 | 17.32 | 588 | 1.18 | 10.21 | 2.49 | 34 | |||||||||||||||||||||||||||||||||||||||||||||||||||||
Period ended 12/31/18(f) | 10.00 | 0.13 | (0.86 | ) | (0.73 | ) | (0.15 | ) | (0.01 | ) | (0.16 | ) | 9.11 | (7.35 | ) | 84 | 1.16 | (g) | 47.75 | (g) | 1.34 | (g) | 6 | |||||||||||||||||||||||||||||||||||||||||||||||
Class R | ||||||||||||||||||||||||||||||||||||||||||||||||||||||||||||||||||||||
Year ended 12/31/22 | 12.65 | 0.16 | (2.37 | ) | (2.21 | ) | (0.16 | ) | (0.24 | ) | (0.40 | ) | 10.04 | (17.57 | ) | 3,983 | 0.56 | 1.44 | 1.42 | 46 | ||||||||||||||||||||||||||||||||||||||||||||||||||
Year ended 12/31/21 | 11.50 | 0.14 | 1.26 | 1.40 | (0.20 | ) | (0.05 | ) | (0.25 | ) | 12.65 | 12.19 | 4,916 | 0.55 | 1.70 | 1.15 | 26 | |||||||||||||||||||||||||||||||||||||||||||||||||||||
Year ended 12/31/20 | 10.50 | 0.14 | 1.06 | 1.20 | (0.16 | ) | (0.04 | ) | (0.20 | ) | 11.50 | 11.46 | 1,897 | 0.64 | 3.29 | 1.38 | 78 | |||||||||||||||||||||||||||||||||||||||||||||||||||||
Year ended 12/31/19 | 9.11 | 0.31 | 1.33 | 1.64 | (0.18 | ) | (0.07 | ) | (0.25 | ) | 10.50 | 17.98 | 824 | 0.68 | 9.71 | 2.99 | 34 | |||||||||||||||||||||||||||||||||||||||||||||||||||||
Period ended 12/31/18(f) | 10.00 | 0.18 | (0.86 | ) | (0.68 | ) | (0.20 | ) | (0.01 | ) | (0.21 | ) | 9.11 | (6.86 | ) | 65 | 0.66 | (g) | 47.25 | (g) | 1.84 | (g) | 6 | |||||||||||||||||||||||||||||||||||||||||||||||
Class Y | ||||||||||||||||||||||||||||||||||||||||||||||||||||||||||||||||||||||
Year ended 12/31/22 | 12.77 | 0.21 | (2.40 | ) | (2.19 | ) | (0.22 | ) | (0.24 | ) | (0.46 | ) | 10.12 | (17.19 | ) | 695 | 0.06 | 0.94 | 1.92 | 46 | ||||||||||||||||||||||||||||||||||||||||||||||||||
Year ended 12/31/21 | 11.59 | 0.21 | 1.26 | 1.47 | (0.24 | ) | (0.05 | ) | (0.29 | ) | 12.77 | 12.77 | 1,019 | 0.05 | 1.20 | 1.65 | 26 | |||||||||||||||||||||||||||||||||||||||||||||||||||||
Year ended 12/31/20 | 10.56 | 0.20 | 1.07 | 1.27 | (0.20 | ) | (0.04 | ) | (0.24 | ) | 11.59 | 12.05 | 752 | 0.14 | 2.79 | 1.88 | 78 | |||||||||||||||||||||||||||||||||||||||||||||||||||||
Year ended 12/31/19 | 9.14 | 0.36 | 1.32 | 1.68 | (0.19 | ) | (0.07 | ) | (0.26 | ) | 10.56 | 18.45 | 341 | 0.18 | 9.21 | 3.49 | 34 | |||||||||||||||||||||||||||||||||||||||||||||||||||||
Period ended 12/31/18(f) | 10.00 | 0.23 | (0.86 | ) | (0.63 | ) | (0.22 | ) | (0.01 | ) | (0.23 | ) | 9.14 | (6.33 | ) | 37 | 0.16 | (g) | 46.75 | (g) | 2.34 | (g) | 6 | |||||||||||||||||||||||||||||||||||||||||||||||
Class R5 | ||||||||||||||||||||||||||||||||||||||||||||||||||||||||||||||||||||||
Year ended 12/31/22 | 12.76 | 0.21 | (2.39 | ) | (2.18 | ) | (0.22 | ) | (0.24 | ) | (0.46 | ) | 10.12 | (17.13 | ) | 10 | 0.05 | 0.83 | 1.93 | 46 | ||||||||||||||||||||||||||||||||||||||||||||||||||
Year ended 12/31/21 | 11.59 | 0.20 | 1.26 | 1.46 | (0.24 | ) | (0.05 | ) | (0.29 | ) | 12.76 | 12.68 | 12 | 0.05 | 1.06 | 1.65 | 26 | |||||||||||||||||||||||||||||||||||||||||||||||||||||
Year ended 12/31/20 | 10.56 | 0.20 | 1.07 | 1.27 | (0.20 | ) | (0.04 | ) | (0.24 | ) | 11.59 | 12.05 | 25 | 0.14 | 2.56 | 1.88 | 78 | |||||||||||||||||||||||||||||||||||||||||||||||||||||
Year ended 12/31/19 | 9.14 | 0.35 | 1.33 | 1.68 | (0.19 | ) | (0.07 | ) | (0.26 | ) | 10.56 | 18.45 | 106 | 0.18 | 8.98 | 3.49 | 34 | |||||||||||||||||||||||||||||||||||||||||||||||||||||
Period ended 12/31/18(f) | 10.00 | 0.23 | (0.86 | ) | (0.63 | ) | (0.22 | ) | (0.01 | ) | (0.23 | ) | 9.14 | (6.33 | ) | 91 | 0.16 | (g) | 46.29 | (g) | 2.34 | (g) | 6 | |||||||||||||||||||||||||||||||||||||||||||||||
Class R6 | ||||||||||||||||||||||||||||||||||||||||||||||||||||||||||||||||||||||
Year ended 12/31/22 | 12.77 | 0.21 | (2.40 | ) | (2.19 | ) | (0.22 | ) | (0.24 | ) | (0.46 | ) | 10.12 | (17.19 | ) | 9 | 0.05 | 0.83 | 1.93 | 46 | ||||||||||||||||||||||||||||||||||||||||||||||||||
Year ended 12/31/21 | 11.59 | 0.20 | 1.27 | 1.47 | (0.24 | ) | (0.05 | ) | (0.29 | ) | 12.77 | 12.77 | 11 | 0.05 | 1.06 | 1.65 | 26 | |||||||||||||||||||||||||||||||||||||||||||||||||||||
Year ended 12/31/20 | 10.56 | 0.20 | 1.07 | 1.27 | (0.20 | ) | (0.04 | ) | (0.24 | ) | 11.59 | 12.05 | 247 | 0.14 | 2.56 | 1.88 | 78 | |||||||||||||||||||||||||||||||||||||||||||||||||||||
Year ended 12/31/19 | 9.13 | 0.35 | 1.34 | 1.69 | (0.19 | ) | (0.07 | ) | (0.26 | ) | 10.56 | 18.58 | 317 | 0.18 | 8.98 | 3.49 | 34 | |||||||||||||||||||||||||||||||||||||||||||||||||||||
Period ended 12/31/18(f) | 10.00 | 0.23 | (0.87 | ) | (0.64 | ) | (0.22 | ) | (0.01 | ) | (0.23 | ) | 9.13 | (6.44 | ) | 274 | 0.16 | (g) | 46.29 | (g) | 2.34 | (g) | 6 | |||||||||||||||||||||||||||||||||||||||||||||||
| (a) | Calculated using average shares outstanding. |
| (b) | Net investment income is affected by the timing of the declaration of dividends by the underlying funds in which the Fund invests. Ratio of net investment income does not include net investment income of the underlying funds in which the Fund invests. |
| (c) | Includes adjustments in accordance with accounting principles generally accepted in the United States of America and as such, the net asset value for financial reporting purposes and the returns based upon those net asset values may differ from the net asset value and returns for shareholder transactions. Does not include sales charges and is not annualized for periods less than one year, if applicable. |
| (d) | In addition to the fees and expenses which the Fund bears directly; the Fund indirectly bears a pro rata share of the fees and expenses of the underlying funds in which the Fund invests. Because the underlying funds have varied expenses and fee levels and the Fund may own different proportions at different times, the amount of fees and expenses incurred indirectly by the Fund will vary. Estimated underlying fund expenses are not expenses that are incurred directly by the Fund. They are expenses that are incurred directly by the underlying funds and are deducted from the value of the funds the Fund invests in. The effect of the estimated underlying fund expenses that the Fund bears indirectly is included in the Fund’s total return. Estimated acquired fund fees from underlying funds were 0.42%, 0.46%, 0.44%, 0.44% and 0.38% for the years ended December 31, 2022, 2021, 2020, 2019 and 2018, respectively. |
| (e) | Portfolio turnover is calculated at the fund level and is not annualized for periods less than one year, if applicable. |
| (f) | Commencement date of January 3, 2018. |
| (g) | Annualized. |
See accompanying Notes to Financial Statements which are an integral part of the financial statements.
| 93 | Invesco Peak Retirement™ Funds |
Financial Highlights–(continued)
Invesco Peak Retirement™ 2040 Fund
| Net asset value, beginning of period | Net investment income(a)(b) | Net gains on securities | Total from investment operations | Dividends from net investment income | Distributions from net realized gains | Total distributions | Net asset value, end of period | Total return (c) | Net assets, end of period (000’s omitted) | Ratio of to average net assets | Ratio of expenses to average net assets without fee waivers and/or expenses absorbed | Ratio of net to average | Portfolio turnover (e) | |||||||||||||||||||||||||||||||||||||||||||||||||||||||||
Class A | ||||||||||||||||||||||||||||||||||||||||||||||||||||||||||||||||||||||
Year ended 12/31/22 | $ | 12.88 | $ | 0.16 | $ | (2.52 | ) | $ | (2.36 | ) | $ | (0.18 | ) | $ | (0.27 | ) | $ | (0.45 | ) | $ | 10.07 | (18.36 | )% | $ | 10,692 | 0.32 | % | 1.15 | % | 1.45 | % | 40 | % | |||||||||||||||||||||||||||||||||||||
Year ended 12/31/21 | 11.58 | 0.13 | 1.51 | 1.64 | (0.19 | ) | (0.15 | ) | (0.34 | ) | 12.88 | 14.21 | 15,050 | 0.32 | 1.31 | 1.04 | 29 | |||||||||||||||||||||||||||||||||||||||||||||||||||||
Year ended 12/31/20 | 10.50 | 0.16 | 1.09 | 1.25 | (0.12 | ) | (0.05 | ) | (0.17 | ) | 11.58 | 11.87 | 4,222 | 0.40 | 3.74 | 1.51 | 80 | |||||||||||||||||||||||||||||||||||||||||||||||||||||
Year ended 12/31/19 | 9.03 | 0.29 | 1.48 | 1.77 | (0.19 | ) | (0.11 | ) | (0.30 | ) | 10.50 | 19.61 | 1,538 | 0.44 | 11.33 | 2.83 | 51 | |||||||||||||||||||||||||||||||||||||||||||||||||||||
Period ended 12/31/18(f) | 10.00 | 0.20 | (0.97 | ) | (0.77 | ) | (0.19 | ) | (0.01 | ) | (0.20 | ) | 9.03 | (7.72 | ) | 278 | 0.40 | (g) | 47.00 | (g) | 2.06 | (g) | 5 | |||||||||||||||||||||||||||||||||||||||||||||||
Class C | ||||||||||||||||||||||||||||||||||||||||||||||||||||||||||||||||||||||
Year ended 12/31/22 | 12.74 | 0.08 | (2.49 | ) | (2.41 | ) | (0.07 | ) | (0.27 | ) | (0.34 | ) | 9.99 | (18.91 | ) | 2,171 | 1.07 | 1.90 | 0.70 | 40 | ||||||||||||||||||||||||||||||||||||||||||||||||||
Year ended 12/31/21 | 11.48 | 0.04 | 1.48 | 1.52 | (0.11 | ) | (0.15 | ) | (0.26 | ) | 12.74 | 13.28 | 3,117 | 1.07 | 2.06 | 0.29 | 29 | |||||||||||||||||||||||||||||||||||||||||||||||||||||
Year ended 12/31/20 | 10.45 | 0.08 | 1.08 | 1.16 | (0.08 | ) | (0.05 | ) | (0.13 | ) | 11.48 | 11.06 | 1,189 | 1.15 | 4.49 | 0.76 | 80 | |||||||||||||||||||||||||||||||||||||||||||||||||||||
Year ended 12/31/19 | 9.03 | 0.21 | 1.48 | 1.69 | (0.16 | ) | (0.11 | ) | (0.27 | ) | 10.45 | 18.73 | 179 | 1.19 | 12.08 | 2.08 | 51 | |||||||||||||||||||||||||||||||||||||||||||||||||||||
Period ended 12/31/18(f) | 10.00 | 0.13 | (0.98 | ) | (0.85 | ) | (0.11 | ) | (0.01 | ) | (0.12 | ) | 9.03 | (8.47 | ) | 9 | 1.15 | (g) | 47.75 | (g) | 1.31 | (g) | 5 | |||||||||||||||||||||||||||||||||||||||||||||||
Class R | ||||||||||||||||||||||||||||||||||||||||||||||||||||||||||||||||||||||
Year ended 12/31/22 | 12.80 | 0.13 | (2.50 | ) | (2.37 | ) | (0.14 | ) | (0.27 | ) | (0.41 | ) | 10.02 | (18.56 | ) | 3,077 | 0.57 | 1.40 | 1.20 | 40 | ||||||||||||||||||||||||||||||||||||||||||||||||||
Year ended 12/31/21 | 11.52 | 0.10 | 1.49 | 1.59 | (0.16 | ) | (0.15 | ) | (0.31 | ) | 12.80 | 13.88 | 6,583 | 0.57 | 1.56 | 0.79 | 29 | |||||||||||||||||||||||||||||||||||||||||||||||||||||
Year ended 12/31/20 | 10.48 | 0.13 | 1.07 | 1.20 | (0.11 | ) | (0.05 | ) | (0.16 | ) | 11.52 | 11.40 | 2,521 | 0.65 | 3.99 | 1.26 | 80 | |||||||||||||||||||||||||||||||||||||||||||||||||||||
Year ended 12/31/19 | 9.03 | 0.27 | 1.47 | 1.74 | (0.18 | ) | (0.11 | ) | (0.29 | ) | 10.48 | 19.32 | 301 | 0.69 | 11.58 | 2.58 | 51 | |||||||||||||||||||||||||||||||||||||||||||||||||||||
Period ended 12/31/18(f) | 10.00 | 0.18 | (0.98 | ) | (0.80 | ) | (0.16 | ) | (0.01 | ) | (0.17 | ) | 9.03 | (7.97 | ) | 9 | 0.65 | (g) | 47.25 | (g) | 1.81 | (g) | 5 | |||||||||||||||||||||||||||||||||||||||||||||||
Class Y | ||||||||||||||||||||||||||||||||||||||||||||||||||||||||||||||||||||||
Year ended 12/31/22 | 12.94 | 0.19 | (2.53 | ) | (2.34 | ) | (0.22 | ) | (0.27 | ) | (0.49 | ) | 10.11 | (18.16 | ) | 713 | 0.07 | 0.90 | 1.70 | 40 | ||||||||||||||||||||||||||||||||||||||||||||||||||
Year ended 12/31/21 | 11.63 | 0.16 | 1.51 | 1.67 | (0.21 | ) | (0.15 | ) | (0.36 | ) | 12.94 | 14.46 | 761 | 0.07 | 1.06 | 1.29 | 29 | |||||||||||||||||||||||||||||||||||||||||||||||||||||
Year ended 12/31/20 | 10.54 | 0.19 | 1.08 | 1.27 | (0.13 | ) | (0.05 | ) | (0.18 | ) | 11.63 | 12.06 | 547 | 0.15 | 3.49 | 1.76 | 80 | |||||||||||||||||||||||||||||||||||||||||||||||||||||
Year ended 12/31/19 | 9.05 | 0.31 | 1.49 | 1.80 | (0.20 | ) | (0.11 | ) | (0.31 | ) | 10.54 | 19.90 | 95 | 0.19 | 11.08 | 3.08 | 51 | |||||||||||||||||||||||||||||||||||||||||||||||||||||
Period ended 12/31/18(f) | 10.00 | 0.23 | (0.97 | ) | (0.74 | ) | (0.20 | ) | (0.01 | ) | (0.21 | ) | 9.05 | (7.42 | ) | 36 | 0.15 | (g) | 46.75 | (g) | 2.31 | (g) | 5 | |||||||||||||||||||||||||||||||||||||||||||||||
Class R5 | ||||||||||||||||||||||||||||||||||||||||||||||||||||||||||||||||||||||
Year ended 12/31/22 | 12.93 | 0.19 | (2.52 | ) | (2.33 | ) | (0.22 | ) | (0.27 | ) | (0.49 | ) | 10.11 | (18.10 | ) | 9 | 0.07 | 0.76 | 1.70 | 40 | ||||||||||||||||||||||||||||||||||||||||||||||||||
Year ended 12/31/21 | 11.63 | 0.15 | 1.51 | 1.66 | (0.21 | ) | (0.15 | ) | (0.36 | ) | 12.93 | 14.37 | 12 | 0.07 | 0.89 | 1.29 | 29 | |||||||||||||||||||||||||||||||||||||||||||||||||||||
Year ended 12/31/20 | 10.54 | 0.18 | 1.09 | 1.27 | (0.13 | ) | (0.05 | ) | (0.18 | ) | 11.63 | 12.06 | 25 | 0.15 | 3.16 | 1.76 | 80 | |||||||||||||||||||||||||||||||||||||||||||||||||||||
Year ended 12/31/19 | 9.05 | 0.31 | 1.49 | 1.80 | (0.20 | ) | (0.11 | ) | (0.31 | ) | 10.54 | 19.90 | 105 | 0.19 | 10.81 | 3.08 | 51 | |||||||||||||||||||||||||||||||||||||||||||||||||||||
Period ended 12/31/18(f) | 10.00 | 0.23 | (0.97 | ) | (0.74 | ) | (0.20 | ) | (0.01 | ) | (0.21 | ) | 9.05 | (7.42 | ) | 90 | 0.15 | (g) | 46.29 | (g) | 2.31 | (g) | 5 | |||||||||||||||||||||||||||||||||||||||||||||||
Class R6 | ||||||||||||||||||||||||||||||||||||||||||||||||||||||||||||||||||||||
Year ended 12/31/22 | 12.94 | 0.19 | (2.53 | ) | (2.34 | ) | (0.22 | ) | (0.27 | ) | (0.49 | ) | 10.11 | (18.16 | ) | 9 | 0.07 | 0.76 | 1.70 | 40 | ||||||||||||||||||||||||||||||||||||||||||||||||||
Year ended 12/31/21 | 11.63 | 0.16 | 1.51 | 1.67 | (0.21 | ) | (0.15 | ) | (0.36 | ) | 12.94 | 14.46 | 11 | 0.07 | 0.89 | 1.29 | 29 | |||||||||||||||||||||||||||||||||||||||||||||||||||||
Year ended 12/31/20 | 10.54 | 0.18 | 1.09 | 1.27 | (0.13 | ) | (0.05 | ) | (0.18 | ) | 11.63 | 12.06 | 248 | 0.15 | 3.16 | 1.76 | 80 | |||||||||||||||||||||||||||||||||||||||||||||||||||||
Year ended 12/31/19 | 9.05 | 0.31 | 1.49 | 1.80 | (0.20 | ) | (0.11 | ) | (0.31 | ) | 10.54 | 19.90 | 316 | 0.19 | 10.81 | 3.08 | 51 | |||||||||||||||||||||||||||||||||||||||||||||||||||||
Period ended 12/31/18(f) | 10.00 | 0.23 | (0.97 | ) | (0.74 | ) | (0.20 | ) | (0.01 | ) | (0.21 | ) | 9.05 | (7.42 | ) | 271 | 0.15 | (g) | 46.29 | (g) | 2.31 | (g) | 5 | |||||||||||||||||||||||||||||||||||||||||||||||
| (a) | Calculated using average shares outstanding. |
| (b) | Net investment income is affected by the timing of the declaration of dividends by the underlying funds in which the Fund invests. Ratio of net investment income does not include net investment income of the underlying funds in which the Fund invests. |
| (c) | Includes adjustments in accordance with accounting principles generally accepted in the United States of America and as such, the net asset value for financial reporting purposes and the returns based upon those net asset values may differ from the net asset value and returns for shareholder transactions. Does not include sales charges and is not annualized for periods less than one year, if applicable. |
| (d) | In addition to the fees and expenses which the Fund bears directly; the Fund indirectly bears a pro rata share of the fees and expenses of the underlying funds in which the Fund invests. Because the underlying funds have varied expenses and fee levels and the Fund may own different proportions at different times, the amount of fees and expenses incurred indirectly by the Fund will vary. Estimated underlying fund expenses are not expenses that are incurred directly by the Fund. They are expenses that are incurred directly by the underlying funds and are deducted from the value of the funds the Fund invests in. The effect of the estimated underlying fund expenses that the Fund bears indirectly is included in the Fund’s total return. |
Estimated Fund’s total return estimated acquired fund fees from underlying funds were 0.40%, 0.44%, 0.43%, 0.43% and 0.36% for the years ended December 31, 2022, 2021, 2020, 2019 and 2018, respectively. |
| (e) | Portfolio turnover is calculated at the fund level and is not annualized for periods less than one year, if applicable. |
| (f) | Commencement date of January 3, 2018. |
| (g) | Annualized. |
See accompanying Notes to Financial Statements which are an integral part of the financial statements.
| 94 | Invesco Peak Retirement™ Funds |
Financial Highlights–(continued)
Invesco Peak Retirement™ 2045 Fund
| Net asset value, beginning of period | Net investment income(a)(b) | Net gains on securities | Total from investment operations | Dividends from net investment income | Distributions from net realized gains | Total distributions | Net asset value, end of period | Total return (c) | Net assets, end of period (000’s omitted) | Ratio of to average net assets | Ratio of expenses to average net assets without fee waivers and/or expenses absorbed | Ratio of net to average | Portfolio turnover (e) | |||||||||||||||||||||||||||||||||||||||||||||||||||||||||
Class A | ||||||||||||||||||||||||||||||||||||||||||||||||||||||||||||||||||||||
Year ended 12/31/22 | $ | 12.64 | $ | 0.14 | $ | (2.52 | ) | $ | (2.38 | ) | $ | (0.15 | ) | $ | (0.34 | ) | $ | (0.49 | ) | $ | 9.77 | (18.85 | )% | $ | 4,185 | 0.33 | % | 2.07 | % | 1.35 | % | 54 | % | |||||||||||||||||||||||||||||||||||||
Year ended 12/31/21 | 11.64 | 0.11 | 1.69 | 1.80 | (0.20 | ) | (0.60 | ) | (0.80 | ) | 12.64 | 15.64 | 5,397 | 0.34 | 2.45 | 0.89 | 51 | |||||||||||||||||||||||||||||||||||||||||||||||||||||
Year ended 12/31/20 | 10.65 | 0.13 | 1.02 | 1.15 | (0.10 | ) | (0.06 | ) | (0.16 | ) | 11.64 | 10.80 | 3,544 | 0.41 | 4.59 | 1.28 | 86 | |||||||||||||||||||||||||||||||||||||||||||||||||||||
Year ended 12/31/19 | 9.00 | 0.27 | 1.69 | 1.96 | (0.18 | ) | (0.13 | ) | (0.31 | ) | 10.65 | 21.81 | 915 | 0.45 | 12.89 | 2.66 | 45 | |||||||||||||||||||||||||||||||||||||||||||||||||||||
Period ended 12/31/18(f) | 10.00 | 0.18 | (0.97 | ) | (0.79 | ) | (0.19 | ) | (0.02 | ) | (0.21 | ) | 9.00 | (7.90 | ) | 142 | 0.41 | (g) | 44.98 | (g) | 1.84 | (g) | 3 | |||||||||||||||||||||||||||||||||||||||||||||||
Class C | ||||||||||||||||||||||||||||||||||||||||||||||||||||||||||||||||||||||
Year ended 12/31/22 | 12.45 | 0.06 | (2.48 | ) | (2.42 | ) | (0.05 | ) | (0.34 | ) | (0.39 | ) | 9.64 | (19.46 | ) | 1,204 | 1.08 | 2.82 | 0.60 | 54 | ||||||||||||||||||||||||||||||||||||||||||||||||||
Year ended 12/31/21 | 11.49 | 0.02 | 1.66 | 1.68 | (0.12 | ) | (0.60 | ) | (0.72 | ) | 12.45 | 14.77 | 2,033 | 1.09 | 3.20 | 0.14 | 51 | |||||||||||||||||||||||||||||||||||||||||||||||||||||
Year ended 12/31/20 | 10.53 | 0.05 | 1.01 | 1.06 | (0.04 | ) | (0.06 | ) | (0.10 | ) | 11.49 | 10.06 | 1,062 | 1.16 | 5.34 | 0.53 | 86 | |||||||||||||||||||||||||||||||||||||||||||||||||||||
Year ended 12/31/19 | 8.94 | 0.20 | 1.67 | 1.87 | (0.15 | ) | (0.13 | ) | (0.28 | ) | 10.53 | 20.95 | 599 | 1.20 | 13.64 | 1.91 | 45 | |||||||||||||||||||||||||||||||||||||||||||||||||||||
Period ended 12/31/18(f) | 10.00 | 0.11 | (0.99 | ) | (0.88 | ) | (0.16 | ) | (0.02 | ) | (0.18 | ) | 8.94 | (8.73 | ) | 70 | 1.16 | (g) | 45.73 | (g) | 1.09 | (g) | 3 | |||||||||||||||||||||||||||||||||||||||||||||||
Class R | ||||||||||||||||||||||||||||||||||||||||||||||||||||||||||||||||||||||
Year ended 12/31/22 | 12.57 | 0.12 | (2.51 | ) | (2.39 | ) | (0.12 | ) | (0.34 | ) | (0.46 | ) | 9.72 | (19.06 | ) | 2,363 | 0.58 | 2.32 | 1.10 | 54 | ||||||||||||||||||||||||||||||||||||||||||||||||||
Year ended 12/31/21 | 11.59 | 0.08 | 1.67 | 1.75 | (0.17 | ) | (0.60 | ) | (0.77 | ) | 12.57 | 15.29 | 2,632 | 0.59 | 2.70 | 0.64 | 51 | |||||||||||||||||||||||||||||||||||||||||||||||||||||
Year ended 12/31/20 | 10.61 | 0.11 | 1.01 | 1.12 | (0.08 | ) | (0.06 | ) | (0.14 | ) | 11.59 | 10.57 | 1,451 | 0.66 | 4.84 | 1.03 | 86 | |||||||||||||||||||||||||||||||||||||||||||||||||||||
Year ended 12/31/19 | 8.99 | 0.25 | 1.67 | 1.92 | (0.17 | ) | (0.13 | ) | (0.30 | ) | 10.61 | 21.39 | 340 | 0.70 | 13.14 | 2.41 | 45 | |||||||||||||||||||||||||||||||||||||||||||||||||||||
Period ended 12/31/18(f) | 10.00 | 0.16 | (0.97 | ) | (0.81 | ) | (0.18 | ) | (0.02 | ) | (0.20 | ) | 8.99 | (8.09 | ) | 37 | 0.66 | (g) | 45.23 | (g) | 1.59 | (g) | 3 | |||||||||||||||||||||||||||||||||||||||||||||||
Class Y | ||||||||||||||||||||||||||||||||||||||||||||||||||||||||||||||||||||||
Year ended 12/31/22 | 12.69 | 0.18 | (2.54 | ) | (2.36 | ) | (0.19 | ) | (0.34 | ) | (0.53 | ) | 9.80 | (18.67 | ) | 53 | 0.08 | 1.82 | 1.60 | 54 | ||||||||||||||||||||||||||||||||||||||||||||||||||
Year ended 12/31/21 | 11.68 | 0.15 | 1.69 | 1.84 | (0.23 | ) | (0.60 | ) | (0.83 | ) | 12.69 | 15.91 | 199 | 0.09 | 2.20 | 1.14 | 51 | |||||||||||||||||||||||||||||||||||||||||||||||||||||
Year ended 12/31/20 | 10.67 | 0.16 | 1.02 | 1.18 | (0.11 | ) | (0.06 | ) | (0.17 | ) | 11.68 | 11.12 | 100 | 0.16 | 4.34 | 1.53 | 86 | |||||||||||||||||||||||||||||||||||||||||||||||||||||
Year ended 12/31/19 | 9.01 | 0.30 | 1.68 | 1.98 | (0.19 | ) | (0.13 | ) | (0.32 | ) | 10.67 | 22.00 | 54 | 0.20 | 12.64 | 2.91 | 45 | |||||||||||||||||||||||||||||||||||||||||||||||||||||
Period ended 12/31/18(f) | 10.00 | 0.21 | (0.98 | ) | (0.77 | ) | (0.20 | ) | (0.02 | ) | (0.22 | ) | 9.01 | (7.65 | ) | 36 | 0.16 | (g) | 44.73 | (g) | 2.09 | (g) | 3 | |||||||||||||||||||||||||||||||||||||||||||||||
Class R5 | ||||||||||||||||||||||||||||||||||||||||||||||||||||||||||||||||||||||
Year ended 12/31/22 | 12.70 | 0.17 | (2.53 | ) | (2.36 | ) | (0.19 | ) | (0.34 | ) | (0.53 | ) | 9.81 | (18.65 | ) | 22 | 0.08 | 1.62 | 1.60 | 54 | ||||||||||||||||||||||||||||||||||||||||||||||||||
Year ended 12/31/21 | 11.69 | 0.15 | 1.69 | 1.84 | (0.23 | ) | (0.60 | ) | (0.83 | ) | 12.70 | 15.90 | 28 | 0.09 | 1.97 | 1.14 | 51 | |||||||||||||||||||||||||||||||||||||||||||||||||||||
Year ended 12/31/20 | 10.67 | 0.16 | 1.03 | 1.19 | (0.11 | ) | (0.06 | ) | (0.17 | ) | 11.69 | 11.21 | 26 | 0.16 | 4.00 | 1.53 | 86 | |||||||||||||||||||||||||||||||||||||||||||||||||||||
Year ended 12/31/19 | 9.01 | 0.30 | 1.68 | 1.98 | (0.19 | ) | (0.13 | ) | (0.32 | ) | 10.67 | 22.00 | 107 | 0.20 | 12.32 | 2.91 | 45 | |||||||||||||||||||||||||||||||||||||||||||||||||||||
Period ended 12/31/18(f) | 10.00 | 0.21 | (0.98 | ) | (0.77 | ) | (0.20 | ) | (0.02 | ) | (0.22 | ) | 9.01 | (7.65 | ) | 90 | 0.16 | (g) | 44.37 | (g) | 2.09 | (g) | 3 | |||||||||||||||||||||||||||||||||||||||||||||||
Class R6 | ||||||||||||||||||||||||||||||||||||||||||||||||||||||||||||||||||||||
Year ended 12/31/22 | 12.69 | 0.17 | (2.53 | ) | (2.36 | ) | (0.19 | ) | (0.34 | ) | (0.53 | ) | 9.80 | (18.67 | ) | 101 | 0.08 | 1.62 | 1.60 | 54 | ||||||||||||||||||||||||||||||||||||||||||||||||||
Year ended 12/31/21 | 11.68 | 0.15 | 1.69 | 1.84 | (0.23 | ) | (0.60 | ) | (0.83 | ) | 12.69 | 15.91 | 131 | 0.09 | 1.97 | 1.14 | 51 | |||||||||||||||||||||||||||||||||||||||||||||||||||||
Year ended 12/31/20 | 10.67 | 0.16 | 1.02 | 1.18 | (0.11 | ) | (0.06 | ) | (0.17 | ) | 11.68 | 11.12 | 249 | 0.16 | 4.00 | 1.53 | 86 | |||||||||||||||||||||||||||||||||||||||||||||||||||||
Year ended 12/31/19 | 9.01 | 0.30 | 1.68 | 1.98 | (0.19 | ) | (0.13 | ) | (0.32 | ) | 10.67 | 22.00 | 320 | 0.20 | 12.32 | 2.91 | 45 | |||||||||||||||||||||||||||||||||||||||||||||||||||||
Period ended 12/31/18(f) | 10.00 | 0.21 | (0.98 | ) | (0.77 | ) | (0.20 | ) | (0.02 | ) | (0.22 | ) | 9.01 | (7.65 | ) | 270 | 0.16 | (g) | 44.37 | (g) | 2.09 | (g) | 3 | |||||||||||||||||||||||||||||||||||||||||||||||
| (a) | Calculated using average shares outstanding. |
| (b) | Net investment income is affected by the timing of the declaration of dividends by the underlying funds in which the Fund invests. Ratio of net investment income does not include net investment income of the underlying funds in which the Fund invests. |
| (c) | Includes adjustments in accordance with accounting principles generally accepted in the United States of America and as such, the net asset value for financial reporting purposes and the returns based upon those net asset values may differ from the net asset value and returns for shareholder transactions. Does not include sales charges and is not annualized for periods less than one year, if applicable. |
| (d) | In addition to the fees and expenses which the Fund bears directly; the Fund indirectly bears a pro rata share of the fees and expenses of the underlying funds in which the Fund invests. Because the underlying funds have varied expenses and fee levels and the Fund may own different proportions at different times, the amount of fees and expenses incurred indirectly by the Fund will vary. Estimated underlying fund expenses are not expenses that are incurred directly by the Fund. They are expenses that are incurred directly by the underlying funds and are deducted from the value of the funds the Fund invests in. The effect of the estimated underlying fund expenses that the Fund bears indirectly is included in the Fund’s total return. |
Estimated acquired fund fees from underlying funds were 0.40%, 0.43%, 0.42%, 0.42% and 0.35% for the years ended December 31, 2022, 2021, 2020, 2019 and 2018, respectively. |
| (e) | Portfolio turnover is calculated at the fund level and is not annualized for periods less than one year, if applicable. |
| (f) | Commencement date of January 3, 2018. |
| (g) | Annualized. |
See accompanying Notes to Financial Statements which are an integral part of the financial statements.
| 95 | Invesco Peak Retirement™ Funds |
Financial Highlights–(continued)
Invesco Peak Retirement™ 2050 Fund
| Net asset value, beginning of period | Net investment income(a)(b) | Net gains on securities | Total from investment operations | Dividends from net investment income | Distributions from net realized gains | Total distributions | Net asset value, end of period | Total return (c) | Net assets, end of period (000’s omitted) | Ratio of to average net assets | Ratio of expenses to average net assets without fee waivers and/or expenses absorbed | Ratio of net to average | Portfolio turnover (e) | |||||||||||||||||||||||||||||||||||||||||||||||||||||||||
Class A | ||||||||||||||||||||||||||||||||||||||||||||||||||||||||||||||||||||||
Year ended 12/31/22 | $ | 13.46 | $ | 0.15 | $ | (2.69 | ) | $ | (2.54 | ) | $ | (0.17 | ) | $ | (0.36 | ) | $ | (0.53 | ) | $ | 10.39 | (18.86 | )% | $ | 7,903 | 0.33 | % | 1.48 | % | 1.29 | % | 40 | % | |||||||||||||||||||||||||||||||||||||
Year ended 12/31/21 | 11.74 | 0.11 | 1.78 | 1.89 | (0.17 | ) | (0.00 | ) | (0.17 | ) | 13.46 | 16.17 | 10,208 | 0.34 | 1.64 | 0.86 | 29 | |||||||||||||||||||||||||||||||||||||||||||||||||||||
Year ended 12/31/20 | 10.71 | 0.12 | 1.08 | 1.20 | (0.10 | ) | (0.07 | ) | (0.17 | ) | 11.74 | 11.19 | 2,855 | 0.41 | 5.23 | 1.22 | 87 | |||||||||||||||||||||||||||||||||||||||||||||||||||||
Year ended 12/31/19 | 9.02 | 0.23 | 1.84 | 2.07 | (0.19 | ) | (0.19 | ) | (0.38 | ) | 10.71 | 22.93 | 913 | 0.44 | 11.49 | 2.22 | 59 | |||||||||||||||||||||||||||||||||||||||||||||||||||||
Period ended 12/31/18(f) | 10.00 | 0.20 | (1.01 | ) | (0.81 | ) | (0.16 | ) | (0.01 | ) | (0.17 | ) | 9.02 | (8.04 | ) | 222 | 0.40 | (g) | 45.97 | (g) | 2.07 | (g) | 10 | |||||||||||||||||||||||||||||||||||||||||||||||
Class C | ||||||||||||||||||||||||||||||||||||||||||||||||||||||||||||||||||||||
Year ended 12/31/22 | 13.27 | 0.06 | (2.65 | ) | (2.59 | ) | (0.06 | ) | (0.36 | ) | (0.42 | ) | 10.26 | (19.50 | ) | 1,905 | 1.08 | 2.23 | 0.54 | 40 | ||||||||||||||||||||||||||||||||||||||||||||||||||
Year ended 12/31/21 | 11.59 | 0.01 | 1.76 | 1.77 | (0.09 | ) | (0.00 | ) | (0.09 | ) | 13.27 | 15.31 | 3,059 | 1.09 | 2.39 | 0.11 | 29 | |||||||||||||||||||||||||||||||||||||||||||||||||||||
Year ended 12/31/20 | 10.62 | 0.05 | 1.05 | 1.10 | (0.06 | ) | (0.07 | ) | (0.13 | ) | 11.59 | 10.31 | 1,141 | 1.16 | 5.98 | 0.47 | 87 | |||||||||||||||||||||||||||||||||||||||||||||||||||||
Year ended 12/31/19 | 8.96 | 0.15 | 1.83 | 1.98 | (0.13 | ) | (0.19 | ) | (0.32 | ) | 10.62 | 22.15 | 277 | 1.19 | 12.24 | 1.47 | 59 | |||||||||||||||||||||||||||||||||||||||||||||||||||||
Period ended 12/31/18(f) | 10.00 | 0.13 | (1.01 | ) | (0.88 | ) | (0.15 | ) | (0.01 | ) | (0.16 | ) | 8.96 | (8.82 | ) | 108 | 1.15 | (g) | 46.72 | (g) | 1.32 | (g) | 10 | |||||||||||||||||||||||||||||||||||||||||||||||
Class R | ||||||||||||||||||||||||||||||||||||||||||||||||||||||||||||||||||||||
Year ended 12/31/22 | 13.35 | 0.12 | (2.65 | ) | (2.53 | ) | (0.14 | ) | (0.36 | ) | (0.50 | ) | 10.32 | (18.97 | ) | 3,580 | 0.58 | 1.73 | 1.04 | 40 | ||||||||||||||||||||||||||||||||||||||||||||||||||
Year ended 12/31/21 | 11.66 | 0.08 | 1.75 | 1.83 | (0.14 | ) | (0.00 | ) | (0.14 | ) | 13.35 | 15.79 | 4,831 | 0.59 | 1.89 | 0.61 | 29 | |||||||||||||||||||||||||||||||||||||||||||||||||||||
Year ended 12/31/20 | 10.66 | 0.10 | 1.05 | 1.15 | (0.08 | ) | (0.07 | ) | (0.15 | ) | 11.66 | 10.81 | 1,244 | 0.66 | 5.48 | 0.97 | 87 | |||||||||||||||||||||||||||||||||||||||||||||||||||||
Year ended 12/31/19 | 9.00 | 0.20 | 1.82 | 2.02 | (0.17 | ) | (0.19 | ) | (0.36 | ) | 10.66 | 22.50 | 433 | 0.69 | 11.74 | 1.97 | 59 | |||||||||||||||||||||||||||||||||||||||||||||||||||||
Period ended 12/31/18(f) | 10.00 | 0.18 | (1.01 | ) | (0.83 | ) | (0.16 | ) | (0.01 | ) | (0.17 | ) | 9.00 | (8.32 | ) | 43 | 0.65 | (g) | 46.22 | (g) | 1.82 | (g) | 10 | |||||||||||||||||||||||||||||||||||||||||||||||
Class Y | ||||||||||||||||||||||||||||||||||||||||||||||||||||||||||||||||||||||
Year ended 12/31/22 | 13.52 | 0.18 | (2.69 | ) | (2.51 | ) | (0.21 | ) | (0.36 | ) | (0.57 | ) | 10.44 | (18.60 | ) | 18 | 0.08 | 1.23 | 1.54 | 40 | ||||||||||||||||||||||||||||||||||||||||||||||||||
Year ended 12/31/21 | 11.79 | 0.14 | 1.79 | 1.93 | (0.20 | ) | (0.00 | ) | (0.20 | ) | 13.52 | 16.42 | 262 | 0.09 | 1.39 | 1.11 | 29 | |||||||||||||||||||||||||||||||||||||||||||||||||||||
Year ended 12/31/20 | 10.74 | 0.15 | 1.09 | 1.24 | (0.12 | ) | (0.07 | ) | (0.19 | ) | 11.79 | 11.49 | 201 | 0.16 | 4.98 | 1.47 | 87 | |||||||||||||||||||||||||||||||||||||||||||||||||||||
Year ended 12/31/19 | 9.03 | 0.25 | 1.85 | 2.10 | (0.20 | ) | (0.19 | ) | (0.39 | ) | 10.74 | 23.28 | 178 | 0.19 | 11.24 | 2.47 | 59 | |||||||||||||||||||||||||||||||||||||||||||||||||||||
Period ended 12/31/18(f) | 10.00 | 0.23 | (1.02 | ) | (0.79 | ) | (0.17 | ) | (0.01 | ) | (0.18 | ) | 9.03 | (7.88 | ) | 47 | 0.15 | (g) | 45.72 | (g) | 2.32 | (g) | 10 | |||||||||||||||||||||||||||||||||||||||||||||||
Class R5 | ||||||||||||||||||||||||||||||||||||||||||||||||||||||||||||||||||||||
Year ended 12/31/22 | 13.52 | 0.18 | (2.70 | ) | (2.52 | ) | (0.21 | ) | (0.36 | ) | (0.57 | ) | 10.43 | (18.67 | ) | 104 | 0.08 | 1.01 | 1.54 | 40 | ||||||||||||||||||||||||||||||||||||||||||||||||||
Year ended 12/31/21 | 11.79 | 0.14 | 1.79 | 1.93 | (0.20 | ) | (0.00 | ) | (0.20 | ) | 13.52 | 16.42 | 135 | 0.09 | 1.12 | �� | 1.11 | 29 | ||||||||||||||||||||||||||||||||||||||||||||||||||||
Year ended 12/31/20 | 10.74 | 0.15 | 1.09 | 1.24 | (0.12 | ) | (0.07 | ) | (0.19 | ) | 11.79 | 11.49 | 118 | 0.16 | 4.45 | 1.47 | 87 | |||||||||||||||||||||||||||||||||||||||||||||||||||||
Year ended 12/31/19 | 9.03 | 0.25 | 1.85 | 2.10 | (0.20 | ) | (0.19 | ) | (0.39 | ) | 10.74 | 23.28 | 107 | 0.19 | 10.83 | 2.47 | 59 | |||||||||||||||||||||||||||||||||||||||||||||||||||||
Period ended 12/31/18(f) | 10.00 | 0.23 | (1.02 | ) | (0.79 | ) | (0.17 | ) | (0.01 | ) | (0.18 | ) | 9.03 | (7.88 | ) | 90 | 0.15 | (g) | 45.18 | (g) | 2.32 | (g) | 10 | |||||||||||||||||||||||||||||||||||||||||||||||
Class R6 | ||||||||||||||||||||||||||||||||||||||||||||||||||||||||||||||||||||||
Year ended 12/31/22 | 13.52 | 0.18 | (2.70 | ) | (2.52 | ) | (0.21 | ) | (0.36 | ) | (0.57 | ) | 10.43 | (18.67 | ) | 124 | 0.08 | 1.01 | 1.54 | 40 | ||||||||||||||||||||||||||||||||||||||||||||||||||
Year ended 12/31/21 | 11.79 | 0.14 | 1.79 | 1.93 | (0.20 | ) | (0.00 | ) | (0.20 | ) | 13.52 | 16.42 | 160 | 0.09 | 1.12 | 1.11 | 29 | |||||||||||||||||||||||||||||||||||||||||||||||||||||
Year ended 12/31/20 | 10.74 | 0.15 | 1.09 | 1.24 | (0.12 | ) | (0.07 | ) | (0.19 | ) | 11.79 | 11.50 | 354 | 0.16 | 4.45 | 1.47 | 87 | |||||||||||||||||||||||||||||||||||||||||||||||||||||
Year ended 12/31/19 | 9.03 | 0.25 | 1.85 | 2.10 | (0.20 | ) | (0.19 | ) | (0.39 | ) | 10.74 | 23.28 | 322 | 0.19 | 10.83 | 2.47 | 59 | |||||||||||||||||||||||||||||||||||||||||||||||||||||
Period ended 12/31/18(f) | 10.00 | 0.23 | (1.02 | ) | (0.79 | ) | (0.17 | ) | (0.01 | ) | (0.18 | ) | 9.03 | (7.88 | ) | 271 | 0.15 | (g) | 45.18 | (g) | 2.32 | (g) | 10 | |||||||||||||||||||||||||||||||||||||||||||||||
| (a) | Calculated using average shares outstanding. |
| (b) | Net investment income is affected by the timing of the declaration of dividends by the underlying funds in which the Fund invests. Ratio of net investment income does not include net investment income of the underlying funds in which the Fund invests. |
| (c) | Includes adjustments in accordance with accounting principles generally accepted in the United States of America and as such, the net asset value for financial reporting purposes and the returns based upon those net asset values may differ from the net asset value and returns for shareholder transactions. Does not include sales charges and is not annualized for periods less than one year, if applicable. |
| (d) | In addition to the fees and expenses which the Fund bears directly; the Fund indirectly bears a pro rata share of the fees and expenses of the underlying funds in which the Fund invests. Because the underlying funds have varied expenses and fee levels and the Fund may own different proportions at different times, the amount of fees and expenses incurred indirectly by the Fund will vary. Estimated underlying fund expenses are not expenses that are incurred directly by the Fund. They are expenses that are incurred directly by the underlying funds and are deducted from the value of the funds the Fund invests in. The effect of the estimated underlying fund expenses that the Fund bears indirectly is included in the Fund’s total return. |
Estimated acquired fund fees from underlying funds were 0.37%, 0.43%, 0.42%, 0.41% and 0.36% for the years ended December 31, 2022, 2021, 2020, 2019 and 2018, respectively. |
| (e) | Portfolio turnover is calculated at the fund level and is not annualized for periods less than one year, if applicable. |
| (f) | Commencement date of January 3, 2018. |
| (g) | Annualized. |
See accompanying Notes to Financial Statements which are an integral part of the financial statements.
| 96 | Invesco Peak Retirement™ Funds |
Financial Highlights–(continued)
Invesco Peak Retirement™ 2055 Fund
| Net asset value, beginning of period | Net investment income(a)(b) | Net gains on securities | Total from investment operations | Dividends from net investment income | Distributions from net realized gains | Total distributions | Net asset value, end of period | Total return (c) | Net assets, end of period (000’s omitted) | Ratio of to average net assets | Ratio of expenses to average net assets without fee waivers and/or expenses absorbed | Ratio of net to average | Portfolio turnover (e) | |||||||||||||||||||||||||||||||||||||||||||||||||||||||||
Class A | ||||||||||||||||||||||||||||||||||||||||||||||||||||||||||||||||||||||
Year ended 12/31/22 | $ | 13.44 | $ | 0.15 | $ | (2.66 | ) | $ | (2.51 | ) | $ | (0.14 | ) | $ | (0.37 | ) | $ | (0.51 | ) | $ | 10.42 | (18.76 | )% | $ | 2,979 | 0.34 | % | 3.24 | % | 1.33 | % | 55 | % | |||||||||||||||||||||||||||||||||||||
Year ended 12/31/21 | 11.81 | 0.11 | 1.81 | 1.92 | (0.19 | ) | (0.10 | ) | (0.29 | ) | 13.44 | 16.32 | 3,206 | 0.34 | 4.27 | 0.85 | 33 | |||||||||||||||||||||||||||||||||||||||||||||||||||||
Year ended 12/31/20 | 10.62 | 0.12 | 1.22 | 1.34 | (0.09 | ) | (0.06 | ) | (0.15 | ) | 11.81 | 12.66 | 1,549 | 0.42 | 9.21 | 1.13 | 86 | |||||||||||||||||||||||||||||||||||||||||||||||||||||
Year ended 12/31/19 | 8.94 | 0.22 | 1.91 | 2.13 | (0.20 | ) | (0.25 | ) | (0.45 | ) | 10.62 | 23.92 | 382 | 0.45 | 23.79 | 2.15 | 54 | |||||||||||||||||||||||||||||||||||||||||||||||||||||
Period ended 12/31/18(f) | 10.00 | �� | 0.16 | (1.02 | ) | (0.86 | ) | (0.19 | ) | (0.01 | ) | (0.20 | ) | 8.94 | (8.59 | ) | 53 | 0.42 | (g) | 49.71 | (g) | 1.63 | (g) | 6 | ||||||||||||||||||||||||||||||||||||||||||||||
Class C | ||||||||||||||||||||||||||||||||||||||||||||||||||||||||||||||||||||||
Year ended 12/31/22 | 13.27 | 0.07 | (2.64 | ) | (2.57 | ) | (0.03 | ) | (0.37 | ) | (0.40 | ) | 10.30 | (19.41 | ) | 715 | 1.09 | 3.99 | 0.58 | 55 | ||||||||||||||||||||||||||||||||||||||||||||||||||
Year ended 12/31/21 | 11.68 | 0.01 | 1.80 | 1.81 | (0.12 | ) | (0.10 | ) | (0.22 | ) | 13.27 | 15.49 | 1,006 | 1.09 | 5.02 | 0.10 | 33 | |||||||||||||||||||||||||||||||||||||||||||||||||||||
Year ended 12/31/20 | 10.55 | 0.04 | 1.20 | 1.24 | (0.05 | ) | (0.06 | ) | (0.11 | ) | 11.68 | 11.78 | 457 | 1.17 | 9.96 | 0.38 | 86 | |||||||||||||||||||||||||||||||||||||||||||||||||||||
Year ended 12/31/19 | 8.90 | 0.14 | 1.92 | 2.06 | (0.16 | ) | (0.25 | ) | (0.41 | ) | 10.55 | 23.17 | 78 | 1.20 | 24.54 | 1.40 | 54 | |||||||||||||||||||||||||||||||||||||||||||||||||||||
Period ended 12/31/18(f) | 10.00 | 0.09 | (1.03 | ) | (0.94 | ) | (0.15 | ) | (0.01 | ) | (0.16 | ) | 8.90 | (9.40 | ) | 23 | 1.17 | (g) | 50.46 | (g) | 0.88 | (g) | 6 | |||||||||||||||||||||||||||||||||||||||||||||||
Class R | ||||||||||||||||||||||||||||||||||||||||||||||||||||||||||||||||||||||
Year ended 12/31/22 | 13.36 | 0.12 | (2.64 | ) | (2.52 | ) | (0.10 | ) | (0.37 | ) | (0.47 | ) | 10.37 | (18.88 | ) | 1,382 | 0.59 | 3.49 | 1.08 | 55 | ||||||||||||||||||||||||||||||||||||||||||||||||||
Year ended 12/31/21 | 11.75 | 0.08 | 1.80 | 1.88 | (0.17 | ) | (0.10 | ) | (0.27 | ) | 13.36 | 16.01 | 1,207 | 0.59 | 4.52 | 0.60 | 33 | |||||||||||||||||||||||||||||||||||||||||||||||||||||
Year ended 12/31/20 | 10.58 | 0.09 | 1.21 | 1.30 | (0.07 | ) | (0.06 | ) | (0.13 | ) | 11.75 | 12.38 | 483 | 0.67 | 9.46 | 0.88 | 86 | |||||||||||||||||||||||||||||||||||||||||||||||||||||
Year ended 12/31/19 | 8.93 | 0.20 | 1.89 | 2.09 | (0.19 | ) | (0.25 | ) | (0.44 | ) | 10.58 | 23.43 | 149 | 0.70 | 24.04 | 1.90 | 54 | |||||||||||||||||||||||||||||||||||||||||||||||||||||
Period ended 12/31/18(f) | 10.00 | 0.14 | (1.03 | ) | (0.89 | ) | (0.17 | ) | (0.01 | ) | (0.18 | ) | 8.93 | (8.86 | ) | 9 | 0.67 | (g) | 49.96 | (g) | 1.38 | (g) | 6 | |||||||||||||||||||||||||||||||||||||||||||||||
Class Y | ||||||||||||||||||||||||||||||||||||||||||||||||||||||||||||||||||||||
Year ended 12/31/22 | 13.47 | 0.18 | (2.67 | ) | (2.49 | ) | (0.17 | ) | (0.37 | ) | (0.54 | ) | 10.44 | (18.56 | ) | 62 | 0.09 | 2.99 | 1.58 | 55 | ||||||||||||||||||||||||||||||||||||||||||||||||||
Year ended 12/31/21 | 11.84 | 0.14 | 1.81 | 1.95 | (0.22 | ) | (0.10 | ) | (0.32 | ) | 13.47 | 16.50 | 89 | 0.09 | 4.02 | 1.10 | 33 | |||||||||||||||||||||||||||||||||||||||||||||||||||||
Year ended 12/31/20 | 10.64 | 0.14 | 1.22 | 1.36 | (0.10 | ) | (0.06 | ) | (0.16 | ) | 11.84 | 12.87 | 55 | 0.17 | 8.96 | 1.38 | 86 | |||||||||||||||||||||||||||||||||||||||||||||||||||||
Year ended 12/31/19 | 8.94 | 0.25 | 1.91 | 2.16 | (0.21 | ) | (0.25 | ) | (0.46 | ) | 10.64 | 24.26 | 64 | 0.20 | 23.54 | 2.40 | 54 | |||||||||||||||||||||||||||||||||||||||||||||||||||||
Period ended 12/31/18(f) | 10.00 | 0.19 | (1.03 | ) | (0.84 | ) | (0.21 | ) | (0.01 | ) | (0.22 | ) | 8.94 | (8.40 | ) | 36 | 0.17 | (g) | 49.46 | (g) | 1.88 | (g) | 6 | |||||||||||||||||||||||||||||||||||||||||||||||
Class R5 | ||||||||||||||||||||||||||||||||||||||||||||||||||||||||||||||||||||||
Year ended 12/31/22 | 13.49 | 0.18 | (2.67 | ) | (2.49 | ) | (0.17 | ) | (0.37 | ) | (0.54 | ) | 10.46 | (18.53 | ) | 105 | 0.09 | 2.66 | 1.58 | 55 | ||||||||||||||||||||||||||||||||||||||||||||||||||
Year ended 12/31/21 | 11.85 | 0.14 | 1.82 | 1.96 | (0.22 | ) | (0.10 | ) | (0.32 | ) | 13.49 | 16.57 | 135 | 0.09 | 3.57 | 1.10 | 33 | |||||||||||||||||||||||||||||||||||||||||||||||||||||
Year ended 12/31/20 | 10.64 | 0.14 | 1.23 | 1.37 | (0.10 | ) | (0.06 | ) | (0.16 | ) | 11.85 | 12.96 | 118 | 0.17 | 8.15 | 1.38 | 86 | |||||||||||||||||||||||||||||||||||||||||||||||||||||
Year ended 12/31/19 | 8.94 | 0.25 | 1.91 | 2.16 | (0.21 | ) | (0.25 | ) | (0.46 | ) | 10.64 | 24.26 | 106 | 0.20 | 22.61 | 2.40 | 54 | |||||||||||||||||||||||||||||||||||||||||||||||||||||
Period ended 12/31/18(f) | 10.00 | 0.19 | (1.03 | ) | (0.84 | ) | (0.21 | ) | (0.01 | ) | (0.22 | ) | 8.94 | (8.40 | ) | 89 | 0.17 | (g) | 48.81 | (g) | 1.88 | (g) | 6 | |||||||||||||||||||||||||||||||||||||||||||||||
Class R6 | ||||||||||||||||||||||||||||||||||||||||||||||||||||||||||||||||||||||
Year ended 12/31/22 | 13.49 | 0.18 | (2.67 | ) | (2.49 | ) | (0.17 | ) | (0.37 | ) | (0.54 | ) | 10.46 | (18.53 | ) | 277 | 0.09 | 2.66 | 1.58 | 55 | ||||||||||||||||||||||||||||||||||||||||||||||||||
Year ended 12/31/21 | 11.85 | 0.14 | 1.82 | 1.96 | (0.22 | ) | (0.10 | ) | (0.32 | ) | 13.49 | 16.57 | 356 | 0.09 | 3.57 | 1.10 | 33 | |||||||||||||||||||||||||||||||||||||||||||||||||||||
Year ended 12/31/20 | 10.64 | 0.14 | 1.23 | 1.37 | (0.10 | ) | (0.06 | ) | (0.16 | ) | 11.85 | 12.96 | 355 | 0.17 | 8.15 | 1.38 | 86 | |||||||||||||||||||||||||||||||||||||||||||||||||||||
Year ended 12/31/19 | 8.94 | 0.25 | 1.91 | 2.16 | (0.21 | ) | (0.25 | ) | (0.46 | ) | 10.64 | 24.26 | 319 | 0.20 | 22.61 | 2.40 | 54 | |||||||||||||||||||||||||||||||||||||||||||||||||||||
Period ended 12/31/18(f) | 10.00 | 0.19 | (1.03 | ) | (0.84 | ) | (0.21 | ) | (0.01 | ) | (0.22 | ) | 8.94 | (8.40 | ) | 268 | 0.17 | (g) | 48.81 | (g) | 1.88 | (g) | 6 | |||||||||||||||||||||||||||||||||||||||||||||||
| (a) | Calculated using average shares outstanding. |
| (b) | Net investment income is affected by the timing of the declaration of dividends by the underlying funds in which the Fund invests. Ratio of net investment income does not include net investment income of the underlying funds in which the Fund invests. |
| (c) | Includes adjustments in accordance with accounting principles generally accepted in the United States of America and as such, the net asset value for financial reporting purposes and the returns based upon those net asset values may differ from the net asset value and returns for shareholder transactions. Does not include sales charges and is not annualized for periods less than one year, if applicable. |
| (d) | In addition to the fees and expenses which the Fund bears directly; the Fund indirectly bears a pro rata share of the fees and expenses of the underlying funds in which the Fund invests. Because the underlying funds have varied expenses and fee levels and the Fund may own different proportions at different times, the amount of fees and expenses incurred indirectly by the Fund will vary. Estimated underlying fund expenses are not expenses that are incurred directly by the Fund. They are expenses that are incurred directly by the underlying funds and are deducted from the value of the funds the Fund invests in. The effect of the estimated underlying fund expenses that the Fund bears indirectly is included in the Fund’s total return. |
Estimated acquired fund fees from underlying funds were 0.37%, 0.43%, 0.44%, 0.40% and 0.35% for the years ended December 31, 2022, 2021, 2020, 2019 and 2018, respectively. |
| (e) | Portfolio turnover is calculated at the fund level and is not annualized for periods less than one year, if applicable. |
| (f) | Commencement date of January 3, 2018. |
| (g) | Annualized. |
See accompanying Notes to Financial Statements which are an integral part of the financial statements.
| 97 | Invesco Peak Retirement™ Funds |
Financial Highlights–(continued)
Invesco Peak Retirement™ 2060 Fund
| Net asset value, beginning of period | Net investment income(a)(b) | Net gains on securities | Total from investment operations | Dividends from net investment income | Distributions from net realized gains | Total distributions | Net asset value, end of period | Total return (c) | Net assets, end of period (000’s omitted) | Ratio of to average net assets | Ratio of expenses to average net assets without fee waivers and/or expenses absorbed | Ratio of net to average | Portfolio turnover (e) | |||||||||||||||||||||||||||||||||||||||||||||||||||||||||
Class A | ||||||||||||||||||||||||||||||||||||||||||||||||||||||||||||||||||||||
Year ended 12/31/22 | $ | 13.54 | $ | 0.14 | $ | (2.70 | ) | $ | (2.56 | ) | $ | (0.16 | ) | $ | (0.28 | ) | $ | (0.44 | ) | $ | 10.54 | �� | (18.94 | )% | $ | 3,682 | 0.36 | % | 2.77 | % | 1.23 | % | 39 | % | ||||||||||||||||||||||||||||||||||||
Year ended 12/31/21 | 11.75 | 0.11 | 1.83 | 1.94 | (0.15 | ) | – | (0.15 | ) | 13.54 | 16.56 | 4,220 | 0.33 | 3.17 | 0.89 | 27 | ||||||||||||||||||||||||||||||||||||||||||||||||||||||
Year ended 12/31/20 | 10.72 | 0.12 | 1.05 | 1.17 | (0.07 | ) | (0.07 | ) | (0.14 | ) | 11.75 | 10.94 | 1,988 | 0.43 | 8.43 | 1.17 | 86 | |||||||||||||||||||||||||||||||||||||||||||||||||||||
Year ended 12/31/19 | 8.91 | 0.24 | 1.97 | 2.21 | (0.18 | ) | (0.22 | ) | (0.40 | ) | 10.72 | 24.84 | 562 | 0.45 | 19.50 | 2.33 | 50 | |||||||||||||||||||||||||||||||||||||||||||||||||||||
Period ended 12/31/18(f) | 10.00 | 0.16 | (1.05 | ) | (0.89 | ) | (0.18 | ) | (0.02 | ) | (0.20 | ) | 8.91 | (8.87 | ) | 48 | 0.42 | (g) | 51.11 | (g) | 1.57 | (g) | 6 | |||||||||||||||||||||||||||||||||||||||||||||||
Class C | ||||||||||||||||||||||||||||||||||||||||||||||||||||||||||||||||||||||
Year ended 12/31/22 | 13.38 | 0.05 | (2.66 | ) | (2.61 | ) | (0.06 | ) | (0.28 | ) | (0.34 | ) | 10.43 | (19.53 | ) | 575 | 1.11 | 3.52 | 0.48 | 39 | ||||||||||||||||||||||||||||||||||||||||||||||||||
Year ended 12/31/21 | 11.63 | 0.02 | 1.81 | 1.83 | (0.08 | ) | – | (0.08 | ) | 13.38 | 15.71 | 739 | 1.08 | 3.92 | 0.14 | 27 | ||||||||||||||||||||||||||||||||||||||||||||||||||||||
Year ended 12/31/20 | 10.65 | 0.04 | 1.04 | 1.08 | (0.03 | ) | (0.07 | ) | (0.10 | ) | 11.63 | 10.15 | 321 | 1.18 | 9.18 | 0.42 | 86 | |||||||||||||||||||||||||||||||||||||||||||||||||||||
Year ended 12/31/19 | 8.89 | 0.16 | 1.97 | 2.13 | (0.15 | ) | (0.22 | ) | (0.37 | ) | 10.65 | 23.97 | 56 | 1.20 | 20.25 | 1.58 | 50 | |||||||||||||||||||||||||||||||||||||||||||||||||||||
Period ended 12/31/18(f) | 10.00 | 0.08 | (1.05 | ) | (0.97 | ) | (0.12 | ) | (0.02 | ) | (0.14 | ) | 8.89 | (9.66 | ) | 12 | 1.17 | (g) | 51.86 | (g) | 0.82 | (g) | 6 | |||||||||||||||||||||||||||||||||||||||||||||||
Class R | ||||||||||||||||||||||||||||||||||||||||||||||||||||||||||||||||||||||
Year ended 12/31/22 | 13.47 | 0.11 | (2.69 | ) | (2.58 | ) | (0.12 | ) | (0.28 | ) | (0.40 | ) | 10.49 | (19.14 | ) | 1,816 | 0.61 | 3.02 | 0.98 | 39 | ||||||||||||||||||||||||||||||||||||||||||||||||||
Year ended 12/31/21 | 11.70 | 0.08 | 1.81 | 1.89 | (0.12 | ) | – | (0.12 | ) | 13.47 | 16.22 | 2,362 | 0.58 | 3.42 | 0.64 | 27 | ||||||||||||||||||||||||||||||||||||||||||||||||||||||
Year ended 12/31/20 | 10.69 | 0.09 | 1.05 | 1.14 | (0.06 | ) | (0.07 | ) | (0.13 | ) | 11.70 | 10.64 | 819 | 0.68 | 8.68 | 0.92 | 86 | |||||||||||||||||||||||||||||||||||||||||||||||||||||
Year ended 12/31/19 | 8.90 | 0.22 | 1.96 | 2.18 | (0.17 | ) | (0.22 | ) | (0.39 | ) | 10.69 | 24.57 | 173 | 0.70 | 19.75 | 2.08 | 50 | |||||||||||||||||||||||||||||||||||||||||||||||||||||
Period ended 12/31/18(f) | 10.00 | 0.13 | (1.05 | ) | (0.92 | ) | (0.16 | ) | (0.02 | ) | (0.18 | ) | 8.90 | (9.18 | ) | 10 | 0.67 | (g) | 51.36 | (g) | 1.32 | (g) | 6 | |||||||||||||||||||||||||||||||||||||||||||||||
Class Y | ||||||||||||||||||||||||||||||||||||||||||||||||||||||||||||||||||||||
Year ended 12/31/22 | 13.60 | 0.17 | (2.71 | ) | (2.54 | ) | (0.19 | ) | (0.28 | ) | (0.47 | ) | 10.59 | (18.70 | ) | 129 | 0.11 | 2.52 | 1.48 | 39 | ||||||||||||||||||||||||||||||||||||||||||||||||||
Year ended 12/31/21 | 11.80 | 0.15 | 1.83 | 1.98 | (0.18 | ) | – | (0.18 | ) | 13.60 | 16.80 | 159 | 0.08 | 2.92 | 1.14 | 27 | ||||||||||||||||||||||||||||||||||||||||||||||||||||||
Year ended 12/31/20 | 10.74 | 0.14 | 1.07 | 1.21 | (0.08 | ) | (0.07 | ) | (0.15 | ) | 11.80 | 11.32 | 93 | 0.18 | 8.18 | 1.42 | 86 | |||||||||||||||||||||||||||||||||||||||||||||||||||||
Year ended 12/31/19 | 8.91 | 0.26 | 1.98 | 2.24 | (0.19 | ) | (0.22 | ) | (0.41 | ) | 10.74 | 25.17 | 43 | 0.20 | 19.25 | 2.58 | 50 | |||||||||||||||||||||||||||||||||||||||||||||||||||||
Period ended 12/31/18(f) | 10.00 | 0.18 | (1.05 | ) | (0.87 | ) | (0.20 | ) | (0.02 | ) | (0.22 | ) | 8.91 | (8.66 | ) | 36 | 0.17 | (g) | 50.86 | (g) | 1.82 | (g) | 6 | |||||||||||||||||||||||||||||||||||||||||||||||
Class R5 | ||||||||||||||||||||||||||||||||||||||||||||||||||||||||||||||||||||||
Year ended 12/31/22 | 13.60 | 0.17 | (2.71 | ) | (2.54 | ) | (0.19 | ) | (0.28 | ) | (0.47 | ) | 10.59 | (18.70 | ) | 106 | 0.11 | 2.24 | 1.48 | 39 | ||||||||||||||||||||||||||||||||||||||||||||||||||
Year ended 12/31/21 | 11.80 | 0.15 | 1.83 | 1.98 | (0.18 | ) | – | (0.18 | ) | 13.60 | 16.80 | 136 | 0.08 | 2.54 | 1.14 | 27 | ||||||||||||||||||||||||||||||||||||||||||||||||||||||
Year ended 12/31/20 | 10.74 | 0.14 | 1.07 | 1.21 | (0.08 | ) | (0.07 | ) | (0.15 | ) | 11.80 | 11.32 | 118 | 0.18 | 7.36 | 1.42 | 86 | |||||||||||||||||||||||||||||||||||||||||||||||||||||
Year ended 12/31/19 | 8.91 | 0.26 | 1.98 | 2.24 | (0.19 | ) | (0.22 | ) | (0.41 | ) | 10.74 | 25.17 | 107 | 0.20 | 18.62 | 2.58 | 50 | |||||||||||||||||||||||||||||||||||||||||||||||||||||
Period ended 12/31/18(f) | 10.00 | 0.18 | (1.05 | ) | (0.87 | ) | (0.20 | ) | (0.02 | ) | (0.22 | ) | 8.91 | (8.66 | ) | 89 | 0.17 | (g) | 50.20 | (g) | 1.82 | (g) | 6 | |||||||||||||||||||||||||||||||||||||||||||||||
Class R6 | ||||||||||||||||||||||||||||||||||||||||||||||||||||||||||||||||||||||
Year ended 12/31/22 | 13.60 | 0.17 | (2.72 | ) | (2.55 | ) | (0.19 | ) | (0.28 | ) | (0.47 | ) | 10.58 | (18.77 | ) | 260 | 0.11 | 2.24 | 1.48 | 39 | ||||||||||||||||||||||||||||||||||||||||||||||||||
Year ended 12/31/21 | 11.80 | 0.15 | 1.83 | 1.98 | (0.18 | ) | – | (0.18 | ) | 13.60 | 16.80 | 334 | 0.08 | 2.54 | 1.14 | 27 | ||||||||||||||||||||||||||||||||||||||||||||||||||||||
Year ended 12/31/20 | 10.74 | 0.14 | 1.07 | 1.21 | (0.08 | ) | (0.07 | ) | (0.15 | ) | 11.80 | 11.32 | 354 | 0.18 | 7.36 | 1.42 | 86 | |||||||||||||||||||||||||||||||||||||||||||||||||||||
Year ended 12/31/19 | 8.91 | 0.26 | 1.98 | 2.24 | (0.19 | ) | (0.22 | ) | (0.41 | ) | 10.74 | 25.17 | 322 | 0.20 | 18.62 | 2.58 | 50 | |||||||||||||||||||||||||||||||||||||||||||||||||||||
Period ended 12/31/18(f) | 10.00 | 0.18 | (1.05 | ) | (0.87 | ) | (0.20 | ) | (0.02 | ) | (0.22 | ) | 8.91 | (8.66 | ) | 267 | 0.17 | (g) | 50.20 | (g) | 1.82 | (g) | 6 | |||||||||||||||||||||||||||||||||||||||||||||||
| (a) | Calculated using average shares outstanding. |
| (b) | Net investment income is affected by the timing of the declaration of dividends by the underlying funds in which the Fund invests. Ratio of net investment income does not include net investment income of the underlying funds in which the Fund invests. |
| (c) | Includes adjustments in accordance with accounting principles generally accepted in the United States of America and as such, the net asset value for financial reporting purposes and the returns based upon those net asset values may differ from the net asset value and returns for shareholder transactions. Does not include sales charges and is not annualized for periods less than one year, if applicable. |
| (d) | In addition to the fees and expenses which the Fund bears directly; the Fund indirectly bears a pro rata share of the fees and expenses of the underlying funds in which the Fund invests. Because the underlying funds have varied expenses and fee levels and the Fund may own different proportions at different times, the amount of fees and expenses incurred indirectly by the Fund will vary. Estimated underlying fund expenses are not expenses that are incurred directly by the Fund. They are expenses that are incurred directly by the underlying funds and are deducted from the value of the funds the Fund invests in. The effect of the estimated underlying fund expenses that the Fund bears indirectly is included in the Fund’s total return. |
Estimated acquired fund fees from underlying funds were 0.37%, 0.43%, 0.41%, 0.40% and 0.35% for the years ended December 31, 2022, 2021, 2020, 2019 and 2018, respectively |
| (e) | Portfolio turnover is calculated at the fund level and is not annualized for periods less than one year, if applicable. |
| (f) | Commencement date of January 3, 2018. |
| (g) | Annualized. |
See accompanying Notes to Financial Statements which are an integral part of the financial statements.
| 98 | Invesco Peak Retirement™ Funds |
Financial Highlights–(continued)
Invesco Peak Retirement™ 2065 Fund
| Net asset value, beginning of period | Net investment income(a)(b) | Net gains on securities | Total from investment operations | Dividends from net investment income | Distributions from net realized gains | Total distributions | Net asset value, end of period | Total return (c) | Net assets, end of period (000’s omitted) | Ratio of to average net assets | Ratio of expenses to average net assets without fee waivers and/or expenses absorbed | Ratio of net to average | Portfolio turnover (e) | |||||||||||||||||||||||||||||||||||||||||||||||||||||||||
Class A | ||||||||||||||||||||||||||||||||||||||||||||||||||||||||||||||||||||||
Year ended 12/31/22 | $ | 13.78 | $ | 0.15 | $ | (2.77 | ) | $ | (2.62 | ) | $ | (0.12 | ) | $ | (0.40 | ) | $ | (0.52 | ) | $ | 10.64 | (19.04 | )% | $ | 2,757 | 0.35 | % | 3.30 | % | 1.25 | % | 55 | % | |||||||||||||||||||||||||||||||||||||
Year ended 12/31/21 | 12.09 | 0.11 | 1.89 | 2.00 | (0.17 | ) | (0.14 | ) | (0.31 | ) | 13.78 | 16.55 | 3,510 | 0.34 | 4.22 | 0.85 | 37 | |||||||||||||||||||||||||||||||||||||||||||||||||||||
Year ended 12/31/20 | 10.79 | 0.13 | 1.34 | 1.47 | (0.12 | ) | (0.05 | ) | (0.17 | ) | 12.09 | 13.66 | 1,536 | 0.42 | 11.26 | 1.21 | 82 | |||||||||||||||||||||||||||||||||||||||||||||||||||||
Year ended 12/31/19 | 9.00 | 0.21 | 2.00 | 2.21 | (0.19 | ) | (0.23 | ) | (0.42 | ) | 10.79 | 24.56 | 216 | 0.43 | 23.83 | 2.00 | 49 | |||||||||||||||||||||||||||||||||||||||||||||||||||||
Period ended 12/31/18(f) | 10.00 | 0.16 | (0.98 | ) | (0.82 | ) | (0.18 | ) | – | (0.18 | ) | 9.00 | (8.15 | ) | 49 | 0.42 | (g) | 48.89 | (g) | 1.56 | (g) | 165 | ||||||||||||||||||||||||||||||||||||||||||||||||
Class C | ||||||||||||||||||||||||||||||||||||||||||||||||||||||||||||||||||||||
Year ended 12/31/22 | 13.42 | 0.06 | (2.68 | ) | (2.62 | ) | (0.02 | ) | (0.40 | ) | (0.42 | ) | 10.38 | (19.54 | ) | 639 | 1.10 | 4.05 | 0.50 | 55 | ||||||||||||||||||||||||||||||||||||||||||||||||||
Year ended 12/31/21 | 11.81 | 0.01 | 1.84 | 1.85 | (0.10 | ) | (0.14 | ) | (0.24 | ) | 13.42 | 15.66 | 867 | 1.09 | 4.97 | 0.10 | 37 | |||||||||||||||||||||||||||||||||||||||||||||||||||||
Year ended 12/31/20 | 10.60 | 0.05 | 1.30 | 1.35 | (0.09 | ) | (0.05 | ) | (0.14 | ) | 11.81 | 12.72 | 299 | 1.17 | 12.01 | 0.46 | 82 | |||||||||||||||||||||||||||||||||||||||||||||||||||||
Year ended 12/31/19 | 8.88 | 0.13 | 1.95 | 2.08 | (0.13 | ) | (0.23 | ) | (0.36 | ) | 10.60 | 23.46 | 71 | 1.18 | 24.58 | 1.25 | 49 | |||||||||||||||||||||||||||||||||||||||||||||||||||||
Period ended 12/31/18(f) | 10.00 | 0.08 | (1.05 | ) | (0.97 | ) | (0.15 | ) | – | (0.15 | ) | 8.88 | (9.69 | ) | 24 | 1.17 | (g) | 49.64 | (g) | 0.81 | (g) | 165 | ||||||||||||||||||||||||||||||||||||||||||||||||
Class R | ||||||||||||||||||||||||||||||||||||||||||||||||||||||||||||||||||||||
Year ended 12/31/22 | 13.55 | 0.11 | (2.70 | ) | (2.59 | ) | (0.09 | ) | (0.40 | ) | (0.49 | ) | 10.47 | (19.12 | ) | 939 | 0.60 | 3.55 | 1.00 | 55 | ||||||||||||||||||||||||||||||||||||||||||||||||||
Year ended 12/31/21 | 11.90 | 0.08 | 1.85 | 1.93 | (0.14 | ) | (0.14 | ) | (0.28 | ) | 13.55 | 16.26 | 669 | 0.59 | 4.47 | 0.60 | 37 | |||||||||||||||||||||||||||||||||||||||||||||||||||||
Year ended 12/31/20 | 10.65 | 0.10 | 1.31 | 1.41 | (0.11 | ) | (0.05 | ) | (0.16 | ) | 11.90 | 13.25 | 309 | 0.67 | 11.51 | 0.96 | 82 | |||||||||||||||||||||||||||||||||||||||||||||||||||||
Year ended 12/31/19 | 8.90 | 0.18 | 1.98 | 2.16 | (0.18 | ) | (0.23 | ) | (0.41 | ) | 10.65 | 24.23 | 75 | 0.68 | 24.08 | 1.75 | 49 | |||||||||||||||||||||||||||||||||||||||||||||||||||||
Period ended 12/31/18(f) | 10.00 | 0.13 | (1.06 | ) | (0.93 | ) | (0.17 | ) | – | (0.17 | ) | 8.90 | (9.29 | ) | 9 | 0.67 | (g) | 49.14 | (g) | 1.31 | (g) | 165 | ||||||||||||||||||||||||||||||||||||||||||||||||
Class Y | ||||||||||||||||||||||||||||||||||||||||||||||||||||||||||||||||||||||
Year ended 12/31/22 | 13.67 | 0.18 | (2.75 | ) | (2.57 | ) | (0.15 | ) | (0.40 | ) | (0.55 | ) | 10.55 | (18.80 | ) | 323 | 0.10 | 3.05 | 1.50 | 55 | ||||||||||||||||||||||||||||||||||||||||||||||||||
Year ended 12/31/21 | 11.99 | 0.15 | 1.87 | 2.02 | (0.20 | ) | (0.14 | ) | (0.34 | ) | 13.67 | 16.83 | 410 | 0.09 | 3.97 | 1.10 | 37 | |||||||||||||||||||||||||||||||||||||||||||||||||||||
Year ended 12/31/20 | 10.70 | 0.15 | 1.32 | 1.47 | (0.13 | ) | (0.05 | ) | (0.18 | ) | 11.99 | 13.80 | 205 | 0.17 | 11.01 | 1.46 | 82 | |||||||||||||||||||||||||||||||||||||||||||||||||||||
Year ended 12/31/19 | 8.92 | 0.23 | 1.98 | 2.21 | (0.20 | ) | (0.23 | ) | (0.43 | ) | 10.70 | 24.82 | 43 | 0.18 | 23.58 | 2.25 | 49 | |||||||||||||||||||||||||||||||||||||||||||||||||||||
Period ended 12/31/18(f) | 10.00 | 0.18 | (1.05 | ) | (0.87 | ) | (0.21 | ) | – | (0.21 | ) | 8.92 | (8.72 | ) | 36 | 0.17 | (g) | 48.64 | (g) | 1.81 | (g) | 165 | ||||||||||||||||||||||||||||||||||||||||||||||||
Class R5 | ||||||||||||||||||||||||||||||||||||||||||||||||||||||||||||||||||||||
Year ended 12/31/22 | 13.67 | 0.18 | (2.75 | ) | (2.57 | ) | (0.15 | ) | (0.40 | ) | (0.55 | ) | 10.55 | (18.80 | ) | 106 | 0.08 | 2.72 | 1.52 | 55 | ||||||||||||||||||||||||||||||||||||||||||||||||||
Year ended 12/31/21 | 11.99 | 0.15 | 1.87 | 2.02 | (0.20 | ) | (0.14 | ) | (0.34 | ) | 13.67 | 16.83 | 137 | 0.09 | 3.59 | 1.10 | 37 | |||||||||||||||||||||||||||||||||||||||||||||||||||||
Year ended 12/31/20 | 10.70 | 0.15 | 1.32 | 1.47 | (0.13 | ) | (0.05 | ) | (0.18 | ) | 11.99 | 13.80 | 120 | 0.17 | 10.12 | 1.46 | 82 | |||||||||||||||||||||||||||||||||||||||||||||||||||||
Year ended 12/31/19 | 8.92 | 0.23 | 1.98 | 2.21 | (0.20 | ) | (0.23 | ) | (0.43 | ) | 10.70 | 24.82 | 107 | 0.18 | 22.73 | 2.25 | 49 | |||||||||||||||||||||||||||||||||||||||||||||||||||||
Period ended 12/31/18(f) | 10.00 | 0.18 | (1.05 | ) | (0.87 | ) | (0.21 | ) | – | (0.21 | ) | 8.92 | (8.72 | ) | 89 | 0.17 | (g) | 48.08 | (g) | 1.81 | (g) | 165 | ||||||||||||||||||||||||||||||||||||||||||||||||
Class R6 | ||||||||||||||||||||||||||||||||||||||||||||||||||||||||||||||||||||||
Year ended 12/31/22 | 13.67 | 0.18 | (2.75 | ) | (2.57 | ) | (0.15 | ) | (0.40 | ) | (0.55 | ) | 10.55 | (18.80 | ) | 260 | 0.08 | 2.72 | 1.52 | 55 | ||||||||||||||||||||||||||||||||||||||||||||||||||
Year ended 12/31/21 | 11.99 | 0.15 | 1.87 | 2.02 | (0.20 | ) | (0.14 | ) | (0.34 | ) | 13.67 | 16.83 | 337 | 0.09 | 3.59 | 1.10 | 37 | |||||||||||||||||||||||||||||||||||||||||||||||||||||
Year ended 12/31/20 | 10.70 | 0.15 | 1.32 | 1.47 | (0.13 | ) | (0.05 | ) | (0.18 | ) | 11.99 | 13.80 | 360 | 0.17 | 10.12 | 1.46 | 82 | |||||||||||||||||||||||||||||||||||||||||||||||||||||
Year ended 12/31/19 | 8.92 | 0.23 | 1.98 | 2.21 | (0.20 | ) | (0.23 | ) | (0.43 | ) | 10.70 | 24.82 | 321 | 0.18 | 22.73 | 2.25 | 49 | |||||||||||||||||||||||||||||||||||||||||||||||||||||
Period ended 12/31/18(f) | 10.00 | 0.18 | (1.05 | ) | (0.87 | ) | (0.21 | ) | – | (0.21 | ) | 8.92 | (8.72 | ) | 268 | 0.17 | (g) | 48.08 | (g) | 1.81 | (g) | 165 | ||||||||||||||||||||||||||||||||||||||||||||||||
| (a) | Calculated using average shares outstanding. |
| (b) | Net investment income is affected by the timing of the declaration of dividends by the underlying funds in which the Fund invests. Ratio of net investment income does not include net investment income of the underlying funds in which the Fund invests. |
| (c) | Includes adjustments in accordance with accounting principles generally accepted in the United States of America and as such, the net asset value for financial reporting purposes and the returns based upon those net asset values may differ from the net asset value and returns for shareholder transactions. Does not include sales charges and is not annualized for periods less than one year, if applicable. |
| (d) | In addition to the fees and expenses which the Fund bears directly; the Fund indirectly bears a pro rata share of the fees and expenses of the underlying funds in which the Fund invests. Because the underlying funds have varied expenses and fee levels and the Fund may own different proportions at different times, the amount of fees and expenses incurred indirectly by the Fund will vary. Estimated underlying fund expenses are not expenses that are incurred directly by the Fund. They are expenses that are incurred directly by the underlying funds and are deducted from the value of the funds the Fund invests in. The effect of the estimated underlying fund expenses that the Fund bears indirectly is included in the Fund’s total return. |
Estimated acquired fund fees from underlying funds were 0.37%, 0.43%, 0.41%, 0.40% and 0.35% for the years ended December 31, 2022, 2021, 2020, 2019 and 2018, respectively |
| (e) | Portfolio turnover is calculated at the fund level and is not annualized for periods less than one year, if applicable. |
| (f) | Commencement date of January 3, 2018. |
| (g) | Annualized. |
See accompanying Notes to Financial Statements which are an integral part of the financial statements.
| 99 | Invesco Peak Retirement™ Funds |
December 31, 2022
NOTE 1–Significant Accounting Policies
AIM Growth Series (Invesco Growth Series) (the “Trust”) is organized as a Delaware statutory trust and is registered under the Investment Company Act of 1940, as amended (the “1940 Act”), as an open-end series management investment company authorized to issue an unlimited number of shares of beneficial interest. The Funds covered in this report, each a series portfolio of the Trust, are Invesco Peak Retirement™ Destination Fund, Invesco Peak Retirement™ 2010 Fund, Invesco Peak Retirement™ 2015 Fund, Invesco Peak Retirement™ 2020 Fund, Invesco Peak Retirement™ 2025 Fund, Invesco Peak Retirement™ 2030 Fund, Invesco Peak Retirement™ 2035 Fund, Invesco Peak Retirement™ 2040 Fund, Invesco Peak Retirement™ 2045 Fund, Invesco Peak Retirement™ 2050 Fund, Invesco Peak Retirement™ 2055 Fund, Invesco Peak Retirement™ 2060 Fund and Invesco Peak Retirement™ 2065 Fund (collectively, the “Funds”). Information presented in these financial statements pertains only to the Funds. Matters affecting each Fund or each class will be voted on exclusively by the shareholders of each Fund or each class.
The investment objective of each Fund is total return over time, consistent with its strategic target allocation.
Each Fund is a “fund of funds”, in that it invests in other mutual funds (“underlying funds”) advised by Invesco Advisers, Inc. (the “Adviser” or “Invesco”), exchange-traded funds advised by Invesco Capital Management (“Invesco Capital”), an affiliate of Invesco, or other unaffiliated advisers. The Adviser may change each Fund’s asset class allocations, the underlying funds or the target weightings in the underlying funds without shareholder approval. The underlying funds may engage in a number of investment techniques and practices, which involve certain risks. Each underlying fund’s accounting policies are outlined in the underlying fund’s financial statements and are publicly available.
Each Fund currently consists of six different classes of shares: Class A, Class C, Class R, Class Y, Class R5 and Class R6. Class Y shares are available only to certain investors. Class A shares are sold with a front-end sales charge unless certain waiver criteria are met. Under certain circumstances, load waived shares may be subject to contingent deferred sales charges (“CDSC”). Class C shares are sold with a CDSC. Class R, Class Y, Class R5 and Class R6 shares are sold at net asset value. Class C shares held for eight years after purchase are eligible for automatic conversion into Class A shares of the same Fund (the “Conversion Feature”). The automatic conversion pursuant to the Conversion Feature will generally occur at the end of the month following the eighth anniversary after a purchase of Class C shares.
Each Fund is an investment company and accordingly follows the investment company accounting and reporting guidance in accordance with Financial Accounting Standards Board Accounting Standards Codification Topic 946, Financial Services – Investment Companies.
The following is a summary of the significant accounting policies followed by the Funds in the preparation of their financial statements.
| A. | Security Valuations – Securities of investment companies listed or traded on an exchange are generally valued at the trade price or official closing price that day as of the close of the exchange where the security is principally traded, or lacking any trades or official closing price on a particular day, the security may be valued at the closing bid price on that day. Securities of investment companies that are not exchange-traded (e.g., open-end mutual funds) are valued using such company’s end-of-business-day net asset value per share. Securities in the underlying funds, including restricted securities, are valued in accordance with the valuation policy of such fund. The policies of the underlying funds affiliated with the Funds, as a result of having the same investment adviser, are set forth below. |
A security listed or traded on an exchange is generally valued at its trade price or official closing price that day as of the close of the exchange where the security is principally traded, or lacking any trades or official closing price on a particular day, the security may be valued at the closing bid price on that day. Securities traded in the over-the-counter market are valued based on prices furnished by independent pricing services or market makers. When such securities are valued using prices provided by an independent pricing service they may be considered fair valued. Futures contracts are valued at the daily settlement price set by an exchange on which they are principally traded. U.S. exchange-traded options are valued at the mean between the last bid and asked prices from the exchange on which they are principally traded. Non-U.S. exchange-traded options are valued at the final settlement price set by the exchange on which they trade. Options not listed on an exchange and swaps generally are valued using pricing provided from independent pricing services.
Variable rate senior loan interests are fair valued using quotes provided by an independent pricing service. Quotes provided by the pricing service may reflect appropriate factors such as ratings, tranche type, industry, company performance, spread, individual trading characteristics, institution-size trading in similar groups of securities and other market data.
Securities of investment companies that are not exchange-traded (e.g., open-end mutual funds) are valued using such company’s end-of-business-day net asset value per share.
Deposits, other obligations of U.S. and non-U.S. banks and financial institutions are valued at their daily account value.
Fixed income securities (including convertible debt securities) generally are valued on the basis of prices provided by independent pricing services. Prices provided by the pricing service may be determined without exclusive reliance on quoted prices, and may reflect appropriate factors such as institution-size trading in similar groups of securities, developments related to specific securities, dividend rate (for unlisted equities), yield (for debt obligations), quality, type of issue, coupon rate (for debt obligations), maturity (for debt obligations), individual trading characteristics and other market data. Pricing services generally value debt obligations assuming orderly transactions of institutional round lot size, but a fund may hold or transact in the same securities in smaller, odd lot sizes. Odd lots often trade at lower prices than institutional round lots, and their value may be adjusted accordingly. Debt obligations are subject to interest rate and credit risks. In addition, all debt obligations involve some risk of default with respect to interest and/or principal payments.
Swap agreements are fair valued using an evaluated quote, if available, provided by an independent pricing service. Evaluated quotes provided by the pricing service are valued based on a model which may include end-of-day net present values, spreads, ratings, industry, company performance and returns of referenced assets. Centrally cleared swap agreements are valued at the daily settlement price determined by the relevant exchange or clearinghouse.
Foreign securities’ (including foreign exchange contracts) prices are converted into U.S. dollar amounts using the applicable exchange rates as of the close of the New York Stock Exchange (“NYSE”). If market quotations are available and reliable for foreign exchange-traded equity securities, the securities will be valued at the market quotations. The Adviser may use various pricing services to obtain market quotations as well as fair value prices. Because trading hours for certain foreign securities end before the close of the NYSE, closing market quotations may become not representative of market value in the Adviser’s judgment (“unreliable”). If, between the time trading ends on a particular security and the close of
| 100 | Invesco Peak Retirement™ Funds |
the customary trading session on the NYSE, a significant event occurs that makes the closing price of the security unreliable, the Adviser may fair value the security. If the event is likely to have affected the closing price of the security, the security will be valued at fair value in good faith in accordance with Board- approved policies and related Adviser procedures (“Valuation Procedures”). Adjustments to closing prices to reflect fair value may also be based on a screening process of an independent pricing service to indicate the degree of certainty, based on historical data, that the closing price in the principal market where a foreign security trades is not the current value as of the close of the NYSE. Foreign securities’ prices meeting the degree of certainty that the price is not reflective of current value will be priced at the indication of fair value from the independent pricing service. Multiple factors may be considered by the independent pricing service in determining adjustments to reflect fair value and may include information relating to sector indices, American Depositary Receipts and domestic and foreign index futures. Foreign securities may have additional risks including exchange rate changes, potential for sharply devalued currencies and high inflation, political and economic upheaval, the relative lack of issuer information, relatively low market liquidity and the potential lack of strict financial and accounting controls and standards.
Unlisted securities will be valued using prices provided by independent pricing services or by another method that the Adviser, in its judgment, believes better reflects the security’s fair value in accordance with the Valuation Procedures.
Securities for which market prices are not provided by any of the above methods may be valued based upon quotes furnished by independent sources. The last bid price may be used to value equity securities. The mean between the last bid and asked prices may be used to value debt obligations, including corporate loans.
Securities for which market quotations are not readily available are fair valued by the Adviser in accordance with the Valuation Procedures. If a fair value price provided by a pricing service is unreliable, the Adviser will fair value the security using the Valuation Procedures. Issuer specific events, market trends, bid/asked quotes of brokers and information providers and other market data may be reviewed in the course of making a good faith determination of a security’s fair value.
The Funds may invest in securities that are subject to interest rate risk, meaning the risk that the prices will generally fall as interest rates rise and, conversely, the prices will generally rise as interest rates fall. Specific securities differ in their sensitivity to changes in interest rates depending on their individual characteristics. Changes in interest rates may result in increased market volatility, which may affect the value and/or liquidity of certain Fund investments.
Valuations change in response to many factors including the historical and prospective earnings of the issuer, the value of the issuer’s assets, general market conditions which are not specifically related to the particular issuer, such as real or perceived adverse economic conditions, changes in the general outlook for revenues or corporate earnings, changes in interest or currency rates, regional or global instability, natural or environmental disasters, widespread disease or other public health issues, war, acts of terrorism, significant governmental actions or adverse investor sentiment generally and market liquidity. Because of the inherent uncertainties of valuation, the values reflected in the financial statements may materially differ from the value received upon actual sale of those investments.
The price the Funds could receive upon the sale of any investment may differ from the Adviser’s valuation of the investment, particularly for securities that are valued using a fair valuation technique. When fair valuation techniques are applied, the Adviser uses available information, including both observable and unobservable inputs and assumptions, to determine a methodology that will result in a valuation that the Adviser believes approximates market value. Each Funds’ securities that are fair valued may be subject to greater fluctuation in their value from one day to the next than would be the case if market quotations were used. Because of the inherent uncertainties of valuation, and the degree of subjectivity in such decisions, each Fund could realize a greater or lesser than expected gain or loss upon the sale of the investment.
| B. | Securities Transactions and Investment Income – Securities transactions are accounted for on a trade date basis. Realized gains or losses on sales are computed on the basis of specific identification of the securities sold. Distributions from ordinary income from underlying funds, if any, are recorded as dividend income on ex-dividend date. Distributions from gains from underlying funds, if any, are recorded as realized gains on the ex-dividend date. The following policies are followed by the underlying funds: Interest income (net of withholding tax, if any) is recorded on an accrual basis from settlement date and includes coupon interest and amortization of premium and accretion of discount on debt securities as applicable. Pay-in-kind interest income and non-cash dividend income received in the form of securities in-lieu of cash are recorded at the fair value of the securities received. Paydown gains and losses on mortgage and asset-backed securities are recorded as adjustments to interest income. |
The Funds may periodically participate in litigation related to each Fund’s investments. As such, the Funds may receive proceeds from litigation settlements. Any proceeds received are included in the Statements of Operations as realized gain (loss) for investments no longer held and as unrealized gain (loss) for investments still held.
Each Fund allocates income and realized and unrealized capital gains and losses to a class based on the relative net assets of each class.
| C. | Distributions – Invesco Peak Retirement™ Destination Fund generally declares and pays dividends from net investment income, if any, monthly. Invesco Peak Retirement™ 2010 Fund, Invesco Peak Retirement™ 2015 Fund, Invesco Peak Retirement™ 2020 Fund, Invesco Peak Retirement™ 2025 Fund, Invesco Peak Retirement™ 2030 Fund, Invesco Peak Retirement™ 2035 Fund, Invesco Peak Retirement™ 2040 Fund, Invesco Peak Retirement™ 2045 Fund, Invesco Peak Retirement™ 2050 Fund, Invesco Peak Retirement™ 2055 Fund, Invesco Peak Retirement™ 2060 Fund and Invesco Peak Retirement™ 2065 Fund generally declare and pay dividends from net investment income, if any, annually. Distributions from net realized capital gains, if any, are generally paid annually and recorded on the ex-dividend date. The Funds may elect to treat a portion of the proceeds from redemptions as distributions for federal income tax purposes. |
| D. | Federal Income Taxes – The Funds intend to comply with the requirements of Subchapter M of the Internal Revenue Code of 1986, as amended (the “Internal Revenue Code”), necessary to qualify as a regulated investment company and to distribute substantially all of the Funds’ taxable earnings to shareholders. As such, the Funds will not be subject to federal income taxes on otherwise taxable income (including net realized capital gain) that is distributed to shareholders. Therefore, no provision for federal income taxes is recorded in the financial statements. |
The Funds recognize the tax benefits of uncertain tax positions only when the position is more likely than not to be sustained. Management has analyzed each Fund’s uncertain tax positions and concluded that no liability for unrecognized tax benefits should be recorded related to uncertain tax positions. Management is not aware of any tax positions for which it is reasonably possible that the total amounts of unrecognized tax benefits will change materially in the next 12 months.
Each Fund files tax returns in the U.S. Federal jurisdiction and certain other jurisdictions. Generally, each Fund is subject to examinations by such taxing authorities for up to three years after the filing of the return for the tax period.
| 101 | Invesco Peak Retirement™ Funds |
| E. | Expenses – Expenses included in the accompanying financial statements reflect the expenses of the Funds and do not include any expenses of the underlying funds. The effects of the underlying funds expenses are included in the realized and unrealized gain/loss on the investments in the underlying funds. Estimated expenses of the underlying funds are discussed further within the Financial Highlights. |
Fees provided for under the Rule 12b-1 plan of a particular class of each Fund and which are directly attributable to that class are charged to the operations of such class. Transfer agency fees and expenses and other shareholder recordkeeping fees and expenses attributable to Class R5 and Class R6 are allocated based on relative net assets of Class R5 and Class R6. Sub-accounting fees attributable to Class R5 are charged to the operations of the class. Transfer agency fees and expenses and other shareholder recordkeeping fees and expenses relating to all other classes are allocated among those classes based on relative net assets. All other expenses are allocated among the classes based on relative net assets.
| F. | Accounting Estimates – The preparation of financial statements in conformity with accounting principles generally accepted in the United States of America (“GAAP”) requires management to make estimates and assumptions that affect the reported amounts of assets and liabilities at the date of the financial statements and the reported amounts of revenues and expenses during the reporting period including estimates and assumptions related to taxation. Actual results could differ from those estimates by a significant amount. In addition, each Fund monitors for material events or transactions that may occur or become known after the period-end date and before the date the financial statements are released to print. |
| G. | Indemnifications – Under the Trust’s organizational documents, each Trustee, officer, employee or other agent of the Trust is indemnified against certain liabilities that may arise out of the performance of their duties to the Funds. Additionally, in the normal course of business, the Funds enter into contracts, including each Fund’s servicing agreements, that contain a variety of indemnification clauses. Each Fund’s maximum exposure under these arrangements is unknown as this would involve future claims that may be made against such Fund that have not yet occurred. The risk of material loss as a result of such indemnification claims is considered remote. |
| H. | Securities Lending – Each Fund may lend portfolio securities having a market value up to one-third of each Fund’s total assets. Such loans are secured by collateral equal to no less than the market value of the loaned securities determined daily by the securities lending provider. Such collateral will be cash or debt securities issued or guaranteed by the U.S. Government or any of its sponsored agencies. Cash collateral received in connection with these loans is invested in short-term money market instruments or affiliated, unregistered investment companies that comply with Rule 2a-7 under the 1940 Act and money market funds (collectively, “affiliated money market funds”) and is shown as such on the Schedules of Investments. Each Fund bears the risk of loss with respect to the investment of collateral. It is the policy of these Funds to obtain additional collateral from or return excess collateral to the borrower by the end of the next business day, following the valuation date of the securities loaned. Therefore, the value of the collateral held may be temporarily less than the value of the securities on loan. When loaning securities, each Fund retains certain benefits of owning the securities, including the economic equivalent of dividends or interest generated by the security. Lending securities entails a risk of loss to each Fund if, and to the extent that, the market value of the securities loaned were to increase and the borrower did not increase the collateral accordingly, and the borrower failed to return the securities. The securities loaned are subject to termination at the option of the borrower or each Fund. Upon termination, the borrower will return to each Fund the securities loaned and each Fund will return the collateral. Upon the failure of the borrower to return the securities, collateral may be liquidated and the securities may be purchased on the open market to replace the loaned securities. Each Fund could experience delays and costs in gaining access to the collateral and the securities may lose value during the delay which could result in potential losses to each Fund. Some of these losses may be indemnified by the lending agent. Each Fund bears the risk of any deficiency in the amount of the collateral available for return to the borrower due to any loss on the collateral invested. Dividends received on cash collateral investments for securities lending transactions, which are net of compensation to counterparties, are included in Securities lending income on the Statements of Operations. The aggregate value of securities out on loan, if any, is shown as a footnote on the Statements of Assets and Liabilities. |
The Adviser serves as an affiliated securities lending agent for each Fund. The Bank of New York Mellon also serves as a lending agent. To the extent each Fund utilizes the Adviser as an affiliated securities lending agent, each Fund conducts its securities lending in accordance with, and in reliance upon, no-action letters issued by the SEC staff that provide guidance on how an affiliate may act as a direct agent lender and receive compensation for those services in a manner consistent with the federal securities laws. For the year ended December 31, 2022, fees paid to the Adviser were less than $500 for each Fund, except for Invesco Peak RetirementTM 2040 Fund and Invesco Peak RetirementTM 2065 Fund. Invesco Peak RetirementTM 2040 Fund and Invesco Peak RetirementTM 2065 Fund had no securities lending transactions with the Adviser. Fees paid to the Adviser for securities lending agent services, if any, are included in Securities lending income on the Statement of Operations.
| I. | COVID-19 Risk – The COVID-19 strain of coronavirus has resulted in instances of market closures and dislocations, extreme volatility, liquidity constraints and increased trading costs. Efforts to contain its spread have resulted in travel restrictions, disruptions of healthcare systems, business operations (including business closures) and supply chains, layoffs, lower consumer demand and employee availability, and defaults and credit downgrades, among other significant economic impacts that have disrupted global economic activity across many industries. Such economic impacts may exacerbate other pre-existing political, social and economic risks locally or globally and cause general concern and uncertainty. The full economic impact and ongoing effects of COVID-19 (or other future epidemics or pandemics) at the macro-level and on individual businesses are unpredictable and may result in significant and prolonged effects on the Funds’ performance. |
| J. | Other Risks – Certain of the underlying funds are non-diversified and can invest a greater portion of their assets in the obligations or securities of a small number of issuers or any single issuer than a diversified fund can. A change in the value of one or a few issuers’ securities will therefore affect the value of an underlying fund more than would occur in a diversified fund. |
Investments in ETFs generally present the same primary risks as an investment in a conventional mutual fund that has the same investment objective, strategy and policies. Investments in ETFs further involve the same risks associated with a direct investment in the types of securities, commodities and/or currencies included in the indices the ETFs are designed to replicate. In addition, shares of an ETF may trade at a market price that is higher or lower than their net asset value and an active trading market in such shares may not develop or continue. Moreover, trading of an ETF’s shares may be halted if the listing exchange’s officials deem such action to be appropriate, the shares are de-listed from the exchange, or the activation of market-wide “circuit breakers” (which are tied to large decreases in stock prices) halts stock trading generally.
NOTE 2–Advisory Fees and Other Fees Paid to Affiliates
The Trust has entered into a master investment advisory agreement with Invesco. Under the terms of the investment advisory agreement, the Funds do not pay an advisory fee. However, each Fund pays advisory fees to Invesco indirectly as a shareholder of the underlying funds.
| 102 | Invesco Peak Retirement™ Funds |
Under the terms of a master sub-advisory agreement between the Adviser and each of Invesco Asset Management Deutschland GmbH, Invesco Asset Management Limited, Invesco Asset Management (Japan) Limited, Invesco Hong Kong Limited, Invesco Senior Secured Management, Inc. and Invesco Canada Ltd. and separate sub-advisory agreements with Invesco Capital Management LLC and Invesco Asset Management (India) Private Limited (collectively, the “Affiliated Sub-Advisers”) the Adviser, not the Funds, will pay 40% of the fees paid to the Adviser to any such Affiliated Sub-Adviser(s) that provide(s) discretionary investment management services to the Funds based on the percentage of assets allocated to such Affiliated Sub-Adviser(s).
Invesco has contractually agreed, through at least April 30, 2023, to reimburse expenses to the extent necessary to limit total annual fund operating expenses after expense reimbursement (including estimated prior fiscal year-end Acquired Fund Fees and Expenses and excluding certain items discussed below) of Class A, Class C, Class R, Class Y, Class R5 and Class R6 shares for each Fund as shown in the following table (the “expense limits”):
| Class A | Class C | Class R | Class Y | Class R5 | Class R6 | Acquired Fund Fees and Expenses | ||||||||
Invesco Peak Retirement™ Destination Fund | 0.74% | 1.49% | 0.99% | 0.49% | 0.49% | 0.49% | 0.42% | |||||||
Invesco Peak Retirement™ 2010 Fund | 0.74% | 1.49% | 0.99% | 0.49% | 0.49% | 0.49% | 0.41% | |||||||
Invesco Peak Retirement™ 2015 Fund | 0.74% | 1.49% | 0.99% | 0.49% | 0.49% | 0.49% | 0.42% | |||||||
Invesco Peak Retirement™ 2020 Fund | 0.74% | 1.49% | 0.99% | 0.49% | 0.49% | 0.49% | 0.42% | |||||||
Invesco Peak Retirement™ 2025 Fund | 0.74% | 1.49% | 0.99% | 0.49% | 0.49% | 0.49% | 0.43% | |||||||
Invesco Peak Retirement™ 2030 Fund | 0.74% | 1.49% | 0.99% | 0.49% | 0.49% | 0.49% | 0.43% | |||||||
Invesco Peak Retirement™ 2035 Fund | 0.74% | 1.49% | 0.99% | 0.49% | 0.49% | 0.49% | 0.43% | |||||||
Invesco Peak Retirement™ 2040 Fund | 0.74% | 1.49% | 0.99% | 0.49% | 0.49% | 0.49% | 0.41% | |||||||
Invesco Peak Retirement™ 2045 Fund | 0.74% | 1.49% | 0.99% | 0.49% | 0.49% | 0.49% | 0.40% | |||||||
Invesco Peak Retirement™ 2050 Fund | 0.74% | 1.49% | 0.99% | 0.49% | 0.49% | 0.49% | 0.40% | |||||||
Invesco Peak Retirement™ 2055 Fund | 0.74% | 1.49% | 0.99% | 0.49% | 0.49% | 0.49% | 0.39% | |||||||
Invesco Peak Retirement™ 2060 Fund | 0.74% | 1.49% | 0.99% | 0.49% | 0.49% | 0.49% | 0.39% | |||||||
Invesco Peak Retirement™ 2065 Fund | 0.74% | 1.49% | 0.99% | 0.49% | 0.49% | 0.49% | 0.39% |
In determining Invesco’s obligation to reimburse expenses, the following expenses are not taken into account, and could cause the total annual fund operating expenses after expense reimbursement to exceed the numbers reflected above: (1) interest; (2) taxes; (3) dividend expense on short sales; (4) extraordinary or non-routine items, including litigation expenses; and (5) expenses that the Funds have incurred but did not actually pay because of an expense offset arrangement. Acquired Fund Fees and Expenses are not operating expenses of a Fund directly, but are fees and expenses, including management fees of the investment companies in which a Fund invests. As a result, the total annual fund operating expenses after expense reimbursement may exceed the expense limits above. Unless Invesco continues each Fund’s expense reimbursement agreement, it will terminate on April 30, 2023. During its term, each expense reimbursement agreement cannot be terminated or amended to increase the expense limits or reduce the expense reimbursement without approval of the Board of Trustees.
For the year ended December 31, 2022, the Adviser reimbursed the following expenses:
| Fund Level | Class A | Class C | Class R | Class Y | Class R5 | Class R6 | ||||||||||||||||||||||
Invesco Peak Retirement™ Destination Fund | $ | 169,640 | $ | 3,000 | $ | 70 | $ | 185 | $ | 29 | $35 | $ 64 | ||||||||||||||||
Invesco Peak Retirement™ 2010 Fund | 169,251 | 0 | 0 | 0 | 0 | 3 | 63 | |||||||||||||||||||||
Invesco Peak Retirement™ 2015 Fund | 170,725 | 915 | 168 | 192 | 47 | 34 | 102 | |||||||||||||||||||||
Invesco Peak Retirement™ 2020 Fund | 162,854 | 7,064 | 1,237 | 1,749 | 108 | 50 | 7 | |||||||||||||||||||||
Invesco Peak Retirement™ 2025 Fund | 162,153 | 13,992 | 2,428 | 2,563 | 165 | 3 | 3 | |||||||||||||||||||||
Invesco Peak Retirement™ 2030 Fund | 167,121 | 29,388 | 6,054 | 9,317 | 338 | 3 | 3 | |||||||||||||||||||||
Invesco Peak Retirement™ 2035 Fund | 163,050 | 16,123 | 5,067 | 7,132 | 1,347 | 3 | 3 | |||||||||||||||||||||
Invesco Peak Retirement™ 2040 Fund | 158,928 | 24,825 | 4,844 | 10,327 | 1,207 | 3 | 3 | |||||||||||||||||||||
Invesco Peak Retirement™ 2045 Fund | 162,882 | 12,777 | 4,592 | 6,878 | 342 | 7 | 35 | |||||||||||||||||||||
Invesco Peak Retirement™ 2050 Fund | 161,867 | 26,576 | 7,128 | 11,687 | 587 | 46 | 54 | |||||||||||||||||||||
Invesco Peak Retirement™ 2055 Fund | 162,405 | 12,808 | 3,579 | 5,720 | 266 | 41 | 108 | |||||||||||||||||||||
Invesco Peak Retirement™ 2060 Fund | 163,217 | 13,827 | 2,342 | 7,317 | 437 | 42 | 102 | |||||||||||||||||||||
Invesco Peak Retirement™ 2065 Fund | 163,433 | 13,432 | 3,025 | 3,179 | 1,290 | 38 | 94 | |||||||||||||||||||||
The Trust has entered into a master administrative services agreement with Invesco pursuant to which each Fund has agreed to pay Invesco for certain administrative costs incurred in providing accounting services to such Fund. For the year ended December 31, 2022, expenses incurred under the agreement are shown in the Statements of Operations as Administrative services fees. Also, Invesco has entered into a sub-administration agreement whereby State Street Bank and Trust Company (“SSB”) serves as custodian and fund accountant and provides certain administrative services to the Funds.
The Trust has entered into a transfer agency and service agreement with Invesco Investment Services, Inc. (“IIS”) pursuant to which each Fund has agreed to pay IIS a fee for providing transfer agency and shareholder services to such Fund. For the year ended December 31, 2022, expenses incurred under the agreement are shown in the Statements of Operations as Transfer agent fees.
| 103 | Invesco Peak Retirement™ Funds |
The Trust has entered into master distribution agreements with Invesco Distributors, Inc. (“IDI”) to serve as the distributor for the Class A, Class C, Class R, Class Y, Class R5 and Class R6 shares of each Fund. The Trust has adopted plans pursuant to Rule 12b-1 under the 1940 Act with respect to each Fund’s Class A, Class C and Class R shares (collectively, the “Plans”). Each Fund, pursuant to the Plans, pays IDI compensation at the annual rate of 0.25% of each Fund’s average daily net assets of Class A shares, 1.00% of the average daily net assets of Class C shares and 0.50% of the average daily net assets of Class R shares. The fees are accrued daily and paid monthly. Of the Plan payments, up to 0.25% of the average daily net assets of each class of shares may be paid to furnish continuing personal shareholder services to customers who purchase and own shares of such classes. Any amounts not paid as a service fee under the Plans would constitute an asset-based sales charge. Rules of the Financial Industry Regulatory Authority (“FINRA”) impose a cap on the total sales charges, including asset-based sales charges, that may be paid by any class of shares of each Fund. For the year ended December 31, 2022, expenses incurred under the Plans are shown in the Statements of Operations as Distribution fees.
Front-end sales commissions and CDSC (collectively, the “sales charges”) are not recorded as expenses of the Funds. Front-end sales commissions are deducted from proceeds from the sales of each Fund’s shares prior to investment in Class A shares of the Funds. CDSC are deducted from redemption proceeds prior to remittance to the shareholder. During the year ended December 31, 2022, IDI advised the Funds that IDI retained the following front-end sales commissions from the sale of Class A shares and received the following in CDSC imposed on redemptions by shareholders:
| Front End Sales Charge | Contingent Deferred Sales Charge | |||||||||
| Class A | Class C | |||||||||
Invesco Peak Retirement™ Destination Fund | $ 5,049 | $0 | $ 0 | |||||||
Invesco Peak Retirement™ 2015 Fund | 488 | 0 | 0 | |||||||
Invesco Peak Retirement™ 2020 Fund | 1,125 | 0 | 0 | |||||||
Invesco Peak Retirement™ 2025 Fund | 7,727 | 0 | 2 | |||||||
Invesco Peak Retirement™ 2030 Fund | 25,427 | 0 | 170 | |||||||
Invesco Peak Retirement™ 2035 Fund | 21,169 | 0 | 56 | |||||||
Invesco Peak Retirement™ 2040 Fund | 28,973 | 0 | 0 | |||||||
Invesco Peak Retirement™ 2045 Fund | 16,210 | 0 | 0 | |||||||
Invesco Peak Retirement™ 2050 Fund | 23,906 | 0 | 41 | |||||||
Invesco Peak Retirement™ 2055 Fund | 15,269 | 0 | 0 | |||||||
Invesco Peak Retirement™ 2060 Fund | 12,108 | 0 | 0 | |||||||
Invesco Peak Retirement™ 2065 Fund | 10,277 | 0 | 6 | |||||||
The underlying Invesco Funds pay no distribution fees for Class R6 shares and the Funds pay no sales loads or other similar compensation to IDI for acquiring underlying fund shares.
Certain officers and trustees of the Trust are officers and directors of the Adviser, IIS and/or IDI.
NOTE 3–Additional Valuation Information
GAAP defines fair value as the price that would be received to sell an asset or paid to transfer a liability in an orderly transaction between market participants at the measurement date, under current market conditions. GAAP establishes a hierarchy that prioritizes the inputs to valuation methods, giving the highest priority to readily available unadjusted quoted prices in an active market for identical assets (Level 1) and the lowest priority to significant unobservable inputs (Level 3), generally when market prices are not readily available. Based on the valuation inputs, the securities or other investments are tiered into one of three levels. Changes in valuation methods may result in transfers in or out of an investment’s assigned level:
| Level 1 – | Prices are determined using quoted prices in an active market for identical assets. | |
| Level 2 – | Prices are determined using other significant observable inputs. Observable inputs are inputs that other market participants may use in pricing a security. These may include quoted prices for similar securities, interest rates, prepayment speeds, credit risk, yield curves, loss severities, default rates, discount rates, volatilities and others. | |
| Level 3 – | Prices are determined using significant unobservable inputs. In situations where quoted prices or observable inputs are unavailable (for example, when there is little or no market activity for an investment at the end of the period), unobservable inputs may be used. Unobservable inputs reflect the Adviser’s assumptions about the factors market participants would use in determining fair value of the securities or instruments and would be based on the best available information. |
As of December 31, 2022, all of the securities in this Fund were valued based on Level 1 inputs (see the Schedule of Investments for security categories). The level assigned to the securities valuations may not be an indication of the risk or liquidity associated with investing in those securities. Because of the inherent uncertainties of valuation, the values reflected in the financial statements may materially differ from the value received upon actual sale of those investments.
| 104 | Invesco Peak Retirement™ Funds |
NOTE 4–Expense Offset Arrangement(s)
The expense offset arrangements are comprised of transfer agency credits which result from balances in demand deposit accounts used by the transfer agent for clearing shareholder transactions. For the year ended December 31, 2022, the Funds received credits from these arrangements, which resulted in the reduction of the Funds’ total expenses of:
| Transfer Agent Credits | ||
Invesco Peak Retirement™ Destination Fund | $ 0 | |
Invesco Peak Retirement™ 2010 Fund | 0 | |
Invesco Peak Retirement™ 2015 Fund | 0 | |
Invesco Peak Retirement™ 2020 Fund | 103 | |
Invesco Peak Retirement™ 2025 Fund | 306 | |
Invesco Peak Retirement™ 2030 Fund | 662 | |
Invesco Peak Retirement™ 2035 Fund | 565 | |
Invesco Peak Retirement™ 2040 Fund | 755 | |
Invesco Peak Retirement™ 2045 Fund | 529 | |
Invesco Peak Retirement™ 2050 Fund | 828 | |
Invesco Peak Retirement™ 2055 Fund | 508 | |
Invesco Peak Retirement™ 2060 Fund | 572 | |
Invesco Peak Retirement™ 2065 Fund | 497 |
NOTE 5–Trustees’ and Officers’ Fees and Benefits
Trustees’ and Officers’ Fees and Benefits include amounts accrued by each Fund to pay remuneration to certain Trustees and Officers of such Fund. Trustees have the option to defer compensation payable by the Funds, and Trustees’ and Officers’ Fees and Benefits also include amounts accrued by each Fund to fund such deferred compensation amounts. Those Trustees who defer compensation have the option to select various Invesco Funds in which their deferral accounts shall be deemed to be invested. Obligations under the deferred compensation plans represent unsecured claims against the general assets of the Funds.
NOTE 6–Cash Balances
The Funds are permitted to temporarily carry a negative or overdrawn balance in their account with SSB, the custodian bank. Such balances, if any at period-end, are shown in the Statements of Assets and Liabilities under the payable caption Amount due custodian. To compensate the custodian bank for such overdrafts, the overdrawn Fund may either (1) leave funds as a compensating balance in the account so the custodian bank can be compensated by earning the additional interest; or (2) compensate by paying the custodian bank at a rate agreed upon by the custodian bank and Invesco, not to exceed the contractually agreed upon rate. The Funds may not purchase additional securities when any borrowings from banks or broker-dealers exceed 5% of the Funds’ total assets, or when any borrowings from an Invesco Fund are outstanding.
NOTE 7–Distributions to Shareholders and Tax Components of Net Assets
Tax Character of Distributions to Shareholders Paid During the Fiscal Years Ended December 31, 2022 and 2021:
| December 31, 2022 | December 31, 2021 | |||||||||||||||||||||||||||
| Ordinary income* | Long-term capital gains | Return of capital | Total distributions | Ordinary Income | Long-Term Capital Gains | Total distributions | ||||||||||||||||||||||
Invesco Peak Retirement™ Destination Fund | $166,404 | $ 23,016 | $11,411 | $ 200,831 | $122,682 | $ 24,041 | $ 146,723 | |||||||||||||||||||||
Invesco Peak Retirement™ 2010 Fund | 26,157 | 434 | 662 | 27,253 | 8,633 | 372 | 9,005 | |||||||||||||||||||||
Invesco Peak Retirement™ 2015 Fund | 50,453 | 2,865 | – | 53,318 | 46,261 | 33,005 | 79,266 | |||||||||||||||||||||
Invesco Peak Retirement™ 2020 Fund | 270,750 | 122,029 | 5,358 | 398,137 | 237,109 | 64,047 | 301,156 | |||||||||||||||||||||
Invesco Peak Retirement™ 2025 Fund | 335,146 | 309,002 | – | 644,148 | 534,139 | 202,185 | 736,324 | |||||||||||||||||||||
Invesco Peak Retirement™ 2030 Fund | 503,975 | 531,978 | – | 1,035,953 | 750,392 | 253,205 | 1,003,597 | |||||||||||||||||||||
Invesco Peak Retirement™ 2035 Fund | 252,334 | 364,400 | – | 616,734 | 324,018 | 82,118 | 406,136 | |||||||||||||||||||||
Invesco Peak Retirement™ 2040 Fund | 281,180 | 466,826 | – | 748,006 | 350,263 | 265,728 | 615,991 | |||||||||||||||||||||
Invesco Peak Retirement™ 2045 Fund | 104,384 | 273,617 | – | 378,001 | 156,127 | 423,017 | 579,144 | |||||||||||||||||||||
Invesco Peak Retirement™ 2050 Fund | 203,261 | 483,352 | – | 686,613 | 205,143 | 4,793 | 209,936 | |||||||||||||||||||||
Invesco Peak Retirement™ 2055 Fund | 61,532 | 189,724 | – | 251,256 | 74,041 | 42,002 | 116,043 | |||||||||||||||||||||
Invesco Peak Retirement™ 2060 Fund | 87,949 | 173,185 | – | 261,134 | 79,081 | – | 79,081 | |||||||||||||||||||||
Invesco Peak Retirement™ 2065 Fund | 51,808 | 192,322 | – | 244,130 | 87,074 | 35,032 | 122,106 | |||||||||||||||||||||
| * | Includes short-term capital gain distributions, if any. |
| 105 | Invesco Peak Retirement™ Funds |
Tax Components of Net Assets at Period-End:
| Undistributed Ordinary Income | Net unrealized Appreciation (Depreciation) - Investments | Temporary Book/Tax Differences | Capital Loss Carryforward | Shares of Beneficial Interest | Total Net Assets | |||||||||||||||||||||||
Invesco Peak Retirement™ Destination Fund | $ – | $ (38 | ) | $(12,530 | ) | $ (517,138 | ) | $ 3,704,314 | $ 3,174,608 | |||||||||||||||||||
Invesco Peak Retirement™ 2010 Fund | – | 2 | (7,147 | ) | (85,658 | ) | 467,427 | 374,624 | ||||||||||||||||||||
Invesco Peak Retirement™ 2015 Fund | 2,292 | (15 | ) | (12,314 | ) | (161,737 | ) | 1,120,693 | 948,919 | |||||||||||||||||||
Invesco Peak Retirement™ 2020 Fund | – | (43,510 | ) | (12,669 | ) | (1,219,522 | ) | 6,960,420 | 5,684,719 | |||||||||||||||||||
Invesco Peak Retirement™ 2025 Fund | 139,360 | (99,307 | ) | (12,710 | ) | (2,795,015 | ) | 11,728,469 | 8,960,797 | |||||||||||||||||||
Invesco Peak Retirement™ 2030 Fund | 224,809 | (299,514 | ) | (12,764 | ) | (4,546,154 | ) | 26,510,946 | 21,877,323 | |||||||||||||||||||
Invesco Peak Retirement™ 2035 Fund | 146,574 | (286,271 | ) | (12,705 | ) | (2,449,663 | ) | 17,693,095 | 15,091,030 | |||||||||||||||||||
Invesco Peak Retirement™ 2040 Fund | 116,193 | (327,868 | ) | (12,708 | ) | (2,805,741 | ) | 19,702,357 | 16,672,233 | |||||||||||||||||||
Invesco Peak Retirement™ 2045 Fund | 63,816 | (172,721 | ) | (15,610 | ) | (983,311 | ) | 9,035,579 | 7,927,753 | |||||||||||||||||||
Invesco Peak Retirement™ 2050 Fund | 58,360 | (242,696 | ) | (12,691 | ) | (1,810,025 | ) | 15,641,649 | 13,634,597 | |||||||||||||||||||
Invesco Peak Retirement™ 2055 Fund | 40,658 | (96,261 | ) | (12,647 | ) | (504,695 | ) | 6,092,164 | 5,519,219 | |||||||||||||||||||
Invesco Peak Retirement™ 2060 Fund | 47,413 | (109,402 | ) | (12,658 | ) | (547,439 | ) | 7,190,155 | 6,568,069 | |||||||||||||||||||
Invesco Peak Retirement™ 2065 Fund | 45,073 | (116,081 | ) | (12,635 | ) | (543,331 | ) | 5,651,491 | 5,024,517 | |||||||||||||||||||
The difference between book-basis and tax-basis unrealized appreciation (depreciation) is due to differences in the timing of recognition of gains and losses on investments for tax and book purposes. The Funds’ net unrealized appreciation (depreciation) differences are attributable primarily to wash sales.
The temporary book/tax differences are a result of timing differences between book and tax recognition of income and/or expenses. The Funds’ temporary book/tax differences are the result of the trustee deferral of compensation and retirement plan benefits.
Capital loss carryforward is calculated and reported as of a specific date. Results of transactions and other activity after that date may affect the amount of capital loss carryforward actually available for the Funds to utilize. The ability to utilize capital loss carryforwards in the future may be limited under the Internal Revenue Code and related regulations based on the results of future transactions.
| 106 | Invesco Peak Retirement™ Funds |
The Fund has a capital loss carryforward as of December 31, 2022, as follows:
Short-Term | Long-Term | ||||||||||||||
| Not subject to | Not subject to | ||||||||||||||
| Fund | Expiration | Expiration | Total* | ||||||||||||
Invesco Peak Retirement™ Destination Fund | $ | 82,408 | $ | 434,730 | $ | 517,138 | |||||||||
Invesco Peak Retirement™ 2010 Fund | 27,978 | 57,680 | 85,658 | ||||||||||||
Invesco Peak Retirement™ 2015 Fund | 26,410 | 135,327 | 161,737 | ||||||||||||
Invesco Peak Retirement™ 2020 Fund | 183,991 | 1,035,531 | 1,219,522 | ||||||||||||
Invesco Peak Retirement™ 2025 Fund | 404,780 | 2,390,235 | 2,795,015 | ||||||||||||
Invesco Peak Retirement™ 2030 Fund | 678,977 | 3,867,177 | 4,546,154 | ||||||||||||
Invesco Peak Retirement™ 2035 Fund | 631,792 | 1,817,871 | 2,449,663 | ||||||||||||
Invesco Peak Retirement™ 2040 Fund | 515,453 | 2,290,288 | 2,805,741 | ||||||||||||
Invesco Peak Retirement™ 2045 Fund | 393,009 | 590,302 | 983,311 | ||||||||||||
Invesco Peak Retirement™ 2050 Fund | 419,670 | 1,390,355 | 1,810,025 | ||||||||||||
Invesco Peak Retirement™ 2055 Fund | 243,385 | 261,310 | 504,695 | ||||||||||||
Invesco Peak Retirement™ 2060 Fund | 213,258 | 334,181 | 547,439 | ||||||||||||
Invesco Peak Retirement™ 2065 Fund | 260,303 | 283,028 | 543,331 | ||||||||||||
| * | Capital loss carryforward as of the date listed above is reduced for limitations, if any, to the extent required by the Internal Revenue Code and may be further limited depending upon a variety of factors, including the realization of net unrealized gains or losses as of the date of any reorganization. |
NOTE 8–Investment Transactions
The aggregate amount of investment securities purchased and sold by each Fund and aggregate cost and the net unrealized appreciation (depreciation) of investments for tax purposes are as follows:
| At December 31, 2022 | ||||||||||||||||||||||||
| For the year ended | Net Unrealized | |||||||||||||||||||||||
| December 31, 2022* | Unrealized | Unrealized | Appreciation | |||||||||||||||||||||
| Purchases | Sales | Federal Tax Cost | Appreciation | (Depreciation) | (Depreciation) | |||||||||||||||||||
| ||||||||||||||||||||||||
Invesco Peak Retirement™ Destination Fund | $ | 1,730,695 | $ | 5,775,511 | $ 3,338,857 | $ | 1 | $ (39 | ) | $ (38 | ) | |||||||||||||
| ||||||||||||||||||||||||
Invesco Peak Retirement™ 2010 Fund | 238,675 | 679,831 | 374,943 | 2 | – | 2 | ||||||||||||||||||
| ||||||||||||||||||||||||
Invesco Peak Retirement™ 2015 Fund | 323,249 | 1,658,552 | 950,478 | 1 | (16 | ) | (15 | ) | ||||||||||||||||
| ||||||||||||||||||||||||
Invesco Peak Retirement™ 2020 Fund | 2,493,968 | 12,302,517 | 5,762,825 | 25 | (43,535 | ) | (43,510 | ) | ||||||||||||||||
| ||||||||||||||||||||||||
Invesco Peak Retirement™ 2025 Fund | 5,588,380 | 24,620,714 | 9,098,665 | 3 | (99,310 | ) | (99,307 | ) | ||||||||||||||||
| ||||||||||||||||||||||||
Invesco Peak Retirement™ 2030 Fund | 9,698,742 | 38,807,500 | 22,328,939 | 36 | (299,550 | ) | (299,514 | ) | ||||||||||||||||
| ||||||||||||||||||||||||
Invesco Peak Retirement™ 2035 Fund | 9,421,531 | 23,996,219 | 15,477,786 | 9 | (286,280 | ) | (286,271 | ) | ||||||||||||||||
| ||||||||||||||||||||||||
Invesco Peak Retirement™ 2040 Fund | 9,084,910 | 26,123,300 | 17,033,649 | 5 | (327,873 | ) | (327,868 | ) | ||||||||||||||||
| ||||||||||||||||||||||||
Invesco Peak Retirement™ 2045 Fund | 5,423,019 | 12,167,941 | 8,085,233 | 13 | (172,734 | ) | (172,721 | ) | ||||||||||||||||
| ||||||||||||||||||||||||
Invesco Peak Retirement™ 2050 Fund | 6,773,525 | 19,190,169 | 13,850,938 | 13 | (242,709 | ) | (242,696 | ) | ||||||||||||||||
| ||||||||||||||||||||||||
Invesco Peak Retirement™ 2055 Fund | 3,297,950 | 7,184,766 | 5,628,660 | 7 | (96,268 | ) | (96,261 | ) | ||||||||||||||||
| ||||||||||||||||||||||||
Invesco Peak Retirement™ 2060 Fund | 2,892,962 | 8,148,807 | 6,680,542 | 7 | (109,409 | ) | (109,402 | ) | ||||||||||||||||
| ||||||||||||||||||||||||
Invesco Peak Retirement™ 2065 Fund | 3,251,779 | 6,992,266 | 5,249,804 | 13 | (116,094 | ) | (116,081 | ) | ||||||||||||||||
| ||||||||||||||||||||||||
| * | Excludes U.S. Treasury obligations and money market funds, if any. |
| 107 | Invesco Peak Retirement™ Funds |
NOTE 9–Reclassification of Permanent Differences
Primarily as a result of differing book/tax treatment of distributions from underlying funds, on December 31, 2022, amounts were reclassified between undistributed net investment income (loss), undistributed net realized gain (loss) and shares of beneficial interest. These reclassifications had no effect on the net assets or the distributable earnings of each Fund.
| Undistributed Net | Undistributed Net | Shares of | |||||||||||||
| Investment Income | Realized Gain (Loss) | Beneficial Interest | |||||||||||||
Invesco Peak Retirement™ Destination Fund | $ | 1,907 | $ | 9,504 | $ | (11,411 | ) | ||||||||
Invesco Peak Retirement™ 2010 Fund | 406 | 256 | (662 | ) | |||||||||||
Invesco Peak Retirement™ 2015 Fund | (622 | ) | 622 | – | |||||||||||
Invesco Peak Retirement™ 2020 Fund | 9,901 | (4,543 | ) | (5,358 | ) | ||||||||||
Invesco Peak Retirement™ 2025 Fund | 26,497 | (26,497 | ) | – | |||||||||||
Invesco Peak Retirement™ 2030 Fund | 78,071 | (78,071 | ) | – | |||||||||||
Invesco Peak Retirement™ 2035 Fund | 62,726 | (62,726 | ) | – | |||||||||||
Invesco Peak Retirement™ 2040 Fund | 72,321 | (72,321 | ) | – | |||||||||||
Invesco Peak Retirement™ 2045 Fund | 31,317 | (31,317 | ) | – | |||||||||||
Invesco Peak Retirement™ 2050 Fund | 50,075 | (50,075 | ) | – | |||||||||||
Invesco Peak Retirement™ 2055 Fund | 19,440 | (19,440 | ) | – | |||||||||||
Invesco Peak Retirement™ 2060 Fund | 20,786 | (20,786 | ) | – | |||||||||||
Invesco Peak Retirement™ 2065 Fund | 17,669 | (17,669 | ) | – | |||||||||||
NOTE 10–Share Information
Invesco Peak Retirement™ Destination Fund
| Summary of Share Activity | ||||||||||||||||||||
| ||||||||||||||||||||
| Year ended | Year ended | |||||||||||||||||||
| December 31, 2022(a) | December 31, 2021 | |||||||||||||||||||
| Shares | Amount | Shares | Amount | |||||||||||||||||
| ||||||||||||||||||||
Sold: | ||||||||||||||||||||
Class A | 155,111 | $ | 1,515,948 | 287,746 | $ | 3,022,564 | ||||||||||||||
| ||||||||||||||||||||
Class C | 586 | 5,813 | 17,345 | 182,670 | ||||||||||||||||
| ||||||||||||||||||||
Class R | 13,698 | 132,902 | 26,283 | 279,655 | ||||||||||||||||
| ||||||||||||||||||||
Issued as reinvestment of dividends: | ||||||||||||||||||||
Class A | 17,759 | 168,188 | 11,422 | 120,511 | ||||||||||||||||
| ||||||||||||||||||||
Class C | 252 | 2,406 | 418 | 4,407 | ||||||||||||||||
| ||||||||||||||||||||
Class R | 1,215 | 11,388 | 393 | 4,155 | ||||||||||||||||
| ||||||||||||||||||||
Automatic conversion of Class C shares to Class A shares: | ||||||||||||||||||||
Class A | 122 | 1,182 | 140 | 1,475 | ||||||||||||||||
| ||||||||||||||||||||
Class C | (122 | ) | (1,182 | ) | (140 | ) | (1,475 | ) | ||||||||||||
| ||||||||||||||||||||
Reacquired: | ||||||||||||||||||||
Class A | (284,340 | ) | (2,671,185 | ) | (89,647 | ) | (944,406 | ) | ||||||||||||
| ||||||||||||||||||||
Class C | (14,912 | ) | (146,318 | ) | (12,482 | ) | (133,416 | ) | ||||||||||||
| ||||||||||||||||||||
Class R | (12,113 | ) | (110,878 | ) | (10,236 | ) | (109,058 | ) | ||||||||||||
| ||||||||||||||||||||
Class R6 | - | - | (11,682 | ) | (125,000 | ) | ||||||||||||||
| ||||||||||||||||||||
Net increase (decrease) in share activity | (122,744 | ) | $ | (1,091,736 | ) | 219,560 | $ | 2,302,082 | ||||||||||||
| ||||||||||||||||||||
| (a) | There is an entity that is a record owner of more than 5% of the outstanding shares of the Fund and owns 10% of the outstanding shares of the Fund. IDI has an agreement with this entity to sell Fund shares. The Fund, Invesco and/or Invesco affiliates may make payments to this entity, which is considered to be related to the Fund, for providing services to the Fund, Invesco and/or Invesco affiliates including but not limited to services such as, securities brokerage, distribution, third party record keeping and account servicing. The Fund has no knowledge as to whether all or any portion of the shares owned of record by this entity are also owned beneficially. |
In addition, 48% of the outstanding shares of the Fund are owned by the Adviser or an affiliate of the Adviser.
| 108 | Invesco Peak Retirement™ Funds |
NOTE 10–Share Information–(continued)
Invesco Peak Retirement™ 2010 Fund
| Summary of Share Activity | ||||||||||||||||||||
| ||||||||||||||||||||
| Year ended | ||||||||||||||||||||
| December 31, 2022(a) | December 31, 2021(b) | |||||||||||||||||||
| Shares | Amount | Shares | Amount | |||||||||||||||||
| ||||||||||||||||||||
Sold: | ||||||||||||||||||||
Class A | 13,876 | $ | 131,303 | 24,639 | $ | 251,624 | ||||||||||||||
| ||||||||||||||||||||
Class C | 1,795 | 17,394 | 2,339 | 23,510 | ||||||||||||||||
| ||||||||||||||||||||
Class R | 6,681 | 61,014 | 1,001 | 10,010 | ||||||||||||||||
| ||||||||||||||||||||
Class Y | - | - | 1,001 | 10,010 | ||||||||||||||||
| ||||||||||||||||||||
Class R5 | - | - | 1,001 | 10,010 | ||||||||||||||||
| ||||||||||||||||||||
Class R6 | - | - | 25,001 | 250,010 | ||||||||||||||||
| ||||||||||||||||||||
Issued as reinvestment of dividends: | ||||||||||||||||||||
Class A | 702 | 5,981 | 382 | 3,830 | ||||||||||||||||
| ||||||||||||||||||||
Class C | 90 | 768 | 17 | 167 | ||||||||||||||||
| ||||||||||||||||||||
Class R | 206 | 1,754 | - | - | ||||||||||||||||
| ||||||||||||||||||||
Reacquired: | ||||||||||||||||||||
Class A | (27,762 | ) | (248,612 | ) | - | - | ||||||||||||||
| ||||||||||||||||||||
Class C | (3,240 | ) | (28,371 | ) | - | - | ||||||||||||||
| ||||||||||||||||||||
Class R | (3,538 | ) | (31,811 | ) | - | - | ||||||||||||||
| ||||||||||||||||||||
Net increase (decrease) in share activity | (11,190 | ) | $ | (90,580 | ) | 55,381 | $ | 559,171 | ||||||||||||
| ||||||||||||||||||||
| (a) | There is an entity that is a record owner of more than 5% of the outstanding shares of the Fund and owns 8% of the outstanding shares of the Fund. IDI has an agreement with this entity to sell Fund shares. The Fund, Invesco and/or Invesco affiliates may make payments to this entity, which is considered to be related to the Fund, for providing services to the Fund, Invesco and/or Invesco affiliates including but not limited to services such as, securities brokerage, distribution, third party record keeping and account servicing. The Fund has no knowledge as to whether all or any portion of the shares owned of record by this entity are also owned beneficially. |
In addition, 88% of the outstanding shares of the Fund are owned by the Adviser or an affiliate of the Adviser.
| (b) | Commencement date of April 30, 2021. |
Invesco Peak Retirement™ 2015 Fund
| Summary of Share Activity | ||||||||||||||||||||
| ||||||||||||||||||||
| Year ended | Year ended | |||||||||||||||||||
| December 31, 2022(a) | December 31, 2021 | |||||||||||||||||||
| Shares | Amount | Shares | Amount | |||||||||||||||||
| ||||||||||||||||||||
Sold: | ||||||||||||||||||||
Class A | 24,867 | $ | 248,478 | 68,043 | $ | 741,763 | ||||||||||||||
| ||||||||||||||||||||
Class C | 5,441 | 56,338 | 28,190 | 306,720 | ||||||||||||||||
| ||||||||||||||||||||
Class R | 2,626 | 26,036 | 8,835 | 95,776 | ||||||||||||||||
| ||||||||||||||||||||
Issued as reinvestment of dividends: | ||||||||||||||||||||
Class A | 1,919 | 17,465 | 3,852 | 40,643 | ||||||||||||||||
| ||||||||||||||||||||
Class C | 181 | 1,658 | 364 | 3,821 | ||||||||||||||||
| ||||||||||||||||||||
Class R | 840 | 7,634 | 646 | 6,798 | ||||||||||||||||
| ||||||||||||||||||||
Automatic conversion of Class C shares to Class A shares: | ||||||||||||||||||||
Class A | - | - | 922 | 10,261 | ||||||||||||||||
| ||||||||||||||||||||
Class C | - | - | (934 | ) | (10,261 | ) | ||||||||||||||
| ||||||||||||||||||||
Reacquired: | ||||||||||||||||||||
Class A | (68,823 | ) | (668,760 | ) | (39,940 | ) | (438,564 | ) | ||||||||||||
| ||||||||||||||||||||
Class C | (16,755 | ) | (154,629 | ) | (20,185 | ) | (220,427 | ) | ||||||||||||
| ||||||||||||||||||||
Class R | (156 | ) | (1,535 | ) | (6,320 | ) | (69,319 | ) | ||||||||||||
| ||||||||||||||||||||
Net increase (decrease) in share activity | (49,860 | ) | $ | (467,315 | ) | 43,473 | $ | 467,211 | ||||||||||||
| ||||||||||||||||||||
| (a) | There is an entity that is a record owner of more than 5% of the outstanding shares of the Fund and owns 15% of the outstanding shares of the Fund. IDI has an agreement with this entity to sell Fund shares. The Fund, Invesco and/or Invesco affiliates may make payments to this entity, which is considered to be related to the Fund, for providing services to the Fund, Invesco and/or Invesco affiliates including but not limited to services such as, securities brokerage, distribution, third party record keeping and account servicing. The Fund has no knowledge as to whether all or any portion of the shares owned of record by this entity are also owned beneficially. |
In addition, 67% of the outstanding shares of the Fund are owned by the Adviser or an affiliate of the Adviser.
| 109 | Invesco Peak Retirement™ Funds |
NOTE 10–Share Information–(continued)
Invesco Peak Retirement™ 2020 Fund
| Summary of Share Activity | ||||||||||||||||||||
| ||||||||||||||||||||
| Year ended | Year ended | |||||||||||||||||||
| December 31, 2022(a) | December 31, 2021 | |||||||||||||||||||
| Shares | Amount | Shares | Amount | |||||||||||||||||
| ||||||||||||||||||||
Sold: | ||||||||||||||||||||
Class A | 157,190 | $ | 1,696,690 | 533,426 | $ | 6,043,745 | ||||||||||||||
| ||||||||||||||||||||
Class C | 13,482 | 138,214 | 95,057 | 1,045,403 | ||||||||||||||||
| ||||||||||||||||||||
Class R | 49,372 | 520,076 | 150,317 | 1,678,241 | ||||||||||||||||
| ||||||||||||||||||||
Class Y | 810 | 8,853 | 1,537 | 17,035 | ||||||||||||||||
| ||||||||||||||||||||
Issued as reinvestment of dividends: | ||||||||||||||||||||
Class A | 30,373 | 288,236 | 18,786 | 213,028 | ||||||||||||||||
| ||||||||||||||||||||
Class C | 2,314 | 22,030 | 2,810 | 31,667 | ||||||||||||||||
| ||||||||||||||||||||
Class R | 6,645 | 62,996 | 4,331 | 48,983 | ||||||||||||||||
| ||||||||||||||||||||
Class Y | 363 | 3,464 | 172 | 1,961 | ||||||||||||||||
| ||||||||||||||||||||
Automatic conversion of Class C shares to Class A shares: | ||||||||||||||||||||
Class A | 6,517 | 68,075 | 7,661 | 87,768 | ||||||||||||||||
| ||||||||||||||||||||
Class C | (6,579 | ) | (68,075 | ) | (7,740 | ) | (87,768 | ) | ||||||||||||
| ||||||||||||||||||||
Reacquired: | ||||||||||||||||||||
Class A | (519,267 | ) | (5,282,528 | ) | (104,276 | ) | (1,199,536 | ) | ||||||||||||
| ||||||||||||||||||||
Class C | (107,767 | ) | (1,089,340 | ) | (26,453 | ) | (301,953 | ) | ||||||||||||
| ||||||||||||||||||||
Class R | (129,429 | ) | (1,327,022 | ) | (64,204 | ) | (734,716 | ) | ||||||||||||
| ||||||||||||||||||||
Class Y | (1,540 | ) | (14,922 | ) | - | - | ||||||||||||||
| ||||||||||||||||||||
Class R6 | - | - | (28,737 | ) | (342,261 | ) | ||||||||||||||
| ||||||||||||||||||||
Net increase (decrease) in share activity | (497,516 | ) | $ | (4,973,253 | ) | 582,687 | $ | 6,501,597 | ||||||||||||
| ||||||||||||||||||||
| (a) | There are entities that are record owners of more than 5% of the outstanding shares of the Fund and in the aggregate own 10% of the outstanding shares of the Fund. IDI has an agreement with these entities to sell Fund shares. The Fund, Invesco and/or Invesco affiliates may make payments to these entities, which are considered to be related to the Fund, for providing services to the Fund, Invesco and/or Invesco affiliates including but not limited to services such as securities brokerage, distribution, third party record keeping and account servicing. The Fund has no knowledge as to whether all or any portion of the shares owned of record by these entities are also owned beneficially. |
In addition, 33% of the outstanding shares of the Fund are owned by the Adviser or an affiliate of the Adviser.
Invesco Peak Retirement™ 2025 Fund
| Summary of Share Activity | ||||||||||||||||||||
| ||||||||||||||||||||
| Year ended | Year ended | |||||||||||||||||||
| December 31, 2022(a) | December 31, 2021 | |||||||||||||||||||
| Shares | Amount | Shares | Amount | |||||||||||||||||
| ||||||||||||||||||||
Sold: | ||||||||||||||||||||
Class A | 292,427 | $ | 3,164,482 | 936,855 | $ | 11,027,656 | ||||||||||||||
| ||||||||||||||||||||
Class C | 131,906 | 1,417,043 | 126,798 | 1,468,708 | ||||||||||||||||
| ||||||||||||||||||||
Class R | 154,762 | 1,616,807 | 104,175 | 1,229,086 | ||||||||||||||||
| ||||||||||||||||||||
Class Y | 13,931 | 140,906 | 8,957 | 105,146 | ||||||||||||||||
| ||||||||||||||||||||
Issued as reinvestment of dividends: | ||||||||||||||||||||
Class A | 41,427 | 397,281 | 49,245 | 579,616 | ||||||||||||||||
| ||||||||||||||||||||
Class C | 8,801 | 83,786 | 5,802 | 67,418 | ||||||||||||||||
| ||||||||||||||||||||
Class R | 10,931 | 104,720 | 6,620 | 77,655 | ||||||||||||||||
| ||||||||||||||||||||
Class Y | 1,180 | 11,354 | 441 | 5,210 | ||||||||||||||||
| ||||||||||||||||||||
Automatic conversion of Class C shares to Class A shares: | ||||||||||||||||||||
Class A | 17,354 | 184,516 | 15,320 | 182,337 | ||||||||||||||||
| ||||||||||||||||||||
Class C | (17,616 | ) | (184,516 | ) | (15,558 | ) | (182,337 | ) | ||||||||||||
| ||||||||||||||||||||
| 110 | Invesco Peak Retirement™ Funds |
NOTE 10–Share Information–(continued)
| Summary of Share Activity | ||||||||||||||||||||
| ||||||||||||||||||||
| Year ended | Year ended | |||||||||||||||||||
| December 31, 2022(a) | December 31, 2021 | |||||||||||||||||||
| Shares | Amount | Shares | Amount | |||||||||||||||||
| ||||||||||||||||||||
Reacquired: | ||||||||||||||||||||
Class A | (1,297,701 | ) | $ | (13,174,260 | ) | (244,578 | ) | $ | (2,904,205 | ) | ||||||||||
| ||||||||||||||||||||
Class C | (219,830 | ) | (2,196,663 | ) | (62,282 | ) | (733,259 | ) | ||||||||||||
| ||||||||||||||||||||
Class R | (253,152 | ) | (2,539,652 | ) | (2,687 | ) | (31,894 | ) | ||||||||||||
Class Y | (9,521 | ) | (97,212 | ) | (4,341 | ) | (52,261 | ) | ||||||||||||
| ||||||||||||||||||||
Class R5 | - | - | (961 | ) | (11,500 | ) | ||||||||||||||
| ||||||||||||||||||||
Class R6 | - | - | (20,133 | ) | (241,000 | ) | ||||||||||||||
| ||||||||||||||||||||
Net increase (decrease) in share activity | (1,125,101 | ) | $ | (11,071,408 | ) | 903,673 | $ | 10,586,376 | ||||||||||||
| ||||||||||||||||||||
| (a) | There is an entity that is a record owner of more than 5% of the outstanding shares of the Fund and owns 8% of the outstanding shares of the Fund. IDI has an agreement with this entity to sell Fund shares. The Fund, Invesco and/or Invesco affiliates may make payments to this entity, which is considered to be related to the Fund, for providing services to the Fund, Invesco and/or Invesco affiliates including but not limited to services such as, securities brokerage, distribution, third party record keeping and account servicing. The Fund has no knowledge as to whether all or any portion of the shares owned of record by this entity are also owned beneficially. |
In addition, 8% of the outstanding shares of the Fund are owned by the Adviser or an affiliate of the Adviser.
Invesco Peak Retirement™ 2030 Fund
| Summary of Share Activity | ||||||||||||||||||||
| ||||||||||||||||||||
| Year ended | Year ended | |||||||||||||||||||
| December 31, 2022(a) | December 31, 2021 | |||||||||||||||||||
| Shares | Amount | Shares | Amount | |||||||||||||||||
| ||||||||||||||||||||
Sold: | ||||||||||||||||||||
Class A | 654,263 | $ | 7,011,780 | 1,267,273 | $ | 15,024,463 | ||||||||||||||
| ||||||||||||||||||||
Class C | 147,203 | 1,553,988 | 374,875 | 4,380,285 | ||||||||||||||||
| ||||||||||||||||||||
Class R | 248,808 | 2,670,602 | 463,758 | 5,448,870 | ||||||||||||||||
| ||||||||||||||||||||
Class Y | 2,376 | 25,304 | 12,218 | 144,818 | ||||||||||||||||
| ||||||||||||||||||||
Issued as reinvestment of dividends: | ||||||||||||||||||||
Class A | 71,399 | 706,854 | 56,690 | 684,250 | ||||||||||||||||
| ||||||||||||||||||||
Class C | 11,458 | 112,628 | 9,462 | 112,977 | ||||||||||||||||
| ||||||||||||||||||||
Class R | 18,467 | 182,268 | 16,234 | 195,139 | ||||||||||||||||
| ||||||||||||||||||||
Class Y | 1,179 | 11,716 | 707 | 8,575 | ||||||||||||||||
| ||||||||||||||||||||
Automatic conversion of Class C shares to Class A shares: | ||||||||||||||||||||
Class A | 29,661 | 313,177 | 18,599 | 226,201 | ||||||||||||||||
| ||||||||||||||||||||
Class C | (30,103 | ) | (313,177 | ) | (18,844 | ) | (226,201 | ) | ||||||||||||
| ||||||||||||||||||||
Reacquired: | ||||||||||||||||||||
Class A | (1,405,128 | ) | (14,468,859 | ) | (457,395 | ) | (5,438,375 | ) | ||||||||||||
| ||||||||||||||||||||
Class C | (267,605 | ) | (2,705,415 | ) | (84,561 | ) | (1,005,501 | ) | ||||||||||||
| ||||||||||||||||||||
Class R | (517,261 | ) | (5,275,064 | ) | (35,907 | ) | (431,882 | ) | ||||||||||||
| ||||||||||||||||||||
Class Y | (17,042 | ) | (169,725 | ) | (77 | ) | (935 | ) | ||||||||||||
| ||||||||||||||||||||
Class R5 | - | - | (1,079 | ) | (13,200 | ) | ||||||||||||||
| ||||||||||||||||||||
Class R6 | - | - | (20,262 | ) | (247,800 | ) | ||||||||||||||
| ||||||||||||||||||||
Net increase (decrease) in share activity | (1,052,325 | ) | $ | (10,343,923 | ) | 1,601,691 | $ | 18,861,684 | ||||||||||||
| ||||||||||||||||||||
| (a) | 4% of the outstanding shares of the Fund are owned by the Adviser or an affiliate of the Adviser. |
| 111 | Invesco Peak Retirement™ Funds |
NOTE 10–Share Information–(continued)
Invesco Peak Retirement™ 2035 Fund
| Summary of Share Activity | ||||||||||||||||||||
| ||||||||||||||||||||
| Year ended | Year ended | |||||||||||||||||||
| December 31, 2022 | December 31, 2021 | |||||||||||||||||||
| Shares | Amount | Shares | Amount | |||||||||||||||||
| ||||||||||||||||||||
Sold: | ||||||||||||||||||||
Class A | 440,875 | $ | 4,909,591 | 610,463 | $ | 7,484,095 | ||||||||||||||
| ||||||||||||||||||||
Class C | 156,107 | 1,688,582 | 126,124 | 1,545,591 | ||||||||||||||||
| ||||||||||||||||||||
Class R | 253,240 | 2,803,467 | 239,264 | 2,971,399 | ||||||||||||||||
| ||||||||||||||||||||
Class Y | 26,313 | 289,585 | 16,994 | 208,177 | ||||||||||||||||
| ||||||||||||||||||||
Issued as reinvestment of dividends: | ||||||||||||||||||||
Class A | 31,808 | 323,808 | 19,092 | 238,266 | ||||||||||||||||
| ||||||||||||||||||||
Class C | 9,525 | 96,106 | 4,617 | 57,018 | ||||||||||||||||
| ||||||||||||||||||||
Class R | 15,677 | 158,969 | 7,033 | 87,421 | ||||||||||||||||
| ||||||||||||||||||||
Class Y | 2,886 | 29,497 | 1,798 | 22,546 | ||||||||||||||||
| ||||||||||||||||||||
Automatic conversion of Class C shares to Class A shares: | ||||||||||||||||||||
Class A | 7,101 | 77,712 | 12,620 | 158,218 | ||||||||||||||||
| ||||||||||||||||||||
Class C | (7,204 | ) | (77,712 | ) | (12,795 | ) | (158,218 | ) | ||||||||||||
| ||||||||||||||||||||
Reacquired: | ||||||||||||||||||||
Class A | (645,733 | ) | (6,859,378 | ) | (82,233 | ) | (1,037,866 | ) | ||||||||||||
| ||||||||||||||||||||
Class C | (187,869 | ) | (1,964,456 | ) | (11,741 | ) | (147,259 | ) | ||||||||||||
| ||||||||||||||||||||
Class R | (260,876 | ) | (2,761,352 | ) | (22,644 | ) | (280,727 | ) | ||||||||||||
| ||||||||||||||||||||
Class Y | (40,276 | ) | (442,508 | ) | (3,915 | ) | (49,245 | ) | ||||||||||||
| ||||||||||||||||||||
Class R5 | - | - | (1,222 | ) | (15,300 | ) | ||||||||||||||
| ||||||||||||||||||||
Class R6 | - | - | (20,415 | ) | (255,600 | ) | ||||||||||||||
| ||||||||||||||||||||
Net increase (decrease) in share activity | (198,426 | ) | $ | (1,728,089 | ) | 883,040 | $ | 10,828,516 | ||||||||||||
| ||||||||||||||||||||
Invesco Peak Retirement™ 2040 Fund
| Summary of Share Activity | ||||||||||||||||||||
| ||||||||||||||||||||
| Year ended | Year ended | |||||||||||||||||||
| December 31, 2022(a) | December 31, 2021 | |||||||||||||||||||
| Shares | Amount | Shares | Amount | |||||||||||||||||
| ||||||||||||||||||||
Sold: | ||||||||||||||||||||
Class A | 572,438 | $ | 6,372,598 | 886,005 | $ | 10,848,723 | ||||||||||||||
| ||||||||||||||||||||
Class C | 130,666 | 1,429,869 | 170,342 | 2,055,178 | ||||||||||||||||
| ||||||||||||||||||||
Class R | 189,630 | 2,078,408 | 390,361 | 4,833,194 | ||||||||||||||||
| ||||||||||||||||||||
Class Y | 13,808 | 148,442 | 13,435 | 167,851 | ||||||||||||||||
| ||||||||||||||||||||
Issued as reinvestment of dividends: | ||||||||||||||||||||
Class A | 47,845 | 487,541 | 30,069 | 379,474 | ||||||||||||||||
| ||||||||||||||||||||
Class C | 7,375 | 74,559 | 4,927 | 61,533 | ||||||||||||||||
| ||||||||||||||||||||
Class R | 13,561 | 137,511 | 12,176 | 152,803 | ||||||||||||||||
| ||||||||||||||||||||
Class Y | 3,165 | 32,381 | 1,605 | 20,358 | ||||||||||||||||
| ||||||||||||||||||||
Automatic conversion of Class C shares to Class A shares: | ||||||||||||||||||||
Class A | 4,684 | 50,672 | 4,143 | 52,599 | ||||||||||||||||
| ||||||||||||||||||||
Class C | (4,747 | ) | (50,672 | ) | (4,194 | ) | (52,599 | ) | ||||||||||||
| ||||||||||||||||||||
Reacquired: | ||||||||||||||||||||
Class A | (732,201 | ) | (7,857,505 | ) | (116,019 | ) | (1,435,398 | ) | ||||||||||||
| ||||||||||||||||||||
Class C | (160,545 | ) | (1,718,183 | ) | (30,004 | ) | (373,151 | ) | ||||||||||||
| ||||||||||||||||||||
Class R | (410,480 | ) | (4,331,475 | ) | (107,107 | ) | (1,350,178 | ) | ||||||||||||
| ||||||||||||||||||||
Class Y | (5,285 | ) | (56,109 | ) | (3,288 | ) | (39,670 | ) | ||||||||||||
| ||||||||||||||||||||
Class R5 | - | - | (1,244 | ) | (15,800 | ) | ||||||||||||||
| ||||||||||||||||||||
Class R6 | - | - | (20,449 | ) | (259,627 | ) | ||||||||||||||
| ||||||||||||||||||||
Net increase (decrease) in share activity | (330,086 | ) | $ | (3,201,963 | ) | 1,230,758 | $ | 15,045,290 | ||||||||||||
| ||||||||||||||||||||
| (a) | 4% of the outstanding shares of the Fund are owned by the Adviser or an affiliate of the Adviser. |
| 112 | Invesco Peak Retirement™ Funds |
NOTE 10–Share Information–(continued)
Invesco Peak Retirement™ 2045 Fund
| Summary of Share Activity | ||||||||||||||||||||
| ||||||||||||||||||||
| Year ended | Year ended | |||||||||||||||||||
| December 31, 2022 | December 31, 2021 | |||||||||||||||||||
| Shares | Amount | Shares | Amount | |||||||||||||||||
| ||||||||||||||||||||
Sold: | ||||||||||||||||||||
Class A | 315,931 | $ | 3,390,875 | 257,600 | $ | 3,259,252 | ||||||||||||||
| ||||||||||||||||||||
Class C | 96,870 | 1,044,544 | 72,925 | 897,218 | ||||||||||||||||
| ||||||||||||||||||||
Class R | 174,662 | 1,873,200 | 86,707 | 1,096,317 | ||||||||||||||||
| ||||||||||||||||||||
Class Y | 2,360 | 25,114 | 6,403 | 82,707 | ||||||||||||||||
| ||||||||||||||||||||
Issued as reinvestment of dividends: | ||||||||||||||||||||
Class A | 20,386 | 201,613 | 23,898 | 295,863 | ||||||||||||||||
| ||||||||||||||||||||
Class C | 4,847 | 47,305 | 8,938 | 109,043 | ||||||||||||||||
| ||||||||||||||||||||
Class R | 10,419 | 102,523 | 11,917 | 146,818 | ||||||||||||||||
| ||||||||||||||||||||
Class Y | 201 | 1,994 | 714 | 8,871 | ||||||||||||||||
| ||||||||||||||||||||
Automatic conversion of Class C shares to Class A shares: | ||||||||||||||||||||
Class A | 2,635 | 27,780 | 2,545 | 32,296 | ||||||||||||||||
| ||||||||||||||||||||
Class C | (2,685 | ) | (27,780 | ) | (2,587 | ) | (32,296 | ) | ||||||||||||
| ||||||||||||||||||||
Reacquired: | ||||||||||||||||||||
Class A | (337,487 | ) | (3,551,751 | ) | (161,483 | ) | (2,082,576 | ) | ||||||||||||
| ||||||||||||||||||||
Class C | (137,479 | ) | (1,396,120 | ) | (8,434 | ) | (105,041 | ) | ||||||||||||
| ||||||||||||||||||||
Class R | (151,386 | ) | (1,552,838 | ) | (14,503 | ) | (186,196 | ) | ||||||||||||
| ||||||||||||||||||||
Class Y | (12,804 | ) | (132,009 | ) | (48 | ) | (616 | ) | ||||||||||||
| ||||||||||||||||||||
Class R6 | - | - | (11,029 | ) | (151,323 | ) | ||||||||||||||
| ||||||||||||||||||||
Net increase (decrease) in share activity | (13,530 | ) | $ | 54,450 | 273,563 | $ | 3,370,337 | |||||||||||||
| ||||||||||||||||||||
Invesco Peak Retirement™ 2050 Fund
| Summary of Share Activity | ||||||||||||||||||||
| ||||||||||||||||||||
| Year ended | Year ended | |||||||||||||||||||
| December 31, 2022 | December 31, 2021 | |||||||||||||||||||
| Shares | Amount | Shares | Amount | |||||||||||||||||
| ||||||||||||||||||||
Sold: | ||||||||||||||||||||
Class A | 458,006 | $ | 5,283,033 | 648,608 | $ | 8,086,472 | ||||||||||||||
| ||||||||||||||||||||
Class C | 89,545 | 1,019,903 | 161,328 | 1,984,096 | ||||||||||||||||
| ||||||||||||||||||||
Class R | 172,063 | 1,918,418 | 299,811 | 3,765,549 | ||||||||||||||||
| ||||||||||||||||||||
Class Y | 1,663 | 19,331 | 5,474 | 69,409 | ||||||||||||||||
| ||||||||||||||||||||
Issued as reinvestment of dividends: | ||||||||||||||||||||
Class A | 38,527 | 404,926 | 9,783 | 128,866 | ||||||||||||||||
| ||||||||||||||||||||
Class C | 7,699 | 79,996 | 1,598 | 20,740 | ||||||||||||||||
| ||||||||||||||||||||
Class R | 16,195 | 169,080 | 3,901 | 50,988 | ||||||||||||||||
| ||||||||||||||||||||
Class Y | 841 | 8,885 | 252 | 3,330 | ||||||||||||||||
| ||||||||||||||||||||
Automatic conversion of Class C shares to Class A shares: | ||||||||||||||||||||
Class A | 6,255 | 70,364 | 2,640 | 34,573 | ||||||||||||||||
| ||||||||||||||||||||
Class C | (6,371 | ) | (70,364 | ) | (2,683 | ) | (34,573 | ) | ||||||||||||
| ||||||||||||||||||||
Reacquired: | ||||||||||||||||||||
Class A | (500,592 | ) | (5,567,133 | ) | (145,744 | ) | (1,879,233 | ) | ||||||||||||
| ||||||||||||||||||||
Class C | (135,808 | ) | (1,464,968 | ) | (28,122 | ) | (357,179 | ) | ||||||||||||
| ||||||||||||||||||||
Class R | (202,989 | ) | (2,238,018 | ) | (48,680 | ) | (618,203 | ) | ||||||||||||
| ||||||||||||||||||||
Class Y | (20,127 | ) | (214,729 | ) | (3,422 | ) | (47,192 | ) | ||||||||||||
| ||||||||||||||||||||
Class R6 | - | - | (18,142 | ) | (252,177 | ) | ||||||||||||||
| ||||||||||||||||||||
Net increase (decrease) in share activity | (75,093 | ) | $ | (581,276 | ) | 886,602 | $ | 10,955,466 | ||||||||||||
| ||||||||||||||||||||
| 113 | Invesco Peak Retirement™ Funds |
NOTE 10–Share Information–(continued)
Invesco Peak Retirement™ 2055 Fund
| Summary of Share Activity | ||||||||||||||||||||
| ||||||||||||||||||||
| Year ended | Year ended | |||||||||||||||||||
| December 31, 2022(a) | December 31, 2021 | |||||||||||||||||||
| Shares | Amount | Shares | Amount | |||||||||||||||||
| ||||||||||||||||||||
Sold: | ||||||||||||||||||||
Class A | 187,994 | $ | 2,140,062 | 149,323 | $ | 1,931,182 | ||||||||||||||
| ||||||||||||||||||||
Class C | 41,847 | 472,466 | 43,738 | 559,379 | ||||||||||||||||
| ||||||||||||||||||||
Class R | 112,383 | 1,284,799 | 52,487 | 679,343 | ||||||||||||||||
| ||||||||||||||||||||
Class Y | - | - | 4,146 | 53,924 | ||||||||||||||||
| ||||||||||||||||||||
Class R6 | 54 | 600 | - | - | ||||||||||||||||
| ||||||||||||||||||||
Issued as reinvestment of dividends: | ||||||||||||||||||||
Class A | 13,278 | 139,946 | 4,997 | 65,707 | ||||||||||||||||
| ||||||||||||||||||||
Class C | 2,563 | 26,708 | 1,142 | 14,818 | ||||||||||||||||
| ||||||||||||||||||||
Class R | 5,749 | 60,255 | 1,682 | 22,001 | ||||||||||||||||
| ||||||||||||||||||||
Class Y | 92 | 976 | 27 | 350 | ||||||||||||||||
| ||||||||||||||||||||
Class R6 | 2 | 21 | - | - | ||||||||||||||||
| ||||||||||||||||||||
Reacquired: | ||||||||||||||||||||
Class A | (154,034 | ) | (1,704,842 | ) | (46,880 | ) | (616,376 | ) | ||||||||||||
| ||||||||||||||||||||
Class C | (50,846 | ) | (550,528 | ) | (8,199 | ) | (107,408 | ) | ||||||||||||
| ||||||||||||||||||||
Class R | (75,133 | ) | (822,636 | ) | (4,959 | ) | (66,691 | ) | ||||||||||||
| ||||||||||||||||||||
Class Y | (777 | ) | (9,346 | ) | (2,199 | ) | (29,545 | ) | ||||||||||||
| ||||||||||||||||||||
Class R6 | - | (3 | ) | (3,602 | ) | (50,468 | ) | |||||||||||||
| ||||||||||||||||||||
Net increase in share activity | 83,172 | $ | 1,038,478 | 191,703 | $ | 2,456,216 | ||||||||||||||
| ||||||||||||||||||||
| (a) | 8% of the outstanding shares of the Fund are owned by the Adviser or an affiliate of the Adviser. |
Invesco Peak Retirement™ 2060 Fund
| Summary of Share Activity | ||||||||||||||||||||
| ||||||||||||||||||||
| Year ended | Year ended | |||||||||||||||||||
| December 31, 2022(a) | December 31, 2021 | |||||||||||||||||||
| Shares | Amount | Shares | Amount | |||||||||||||||||
| ||||||||||||||||||||
Sold: | ||||||||||||||||||||
Class A | 184,943 | $ | 2,148,344 | 166,305 | $ | 2,138,893 | ||||||||||||||
| ||||||||||||||||||||
Class C | 36,703 | 415,600 | 32,745 | 420,275 | ||||||||||||||||
| ||||||||||||||||||||
Class R | 65,464 | 740,637 | 108,213 | 1,331,952 | ||||||||||||||||
| ||||||||||||||||||||
Class Y | 655 | 7,560 | 3,755 | 49,190 | ||||||||||||||||
| ||||||||||||||||||||
Issued as reinvestment of dividends: | ||||||||||||||||||||
Class A | 13,930 | 148,491 | 3,430 | 45,452 | ||||||||||||||||
| ||||||||||||||||||||
Class C | 1,772 | 18,680 | 296 | 3,877 | ||||||||||||||||
| ||||||||||||||||||||
Class R | 6,699 | 71,071 | 1,628 | 21,456 | ||||||||||||||||
| ||||||||||||||||||||
Class Y | 344 | 3,683 | 102 | 1,352 | ||||||||||||||||
| ||||||||||||||||||||
Automatic conversion of Class C shares to Class A shares: | ||||||||||||||||||||
Class A | 56 | 612 | - | - | ||||||||||||||||
| ||||||||||||||||||||
Class C | (57 | ) | (612 | ) | - | - | ||||||||||||||
| ||||||||||||||||||||
| 114 | Invesco Peak Retirement™ Funds |
NOTE 10–Share Information–(continued)
| Summary of Share Activity | ||||||||||||||||||||
| ||||||||||||||||||||
| Year ended | Year ended | |||||||||||||||||||
| December 31, 2022(a) | December 31, 2021 | |||||||||||||||||||
| Shares | Amount | Shares | Amount | |||||||||||||||||
| ||||||||||||||||||||
Reacquired: | ||||||||||||||||||||
Class A | (161,217 | ) | $ | (1,803,195 | ) | (27,307 | ) | $ | (355,674 | ) | ||||||||||
| ||||||||||||||||||||
Class C | (38,491 | ) | (416,266 | ) | (5,403 | ) | (70,235 | ) | ||||||||||||
| ||||||||||||||||||||
Class R | (74,415 | ) | (820,620 | ) | (4,452 | ) | (59,034 | ) | ||||||||||||
| ||||||||||||||||||||
Class Y | (566 | ) | (6,798 | ) | (2 | ) | (25 | ) | ||||||||||||
| ||||||||||||||||||||
Class R6 | - | - | (5,419 | ) | (75,705 | ) | ||||||||||||||
| ||||||||||||||||||||
Net increase in share activity | 35,820 | $ | 507,187 | 273,891 | $ | 3,451,774 | ||||||||||||||
| ||||||||||||||||||||
| (a) | There are entities that are record owners of more than 5% of the outstanding shares of the Fund and in the aggregate own 16% of the outstanding shares of the Fund. IDI has an agreement with these entities to sell Fund shares. The Fund, Invesco and/or Invesco affiliates may make payments to these entities, which are considered to be related to the Fund, for providing services to the Fund, Invesco and/or Invesco affiliates including but not limited to services such as securities brokerage, distribution, third party record keeping and account servicing. The Fund has no knowledge as to whether all or any portion of the shares owned of record by these entities are also owned beneficially. |
In addition, 6% of the outstanding shares of the Fund are owned by the Adviser or an affiliate of the Adviser.
Invesco Peak Retirement™ 2065 Fund
| Summary of Share Activity | ||||||||||||||||||||
| ||||||||||||||||||||
| Year ended | Year ended | |||||||||||||||||||
| December 31, 2022(a) | December 31, 2021 | |||||||||||||||||||
| Shares | Amount | Shares | Amount | |||||||||||||||||
| ||||||||||||||||||||
Sold: | ||||||||||||||||||||
Class A | 201,693 | $ | 2,398,878 | 168,581 | $ | 2,214,268 | ||||||||||||||
| ||||||||||||||||||||
Class C | 29,318 | 337,878 | 43,780 | 565,831 | ||||||||||||||||
| ||||||||||||||||||||
Class R | 79,610 | 899,439 | 32,716 | 427,699 | ||||||||||||||||
| ||||||||||||||||||||
Class Y | 3,464 | 40,291 | 21,860 | 296,681 | ||||||||||||||||
| ||||||||||||||||||||
Issued as reinvestment of dividends: | ||||||||||||||||||||
Class A | 12,428 | 133,846 | 5,389 | 72,647 | ||||||||||||||||
| ||||||||||||||||||||
Class C | 2,419 | 25,402 | 1,084 | 14,227 | ||||||||||||||||
| ||||||||||||||||||||
Class R | 4,259 | 45,065 | 970 | 12,865 | ||||||||||||||||
| ||||||||||||||||||||
Class Y | 1,416 | 15,105 | 505 | 6,748 | ||||||||||||||||
| ||||||||||||||||||||
Reacquired: | ||||||||||||||||||||
Class A | (209,882 | ) | (2,362,795 | ) | (46,262 | ) | (614,130 | ) | ||||||||||||
| ||||||||||||||||||||
Class C | (34,764 | ) | (379,440 | ) | (5,559 | ) | (72,629 | ) | ||||||||||||
| ||||||||||||||||||||
Class R | (43,467 | ) | (474,421 | ) | (10,269 | ) | (138,036 | ) | ||||||||||||
| ||||||||||||||||||||
Class Y | (4,241 | ) | (46,169 | ) | (9,524 | ) | (130,857 | ) | ||||||||||||
| ||||||||||||||||||||
Class R6 | - | - | (5,330 | ) | (75,693 | ) | ||||||||||||||
| ||||||||||||||||||||
Net increase in share activity | 42,253 | $ | 633,079 | 197,941 | $ | 2,579,621 | ||||||||||||||
| ||||||||||||||||||||
| (a) | 8% of the outstanding shares of the Fund are owned by the Adviser or an affiliate of the Adviser. |
NOTE 11–Significant Event
On September 20, 2022, the Board of Trustees approved a Plan of Liquidation and Dissolution, which authorizes the termination, liquidation and dissolution of each Fund. In order to effect such liquidations, each Fund closed to investments by new accounts after the close of business on October 24, 2022. Each Fund was liquidated on January 23, 2023.
| 115 | Invesco Peak Retirement™ Funds |
Report of Independent Registered Public Accounting Firm
To the Board of Trustees of AIM Growth Series (Invesco Growth Series) and Shareholders of Invesco Peak Retirement™ Destination Fund, Invesco Peak Retirement™ 2010 Fund, Invesco Peak Retirement™ 2015 Fund, Invesco Peak Retirement™ 2020 Fund, Invesco Peak Retirement™ 2025 Fund, Invesco Peak Retirement™ 2030 Fund, Invesco Peak Retirement™ 2035 Fund, Invesco Peak Retirement™ 2040 Fund, Invesco Peak Retirement™ 2045 Fund, Invesco Peak Retirement™ 2050 Fund, Invesco Peak Retirement™ 2055 Fund, Invesco Peak Retirement™ 2060 Fund and Invesco Peak Retirement™ 2065 Fund
Opinion on the Financial Statements
We have audited the accompanying statements of assets and liabilities, including the schedules of investments, of Invesco Peak Retirement™ Destination Fund, Invesco Peak Retirement™ 2010 Fund, Invesco Peak Retirement™ 2015 Fund, Invesco Peak Retirement™ 2020 Fund, Invesco Peak Retirement™ 2025 Fund, Invesco Peak Retirement™ 2030 Fund, Invesco Peak Retirement™ 2035 Fund, Invesco Peak Retirement™ 2040 Fund, Invesco Peak Retirement™ 2045 Fund, Invesco Peak Retirement™ 2050 Fund, Invesco Peak Retirement™ 2055 Fund, Invesco Peak Retirement™ 2060 Fund and Invesco Peak Retirement™ 2065 Fund (thirteen of the funds constituting AIM Growth Series (Invesco Growth Series), hereafter collectively referred to as the “Funds”) as of December 31, 2022, the related statements of operations for the year ended December 31, 2022 and the statements of changes in net assets for each of the periods indicated in the table below, including the related notes, and the financial highlights for each of the periods indicated in the table below (collectively referred to as the “financial statements”). In our opinion, the financial statements present fairly, in all material respects, the financial position of each of the Funds as of December 31, 2022, the results of each of their operations for the year then ended and the changes in each of their net assets for each of the periods indicated in the table below and each of the financial highlights for each of the periods indicated in the table below in conformity with accounting principles generally accepted in the United States of America.
| Invesco Peak Retirement™ Destination Fund, Invesco Peak Retirement™ 2015 Fund, Invesco Peak Retirement™ 2020 Fund, Invesco Peak Retirement™ 2025 Fund, Invesco Peak Retirement™ 2030 Fund, Invesco Peak Retirement™ 2035 Fund, Invesco Peak Retirement™ 2040 Fund, Invesco Peak Retirement™ 2045 Fund, Invesco Peak Retirement™ 2050 Fund, Invesco Peak Retirement™ 2055 Fund, Invesco Peak Retirement™ 2060 Fund and Invesco Peak Retirement™ 2065 Fund: statements of changes in net assets for each of the two years in the period ended December 31, 2022 and each of the financial highlights for each of the four years in the period ended December 31, 2022 and for the period January 3, 2018 (commencement of operations) through December 31, 2018. |
| Invesco Peak Retirement™ 2010 Fund: statement of changes in net assets and the financial highlights for the year ended December 31, 2022 and for the period April 30, 2021 (commencement of operations) through December 31, 2021. |
Basis for Opinion
These financial statements are the responsibility of the Funds’ management. Our responsibility is to express an opinion on the Funds’ financial statements based on our audits. We are a public accounting firm registered with the Public Company Accounting Oversight Board (United States) (PCAOB) and are required to be independent with respect to the Funds in accordance with the U.S. federal securities laws and the applicable rules and regulations of the Securities and Exchange Commission and the PCAOB.
We conducted our audits of these financial statements in accordance with the standards of the PCAOB. Those standards require that we plan and perform the audit to obtain reasonable assurance about whether the financial statements are free of material misstatement, whether due to error or fraud.
Our audits included performing procedures to assess the risks of material misstatement of the financial statements, whether due to error or fraud, and performing procedures that respond to those risks. Such procedures included examining, on a test basis, evidence regarding the amounts and disclosures in the financial statements. Our audits also included evaluating the accounting principles used and significant estimates made by management, as well as evaluating the overall presentation of the financial statements. Our procedures included confirmation of securities owned as of December 31, 2022 by correspondence with the custodian, transfer agent and brokers; when replies were not received from brokers, we performed other auditing procedures. We believe that our audits provide a reasonable basis for our opinions.
Subsequent Event
As discussed in Note 10 to the financial statements, the board of trustees approved a plan of liquidation for Funds on September 20, 2022.
/s/PricewaterhouseCoopers LLP
Houston, Texas
February 22, 2023
We have served as the auditor of one or more of the investment companies in the Invesco group of investment companies since at least 1995. We have not been able to determine the specific year we began serving as auditor.
| 116 | Invesco Peak Retirement™ Funds |
Calculating your ongoing Fund expenses
Example
As a shareholder of the Fund, you incur two types of costs: (1) transaction costs, which may include sales charges (loads) on purchase payments or contingent deferred sales charges on redemptions, if any; and (2) ongoing costs, including distribution and/or service (12b-1) fees, and other Fund expenses. This example is intended to help you understand your ongoing costs (in dollars) of investing in the Fund and to compare these costs with ongoing costs of investing in other mutual funds. The example is based on an investment of $1,000 invested at the beginning of the period and held for the entire period July 1, 2022 through December 31, 2022.
In addition to the fees and expenses which the Funds bear directly, the Funds indirectly bear a pro rata share of the fees and expenses of the underlying funds in which the Funds invest. The amount of fees and expenses incurred indirectly by the Funds will vary because the underlying funds have varied expenses and fee levels and the Funds may own different proportions of the underlying funds at different times. Estimated underlying fund expenses are not expenses that are incurred directly by the Funds. They are expenses that are incurred directly by the underlying funds and are deducted from the value of the underlying funds the Funds invest in. The effect of the estimated underlying fund expenses that the Funds bear indirectly are included in each Fund’s total return.
Actual expenses
The table below provides information about actual account values and actual expenses. You may use the information in this table, together with the amount you invested, to estimate the expenses that you paid over the period. Simply divide your account value by $1,000 (for example, an $8,600 account value divided by $1,000 = 8.6), then multiply the result by the number in the table under the heading entitled “Actual Expenses Paid During Period” to estimate the expenses you paid on your account during this period.
Hypothetical example for comparison purposes
The table below also provides information about hypothetical account values and hypothetical expenses based on each Fund’s actual expense ratio and an assumed rate of return of 5% per year before expenses, which is not each Fund’s actual return.
The hypothetical account values and expenses may not be used to estimate the actual ending account balance or expenses you paid for the period. You may use this information to compare the ongoing costs of investing in the Funds and other funds. To do so, compare this 5% hypothetical example with the 5% hypothetical examples that appear in the shareholder reports of the other funds.
Please note that the expenses shown in the table are meant to highlight your ongoing costs only and do not reflect any transaction costs, such as sales charges (loads) on purchase payments or contingent deferred sales charges on redemptions, if any. Therefore, the hypothetical information is useful in comparing ongoing costs only, and will not help you determine the relative total costs of owning different funds. In addition, expenses shown in the table do not include the expenses of the underlying funds, which are borne indirectly by the Funds. If transaction costs and indirect expenses were included, your costs would have been higher.
Invesco Peak Retirement™ Destination Fund
Invesco Peak Retirement™ Destination Fund | Beginning Account Value (07/01/22) | ACTUAL | HYPOTHETICAL (5% annual return before expenses) | Annualized Ratio | ||||||||
| Ending Account Value (12/31/22)1 | Expenses Paid During Period2 | Ending Account Value (12/31/22) | Expenses Paid During | |||||||||
Class A | $1,000.00 | $996.90 | $1.61 | $1,023.59 | $1.63 | 0.32% | ||||||
Class C | 1,000.00 | 993.20 | 5.38 | 1,019.81 | 5.45 | 1.07 | ||||||
Class R | 1,000.00 | 995.70 | 2.87 | 1,022.33 | 2.91 | 0.57 | ||||||
Class Y | 1,000.00 | 998.20 | 0.35 | 1,024.85 | 0.36 | 0.07 | ||||||
Class R5 | 1,000.00 | 998.20 | 0.35 | 1,024.85 | 0.36 | 0.07 | ||||||
Class R6 | 1,000.00 | 998.20 | 0.35 | 1,024.85 | 0.36 | 0.07 | ||||||
| 1 | The actual ending account value is based on the actual total return of the Funds for the period July 1, 2022 through December 31, 2022, after actual expenses and will differ from the hypothetical ending account value which is based on each Fund’s expense ratio and a hypothetical annual return of 5% before expenses. |
| 2 | Expenses are equal to each Fund’s annualized expense ratio as indicated above multiplied by the average account value over the period, multiplied by 184/365 to reflect the most recent fiscal half year. |
| 117 | Invesco Peak Retirement™ Funds |
Invesco Peak Retirement™ 2010 Fund
Invesco Peak Retirement™ 2010 Fund | Beginning | ACTUAL | HYPOTHETICAL (5% annual return before expenses) | Annualized Ratio | ||||||||
| Ending Account Value (12/31/22)1 | Expenses Paid During Period2 | Ending Account Value (12/31/22) | Expenses Paid During Period2 | |||||||||
Class A | $1,000.00 | $998.10 | $1.66 | $1,023.54 | $1.68 | 0.33% | ||||||
Class C | 1,000.00 | 993.50 | 5.43 | 1,019.76 | 5.50 | 1.08 | ||||||
Class R | 1,000.00 | 997.40 | 2.92 | 1,022.28 | 2.96 | 0.58 | ||||||
Class Y | 1,000.00 | 1,000.10 | 0.40 | 1,024.80 | 0.41 | 0.08 | ||||||
Class R5 | 1,000.00 | 1,000.10 | 0.40 | 1,024.80 | 0.41 | 0.08 | ||||||
Class R6 | 1,000.00 | 1,000.10 | 0.40 | 1,024.80 | 0.41 | 0.08 | ||||||
| 1 | The actual ending account value is based on the actual total return of the Funds for the period July 1, 2022 through December 31, 2022, after actual expenses and will differ from the hypothetical ending account value which is based on each Fund’s expense ratio and a hypothetical annual return of 5% before expenses. |
| 2 | Expenses are equal to each Fund’s annualized expense ratio as indicated above multiplied by the average account value over the period, multiplied by 184/365 to reflect the most recent fiscal half year. |
Invesco Peak Retirement™ 2015 Fund
Invesco Peak | Beginning | ACTUAL | HYPOTHETICAL (5% annual return before expenses) | Annualized Ratio | ||||||||
| Ending Account Value (12/31/22)1 | Expenses Paid During Period2 | Ending Account Value (12/31/22) | Expenses Paid During Period2 | |||||||||
Class A | $1,000.00 | $1,001.40 | $1.61 | $1,023.59 | $1.63 | 0.32% | ||||||
Class C | 1,000.00 | 998.20 | 5.39 | 1,019.81 | 5.45 | 1.07 | ||||||
Class R | 1,000.00 | 1,001.10 | 2.88 | 1,022.33 | 2.91 | 0.57 | ||||||
Class Y | 1,000.00 | 1,002.90 | 0.35 | 1,024.85 | 0.36 | 0.07 | ||||||
Class R5 | 1,000.00 | 1,004.00 | 0.35 | 1,024.85 | 0.36 | 0.07 | ||||||
Class R6 | 1,000.00 | 1,004.00 | 0.35 | 1,024.85 | 0.36 | 0.07 | ||||||
| 1 | The actual ending account value is based on the actual total return of the Funds for the period July 1, 2022 through December 31, 2022, after actual expenses and will differ from the hypothetical ending account value which is based on each Fund’s expense ratio and a hypothetical annual return of 5% before expenses. |
| 2 | Expenses are equal to each Fund’s annualized expense ratio as indicated above multiplied by the average account value over the period, multiplied by 184/365 to reflect the most recent fiscal half year. |
Invesco Peak Retirement™ 2020 Fund
Invesco Peak Retirement™ 2020 Fund | Beginning | ACTUAL | HYPOTHETICAL (5% annual return before expenses) | Annualized Ratio | ||||||||
| Ending Account Value (12/31/22)1 | Expenses Paid During Period2 | Ending Account Value (12/31/22) | Expenses Paid During Period2 | |||||||||
Class A | $1,000.00 | $1,004.90 | $1.62 | $1,023.59 | $1.63 | 0.32% | ||||||
Class C | 1,000.00 | 1,001.10 | 5.40 | 1,019.81 | 5.45 | 1.07 | ||||||
Class R | 1,000.00 | 1,003.30 | 2.88 | 1,022.33 | 2.91 | 0.57 | ||||||
Class Y | 1,000.00 | 1,005.60 | 0.35 | 1,024.85 | 0.36 | 0.07 | ||||||
Class R5 | 1,000.00 | 1,006.70 | 0.35 | 1,024.85 | 0.36 | 0.07 | ||||||
Class R6 | 1,000.00 | 1,006.70 | 0.35 | 1,024.85 | 0.36 | 0.07 | ||||||
| 1 | The actual ending account value is based on the actual total return of the Funds for the period July 1, 2022 through December 31, 2022, after actual expenses and will differ from the hypothetical ending account value which is based on each Fund’s expense ratio and a hypothetical annual return of 5% before expenses. |
| 2 | Expenses are equal to each Fund’s annualized expense ratio as indicated above multiplied by the average account value over the period, multiplied by 184/365 to reflect the most recent fiscal half year. |
| 118 | Invesco Peak Retirement™ Funds |
Invesco Peak Retirement™ 2025 Fund
Invesco Peak Retirement™ 2025 Fund | Beginning | ACTUAL | HYPOTHETICAL (5% annual return before expenses) | Annualized Ratio | ||||||||
| Ending Account Value (12/31/22)1 | Expenses Paid During Period2 | Ending Account Value (12/31/22) | Expenses Paid During Period2 | |||||||||
Class A | $1,000.00 | $1,006.50 | $1.57 | $1,023.64 | $1.58 | 0.31% | ||||||
Class C | 1,000.00 | 1,002.90 | 5.35 | 1,019.86 | 5.40 | 1.06 | ||||||
Class R | 1,000.00 | 1,005.30 | 2.83 | 1,022.38 | 2.85 | 0.56 | ||||||
Class Y | 1,000.00 | 1,007.70 | 0.30 | 1,024.90 | 0.31 | 0.06 | ||||||
Class R5 | 1,000.00 | 1,007.70 | 0.30 | 1,024.90 | 0.31 | 0.06 | ||||||
Class R6 | 1,000.00 | 1,007.80 | 0.30 | 1,024.90 | 0.31 | 0.06 | ||||||
| 1 | The actual ending account value is based on the actual total return of the Funds for the period July 1, 2022 through December 31, 2022, after actual expenses and will differ from the hypothetical ending account value which is based on each Fund’s expense ratio and a hypothetical annual return of 5% before expenses. |
| 2 | Expenses are equal to each Fund’s annualized expense ratio as indicated above multiplied by the average account value over the period, multiplied by 184/365 to reflect the most recent fiscal half year. |
Invesco Peak Retirement™ 2030 Fund
Invesco Peak Retirement™ 2030 Fund | Beginning | ACTUAL | HYPOTHETICAL (5% annual return before expenses) | Annualized Ratio | ||||||||
| Ending Account Value (12/31/22)1 | Expenses Paid During Period2 | Ending Account Value (12/31/22) | Expenses Paid During Period2 | |||||||||
Class A | $1,000.00 | $1,008.70 | $1.57 | $1,023.64 | $1.58 | 0.31% | ||||||
Class C | 1,000.00 | 1,005.00 | 5.36 | 1,019.86 | �� 5.40 | 1.06 | ||||||
Class R | 1,000.00 | 1,007.60 | 2.83 | 1,022.38 | 2.85 | 0.56 | ||||||
Class Y | 1,000.00 | 1,010.60 | 0.30 | 1,024.90 | 0.31 | 0.06 | ||||||
Class R5 | 1,000.00 | 1,010.60 | 0.30 | 1,024.90 | 0.31 | 0.06 | ||||||
Class R6 | 1,000.00 | 1,010.60 | 0.30 | 1,024.90 | 0.31 | 0.06 | ||||||
| 1 | The actual ending account value is based on the actual total return of the Funds for the period July 1, 2022 through December 31, 2022, after actual expenses and will differ from the hypothetical ending account value which is based on each Fund’s expense ratio and a hypothetical annual return of 5% before expenses. |
| 2 | Expenses are equal to each Fund’s annualized expense ratio as indicated above multiplied by the average account value over the period, multiplied by 184/365 to reflect the most recent fiscal half year. |
Invesco Peak Retirement™ 2035 Fund
Invesco Peak Retirement™ 2035 Fund | Beginning | ACTUAL | HYPOTHETICAL (5% annual return before expenses) | Annualized Ratio | ||||||||
| Ending Account Value (12/31/22)1 | Expenses Paid During Period2 | Ending Account Value (12/31/22) | Expenses Paid During Period2 | |||||||||
Class A | $1,000.00 | $1,009.60 | $1.57 | $1,023.64 | $1.58 | 0.31% | ||||||
Class C | 1,000.00 | 1,005.40 | 5.36 | 1,019.86 | 5.40 | 1.06 | ||||||
Class R | 1,000.00 | 1,008.50 | 2.84 | 1,022.38 | 2.85 | 0.56 | ||||||
Class Y | 1,000.00 | 1,011.00 | 0.30 | 1,024.90 | 0.31 | 0.06 | ||||||
Class R5 | 1,000.00 | 1,011.00 | 0.30 | 1,024.90 | 0.31 | 0.06 | ||||||
Class R6 | 1,000.00 | 1,011.00 | 0.30 | 1,024.90 | 0.31 | 0.06 | ||||||
| 1 | The actual ending account value is based on the actual total return of the Funds for the period July 1, 2022 through December 31, 2022, after actual expenses and will differ from the hypothetical ending account value which is based on each Fund’s expense ratio and a hypothetical annual return of 5% before expenses. |
| 2 | Expenses are equal to each Fund’s annualized expense ratio as indicated above multiplied by the average account value over the period, multiplied by 184/365 to reflect the most recent fiscal half year. |
| 119 | Invesco Peak Retirement™ Funds |
Invesco Peak Retirement™ 2040 Fund
Invesco Peak Retirement™ 2040 Fund | Beginning | ACTUAL | HYPOTHETICAL (5% annual return before expenses) | Annualized Ratio | ||||||||
| Ending Account Value (12/31/22)1 | Expenses Paid During | Ending Account Value (12/31/22) | Expenses Paid During Period2 | |||||||||
Class A | $1,000.00 | $1,014.90 | $1.68 | $1,023.54 | $1.68 | 0.33% | ||||||
Class C | 1,000.00 | 1,010.90 | 5.47 | 1,019.76 | 5.50 | 1.08 | ||||||
Class R | 1,000.00 | 1,013.10 | 2.94 | 1,022.28 | 2.96 | 0.58 | ||||||
Class Y | 1,000.00 | 1,016.30 | 0.41 | 1,024.80 | 0.41 | 0.08 | ||||||
Class R5 | 1,000.00 | 1,016.30 | 0.41 | 1,024.80 | 0.41 | 0.08 | ||||||
Class R6 | 1,000.00 | 1,015.40 | 0.41 | 1,024.80 | 0.41 | 0.08 | ||||||
| 1 | The actual ending account value is based on the actual total return of the Funds for the period July 1, 2022 through December 31, 2022, after actual expenses and will differ from the hypothetical ending account value which is based on each Fund’s expense ratio and a hypothetical annual return of 5% before expenses. |
| 2 | Expenses are equal to each Fund’s annualized expense ratio as indicated above multiplied by the average account value over the period, multiplied by 184/365 to reflect the most recent fiscal half year. |
Invesco Peak Retirement™ 2045 Fund
Invesco Peak Retirement™ 2045 Fund | Beginning | ACTUAL | HYPOTHETICAL (5% annual return before expenses) | Annualized Ratio | ||||||||
| Ending Account Value (12/31/22)1 | Expenses Paid During Period2 | Ending Account Value (12/31/22) | Expenses Paid During Period2 | |||||||||
Class A | $1,000.00 | $1,018.60 | $1.78 | $1,023.44 | $1.79 | 0.35% | ||||||
Class C | 1,000.00 | 1,014.90 | 5.59 | 1,019.66 | 5.60 | 1.10 | ||||||
Class R | 1,000.00 | 1,017.40 | 3.05 | 1,022.18 | 3.06 | 0.60 | ||||||
Class Y | 1,000.00 | 1,019.90 | 0.51 | 1,024.70 | 0.51 | 0.10 | ||||||
Class R5 | 1,000.00 | 1,019.80 | 0.51 | 1,024.70 | 0.51 | 0.10 | ||||||
Class R6 | 1,000.00 | 1,019.90 | 0.51 | 1,024.70 | 0.51 | 0.10 | ||||||
| 1 | The actual ending account value is based on the actual total return of the Funds for the period July 1, 2022 through December 31, 2022, after actual expenses and will differ from the hypothetical ending account value which is based on each Fund’s expense ratio and a hypothetical annual return of 5% before expenses. |
| 2 | Expenses are equal to each Fund’s annualized expense ratio as indicated above multiplied by the average account value over the period, multiplied by 184/365 to reflect the most recent fiscal half year. |
Invesco Peak Retirement™ 2050 Fund
Invesco Peak Retirement™ 2050 Fund | Beginning | ACTUAL | HYPOTHETICAL (5% annual return before expenses) | Annualized Ratio | ||||||||
| Ending Account Value (12/31/22)1 | Expenses Paid During Period2 | Ending Account Value (12/31/22) | Expenses Paid During Period2 | |||||||||
Class A | $1,000.00 | $1,021.70 | $1.73 | $1,023.49 | $1.73 | 0.34% | ||||||
Class C | 1,000.00 | 1,017.40 | 5.54 | 1,019.71 | 5.55 | 1.09 | ||||||
Class R | 1,000.00 | 1,020.50 | 3.00 | 1,022.23 | 3.01 | 0.59 | ||||||
Class Y | 1,000.00 | 1,021.90 | 0.46 | 1,024.75 | 0.46 | 0.09 | ||||||
Class R5 | 1,000.00 | 1,021.90 | 0.46 | 1,024.75 | 0.46 | 0.09 | ||||||
Class R6 | 1,000.00 | 1,021.90 | 0.46 | 1,024.75 | 0.46 | 0.09 | ||||||
| 1 | The actual ending account value is based on the actual total return of the Funds for the period July 1, 2022 through December 31, 2022, after actual expenses and will differ from the hypothetical ending account value which is based on each Fund’s expense ratio and a hypothetical annual return of 5% before expenses. |
| 2 | Expenses are equal to each Fund’s annualized expense ratio as indicated above multiplied by the average account value over the period, multiplied by 184/365 to reflect the most recent fiscal half year. |
| 120 | Invesco Peak Retirement™ Funds |
Invesco Peak Retirement™ 2055 Fund
Invesco Peak Retirement™ 2055 Fund | Beginning | ACTUAL | HYPOTHETICAL (5% annual return before expenses) | Annualized Ratio | ||||||||
| Ending Account Value (12/31/22)1 | Expenses Paid During Period2 | Ending Account Value (12/31/22) | Expenses Paid During Period2 | |||||||||
Class A | $1,000.00 | $1,024.30 | $1.79 | $1,023.44 | $1.79 | 0.35% | ||||||
Class C | 1,000.00 | 1,020.50 | 5.60 | 1,019.66 | 5.60 | 1.10 | ||||||
Class R | 1,000.00 | 1,023.30 | 3.06 | 1,022.18 | 3.06 | 0.60 | ||||||
Class Y | 1,000.00 | 1,025.20 | 0.51 | 1,024.70 | 0.51 | 0.10 | ||||||
Class R5 | 1,000.00 | 1,026.20 | 0.51 | 1,024.70 | 0.51 | 0.10 | ||||||
Class R6 | 1,000.00 | 1,026.20 | 0.51 | 1,024.70 | 0.51 | 0.10 | ||||||
| 1 | The actual ending account value is based on the actual total return of the Funds for the period July 1, 2022 through December 31, 2022, after actual expenses and will differ from the hypothetical ending account value which is based on each Fund’s expense ratio and a hypothetical annual return of 5% before expenses. |
| 2 | Expenses are equal to each Fund’s annualized expense ratio as indicated above multiplied by the average account value over the period, multiplied by 184/365 to reflect the most recent fiscal half year. |
Invesco Peak Retirement™ 2060 Fund
Invesco Peak Retirement™ 2060 Fund | Beginning | ACTUAL | HYPOTHETICAL (5% annual return before expenses) | Annualized Ratio | ||||||||
| Ending Account Value (12/31/22)1 | Expenses Paid During Period2 | Ending Account Value (12/31/22) | Expenses Paid During Period2 | |||||||||
Class A | $1,000.00 | $1,022.80 | $1.99 | $1,023.24 | $1.99 | 0.39% | ||||||
Class C | 1,000.00 | 1,019.60 | 5.80 | 1,019.46 | 5.80 | 1.14 | ||||||
Class R | 1,000.00 | 1,021.80 | 3.26 | 1,021.98 | 3.26 | 0.64 | ||||||
Class Y | 1,000.00 | 1,024.80 | 0.71 | 1,024.50 | 0.71 | 0.14 | ||||||
Class R5 | 1,000.00 | 1,024.80 | 0.71 | 1,024.50 | 0.71 | 0.14 | ||||||
Class R6 | 1,000.00 | 1,023.80 | 0.71 | 1,024.50 | 0.71 | 0.14 | ||||||
| 1 | The actual ending account value is based on the actual total return of the Funds for the period July 1, 2022 through December 31, 2022, after actual expenses and will differ from the hypothetical ending account value which is based on each Fund’s expense ratio and a hypothetical annual return of 5% before expenses. |
| 2 | Expenses are equal to each Fund’s annualized expense ratio as indicated above multiplied by the average account value over the period, multiplied by 184/365 to reflect the most recent fiscal half year. |
Invesco Peak Retirement™ 2065 Fund
Invesco Peak Retirement™ 2065 Fund | Beginning | ACTUAL | HYPOTHETICAL (5% annual return before expenses) | Annualized Ratio | ||||||||
| Ending Account Value (12/31/22)1 | Expenses Paid During Period2 | Ending Account Value (12/31/22) | Expenses Paid During Period2 | |||||||||
Class A | $1,000.00 | $1,022.60 | $1.78 | $1,023.44 | $1.79 | 0.35% | ||||||
Class C | 1,000.00 | 1,020.60 | 5.60 | 1,019.66 | 5.60 | 1.10 | ||||||
Class R | 1,000.00 | 1,021.30 | 3.06 | 1,022.18 | 3.06 | 0.60 | ||||||
Class Y | 1,000.00 | 1,024.00 | 0.51 | 1,024.70 | 0.51 | 0.10 | ||||||
Class R5 | 1,000.00 | 1,024.00 | 0.51 | 1,024.70 | 0.51 | 0.10 | ||||||
Class R6 | 1,000.00 | 1,024.00 | 0.51 | 1,024.70 | 0.51 | 0.10 | ||||||
| 1 | The actual ending account value is based on the actual total return of the Funds for the period July 1, 2022 through December 31, 2022, after actual expenses and will differ from the hypothetical ending account value which is based on each Fund’s expense ratio and a hypothetical annual return of 5% before expenses. |
| 2 | Expenses are equal to each Fund’s annualized expense ratio as indicated above multiplied by the average account value over the period, multiplied by 184/365 to reflect the most recent fiscal half year. |
| 121 | Invesco Peak Retirement™ Funds |
Shareholders were sent a notice from each Fund that set forth an estimate on a per share basis of the source or sources from which the distribution was paid in December of 2022. Subsequently, certain of these estimates have been corrected. Listed below is a written statement of the sources of this distribution for each Fund impacted, as corrected, on a generally accepted accounting principles (“GAAP”) basis.
Invesco Peak Retirement™ 2010 Fund
| Net Income | Gain from Sale of Securities | Return of Principal | Total Distribution | |||||||
| 12/21/2022 | Class A | $0.4061 | $0.0059 | $0.1735 | $0.5855 | |||||
| 12/21/2022 | Class C | $0.3150 | $0.0059 | $0.1735 | $0.4944 | |||||
| 12/21/2022 | Class R | $0.3797 | $0.0059 | $0.1735 | $0.5591 | |||||
| 12/21/2022 | Class Y | $0.4542 | $0.0059 | $0.1735 | $0.6336 | |||||
| 12/21/2022 | Class R5 | $0.4542 | $0.0059 | $0.1735 | $0.6336 | |||||
| 12/21/2022 | Class R6 | $0.4542 | $0.0059 | $0.1735 | $0.6336 | |||||
| Invesco Peak Retirement™ 2015 Fund | ||||||||||
| Net Income | Gain from Sale of Securities | Return of Principal | Total Distribution | |||||||
| 12/21/2022 | Class A | $0.4373 | $0.0000 | $0.0584 | $0.4957 | |||||
| 12/21/2022 | Class C | $0.2761 | $0.0000 | $0.0584 | $0.3345 | |||||
| 12/21/2022 | Class R | $0.4039 | $0.0000 | $0.0584 | $0.4623 | |||||
| 12/21/2022 | Class Y | $0.4820 | $0.0000 | $0.0584 | $0.5404 | |||||
| 12/21/2022 | Class R5 | $0.4820 | $0.0000 | $0.0584 | $0.5404 | |||||
| 12/21/2022 | Class R6 | $0.4820 | $0.0000 | $0.0584 | $0.5404 | |||||
Please note that the information in the preceding chart is for financial accounting purposes only. Shareholders should be aware that the tax treatment of distributions likely differs from GAAP treatment. Form 1099-DIV for the calendar year will report distributions for U.S. federal income tax purposes. This notice is sent to comply with certain U.S. Securities and Exchange Commission requirements.
| 122 | Invesco Peak Retirement™ Funds |
Form 1099-DIV, Form 1042-S and other year-end tax information provide shareholders with actual calendar year amounts that should be included in their tax returns. Shareholders should consult their tax advisers.
The following distribution information is being provided as required by the Internal Revenue Code or to meet a specific state’s requirement.
The Funds designate the following amounts or, if subsequently determined to be different, the maximum amount allowable for their fiscal year ended December 31, 2022:
Federal and State Income
Tax
| Long-Term Capital Gain Distribution | Qualified Dividend Income* | Corporate Dividends Received Deduction* | U.S. Treasury Obligations* | Qualifed Buiness Income* | Business Interest Income* | |||||||||||||||||||||||||
| Invesco Peak Retirement™ Destination Fund | 23,016 | 25.45 | % | 18.69 | % | 10.89 | % | 2.46 | % | 51.21 | % | |||||||||||||||||||
Invesco Peak Retirement™ 2010 Fund | 434 | 21.91 | % | 16.49 | % | 8.79 | % | 2.49 | % | 51.89 | % | |||||||||||||||||||
Invesco Peak Retirement™ 2015 Fund | 2,865 | 28.09 | % | 21.23 | % | 11.67 | % | 2.25 | % | 50.62 | % | |||||||||||||||||||
Invesco Peak Retirement™ 2020 Fund | 123,061 | 25.40 | % | 18.64 | % | 14.40 | % | 1.44 | % | 54.54 | % | |||||||||||||||||||
Invesco Peak Retirement™ 2025 Fund | 309,002 | 23.50 | % | 13.82 | % | 23.14 | % | 1.10 | % | 59.70 | % | |||||||||||||||||||
Invesco Peak Retirement™ 2030 Fund | 531,978 | 25.12 | % | 14.55 | % | 16.09 | % | 1.66 | % | 56.60 | % | |||||||||||||||||||
Invesco Peak Retirement™ 2035 Fund | 364,400 | 39.74 | % | 22.87 | % | 13.41 | % | 2.50 | % | 40.66 | % | |||||||||||||||||||
Invesco Peak Retirement™ 2040 Fund | 466,826 | 41.83 | % | 24.76 | % | 4.91 | % | 2.28 | % | 24.03 | % | |||||||||||||||||||
Invesco Peak Retirement™ 2045 Fund | 273,617 | 53.03 | % | 31.52 | % | 3.26 | % | 1.70 | % | 16.97 | % | |||||||||||||||||||
Invesco Peak Retirement™ 2050 Fund | 483,352 | 63.09 | % | 39.14 | % | 2.41 | % | 2.45 | % | 12.37 | % | |||||||||||||||||||
Invesco Peak Retirement™ 2055 Fund | 189,724 | 60.63 | % | 37.73 | % | 3.04 | % | 1.86 | % | 7.41 | % | |||||||||||||||||||
Invesco Peak Retirement™ 2060 Fund | 173,185 | 62.43 | % | 37.89 | % | 2.49 | % | 1.69 | % | 7.01 | % | |||||||||||||||||||
Invesco Peak Retirement™ 2065 Fund | 192,322 | 61.38 | % | 38.09 | % | 3.32 | % | 2.40 | % | 9.42 | % | |||||||||||||||||||
| * | The above percentages are based on ordinary income dividends paid to shareholders during the Fund’s fiscal year. |
| 123 | Invesco Peak Retirement™ Funds |
The address of each trustee and officer is AIM Growth Series (Invesco Growth Series) (the “Trust”), 11 Greenway Plaza, Suite 1000, Houston, Texas 77046-1173. The trustees serve for the life of the Trust, subject to their earlier death, incapacitation, resignation, retirement or removal as more specifically provided in the Trust’s organizational documents. Each officer serves for a one year term or until their successors are elected and qualified. Column two below includes length of time served with predecessor entities, if any.
Name, Year of Birth and Position(s) Held with the Trust | Trustee and/or Officer Since | Principal Occupation(s) During Past 5 Years | Number of Funds in Fund Complex Overseen by Trustee | Other Directorship(s) Held by Trustee During Past 5 Years | ||||
| Interested Trustee | ||||||||
Martin L. Flanagan1 – 1960 Trustee and Vice Chair | 2007 | Executive Director, Chief Executive Officer and President, Invesco Ltd. (ultimate parent of Invesco and a global investment management firm); Trustee and Vice Chair, The Invesco Funds; Vice Chair, Investment Company Institute; and Member of Executive Board, SMU Cox School of Business
Formerly: Advisor to the Board, Invesco Advisers, Inc. (formerly known as Invesco Institutional (N.A.), Inc.); Chairman and Chief Executive Officer, Invesco Advisers, Inc. (registered investment adviser); Director, Chairman, Chief Executive Officer and President, Invesco Holding Company (US), Inc. (formerly IVZ Inc.) (holding company), Invesco Group Services, Inc. (service provider) and Invesco North American Holdings, Inc. (holding company); Director, Chief Executive Officer and President, Invesco Holding Company Limited (parent of Invesco and a global investment management firm); Director, Invesco Ltd.; Chairman, Investment Company Institute and President, Co-Chief Executive Officer, Co-President, Chief Operating Officer and Chief Financial Officer, Franklin Resources, Inc. (global investment management organization) | 189 | None |
| 1 | Mr. Flanagan is considered an interested person (within the meaning of Section 2(a)(19) of the 1940 Act) of the Trust because he is an officer of the Adviser to the Trust, and an officer and a director of Invesco Ltd., ultimate parent of the Adviser. |
| T-1 | Invesco Peak Retirement™ Funds |
Trustees and Officers–(continued)
Name, Year of Birth and Position(s) Held with the Trust | Trustee and/or Officer Since | Principal Occupation(s) During Past 5 Years | Number of Funds in Fund Complex Overseen by Trustee | Other Directorship(s) Held by Trustee During Past 5 Years | ||||
| Independent Trustees | ||||||||
Beth Ann Brown - 1968 Trustee (2019) and Chair (August 2022) | 2019 | Independent Consultant
Formerly: Head of Intermediary Distribution, Managing Director, Strategic Relations, Managing Director, Head of National Accounts, Senior Vice President, National Account Manager and Senior Vice President, Key Account Manager, Columbia Management Investment Advisers LLC; Vice President, Key Account Manager, Liberty Funds Distributor, Inc.; and Trustee of certain Oppenheimer Funds | 189 | Director, Board of Directors of Caron Engineering Inc.; Advisor, Board of Advisors of Caron Engineering Inc.; President and Director, Acton Shapleigh Youth Conservation Corps (non-profit) Formerly: President and Director Director of Grahamtastic Connection (non-profit) | ||||
Cynthia Hostetler - 1962 Trustee | 2017 | Non-Executive Director and Trustee of a number of public and private business corporations
Formerly: Director, Aberdeen Investment Funds (4 portfolios); Director, Artio Global Investment LLC (mutual fund complex); Director, Edgen Group, Inc. (specialized energy and infrastructure products distributor); Director, Genesee & Wyoming, Inc. (railroads); Head of Investment Funds and Private Equity, Overseas Private Investment Corporation; President, First Manhattan Bancorporation, Inc.; and Attorney, Simpson Thacher & Bartlett LLP | 189 | Resideo Technologies, Inc. (smart home technology); Vulcan Materials Company (construction materials company); Trilinc Global Impact Fund; Textainer Group Holdings, (shipping container leasing company); Investment Company Institute (professional organization); and Independent Directors Council (professional organization) | ||||
Eli Jones - 1961 Trustee | 2016 | Professor and Dean Emeritus, Mays Business School - Texas A&M University
Formerly: Dean of Mays Business School-Texas A&M University; Professor and Dean, Walton College of Business, University of Arkansas and E.J. Ourso College of Business, Louisiana State University; and Director, Arvest Bank | 189 | Insperity, Inc. (formerly known as Administaff) (human resources provider); and Member of Regional Board of Directors and Board of Directors, First Financial Bancorp (regional bank) | ||||
Elizabeth Krentzman - 1959 Trustee | 2019 | Formerly: Principal and Chief Regulatory Advisor for Asset Management Services and U.S. Mutual Fund Leader of Deloitte & Touche LLP; General Counsel of the Investment Company Institute (trade association); National Director of the Investment Management Regulatory Consulting Practice, Principal, Director and Senior Manager of Deloitte & Touche LLP; Assistant Director of the Division of Investment Management - Office of Disclosure and Investment Adviser Regulation of the U.S. Securities and Exchange Commission and various positions with the Division of Investment Management – Office of Regulatory Policy of the U.S. Securities and Exchange Commission; Associate at Ropes & Gray LLP; and Trustee of certain Oppenheimer Funds | 189 | Formerly: Member of the Cartica Funds Board of Directors (private investment fund); Trustee of the University of Florida National Board Foundation; and Member of the University of Florida Law Center Association, Inc. Board of Trustees, Audit Committee and Membership Committee | ||||
Anthony J. LaCava, Jr. - 1956 Trustee | 2019 | Formerly: Director and Member of the Audit Committee, Blue Hills Bank (publicly traded financial institution) and Managing Partner, KPMG LLP | 189 | Blue Hills Bank; Chairman, Bentley University; Member, Business School Advisory Council; and Nominating Committee, KPMG LLP | ||||
Prema Mathai-Davis - 1950 Trustee | 2001 | Retired
Formerly: Co-Founder & Partner of Quantalytics Research, LLC, (a FinTech Investment Research Platform for the Self-Directed Investor); Trustee of YWCA Retirement Fund; CEO of YWCA of the USA; Board member of the NY Metropolitan Transportation Authority; Commissioner of the NYC Department of Aging; and Board member of Johns Hopkins Bioethics Institute | 189 | Member of Board of Positive Planet US (non-profit) and HealthCare Chaplaincy Network (non-profit) |
| T-2 | Invesco Peak Retirement™ Funds |
Trustees and Officers–(continued)
Name, Year of Birth and Position(s) Held with the Trust | Trustee and/or Officer Since | Principal Occupation(s) During Past 5 Years | Number of Funds in Fund Complex Overseen by Trustee | Other Directorship(s) Held by Trustee During Past 5 Years | ||||
| Independent Trustees–(continued) | ||||||||
Joel W. Motley - 1952 Trustee | 2019 | Director of Office of Finance, Federal Home Loan Bank System; Managing Director of Carmona Motley Inc. (privately held financial advisor); Member of the Council on Foreign Relations and its Finance and Budget Committee; Chairman Emeritus of Board of Human Rights Watch and Member of its Investment Committee; and Member of Investment Committee Board of Historic Hudson Valley (non-profit cultural organization); Member of the Board, Blue Ocean Acquisition Corp.; and Member of the Vestry and the Investment Committee of Trinity Church Wall Street.
Formerly: Managing Director of Public Capital Advisors, LLC (privately held financial advisor); Managing Director of Carmona Motley Hoffman, Inc. (privately held financial advisor); Trustee of certain Oppenheimer Funds; and Director of Columbia Equity Financial Corp. (privately held financial advisor) | 189 | Member of Board of Trust for Mutual Understanding (non-profit promoting the arts and environment); Member of Board of Greenwall Foundation (bioethics research foundation) and its Investment Committee; Member of Board of Friends of the LRC (non-profit legal advocacy); and Board Member and Investment Committee Member of Pulitzer Center for Crisis Reporting (non-profit journalism) | ||||
Teresa M. Ressel - 1962 Trustee | 2017 | Non-executive director and trustee of a number of public and private business corporations
Formerly: Chief Executive Officer, UBS Securities LLC (investment banking); Chief Operating Officer, UBS AG Americas (investment banking); Sr. Management Team Olayan America, The Olayan Group (international investor/commercial/industrial); Assistant Secretary for Management & Budget and Designated Chief Financial Officer, U.S. Department of Treasury and Director, ON Semiconductor Corporation (semiconductor manufacturing) | 189 | None | ||||
Robert C. Troccoli - 1949 Trustee | 2016 | Retired
Formerly: Adjunct Professor, University of Denver – Daniels College of Business; and Managing Partner, KPMG LLP | 189 | None | ||||
Daniel S. Vandivort -1954 Trustee | 2019 | President, Flyway Advisory Services LLC (consulting and property management)
Formerly: President and Chief Investment Officer, previously Head of Fixed Income, Weiss Peck and Greer/Robeco Investment Management; Trustee and Chair, Weiss Peck and Greer Funds Board; and various capacities at CS First Boston including Head of Fixed Income at First Boston Asset Management. | 189 | Formerly: Trustee and Governance Chair, Oppenheimer Funds; Treasurer, Chairman of the Audit and Finance Committee, Huntington Disease Foundation of America | ||||
| T-3 | Invesco Peak Retirement™ Funds |
Trustees and Officers–(continued)
Name, Year of Birth and Position(s) Held with the Trust | Trustee and/or Officer Since | Principal Occupation(s) During Past 5 Years | Number of Funds in Fund Complex Overseen by Trustee | Other Directorship(s) Held by Trustee During Past 5 Years | ||||
| Officers | ||||||||
Sheri Morris - 1964 President and Principal Executive Officer | 1999 | Director, Invesco Trust Company; Head of Global Fund Services, Invesco Ltd.; President and Principal Executive Officer, The Invesco Funds; Vice President, Invesco Exchange-Traded Fund Trust, Invesco Exchange-Traded Fund Trust II, Invesco India Exchange-Traded Fund Trust, Invesco Actively Managed Exchange-Traded Fund Trust, Invesco Actively Managed Exchange-Traded Commodity Fund Trust and Invesco Exchange-Traded Self-Indexed Fund Trust; and Vice President, OppenheimerFunds, Inc.
Formerly: Vice President, Treasurer and Principal Financial Officer, The Invesco Funds; Vice President, Invesco AIM Advisers, Inc., Invesco AIM Capital Management, Inc. and Invesco AIM Private Asset Management, Inc.; Assistant Vice President and Assistant Treasurer, The Invesco Funds; Vice President and Assistant Vice President, Invesco Advisers, Inc.; Assistant Vice President, Invesco AIM Capital Management, Inc. and Invesco AIM Private Asset Management, Inc.; Treasurer, Invesco Exchange-Traded Fund Trust, Invesco Exchange-Traded Fund Trust II, Invesco India Exchange-Traded Fund Trust and Invesco Actively Managed Exchange-Traded Fund Trust; and Senior Vice President, Invesco Advisers, Inc. (formerly known as Invesco Institutional (N.A.), Inc.) (registered investment adviser) | N/A | N/A | ||||
Jeffrey H. Kupor - 1968 Senior Vice President, Chief Legal Officer and Secretary | 2018 | Head of Legal of the Americas, Invesco Ltd.; Senior Vice President and Secretary, Invesco Advisers, Inc. (formerly known as Invesco Institutional (N.A.), Inc.) (registered investment adviser); Secretary, Invesco Distributors, Inc. (formerly known as Invesco AIM Distributors, Inc.); Vice President and Secretary, Invesco Investment Services, Inc. (formerly known as Invesco AIM Investment Services, Inc.); Senior Vice President, Chief Legal Officer and Secretary, The Invesco Funds; Secretary and General Counsel, Invesco Investment Advisers LLC (formerly known as Van Kampen Asset Management); Secretary and General Counsel, Invesco Capital Markets, Inc. (formerly known as Van Kampen Funds Inc.); Chief Legal Officer, Invesco Exchange-Traded Fund Trust, Invesco Exchange-Traded Fund Trust II, Invesco India Exchange-Traded Fund Trust, Invesco Actively Managed Exchange-Traded Fund Trust, Invesco Actively Managed Exchange-Traded Commodity Fund Trust and Invesco Exchange-Traded Self-Indexed Fund Trust;; Secretary and Vice President, Harbourview Asset Management Corporation; Secretary and Vice President, OppenheimerFunds, Inc. and Invesco Managed Accounts, LLC; Secretary and Senior Vice President, OFI Global Institutional, Inc.; Secretary and Vice President, OFI SteelPath, Inc.; Secretary and Vice President, Oppenheimer Acquisition Corp.; Secretary and Vice President, Shareholder Services, Inc.; and Secretary and Vice President, Trinity Investment Management Corporation
Formerly: Senior Vice President, Invesco Distributors, Inc.; Secretary and Vice President, Jemstep, Inc.; Head of Legal, Worldwide Institutional, Invesco Ltd.; Secretary and General Counsel, INVESCO Private Capital Investments, Inc.; Senior Vice President, Secretary and General Counsel, Invesco Management Group, Inc. (formerly known as Invesco AIM Management Group, Inc.); Assistant Secretary, INVESCO Asset Management (Bermuda) Ltd.; Secretary and General Counsel, Invesco Private Capital, Inc.;Assistant Secretary and General Counsel, INVESCO Realty, Inc.; Secretary and General Counsel, Invesco Senior Secured Management, Inc.; Secretary, Sovereign G./P. Holdings Inc.; Secretary, Invesco Indexing LLC; and Secretary, W.L. Ross & Co., LLC | N/A | N/A | ||||
Andrew R. Schlossberg - 1974 Senior Vice President | 2019 | Senior Vice President, Invesco Group Services, Inc.; Head of the Americas and Senior Managing Director, Invesco Ltd.; Director and Senior Vice President, Invesco Advisers, Inc. (formerly known as Invesco Institutional (N.A.), Inc.) (registered investment adviser); Director and Chairman, Invesco Investment Services, Inc. (formerly known as Invesco AIM Investment Services, Inc.) (registered transfer agent); Senior Vice President, The Invesco Funds; and Director, Invesco Investment Advisers LLC (formerly known as Van Kampen Asset Management)
Formerly: Director, President and Chairman, Invesco Insurance Agency, Inc.; Director, Invesco UK Limited; Director and Chief Executive, Invesco Asset Management Limited and Invesco Fund Managers Limited; Assistant Vice President, The Invesco Funds; Senior Vice President, Invesco Advisers, Inc. (formerly known as Invesco Institutional (N.A.), Inc.) (registered investment adviser); Director and Chief Executive, Invesco Administration Services Limited and Invesco Global Investment Funds Limited; Director, Invesco Distributors, Inc.; Head of EMEA, Invesco Ltd.; President, Invesco Actively Managed Exchange-Traded Commodity Fund Trust, Invesco Actively Managed Exchange-Traded Fund Trust, Invesco Exchange-Traded Fund Trust, Invesco Exchange-Traded Fund Trust II and Invesco India Exchange-Traded Fund Trust; and Managing Director and Principal Executive Officer, Invesco Capital Management LLC | N/A | N/A |
| T-4 | Invesco Peak Retirement™ Funds |
Trustees and Officers–(continued)
Name, Year of Birth and Position(s) Held with the Trust | Trustee and/or Officer Since | Principal Occupation(s) During Past 5 Years | Number of Funds in Fund Complex Overseen by Trustee | Other Directorship(s) Held by Trustee During Past 5 Years | ||||
| Officers–(continued) | ||||||||
John M. Zerr - 1962 Senior Vice President | 2006 | Chief Operating Officer of the Americas; Senior Vice President, Invesco Advisers, Inc. (formerly known as Invesco Institutional (N.A.), Inc.) (registered investment adviser); Senior Vice President, Invesco Distributors, Inc. (formerly known as Invesco AIM Distributors, Inc.); Director and Vice President, Invesco Investment Services, Inc. (formerly known as Invesco AIM Investment Services, Inc.) Senior Vice President, The Invesco Funds; Managing Director, Invesco Capital Management LLC; Director, Invesco Investment Advisers LLC (formerly known as Van Kampen Asset Management); Senior Vice President, Invesco Capital Markets, Inc. (formerly known as Van Kampen Funds Inc.); Manager, Invesco Indexing LLC; Manager, Invesco Specialized Products, LLC; Member, Invesco Canada Funds Advisory Board; Director, President and Chief Executive Officer, Invesco Corporate Class Inc. (corporate mutual fund company); and Director, Chairman, President and Chief Executive Officer, Invesco Canada Ltd. (formerly known as Invesco Trimark Ltd./Invesco Trimark Ltèe) (registered investment adviser and registered transfer agent); President, Invesco, Inc.; President, Invesco Global Direct Real Estate Feeder GP Ltd.; President, Invesco IP Holdings (Canada) Ltd; President, Invesco Global Direct Real Estate GP Ltd.; President, Invesco Financial Services Ltd. / Services Financiers Invesco Ltée; and Director and Chairman, Invesco Trust Company
Formerly: President, Trimark Investments Ltd/Services Financiers Invesco Ltee; Director and Senior Vice President, Invesco Insurance Agency, Inc.; Director and Senior Vice President, Invesco Management Group, Inc. (formerly known as Invesco AIM Management Group, Inc.); Secretary and General Counsel, Invesco Management Group, Inc. (formerly known as Invesco AIM Management Group, Inc.); Secretary, Invesco Investment Services, Inc. (formerly known as Invesco AIM Investment Services, Inc.); Chief Legal Officer and Secretary, The Invesco Funds; Secretary and General Counsel, Invesco Investment Advisers LLC (formerly known as Van Kampen Asset Management); Secretary and General Counsel, Invesco Capital Markets, Inc. (formerly known as Van Kampen Funds Inc.); Chief Legal Officer, Invesco Exchange-Traded Fund Trust, Invesco Exchange-Traded Fund Trust II, Invesco India Exchange-Traded Fund Trust, Invesco Actively Managed Exchange-Traded Fund Trust, Invesco Actively Managed Exchange-Traded Commodity Fund Trust and Invesco Exchange-Traded Self-Indexed Fund Trust; Secretary, Invesco Indexing LLC; Director, Secretary, General Counsel and Senior Vice President, Van Kampen Exchange Corp.; Director, Vice President and Secretary, IVZ Distributors, Inc. (formerly known as INVESCO Distributors, Inc.); Director and Vice President, INVESCO Funds Group, Inc.; Director and Vice President, Van Kampen Advisors Inc.; Director, Vice President, Secretary and General Counsel, Van Kampen Investor Services Inc.; Director and Secretary, Invesco Distributors, Inc. (formerly known as Invesco AIM Distributors, Inc.); Director, Senior Vice President, General Counsel and Secretary, Invesco AIM Advisers, Inc. and Van Kampen Investments Inc.; Director, Vice President and Secretary, Fund Management Company; Director, Senior Vice President, Secretary, General Counsel and Vice President, Invesco AIM Capital Management, Inc.; and Chief Operating Officer and General Counsel, Liberty Ridge Capital, Inc. (an investment adviser) | N/A | N/A | ||||
Gregory G. McGreevey - 1962 Senior Vice President | 2012 | Senior Managing Director, Invesco Ltd.; Director, Chairman, President, and Chief Executive Officer, Invesco Advisers, Inc. (formerly known as Invesco Institutional (N.A.), Inc.) (registered investment adviser); Director, Invesco Mortgage Capital, Inc. and Invesco Senior Secured Management, Inc.; Senior Vice President, The Invesco Funds; President, SNW Asset Management Corporation and Invesco Managed Accounts, LLC; Chairman and Director, Invesco Private Capital, Inc.; Chairman and Director, INVESCO Private Capital Investments, Inc.; Chairman and Director, INVESCO Realty, Inc.; and Senior Vice President, Invesco Group Services, Inc.
Formerly: Senior Vice President, Invesco Management Group, Inc. and Invesco Advisers, Inc.; Assistant Vice President, The Invesco Funds | N/A | N/A | ||||
Adrien Deberghes - 1967 Principal Financial Officer, Treasurer and Vice President | 2020 | Head of the Fund Office of the CFO and Fund Administration; Vice President, Invesco Advisers, Inc.; Principal Financial Officer, Treasurer and Vice President, The Invesco Funds; Vice President, Invesco Exchange-Traded Fund Trust, Invesco Exchange-Traded Fund Trust II, Invesco India Exchange-Traded Fund Trust, Invesco Actively Managed Exchange-Traded Fund Trust, Invesco Actively Managed Exchange-Traded Commodity Fund Trust and Invesco Exchange-Traded Self-Indexed Fund Trust
Formerly: Senior Vice President and Treasurer, Fidelity Investments | N/A | N/A | ||||
Crissie M. Wisdom - 1969 Anti-Money Laundering Compliance Officer | 2013 | Anti-Money Laundering and OFAC Compliance Officer for Invesco U.S. entities including: Invesco Advisers, Inc. and its affiliates, Invesco Capital Markets, Inc., Invesco Distributors, Inc., Invesco Investment Services, Inc., The Invesco Funds, Invesco Capital Management, LLC, Invesco Trust Company; and Fraud Prevention Manager for Invesco Investment Services, Inc. | N/A | N/A |
| T-5 | Invesco Peak Retirement™ Funds |
Trustees and Officers–(continued)
Name, Year of Birth and Position(s) Held with the Trust | Trustee and/or Officer Since | Principal Occupation(s) During Past 5 Years | Number of Funds in Fund Complex Overseen by Trustee | Other Directorship(s) Held by Trustee During Past 5 Years | ||||
| Officers–(continued) | ||||||||
Todd F. Kuehl - 1969 Chief Compliance Officer and Senior Vice President | 2020 | Chief Compliance Officer, Invesco Advisers, Inc. (registered investment adviser); and Chief Compliance Officer and Senior Vice President, The Invesco Funds
Formerly: Managing Director and Chief Compliance Officer, Legg Mason (Mutual Funds); Chief Compliance Officer, Legg Mason Private Portfolio Group (registered investment adviser) | N/A | N/A | ||||
James Bordewick, Jr. - 1959 Senior Vice President and Senior Officer | 2022 | Senior Vice President and Senior Officer, The Invesco Funds
Formerly: Chief Legal Officer, KingsCrowd, Inc. (research and analytical platform for investment in private capital markets); Chief Operating Officer and Head of Legal and Regulatory, Netcapital (private capital investment platform); Managing Director, General Counsel of asset management and Chief Compliance Officer for asset management and private banking, Bank of America Corporation; Chief Legal Officer, Columbia Funds and BofA Funds;
Senior Vice President and Associate General Counsel, MFS Investment Management; Chief Legal Officer, MFS Funds; Associate, Ropes & Gray; and Associate, Gaston Snow & Ely Bartlett | N/A | N/A |
The Statement of Additional Information of the Trust includes additional information about the Fund’s Trustees and is available upon request, without charge, by calling 1.800.959.4246. Please refer to the Fund’s Statement of Additional Information for information on the Fund’s sub-advisers.
| Office of the Fund | Investment Adviser | Distributor | Auditors | |||
| 11 Greenway Plaza, Suite 1000 | Invesco Advisers, Inc. | Invesco Distributors, Inc. | PricewaterhouseCoopers LLP | |||
| Houston, TX 77046-1173 | 1555 Peachtree Street, N.E. | 11 Greenway Plaza, Suite 1000 | 1000 Louisiana Street, Suite 5800 | |||
| Atlanta, GA 30309 | Houston, TX 77046-1173 | Houston, TX 77002-5021 | ||||
| Counsel to the Fund | Counsel to the Independent Trustees | Transfer Agent | Custodian | |||
| Stradley Ronon Stevens & Young, LLP | Sidley Austin LLP | Invesco Investment Services, Inc. | State Street Bank and Trust Company | |||
| 2005 Market Street, Suite 2600 | 787 Seventh Avenue | 11 Greenway Plaza, Suite 1000 | 225 Franklin Street | |||
| Philadelphia, PA 19103-7018 | New York, NY 10019 | Houston, TX 77046-1173 | Boston, MA 02110-2801 | |||
| T-6 | Invesco Peak Retirement™ Funds |
(This page intentionally left blank)
(This page intentionally left blank)

Go paperless with eDelivery
Visit invesco.com/edelivery to enjoy the convenience and security of anytime electronic access to your investment documents.
With eDelivery, you can elect to have any or all of the following materials delivered straight to your inbox to download, save and print from your own computer:
∎ Fund reports and prospectuses
∎ Quarterly statements
∎ Daily confirmations
∎ Tax forms
Invesco mailing information
Send general correspondence to Invesco Investment Services, Inc., P.O. Box 219078, Kansas City, MO 64121-9078.
Important notice regarding delivery of security holder documents
To reduce Fund expenses, only one copy of most shareholder documents may be mailed to shareholders with multiple accounts at the same address (Householding). Mailing of your shareholder documents may be householded indefinitely unless you instruct us otherwise. If you do not want the mailing of these documents to be combined with those for other members of your household, please contact Invesco Investment Services, Inc. at 800 959 4246 or contact your financial institution. We will begin sending you individual copies for each account within 30 days after receiving your request.
Fund holdings and proxy voting information
The Fund provides a complete list of its portfolio holdings four times each year, at the end of each fiscal quarter. For the second and fourth quarters, the list appears, respectively, in the Fund’s semiannual and annual reports to shareholders. For the first and third quarters, the Fund files the list with the Securities and Exchange Commission (SEC) as an exhibit to its reports on Form N-PORT. The most recent list of portfolio holdings is available at invesco.com/completeqtrholdings. Shareholders can also look up the Fund’s Form N-PORT filings on the SEC website, sec.gov. The SEC file numbers for the Fund are shown below.
A description of the policies and procedures that the Fund uses to determine how to vote proxies relating to portfolio securities is available without charge, upon request, from our Client Services department at 800 959 4246, or at invesco.com/corporate/about-us/esg. The information is also available on the SEC website, sec.gov.
Information regarding how the Fund voted proxies related to its portfolio securities during the most recent 12-month period ended June 30 is available at invesco.com/proxysearch. This information is also available on the SEC website, sec.gov.
Invesco Advisers, Inc. is an investment adviser; it provides investment advisory services to individual and institutional clients and does not sell securities. Invesco Distributors, Inc. is the US distributor for Invesco Ltd.’s retail mutual funds, exchange-traded funds and institutional money market funds. Both are wholly owned, indirect subsidiaries of Invesco Ltd.
| SEC file number(s): 811-02699 and 002-57526 | Invesco Distributors, Inc. | PR-AR-1 |

Annual Report to Shareholders | December 31, 2022 |
Invesco Quality Income Fund
Nasdaq:
A: VKMGX ∎ C: VUSCX ∎ R: VUSRX ∎ Y: VUSIX ∎ R5: VUSJX ∎ R6: VUSSX
Management’s Discussion of Fund Performance
|
For the fiscal year ended December 31, 2022, Class A shares of Invesco Quality Income Fund (the Fund), at net asset value (NAV), underperformed the Bloomberg U.S. Mortgage-Backed Securities Index, the Fund’s broad market/style-specific benchmark. |
Your Fund’s long-term performance appears later in this report.
|
Fund vs. Indexes |
Total returns, 12/31/21 to 12/31/22, at net asset value (NAV). Performance shown does not include applicable contingent deferred sales charges (CDSC) or front-end sales charges, which would have reduced performance. |
Class A Shares | -12.52 | % | ||
Class C Shares | -13.12 | |||
Class R Shares | -12.76 | |||
Class Y Shares | -12.26 | |||
Class R5 Shares | -12.26 | |||
Class R6 Shares | -12.16 | |||
Bloomberg U.S. Mortgage-Backed Securities Index▼ (Broad Market/Style- Specific Index) | -11.81 | |||
Source(s): ▼RIMES Technologies Corp.
|
Market conditions and your Fund
2022 was a year the bond market would like to forget. Our expectations coming into 2022 were that inflation was transitory. As of December 31, 2021, futures markets expected the US Federal Reserve (the Fed) to hike three times during 2022 and end with a Fed funds rate of 0.80%. The Fed hiked nine times during 2022 bringing the Fed funds to 4.25% as of the end of the fiscal year.
We believe there is reason to be more optimistic on bond market prospects for 2023 as headline Consumer Price Index inflation peaked at a rate of 9.1% annualized in June 2022 and has retreated to 6.5% as of December 31, 2022. The employment situation has remained strong for job seekers and challenging for employers. Average non-farm monthly payrolls registered 385,000 during 2022, but the quarterly average for the fourth quarter had fallen to approximately 250,000 monthly new jobs.1 While this is still higher than where the Fed would desire this figure, progress is being made. Additionally, average hourly earnings fell from 5.6% in the spring to 4.6% as of December 31, 2022,1 indicating some further progress in the Fed’s efforts to slow wage inflation.
The yield curve flattened and inverted this fiscal year given the unanticipated nature of inflation and the Fed moves, with the one-year Treasury rate increasing by 431 basis points, while the 10-year Treasury rate increased by 236 basis points. As of December 31, 2022, the one-year rate was 81 basis points higher than the 10-year rate.1
Given this market backdrop, Class A shares of Invesco Quality Income Fund, at NAV, generated a negative return and underperformed its broad market/style-specific index, the Bloomberg U.S. Mortgage-Backed Securities Index. Sector allocation and security selection within fixed-rate MBS lower coupons were
significant contributors to relative Fund performance during the fiscal year. Duration and yield curve positioning proved to be the largest detractor from relative Fund performance for the fiscal year. The Fund’s modest exposure to out-of-index structured credit also detracted from relative Fund performance.
The Fund utilizes duration and yield curve positioning for risk management and for generating returns. We believe duration measures a portfolio’s price sensitivity to interest rate changes, with a shorter duration tending to be less sensitive to these changes. Yield curve positioning refers to actively emphasizing points (maturities) along the yield curve with favorable risk-return expectations. During the fiscal year, duration was managed with cash, bonds and futures positions. Buying and selling interest rate futures contracts was an important tool we used to manage interest rate risk.
Our strategy is implemented using derivative instruments, including futures, swaps and options. Therefore, a portion of the performance of the Fund, both positive and negative, can be attributed to these instruments. We believe derivatives can be a cost-effective way to gain or hedge exposure to certain risks and asset classes. However, derivatives may amplify traditional investment risks through the creation of leverage and may be less liquid than traditional securities.
We wish to remind you that the Fund is subject to interest rate risk, meaning when interest rates rise, the value of fixed-income securities tends to fall. The degree to which the value of fixed-income securities may decline due to rising interest rates may vary depending on the speed and magnitude of the increase in interest rates as well as individual security characteristics, such as price, maturity, duration and coupon and market forces such as supply and demand for similar securities. We are monitoring interest rates and the
market, economic and geopolitical factors that may impact the direction, speed and magnitude of changes to interest rates across the maturity spectrum, including the potential impact of monetary policy changes by the Fed and certain foreign central banks. If interest rates continue to rise, markets may experience increased volatility, which may affect the value and/or liquidity of certain investments.
We welcome new investors who joined the Fund during the year and thank you for your investment in Invesco Quality Income Fund.
1 Source: Bloomberg LP
Portfolio manager(s):
Mario Clemente
Clint Dudley
Brian Norris
The views and opinions expressed in management’s discussion of Fund performance are those of Invesco Advisers, Inc. and its affiliates. These views and opinions are subject to change at any time based on factors such as market and economic conditions. These views and opinions may not be relied upon as investment advice or recommendations, or as an offer for a particular security. The information is not a complete analysis of every aspect of any market, country, industry, security or the Fund. Statements of fact are from sources considered reliable, but Invesco Advisers, Inc. makes no representation or warranty as to their completeness or accuracy. Although historical performance is no guarantee of future results, these insights may help you understand our investment management philosophy.
See important Fund and, if applicable, index disclosures later in this report.
| 2 Invesco Quality Income Fund |
Your Fund’s Long-Term Performance
Results of a $10,000 Investment – Oldest Share Class(es)
Fund and index data from 12/31/12
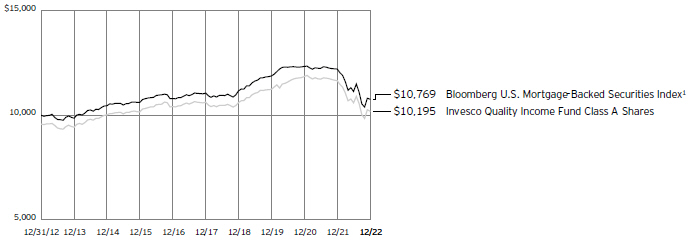
| 1 | Source: RIMES Technologies Corp. |
Past performance cannot guarantee future results.
The data shown in the chart include reinvested distributions, applicable sales charges and Fund expenses including management
fees. Index results include reinvested dividends, but they do not reflect sales charges. Performance of the peer group, if applicable, reflects fund expenses and management fees;
performance of a market index does not. Performance shown in the chart does not reflect deduction of taxes a shareholder would pay on Fund distributions or sale of Fund shares.
| 3 Invesco Quality Income Fund |
Average Annual Total Returns |
| |||
As of 12/31/22, including maximum applicable sales charges |
| |||
Class A Shares | ||||
Inception (5/31/84) | 5.25% | |||
10 Years | 0.19 | |||
5 Years | -1.68 | |||
1 Year | -16.21 | |||
Class C Shares | ||||
Inception (8/13/93) | 3.16% | |||
10 Years | 0.03 | |||
5 Years | -1.56 | |||
1 Year | -13.98 | |||
Class R Shares | ||||
10 Years | 0.35% | |||
5 Years | -1.11 | |||
1 Year | -12.76 | |||
Class Y Shares | ||||
Inception (9/25/06) | 2.31% | |||
10 Years | 0.88 | |||
5 Years | -0.57 | |||
1 Year | -12.26 | |||
Class R5 Shares | ||||
Inception (6/1/10) | 1.70% | |||
10 Years | 0.93 | |||
5 Years | -0.55 | |||
1 Year | -12.26 | |||
Class R6 Shares | ||||
10 Years | 0.85% | |||
5 Years | -0.47 | |||
1 Year | -12.16 | |||
Effective June 1, 2010, Class A, Class C and Class I shares of the predecessor fund, Van Kampen U.S. Mortgage Fund, advised by Van Kampen Asset Management were reorganized into Class A, Class C and Class Y shares, respectively, of Invesco Van Kampen U.S. Mortgage Fund (renamed Invesco U.S. Mortgage Fund and subsequently Invesco Quality Income Fund). Returns shown above, prior to June 1, 2010, for Class A, Class C and Class Y shares are those for Class A, Class C and Class I shares of the predecessor fund. Share class returns will differ from the predecessor fund because of different expenses.
Class R shares incepted on May 15, 2020. Performance shown prior to that date is that of the Fund’s Class A shares at net asset value, restated to reflect the higher 12b-1 fees applicable to Class R shares.
Class R6 shares incepted on April 4, 2017. Performance shown prior to that date is that of the Fund’s Class A shares at net asset value and includes the 12b-1 fees applicable to Class A shares.
The performance data quoted represent past performance and cannot guarantee future results; current performance may be lower or higher. Please visit invesco.com/performance for the most recent month-end performance. Performance figures reflect reinvested distributions, changes in
net asset value and the effect of the maximum sales charge unless otherwise stated. Performance figures do not reflect deduction of taxes a shareholder would pay on Fund distributions or sale of Fund shares. Investment return and principal value will fluctuate so that you may have a gain or loss when you sell shares.
Class A share performance reflects the maximum 4.25% sales charge, and Class C share performance reflects the applicable contingent deferred sales charge (CDSC) for the period involved. The CDSC on Class C shares is 1% for the first year after purchase. Class R, Class Y, Class R5 and Class R6 shares do not have a front-end sales charge or a CDSC; therefore, performance is at net asset value.
The performance of the Fund’s share classes will differ primarily due to different sales charge structures and class expenses.
Fund performance reflects any applicable fee waivers and/or expense reimbursements. Had the adviser not waived fees and/or reimbursed expenses currently or in the past, returns would have been lower. See current prospectus for more information.
| 4 Invesco Quality Income Fund |
Invesco Quality Income Fund’s investment objective is to provide a high level of current income, with liquidity and safety of principal.
| ∎ | Unless otherwise stated, information presented in this report is as of December 31, 2022, and is based on total net assets. |
| ∎ | Unless otherwise noted, all data is provided by Invesco. |
| ∎ | To access your Fund’s reports/prospectus, visit invesco.com/fundreports. |
About indexes used in this report
| ∎ | The Bloomberg U.S. Mortgage-Backed Securities Index represents mortgage-backed pass-through securities of Ginnie Mae, Fannie Mae and Freddie Mac. |
| ∎ | The Fund is not managed to track the performance of any particular index, including the index(es) described here, and consequently, the performance of the Fund may deviate significantly from the performance of the index(es). |
| ∎ | A direct investment cannot be made in an index. Unless otherwise indicated, index results include reinvested dividends, and they do not reflect sales charges. Performance of the peer group, if applicable, reflects fund expenses; performance of a market index does not. |
This report must be accompanied or preceded by a currently effective Fund prospectus, which contains more complete information, including sales charges and expenses. Investors should read it carefully before investing. |
| NOT FDIC INSURED | MAY LOSE VALUE | NO BANK GUARANTEE |
| 5 Invesco Quality Income Fund |
Fund Information
Portfolio Composition
| By security type | % of total investments | |
U.S. Government Sponsored Agency Mortgage- Backed Securities | 82.53% | |
Asset-Backed Securities | 6.22 | |
Commercial Paper | 5.83 | |
Certificate of Deposit | 2.46 | |
Security types each less than 1% of portfolio | 1.11 | |
Money Market Funds | 1.85 | |
| Top Five Debt Issuers* | ||
| % of total net assets | ||
1. Federal National Mortgage Association | 68.35% | |
2. Federal Home Loan Mortgage Corp. | 23.67 | |
3. Government National Mortgage Association | 15.25 | |
4. Canadian Imperial Bank of Commerce | 3.38 | |
5. Societe Generale S.A. | 2.92 | |
The Fund’s holdings are subject to change, and there is no assurance that the Fund will continue to hold any particular security.
| * | Excluding money market fund holdings, if any. |
Data presented here are as of December 31, 2022.
| 6 Invesco Quality Income Fund |
December 31, 2022
| Principal Amount | Value | |||||
U.S. Government Sponsored Agency Mortgage-Backed Securities–113.23% | ||||||
Collateralized Mortgage Obligations–5.96% | ||||||
Fannie Mae Grantor Trust, 7.50%, 01/19/2039(a) | $ | 115,285 | $ 116,234 | |||
| ||||||
Fannie Mae Interest STRIPS, | 112,786 | 8,943 | ||||
| ||||||
6.50%, 10/25/2024 to 02/25/2033(b) | 1,155,965 | 174,376 | ||||
| ||||||
7.00%, 02/25/2028(b) | 211,229 | 20,417 | ||||
| ||||||
8.00%, 05/25/2030(b) | 267,718 | 47,595 | ||||
| ||||||
6.00%, 02/25/2033 to 09/25/2035(b)(d) | 1,480,015 | 227,907 | ||||
| ||||||
5.50%, 11/25/2033 to 06/25/2035(b) | 678,069 | 114,115 | ||||
| ||||||
PO, | 39,500 | 34,058 | ||||
| ||||||
Fannie Mae REMICs, | 1,548,127 | 189,364 | ||||
| ||||||
4.00%, 07/25/2024 to 08/25/2047(b) | 898,704 | 591,773 | ||||
| ||||||
2.50%, 12/25/2025 to 08/25/2049(b) | 22,635,102 | 3,611,064 | ||||
| ||||||
5.50%, 12/25/2025 to 07/25/2046(b) | 489,577 | 207,787 | ||||
| ||||||
7.00%, 03/18/2027 to 05/25/2033(b) | 473,023 | 282,305 | ||||
| ||||||
6.50%, 10/25/2028 to 05/25/2033(b) | 125,171 | 113,618 | ||||
| ||||||
5.39% (1 mo. USD LIBOR + 1.00%), 12/25/2031 to 12/25/2032(e) | 362,363 | 364,500 | ||||
| ||||||
5.34% (1 mo. USD LIBOR + 1.00%), 03/18/2032 to 12/18/2032(e) | 306,405 | 308,810 | ||||
| ||||||
4.89% (1 mo. USD LIBOR + 0.50%), 08/25/2032 to 06/25/2046(e) | 1,099,226 | 1,083,402 | ||||
| ||||||
4.84% (1 mo. USD LIBOR + 0.50%), 10/18/2032(e) | 33,669 | 33,324 | ||||
| ||||||
4.79% (1 mo. USD LIBOR + 0.40%), 03/25/2033 to 03/25/2042(e) | 180,394 | 177,222 | ||||
| ||||||
4.73% (1 mo. USD LIBOR + 0.34%), 06/25/2035(e) | 804,512 | 792,351 | ||||
| ||||||
4.74% (1 mo. USD LIBOR + 0.35%), 08/25/2035 to 10/25/2035(e) | 659,276 | 652,231 | ||||
| ||||||
8.47% (24.57% - (3.67 x 1 mo. USD LIBOR)), 03/25/2036(e) | 129,317 | 150,263 | ||||
| ||||||
8.11% (24.20% - (3.67 x 1 mo. USD LIBOR)), 06/25/2036(e) | 86,274 | 100,783 | ||||
| ||||||
8.11% (24.20% - (3.67 x 1 mo. USD LIBOR)), 06/25/2036(e) | 86,162 | 95,130 | ||||
| ||||||
5.33% (1 mo. USD LIBOR + 0.94%), 06/25/2037(e) | 641,375 | 645,427 | ||||
| ||||||
4.84% (1 mo. USD LIBOR + 0.45%), 08/25/2037(e) | 352,222 | 345,204 | ||||
| ||||||
| Principal Amount | Value | |||||
Collateralized Mortgage Obligations–(continued) | ||||||
6.60%, 06/25/2039(a) | $ | 347,396 | $ 363,274 | |||
| ||||||
5.00%, 04/25/2040 | 198,257 | 196,044 | ||||
| ||||||
2.00%, 05/25/2044 to 03/25/2051(b) | 6,733,490 | 1,122,253 | ||||
| ||||||
IO, 2.31% (6.70% - (1.00 x 1 mo. USD LIBOR)), 02/25/2024 to | 636,730 | 43,413 | ||||
| ||||||
3.00%, 10/25/2026 to 07/25/2045(b) | 8,265,161 | 4,481,678 | ||||
| ||||||
8.00%, 08/18/2027 to 09/18/2027(b) | 169,824 | 17,504 | ||||
| ||||||
0.75%, 10/25/2031(b) | 3,353 | 56 | ||||
| ||||||
3.51% (7.90% - (1.00 x 1 mo. USD LIBOR)), 11/25/2031(b)(e) | 78,532 | 7,700 | ||||
| ||||||
3.56% (7.90% - (1.00 x 1 mo. USD LIBOR)), 12/18/2031(b)(e) | 62,892 | 4,875 | ||||
| ||||||
3.56% (7.95% - (1.00 x 1 mo. USD LIBOR)), 01/25/2032(b)(e) | 50,236 | 4,648 | ||||
| ||||||
3.66% (8.00% - (1.00 x 1 mo. USD LIBOR)), 03/18/2032(b)(e) | 120,066 | 12,037 | ||||
| ||||||
3.71% (8.10% - (1.00 x 1 mo. USD LIBOR)), 03/25/2032 to | 161,633 | 16,689 | ||||
| ||||||
2.61% (7.00% - (1.00 x 1 mo. USD LIBOR)), 04/25/2032 to | 264,172 | 19,024 | ||||
| ||||||
3.41% (7.80% - (1.00 x 1 mo. USD LIBOR)), 04/25/2032(b)(e) | 55,395 | 5,669 | ||||
| ||||||
3.61% (8.00% - (1.00 x 1 mo. USD LIBOR)), 07/25/2032 to | 358,825 | 39,253 | ||||
| ||||||
3.76% (8.10% - (1.00 x 1 mo. USD LIBOR)), 12/18/2032(b)(e) | 222,717 | 19,424 | ||||
| ||||||
3.86% (8.25% - (1.00 x 1 mo. USD LIBOR)), 02/25/2033 to | 293,553 | 39,056 | ||||
| ||||||
6.00%, 05/25/2033(b) | 15,988 | 2,796 | ||||
| ||||||
1.66% (6.05% - (1.00 x 1 mo. USD LIBOR)), 03/25/2035 to | 875,132 | 49,411 | ||||
| ||||||
2.36% (6.75% - (1.00 x 1 mo. USD LIBOR)), 03/25/2035(b)(e) | 51,069 | 3,346 | ||||
| ||||||
2.21% (6.60% - (1.00 x 1 mo. USD LIBOR)), 05/25/2035(b)(e) | 176,804 | 10,221 | ||||
| ||||||
2.26% (6.65% - (1.00 x 1 mo. USD LIBOR)), 03/25/2039(b)(e) | 442,133 | 2,440 | ||||
| ||||||
2.16% (6.55% - (1.00 x 1 mo. USD LIBOR)), 10/25/2041(b)(e) | 146,562 | 9,564 | ||||
| ||||||
1.76% (6.15% - (1.00 x 1 mo. USD LIBOR)), 12/25/2042(b)(e) | 411,352 | 41,303 | ||||
| ||||||
4.50%, 02/25/2043(b) | 357,272 | 53,709 | ||||
| ||||||
1.51% (5.90% - (1.00 x 1 mo. USD LIBOR)), 09/25/2047(b)(e) | 1,710,386 | 118,611 | ||||
| ||||||
0.00%, 02/25/2056(d) | 4,993,846 | 237,090 | ||||
| ||||||
See accompanying Notes to Financial Statements which are an integral part of the financial statements.
| 7 Invesco Quality Income Fund |
| Principal Amount | Value | |||||
Collateralized Mortgage Obligations–(continued) | ||||||
Freddie Mac Multifamily Structured Pass-Through Ctfs., Series KC02, Class X1, IO, | $ | 217,192,043 | $ 879,823 | |||
| ||||||
Series KC03, Class X1, IO, 0.63%, 11/25/2024(d) | 21,067,303 | 204,926 | ||||
| ||||||
0.50%, 09/25/2025(a) | 56,601,408 | 638,888 | ||||
| ||||||
Series K734, Class X1, IO, 0.65%, 02/25/2026(d) | 16,713,087 | 265,190 | ||||
| ||||||
Series K735, Class X1, IO, 1.10%, 05/25/2026(d) | 15,654,848 | 406,243 | ||||
| ||||||
Series K093, Class X1, IO, 0.95%, 05/25/2029(d) | 13,203,973 | 630,136 | ||||
| ||||||
Series Q004, Class AFL, 3.17%(12 mo. MTA Rate + 0.74%), 05/25/2044(e) | 365,628 | 365,596 | ||||
| ||||||
Freddie Mac REMICs, | 16,969 | 16,911 | ||||
| ||||||
2.00%, 12/15/2023 | 177,734 | 174,149 | ||||
| ||||||
2.66% (COFI 11 + 1.37%), 03/15/2024(e) | 35,266 | 35,387 | ||||
| ||||||
4.00%, 10/15/2024 to 03/15/2045(b) | 308,566 | 194,370 | ||||
| ||||||
3.50%, 11/15/2025 to 05/15/2032 | 689,479 | 664,535 | ||||
| ||||||
3.00%, 07/15/2026 to 05/15/2040(b) | 4,353,463 | 490,418 | ||||
| ||||||
1.50%, 08/15/2027 | 5,999,327 | 5,327,181 | ||||
| ||||||
6.95%, 03/15/2028 | 113,930 | 116,634 | ||||
| ||||||
6.50%, 08/15/2028 to 03/15/2032 | 1,191,093 | 1,212,665 | ||||
| ||||||
4.92% (1 mo. USD LIBOR + 0.60%), 01/15/2029 to 12/15/2032(e) | 85,749 | 85,338 | ||||
| ||||||
6.00%, 01/15/2029 to 04/15/2029 | 184,723 | 187,646 | ||||
| ||||||
4.67% (1 mo. USD LIBOR + 0.35%), 02/15/2029(e) | 98,700 | 97,661 | ||||
| ||||||
5.02% (1 mo. USD LIBOR + 0.90%), 03/15/2029(e) | 110,414 | 110,463 | ||||
| ||||||
4.72% (1 mo. USD LIBOR + 0.40%), 06/15/2029 to 01/15/2033(e) | 147,127 | 145,526 | ||||
| ||||||
4.97% (1 mo. USD LIBOR + 0.65%), 07/15/2029(e) | 26,172 | 26,069 | ||||
| ||||||
8.00%, 03/15/2030 | 52,826 | 55,468 | ||||
| ||||||
5.27% (1 mo. USD LIBOR + 0.95%), 08/15/2031(e) | 82,047 | 82,552 | ||||
| ||||||
4.82% (1 mo. USD LIBOR + 0.50%), 02/15/2032 to 03/15/2032(e) | 248,883 | 246,349 | ||||
| ||||||
5.32% (1 mo. USD LIBOR + 1.00%), 02/15/2032 to 03/15/2032(e) | 168,125 | 169,269 | ||||
| ||||||
4.87% (1 mo. USD LIBOR + 0.55%), 03/15/2032 to 10/15/2036(e) | 483,392 | 476,162 | ||||
| ||||||
8.92% (24.75% - (3.67 x 1 mo. USD LIBOR)), 08/15/2035(e) | 23,125 | 27,176 | ||||
| ||||||
4.62% (1 mo. USD LIBOR + 0.30%), 03/15/2036(e) | 1,310,005 | 1,283,226 | ||||
| ||||||
4.77% (1 mo. USD LIBOR + 0.45%), 07/15/2037(e) | 68,008 | 66,885 | ||||
| ||||||
| Principal Amount | Value | |||||
Collateralized Mortgage Obligations–(continued) | ||||||
3.66% (1 mo. USD LIBOR + 0.50%), 03/15/2042(e) | $ | 113,991 | $ 114,019 | |||
| ||||||
IO, | 176,399 | 3,310 | ||||
| ||||||
3.33% (7.65% - (1.00 x 1 mo. USD LIBOR)), 07/15/2026(b)(e) | 16,718 | 447 | ||||
| ||||||
2.50%, 09/15/2027 to 09/25/2048(b) | 10,710,419 | 2,179,693 | ||||
| ||||||
4.36% (8.70% - (1.00 x 1 mo. USD LIBOR)), | 23,591 | 362 | ||||
| ||||||
3.78% (8.10% - (1.00 x 1 mo. USD LIBOR)), 06/15/2029 to 09/15/2029(b)(e) | 158,336 | 9,576 | ||||
| ||||||
2.38% (6.70% - (1.00 x 1 mo. USD LIBOR)), | 714,808 | 35,102 | ||||
| ||||||
2.43% (6.75% - (1.00 x 1 mo. USD LIBOR)), | 110,074 | 5,771 | ||||
| ||||||
2.40% (6.72% - (1.00 x 1 mo. USD LIBOR)), | 177,766 | 9,568 | ||||
| ||||||
2.68% (7.00% - (1.00 x 1 mo. USD LIBOR)), | 14,213 | 1,420 | ||||
| ||||||
1.75% (6.07% - (1.00 x 1 mo. USD LIBOR)), | 880,430 | 65,601 | ||||
| ||||||
0.02%, 02/15/2039(d) | 1,893,688 | 88,349 | ||||
| ||||||
1.93% (6.25% - (1.00 x 1 mo. USD LIBOR)), | 229,329 | 14,797 | ||||
| ||||||
1.78% (6.10% - (1.00 x 1 mo. USD LIBOR)), | 281,860 | 28,167 | ||||
| ||||||
Freddie Mac Seasoned Loans Structured Transaction, Series 2019-1, Class A2, | 2,000,000 | 1,837,292 | ||||
| ||||||
Freddie Mac STRIPS, | 385,804 | 20,575 | ||||
| ||||||
3.27%, 12/15/2027(d) | 98,194 | 4,535 | ||||
| ||||||
6.50%, 02/01/2028(b) | 23,810 | 2,523 | ||||
| ||||||
7.00%, 09/01/2029(b) | 225,263 | 31,485 | ||||
| ||||||
7.50%, 12/15/2029(b) | 15,240 | 2,311 | ||||
| ||||||
8.00%, 06/15/2031(b) | 391,628 | 75,944 | ||||
| ||||||
6.00%, 12/15/2032(b) | 81,837 | 10,592 | ||||
| ||||||
0.00%, 12/01/2031 to 03/01/2032(c) | 210,173 | 181,579 | ||||
| ||||||
4.82%(1 mo. USD LIBOR + 0.50%), 05/15/2036(e) | 560,615 | 558,218 | ||||
| ||||||
Freddie Mac Structured | 1,256,343 | 1,311,445 | ||||
| ||||||
Freddie Mac Whole Loan Securities Trust, Series 2015-SC02, Class 1A, | 256,601 | 237,751 | ||||
| ||||||
| 38,922,565 | ||||||
| ||||||
See accompanying Notes to Financial Statements which are an integral part of the financial statements.
| 8 Invesco Quality Income Fund |
| Principal Amount | Value | |||||
Federal Home Loan Mortgage Corp. (FHLMC)–23.67% | ||||||
9.00%, 08/01/2022 to 05/01/2025 | $ | 3,057 | $ 3,105 | |||
| ||||||
5.50%, 01/01/2024 to 11/01/2052 | 22,725,596 | 22,925,754 | ||||
| ||||||
6.00%, 07/01/2024 to 10/01/2029 | 201,686 | 206,465 | ||||
| ||||||
6.50%, 10/17/2024 to 04/01/2034 | 459,722 | 472,724 | ||||
| ||||||
2.50%, 02/01/2031 to 10/01/2051 | 19,496,331 | 16,727,260 | ||||
| ||||||
8.50%, 03/01/2031 to 08/01/2031 | 108,728 | 114,551 | ||||
| ||||||
7.00%, 10/01/2031 to 10/01/2037 | 174,290 | 180,591 | ||||
| ||||||
7.50%, 01/01/2032 to 08/01/2037 | 4,671,515 | 4,880,529 | ||||
| ||||||
3.00%, 02/01/2032 to 05/01/2050 | 33,571,890 | 30,488,397 | ||||
| ||||||
8.00%, 08/01/2032 | 69,254 | 72,477 | ||||
| ||||||
5.00%, 01/01/2037 to 07/01/2052 | 9,510,486 | 9,462,291 | ||||
| ||||||
4.50%, 05/01/2038 to 07/01/2052 | 17,507,468 | 17,087,287 | ||||
| ||||||
5.35%, 07/01/2038 to 10/17/2038 | 1,053,785 | 1,062,374 | ||||
| ||||||
5.45%, 11/25/2038 | 1,056,896 | 1,068,059 | ||||
| ||||||
5.80%, 01/20/2039 | 443,662 | 442,845 | ||||
| ||||||
4.00%, 06/01/2042 to 07/01/2049 | 18,200,973 | 17,506,823 | ||||
| ||||||
3.50%, 09/01/2045 to 05/01/2050 | 18,503,923 | 17,150,578 | ||||
| ||||||
2.00%, 12/01/2051 to 01/01/2052 | 17,878,430 | 14,697,400 | ||||
| ||||||
| 154,549,510 | ||||||
| ||||||
Federal National Mortgage Association (FNMA)–42.90% | ||||||
2.00%, 03/01/2023 to 01/01/2052 | 60,965,237 | 51,707,679 | ||||
| ||||||
5.00%, 03/01/2023 to 01/01/2041 | 2,131,761 | 2,164,037 | ||||
| ||||||
6.00%, 05/01/2023 to 05/01/2040 | 1,527,686 | 1,573,101 | ||||
| ||||||
7.00%, 07/01/2023 to 01/01/2036 | 1,321,713 | 1,355,361 | ||||
| ||||||
6.50%, 08/01/2023 to 11/01/2038 | 2,194,033 | 2,262,941 | ||||
| ||||||
5.50%, 01/01/2024 to 04/01/2038 | 2,924,184 | 2,998,284 | ||||
| ||||||
4.50%, 07/01/2025 to 07/01/2044 | 3,815,890 | 3,786,791 | ||||
| ||||||
7.50%, 02/01/2027 to 08/01/2037 | 1,857,445 | 1,927,500 | ||||
| ||||||
3.59%, 10/01/2028 | 9,586,000 | 9,192,482 | ||||
| ||||||
3.00%, 02/01/2029 to 01/01/2052 | 64,119,673 | 57,917,399 | ||||
| ||||||
9.50%, 04/01/2030 | 5,019 | 5,130 | ||||
| ||||||
5.63%, 08/01/2032 | 66,310 | 65,723 | ||||
| ||||||
8.50%, 10/01/2032 | 152,386 | 163,153 | ||||
| ||||||
8.00%, 04/01/2033 | 155,393 | 165,425 | ||||
| ||||||
3.50%, 11/01/2034 to 05/01/2050 | 44,523,654 | 41,882,227 | ||||
| ||||||
2.50%, 03/01/2035 to 04/01/2052 | 78,123,997 | 67,020,147 | ||||
| ||||||
| Principal Amount | Value | |||||
Federal National Mortgage Association (FNMA)–(continued) | ||||||
5.45%, 01/01/2038 | $ | 243,415 | $ 243,052 | |||
| ||||||
4.00%, 02/01/2042 to 03/01/2050 | 37,181,274 | 35,645,015 | ||||
| ||||||
| 280,075,447 | ||||||
| ||||||
Government National Mortgage Association (GNMA)–15.25% | ||||||
7.00%, 05/15/2023 to 01/20/2030 | 169,885 | 171,577 | ||||
| ||||||
6.50%, 01/15/2024 to 10/15/2028 | 21,873 | 22,537 | ||||
| ||||||
3.00%, 12/16/2025 to 02/20/2050 | 2,772,748 | 2,493,130 | ||||
| ||||||
6.00%, 06/15/2028 to 04/20/2029 | 73,683 | 75,366 | ||||
| ||||||
7.50%, 06/15/2028 to 08/15/2028 | 105,181 | 105,485 | ||||
| ||||||
8.00%, 09/15/2028 | 3,377 | 3,375 | ||||
| ||||||
5.50%, 05/15/2033 to 10/15/2034 | 285,176 | 296,397 | ||||
| ||||||
7.11%, 11/20/2033(a) | 879,806 | 916,918 | ||||
| ||||||
5.00%, 11/20/2037 | 345,256 | 340,689 | ||||
| ||||||
5.90%, 01/20/2039(a) | 783,987 | 807,658 | ||||
| ||||||
4.52%, 07/20/2041(a) | 784,713 | 773,185 | ||||
| ||||||
2.44%, 09/20/2041 | 615,473 | 591,798 | ||||
| ||||||
2.53% (1 mo. USD LIBOR + 0.45%), 07/20/2044(e) | 432,554 | 422,631 | ||||
| ||||||
3.50%, 05/20/2046 to 06/20/2050 | 12,020,479 | 11,204,576 | ||||
| ||||||
4.00%, 02/20/2048 to 03/20/2050 | 4,276,716 | 4,079,280 | ||||
| ||||||
IO, | 1,255,644 | 72,647 | ||||
| ||||||
4.50%, 09/16/2047(b) | 746,463 | 124,535 | ||||
| ||||||
1.87% (6.20% - (1.00 x 1 mo. USD LIBOR)), 10/16/2047(b)(e) | 666,873 | 58,431 | ||||
| ||||||
TBA, | 4,984,000 | 4,178,107 | ||||
| ||||||
2.50%, 01/01/2053(f) | 23,848,000 | 20,672,086 | ||||
| ||||||
3.00%, 01/01/2053(f) | 29,450,000 | 26,229,658 | ||||
| ||||||
3.50%, 01/01/2053(f) | 9,700,000 | 8,913,599 | ||||
| ||||||
4.50%, 01/01/2053(f) | 7,200,000 | 6,985,620 | ||||
| ||||||
5.00%, 01/01/2053(f) | 3,600,000 | 3,567,750 | ||||
| ||||||
Series 2020-137, Class A, 1.50%, 04/16/2062 | 7,928,041 | 6,422,559 | ||||
| ||||||
| 99,529,594 | ||||||
| ||||||
Uniform Mortgage-Backed Securities–25.45% | ||||||
TBA, | 21,600,000 | 21,059,102 | ||||
| ||||||
2.00%, 01/01/2053(f) | 40,919,000 | 33,305,161 | ||||
| ||||||
2.50%, 01/01/2053(f) | 39,845,000 | 33,748,040 | ||||
| ||||||
3.50%, 01/01/2053(f) | 25,380,000 | 23,060,654 | ||||
| ||||||
4.50%, 01/01/2053(f) | 17,200,000 | 16,556,183 | ||||
| ||||||
5.00%, 01/01/2053(f) | 21,700,000 | 21,386,086 | ||||
| ||||||
5.50%, 01/01/2053(f) | 17,000,000 | 17,047,245 | ||||
| ||||||
| 166,162,471 | ||||||
| ||||||
Total U.S. Government Sponsored Agency Mortgage-Backed Securities |
| 739,239,587 | ||||
| ||||||
See accompanying Notes to Financial Statements which are an integral part of the financial statements.
| 9 Invesco Quality Income Fund |
Principal Amount | Value | |||||||
Asset-Backed Securities–8.54% |
| |||||||
Adjustable Rate Mortgage Trust, Series 2005-7, Class 2A21, 0.77%, 10/25/2035(a) | $ | 169,672 | $ | 143,482 | ||||
| ||||||||
Agate Bay Mortgage Trust, Series 2015-2, Class B1, 3.62%, 03/25/2045(a)(g) | 1,557,736 | 1,437,056 | ||||||
| ||||||||
Banc of America Funding Trust, Series 2006-3, Class 5A5, 5.50%, 03/25/2036 | 26,604 | 22,563 | ||||||
| ||||||||
Series 2006-A, Class 1A1, 3.96%, 02/20/2036(a) | 203,122 | 189,639 | ||||||
| ||||||||
Bear Stearns Adjustable Rate Mortgage Trust, Series 2005-1, Class 2A1, 3.37%, 03/25/2035(a) | 788,618 | 731,385 | ||||||
| ||||||||
Benchmark Mortgage Trust, Series 2018-B1, Class XA, IO, 0.53%, 01/15/2051(d) | 13,075,027 | 259,717 | ||||||
| ||||||||
BINOM Securitization Trust, Series 2021-INV1, Class A1, 2.03%, 06/25/2056(a)(g) | 3,241,125 | 2,855,618 | ||||||
| ||||||||
CCG Receivables Trust, Series 2019-2, Class C, 2.89%, 03/15/2027(g) | 405,000 | 400,333 | ||||||
| ||||||||
CD Mortgage Trust, Series 2017- CD6, Class XA, IO, 0.88%, 11/13/2050(d) | 6,685,877 | 186,534 | ||||||
| ||||||||
Chase Mortgage Finance Corp., Series 2016-2, Class M4, 3.75%, 12/25/2045(d)(g) | 1,551,261 | 1,336,081 | ||||||
| ||||||||
Series 2016-SH1, Class M3, 3.75%, 04/25/2045(a)(g) | 1,235,505 | 1,036,508 | ||||||
| ||||||||
Chase Mortgage Finance Trust, Series 2005-A1, Class 3A1, 3.94%, 12/25/2035(a) | 14,667 | 12,399 | ||||||
| ||||||||
Series 2007-A2, Class 2A1, 4.14%, 06/25/2035(a) | 193,557 | 185,845 | ||||||
| ||||||||
Series 2007-A2, Class 2A4, 4.14%, 06/25/2035(a) | 178,806 | 170,761 | ||||||
| ||||||||
Citigroup Commercial Mortgage Trust, Series 2013-GC17, Class XA, IO, 0.99%, 11/10/2046(d) | 4,868,428 | 23,190 | ||||||
| ||||||||
Series 2017-C4, Class XA, IO, 1.04%, 10/12/2050(d) | 17,229,581 | 591,572 | ||||||
| ||||||||
Citigroup Mortgage Loan Trust, Inc., Series 2004-UST1, Class A4, 3.88%, 08/25/2034(a) | 60,062 | 55,092 | ||||||
| ||||||||
Series 2005-11, Class A2A, 5.41% (1 yr. U.S. Treasury Yield Curve Rate + 2.40%), 10/25/2035(e) | 526,847 | 487,347 | ||||||
| ||||||||
Series 2006-AR2, Class 1A2, 2.56%, 03/25/2036(a) | 12,668 | 11,776 | ||||||
| ||||||||
COMM Mortgage Trust, | 17,617,012 | 61,707 | ||||||
| ||||||||
Series 2015-CR24, Class XA, IO, 0.69%, 08/10/2048(d) | 34,632,699 | 491,732 | ||||||
| ||||||||
Commonbond Student Loan Trust, Series 2018-CGS, Class A1, 3.87%, 02/25/2046(g) | 852,765 | 817,626 | ||||||
| ||||||||
Principal Amount | Value | |||||||
Countrywide Home Loans Mortgage Pass-Through Trust, Series 2004-29, Class 1A1, 4.93% (1 mo. USD LIBOR + 0.54%), 02/25/2035(e) | $ | 164,449 | $ | 146,253 | ||||
| ||||||||
Credit Suisse Mortgage Capital Trust, Series 2013-7, Class B1, 3.53%, 08/25/2043(a)(g) | 1,319,993 | 1,234,932 | ||||||
| ||||||||
Credit Suisse Mortgage Loan Trust, Series 2015-1, Class A9, 3.50%, 05/25/2045(a)(g) | 316,057 | 279,944 | ||||||
| ||||||||
CSFB Mortgage-Backed Pass-Through Ctfs., Series 2004-AR5, Class 5A1, 3.52%, 06/25/2034(a) | 346,489 | 329,947 | ||||||
| ||||||||
Deutsche Mortgage Securities, Inc. Re-REMIC Trust Ctfs., Series 2007-WM1, Class A1, 3.46%, 06/27/2037(a)(g) | 1,472,196 | 1,272,024 | ||||||
| ||||||||
Galton Funding Mortgage Trust, Series 2018-1, Class A33, 3.50%, 11/25/2057(a)(g) | 360,566 | 320,925 | ||||||
| ||||||||
GMACM Mortgage Loan Trust, Series 2005-AR3, Class 2A1, 2.96%, 06/19/2035(a) | 646,964 | 586,281 | ||||||
| ||||||||
GSAA Home Equity Trust, Series 2007-7, Class A4, 4.93% (1 mo. USD LIBOR + 0.54%), 07/25/2037(e) | 25,961 | 24,732 | ||||||
| ||||||||
GSR Mortgage Loan Trust, Series 2004-12, Class 3A6, 1.46%, 12/25/2034(a) | 179,184 | 158,548 | ||||||
| ||||||||
Series 2005-AR4, Class 6A1, 3.65%, 07/25/2035(a) | 107,523 | 98,957 | ||||||
| ||||||||
Invitation Homes Trust, Series 2018-SFR4, Class C, 5.74% (1 mo. USD LIBOR + 1.40%), 01/17/2038(e)(g) | 4,228,805 | 4,167,318 | ||||||
| ||||||||
JP Morgan Mortgage Trust, | 392,646 | 366,704 | ||||||
| ||||||||
Series 2005-A3, Class 6A5, 3.08%, 06/25/2035(a) | 221,559 | 216,486 | ||||||
| ||||||||
Series 2014-1, Class 1A17, 0.79%, 01/25/2044(a)(g) | 627,288 | 567,127 | ||||||
| ||||||||
Series 2015-3, Class A3, 3.50%, 05/25/2045(a)(g) | 599,413 | 539,538 | ||||||
| ||||||||
Series 2017-5, Class A1, 3.21%, 10/26/2048(a)(g) | 469,788 | 448,753 | ||||||
| ||||||||
Series 2019-INV2, Class A15, 3.50%, 02/25/2050(a)(g) | 151,325 | 132,919 | ||||||
| ||||||||
Luminent Mortgage Trust, Series 2006-1, Class A1, 5.11% (1 mo. USD LIBOR + 0.72%), 04/25/2036(e) | 30,976 | 25,444 | ||||||
| ||||||||
MASTR Adjustable Rate Mortgages Trust, Series 2004-13, Class 2A2, 4.02%, 04/21/2034(a) | 107,797 | 103,123 | ||||||
| ||||||||
Merrill Lynch Mortgage Investors Trust, Series 2005-3, Class 3A, 2.39%, 11/25/2035(a) | 222,461 | 202,522 | ||||||
| ||||||||
Series 2005-A, Class A1, 4.85% (1 mo. USD LIBOR + 0.46%), 03/25/2030(e) | 276,592 | 253,754 | ||||||
| ||||||||
See accompanying Notes to Financial Statements which are an integral part of the financial statements.
| 10 Invesco Quality Income Fund |
Principal Amount | Value | |||||||
Morgan Stanley Capital I Trust, Series 2017-HR2, Class XA, IO, 0.87%, 12/15/2050(d) | $ | 5,458,769 | $ | 187,800 | ||||
| ||||||||
Onslow Bay Mortgage Loan Trust, Series 2021-NQM4, Class A1, 1.96%, 10/25/2061(a)(g) | 6,685,309 | 5,349,933 | ||||||
| ||||||||
PRKCM Trust, Series 2021-AFC2, Class A1, 2.07%, | 8,004,746 | 6,670,314 | ||||||
| ||||||||
Progress Residential Trust, Series 2020-SFR1, Class C, 2.18%, 04/17/2037(g) | 2,500,000 | 2,268,840 | ||||||
| ||||||||
Residential Accredit Loans, Inc. Trust, Series 2006-QO2, Class A2, 4.93% (1 mo. USD LIBOR + 0.54%), 02/25/2046(e) | 40,763 | 9,086 | ||||||
| ||||||||
Series 2006-QS13, Class 1A8, 6.00%, 09/25/2036 | 29,272 | 22,582 | ||||||
| ||||||||
Sapphire Aviation Finance II Ltd., Series 2020-1A, Class B, 4.34%, 03/15/2040(g) | 5,610,803 | 3,425,495 | ||||||
| ||||||||
SGR Residential Mortgage Trust, Series 2021-2, Class A1, 1.74%, 12/25/2061(a)(g) | 7,363,077 | 5,948,248 | ||||||
| ||||||||
Shellpoint Asset Funding Trust, Series 2013-1, Class A3, 3.75%, 07/25/2043(a)(g) | 382,099 | 344,546 | ||||||
| ||||||||
Starwood Mortgage Residential Trust, Series 2021-6, Class A1, 1.92%, 11/25/2066(a)(g) | 4,347,927 | 3,622,847 | ||||||
| ||||||||
Structured Adjustable Rate Mortgage Loan Trust, | 235,508 | 203,074 | ||||||
| ||||||||
Series 2004-20, Class 3A1, 3.56%, 01/25/2035(a) | 45,170 | 44,582 | ||||||
| ||||||||
Structured Asset Mortgage Investments II Trust, Series 2005-AR2, Class 2A1, 4.85% (1 mo. USD LIBOR + 0.46%), 05/25/2045(e) | 468,100 | 409,537 | ||||||
| ||||||||
Structured Asset Sec Mortgage Pass-Through Ctfs., Series 2002-21A, Class B1II, 4.46%, 11/25/2032(a) | 36,022 | 34,675 | ||||||
| ||||||||
UBS Commercial Mortgage Trust, Series 2017-C5, Class XA, IO, 1.07%, 11/15/2050(d) | 10,225,101 | 336,039 | ||||||
| ||||||||
Vendee Mortgage Trust, | 3,971,528 | 4 | ||||||
| ||||||||
Series 2001-3, Class IO, 0.00%, 10/15/2031(d) | 2,023,618 | 2 | ||||||
| ||||||||
Series 2002-2, Class IO, 0.00%, 01/15/2032(d) | 5,591,653 | 628 | ||||||
| ||||||||
Series 2002-3, Class IO, 0.27%, 08/15/2032(d) | 6,478,111 | 36,837 | ||||||
| ||||||||
Series 2003-1, Class IO, 0.07%, 11/15/2032(d) | 10,368,219 | 21,958 | ||||||
| ||||||||
Verus Securitization Trust, Series 2019-INV3, Class A2, 2.95%, 11/25/2059(a)(g) | 1,088,778 | 1,029,401 | ||||||
| ||||||||
Principal Amount | Value | |||||||
WaMu Mortgage Pass-Through Ctfs. Trust, | $ | 138,635 | $ | 129,075 | ||||
| ||||||||
Series 2007-HY2, Class 2A1, 3.74%, 11/25/2036(a) | 43,896 | 39,141 | ||||||
| ||||||||
Wells Fargo Commercial Mortgage Trust, Series 2017-C42, Class XA, IO, 0.86%, 12/15/2050(d) | 9,105,595 | 310,669 | ||||||
| ||||||||
Zaxby’s Funding LLC, Series 2021-1A, Class A2, 3.24%, 07/30/2051(g) | 2,863,750 | 2,316,333 | ||||||
| ||||||||
Total Asset-Backed Securities |
| 55,745,840 | ||||||
| ||||||||
Commercial Paper–7.99% |
| |||||||
Diversified Banks–7.99% | ||||||||
BPCE S.A. (France), 0.00%, 11/15/2023(g) | 20,000,000 | 19,060,978 | ||||||
| ||||||||
Societe Generale S.A. (France), 0.00%, 11/15/2023(g) | 20,000,000 | 19,100,800 | ||||||
| ||||||||
Svenska Handelsbanken AB (Sweden), 5.00%(SOFR + 0.69%), 08/29/2023(e) | 14,000,000 | 14,012,374 | ||||||
| ||||||||
Total Commercial Paper (Cost $52,136,167) |
| 52,174,152 | ||||||
| ||||||||
Certificates of Deposit–3.38% |
| |||||||
Diversified Banks–3.38% | ||||||||
Canadian Imperial Bank of Commerce (Canada), 5.03% (SOFR + 0.73%), 08/04/2023(e) (Cost $22,000,000) | 22,000,000 | 22,056,347 | ||||||
| ||||||||
Agency Credit Risk Transfer Notes–1.32% |
| |||||||
Fannie Mae Connecticut Avenue Securities, | 4,809,045 | 4,778,042 | ||||||
| ||||||||
Series 2022-R06, Class 1M1, 6.68% (30 Day Average SOFR + 2.75%), 05/25/2042(e)(g) | 3,762,219 | 3,811,139 | ||||||
| ||||||||
Total Agency Credit Risk Transfer Notes |
| 8,589,181 | ||||||
| ||||||||
U.S. Treasury Securities–0.21% |
| |||||||
U.S. Treasury Bills–0.21% | ||||||||
2.04% - 2.15%, 03/09/2023(h)(i) | 442,000 | 438,617 | ||||||
| ||||||||
3.35% - 4.65%, 05/11/2023(h)(i) | 931,000 | 915,987 | ||||||
| ||||||||
Total U.S. Treasury Securities |
| 1,354,604 | ||||||
| ||||||||
| Shares | ||||||||
Money Market Funds–2.53% |
| |||||||
Invesco Government & Agency Portfolio, Institutional Class, 4.22%(j)(k) | 16,552,417 | 16,552,417 | ||||||
| ||||||||
TOTAL INVESTMENTS IN |
| 895,712,128 | ||||||
| ||||||||
OTHER ASSETS LESS LIABILITIES–(37.20)% |
| (242,861,758 | ) | |||||
| ||||||||
NET ASSETS–100.00% | $ | 652,850,370 | ||||||
| ||||||||
See accompanying Notes to Financial Statements which are an integral part of the financial statements.
| 11 Invesco Quality Income Fund |
| Investment Abbreviations: | ||
COFI | – Cost of Funds Index | |
Ctfs. | – Certificates | |
IO | – Interest Only | |
LIBOR | – London Interbank Offered Rate | |
MTA | – Moving Treasury Average | |
PO | – Principal Only | |
REMICs | – Real Estate Mortgage Investment Conduits | |
SOFR | – Secured Overnight Financing Rate | |
STRIPS | – Separately Traded Registered Interest and Principal Security | |
TBA | – To Be Announced | |
USD | – U.S. Dollar | |
Notes to Schedule of Investments:
| (a) | Interest rate is redetermined periodically based on the cash flows generated by the pool of assets backing the security, less any applicable fees. The rate shown is the rate in effect on December 31, 2022. |
| (b) | Interest only security. Principal amount shown is the notional principal and does not reflect the maturity value of the security. |
| (c) | Zero coupon bond issued at a discount. |
| (d) | Interest only security. Principal amount shown is the notional principal and does not reflect the maturity value of the security. Interest rate is redetermined periodically based on the cash flows generated by the pool of assets backing the security, less any applicable fees. The rate shown is the rate in effect on December 31, 2022. |
| (e) | Interest or dividend rate is redetermined periodically. Rate shown is the rate in effect on December 31, 2022. |
| (f) | Security purchased on a forward commitment basis. This security is subject to dollar roll transactions. See Note 1J. |
| (g) | Security purchased or received in a transaction exempt from registration under the Securities Act of 1933, as amended (the “1933 Act”). The security may be resold pursuant to an exemption from registration under the 1933 Act, typically to qualified institutional buyers. The aggregate value of these securities at December 31, 2022 was $94,573,618, which represented 14.49% of the Fund’s Net Assets. |
| (h) | All or a portion of the value was pledged as collateral to cover margin requirements for open futures contracts. See Note 1I. |
| (i) | Security traded on a discount basis. The interest rate shown represents the discount rate at the time of purchase by the Fund. |
| (j) | Affiliated issuer. The issuer and/or the Fund is a wholly-owned subsidiary of Invesco Ltd., or is affiliated by having an investment adviser that is under common control of Invesco Ltd. The table below shows the Fund’s transactions in, and earnings from, its investments in affiliates for the fiscal year ended December 31, 2022. |
Value December 31, 2021 | Purchases at Cost | Proceeds from Sales | Change in Unrealized Appreciation | Realized Gain | Value December 31, 2022 | Dividend Income | ||||||||||||||||||||||
| Investments in Affiliated Money Market Funds: | ||||||||||||||||||||||||||||
Invesco Government & Agency Portfolio, Institutional Class | $9,273,851 | $ | 286,710,779 | $ | (279,432,213) | $- | $- | $16,552,417 | $ | 144,569 | ||||||||||||||||||
| Investments Purchased with Cash Collateral from Securities on Loan: | ||||||||||||||||||||||||||||
Invesco Private Government Fund | - | 10,464,062 | (10,464,062) | - | - | - | 71* | |||||||||||||||||||||
Invesco Private Prime Fund | - | 10,618,727 | (10,618,727) | - | - | - | 147* | |||||||||||||||||||||
Total | $9,273,851 | $ | 307,793,568 | $ | (300,515,002) | $- | $- | $16,552,417 | $ | 144,787 | ||||||||||||||||||
| * | Represents the income earned on the investment of cash collateral, which is included in securities lending income on the Statement of Operations. Does not include rebates and fees paid to lending agent or premiums received from borrowers, if any. |
| (k) | The rate shown is the 7-day SEC standardized yield as of December 31, 2022. |
| Open Futures Contracts | ||||||||||||||||||||
| Long Futures Contracts | Number of Contracts | Expiration Month | Notional Value | Value | Unrealized Appreciation (Depreciation) | |||||||||||||||
Interest Rate Risk | ||||||||||||||||||||
U.S. Treasury Long Bonds | 92 | March-2023 | $11,531,625 | $(77,910 | ) | $(77,910 | ) | |||||||||||||
U.S. Treasury Ultra Bonds | 22 | March-2023 | 2,954,875 | (3,094 | ) | (3,094 | ) | |||||||||||||
Subtotal–Long Futures Contracts | (81,004 | ) | (81,004 | ) | ||||||||||||||||
See accompanying Notes to Financial Statements which are an integral part of the financial statements.
| 12 Invesco Quality Income Fund |
| Open Futures Contracts–(continued) | ||||||||||||||||||||
| Short Futures Contracts | Number of Contracts | Expiration Month | Notional Value | Value | Unrealized Appreciation (Depreciation) | |||||||||||||||
Interest Rate Risk | ||||||||||||||||||||
U.S. Treasury 2 Year Notes | 285 | March-2023 | $(58,447,266 | ) | $(14,773 | ) | $(14,773 | ) | ||||||||||||
U.S. Treasury 5 Year Notes | 471 | March-2023 | (50,834,883 | ) | 29,929 | 29,929 | ||||||||||||||
U.S. Treasury 10 Year Notes | 165 | March-2023 | (18,528,984 | ) | 108,281 | 108,281 | ||||||||||||||
U.S. Treasury 10 Year Ultra Notes | 54 | March-2023 | (6,387,188 | ) | 201,656 | 201,656 | ||||||||||||||
Subtotal–Short Futures Contracts | 325,093 | 325,093 | ||||||||||||||||||
Total Futures Contracts | $244,089 | $244,089 | ||||||||||||||||||
See accompanying Notes to Financial Statements which are an integral part of the financial statements.
| 13 Invesco Quality Income Fund |
Statement of Assets and Liabilities
December 31, 2022
Assets: | ||||
Investments in unaffiliated securities, at value (Cost $ 977,870,937) | $ | 879,159,711 | ||
| ||||
Investments in affiliated money market funds, at value (Cost $ 16,552,417) | 16,552,417 | |||
| ||||
Other investments: | ||||
Variation margin receivable – futures contracts | 86,260 | |||
| ||||
Cash collateral – TBA commitments | 1,315,459 | |||
| ||||
Receivable for: | ||||
Investments sold | 923 | |||
| ||||
TBA sales commitment | 61,503,903 | |||
| ||||
Fund shares sold | 231,299 | |||
| ||||
Interest | 2,384,051 | |||
| ||||
Principal paydowns | 211 | |||
| ||||
Investment for trustee deferred compensation and retirement plans | 191,600 | |||
| ||||
Other assets | 382,167 | |||
| ||||
Total assets | 961,808,001 | |||
| ||||
Liabilities: | ||||
Payable for: | ||||
TBA sales commitment | 301,576,231 | |||
| ||||
Dividends | 269,272 | |||
| ||||
Fund shares reacquired | 5,292,032 | |||
| ||||
Amount due custodian | 1,065,127 | |||
| ||||
Accrued fees to affiliates | 367,317 | |||
| ||||
Accrued trustees’ and officers’ fees and benefits | 3,570 | |||
| ||||
Accrued other operating expenses | 183,433 | |||
| ||||
Trustee deferred compensation and retirement plans | 200,649 | |||
| ||||
Total liabilities | 308,957,631 | |||
| ||||
Net assets applicable to shares outstanding | $ | 652,850,370 | ||
| ||||
Net assets consist of: | ||||
Shares of beneficial interest | $ | 879,353,150 | ||
| ||||
Distributable earnings (loss) | (226,502,780 | ) | ||
| ||||
| $ | 652,850,370 | |||
| ||||
Net Assets: | ||
Class A | $511,108,114 | |
Class C | $ 19,024,508 | |
Class R | $ 19,496,756 | |
Class Y | $ 82,041,638 | |
Class R5 | $ 138,952 | |
Class R6 | $ 21,040,402 | |
Shares outstanding, no par value, with an unlimited number of shares authorized: | ||
Class A | 52,906,102 | |
Class C | 1,981,198 | |
Class R | 2,019,563 | |
Class Y | 8,459,432 | |
Class R5 | 14,365 | |
Class R6 | 2,169,515 | |
Class A: | ||
Net asset value per share | $ 9.66 | |
Maximum offering price per share (Net asset value of $9.66 ÷ 95.75%) | $ 10.09 | |
Class C: | ||
Net asset value and offering price per share | $ 9.60 | |
Class R: | ||
Net asset value and offering price per share | $ 9.65 | |
Class Y: | ||
Net asset value and offering price per share | $ 9.70 | |
Class R5: | ||
Net asset value and offering price per share | $ 9.67 | |
Class R6: | ||
Net asset value and offering price per share | $ 9.70 | |
See accompanying Notes to Financial Statements which are an integral part of the financial statements.
| 14 Invesco Quality Income Fund |
Statement of Operations
For the year ended December 31, 2022
Investment income: | ||||
Interest (net of foreign withholding taxes of $2,060) | $ | 17,638,674 | ||
| ||||
Dividends from affiliated money market funds (includes net securities lending income of $122) | 144,691 | |||
| ||||
Total investment income | 17,783,365 | |||
| ||||
Expenses: | ||||
Advisory fees | 3,106,827 | |||
| ||||
Administrative services fees | 108,820 | |||
| ||||
Custodian fees | 20,857 | |||
| ||||
Distribution fees: | ||||
Class A | 1,431,944 | |||
| ||||
Class C | 240,836 | |||
| ||||
Class R | 107,985 | |||
| ||||
Transfer agent fees – A, C, R and Y | 1,010,393 | |||
| ||||
Transfer agent fees – R5 | 217 | |||
| ||||
Transfer agent fees – R6 | 8,052 | |||
| ||||
Trustees’ and officers’ fees and benefits | 22,391 | |||
| ||||
Registration and filing fees | 90,897 | |||
| ||||
Reports to shareholders | 79,101 | |||
| ||||
Professional services fees | 62,602 | |||
| ||||
Other | 20,862 | |||
| ||||
Total expenses | 6,311,784 | |||
| ||||
Less: Fees waived and/or expense offset arrangement(s) | (16,012 | ) | ||
| ||||
Net expenses | 6,295,772 | |||
| ||||
Net investment income | 11,487,593 | |||
| ||||
Realized and unrealized gain (loss) from: | ||||
Net realized gain (loss) from: | ||||
Unaffiliated investment securities | (38,400,252 | ) | ||
| ||||
Futures contracts | 2,448,750 | |||
| ||||
| (35,951,502 | ) | |||
| ||||
Change in net unrealized appreciation (depreciation) of: | ||||
Unaffiliated investment securities | (81,210,164 | ) | ||
| ||||
Futures contracts | 903,683 | |||
| ||||
| (80,306,481 | ) | |||
| ||||
Net realized and unrealized gain (loss) | (116,257,983 | ) | ||
| ||||
Net increase (decrease) in net assets resulting from operations | $ | (104,770,390 | ) | |
| ||||
See accompanying Notes to Financial Statements which are an integral part of the financial statements.
| 15 Invesco Quality Income Fund |
Statement of Changes in Net Assets
For the years ended December 31, 2022 and 2021
| 2022 | 2021 | |||||||
| ||||||||
Operations: | ||||||||
Net investment income | $ | 11,487,593 | $ | 5,865,498 | ||||
| ||||||||
Net realized gain (loss) | (35,951,502 | ) | 3,622,147 | |||||
| ||||||||
Change in net unrealized appreciation (depreciation) | (80,306,481 | ) | (25,410,576 | ) | ||||
| ||||||||
Net increase (decrease) in net assets resulting from operations | (104,770,390 | ) | (15,922,931 | ) | ||||
| ||||||||
Distributions to shareholders from distributable earnings: | ||||||||
Class A | (16,334,116 | ) | (23,336,759 | ) | ||||
| ||||||||
Class C | (478,546 | ) | (980,466 | ) | ||||
| ||||||||
Class R | (548,387 | ) | (725,039 | ) | ||||
| ||||||||
Class Y | (2,663,489 | ) | (5,164,083 | ) | ||||
| ||||||||
Class R5 | (6,617 | ) | (15,287 | ) | ||||
| ||||||||
Class R6 | (872,066 | ) | (1,152,084 | ) | ||||
| ||||||||
Total distributions from distributable earnings | (20,903,221 | ) | (31,373,718 | ) | ||||
| ||||||||
Share transactions–net: | ||||||||
Class A | (87,661,083 | ) | (84,007,942 | ) | ||||
| ||||||||
Class C | (9,564,788 | ) | (19,118,430 | ) | ||||
| ||||||||
Class R | (1,496,150 | ) | (2,029,383 | ) | ||||
| ||||||||
Class Y | (9,384,216 | ) | (72,778,157 | ) | ||||
| ||||||||
Class R5 | (302,893 | ) | 114,913 | |||||
| ||||||||
Class R6 | (7,666,318 | ) | 2,041,712 | |||||
| ||||||||
Net increase (decrease) in net assets resulting from share transactions | (116,075,448 | ) | (175,777,287 | ) | ||||
| ||||||||
Net increase (decrease) in net assets | (241,749,059 | ) | (223,073,936 | ) | ||||
| ||||||||
Net assets: | ||||||||
Beginning of year | 894,599,429 | 1,117,673,365 | ||||||
| ||||||||
End of year | $ | 652,850,370 | $ | 894,599,429 | ||||
| ||||||||
See accompanying Notes to Financial Statements which are an integral part of the financial statements.
| 16 Invesco Quality Income Fund |
The following schedule presents financial highlights for a share of the Fund outstanding throughout the periods indicated.
| Net asset value, beginning of period | Net (loss)(a) | Net gains (losses) on securities (both realized and unrealized) | Total from investment operations | Dividends from net investment income | Net asset value, end | Total return (b) | Net assets, end of period (000’s omitted) | Ratio of to average net assets | Ratio of expenses to average net assets without fee waivers and/or expenses absorbed | Ratio of net (loss) to average | Portfolio turnover (c) | |||||||||||||||||||||||||||||||||||||||||||||||||
Class A | ||||||||||||||||||||||||||||||||||||||||||||||||||||||||||||
Year ended 12/31/22 | $ | 11.36 | $ | 0.16 | $ | (1.57 | ) | $ | (1.41 | ) | $ | (0.29 | ) | $ | 9.66 | (12.52 | )%(d) | $ | 511,108 | 0.85 | %(d) | 0.85 | %(d) | 1.53 | %(d) | 520 | % | |||||||||||||||||||||||||||||||||
Year ended 12/31/21 | 11.90 | 0.07 | (0.25 | ) | (0.18 | ) | (0.36 | ) | 11.36 | (1.55 | )(e) | 697,347 | 0.84 | (e) | 0.86 | (e) | 0.57 | (e) | 401 | |||||||||||||||||||||||||||||||||||||||||
Year ended 12/31/20 | 11.72 | 0.26 | 0.36 | 0.62 | (0.44 | ) | 11.90 | 5.33 | (e) | 816,715 | 0.83 | (e) | 0.85 | (e) | 2.15 | (e) | 979 | |||||||||||||||||||||||||||||||||||||||||||
Year ended 12/31/19 | 11.48 | 0.35 | 0.33 | 0.68 | (0.44 | ) | 11.72 | 5.97 | (d) | 301,996 | 0.92 | (d) | 0.92 | (d) | 3.04 | (d) | 448 | |||||||||||||||||||||||||||||||||||||||||||
Year ended 12/31/18 | 11.95 | 0.36 | (0.38 | ) | (0.02 | ) | (0.45 | ) | 11.48 | (0.15 | )(d) | 308,880 | 0.94 | (d) | 0.94 | (d) | 3.10 | (d) | 416 | |||||||||||||||||||||||||||||||||||||||||
Class C | ||||||||||||||||||||||||||||||||||||||||||||||||||||||||||||
Year ended 12/31/22 | 11.28 | 0.08 | (1.55 | ) | (1.47 | ) | (0.21 | ) | 9.60 | (13.12 | ) | 19,025 | 1.61 | 1.61 | 0.77 | 520 | ||||||||||||||||||||||||||||||||||||||||||||
Year ended 12/31/21 | 11.82 | (0.02 | ) | (0.25 | ) | (0.27 | ) | (0.27 | ) | 11.28 | (2.35 | )(e) | 32,752 | 1.62 | (e) | 1.62 | (e) | (0.21 | )(e) | 401 | ||||||||||||||||||||||||||||||||||||||||
Year ended 12/31/20 | 11.64 | 0.16 | 0.37 | 0.53 | (0.35 | ) | 11.82 | 4.57 | (e) | 53,821 | 1.60 | (e) | 1.60 | (e) | 1.38 | (e) | 979 | |||||||||||||||||||||||||||||||||||||||||||
Year ended 12/31/19 | 11.40 | 0.27 | 0.32 | 0.59 | (0.35 | ) | 11.64 | 5.19 | 8,659 | 1.68 | 1.68 | 2.28 | 448 | |||||||||||||||||||||||||||||||||||||||||||||||
Year ended 12/31/18 | 11.87 | 0.27 | (0.38 | ) | (0.11 | ) | (0.36 | ) | 11.40 | (0.93 | ) | 9,179 | 1.70 | 1.70 | 2.34 | 416 | ||||||||||||||||||||||||||||||||||||||||||||
Class R | ||||||||||||||||||||||||||||||||||||||||||||||||||||||||||||
Year ended 12/31/22 | 11.35 | 0.13 | (1.57 | ) | (1.44 | ) | (0.26 | ) | 9.65 | (12.76 | ) | 19,497 | 1.11 | 1.11 | 1.27 | 520 | ||||||||||||||||||||||||||||||||||||||||||||
Year ended 12/31/21 | 11.89 | 0.03 | (0.25 | ) | �� | (0.22 | ) | (0.32 | ) | 11.35 | (1.84 | ) | 24,551 | 1.12 | 1.12 | 0.29 | 401 | |||||||||||||||||||||||||||||||||||||||||||
Period ended 12/31/20(f) | 11.79 | 0.14 | 0.21 | 0.35 | (0.25 | ) | 11.89 | 2.99 | 27,785 | 1.10 | (g) | 1.10 | (g) | 1.88 | (g) | 979 | ||||||||||||||||||||||||||||||||||||||||||||
Class Y | ||||||||||||||||||||||||||||||||||||||||||||||||||||||||||||
Year ended 12/31/22 | 11.40 | 0.18 | (1.57 | ) | (1.39 | ) | (0.31 | ) | 9.70 | (12.26 | ) | 82,042 | 0.61 | 0.61 | 1.77 | 520 | ||||||||||||||||||||||||||||||||||||||||||||
Year ended 12/31/21 | 11.95 | 0.10 | (0.26 | ) | (0.16 | ) | (0.39 | ) | 11.40 | (1.35 | ) | 106,019 | 0.57 | 0.62 | 0.84 | 401 | ||||||||||||||||||||||||||||||||||||||||||||
Year ended 12/31/20 | 11.77 | 0.29 | 0.36 | 0.65 | (0.47 | ) | 11.95 | 5.59 | 185,925 | 0.52 | 0.61 | 2.46 | 979 | |||||||||||||||||||||||||||||||||||||||||||||||
Year ended 12/31/19 | 11.53 | 0.38 | 0.33 | 0.71 | (0.47 | ) | 11.77 | 6.21 | 20,339 | 0.68 | 0.68 | 3.28 | 448 | |||||||||||||||||||||||||||||||||||||||||||||||
Year ended 12/31/18 | 12.00 | 0.39 | (0.38 | ) | 0.01 | (0.48 | ) | 11.53 | 0.11 | 13,189 | 0.70 | 0.70 | 3.34 | 416 | ||||||||||||||||||||||||||||||||||||||||||||||
Class R5 | ||||||||||||||||||||||||||||||||||||||||||||||||||||||||||||
Year ended 12/31/22 | 11.37 | 0.19 | (1.57 | ) | (1.38 | ) | (0.32 | ) | 9.67 | (12.26 | ) | 139 | 0.57 | 0.57 | 1.81 | 520 | ||||||||||||||||||||||||||||||||||||||||||||
Year ended 12/31/21 | 11.91 | 0.10 | (0.25 | ) | (0.15 | ) | (0.39 | ) | 11.37 | (1.29 | ) | 489 | 0.56 | 0.57 | 0.85 | 401 | ||||||||||||||||||||||||||||||||||||||||||||
Year ended 12/31/20 | 11.76 | 0.30 | 0.33 | 0.63 | (0.48 | ) | 11.91 | 5.42 | 395 | 0.46 | 0.46 | 2.52 | 979 | |||||||||||||||||||||||||||||||||||||||||||||||
Year ended 12/31/19 | 11.52 | 0.40 | 0.32 | 0.72 | (0.48 | ) | 11.76 | 6.36 | 132,657 | 0.55 | 0.55 | 3.41 | 448 | |||||||||||||||||||||||||||||||||||||||||||||||
Year ended 12/31/18 | 12.00 | 0.40 | (0.39 | ) | 0.01 | (0.49 | ) | 11.52 | 0.16 | 142,812 | 0.56 | 0.56 | 3.48 | 416 | ||||||||||||||||||||||||||||||||||||||||||||||
Class R6 | ||||||||||||||||||||||||||||||||||||||||||||||||||||||||||||
Year ended 12/31/22 | 11.40 | 0.20 | (1.57 | ) | (1.37 | ) | (0.33 | ) | 9.70 | (12.16 | ) | 21,040 | 0.50 | 0.50 | 1.88 | 520 | ||||||||||||||||||||||||||||||||||||||||||||
Year ended 12/31/21 | 11.95 | 0.11 | (0.26 | ) | (0.15 | ) | (0.40 | ) | 11.40 | (1.30 | ) | 33,442 | 0.51 | 0.51 | 0.90 | 401 | ||||||||||||||||||||||||||||||||||||||||||||
Year ended 12/31/20 | 11.77 | 0.30 | 0.36 | 0.66 | (0.48 | ) | 11.95 | 5.69 | 33,032 | 0.46 | 0.46 | 2.52 | 979 | |||||||||||||||||||||||||||||||||||||||||||||||
Year ended 12/31/19 | 11.53 | 0.40 | 0.32 | 0.72 | (0.48 | ) | 11.77 | 6.35 | 22,379 | 0.55 | 0.55 | 3.41 | 448 | |||||||||||||||||||||||||||||||||||||||||||||||
Year ended 12/31/18 | 12.00 | 0.40 | (0.38 | ) | 0.02 | (0.49 | ) | 11.53 | 0.25 | 19,097 | 0.56 | 0.56 | 3.48 | 416 | ||||||||||||||||||||||||||||||||||||||||||||||
| (a) | Calculated using average shares outstanding. |
| (b) | Includes adjustments in accordance with accounting principles generally accepted in the United States of America and as such, the net asset value for financial reporting purposes and the returns based upon those net asset values may differ from the net asset value and returns for shareholder transactions. Does not include sales charges and is not annualized for periods less than one year, if applicable. |
| (c) | Portfolio turnover is calculated at the fund level and is not annualized for periods less than one year, if applicable. For the year ended December 31, 2020, the portfolio turnover calculation excludes the value of securities purchased of $1,606,141,382 in connection with the acquisition of Invesco Oppenheimer Limited-Term Government Fund into the Fund. |
| (d) | The total return, ratio of expenses to average net assets and ratio of net investment income to average net assets reflect actual 12b-1 fees of 0.24% for the years ended December 31, 2022, 2019 and 2018, respectively. |
| (e) | The total return, ratio of expenses to average net assets and ratio of net investment income to average net assets reflect actual 12b-1 fees of 0.24% and 0.99% for Class A and Class C shares for the years ended December 31, 2021 and 2020, respectively. |
| (f) | Commencement date of May 15, 2020 for Class R. |
| (g) | Annualized. |
See accompanying Notes to Financial Statements which are an integral part of the financial statements.
| 17 Invesco Quality Income Fund |
December 31, 2022
NOTE 1–Significant Accounting Policies
Invesco Quality Income Fund (the “Fund”) is a series portfolio of AIM Growth Series (Invesco Growth Series) (the “Trust”). The Trust is a Delaware statutory trust registered under the Investment Company Act of 1940, as amended (the “1940 Act”), as an open-end series management investment company authorized to issue an unlimited number of shares of beneficial interest. Information presented in these financial statements pertains only to the Fund. Matters affecting the Fund or each class will be voted on exclusively by the shareholders of the Fund or each class.
The Fund’s investment objective is to provide a high level of current income, with liquidity and safety of principal.
The Fund currently consists of six different classes of shares: Class A, Class C, Class R, Class Y, Class R5 and Class R6. Class Y shares are available only to certain investors. Class A shares are sold with a front-end sales charge unless certain waiver criteria are met. Under certain circumstances, load waived shares may be subject to contingent deferred sales charges (“CDSC”). Class C shares are sold with a CDSC. Class R, Class Y, Class R5 and Class R6 shares are sold at net asset value. Class C shares held for eight years after purchase are eligible for automatic conversion into Class A shares of the same Fund (the “Conversion Feature”). The automatic conversion pursuant to the Conversion Feature will generally occur at the end of the month following the eighth anniversary after a purchase of Class C shares.
The Fund is an investment company and accordingly follows the investment company accounting and reporting guidance in accordance with Financial Accounting Standards Board Accounting Standards Codification Topic 946, Financial Services – Investment Companies.
The following is a summary of the significant accounting policies followed by the Fund in the preparation of its financial statements.
| A. | Security Valuations – Securities, including restricted securities, are valued according to the following policy. |
Fixed income securities (including convertible debt securities) generally are valued on the basis of prices provided by independent pricing services. Prices provided by the pricing service may be determined without exclusive reliance on quoted prices, and may reflect appropriate factors such as institution-size trading in similar groups of securities, developments related to specific securities, dividend rate (for unlisted equities), yield (for debt obligations), quality, type of issue, coupon rate (for debt obligations), maturity (for debt obligations), individual trading characteristics and other market data. Pricing services generally value debt obligations assuming orderly transactions of institutional round lot size, but a fund may hold or transact in the same securities in smaller, odd lot sizes. Odd lots often trade at lower prices than institutional round lots, and their value may be adjusted accordingly. Debt obligations are subject to interest rate and credit risks. In addition, all debt obligations involve some risk of default with respect to interest and/or principal payments.
A security listed or traded on an exchange is generally valued at its trade price or official closing price that day as of the close of the exchange where the security is principally traded, or lacking any trades or official closing price on a particular day, the security may be valued at the closing bid price on that day. Securities traded in the over-the-counter market are valued based on prices furnished by independent pricing services or market makers. When such securities are valued using prices provided by an independent pricing service they may be considered fair valued.
Securities of investment companies that are not exchange-traded (e.g., open-end mutual funds) are valued using such company’s end-of-business-day net asset value per share.
Deposits, other obligations of U.S. and non-U.S. banks and financial institutions are valued at their daily account value.
Foreign securities’ (including foreign exchange contracts) prices are converted into U.S. dollar amounts using the applicable exchange rates as of the close of the New York Stock Exchange (“NYSE”). If market quotations are available and reliable for foreign exchange-traded equity securities, the securities will be valued at the market quotations. Invesco Advisers, Inc. (the “Adviser” or “Invesco”) may use various pricing services to obtain market quotations as well as fair value prices. Because trading hours for certain foreign securities end before the close of the NYSE, closing market quotations may become not representative of market value in the Adviser’s judgment (“unreliable”). If, between the time trading ends on a particular security and the close of the customary trading session on the NYSE, a significant event occurs that makes the closing price of the security unreliable, the Adviser may fair value the security. If the event is likely to have affected the closing price of the security, the security will be valued at fair value in good faith in accordance with Board- approved policies and related Adviser procedures (“Valuation Procedures”). Adjustments to closing prices to reflect fair value may also be based on a screening process of an independent pricing service to indicate the degree of certainty, based on historical data, that the closing price in the principal market where a foreign security trades is not the current value as of the close of the NYSE. Foreign securities’ prices meeting the degree of certainty that the price is not reflective of current value will be priced at the indication of fair value from the independent pricing service. Multiple factors may be considered by the independent pricing service in determining adjustments to reflect fair value and may include information relating to sector indices, American Depositary Receipts and domestic and foreign index futures. Foreign securities may have additional risks including exchange rate changes, potential for sharply devalued currencies and high inflation, political and economic upheaval, the relative lack of issuer information, relatively low market liquidity and the potential lack of strict financial and accounting controls and standards.
Unlisted securities will be valued using prices provided by independent pricing services or by another method that the Adviser, in its judgment, believes better reflects the security’s fair value in accordance with the Valuation Procedures.
Securities for which market prices are not provided by any of the above methods may be valued based upon quotes furnished by independent sources. The last bid price may be used to value equity securities. The mean between the last bid and asked prices may be used to value debt obligations, including corporate loans.
Securities for which market quotations are not readily available are fair valued by the Adviser in accordance with the Valuation Procedures. If a fair value price provided by a pricing service is unreliable, the Adviser will fair value the security using the Valuation Procedures. Issuer specific events, market trends, bid/asked quotes of brokers and information providers and other market data may be reviewed in the course of making a good faith determination of a security’s fair value.
The Fund may invest in securities that are subject to interest rate risk, meaning the risk that the prices will generally fall as interest rates rise and, conversely, the prices will generally rise as interest rates fall. Specific securities differ in their sensitivity to changes in interest rates depending on their individual characteristics. Changes in interest rates may result in increased market volatility, which may affect the value and/or liquidity of certain Fund investments.
Valuations change in response to many factors including the historical and prospective earnings of the issuer, the value of the issuer’s assets, general market conditions which are not specifically related to the particular issuer, such as real or perceived adverse economic conditions, changes in the general outlook for revenues or corporate earnings, changes in interest or currency rates, regional or global instability, natural or environmental disasters, widespread disease or other public health issues, war, acts of terrorism, significant governmental actions or adverse investor sentiment generally and market liquidity. Because of the inherent uncertainties of valuation, the values reflected in the financial statements may materially differ from the value received upon actual sale of those investments.
The price the Fund could receive upon the sale of any investment may differ from the Adviser’s valuation of the investment, particularly for securities that are valued using a fair valuation technique. When fair valuation techniques are applied, the Adviser uses available information, including both observable and unobservable inputs and assumptions, to determine a methodology that will result in a valuation that the Adviser believes approximates market value. Fund securities that are fair valued may be subject to greater fluctuation in their value from one day to the next than would be the case if market quotations were used. Because of the inherent uncertainties of valuation, and the degree of subjectivity in such decisions, the Fund could realize a greater or lesser than expected gain or loss upon the sale of the investment.
| B. | Securities Transactions and Investment Income – Securities transactions are accounted for on a trade date basis. Realized gains or losses on sales are computed on the basis of specific identification of the securities sold. Interest income (net of withholding tax, if any) is recorded on an accrual basis from settlement date and includes coupon interest and amortization of premium and accretion of discount on debt securities as applicable. Pay-in-kind interest income |
| 18 Invesco Quality Income Fund |
and non-cash dividend income received in the form of securities in-lieu of cash are recorded at the fair value of the securities received. Paydown gains and losses on mortgage and asset-backed securities are recorded as adjustments to interest income. Dividend income (net of withholding tax, if any) is recorded on the ex-dividend date.
The Fund may periodically participate in litigation related to Fund investments. As such, the Fund may receive proceeds from litigation settlements. Any proceeds received are included in the Statement of Operations as realized gain (loss) for investments no longer held and as unrealized gain (loss) for investments still held.
Brokerage commissions and mark ups are considered transaction costs and are recorded as an increase to the cost basis of securities purchased and/or a reduction of proceeds on a sale of securities. Such transaction costs are included in the determination of net realized and unrealized gain (loss) from investment securities reported in the Statement of Operations and the Statement of Changes in Net Assets and the net realized and unrealized gains (losses) on securities per share in the Financial Highlights. Transaction costs are included in the calculation of the Fund’s net asset value and, accordingly, they reduce the Fund’s total returns. These transaction costs are not considered operating expenses and are not reflected in net investment income reported in the Statement of Operations and the Statement of Changes in Net Assets, or the net investment income per share and the ratios of expenses and net investment income reported in the Financial Highlights, nor are they limited by any expense limitation arrangements between the Fund and the investment adviser.
The Fund allocates income and realized and unrealized capital gains and losses to a class based on the relative net assets of each class.
| C. | Distributions – Distributions from net investment income, if any, are declared daily and paid monthly. Distributions from net realized capital gain, if any, are generally declared and paid annually and recorded on the ex-dividend date. |
| D. | Federal Income Taxes – The Fund intends to comply with the requirements of Subchapter M of the Internal Revenue Code of 1986, as amended (the “Internal Revenue Code”), necessary to qualify as a regulated investment company and to distribute substantially all of the Fund’s taxable earnings to shareholders. As such, the Fund will not be subject to federal income taxes on otherwise taxable income (including net realized capital gain) that is distributed to shareholders. Therefore, no provision for federal income taxes is recorded in the financial statements. |
The Fund recognizes the tax benefits of uncertain tax positions only when the position is more likely than not to be sustained. Management has analyzed the Fund’s uncertain tax positions and concluded that no liability for unrecognized tax benefits should be recorded related to uncertain tax positions. Management is not aware of any tax positions for which it is reasonably possible that the total amounts of unrecognized tax benefits will change materially in the next 12 months.
The Fund files tax returns in the U.S. Federal jurisdiction and certain other jurisdictions. Generally, the Fund is subject to examinations by such taxing authorities for up to three years after the filing of the return for the tax period.
| E. | Expenses – Fees provided for under the Rule 12b-1 plan of a particular class of the Fund are charged to the operations of such class. Transfer agency fees and expenses and other shareholder recordkeeping fees and expenses attributable to Class R5 and Class R6 are allocated based on relative net assets of Class R5 and Class R6. Sub-accounting fees attributable to Class R5 are charged to the operations of the class. Transfer agency fees and expenses and other shareholder recordkeeping fees and expenses relating to all other classes are allocated among those classes based on relative net assets. All other expenses are allocated among the classes based on relative net assets. |
| F. | Accounting Estimates – The preparation of financial statements in conformity with accounting principles generally accepted in the United States of America (“GAAP”) requires management to make estimates and assumptions that affect the reported amounts of assets and liabilities at the date of the financial statements and the reported amounts of revenues and expenses during the reporting period including estimates and assumptions related to taxation. Actual results could differ from those estimates by a significant amount. In addition, the Fund monitors for material events or transactions that may occur or become known after the period-end date and before the date the financial statements are released to print. |
| G. | Indemnifications – Under the Trust’s organizational documents, each Trustee, officer, employee or other agent of the Trust is indemnified against certain liabilities that may arise out of the performance of their duties to the Fund. Additionally, in the normal course of business, the Fund enters into contracts, including the Fund’s servicing agreements, that contain a variety of indemnification clauses. The Fund’s maximum exposure under these arrangements is unknown as this would involve future claims that may be made against the Fund that have not yet occurred. The risk of material loss as a result of such indemnification claims is considered remote. |
| H. | Securities Lending – The Fund may lend portfolio securities having a market value up to one-third of the Fund’s total assets. Such loans are secured by collateral equal to no less than the market value of the loaned securities determined daily by the securities lending provider. Such collateral will be cash or debt securities issued or guaranteed by the U.S. Government or any of its sponsored agencies. Cash collateral received in connection with these loans is invested in short-term money market instruments or affiliated, unregistered investment companies that comply with Rule 2a-7 under the 1940 Act and money market funds (collectively, “affiliated money market funds”) and is shown as such on the Schedule of Investments. The Fund bears the risk of loss with respect to the investment of collateral. It is the Fund’s policy to obtain additional collateral from or return excess collateral to the borrower by the end of the next business day, following the valuation date of the securities loaned. Therefore, the value of the collateral held may be temporarily less than the value of the securities on loan. When loaning securities, the Fund retains certain benefits of owning the securities, including the economic equivalent of dividends or interest generated by the security. Lending securities entails a risk of loss to the Fund if, and to the extent that, the market value of the securities loaned were to increase and the borrower did not increase the collateral accordingly, and the borrower failed to return the securities. The securities loaned are subject to termination at the option of the borrower or the Fund. Upon termination, the borrower will return to the Fund the securities loaned and the Fund will return the collateral. Upon the failure of the borrower to return the securities, collateral may be liquidated and the securities may be purchased on the open market to replace the loaned securities. The Fund could experience delays and costs in gaining access to the collateral and the securities may lose value during the delay which could result in potential losses to the Fund. Some of these losses may be indemnified by the lending agent. The Fund bears the risk of any deficiency in the amount of the collateral available for return to the borrower due to any loss on the collateral invested. Dividends received on cash collateral investments for securities lending transactions, which are net of compensation to counterparties, are included in Dividends from affiliated money market funds on the Statement of Operations. The aggregate value of securities out on loan, if any, is shown as a footnote on the Statement of Assets and Liabilities. |
The Adviser serves as an affiliated securities lending agent for the Fund. The Bank of New York Mellon also serves as a lending agent. To the extent the Fund utilizes the Adviser as an affiliated securities lending agent, the Fund conducts its securities lending in accordance with, and in reliance upon, no-action letters issued by the SEC staff that provide guidance on how an affiliate may act as a direct agent lender and receive compensation for those services in a manner consistent with the federal securities laws. For the year ended December 31, 2022, there were no securities lending transactions with the Adviser. Fees paid to the Adviser for securities lending agent services, if any, are included in Dividends from affiliated money market funds on the Statement of Operations.
| I. | Futures Contracts – The Fund may enter into futures contracts to manage exposure to interest rate, equity and market price movements and/or currency risks. A futures contract is an agreement between two parties (“Counterparties”) to purchase or sell a specified underlying security, currency or commodity (or delivery of a cash settlement price, in the case of an index future) for a fixed price at a future date. The Fund currently invests only in exchange-traded futures and they are standardized as to maturity date and underlying financial instrument. Initial margin deposits required upon entering into futures contracts are satisfied by the segregation of specific securities or cash as collateral at the futures commission merchant (broker). During the period the futures contracts are open, changes in the value of the contracts are recognized as unrealized gains or losses by recalculating the value of the contracts on a daily basis. Subsequent or variation margin payments are received or made depending upon whether unrealized gains or losses are incurred. These amounts are reflected as receivables or payables on the Statement of Assets and Liabilities. When the contracts are closed or expire, the Fund recognizes a realized gain or loss equal to the difference between the proceeds from, or cost of, the closing transaction and the Fund’s basis in the contract. The net realized gain (loss) and the change in unrealized gain (loss) on futures contracts held during the period is included on the Statement of Operations. The primary risks associated with futures contracts are market risk |
| 19 Invesco Quality Income Fund |
and the absence of a liquid secondary market. If the Fund were unable to liquidate a futures contract and/or enter into an offsetting closing transaction, the Fund would continue to be subject to market risk with respect to the value of the contracts and continue to be required to maintain the margin deposits on the futures contracts. Futures contracts have minimal Counterparty risk since the exchange’s clearinghouse, as Counterparty to all exchange-traded futures, guarantees the futures against default. Risks may exceed amounts recognized in the Statement of Assets and Liabilities.
| J. | Dollar Rolls and Forward Commitment Transactions – The Fund may enter into dollar roll transactions to enhance the Fund’s performance. The Fund executes its dollar roll transactions in the to be announced (“TBA”) market whereby the Fund makes a forward commitment to purchase a security and, instead of accepting delivery, the position is offset by the sale of the security with a simultaneous agreement to repurchase at a future date. |
The Fund accounts for dollar roll transactions as purchases and sales and realizes gains and losses on these transactions. These transactions increase the Fund’s portfolio turnover rate.
Dollar roll transactions involve the risk that a Counterparty to the transaction may fail to complete the transaction. If this occurs, the Fund may lose the opportunity to purchase or sell the security at the agreed upon price. Dollar roll transactions also involve the risk that the value of the securities retained by the Fund may decline below the price of the securities that the Fund has sold but is obligated to purchase under the agreement.
| K. | Collateral – To the extent the Fund has designated or segregated a security as collateral and that security is subsequently sold, it is the Fund’s practice to replace such collateral no later than the next business day. |
| L. | Other Risks – The Fund may invest in obligations issued by agencies and instrumentalities of the U.S. Government that may vary in the level of support they receive from the government. The government may choose not to provide financial support to government sponsored agencies or instrumentalities if it is not legally obligated to do so. In this case, if the issuer defaulted, the Fund may not be able to recover its investment in such issuer from the U.S. Government. Many securities purchased by the Fund are not guaranteed by the U.S. Government. Additionally, from time to time, uncertainty regarding the status of negotiations in the U.S. Government to increase the statutory debt limit, commonly called the “debt ceiling”, could increase the risk that the U.S. Government may default on payments on certain U.S. Government securities, cause the credit rating of the U.S. Government to be downgraded, increase volatility in the stock and bond markets, result in higher interest rates, reduce prices of U.S. Treasury securities, and/or increase the costs of various kinds of debt. If a U.S. Government-sponsored entity is negatively impacted by legislative or regulatory action, is unable to meet its obligations, or its creditworthiness declines, the performance of a Fund that holds securities of that entity will be adversely impacted. |
Mortgage- and asset-backed securities, including collateralized debt obligations and collateralized mortgage obligations, are subject to prepayment or call risk, which is the risk that a borrower’s payments may be received earlier or later than expected due to changes in prepayment rates on underlying loans. This could result in the Fund reinvesting these early payments at lower interest rates, thereby reducing the Fund’s income. Mortgage- and asset-backed securities also are subject to extension risk, which is the risk that an unexpected rise in interest rates could reduce the rate of prepayments, causing the price of the mortgage- and asset-backed securities and the Fund’s share price to fall. An unexpectedly high rate of defaults on the mortgages held by a mortgage pool may adversely affect the value of mortgage-backed securities and could result in losses to the Fund. Privately-issued mortgage-backed securities and asset-backed securities may be less liquid than other types of securities and the Fund may be unable to sell these securities at the time or price it desires.
Active trading of portfolio securities may result in added expenses, a lower return and increased tax liability.
| M. | COVID-19 Risk – The COVID-19 strain of coronavirus has resulted in instances of market closures and dislocations, extreme volatility, liquidity constraints and increased trading costs. Efforts to contain its spread have resulted in travel restrictions, disruptions of healthcare systems, business operations (including business closures) and supply chains, layoffs, lower consumer demand and employee availability, and defaults and credit downgrades, among other significant economic impacts that have disrupted global economic activity across many industries. Such economic impacts may exacerbate other pre-existing political, social and economic risks locally or globally and cause general concern and uncertainty. The full economic impact and ongoing effects of COVID-19 (or other future epidemics or pandemics) at the macro-level and on individual businesses are unpredictable and may result in significant and prolonged effects on the Fund’s performance. |
NOTE 2–Advisory Fees and Other Fees Paid to Affiliates
The Trust has entered into a master investment advisory agreement with the Adviser. Under the terms of the investment advisory agreement, the Fund accrues daily and pays monthly an advisory fee to the Adviser based on the annual rate of the Fund’s average daily net assets as follows:
Average Daily Net Assets | Rate | |
First $100 million | 0.4700% | |
Next $150 million | 0.4400% | |
Next $250 million | 0.4125% | |
Next $2 billion | 0.3825% | |
Next $2.5 billion | 0.3800% | |
Next $2.5 billion | 0.3650% | |
Next $2.5 billion | 0.3400% | |
Next $2.5 billion | 0.2950% | |
Over $12.5 billion | 0.2700% |
For the year ended December 31, 2022, the effective advisory fee rate incurred by the Fund was 0.42%.
Under the terms of a master sub-advisory agreement between the Adviser and each of Invesco Asset Management Deutschland GmbH, Invesco Asset Management Limited, Invesco Asset Management (Japan) Limited, Invesco Hong Kong Limited, Invesco Senior Secured Management, Inc. and Invesco Canada Ltd. and separate sub-advisory agreements with Invesco Capital Management LLC and Invesco Asset Management (India) Private Limited (collectively, the “Affiliated Sub-Advisers”) the Adviser, not the Fund, will pay 40% of the fees paid to the Adviser to any such Affiliated Sub-Adviser(s) that provide(s) discretionary investment management services to the Fund based on the percentage of assets allocated to such Affiliated Sub-Adviser(s).
The Adviser has contractually agreed, through at least June 30, 2023, to waive advisory fees and/or reimburse expenses to the extent necessary to limit total annual fund operating expenses after fee waiver and/or expense reimbursement (excluding certain items discussed below) of Class A, Class C, Class R, Class Y, Class R5 and Class R6 shares to 1.50%, 2.25%, 1.75%, 1.25%, 1.25% and 1.25%, respectively, of the Fund’s average daily net assets (the “expense limits”). In determining the Adviser’s obligation to waive advisory fees and/or reimburse expenses, the following expenses are not taken into account, and could cause the total annual fund operating expenses after fee waiver and/or expense reimbursement to exceed the numbers reflected above: (1) interest; (2) taxes; (3) dividend expense on short sales; (4) extraordinary or non-routine items, including litigation expenses; and (5) expenses that the Fund has incurred but did not actually pay because of an expense offset arrangement. Unless Invesco continues the fee waiver agreement, it will terminate on June 30, 2023. During its term, the fee waiver agreement cannot be terminated or amended to increase the expense limits or reduce the advisory fee waiver without approval of the Board of Trustees. The Adviser did not waive fees and/or reimburse expenses during the period under these expense limits.
| 20 Invesco Quality Income Fund |
Further, the Adviser has contractually agreed, through at least June 30, 2024, to waive the advisory fee payable by the Fund in an amount equal to 100% of the net advisory fees the Adviser receives from the affiliated money market funds on investments by the Fund of uninvested cash (excluding investments of cash collateral from securities lending) in such affiliated money market funds.
For the year ended December 31, 2022, the Adviser waived advisory fees of $6,638.
The Trust has entered into a master administrative services agreement with Invesco pursuant to which the Fund has agreed to pay Invesco for certain administrative costs incurred in providing accounting services to the Fund. For the year ended December 31, 2022, expenses incurred under the agreement are shown in the Statement of Operations as Administrative services fees. Invesco has entered into a sub-administration agreement whereby State Street Bank and Trust Company (“SSB”) serves as fund accountant and provides certain administrative services to the Fund. Pursuant to a custody agreement with the Trust on behalf of the Fund, SSB also serves as the Fund’s custodian.
The Trust has entered into a transfer agency and service agreement with Invesco Investment Services, Inc. (“IIS”) pursuant to which the Fund has agreed to pay IIS a fee for providing transfer agency and shareholder services to the Fund and reimburse IIS for certain expenses incurred by IIS in the course of providing such services. IIS may make payments to intermediaries that provide omnibus account services, sub-accounting services and/or networking services. All fees payable by IIS to intermediaries that provide omnibus account services or sub-accounting services are charged back to the Fund, subject to certain limitations approved by the Trust’s Board of Trustees. For the year ended December 31, 2022, expenses incurred under the agreement are shown in the Statement of Operations as Transfer agent fees.
The Trust has entered into master distribution agreements with Invesco Distributors, Inc.(“IDI”) to serve as the distributor for the Class A, Class C, Class R, Class Y, Class R5 and Class R6 shares of the Fund. The Trust has adopted plans pursuant to Rule 12b-1 under the 1940 Act with respect to the Fund’s Class A, Class C and Class R shares (collectively the “Plans”). The Fund, pursuant to the Plans, reimburses IDI for its allocated share of expenses incurred for the period, up to a maximum annual rate of 0.25% of the average daily net assets of Class A shares and up to a maximum annual rate of 1.00% of the average daily net assets of Class C shares. The Fund pursuant to the Class R Plan, pays IDI compensation at the annual rate of 0.50% of the average daily net assets of Class R shares. The fees are accrued daily and paid monthly. Of the Plan payments, up to 0.25% of the average daily net assets of each class of shares may be paid to furnish continuing personal shareholder services to customers who purchase and own shares of such classes. Any amounts not paid as a service fee under the Plan would constitute an asset-based sales charge. Rules of the Financial Industry Regulatory Authority (“FINRA”) impose a cap on the total sales charges, including asset-based sales charges, that may be paid by any class of shares of the Fund. For the year ended December 31, 2022, expenses incurred under the Plans are shown in the Statement of Operations as Distribution fees.
Front-end sales commissions and CDSC (collectively, the “sales charges”) are not recorded as expenses of the Fund. Front-end sales commissions are deducted from proceeds from the sales of Fund shares prior to investment in Class A shares of the Fund. CDSC are deducted from redemption proceeds prior to remittance to the shareholder. During the year ended December 31, 2022, IDI advised the Fund that IDI retained $26,289 in front-end sales commissions from the sale of Class A shares and $649 and $625 from Class A and Class C shares, respectively, for CDSC imposed upon redemptions by shareholders.
Certain officers and trustees of the Trust are officers and directors of the Adviser, IIS and/or IDI.
NOTE 3–Additional Valuation Information
GAAP defines fair value as the price that would be received to sell an asset or paid to transfer a liability in an orderly transaction between market participants at the measurement date, under current market conditions. GAAP establishes a hierarchy that prioritizes the inputs to valuation methods, giving the highest priority to readily available unadjusted quoted prices in an active market for identical assets (Level 1) and the lowest priority to significant unobservable inputs (Level 3), generally when market prices are not readily available. Based on the valuation inputs, the securities or other investments are tiered into one of three levels. Changes in valuation methods may result in transfers in or out of an investment’s assigned level:
| Level 1 | - | Prices are determined using quoted prices in an active market for identical assets. | ||
| Level 2 | - | Prices are determined using other significant observable inputs. Observable inputs are inputs that other market participants may use in pricing a security. These may include quoted prices for similar securities, interest rates, prepayment speeds, credit risk, yield curves, loss severities, default rates, discount rates, volatilities and others. | ||
| Level 3 | - | Prices are determined using significant unobservable inputs. In situations where quoted prices or observable inputs are unavailable (for example, when there is little or no market activity for an investment at the end of the period), unobservable inputs may be used. Unobservable inputs reflect the Adviser’s assumptions about the factors market participants would use in determining fair value of the securities or instruments and would be based on the best available information. |
The following is a summary of the tiered valuation input levels, as of December 31, 2022. The level assigned to the securities valuations may not be an indication of the risk or liquidity associated with investing in those securities. Because of the inherent uncertainties of valuation, the values reflected in the financial statements may materially differ from the value received upon actual sale of those investments.
| Level 1 | Level 2 | Level 3 | Total | |||||||||||||
| ||||||||||||||||
Investments in Securities | ||||||||||||||||
| ||||||||||||||||
U.S. Government Sponsored Agency Mortgage-Backed Securities | $ | – | $ | 739,239,587 | $– | $ | 739,239,587 | |||||||||
| ||||||||||||||||
Asset-Backed Securities | – | 55,745,840 | – | 55,745,840 | ||||||||||||
| ||||||||||||||||
Commercial Paper | – | 52,174,152 | – | 52,174,152 | ||||||||||||
| ||||||||||||||||
Certificate of Deposit | – | 22,056,347 | – | 22,056,347 | ||||||||||||
| ||||||||||||||||
Agency Credit Risk Transfer Notes | – | 8,589,181 | – | 8,589,181 | ||||||||||||
| ||||||||||||||||
U.S. Treasury Securities | – | 1,354,604 | – | 1,354,604 | ||||||||||||
| ||||||||||||||||
Money Market Funds | 16,552,417 | – | – | 16,552,417 | ||||||||||||
| ||||||||||||||||
Total Investments in Securities | 16,552,417 | 879,159,711 | – | 895,712,128 | ||||||||||||
| ||||||||||||||||
Other Investments - Assets* | ||||||||||||||||
| ||||||||||||||||
Futures Contracts | 339,866 | – | – | 339,866 | ||||||||||||
| ||||||||||||||||
Other Investments - Liabilities* | ||||||||||||||||
| ||||||||||||||||
Futures Contracts | (95,777 | ) | – | – | (95,777 | ) | ||||||||||
| ||||||||||||||||
Total Other Investments | 244,089 | – | – | 244,089 | ||||||||||||
| ||||||||||||||||
Total Investments | $ | 16,796,506 | $ | 879,159,711 | $– | $ | 895,956,217 | |||||||||
| ||||||||||||||||
| * | Unrealized appreciation (depreciation). |
| 21 Invesco Quality Income Fund |
NOTE 4–Derivative Investments
The Fund may enter into an International Swaps and Derivatives Association Master Agreement (“ISDA Master Agreement”) under which a fund may trade OTC derivatives. An OTC transaction entered into under an ISDA Master Agreement typically involves a collateral posting arrangement, payment netting provisions and close-out netting provisions. These netting provisions allow for reduction of credit risk through netting of contractual obligations. The enforceability of the netting provisions of the ISDA Master Agreement depends on the governing law of the ISDA Master Agreement, among other factors.
For financial reporting purposes, the Fund does not offset OTC derivative assets or liabilities that are subject to ISDA Master Agreements in the Statement of Assets and Liabilities.
Value of Derivative Investments at Period-End
The table below summarizes the value of the Fund’s derivative investments, detailed by primary risk exposure, held as of December 31, 2022:
| Value | ||||
|
| |||
| Derivative Assets | Interest Rate Risk | |||
| ||||
Unrealized appreciation on futures contracts – Exchange-Traded(a) | $ | 339,866 | ||
| ||||
Derivatives not subject to master netting agreements | (339,866 | ) | ||
| ||||
Total Derivative Assets subject to master netting agreements | $ | – | ||
| ||||
| Value | ||||
|
| |||
| Interest | ||||
| Derivative Liabilities | Rate Risk | |||
| ||||
Unrealized depreciation on futures contracts – Exchange-Traded(a) | $ | (95,777 | ) | |
| ||||
Derivatives not subject to master netting agreements | 95,777 | |||
| ||||
Total Derivative Liabilities subject to master netting agreements | $ | – | ||
| ||||
| (a) | The daily variation margin receivable (payable) at period-end is recorded in the Statement of Assets and Liabilities. |
Effect of Derivative Investments for the year ended December 31, 2022
The table below summarizes the gains (losses) on derivative investments, detailed by primary risk exposure, recognized in earnings during the period:
| Location of Gain on Statement of Operations | |||||
| Interest | |||||
| Rate Risk | |||||
Realized Gain: | |||||
Futures contracts | $ | 2,448,750 | |||
Change in Net Unrealized Appreciation: | |||||
Futures contracts | 903,683 | ||||
Total | $ | 3,352,433 | |||
The table below summarizes the average notional value of derivatives held during the period.
| Futures | ||||
| Contracts | ||||
Average notional value | $ | 126,484,817 | ||
NOTE 5–Expense Offset Arrangement(s)
The expense offset arrangement is comprised of transfer agency credits which result from balances in demand deposit accounts used by the transfer agent for clearing shareholder transactions. For the year ended December 31, 2022, the Fund received credits from this arrangement, which resulted in the reduction of the Fund’s total expenses of $9,374.
NOTE 6–Trustees’ and Officers’ Fees and Benefits
Trustees’ and Officers’ Fees and Benefits include amounts accrued by the Fund to pay remuneration to certain Trustees and Officers of the Fund. Trustees have the option to defer compensation payable by the Fund, and Trustees’ and Officers’ Fees and Benefits also include amounts accrued by the Fund to fund such deferred compensation amounts. Those Trustees who defer compensation have the option to select various Invesco Funds in which their deferral accounts shall be deemed to be invested. Finally, certain current Trustees were eligible to participate in a retirement plan that provided for benefits to be paid upon retirement to Trustees over a period of time based on the number of years of service. The Fund may have certain former Trustees who also participate in a retirement plan and receive benefits under such plan. Trustees’ and Officers’ Fees and Benefits include amounts accrued by the Fund to fund such retirement benefits. Obligations under the deferred compensation and retirement plans represent unsecured claims against the general assets of the Fund.
NOTE 7–Cash Balances
The Fund may borrow for leveraging in an amount up to 5% of the Fund’s total assets (excluding the amount borrowed) at the time the borrowing is made. In doing so, the Fund is permitted to temporarily carry a negative or overdrawn balance in its account with SSB, the custodian bank. Such balances, if any at period end, are shown in the Statement of Assets and Liabilities under the payable caption Amount due custodian. To compensate the custodian bank for such overdrafts, the overdrawn Fund may either (1) leave funds as a compensating balance in the account so the custodian bank can be compensated by earning the additional interest; or (2) compensate
| 22 Invesco Quality Income Fund |
by paying the custodian bank at a rate agreed upon by the custodian bank and Invesco, not to exceed the contractually agreed upon rate. The Fund may not purchase additional securities when any borrowings from banks or broker-dealers exceed 5% of the Fund’s total assets, or when any borrowings from an Invesco Fund are outstanding.
NOTE 8–Distributions to Shareholders and Tax Components of Net Assets
Tax Character of Distributions to Shareholders Paid During the Fiscal Years Ended December 31, 2022 and 2021:
| 2022 | 2021 | |||||
Ordinary income* | $ | 20,903,221 | $31,373,718 | |||
| * | Includes short-term capital gain distributions, if any. |
Tax Components of Net Assets at Period-End:
| 2022 | ||||
| ||||
Undistributed ordinary income | $ | 2,536,801 | ||
| ||||
Net unrealized appreciation (depreciation) – investments | (98,786,371 | ) | ||
| ||||
Temporary book/tax differences | (184,617 | ) | ||
| ||||
Capital loss carryforward | (130,068,593 | ) | ||
| ||||
Shares of beneficial interest | 879,353,150 | |||
| ||||
Total net assets | $ | 652,850,370 | ||
| ||||
The difference between book-basis and tax-basis unrealized appreciation (depreciation) is due to differences in the timing of recognition of gains and losses on investments for tax and book purposes. The Fund’s net unrealized appreciation (depreciation) difference is attributable primarily to wash sales and derivative instruments.
The temporary book/tax differences are a result of timing differences between book and tax recognition of income and/or expenses. The Fund’s temporary book/tax differences are the result of the trustee deferral of compensation and retirement plan benefits.
Capital loss carryforward is calculated and reported as of a specific date. Results of transactions and other activity after that date may affect the amount of capital loss carryforward actually available for the Fund to utilize. The ability to utilize capital loss carryforward in the future may be limited under the Internal Revenue Code and related regulations based on the results of future transactions.
The Fund has a capital loss carryforward as of December 31, 2022, as follows:
| Capital Loss Carryforward* | ||||||||||
| Expiration | Short-Term | Long-Term | Total | |||||||
Not subject to expiration | $ | 73,818,980 | $ | 56,249,613 | $130,068,593 | |||||
| * | Capital loss carryforward is reduced for limitations, if any, to the extent required by the Internal Revenue Code and may be further limited depending upon a variety of factors, including the realization of net unrealized gains or losses as of the date of any reorganization. |
NOTE 9–Investment Transactions
The aggregate amount of investment securities (other than short-term securities, U.S. Government obligations and money market funds, if any) purchased and sold by the Fund during the year ended December 31, 2022 was $0 and $20,841,653, respectively. Cost of investments, including any derivatives, on a tax basis includes the adjustments for financial reporting purposes as of the most recently completed federal income tax reporting period-end.
| Unrealized Appreciation (Depreciation) of Investments on a Tax Basis | ||||
| ||||
Aggregate unrealized appreciation of investments | $ | 1,638,951 | ||
| ||||
Aggregate unrealized (depreciation) of investments | (100,425,322 | ) | ||
| ||||
Net unrealized appreciation (depreciation) of investments | $ | (98,786,371 | ) | |
| ||||
Cost of investments for tax purposes is $994,742,588.
NOTE 10–Reclassification of Permanent Differences
Primarily as a result of differing book/tax treatment of dollar rolls and paydowns, on December 31, 2022, undistributed net investment income was increased by $11,645,762 and undistributed net realized gain (loss) was decreased by $11,645,762. This reclassification had no effect on the net assets or the distributable earnings (loss) of the Fund.
NOTE 11–Share Information
| Summary of Share Activity | ||||||||||||||
| Year ended | Year ended | |||||||||||||
| December 31, 2022(a) | December 31, 2021 | |||||||||||||
| Shares | Amount | Shares | Amount | |||||||||||
Sold: | ||||||||||||||
Class A | 3,372,175 | $ | 35,129,235 | 5,247,785 | $ 61,226,557 | |||||||||
Class C | 390,796 | 4,059,915 | 442,265 | 5,135,542 | ||||||||||
Class R | 352,401 | 3,685,988 | 457,434 | 5,336,274 | ||||||||||
Class Y | 4,316,746 | 44,291,312 | 4,240,157 | 49,957,902 | ||||||||||
Class R5 | 18,411 | 194,453 | 9,444 | 110,786 | ||||||||||
Class R6 | 406,909 | 4,263,706 | 2,160,441 | 25,243,150 | ||||||||||
| 23 Invesco Quality Income Fund |
| Summary of Share Activity | ||||||||||||||||
| ||||||||||||||||
| Year ended | Year ended | |||||||||||||||
| December 31, 2022(a) | December 31, 2021 | |||||||||||||||
| Shares | Amount | Shares | Amount | |||||||||||||
| ||||||||||||||||
Issued as reinvestment of dividends: | ||||||||||||||||
Class A | 1,370,790 | $ | 13,965,439 | 1,707,161 | $ | 19,856,606 | ||||||||||
| ||||||||||||||||
Class C | 41,871 | 424,011 | 72,652 | 840,995 | ||||||||||||
| ||||||||||||||||
Class R | 53,209 | 540,200 | 61,299 | 712,320 | ||||||||||||
| ||||||||||||||||
Class Y | 202,453 | 2,061,206 | 298,525 | 3,490,500 | ||||||||||||
| ||||||||||||||||
Class R5 | 517 | 5,374 | 1,271 | 14,775 | ||||||||||||
| ||||||||||||||||
Class R6 | 63,882 | 654,044 | 79,035 | 922,272 | ||||||||||||
| ||||||||||||||||
Automatic conversion of Class C shares to Class A shares: | ||||||||||||||||
Class A | 355,040 | 3,669,718 | 490,064 | 5,712,148 | ||||||||||||
| ||||||||||||||||
Class C | (357,288 | ) | (3,669,718 | ) | (493,153 | ) | (5,712,148 | ) | ||||||||
| ||||||||||||||||
Reacquired: | ||||||||||||||||
Class A | (13,604,332 | ) | (140,425,475 | ) | (14,665,238 | ) | (170,803,253 | ) | ||||||||
| ||||||||||||||||
Class C | (996,999 | ) | (10,378,996 | ) | (1,671,452 | ) | (19,382,819 | ) | ||||||||
| ||||||||||||||||
Class R | (549,950 | ) | (5,722,338 | ) | (691,970 | ) | (8,077,977 | ) | ||||||||
| ||||||||||||||||
Class Y | (5,360,927 | ) | (55,736,734 | ) | (10,800,066 | ) | (126,226,559 | ) | ||||||||
| ||||||||||||||||
Class R5 | (47,530 | ) | (502,720 | ) | (916 | ) | (10,648 | ) | ||||||||
| ||||||||||||||||
Class R6 | (1,234,913 | ) | (12,584,068 | ) | (2,070,983 | ) | (24,123,710 | ) | ||||||||
| ||||||||||||||||
Net increase (decrease) in share activity | (11,206,739 | ) | $ | (116,075,448 | ) | (15,126,245 | ) | $ | (175,777,287 | ) | ||||||
| ||||||||||||||||
| (a) | There are entities that are record owners of more than 5% of the outstanding shares of the Fund and in the aggregate own 11% of the outstanding shares of the Fund. IDI has an agreement with these entities to sell Fund shares. The Fund, Invesco and/or Invesco affiliates may make payments to these entities, which are considered to be related to the Fund, for providing services to the Fund, Invesco and/or Invesco affiliates including but not limited to services such as securities brokerage, distribution, third party record keeping and account servicing. The Fund has no knowledge as to whether all or any portion of the shares owned of record by these entities are also owned beneficially. |
| 24 Invesco Quality Income Fund |
Report of Independent Registered Public Accounting Firm
To the Board of Trustees of AIM Growth Series (Invesco Growth Series) and Shareholders of Invesco Quality Income Fund
Opinion on the Financial Statements
We have audited the accompanying statement of assets and liabilities, including the schedule of investments, of Invesco Quality Income Fund (one of the funds constituting AIM Growth Series (Invesco Growth Series), referred to hereafter as the “Fund”) as of December 31, 2022, the related statement of operations for the year ended December 31, 2022, the statement of changes in net assets for each of the two years in the period ended December 31, 2022, including the related notes, and the financial highlights for each of the periods indicated therein (collectively referred to as the “financial statements”). In our opinion, the financial statements present fairly, in all material respects, the financial position of the Fund as of December 31, 2022, the results of its operations for the year then ended, the changes in its net assets for each of the two years in the period ended December 31, 2022 and the financial highlights for each of the periods indicated therein in conformity with accounting principles generally accepted in the United States of America.
Basis for Opinion
These financial statements are the responsibility of the Fund’s management. Our responsibility is to express an opinion on the Fund’s financial statements based on our audits. We are a public accounting firm registered with the Public Company Accounting Oversight Board (United States) (PCAOB) and are required to be independent with respect to the Fund in accordance with the U.S. federal securities laws and the applicable rules and regulations of the Securities and Exchange Commission and the PCAOB.
We conducted our audits of these financial statements in accordance with the standards of the PCAOB. Those standards require that we plan and perform the audit to obtain reasonable assurance about whether the financial statements are free of material misstatement, whether due to error or fraud.
Our audits included performing procedures to assess the risks of material misstatement of the financial statements, whether due to error or fraud, and performing procedures that respond to those risks. Such procedures included examining, on a test basis, evidence regarding the amounts and disclosures in the financial statements. Our audits also included evaluating the accounting principles used and significant estimates made by management, as well as evaluating the overall presentation of the financial statements. Our procedures included confirmation of securities owned as of December 31, 2022 by correspondence with the custodian, transfer agent and brokers. We believe that our audits provide a reasonable basis for our opinion.
/s/PricewaterhouseCoopers LLP
Houston, Texas
February 22, 2023
We have served as the auditor of one or more of the investment companies in the Invesco group of investment companies since at least 1995. We have not been able to determine the specific year we began serving as auditor.
| 25 Invesco Quality Income Fund |
Calculating your ongoing Fund expenses
Example
As a shareholder of the Fund, you incur two types of costs: (1) transaction costs, which may include sales charges (loads) on purchase payments or contingent deferred sales charges on redemptions, if any; and (2) ongoing costs, including management fees, distribution and/or service (12b-1) fees, and other Fund expenses. This example is intended to help you understand your ongoing costs (in dollars) of investing in the Fund and to compare these costs with ongoing costs of investing in other mutual funds. The example is based on an investment of $1,000 invested at the beginning of the period and held for the entire period July 1, 2022 through December 31, 2022.
Actual expenses
The table below provides information about actual account values and actual expenses. You may use the information in this table, together with the amount you invested, to estimate the expenses that you paid over the period. Simply divide your account value by $1,000 (for example, an $8,600 account value divided by $1,000 = 8.6), then multiply the result by the number in the table under the heading entitled “Actual Expenses Paid During Period” to estimate the expenses you paid on your account during this period.
Hypothetical example for comparison purposes
The table below also provides information about hypothetical account values and hypothetical expenses based on the Fund’s actual expense ratio and an assumed rate of return of 5% per year before expenses, which is not the Fund’s actual return.
The hypothetical account values and expenses may not be used to estimate the actual ending account balance or expenses you paid for the period. You may use this information to compare the ongoing costs of investing in the Fund and other funds. To do so, compare this 5% hypothetical example with the 5% hypothetical examples that appear in the shareholder reports of the other funds.
Please note that the expenses shown in the table are meant to highlight your ongoing costs only and do not reflect any transaction costs, such as sales charges (loads) on purchase payments or contingent deferred sales charges on redemptions, if any. Therefore, the hypothetical information is useful in comparing ongoing costs only, and will not help you determine the relative total costs of owning different funds. In addition, if these transaction costs were included, your costs would have been higher.
| ACTUAL | HYPOTHETICAL (5% annual return before expenses) | |||||||||||||||||||
| Beginning Account Value (07/01/22) | Ending Account Value (12/31/22)1 | Expenses Paid During Period2 | Ending Account Value (12/31/22) | Expenses Paid During Period2 | Annualized Expense Ratio | |||||||||||||||
| Class A | $1,000.00 | $962.20 | $4.25 | $1,020.87 | $4.38 | 0.86% | ||||||||||||||
| Class C | 1,000.00 | 958.10 | 8.00 | 1,017.04 | 8.24 | 1.62 | ||||||||||||||
| Class R | 1,000.00 | 960.80 | 5.54 | 1,019.56 | 5.70 | 1.12 | ||||||||||||||
| Class Y | 1,000.00 | 963.50 | 3.07 | 1,022.08 | 3.16 | 0.62 | ||||||||||||||
| Class R5 | 1,000.00 | 963.60 | 2.72 | 1,022.43 | 2.80 | 0.55 | ||||||||||||||
| Class R6 | 1,000.00 | 964.10 | 2.48 | 1,022.68 | 2.55 | 0.50 | ||||||||||||||
| 1 | The actual ending account value is based on the actual total return of the Fund for the period July 1, 2022 through December 31, 2022, after actual expenses and will differ from the hypothetical ending account value which is based on the Fund’s expense ratio and a hypothetical annual return of 5% before expenses. |
| 2 | Expenses are equal to the Fund’s annualized expense ratio as indicated above multiplied by the average account value over the period, multiplied by 184/365 to reflect the most recent fiscal half year. |
| 26 Invesco Quality Income Fund |
Form 1099-DIV, Form 1042-S and other year–end tax information provide shareholders with actual calendar year amounts that should be included in their tax returns. Shareholders should consult their tax advisers.
The following distribution information is being provided as required by the Internal Revenue Code or to meet a specific state’s requirement.
The Fund designates the following amounts or, if subsequently determined to be different, the maximum amount allowable for its fiscal year ended December 31, 2022:
| Federal and State Income Tax | ||||||
| Qualified Dividend Income* | 0.00% | |||||
| Corporate Dividends Received Deduction* | 0.00% | |||||
| U.S. Treasury Obligations* | 0.54% | |||||
| Qualified Business Income* | 0.00% | |||||
| Business Interest Income* | 100.00% | |||||
* The above percentages are based on ordinary income dividends paid to shareholders during the Fund’s fiscal year. | ||||||
| 27 Invesco Quality Income Fund |
The address of each trustee and officer is AIM Growth Series (Invesco Growth Series) (the “Trust”), 11 Greenway Plaza, Suite 1000, Houston, Texas 77046-1173. The trustees serve for the life of the Trust, subject to their earlier death, incapacitation, resignation, retirement or removal as more specifically provided in the Trust’s organizational documents. Each officer serves for a one year term or until their successors are elected and qualified. Column two below includes length of time served with predecessor entities, if any.
| Name, Year of Birth and Position(s) Held with the Trust | Trustee and/or Officer Since | Principal Occupation(s) During Past 5 Years | Number of Funds in Fund Complex Overseen by Trustee | Other Directorship(s) Held by Trustee During Past 5 Years | ||||
Interested Trustee | ||||||||
Martin L. Flanagan1 – 1960 Trustee and Vice Chair | 2007 | Executive Director, Chief Executive Officer and President, Invesco Ltd. (ultimate parent of Invesco and a global investment management firm); Trustee and Vice Chair, The Invesco Funds; Vice Chair, Investment Company Institute; and Member of Executive Board, SMU Cox School of Business
Formerly: Advisor to the Board, Invesco Advisers, Inc. (formerly known as Invesco Institutional (N.A.), Inc.); Chairman and Chief Executive Officer, Invesco Advisers, Inc. (registered investment adviser); Director, Chairman, Chief Executive Officer and President, Invesco Holding Company (US), Inc. (formerly IVZ Inc.) (holding company), Invesco Group Services, Inc. (service provider) and Invesco North American Holdings, Inc. (holding company); Director, Chief Executive Officer and President, Invesco Holding Company Limited (parent of Invesco and a global investment management firm); Director, Invesco Ltd.; Chairman, Investment Company Institute and President, Co-Chief Executive Officer, Co-President, Chief Operating Officer and Chief Financial Officer, Franklin Resources, Inc. (global investment management organization) | 189 | None |
| 1 | Mr. Flanagan is considered an interested person (within the meaning of Section 2(a)(19) of the 1940 Act) of the Trust because he is an officer of the Adviser to the Trust, and an officer and a director of Invesco Ltd., ultimate parent of the Adviser. |
| T-1 Invesco Quality Income Fund |
Trustees and Officers–(continued)
Name, Year of Birth and Position(s) Held with the Trust | Trustee and/or Officer Since | Principal Occupation(s) During Past 5 Years | Number of Funds in Fund Complex Overseen by Trustee | Other Directorship(s) Held by Trustee During Past 5 | ||||
Independent Trustees | ||||||||
| Beth Ann Brown – 1968 Trustee (2019) and Chair (August 2022) | 2019 | Independent Consultant
Formerly: Head of Intermediary Distribution, Managing Director, Strategic Relations, Managing Director, Head of National Accounts, Senior Vice President, National Account Manager and Senior Vice President, Key Account Manager, Columbia Management Investment Advisers LLC; Vice President, Key Account Manager, Liberty Funds Distributor, Inc.; and Trustee of certain Oppenheimer Funds | 189 | Director, Board of Directors of Caron Engineering Inc.; Advisor, Board of Advisors of Caron Engineering Inc.; President and Director, Acton Shapleigh Youth Conservation Corps (non-profit) Formerly: President and Director Director of Grahamtastic Connection (non-profit) | ||||
| Cynthia Hostetler – 1962 Trustee | 2017 | Non-Executive Director and Trustee of a number of public and private business corporations
Formerly: Director, Aberdeen Investment Funds (4 portfolios); Director, Artio Global Investment LLC (mutual fund complex); Director, Edgen Group, Inc. (specialized energy and infrastructure products distributor); Director, Genesee & Wyoming, Inc. (railroads); Head of Investment Funds and Private Equity, Overseas Private Investment Corporation; President, First Manhattan Bancorporation, Inc.; and Attorney, Simpson Thacher & Bartlett LLP | 189 | Resideo Technologies, Inc. (smart home technology); Vulcan Materials Company (construction materials company); Trilinc Global Impact Fund; Textainer Group Holdings, (shipping container leasing company); Investment Company Institute (professional organization); and Independent Directors Council (professional organization) | ||||
| Eli Jones – 1961 Trustee | 2016 | Professor and Dean Emeritus, Mays Business School - Texas A&M University
Formerly: Dean of Mays Business School-Texas A&M University; Professor and Dean, Walton College of Business, University of Arkansas and E.J. Ourso College of Business, Louisiana State University; and Director, Arvest Bank | 189 | Insperity, Inc. (formerly known as Administaff) (human resources provider); and Member of Regional Board of Directors and Board of Directors, First Financial Bancorp (regional bank) | ||||
| Elizabeth Krentzman – 1959 Trustee | 2019 | Formerly: Principal and Chief Regulatory Advisor for Asset Management Services and U.S. Mutual Fund Leader of Deloitte & Touche LLP; General Counsel of the Investment Company Institute (trade association); National Director of the Investment Management Regulatory Consulting Practice, Principal, Director and Senior Manager of Deloitte & Touche LLP; Assistant Director of the Division of Investment Management - Office of Disclosure and Investment Adviser Regulation of the U.S. Securities and Exchange Commission and various positions with the Division of Investment Management – Office of Regulatory Policy of the U.S. Securities and Exchange Commission; Associate at Ropes & Gray LLP; and Trustee of certain Oppenheimer Funds | 189 | Formerly: Member of the Cartica Funds Board of Directors (private investment fund); Trustee of the University of Florida National Board Foundation; and Member of the University of Florida Law Center Association, Inc. Board of Trustees, Audit Committee and Membership Committee | ||||
| Anthony J. LaCava, Jr. – 1956 Trustee | 2019 | Formerly: Director and Member of the Audit Committee, Blue Hills Bank (publicly traded financial institution) and Managing Partner, KPMG LLP | 189 | Blue Hills Bank; Chairman, Bentley University; Member, Business School Advisory Council; and Nominating Committee, KPMG LLP | ||||
| Prema Mathai-Davis – 1950 Trustee | 2001 | Retired
Formerly: Co-Founder & Partner of Quantalytics Research, LLC, (a FinTech Investment Research Platform for the Self-Directed Investor); Trustee of YWCA Retirement Fund; CEO of YWCA of the USA; Board member of the NY Metropolitan Transportation Authority; Commissioner of the NYC Department of Aging; and Board member of Johns Hopkins Bioethics Institute | 189 | Member of Board of Positive Planet US (non-profit) and HealthCare Chaplaincy Network (non-profit) | ||||
| T-2 Invesco Quality Income Fund |
Trustees and Officers–(continued)
Name, Year of Birth and Position(s) Held with the Trust | Trustee and/or Officer Since | Principal Occupation(s) During Past 5 Years | Number of Funds in Fund Complex Overseen by Trustee | Other Directorship(s) Held by Trustee During Past 5 | ||||
Independent Trustees–(continued) | ||||||||
| Joel W. Motley – 1952 Trustee | 2019 | Director of Office of Finance, Federal Home Loan Bank System; Managing Director of Carmona Motley Inc. (privately held financial advisor); Member of the Council on Foreign Relations and its Finance and Budget Committee; Chairman Emeritus of Board of Human Rights Watch and Member of its Investment Committee; and Member of Investment Committee Board of Historic Hudson Valley (non-profit cultural organization); Member of the Board, Blue Ocean Acquisition Corp.; and Member of the Vestry and the Investment Committee of Trinity Church Wall Street.
Formerly: Managing Director of Public Capital Advisors, LLC (privately held financial advisor); Managing Director of Carmona Motley Hoffman, Inc. (privately held financial advisor); Trustee of certain Oppenheimer Funds; and Director of Columbia Equity Financial Corp. (privately held financial advisor) | 189 | Member of Board of Trust for Mutual Understanding (non-profit promoting the arts and environment); Member of Board of Greenwall Foundation (bioethics research foundation) and its Investment Committee; Member of Board of Friends of the LRC (non-profit legal advocacy); and Board Member and Investment Committee Member of Pulitzer Center for Crisis Reporting (non-profit journalism) | ||||
| Teresa M. Ressel – 1962 Trustee | 2017 | Non-executive director and trustee of a number of public and private business corporations
Formerly: Chief Executive Officer, UBS Securities LLC (investment banking); Chief Operating Officer, UBS AG Americas (investment banking); Sr. Management Team Olayan America, The Olayan Group (international investor/commercial/industrial); Assistant Secretary for Management & Budget and Designated Chief Financial Officer, U.S. Department of Treasury and Director, ON Semiconductor Corporation (semiconductor manufacturing) | 189 | None | ||||
| Robert C. Troccoli – 1949 Trustee | 2016 | Retired
Formerly: Adjunct Professor, University of Denver – Daniels College of Business; and Managing Partner, KPMG LLP | 189 | None | ||||
| Daniel S. Vandivort – 1954 Trustee | 2019 | President, Flyway Advisory Services LLC (consulting and property management)
Formerly: President and Chief Investment Officer, previously Head of Fixed Income, Weiss Peck and Greer/Robeco Investment Management; Trustee and Chair, Weiss Peck and Greer Funds Board; and various capacities at CS First Boston including Head of Fixed Income at First Boston Asset Management. | 189 | Formerly: Trustee and Governance Chair, Oppenheimer Funds; Treasurer, Chairman of the Audit and Finance Committee, Huntington Disease Foundation of America | ||||
| T-3 Invesco Quality Income Fund |
Trustees and Officers–(continued)
Name, Year of Birth and Position(s) Held with the Trust | Trustee and/or Officer Since | Principal Occupation(s) During Past 5 Years | Number of Funds in Fund Complex Overseen by Trustee | Other Directorship(s) Held by Trustee During Past 5 | ||||
Officers | ||||||||
| Sheri Morris – 1964 President and Principal Executive Officer | 1999 | Director, Invesco Trust Company; Head of Global Fund Services, Invesco Ltd.; President and Principal Executive Officer, The Invesco Funds; Vice President, Invesco Exchange-Traded Fund Trust, Invesco Exchange-Traded Fund Trust II, Invesco India Exchange-Traded Fund Trust, Invesco Actively Managed Exchange-Traded Fund Trust, Invesco Actively Managed Exchange-Traded Commodity Fund Trust and Invesco Exchange-Traded Self-Indexed Fund Trust; and Vice President, OppenheimerFunds, Inc.
Formerly: Vice President, Treasurer and Principal Financial Officer, The Invesco Funds; Vice President, Invesco AIM Advisers, Inc., Invesco AIM Capital Management, Inc. and Invesco AIM Private Asset Management, Inc.; Assistant Vice President and Assistant Treasurer, The Invesco Funds; Vice President and Assistant Vice President, Invesco Advisers, Inc.; Assistant Vice President, Invesco AIM Capital Management, Inc. and Invesco AIM Private Asset Management, Inc.; Treasurer, Invesco Exchange-Traded Fund Trust, Invesco Exchange-Traded Fund Trust II, Invesco India Exchange-Traded Fund Trust and Invesco Actively Managed Exchange-Traded Fund Trust; and Senior Vice President, Invesco Advisers, Inc. (formerly known as Invesco Institutional (N.A.), Inc.) (registered investment adviser) | N/A | N/A | ||||
| Jeffrey H. Kupor – 1968 Senior Vice President, Chief Legal Officer and Secretary | 2018 | Head of Legal of the Americas, Invesco Ltd.; Senior Vice President and Secretary, Invesco Advisers, Inc. (formerly known as Invesco Institutional (N.A.), Inc.) (registered investment adviser); Secretary, Invesco Distributors, Inc. (formerly known as Invesco AIM Distributors, Inc.); Vice President and Secretary, Invesco Investment Services, Inc. (formerly known as Invesco AIM Investment Services, Inc.); Senior Vice President, Chief Legal Officer and Secretary, The Invesco Funds; Secretary and General Counsel, Invesco Investment Advisers LLC (formerly known as Van Kampen Asset Management); Secretary and General Counsel, Invesco Capital Markets, Inc. (formerly known as Van Kampen Funds Inc.); Chief Legal Officer, Invesco Exchange-Traded Fund Trust, Invesco Exchange-Traded Fund Trust II, Invesco India Exchange-Traded Fund Trust, Invesco Actively Managed Exchange-Traded Fund Trust, Invesco Actively Managed Exchange-Traded Commodity Fund Trust and Invesco Exchange-Traded Self-Indexed Fund Trust;; Secretary and Vice President, Harbourview Asset Management Corporation; Secretary and Vice President, OppenheimerFunds, Inc. and Invesco Managed Accounts, LLC; Secretary and Senior Vice President, OFI Global Institutional, Inc.; Secretary and Vice President, OFI SteelPath, Inc.; Secretary and Vice President, Oppenheimer Acquisition Corp.; Secretary and Vice President, Shareholder Services, Inc.; and Secretary and Vice President, Trinity Investment Management Corporation
Formerly: Senior Vice President, Invesco Distributors, Inc.; Secretary and Vice President, Jemstep, Inc.; Head of Legal, Worldwide Institutional, Invesco Ltd.; Secretary and General Counsel, INVESCO Private Capital Investments, Inc.; Senior Vice President, Secretary and General Counsel, Invesco Management Group, Inc. (formerly known as Invesco AIM Management Group, Inc.); Assistant Secretary, INVESCO Asset Management (Bermuda) Ltd.; Secretary and General Counsel, Invesco Private Capital, Inc.; Assistant Secretary and General Counsel, INVESCO Realty, Inc.; Secretary and General Counsel, Invesco Senior Secured Management, Inc.; Secretary, Sovereign G./P. Holdings Inc.; Secretary, Invesco Indexing LLC; and Secretary, W.L. Ross & Co., LLC | N/A | N/A | ||||
| Andrew R. Schlossberg – 1974 Senior Vice President | 2019 | Senior Vice President, Invesco Group Services, Inc.; Head of the Americas and Senior Managing Director, Invesco Ltd.; Director and Senior Vice President, Invesco Advisers, Inc. (formerly known as Invesco Institutional (N.A.), Inc.) (registered investment adviser); Director and Chairman, Invesco Investment Services, Inc. (formerly known as Invesco AIM Investment Services, Inc.) (registered transfer agent); Senior Vice President, The Invesco Funds; and Director, Invesco Investment Advisers LLC (formerly known as Van Kampen Asset Management)
Formerly: Director, President and Chairman, Invesco Insurance Agency, Inc.; Director, Invesco UK Limited; Director and Chief Executive, Invesco Asset Management Limited and Invesco Fund Managers Limited; Assistant Vice President, The Invesco Funds; Senior Vice President, Invesco Advisers, Inc. (formerly known as Invesco Institutional (N.A.), Inc.) (registered investment adviser); Director and Chief Executive, Invesco Administration Services Limited and Invesco Global Investment Funds Limited; Director, Invesco Distributors, Inc.; Head of EMEA, Invesco Ltd.; President, Invesco Actively Managed Exchange-Traded Commodity Fund Trust, Invesco Actively Managed Exchange-Traded Fund Trust, Invesco Exchange-Traded Fund Trust, Invesco Exchange-Traded Fund Trust II and Invesco India Exchange-Traded Fund Trust; and Managing Director and Principal Executive Officer, Invesco Capital Management LLC | N/A | N/A | ||||
| T-4 Invesco Quality Income Fund |
Trustees and Officers–(continued)
Name, Year of Birth and Position(s) Held with the Trust | Trustee and/or Officer Since | Principal Occupation(s) During Past 5 Years | Number of Funds in Fund Complex Overseen by Trustee | Other Directorship(s) Held by Trustee During Past 5 | ||||
Officers–(continued) | ||||||||
John M. Zerr – 1962 Senior Vice President | 2006 | Chief Operating Officer of the Americas; Senior Vice President, Invesco Advisers, Inc. (formerly known as Invesco Institutional (N.A.), Inc.) (registered investment adviser); Senior Vice President, Invesco Distributors, Inc. (formerly known as Invesco AIM Distributors, Inc.); Director and Vice President, Invesco Investment Services, Inc. (formerly known as Invesco AIM Investment Services, Inc.) Senior Vice President, The Invesco Funds; Managing Director, Invesco Capital Management LLC; Director, Invesco Investment Advisers LLC (formerly known as Van Kampen Asset Management); Senior Vice President, Invesco Capital Markets, Inc. (formerly known as Van Kampen Funds Inc.); Manager, Invesco Indexing LLC; Manager, Invesco Specialized Products, LLC; Member, Invesco Canada Funds Advisory Board; Director, President and Chief Executive Officer, Invesco Corporate Class Inc. (corporate mutual fund company); and Director, Chairman, President and Chief Executive Officer, Invesco Canada Ltd. (formerly known as Invesco Trimark Ltd./Invesco Trimark Ltèe) (registered investment adviser and registered transfer agent); President, Invesco, Inc.; President, Invesco Global Direct Real Estate Feeder GP Ltd.; President, Invesco IP Holdings (Canada) Ltd; President, Invesco Global Direct Real Estate GP Ltd.; President, Invesco Financial Services Ltd. / Services Financiers Invesco Ltée; and Director and Chairman, Invesco Trust Company
Formerly: President, Trimark Investments Ltd/Services Financiers Invesco Ltee; Director and Senior Vice President, Invesco Insurance Agency, Inc.; Director and Senior Vice President, Invesco Management Group, Inc. (formerly known as Invesco AIM Management Group, Inc.); Secretary and General Counsel, Invesco Management Group, Inc. (formerly known as Invesco AIM Management Group, Inc.); Secretary, Invesco Investment Services, Inc. (formerly known as Invesco AIM Investment Services, Inc.); Chief Legal Officer and Secretary, The Invesco Funds; Secretary and General Counsel, Invesco Investment Advisers LLC (formerly known as Van Kampen Asset Management); Secretary and General Counsel, Invesco Capital Markets, Inc. (formerly known as Van Kampen Funds Inc.); Chief Legal Officer, Invesco Exchange-Traded Fund Trust, Invesco Exchange-Traded Fund Trust II, Invesco India Exchange-Traded Fund Trust, Invesco Actively Managed Exchange-Traded Fund Trust, Invesco Actively Managed Exchange-Traded Commodity Fund Trust and Invesco Exchange-Traded Self-Indexed Fund Trust; Secretary, Invesco Indexing LLC; Director, Secretary, General Counsel and Senior Vice President, Van Kampen Exchange Corp.; Director, Vice President and Secretary, IVZ Distributors, Inc. (formerly known as INVESCO Distributors, Inc.); Director and Vice President, INVESCO Funds Group, Inc.; Director and Vice President, Van Kampen Advisors Inc.; Director, Vice President, Secretary and General Counsel, Van Kampen Investor Services Inc.; Director and Secretary, Invesco Distributors, Inc. (formerly known as Invesco AIM Distributors, Inc.); Director, Senior Vice President, General Counsel and Secretary, Invesco AIM Advisers, Inc. and Van Kampen Investments Inc.; Director, Vice President and Secretary, Fund Management Company; Director, Senior Vice President, Secretary, General Counsel and Vice President, Invesco AIM Capital Management, Inc.; and Chief Operating Officer and General Counsel, Liberty Ridge Capital, Inc. (an investment adviser) | N/A | N/A | ||||
| Gregory G. McGreevey – 1962 Senior Vice President | 2012 | Senior Managing Director, Invesco Ltd.; Director, Chairman, President, and Chief Executive Officer, Invesco Advisers, Inc. (formerly known as Invesco Institutional (N.A.), Inc.) (registered investment adviser); Director, Invesco Mortgage Capital, Inc. and Invesco Senior Secured Management, Inc.; Senior Vice President, The Invesco Funds; President, SNW Asset Management Corporation and Invesco Managed Accounts, LLC; Chairman and Director, Invesco Private Capital, Inc.; Chairman and Director, INVESCO Private Capital Investments, Inc.; Chairman and Director, INVESCO Realty, Inc.; and Senior Vice President, Invesco Group Services, Inc.
Formerly: Senior Vice President, Invesco Management Group, Inc. and Invesco Advisers, Inc.; Assistant Vice President, The Invesco Funds | N/A | N/A | ||||
| Adrien Deberghes – 1967 Principal Financial Officer, Treasurer and Vice President | 2020 | Head of the Fund Office of the CFO and Fund Administration; Vice President, Invesco Advisers, Inc.; Principal Financial Officer, Treasurer and Vice President, The Invesco Funds; Vice President, Invesco Exchange-Traded Fund Trust, Invesco Exchange-Traded Fund Trust II, Invesco India Exchange-Traded Fund Trust, Invesco Actively Managed Exchange-Traded Fund Trust, Invesco Actively Managed Exchange-Traded Commodity Fund Trust and Invesco Exchange-Traded Self-Indexed Fund Trust
Formerly: Senior Vice President and Treasurer, Fidelity Investments | N/A | N/A | ||||
| Crissie M. Wisdom – 1969 Anti-Money Laundering Compliance Officer | 2013 | Anti-Money Laundering and OFAC Compliance Officer for Invesco U.S. entities including: Invesco Advisers, Inc. and its affiliates, Invesco Capital Markets, Inc., Invesco Distributors, Inc., Invesco Investment Services, Inc., The Invesco Funds, Invesco Capital Management, LLC, Invesco Trust Company; and Fraud Prevention Manager for Invesco Investment Services, Inc. | N/A | N/A | ||||
| T-5 Invesco Quality Income Fund |
Trustees and Officers–(continued)
Name, Year of Birth and Position(s) Held with the Trust | Trustee and/or Officer Since | Principal Occupation(s) During Past 5 Years | Number of Funds in Fund Complex Overseen by Trustee | Other Directorship(s) Held by Trustee During Past 5 | ||||
Officers–(continued) | ||||||||
| Todd F. Kuehl – 1969 Chief Compliance Officer and Senior Vice President | 2020 | Chief Compliance Officer, Invesco Advisers, Inc. (registered investment adviser); and Chief Compliance Officer and Senior Vice President, The Invesco Funds
Formerly: Managing Director and Chief Compliance Officer, Legg Mason (Mutual Funds); Chief Compliance Officer, Legg Mason Private Portfolio Group (registered investment adviser) | N/A | N/A | ||||
| James Bordewick, Jr. – 1959 Senior Vice President and Senior Officer | 2022 | Senior Vice President and Senior Officer, The Invesco Funds
Formerly: Chief Legal Officer, KingsCrowd, Inc. (research and analytical platform for investment in private capital markets); Chief Operating Officer and Head of Legal and Regulatory, Netcapital (private capital investment platform); Managing Director, General Counsel of asset management and Chief Compliance Officer for asset management and private banking, Bank of America Corporation; Chief Legal Officer, Columbia Funds and BofA Funds;
Senior Vice President and Associate General Counsel, MFS Investment Management; Chief Legal Officer, MFS Funds; Associate, Ropes & Gray; and Associate, Gaston Snow & Ely Bartlett | N/A | N/A | ||||
The Statement of Additional Information of the Trust includes additional information about the Fund’s Trustees and is available upon request, without charge, by calling 1.800.959.4246. Please refer to the Fund’s Statement of Additional Information for information on the Fund’s sub-advisers.
| Office of the Fund | Investment Adviser | Distributor | Auditors | |||
| 11 Greenway Plaza, Suite 1000 | Invesco Advisers, Inc. | Invesco Distributors, Inc. | PricewaterhouseCoopers LLP | |||
| Houston, TX 77046-1173 | 1555 Peachtree Street, N.E. | 11 Greenway Plaza, Suite 1000 | 1000 Louisiana Street, Suite 5800 | |||
| Atlanta, GA 30309 | Houston, TX 77046-1173 | Houston, TX 77002-5021 | ||||
| Counsel to the Fund | Counsel to the Independent Trustees | Transfer Agent | Custodian | |||
| Stradley Ronon Stevens & Young, LLP | Sidley Austin LLP | Invesco Investment Services, Inc. | State Street Bank and Trust Company | |||
| 2005 Market Street, Suite 2600 | 787 Seventh Avenue | 11 Greenway Plaza, Suite 1000 | 225 Franklin Street | |||
| Philadelphia, PA 19103-7018 | New York, NY 10019 | Houston, TX 77046-1173 | Boston, MA 02110-2801 | |||
| T-6 Invesco Quality Income Fund |
(This page intentionally left blank)
(This page intentionally left blank)

Go paperless with eDelivery
Visit invesco.com/edelivery to enjoy the convenience and security of anytime electronic access to your investment documents.
With eDelivery, you can elect to have any or all of the following materials delivered straight to your inbox to download, save and print from your own computer:
∎ Fund reports and prospectuses
∎ Quarterly statements
∎ Daily confirmations
∎ Tax forms
Invesco mailing information
Send general correspondence to Invesco Investment Services, Inc., P.O. Box 219078, Kansas City, MO 64121-9078.
Important notice regarding delivery of security holder documents
To reduce Fund expenses, only one copy of most shareholder documents may be mailed to shareholders with multiple accounts at the same address (Householding). Mailing of your shareholder documents may be householded indefinitely unless you instruct us otherwise. If you do not want the mailing of these documents to be combined with those for other members of your household, please contact Invesco Investment Services, Inc. at 800 959 4246 or contact your financial institution. We will begin sending you individual copies for each account within 30 days after receiving your request.
Fund holdings and proxy voting information
The Fund provides a complete list of its portfolio holdings four times each year, at the end of each fiscal quarter. For the second and fourth quarters, the list appears, respectively, in the Fund’s semiannual and annual reports to shareholders. For the first and third quarters, the Fund files the list with the Securities and Exchange Commission (SEC) as an exhibit to its reports on Form N-PORT. The most recent list of portfolio holdings is available at invesco.com/completeqtrholdings. Shareholders can also look up the Fund’s Form N-PORT filings on the SEC website, sec.gov. The SEC file numbers for the Fund are shown below.
A description of the policies and procedures that the Fund uses to determine how to vote proxies relating to portfolio securities is available without charge, upon request, from our Client Services department at 800 959 4246, or at invesco.com/corporate/about-us/esg. The information is also available on the SEC website, sec.gov.
Information regarding how the Fund voted proxies related to its portfolio securities during the most recent 12-month period ended June 30 is available at invesco.com/proxysearch. This information is also available on the SEC website, sec.gov.
Invesco Advisers, Inc. is an investment adviser; it provides investment advisory services to individual and institutional clients and does not sell securities. Invesco Distributors, Inc. is the US distributor for Invesco Ltd.’s retail mutual funds, exchange-traded funds and institutional money market funds. Both are wholly owned, indirect subsidiaries of Invesco Ltd.
| SEC file number(s): 811-02699 and 002-57526 | Invesco Distributors, Inc. | VK-QINC-AR-1 |

| Annual Report to Shareholders | December 31, 2022 |
Invesco Select Risk: Conservative Investor Fund
Nasdaq:
A: OACIX ∎ C: OCCIX ∎ R: ONCIX ∎ Y: OYCIX ∎ R5: PXCIX ∎ R6: PXCCX
| 2 | ||||
| 2 | ||||
| 3 | ||||
| 5 | ||||
| 7 | ||||
| 9 | ||||
| 12 | ||||
| 13 | ||||
| 20 | ||||
| 21 | ||||
| 22 | ||||
| T-1 | ||||
Management’s Discussion of Fund Performance
Class A Shares | -15.62 | % | ||
Class C Shares | -16.42 | |||
Class R Shares | -15.90 | |||
Class Y Shares | -15.53 | |||
Class R5 Shares | -15.42 | |||
Class R6 Shares | -15.41 | |||
Bloomberg Global Aggregate USD Hedged Indexq | -11.22 | |||
MSCI All Country World Indexq | -18.36 | |||
Custom Invesco Select Risk: Conservative Investor Index∎ | -12.45 | |||
Source(s): qRIMES Technologies Corp.; ∎Invesco, RIMES Technologies Corp. |
Market conditions and your Fund
Global equity markets declined in the first half of 2022 amid volatility sparked by Russia’s invasion of Ukraine, rising commodity prices, rampant global inflation and central banks shifting toward tighter monetary policy. Russia’s invasion exacerbated inflationary pressures, disrupting already strained supply chains, and increasing shortages of oil, gas and raw materials, with the price of oil rising sharply.
Inflation headwinds continued into the third quarter of 2022. The US Federal Reserve (the Fed), the European Central Bank and the Bank of England all raised interest rates. In contrast, the People’s Bank of China lowered its policy rate and the Bank of Japan kept rates the same. Emerging market equities, hampered by the strong US dollar, underper-formed developed market equities.
Global equity markets posted gains for the fourth quarter of 2022, after better inflation data sparked a rally in October and Novem-ber. However, investor sentiment worsened in December after central banks signaled continued interest rate hikes into 2023 as inflation remained above target levels. International stocks outperformed US stocks in the fourth quarter, led by results in Europe and the UK. Emerging market equities also posted gains for the fourth quarter of 2022, boosted by China, which eased its zero-COVID-19 policy and started to reopen even as COVID-19 infections surged.
Despite the rebound in the fourth quarter of 2022, at the end of the fiscal year ended December 31, 2022, trailing one-year returns for developed market equities and emerging market equities were both in negative territory.
Strategic asset class exposures in the Fund are obtained through underlying representative mutual funds and exchange-traded funds
targeting pre-defined risk levels. From an absolute performance perspective, the portfolio’s allocation to variable rate fixed income was the leading contributor to positive performance. The remaining allocations to equity, fixed income and alternative assets were all detractors from absolute performance as the portfolio produced a negative return for the fiscal year.
From a relative performance perspective, the portfolio underperformed its custom benchmark, the Custom Invesco Select Risk: Conservative Investor Index, during the fiscal year. Underperformance was driven mainly by style selection within the fixed income allocation. Within the allocation, the Invesco 1-30 Laddered Treasury ETF and Invesco Taxable Municipal Bond ETF were the primary detractors.
Conversely, allocations to other fixed income funds and allocations to style-specific US equities were the leading contributors to relative performance during the fiscal year. Within the allocation, the Invesco Variable Rate Investment Grade ETF, Invesco Master Loan Fund and Invesco S&P 500 Low Volatility ETF were the leading contributors.
Please note that some of the Fund’s underlying funds use derivatives, including futures and total return swaps, which may create economic leverage in the underlying funds. Therefore, some of the performance of the strategy, both positive and negative, can be attributed to these instruments. Derivatives can be a cost-effective way to gain exposure to asset classes. However, derivatives may amplify traditional investment risks through the creation of leverage and may be less liquid than traditional securities.
Thank you for your continued investment in the Invesco Select Risk Series: Conservative Investor Fund.
Portfolio manager(s):
Jeffrey Bennett
Jacob Borbidge
Duy Nguyen
The views and opinions expressed in management’s discussion of Fund performance are those of Invesco Advisers, Inc. and its affiliates. These views and opinions are subject to change at any time based on factors such as market and economic conditions. These views and opinions may not be relied upon as investment advice or recommendations, or as an offer for a particular security. The information is not a complete analysis of every aspect of any market, country, industry, security or the Fund. Statements of fact are from sources considered reliable, but Invesco Advisers, Inc. makes no representation or warranty as to their completeness or accuracy. Although historical performance is no guarantee of future results, these insights may help you understand our investment management philosophy.
See important Fund and, if applicable, index disclosures later in this report.
| 2 Invesco Select Risk: Conservative Investor Fund |
Your Fund’s Long-Term Performance
Results of a $10,000 Investment – Oldest Share Class(es)
Fund and index data from 12/31/12
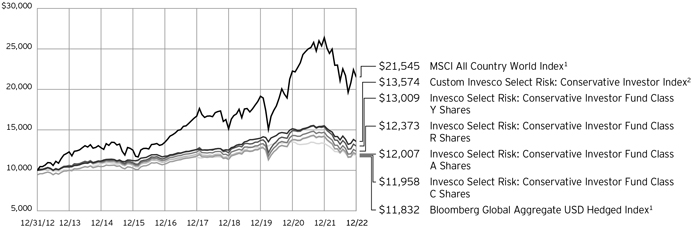
| 1 | Source: RIMES Technologies Corp. |
| 2 | Source: Invesco, RIMES Technologies Corp. |
Past performance cannot guarantee future results.
The data shown in the chart include reinvested distributions, applicable sales charges and Fund expenses including management
fees. Index results include reinvested dividends, but they do not reflect sales charges. Performance of the peer group, if applicable, reflects fund expenses and management fees;
performance of a market index does not. Performance shown in the chart does not reflect deduction of taxes a shareholder would pay on Fund distributions or sale of Fund shares.
| 3 Invesco Select Risk: Conservative Investor Fund |
Average Annual Total Returns |
| |||
| As of 12/31/22, including maximum applicable sales charges |
| |||
Class A Shares | ||||
Inception (4/5/05) | 1.48 | % | ||
10 Years | 1.85 | |||
5 Years | -0.70 | |||
1 Year | -20.30 | |||
Class C Shares | ||||
Inception (4/5/05) | 1.44 | % | ||
10 Years | 1.80 | |||
5 Years | -0.36 | |||
1 Year | -17.24 | |||
Class R Shares | ||||
Inception (4/5/05) | 1.52 | % | ||
10 Years | 2.15 | |||
5 Years | 0.16 | |||
1 Year | -15.90 | |||
Class Y Shares | ||||
Inception (4/5/05) | 2.08 | % | ||
10 Years | 2.67 | |||
5 Years | 0.66 | |||
1 Year | -15.53 | |||
Class R5 Shares | ||||
10 Years | 2.53 | % | ||
5 Years | 0.64 | |||
1 Year | -15.42 | |||
Class R6 Shares | ||||
10 Years | 2.53 | % | ||
5 Years | 0.64 | |||
1 Year | -15.41 | |||
Effective May 24, 2019, Class A, Class C, Class R and Class Y shares of the Oppen-heimer Portfolio Series: Conservative Investor Fund, (the predecessor fund), were reorganized into Class A, Class C, Class R and Class Y shares, respectively, of the Invesco Select Risk: Conservative Investor Fund. Returns shown above, for periods ending on or prior to May 24, 2019, for Class A, Class C, Class R and Class Y shares are those for Class A, Class C, Class R and Class Y shares of the predecessor fund. Share class returns will differ from the predecessor fund because of different expenses.
Class R5 shares incepted on May 24, 2019. Performance shown on or prior to that date is that of the predecessor fund’s Class A shares at net asset value and includes the 12b-1 fees applicable to Class A shares.
Class R6 shares incepted on May 24, 2019. Performance shown on or prior to that date is that of the predecessor fund’s Class A shares at net asset value and includes the 12b-1 fees applicable to Class A shares.
The performance data quoted represent past performance and cannot guarantee future results; current performance may be lower or higher. Please visit invesco.com/ performance for the most recent month-end performance. Performance figures re-
flect reinvested distributions, changes in net asset value and the effect of the maximum sales charge unless otherwise stated. Performance figures do not reflect deduction of taxes a shareholder would pay on Fund distributions or sale of Fund shares. Investment return and principal value will fluctuate so that you may have a gain or loss when you sell shares.
Class A share performance reflects the maximum 5.50% sales charge, and Class C share performance reflects the applicable contingent deferred sales charge (CDSC) for the period involved. The CDSC on Class C shares is 1% for the first year after purchase. Class R, Class Y, Class R5 and Class R6 shares do not have a front-end sales charge or a CDSC; therefore, performance is at net asset value.
The performance of the Fund’s share classes will differ primarily due to different sales charge structures and class expenses.
Fund performance reflects any applicable fee waivers and/or expense reimbursements. Had the adviser not waived fees and/or reimbursed expenses currently or in the past, returns would have been lower. See current prospectus for more information.
| 4 Invesco Select Risk: Conservative Investor Fund |
Invesco Select Risk: Conservative Investor Fund’s investment objective is to seek total return.
| ∎ | Unless otherwise stated, information presented in this report is as of December 31, 2022, and is based on total net assets. |
| ∎ | Unless otherwise noted, all data is provided by Invesco. |
| ∎ | To access your Fund’s reports/prospectus, visit invesco.com/fundreports. |
About indexes used in this report
| ∎ | The Bloomberg Global Aggregate USD Hedged Index tracks fixed-income performance of regions around the world while hedging the currency back to the US dollar. |
| ∎ | The Custom Invesco Select Risk: Conservative Investor Index is composed of 20% MSCI All Country World Index and 80% Bloomberg Global Aggregate USD Hedged Index. |
| ∎ | The MSCI All Country World Index is an unmanaged index considered representative of large- and mid-cap stocks across developed and emerging markets. The index is computed using the net return, which withholds applicable taxes for nonresident investors. |
| ∎ | The Fund is not managed to track the performance of any particular index, including the index(es) described here, and consequently, the performance of the Fund may deviate significantly from the performance of the index(es). |
| ∎ | A direct investment cannot be made in an index. Unless otherwise indicated, index results include reinvested dividends, and they do not reflect sales charges. Performance of the peer group, if applicable, reflects fund expenses; performance of a market index does not. |
| This report must be accompanied or preceded by a currently effective Fund prospectus, which contains more complete information, including sales charges and expenses. Investors should read it carefully before investing. | ||||||
| NOT FDIC INSURED | MAY LOSE VALUE | NO BANK GUARANTEE | ||||
5 Invesco Select Risk: Conservative Investor Fund
Fund Information
Portfolio Composition*
| By fund type | % of total investments | |
Fixed Income Funds | 75.38% | |
Equity Funds | 19.19 | |
Alternative Funds | 4.89 | |
Money Market Funds | 0.54 | |
| * | Based on the Schedule of Investments, which classifies each underlying fund and other investments into broad asset classes based on their predominant investments. |
The Fund’s holdings are subject to change, and there is no assurance that the Fund will continue to hold any particular security. Data presented here are as of December 31, 2022.
6 Invesco Select Risk: Conservative Investor Fund
December 31, 2022
Invesco Select Risk: Conservative Investor Fund
Schedule of Investments in Affiliated Issuers-99.43%(a)
| % of Net Assets 12/31/22 | Value 12/31/21 | Purchases at Cost | Proceeds from Sales | Change in Unrealized Appreciation (Depreciation) | Realized Gain (Loss) | Dividend Income | Shares 12/31/22 | Value 12/31/22 | ||||||||||||||||||||||||||||
| ||||||||||||||||||||||||||||||||||||
Alternative Funds-4.86% | ||||||||||||||||||||||||||||||||||||
Invesco Global Real Estate Income Fund, Class R6(b) | 2.03 | % | $ | 9,491,387 | $ | 948,799 | $ | (838,142 | ) | $ | (2,051,854 | ) | $ | 106,974 | $ | 123,284 | 979,261 | $ | 7,579,479 | |||||||||||||||||
| ||||||||||||||||||||||||||||||||||||
Invesco Macro Allocation Strategy Fund, Class R6(c) | 2.83 | % | 15,397,574 | - | (3,139,914 | ) | (1,411,237 | ) | (250,169 | ) | - | 1,409,076 | 10,596,254 | |||||||||||||||||||||||
| ||||||||||||||||||||||||||||||||||||
Total Alternative Funds | 24,888,961 | 948,799 | (3,978,056 | ) | (3,463,091 | ) | (143,195 | ) | 123,284 | 18,175,733 | ||||||||||||||||||||||||||
| ||||||||||||||||||||||||||||||||||||
Domestic Equity Funds-11.76% | ||||||||||||||||||||||||||||||||||||
Invesco Discovery Mid Cap Growth Fund, Class R6(c) | 1.42 | % | 9,221,620 | 782,339 | (2,096,792 | ) | (2,441,981 | ) | (171,230 | ) | - | 209,165 | 5,293,956 | |||||||||||||||||||||||
| ||||||||||||||||||||||||||||||||||||
Invesco Main Street Small Cap Fund, Class R6 | 1.27 | % | 7,136,773 | 295,366 | (1,660,667 | ) | (808,015 | ) | (227,907 | ) | 28,945 | 264,704 | 4,735,550 | |||||||||||||||||||||||
| ||||||||||||||||||||||||||||||||||||
Invesco Russell 1000® Dynamic Multifactor ETF | 2.63 | % | 8,354,904 | 4,537,538 | (1,360,360 | ) | (1,552,514 | ) | (135,831 | ) | 150,533 | 229,244 | 9,843,737 | |||||||||||||||||||||||
| ||||||||||||||||||||||||||||||||||||
Invesco S&P 500® Low Volatility ETF | 2.56 | % | 9,361,818 | 1,800,722 | (861,400 | ) | (722,037 | ) | (9,056 | ) | 200,215 | 149,766 | 9,570,047 | |||||||||||||||||||||||
| ||||||||||||||||||||||||||||||||||||
Invesco S&P 500® Pure Growth ETF | 2.34 | % | 11,701,142 | 2,831,566 | (2,628,161 | ) | (3,267,597 | ) | 92,754 | 65,263 | 57,580 | 8,729,704 | ||||||||||||||||||||||||
| ||||||||||||||||||||||||||||||||||||
Invesco S&P 500® Pure Value ETF | 1.54 | % | 5,837,219 | 1,140,151 | (998,142 | ) | (486,512 | ) | 261,662 | 128,922 | 73,793 | 5,754,378 | ||||||||||||||||||||||||
| ||||||||||||||||||||||||||||||||||||
Total Domestic Equity Funds | 51,613,476 | 11,387,682 | (9,605,522 | ) | (9,278,656 | ) | (189,608 | ) | 573,878 | 43,927,372 | ||||||||||||||||||||||||||
| ||||||||||||||||||||||||||||||||||||
Fixed Income Funds-74.95% | ||||||||||||||||||||||||||||||||||||
Invesco 1-30 Laddered Treasury ETF | 16.81 | % | 55,884,739 | 27,846,171 | (6,537,542 | ) | (13,491,921 | ) | (909,561 | ) | 1,144,527 | 2,185,586 | 62,791,886 | |||||||||||||||||||||||
| ||||||||||||||||||||||||||||||||||||
Invesco Core Plus Bond Fund, Class R6 | 20.02 | % | 82,291,759 | 14,670,530 | (7,076,808 | ) | (13,696,204 | ) | (1,411,824 | ) | 2,769,752 | 8,208,283 | 74,777,453 | |||||||||||||||||||||||
| ||||||||||||||||||||||||||||||||||||
Invesco Fundamental High Yield® Corporate Bond ETF | 4.94 | % | 30,588,539 | - | (8,877,457 | ) | (2,707,986 | ) | (526,952 | ) | 738,164 | 1,079,214 | 18,476,144 | |||||||||||||||||||||||
| ||||||||||||||||||||||||||||||||||||
Invesco Income Fund, Class R6 | 1.71 | % | 17,642,100 | 341,016 | (10,203,674 | ) | (2,218,589 | ) | 841,637 | 341,017 | 934,670 | 6,402,490 | ||||||||||||||||||||||||
| ||||||||||||||||||||||||||||||||||||
Invesco International Bond Fund, Class R6(b) | 4.25 | % | 32,555,668 | 1,131,666 | (13,701,467 | ) | (2,973,254 | ) | (531,079 | ) | 100,645 | 3,690,816 | 15,870,511 | |||||||||||||||||||||||
| ||||||||||||||||||||||||||||||||||||
Invesco Master Loan Fund, Class R6 | 7.72 | % | 36,457,653 | 2,108,768 | (7,843,814 | ) | (1,202,550 | ) | (684,937 | ) | 2,112,347 | 1,902,680 | 28,835,120 | |||||||||||||||||||||||
| ||||||||||||||||||||||||||||||||||||
Invesco Taxable Municipal Bond ETF | 10.16 | % | 65,933,415 | 1,862,795 | (16,824,265 | ) | (10,117,042 | ) | (2,895,991 | ) | 1,411,479 | 1,476,426 | 37,958,912 | |||||||||||||||||||||||
| ||||||||||||||||||||||||||||||||||||
Invesco Variable Rate Investment Grade ETF | 9.34 | % | 35,128,156 | 9,507,131 | (9,215,857 | ) | (505,730 | ) | (35,486 | ) | 859,966 | 1,411,502 | 34,878,214 | |||||||||||||||||||||||
| ||||||||||||||||||||||||||||||||||||
Total Fixed Income Funds | 356,482,029 | 57,468,077 | (80,280,884 | ) | (46,913,276 | ) | (6,154,193 | ) | 9,477,897 | 279,990,730 | ||||||||||||||||||||||||||
| ||||||||||||||||||||||||||||||||||||
Foreign Equity Funds-7.32% | ||||||||||||||||||||||||||||||||||||
Invesco Developing Markets Fund, Class R6 | 1.54 | % | 11,355,550 | 1,631,006 | (4,553,465 | ) | (657,578 | ) | (2,015,414 | ) | 66,993 | 164,951 | 5,760,099 | |||||||||||||||||||||||
| ||||||||||||||||||||||||||||||||||||
Invesco Global Infrastructure Fund, Class R6 | 0.99 | % | 3,662,836 | 1,072,991 | (634,149 | ) | (463,996 | ) | 37,147 | 71,619 | 316,250 | 3,674,829 | ||||||||||||||||||||||||
| ||||||||||||||||||||||||||||||||||||
Invesco International Select Equity Fund, Class R6 | 1.22 | % | 11,406,016 | 964,475 | (5,146,413 | ) | (1,377,334 | ) | (1,286,318 | ) | 45,619 | 503,358 | 4,560,426 | |||||||||||||||||||||||
| ||||||||||||||||||||||||||||||||||||
Invesco RAFI™ Strategic Developed ex-US ETF | 1.56 | % | - | 6,700,153 | (273,160 | ) | (596,541 | ) | (6 | ) | 133,556 | 217,068 | 5,830,446 | |||||||||||||||||||||||
| ||||||||||||||||||||||||||||||||||||
Invesco S&P Emerging Markets Low Volatility ETF | 1.00 | % | - | 4,258,467 | - | (509,908 | ) | - | 103,819 | 162,910 | 3,748,559 | |||||||||||||||||||||||||
| ||||||||||||||||||||||||||||||||||||
Invesco S&P International Developed Low Volatility ETF | 1.01 | % | 9,348,410 | 116,918 | (4,869,828 | ) | (1,264,421 | ) | 437,242 | 206,929 | 140,714 | 3,768,321 | ||||||||||||||||||||||||
| ||||||||||||||||||||||||||||||||||||
Total Foreign Equity Funds | 35,772,812 | 14,744,010 | (15,477,015 | ) | (4,869,778 | ) | (2,827,349 | ) | 628,535 | 27,342,680 | ||||||||||||||||||||||||||
| ||||||||||||||||||||||||||||||||||||
Money Market Funds-0.54% | ||||||||||||||||||||||||||||||||||||
Invesco Government & Agency Portfolio, Institutional Class, 4.22%(d) | 0.19 | % | 725,211 | 23,344,946 | (23,369,204 | ) | - | - | 11,629 | 700,953 | 700,953 | |||||||||||||||||||||||||
| ||||||||||||||||||||||||||||||||||||
Invesco Liquid Assets Portfolio, Institutional Class, 4.42%(d) | 0.13 | % | 939,732 | 16,674,960 | (17,114,436 | ) | 38 | 527 | 8,624 | 500,672 | 500,821 | |||||||||||||||||||||||||
| ||||||||||||||||||||||||||||||||||||
Invesco Treasury Portfolio, Institutional Class, 4.20%(d) | 0.22 | % | 828,813 | 26,679,938 | (26,707,662 | ) | - | - | 13,152 | 801,089 | 801,089 | |||||||||||||||||||||||||
| ||||||||||||||||||||||||||||||||||||
Total Money Market Funds | 2,493,756 | 66,699,844 | (67,191,302 | ) | 38 | 527 | 33,405 | 2,002,863 | ||||||||||||||||||||||||||||
| ||||||||||||||||||||||||||||||||||||
TOTAL INVESTMENTS IN AFFILIATED ISSUERS (excluding investments purchased with cash collateral from securities on loan) | 99.43 | % | 471,251,034 | 151,248,412 | (176,532,779 | ) | (64,524,763 | ) | (9,313,818 | ) | 10,836,999 | 371,439,378 | ||||||||||||||||||||||||
| ||||||||||||||||||||||||||||||||||||
See accompanying Notes to Financial Statements which are an integral part of the financial statements.
7 Invesco Select Risk: Conservative Investor Fund
Invesco Select Risk: Conservative Investor Fund (continued)
Schedule of Investments in Affiliated Issuers-99.43%(a)
| % of Net Assets 12/31/22 | Value 12/31/21 | Purchases at Cost | Proceeds from Sales | Change in Unrealized Appreciation (Depreciation) | Realized Gain (Loss) | Dividend Income | Shares 12/31/22 | Value 12/31/22 | ||||||||||||||||||||||||||||
| ||||||||||||||||||||||||||||||||||||
Investments Purchased | ||||||||||||||||||||||||||||||||||||
Money Market Funds-0.00% | ||||||||||||||||||||||||||||||||||||
Invesco Private Government Fund, 4.28%(d) | - | $ | - | $ | 30,840,672 | $ | (30,840,672 | ) | $ | - | $ | - | $ | 34,559 | (e) | - | $ | - | ||||||||||||||||||
| ||||||||||||||||||||||||||||||||||||
Invesco Private Prime Fund, 4.46%(d) | - | - | 72,606,970 | (72,613,324 | ) | - | 6,354 | 96,037 | (e) | - | ||||||||||||||||||||||||||
| ||||||||||||||||||||||||||||||||||||
Total Investments Purchased with Cash Collateral from Securities on Loan | 0.00 | % | - | 103,447,642 | (103,453,996 | ) | - | 6,354 | 130,596 | - | ||||||||||||||||||||||||||
| ||||||||||||||||||||||||||||||||||||
TOTAL INVESTMENTS IN AFFILIATED ISSUERS (Cost $418,731,126) | 99.43 | % | $ | 471,251,034 | $ | 254,696,054 | $ | (279,986,775 | ) | $ | (64,524,763 | ) | $ | (9,307,464 | ) | $ | 10,967,595 | $ | 371,439,378 | |||||||||||||||||
| ||||||||||||||||||||||||||||||||||||
OTHER ASSETS LESS LIABILITIES | 0.57 | % | 2,135,657 | |||||||||||||||||||||||||||||||||
| ||||||||||||||||||||||||||||||||||||
NET ASSETS | 100.00 | % | $ | 373,575,035 | ||||||||||||||||||||||||||||||||
| ||||||||||||||||||||||||||||||||||||
Investment Abbreviations:
ETF - Exchange-Traded Fund
Notes to Schedule of Investments:
| (a) | Each underlying fund and the Fund are affiliated by either having the same investment adviser or an investment adviser under common control with the Fund’s investment adviser. |
| (b) | Amounts include a return of capital distribution reclassification which reduces dividend income and increases realized gain (loss) and/or change in unrealized appreciation (depreciation). |
| (c) | Non-income producing security. |
| (d) | The rate shown is the 7-day SEC standardized yield as of December 31, 2022. |
| (e) | Represents the income earned on the investment of cash collateral, which is included in securities lending income on the Statement of Operations. Does not include rebates and fees paid to lending agent or premiums received from borrowers, if any. |
Open Futures Contracts(a) | ||||||||||||||||||
| ||||||||||||||||||
| Long Futures Contracts | Number of Contracts | Expiration | Notional Value | Value | Unrealized Appreciation (Depreciation) | |||||||||||||
| ||||||||||||||||||
Equity Risk | ||||||||||||||||||
| ||||||||||||||||||
E-Mini S&P 500 Index | 5 | March-2023 | $ | 965,250 | $(26,823) | $ | (26,823 | ) | ||||||||||
| ||||||||||||||||||
Interest Rate Risk | ||||||||||||||||||
| ||||||||||||||||||
Canada 10 Year Bonds | 45 | March-2023 | 4,072,932 | (97,378) | (97,378 | ) | ||||||||||||
| ||||||||||||||||||
Euro-BTP | 54 | March-2023 | 6,296,041 | (463,236) | (463,236 | ) | ||||||||||||
| ||||||||||||||||||
Euro-Bund | 32 | March-2023 | 4,553,435 | (278,145) | (278,145 | ) | ||||||||||||
| ||||||||||||||||||
Euro-OAT | 59 | March-2023 | 8,039,825 | (548,199) | (548,199 | ) | ||||||||||||
| ||||||||||||||||||
Japan 10 year Bonds | 29 | March-2023 | 32,142,182 | (614,294) | (614,294 | ) | ||||||||||||
| ||||||||||||||||||
Long Gilt | 72 | March-2023 | 8,695,736 | (539,675) | (539,675 | ) | ||||||||||||
| ||||||||||||||||||
Subtotal | (2,540,927) | (2,540,927 | ) | |||||||||||||||
| ||||||||||||||||||
Total Futures Contracts | $(2,567,750) | $ | (2,567,750 | ) | ||||||||||||||
| ||||||||||||||||||
| (a) | Futures contracts collateralized by $1,862,841 cash held with Merrill Lynch International, the futures commission merchant. |
See accompanying Notes to Financial Statements which are an integral part of the financial statements.
8 Invesco Select Risk: Conservative Investor Fund
Statement of Assets and Liabilities
December 31, 2022
Assets: |
| |||
Investments in affiliated underlying funds, at value | $ | 371,439,378 | ||
Deposits with brokers: | ||||
Cash collateral – exchange-traded futures contracts | 1,862,841 | |||
Cash | 35,707 | |||
Receivable for: | ||||
Fund shares sold | 694,105 | |||
Dividends - affiliated underlying funds | 816,517 | |||
Investment for trustee deferred compensation and retirement plans | 34,291 | |||
Other assets | 45,623 | |||
Total assets | 374,928,462 | |||
Liabilities: | ||||
Other investments: | ||||
Variation margin payable - futures contracts | 161,698 | |||
Payable for: | ||||
Investments purchased - affiliated underlying funds | 793,934 | |||
Fund shares reacquired | 122,710 | |||
Accrued fees to affiliates | 195,967 | |||
Accrued trustees’ and officers’ fees and benefits | 9,030 | |||
Accrued other operating expenses | 35,797 | |||
Trustee deferred compensation and retirement plans | 34,291 | |||
Total liabilities | 1,353,427 | |||
Net assets applicable to shares outstanding | $ | 373,575,035 | ||
Net assets consist of: | ||||
Shares of beneficial interest | $ | 434,398,048 | ||
Distributable earnings (loss) | (60,823,013 | ) | ||
| $ | 373,575,035 | |||
Net Assets: |
| |||
Class A | $ | 287,368,216 | ||
Class C | $ | 38,358,772 | ||
Class R | $ | 40,863,775 | ||
Class Y | $ | 6,967,239 | ||
Class R5 | $ | 8,517 | ||
Class R6 | $ | 8,516 | ||
Shares outstanding, no par value, with an unlimited number of shares authorized: |
| |||
Class A | 35,453,060 | |||
Class C | 4,780,972 | |||
Class R | 5,051,627 | |||
Class Y | 855,960 | |||
Class R5 | 1,053 | |||
Class R6 | 1,053 | |||
Class A: |
| |||
Net asset value per share | $ | 8.11 | ||
Maximum offering price per share | $ | 8.58 | ||
Class C: | ||||
Net asset value and offering price per share | $ | 8.02 | ||
Class R: | ||||
Net asset value and offering price per share | $ | 8.09 | ||
Class Y: | ||||
Net asset value and offering price per share | $ | 8.14 | ||
Class R5: | ||||
Net asset value and offering price per share | $ | 8.09 | ||
Class R6: | ||||
Net asset value and offering price per share | $ | 8.09 | ||
See accompanying Notes to Financial Statements which are an integral part of the financial statements.
9 Invesco Select Risk: Conservative Investor Fund
Statement of Operations
For the year ended December 31, 2022
Investment income: | ||||
Dividends from affiliated underlying funds (includes net securities lending income of $ 86,598) | $ 10,923,597 | |||
Interest | 112,719 | |||
Total investment income | 11,036,316 | |||
Expenses: | ||||
Custodian fees | 12,106 | |||
Distribution fees: | ||||
Class A | 742,836 | |||
Class C | 459,402 | |||
Class R | 216,622 | |||
Transfer agent fees – A, C, R and Y | 482,689 | |||
Transfer agent fees – R5 | 2 | |||
Transfer agent fees – R6 | 2 | |||
Trustees’ and officers’ fees and benefits | 20,986 | |||
Registration and filing fees | 98,782 | |||
Reports to shareholders | 34,392 | |||
Professional services fees | 29,786 | |||
Other | 16,580 | |||
Total expenses | 2,114,185 | |||
Less: Expense offset arrangement(s) | (5,001 | ) | ||
Net expenses | 2,109,184 | |||
Net investment income | 8,927,132 | |||
Realized and unrealized gain (loss) from: | ||||
Net realized gain (loss) from: | ||||
Affiliated underlying fund shares | (9,307,464 | ) | ||
Foreign currencies | (28 | ) | ||
Futures contracts | (6,250,403 | ) | ||
| (15,557,895 | ) | |||
Change in net unrealized appreciation (depreciation) of: | ||||
Affiliated underlying fund shares | (64,524,763 | ) | ||
Foreign currencies | 80,875 | |||
Futures contracts | (2,241,299 | ) | ||
| (66,685,187 | ) | |||
Net realized and unrealized gain (loss) | (82,243,082 | ) | ||
Net increase (decrease) in net assets resulting from operations | $(73,315,950 | ) | ||
See accompanying Notes to Financial Statements which are an integral part of the financial statements.
10 Invesco Select Risk: Conservative Investor Fund
Statement of Changes in Net Assets
For the years ended December 31, 2022 and 2021
| 2022 | 2021 | |||||||
| ||||||||
Operations: | ||||||||
Net investment income | $ | 8,927,132 | $ | 8,260,691 | ||||
| ||||||||
Net realized gain (loss) | (15,557,895 | ) | 20,718,960 | |||||
| ||||||||
Change in net unrealized appreciation (depreciation) | (66,685,187 | ) | (12,458,115 | ) | ||||
| ||||||||
Net increase (decrease) in net assets resulting from operations | (73,315,950 | ) | 16,521,536 | |||||
| ||||||||
Distributions to shareholders from distributable earnings: | ||||||||
Class A | (7,877,419 | ) | (16,015,519 | ) | ||||
| ||||||||
Class C | (739,246 | ) | (2,221,005 | ) | ||||
| ||||||||
Class R | (1,002,758 | ) | (2,048,476 | ) | ||||
| ||||||||
Class Y | (203,313 | ) | (364,777 | ) | ||||
| ||||||||
Class R5 | (275 | ) | (523 | ) | ||||
| ||||||||
Class R6 | (275 | ) | (895 | ) | ||||
| ||||||||
Total distributions from distributable earnings | (9,823,286 | ) | (20,651,195 | ) | ||||
| ||||||||
Share transactions-net: | ||||||||
Class A | (6,424,050 | ) | (91,535,827 | ) | ||||
| ||||||||
Class C | (11,238,113 | ) | (8,582,614 | ) | ||||
| ||||||||
Class R | 625,963 | (1,783,064 | ) | |||||
| ||||||||
Class Y | 602,418 | (982,778 | ) | |||||
| ||||||||
Class R6 | (7,827 | ) | 8,132 | |||||
| ||||||||
Net increase (decrease) in net assets resulting from share transactions | (16,441,609 | ) | (102,876,151 | ) | ||||
| ||||||||
Net increase (decrease) in net assets | (99,580,845 | ) | (107,005,810 | ) | ||||
| ||||||||
Net assets: | ||||||||
Beginning of year | 473,155,880 | 580,161,690 | ||||||
| ||||||||
End of year | $ | 373,575,035 | $ | 473,155,880 | ||||
| ||||||||
See accompanying Notes to Financial Statements which are an integral part of the financial statements.
| 11 Invesco Select Risk: Conservative Investor Fund |
The following schedule presents financial highlights for a share of the Fund outstanding throughout the periods indicated.
| Net asset value, beginning of period | Net investment income(a) | Net gains (losses) on securities (both realized and unrealized) | Total from investment operations | Dividends from net investment income | Distributions from net realized gains | Total distributions | Net asset value, end | Total return(b) | Net assets, end of period (000’s omitted) | Ratio of to average net assets fee waivers | Ratio of expenses to average net assets without fee waivers and/or expenses absorbed(d) | Ratio of net to average | Portfolio turnover(e) | |||||||||||||||||||||||||||||||||||||||||||||||||||||||||
Class A |
| |||||||||||||||||||||||||||||||||||||||||||||||||||||||||||||||||||||
Year ended 12/31/22 | $ | 9.88 | $ | 0.20 | $ | (1.74 | ) | $ | (1.54 | ) | $ | (0.16 | ) | $ | (0.07 | ) | $ | (0.23 | ) | $ | 8.11 | (15.62 | )%(f) | $ | 287,368 | 0.41 | %(f) | 0.41 | %(f) | 2.32 | %(f) | 21 | % | |||||||||||||||||||||||||||||||||||||
Year ended 12/31/21 | 10.03 | 0.17 | 0.14 | 0.31 | (0.35 | ) | (0.11 | ) | (0.46 | ) | 9.88 | 3.11 | (f) | 357,004 | 0.37 | (f) | 0.42 | (f) | 1.68 | (f) | 27 | |||||||||||||||||||||||||||||||||||||||||||||||||
Year ended 12/31/20 | 9.46 | 0.18 | 0.60 | 0.78 | (0.21 | ) | – | (0.21 | ) | 10.03 | 8.29 | (f) | 451,258 | 0.33 | (f) | 0.43 | (f) | 1.85 | (f) | 80 | ||||||||||||||||||||||||||||||||||||||||||||||||||
Eleven months ended 12/31/19 | 9.31 | 0.21 | 0.56 | 0.77 | (0.33 | ) | (0.29 | ) | (0.62 | ) | 9.46 | 8.26 | 415,244 | 0.43 | (g) | 0.53 | (g) | 2.39 | (g) | 6 | ||||||||||||||||||||||||||||||||||||||||||||||||||
Year ended 01/31/19 | 9.67 | 0.22 | (0.37 | ) | (0.15 | ) | (0.21 | ) | – | (0.21 | ) | 9.31 | (1.49 | ) | 396,318 | 0.42 | 0.52 | 2.35 | 45 | |||||||||||||||||||||||||||||||||||||||||||||||||||
Year ended 01/31/18 | 9.02 | 0.17 | 0.69 | 0.86 | (0.21 | ) | – | (0.21 | ) | 9.67 | 9.53 | 445,732 | 0.42 | 0.53 | 1.82 | 7 | ||||||||||||||||||||||||||||||||||||||||||||||||||||||
Class C | ||||||||||||||||||||||||||||||||||||||||||||||||||||||||||||||||||||||
Year ended 12/31/22 | 9.77 | 0.14 | (1.73 | ) | (1.59 | ) | (0.09 | ) | (0.07 | ) | (0.16 | ) | 8.02 | (16.34 | ) | 38,359 | 1.17 | 1.17 | 1.56 | 21 | ||||||||||||||||||||||||||||||||||||||||||||||||||
Year ended 12/31/21 | 9.92 | 0.09 | 0.14 | 0.23 | (0.27 | ) | (0.11 | ) | (0.38 | ) | 9.77 | 2.31 | 59,281 | 1.13 | 1.18 | 0.92 | 27 | |||||||||||||||||||||||||||||||||||||||||||||||||||||
Year ended 12/31/20 | 9.35 | 0.10 | 0.61 | 0.71 | (0.14 | ) | – | (0.14 | ) | 9.92 | 7.55 | 68,581 | 1.09 | 1.19 | 1.09 | 80 | ||||||||||||||||||||||||||||||||||||||||||||||||||||||
Eleven months ended 12/31/19 | 9.20 | 0.14 | 0.55 | 0.69 | (0.25 | ) | (0.29 | ) | (0.54 | ) | 9.35 | 7.48 | 88,939 | 1.19 | (g) | 1.29 | (g) | 1.63 | (g) | 6 | ||||||||||||||||||||||||||||||||||||||||||||||||||
Year ended 01/31/19 | 9.56 | 0.15 | (0.38 | ) | (0.23 | ) | (0.13 | ) | – | (0.13 | ) | 9.20 | (2.30 | ) | 125,385 | 1.17 | 1.27 | 1.60 | 45 | |||||||||||||||||||||||||||||||||||||||||||||||||||
Year ended 01/31/18 | 8.92 | 0.10 | 0.67 | 0.77 | (0.13 | ) | – | (0.13 | ) | 9.56 | 8.69 | 139,290 | 1.17 | 1.28 | 1.06 | 7 | ||||||||||||||||||||||||||||||||||||||||||||||||||||||
Class R | ||||||||||||||||||||||||||||||||||||||||||||||||||||||||||||||||||||||
Year ended 12/31/22 | 9.86 | 0.17 | (1.74 | ) | (1.57 | ) | (0.13 | ) | (0.07 | ) | (0.20 | ) | 8.09 | (15.90 | ) | 40,864 | 0.67 | 0.67 | 2.06 | 21 | ||||||||||||||||||||||||||||||||||||||||||||||||||
Year ended 12/31/21 | 10.01 | 0.14 | 0.14 | 0.28 | (0.32 | ) | (0.11 | ) | (0.43 | ) | 9.86 | 2.84 | 49,057 | 0.63 | 0.68 | 1.42 | 27 | |||||||||||||||||||||||||||||||||||||||||||||||||||||
Year ended 12/31/20 | 9.44 | 0.15 | 0.61 | 0.76 | (0.19 | ) | – | (0.19 | ) | 10.01 | 8.03 | 51,481 | 0.59 | 0.69 | 1.59 | 80 | ||||||||||||||||||||||||||||||||||||||||||||||||||||||
Eleven months ended 12/31/19 | 9.29 | 0.19 | 0.55 | 0.74 | (0.30 | ) | (0.29 | ) | (0.59 | ) | 9.44 | 7.99 | 49,017 | 0.68 | (g) | 0.78 | (g) | 2.13 | (g) | 6 | ||||||||||||||||||||||||||||||||||||||||||||||||||
Year ended 01/31/19 | 9.65 | 0.20 | (0.37 | ) | (0.17 | ) | (0.19 | ) | – | (0.19 | ) | 9.29 | (1.73 | ) | 44,044 | 0.67 | 0.77 | 2.10 | 45 | |||||||||||||||||||||||||||||||||||||||||||||||||||
Year ended 01/31/18 | 9.01 | 0.15 | 0.67 | 0.82 | (0.18 | ) | – | (0.18 | ) | 9.65 | 9.18 | 45,605 | 0.66 | 0.77 | 1.59 | 7 | ||||||||||||||||||||||||||||||||||||||||||||||||||||||
Class Y | ||||||||||||||||||||||||||||||||||||||||||||||||||||||||||||||||||||||
Year ended 12/31/22 | 9.93 | 0.22 | (1.76 | ) | (1.54 | ) | (0.18 | ) | (0.07 | ) | (0.25 | ) | 8.14 | (15.53 | ) | 6,967 | 0.17 | 0.17 | 2.56 | 21 | ||||||||||||||||||||||||||||||||||||||||||||||||||
Year ended 12/31/21 | 10.08 | 0.20 | 0.14 | 0.34 | (0.38 | ) | (0.11 | ) | (0.49 | ) | 9.93 | 3.38 | 7,785 | 0.13 | 0.18 | 1.92 | 27 | |||||||||||||||||||||||||||||||||||||||||||||||||||||
Year ended 12/31/20 | 9.49 | 0.20 | 0.63 | 0.83 | (0.24 | ) | – | (0.24 | ) | 10.08 | 8.71 | 8,821 | 0.09 | 0.19 | 2.09 | 80 | ||||||||||||||||||||||||||||||||||||||||||||||||||||||
Eleven months ended 12/31/19 | 9.34 | 0.23 | 0.56 | 0.79 | (0.35 | ) | (0.29 | ) | (0.64 | ) | 9.49 | 8.47 | 8,189 | 0.19 | (g) | 0.29 | (g) | 2.63 | (g) | 6 | ||||||||||||||||||||||||||||||||||||||||||||||||||
Year ended 01/31/19 | 9.71 | 0.24 | (0.38 | ) | (0.14 | ) | (0.23 | ) | – | (0.23 | ) | 9.34 | (1.31 | ) | 6,671 | 0.18 | 0.28 | 2.59 | 45 | |||||||||||||||||||||||||||||||||||||||||||||||||||
Year ended 01/31/18 | 9.06 | 0.20 | 0.68 | 0.88 | (0.23 | ) | – | (0.23 | ) | 9.71 | 9.78 | 6,195 | 0.17 | 0.28 | 2.14 | 7 | ||||||||||||||||||||||||||||||||||||||||||||||||||||||
Class R5 | ||||||||||||||||||||||||||||||||||||||||||||||||||||||||||||||||||||||
Year ended 12/31/22 | 9.87 | 0.23 | (1.75 | ) | (1.52 | ) | (0.19 | ) | (0.07 | ) | (0.26 | ) | 8.09 | (15.42 | ) | 9 | 0.07 | 0.07 | 2.66 | 21 | ||||||||||||||||||||||||||||||||||||||||||||||||||
Year ended 12/31/21 | 10.03 | 0.20 | 0.14 | 0.34 | (0.39 | ) | (0.11 | ) | (0.50 | ) | 9.87 | 3.38 | 10 | 0.10 | 0.15 | 1.95 | 27 | |||||||||||||||||||||||||||||||||||||||||||||||||||||
Year ended 12/31/20 | 9.45 | 0.20 | 0.62 | 0.82 | (0.24 | ) | – | (0.24 | ) | 10.03 | 8.67 | 11 | 0.04 | 0.14 | 2.14 | 80 | ||||||||||||||||||||||||||||||||||||||||||||||||||||||
Period ended 12/31/19(h) | 9.50 | 0.16 | 0.43 | 0.59 | (0.35 | ) | (0.29 | ) | (0.64 | ) | 9.45 | 6.30 | 10 | 0.15 | (g) | 0.25 | (g) | 2.67 | (g) | 6 | ||||||||||||||||||||||||||||||||||||||||||||||||||
Class R6 | ||||||||||||||||||||||||||||||||||||||||||||||||||||||||||||||||||||||
Year ended 12/31/22 | 9.87 | 0.23 | (1.75 | ) | (1.52 | ) | (0.19 | ) | (0.07 | ) | (0.26 | ) | 8.09 | (15.41 | ) | 9 | 0.07 | 0.07 | 2.66 | 21 | ||||||||||||||||||||||||||||||||||||||||||||||||||
Year ended 12/31/21 | 10.03 | 0.20 | 0.14 | 0.34 | (0.39 | ) | (0.11 | ) | (0.50 | ) | 9.87 | 3.37 | 18 | 0.10 | 0.15 | 1.95 | 27 | |||||||||||||||||||||||||||||||||||||||||||||||||||||
Year ended 12/31/20 | 9.45 | 0.20 | 0.62 | 0.82 | (0.24 | ) | – | (0.24 | ) | 10.03 | 8.67 | 11 | 0.04 | 0.14 | 2.14 | 80 | ||||||||||||||||||||||||||||||||||||||||||||||||||||||
Period ended 12/31/19(h) | 9.50 | 0.16 | 0.44 | 0.60 | (0.36 | ) | (0.29 | ) | (0.65 | ) | 9.45 | 6.31 | 10 | 0.07 | (g) | 0.17 | (g) | 2.75 | (g) | 6 | ||||||||||||||||||||||||||||||||||||||||||||||||||
| (a) | Calculated using average shares outstanding. |
| (b) | Includes adjustments in accordance with accounting principles generally accepted in the United States of America and as such, the net asset value for financial reporting purposes and the returns based upon those net asset values may differ from the net asset value and returns for shareholder transactions. Does not include sales charges and is not annualized for periods less than one year, if applicable. |
| (c) | In addition to the fees and expenses which the Fund bears directly, the Fund indirectly bears a pro rata share of the fees and expenses of the underlying funds in which the Fund invests. Because the underlying funds have varied expenses and fee levels and the Fund may own different proportions at different times, the amount of fees and expenses incurred indirectly by the Fund will vary. Estimated underlying fund expenses are not expenses that are incurred directly by the Fund. They are expenses that are incurred directly by the underlying funds and are deducted from the value of the funds the Fund invests in. The effect of the estimated underlying fund expenses that the Fund bears indirectly is included in the Fund’s total return. Estimated acquired fund fees from underlying funds was 0.42%, 0.47% and 0.55% for the years ended December 31, 2022, 2021 and 2020, respectively. |
| (d) | Does not include indirect expenses from affiliated fund fees and expenses of 0.46%, 0.48% and 0.53% for the eleven months ended December 31, 2019, and for the years ended January 31, 2019 and 2018, respectively. |
| (e) | Portfolio turnover is calculated at the fund level and is not annualized for periods less than one year, if applicable. |
| (f) | The total return, ratio of expenses to average net assets and ratio of net investment income (loss) to average net assets reflect actual 12b-1 fees of 0.24% for the years ended December 31, 2022, 2021 and 2020, respectively. |
| (g) | Annualized. |
| (h) | Commencement date after the close of business on May 24, 2019. |
See accompanying Notes to Financial Statements which are an integral part of the financial statements.
| 12 Invesco Select Risk: Conservative Investor Fund |
December 31, 2022
NOTE 1–Significant Accounting Policies
Invesco Select Risk: Conservative Investor Fund (the “Fund”) is a series portfolio of AIM Growth Series (Invesco Growth Series) (the “Trust”). The Trust is a Delaware statutory trust registered under the Investment Company Act of 1940, as amended (the “1940 Act”), as an open-end series management investment company authorized to issue an unlimited number of shares of beneficial interest. Information presented in these financial statements pertains only to the Fund. Matters affecting the Fund or each class will be voted on exclusively by the shareholders of the Fund or each class.
The Fund’s investment objective is to seek total return.
The Fund is a “fund of funds”, in that it invests in other mutual funds (“underlying funds”) advised by Invesco Advisers, Inc. (the “Adviser” or “Invesco”) and exchange-traded funds advised by Invesco Capital Management LLC (“Invesco Capital”). Invesco and Invesco Capital are affiliates of each other as they are indirect, wholly-owned subsidiaries of Invesco Ltd. Invesco may change the Fund’s asset class allocations, the underlying funds or the target weightings in the underlying funds without shareholder approval. The underlying funds may engage in a number of investment techniques and practices, which involve certain risks. Each underlying fund’s accounting policies are outlined in the underlying fund’s financial statements and are publicly available.
The Fund currently consists of six different classes of shares: Class A, Class C, Class R, Class Y, Class R5 and Class R6. Class Y shares are available only to certain investors. Class A shares are sold with a front-end sales charge unless certain waiver criteria are met. Under certain circumstances, load waived shares may be subject to contingent deferred sales charges (“CDSC”). Class C shares are sold with a CDSC. Class R, Class Y, Class R5 and Class R6 shares are sold at net asset value. Class C shares held for eight years after purchase are eligible for automatic conversion into Class A shares of the same Fund (the “Conversion Feature”). The automatic conversion pursuant to the Conversion Feature will generally occur at the end of the month following the eighth anniversary after a purchase of Class C shares.
The Fund is an investment company and accordingly follows the investment company accounting and reporting guidance in accordance with Financial Accounting Standards Board Accounting Standards Codification Topic 946, Financial Services – Investment Companies.
The following is a summary of the significant accounting policies followed by the Fund in the preparation of its financial statements.
| A. | Security Valuations – Securities of investment companies listed or traded on an exchange are generally valued at the trade price or official closing price that day as of the close of the exchange where the security is principally traded, or lacking any trades or official closing price on a particular day, the security may be valued at the closing bid price on that day. Securities of investment companies that are not exchange-traded (e.g., open-end mutual funds) are valued using such company’s end-of-business-day net asset value per share. Securities in the underlying funds, including restricted securities, are valued in accordance with the valuation policy of such fund. The policies of the underlying funds affiliated with the Fund, as a result of having the same investment adviser, are set forth below. |
A security listed or traded on an exchange is generally valued at its trade price or official closing price that day as of the close of the exchange where the security is principally traded, or lacking any trades or official closing price on a particular day, the security may be valued at the closing bid price on that day. Securities traded in the over-the-counter market are valued based on prices furnished by independent pricing services or market makers. When such securities are valued using prices provided by an independent pricing service they may be considered fair valued. Futures contracts are valued at the daily settlement price set by an exchange on which they are principally traded. U.S. exchange-traded options are valued at the mean between the last bid and asked prices from the exchange on which they are principally traded. Non-U.S. exchange-traded options are valued at the final settlement price set by the exchange on which they trade. Options not listed on an exchange and swaps generally are valued using pricing provided from independent pricing services.
Variable rate senior loan interests are fair valued using quotes provided by an independent pricing service. Quotes provided by the pricing service may reflect appropriate factors such as ratings, tranche type, industry, company performance, spread, individual trading characteristics, institution-size trading in similar groups of securities and other market data.
Securities of investment companies that are not exchange-traded (e.g., open-end mutual funds) are valued using such company’s end-of-business-day net asset value per share.
Deposits, other obligations of U.S. and non-U.S. banks and financial institutions are valued at their daily account value.
Fixed income securities (including convertible debt securities) generally are valued on the basis of prices provided by independent pricing services. Prices provided by the pricing service may be determined without exclusive reliance on quoted prices, and may reflect appropriate factors such as institution-size trading in similar groups of securities, developments related to specific securities, dividend rate (for unlisted equities), yield (for debt obligations), quality, type of issue, coupon rate (for debt obligations), maturity (for debt obligations), individual trading characteristics and other market data. Pricing services generally value debt obligations assuming orderly transactions of institutional round lot size, but a fund may hold or transact in the same securities in smaller, odd lot sizes. Odd lots often trade at lower prices than institutional round lots, and their value may be adjusted accordingly. Debt obligations are subject to interest rate and credit risks. In addition, all debt obligations involve some risk of default with respect to interest and/or principal payments.
Foreign securities’ (including foreign exchange contracts) prices are converted into U.S. dollar amounts using the applicable exchange rates as of the close of the New York Stock Exchange (“NYSE”). If market quotations are available and reliable for foreign exchange-traded equity securities, the securities will be valued at the market quotations. The Adviser may use various pricing services to obtain market quotations as well as fair value prices. Because trading hours for certain foreign securities end before the close of the NYSE, closing market quotations may become not representative of market value in the Adviser’s judgment (“unreliable”). If, between the time trading ends on a particular security and the close of the customary trading session on the NYSE, a significant event occurs that makes the closing price of the security unreliable, the Adviser may fair value the security. If the event is likely to have affected the closing price of the security, the security will be valued at fair value in good faith in accordance with Board- approved policies and related Adviser procedures (“Valuation Procedures”). Adjustments to closing prices to reflect fair value may also be based on a screening process of an independent pricing service to indicate the degree of certainty, based on historical data, that the closing price in the principal market where a foreign security trades is not the current value as of the close of the NYSE. Foreign securities’ prices meeting the degree of certainty that the price is not reflective of current value will be priced at the indication of fair value from the independent pricing service. Multiple factors may be considered by the independent pricing service in determining adjustments to reflect fair value and may include information relating to sector indices, American Depositary Receipts and domestic and foreign index futures. Foreign securities may have additional risks including exchange rate changes, potential for sharply devalued currencies and high inflation, political and economic upheaval, the relative lack of issuer information, relatively low market liquidity and the potential lack of strict financial and accounting controls and standards.
Unlisted securities will be valued using prices provided by independent pricing services or by another method that the Adviser, in its judgment, believes better reflects the security’s fair value in accordance with the Valuation Procedures.
Securities for which market prices are not provided by any of the above methods may be valued based upon quotes furnished by independent sources. The last bid price may be used to value equity securities. The mean between the last bid and asked prices may be used to value debt obligations, including corporate loans.
Securities for which market quotations are not readily available are fair valued by the Adviser in accordance with the Valuation Procedures. If a fair value price provided by a pricing service is unreliable, the Adviser will fair value the security using the Valuation Procedures. Issuer specific events, market trends, bid/asked quotes of brokers and information providers and other market data may be reviewed in the course of making a good faith determination of a security’s fair value.
| 13 Invesco Select Risk: Conservative Investor Fund |
The Fund may invest in securities that are subject to interest rate risk, meaning the risk that the prices will generally fall as interest rates rise and, conversely, the prices will generally rise as interest rates fall. Specific securities differ in their sensitivity to changes in interest rates depending on their individual characteristics. Changes in interest rates may result in increased market volatility, which may affect the value and/or liquidity of certain Fund investments.
Valuations change in response to many factors including the historical and prospective earnings of the issuer, the value of the issuer’s assets, general market conditions which are not specifically related to the particular issuer, such as real or perceived adverse economic conditions, changes in the general outlook for revenues or corporate earnings, changes in interest or currency rates, regional or global instability, natural or environmental disasters, widespread disease or other public health issues, war, acts of terrorism, significant governmental actions or adverse investor sentiment generally and market liquidity. Because of the inherent uncertainties of valuation, the values reflected in the financial statements may materially differ from the value received upon actual sale of those investments.
The price the Fund could receive upon the sale of any investment may differ from the Adviser’s valuation of the investment, particularly for securities that are valued using a fair valuation technique. When fair valuation techniques are applied, the Adviser uses available information, including both observable and unobservable inputs and assumptions, to determine a methodology that will result in a valuation that the Adviser believes approximates market value. Fund securities that are fair valued may be subject to greater fluctuation in their value from one day to the next than would be the case if market quotations were used. Because of the inherent uncertainties of valuation, and the degree of subjectivity in such decisions, the Fund could realize a greater or lesser than expected gain or loss upon the sale of the investment.
| B. | Securities Transactions and Investment Income – Securities transactions are accounted for on a trade date basis. Realized gains or losses on sales are computed on the basis of specific identification of the securities sold. Distributions from ordinary income from underlying funds, if any, are recorded as dividend income on the ex-dividend date. Distributions from gains from underlying funds, if any, are recorded as realized gains on the ex-dividend date. The following policies are followed by the underlying funds: Interest income (net of withholding tax, if any) is recorded on an accrual basis from settlement date and includes coupon interest and amortization of premium and accretion of discount on debt securities as applicable. Pay-in-kind interest income and non-cash dividend income received in the form of securities in-lieu of cash are recorded at the fair value of the securities received. Paydown gains and losses on mortgage and asset-backed securities are recorded as adjustments to interest income. |
The Fund may periodically participate in litigation related to the Fund’s investments. As such, the Fund may receive proceeds from litigation settlements. Any proceeds received are included in the Statement of Operations as realized gain (loss) for investments no longer held and as unrealized gain (loss) for investments still held.
The Fund allocates income and realized and unrealized capital gains and losses to a class based on the relative net assets of each class.
| C. | Distributions – Distributions from net investment income and net realized capital gain, if any, are generally declared and paid annually and recorded on the ex-dividend date. The Fund may elect to treat a portion of the proceeds from redemptions as distributions for federal income tax purposes. |
| D. | Federal Income Taxes – The Fund intends to comply with the requirements of Subchapter M of the Internal Revenue Code of 1986, as amended (the “Internal Revenue Code”), necessary to qualify as a regulated investment company and to distribute substantially all of the Fund’s taxable earnings to shareholders. As such, the Fund will not be subject to federal income taxes on otherwise taxable income (including net realized capital gain) that is distributed to shareholders. |
Therefore, no provision for federal income taxes is recorded in the financial statements.
The Fund recognizes the tax benefits of uncertain tax positions only when the position is more likely than not to be sustained. Management has analyzed the Fund’s uncertain tax positions and concluded that no liability for unrecognized tax benefits should be recorded related to uncertain tax positions. Management is not aware of any tax positions for which it is reasonably possible that the total amounts of unrecognized tax benefits will change materially in the next 12 months.
The Fund files tax returns in the U.S. Federal jurisdiction and certain other jurisdictions. Generally, the Fund is subject to examinations by such taxing authorities for up to three years after the filing of the return for the tax period.
| E. | Expenses – Expenses included in the accompanying financial statements reflect the expenses of the Fund and do not include any expenses of the underlying funds. The effects of the underlying funds expenses are included in the realized and unrealized gain/loss on the investments in the underlying funds. Estimated expenses of the underlying funds are discussed further within the Financial Highlights. |
Fees provided for under the Rule 12b-1 plan of a particular class of the Fund and which are directly attributable to that class are charged to the operations of such class. Transfer agency fees and expenses and other shareholder recordkeeping fees and expenses attributable to Class R5 and Class R6 are allocated based on relative net assets of Class R5 and Class R6. Transfer agency fees and expenses and other shareholder recordkeeping fees and expenses relating to all other classes are allocated among those classes based on relative net assets. All other expenses are allocated among the classes based on relative net assets.
| F. | Accounting Estimates – The preparation of financial statements in conformity with accounting principles generally accepted in the United States of America (“GAAP”) requires management to make estimates and assumptions that affect the reported amounts of assets and liabilities at the date of the financial statements and the reported amounts of revenues and expenses during the reporting period including estimates and assumptions related to taxation. Actual results could differ from those estimates by a significant amount. In addition, the Fund monitors for material events or transactions that may occur or become known after the period-end date and before the date the financial statements are released to print. |
| G. | Indemnifications – Under the Trust’s organizational documents, each Trustee, officer, employee or other agent of the Trust is indemnified against certain liabilities that may arise out of the performance of their duties to the Fund. Additionally, in the normal course of business, the Fund enters into contracts, including the Fund’s servicing agreements, that contain a variety of indemnification clauses. The Fund’s maximum exposure under these arrangements is unknown as this would involve future claims that may be made against the Fund that have not yet occurred. The risk of material loss as a result of such indemnification claims is considered remote. |
| H. | Securities Lending – The Fund may lend portfolio securities having a market value up to one-third of the Fund’s total assets. Such loans are secured by collateral equal to no less than the market value of the loaned securities determined daily by the securities lending provider. Such collateral will be cash or debt securities issued or guaranteed by the U.S. Government or any of its sponsored agencies. Cash collateral received in connection with these loans is invested in short-term money market instruments or affiliated, unregistered investment companies that comply with Rule 2a-7 under the 1940 Act and money market funds (collectively, “affiliated money market funds”) and is shown as such on the Schedule of Investments. The Fund bears the risk of loss with respect to the investment of collateral. It is the Fund’s policy to obtain additional collateral from or return excess collateral to the borrower by the end of the next business day, following the valuation date of the securities loaned. Therefore, the value of the collateral held may be temporarily less than the value of the securities on loan. |
When loaning securities, the Fund retains certain benefits of owning the securities, including the economic equivalent of dividends or interest generated by the security. Lending securities entails a risk of loss to the Fund if, and to the extent that, the market value of the securities loaned were to increase and the borrower did not increase the collateral accordingly, and the borrower failed to return the securities. The securities loaned are subject to termination at the option of the borrower or the Fund. Upon termination, the borrower will return to the Fund the securities loaned and the Fund will return the collateral. Upon the failure of the borrower to return the securities, collateral may be liquidated and the securities may be purchased on the open market to replace the loaned securities. The Fund could experience delays and costs in gaining access to the collateral and the securities may lose value during the delay which could result in potential losses to the Fund. Some of these losses may be indemnified by the lending agent. The Fund bears the risk of any deficiency in the amount of the collateral available for return to the borrower due to any loss on the collateral invested. Dividends received on cash collateral investments for securities lending transactions, which are
| 14 Invesco Select Risk: Conservative Investor Fund |
net of compensation to counterparties, are included in Dividends from affiliated underlying funds on the Statement of Operations. The aggregate value of securities out on loan, if any, is shown as a footnote on the Statement of Assets and Liabilities.
The Adviser serves as an affiliated securities lending agent for the Fund. The Bank of New York Mellon also serves as a lending agent. To the extent the Fund utilizes the Adviser as an affiliated securities lending agent, the Fund conducts its securities lending in accordance with, and in reliance upon, no-action letters issued by the SEC staff that provide guidance on how an affiliate may act as a direct agent lender and receive compensation for those services in a manner consistent with the federal securities laws. For the year ended December 31, 2022, the Fund paid the Adviser $8,856 in fees for securities lending agent services. Fees paid to the Adviser for securities lending agent services, if any, are included in Dividends from affiliated underlying funds on the Statement of Operations.
| I. | Foreign Currency Translations – Foreign currency is valued at the close of the NYSE based on quotations posted by banks and major currency dealers. Portfolio securities and other assets and liabilities denominated in foreign currencies are translated into U.S. dollar amounts at the date of valuation. Purchases and sales of portfolio securities (net of foreign taxes withheld on disposition) and income items denominated in foreign currencies are translated into U.S. dollar amounts on the respective dates of such transactions. The Fund does not separately account for the portion of the results of operations resulting from changes in foreign exchange rates on investments and the fluctuations arising from changes in market prices of securities held. The combined results of changes in foreign exchange rates and the fluctuation of market prices on investments (net of estimated foreign tax withholding) are included with the net realized and unrealized gain or loss from investments in the Statement of Operations. Reported net realized foreign currency gains or losses arise from (1) sales of foreign currencies, (2) currency gains or losses realized between the trade and settlement dates on securities transactions, and (3) the difference between the amounts of dividends, interest, and foreign withholding taxes recorded on the Fund’s books and the U.S. dollar equivalent of the amounts actually received or paid. Net unrealized foreign currency gains and losses arise from changes in the fair values of assets and liabilities, other than investments in securities at fiscal period end, resulting from changes in exchange rates. |
The Fund may invest in foreign securities, which may be subject to foreign taxes on income, gains on investments or currency repatriation, a portion of which may be recoverable. Foreign taxes, if any, are recorded based on the tax regulations and rates that exist in the foreign markets in which the Fund invests and are shown in the Statement of Operations.
| J. | Forward Foreign Currency Contracts – The Fund may engage in foreign currency transactions either on a spot (i.e. for prompt delivery and settlement) basis, or through forward foreign currency contracts, to manage or minimize currency or exchange rate risk. |
The Fund may also enter into forward foreign currency contracts for the purchase or sale of a security denominated in a foreign currency in order to “lock in” the U.S. dollar price of that security, or the Fund may also enter into forward foreign currency contracts that do not provide for physical exchange of the two currencies on the settlement date, but instead are settled by a single cash payment calculated as the difference between the agreed upon exchange rate and the spot rate at settlement based upon an agreed upon notional amount (non-deliverable forwards).
A forward foreign currency contract is an obligation between two parties (“Counterparties”) to purchase or sell a specific currency for an agreed-upon price at a future date. The use of forward foreign currency contracts for hedging does not eliminate fluctuations in the price of the underlying securities the Fund owns or intends to acquire but establishes a rate of exchange in advance. Fluctuations in the value of these contracts are measured by the difference in the contract date and reporting date exchange rates and are recorded as unrealized appreciation (depreciation) until the contracts are closed. When the contracts are closed, realized gains (losses) are recorded. Realized and unrealized gains (losses) on the contracts are included in the Statement of Operations. The primary risks associated with forward foreign currency contracts include failure of the Counterparty to meet the terms of the contract and the value of the foreign currency changing unfavorably. These risks may be in excess of the amounts reflected in the Statement of Assets and Liabilities.
| K. | Futures Contracts – The Fund may enter into futures contracts to manage exposure to interest rate, equity and market price movements and/or currency risks. A futures contract is an agreement between two parties (“Counterparties”) to purchase or sell a specified underlying security, currency or commodity (or delivery of a cash settlement price, in the case of an index future) for a fixed price at a future date. The Fund currently invests only in exchange-traded futures and they are standardized as to maturity date and underlying financial instrument. Initial margin deposits required upon entering into futures contracts are satisfied by the segregation of specific securities or cash as collateral at the futures commission merchant (broker). During the period the futures contracts are open, changes in the value of the contracts are recognized as unrealized gains or losses by recalculating the value of the contracts on a daily basis. Subsequent or variation margin payments are received or made depending upon whether unrealized gains or losses are incurred. These amounts are reflected as receivables or payables on the Statement of Assets and Liabilities. When the contracts are closed or expire, the Fund recognizes a realized gain or loss equal to the difference between the proceeds from, or cost of, the closing transaction and the Fund’s basis in the contract. The net realized gain (loss) and the change in unrealized gain (loss) on futures contracts held during the period is included on the Statement of Operations. The primary risks associated with futures contracts are market risk and the absence of a liquid secondary market. If the Fund were unable to liquidate a futures contract and/or enter into an offsetting closing transaction, the Fund would continue to be subject to market risk with respect to the value of the contracts and continue to be required to maintain the margin deposits on the futures contracts. Futures contracts have minimal Counterparty risk since the exchange’s clearinghouse, as Counterparty to all exchange-traded futures, guarantees the futures against default. Risks may exceed amounts recognized in the Statement of Assets and Liabilities. |
| L. | Leverage Risk – Leverage exists when the Fund can lose more than it originally invests because it purchases or sells an instrument or enters into a transaction without investing an amount equal to the full economic exposure of the instrument or transaction. |
| M. | Other Risks – Investments in ETFs generally present the same primary risks as an investment in a conventional mutual fund that has the same investment objective, strategy and policies. Investments in ETFs further involve the same risks associated with a direct investment in the types of securities, commodities and/or currencies included in the indices the ETFs are designed to replicate. In addition, shares of an ETF may trade at a market price that is higher or lower than their net asset value and an active trading market in such shares may not develop or continue. Moreover, trading of an ETF’s shares may be halted if the listing exchange’s officials deem such action to be appropriate, the shares are de-listed from the exchange, or the activation of market-wide “circuit breakers” (which are tied to large decreases in stock prices) halts stock trading generally. |
| N. | COVID-19 Risk – The COVID-19 strain of coronavirus has resulted in instances of market closures and dislocations, extreme volatility, liquidity constraints and increased trading costs. Efforts to contain its spread have resulted in travel restrictions, disruptions of healthcare systems, business operations (including business closures) and supply chains, layoffs, lower consumer demand and employee availability, and defaults and credit downgrades, among other significant economic impacts that have disrupted global economic activity across many industries. Such economic impacts may exacerbate other pre-existing political, social and economic risks locally or globally and cause general concern and uncertainty. The full economic impact and ongoing effects of COVID-19 (or other future epidemics or pandemics) at the macro-level and on individual businesses are unpredictable and may result in significant and prolonged effects on the Fund’s performance. |
NOTE 2–Advisory Fees and Other Fees Paid to Affiliates
The Trust has entered into a master investment advisory agreement with the Adviser. Under the terms of the investment advisory agreement, the Fund does not pay an advisory fee. However, the Fund pays advisory fees to the Adviser indirectly as a shareholder of the underlying funds.
Under the terms of a master sub-advisory agreement between the Adviser and each of Invesco Asset Management Deutschland GmbH, Invesco Asset Management Limited, Invesco Asset Management (Japan) Limited, Invesco Hong Kong Limited, Invesco Senior Secured Management, Inc. and Invesco Canada Ltd. and separate sub-advisory agreements with Invesco Capital Management LLC and Invesco Asset Management (India) Private Limited (collectively, the “Affiliated Sub-Advisers”) the
| 15 Invesco Select Risk: Conservative Investor Fund |
Adviser, not the Fund, will pay 40% of the fees paid to the Adviser to any such Affiliated Sub-Adviser(s) that provide(s) discretionary investment management services to the Fund based on the percentage of assets allocated to such Affiliated Sub-Adviser(s). Invesco has also entered into a sub-advisory agreement with OppenheimerFunds, Inc. to provide discretionary management services to the Fund.
Effective May 1, 2022, the Adviser has contractually agreed, through at least April 30, 2024, to reimburse expenses of all shares to the extent necessary to limit total annual fund operating expenses after expense reimbursement (excluding certain items discussed below) of Class A, Class C, Class R, Class Y, Class R5 and Class R6 shares to 0.50%, 1.25%, 0.75%, 0.25%, 0.25%, and 0.25%, respectively, of the Fund’s average daily net assets (the “expense limits”). Prior to May 1, 2022, the Adviser had contractually agreed to reimburse expenses of all shares to the extent necessary to limit total annual fund operating expenses after expense reimbursement (excluding certain items discussed below) of Class A, Class C, Class R, Class Y, Class R5 and Class R6 shares to 0.50%, 1.25%, 0.75%, 0.25%, 0.20% and 0.15%, respectively, of the Fund’s average daily net assets. In determining the Adviser’s obligation to reimburse expenses, the following expenses are not taken into account, and could cause the total annual fund operating expenses after expense reimbursement to exceed the numbers reflected above: (1) interest; (2) taxes; (3) dividend expense on short sales; (4) extraordinary or non-routine items, litigation expenses; and (5) expenses that the Fund has incurred but did not actually pay because of an expense offset arrangement. Unless Invesco continues the expense reimbursement agreement, it will terminate on April 30, 2024. During its term, the expense reimbursement agreement cannot be terminated or amended to increase the expense limits or reduce the expense reimbursement without approval of the Board of Trustees. The Adviser did not reimburse expenses during the period under these expense limits.
The Trust has entered into a master administrative services agreement with Invesco pursuant to which the Fund has agreed to pay Invesco for certain administrative costs incurred in providing accounting services to the Fund. For the year ended December 31, 2022, expenses incurred under the agreement are shown in the Statement of Operations as Administrative services fees. Invesco has entered into a sub-administration agreement whereby State Street Bank and Trust Company (“SSB”) serves as fund accountant and provides certain administrative services to the Fund. Pursuant to a custody agreement with the Trust on behalf of the Fund, SSB also serves as the Fund’s custodian.
The Trust has entered into a transfer agency and service agreement with Invesco Investment Services, Inc. (“IIS”) pursuant to which the Fund has agreed to pay IIS a fee for providing transfer agency and shareholder services to the Fund and reimburse IIS for certain expenses incurred by IIS in the course of providing such services. IIS may make payments to intermediaries that provide omnibus account services, sub-accounting services and/or networking services. All fees payable by IIS to intermediaries that provide omnibus account services or sub-accounting services are charged back to the Fund, subject to certain limitations approved by the Trust’s Board of Trustees. For the year ended December 31, 2022, expenses incurred under the agreement are shown in the Statement of Operations as Transfer agent fees.
The Trust has entered into master distribution agreements with Invesco Distributors, Inc. (“IDI”) to serve as the distributor for the Class A, Class C, Class R, Class Y, Class R5 and Class R6 shares of the Fund. The Trust has adopted plans pursuant to Rule 12b-1 under the 1940 Act with respect to the Fund’s Class A, Class C and Class R shares (collectively, the “Plans”). The Fund, pursuant to the Class A Plan, reimburses IDI for its allocated share of expenses incurred for the period, up to a maximum annual rate of 0.25% of the average daily net assets of Class A shares. The Fund, pursuant to the Class C and Class R Plans, pays IDI compensation at the annual rate of 1.00% of the average daily net assets of Class C shares and 0.50% of the average daily net assets of Class R shares. The fees are accrued daily and paid monthly. Of the Plan payments, up to 0.25% of the average daily net assets of each class of shares may be paid to furnish continuing personal shareholder services to customers who purchase and own shares of such classes. Any amounts not paid as a service fee under the Plans would constitute an asset-based sales charge. Rules of the Financial Industry Regulatory Authority (“FINRA”) impose a cap on the total sales charges, including asset-based sales charges, that may be paid by any class of shares of the Fund. For the year ended December 31, 2022, expenses incurred under the Plans are shown in the Statement of Operations as Distribution fees.
Front-end sales commissions and CDSC (collectively, the “sales charges”) are not recorded as expenses of the Fund. Front-end sales commissions are deducted from proceeds from the sales of Fund shares prior to investment in Class A shares of the Fund. CDSC are deducted from redemption proceeds prior to remittance to the shareholder. During the year ended December 31, 2022, IDI advised the Fund that IDI retained $38,986 in front-end sales commissions from the sale of Class A shares and $11,587 and $1,870 from Class A and Class C shares, respectively, for CDSC imposed upon redemptions by shareholders.
The underlying Invesco Funds pay no distribution fees for Class R6 shares and the Funds pay no sales loads or other similar compensation to IDI for acquiring underlying fund shares.
Certain officers and trustees of the Trust are officers and directors of the Adviser, IIS and/or IDI.
NOTE 3–Additional Valuation Information
GAAP defines fair value as the price that would be received to sell an asset or paid to transfer a liability in an orderly transaction between market participants at the measurement date, under current market conditions. GAAP establishes a hierarchy that prioritizes the inputs to valuation methods, giving the highest priority to readily available unadjusted quoted prices in an active market for identical assets (Level 1) and the lowest priority to significant unobservable inputs (Level 3), generally when market prices are not readily available. Based on the valuation inputs, the securities or other investments are tiered into one of three levels. Changes in valuation methods may result in transfers in or out of an investment’s assigned level:
Level 1 - | Prices are determined using quoted prices in an active market for identical assets. | |
Level 2 - | Prices are determined using other significant observable inputs. Observable inputs are inputs that other market participants may use in pricing a security. These may include quoted prices for similar securities, interest rates, prepayment speeds, credit risk, yield curves, loss severities, default rates, discount rates, volatilities and others. | |
Level 3 - | Prices are determined using significant unobservable inputs. In situations where quoted prices or observable inputs are unavailable (for example, when there is little or no market activity for an investment at the end of the period), unobservable inputs may be used. Unobservable inputs reflect the Adviser’s assumptions about the factors market participants would use in determining fair value of the securities or instruments and would be based on the best available information. |
The following is a summary of the tiered valuation input levels, as of December 31, 2022. The level assigned to the securities valuations may not be an indication of the risk or liquidity associated with investing in those securities. Because of the inherent uncertainties of valuation, the values reflected in the financial statements may materially differ from the value received upon actual sale of those investments.
| Level 1 | Level 2 | Level 3 | Total | |||||||||||||
| ||||||||||||||||
Investments in Securities | ||||||||||||||||
| ||||||||||||||||
Affiliated Issuers | $369,436,515 | $- | $- | $369,436,515 | ||||||||||||
| ||||||||||||||||
Money Market Funds | 2,002,863 | - | - | 2,002,863 | ||||||||||||
| ||||||||||||||||
Total Investments in Securities | 371,439,378 | - | - | 371,439,378 | ||||||||||||
| ||||||||||||||||
Other Investments - Liabilities* | ||||||||||||||||
| ||||||||||||||||
Futures Contracts | (2,567,750 | ) | - | - | (2,567,750 | ) | ||||||||||
| ||||||||||||||||
Total Investments | $368,871,628 | $- | $- | $368,871,628 | ||||||||||||
| ||||||||||||||||
| * | Unrealized appreciation (depreciation). |
| 16 Invesco Select Risk: Conservative Investor Fund |
NOTE 4–Derivative Investments
The Fund may enter into an International Swaps and Derivatives Association Master Agreement (“ISDA Master Agreement”) under which a fund may trade OTC derivatives. An OTC transaction entered into under an ISDA Master Agreement typically involves a collateral posting arrangement, payment netting provisions and close-out netting provisions. These netting provisions allow for reduction of credit risk through netting of contractual obligations. The enforceability of the netting provisions of the ISDA Master Agreement depends on the governing law of the ISDA Master Agreement, among other factors.
For financial reporting purposes, the Fund does not offset OTC derivative assets or liabilities that are subject to ISDA Master Agreements in the Statement of Assets and Liabilities.
Value of Derivative Investments at Period-End
The table below summarizes the value of the Fund’s derivative investments, detailed by primary risk exposure, held as of December 31, 2022:
| Value | ||||||||||||
| Derivative Liabilities | Equity Risk | Interest Rate Risk | Total | |||||||||
| ||||||||||||
Unrealized depreciation on futures contracts -Exchange-Traded(a) | $ | (26,823 | ) | $ | (2,540,927 | ) | $ | (2,567,750 | ) | |||
| ||||||||||||
Derivatives not subject to master netting agreements | 26,823 | 2,540,927 | 2,567,750 | |||||||||
| ||||||||||||
Total Derivative Liabilities subject to master netting agreements | $ | - | $ | - | $ | - | ||||||
| ||||||||||||
| (a) | The daily variation margin receivable (payable) at period-end is recorded in the Statement of Assets and Liabilities. |
Effect of Derivative Investments for the year ended December 31, 2022
The table below summarizes the gains (losses) on derivative investments, detailed by primary risk exposure, recognized in earnings during the period:
| Location of Gain (Loss) on Statement of Operations | ||||||||||||
| Equity Risk | Interest Rate Risk | Total | ||||||||||
| ||||||||||||
Realized Gain (Loss): | $ | (176,681 | ) | $ | (6,073,722 | ) | $ | (6,250,403 | ) | |||
| ||||||||||||
Change in Net Unrealized Appreciation (Depreciation): | ||||||||||||
Futures contracts | (51,638 | ) | (2,189,661 | ) | (2,241,299 | ) | ||||||
| ||||||||||||
Total | $ | (228,319 | ) | $ | (8,263,383 | ) | $ | (8,491,702 | ) | |||
| ||||||||||||
The table below summarizes the average notional value of derivatives held during the period.
| Futures | ||||
| Contracts | ||||
| ||||
Average notional value | $ | 69,587,445 | ||
| ||||
NOTE 5–Expense Offset Arrangement(s)
The expense offset arrangement is comprised of transfer agency credits which result from balances in demand deposit accounts used by the transfer agent for clearing shareholder transactions. For the year ended December 31, 2022, the Fund received credits from this arrangement, which resulted in the reduction of the Fund’s total expenses of $5,001.
NOTE 6–Trustees’ and Officers’ Fees and Benefits
Trustees’ and Officers’ Fees and Benefits include amounts accrued by the Fund to pay remuneration to certain Trustees and Officers of the Fund. Trustees have the option to defer compensation payable by the Fund, and Trustees’ and Officers’ Fees and Benefits also include amounts accrued by the Fund to fund such deferred compensation amounts. Those Trustees who defer compensation have the option to select various Invesco Funds in which their deferral accounts shall be deemed to be invested. Finally, certain current Trustees were eligible to participate in a retirement plan that provided for benefits to be paid upon retirement to Trustees over a period of time based on the number of years of service. The Fund may have certain former Trustees who also participate in a retirement plan and receive benefits under such plan. Trustees’ and Officers’ Fees and Benefits include amounts accrued by the Fund to fund such retirement benefits. Obligations under the deferred compensation and retirement plans represent unsecured claims against the general assets of the Fund.
NOTE 7–Cash Balances
The Fund is permitted to temporarily carry a negative or overdrawn balance in its account with SSB, the custodian bank. Such balances, if any at period-end, are shown in the Statement of Assets and Liabilities under the payable caption Amount due custodian. To compensate the custodian bank for such overdrafts, the overdrawn Fund may either (1) leave funds as a compensating balance in the account so the custodian bank can be compensated by earning the additional interest; or (2) compensate by paying the custodian bank at a rate agreed upon by the custodian bank and Invesco, not to exceed the contractually agreed upon rate. The Fund may not purchase additional securities when any borrowings from banks or broker-dealers exceed 5% of the Fund’s total assets, or when any borrowings from an Invesco Fund are outstanding.
NOTE 8–Distributions to Shareholders and Tax Components of Net Assets
Tax Character of Distributions to Shareholders Paid During the Fiscal Years Ended December 31, 2022 and 2021:
| 2022 | 2021 | |||||||||||
| ||||||||||||
Ordinary income* | $ | 9,823,286 | $ | 20,651,195 | ||||||||
| ||||||||||||
| * | Includes short-term capital gain distributions, if any. |
| 17 Invesco Select Risk: Conservative Investor Fund |
Tax Components of Net Assets at Period-End:
| 2022 | ||||
| ||||
Undistributed ordinary income | $ | 2,973,489 | ||
| ||||
Net unrealized appreciation (depreciation) – investments | (50,472,458 | ) | ||
| ||||
Net unrealized appreciation – foreign currencies | 56,717 | |||
| ||||
Temporary book/tax differences | (38,696 | ) | ||
| ||||
Capital loss carryforward | (13,342,065 | ) | ||
| ||||
Shares of beneficial interest | 434,398,048 | |||
| ||||
Total net assets | $ | 373,575,035 | ||
| ||||
The difference between book-basis and tax-basis unrealized appreciation (depreciation) is due to differences in the timing of recognition of gains and losses on investments for tax and book purposes. The Fund’s net unrealized appreciation (depreciation) difference is attributable primarily to derivative instruments and wash sales .
The temporary book/tax differences are a result of timing differences between book and tax recognition of income and/or expenses. The Fund’s temporary book/tax differences are the result of the trustee deferral of compensation and retirement plan benefits.
Capital loss carryforward is calculated and reported as of a specific date. Results of transactions and other activity after that date may affect the amount of capital loss carryforward actually available for the Fund to utilize. The ability to utilize capital loss carryforward in the future may be limited under the Internal Revenue Code and related regulations based on the results of future transactions.
The Fund does not have a capital loss carryforward as of December 31, 2022.
Capital Loss Carryforward*
| Expiration | Short-Term | Long-Term | Total | |||||||||||
Not subject to expiration | $ | 4,100,876 | $ | 9,241,189 | $ | 13,342,065 | ||||||||
| * | Capital loss carryforward is reduced for limitations, if any, to the extent required by the Internal Revenue Code and may be further limited depending upon a variety of factors, including the realization of net unrealized gains or losses as of the date of any reorganization. |
NOTE 9–Investment Transactions
The aggregate amount of investment securities (other than short-term securities, U.S. Government obligations and money market funds, if any) purchased and sold by the Fund during the year ended December 31, 2022 was $84,548,566 and $109,341,477, respectively. Cost of investments, including any derivatives, on a tax basis includes the adjustments for financial reporting purposes as of the most recently completed federal income tax reporting period-end.
| Unrealized Appreciation (Depreciation) of Investments on a Tax Basis | ||||
Aggregate unrealized appreciation of investments | $ | 9,116,248 | ||
Aggregate unrealized (depreciation) of investments | (59,588,706 | ) | ||
Net unrealized appreciation (depreciation) of investments | $ | (50,472,458 | ) | |
Cost of investments for tax purposes is $419,344,086.
NOTE 10–Reclassification of Permanent Differences
Primarily as a result of differing book/tax treatment of foreign currency transactions and partnerships, on December 31, 2022, undistributed net investment income was decreased by $1,236,694 and undistributed net realized gain (loss) was increased by $1,236,694. This reclassification had no effect on the net assets or the distributable earnings (loss) of the Fund.
NOTE 11–Share Information
| Summary of Share Activity | ||||||||||||||||
| Year ended | Year ended | |||||||||||||||
| December 31, 2022(a) | December 31, 2021 | |||||||||||||||
|
|
|
| |||||||||||||
| Shares | Amount | Shares | Amount | |||||||||||||
Sold: | ||||||||||||||||
Class A | 7,485,091 | $ | 65,209,057 | 8,829,161 | $ | 90,142,169 | ||||||||||
Class C | 739,809 | 6,427,846 | 1,312,657 | 13,172,393 | ||||||||||||
Class R | 930,994 | 8,142,117 | 940,856 | 9,573,909 | ||||||||||||
Class Y | 249,946 | 2,190,915 | 328,551 | 3,353,031 | ||||||||||||
Class R6 | 11 | 98 | 765 | 7,770 | ||||||||||||
Issued as reinvestment of dividends: | ||||||||||||||||
Class A | 926,391 | 7,586,867 | 1,575,051 | 15,482,752 | ||||||||||||
Class C | 89,431 | 725,288 | 224,018 | 2,179,692 | ||||||||||||
Class R | 122,510 | 1,000,908 | 208,786 | 2,048,191 | ||||||||||||
Class Y | 22,710 | 186,675 | 32,815 | 323,891 | ||||||||||||
Class R6 | - | - | 38 | 374 | ||||||||||||
Automatic conversion of Class C shares to Class A shares: | ||||||||||||||||
Class A | 760,823 | 6,720,693 | 771,456 | 7,832,170 | ||||||||||||
Class C | (771,541 | ) | (6,720,693 | ) | (782,269 | ) | (7,832,170 | ) | ||||||||
| 18 Invesco Select Risk: Conservative Investor Fund |
| Summary of Share Activity | ||||||||||||||||
| ||||||||||||||||
| Year ended | Year ended | |||||||||||||||
| December 31, 2022(a) | December 31, 2021 | |||||||||||||||
|
|
|
| |||||||||||||
| Shares | Amount | Shares | Amount | |||||||||||||
| ||||||||||||||||
Reacquired: | ||||||||||||||||
Class A | (9,835,742 | ) | $ | (85,940,667 | ) | (20,030,567 | ) | $ | (204,992,918 | ) | ||||||
| ||||||||||||||||
Class C | (1,341,309 | ) | (11,670,554 | ) | (1,602,165 | ) | (16,102,529 | ) | ||||||||
| ||||||||||||||||
Class R | (976,092 | ) | (8,517,062 | ) | (1,318,513 | ) | (13,405,164 | ) | ||||||||
| ||||||||||||||||
Class Y | (200,955 | ) | (1,775,172 | ) | (452,556 | ) | (4,659,700 | ) | ||||||||
| ||||||||||||||||
Class R6 | (813 | ) | (7,925 | ) | (1 | ) | (12 | ) | ||||||||
| ||||||||||||||||
Net increase (decrease) in share activity | (1,798,736 | ) | $ | (16,441,609 | ) | (9,961,917 | ) | $ | (102,876,151 | ) | ||||||
| ||||||||||||||||
| (a) | There is an entity that is a record owner of more than 5% of the outstanding shares of the Fund and owns 10% of the outstanding shares of the Fund. IDI has an agreement with this entity to sell Fund shares. The Fund, Invesco and/or Invesco affiliates may make payments to this entity, which is considered to be related to the Fund, for providing services to the Fund, Invesco and/or Invesco affiliates including but not limited to services such as, securities brokerage, distribution, third party record keeping and account servicing. The Fund has no knowledge as to whether all or any portion of the shares owned of record by this entity are also owned beneficially. |
| 19 Invesco Select Risk: Conservative Investor Fund |
Report of Independent Registered Public Accounting Firm
To the Board of Trustees of AIM Growth Series (Invesco Growth Series) and Shareholders of Invesco Select Risk: Conservative Investor Fund
Opinion on the Financial Statements
We have audited the accompanying statement of assets and liabilities, including the schedule of investments, of Invesco Select Risk: Conservative Investor Fund (one of the funds constituting AIM Growth Series (Invesco Growth Series), referred to hereafter as the “Fund”) as of December 31, 2022, the related statement of operations for the year ended December 31, 2022, the statement of changes in net assets for each of the two years in the period ended December 31, 2022, including the related notes, and the financial highlights for each of the periods indicated in the table below (collectively referred to as the “financial statements”). In our opinion, the financial statements present fairly, in all material respects, the financial position of the Fund as of December 31, 2022, the results of its operations for the year then ended, the changes in its net assets for each of the two years in the period ended December 31, 2022 and the financial highlights for each of the periods indicated in the table below, in conformity with accounting principles generally accepted in the United States of America.
| Financial Highlights |
| For each of the three years in the period ended December 31, 2022 and the eleven months ended December 31, 2019 for Class A, Class C, Class R and Class Y. For each of the three years in the period ended December 31, 2022 and the period May 24, 2019 (commencement of operations) through December 31, 2019 for Class R5 and Class R6. |
The financial statements of Oppenheimer Portfolio Series: Conservative Investor Fund (subsequently renamed Invesco Select Risk: Conservative Investor Fund) as of and for the year ended January 31, 2019 and the financial highlights for each of the periods ended on or prior to January 31, 2019 (not presented herein, other than the financial highlights) were audited by other auditors whose report dated March 25, 2019 expressed an unqualified opinion on those financial statements and financial highlights.
Basis for Opinion
These financial statements are the responsibility of the Fund’s management. Our responsibility is to express an opinion on the Fund’s financial statements based on our audits. We are a public accounting firm registered with the Public Company Accounting Oversight Board (United States) (PCAOB) and are required to be independent with respect to the Fund in accordance with the U.S. federal securities laws and the applicable rules and regulations of the Securities and Exchange Commission and the PCAOB.
We conducted our audits of these financial statements in accordance with the standards of the PCAOB. Those standards require that we plan and perform the audit to obtain reasonable assurance about whether the financial statements are free of material misstatement, whether due to error or fraud.
Our audits included performing procedures to assess the risks of material misstatement of the financial statements, whether due to error or fraud, and performing procedures that respond to those risks. Such procedures included examining, on a test basis, evidence regarding the amounts and disclosures in the financial statements. Our audits also included evaluating the accounting principles used and significant estimates made by management, as well as evaluating the overall presentation of the financial statements. Our procedures included confirmation of securities owned as of December 31, 2022 by correspondence with the custodian, transfer agent and brokers; when replies were not received from brokers, we performed other auditing procedures. We believe that our audits provide a reasonable basis for our opinion.
/s/PricewaterhouseCoopers LLP
Houston, Texas
February 22, 2023
We have served as the auditor of one or more of the investment companies in the Invesco group of investment companies since at least 1995. We have not been able to determine the specific year we began serving as auditor.
| 20 Invesco Select Risk: Conservative Investor Fund |
Calculating your ongoing Fund expenses
Example
As a shareholder of the Fund, you incur two types of costs: (1) transaction costs, which may include sales charges (loads) on purchase payments or contingent deferred sales charges on redemptions, if any; and (2) ongoing costs, including management fees, distribution and/or service (12b-1) fees, and other Fund expenses. This example is intended to help you understand your ongoing costs (in dollars) of investing in the Fund and to compare these costs with ongoing costs of investing in other mutual funds. The example is based on an investment of $1,000 invested at the beginning of the period and held for the entire period July 1, 2022 through December 31, 2022.
In addition to the fees and expenses which the Fund bears directly, the Fund indirectly bears a pro-rata share of the fees and expenses of the underlying funds in which the Fund invests. The amount of fees and expenses incurred indirectly by the Fund will vary because the underlying funds have varied expenses and fee levels and the Fund may own different proportions of the underlying funds at different times. Estimated underlying fund expenses are not expenses that are incurred directly by the Fund. They are expenses that are incurred directly by the underlying funds and are deducted from the value of the underlying funds the Fund invests in. The effect of the estimated underlying fund expenses that the Fund bears indirectly are included in the Fund’s total return.
Actual expenses
The table below provides information about actual account values and actual expenses. You may use the information in this table, together with the amount you invested, to estimate the expenses that you paid over the period. Simply divide your account value by $1,000 (for example, an $8,600 account value divided by $1,000 = 8.6), then multiply the result by the number in the table under the heading entitled “Actual Expenses Paid During Period” to estimate the expenses you paid on your account during this period.
Hypothetical example for comparison purposes
The table below also provides information about hypothetical account values and hypothetical expenses based on the Fund’s actual expense ratio and an assumed rate of return of 5% per year before expenses, which is not the Fund’s actual return.
The hypothetical account values and expenses may not be used to estimate the actual ending account balance or expenses you paid for the period. You may use this information to compare the ongoing costs of investing in the Fund and other funds. To do so, compare this 5% hypothetical example with the 5% hypothetical examples that appear in the shareholder reports of the other funds.
Please note that the expenses shown in the table are meant to highlight your ongoing costs only and do not reflect any transaction costs, such as sales charges (loads) on purchase payments or contingent deferred sales charges on redemptions, if any. Therefore, the hypothetical information is useful in comparing ongoing costs only, and will not help you determine the relative total costs of owning different funds. In addition, expenses shown in the table do not include the expenses of the underlying funds, which are borne indirectly by the Fund. If transaction costs and indirect expenses were included, your costs would have been higher.
ACTUAL | HYPOTHETICAL (5% annual return before expenses) | Annualized | ||||||||||
| Beginning Account Value (07/01/22) | Ending Account Value (12/31/22)1 | Expenses Period2 | Ending Account Value (12/31/22) | Expenses Period2 | ||||||||
Class A | $1,000.00 | $983.10 | $2.10 | $1,023.09 | $2.14 | 0.42% | ||||||
Class C | 1,000.00 | 978.90 | 5.89 | 1,019.26 | 6.01 | 1.18 | ||||||
Class R | 1,000.00 | 981.30 | 3.40 | 1,021.78 | 3.47 | 0.68 | ||||||
Class Y | 1,000.00 | 984.50 | 0.90 | 1,024.30 | 0.92 | 0.18 | ||||||
Class R5 | 1,000.00 | 984.50 | 0.25 | 1,024.95 | 0.26 | 0.05 | ||||||
Class R6 | 1,000.00 | 984.50 | 0.25 | 1,024.95 | 0.26 | 0.05 | ||||||
| 1 | The actual ending account value is based on the actual total return of the Fund for the period July 1, 2022 through December 31, 2022, after actual expenses and will differ from the hypothetical ending account value which is based on the Fund’s expense ratio and a hypothetical annual return of 5% before expenses. |
| 2 | Expenses are equal to the Fund’s annualized expense ratio as indicated above multiplied by the average account value over the period, multiplied by 184/365 to reflect the most recent fiscal half year. |
| 21 Invesco Select Risk: Conservative Investor Fund |
Form 1099-DIV, Form 1042-S and other year–end tax information provide shareholders with actual calendar year amounts that should be included in their tax returns. Shareholders should consult their tax advisers.
The following distribution information is being provided as required by the Internal Revenue Code or to meet a specific state’s requirement.
The Fund designates the following amounts or, if subsequently determined to be different, the maximum amount allowable for its fiscal year ended December 31, 2022:
Federal and State Income Tax | ||||||||
Qualified Dividend Income* | 10.49 | % | ||||||
Corporate Dividends Received Deduction* | 6.49 | % | ||||||
U.S. Treasury Obligations* | 15.17 | % | ||||||
Qualified Business Income* | 0.00 | % | ||||||
Business Interest Income* | 48.10 | % | ||||||
| * | The above percentages are based on ordinary income dividends paid to shareholders during the Fund’s fiscal year. |
Non-Resident Alien Shareholders | ||||||||
Short-Term Capital Gain Distributions | $3,020,113 | |||||||
| 22 Invesco Select Risk: Conservative Investor Fund |
The address of each trustee and officer is AIM Growth Series (Invesco Growth Series) (the “Trust”), 11 Greenway Plaza, Suite 1000, Houston, Texas 77046-1173. The trustees serve for the life of the Trust, subject to their earlier death, incapacitation, resignation, retirement or removal as more specifically provided in the Trust’s organizational documents. Each officer serves for a one year term or until their successors are elected and qualified. Column two below includes length of time served with predecessor entities, if any.
| Name, Year of Birth and Position(s) Held with the Trust | Trustee and/or Officer Since | Principal Occupation(s) During Past 5 Years | Number of Funds in Fund Complex Overseen by Trustee | Other Directorship(s) Held by Trustee During Past 5 Years | ||||
| Interested Trustee | ||||||||
| Martin L. Flanagan1 – 1960 Trustee and Vice Chair | 2007 | Executive Director, Chief Executive Officer and President, Invesco Ltd. (ultimate parent of Invesco and a global investment management firm); Trustee and Vice Chair, The Invesco Funds; Vice Chair, Investment Company Institute; and Member of Executive Board, SMU Cox School of Business
Formerly: Advisor to the Board, Invesco Advisers, Inc. (formerly known as Invesco Institutional (N.A.), Inc.); Chairman and Chief Executive Officer, Invesco Advisers, Inc. (registered investment adviser); Director, Chairman, Chief Executive Officer and President, Invesco Holding Company (US), Inc. (formerly IVZ Inc.) (holding company), Invesco Group Services, Inc. (service provider) and Invesco North American Holdings, Inc. (holding company); Director, Chief Executive Officer and President, Invesco Holding Company Limited (parent of Invesco and a global investment management firm); Director, Invesco Ltd.; Chairman, Investment Company Institute and President, Co-Chief Executive Officer, Co-President, Chief Operating Officer and Chief Financial Officer, Franklin Resources, Inc. (global investment management organization) | 189 | None | ||||
| 1 | Mr. Flanagan is considered an interested person (within the meaning of Section 2(a)(19) of the 1940 Act) of the Trust because he is an officer of the Adviser to the Trust, and an officer and a director of Invesco Ltd., ultimate parent of the Adviser. |
| T-1 Invesco Select Risk: Conservative Investor Fund |
Trustees and Officers–(continued)
| Name, Year of Birth and Position(s) Held with the Trust | Trustee and/or Officer Since | Principal Occupation(s) During Past 5 Years | Number of Funds in Fund Complex Overseen by Trustee | Other Directorship(s) Years | ||||
| Independent Trustees | ||||||||
Beth Ann Brown – 1968 Trustee (2019) and Chair (August 2022) | 2019 | Independent Consultant
Formerly: Head of Intermediary Distribution, Managing Director, Strategic Relations, Managing Director, Head of National Accounts, Senior Vice President, National Account Manager and Senior Vice President, Key Account Manager, Columbia Management Investment Advisers LLC; Vice President, Key Account Manager, Liberty Funds Distributor, Inc.; and Trustee of certain Oppenheimer Funds | 189 | Director, Board of Directors of Caron Engineering Inc.; Advisor, Board of Advisors of Caron Engineering Inc.; President and Director, Acton Shapleigh Youth Conservation Corps (non-profit) Formerly: President and Director Director of Grahamtastic Connection (non-profit) | ||||
| Cynthia Hostetler –1962 Trustee | 2017 | Non-Executive Director and Trustee of a number of public and private business corporations
Formerly: Director, Aberdeen Investment Funds (4 portfolios); Director, Artio Global Investment LLC (mutual fund complex); Director, Edgen Group, Inc. (specialized energy and infrastructure products distributor); Director, Genesee & Wyoming, Inc. (railroads); Head of Investment Funds and Private Equity, Overseas Private Investment Corporation; President, First Manhattan Bancorporation, Inc.; and Attorney, Simpson Thacher & Bartlett LLP | 189 | Resideo Technologies, Inc. (smart home technology); Vulcan Materials Company (construction materials company); Trilinc Global Impact Fund; Textainer Group Holdings, (shipping container leasing company); Investment Company Institute (professional organization); and Independent Directors Council (professional organization) | ||||
| Eli Jones – 1961 Trustee | 2016 | Professor and Dean Emeritus, Mays Business School - Texas A&M University
Formerly: Dean of Mays Business School-Texas A&M University; Professor and Dean, Walton College of Business, University of Arkansas and E.J. Ourso College of Business, Louisiana State University; and Director, Arvest Bank | 189 | Insperity, Inc. (formerly known as Administaff) (human resources provider); and Member of Regional Board of Directors and Board of Directors, First Financial Bancorp (regional bank) | ||||
Elizabeth Krentzman – 1959 Trustee | 2019 | Formerly: Principal and Chief Regulatory Advisor for Asset Management Services and U.S. Mutual Fund Leader of Deloitte & Touche LLP; General Counsel of the Investment Company Institute (trade association); National Director of the Investment Management Regulatory Consulting Practice, Principal, Director and Senior Manager of Deloitte & Touche LLP; Assistant Director of the Division of Investment Management - Office of Disclosure and Investment Adviser Regulation of the U.S. Securities and Exchange Commission and various positions with the Division of Investment Management - Office of Regulatory Policy of the U.S. Securities and Exchange Commission; Associate at Ropes & Gray LLP; and Trustee of certain Oppenheimer Funds | 189 | Formerly: Member of the Cartica Funds Board of Directors (private investment fund); Trustee of the University of Florida National Board Foundation; and Member of the University of Florida Law Center Association, Inc. Board of Trustees, Audit Committee and Membership Committee | ||||
Anthony J. LaCava, Jr. – 1956 Trustee | 2019 | Formerly: Director and Member of the Audit Committee, Blue Hills Bank (publicly traded financial institution) and Managing Partner, KPMG LLP | 189 | Blue Hills Bank; Chairman, Bentley University; Member, Business School Advisory Council; and Nominating Committee, KPMG LLP | ||||
Prema Mathai-Davis – 1950 Trustee | 2001 | Retired
Formerly: Co-Founder & Partner of Quantalytics Research, LLC, (a FinTech Investment Research Platform for the Self-Directed Investor); Trustee of YWCA Retirement Fund; CEO of YWCA of the USA; Board member of the NY Metropolitan Transportation Authority; Commissioner of the NYC Department of Aging; and Board member of Johns Hopkins Bioethics Institute | 189 | Member of Board of Positive Planet US (non-profit) and HealthCare Chaplaincy Network (non-profit) | ||||
T-2 Invesco Select Risk: Conservative Investor Fund
Trustees and Officers–(continued)
| Name, Year of Birth and Position(s) Held with the Trust | Trustee and/or Officer Since | Principal Occupation(s) During Past 5 Years | Number of Funds in Fund Complex Overseen by Trustee | Other Directorship(s) Years | ||||
| Independent Trustees–(continued) | ||||||||
Joel W. Motley – 1952 Trustee | 2019 | Director of Office of Finance, Federal Home Loan Bank System; Managing Director of Carmona Motley Inc. (privately held financial advisor); Member of the Council on Foreign Relations and its Finance and Budget Committee; Chairman Emeritus of Board of Human Rights Watch and Member of its Investment Committee; and Member of Investment Committee Board of Historic Hudson Valley (non-profit cultural organization); Member of the Board, Blue Ocean Acquisition Corp.; and Member of the Vestry and the Investment Committee of Trinity Church Wall Street.
Formerly: Managing Director of Public Capital Advisors, LLC (privately held financial advisor); Managing Director of Carmona Motley Hoffman, Inc. (privately held financial advisor); Trustee of certain Oppenheimer Funds; and Director of Columbia Equity Financial Corp. (privately held financial advisor) | 189 | Member of Board of Trust for Mutual Understanding (non-profit promoting the arts and environment); Member of Board of Greenwall Foundation (bioethics research foundation) and its Investment Committee; Member of Board of Friends of the LRC (non-profit legal advocacy); and Board Member and Investment Committee Member of Pulitzer Center for Crisis Reporting (non-profit journalism) | ||||
Teresa M. Ressel – 1962 Trustee | 2017 | Non-executive director and trustee of a number of public and private business corporations
Formerly: Chief Executive Officer, UBS Securities LLC (investment banking); Chief Operating Officer, UBS AG Americas (investment banking); Sr. Management Team Olayan America, The Olayan Group (international investor/commercial/industrial); Assistant Secretary for Management & Budget and Designated Chief Financial Officer, U.S. Department of Treasury and Director, ON Semiconductor Corporation (semiconductor manufacturing) | 189 | None | ||||
Robert C. Troccoli – 1949 Trustee | 2016 | Retired
Formerly: Adjunct Professor, University of Denver - Daniels College of Business; and Managing Partner, KPMG LLP | 189 | None | ||||
Daniel S. Vandivort – 1954 Trustee | 2019 | President, Flyway Advisory Services LLC (consulting and property management)
Formerly: President and Chief Investment Officer, previously Head of Fixed Income, Weiss Peck and Greer/Robeco Investment Management; Trustee and Chair, Weiss Peck and Greer Funds Board; and various capacities at CS First Boston including Head of Fixed Income at First Boston Asset Management. | 189 | Formerly: Trustee and Governance Chair, Oppenheimer Funds; Treasurer, Chairman of the Audit and Finance Committee, Huntington Disease Foundation of America | ||||
T-3 Invesco Select Risk: Conservative Investor Fund
Trustees and Officers–(continued)
Name, Year of Birth and Position(s) Held with the Trust | Trustee and/or Officer Since | Principal Occupation(s) During Past 5 Years | Number of Funds in Fund Complex Overseen by Trustee | Other Directorship(s) Held by Trustee During Past 5 Years | ||||
| Officers | ||||||||
Sheri Morris – 1964 President and Principal Executive Officer | 1999 | Director, Invesco Trust Company; Head of Global Fund Services, Invesco Ltd.; President and Principal Executive Officer, The Invesco Funds; Vice President, Invesco Exchange-Traded Fund Trust, Invesco Exchange-Traded Fund Trust II, Invesco India Exchange-Traded Fund Trust, Invesco Actively Managed Exchange-Traded Fund Trust, Invesco Actively Managed Exchange-Traded Commodity Fund Trust and Invesco Exchange-Traded Self-Indexed Fund Trust; and Vice President, OppenheimerFunds, Inc.
Formerly: Vice President, Treasurer and Principal Financial Officer, The Invesco Funds; Vice President, Invesco AIM Advisers, Inc., Invesco AIM Capital Management, Inc. and Invesco AIM Private Asset Management, Inc.; Assistant Vice President and Assistant Treasurer, The Invesco Funds; Vice President and Assistant Vice President, Invesco Advisers, Inc.; Assistant Vice President, Invesco AIM Capital Management, Inc. and Invesco AIM Private Asset Management, Inc.; Treasurer, Invesco Exchange-Traded Fund Trust, Invesco Exchange-Traded Fund Trust II, Invesco India Exchange-Traded Fund Trust and Invesco Actively Managed Exchange-Traded Fund Trust; and Senior Vice President, Invesco Advisers, Inc. (formerly known as Invesco Institutional (N.A.), Inc.) (registered investment adviser) | N/A | N/A | ||||
Jeffrey H. Kupor – 1968 Senior Vice President, Chief Legal Officer and Secretary | 2018 | Head of Legal of the Americas, Invesco Ltd.; Senior Vice President and Secretary, Invesco Advisers, Inc. (formerly known as Invesco Institutional (N.A.), Inc.) (registered investment adviser); Secretary, Invesco Distributors, Inc. (formerly known as Invesco AIM Distributors, Inc.); Vice President and Secretary, Invesco Investment Services, Inc. (formerly known as Invesco AIM Investment Services, Inc.); Senior Vice President, Chief Legal Officer and Secretary, The Invesco Funds; Secretary and General Counsel, Invesco Investment Advisers LLC (formerly known as Van Kampen Asset Management); Secretary and General Counsel, Invesco Capital Markets, Inc. (formerly known as Van Kampen Funds Inc.); Chief Legal Officer, Invesco Exchange-Traded Fund Trust, Invesco Exchange-Traded Fund Trust II, Invesco India Exchange-Traded Fund Trust, Invesco Actively Managed Exchange-Traded Fund Trust, Invesco Actively Managed Exchange-Traded Commodity Fund Trust and Invesco Exchange-Traded Self-Indexed Fund Trust;; Secretary and Vice President, Harbourview Asset Management Corporation; Secretary and Vice President, OppenheimerFunds, Inc. and Invesco Managed Accounts, LLC; Secretary and Senior Vice President, OFI Global Institutional, Inc.; Secretary and Vice President, OFI SteelPath, Inc.; Secretary and Vice President, Oppenheimer Acquisition Corp.; Secretary and Vice President, Shareholder Services, Inc.; and Secretary and Vice President, Trinity Investment Management Corporation
Formerly: Senior Vice President, Invesco Distributors, Inc.; Secretary and Vice President, Jemstep, Inc.; Head of Legal, Worldwide Institutional, Invesco Ltd.; Secretary and General Counsel, INVESCO Private Capital Investments, Inc.; Senior Vice President, Secretary and General Counsel, Invesco Management Group, Inc. (formerly known as Invesco AIM Management Group, Inc.); Assistant Secretary, INVESCO Asset Management (Bermuda) Ltd.; Secretary and General Counsel, Invesco Private Capital, Inc.;Assistant Secretary and General Counsel, INVESCO Realty, Inc.; Secretary and General Counsel, Invesco Senior Secured Management, Inc.; Secretary, Sovereign G./P. Holdings Inc.; Secretary, Invesco Indexing LLC; and Secretary, W.L. Ross & Co., LLC | N/A | N/A | ||||
Andrew R. Schlossberg – 1974 Senior Vice President | 2019 | Senior Vice President, Invesco Group Services, Inc.; Head of the Americas and Senior Managing Director, Invesco Ltd.; Director and Senior Vice President, Invesco Advisers, Inc. (formerly known as Invesco Institutional (N.A.), Inc.) (registered investment adviser); Director and Chairman, Invesco Investment Services, Inc. (formerly known as Invesco AIM Investment Services, Inc.) (registered transfer agent); Senior Vice President, The Invesco Funds; and Director, Invesco Investment Advisers LLC (formerly known as Van Kampen Asset Management)
Formerly: Director, President and Chairman, Invesco Insurance Agency, Inc.; Director, Invesco UK Limited; Director and Chief Executive, Invesco Asset Management Limited and Invesco Fund Managers Limited; Assistant Vice President, The Invesco Funds; Senior Vice President, Invesco Advisers, Inc. (formerly known as Invesco Institutional (N.A.), Inc.) (registered investment adviser); Director and Chief Executive, Invesco Administration Services Limited and Invesco Global Investment Funds Limited; Director, Invesco Distributors, Inc.; Head of EMEA, Invesco Ltd.; President, Invesco Actively Managed Exchange-Traded Commodity Fund Trust, Invesco Actively Managed Exchange-Traded Fund Trust, Invesco Exchange-Traded Fund Trust, Invesco Exchange-Traded Fund Trust II and Invesco India Exchange-Traded Fund Trust; and Managing Director and Principal Executive Officer, Invesco Capital Management LLC | N/A | N/A |
T-4 Invesco Select Risk: Conservative Investor Fund
Trustees and Officers–(continued)
Name, Year of Birth and Position(s) Held with the Trust | Trustee and/or Officer Since | Principal Occupation(s) During Past 5 Years | Number of Funds in Fund Complex Overseen by Trustee | Other Directorship(s) Held by Trustee During Past 5 Years | ||||
| Officers–(continued) | ||||||||
John M. Zerr – 1962 Senior Vice President | 2006 | Chief Operating Officer of the Americas; Senior Vice President, Invesco Advisers, Inc. (formerly known as Invesco Institutional (N.A.), Inc.) (registered investment adviser); Senior Vice President, Invesco Distributors, Inc. (formerly known as Invesco AIM Distributors, Inc.); Director and Vice President, Invesco Investment Services, Inc. (formerly known as Invesco AIM Investment Services, Inc.) Senior Vice President, The Invesco Funds; Managing Director, Invesco Capital Management LLC; Director, Invesco Investment Advisers LLC (formerly known as Van Kampen Asset Management); Senior Vice President, Invesco Capital Markets, Inc. (formerly known as Van Kampen Funds Inc.); Manager, Invesco Indexing LLC; Manager, Invesco Specialized Products, LLC; Member, Invesco Canada Funds Advisory Board; Director, President and Chief Executive Officer, Invesco Corporate Class Inc. (corporate mutual fund company); and Director, Chairman, President and Chief Executive Officer, Invesco Canada Ltd. (formerly known as Invesco Trimark Ltd./Invesco Trimark Ltèe) (registered investment adviser and registered transfer agent); President, Invesco, Inc.; President, Invesco Global Direct Real Estate Feeder GP Ltd.; President, Invesco IP Holdings (Canada) Ltd; President, Invesco Global Direct Real Estate GP Ltd.; President, Invesco Financial Services Ltd. / Services Financiers Invesco Ltée; and Director and Chairman, Invesco Trust Company
Formerly: President, Trimark Investments Ltd/Services Financiers Invesco Ltee; Director and Senior Vice President, Invesco Insurance Agency, Inc.; Director and Senior Vice President, Invesco Management Group, Inc. (formerly known as Invesco AIM Management Group, Inc.); Secretary and General Counsel, Invesco Management Group, Inc. (formerly known as Invesco AIM Management Group, Inc.); Secretary, Invesco Investment Services, Inc. (formerly known as Invesco AIM Investment Services, Inc.); Chief Legal Officer and Secretary, The Invesco Funds; Secretary and General Counsel, Invesco Investment Advisers LLC (formerly known as Van Kampen Asset Management); Secretary and General Counsel, Invesco Capital Markets, Inc. (formerly known as Van Kampen Funds Inc.); Chief Legal Officer, Invesco Exchange-Traded Fund Trust, Invesco Exchange-Traded Fund Trust II, Invesco India Exchange-Traded Fund Trust, Invesco Actively Managed Exchange-Traded Fund Trust, Invesco Actively Managed Exchange-Traded Commodity Fund Trust and Invesco Exchange-Traded Self-Indexed Fund Trust; Secretary, Invesco Indexing LLC; Director, Secretary, General Counsel and Senior Vice President, Van Kampen Exchange Corp.; Director, Vice President and Secretary, IVZ Distributors, Inc. (formerly known as INVESCO Distributors, Inc.); Director and Vice President, INVESCO Funds Group, Inc.; Director and Vice President, Van Kampen Advisors Inc.; Director, Vice President, Secretary and General Counsel, Van Kampen Investor Services Inc.;Director and Secretary, Invesco Distributors, Inc. (formerly known as Invesco AIM Distributors, Inc.); Director, Senior Vice President, General Counsel and Secretary, Invesco AIM Advisers, Inc. and Van Kampen Investments Inc.; Director, Vice President and Secretary, Fund Management Company; Director, Senior Vice President, Secretary, General Counsel and Vice President, Invesco AIM Capital Management, Inc.; and Chief Operating Officer and General Counsel, Liberty Ridge Capital, Inc. (an investment adviser) | N/A | N/A | ||||
Gregory G. McGreevey - 1962 Senior Vice President | 2012 | Senior Managing Director, Invesco Ltd.; Director, Chairman, President, and Chief Executive Officer, Invesco Advisers, Inc. (formerly known as Invesco Institutional (N.A.), Inc.) (registered investment adviser); Director, Invesco Mortgage Capital, Inc. and Invesco Senior Secured Management, Inc.; Senior Vice President, The Invesco Funds; President, SNW Asset Management Corporation and Invesco Managed Accounts, LLC; Chairman and Director, Invesco Private Capital, Inc.; Chairman and Director, INVESCO Private Capital Investments, Inc.; Chairman and Director, INVESCO Realty, Inc.; and Senior Vice President, Invesco Group Services, Inc.
Formerly: Senior Vice President, Invesco Management Group, Inc. and Invesco Advisers, Inc.; Assistant Vice President, The Invesco Funds | N/A | N/A | ||||
Adrien Deberghes- 1967 Principal Financial Officer, Treasurer and Vice President | 2020 | Head of the Fund Office of the CFO and Fund Administration; Vice President, Invesco Advisers, Inc.; Principal Financial Officer, Treasurer and Vice President, The Invesco Funds; Vice President, Invesco Exchange-Traded Fund Trust, Invesco Exchange-Traded Fund Trust II, Invesco India Exchange-Traded Fund Trust, Invesco Actively Managed Exchange-Traded Fund Trust, Invesco Actively Managed Exchange-Traded Commodity Fund Trust and Invesco Exchange-Traded Self-Indexed Fund Trust
Formerly: Senior Vice President and Treasurer, Fidelity Investments | N/A | N/A | ||||
Crissie M. Wisdom – 1969 Anti-Money Laundering Compliance Officer | 2013 | Anti-Money Laundering and OFAC Compliance Officer for Invesco U.S. entities including: Invesco Advisers, Inc. and its affiliates, Invesco Capital Markets, Inc., Invesco Distributors, Inc., Invesco Investment Services, Inc., The Invesco Funds, Invesco Capital Management, LLC, Invesco Trust Company; and Fraud Prevention Manager for Invesco Investment Services, Inc. | N/A | N/A |
T-5 Invesco Select Risk: Conservative Investor Fund
Trustees and Officers–(continued)
Name, Year of Birth and Position(s) Held with the Trust | Trustee and/or Officer Since | Principal Occupation(s) During Past 5 Years | Number of Funds in Fund Complex Overseen by Trustee | Other Directorship(s) Held by Trustee During Past 5 Years | ||||
| Officers–(continued) | ||||||||
Todd F. Kuehl – 1969 Chief Compliance Officer and Senior Vice President | 2020 | Chief Compliance Officer, Invesco Advisers, Inc. (registered investment adviser); and Chief Compliance Officer and Senior Vice President, The Invesco Funds
Formerly: Managing Director and Chief Compliance Officer, Legg Mason (Mutual Funds); Chief Compliance Officer, Legg Mason Private Portfolio Group (registered investment adviser) | N/A | N/A | ||||
James Bordewick, Jr. – 1959 Senior Vice President and Senior Officer | 2022 | Senior Vice President and Senior Officer, The Invesco Funds
Formerly: Chief Legal Officer, KingsCrowd, Inc. (research and analytical platform for investment in private capital markets); Chief Operating Officer and Head of Legal and Regulatory, Netcapital (private capital investment platform); Managing Director, General Counsel of asset management and Chief Compliance Officer for asset management and private banking, Bank of America Corporation; Chief Legal Officer, Columbia Funds and BofA Funds;
Senior Vice President and Associate General Counsel, MFS Investment Management; Chief Legal Officer, MFS Funds; Associate, Ropes & Gray; and Associate, Gaston Snow & Ely Bartlett | N/A | N/A |
The Statement of Additional Information of the Trust includes additional information about the Fund’s Trustees and is available upon request, without charge, by calling 1.800.959.4246. Please refer to the Fund’s Statement of Additional Information for information on the Fund’s sub-advisers.
| Office of the Fund | Investment Adviser | Distributor | Auditors | |||
| 11 Greenway Plaza, Suite 1000 | Invesco Advisers, Inc. | Invesco Distributors, Inc. | PricewaterhouseCoopers LLP | |||
| Houston, TX 77046-1173 | 1555 Peachtree Street, N.E. | 11 Greenway Plaza, Suite 1000 | 1000 Louisiana Street, Suite 5800 | |||
| Atlanta, GA 30309 | Houston, TX 77046-1173 | Houston, TX 77002-5021 | ||||
| Counsel to the Fund | Counsel to the Independent Trustees | Transfer Agent | Custodian | |||
| Stradley Ronon Stevens & Young, LLP | Sidley Austin LLP | Invesco Investment Services, Inc. | State Street Bank and Trust Company | |||
| 2005 Market Street, Suite 2600 | 787 Seventh Avenue | 11 Greenway Plaza, Suite 1000 | 225 Franklin Street | |||
| Philadelphia, PA 19103-7018 | New York, NY 10019 | Houston, TX 77046-1173 | Boston, MA 02110-2801 | |||
T-6 Invesco Select Risk: Conservative Investor Fund
(This page intentionally left blank)
(This page intentionally left blank)
(This page intentionally left blank)

Go paperless with eDelivery
Visit invesco.com/edelivery to enjoy the convenience and security of anytime electronic access to your investment documents.
With eDelivery, you can elect to have any or all of the following materials delivered straight to your inbox to download, save and print from your own computer:
∎ Fund reports and prospectuses
∎ Quarterly statements
∎ Daily confirmations
∎ Tax forms
Invesco mailing information
Send general correspondence to Invesco Investment Services, Inc., P.O. Box 219078, Kansas City, MO 64121-9078.
Important notice regarding delivery of security holder documents
To reduce Fund expenses, only one copy of most shareholder documents may be mailed to shareholders with multiple accounts at the same address (Householding). Mailing of your shareholder documents may be householded indefinitely unless you instruct us otherwise. If you do not want the mailing of these documents to be combined with those for other members of your household, please contact Invesco Investment Services, Inc. at 800 959 4246 or contact your financial institution. We will begin sending you individual copies for each account within 30 days after receiving your request.
Fund holdings and proxy voting information
The Fund provides a complete list of its portfolio holdings four times each year, at the end of each fiscal quarter. For the second and fourth quarters, the list appears, respectively, in the Fund’s semiannual and annual reports to shareholders. For the first and third quarters, the Fund files the list with the Securities and Exchange Commission (SEC) as an exhibit to its reports on Form N-PORT. The most recent list of portfolio holdings is available at invesco.com/completeqtrholdings. Shareholders can also look up the Fund’s Form N-PORT filings on the SEC website, sec.gov. The SEC file numbers for the Fund are shown below.
A description of the policies and procedures that the Fund uses to determine how to vote proxies relating to portfolio securities is available without charge, upon request, from our Client Services department at 800 959 4246, or at invesco.com/ corporate/about-us/esg. The information is also available on the SEC website, sec.gov.
Information regarding how the Fund voted proxies related to its portfolio securities during the most recent 12-month period ended June 30 is available at invesco.com/proxysearch. This information is also available on the SEC website, sec.gov.
Invesco Advisers, Inc. is an investment adviser; it provides investment advisory services to individual and institutional clients and does not sell securities. Invesco Distributors, Inc. is the US distributor for Invesco Ltd.’s retail mutual funds, exchange-traded funds and institutional money market funds. Both are wholly owned, indirect subsidiaries of Invesco Ltd.
SEC file number(s): 811-02699 and 002-57526 | Invesco Distributors, Inc. | O-OPSCI-AR-1 |

| Annual Report to Shareholders | December 31, 2022 | |
Invesco Select Risk: Growth Investor Fund
A: AADAX ∎ C: AADCX ∎ R: AADRX ∎ S: AADSX ∎ Y: AADYX ∎ R5: AADIX ∎ R6: AAESX
Management’s Discussion of Fund Performance
For the fiscal year ended December 31, 2022, Class A shares of Invesco Select Risk: Growth Investor Fund (the Fund), at net asset value (NAV), underperformed the Custom Invesco Select Risk: Growth Investor Index. |
| |||
Your Fund’s long-term performance appears later in this report. | ||||
Fund vs. Indexes | ||||
Total returns, 12/31/21 to 12/31/22, at net asset value (NAV). Performance shown does not include applicable contingent deferred sales charges (CDSC) or front-end sales charges, which would have reduced performance. |
| |||
Class A Shares | -18.79 | % | ||
Class C Shares | -19.42 | |||
Class R Shares | -19.04 | |||
Class S Shares | -18.68 | |||
Class Y Shares | -18.59 | |||
Class R5 Shares | -18.57 | |||
Class R6 Shares | -18.57 | |||
Bloomberg Global Aggregate USD Hedged Index▼ | -11.22 | |||
MSCI All Country World Index▼ | -18.36 | |||
Custom Invesco Select Risk: Growth Investor Index∎ | -16.81 | |||
Source(s): ▼RIMES Technologies Corp.; ∎Invesco, RIMES Technologies Corp. | ||||
Market conditions and your Fund
Global equity markets declined in the first half of 2022 amid volatility sparked by Russia’s invasion of Ukraine, rising commodity prices, rampant global inflation and central banks shifting toward tighter monetary policy. Russia’s invasion exacerbated inflationary pressures, disrupting already strained supply chains, and increasing shortages of oil, gas and raw materials, with the price of oil rising sharply.
Inflation headwinds continued into the third quarter of 2022. The US Federal Reserve (the Fed), the European Central Bank and the Bank of England all raised interest rates. In contrast, the People’s Bank of China lowered its policy rate and the Bank of Japan kept rates the same. Emerging market equities, hampered by the strong US dollar, underperformed developed market equities.
Global equity markets posted gains for the fourth quarter of 2022, after better inflation data sparked a rally in October and November. However, investor sentiment worsened in December after central banks signaled continued interest rate hikes into 2023 as inflation remained above target levels. International stocks outperformed US stocks in the fourth quarter, led by results in Europe and the UK. Emerging market equities also posted gains for the fourth quarter of 2022, boosted by China, which eased its zero-COVID-19 policy and started to reopen even as COVID-19 infections surged.
Despite the rebound in the fourth quarter of 2022, at the end of the fiscal year ended December 31, 2022, trailing one-year returns for developed market equities and emerging market equities were both in negative territory.
Strategic asset class exposures in the Fund are obtained through underlying representative
mutual funds and exchange-traded funds targeting pre-defined risk levels. From an absolute Fund performance perspective, an allocation to variable rate fixed income was slightly additive to performance and leading contributor to absolute return. The remaining allocations to equity, fixed income and alternative assets were all detractors from absolute performance as the portfolio produced a negative return for the fiscal year.
From a relative Fund performance perspective, the portfolio underperformed its custom benchmark, the Custom Invesco Select Risk: Growth Investor Index, during the fiscal year. Fund underperformance was driven mainly by manager selection within the equity allocations. Within the equity allocation, the Invesco Global Fund, Invesco Discovery Mid Cap Growth Fund and Invesco International Small-Mid Company Fund were the primary detractors.
Conversely, allocations to other fixed income funds and allocations to style-specific equities were the leading contributors to relative performance during the fiscal year. Within the allocations, the Invesco S&P 500 Low Volatility ETF and Invesco Russell 1000 Dynamic Multifactor ETF were the leading contributors to relative performance.
Please note that some of the Fund’s underlying funds use derivatives, including futures and total return swaps, which may create economic leverage in the underlying funds. Therefore, some of the performance of the strategy, both positive and negative, can be attributed to these instruments. Derivatives can be a cost-effective way to gain exposure to asset classes. However, derivatives may amplify traditional investment risks through the creation of leverage and may be less liquid than traditional securities.
Thank you for your continued investment in the Invesco Select Risk: Growth Investor Fund.
Portfolio manager(s):
Jeffrey Bennett
Jacob Borbidge
Duy Nguyen
The views and opinions expressed in management’s discussion of Fund performance are those of Invesco Advisers, Inc. and its affiliates. These views and opinions are subject to change at any time based on factors such as market and economic conditions. These views and opinions may not be relied upon as investment advice or recommendations, or as an offer for a particular security. The information is not a complete analysis of every aspect of any market, country, industry, security or the Fund. Statements of fact are from sources considered reliable, but Invesco Advisers, Inc. makes no representation or warranty as to their completeness or accuracy. Although historical performance is no guarantee of future results, these insights may help you understand our investment management philosophy.
See important Fund and, if applicable, index disclosures later in this report.
| 2 | Invesco Select Risk: Growth Investor Fund |
Your Fund’s Long-Term Performance
Results of a $10,000 Investment – Oldest Share Class(es)
Fund and index data from 12/31/12
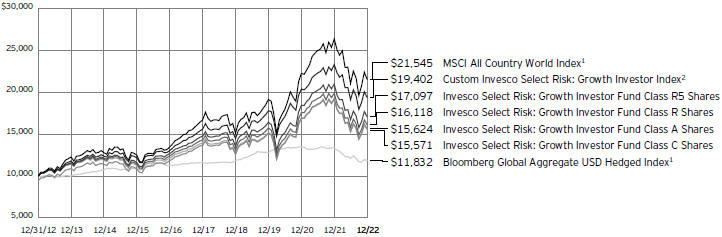
1 Source: RIMES Technologies Corp.
2 Source: Invesco, RIMES Technologies Corp.
Past performance cannot guarantee future results.
The data shown in the chart include reinvested distributions, applicable sales charges and Fund expenses including management
fees. Index results include reinvested dividends, but they do not reflect sales charges. Performance of the peer group, if applicable, reflects fund expenses and management fees;
performance of a market index does not. Performance shown in the chart does not reflect deduction of taxes a shareholder would pay on Fund distributions or sale of Fund shares.
| 3 | Invesco Select Risk: Growth Investor Fund |
Average Annual Total Returns |
| |||
As of 12/31/22, including maximum applicable sales charges |
| |||
Class A Shares | ||||
Inception (4/30/04) | 4.90 | % | ||
10 Years | 4.56 | |||
5 Years | 1.53 | |||
1 Year | -23.26 | |||
Class C Shares | ||||
Inception (4/30/04) | 4.89 | % | ||
10 Years | 4.53 | |||
5 Years | 1.90 | |||
1 Year | -20.19 | |||
Class R Shares | ||||
Inception (4/30/04) | 4.96 | % | ||
10 Years | 4.89 | |||
5 Years | 2.41 | |||
1 Year | -19.04 | |||
Class S Shares | ||||
Inception (9/25/09) | 6.38 | % | ||
10 Years | 5.26 | |||
5 Years | 2.78 | |||
1 Year | -18.68 | |||
Class Y Shares | ||||
Inception (10/3/08) | 6.23 | % | ||
10 Years | 5.41 | |||
5 Years | 2.92 | |||
1 Year | -18.59 | |||
Class R5 Shares | ||||
Inception (4/30/04) | 5.56 | % | ||
10 Years | 5.51 | |||
5 Years | 2.98 | |||
1 Year | -18.57 | |||
Class R6 Shares | ||||
10 Years | 5.36 | % | ||
5 Years | 3.01 | |||
1 Year | -18.57 | |||
Class R6 shares incepted on April 4, 2017. Performance shown prior to that date is that of Class A shares and includes the 12b-1 fees applicable to Class A shares.
The performance data quoted represent past performance and cannot guarantee future results; current performance may be lower or higher. Please visit invesco.com/performance for the most recent month-end performance. Performance figures reflect reinvested distributions, changes in net asset value and the effect of the maximum sales charge unless otherwise stated. Performance figures do not reflect deduction of taxes a shareholder would pay on Fund distributions or sale of Fund shares. Investment return and principal value will fluctuate so that you may have a gain or loss when you sell shares.
Class A share performance reflects the maximum 5.50% sales charge, and Class C share performance reflects the applicable contingent deferred sales charge (CDSC) for the period involved. The CDSC on Class C shares is 1% for the first year after purchase. Class R, Class S, Class Y, Class R5 and Class R6 shares do not have
a front-end sales charge or a CDSC; therefore, performance is at net asset value.
The performance of the Fund’s share classes will differ primarily due to different sales charge structures and class expenses.
Fund performance reflects any applicable fee waivers and/or expense reimbursements. Had the adviser not waived fees and/or reimbursed expenses currently or in the past, returns would have been lower. See current prospectus for more information.
| 4 | Invesco Select Risk: Growth Investor Fund |
Invesco Select Risk: Growth Investor Fund’s investment objective is long-term growth of capital consistent with a higher level of risk relative to the broad stock market.
| ∎ | Unless otherwise stated, information presented in this report is as of December 31, 2022, and is based on total net assets. |
| ∎ | Unless otherwise noted, all data is provided by Invesco. |
| ∎ | To access your Fund’s reports/prospectus, visit invesco.com/fundreports. |
About indexes used in this report
| ∎ | The Bloomberg Global Aggregate USD Hedged Index tracks fixed-income performance of regions around the world while hedging the currency back to the US dollar. |
| ∎ | The Custom Invesco Select Risk: Growth Investor Index is composed of 80% MSCI All Country World Index and 20% Bloomberg Global Aggregate USD Hedged Index. |
| ∎ | The MSCI All Country World Index is an unmanaged index considered representative of large- and mid-cap stocks across developed and emerging markets. The index is computed using the net return, which withholds applicable taxes for non-resident investors. |
| ∎ | The Fund is not managed to track the performance of any particular index, including the index(es) described here, and consequently, the performance of the Fund may deviate significantly from the performance of the index(es). |
| ∎ | A direct investment cannot be made in an index. Unless otherwise indicated, index results include reinvested dividends, and they do not reflect sales charges. Performance of the peer group, if applicable, reflects fund expenses; performance of a market index does not. |
This report must be accompanied or preceded by a currently effective Fund prospectus, which contains more complete information, including sales charges and expenses. Investors should read it carefully before investing. |
| NOT FDIC INSURED | MAY LOSE VALUE | NO BANK GUARANTEE |
| 5 | Invesco Select Risk: Growth Investor Fund |
Fund Information
Portfolio Composition*
| By fund type | % of total investments | ||||
Equity Funds | 77.82 | % | |||
Fixed Income Funds | 16.46 | ||||
Alternative Funds | 4.66 | ||||
Money Market Funds | 1.06 | ||||
| * | Based on the Schedule of Investments, which classifies each underlying fund and other investments into broad asset classes based on their predominant investments. |
The Fund’s holdings are subject to change, and there is no assurance that the Fund will continue to hold any particular security. Data presented here are as of December 31, 2022.
| 6 | Invesco Select Risk: Growth Investor Fund |
December 31, 2022
Invesco Select Risk: Growth Investor Fund
Schedule of Investments in Affiliated Issuers–100.04%(a)
| % of | Change in | |||||||||||||||||||||||||||||||||
| Net | Unrealized | |||||||||||||||||||||||||||||||||
| Assets | Value | Purchases | Proceeds | Appreciation | Realized | Dividend | Shares | Value | ||||||||||||||||||||||||||
| 12/31/22 | 12/31/21 | at Cost | from Sales | (Depreciation) | Gain (Loss) | Income | 12/31/22 | 12/31/22 | ||||||||||||||||||||||||||
Alternative Funds–4.68% |
| |||||||||||||||||||||||||||||||||
Invesco Global Real Estate Income Fund, Class R6(b) | 2.37% | $ | 20,997,007 | $ | 7,219,682 | $ | (1,557,175 | ) | $ | (5,633,022 | ) | $ | 87,509 | $ | 343,202 | 2,702,431 | $ 20,916,820 | |||||||||||||||||
Invesco Macro Allocation Strategy Fund, Class R6(c) | 2.31% | 36,517,511 | 1,165,096 | (13,644,644 | ) | (1,987,919 | ) | (1,627,393 | ) | – | 2,715,778 | 20,422,651 | ||||||||||||||||||||||
Total Alternative Funds | 57,514,518 | 8,384,778 | (15,201,819 | ) | (7,620,941 | ) | (1,539,884 | ) | 343,202 | 41,339,471 | ||||||||||||||||||||||||
Domestic Equity Funds–43.87% |
| |||||||||||||||||||||||||||||||||
Invesco Discovery Mid Cap Growth Fund, Class R6(c) | 5.88% | 100,403,223 | 13,116,554 | (33,921,323 | ) | (21,560,885 | ) | (6,186,230 | ) | – | 2,048,650 | 51,851,339 | ||||||||||||||||||||||
Invesco Main Street Small Cap Fund, Class R6 | 6.13% | 94,165,710 | 330,684 | (27,704,310 | ) | (16,975,896 | ) | 4,285,316 | 330,684 | 3,024,120 | 54,101,504 | |||||||||||||||||||||||
Invesco Russell 1000® Dynamic Multifactor ETF | 11.93% | 81,758,365 | 50,862,827 | (10,188,853 | ) | (17,103,228 | ) | (46,586 | ) | 1,533,693 | 2,451,852 | 105,282,525 | ||||||||||||||||||||||
Invesco S&P 500® Low Volatility ETF | 8.17% | 73,597,577 | 13,520,723 | (9,193,824 | ) | (6,363,551 | ) | 526,965 | 1,509,255 | 1,128,136 | 72,087,890 | |||||||||||||||||||||||
Invesco S&P 500® Pure Growth ETF(d) | 5.15% | 53,983,623 | 15,737,586 | (8,267,074 | ) | (15,854,027 | ) | (146,065 | ) | 339,505 | 299,809 | 45,454,043 | ||||||||||||||||||||||
Invesco S&P SmallCap Low Volatility ETF | 3.45% | 85,222,001 | 1,239,316 | (46,748,931 | ) | (21,906,339 | ) | 12,635,847 | 1,028,987 | 681,713 | 30,441,894 | |||||||||||||||||||||||
Invesco Value Opportunities Fund, Class R6 | 3.16% | – | 34,080,863 | (4,032,822 | ) | (1,909,512 | ) | 1,987,217 | 284,499 | 1,743,741 | 27,864,983 | |||||||||||||||||||||||
Total Domestic Equity Funds | 489,130,499 | 128,888,553 | (140,057,137 | ) | (101,673,438 | ) | 13,056,464 | 5,026,623 | 387,084,178 | |||||||||||||||||||||||||
Fixed Income Funds–16.55% |
| |||||||||||||||||||||||||||||||||
Invesco 1-30 Laddered Treasury ETF | 1.96% | 22,630,530 | 1,854,067 | (2,510,296 | ) | (4,534,837 | ) | (141,533 | ) | 338,654 | 602,086 | 17,297,931 | ||||||||||||||||||||||
Invesco Core Plus Bond Fund, Class R6 | 7.35% | 83,568,140 | 9,093,142 | (13,391,937 | ) | (11,632,916 | ) | (2,776,414 | ) | 2,489,564 | 7,119,650 | 64,860,015 | ||||||||||||||||||||||
Invesco Income Fund, Class R6 | 1.03% | 19,501,163 | 876,471 | (9,569,258 | ) | (1,771,403 | ) | 77,078 | 425,558 | 1,330,518 | 9,114,051 | |||||||||||||||||||||||
Invesco Master Loan Fund, Class R6 | 0.76% | – | 7,867,746 | (720,537 | ) | (375,286 | ) | (38,456 | ) | 391,251 | 444,307 | 6,733,467 | ||||||||||||||||||||||
Invesco Senior Floating Rate Fund, Class R6 | 0.95% | – | 10,787,388 | (1,632,867 | ) | (650,881 | ) | (100,855 | ) | 603,861 | 1,290,750 | 8,402,785 | ||||||||||||||||||||||
Invesco Taxable Municipal Bond ETF(d) | 3.56% | 41,940,018 | 5,305,489 | (6,726,892 | ) | (7,875,276 | ) | (1,289,068 | ) | 1,093,308 | 1,219,536 | 31,354,271 | ||||||||||||||||||||||
Invesco Variable Rate Investment Grade ETF | 0.94% | 10,964,051 | 512,389 | (3,056,003 | ) | (136,953 | ) | (9,958 | ) | 211,937 | 334,825 | 8,273,526 | ||||||||||||||||||||||
Total Fixed Income Funds | 178,603,902 | 36,296,692 | (37,607,790 | ) | (26,977,552 | ) | (4,279,206 | ) | 5,554,133 | 146,036,046 | ||||||||||||||||||||||||
Foreign Equity Funds–34.38% |
| |||||||||||||||||||||||||||||||||
Invesco EQV Emerging Markets All Cap Fund, Class R6(e) | 3.55% | 35,943,960 | 5,042,630 | (2,861,453 | ) | (5,701,400 | ) | (1,076,616 | ) | 500,726 | 1,013,486 | 31,347,121 | ||||||||||||||||||||||
Invesco Developing Markets Fund, Class R6 | 3.92% | 58,510,292 | 12,548,305 | (22,772,163 | ) | (3,705,910 | ) | (10,022,585 | ) | 422,496 | 989,632 | 34,557,939 | ||||||||||||||||||||||
Invesco Global Fund, Class R6 | 11.10% | 125,308,070 | 37,833,901 | (12,924,086 | ) | (48,861,038 | ) | 8,664,708 | (67 | ) | 1,293,772 | 97,964,429 | ||||||||||||||||||||||
Invesco Global Infrastructure Fund, Class R6 | 0.97% | 11,842,646 | 180,999 | (2,442,216 | ) | (1,295,305 | ) | 296,499 | 180,999 | 738,608 | 8,582,623 | |||||||||||||||||||||||
Invesco International Select Equity Fund, Class R6 | 1.71% | 39,560,007 | 2,135,453 | (17,613,984 | ) | (7,258,686 | ) | (1,791,379 | ) | 150,364 | 1,659,096 | 15,031,411 | ||||||||||||||||||||||
Invesco International Small-Mid Company Fund, Class R6 | 3.58% | 43,711,969 | 6,287,830 | (4,910,297 | ) | (12,027,879 | ) | (1,390,195 | ) | 134,879 | 808,806 | 31,583,865 | ||||||||||||||||||||||
Invesco RAFI™ Strategic Developed ex-US ETF | 4.71% | 32,423,086 | 18,374,557 | (4,530,343 | ) | (4,965,323 | ) | 279,452 | 1,230,067 | 1,548,082 | 41,581,429 | |||||||||||||||||||||||
Invesco S&P Emerging Markets Low Volatility ETF | 3.84% | 25,738,837 | 16,707,739 | (5,394,456 | ) | (3,923,767 | ) | 764,986 | 1,057,559 | 1,472,983 | 33,893,339 | |||||||||||||||||||||||
Invesco S&P International Developed Low Volatility ETF | 1.00% | 34,156,890 | 233,058 | (23,298,716 | ) | (4,239,021 | ) | 1,959,453 | 569,931 | 329,039 | 8,811,664 | |||||||||||||||||||||||
Total Foreign Equity Funds | 407,195,757 | 99,344,472 | (96,747,714 | ) | (91,978,329 | ) | (2,315,677 | ) | 4,246,954 | 303,353,820 | ||||||||||||||||||||||||
Money Market Funds–0.56% |
| |||||||||||||||||||||||||||||||||
Invesco Government & Agency Portfolio, Institutional Class, 4.22%(f) | 0.20% | 1,820,180 | 37,081,825 | (37,197,930 | ) | – | – | 15,368 | 1,704,075 | 1,704,075 | ||||||||||||||||||||||||
See accompanying Notes to Financial Statements which are an integral part of the financial statements.
| 7 | Invesco Select Risk: Growth Investor Fund |
Invesco Select Risk: Growth Investor Fund (continued)
Schedule of Investments in Affiliated Issuers–100.04%(a)
| % of | Change in | |||||||||||||||||||||||||||||||||||
| Net | Unrealized | |||||||||||||||||||||||||||||||||||
| Assets | Value | Purchases | Proceeds | Appreciation | Realized | Dividend | Shares | Value | ||||||||||||||||||||||||||||
| 12/31/22 | 12/31/21 | at Cost | from Sales | (Depreciation) | Gain (Loss) | Income | 12/31/22 | 12/31/22 | ||||||||||||||||||||||||||||
| ||||||||||||||||||||||||||||||||||||
Money Market Funds–(continued) |
| |||||||||||||||||||||||||||||||||||
Invesco Liquid Assets Portfolio, Institutional Class, 4.42%(f) | 0.14% | $ | 1,368,752 | $ | 26,487,018 | $ | (26,607,801 | ) | $ | 126 | $ | 634 | $ | 14,519 | 1,248,355 | $ | 1,248,729 | |||||||||||||||||||
| ||||||||||||||||||||||||||||||||||||
Invesco Treasury Portfolio, Institutional Class, 4.20%(f) | 0.22% | 2,080,205 | 42,379,229 | (42,511,920 | ) | – | – | 20,925 | 1,947,514 | 1,947,514 | ||||||||||||||||||||||||||
| ||||||||||||||||||||||||||||||||||||
Total Money Market Funds | 5,269,137 | 105,948,072 | (106,317,651 | ) | 126 | 634 | 50,812 | 4,900,318 | ||||||||||||||||||||||||||||
| ||||||||||||||||||||||||||||||||||||
TOTAL INVESTMENTS IN AFFILIATED ISSUERS (excluding investments purchased with cash collateral from securities on loan) (Cost $911,926,670) | 100.04% | 1,137,713,813 | 378,862,567 | (395,932,111 | ) | (228,250,134 | ) | 4,922,331 | 15,221,724 | 882,713,833 | ||||||||||||||||||||||||||
| ||||||||||||||||||||||||||||||||||||
Investments Purchased with Cash Collateral from Securities on Loan | ||||||||||||||||||||||||||||||||||||
Money Market Funds–0.51% |
| |||||||||||||||||||||||||||||||||||
Invesco Private Government Fund, 4.28%(f)(g) | 0.14% | 2,048,942 | 117,333,035 | (118,117,220 | ) | – | – | 16,619 | (h) | 1,264,757 | 1,264,757 | |||||||||||||||||||||||||
| ||||||||||||||||||||||||||||||||||||
Invesco Private Prime Fund, 4.46%(f)(g) | 0.37% | 4,780,865 | 265,937,394 | (267,467,910 | ) | – | 1,882 | 46,924 | (h) | 3,252,231 | 3,252,231 | |||||||||||||||||||||||||
| ||||||||||||||||||||||||||||||||||||
Total Investments Purchased with Cash Collateral from Securities on Loan (Cost $4,516,988) | 0.51% | 6,829,807 | 383,270,429 | (385,585,130 | ) | – | 1,882 | 63,543 | 4,516,988 | |||||||||||||||||||||||||||
| ||||||||||||||||||||||||||||||||||||
TOTAL INVESTMENTS IN AFFILIATED ISSUERS (Cost $916,443,658) | 100.55% | $ | 1,144,543,620 | $ | 762,132,996 | $ | (781,517,241 | ) | $ | (228,250,134 | ) | $ | 4,924,213 | (i) | $ | 15,285,267 | $ | 887,230,821 | ||||||||||||||||||
| ||||||||||||||||||||||||||||||||||||
OTHER ASSETS LESS LIABILITIES | (0.55)% | (4,859,411 | ) | |||||||||||||||||||||||||||||||||
| ||||||||||||||||||||||||||||||||||||
NET ASSETS | 100.00% | $ | 882,371,410 | |||||||||||||||||||||||||||||||||
| ||||||||||||||||||||||||||||||||||||
Investment Abbreviations:
ETF - Exchange-Traded Fund
Notes to Schedule of Investments:
| (a) | Each underlying fund and the Fund are affiliated by either having the same investment adviser or an investment adviser under common control with the Fund’s investment adviser. |
| (b) | Amounts include a return of capital distribution reclassification which reduces dividend income and increases realized gain (loss) and/or change in unrealized appreciation (depreciation). |
| (c) | Non-income producing security. |
| (d) | All or a portion of this security was out on loan at December 31, 2022. |
| (e) | Effective February 28, 2022, the underlying fund’s name changed. |
| (f) | The rate shown is the 7-day SEC standardized yield as of December 31, 2022. |
| (g) | The security has been segregated to satisfy the commitment to return the cash collateral received in securities lending transactions upon the borrower’s return of the securities loaned. See Note 1H. |
| (h) | Represents the income earned on the investment of cash collateral, which is included in securities lending income on the Statement of Operations. Does not include rebates and fees paid to lending agent or premiums received from borrowers, if any. |
| (i) | Includes capital gains distributions from affiliated underlying funds as follows: |
| Fund Name | Capital Gain | |
Invesco Global Fund | $12,057,126 | |
Invesco International Small-Mid Company Fund | 87,563 | |
Invesco Value Opportunities Fund | 2,260,763 |
See accompanying Notes to Financial Statements which are an integral part of the financial statements.
| 8 | Invesco Select Risk: Growth Investor Fund |
Statement of Assets and Liabilities
December 31, 2022
Assets: | ||||
Investments in affiliated underlying funds, at value (Cost $916,443,658)* | $ | 887,230,821 | ||
| ||||
Cash | 31,300 | |||
| ||||
Receivable for: | ||||
Dividends - affiliated underlying funds | 795,220 | |||
| ||||
Fund shares sold | 897,934 | |||
| ||||
Investment for trustee deferred compensation and retirement plans | 128,382 | |||
| ||||
Other assets | 54,087 | |||
| ||||
Total assets | 889,137,744 | |||
| ||||
Liabilities: | ||||
Payable for: | ||||
Investments purchased - affiliated underlying funds | 776,891 | |||
| ||||
Fund shares reacquired | 691,570 | |||
| ||||
Collateral upon return of securities loaned | 4,516,988 | |||
| ||||
Accrued fees to affiliates | 520,680 | |||
| ||||
Accrued trustees’ and officers’ fees and benefits | 3,875 | |||
| ||||
Accrued other operating expenses | 115,827 | |||
| ||||
Trustee deferred compensation and retirement plans | 140,503 | |||
| ||||
Total liabilities | 6,766,334 | |||
| ||||
Net assets applicable to shares outstanding | $ | 882,371,410 | ||
| ||||
Net assets consist of: | ||||
Shares of beneficial interest | $ | 901,873,788 | ||
| ||||
Distributable earnings (loss) | (19,502,378 | ) | ||
| ||||
| $ | 882,371,410 | |||
| ||||
Net Assets: | ||||
Class A | $ | 787,334,762 | ||
| ||||
Class C | $ | 40,057,912 | ||
| ||||
Class R | $ | 25,191,807 | ||
| ||||
Class S | $ | 17,950,612 | ||
| ||||
Class Y | $ | 11,673,083 | ||
| ||||
Class R5 | $ | 45,216 | ||
| ||||
Class R6 | $ | 118,018 | ||
| ||||
Shares outstanding, no par value, with an unlimited number of shares authorized: |
| |||
Class A | 60,912,607 | |||
| ||||
Class C | 3,149,055 | |||
| ||||
Class R | 1,955,219 | |||
| ||||
Class S | 1,390,946 | |||
| ||||
Class Y | 906,374 | |||
| ||||
Class R5 | 3,481 | |||
| ||||
Class R6 | 9,084 | |||
| ||||
Class A: | ||||
Net asset value per share | $ | 12.93 | ||
| ||||
Maximum offering price per share | $ | 13.68 | ||
| ||||
Class C: | ||||
Net asset value and offering price per share | $ | 12.72 | ||
| ||||
Class R: | ||||
Net asset value and offering price per share | $ | 12.88 | ||
| ||||
Class S: | ||||
Net asset value and offering price per share | $ | 12.91 | ||
| ||||
Class Y: | ||||
Net asset value and offering price per share | $ | 12.88 | ||
| ||||
Class R5: | ||||
Net asset value and offering price per share | $ | 12.99 | ||
| ||||
Class R6: | ||||
Net asset value and offering price per share | $ | 12.99 | ||
| ||||
| * | At December 31, 2022, securities with an aggregate value of $1,735,226 were on loan to brokers. |
See accompanying Notes to Financial Statements which are an integral part of the financial statements.
| 9 | Invesco Select Risk: Growth Investor Fund |
Statement of Operations
For the year ended December 31, 2022
Investment income: | ||||
Dividends from affiliated underlying funds (includes net securities lending income of $81,077) | $ | 15,302,801 | ||
| ||||
Interest | 160,932 | |||
| ||||
Total investment income | 15,463,733 | |||
| ||||
Expenses: | ||||
Administrative services fees | 138,049 | |||
| ||||
Custodian fees | 14,305 | |||
| ||||
Distribution fees: | ||||
Class A | 2,103,161 | |||
| ||||
Class C | 430,694 | |||
| ||||
Class R | 115,497 | |||
| ||||
Class S | 29,887 | |||
| ||||
Transfer agent fees – A, C, R, S and Y | 1,336,575 | |||
| ||||
Transfer agent fees – R5 | 41 | |||
| ||||
Transfer agent fees – R6 | 98 | |||
| ||||
Trustees’ and officers’ fees and benefits | 24,143 | |||
| ||||
Registration and filing fees | 118,574 | |||
| ||||
Reports to shareholders | 54,800 | |||
| ||||
Professional services fees | 36,905 | |||
| ||||
Other | 20,705 | |||
| ||||
Total expenses | 4,423,434 | |||
| ||||
Less: Expense offset arrangement(s) | (9,962 | ) | ||
| ||||
Net expenses | 4,413,472 | |||
| ||||
Net investment income | 11,050,261 | |||
| ||||
Realized and unrealized gain (loss) from: | ||||
Net realized gain (loss) from: | ||||
Affiliated underlying fund shares | (9,481,239 | ) | ||
| ||||
Capital gain distributions from affiliated underlying fund shares | 14,405,452 | |||
| ||||
| 4,924,213 | ||||
| ||||
Change in net unrealized appreciation (depreciation) of affiliated underlying fund shares | (228,250,134 | ) | ||
| ||||
Net realized and unrealized gain (loss) | (223,325,921 | ) | ||
| ||||
Net increase (decrease) in net assets resulting from operations | $ | (212,275,660 | ) | |
| ||||
See accompanying Notes to Financial Statements which are an integral part of the financial statements.
| 10 | Invesco Select Risk: Growth Investor Fund |
Statement of Changes in Net Assets
For the years ended December 31, 2022 and 2021
| 2022 | 2021 | |||||||
| ||||||||
Operations: | ||||||||
Net investment income | $ | 11,050,261 | $ | 8,912,515 | ||||
| ||||||||
Net realized gain | 4,924,213 | 79,356,776 | ||||||
| ||||||||
Change in net unrealized appreciation (depreciation) | (228,250,134 | ) | 51,608,047 | |||||
| ||||||||
Net increase (decrease) in net assets resulting from operations | (212,275,660 | ) | 139,877,338 | |||||
| ||||||||
Distributions to shareholders from distributable earnings: | ||||||||
Class A | (43,731,932 | ) | (60,863,717 | ) | ||||
| ||||||||
Class C | (2,022,504 | ) | (2,894,317 | ) | ||||
| ||||||||
Class R | (1,310,594 | ) | (1,476,979 | ) | ||||
| ||||||||
Class S | (1,019,840 | ) | (1,492,207 | ) | ||||
| ||||||||
Class Y | (694,228 | ) | (918,692 | ) | ||||
| ||||||||
Class R5 | (2,647 | ) | (3,107 | ) | ||||
| ||||||||
Class R6 | (6,868 | ) | (38,398 | ) | ||||
| ||||||||
Total distributions from distributable earnings | (48,788,613 | ) | (67,687,417 | ) | ||||
| ||||||||
Share transactions–net: | ||||||||
Class A | 3,419,049 | 5,099,523 | ||||||
| ||||||||
Class C | (1,867,405 | ) | (7,933,298 | ) | ||||
| ||||||||
Class R | 5,448,140 | 3,156,194 | ||||||
| ||||||||
Class S | (811,152 | ) | (1,001,865 | ) | ||||
| ||||||||
Class Y | 238,568 | 3,587,352 | ||||||
| ||||||||
Class R5 | 8,007 | (434,271 | ) | |||||
| ||||||||
Class R6 | (443,787 | ) | (226,919 | ) | ||||
| ||||||||
Net increase in net assets resulting from share transactions | 5,991,420 | 2,246,716 | ||||||
| ||||||||
Net increase (decrease) in net assets | (255,072,853 | ) | 74,436,637 | |||||
| ||||||||
Net assets: | ||||||||
Beginning of year | 1,137,444,263 | 1,063,007,626 | ||||||
| ||||||||
End of year | $ | 882,371,410 | $ | 1,137,444,263 | ||||
| ||||||||
See accompanying Notes to Financial Statements which are an integral part of the financial statements.
| 11 | Invesco Select Risk: Growth Investor Fund |
The following schedule presents financial highlights for a share of the Fund outstanding throughout the periods indicated.
Net asset value, beginning of period | Net investment income(a)(b) | Net gains (losses) on securities (both realized and unrealized) | Total from investment operations | Dividends from net investment income | Distributions from net realized gains | Total distributions | Net asset value, end of period | Total return (c) | Net assets, end of period (000’s omitted) | Ratio of expenses to average net assets with fee waivers and/or expenses absorbed(d) | Ratio of expenses to average net assets without fee waivers and/or expenses absorbed | Ratio of net investment income to average net assets(b) | Portfolio turnover (e) | |||||||||||||||||||||||||||||||||||||||||||
Class A | ||||||||||||||||||||||||||||||||||||||||||||||||||||||||
Year ended 12/31/22 | $16.85 | $0.17 | $(3.33 | ) | $(3.16 | ) | $(0.19 | ) | $(0.57 | ) | $(0.76 | ) | $12.93 | (18.79 | )% | $ 787,335 | 0.43 | % | 0.43 | % | 1.22 | % | 29 | % | ||||||||||||||||||||||||||||||||
Year ended 12/31/21 | 15.80 | 0.14 | 1.98 | 2.12 | (0.25 | ) | (0.82 | ) | (1.07 | ) | 16.85 | 13.55 | 1,017,511 | 0.45 | 0.45 | 0.83 | 19 | |||||||||||||||||||||||||||||||||||||||
Year ended 12/31/20 | 15.79 | 0.14 | 1.71 | 1.85 | (0.27 | ) | (1.57 | ) | (1.84 | ) | 15.80 | 11.87 | 948,121 | 0.47 | 0.47 | 0.92 | 90 | |||||||||||||||||||||||||||||||||||||||
Year ended 12/31/19 | 14.37 | 0.28 | 2.68 | 2.96 | (0.22 | ) | (1.32 | ) | (1.54 | ) | 15.79 | 20.59 | 889,968 | 0.49 | 0.49 | 1.76 | 32 | |||||||||||||||||||||||||||||||||||||||
Year ended 12/31/18 | 16.05 | 0.20 | (1.53 | ) | (1.33 | ) | (0.20 | ) | (0.15 | ) | (0.35 | ) | 14.37 | (8.27 | ) | 739,240 | 0.50 | 0.50 | 1.26 | 16 | ||||||||||||||||||||||||||||||||||||
Class C | ||||||||||||||||||||||||||||||||||||||||||||||||||||||||
Year ended 12/31/22 | 16.62 | 0.06 | (3.28 | ) | (3.22 | ) | (0.11 | ) | (0.57 | ) | (0.68 | ) | 12.72 | (19.42 | ) | 40,058 | 1.18 | 1.18 | 0.47 | 29 | ||||||||||||||||||||||||||||||||||||
Year ended 12/31/21 | 15.60 | 0.01 | 1.95 | 1.96 | (0.12 | ) | (0.82 | ) | (0.94 | ) | 16.62 | 12.64 | 54,151 | 1.20 | 1.20 | 0.08 | 19 | |||||||||||||||||||||||||||||||||||||||
Year ended 12/31/20 | 15.64 | 0.02 | 1.70 | 1.72 | (0.19 | ) | (1.57 | ) | (1.76 | ) | 15.60 | 11.09 | 58,187 | 1.22 | 1.22 | 0.17 | 90 | |||||||||||||||||||||||||||||||||||||||
Year ended 12/31/19 | 14.26 | 0.16 | 2.64 | 2.80 | (0.10 | ) | (1.32 | ) | (1.42 | ) | 15.64 | 19.64 | 73,066 | 1.24 | 1.24 | 1.01 | 32 | |||||||||||||||||||||||||||||||||||||||
Year ended 12/31/18 | 15.91 | 0.08 | (1.51 | ) | (1.43 | ) | (0.07 | ) | (0.15 | ) | (0.22 | ) | 14.26 | (8.95 | ) | 118,925 | 1.25 | 1.25 | 0.51 | 16 | ||||||||||||||||||||||||||||||||||||
Class R | ||||||||||||||||||||||||||||||||||||||||||||||||||||||||
Year ended 12/31/22 | 16.80 | 0.14 | (3.33 | ) | (3.19 | ) | (0.16 | ) | (0.57 | ) | (0.73 | ) | 12.88 | (19.04 | ) | 25,192 | 0.68 | 0.68 | 0.97 | 29 | ||||||||||||||||||||||||||||||||||||
Year ended 12/31/21 | 15.76 | 0.10 | 1.97 | 2.07 | (0.21 | ) | (0.82 | ) | (1.03 | ) | 16.80 | 13.24 | 26,032 | 0.70 | 0.70 | 0.58 | 19 | |||||||||||||||||||||||||||||||||||||||
Year ended 12/31/20 | 15.75 | 0.10 | 1.71 | 1.81 | (0.23 | ) | (1.57 | ) | (1.80 | ) | 15.76 | 11.64 | 21,447 | 0.72 | 0.72 | 0.67 | 90 | |||||||||||||||||||||||||||||||||||||||
Year ended 12/31/19 | 14.34 | 0.24 | 2.66 | 2.90 | (0.17 | ) | (1.32 | ) | (1.49 | ) | 15.75 | 20.26 | 20,690 | 0.74 | 0.74 | 1.51 | 32 | |||||||||||||||||||||||||||||||||||||||
Year ended 12/31/18 | 16.01 | 0.16 | (1.52 | ) | (1.36 | ) | (0.16 | ) | (0.15 | ) | (0.31 | ) | 14.34 | (8.49 | ) | 18,275 | 0.75 | 0.75 | 1.01 | 16 | ||||||||||||||||||||||||||||||||||||
Class S | ||||||||||||||||||||||||||||||||||||||||||||||||||||||||
Year ended 12/31/22 | 16.82 | 0.19 | (3.33 | ) | (3.14 | ) | (0.20 | ) | (0.57 | ) | (0.77 | ) | 12.91 | (18.68 | ) | 17,951 | 0.33 | 0.33 | 1.32 | 29 | ||||||||||||||||||||||||||||||||||||
Year ended 12/31/21 | 15.78 | 0.16 | 1.97 | 2.13 | (0.27 | ) | (0.82 | ) | (1.09 | ) | 16.82 | 13.62 | 24,254 | 0.35 | 0.35 | 0.93 | 19 | |||||||||||||||||||||||||||||||||||||||
Year ended 12/31/20 | 15.77 | 0.15 | 1.72 | 1.87 | (0.29 | ) | (1.57 | ) | (1.86 | ) | 15.78 | 11.98 | 23,627 | 0.37 | 0.37 | 1.02 | 90 | |||||||||||||||||||||||||||||||||||||||
Year ended 12/31/19 | 14.35 | 0.30 | 2.67 | 2.97 | (0.23 | ) | (1.32 | ) | (1.55 | ) | 15.77 | 20.73 | 22,788 | 0.39 | 0.39 | 1.86 | 32 | |||||||||||||||||||||||||||||||||||||||
Year ended 12/31/18 | 16.03 | 0.22 | (1.53 | ) | (1.31 | ) | (0.22 | ) | (0.15 | ) | (0.37 | ) | 14.35 | (8.17 | ) | 20,700 | 0.40 | 0.40 | 1.36 | 16 | ||||||||||||||||||||||||||||||||||||
Class Y | ||||||||||||||||||||||||||||||||||||||||||||||||||||||||
Year ended 12/31/22 | 16.79 | 0.21 | (3.32 | ) | (3.11 | ) | (0.23 | ) | (0.57 | ) | (0.80 | ) | 12.88 | (18.59 | ) | 11,673 | 0.18 | 0.18 | 1.47 | 29 | ||||||||||||||||||||||||||||||||||||
Year ended 12/31/21 | 15.75 | 0.19 | 1.97 | 2.16 | (0.30 | ) | (0.82 | ) | (1.12 | ) | �� | 16.79 | 13.82 | 14,854 | 0.20 | 0.20 | 1.08 | 19 | ||||||||||||||||||||||||||||||||||||||
Year ended 12/31/20 | 15.74 | 0.17 | 1.72 | 1.89 | (0.31 | ) | (1.57 | ) | (1.88 | ) | 15.75 | 12.16 | 10,589 | 0.22 | 0.22 | 1.17 | 90 | |||||||||||||||||||||||||||||||||||||||
Year ended 12/31/19 | 14.33 | 0.32 | 2.67 | 2.99 | (0.26 | ) | (1.32 | ) | (1.58 | ) | 15.74 | 20.86 | 10,233 | 0.24 | 0.24 | 2.01 | 32 | |||||||||||||||||||||||||||||||||||||||
Year ended 12/31/18 | 16.02 | 0.24 | (1.54 | ) | (1.30 | ) | (0.24 | ) | (0.15 | ) | (0.39 | ) | 14.33 | (8.08 | ) | 8,271 | 0.25 | 0.25 | 1.51 | 16 | ||||||||||||||||||||||||||||||||||||
Class R5 | ||||||||||||||||||||||||||||||||||||||||||||||||||||||||
Year ended 12/31/22 | 16.93 | 0.22 | (3.36 | ) | (3.14 | ) | (0.23 | ) | (0.57 | ) | (0.80 | ) | 12.99 | (18.57 | ) | 45 | 0.13 | 0.13 | 1.52 | 29 | ||||||||||||||||||||||||||||||||||||
Year ended 12/31/21 | 15.88 | 0.19 | 1.99 | 2.18 | (0.31 | ) | (0.82 | ) | (1.13 | ) | 16.93 | 13.84 | 49 | 0.14 | 0.14 | 1.14 | 19 | |||||||||||||||||||||||||||||||||||||||
Year ended 12/31/20 | 15.86 | 0.19 | 1.72 | 1.91 | (0.32 | ) | (1.57 | ) | (1.89 | ) | 15.88 | 12.20 | 453 | 0.14 | 0.14 | 1.25 | 90 | |||||||||||||||||||||||||||||||||||||||
Year ended 12/31/19 | 14.42 | 0.34 | 2.69 | 3.03 | (0.27 | ) | (1.32 | ) | (1.59 | ) | 15.86 | 21.05 | 33 | 0.15 | 0.15 | 2.10 | 32 | |||||||||||||||||||||||||||||||||||||||
Year ended 12/31/18 | 16.12 | 0.26 | (1.56 | ) | (1.30 | ) | (0.25 | ) | (0.15 | ) | (0.40 | ) | 14.42 | (8.02 | ) | 25 | 0.16 | 0.16 | 1.60 | 16 | ||||||||||||||||||||||||||||||||||||
Class R6 | ||||||||||||||||||||||||||||||||||||||||||||||||||||||||
Year ended 12/31/22 | 16.93 | 0.22 | (3.36 | ) | (3.14 | ) | (0.23 | ) | (0.57 | ) | (0.80 | ) | 12.99 | (18.57 | ) | 118 | 0.13 | 0.13 | 1.52 | 29 | ||||||||||||||||||||||||||||||||||||
Year ended 12/31/21 | 15.88 | 0.22 | 1.97 | 2.19 | (0.32 | ) | (0.82 | ) | (1.14 | ) | 16.93 | 13.95 | 594 | 0.05 | 0.05 | 1.23 | 19 | |||||||||||||||||||||||||||||||||||||||
Year ended 12/31/20 | 15.85 | 0.19 | 1.73 | 1.92 | (0.32 | ) | (1.57 | ) | (1.89 | ) | 15.88 | 12.27 | 584 | 0.14 | 0.14 | 1.25 | 90 | |||||||||||||||||||||||||||||||||||||||
Year ended 12/31/19 | 14.42 | 0.34 | 2.68 | 3.02 | (0.27 | ) | (1.32 | ) | (1.59 | ) | 15.85 | 20.98 | 11 | 0.15 | 0.15 | 2.10 | 32 | |||||||||||||||||||||||||||||||||||||||
Year ended 12/31/18 | 16.11 | 0.26 | (1.55 | ) | (1.29 | ) | (0.25 | ) | (0.15 | ) | (0.40 | ) | 14.42 | (7.96 | ) | 10 | 0.16 | 0.16 | 1.60 | 16 | ||||||||||||||||||||||||||||||||||||
| (a) | Calculated using average shares outstanding. |
| (b) | Net investment income (loss) is affected by the timing of the declaration of dividends by the underlying funds in which the Fund invests. Ratio of net investment income (loss) does not include net investment income of the underlying funds in which the Fund invests. |
| (c) | Includes adjustments in accordance with accounting principles generally accepted in the United States of America and as such, the net asset value for financial reporting purposes and the returns based upon those net asset values may differ from the net asset value and returns for shareholder transactions. Does not include sales charges and is not annualized for periods less than one year, if applicable. |
| (d) | In addition to the fees and expenses which the Fund bears directly, the Fund indirectly bears a pro rata share of the fees and expenses of the underlying funds in which the Fund invests. Because the underlying funds have varied expenses and fee levels and the Fund may own different proportions at different times, the amount of fees and expenses incurred indirectly by the Fund will vary. Estimated underlying fund expenses are not expenses that are incurred directly by the Fund. They are expenses that are incurred directly by the underlying funds and are deducted from the value of the funds the Fund invests in. The effect of the estimated underlying fund expenses that the Fund bears indirectly is included in the Fund’s total return. Estimated acquired fund fees from underlying funds 0.50%, 0.54%, 0.58%, 0.58% and 0.55% for the years ended December 31, 2022, 2021, 2020, 2019, and 2018, respectively. |
| (e) | Portfolio turnover is calculated at the fund level and is not annualized for periods less than one year, if applicable. |
See accompanying Notes to Financial Statements which are an integral part of the financial statements.
| 12 | Invesco Select Risk: Growth Investor Fund |
December 31, 2022
NOTE 1–Significant Accounting Policies
Invesco Select Risk: Growth Investor Fund (the “Fund”) is a series portfolio of AIM Growth Series (Invesco Growth Series) (the “Trust”). The Trust is a Delaware statutory trust registered under the Investment Company Act of 1940, as amended (the “1940 Act”), as an open-end series management investment company authorized to issue an unlimited number of shares of beneficial interest. Information presented in these financial statements pertains only to the Fund. Matters affecting the Fund or each class will be voted on exclusively by the shareholders of the Fund or each class.
The Fund’s investment objective is long-term growth of capital consistent with a higher level of risk relative to the broad stock market.
The Fund is a “fund of funds”, in that it invests in other mutual funds (“underlying funds”) advised by Invesco Advisers, Inc. (the “Adviser” or “Invesco”) and exchange-traded funds advised by Invesco Capital Management LLC (“Invesco Capital”), an affiliate of Invesco, or other unaffiliated advisers. The Adviser may change the Fund’s asset class allocations, the underlying funds or the target weightings in the underlying funds without shareholder approval. The underlying funds may engage in a number of investment techniques and practices, which involve certain risks. Each underlying fund’s accounting policies are outlined in the underlying fund’s financial statements and are publicly available.
The Fund currently consists of seven different classes of shares: Class A, Class C, Class R, Class S, Class Y, Class R5 and Class R6. Class Y shares are available only to certain investors. Class A shares are sold with a front-end sales charge unless certain waiver criteria are met. Under certain circumstances, load waived shares may be subject to contingent deferred sales charges (“CDSC”). Class C shares are sold with a CDSC. Class R, Class S, Class Y, Class R5 and Class R6 shares are sold at net asset value. Class C shares held for eight years after purchase are eligible for automatic conversion into Class A shares of the same Fund (the “Conversion Feature”). The automatic conversion pursuant to the Conversion Feature will generally occur at the end of the month following the eighth anniversary after a purchase of Class C shares.
The Fund is an investment company and accordingly follows the investment company accounting and reporting guidance in accordance with Financial Accounting Standards Board Accounting Standards Codification Topic 946, Financial Services – Investment Companies.
The following is a summary of the significant accounting policies followed by the Fund in the preparation of its financial statements.
| A. | Security Valuations – Securities of investment companies listed or traded on an exchange are generally valued at the trade price or official closing price that day as of the close of the exchange where the security is principally traded, or lacking any trades or official closing price on a particular day, the security may be valued at the closing bid price on that day. Securities of investment companies that are not exchange-traded (e.g., open-end mutual funds) are valued using such company’s end-of-business-day net asset value per share. Securities in the underlying funds, including restricted securities, are valued in accordance with the valuation policy of such fund. The policies of the underlying funds affiliated with the Fund, as a result of having the same investment adviser, are set forth below. |
A security listed or traded on an exchange is generally valued at its trade price or official closing price that day as of the close of the exchange where the security is principally traded, or lacking any trades or official closing price on a particular day, the security may be valued at the closing bid price on that day. Securities traded in the over-the-counter market are valued based on prices furnished by independent pricing services or market makers. When such securities are valued using prices provided by an independent pricing service they may be considered fair valued. Futures contracts are valued at the daily settlement price set by an exchange on which they are principally traded. U.S. exchange-traded options are valued at the mean between the last bid and asked prices from the exchange on which they are principally traded. Non-U.S. exchange-traded options are valued at the final settlement price set by the exchange on which they trade. Options not listed on an exchange and swaps generally are valued using pricing provided from independent pricing services.
Variable rate senior loan interests are fair valued using quotes provided by an independent pricing service. Quotes provided by the pricing service may reflect appropriate factors such as ratings, tranche type, industry, company performance, spread, individual trading characteristics, institution-size trading in similar groups of securities and other market data.
Securities of investment companies that are not exchange-traded (e.g., open-end mutual funds) are valued using such company’s end-of-business-day net asset value per share.
Deposits, other obligations of U.S. and non-U.S. banks and financial institutions are valued at their daily account value.
Fixed income securities (including convertible debt securities) generally are valued on the basis of prices provided by independent pricing services. Prices provided by the pricing service may be determined without exclusive reliance on quoted prices, and may reflect appropriate factors such as institution-size trading in similar groups of securities, developments related to specific securities, dividend rate (for unlisted equities), yield (for debt obligations), quality, type of issue, coupon rate (for debt obligations), maturity (for debt obligations), individual trading characteristics and other market data. Pricing services generally value debt obligations assuming orderly transactions of institutional round lot size, but a fund may hold or transact in the same securities in smaller, odd lot sizes. Odd lots often trade at lower prices than institutional round lots, and their value may be adjusted accordingly. Debt obligations are subject to interest rate and credit risks. In addition, all debt obligations involve some risk of default with respect to interest and/or principal payments.
Swap agreements are fair valued using an evaluated quote, if available, provided by an independent pricing service. Evaluated quotes provided by the pricing service are valued based on a model which may include end-of-day net present values, spreads, ratings, industry, company performance and returns of referenced assets. Centrally cleared swap agreements are valued at the daily settlement price determined by the relevant exchange or clearinghouse.
Foreign securities’ (including foreign exchange contracts) prices are converted into U.S. dollar amounts using the applicable exchange rates as of the close of the New York Stock Exchange (“NYSE”). If market quotations are available and reliable for foreign exchange-traded equity securities, the securities will be valued at the market quotations. The Adviser may use various pricing services to obtain market quotations as well as fair value prices. Because trading hours for certain foreign securities end before the close of the NYSE, closing market quotations may become not representative of market value in the Adviser’s judgment (“unreliable”). If, between the time trading ends on a particular security and the close of the customary trading session on the NYSE, a significant event occurs that makes the closing price of the security unreliable, the Adviser may fair value the security. If the event is likely to have affected the closing price of the security, the security will be valued at fair value in good faith in accordance with Board- approved policies and related Adviser procedures (“Valuation Procedures”). Adjustments to closing prices to reflect fair value may also be based on a screening process of an independent pricing service to indicate the degree of certainty, based on historical data, that the closing price in the principal market where a foreign security trades is not the current value as of the close of the NYSE. Foreign securities’ prices meeting the degree of certainty that the price is not reflective of current value will be priced at the indication of fair value from the independent pricing service. Multiple factors may be considered by the independent pricing service in determining adjustments to reflect fair value and may include information relating to sector indices, American Depositary Receipts and domestic and foreign index futures. Foreign securities may have additional risks including exchange rate changes, potential for sharply devalued currencies and high inflation, political and economic upheaval, the relative lack of issuer information, relatively low market liquidity and the potential lack of strict financial and accounting controls and standards.
Unlisted securities will be valued using prices provided by independent pricing services or by another method that the Adviser, in its judgment, believes better reflects the security’s fair value in accordance with the Valuation Procedures.
Securities for which market prices are not provided by any of the above methods may be valued based upon quotes furnished by independent sources. The last bid price may be used to value equity securities. The mean between the last bid and asked prices may be used to value debt obligations, including corporate loans.
| 13 | Invesco Select Risk: Growth Investor Fund |
Securities for which market quotations are not readily available are fair valued by the Adviser in accordance with the Valuation Procedures. If a fair value price provided by a pricing service is unreliable, the Adviser will fair value the security using the Valuation Procedures. Issuer specific events, market trends, bid/asked quotes of brokers and information providers and other market data may be reviewed in the course of making a good faith determination of a security’s fair value.
The Fund may invest in securities that are subject to interest rate risk, meaning the risk that the prices will generally fall as interest rates rise and, conversely, the prices will generally rise as interest rates fall. Specific securities differ in their sensitivity to changes in interest rates depending on their individual characteristics. Changes in interest rates may result in increased market volatility, which may affect the value and/or liquidity of certain Fund investments.
Valuations change in response to many factors including the historical and prospective earnings of the issuer, the value of the issuer’s assets, general market conditions which are not specifically related to the particular issuer, such as real or perceived adverse economic conditions, changes in the general outlook for revenues or corporate earnings, changes in interest or currency rates, regional or global instability, natural or environmental disasters, widespread disease or other public health issues, war, acts of terrorism, significant governmental actions or adverse investor sentiment generally and market liquidity. Because of the inherent uncertainties of valuation, the values reflected in the financial statements may materially differ from the value received upon actual sale of those investments.
The price the Fund could receive upon the sale of any investment may differ from the Adviser’s valuation of the investment, particularly for securities that are valued using a fair valuation technique. When fair valuation techniques are applied, the Adviser uses available information, including both observable and unobservable inputs and assumptions, to determine a methodology that will result in a valuation that the Adviser believes approximates market value. Fund securities that are fair valued may be subject to greater fluctuation in their value from one day to the next than would be the case if market quotations were used. Because of the inherent uncertainties of valuation, and the degree of subjectivity in such decisions, the Fund could realize a greater or lesser than expected gain or loss upon the sale of the investment.
| B. | Securities Transactions and Investment Income – Securities transactions are accounted for on a trade date basis. Realized gains or losses on sales are computed on the basis of specific identification of the securities sold. Distributions from ordinary income from underlying funds, if any, are recorded as dividend income on the ex-dividend date. Distributions from gains from underlying funds, if any, are recorded as realized gains on the ex-dividend date. The following policies are followed by the underlying funds: Interest income (net of withholding tax, if any) is recorded on an accrual basis from settlement date and includes coupon interest and amortization of premium and accretion of discount on debt securities as applicable. Pay-in-kind interest income and non-cash dividend income received in the form of securities in-lieu of cash are recorded at the fair value of the securities received. Paydown gains and losses on mortgage and asset-backed securities are recorded as adjustments to interest income. |
The Fund may periodically participate in litigation related to the Fund’s investments. As such, the Fund may receive proceeds from litigation settlements. Any proceeds received are included in the Statement of Operations as realized gain (loss) for investments no longer held and as unrealized gain (loss) for investments still held.
The Fund allocates income and realized and unrealized capital gains and losses to a class based on the relative net assets of each class.
| C. | Distributions – Distributions from net investment income and net realized capital gain, if any, are generally declared and paid annually and recorded on the ex-dividend date. The Fund may elect to treat a portion of the proceeds from redemptions as distributions for federal income tax purposes. |
| D. | Federal Income Taxes – The Fund intends to comply with the requirements of Subchapter M of the Internal Revenue Code of 1986, as amended (the “Internal Revenue Code”), necessary to qualify as a regulated investment company and to distribute substantially all of the Fund’s taxable earnings to shareholders. As such, the Fund will not be subject to federal income taxes on otherwise taxable income (including net realized capital gain) that is distributed to shareholders. Therefore, no provision for federal income taxes is recorded in the financial statements. |
The Fund recognizes the tax benefits of uncertain tax positions only when the position is more likely than not to be sustained. Management has analyzed the Fund’s uncertain tax positions and concluded that no liability for unrecognized tax benefits should be recorded related to uncertain tax positions. Management is not aware of any tax positions for which it is reasonably possible that the total amounts of unrecognized tax benefits will change materially in the next 12 months.
The Fund files tax returns in the U.S. Federal jurisdiction and certain other jurisdictions. Generally, the Fund is subject to examinations by such taxing authorities for up to three years after the filing of the return for the tax period.
| E. | Expenses – Expenses included in the accompanying financial statements reflect the expenses of the Fund and do not include any expenses of the underlying funds. The effects of the underlying funds expenses are included in the realized and unrealized gain/loss on the investments in the underlying funds. Estimated expenses of the underlying funds are discussed further within the Financial Highlights. |
Fees provided for under the Rule 12b-1 plan of a particular class of the Fund and which are directly attributable to that class are charged to the operations of such class. Transfer agency fees and expenses and other shareholder recordkeeping fees and expenses attributable to Class R5 and Class R6 are allocated based on relative net assets of Class R5 and Class R6. Transfer agency fees and expenses and other shareholder recordkeeping fees and expenses relating to all other classes are allocated among those classes based on relative net assets. All other expenses are allocated among the classes based on relative net assets.
| F. | Accounting Estimates – The preparation of financial statements in conformity with accounting principles generally accepted in the United States of America (“GAAP”) requires management to make estimates and assumptions that affect the reported amounts of assets and liabilities at the date of the financial statements and the reported amounts of revenues and expenses during the reporting period including estimates and assumptions related to taxation. Actual results could differ from those estimates by a significant amount. In addition, the Fund monitors for material events or transactions that may occur or become known after the period-end date and before the date the financial statements are released to print. |
| G. | Indemnifications – Under the Trust’s organizational documents, each Trustee, officer, employee or other agent of the Trust is indemnified against certain liabilities that may arise out of the performance of their duties to the Fund. Additionally, in the normal course of business, the Fund enters into contracts, including the Fund’s servicing agreements, that contain a variety of indemnification clauses. The Fund’s maximum exposure under these arrangements is unknown as this would involve future claims that may be made against the Fund that have not yet occurred. The risk of material loss as a result of such indemnification claims is considered remote. |
| H. | Securities Lending – The Fund may lend portfolio securities having a market value up to one-third of the Fund’s total assets. Such loans are secured by collateral equal to no less than the market value of the loaned securities determined daily by the securities lending provider. Such collateral will be cash or debt securities issued or guaranteed by the U.S. Government or any of its sponsored agencies. Cash collateral received in connection with these loans is invested in short-term money market instruments or affiliated, unregistered investment companies that comply with Rule 2a-7 under the 1940 Act and money market funds (collectively, “affiliated money market funds”) and is shown as such on the Schedule of Investments. The Fund bears the risk of loss with respect to the investment of collateral. It is the Fund’s policy to obtain additional collateral from or return excess collateral to the borrower by the end of the next business day, following the valuation date of the securities loaned. Therefore, the value of the collateral held may be temporarily less than the value of the securities on loan. When loaning securities, the Fund retains certain benefits of owning the securities, including the economic equivalent of dividends or interest generated by the security. Lending securities entails a risk of loss to the Fund if, and to the extent that, the market value of the securities loaned were to increase and the borrower did not increase the collateral accordingly, and the borrower failed to return the securities. The securities loaned are subject to termination at the option of the borrower or the Fund. Upon termination, the borrower will return to the Fund the securities loaned and the Fund will return the collateral. Upon the failure of the borrower to return the securities, collateral may be liquidated and the securities may be purchased on the open market to replace the loaned securities. The Fund could experience delays and costs in gaining access to the collateral and the securities may lose value during the delay which could result in potential losses to the Fund. Some of these losses may be indemnified by the lending agent. The Fund bears the risk of any deficiency in the amount of the collateral available for return to the borrower due to any loss on the collateral invested. Dividends received on cash collateral investments for securities lending transactions, which are |
| 14 | Invesco Select Risk: Growth Investor Fund |
| net of compensation to counterparties, are included in Dividends from affiliated underlying funds on the Statement of Operations. The aggregate value of securities out on loan, if any, is shown as a footnote on the Statement of Assets and Liabilities. |
The Adviser serves as an affiliated securities lending agent for the Fund. The Bank of New York Mellon also serves as a lending agent. To the extent the Fund utilizes the Adviser as an affiliated securities lending agent, the Fund conducts its securities lending in accordance with, and in reliance upon, no-action letters issued by the SEC staff that provide guidance on how an affiliate may act as a direct agent lender and receive compensation for those services in a manner consistent with the federal securities laws. For the year ended December 31, 2022, the Fund paid the Adviser $7,708 in fees for securities lending agent services. Fees paid to the Adviser for securities lending agent services, if any, are included in Dividends from affiliated underlying funds on the Statement of Operations.
| I. | Other Risks – Certain of the underlying funds are non-diversified and can invest a greater portion of their assets in the obligations or securities of a small number of issuers or any single issuer than a diversified fund can. A change in the value of one or a few issuers’ securities will therefore affect the value of an underlying fund more than would occur in a diversified fund. |
Investments in ETFs generally present the same primary risks as an investment in a conventional mutual fund that has the same investment objective, strategy and policies. Investments in ETFs further involve the same risks associated with a direct investment in the types of securities, commodities and/or currencies included in the indices the ETFs are designed to replicate. In addition, shares of an ETF may trade at a market price that is higher or lower than their net asset value and an active trading market in such shares may not develop or continue. Moreover, trading of an ETF’s shares may be halted if the listing exchange’s officials deem such action to be appropriate, the shares are de-listed from the exchange, or the activation of market-wide “circuit breakers” (which are tied to large decreases in stock prices) halts stock trading generally.
| J. | COVID-19 Risk – The COVID-19 strain of coronavirus has resulted in instances of market closures and dislocations, extreme volatility, liquidity constraints and increased trading costs. Efforts to contain its spread have resulted in travel restrictions, disruptions of healthcare systems, business operations (including business closures) and supply chains, layoffs, lower consumer demand and employee availability, and defaults and credit downgrades, among other significant economic impacts that have disrupted global economic activity across many industries. Such economic impacts may exacerbate other pre-existing political, social and economic risks locally or globally and cause general concern and uncertainty. The full economic impact and ongoing effects of COVID-19 (or other future epidemics or pandemics) at the macro-level and on individual businesses are unpredictable and may result in significant and prolonged effects on the Fund’s performance. |
NOTE 2–Advisory Fees and Other Fees Paid to Affiliates
The Trust has entered into a master investment advisory agreement with the Adviser. Under the terms of the investment advisory agreement, the Fund does not pay an advisory fee. However, the Fund pays advisory fees to the Adviser indirectly as a shareholder of the underlying funds.
Under the terms of a master sub-advisory agreement between the Adviser and each of Invesco Asset Management Deutschland GmbH, Invesco Asset Management Limited, Invesco Asset Management (Japan) Limited, Invesco Hong Kong Limited, Invesco Senior Secured Management, Inc. and Invesco Canada Ltd. (collectively, the “Affiliated Sub-Advisers”) the Adviser, not the Fund, will pay 40% of the fees paid to the Adviser to any such Affiliated Sub-Adviser(s) that provide(s) discretionary investment management services to the Fund based on the percentage of assets allocated to such Affiliated Sub-Adviser(s).
The Adviser has contractually agreed, through June 30, 2023, to reimburse expenses of all shares to the extent necessary to limit total annual fund operating expenses after expense reimbursement (excluding certain items discussed below) of Class A, Class C, Class R, Class S, Class Y, Class R5 and Class R6 shares to 2.00%, 2.75%, 2.25%, 1.90%, 1.75%, 1.75% and 1.75%, respectively, of the Fund’s average daily net assets (the “expense limits”). In determining the Adviser’s obligation to reimburse expenses, the following expenses are not taken into account, and could cause the total annual fund operating expenses after expense reimbursement to exceed the numbers reflected above: (1) interest; (2) taxes; (3) dividend expense on short sales; (4) extraordinary or non-routine items, litigation expenses; and (5) expenses that the Fund has incurred but did not actually pay because of an expense offset arrangement. Unless Invesco continues the expense reimbursement agreement, it will terminate on June 30, 2023. During its term, the expense reimbursement agreement cannot be terminated or amended to increase the expense limits or reduce the expense reimbursement without approval of the Board of Trustees. The Adviser did not reimburse expenses during the period under these expense limits.
The Trust has entered into a master administrative services agreement with Invesco pursuant to which the Fund has agreed to pay Invesco for certain administrative costs incurred in providing accounting services to the Fund. For the year ended December 31, 2022, expenses incurred under the agreement are shown in the Statement of Operations as Administrative services fees. Invesco has entered into a sub-administration agreement whereby State Street Bank and Trust Company (“SSB”) serves as fund accountant and provides certain administrative services to the Fund. Pursuant to a custody agreement with the Trust on behalf of the Fund, SSB also serves as the Fund’s custodian.
The Trust has entered into a transfer agency and service agreement with Invesco Investment Services, Inc. (“IIS”) pursuant to which the Fund has agreed to pay IIS a fee for providing transfer agency and shareholder services to the Fund and reimburse IIS for certain expenses incurred by IIS in the course of providing such services. IIS may make payments to intermediaries that provide omnibus account services, sub-accounting services and/or networking services. All fees payable by IIS to intermediaries that provide omnibus account services or sub-accounting services are charged back to the Fund, subject to certain limitations approved by the Trust’s Board of Trustees. For the year ended December 31, 2022, expenses incurred under the agreement are shown in the Statement of Operations as Transfer agent fees.
The Trust has entered into master distribution agreements with Invesco Distributors, Inc. (“IDI”) to serve as the distributor for the Class A, Class C, Class R, Class S, Class Y, Class R5 and Class R6 shares of the Fund. The Trust has adopted plans pursuant to Rule 12b-1 under the 1940 Act with respect to the Fund’s Class A, Class C, Class R and Class S shares (collectively, the “Plans”). The Fund, pursuant to the Plans, pays IDI compensation at the annual rate of 0.25% of the Fund’s average daily net assets of Class A shares, 1.00% of the average daily net assets of Class C shares, 0.50% of the average daily net assets of Class R shares and 0.15% of the average daily net assets of Class S shares. The fees are accrued daily and paid monthly. Of the Plan payments, up to 0.25% of the average daily net assets of Class A, Class C and Class R shares and 0.15% of the average daily net assets of Class S shares may be paid to furnish continuing personal shareholder services to customers who purchase and own shares of such classes. Any amounts not paid as a service fee under the Plans would constitute an asset-based sales charge. Rules of the Financial Industry Regulatory Authority (“FINRA”) impose a cap on the total sales charges, including asset-based sales charges, that may be paid by any class of shares of the Fund. For the year ended December 31, 2022, expenses incurred under the Plans are shown in the Statement of Operations as Distribution fees.
Front-end sales commissions and CDSC (collectively, the “sales charges”) are not recorded as expenses of the Fund. Front-end sales commissions are deducted from proceeds from the sales of Fund shares prior to investment in Class A shares of the Fund. CDSC are deducted from redemption proceeds prior to remittance to the shareholder. During the year ended December 31, 2022, IDI advised the Fund that IDI retained $110,201 in front-end sales commissions from the sale of Class A shares and $16,523 and $2,592 from Class A and Class C shares, respectively, for CDSC imposed upon redemptions by shareholders.
Certain officers and trustees of the Trust are officers and directors of the Adviser, IIS and/or IDI.
NOTE 3–Additional Valuation Information
GAAP defines fair value as the price that would be received to sell an asset or paid to transfer a liability in an orderly transaction between market participants at the measurement date, under current market conditions. GAAP establishes a hierarchy that prioritizes the inputs to valuation methods, giving the highest priority to readily available unadjusted quoted prices in an active market for identical assets (Level 1) and the lowest priority to significant unobservable inputs (Level 3), generally when
| 15 | Invesco Select Risk: Growth Investor Fund |
market prices are not readily available. Based on the valuation inputs, the securities or other investments are tiered into one of three levels. Changes in valuation methods may result in transfers in or out of an investment’s assigned level:
| Level 1 - | Prices are determined using quoted prices in an active market for identical assets. | |
| Level 2 - | Prices are determined using other significant observable inputs. Observable inputs are inputs that other market participants may use in pricing a security. These may include quoted prices for similar securities, interest rates, prepayment speeds, credit risk, yield curves, loss severities, default rates, discount rates, volatilities and others. | |
| Level 3 - | Prices are determined using significant unobservable inputs. In situations where quoted prices or observable inputs are unavailable (for example, when there is little or no market activity for an investment at the end of the period), unobservable inputs may be used. Unobservable inputs reflect the Adviser’s assumptions about the factors market participants would use in determining fair value of the securities or instruments and would be based on the best available information. |
The following is a summary of the tiered valuation input levels, as of December 31, 2022. The level assigned to the securities valuations may not be an indication of the risk or liquidity associated with investing in those securities. Because of the inherent uncertainties of valuation, the values reflected in the financial statements may materially differ from the value received upon actual sale of those investments.
| Level 1 | Level 2 | Level 3 | Total | |||||||||||||
| ||||||||||||||||
Investments in Securities | ||||||||||||||||
| ||||||||||||||||
Affiliated Issuers | $ | 877,813,515 | $ | – | $– | $ | 877,813,515 | |||||||||
| ||||||||||||||||
Money Market Funds | 4,900,318 | 4,516,988 | – | 9,417,306 | ||||||||||||
| ||||||||||||||||
Total Investments | $ | 882,713,833 | $ | 4,516,988 | $– | $ | 887,230,821 | |||||||||
| ||||||||||||||||
NOTE 4–Expense Offset Arrangement(s)
The expense offset arrangement is comprised of transfer agency credits which result from balances in demand deposit accounts used by the transfer agent for clearing shareholder transactions. For the year ended December 31, 2022, the Fund received credits from this arrangement, which resulted in the reduction of the Fund’s total expenses of $9,962.
NOTE 5–Trustees’ and Officers’ Fees and Benefits
Trustees’ and Officers’ Fees and Benefits include amounts accrued by the Fund to pay remuneration to certain Trustees and Officers of the Fund. Trustees have the option to defer compensation payable by the Fund, and Trustees’ and Officers’ Fees and Benefits also include amounts accrued by the Fund to fund such deferred compensation amounts. Those Trustees who defer compensation have the option to select various Invesco Funds in which their deferral accounts shall be deemed to be invested. Finally, certain current Trustees were eligible to participate in a retirement plan that provided for benefits to be paid upon retirement to Trustees over a period of time based on the number of years of service. The Fund may have certain former Trustees who also participate in a retirement plan and receive benefits under such plan. Trustees’ and Officers’ Fees and Benefits include amounts accrued by the Fund to fund such retirement benefits. Obligations under the deferred compensation and retirement plans represent unsecured claims against the general assets of the Fund.
NOTE 6–Cash Balances
The Fund is permitted to temporarily carry a negative or overdrawn balance in its account with SSB, the custodian bank. Such balances, if any at period-end, are shown in the Statement of Assets and Liabilities under the payable caption Amount due custodian. To compensate the custodian bank for such overdrafts, the overdrawn Fund may either (1) leave funds as a compensating balance in the account so the custodian bank can be compensated by earning the additional interest; or (2) compensate by paying the custodian bank at a rate agreed upon by the custodian bank and Invesco, not to exceed the contractually agreed upon rate. The Fund may not purchase additional securities when any borrowings from banks or broker-dealers exceed 5% of the Fund’s total assets, or when any borrowings from an Invesco Fund are outstanding.
NOTE 7–Distributions to Shareholders and Tax Components of Net Assets
Tax Character of Distributions to Shareholders Paid During the Fiscal Years Ended December 31, 2022 and 2021:
| 2022 | 2021 | |||||||||||
| ||||||||||||
Ordinary income* | $ | 12,187,211 | $ | 44,545,753 | ||||||||
| ||||||||||||
Long-term capital gain | 36,601,402 | 23,141,664 | ||||||||||
| ||||||||||||
Total distributions | $ | 48,788,613 | $ | 67,687,417 | ||||||||
| ||||||||||||
| * | Includes short-term capital gain distributions, if any. |
Tax Components of Net Assets at Period-End:
| 2022 | ||||
| ||||
Undistributed ordinary income | $ | 6,005,217 | ||
| ||||
Undistributed long-term capital gain | 13,395,350 | |||
| ||||
Net unrealized appreciation (depreciation) – investments | (38,801,436 | ) | ||
| ||||
Temporary book/tax differences | (101,509 | ) | ||
| ||||
Shares of beneficial interest | 901,873,788 | |||
| ||||
Total net assets | $ | 882,371,410 | ||
| ||||
The difference between book-basis and tax-basis unrealized appreciation (depreciation) is due to differences in the timing of recognition of gains and losses on investments for tax and book purposes. The Fund’s net unrealized appreciation (depreciation) difference is attributable primarily to wash sales.
The temporary book/tax differences are a result of timing differences between book and tax recognition of income and/or expenses. The Fund’s temporary book/tax differences are the result of the trustee deferral of compensation and retirement plan benefits.
| 16 | Invesco Select Risk: Growth Investor Fund |
Capital loss carryforward is calculated and reported as of a specific date. Results of transactions and other activity after that date may affect the amount of capital loss carryforward actually available for the Fund to utilize. The ability to utilize capital loss carryforward in the future may be limited under the Internal Revenue Code and related regulations based on the results of future transactions.
The Fund does not have a capital loss carryforward as of December 31, 2022.
NOTE 8–Investment Transactions
The aggregate amount of investment securities (other than short-term securities, U.S. Government obligations and money market funds, if any) purchased and sold by the Fund during the year ended December 31, 2022 was $272,914,495 and $289,614,460, respectively. Cost of investments, including any derivatives, on a tax basis includes the adjustments for financial reporting purposes as of the most recently completed federal income tax reporting period-end.
Unrealized Appreciation (Depreciation) of Investments on a Tax Basis | ||||
Aggregate unrealized appreciation of investments | $57,837,315 | |||
| ||||
Aggregate unrealized (depreciation) of investments | (96,638,751 | ) | ||
| ||||
Net unrealized appreciation (depreciation) of investments | $(38,801,436 | ) | ||
| ||||
Cost of investments for tax purposes is $926,032,257.
NOTE 9–Reclassification of Permanent Differences
Primarily as a result of differing book/tax treatment of partnerships and distributions, on December 31, 2022, undistributed net investment income was increased by $685,426 and undistributed net realized gain was decreased by $685,426. This reclassification had no effect on the net assets or the distributable earnings (loss) of the Fund.
NOTE 10–Share Information
| Summary of Share Activity | ||||||||||||||||
| ||||||||||||||||
| Year ended | Year ended | |||||||||||||||
| December 31, 2022(a) | December 31, 2021 | |||||||||||||||
| Shares | Amount | Shares | Amount | |||||||||||||
| ||||||||||||||||
Sold: | ||||||||||||||||
Class A | 6,095,363 | $ | 87,099,917 | 5,767,516 | $ | 98,495,471 | ||||||||||
| ||||||||||||||||
Class C | 608,534 | 8,441,416 | 532,000 | 8,906,676 | ||||||||||||
| ||||||||||||||||
Class R | 478,639 | 6,648,080 | 330,716 | 5,633,671 | ||||||||||||
| ||||||||||||||||
Class S | 38,771 | 535,561 | 28,658 | 494,736 | ||||||||||||
| ||||||||||||||||
Class Y | 196,578 | 2,798,081 | 360,974 | 6,177,497 | ||||||||||||
| ||||||||||||||||
Class R5 | 441 | 6,165 | 282 | 4,937 | ||||||||||||
| ||||||||||||||||
Class R6 | 6,104 | 87,020 | 197,960 | 3,408,627 | ||||||||||||
| ||||||||||||||||
Issued as reinvestment of dividends: | ||||||||||||||||
Class A | 3,252,278 | 42,345,053 | 3,565,205 | 58,897,268 | ||||||||||||
| ||||||||||||||||
Class C | 155,309 | 1,991,063 | 174,949 | 2,851,658 | ||||||||||||
| ||||||||||||||||
Class R | 100,970 | 1,310,588 | 89,676 | 1,476,971 | ||||||||||||
| ||||||||||||||||
Class S | 78,126 | 1,015,639 | 90,463 | 1,491,736 | ||||||||||||
| ||||||||||||||||
Class Y | 46,853 | 608,157 | 49,021 | 806,880 | ||||||||||||
| ||||||||||||||||
Class R5 | 149 | 1,947 | 128 | 2,127 | ||||||||||||
| ||||||||||||||||
Class R6 | 409 | 5,355 | 2,127 | 35,307 | ||||||||||||
| ||||||||||||||||
Automatic conversion of Class C shares to Class A shares: | ||||||||||||||||
Class A | 288,355 | 4,109,381 | 327,512 | 5,552,372 | ||||||||||||
| ||||||||||||||||
Class C | (293,223 | ) | (4,109,381 | ) | (332,773 | ) | (5,552,372 | ) | ||||||||
| ||||||||||||||||
Reacquired: | ||||||||||||||||
Class A | (9,121,498 | ) | (130,135,302 | ) | (9,263,372 | ) | (157,845,588 | ) | ||||||||
| ||||||||||||||||
Class C | (579,661 | ) | (8,190,503 | ) | (846,822 | ) | (14,139,260 | ) | ||||||||
| ||||||||||||||||
Class R | (173,797 | ) | (2,510,528 | ) | (231,663 | ) | (3,954,448 | ) | ||||||||
| ||||||||||||||||
Class S | (167,684 | ) | (2,362,352 | ) | (174,571 | ) | (2,988,337 | ) | ||||||||
| ||||||||||||||||
Class Y | (221,563 | ) | (3,167,670 | ) | (197,595 | ) | (3,397,025 | ) | ||||||||
| ||||||||||||||||
Class R5 | (7 | ) | (105 | ) | (26,029 | ) | (441,335 | ) | ||||||||
| ||||||||||||||||
Class R6 | (32,502 | ) | (536,162 | ) | (201,811 | ) | (3,670,853 | ) | ||||||||
| ||||||||||||||||
Net increase in share activity | 756,944 | $ | 5,991,420 | 242,551 | $ | 2,246,716 | ||||||||||
| ||||||||||||||||
| (a) | There are entities that are record owners of more than 5% of the outstanding shares of the Fund and in the aggregate own 33% of the outstanding shares of the Fund. IDI has an agreement with these entities to sell Fund shares. The Fund, Invesco and/or Invesco affiliates may make payments to these entities, which are considered to be related to the Fund, for providing services to the Fund, Invesco and/or Invesco affiliates including but not limited to services such as securities brokerage, distribution, third party record keeping and account servicing. The Fund has no knowledge as to whether all or any portion of the shares owned of record by these entities are also owned beneficially. |
| 17 | Invesco Select Risk: Growth Investor Fund |
Report of Independent Registered Public Accounting Firm
To the Board of Trustees of AIM Growth Series (Invesco Growth Series) and Shareholders of Invesco Select Risk: Growth Investor Fund
Opinion on the Financial Statements
We have audited the accompanying statement of assets and liabilities, including the schedule of investments, of Invesco Select Risk: Growth Investor Fund (one of the funds constituting AIM Growth Series (Invesco Growth Series), referred to hereafter as the “Fund”) as of December 31, 2022, the related statement of operations for the year ended December 31, 2022, the statement of changes in net assets for each of the two years in the period ended December 31, 2022, including the related notes, and the financial highlights for each of the five years in the period ended December 31, 2022 (collectively referred to as the “financial statements”). In our opinion, the financial statements present fairly, in all material respects, the financial position of the Fund as of December 31, 2022, the results of its operations for the year then ended, the changes in its net assets for each of the two years in the period ended December 31, 2022 and the financial highlights for each of the five years in the period ended December 31, 2022 in conformity with accounting principles generally accepted in the United States of America.
Basis for Opinion
These financial statements are the responsibility of the Fund’s management. Our responsibility is to express an opinion on the Fund’s financial statements based on our audits. We are a public accounting firm registered with the Public Company Accounting Oversight Board (United States) (PCAOB) and are required to be independent with respect to the Fund in accordance with the U.S. federal securities laws and the applicable rules and regulations of the Securities and Exchange Commission and the PCAOB.
We conducted our audits of these financial statements in accordance with the standards of the PCAOB. Those standards require that we plan and perform the audit to obtain reasonable assurance about whether the financial statements are free of material misstatement, whether due to error or fraud.
Our audits included performing procedures to assess the risks of material misstatement of the financial statements, whether due to error or fraud, and performing procedures that respond to those risks. Such procedures included examining, on a test basis, evidence regarding the amounts and disclosures in the financial statements. Our audits also included evaluating the accounting principles used and significant estimates made by management, as well as evaluating the overall presentation of the financial statements. Our procedures included confirmation of securities owned as of December 31, 2022 by correspondence with the custodian, transfer agent and broker; when replies were not received from the broker, we performed other auditing procedures. We believe that our audits provide a reasonable basis for our opinion.
/s/PricewaterhouseCoopers LLP
Houston, Texas
February 22, 2023
We have served as the auditor of one or more of the investment companies in the Invesco group of investment companies since at least 1995. We have not been able to determine the specific year we began serving as auditor.
| 18 | Invesco Select Risk: Growth Investor Fund |
Calculating your ongoing Fund expenses
Example
As a shareholder of the Fund, you incur two types of costs: (1) transaction costs, which may include sales charges (loads) on purchase payments or contingent deferred sales charges on redemptions, if any; and (2) ongoing costs, including management fees, distribution and/or service (12b-1) fees, and other Fund expenses. This example is intended to help you understand your ongoing costs (in dollars) of investing in the Fund and to compare these costs with ongoing costs of investing in other mutual funds. The example is based on an investment of $1,000 invested at the beginning of the period and held for the entire period July 1, 2022 through December 31, 2022.
In addition to the fees and expenses which the Fund bears directly, the Fund indirectly bears a pro-rata share of the fees and expenses of the underlying funds in which the Fund invests. The amount of fees and expenses incurred indirectly by the Fund will vary because the underlying funds have varied expenses and fee levels and the Fund may own different proportions of the underlying funds at different times. Estimated underlying fund expenses are not expenses that are incurred directly by the Fund. They are expenses that are incurred directly by the underlying funds and are deducted from the value of the underlying funds the Fund invests in. The effect of the estimated underlying fund expenses that the Fund bears indirectly are included in the Fund’s total return.
Actual expenses
The table below provides information about actual account values and actual expenses. You may use the information in this table, together with the amount you invested, to estimate the expenses that you paid over the period. Simply divide your account value by $1,000 (for example, an $8,600 account value divided by $1,000 = 8.6), then multiply the result by the number in the table under the heading entitled “Actual Expenses Paid During Period” to estimate the expenses you paid on your account during this period.
Hypothetical example for comparison purposes
The table below also provides information about hypothetical account values and hypothetical expenses based on the Fund’s actual expense ratio and an assumed rate of return of 5% per year before expenses, which is not the Fund’s actual return.
The hypothetical account values and expenses may not be used to estimate the actual ending account balance or expenses you paid for the period. You may use this information to compare the ongoing costs of investing in the Fund and other funds. To do so, compare this 5% hypothetical example with the 5% hypothetical examples that appear in the shareholder reports of the other funds.
Please note that the expenses shown in the table are meant to highlight your ongoing costs only and do not reflect any transaction costs, such as sales charges (loads) on purchase payments or contingent deferred sales charges on redemptions, if any. Therefore, the hypothetical information is useful in comparing ongoing costs only, and will not help you determine the relative total costs of owning different funds. In addition, expenses shown in the table do not include the expenses of the underlying funds, which are borne indirectly by the Fund. If transaction costs and indirect expenses were included, your costs would have been higher.
| ACTUAL | HYPOTHETICAL (5% annual return before expenses) | |||||||||||
Beginning Account Value (07/01/22) | Ending Account Value (12/31/22)1 | Expenses Paid During Period2 | Ending Account Value (12/31/22) | Expenses Paid During | Annualized Expense Ratio | |||||||
Class A | $1,000.00 | $1,019.60 | $2.29 | $1,022.94 | $2.29 | 0.45% | ||||||
Class C | 1,000.00 | 1,015.30 | 6.10 | 1,019.16 | 6.11 | 1.20 | ||||||
Class R | 1,000.00 | 1,017.30 | 3.56 | 1,021.68 | 3.57 | 0.70 | ||||||
Class S | 1,000.00 | 1,020.00 | 1.78 | 1,023.44 | 1.79 | 0.35 | ||||||
Class Y | 1,000.00 | 1,020.80 | 1.02 | 1,024.20 | 1.02 | 0.20 | ||||||
Class R5 | 1,000.00 | 1,021.20 | 0.66 | 1,024.55 | 0.66 | 0.13 | ||||||
Class R6 | 1,000.00 | 1,020.50 | 0.61 | 1,024.60 | 0.61 | 0.12 | ||||||
| 1 | The actual ending account value is based on the actual total return of the Fund for the period July 1, 2022 through December 31, 2022, after actual expenses and will differ from the hypothetical ending account value which is based on the Fund’s expense ratio and a hypothetical annual return of 5% before expenses. |
| 2 | Expenses are equal to the Fund’s annualized expense ratio as indicated above multiplied by the average account value over the period, multiplied by 184/365 to reflect the most recent fiscal half year. |
| 19 | Invesco Select Risk: Growth Investor Fund |
Form 1099-DIV, Form 1042-S and other year–end tax information provide shareholders with actual calendar year amounts that should be included in their tax returns. Shareholders should consult their tax advisers.
The following distribution information is being provided as required by the Internal Revenue Code or to meet a specific state’s requirement.
The Fund designates the following amounts or, if subsequently determined to be different, the maximum amount allowable for its fiscal year ended December 31, 2022:
Federal and State Income Tax | ||||||
Long-Term Capital Gain Distributions | $ | 36,601,402 | ||||
Qualified Dividend Income* | 39.22 | % | ||||
Corporate Dividends Received Deduction* | 22.80 | % | ||||
U.S. Treasury Obligations* | 4.86 | % | ||||
Qualified Business Income* | 2.22 | % | ||||
Business Interest Income* | 16.48 | % | ||||
| * | The above percentages are based on ordinary income dividends paid to shareholders during the Fund’s fiscal year. |
| 20 | Invesco Select Risk: Growth Investor Fund |
The address of each trustee and officer is AIM Growth Series (Invesco Growth Series) (the “Trust”), 11 Greenway Plaza, Suite 1000, Houston, Texas 77046-1173. The trustees serve for the life of the Trust, subject to their earlier death, incapacitation, resignation, retirement or removal as more specifically provided in the Trust’s organizational documents. Each officer serves for a one year term or until their successors are elected and qualified. Column two below includes length of time served with predecessor entities, if any.
Name, Year of Birth and Position(s) Held with the Trust | Trustee and/or Officer Since | Principal Occupation(s) During Past 5 Years | Number of Fund Complex Overseen by Trustee | Other Directorship(s) Held by Trustee During Past 5 Years | ||||
| Interested Trustee | ||||||||
Martin L. Flanagan1 - 1960 Trustee and Vice Chair | 2007 | Executive Director, Chief Executive Officer and President, Invesco Ltd. (ultimate parent of Invesco and a global investment management firm); Trustee and Vice Chair, The Invesco Funds; Vice Chair, Investment Company Institute; and Member of Executive Board, SMU Cox School of Business
Formerly: Advisor to the Board, Invesco Advisers, Inc. (formerly known as Invesco Institutional (N.A.), Inc.); Chairman and Chief Executive Officer, Invesco Advisers, Inc. (registered investment adviser); Director, Chairman, Chief Executive Officer and President, Invesco Holding Company (US), Inc. (formerly IVZ Inc.) (holding company), Invesco Group Services, Inc. (service provider) and Invesco North American Holdings, Inc. (holding company); Director, Chief Executive Officer and President, Invesco Holding Company Limited (parent of Invesco and a global investment management firm); Director, Invesco Ltd.; Chairman, Investment Company Institute and President, Co-Chief Executive Officer, Co-President, Chief Operating Officer and Chief Financial Officer, Franklin Resources, Inc. (global investment management organization) | 189 | None |
| 1 | Mr. Flanagan is considered an interested person (within the meaning of Section 2(a)(19) of the 1940 Act) of the Trust because he is an officer of the Adviser to the Trust, and an officer and a director of Invesco Ltd., ultimate parent of the Adviser. |
| T-1 | Invesco Select Risk: Growth Investor Fund |
Trustees and Officers–(continued)
Name, Year of Birth and Position(s) Held with the Trust | Trustee and/or Officer Since | Principal Occupation(s) During Past 5 Years | Number of Fund Complex Overseen by Trustee | Other Directorship(s) Held by Trustee During Past 5 Years | ||||
| Independent Trustees | ||||||||
Beth Ann Brown - 1968 Trustee (2019) and Chair (August 2022) | 2019 | Independent Consultant
Formerly: Head of Intermediary Distribution, Managing Director, Strategic Relations, Managing Director, Head of National Accounts, Senior Vice President, National Account Manager and Senior Vice President, Key Account Manager, Columbia Management Investment Advisers LLC; Vice President, Key Account Manager, Liberty Funds Distributor, Inc.; and Trustee of certain Oppenheimer Funds | 189 | Director, Board of Directors of Caron Engineering Inc.; Advisor, Board of Advisors of Caron Engineering Inc.; President and Director, Acton Shapleigh Youth Conservation Corps (non-profit) Formerly: President and Director Director of Grahamtastic Connection (non-profit) | ||||
Cynthia Hostetler - 1962 Trustee | 2017 | Non-Executive Director and Trustee of a number of public and private business corporations
Formerly: Director, Aberdeen Investment Funds (4 portfolios); Director, Artio Global Investment LLC (mutual fund complex); Director, Edgen Group, Inc. (specialized energy and infrastructure products distributor); Director, Genesee & Wyoming, Inc. (railroads); Head of Investment Funds and Private Equity, Overseas Private Investment Corporation; President, First Manhattan Bancorporation, Inc.; and Attorney, Simpson Thacher & Bartlett LLP | 189 | Resideo Technologies, Inc. (smart home technology); Vulcan Materials Company (construction materials company); Trilinc Global Impact Fund; Textainer Group Holdings, (shipping container leasing company); Investment Company Institute (professional organization); and Independent Directors Council (professional organization) | ||||
Eli Jones - 1961 Trustee | 2016 | Professor and Dean Emeritus, Mays Business School - Texas A&M University
Formerly: Dean of Mays Business School-Texas A&M University; Professor and Dean, Walton College of Business, University of Arkansas and E.J. Ourso College of Business, Louisiana State University; and Director, Arvest Bank | 189 | Insperity, Inc. (formerly known as Administaff) (human resources provider); and Member of Regional Board of Directors and Board of Directors, First Financial Bancorp (regional bank) | ||||
Elizabeth Krentzman - 1959 Trustee | 2019 | Formerly: Principal and Chief Regulatory Advisor for Asset Management Services and U.S. Mutual Fund Leader of Deloitte & Touche LLP; General Counsel of the Investment Company Institute (trade association); National Director of the Investment Management Regulatory Consulting Practice, Principal, Director and Senior Manager of Deloitte & Touche LLP; Assistant Director of the Division of Investment Management - Office of Disclosure and Investment Adviser Regulation of the U.S. Securities and Exchange Commission and various positions with the Division of Investment Management – Office of Regulatory Policy of the U.S. Securities and Exchange Commission; Associate at Ropes & Gray LLP; and Trustee of certain Oppenheimer Funds | 189 | Formerly: Member of the Cartica Funds Board of Directors (private investment fund); Trustee of the University of Florida National Board Foundation; and Member of the University of Florida Law Center Association, Inc. Board of Trustees, Audit Committee and Membership Committee | ||||
Anthony J. LaCava, Jr. - 1956 Trustee | 2019 | Formerly: Director and Member of the Audit Committee, Blue Hills Bank (publicly traded financial institution) and Managing Partner, KPMG LLP | 189 | Blue Hills Bank; Chairman, Bentley University; Member, Business School Advisory Council; and Nominating Committee, KPMG LLP | ||||
Prema Mathai-Davis - 1950 Trustee | 2001 | Retired
Formerly: Co-Founder & Partner of Quantalytics Research, LLC, (a FinTech Investment Research Platform for the Self-Directed Investor); Trustee of YWCA Retirement Fund; CEO of YWCA of the USA; Board member of the NY Metropolitan Transportation Authority; Commissioner of the NYC Department of Aging; and Board member of Johns Hopkins Bioethics Institute | 189 | Member of Board of Positive Planet US (non-profit) and HealthCare Chaplaincy Network (non-profit) |
| T-2 | Invesco Select Risk: Growth Investor Fund |
Trustees and Officers–(continued)
Name, Year of Birth and Position(s) Held with the Trust | Trustee and/or Officer Since | Principal Occupation(s) During Past 5 Years | Number of Fund Complex Overseen by Trustee | Other Directorship(s) Held by Trustee During Past 5 Years | ||||
| Independent Trustees–(continued) | ||||||||
Joel W. Motley - 1952 Trustee | 2019 | Director of Office of Finance, Federal Home Loan Bank System; Managing Director of Carmona Motley Inc. (privately held financial advisor); Member of the Council on Foreign Relations and its Finance and Budget Committee; Chairman Emeritus of Board of Human Rights Watch and Member of its Investment Committee; and Member of Investment Committee Board of Historic Hudson Valley (non-profit cultural organization); Member of the Board, Blue Ocean Acquisition Corp.; and Member of the Vestry and the Investment Committee of Trinity Church Wall Street.
Formerly: Managing Director of Public Capital Advisors, LLC (privately held financial advisor); Managing Director of Carmona Motley Hoffman, Inc. (privately held financial advisor); Trustee of certain Oppenheimer Funds; and Director of Columbia Equity Financial Corp. (privately held financial advisor) | 189 | Member of Board of Trust for Mutual Understanding (non-profit promoting the arts and environment); Member of Board of Greenwall Foundation (bioethics research foundation) and its Investment Committee; Member of Board of Friends of the LRC (non-profit legal advocacy); and Board Member and Investment Committee Member of Pulitzer Center for Crisis Reporting (non-profit journalism) | ||||
Teresa M. Ressel - 1962 Trustee | 2017 | Non-executive director and trustee of a number of public and private business corporations
Formerly: Chief Executive Officer, UBS Securities LLC (investment banking); Chief Operating Officer, UBS AG Americas (investment banking); Sr. Management Team Olayan America, The Olayan Group (international investor/commercial/industrial); Assistant Secretary for Management & Budget and Designated Chief Financial Officer, U.S. Department of Treasury and Director, ON Semiconductor Corporation (semiconductor manufacturing) | 189 | None | ||||
Robert C. Troccoli - 1949 Trustee | 2016 | Retired
Formerly: Adjunct Professor, University of Denver - Daniels College of Business; and Managing Partner, KPMG LLP | 189 | None | ||||
Daniel S. Vandivort - 1954 Trustee | 2019 | President, Flyway Advisory Services LLC (consulting and property management)
Formerly: President and Chief Investment Officer, previously Head of Fixed Income, Weiss Peck and Greer/Robeco Investment Management; Trustee and Chair, Weiss Peck and Greer Funds Board; and various capacities at CS First Boston including Head of Fixed Income at First Boston Asset Management. | 189 | Formerly: Trustee and Governance Chair, Oppenheimer Funds; Treasurer, Chairman of the Audit and Finance Committee, Huntington Disease Foundation of America | ||||
| T-3 | Invesco Select Risk: Growth Investor Fund |
Trustees and Officers–(continued)
Name, Year of Birth and Position(s) Held with the Trust | Trustee and/or Officer Since | Principal Occupation(s) During Past 5 Years | Number of Fund Complex Overseen by Trustee | Other Directorship(s) Held by Trustee During Past 5 Years | ||||
| Officers | ||||||||
Sheri Morris - 1964 President and Principal Executive Officer | 1999 | Director, Invesco Trust Company; Head of Global Fund Services, Invesco Ltd.; President and Principal Executive Officer, The Invesco Funds; Vice President, Invesco Exchange-Traded Fund Trust, Invesco Exchange-Traded Fund Trust II, Invesco India Exchange-Traded Fund Trust, Invesco Actively Managed Exchange-Traded Fund Trust, Invesco Actively Managed Exchange-Traded Commodity Fund Trust and Invesco Exchange-Traded Self-Indexed Fund Trust; and Vice President, OppenheimerFunds, Inc.
Formerly: Vice President, Treasurer and Principal Financial Officer, The Invesco Funds; Vice President, Invesco AIM Advisers, Inc., Invesco AIM Capital Management, Inc. and Invesco AIM Private Asset Management, Inc.; Assistant Vice President and Assistant Treasurer, The Invesco Funds; Vice President and Assistant Vice President, Invesco Advisers, Inc.; Assistant Vice President, Invesco AIM Capital Management, Inc. and Invesco AIM Private Asset Management, Inc.; Treasurer, Invesco Exchange-Traded Fund Trust, Invesco Exchange-Traded Fund Trust II, Invesco India Exchange-Traded Fund Trust and Invesco Actively Managed Exchange-Traded Fund Trust; and Senior Vice President, Invesco Advisers, Inc. (formerly known as Invesco Institutional (N.A.), Inc.) (registered investment adviser) | N/A | N/A | ||||
Jeffrey H. Kupor - 1968 Senior Vice President, Chief Legal Officer and Secretary | 2018 | Head of Legal of the Americas, Invesco Ltd.; Senior Vice President and Secretary, Invesco Advisers, Inc. (formerly known as Invesco Institutional (N.A.), Inc.) (registered investment adviser); Secretary, Invesco Distributors, Inc. (formerly known as Invesco AIM Distributors, Inc.); Vice President and Secretary, Invesco Investment Services, Inc. (formerly known as Invesco AIM Investment Services, Inc.); Senior Vice President, Chief Legal Officer and Secretary, The Invesco Funds; Secretary and General Counsel, Invesco Investment Advisers LLC (formerly known as Van Kampen Asset Management); Secretary and General Counsel, Invesco Capital Markets, Inc. (formerly known as Van Kampen Funds Inc.); Chief Legal Officer, Invesco Exchange-Traded Fund Trust, Invesco Exchange-Traded Fund Trust II, Invesco India Exchange-Traded Fund Trust, Invesco Actively Managed Exchange-Traded Fund Trust, Invesco Actively Managed Exchange-Traded Commodity Fund Trust and Invesco Exchange-Traded Self-Indexed Fund Trust;; Secretary and Vice President, Harbourview Asset Management Corporation; Secretary and Vice President, OppenheimerFunds, Inc. and Invesco Managed Accounts, LLC; Secretary and Senior Vice President, OFI Global Institutional, Inc.; Secretary and Vice President, OFI SteelPath, Inc.; Secretary and Vice President, Oppenheimer Acquisition Corp.; Secretary and Vice President, Shareholder Services, Inc.; and Secretary and Vice President, Trinity Investment Management Corporation
Formerly: Senior Vice President, Invesco Distributors, Inc.; Secretary and Vice President, Jemstep, Inc.; Head of Legal, Worldwide Institutional, Invesco Ltd.; Secretary and General Counsel, INVESCO Private Capital Investments, Inc.; Senior Vice President, Secretary and General Counsel, Invesco Management Group, Inc. (formerly known as Invesco AIM Management Group, Inc.); Assistant Secretary, INVESCO Asset Management (Bermuda) Ltd.; Secretary and General Counsel, Invesco Private Capital, Inc.; Assistant Secretary and General Counsel, INVESCO Realty, Inc.; Secretary and General Counsel, Invesco Senior Secured Management, Inc.; Secretary, Sovereign G./P. Holdings Inc.; Secretary, Invesco Indexing LLC; and Secretary, W.L. Ross & Co., LLC | N/A | N/A | ||||
Andrew R. Schlossberg - 1974 Senior Vice President | 2019 | Senior Vice President, Invesco Group Services, Inc.; Head of the Americas and Senior Managing Director, Invesco Ltd.; Director and Senior Vice President, Invesco Advisers, Inc. (formerly known as Invesco Institutional (N.A.), Inc.) (registered investment adviser); Director and Chairman, Invesco Investment Services, Inc. (formerly known as Invesco AIM Investment Services, Inc.) (registered transfer agent); Senior Vice President, The Invesco Funds; and Director, Invesco Investment Advisers LLC (formerly known as Van Kampen Asset Management)
Formerly: Director, President and Chairman, Invesco Insurance Agency, Inc.; Director, Invesco UK Limited; Director and Chief Executive, Invesco Asset Management Limited and Invesco Fund Managers Limited; Assistant Vice President, The Invesco Funds; Senior Vice President, Invesco Advisers, Inc. (formerly known as Invesco Institutional (N.A.), Inc.) (registered investment adviser); Director and Chief Executive, Invesco Administration Services Limited and Invesco Global Investment Funds Limited; Director, Invesco Distributors, Inc.; Head of EMEA, Invesco Ltd.; President, Invesco Actively Managed Exchange-Traded Commodity Fund Trust, Invesco Actively Managed Exchange-Traded Fund Trust, Invesco Exchange-Traded Fund Trust, Invesco Exchange-Traded Fund Trust II and Invesco India Exchange-Traded Fund Trust; and Managing Director and Principal Executive Officer, Invesco Capital Management LLC | N/A | N/A |
| T-4 | Invesco Select Risk: Growth Investor Fund |
Trustees and Officers–(continued)
Name, Year of Birth and Position(s) Held with the Trust | Trustee and/or Officer Since | Principal Occupation(s) During Past 5 Years | Number of Fund Complex Overseen by Trustee | Other Directorship(s) Held by Trustee During Past 5 Years | ||||
| Officers–(continued) | ||||||||
John M. Zerr - 1962 Senior Vice President | 2006 | Chief Operating Officer of the Americas; Senior Vice President, Invesco Advisers, Inc. (formerly known as Invesco Institutional (N.A.), Inc.) (registered investment adviser); Senior Vice President, Invesco Distributors, Inc. (formerly known as Invesco AIM Distributors, Inc.); Director and Vice President, Invesco Investment Services, Inc. (formerly known as Invesco AIM Investment Services, Inc.) Senior Vice President, The Invesco Funds; Managing Director, Invesco Capital Management LLC; Director, Invesco Investment Advisers LLC (formerly known as Van Kampen Asset Management); Senior Vice President, Invesco Capital Markets, Inc. (formerly known as Van Kampen Funds Inc.); Manager, Invesco Indexing LLC; Manager, Invesco Specialized Products, LLC; Member, Invesco Canada Funds Advisory Board; Director, President and Chief Executive Officer, Invesco Corporate Class Inc. (corporate mutual fund company); and Director, Chairman, President and Chief Executive Officer, Invesco Canada Ltd. (formerly known as Invesco Trimark Ltd./Invesco Trimark Ltèe) (registered investment adviser and registered transfer agent); President, Invesco, Inc.; President, Invesco Global Direct Real Estate Feeder GP Ltd.; President, Invesco IP Holdings (Canada) Ltd; President, Invesco Global Direct Real Estate GP Ltd.; President, Invesco Financial Services Ltd. / Services Financiers Invesco Ltée; and Director and Chairman, Invesco Trust Company
Formerly: President, Trimark Investments Ltd/Services Financiers Invesco Ltee; Director and Senior Vice President, Invesco Insurance Agency, Inc.; Director and Senior Vice President, Invesco Management Group, Inc. (formerly known as Invesco AIM Management Group, Inc.); Secretary and General Counsel, Invesco Management Group, Inc. (formerly known as Invesco AIM Management Group, Inc.); Secretary, Invesco Investment Services, Inc. (formerly known as Invesco AIM Investment Services, Inc.); Chief Legal Officer and Secretary, The Invesco Funds; Secretary and General Counsel, Invesco Investment Advisers LLC (formerly known as Van Kampen Asset Management); Secretary and General Counsel, Invesco Capital Markets, Inc. (formerly known as Van Kampen Funds Inc.); Chief Legal Officer, Invesco Exchange-Traded Fund Trust, Invesco Exchange-Traded Fund Trust II, Invesco India Exchange-Traded Fund Trust, Invesco Actively Managed Exchange-Traded Fund Trust, Invesco Actively Managed Exchange-Traded Commodity Fund Trust and Invesco Exchange-Traded Self-Indexed Fund Trust; Secretary, Invesco Indexing LLC; Director, Secretary, General Counsel and Senior Vice President, Van Kampen Exchange Corp.; Director, Vice President and Secretary, IVZ Distributors, Inc. (formerly known as INVESCO Distributors, Inc.); Director and Vice President, INVESCO Funds Group, Inc.; Director and Vice President, Van Kampen Advisors Inc.; Director, Vice President, Secretary and General Counsel, Van Kampen Investor Services Inc.; Director and Secretary, Invesco Distributors, Inc. (formerly known as Invesco AIM Distributors, Inc.); Director, Senior Vice President, General Counsel and Secretary, Invesco AIM Advisers, Inc. and Van Kampen Investments Inc.; Director, Vice President and Secretary, Fund Management Company; Director, Senior Vice President, Secretary, General Counsel and Vice President, Invesco AIM Capital Management, Inc.; and Chief Operating Officer and General Counsel, Liberty Ridge Capital, Inc. (an investment adviser) | N/A | N/A | ||||
Gregory G. McGreevey - 1962 Senior Vice President | 2012 | Senior Managing Director, Invesco Ltd.; Director, Chairman, President, and Chief Executive Officer, Invesco Advisers, Inc. (formerly known as Invesco Institutional (N.A.), Inc.) (registered investment adviser); Director, Invesco Mortgage Capital, Inc. and Invesco Senior Secured Management, Inc.; Senior Vice President, The Invesco Funds; President, SNW Asset Management Corporation and Invesco Managed Accounts, LLC; Chairman and Director, Invesco Private Capital, Inc.; Chairman and Director, INVESCO Private Capital Investments, Inc.; Chairman and Director, INVESCO Realty, Inc.; and Senior Vice President, Invesco Group Services, Inc.
Formerly: Senior Vice President, Invesco Management Group, Inc. and Invesco Advisers, Inc.; Assistant Vice President, The Invesco Funds | N/A | N/A | ||||
Adrien Deberghes - 1967 Principal Financial Officer, Treasurer and Vice President | 2020 | Head of the Fund Office of the CFO and Fund Administration; Vice President, Invesco Advisers, Inc.; Principal Financial Officer, Treasurer and Vice President, The Invesco Funds; Vice President, Invesco Exchange-Traded Fund Trust, Invesco Exchange-Traded Fund Trust II, Invesco India Exchange-Traded Fund Trust, Invesco Actively Managed Exchange-Traded Fund Trust, Invesco Actively Managed Exchange-Traded Commodity Fund Trust and Invesco Exchange-Traded Self-Indexed Fund Trust
Formerly: Senior Vice President and Treasurer, Fidelity Investments | N/A | N/A | ||||
Crissie M. Wisdom - 1969 Anti-Money Laundering Compliance Officer | 2013 | Anti-Money Laundering and OFAC Compliance Officer for Invesco U.S. entities including: Invesco Advisers, Inc. and its affiliates, Invesco Capital Markets, Inc., Invesco Distributors, Inc., Invesco Investment Services, Inc., The Invesco Funds, Invesco Capital Management, LLC, Invesco Trust Company; and Fraud Prevention Manager for Invesco Investment Services, Inc. | N/A | N/A |
| T-5 | Invesco Select Risk: Growth Investor Fund |
Trustees and Officers–(continued)
Name, Year of Birth and Position(s) Held with the Trust | Trustee and/or Officer Since | Principal Occupation(s) During Past 5 Years | Number of Fund Complex Overseen by Trustee | Other Directorship(s) Held by Trustee During Past 5 Years | ||||
| Officers–(continued) | ||||||||
Todd F. Kuehl - 1969 Chief Compliance Officer and Senior Vice President | 2020 | Chief Compliance Officer, Invesco Advisers, Inc. (registered investment adviser); and Chief Compliance Officer and Senior Vice President, The Invesco Funds
Formerly: Managing Director and Chief Compliance Officer, Legg Mason (Mutual Funds); Chief Compliance Officer, Legg Mason Private Portfolio Group (registered investment adviser) | N/A | N/A | ||||
James Bordewick, Jr. - 1959 Senior Vice President and Senior Officer | 2022 | Senior Vice President and Senior Officer, The Invesco Funds
Formerly: Chief Legal Officer, KingsCrowd, Inc. (research and analytical platform for investment in private capital markets); Chief Operating Officer and Head of Legal and Regulatory, Netcapital (private capital investment platform); Managing Director, General Counsel of asset management and Chief Compliance Officer for asset management and private banking, Bank of America Corporation; Chief Legal Officer, Columbia Funds and BofA Funds;
Senior Vice President and Associate General Counsel, MFS Investment Management; Chief Legal Officer, MFS Funds; Associate, Ropes & Gray; and Associate, Gaston Snow & Ely Bartlett | N/A | N/A |
The Statement of Additional Information of the Trust includes additional information about the Fund’s Trustees and is available upon request, without charge, by calling 1.800.959.4246. Please refer to the Fund’s Statement of Additional Information for information on the Fund’s sub-advisers.
| Office of the Fund | Investment Adviser | Distributor | Auditors | |||
| 11 Greenway Plaza, Suite 1000 | Invesco Advisers, Inc. | Invesco Distributors, Inc. | PricewaterhouseCoopers LLP | |||
| Houston, TX 77046-1173 | 1555 Peachtree Street, N.E. | 11 Greenway Plaza, Suite 1000 | 1000 Louisiana Street, Suite 5800 | |||
| Atlanta, GA 30309 | Houston, TX 77046-1173 | Houston, TX 77002-5021 | ||||
| Counsel to the Fund | Counsel to the Independent Trustees | Transfer Agent | Custodian | |||
| Stradley Ronon Stevens & Young, LLP | Sidley Austin LLP | Invesco Investment Services, Inc. | State Street Bank and Trust Company | |||
| 2005 Market Street, Suite 2600 | 787 Seventh Avenue | 11 Greenway Plaza, Suite 1000 | 225 Franklin Street | |||
| Philadelphia, PA 19103-7018 | New York, NY 10019 | Houston, TX 77046-1173 | Boston, MA 02110-2801 | |||
| T-6 | Invesco Select Risk: Growth Investor Fund |
(This page intentionally left blank)

Go paperless with eDelivery
Visit invesco.com/edelivery to enjoy the convenience and security of anytime electronic access to your investment documents.
With eDelivery, you can elect to have any or all of the following materials delivered straight to your inbox to download, save and print from your own computer:
∎ Fund reports and prospectuses
∎ Quarterly statements
∎ Daily confirmations
∎ Tax forms
Invesco mailing information
Send general correspondence to Invesco Investment Services, Inc., P.O. Box 219078, Kansas City, MO 64121-9078.
Important notice regarding delivery of security holder documents
To reduce Fund expenses, only one copy of most shareholder documents may be mailed to shareholders with multiple accounts at the same address (Householding). Mailing of your shareholder documents may be householded indefinitely unless you instruct us otherwise. If you do not want the mailing of these documents to be combined with those for other members of your household, please contact Invesco Investment Services, Inc. at 800 959 4246 or contact your financial institution. We will begin sending you individual copies for each account within 30 days after receiving your request.
Fund holdings and proxy voting information
The Fund provides a complete list of its portfolio holdings four times each year, at the end of each fiscal quarter. For the second and fourth quarters, the list appears, respectively, in the Fund’s semiannual and annual reports to shareholders. For the first and third quarters, the Fund files the list with the Securities and Exchange Commission (SEC) as an exhibit to its reports on Form N-PORT. The most recent list of portfolio holdings is available at invesco.com/completeqtrholdings. Shareholders can also look up the Fund’s Form N-PORT filings on the SEC website, sec.gov. The SEC file numbers for the Fund are shown below.
A description of the policies and procedures that the Fund uses to determine how to vote proxies relating to portfolio securities is available without charge, upon request, from our Client Services department at 800 959 4246, or at invesco.com/ corporate/about-us/esg. The information is also available on the SEC website, sec.gov.
Information regarding how the Fund voted proxies related to its portfolio securities during the most recent 12-month period ended June 30 is available at invesco.com/proxysearch. This information is also available on the SEC website, sec.gov.
Invesco Advisers, Inc. is an investment adviser; it provides investment advisory services to individual and institutional clients and does not sell securities. Invesco Distributors, Inc. is the US distributor for Invesco Ltd.’s retail mutual funds, exchange-traded funds and institutional money market funds. Both are wholly owned, indirect subsidiaries of Invesco Ltd.

| SEC file number(s): 811-02699 and 002-57526 | Invesco Distributors, Inc. | GAL-AR-1 |

| ||||
Annual Report to Shareholders |
|
December 31, 2022 |
| |
Invesco Select Risk: High Growth Investor Fund
Nasdaq:
A: OAAIX ∎ C: OCAIX ∎ R: ONAIX ∎ Y: OYAIX ∎ R5: PXQIX ∎ R6: PXGGX
Management’s Discussion of Fund Performance
| ||||
For the fiscal year ended December 31, 2022, Class A shares of Invesco Select Risk: High Growth Investor Fund (the Fund), at net asset value (NAV), underper-formed the Custom Invesco Select Risk: High Growth Investor Index. Your Fund’s long-term performance appears later in this report.
|
| |||
Fund vs. Indexes | ||||
Total returns, 12/31/21 to 12/31/22, at net asset value (NAV). Performance shown does not include applicable contingent deferred sales charges (CDSC) or front-end sales charges, which would have reduced performance. |
| |||
Class A Shares | -19.59 | % | ||
Class C Shares | -20.19 | |||
Class R Shares | -19.83 | |||
Class Y Shares | -19.42 | |||
Class R5 Shares | -19.38 | |||
Class R6 Shares | -19.38 | |||
Bloomberg Global Aggregate USD Hedged Index▼ | -11.22 | |||
Custom Invesco Select Risk: High Growth Investor Index∎ | -17.58 | |||
MSCI All Country World Index▼ | -18.36 | |||
Source(s): ▼RIMES Technologies Corp.; ∎Invesco, RIMES Technologies Corp. | ||||
Market conditions and your Fund
Global equity markets declined in the first half of 2022 amid volatility sparked by Russia’s invasion of Ukraine, rising commodity prices, rampant global inflation and central banks shifting toward tighter monetary policy. Russia’s invasion exacerbated inflationary pressures, disrupting already strained supply chains, and increasing shortages of oil, gas and raw materials, with the price of oil rising sharply.
Inflation headwinds continued into the third quarter of 2022. The US Federal Reserve (the Fed), the European Central Bank and the Bank of England all raised interest rates. In contrast, the People’s Bank of China lowered its policy rate and the Bank of Japan kept rates the same. Emerging market equities, hampered by the strong US dollar, underperformed developed market equities.
Global equity markets posted gains for the fourth quarter of 2022, after better inflation data sparked a rally in October and November. However, investor sentiment worsened in December after central banks signaled continued interest rate hikes into 2023 as inflation remained above target levels. International stocks outperformed US stocks in the fourth quarter, led by results in Europe and the UK. Emerging market equities also posted gains for the fourth quarter of 2022, boosted by China, which eased its zero-COVID-19 policy and started to reopen even as COVID-19 infections surged.
Despite the rebound in the fourth quarter of 2022, at the end of the fiscal year ended December 31, 2022, trailing one-year returns for developed market equities and emerging market equities were both in negative territory.
Strategic asset class exposures in the Fund are obtained through underlying representative mutual funds and exchange-traded funds
targeting pre-defined risk levels. From an absolute performance perspective, an allocation to value style-specific US equity was slightly additive to performance and leading contributor to absolute return. The remaining allocations to equity, fixed income and alternative assets were all detractors from absolute performance as the portfolio produced a negative return for the fiscal year.
From a relative performance perspective, the portfolio underperformed its custom benchmark, the Custom Invesco Select Risk: High Growth Investor Index, during the fiscal year. Underperformance was driven mainly by manager selection within the equity allocations. Within the equity allocation, the Invesco Global Fund, Invesco Discovery Mid Cap Growth Fund and Invesco International Small-Mid Company Fund were the primary detractors.
Conversely, allocations to other fixed income funds and allocations to style-specific equities were the leading contributors to relative performance during the fiscal year. Within the allocations, the Invesco S&P 500 Low Volatility ETF, Invesco Russell 1000 Dynamic Multifactor ETF and Invesco Value Opportunities Fund were the leading contributors to relative performance.
Please note that some of the Fund’s underlying funds use derivatives, including futures and total return swaps, which may create economic leverage in the underlying funds. Therefore, some of the performance of the strategy, both positive and negative, can be attributed to these instruments. Derivatives can be a cost-effective way to gain exposure to asset classes. However, derivatives may amplify traditional investment risks through the creation of leverage and may be less liquid than traditional securities.
Thank you for your continued investment in the Invesco Select Risk: High Growth Investor Fund.
Portfolio manager(s):
Jeffrey Bennett
Jacob Borbidge
Duy Nguyen
The views and opinions expressed in management’s discussion of Fund performance are those of Invesco Advisers, Inc. and its affiliates. These views and opinions are subject to change at any time based on factors such as market and economic conditions. These views and opinions may not be relied upon as investment advice or recommendations, or as an offer for a particular security. The information is not a complete analysis of every aspect of any market, country, industry, security or the Fund. Statements of fact are from sources considered reliable, but Invesco Advisers, Inc. makes no representation or warranty as to their completeness or accuracy. Although historical performance is no guarantee of future results, these insights may help you understand our investment management philosophy.
See important Fund and, if applicable, index disclosures later in this report.
2 Invesco Select Risk: High Growth Investor Fund
Your Fund’s Long-Term Performance
Results of a $10,000 Investment — Oldest Share Class(es)
Fund and index data from 12/31/12
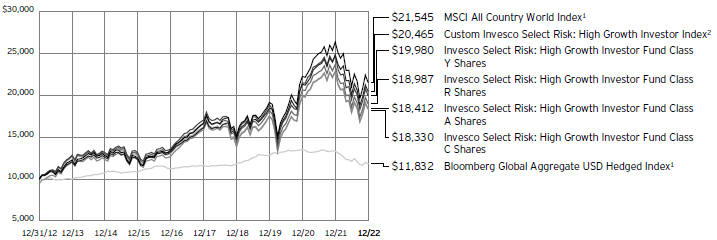
| 1 | Source: RIMES Technologies Corp. |
| 2 | Source: Invesco, RIMES Technologies Corp. |
Past performance cannot guarantee future results.
The data shown in the chart include reinvested distributions, applicable sales charges and Fund expenses including management
fees. Index results include reinvested dividends, but they do not reflect sales charges. Performance of the peer group, if applicable, reflects fund expenses and management fees;
performance of a market index does not. Performance shown in the chart does not reflect deduction of taxes a shareholder would pay on Fund distributions or sale of Fund shares.
3 Invesco Select Risk: High Growth Investor Fund
Average Annual Total Returns |
| |||
As of 12/31/22, including maximum applicable sales charges |
| |||
Class A Shares | ||||
Inception (4/5/05) | 5.55 | % | ||
10 Years | 6.29 | |||
5 Years | 1.82 | |||
1 Year | -24.02 | |||
Class C Shares | ||||
Inception (4/5/05) | 5.52 | % | ||
10 Years | 6.25 | |||
5 Years | 2.19 | |||
1 Year | -20.94 | |||
Class R Shares | ||||
Inception (4/5/05) | 5.65 | % | ||
10 Years | 6.62 | |||
5 Years | 2.70 | |||
1 Year | -19.83 | |||
Class Y Shares | ||||
Inception (4/5/05) | 6.23 | % | ||
10 Years | 7.17 | |||
5 Years | 3.23 | |||
1 Year | -19.42 | |||
Class R5 Shares | ||||
10 Years | 7.01 | % | ||
5 Years | 3.20 | |||
1 Year | -19.38 | |||
Class R6 Shares | ||||
10 Years | 7.02 | % | ||
5 Years | 3.22 | |||
1 Year | -19.38 | |||
Effective May 24, 2019, Class A, Class C, Class R and Class Y shares of the Oppenheimer Portfolio Series: Growth investor Fund, (the predecessor fund), were reorganized into Class A, Class C, Class R and Class Y shares, respectively, of the Invesco Select Risk: High Growth Investor Fund. Returns shown above, for periods ending on or prior to May 24, 2019, for Class A, Class C, Class R and Class Y shares are those for Class A, Class C, Class R and Class Y shares of the predecessor fund. Share class returns will differ from the predecessor fund because of different expenses.
Class R5 shares incepted on May 24, 2019. Performance shown on or prior to that date is that of the predecessor fund’s Class A shares at net asset value and includes the 12b-1 fees applicable to Class A shares.
Class R6 shares incepted on May 24, 2019. Performance shown on or prior to that date is that of the predecessor fund’s Class A shares at net asset value and includes the 12b-1 fees applicable to Class A shares.
The performance data quoted represent past performance and cannot guarantee future results; current performance may be lower or higher. Please visit invesco.com/ performance for the most recent
month-end performance. Performance figures reflect reinvested distributions, changes in net asset value and the effect of the maximum sales charge unless otherwise stated. Performance figures do not reflect deduction of taxes a shareholder would pay on Fund distributions or sale of Fund shares. Investment return and principal value will fluctuate so that you may have a gain or loss when you sell shares.
Class A share performance reflects the maximum 5.50% sales charge, and Class C share performance reflects the applicable contingent deferred sales charge (CDSC) for the period involved. The CDSC on Class C shares is 1% for the first year after purchase. Class R, Class Y, Class R5 and Class R6 shares do not have a front-end sales charge or a CDSC; therefore, performance is at net asset value.
The performance of the Fund’s share classes will differ primarily due to different sales charge structures and class expenses.
Fund performance reflects any applicable fee waivers and/or expense reimbursements. Had the adviser not waived fees and/or reimbursed expenses currently or in the past, returns would have been lower. See current prospectus for more information.
4 Invesco Select Risk: High Growth Investor Fund
Invesco Select Risk: High Growth Investor Fund’s investment objective is to seek total return.
| ∎ | Unless otherwise stated, information presented in this report is as of December 31, 2022, and is based on total net assets. |
| ∎ | Unless otherwise noted, all data is provided by Invesco. |
| ∎ | To access your Fund’s reports/prospectus, visit invesco.com/fundreports. |
About indexes used in this report
| ∎ | The MSCI All Country World Index is an unmanaged index considered representative of large- and mid-cap stocks across developed and emerging markets. The index is computed using the net return, which withholds applicable taxes for non-resident investors. |
| ∎ | The Custom Invesco Select Risk: High Growth Investor Index is composed of 90% MSCI All Country World Index and 10% Bloomberg Global Aggregate USD Hedged Index. |
| ∎ | The Bloomberg Global Aggregate USD Hedged Index tracks fixed-income performance of regions around the world while hedging the currency back to the US dollar. |
| ∎ | The Fund is not managed to track the performance of any particular index, including the index(es) described here, and consequently, the performance of the Fund may deviate significantly from the performance of the index(es). |
| ∎ | A direct investment cannot be made in an index. Unless otherwise indicated, index results include reinvested dividends, and they do not reflect sales charges. Performance of the peer group, if applicable, reflects fund expenses; performance of a market index does not. |
This report must be accompanied or preceded by a currently effective Fund prospectus, which contains more complete information, including sales charges and expenses. Investors should read it carefully before investing. | ||
NOT FDIC INSURED | MAY LOSE VALUE | NO BANK GUARANTEE | ||
5 Invesco Select Risk: High Growth Investor Fund
Fund Information
Portfolio Composition*
| By fund type | % of total investments | |
Equity Funds | 86.75% | |
Fixed Income Funds | 7.73 | |
Alternative Funds | 4.91 | |
Money Market Funds | 0.61 | |
| * | Based on the Schedule of Investments, which classifies each underlying fund and other investments into broad asset classes based on their predominant investments. |
The Fund’s holdings are subject to change, and there is no assurance that the Fund will continue to hold any particular security. Data presented here are as of December 31, 2022.
6 Invesco Select Risk: High Growth Investor Fund
Invesco Select Risk: High Growth Investor Fund
Schedule of Investments in Affiliated Issuers–99.87%(a)
| % of | Change in | |||||||||||||||||||||||||||||||||||
| Net | Unrealized | |||||||||||||||||||||||||||||||||||
| Assets | Value | Purchases | Proceeds | Appreciation | Realized | Dividend | Shares | Value | ||||||||||||||||||||||||||||
| 12/31/22 | 12/31/21 | at Cost | from Sales | (Depreciation) | Gain (Loss) | Income | 12/31/22 | 12/31/22 | ||||||||||||||||||||||||||||
| ||||||||||||||||||||||||||||||||||||
Alternative Funds–4.91% | ||||||||||||||||||||||||||||||||||||
Invesco Global Real Estate Income Fund, Class R6(b) | 2.55 | % | $ | 16,999,165 | $ | 7,334,185 | $ | (1,030,138 | ) | $ | (4,616,625 | ) | $ | 48,200 | $ | 292,730 | 2,399,415 | $ | 18,571,474 | |||||||||||||||||
| ||||||||||||||||||||||||||||||||||||
Invesco Macro Allocation Strategy Fund, Class R6(c) | 2.36 | % | 30,341,757 | — | (10,185,451 | ) | (1,750,247 | ) | (1,236,876 | ) | — | 2,283,136 | 17,169,183 | |||||||||||||||||||||||
| ||||||||||||||||||||||||||||||||||||
Total Alternative Funds | 47,340,922 | 7,334,185 | (11,215,589 | ) | (6,366,872 | ) | (1,188,676 | ) | 292,730 | 35,740,657 | ||||||||||||||||||||||||||
| ||||||||||||||||||||||||||||||||||||
Domestic Equity Funds–49.03% | ||||||||||||||||||||||||||||||||||||
Invesco Discovery Mid Cap Growth Fund, Class R6(c) | 7.33 | % | 92,104,894 | 13,289,240 | (25,301,220 | ) | (23,203,206 | ) | (3,475,609 | ) | — | 2,110,395 | 53,414,099 | |||||||||||||||||||||||
| ||||||||||||||||||||||||||||||||||||
Invesco Main Street Small Cap Fund, Class R6 | 7.45 | % | 91,731,825 | 1,582,305 | (26,393,837 | ) | (17,412,255 | ) | 4,774,944 | 331,793 | 3,034,264 | 54,282,982 | ||||||||||||||||||||||||
| ||||||||||||||||||||||||||||||||||||
Invesco Russell 1000® Dynamic Multifactor ETF | 13.23 | % | 78,126,469 | 45,936,291 | (11,489,907 | ) | (16,871,514 | ) | 679,595 | 1,445,656 | 2,244,549 | 96,380,934 | ||||||||||||||||||||||||
| ||||||||||||||||||||||||||||||||||||
Invesco S&P 500® Low Volatility ETF | 8.44 | % | 62,972,280 | 12,757,180 | (8,982,017 | ) | (5,781,425 | ) | 507,507 | 1,314,412 | 962,027 | 61,473,525 | ||||||||||||||||||||||||
| ||||||||||||||||||||||||||||||||||||
Invesco S&P 500® Pure Growth ETF | 5.32 | % | 48,345,453 | 11,644,896 | (6,890,925 | ) | (14,053,530 | ) | (278,915 | ) | 299,278 | 255,702 | 38,766,979 | |||||||||||||||||||||||
| ||||||||||||||||||||||||||||||||||||
Invesco S&P SmallCap Low Volatility ETF | 3.96 | % | 85,609,811 | — | (47,509,606 | ) | (21,859,784 | ) | 12,631,314 | 1,046,001 | 646,551 | 28,871,735 | ||||||||||||||||||||||||
| ||||||||||||||||||||||||||||||||||||
Invesco Value Opportunities Fund, Class R6 | 3.30 | % | — | 28,564,398 | (2,479,353 | ) | (1,970,230 | ) | 1,919,265 | 245,859 | 1,506,907 | 24,080,373 | ||||||||||||||||||||||||
| ||||||||||||||||||||||||||||||||||||
Total Domestic Equity Funds | 458,890,732 | 113,774,310 | (129,046,865 | ) | (101,151,944 | ) | 16,758,101 | 4,682,999 | 357,270,627 | |||||||||||||||||||||||||||
| ||||||||||||||||||||||||||||||||||||
Fixed Income Funds–7.72% | ||||||||||||||||||||||||||||||||||||
Invesco 1-30 Laddered Treasury ETF | 2.59 | % | 19,087,172 | 7,099,149 | (2,758,314 | ) | (4,333,768 | ) | (221,099 | ) | 355,559 | 656,914 | 18,873,140 | |||||||||||||||||||||||
| ||||||||||||||||||||||||||||||||||||
Invesco Core Plus Bond Fund, Class R6 | 5.13 | % | 37,925,185 | 11,882,563 | (5,529,339 | ) | (6,067,983 | ) | (843,290 | ) | 1,312,936 | 4,101,771 | 37,367,136 | |||||||||||||||||||||||
| ||||||||||||||||||||||||||||||||||||
Total Fixed Income Funds | 57,012,357 | 18,981,712 | (8,287,653 | ) | (10,401,751 | ) | (1,064,389 | ) | 1,668,495 | 56,240,276 | ||||||||||||||||||||||||||
| ||||||||||||||||||||||||||||||||||||
Foreign Equity Funds–37.60% | ||||||||||||||||||||||||||||||||||||
Invesco EQV Emerging Markets All Cap Fund, Class R6 | 4.19 | % | 31,951,687 | 7,716,026 | (3,088,528 | ) | (4,981,817 | ) | (1,068,815 | ) | 487,651 | 987,021 | 30,528,553 | |||||||||||||||||||||||
| ||||||||||||||||||||||||||||||||||||
Invesco Developing Markets Fund, Class R6 | 4.72 | % | 46,647,242 | 6,728,438 | (6,985,272 | ) | (8,944,845 | ) | (3,081,678 | ) | 399,670 | 984,075 | 34,363,885 | |||||||||||||||||||||||
| ||||||||||||||||||||||||||||||||||||
Invesco Global Fund, Class R6 | 11.49 | % | 111,165,102 | 27,130,795 | (7,874,517 | ) | (44,818,194 | ) | 8,407,505 | 0 | 1,105,496 | 83,708,176 | ||||||||||||||||||||||||
| ||||||||||||||||||||||||||||||||||||
Invesco Global Infrastructure Fund, Class R6 | 0.95 | % | 9,740,850 | 145,046 | (2,217,645 | ) | (1,080,232 | ) | 309,717 | 145,046 | 593,609 | 6,897,736 | ||||||||||||||||||||||||
| ||||||||||||||||||||||||||||||||||||
Invesco International Select Equity Fund, Class R6 | 2.10 | % | 37,078,186 | 1,389,455 | (14,680,601 | ) | (4,769,568 | ) | (3,689,390 | ) | 153,331 | 1,691,841 | 15,328,082 | |||||||||||||||||||||||
| ||||||||||||||||||||||||||||||||||||
Invesco International Small-Mid Company Fund, Class R6 | 4.03 | % | 40,688,519 | 3,474,550 | (1,841,765 | ) | (12,545,617 | ) | (329,228 | ) | 125,403 | 751,986 | 29,365,047 | |||||||||||||||||||||||
| ||||||||||||||||||||||||||||||||||||
Invesco RAFI™ Strategic Developed ex-US ETF | 5.43 | % | 37,169,227 | 15,098,113 | (7,895,030 | ) | (4,819,107 | ) | 46,871 | 1,257,621 | 1,474,314 | 39,600,074 | ||||||||||||||||||||||||
| ||||||||||||||||||||||||||||||||||||
Invesco S&P Emerging Markets Low Volatility ETF | 3.74 | % | 23,360,609 | 10,968,036 | (4,584,472 | ) | (2,930,785 | ) | 470,766 | 859,038 | 1,185,752 | 27,284,154 | ||||||||||||||||||||||||
| ||||||||||||||||||||||||||||||||||||
Invesco S&P International Developed Low Volatility ETF | 0.95 | % | 33,289,145 | — | (24,432,389 | ) | (3,893,443 | ) | 1,936,554 | 491,397 | 257,650 | 6,899,867 | ||||||||||||||||||||||||
| ||||||||||||||||||||||||||||||||||||
Total Foreign Equity Funds | 371,090,567 | 72,650,459 | (73,600,219 | ) | (88,783,608 | ) | 3,002,302 | 3,919,157 | 273,975,574 | |||||||||||||||||||||||||||
| ||||||||||||||||||||||||||||||||||||
Money Market Funds–0.61% | ||||||||||||||||||||||||||||||||||||
Invesco Government & Agency Portfolio, Institutional Class, 4.22%(d) | 0.21 | % | 1,983,970 | 28,117,812 | (28,583,281 | ) | — | — | 12,021 | 1,518,501 | 1,518,501 | |||||||||||||||||||||||||
| ||||||||||||||||||||||||||||||||||||
Invesco Liquid Assets Portfolio, Institutional Class, 4.42%(d) | 0.16 | % | 1,781,818 | 20,084,152 | (20,666,022 | ) | 95 | 473 | 14,352 | 1,200,156 | 1,200,516 | |||||||||||||||||||||||||
| ||||||||||||||||||||||||||||||||||||
Invesco Treasury Portfolio, Institutional Class, 4.20%(d) | 0.24 | % | 2,267,394 | 32,134,643 | (32,666,607 | ) | — | — | 17,856 | 1,735,430 | 1,735,430 | |||||||||||||||||||||||||
| ||||||||||||||||||||||||||||||||||||
Total Money Market Funds | 6,033,182 | 80,336,607 | (81,915,910 | ) | 95 | 473 | 44,229 | 4,454,447 | ||||||||||||||||||||||||||||
| ||||||||||||||||||||||||||||||||||||
TOTAL INVESTMENTS IN AFFILIATED ISSUERS (excluding investments purchased with cash collateral from securities on loan) (Cost $695,723,844) | 99.87 | % | 940,367,760 | 293,077,273 | (304,066,236 | ) | (206,704,080 | ) | 17,507,811 | 10,607,610 | 727,681,581 | |||||||||||||||||||||||||
| ||||||||||||||||||||||||||||||||||||
See accompanying Notes to Financial Statements which are an integral part of the financial statements.
7 Invesco Select Risk: High Growth Investor Fund
Invesco Select Risk: High Growth Investor Fund (continued)
Schedule of Investments in Affiliated Issuers–99.87%(a)
| % of | Change in | |||||||||||||||||||||||||||||||||||
| Net | Unrealized | |||||||||||||||||||||||||||||||||||
| Assets | Value | Purchases | Proceeds | Appreciation | Realized | Dividend | Shares | Value | ||||||||||||||||||||||||||||
| 12/31/22 | 12/31/21 | at Cost | from Sales | (Depreciation) | Gain (Loss) | Income | 12/31/22 | 12/31/22 | ||||||||||||||||||||||||||||
| ||||||||||||||||||||||||||||||||||||
Investments Purchased with Cash Collateral from Securities on Loan | ||||||||||||||||||||||||||||||||||||
Money Market Funds–0.00% | ||||||||||||||||||||||||||||||||||||
Invesco Private Government Fund, 4.28%(d)(e) | 0.00 | % | $ | 374,772 | $ | 22,958,708 | $ | (23,333,109 | ) | $ | — | $ | — | $ | 3,453 | (f) | 371 | $ | 371 | |||||||||||||||||
| ||||||||||||||||||||||||||||||||||||
Invesco Private Prime Fund, 4.46%(d)(e) | 0.00 | % | 874,467 | 57,189,720 | (58,066,001 | ) | — | 2,767 | 10,717 | (f) | 953 | 953 | ||||||||||||||||||||||||
| ||||||||||||||||||||||||||||||||||||
Total Investments Purchased with Cash Collateral from Securities on Loan | 0.00 | % | 1,249,239 | 80,148,428 | (81,399,110 | ) | — | 2,767 | 14,170 | 1,324 | ||||||||||||||||||||||||||
| ||||||||||||||||||||||||||||||||||||
TOTAL INVESTMENTS IN AFFILIATED ISSUERS (Cost $695,725,168) | 99.87 | % | $ | 941,616,999 | $ | 373,225,701 | $ | (385,465,346 | ) | $ | (206,704,080 | ) | $ | 17,510,578 | (g) | $ | 10,621,780 | $ | 727,682,905 | |||||||||||||||||
| ||||||||||||||||||||||||||||||||||||
OTHER ASSETS LESS LIABILITIES | 0.13 | % | 927,040 | |||||||||||||||||||||||||||||||||
| ||||||||||||||||||||||||||||||||||||
NET ASSETS | 100.00 | % | $ | 728,609,945 | ||||||||||||||||||||||||||||||||
| ||||||||||||||||||||||||||||||||||||
Investment Abbreviations:
ETF - Exchange-Traded Fund
Notes to Schedule of Investments:
| (a) | Each underlying fund and the Fund are affiliated by either having the same investment adviser or an investment adviser under common control with the Fund’s investment adviser. |
| (b) | Amounts include a return of capital distribution reclassification which reduces dividend income and increases realized gain (loss) and/or change in unrealized appreciation (depreciation). |
| (c) | Non-income producing security. |
| (d) | The rate shown is the 7-day SEC standardized yield as of December 31, 2022. |
| (e) | The security has been segregated to satisfy the commitment to return the cash collateral received in securities lending transactions upon the borrower’s return of the securities loaned. See Note 1H. |
| (f) | Represents the income earned on the investment of cash collateral, which is included in securities lending income on the Statement of Operations. Does not include rebates and fees paid to lending agent or premiums received from borrowers, if any. |
| (g) | Includes capital gains distributions from affiliated underlying funds as follows: |
| Fund Name | Capital Gain | |||
Invesco Global Fund | $ | 10,302,515 | ||
Invesco International Small-Mid Company Fund | 81,412 | |||
Invesco Value Opportunities Fund | 1,953,707 | |||
| Open Futures Contracts(a) | ||||||||||||||||||||
| ||||||||||||||||||||
| Long Futures Contracts | Number of Contracts | Expiration Month | Notional Value | Value | Unrealized Appreciation (Depreciation) | |||||||||||||||
| ||||||||||||||||||||
Equity Risk | ||||||||||||||||||||
| ||||||||||||||||||||
E-Mini S&P 500 Index | 27 | March-2023 | $ | 5,212,350 | $ | (144,842 | ) | $ | (144,842 | ) | ||||||||||
| ||||||||||||||||||||
MSCI Emerging Markets Index | 6 | March-2023 | 287,820 | (5,007 | ) | (5,007 | ) | |||||||||||||
| ||||||||||||||||||||
Nikkei 225 Index | 1 | March-2023 | 198,720 | (12,119 | ) | (12,119 | ) | |||||||||||||
| ||||||||||||||||||||
S&P/TSX 60 Index | 1 | March-2023 | 172,807 | (5,960 | ) | (5,960 | ) | |||||||||||||
| ||||||||||||||||||||
SPI 200 Index | 1 | March-2023 | 119,013 | (2,817 | ) | (2,817 | ) | |||||||||||||
| ||||||||||||||||||||
STOXX Europe 600 Index | 28 | March-2023 | 635,569 | (18,982 | ) | (18,982 | ) | |||||||||||||
| ||||||||||||||||||||
Total Futures Contracts | $ | (189,727 | ) | $ | (189,727 | ) | ||||||||||||||
| ||||||||||||||||||||
(a) Futures contracts collateralized by $417,493 cash held with Merrill Lynch International, the futures commission merchant.
See accompanying Notes to Financial Statements which are an integral part of the financial statements.
8 Invesco Select Risk: High Growth Investor Fund
Statement of Assets and Liabilities
December 31, 2022
Assets: | ||||
Investments in affiliated underlying funds, at value (Cost $695,725,168) | $ | 727,682,905 | ||
| ||||
Other investments: | ||||
Variation margin receivable – futures contracts | 144,791 | |||
| ||||
Deposits with brokers: | ||||
Cash collateral – exchange-traded futures contracts | 417,493 | |||
| ||||
Cash | 323,204 | |||
| ||||
Receivable for: | ||||
Dividends - affiliated underlying funds | 262,371 | |||
| ||||
Fund shares sold | 623,200 | |||
| ||||
Investment for trustee deferred compensation and retirement plans | 43,280 | |||
| ||||
Other assets | 48,137 | |||
| ||||
Total assets | 729,545,381 | |||
| ||||
Liabilities: | ||||
Payable for: | ||||
Investments purchased - affiliated underlying funds | 246,925 | |||
| ||||
Fund shares reacquired | 257,180 | |||
| ||||
Collateral upon return of securities loaned | 1,324 | |||
| ||||
Accrued fees to affiliates | 323,172 | |||
| ||||
Accrued trustees’ and officers’ fees and benefits | 12,428 | |||
| ||||
Accrued other operating expenses | 51,127 | |||
| ||||
Trustee deferred compensation and retirement plans | 43,280 | |||
| ||||
Total liabilities | 935,436 | |||
| ||||
Net assets applicable to shares outstanding | $ | 728,609,945 | ||
| ||||
Net assets consist of: | ||||
Shares of beneficial interest | $ | 689,986,313 | ||
| ||||
Distributable earnings | 38,623,632 | |||
| ||||
| $ | 728,609,945 | |||
| ||||
Net Assets: | ||||
Class A | $ | 570,008,826 | ||
| ||||
Class C | $ | 73,396,734 | ||
| ||||
Class R | $ | 72,465,443 | ||
| ||||
Class Y | $ | 12,716,179 | ||
| ||||
Class R5 | $ | 7,299 | ||
| ||||
Class R6 | $ | 15,464 | ||
| ||||
Shares outstanding, no par value, with an unlimited number of shares authorized: |
| |||
Class A | 46,959,795 | |||
| ||||
Class C | 6,318,436 | |||
| ||||
Class R | 5,977,340 | |||
| ||||
Class Y | 1,038,906 | |||
| ||||
Class R5 | 602 | |||
| ||||
Class R6 | 1,276 | |||
| ||||
Class A: | ||||
Net asset value per share | $ | 12.14 | ||
| ||||
Maximum offering price per share | $ | 12.85 | ||
| ||||
Class C: | ||||
Net asset value and offering price per share | $ | 11.62 | ||
| ||||
Class R: | ||||
Net asset value and offering price per share | $ | 12.12 | ||
| ||||
Class Y: | ||||
Net asset value and offering price per share | $ | 12.24 | ||
| ||||
Class R5: | ||||
Net asset value and offering price per share | $ | 12.12 | ||
| ||||
Class R6: | ||||
Net asset value and offering price per share | $ | 12.12 | ||
| ||||
See accompanying Notes to Financial Statements which are an integral part of the financial statements.
9 Invesco Select Risk: High Growth Investor Fund
Statement of Operations
For the year ended December 31, 2022
Investment income: | ||||
Dividends from affiliated underlying funds (includes net securities lending income of $ 73,912) | $ | 10,681,522 | ||
| ||||
Interest | 138,110 | |||
| ||||
Total investment income | 10,819,632 | |||
| ||||
Expenses: | ||||
Custodian fees | 14,735 | |||
| ||||
Distribution fees: | ||||
Class A | 1,470,224 | |||
| ||||
Class C | 819,778 | |||
| ||||
Class R | 368,304 | |||
| ||||
Transfer agent fees – A, C, R and Y | 877,176 | |||
| ||||
Transfer agent fees – R5 | 6 | |||
| ||||
Transfer agent fees – R6 | 24 | |||
| ||||
Trustees’ and officers’ fees and benefits | 24,737 | |||
| ||||
Registration and filing fees | 107,404 | |||
| ||||
Reports to shareholders | 44,652 | |||
| ||||
Professional services fees | 31,903 | |||
| ||||
Other | 18,457 | |||
| ||||
Total expenses | 3,777,400 | |||
| ||||
Less: Expenses reimbursed and/or expense offset arrangement(s) | (12,284 | ) | ||
| ||||
Net expenses | 3,765,116 | |||
| ||||
Net investment income | 7,054,516 | |||
| ||||
Realized and unrealized gain (loss) from: | ||||
Net realized gain (loss) from: | ||||
Affiliated underlying fund shares | 5,172,944 | |||
| ||||
Foreign currencies | (168 | ) | ||
| ||||
Futures contracts | (1,122,504 | ) | ||
| ||||
Capital gain distributions from affiliated underlying fund shares | 12,337,634 | |||
| ||||
| 16,387,906 | ||||
| ||||
Change in net unrealized appreciation (depreciation) of: | ||||
Affiliated underlying fund shares | (206,704,080 | ) | ||
| ||||
Foreign currencies | (7,244 | ) | ||
| ||||
Futures contracts | (361,949 | ) | ||
| ||||
| (207,073,273 | ) | |||
| ||||
Net realized and unrealized gain (loss) | (190,685,367 | ) | ||
| ||||
Net increase (decrease) in net assets resulting from operations | $ | (183,630,851 | ) | |
| ||||
See accompanying Notes to Financial Statements which are an integral part of the financial statements.
10 Invesco Select Risk: High Growth Investor Fund
Statement of Changes in Net Assets
For the years ended December 31, 2022 and 2021
| 2022 | 2021 | |||||||
| ||||||||
Operations: | ||||||||
Net investment income | $ | 7,054,516 | $ | 4,821,883 | ||||
| ||||||||
Net realized gain | 16,387,906 | 71,851,533 | ||||||
| ||||||||
Change in net unrealized appreciation (depreciation) | (207,073,273 | ) | 53,205,202 | |||||
| ||||||||
Net increase (decrease) in net assets resulting from operations | (183,630,851 | ) | 129,878,618 | |||||
| ||||||||
Distributions to shareholders from distributable earnings: | ||||||||
Class A | (36,054,856 | ) | (48,416,741 | ) | ||||
| ||||||||
Class C | (4,267,974 | ) | (6,414,634 | ) | ||||
| ||||||||
Class R | (4,385,194 | ) | (5,533,480 | ) | ||||
| ||||||||
Class Y | (865,084 | ) | (857,944 | ) | ||||
| ||||||||
Class R5 | (517 | ) | (719 | ) | ||||
| ||||||||
Class R6 | (1,063 | ) | (26,643 | ) | ||||
| ||||||||
Total distributions from distributable earnings | (45,574,688 | ) | (61,250,161 | ) | ||||
| ||||||||
Share transactions–net: | ||||||||
Class A | 13,262,927 | (20,803,215 | ) | |||||
| ||||||||
Class C | (6,367,274 | ) | (7,769,991 | ) | ||||
| ||||||||
Class R | 6,737,802 | 3,374,905 | ||||||
| ||||||||
Class Y | 3,389,456 | (1,378,039 | ) | |||||
| ||||||||
Class R6 | (332,713 | ) | 342,426 | |||||
| ||||||||
Net increase (decrease) in net assets resulting from share transactions | 16,690,198 | (26,233,914 | ) | |||||
| ||||||||
Net increase (decrease) in net assets | (212,515,341 | ) | 42,394,543 | |||||
| ||||||||
Net assets: | ||||||||
Beginning of year | 941,125,286 | 898,730,743 | ||||||
| ||||||||
End of year | $ | 728,609,945 | $ | 941,125,286 | ||||
| ||||||||
See accompanying Notes to Financial Statements which are an integral part of the financial statements.
11 Invesco Select Risk: High Growth Investor Fund
The following schedule presents financial highlights for a share of the Fund outstanding throughout the periods indicated.
| Net asset value, beginning of period | Net investment income (loss)(a) | Net gains (losses) on securities (both realized and unrealized) | Total from investment operations | Dividends from net investment income | Distributions from net realized gains | Total distributions | Net asset value, end of period | Total return(b) | Net assets, end of period (000’s omitted) | Ratio of fee waivers | Ratio of expenses to average net assets without fee waivers and/or expenses absorbed(d) | Ratio of net investment income (loss) to average net assets | Portfolio turnover (e) | |||||||||||||||||||||||||||||||||||||||||||
Class A | ||||||||||||||||||||||||||||||||||||||||||||||||||||||||
Year ended 12/31/22 | $ | 16.11 | $ | 0.14 | $ | (3.29 | ) | $ | (3.15 | ) | $ | (0.15 | ) | $ | (0.67 | ) | $ | (0.82 | ) | $ | 12.14 | (19.59 | )%(f) | $ | 570,009 | 0.38 | %(f) | 0.38 | %(f) | 1.02 | %(f) | 27 | % | |||||||||||||||||||||||
Year ended 12/31/21 | 15.01 | 0.10 | 2.14 | 2.24 | (0.28 | ) | (0.86 | ) | (1.14 | ) | 16.11 | 15.06 | (f) | 736,134 | 0.39 | (f) | 0.39 | (f) | 0.62 | (f) | 17 | |||||||||||||||||||||||||||||||||||
Year ended 12/31/20 | 15.84 | 0.09 | 2.01 | 2.10 | (0.10 | ) | (2.83 | ) | (2.93 | ) | 15.01 | 13.52 | (f) | 702,842 | 0.42 | (f) | 0.42 | (f) | 0.62 | (f) | 70 | |||||||||||||||||||||||||||||||||||
Eleven months ended 12/31/19 | 16.13 | 0.19 | 2.53 | 2.72 | (0.18 | ) | (2.83 | ) | (3.01 | ) | 15.84 | 16.94 | 657,555 | 0.46 | (g) | 0.46 | (g) | 1.21 | (g) | 31 | ||||||||||||||||||||||||||||||||||||
Year ended 01/31/19 | 19.46 | 0.11 | (2.31 | ) | (2.20 | ) | (0.18 | ) | (0.95 | ) | (1.13 | ) | 16.13 | (10.71 | ) | 574,046 | 0.45 | 0.45 | 0.62 | 38 | ||||||||||||||||||||||||||||||||||||
Year ended 01/31/18 | 15.59 | 0.07 | 4.24 | 4.31 | (0.27 | ) | (0.17 | ) | (0.44 | ) | 19.46 | 27.83 | 674,845 | 0.46 | 0.47 | 0.42 | 8 | |||||||||||||||||||||||||||||||||||||||
Class C | ||||||||||||||||||||||||||||||||||||||||||||||||||||||||
Year ended 12/31/22 | 15.45 | 0.03 | (3.15 | ) | (3.12 | ) | (0.04 | ) | (0.67 | ) | (0.71 | ) | 11.62 | (20.19 | ) | 73,397 | 1.14 | 1.14 | 0.26 | 27 | ||||||||||||||||||||||||||||||||||||
Year ended 12/31/21 | 14.43 | �� | (0.02 | ) | 2.05 | 2.03 | (0.15 | ) | (0.86 | ) | (1.01 | ) | 15.45 | 14.22 | 104,723 | 1.15 | 1.15 | (0.14 | ) | 17 | ||||||||||||||||||||||||||||||||||||
Year ended 12/31/20 | 15.37 | (0.02 | ) | 1.93 | 1.91 | (0.02 | ) | (2.83 | ) | (2.85 | ) | 14.43 | 12.66 | 104,858 | 1.18 | 1.18 | (0.14 | ) | 70 | |||||||||||||||||||||||||||||||||||||
Eleven months ended 12/31/19 | 15.71 | 0.07 | 2.46 | 2.53 | (0.04 | ) | (2.83 | ) | (2.87 | ) | 15.37 | 16.16 | 127,666 | 1.22 | (g) | 1.22 | (g) | 0.45 | (g) | 31 | ||||||||||||||||||||||||||||||||||||
Year ended 01/31/19 | 18.96 | (0.02 | ) | (2.24 | ) | (2.26 | ) | (0.04 | ) | (0.95 | ) | (0.99 | ) | 15.71 | (11.39 | ) | 169,142 | 1.20 | 1.20 | (0.13 | ) | 38 | ||||||||||||||||||||||||||||||||||
Year ended 01/31/18 | 15.21 | (0.06 | ) | 4.12 | 4.06 | (0.14 | ) | (0.17 | ) | (0.31 | ) | 18.96 | 26.83 | 212,996 | 1.21 | 1.22 | (0.36 | ) | 8 | |||||||||||||||||||||||||||||||||||||
Class R | ||||||||||||||||||||||||||||||||||||||||||||||||||||||||
Year ended 12/31/22 | 16.09 | 0.10 | (3.29 | ) | (3.19 | ) | (0.11 | ) | (0.67 | ) | (0.78 | ) | 12.12 | (19.83 | ) | 72,465 | 0.64 | 0.64 | 0.76 | 27 | ||||||||||||||||||||||||||||||||||||
Year ended 12/31/21 | 14.99 | 0.06 | 2.13 | 2.19 | (0.23 | ) | (0.86 | ) | (1.09 | ) | 16.09 | 14.79 | 87,346 | 0.65 | 0.65 | 0.36 | 17 | |||||||||||||||||||||||||||||||||||||||
Year ended 12/31/20 | 15.83 | 0.05 | 2.00 | 2.05 | (0.06 | ) | (2.83 | ) | (2.89 | ) | 14.99 | 13.22 | 78,109 | 0.68 | 0.68 | 0.36 | 70 | |||||||||||||||||||||||||||||||||||||||
Eleven months ended 12/31/19 | 16.11 | 0.15 | 2.53 | 2.68 | (0.13 | ) | (2.83 | ) | (2.96 | ) | 15.83 | 16.72 | 66,628 | 0.72 | (g) | 0.72 | (g) | 0.96 | (g) | 31 | ||||||||||||||||||||||||||||||||||||
Year ended 01/31/19 | 19.44 | 0.07 | (2.31 | ) | (2.24 | ) | (0.14 | ) | (0.95 | ) | (1.09 | ) | 16.11 | (10.97 | ) | 56,312 | 0.70 | 0.70 | 0.37 | 38 | ||||||||||||||||||||||||||||||||||||
Year ended 01/31/18 | 15.59 | 0.04 | 4.21 | 4.25 | (0.23 | ) | (0.17 | ) | (0.40 | ) | 19.44 | 27.44 | 59,559 | 0.71 | 0.72 | 0.22 | 8 | |||||||||||||||||||||||||||||||||||||||
Class Y | ||||||||||||||||||||||||||||||||||||||||||||||||||||||||
Year ended 12/31/22 | 16.24 | 0.17 | (3.32 | ) | (3.15 | ) | (0.18 | ) | (0.67 | ) | (0.85 | ) | 12.24 | (19.42 | ) | 12,716 | 0.14 | 0.14 | 1.26 | 27 | ||||||||||||||||||||||||||||||||||||
Year ended 12/31/21 | 15.12 | 0.14 | 2.16 | 2.30 | (0.32 | ) | (0.86 | ) | (1.18 | ) | 16.24 | 15.37 | 12,553 | 0.15 | 0.15 | 0.86 | 17 | |||||||||||||||||||||||||||||||||||||||
Year ended 12/31/20 | 15.93 | 0.13 | 2.03 | 2.16 | (0.14 | ) | (2.83 | ) | (2.97 | ) | 15.12 | 13.82 | 12,904 | 0.18 | 0.18 | 0.86 | 70 | |||||||||||||||||||||||||||||||||||||||
Eleven months ended 12/31/19 | 16.20 | 0.23 | 2.55 | 2.78 | (0.22 | ) | (2.83 | ) | (3.05 | ) | 15.93 | 17.24 | 21,733 | 0.22 | (g) | 0.22 | (g) | 1.46 | (g) | 31 | ||||||||||||||||||||||||||||||||||||
Year ended 01/31/19 | 19.55 | 0.16 | (2.33 | ) | (2.17 | ) | (0.23 | ) | (0.95 | ) | (1.18 | ) | 16.20 | (10.50 | ) | 21,582 | 0.21 | 0.21 | 0.87 | 38 | ||||||||||||||||||||||||||||||||||||
Year ended 01/31/18 | 15.67 | 0.13 | 4.23 | 4.36 | (0.31 | ) | (0.17 | ) | (0.48 | ) | 19.55 | 28.04 | 25,773 | 0.22 | 0.23 | 0.72 | 8 | |||||||||||||||||||||||||||||||||||||||
Class R5 | ||||||||||||||||||||||||||||||||||||||||||||||||||||||||
Year ended 12/31/22 | 16.09 | 0.17 | (3.28 | ) | (3.11 | ) | (0.19 | ) | (0.67 | ) | (0.86 | ) | 12.12 | (19.38 | ) | 7 | 0.11 | 0.11 | 1.29 | 27 | ||||||||||||||||||||||||||||||||||||
Year ended 12/31/21 | 14.99 | 0.16 | 2.13 | 2.29 | (0.33 | ) | (0.86 | ) | (1.19 | ) | 16.09 | 15.48 | 10 | 0.06 | 0.06 | 0.95 | 17 | |||||||||||||||||||||||||||||||||||||||
Year ended 12/31/20 | 15.82 | 0.14 | 2.01 | 2.15 | (0.15 | ) | (2.83 | ) | (2.98 | ) | 14.99 | 13.83 | 9 | 0.14 | 0.14 | 0.90 | 70 | |||||||||||||||||||||||||||||||||||||||
Period ended 12/31/19(h) | 16.60 | 0.16 | 2.12 | 2.28 | (0.23 | ) | (2.83 | ) | (3.06 | ) | 15.82 | 13.83 | 10 | 0.14 | (g) | 0.14 | (g) | 1.53 | (g) | 31 | ||||||||||||||||||||||||||||||||||||
Class R6 | ||||||||||||||||||||||||||||||||||||||||||||||||||||||||
Year ended 12/31/22 | 16.09 | 0.19 | (3.30 | ) | (3.11 | ) | (0.19 | ) | (0.67 | ) | (0.86 | ) | 12.12 | (19.38 | ) | 15 | 0.10 | 0.11 | 1.30 | 27 | ||||||||||||||||||||||||||||||||||||
Year ended 12/31/21 | 14.99 | 0.16 | 2.13 | 2.29 | (0.33 | ) | (0.86 | ) | (1.19 | ) | 16.09 | 15.48 | 359 | 0.06 | 0.06 | 0.95 | 17 | |||||||||||||||||||||||||||||||||||||||
Year ended 12/31/20 | 15.82 | 0.14 | 2.01 | 2.15 | (0.15 | ) | (2.83 | ) | (2.98 | ) | 14.99 | 13.87 | 9 | 0.10 | 0.14 | 0.94 | 70 | |||||||||||||||||||||||||||||||||||||||
Period ended 12/31/19(h) | 16.60 | 0.17 | 2.12 | 2.29 | (0.24 | ) | (2.83 | ) | (3.07 | ) | 15.82 | 13.90 | 10 | 0.10 | (g) | 0.10 | (g) | 1.58 | (g) | 31 | ||||||||||||||||||||||||||||||||||||
| (a) | Calculated using average shares outstanding. |
| (b) | Includes adjustments in accordance with accounting principles generally accepted in the United States of America and as such, the net asset value for financial reporting purposes and the returns based upon those net asset values may differ from the net asset value and returns for shareholder transactions. Does not include sales charges and is not annualized for periods less than one year, if applicable. |
| (c) | In addition to the fees and expenses which the Fund bears directly, the Fund indirectly bears a pro rata share of the fees and expenses of the underlying funds in which the Fund invests. Because the underlying funds have varied expenses and fee levels and the Fund may own different proportions at different times, the amount of fees and expenses incurred indirectly by the Fund will vary. Estimated underlying fund expenses are not expenses that are incurred directly by the Fund. They are expenses that are incurred directly by the underlying funds and are deducted from the value of the funds the Fund invests in. The effect of the estimated underlying fund expenses that the Fund bears indirectly is included in the Fund’s total return. Estimated acquired fund fees from underlying funds was 0.51%, 0.55% and 0.64% for the years ended December 31, 2022, 2021 and 2020, respectively. |
| (d) | Does not include indirect expenses from affiliated fund fees and expenses of 0.67%, 0.71% and 0.70% or the eleven months ended December 31, 2019, and for the years ended January 31, 2019 and 2018, respectively. |
| (e) | Portfolio turnover is calculated at the fund level and is not annualized for periods less than one year, if applicable. |
| (f) | The total return, ratio of expenses to average net assets and ratio of net investment income (loss) to average net assets reflect actual 12b-1 fees of 0.24% for the years ended December 31, 2022, 2021 and 2020, respectively. |
| (g) | Annualized. |
| (h) | Commencement date after the close of business on May 24, 2019. |
See accompanying Notes to Financial Statements which are an integral part of the financial statements.
12 Invesco Select Risk: High Growth Investor Fund
December 31, 2022
NOTE 1–Significant Accounting Policies
Invesco Select Risk: High Growth Investor Fund (the “Fund”) is a series portfolio of AIM Growth Series (Invesco Growth Series) (the “Trust”). The Trust is a Delaware statutory trust registered under the Investment Company Act of 1940, as amended (the “1940 Act”), as an open-end series management investment company authorized to issue an unlimited number of shares of beneficial interest. Information presented in these financial statements pertains only to the Fund. Matters affecting the Fund or each class will be voted on exclusively by the shareholders of the Fund or each class.
The Fund’s investment objective is to seek total return.
The Fund is a “fund of funds”, in that it invests in other mutual funds (“underlying funds”) advised by Invesco Advisers, Inc. (the “Adviser” or “Invesco”) and exchange-traded funds advised by Invesco Capital Management LLC (“Invesco Capital”). Invesco and Invesco Capital are affiliates of each other as they are indirect, wholly-owned subsidiaries of Invesco Ltd. Invesco may change the Fund’s asset class allocations, the underlying funds or the target weightings in the underlying funds without shareholder approval. The underlying funds may engage in a number of investment techniques and practices, which involve certain risks. Each underlying fund’s accounting policies are outlined in the underlying fund’s financial statements and are publicly available.
The Fund currently consists of six different classes of shares: Class A, Class C, Class R, Class Y, Class R5 and Class R6. Class Y shares are available only to certain investors. Class A shares are sold with a front-end sales charge unless certain waiver criteria are met. Under certain circumstances, load waived shares may be subject to contingent deferred sales charges (“CDSC”). Class C shares are sold with a CDSC. Class R, Class Y, Class R5 and Class R6 shares are sold at net asset value. Class C shares held for eight years after purchase are eligible for automatic conversion into Class A shares of the same Fund (the “Conversion Feature”). The automatic conversion pursuant to the Conversion Feature will generally occur at the end of the month following the eighth anniversary after a purchase of Class C shares.
The Fund is an investment company and accordingly follows the investment company accounting and reporting guidance in accordance with Financial Accounting Standards Board Accounting Standards Codification Topic 946, Financial Services – Investment Companies.
The following is a summary of the significant accounting policies followed by the Fund in the preparation of its financial statements.
| A. | Security Valuations – Securities of investment companies listed or traded on an exchange are generally valued at the trade price or official closing price that day as of the close of the exchange where the security is principally traded, or lacking any trades or official closing price on a particular day, the security may be valued at the closing bid price on that day. Securities of investment companies that are not exchange-traded (e.g., open-end mutual funds) are valued using such company’s end-of-business-day net asset value per share. Securities in the underlying funds, including restricted securities, are valued in accordance with the valuation policy of such fund. The policies of the underlying funds affiliated with the Fund, as a result of having the same investment adviser, are set forth below. |
A security listed or traded on an exchange is generally valued at its trade price or official closing price that day as of the close of the exchange where the security is principally traded, or lacking any trades or official closing price on a particular day, the security may be valued at the closing bid price on that day. Securities traded in the over-the-counter market are valued based on prices furnished by independent pricing services or market makers. When such securities are valued using prices provided by an independent pricing service they may be considered fair valued. Futures contracts are valued at the daily settlement price set by an exchange on which they are principally traded. U.S. exchange-traded options are valued at the mean between the last bid and asked prices from the exchange on which they are principally traded. Non-U.S. exchange-traded options are valued at the final settlement price set by the exchange on which they trade. Options not listed on an exchange and swaps generally are valued using pricing provided from independent pricing services.
Variable rate senior loan interests are fair valued using quotes provided by an independent pricing service. Quotes provided by the pricing service may reflect appropriate factors such as ratings, tranche type, industry, company performance, spread, individual trading characteristics, institution-size trading in similar groups of securities and other market data.
Securities of investment companies that are not exchange-traded (e.g., open-end mutual funds) are valued using such company’s end-of-business-day net asset value per share.
Deposits, other obligations of U.S. and non-U.S. banks and financial institutions are valued at their daily account value.
Fixed income securities (including convertible debt securities) generally are valued on the basis of prices provided by independent pricing services. Prices provided by the pricing service may be determined without exclusive reliance on quoted prices, and may reflect appropriate factors such as institution-size trading in similar groups of securities, developments related to specific securities, dividend rate (for unlisted equities), yield (for debt obligations), quality, type of issue, coupon rate (for debt obligations), maturity (for debt obligations), individual trading characteristics and other market data. Pricing services generally value debt obligations assuming orderly transactions of institutional round lot size, but a fund may hold or transact in the same securities in smaller, odd lot sizes. Odd lots often trade at lower prices than institutional round lots, and their value may be adjusted accordingly. Debt obligations are subject to interest rate and credit risks. In addition, all debt obligations involve some risk of default with respect to interest and/or principal payments.
Foreign securities’ (including foreign exchange contracts) prices are converted into U.S. dollar amounts using the applicable exchange rates as of the close of the New York Stock Exchange (“NYSE”). If market quotations are available and reliable for foreign exchange-traded equity securities, the securities will be valued at the market quotations. The Adviser may use various pricing services to obtain market quotations as well as fair value prices. Because trading hours for certain foreign securities end before the close of the NYSE, closing market quotations may become not representative of market value in the Adviser’s judgment (“unreliable”). If, between the time trading ends on a particular security and the close of the customary trading session on the NYSE, a significant event occurs that makes the closing price of the security unreliable, the Adviser may fair value the security. If the event is likely to have affected the closing price of the security, the security will be valued at fair value in good faith in accordance with Board- approved policies and related Adviser procedures (“Valuation Procedures”). Adjustments to closing prices to reflect fair value may also be based on a screening process of an independent pricing service to indicate the degree of certainty, based on historical data, that the closing price in the principal market where a foreign security trades is not the current value as of the close of the NYSE. Foreign securities’ prices meeting the degree of certainty that the price is not reflective of current value will be priced at the indication of fair value from the independent pricing service. Multiple factors may be considered by the independent pricing service in determining adjustments to reflect fair value and may include information relating to sector indices, American Depositary Receipts and domestic and foreign index futures. Foreign securities may have additional risks including exchange rate changes, potential for sharply devalued currencies and high inflation, political and economic upheaval, the relative lack of issuer information, relatively low market liquidity and the potential lack of strict financial and accounting controls and standards.
Unlisted securities will be valued using prices provided by independent pricing services or by another method that the Adviser, in its judgment, believes better reflects the security’s fair value in accordance with the Valuation Procedures.
Securities for which market prices are not provided by any of the above methods may be valued based upon quotes furnished by independent sources. The last bid price may be used to value equity securities. The mean between the last bid and asked prices may be used to value debt obligations, including corporate loans.
Securities for which market quotations are not readily available are fair valued by the Adviser in accordance with the Valuation Procedures. If a fair value price provided by a pricing service is unreliable, the Adviser will fair value the security using the Valuation Procedures. Issuer specific events, market trends, bid/asked quotes of brokers and information providers and other market data may be reviewed in the course of making a good faith determination of a security’s fair value.
13 Invesco Select Risk: High Growth Investor Fund
The Fund may invest in securities that are subject to interest rate risk, meaning the risk that the prices will generally fall as interest rates rise and, conversely, the prices will generally rise as interest rates fall. Specific securities differ in their sensitivity to changes in interest rates depending on their individual characteristics. Changes in interest rates may result in increased market volatility, which may affect the value and/or liquidity of certain Fund investments.
Valuations change in response to many factors including the historical and prospective earnings of the issuer, the value of the issuer’s assets, general market conditions which are not specifically related to the particular issuer, such as real or perceived adverse economic conditions, changes in the general outlook for revenues or corporate earnings, changes in interest or currency rates, regional or global instability, natural or environmental disasters, widespread disease or other public health issues, war, acts of terrorism, significant governmental actions or adverse investor sentiment generally and market liquidity. Because of the inherent uncertainties of valuation, the values reflected in the financial statements may materially differ from the value received upon actual sale of those investments.
The price the Fund could receive upon the sale of any investment may differ from the Adviser’s valuation of the investment, particularly for securities that are valued using a fair valuation technique. When fair valuation techniques are applied, the Adviser uses available information, including both observable and unobservable inputs and assumptions, to determine a methodology that will result in a valuation that the Adviser believes approximates market value. Fund securities that are fair valued may be subject to greater fluctuation in their value from one day to the next than would be the case if market quotations were used. Because of the inherent uncertainties of valuation, and the degree of subjectivity in such decisions, the Fund could realize a greater or lesser than expected gain or loss upon the sale of the investment.
| B. | Securities Transactions and Investment Income – Securities transactions are accounted for on a trade date basis. Realized gains or losses on sales are computed on the basis of specific identification of the securities sold. Distributions from ordinary income from underlying funds, if any, are recorded as dividend income on the ex-dividend date. Distributions from gains from underlying funds, if any, are recorded as realized gains on the ex-dividend date. The following policies are followed by the underlying funds: Interest income (net of withholding tax, if any) is recorded on an accrual basis from settlement date and includes coupon interest and amortization of premium and accretion of discount on debt securities as applicable. Pay-in-kind interest income and non-cash dividend income received in the form of securities in-lieu of cash are recorded at the fair value of the securities received. Paydown gains and losses on mortgage and asset-backed securities are recorded as adjustments to interest income. |
The Fund may periodically participate in litigation related to the Fund’s investments. As such, the Fund may receive proceeds from litigation settlements. Any proceeds received are included in the Statement of Operations as realized gain (loss) for investments no longer held and as unrealized gain (loss) for investments still held.
The Fund allocates income and realized and unrealized capital gains and losses to a class based on the relative net assets of each class.
| C. | Distributions – Distributions from net investment income and net realized capital gain, if any, are generally declared and paid annually and recorded on the ex-dividend date. The Fund may elect to treat a portion of the proceeds from redemptions as distributions for federal income tax purposes. |
| D. | Federal Income Taxes – The Fund intends to comply with the requirements of Subchapter M of the Internal Revenue Code of 1986, as amended (the “Internal Revenue Code”), necessary to qualify as a regulated investment company and to distribute substantially all of the Fund’s taxable earnings to shareholders. As such, the Fund will not be subject to federal income taxes on otherwise taxable income (including net realized capital gain) that is distributed to shareholders. Therefore, no provision for federal income taxes is recorded in the financial statements. |
The Fund recognizes the tax benefits of uncertain tax positions only when the position is more likely than not to be sustained. Management has analyzed the Fund’s uncertain tax positions and concluded that no liability for unrecognized tax benefits should be recorded related to uncertain tax positions. Management is not aware of any tax positions for which it is reasonably possible that the total amounts of unrecognized tax benefits will change materially in the next 12 months.
The Fund files tax returns in the U.S. Federal jurisdiction and certain other jurisdictions. Generally, the Fund is subject to examinations by such taxing authorities for up to three years after the filing of the return for the tax period.
| E. | Expenses – Expenses included in the accompanying financial statements reflect the expenses of the Fund and do not include any expenses of the underlying funds. The effects of the underlying funds expenses are included in the realized and unrealized gain/loss on the investments in the underlying funds. Estimated expenses of the underlying funds are discussed further within the Financial Highlights. |
Fees provided for under the Rule 12b-1 plan of a particular class of the Fund and which are directly attributable to that class are charged to the operations of such class. Transfer agency fees and expenses and other shareholder recordkeeping fees and expenses attributable to Class R5 and Class R6 are allocated based on relative net assets of Class R5 and Class R6. Transfer agency fees and expenses and other shareholder recordkeeping fees and expenses relating to all other classes are allocated among those classes based on relative net assets. All other expenses are allocated among the classes based on relative net assets.
| F. | Accounting Estimates – The preparation of financial statements in conformity with accounting principles generally accepted in the United States of America (“GAAP”) requires management to make estimates and assumptions that affect the reported amounts of assets and liabilities at the date of the financial statements and the reported amounts of revenues and expenses during the reporting period including estimates and assumptions related to taxation. Actual results could differ from those estimates by a significant amount. In addition, the Fund monitors for material events or transactions that may occur or become known after the period-end date and before the date the financial statements are released to print. |
| G. | Indemnifications – Under the Trust’s organizational documents, each Trustee, officer, employee or other agent of the Trust is indemnified against certain liabilities that may arise out of the performance of their duties to the Fund. Additionally, in the normal course of business, the Fund enters into contracts, including the Fund’s servicing agreements, that contain a variety of indemnification clauses. The Fund’s maximum exposure under these arrangements is unknown as this would involve future claims that may be made against the Fund that have not yet occurred. The risk of material loss as a result of such indemnification claims is considered remote. |
| H. | Securities Lending – The Fund may lend portfolio securities having a market value up to one-third of the Fund’s total assets. Such loans are secured by collateral equal to no less than the market value of the loaned securities determined daily by the securities lending provider. Such collateral will be cash or debt securities issued or guaranteed by the U.S. Government or any of its sponsored agencies. Cash collateral received in connection with these loans is invested in short-term money market instruments or affiliated, unregistered investment companies that comply with Rule 2a-7 under the 1940 Act and money market funds (collectively, “affiliated money market funds”) and is shown as such on the Schedule of Investments. The Fund bears the risk of loss with respect to the investment of collateral. It is the Fund’s policy to obtain additional collateral from or return excess collateral to the borrower by the end of the next business day, following the valuation date of the securities loaned. Therefore, the value of the collateral held may be temporarily less than the value of the securities on loan. |
When loaning securities, the Fund retains certain benefits of owning the securities, including the economic equivalent of dividends or interest generated by the security. Lending securities entails a risk of loss to the Fund if, and to the extent that, the market value of the securities loaned were to increase and the borrower did not increase the collateral accordingly, and the borrower failed to return the securities. The securities loaned are subject to termination at the option of the borrower or the Fund. Upon termination, the borrower will return to the Fund the securities loaned and the Fund will return the collateral. Upon the failure of the borrower to return the securities, collateral may be liquidated and the securities may be purchased on the open market to replace the loaned securities. The Fund could experience delays and costs in gaining access to the collateral and the securities may lose value during the delay which could result in potential losses to the Fund. Some of these losses may be indemnified by the lending agent. The Fund bears the risk of any deficiency in the amount of the collateral available for return to the borrower due to any loss on the collateral invested. Dividends received on cash collateral investments for securities lending transactions, which are
14 Invesco Select Risk: High Growth Investor Fund
net of compensation to counterparties, are included in Dividends from affiliated underlying funds on the Statement of Operations. The aggregate value of securities out on loan, if any, is shown as a footnote on the Statement of Assets and Liabilities.
The Adviser serves as an affiliated securities lending agent for the Fund. The Bank of New York Mellon also serves as a lending agent. To the extent the Fund utilizes the Adviser as an affiliated securities lending agent, the Fund conducts its securities lending in accordance with, and in reliance upon, no-action letters issued by the SEC staff that provide guidance on how an affiliate may act as a direct agent lender and receive compensation for those services in a manner consistent with the federal securities laws. For the year ended December 31, 2022, the Fund paid the Adviser $6,144 in fees for securities lending agent services. Fees paid to the Adviser for securities lending agent services, if any, are included in Dividends from affiliated underlying funds on the Statement of Operations.
| I. | Foreign Currency Translations – Foreign currency is valued at the close of the NYSE based on quotations posted by banks and major currency dealers. Portfolio securities and other assets and liabilities denominated in foreign currencies are translated into U.S. dollar amounts at the date of valuation. Purchases and sales of portfolio securities (net of foreign taxes withheld on disposition) and income items denominated in foreign currencies are translated into U.S. dollar amounts on the respective dates of such transactions. The Fund does not separately account for the portion of the results of operations resulting from changes in foreign exchange rates on investments and the fluctuations arising from changes in market prices of securities held. The combined results of changes in foreign exchange rates and the fluctuation of market prices on investments (net of estimated foreign tax withholding) are included with the net realized and unrealized gain or loss from investments in the Statement of Operations. Reported net realized foreign currency gains or losses arise from (1) sales of foreign currencies, (2) currency gains or losses realized between the trade and settlement dates on securities transactions, and (3) the difference between the amounts of dividends, interest, and foreign withholding taxes recorded on the Fund’s books and the U.S. dollar equivalent of the amounts actually received or paid. Net unrealized foreign currency gains and losses arise from changes in the fair values of assets and liabilities, other than investments in securities at fiscal period end, resulting from changes in exchange rates. |
The Fund may invest in foreign securities, which may be subject to foreign taxes on income, gains on investments or currency repatriation, a portion of which may be recoverable. Foreign taxes, if any, are recorded based on the tax regulations and rates that exist in the foreign markets in which the Fund invests and are shown in the Statement of Operations.
| J. | Forward Foreign Currency Contracts – The Fund may engage in foreign currency transactions either on a spot (i.e. for prompt delivery and settlement) basis, or through forward foreign currency contracts, to manage or minimize currency or exchange rate risk. |
The Fund may also enter into forward foreign currency contracts for the purchase or sale of a security denominated in a foreign currency in order to “lock in” the U.S. dollar price of that security, or the Fund may also enter into forward foreign currency contracts that do not provide for physical exchange of the two currencies on the settlement date, but instead are settled by a single cash payment calculated as the difference between the agreed upon exchange rate and the spot rate at settlement based upon an agreed upon notional amount (non-deliverable forwards).
A forward foreign currency contract is an obligation between two parties (“Counterparties”) to purchase or sell a specific currency for an agreed-upon price at a future date. The use of forward foreign currency contracts for hedging does not eliminate fluctuations in the price of the underlying securities the Fund owns or intends to acquire but establishes a rate of exchange in advance. Fluctuations in the value of these contracts are measured by the difference in the contract date and reporting date exchange rates and are recorded as unrealized appreciation (depreciation) until the contracts are closed. When the contracts are closed, realized gains (losses) are recorded. Realized and unrealized gains (losses) on the contracts are included in the Statement of Operations. The primary risks associated with forward foreign currency contracts include failure of the Counterparty to meet the terms of the contract and the value of the foreign currency changing unfavorably. These risks may be in excess of the amounts reflected in the Statement of Assets and Liabilities.
| K. | Futures Contracts — The Fund may enter into futures contracts to manage exposure to interest rate, equity and market price movements and/or currency risks. A futures contract is an agreement between two parties (“Counterparties”) to purchase or sell a specified underlying security, currency or commodity (or delivery of a cash settlement price, in the case of an index future) for a fixed price at a future date. The Fund currently invests only in exchange-traded futures and they are standardized as to maturity date and underlying financial instrument. Initial margin deposits required upon entering into futures contracts are satisfied by the segregation of specific securities or cash as collateral at the futures commission merchant (broker). During the period the futures contracts are open, changes in the value of the contracts are recognized as unrealized gains or losses by recalculating the value of the contracts on a daily basis. Subsequent or variation margin payments are received or made depending upon whether unrealized gains or losses are incurred. These amounts are reflected as receivables or payables on the Statement of Assets and Liabilities. When the contracts are closed or expire, the Fund recognizes a realized gain or loss equal to the difference between the proceeds from, or cost of, the closing transaction and the Fund’s basis in the contract. The net realized gain (loss) and the change in unrealized gain (loss) on futures contracts held during the period is included on the Statement of Operations. The primary risks associated with futures contracts are market risk and the absence of a liquid secondary market. If the Fund were unable to liquidate a futures contract and/or enter into an offsetting closing transaction, the Fund would continue to be subject to market risk with respect to the value of the contracts and continue to be required to maintain the margin deposits on the futures contracts. Futures contracts have minimal Counterparty risk since the exchange’s clearinghouse, as Counterparty to all exchange-traded futures, guarantees the futures against default. Risks may exceed amounts recognized in the Statement of Assets and Liabilities. |
| L. | Leverage Risk — Leverage exists when the Fund can lose more than it originally invests because it purchases or sells an instrument or enters into a transaction without investing an amount equal to the full economic exposure of the instrument or transaction. |
| M. | Collateral —To the extent the Fund has designated or segregated a security as collateral and that security is subsequently sold, it is the Fund’s practice to replace such collateral no later than the next business day. |
| N. | COVID-19 Risk – The COVID-19 strain of coronavirus has resulted in instances of market closures and dislocations, extreme volatility, liquidity constraints and increased trading costs. Efforts to contain its spread have resulted in travel restrictions, disruptions of healthcare systems, business operations (including business closures) and supply chains, layoffs, lower consumer demand and employee availability, and defaults and credit downgrades, among other significant economic impacts that have disrupted global economic activity across many industries. Such economic impacts may exacerbate other pre-existing political, social and economic risks locally or globally and cause general concern and uncertainty. The full economic impact and ongoing effects of COVID-19 (or other future epidemics or pandemics) at the macro-level and on individual businesses are unpredictable and may result in significant and prolonged effects on the Fund’s performance. |
NOTE 2–Advisory Fees and Other Fees Paid to Affiliates
The Trust has entered into a master investment advisory agreement with the Adviser. Under the terms of the investment advisory agreement, the Fund does not pay an advisory fee. However, the Fund pays advisory fees to the Adviser indirectly as a shareholder of the underlying funds.
Under the terms of a master sub-advisory agreement between the Adviser and each of Invesco Asset Management Deutschland GmbH, Invesco Asset Management Limited, Invesco Asset Management (Japan) Limited, Invesco Hong Kong Limited, Invesco Senior Secured Management, Inc. and Invesco Canada Ltd. and separate sub-advisory agreements with Invesco Capital Management LLC and Invesco Asset Management (India) Private Limited (collectively, the “Affiliated Sub-Advisers”) the Adviser, not the Fund, will pay 40% of the fees paid to the Adviser to any such Affiliated Sub-Adviser(s) that provide(s) discretionary investment management services to the Fund based on the percentage of assets allocated to such Affiliated Sub-Adviser(s). Invesco has also entered into a sub-advisory agreement with OppenheimerFunds, Inc. to provide discretionary management services to the Fund.
15 Invesco Select Risk: High Growth Investor Fund
Effective May 1, 2022 through at least April 30, 2024, the Adviser has contractually agreed to reimburse expenses of all shares to the extent necessary to limit total annual fund operating expenses after expense reimbursement (excluding certain items discussed below) of Class A, Class C, Class R, Class Y, Class R5 and Class R6 shares to 0.45%, 1.20%, 0.70%, 0.20%, 0.20%, and 0.20%, respectively, of the Fund’s average daily net assets (the “expense limits”). Prior to May 1, 2022, the Adviser had contractually agreed to reimburse expenses of all shares to the extent necessary to limit total annual fund operating expenses after expense reimbursement (excluding certain items discussed below) of Class A, Class C, Class R, Class Y, Class R5 and Class R6 shares to 0.45%, 1.20%, 0.70%, 0.20%, 0.15% and 0.10%, respectively, of the Fund’s average daily net assets. In determining the Adviser’s obligation to reimburse expenses, the following expenses are not taken into account, and could cause the total annual fund operating expenses after expense reimbursement to exceed the numbers reflected above: (1) interest; (2) taxes; (3) dividend expense on short sales; (4) extraordinary or non-routine items, litigation expenses; and (5) expenses that the Fund has incurred but did not actually pay because of an expense offset arrangement. Unless Invesco continues the expense reimbursement agreement, it will terminate on April 30, 2024. During its term, the expense reimbursement agreement cannot be terminated or amended to increase the expense limits or reduce the expense reimbursement without approval of the Board of Trustees.
For the year ended December 31, 2022, the Adviser reimbursed class level expenses of $2 of Class R6 shares.
The Trust has entered into a master administrative services agreement with Invesco pursuant to which the Fund has agreed to pay Invesco for certain administrative costs incurred in providing accounting services to the Fund. For the year ended December 31, 2022, expenses incurred under the agreement are shown in the Statement of Operations as Administrative services fees. Invesco has entered into a sub-administration agreement whereby State Street Bank and Trust Company (“SSB”) serves as fund accountant and provides certain administrative services to the Fund. Pursuant to a custody agreement with the Trust on behalf of the Fund, SSB also serves as the Fund’s custodian.
The Trust has entered into a transfer agency and service agreement with Invesco Investment Services, Inc. (“IIS”) pursuant to which the Fund has agreed to pay IIS a fee for providing transfer agency and shareholder services to the Fund and reimburse IIS for certain expenses incurred by IIS in the course of providing such services. IIS may make payments to intermediaries that provide omnibus account services, sub-accounting services and/or networking services. All fees payable by IIS to intermediaries that provide omnibus account services or sub-accounting services are charged back to the Fund, subject to certain limitations approved by the Trust’s Board of Trustees. For the year ended December 31, 2022, expenses incurred under the agreement are shown in the Statement of Operations as Transfer agent fees.
The Trust has entered into master distribution agreements with Invesco Distributors, Inc. (“IDI”) to serve as the distributor for the Class A, Class C, Class R, Class Y, Class R5 and Class R6 shares of the Fund. The Trust has adopted plans pursuant to Rule 12b-1 under the 1940 Act with respect to the Fund’s Class A, Class C and Class R shares (collectively, the “Plans”). The Fund, pursuant to the Plans, pays IDI compensation at the annual rate of 0.25% of the Fund’s average daily net assets of Class A shares, 1.00% of the average daily net assets of Class C shares and 0.50% of the average daily net assets of Class R shares. The fees are accrued daily and paid monthly. Of the Plan payments, up to 0.25% of the average daily net assets of each class of shares may be paid to furnish continuing personal shareholder services to customers who purchase and own shares of such classes. Any amounts not paid as a service fee under the Plans would constitute an asset-based sales charge. Rules of the Financial Industry Regulatory Authority (“FINRA”) impose a cap on the total sales charges, including asset-based sales charges, that may be paid by any class of shares of the Fund. For the year ended December 31, 2022, expenses incurred under the Plans are shown in the Statement of Operations as Distribution fees.
Front-end sales commissions and CDSC (collectively, the “sales charges”) are not recorded as expenses of the Fund. Front-end sales commissions are deducted from proceeds from the sales of Fund shares prior to investment in Class A shares of the Fund. CDSC are deducted from redemption proceeds prior to remittance to the shareholder. During the year ended December 31, 2022, IDI advised the Fund that IDI retained $126,643 in front-end sales commissions from the sale of Class A shares and $6,381 and $1,312 from Class A and Class C shares, respectively, for CDSC imposed upon redemptions by shareholders.
The underlying Invesco Funds pay no distribution fees for Class R6 shares and the Funds pay no sales loads or other similar compensation to IDI for acquiring underlying fund shares.
Certain officers and trustees of the Trust are officers and directors of the Adviser, IIS and/or IDI.
NOTE 3–Additional Valuation Information
GAAP defines fair value as the price that would be received to sell an asset or paid to transfer a liability in an orderly transaction between market participants at the measurement date, under current market conditions. GAAP establishes a hierarchy that prioritizes the inputs to valuation methods, giving the highest priority to readily available unadjusted quoted prices in an active market for identical assets (Level 1) and the lowest priority to significant unobservable inputs (Level 3), generally when market prices are not readily available. Based on the valuation inputs, the securities or other investments are tiered into one of three levels. Changes in valuation methods may result in transfers in or out of an investment’s assigned level:
| Level 1 - | Prices are determined using quoted prices in an active market for identical assets. | |||
| Level 2 - | Prices are determined using other significant observable inputs. Observable inputs are inputs that other market participants may use in pricing a security. These may include quoted prices for similar securities, interest rates, prepayment speeds, credit risk, yield curves, loss severities, default rates, discount rates, volatilities and others. | |||
| Level 3 - | Prices are determined using significant unobservable inputs. In situations where quoted prices or observable inputs are unavailable (for example, when there is little or no market activity for an investment at the end of the period), unobservable inputs may be used. Unobservable inputs reflect the Adviser’s assumptions about the factors market participants would use in determining fair value of the securities or instruments and would be based on the best available information. |
The following is a summary of the tiered valuation input levels, as of December 31, 2022. The level assigned to the securities valuations may not be an indication of the risk or liquidity associated with investing in those securities. Because of the inherent uncertainties of valuation, the values reflected in the financial statements may materially differ from the value received upon actual sale of those investments.
| Level 1 | Level 2 | Level 3 | Total | |||||||||||||
| ||||||||||||||||
Investments in Securities | ||||||||||||||||
| ||||||||||||||||
Affiliated Issuers | $ | 723,227,134 | $ | – | $– | $ | 723,227,134 | |||||||||
| ||||||||||||||||
Money Market Funds | 4,454,447 | 1,324 | – | 4,455,771 | ||||||||||||
| ||||||||||||||||
Total Investments in Securities | 727,681,581 | 1,324 | – | 727,682,905 | ||||||||||||
| ||||||||||||||||
Other Investments - Liabilities* | ||||||||||||||||
| ||||||||||||||||
Futures Contracts | (189,727 | ) | – | – | (189,727 | ) | ||||||||||
| ||||||||||||||||
Total Investments | $ | 727,491,854 | $ | 1,324 | $– | $ | 727,493,178 | |||||||||
| ||||||||||||||||
| * | Unrealized appreciation (depreciation). |
16 Invesco Select Risk: High Growth Investor Fund
NOTE 4–Derivative Investments
The Fund may enter into an International Swaps and Derivatives Association Master Agreement (“ISDA Master Agreement”) under which a fund may trade OTC derivatives. An OTC transaction entered into under an ISDA Master Agreement typically involves a collateral posting arrangement, payment netting provisions and close-out netting provisions. These netting provisions allow for reduction of credit risk through netting of contractual obligations. The enforceability of the netting provisions of the ISDA Master Agreement depends on the governing law of the ISDA Master Agreement, among other factors.
For financial reporting purposes, the Fund does not offset OTC derivative assets or liabilities that are subject to ISDA Master Agreements in the Statement of Assets and Liabilities.
Value of Derivative Investments at Period-End
The table below summarizes the value of the Fund’s derivative investments, detailed by primary risk exposure, held as of December 31, 2022:
| Value | ||||
|
| |||
| Equity | ||||
| Derivative Liabilities | Risk | |||
| ||||
| Unrealized depreciation on futures contracts – Exchange-Traded(a) | $(189,727) | |||
| ||||
| Derivatives not subject to master netting agreements | 189,727 | |||
| ||||
| Total Derivative Liabilities subject to master netting agreements | $ - | |||
| ||||
| (a) | The daily variation margin receivable (payable) at period end is recorded in the Statement of Assets and Liabilities. |
Effect of Derivative Investments for the year ended December 31, 2022
The table below summarizes the gains (losses) on derivative investments, detailed by primary risk exposure, recognized in earnings during the period:
| Location of Gain (Loss) on | ||||||||||||
| Statement of Operations | ||||||||||||
| Equity | ||||||||||||
| Risk | ||||||||||||
| ||||||||||||
Realized Gain (Loss): | ||||||||||||
Futures contracts | $(1,122,504 | ) | ||||||||||
| ||||||||||||
Change in Net Unrealized Appreciation (Depreciation): | ||||||||||||
Futures contracts | (361,949 | ) | ||||||||||
| ||||||||||||
Total | $(1,484,453 | ) | ||||||||||
| ||||||||||||
The table below summarizes the average notional value of derivatives held during the period.
| Futures | ||||
| Contracts | ||||
| ||||
Average notional value | $ | 6,968,014 | ||
| ||||
NOTE 5–Expense Offset Arrangement(s)
The expense offset arrangement is comprised of transfer agency credits which result from balances in demand deposit accounts used by the transfer agent for clearing shareholder transactions. For the year ended December 31, 2022, the Fund received credits from this arrangement, which resulted in the reduction of the Fund’s total expenses of $12,282.
NOTE 6–Trustees’ and Officers’ Fees and Benefits
Trustees’ and Officers’ Fees and Benefits include amounts accrued by the Fund to pay remuneration to certain Trustees and Officers of the Fund. Trustees have the option to defer compensation payable by the Fund, and Trustees’ and Officers’ Fees and Benefits also include amounts accrued by the Fund to fund such deferred compensation amounts. Those Trustees who defer compensation have the option to select various Invesco Funds in which their deferral accounts shall be deemed to be invested. Finally, certain current Trustees were eligible to participate in a retirement plan that provided for benefits to be paid upon retirement to Trustees over a period of time based on the number of years of service. The Fund may have certain former Trustees who also participate in a retirement plan and receive benefits under such plan. Trustees’ and Officers’ Fees and Benefits include amounts accrued by the Fund to fund such retirement benefits. Obligations under the deferred compensation and retirement plans represent unsecured claims against the general assets of the Fund.
NOTE 7–Cash Balances
The Fund is permitted to temporarily carry a negative or overdrawn balance in its account with SSB, the custodian bank. Such balances, if any at period-end, are shown in the Statement of Assets and Liabilities under the payable caption Amount due custodian. To compensate the custodian bank for such overdrafts, the overdrawn Fund may either (1) leave funds as a compensating balance in the account so the custodian bank can be compensated by earning the additional interest; or (2) compensate by paying the custodian bank at a rate agreed upon by the custodian bank and Invesco, not to exceed the contractually agreed upon rate. The Fund may not purchase additional securities when any borrowings from banks or broker-dealers exceed 5% of the Fund’s total assets, or when any borrowings from an Invesco Fund are outstanding.
17 Invesco Select Risk: High Growth Investor Fund
NOTE 8–Distributions to Shareholders and Tax Components of Net Assets
Tax Character of Distributions to Shareholders Paid During the Fiscal Years Ended December 31, 2022 and 2021:
| 2022 | 2021 | |||||||
| ||||||||
Ordinary income* | $ | 7,821,447 | $ | 34,162,974 | ||||
| ||||||||
Long-term capital gain | 37,753,241 | 27,087,187 | ||||||
| ||||||||
Total distributions | $ | 45,574,688 | $ | 61,250,161 | ||||
| ||||||||
| * | Includes short-term capital gain distributions, if any. |
Tax Components of Net Assets at Period-End:
| 2022 | ||||
| ||||
Undistributed ordinary income | $ | 3,802 | ||
| ||||
Undistributed long-term capital gain | 11,692,301 | |||
| ||||
Net unrealized appreciation – investments | 27,003,163 | |||
| ||||
Net unrealized appreciation (depreciation) – foreign currencies | (25,200 | ) | ||
| ||||
Temporary book/tax differences | (50,434 | ) | ||
| ||||
Shares of beneficial interest | 689,986,313 | |||
| ||||
Total net assets | $ | 728,609,945 | ||
| ||||
The difference between book-basis and tax-basis unrealized appreciation (depreciation) is due to differences in the timing of recognition of gains and losses on investments for tax and book purposes. The Fund’s net unrealized appreciation (depreciation) difference is attributable primarily to wash sales.
The temporary book/tax differences are a result of timing differences between book and tax recognition of income and/or expenses. The Fund’s temporary book/tax differences are the result of the trustee deferral of compensation and retirement plan benefits.
Capital loss carryforward is calculated and reported as of a specific date. Results of transactions and other activity after that date may affect the amount of capital loss carryforward actually available for the Fund to utilize. The ability to utilize capital loss carryforward in the future may be limited under the Internal Revenue Code and related regulations based on the results of future transactions.
The Fund does not have a capital loss carryforward as of December 31, 2022.
NOTE 9–Investment Transactions
The aggregate amount of investment securities (other than short-term securities, U.S. Government obligations and money market funds, if any) purchased and sold by the Fund during the year ended December 31, 2022 was $212,740,666 and $222,150,326, respectively. Cost of investments, including any derivatives, on a tax basis includes the adjustments for financial reporting purposes as of the most recently completed federal income tax reporting period-end.
| Unrealized Appreciation (Depreciation) of Investments on a Tax Basis | ||||
| ||||
Aggregate unrealized appreciation of investments | $ | 64,853,141 | ||
| ||||
Aggregate unrealized (depreciation) of investments | (37,849,978 | ) | ||
| ||||
Net unrealized appreciation of investments | $ | 27,003,163 | ||
| ||||
Cost of investments for tax purposes is $700,490,015.
NOTE 10–Reclassification of Permanent Differences
Primarily as a result of differing book/tax treatment of distributions, partnerships and equalization, on December 31, 2022, undistributed net investment income was increased by $270,859, undistributed net realized gain was decreased by $3,257,858 and shares of beneficial interest was increased by $2,986,999. This reclassification had no effect on the net assets of the Fund.
NOTE 11–Share Information
| Summary of Share Activity | ||||||||||||||||
| ||||||||||||||||
| Year ended December 31, 2022 | Year ended December 31, 2021 | |||||||||||||||
| Shares | Amount | Shares | Amount | |||||||||||||
| ||||||||||||||||
Sold: | ||||||||||||||||
Class A | 3,915,203 | $ | 53,041,156 | 3,768,609 | $ | 61,352,978 | ||||||||||
| ||||||||||||||||
Class C | 952,699 | 12,305,439 | 1,005,459 | 15,743,648 | ||||||||||||
| ||||||||||||||||
Class R | 1,085,730 | 14,599,307 | 939,898 | 15,314,471 | ||||||||||||
| ||||||||||||||||
Class Y | 596,974 | 7,895,694 | 264,687 | 4,366,110 | ||||||||||||
| ||||||||||||||||
Class R6 | 1,276 | 16,257 | 22,296 | 352,221 | ||||||||||||
| ||||||||||||||||
Issued as reinvestment of dividends: | ||||||||||||||||
Class A | 2,903,853 | 35,513,530 | 3,028,393 | 47,727,446 | ||||||||||||
| ||||||||||||||||
Class C | 362,891 | 4,249,483 | 421,757 | 6,372,745 | ||||||||||||
| ||||||||||||||||
Class R | 358,216 | 4,377,396 | 350,594 | 5,518,320 | ||||||||||||
| ||||||||||||||||
Class Y | 59,288 | 731,017 | 46,943 | 745,454 | ||||||||||||
| ||||||||||||||||
Class R6 | 38 | 464 | 1,648 | 25,924 | ||||||||||||
| ||||||||||||||||
18 Invesco Select Risk: High Growth Investor Fund
| Summary of Share Activity | ||||||||||||||||
| ||||||||||||||||
| Year ended December 31, 2022 | Year ended December 31, 2021 | |||||||||||||||
| Shares | Amount | Shares | Amount | |||||||||||||
| ||||||||||||||||
Automatic conversion of Class C shares to Class A shares: | ||||||||||||||||
Class A | 664,369 | $ | 8,954,181 | 668,770 | $ | 10,916,017 | ||||||||||
| ||||||||||||||||
Class C | (695,192 | ) | (8,954,181 | ) | (697,889 | ) | (10,916,017 | ) | ||||||||
| ||||||||||||||||
Reacquired: | ||||||||||||||||
Class A | (6,205,956 | ) | (84,245,940 | ) | (8,607,620 | ) | (140,799,656 | ) | ||||||||
| ||||||||||||||||
Class C | (1,079,544 | ) | (13,968,015 | ) | (1,217,054 | ) | (18,970,367 | ) | ||||||||
| ||||||||||||||||
Class R | (894,662 | ) | (12,238,901 | ) | (1,073,025 | ) | (17,457,886 | ) | ||||||||
| ||||||||||||||||
Class Y | (390,207 | ) | (5,237,255 | ) | (392,338 | ) | (6,489,603 | ) | ||||||||
| ||||||||||||||||
Class R6 | (22,371 | ) | (349,434 | ) | (2,214 | ) | (35,719 | ) | ||||||||
| ||||||||||||||||
Net increase (decrease) in share activity | 1,612,605 | $ | 16,690,198 | (1,471,086 | ) | $ | (26,233,914 | ) | ||||||||
| ||||||||||||||||
19 Invesco Select Risk: High Growth Investor Fund
Report of Independent Registered Public Accounting Firm
To the Board of Trustees of AIM Growth Series (Invesco Growth Series) and Shareholders of Invesco Select Risk: High Growth Investor Fund
Opinion on the Financial Statements
We have audited the accompanying statement of assets and liabilities, including the schedule of investments, of Invesco Select Risk: High Growth Investor Fund (one of the funds constituting AIM Growth Series (Invesco Growth Series), referred to hereafter as the “Fund”) as of December 31, 2022, the related statement of operations for the year ended December 31, 2022, the statement of changes in net assets for each of the two years in the period ended December 31, 2022, including the related notes, and the financial highlights for each of the periods indicated in the table below (collectively referred to as the “financial statements”). In our opinion, the financial statements present fairly, in all material respects, the financial position of the Fund as of December 31, 2022, the results of its operations for the year then ended, the changes in its net assets for each of the two years in the period ended December 31, 2022 and the financial highlights for each of the periods indicated in the table below, in conformity with accounting principles generally accepted in the United States of America.
| Financial Highlights |
| For each of the three years in the period ended December 31, 2022 and the eleven months ended December 31, 2019 for Class A, Class C, Class R and Class Y. |
| For each of the three years in the period ended December 31, 2022 and the period May 24, 2019 (commencement of operations) through December 31, 2019 for Class R5 and Class R6. |
The financial statements of Oppenheimer Portfolio Series: Growth Investor Fund (subsequently renamed Invesco Select Risk: High Growth Investor Fund)as of and for the year ended January 31, 2019 and the financial highlights for each of the periods ended on or prior to January 31, 2019 (not presented herein, other than the financial highlights) were audited by other auditors whose report dated March 25, 2019 expressed an unqualified opinion on those financial statements and financial highlights.
Basis for Opinion
These financial statements are the responsibility of the Fund’s management. Our responsibility is to express an opinion on the Fund’s financial statements based on our audits. We are a public accounting firm registered with the Public Company Accounting Oversight Board (United States) (PCAOB) and are required to be independent with respect to the Fund in accordance with the U.S. federal securities laws and the applicable rules and regulations of the Securities and Exchange Commission and the PCAOB.
We conducted our audits of these financial statements in accordance with the standards of the PCAOB. Those standards require that we plan and perform the audit to obtain reasonable assurance about whether the financial statements are free of material misstatement, whether due to error or fraud.
Our audits included performing procedures to assess the risks of material misstatement of the financial statements, whether due to error or fraud, and performing procedures that respond to those risks. Such procedures included examining, on a test basis, evidence regarding the amounts and disclosures in the financial statements. Our audits also included evaluating the accounting principles used and significant estimates made by management, as well as evaluating the overall presentation of the financial statements. Our procedures included confirmation of securities owned as of December 31, 2022 by correspondence with the custodian, transfer agent and brokers; when replies were not received from brokers, we performed other auditing procedures. We believe that our audits provide a reasonable basis for our opinion.
/s/PricewaterhouseCoopers LLP
Houston, Texas
February 22, 2023
We have served as the auditor of one or more of the investment companies in the Invesco group of investment companies since at least 1995. We have not been able to determine the specific year we began serving as auditor.
20 Invesco Select Risk: High Growth Investor Fund
Calculating your ongoing Fund expenses
Example
As a shareholder of the Fund, you incur two types of costs: (1) transaction costs, which may include sales charges (loads) on purchase payments or contingent deferred sales charges on redemptions, if any; and (2) ongoing costs, including management fees, distribution and/or service (12b-1) fees, and other Fund expenses. This example is intended to help you understand your ongoing costs (in dollars) of investing in the Fund and to compare these costs with ongoing costs of investing in other mutual funds. The example is based on an investment of $1,000 invested at the beginning of the period and held for the entire period July 1, 2022 through December 31, 2022.
In addition to the fees and expenses which the Fund bears directly, the Fund indirectly bears a pro-rata share of the fees and expenses of the underlying funds in which the Fund invests. The amount of fees and expenses incurred indirectly by the Fund will vary because the underlying funds have varied expenses and fee levels and the Fund may own different proportions of the underlying funds at different times. Estimated underlying fund expenses are not expenses that are incurred directly by the Fund. They are expenses that are incurred directly by the underlying funds and are deducted from the value of the underlying funds the Fund invests in. The effect of the estimated underlying fund expenses that the Fund bears indirectly are included in the Fund’s total return.
Actual expenses
The table below provides information about actual account values and actual expenses. You may use the information in this table, together with the amount you invested, to estimate the expenses that you paid over the period. Simply divide your account value by $1,000 (for example, an $8,600 account value divided by $1,000 = 8.6), then multiply the result by the number in the table under the heading entitled “Actual Expenses Paid During Period” to estimate the expenses you paid on your account during this period.
Hypothetical example for comparison purposes
The table below also provides information about hypothetical account values and hypothetical expenses based on the Fund’s actual expense ratio and an assumed rate of return of 5% per year before expenses, which is not the Fund’s actual return.
The hypothetical account values and expenses may not be used to estimate the actual ending account balance or expenses you paid for the period. You may use this information to compare the ongoing costs of investing in the Fund and other funds. To do so, compare this 5% hypothetical example with the 5% hypothetical examples that appear in the shareholder reports of the other funds.
Please note that the expenses shown in the table are meant to highlight your ongoing costs only and do not reflect any transaction costs, such as sales charges (loads) on purchase payments or contingent deferred sales charges on redemptions, if any. Therefore, the hypothetical information is useful in comparing ongoing costs only, and will not help you determine the relative total costs of owning different funds. In addition, expenses shown in the table do not include the expenses of the underlying funds, which are borne indirectly by the Fund. If transaction costs and indirect expenses were included, your costs would have been higher.
| ACTUAL | HYPOTHETICAL (5% annual return before expenses) | |||||||||||||||||||||||
| Beginning Account Value (07/01/22) | Ending Account Value (12/31/22)1 | Expenses Paid During Period2 | Ending Account Value (12/31/22) | Expenses Paid During Period2 | Annualized Expense Ratio | |||||||||||||||||||
| Class A | $1,000.00 | $1,023.20 | $1.99 | $1,023.24 | $1.99 | 0.39% | ||||||||||||||||||
| Class C | 1,000.00 | 1,019.00 | 5.85 | 1,019.41 | 5.85 | 1.15 | ||||||||||||||||||
| Class R | 1,000.00 | 1,021.30 | 3.31 | 1,021.93 | 3.31 | 0.65 | ||||||||||||||||||
| Class Y | 1,000.00 | 1,024.00 | 0.77 | 1,024.45 | 0.77 | 0.15 | ||||||||||||||||||
| Class R5 | 1,000.00 | 1,024.70 | 0.51 | 1,024.70 | 0.51 | 0.10 | ||||||||||||||||||
| Class R6 | 1,000.00 | 1,024.70 | 0.51 | 1,024.70 | 0.51 | 0.10 | ||||||||||||||||||
| 1 | The actual ending account value is based on the actual total return of the Fund for the period July 1, 2022 through December 31, 2022, after actual expenses and will differ from the hypothetical ending account value which is based on the Fund’s expense ratio and a hypothetical annual return of 5% before expenses. |
| 2 | Expenses are equal to the Fund’s annualized expense ratio as indicated above multiplied by the average account value over the period, multiplied by 184/365 to reflect the most recent fiscal half year. |
21 Invesco Select Risk: High Growth Investor Fund
Form 1099-DIV, Form 1042-S and other year–end tax information provide shareholders with actual calendar year amounts that should be included in their tax returns. Shareholders should consult their tax advisers.
The following distribution information is being provided as required by the Internal Revenue Code or to meet a specific state’s requirement.
The Fund designates the following amounts or, if subsequently determined to be different, the maximum amount allowable for its fiscal year ended December 31, 2022:
| Federal and State Income Tax | ||||||||
Long-Term Capital Gain Distributions | $ | 37,753,241 | ||||||
Qualified Dividend Income* | 92.84 | % | ||||||
Corporate Dividends Received Deduction* | 55.58 | % | ||||||
U.S. Treasury Obligations* | 6.12 | % | ||||||
Qualified Business Income* | 4.86 | % | ||||||
Business Interest Income* | 12.72 | % | ||||||
| * The above percentages are based on ordinary income dividends paid to shareholders during the Fund’s fiscal year. |
| |||||||
| Non-Resident Alien Shareholders |
| |||||
Short-Term Capital Gain Distributions | $ | 166,766 | ||||
22 Invesco Select Risk: High Growth Investor Fund
The address of each trustee and officer is AIM Growth Series (Invesco Growth Series) (the “Trust”), 11 Greenway Plaza, Suite 1000, Houston, Texas 77046-1173. The trustees serve for the life of the Trust, subject to their earlier death, incapacitation, resignation, retirement or removal as more specifically provided in the Trust’s organizational documents. Each officer serves for a one year term or until their successors are elected and qualified. Column two below includes length of time served with predecessor entities, if any.
| Name, Year of Birth and Position(s) Held with the Trust | Trustee and/or Officer Since | Principal Occupation(s) During Past 5 Years | Number of Funds in Fund Complex Overseen by Trustee | Other Directorship(s) Held by Trustee During Past 5 Years | ||||
Interested Trustee | ||||||||
| Martin L. Flanagan1 – 1960 Trustee and Vice Chair | 2007 | Executive Director, Chief Executive Officer and President, Invesco Ltd. (ultimate parent of Invesco and a global investment management firm); Trustee and Vice Chair, The Invesco Funds; Vice Chair, Investment Company Institute; and Member of Executive Board, SMU Cox School of Business
Formerly: Advisor to the Board, Invesco Advisers, Inc. (formerly known as Invesco Institutional (N.A.), Inc.); Chairman and Chief Executive Officer, Invesco Advisers, Inc. (registered investment adviser); Director, Chairman, Chief Executive Officer and President, Invesco Holding Company (US), Inc. (formerly IVZ Inc.) (holding company), Invesco Group Services, Inc. (service provider) and Invesco North American Holdings, Inc. (holding company); Director, Chief Executive Officer and President, Invesco Holding Company Limited (parent of Invesco and a global investment management firm); Director, Invesco Ltd.; Chairman, Investment Company Institute and President, Co-Chief Executive Officer, Co-President, Chief Operating Officer and Chief Financial Officer, Franklin Resources, Inc. (global investment management organization) | 189 | None |
| 1 | Mr. Flanagan is considered an interested person (within the meaning of Section 2(a)(19) of the 1940 Act) of the Trust because he is an officer of the Adviser to the Trust, and an officer and a director of Invesco Ltd., ultimate parent of the Adviser. |
T-1 Invesco Select Risk: High Growth Investor Fund
Trustees and Officers–(continued)
| Name, Year of Birth and Position(s) Held with the Trust | Trustee and/or Officer Since | Principal Occupation(s) During Past 5 Years | Number of Funds in Fund Complex Overseen by Trustee | Other Directorship(s) Held by Trustee During Past 5 Years | ||||
Independent Trustees | ||||||||
Beth Ann Brown – 1968 Trustee (2019) and Chair (August 2022) | 2019 | Independent Consultant
Formerly: Head of Intermediary Distribution, Managing Director, Strategic Relations, Managing Director, Head of National Accounts, Senior Vice President, National Account Manager and Senior Vice President, Key Account Manager, Columbia Management Investment Advisers LLC; Vice President, Key Account Manager, Liberty Funds Distributor, Inc.; and Trustee of certain Oppenheimer Funds | 189 | Director, Board of Directors of Caron Engineering Inc.; Advisor, Board of Advisors of Caron Engineering Inc.; President and Director, Acton Shapleigh Youth Conservation Corps (non-profit) Formerly: President and Director Director of Grahamtastic Connection (non-profit) | ||||
Cynthia Hostetler – 1962 Trustee | 2017 | Non-Executive Director and Trustee of a number of public and private business corporations
Formerly: Director, Aberdeen Investment Funds (4 portfolios); Director, Artio Global Investment LLC (mutual fund complex); Director, Edgen Group, Inc. (specialized energy and infrastructure products distributor); Director, Genesee & Wyoming, Inc. (railroads); Head of Investment Funds and Private Equity, Overseas Private Investment Corporation; President, First Manhattan Bancorporation, Inc.; and Attorney, Simpson Thacher & Bartlett LLP | 189 | Resideo Technologies, Inc. (smart home technology); Vulcan Materials Company (construction materials company); Trilinc Global Impact Fund; Textainer Group Holdings, (shipping container leasing company); Investment Company Institute (professional organization); and Independent Directors Council (professional organization) | ||||
Eli Jones – 1961 Trustee | 2016 | Professor and Dean Emeritus, Mays Business School - Texas A&M University
Formerly: Dean of Mays Business School-Texas A&M University; Professor and Dean, Walton College of Business, University of Arkansas and E.J. Ourso College of Business, Louisiana State University; and Director, Arvest Bank | 189 | Insperity, Inc. (formerly known as Administaff) (human resources provider); and Member of Regional Board of Directors and Board of Directors, First Financial Bancorp (regional bank) | ||||
| Elizabeth Krentzman – 1959 Trustee | 2019 | Formerly: Principal and Chief Regulatory Advisor for Asset Management Services and U.S. Mutual Fund Leader of Deloitte & Touche LLP; General Counsel of the Investment Company Institute (trade association); National Director of the Investment Management Regulatory Consulting Practice, Principal, Director and Senior Manager of Deloitte & Touche LLP; Assistant Director of the Division of Investment Management - Office of Disclosure and Investment Adviser Regulation of the U.S. Securities and Exchange Commission and various positions with the Division of Investment Management – Office of Regulatory Policy of the U.S. Securities and Exchange Commission; Associate at Ropes & Gray LLP; and Trustee of certain Oppenheimer Funds | 189 | Formerly: Member of the Cartica Funds Board of Directors (private investment fund); Trustee of the University of Florida National Board Foundation; and Member of the University of Florida Law Center Association, Inc. Board of Trustees, Audit Committee and Membership Committee | ||||
| Anthony J. LaCava, Jr. – 1956 Trustee | 2019 | Formerly: Director and Member of the Audit Committee, Blue Hills Bank (publicly traded financial institution) and Managing Partner, KPMG LLP | 189 | Blue Hills Bank; Chairman, Bentley University; Member, Business School Advisory Council; and Nominating Committee, KPMG LLP | ||||
| Prema Mathai-Davis – 1950 Trustee | 2001 | Retired
Formerly: Co-Founder & Partner of Quantalytics Research, LLC, (a FinTech Investment Research Platform for the Self-Directed Investor); Trustee of YWCA Retirement Fund; CEO of YWCA of the USA; Board member of the NY Metropolitan Transportation Authority; Commissioner of the NYC Department of Aging; and Board member of Johns Hopkins Bioethics Institute | 189 | Member of Board of Positive Planet US (non-profit) and HealthCare Chaplaincy Network (non-profit) | ||||
T-2 Invesco Select Risk: High Growth Investor Fund
Trustees and Officers–(continued)
| Name, Year of Birth and Position(s) Held with the Trust | Trustee and/or Officer Since | Principal Occupation(s) During Past 5 Years | Number of Funds in Fund Complex Overseen by Trustee | Other Directorship(s) Held by Trustee During Past 5 Years | ||||
Independent Trustees–(continued) | ||||||||
Joel W. Motley – 1952 Trustee | 2019 | Director of Office of Finance, Federal Home Loan Bank System; Managing Director of Carmona Motley Inc. (privately held financial advisor); Member of the Council on Foreign Relations and its Finance and Budget Committee; Chairman Emeritus of Board of Human Rights Watch and Member of its Investment Committee; and Member of Investment Committee Board of Historic Hudson Valley (non-profit cultural organization); Member of the Board, Blue Ocean Acquisition Corp.; and Member of the Vestry and the Investment Committee of Trinity Church Wall Street.
Formerly: Managing Director of Public Capital Advisors, LLC (privately held financial advisor); Managing Director of Carmona Motley Hoffman, Inc. (privately held financial advisor); Trustee of certain Oppenheimer Funds; and Director of Columbia Equity Financial Corp. (privately held financial advisor) | 189 | Member of Board of Trust for Mutual Understanding (non-profit promoting the arts and environment); Member of Board of Greenwall Foundation (bioethics research foundation) and its Investment Committee; Member of Board of Friends of the LRC (non-profit legal advocacy); and Board Member and Investment Committee Member of Pulitzer Center for Crisis Reporting (non-profit journalism) | ||||
Teresa M. Ressel – 1962 Trustee | 2017 | Non-executive director and trustee of a number of public and private business corporations
Formerly: Chief Executive Officer, UBS Securities LLC (investment banking); Chief Operating Officer, UBS AG Americas (investment banking); Sr. Management Team Olayan America, The Olayan Group (international investor/commercial/industrial); Assistant Secretary for Management & Budget and Designated Chief Financial Officer, U.S. Department of Treasury and Director, ON Semiconductor Corporation (semiconductor manufacturing) | 189 | None | ||||
Robert C. Troccoli – 1949 Trustee | 2016 | Retired
Formerly: Adjunct Professor, University of Denver – Daniels College of Business; and Managing Partner, KPMG LLP | 189 | None | ||||
Daniel S. Vandivort –1954 Trustee | 2019 | President, Flyway Advisory Services LLC (consulting and property management)
Formerly: President and Chief Investment Officer, previously Head of Fixed Income, Weiss Peck and Greer/Robeco Investment Management; Trustee and Chair, Weiss Peck and Greer Funds Board; and various capacities at CS First Boston including Head of Fixed Income at First Boston Asset Management. | 189 | Formerly: Trustee and Governance Chair, Oppenheimer Funds; Treasurer, Chairman of the Audit and Finance Committee, Huntington Disease Foundation of America | ||||
T-3 Invesco Select Risk: High Growth Investor Fund
Trustees and Officers–(continued)
| Name, Year of Birth and Position(s) Held with the Trust | Trustee and/or Officer Since | Principal Occupation(s) During Past 5 Years | Number of Funds in Fund Complex Overseen by Trustee | Other Directorship(s) Held by Trustee During Past 5 Years | ||||
Officers | ||||||||
Sheri Morris – 1964 President and Principal Executive Officer | 1999 | Director, Invesco Trust Company; Head of Global Fund Services, Invesco Ltd.; President and Principal Executive Officer, The Invesco Funds; Vice President, Invesco Exchange-Traded Fund Trust, Invesco Exchange-Traded Fund Trust II, Invesco India Exchange-Traded Fund Trust, Invesco Actively Managed Exchange-Traded Fund Trust, Invesco Actively Managed Exchange-Traded Commodity Fund Trust and Invesco Exchange-Traded Self-Indexed Fund Trust; and Vice President, OppenheimerFunds, Inc.
Formerly: Vice President, Treasurer and Principal Financial Officer, The Invesco Funds; Vice President, Invesco AIM Advisers, Inc., Invesco AIM Capital Management, Inc. and Invesco AIM Private Asset Management, Inc.; Assistant Vice President and Assistant Treasurer, The Invesco Funds; Vice President and Assistant Vice President, Invesco Advisers, Inc.; Assistant Vice President, Invesco AIM Capital Management, Inc. and Invesco AIM Private Asset Management, Inc.; Treasurer, Invesco Exchange-Traded Fund Trust, Invesco Exchange-Traded Fund Trust II, Invesco India Exchange-Traded Fund Trust and Invesco Actively Managed Exchange-Traded Fund Trust; and Senior Vice President, Invesco Advisers, Inc. (formerly known as Invesco Institutional (N.A.), Inc.) (registered investment adviser) | N/A | N/A | ||||
Jeffrey H. Kupor – 1968 Senior Vice President, Chief Legal Officer and Secretary | 2018 | Head of Legal of the Americas, Invesco Ltd.; Senior Vice President and Secretary, Invesco Advisers, Inc. (formerly known as Invesco Institutional (N.A.), Inc.) (registered investment adviser); Secretary, Invesco Distributors, Inc. (formerly known as Invesco AIM Distributors, Inc.); Vice President and Secretary, Invesco Investment Services, Inc. (formerly known as Invesco AIM Investment Services, Inc.); Senior Vice President, Chief Legal Officer and Secretary, The Invesco Funds; Secretary and General Counsel, Invesco Investment Advisers LLC (formerly known as Van Kampen Asset Management); Secretary and General Counsel, Invesco Capital Markets, Inc. (formerly known as Van Kampen Funds Inc.); Chief Legal Officer, Invesco Exchange-Traded Fund Trust, Invesco Exchange-Traded Fund Trust II, Invesco India Exchange-Traded Fund Trust, Invesco Actively Managed Exchange-Traded Fund Trust, Invesco Actively Managed Exchange-Traded Commodity Fund Trust and Invesco Exchange-Traded Self-Indexed Fund Trust;; Secretary and Vice President, Harbourview Asset Management Corporation; Secretary and Vice President, OppenheimerFunds, Inc. and Invesco Managed Accounts, LLC; Secretary and Senior Vice President, OFI Global Institutional, Inc.; Secretary and Vice President, OFI SteelPath, Inc.; Secretary and Vice President, Oppenheimer Acquisition Corp.; Secretary and Vice President, Shareholder Services, Inc.; and Secretary and Vice President, Trinity Investment Management Corporation
Formerly: Senior Vice President, Invesco Distributors, Inc.; Secretary and Vice President, Jemstep, Inc.; Head of Legal, Worldwide Institutional, Invesco Ltd.; Secretary and General Counsel, INVESCO Private Capital Investments, Inc.; Senior Vice President, Secretary and General Counsel, Invesco Management Group, Inc. (formerly known as Invesco AIM Management Group, Inc.); Assistant Secretary, INVESCO Asset Management (Bermuda) Ltd.; Secretary and General Counsel, Invesco Private Capital, Inc.; Assistant Secretary and General Counsel, INVESCO Realty, Inc.; Secretary and General Counsel, Invesco Senior Secured Management, Inc.; Secretary, Sovereign G./P. Holdings Inc.; Secretary, Invesco Indexing LLC; and Secretary, W.L. Ross & Co., LLC | N/A | N/A | ||||
| Andrew R. Schlossberg – 1974 Senior Vice President | 2019 | Senior Vice President, Invesco Group Services, Inc.; Head of the Americas and Senior Managing Director, Invesco Ltd.; Director and Senior Vice President, Invesco Advisers, Inc. (formerly known as Invesco Institutional (N.A.), Inc.) (registered investment adviser); Director and Chairman, Invesco Investment Services, Inc. (formerly known as Invesco AIM Investment Services, Inc.) (registered transfer agent); Senior Vice President, The Invesco Funds; and Director, Invesco Investment Advisers LLC (formerly known as Van Kampen Asset Management)
Formerly: Director, President and Chairman, Invesco Insurance Agency, Inc.; Director, Invesco UK Limited; Director and Chief Executive, Invesco Asset Management Limited and Invesco Fund Managers Limited; Assistant Vice President, The Invesco Funds; Senior Vice President, Invesco Advisers, Inc. (formerly known as Invesco Institutional (N.A.), Inc.) (registered investment adviser); Director and Chief Executive, Invesco Administration Services Limited and Invesco Global Investment Funds Limited; Director, Invesco Distributors, Inc.; Head of EMEA, Invesco Ltd.; President, Invesco Actively Managed Exchange-Traded Commodity Fund Trust, Invesco Actively Managed Exchange-Traded Fund Trust, Invesco Exchange-Traded Fund Trust, Invesco Exchange-Traded Fund Trust II and Invesco India Exchange-Traded Fund Trust; and Managing Director and Principal Executive Officer, Invesco Capital Management LLC | N/A | N/A | ||||
T-4 Invesco Select Risk: High Growth Investor Fund
Trustees and Officers–(continued)
| Name, Year of Birth and Position(s) Held with the Trust | Trustee and/or Officer Since | Principal Occupation(s) During Past 5 Years | Number of Funds in Fund Complex Overseen by Trustee | Other Directorship(s) Held by Trustee During Past 5 Years | ||||
Officers–(continued) | ||||||||
John M. Zerr – 1962 Senior Vice President | 2006 | Chief Operating Officer of the Americas; Senior Vice President, Invesco Advisers, Inc. (formerly known as Invesco Institutional (N.A.), Inc.) (registered investment adviser); Senior Vice President, Invesco Distributors, Inc. (formerly known as Invesco AIM Distributors, Inc.); Director and Vice President, Invesco Investment Services, Inc. (formerly known as Invesco AIM Investment Services, Inc.) Senior Vice President, The Invesco Funds; Managing Director, Invesco Capital Management LLC; Director, Invesco Investment Advisers LLC (formerly known as Van Kampen Asset Management); Senior Vice President, Invesco Capital Markets, Inc. (formerly known as Van Kampen Funds Inc.); Manager, Invesco Indexing LLC; Manager, Invesco Specialized Products, LLC; Member, Invesco Canada Funds Advisory Board; Director, President and Chief Executive Officer, Invesco Corporate Class Inc. (corporate mutual fund company); and Director, Chairman, President and Chief Executive Officer, Invesco Canada Ltd. (formerly known as Invesco Trimark Ltd./Invesco Trimark Ltèe) (registered investment adviser and registered transfer agent); President, Invesco, Inc.; President, Invesco Global Direct Real Estate Feeder GP Ltd.; President, Invesco IP Holdings (Canada) Ltd; President, Invesco Global Direct Real Estate GP Ltd.; President, Invesco Financial Services Ltd. / Services Financiers Invesco Ltée; and Director and Chairman, Invesco Trust Company
Formerly: President, Trimark Investments Ltd/Services Financiers Invesco Ltee; Director and Senior Vice President, Invesco Insurance Agency, Inc.; Director and Senior Vice President, Invesco Management Group, Inc. (formerly known as Invesco AIM Management Group, Inc.); Secretary and General Counsel, Invesco Management Group, Inc. (formerly known as Invesco AIM Management Group, Inc.); Secretary, Invesco Investment Services, Inc. (formerly known as Invesco AIM Investment Services, Inc.); Chief Legal Officer and Secretary, The Invesco Funds; Secretary and General Counsel, Invesco Investment Advisers LLC (formerly known as Van Kampen Asset Management); Secretary and General Counsel, Invesco Capital Markets, Inc. (formerly known as Van Kampen Funds Inc.); Chief Legal Officer, Invesco Exchange-Traded Fund Trust, Invesco Exchange-Traded Fund Trust II, Invesco India Exchange-Traded Fund Trust, Invesco Actively Managed Exchange-Traded Fund Trust, Invesco Actively Managed Exchange-Traded Commodity Fund Trust and Invesco Exchange-Traded Self-Indexed Fund Trust; Secretary, Invesco Indexing LLC; Director, Secretary, General Counsel and Senior Vice President, Van Kampen Exchange Corp.; Director, Vice President and Secretary, IVZ Distributors, Inc. (formerly known as INVESCO Distributors, Inc.); Director and Vice President, INVESCO Funds Group, Inc.; Director and Vice President, Van Kampen Advisors Inc.; Director, Vice President, Secretary and General Counsel, Van Kampen Investor Services Inc.; Director and Secretary, Invesco Distributors, Inc. (formerly known as Invesco AIM Distributors, Inc.); Director, Senior Vice President, General Counsel and Secretary, Invesco AIM Advisers, Inc. and Van Kampen Investments Inc.; Director, Vice President and Secretary, Fund Management Company; Director, Senior Vice President, Secretary, General Counsel and Vice President, Invesco AIM Capital Management, Inc.; and Chief Operating Officer and General Counsel, Liberty Ridge Capital, Inc. (an investment adviser) | N/A | N/A | ||||
| Gregory G. McGreevey – 1962 Senior Vice President | 2012 | Senior Managing Director, Invesco Ltd.; Director, Chairman, President, and Chief Executive Officer, Invesco Advisers, Inc. (formerly known as Invesco Institutional (N.A.), Inc.) (registered investment adviser); Director, Invesco Mortgage Capital, Inc. and Invesco Senior Secured Management, Inc.; Senior Vice President, The Invesco Funds; President, SNW Asset Management Corporation and Invesco Managed Accounts, LLC; Chairman and Director, Invesco Private Capital, Inc.; Chairman and Director, INVESCO Private Capital Investments, Inc.; Chairman and Director, INVESCO Realty, Inc.; and Senior Vice President, Invesco Group Services, Inc.
Formerly: Senior Vice President, Invesco Management Group, Inc. and Invesco Advisers, Inc.; Assistant Vice President, The Invesco Funds | N/A | N/A | ||||
| Adrien Deberghes – 1967 Principal Financial Officer, Treasurer and Vice President | 2020 | Head of the Fund Office of the CFO and Fund Administration; Vice President, Invesco Advisers, Inc.; Principal Financial Officer, Treasurer and Vice President, The Invesco Funds; Vice President, Invesco Exchange-Traded Fund Trust, Invesco Exchange-Traded Fund Trust II, Invesco India Exchange-Traded Fund Trust, Invesco Actively Managed Exchange-Traded Fund Trust, Invesco Actively Managed Exchange-Traded Commodity Fund Trust and Invesco Exchange-Traded Self-Indexed Fund Trust
Formerly: Senior Vice President and Treasurer, Fidelity Investments | N/A | N/A | ||||
| Crissie M. Wisdom – 1969 Anti-Money Laundering Compliance Officer | 2013 | Anti-Money Laundering and OFAC Compliance Officer for Invesco U.S. entities including: Invesco Advisers, Inc. and its affiliates, Invesco Capital Markets, Inc., Invesco Distributors, Inc., Invesco Investment Services, Inc., The Invesco Funds, Invesco Capital Management, LLC, Invesco Trust Company; and Fraud Prevention Manager for Invesco Investment Services, Inc. | N/A | N/A | ||||
T-5 Invesco Select Risk: High Growth Investor Fund
Trustees and Officers–(continued)
| Name, Year of Birth and Position(s) Held with the Trust | Trustee and/or Officer Since | Principal Occupation(s) During Past 5 Years | Number of Funds in Fund Complex Overseen by Trustee | Other Directorship(s) Held by Trustee During Past 5 Years | ||||
Officers–(continued) | ||||||||
Todd F. Kuehl – 1969 Chief Compliance Officer and Senior Vice President | 2020 | Chief Compliance Officer, Invesco Advisers, Inc. (registered investment adviser); and Chief Compliance Officer and Senior Vice President, The Invesco Funds
Formerly: Managing Director and Chief Compliance Officer, Legg Mason (Mutual Funds); Chief Compliance Officer, Legg Mason Private Portfolio Group (registered investment adviser) | N/A | N/A | ||||
James Bordewick, Jr. – 1959 Senior Vice President and Senior Officer | 2022 | Senior Vice President and Senior Officer, The Invesco Funds
Formerly: Chief Legal Officer, KingsCrowd, Inc. (research and analytical platform for investment in private capital markets); Chief Operating Officer and Head of Legal and Regulatory, Netcapital (private capital investment platform); Managing Director, General Counsel of asset management and Chief Compliance Officer for asset management and private banking, Bank of America Corporation; Chief Legal Officer, Columbia Funds and BofA Funds; Senior Vice President and Associate General Counsel, MFS Investment Management; Chief Legal Officer, MFS Funds; Associate, Ropes & Gray; and Associate, Gaston Snow & Ely Bartlett | N/A | N/A | ||||
The Statement of Additional Information of the Trust includes additional information about the Fund’s Trustees and is available upon request, without charge, by calling 1.800.959.4246. Please refer to the Fund’s Statement of Additional Information for information on the Fund’s sub-advisers.
| Office of the Fund | Investment Adviser | Distributor | Auditors | |||
| 11 Greenway Plaza, Suite 1000 | Invesco Advisers, Inc. | Invesco Distributors, Inc. | PricewaterhouseCoopers LLP | |||
| Houston, TX 77046-1173 | 1555 Peachtree Street, N.E. | 11 Greenway Plaza, Suite 1000 | 1000 Louisiana Street, Suite 5800 | |||
| Atlanta, GA 30309 | Houston, TX 77046-1173 | Houston, TX 77002-5021 | ||||
| Counsel to the Fund | Counsel to the Independent Trustees | Transfer Agent | Custodian | |||
| Stradley Ronon Stevens & Young, LLP | Sidley Austin LLP | Invesco Investment Services, Inc. | State Street Bank and Trust Company | |||
| 2005 Market Street, Suite 2600 | 787 Seventh Avenue | 11 Greenway Plaza, Suite 1000 | 225 Franklin Street | |||
| Philadelphia, PA 19103-7018 | New York, NY 10019 | Houston, TX 77046-1173 | Boston, MA 02110-2801 | |||
T-6 Invesco Select Risk: High Growth Investor Fund
(This page intentionally left blank)
(This page intentionally left blank)
(This page intentionally left blank)

Go paperless with eDelivery
Visit invesco.com/edelivery to enjoy the convenience and security of anytime electronic access to your investment documents.
With eDelivery, you can elect to have any or all of the following materials delivered straight to your inbox to download, save and print from your own computer:
∎ Fund reports and prospectuses
∎ Quarterly statements
∎ Daily confirmations
∎ Tax forms
Invesco mailing information
Send general correspondence to Invesco Investment Services, Inc., P.O. Box 219078, Kansas City, MO 64121-9078.
Important notice regarding delivery of security holder documents
To reduce Fund expenses, only one copy of most shareholder documents may be mailed to shareholders with multiple accounts at the same address (Householding). Mailing of your shareholder documents may be householded indefinitely unless you instruct us otherwise. If you do not want the mailing of these documents to be combined with those for other members of your household, please contact Invesco Investment Services, Inc. at 800 959 4246 or contact your financial institution. We will begin sending you individual copies for each account within 30 days after receiving your request.
Fund holdings and proxy voting information
The Fund provides a complete list of its portfolio holdings four times each year, at the end of each fiscal quarter. For the second and fourth quarters, the list appears, respectively, in the Fund’s semiannual and annual reports to shareholders. For the first and third quarters, the Fund files the list with the Securities and Exchange Commission (SEC) as an exhibit to its reports on Form N-PORT. The most recent list of portfolio holdings is available at invesco.com/completeqtrholdings. Shareholders can also look up the Fund’s Form N-PORT filings on the SEC website, sec.gov. The SEC file numbers for the Fund are shown below.
A description of the policies and procedures that the Fund uses to determine how to vote proxies relating to portfolio securities is available without charge, upon request, from our Client Services department at 800 959 4246, or at invesco.com/corporate/about-us/esg. The information is also available on the SEC website, sec.gov.
Information regarding how the Fund voted proxies related to its portfolio securities during the most recent 12-month period ended June 30 is available at invesco.com/proxysearch. This information is also available on the SEC website, sec.gov.
Invesco Advisers, Inc. is an investment adviser; it provides investment advisory services to individual and institutional clients and does not sell securities. Invesco Distributors, Inc. is the US distributor for Invesco Ltd.’s retail mutual funds, exchange-traded funds and institutional money market funds. Both are wholly owned, indirect subsidiaries of Invesco Ltd.
| SEC file number(s): 811-02699 and 002-57526 | Invesco Distributors, Inc. | O-OPSGI-AR-1 |

| Annual Report to Shareholders | December 31, 2022 | |
Invesco Select Risk: Moderate Investor Fund
Nasdaq:
A: OAMIX ∎ C: OCMIX ∎ R: ONMIX ∎ S: PXMSX ∎ Y: OYMIX ∎ R5: PXMQX ∎ R6: PXMMX
Management’s Discussion of Fund Performance
| ||||
For the fiscal year ended December 31, 2022, Class A shares of Invesco Select Risk: Moderate Investor Fund (the Fund), at net asset value (NAV), underperformed the Custom Invesco Select Risk: Moderate Investor Index. |
| |||
Your Fund’s long-term performance appears later in this report.
|
| |||
Fund vs. Indexes |
| |||
Total returns, 12/31/21 to 12/31/22, at net asset value (NAV). Performance shown does not include applicable contingent deferred sales charges (CDSC) or front-end sales charges, which would have reduced performance. |
| |||
Class A Shares | -17.73 | % | ||
Class C Shares | -18.38 | |||
Class R Shares | -17.94 | |||
Class S Shares | -17.64 | |||
Class Y Shares | -17.54 | |||
Class R5 Shares | -17.45 | |||
Class R6 Shares | -17.45 | |||
Bloomberg Global Aggregate USD Hedged Index▼ | -11.22 | |||
MSCI All Country World Index▼ | -18.36 | |||
Custom Invesco Select Risk: Moderate Investor Index∎ | -15.22 | |||
Source(s): ▼RIMES Technologies Corp.; ∎Invesco, RIMES Technologies Corp. | ||||
Market conditions and your Fund
Global equity markets declined in the first half of 2022 amid volatility sparked by Russia’s invasion of Ukraine, rising commodity prices, rampant global inflation and central banks shifting toward tighter monetary policy. Russia’s invasion exacerbated inflationary pressures, disrupting already strained supply chains, and increasing shortages of oil, gas and raw materials, with the price of oil rising sharply.
Inflation headwinds continued into the third quarter of 2022. The US Federal Reserve (the Fed), the European Central Bank and the Bank of England all raised interest rates. In contrast, the People’s Bank of China lowered its policy rate and the Bank of Japan kept rates the same. Emerging market equities, hampered by the strong US dollar, underperformed developed market equities.
Global equity markets posted gains for the fourth quarter of 2022, after better inflation data sparked a rally in October and November. However, investor sentiment worsened in December after central banks signaled continued interest rate hikes into 2023 as inflation remained above target levels. International stocks outperformed US stocks in the fourth quarter, led by results in Europe and the UK. Emerging market equities also posted gains for the fourth quarter of 2022, boosted by China, which eased its zero-COVID-19 policy and started to reopen even as COVID-19 infections surged.
Despite the rebound in the fourth quarter of 2022, at the end of the fiscal year ended December 31, 2022, trailing one-year returns for developed market equities and emerging market equities were both in negative territory.
Strategic asset class exposures in the Fund are obtained through underlying representative
mutual funds and exchange-traded funds targeting pre-defined risk levels. From an absolute performance perspective, the allocations to variable rate fixed income and value style-specific equities were slightly additive to Fund performance and leading contributors to absolute return. The remaining allocations to equity, fixed income and alternative assets were all detractors from absolute performance as the portfolio produced a negative return for the fiscal year.
From a relative performance perspective, the portfolio underperformed its custom benchmark, the Custom Invesco Select Risk: Moderate Investor Index, during the fiscal year. Underperformance was driven mainly by manager selection within the equity allocations. Within the equity allocation, the Invesco Global Fund and Invesco Discovery Mid Cap Growth Fund were the primary detractors. The Invesco 1-30 Laddered Treasury ETF and Invesco Taxable Municipal Bond ETF were noteworthy detractors from relative performance for the fiscal year as well.
Conversely, allocations to other fixed income funds and allocations to style-specific equities were the leading contributors to relative performance during the fiscal year. Within the allocations, the Invesco S&P 500 Pure Value ETF and Invesco Variable Rate Investment Grade ETF were the leading contributors to relative performance.
Please note that some of the Fund’s underlying funds use derivatives, including futures and total return swaps, which may create economic leverage in the underlying funds. Therefore, some of the performance of the strategy, both positive and negative, can be attributed to these instruments. Derivatives can be a cost-effective way to gain exposure to asset classes. However, derivatives may amplify traditional investment risks through
the creation of leverage and may be less liquid than traditional securities.
Thank you for your continued investment in the Invesco Select Risk: Moderate Investor Fund.
Portfolio manager(s):
Jeffrey Bennett
Jacob Borbidge
Duy Nguyen
The views and opinions expressed in management’s discussion of Fund performance are those of Invesco Advisers, Inc. and its affiliates. These views and opinions are subject to change at any time based on factors such as market and economic conditions. These views and opinions may not be relied upon as investment advice or recommendations, or as an offer for a particular security. The information is not a complete analysis of every aspect of any market, country, industry, security or the Fund. Statements of fact are from sources considered reliable, but Invesco Advisers, Inc. makes no representation or warranty as to their completeness or accuracy. Although historical performance is no guarantee of future results, these insights may help you understand our investment management philosophy.
See important Fund and, if applicable, index disclosures later in this report.
| 2 | Invesco Select Risk: Moderate Investor Fund |
Your Fund’s Long-Term Performance
Results of a $10,000 Investment – Oldest Share Class(es)
Fund and index data from 12/31/12
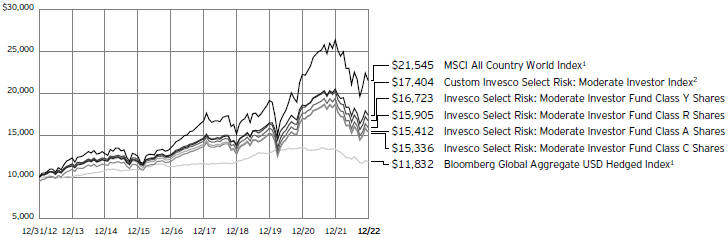
1 Source: RIMES Technologies Corp.
2 Source: Invesco, RIMES Technologies Corp.
Past performance cannot guarantee future results.
The data shown in the chart include reinvested distributions, applicable sales charges and Fund expenses including management
fees. Index results include reinvested dividends, but they do not reflect sales charges. Performance of the peer group, if applicable, reflects fund expenses and management fees;
performance of a market index does not. Performance shown in the chart does not reflect deduction of taxes a shareholder would pay on Fund distributions or sale of Fund shares.
| 3 | Invesco Select Risk: Moderate Investor Fund |
Average Annual Total Returns |
| |||
As of 12/31/22, including maximum applicable sales charges |
| |||
Class A Shares | ||||
Inception (4/5/05) | 3.27 | % | ||
10 Years | 4.42 | |||
5 Years | 1.31 | |||
1 Year | -22.28 | |||
Class C Shares | ||||
Inception (4/5/05) | 3.24 | % | ||
10 Years | 4.37 | |||
5 Years | 1.67 | |||
1 Year | -19.17 | |||
Class R Shares | ||||
Inception (4/5/05) | 3.33 | % | ||
10 Years | 4.75 | |||
5 Years | 2.20 | |||
1 Year | -17.94 | |||
Class S Shares | ||||
10 Years | 5.05 | % | ||
5 Years | 2.54 | |||
1 Year | -17.64 | |||
Class Y Shares | ||||
Inception (4/5/05) | 3.90 | % | ||
10 Years | 5.28 | |||
5 Years | 2.70 | |||
1 Year | -17.54 | |||
Class R5 Shares | ||||
10 Years | 5.14 | % | ||
5 Years | 2.72 | |||
1 Year | -17.45 | |||
Class R6 Shares | ||||
10 Years | 5.15 | % | ||
5 Years | 2.73 | |||
1 Year | -17.45 | |||
Effective May 24, 2019, Class A, Class C, Class R and Class Y shares of the Oppenheimer Portfolio Series: Moderate Investor Fund, (the predecessor fund), were reorganized into Class A, Class C, Class R and Class Y shares, respectively, of the Invesco Select Risk: Moderate Investor Fund. Returns shown above, for periods ending on or prior to May 24, 2019, for Class A, Class C, Class R and Class Y shares are those for Class A, Class C, Class R and Class Y shares of the predecessor fund. Share class returns will differ from the predecessor fund because of different expenses.
Class S shares incepted on May 15, 2020. Performance shown above is that of the Fund’s and the predecessor fund’s Class A shares at net asset value and includes the 12b-1 fees applicable to Class A shares.
Class R5 shares incepted on May 24, 2019. Performance shown on or prior to that date is that of the predecessor fund’s Class A shares at net asset value and includes the 12b-1 fees applicable to Class A shares.
Class R6 shares incepted on May 24, 2019. Performance shown on or prior to that date is that of the predecessor fund’s
Class A shares at net asset value and includes the 12b-1 fees applicable to Class A shares.
The performance data quoted represent past performance and cannot guarantee future results; current performance may be lower or higher. Please visit invesco.com/ performance for the most recent month-end performance. Performance figures reflect reinvested distributions, changes in net asset value and the effect of the maximum sales charge unless otherwise stated. Performance figures do not reflect deduction of taxes a shareholder would pay on Fund distributions or sale of Fund shares. Investment return and principal value will fluctuate so that you may have a gain or loss when you sell shares.
Class A share performance reflects the maximum 5.50% sales charge, and Class C share performance reflects the applicable contingent deferred sales charge (CDSC) for the period involved. The CDSC on Class C shares is 1% for the first year after purchase. Class R, Class S, Class Y, Class R5 and Class R6 shares do not have a front-end sales charge or a CDSC; therefore, performance is at net asset value.
The performance of the Fund’s share classes will differ primarily due to different sales charge structures and class expenses.
Fund performance reflects any applicable fee waivers and/or expense reimbursements. Had the adviser not waived fees and/or reimbursed expenses currently or in the past, returns would have been lower. See current prospectus for more information.
| 4 | Invesco Select Risk: Moderate Investor Fund |
Invesco Select Risk: Moderate Investor Fund’s investment objective is to seek total return.
| ∎ | Unless otherwise stated, information presented in this report is as of December 31, 2022, and is based on total net assets. |
| ∎ | Unless otherwise noted, all data is provided by Invesco. |
| ∎ | To access your Fund’s reports/prospectus, visit invesco.com/fundreports. |
About indexes used in this report
| ∎ | The Bloomberg Global Aggregate USD Hedged Index tracks fixed-income performance of regions around the world while hedging the currency back to the US dollar. |
| ∎ | The Custom Invesco Select Risk: Moderate Investor Index is composed of 60% MSCI All Country World Index and 40% Bloomberg Global Aggregate USD Hedged Index. |
| ∎ | The MSCI All Country World Index is an unmanaged index considered representative of large- and mid-cap stocks across developed and emerging markets. The index is computed using the net return, which withholds applicable taxes for non-resident investors. |
| ∎ | The Fund is not managed to track the performance of any particular index, including the index(es) described here, and consequently, the performance of the Fund may deviate significantly from the performance of the index(es). |
| ∎ | A direct investment cannot be made in an index. Unless otherwise indicated, index results include reinvested dividends, and they do not reflect sales charges. Performance of the peer group, if applicable, reflects fund expenses; performance of a market index does not. |
This report must be accompanied or preceded by a currently effective Fund prospectus, which contains more complete information, including sales charges and expenses. Investors should read it carefully before investing. |
| NOT FDIC INSURED | MAY LOSE VALUE | NO BANK GUARANTEE |
| 5 | Invesco Select Risk: Moderate Investor Fund |
Fund Information
Portfolio Composition*
| By fund type | % of total investments | ||||
Equity Funds | 57.14 | % | |||
Fixed Income Funds | 35.55 | ||||
Alternative Funds | 4.57 | ||||
Money Market Funds | 2.74 | ||||
| * | Based on the Schedule of Investments, which classifies each underlying fund and other investments into broad asset classes based on their predominant investments. |
The Fund’s holdings are subject to change, and there is no assurance that the Fund will continue to hold any particular security. Data presented here are as of December 31, 2022.
| 6 | Invesco Select Risk: Moderate Investor Fund |
Invesco Select Risk: Moderate Investor Fund
Schedule of Investments in Affiliated Issuers–99.85%(a)
| % of | Change in | |||||||||||||||||||||||||||||||||||
| Net | Unrealized | |||||||||||||||||||||||||||||||||||
| Assets | Value | Purchases | Proceeds | Appreciation | Realized | Dividend | Shares | Value | ||||||||||||||||||||||||||||
| 12/31/22 | 12/31/21 | at Cost | from Sales | (Depreciation) | Gain (Loss) | Income | 12/31/22 | 12/31/22 | ||||||||||||||||||||||||||||
| ||||||||||||||||||||||||||||||||||||
Alternative Funds–4.69% |
| |||||||||||||||||||||||||||||||||||
Invesco Global Real Estate Income Fund, Class R6(b) | 2.13 | % | $ | 41,350,560 | $ | 8,431,577 | $ | (2,288,930 | ) | $ | (10,140,546 | ) | $ | 86,781 | $ | 614,208 | 4,789,041 | $ | 37,067,177 | |||||||||||||||||
| ||||||||||||||||||||||||||||||||||||
Invesco Macro Allocation Strategy Fund, Class R6(c) | 2.56 | % | 72,960,020 | - | (21,013,232 | ) | (5,005,167 | ) | (2,508,779 | ) | - | 5,908,623 | 44,432,842 | |||||||||||||||||||||||
| ||||||||||||||||||||||||||||||||||||
Total Alternative Funds | 114,310,580 | 8,431,577 | (23,302,162 | ) | (15,145,713 | ) | (2,421,998 | ) | 614,208 | 81,500,019 | ||||||||||||||||||||||||||
| ||||||||||||||||||||||||||||||||||||
Domestic Equity Funds–33.49% |
| |||||||||||||||||||||||||||||||||||
Invesco Discovery Mid Cap Growth Fund, Class R6(c) | 4.50 | % | 165,651,740 | 23,771,679 | (64,424,747 | ) | (38,596,251 | ) | (8,060,165 | ) | - | 3,095,308 | 78,342,256 | |||||||||||||||||||||||
| ||||||||||||||||||||||||||||||||||||
Invesco Main Street Small Cap Fund, Class R6 | 3.73 | % | 113,973,690 | 2,084,622 | (35,513,529 | ) | (21,432,476 | ) | 5,750,211 | 396,458 | 3,625,630 | 64,862,518 | ||||||||||||||||||||||||
| ||||||||||||||||||||||||||||||||||||
Invesco Russell 1000® Dynamic Multifactor ETF | 8.34 | % | 112,605,562 | 73,249,858 | (17,661,940 | ) | (22,205,687 | ) | (1,036,351 | ) | 2,129,909 | 3,375,674 | 144,951,442 | |||||||||||||||||||||||
| ||||||||||||||||||||||||||||||||||||
Invesco S&P 500® Low Volatility ETF | 6.91 | % | 113,061,748 | 27,912,132 | (11,182,030 | ) | (10,230,455 | ) | 514,948 | 2,491,412 | 1,879,129 | 120,076,343 | ||||||||||||||||||||||||
| ||||||||||||||||||||||||||||||||||||
Invesco S&P 500® Pure Growth ETF(d) | 4.52 | % | 89,902,502 | 26,842,009 | (10,464,297 | ) | (26,904,247 | ) | (840,319 | ) | 597,254 | 518,011 | 78,535,648 | |||||||||||||||||||||||
| ||||||||||||||||||||||||||||||||||||
Invesco S&P 500® Pure Value ETF | 2.53 | % | 46,639,395 | 7,464,787 | (8,200,475 | ) | (2,493,651 | ) | 686,152 | 990,862 | 565,481 | 44,096,208 | ||||||||||||||||||||||||
| ||||||||||||||||||||||||||||||||||||
Invesco S&P SmallCap Low Volatility ETF | 1.04 | % | 85,097,662 | - | (58,539,763 | ) | (24,582,024 | ) | 16,117,438 | 752,603 | 405,180 | 18,093,313 | ||||||||||||||||||||||||
| ||||||||||||||||||||||||||||||||||||
Invesco Value Opportunities Fund, Class R6(b) | 1.92 | % | - | 37,385,980 | (1,211,605 | ) | (2,751,073 | ) | 2,608,499 | 340,275 | 2,085,596 | 33,327,823 | ||||||||||||||||||||||||
| ||||||||||||||||||||||||||||||||||||
Total Domestic Equity Funds | 726,932,299 | 198,711,067 | (207,198,386 | ) | (149,195,864 | ) | 15,740,413 | 7,698,773 | 582,285,551 | |||||||||||||||||||||||||||
| ||||||||||||||||||||||||||||||||||||
Fixed Income Funds–36.44% |
| |||||||||||||||||||||||||||||||||||
Invesco 1-30 Laddered Treasury ETF | 6.73 | % | 124,532,500 | 31,276,110 | (9,639,899 | ) | (28,324,462 | ) | (891,314 | ) | 2,234,551 | 4,070,760 | 116,952,935 | |||||||||||||||||||||||
| ||||||||||||||||||||||||||||||||||||
Invesco Core Plus Bond Fund, Class R6 | 8.01 | % | 177,694,157 | 9,109,515 | (17,441,765 | ) | (27,278,983 | ) | (2,859,094 | ) | 5,298,127 | 15,282,528 | 139,223,830 | |||||||||||||||||||||||
| ||||||||||||||||||||||||||||||||||||
Invesco Fundamental High Yield® Corporate Bond ETF | 3.03 | % | 78,056,942 | - | (16,997,357 | ) | (7,078,688 | ) | (1,361,242 | ) | 2,015,768 | 3,073,578 | 52,619,655 | |||||||||||||||||||||||
| ||||||||||||||||||||||||||||||||||||
Invesco Income Fund, Class R6 | 1.69 | % | 45,076,036 | 1,247,021 | (12,027,554 | ) | (5,222,998 | ) | 392,567 | 1,247,017 | 4,301,470 | 29,465,072 | ||||||||||||||||||||||||
| ||||||||||||||||||||||||||||||||||||
Invesco International Bond Fund, Class R6(b) | 2.35 | % | 66,866,532 | 1,665,657 | (18,656,346 | ) | (6,606,471 | ) | (916,870 | ) | 259,662 | 9,522,444 | 40,946,508 | |||||||||||||||||||||||
| ||||||||||||||||||||||||||||||||||||
Invesco Master Loan Fund, Class R6 | 3.55 | % | 71,584,760 | 4,438,457 | (10,376,070 | ) | (3,781,118 | ) | (194,450 | ) | 4,447,304 | 4,069,388 | 61,671,579 | |||||||||||||||||||||||
| ||||||||||||||||||||||||||||||||||||
Invesco Taxable Municipal Bond ETF(d) | 6.35 | % | 164,825,511 | - | (20,468,787 | ) | (30,714,156 | ) | (3,268,175 | ) | 3,923,716 | 4,293,053 | 110,374,393 | |||||||||||||||||||||||
| ||||||||||||||||||||||||||||||||||||
Invesco Variable Rate Investment Grade ETF | 4.73 | % | 67,087,850 | 42,066,779 | (25,651,679 | ) | (1,124,394 | ) | (61,738 | ) | 2,020,062 | 3,331,316 | 82,316,818 | |||||||||||||||||||||||
| ||||||||||||||||||||||||||||||||||||
Total Fixed Income Funds | 795,724,288 | 89,803,539 | (131,259,457 | ) | (110,131,270 | ) | (9,160,316 | ) | 21,446,207 | 633,570,790 | ||||||||||||||||||||||||||
| ||||||||||||||||||||||||||||||||||||
Foreign Equity Funds–25.08% |
| |||||||||||||||||||||||||||||||||||
Invesco EQV Emerging Markets All Cap Fund, Class R6(e) | 3.46 | % | 71,782,953 | 9,453,416 | (8,174,601 | ) | (10,550,258 | ) | (2,380,086 | ) | 960,515 | 1,944,113 | 60,131,424 | |||||||||||||||||||||||
| ||||||||||||||||||||||||||||||||||||
Invesco Developing Markets Fund, Class R6 | 3.11 | % | 89,028,299 | 628,855 | (14,244,925 | ) | (15,429,316 | ) | (5,913,594 | ) | 628,855 | 1,548,377 | 54,069,319 | |||||||||||||||||||||||
| ||||||||||||||||||||||||||||||||||||
Invesco Global Fund, Class R6(b) | 7.00 | % | 179,829,393 | 44,481,861 | (29,912,495 | ) | (67,983,369 | ) | 10,365,606 | - | 1,608,443 | 121,791,336 | ||||||||||||||||||||||||
| ||||||||||||||||||||||||||||||||||||
Invesco Global Infrastructure Fund, Class R6 | 0.96 | % | 23,575,413 | 349,233 | (5,412,572 | ) | (2,655,841 | ) | 790,759 | 349,233 | 1,432,615 | 16,646,992 | ||||||||||||||||||||||||
| ||||||||||||||||||||||||||||||||||||
Invesco International Select Equity Fund, Class R6 | 1.47 | % | 67,718,134 | 256,275 | (26,949,772 | ) | (4,177,977 | ) | (11,227,557 | ) | 256,276 | 2,827,716 | 25,619,103 | |||||||||||||||||||||||
| ||||||||||||||||||||||||||||||||||||
Invesco International Small-Mid Company Fund, Class R6(b) | 2.70 | % | 56,955,320 | 9,073,068 | (821,831 | ) | (18,023,311 | ) | (46,175 | ) | 200,743 | 1,203,758 | 47,006,750 | |||||||||||||||||||||||
| ||||||||||||||||||||||||||||||||||||
See accompanying Notes to Financial Statements which are an integral part of the financial statements.
| 7 | Invesco Select Risk: Moderate Investor Fund |
Invesco Select Risk: Moderate Investor Fund (continued)
Schedule of Investments in Affiliated Issuers–99.85%(a)
| % of | Change in | |||||||||||||||||||||||||||||||||||
| Net | Unrealized | |||||||||||||||||||||||||||||||||||
| Assets | Value | Purchases | Proceeds | Appreciation | Realized | Dividend | Shares | Value | ||||||||||||||||||||||||||||
| 12/31/22 | 12/31/21 | at Cost | from Sales | (Depreciation) | Gain (Loss) | Income | 12/31/22 | 12/31/22 | ||||||||||||||||||||||||||||
| ||||||||||||||||||||||||||||||||||||
Invesco RAFI™ Strategic Developed ex-US ETF | 3.69 | % | $ | 32,601,550 | $ | 43,812,191 | $ | (5,120,229 | ) | $ | (7,071,866 | ) | $ | (75,964 | ) | $ | 1,743,135 | 2,388,149 | $ | 64,145,682 | ||||||||||||||||
| ||||||||||||||||||||||||||||||||||||
Invesco S&P Emerging Markets Low Volatility ETF | 1.74 | % | 39,987,733 | - | (7,778,982 | ) | (2,638,974 | ) | 604,824 | 1,057,764 | 1,311,369 | 30,174,601 | ||||||||||||||||||||||||
| ||||||||||||||||||||||||||||||||||||
Invesco S&P International Developed Low Volatility ETF | 0.95 | % | 45,865,401 | - | (25,475,723 | ) | (6,109,708 | ) | 2,251,886 | 943,667 | 617,321 | 16,531,856 | ||||||||||||||||||||||||
| ||||||||||||||||||||||||||||||||||||
Total Foreign Equity Funds | 607,344,196 | 108,054,899 | (123,891,130 | ) | (134,640,620 | ) | (5,630,301 | ) | 6,140,188 | 436,117,063 | ||||||||||||||||||||||||||
| ||||||||||||||||||||||||||||||||||||
Money Market Funds–0.15% |
| |||||||||||||||||||||||||||||||||||
Invesco Government & Agency Portfolio, Institutional Class, 4.22%(f) | 0.05 | % | 4,291,522 | 89,579,085 | (92,989,254 | ) | - | - | 24,754 | 881,353 | 881,353 | |||||||||||||||||||||||||
| ||||||||||||||||||||||||||||||||||||
Invesco Liquid Assets Portfolio, Institutional Class, 4.42%(f) | 0.04 | % | 2,912,289 | 63,985,061 | (66,270,088 | ) | 89 | 2,505 | 23,203 | 629,668 | 629,856 | |||||||||||||||||||||||||
| ||||||||||||||||||||||||||||||||||||
Invesco Treasury Portfolio, Institutional Class, 4.20%(f) | 0.06 | % | 4,904,596 | 102,376,097 | (106,273,432 | ) | - | - | 35,079 | 1,007,261 | 1,007,261 | |||||||||||||||||||||||||
| ||||||||||||||||||||||||||||||||||||
Total Money Market Funds | 12,108,407 | 255,940,243 | (265,532,774 | ) | 89 | 2,505 | 83,036 | 2,518,470 | ||||||||||||||||||||||||||||
| ||||||||||||||||||||||||||||||||||||
TOTAL INVESTMENTS IN AFFILIATED ISSUERS (excluding investments purchased with cash collateral from securities on loan) | 99.85 | % | 2,256,419,770 | 660,941,325 | (751,183,909 | ) | (409,113,378 | ) | (1,469,697 | ) | 35,982,412 | 1,735,991,893 | ||||||||||||||||||||||||
| ||||||||||||||||||||||||||||||||||||
Investments Purchased with Cash Collateral from Securities on Loan | ||||||||||||||||||||||||||||||||||||
Money Market Funds–2.66% |
| |||||||||||||||||||||||||||||||||||
Invesco Private Government Fund, 4.28%(f)(g) | 0.74 | % | - | 190,877,854 | (177,922,388 | ) | - | - | 199,999 | (h) | 12,955,466 | 12,955,466 | ||||||||||||||||||||||||
| ||||||||||||||||||||||||||||||||||||
Invesco Private Prime Fund, 4.46%(f)(g) | 1.92 | % | - | 401,488,937 | (368,181,783 | ) | 6,665 | 238 | 552,463 | (h) | 33,304,066 | 33,314,057 | ||||||||||||||||||||||||
| ||||||||||||||||||||||||||||||||||||
Total Investments Purchased with Cash Collateral from Securities on Loan | 2.66 | % | - | 592,366,791 | (546,104,171 | ) | 6,665 | 238 | 752,462 | 46,269,523 | ||||||||||||||||||||||||||
| ||||||||||||||||||||||||||||||||||||
TOTAL INVESTMENTS IN AFFILIATED ISSUERS (Cost $1,846,867,477) | 102.51 | % | $ | 2,256,419,770 | $ | 1,253,308,116 | $ | (1,297,288,080 | ) | $ | (409,106,713 | ) | $ | (1,469,459 | )(i) | $ | 36,734,874 | $ | 1,782,261,416 | |||||||||||||||||
| ||||||||||||||||||||||||||||||||||||
OTHER ASSETS LESS LIABILITIES | (2.51 | )% | (43,679,762 | ) | ||||||||||||||||||||||||||||||||
| ||||||||||||||||||||||||||||||||||||
NET ASSETS | 100.00 | % | $ | 1,738,581,654 | ||||||||||||||||||||||||||||||||
| ||||||||||||||||||||||||||||||||||||
Investment Abbreviations:
ETF - Exchange-Traded Fund
See accompanying Notes to Financial Statements which are an integral part of the financial statements.
| 8 | Invesco Select Risk: Moderate Investor Fund |
Notes to Schedule of Investments:
| (a) | Each underlying fund and the Fund are affiliated by either having the same investment adviser or an investment adviser under common control with the Fund’s investment adviser. |
| (b) | Amounts include a return of capital distribution reclassification which reduces dividend income and increases realized gain (loss) and/or change in unrealized appreciation (depreciation). |
| (c) | Non-income producing security. |
| (d) | All or a portion of this security was out on loan at December 31, 2022. |
| (e) | Effective February 28, 2022, the underlying fund’s name changed. |
| (f) | The rate shown is the 7-day SEC standardized yield as of December 31, 2022. |
| (g) | The security has been segregated to satisfy the commitment to return the cash collateral received in securities lending transactions upon the borrower’s return of the securities loaned. See Note 1H. |
| (h) | Represents the income earned on the investment of cash collateral, which is included in securities lending income on the Statement of Operations. Does not include rebates and fees paid to lending agent or premiums received from borrowers, if any. |
| (i) | Includes capital gains distributions from affiliated underlying funds as follows: |
| Fund Name | Capital Gain | |||
| ||||
Invesco Global Fund | $ | 14,989,660 | ||
Invesco International Small-Mid Company Fund | 130,321 | |||
Invesco Value Opportunities Fund | 2,703,978 | |||
| ||||
| Open Futures Contracts(a) | ||||||||||||||||||||
| ||||||||||||||||||||
| Long Futures Contracts | Number of Contracts | Expiration Month | Notional Value | Value | Unrealized Appreciation (Depreciation) | |||||||||||||||
| ||||||||||||||||||||
Equity Risk | ||||||||||||||||||||
| ||||||||||||||||||||
E-Mini S&P 500 Index | 45 | March-2023 | $ | 8,687,250 | $ | (241,404 | ) | $ | (241,404 | ) | ||||||||||
| ||||||||||||||||||||
MSCI Emerging Markets Index | 6 | March-2023 | 287,820 | (5,007 | ) | (5,007 | ) | |||||||||||||
| ||||||||||||||||||||
Nikkei 225 Index | 1 | March-2023 | 198,720 | (12,119 | ) | (12,119 | ) | |||||||||||||
| ||||||||||||||||||||
S&P/TSX 60 Index | 1 | March-2023 | 172,806 | (5,959 | ) | (5,959 | ) | |||||||||||||
| ||||||||||||||||||||
SPI 200 Index | 1 | March-2023 | 119,013 | (2,816 | ) | (2,816 | ) | |||||||||||||
| ||||||||||||||||||||
STOXX Europe 600 Index | 23 | March-2023 | 522,074 | (15,593 | ) | (15,593 | ) | |||||||||||||
| ||||||||||||||||||||
Subtotal | (282,898 | ) | (282,898 | ) | ||||||||||||||||
| ||||||||||||||||||||
Interest Rate Risk | ||||||||||||||||||||
| ||||||||||||||||||||
Canada 10 Year Bonds | 69 | March-2023 | 6,245,162 | (149,313 | ) | (149,313 | ) | |||||||||||||
| ||||||||||||||||||||
Euro-BTP | 83 | March-2023 | 9,677,249 | (712,011 | ) | (712,011 | ) | |||||||||||||
| ||||||||||||||||||||
Euro-Bund | 49 | March-2023 | 6,972,448 | (425,910 | ) | (425,910 | ) | |||||||||||||
| ||||||||||||||||||||
Euro-OAT | 92 | March-2023 | 12,536,676 | (854,818 | ) | (854,818 | ) | |||||||||||||
| ||||||||||||||||||||
Japan 10 year Bonds | 45 | March-2023 | 49,875,800 | (953,216 | ) | (953,216 | ) | |||||||||||||
| ||||||||||||||||||||
Long Gilt | 111 | March-2023 | 13,405,927 | (831,999 | ) | (831,999 | ) | |||||||||||||
| ||||||||||||||||||||
Subtotal | (3,927,267 | ) | (3,927,267 | ) | ||||||||||||||||
| ||||||||||||||||||||
Total Futures Contracts | $ | (4,210,165 | ) | $ | (4,210,165 | ) | ||||||||||||||
| ||||||||||||||||||||
| (a) | Futures contracts collateralized by $3,404,720 cash held with Merrill Lynch International, the futures commission merchant. |
See accompanying Notes to Financial Statements which are an integral part of the financial statements.
| 9 | Invesco Select Risk: Moderate Investor Fund |
Statement of Assets and Liabilities
December 31, 2022
Assets: | ||||
Investments in affiliated underlying funds, at value (Cost $1,846,867,477)* | $ | 1,782,261,416 | ||
| ||||
Other investments: | ||||
Variation margin receivable – futures contracts | 33,528 | |||
| ||||
Deposits with brokers: | ||||
Cash collateral – exchange-traded futures contracts | 3,404,720 | |||
| ||||
Cash | 394,143 | |||
| ||||
Receivable for: | ||||
Fund shares sold | 1,457,585 | |||
| ||||
Dividends - affiliated underlying funds | 1,703,608 | |||
| ||||
Investment for trustee deferred compensation and retirement plans | 157,879 | |||
| ||||
Other assets | 67,314 | |||
| ||||
Total assets | 1,789,480,193 | |||
| ||||
Liabilities: | ||||
Payable for: | ||||
Investments purchased - affiliated underlying funds | 1,647,486 | |||
| ||||
Fund shares reacquired | 1,833,092 | |||
| ||||
Collateral upon return of securities loaned | 46,262,858 | |||
| ||||
Accrued fees to affiliates | 827,459 | |||
| ||||
Accrued trustees’ and officers’ fees and benefits | 20,391 | |||
| ||||
Accrued other operating expenses | 135,329 | |||
| ||||
Trustee deferred compensation and retirement plans | 171,924 | |||
| ||||
Total liabilities | 50,898,539 | |||
| ||||
Net assets applicable to shares outstanding | $ | 1,738,581,654 | ||
| ||||
Net assets consist of: | ||||
Shares of beneficial interest | $ | 1,820,382,515 | ||
| ||||
Distributable earnings (loss) | (81,800,861 | ) | ||
| ||||
| $ | 1,738,581,654 | |||
| ||||
Net Assets: | ||||
Class A | $ | 1,393,169,362 | ||
| ||||
Class C | $ | 162,701,223 | ||
| ||||
Class R | $ | 135,035,020 | ||
| ||||
Class S | $ | 19,993,745 | ||
| ||||
Class Y | $ | 25,612,502 | ||
| ||||
Class R5 | $ | 8,628 | ||
| ||||
Class R6 | $ | 2,061,174 | ||
| ||||
Shares outstanding, no par value, with an unlimited number of shares authorized: |
| |||
Class A | 145,382,656 | |||
| ||||
Class C | 17,429,792 | |||
| ||||
Class R | 14,217,980 | |||
| ||||
Class S | 2,085,272 | |||
| ||||
Class Y | 2,650,879 | |||
| ||||
Class R5 | 901 | |||
| ||||
Class R6 | 215,200 | |||
| ||||
Class A: | ||||
Net asset value per share | $ | 9.58 | ||
| ||||
Maximum offering price per share | $ | 10.14 | ||
| ||||
Class C: | ||||
Net asset value and offering price per share | $ | 9.33 | ||
| ||||
Class R: | ||||
Net asset value and offering price per share | $ | 9.50 | ||
| ||||
Class S: | ||||
Net asset value and offering price per share | $ | 9.59 | ||
| ||||
Class Y: | ||||
Net asset value and offering price per share | $ | 9.66 | ||
| ||||
Class R5: | ||||
Net asset value and offering price per share | $ | 9.58 | ||
| ||||
Class R6: | ||||
Net asset value and offering price per share | $ | 9.58 | ||
| ||||
| * | At December 31, 2022, securities with an aggregate value of $44,883,389 were on loan to brokers. |
See accompanying Notes to Financial Statements which are an integral part of the financial statements.
| 10 | Invesco Select Risk: Moderate Investor Fund |
Statement of Operations
For the year ended December 31, 2022
Investment income: | ||||
Dividends from affiliated underlying funds (includes net securities lending income of $ 297,503) | $ | 36,279,915 | ||
| ||||
Interest | 390,412 | |||
| ||||
Total investment income | 36,670,327 | |||
| ||||
Expenses: | ||||
Distribution fees: | ||||
Class A | 3,626,537 | |||
| ||||
Class C | 1,836,326 | |||
| ||||
Class R | 689,705 | |||
| ||||
Class S | 32,371 | |||
| ||||
Transfer agent fees – A, C, R, S and Y | 2,035,375 | |||
| ||||
Transfer agent fees – R5 | 3 | |||
| ||||
Transfer agent fees – R6 | 668 | |||
| ||||
Trustees’ and officers’ fees and benefits | 32,965 | |||
| ||||
Registration and filing fees | 156,120 | |||
| ||||
Reports to shareholders | 122,011 | |||
| ||||
Professional services fees | 39,306 | |||
| ||||
Other | (138 | ) | ||
| ||||
Total expenses | 8,571,249 | |||
| ||||
Less: Expense offset arrangement(s) | (22,230 | ) | ||
| ||||
Net expenses | 8,549,019 | |||
| ||||
Net investment income | 28,121,308 | |||
| ||||
Realized and unrealized gain (loss) from: | ||||
Net realized gain (loss) from: | ||||
Affiliated underlying fund shares | (19,293,418 | ) | ||
| ||||
Foreign currencies | (31 | ) | ||
| ||||
Futures contracts | (11,148,255 | ) | ||
| ||||
Capital gain distributions from affiliated underlying fund shares | 17,823,959 | |||
| ||||
| (12,617,745 | ) | |||
| ||||
Change in net unrealized appreciation (depreciation) of: | ||||
Affiliated underlying fund shares | (409,106,713 | ) | ||
| ||||
Foreign currencies | 125,376 | |||
| ||||
Futures contracts | (3,921,353 | ) | ||
| ||||
| (412,902,690 | ) | |||
| ||||
Net realized and unrealized gain (loss) | (425,520,435 | ) | ||
| ||||
Net increase (decrease) in net assets resulting from operations | $ | (397,399,127 | ) | |
| ||||
See accompanying Notes to Financial Statements which are an integral part of the financial statements.
| 11 | Invesco Select Risk: Moderate Investor Fund |
Statement of Changes in Net Assets
For the years ended December 31, 2022 and 2021
| 2022 | 2021 | |||||||
| ||||||||
Operations: | ||||||||
Net investment income | $ | 28,121,308 | $ | 21,069,450 | ||||
| ||||||||
Net realized gain (loss) | (12,617,745 | ) | 179,261,801 | |||||
| ||||||||
Change in net unrealized appreciation (depreciation) | (412,902,690 | ) | 23,347,867 | |||||
| ||||||||
Net increase (decrease) in net assets resulting from operations | (397,399,127 | ) | 223,679,118 | |||||
| ||||||||
Distributions to shareholders from distributable earnings: | ||||||||
Class A | (58,494,777 | ) | (136,177,573 | ) | ||||
| ||||||||
Class C | (5,695,232 | ) | (16,475,705 | ) | ||||
| ||||||||
Class R | (5,290,625 | ) | (11,831,434 | ) | ||||
| ||||||||
Class S | (859,346 | ) | (1,988,500 | ) | ||||
| ||||||||
Class Y | (1,158,407 | ) | (2,599,430 | ) | ||||
| ||||||||
Class R5 | (408 | ) | (940 | ) | ||||
| ||||||||
Class R6 | (93,149 | ) | (218,480 | ) | ||||
| ||||||||
Total distributions from distributable earnings | (71,591,944 | ) | (169,292,062 | ) | ||||
| ||||||||
Share transactions–net: | ||||||||
Class A | (33,245,176 | ) | (94,480,858 | ) | ||||
| ||||||||
Class C | (23,833,583 | ) | (22,648,712 | ) | ||||
| ||||||||
Class R | 8,181,682 | 4,777,137 | ||||||
| ||||||||
Class S | (661,448 | ) | (913,586 | ) | ||||
| ||||||||
Class Y | (978,788 | ) | 3,774,344 | |||||
| ||||||||
Class R6 | (190,185 | ) | 608,688 | |||||
| ||||||||
Net increase (decrease) in net assets resulting from share transactions | (50,727,498 | ) | (108,882,987 | ) | ||||
| ||||||||
Net increase (decrease) in net assets | (519,718,569 | ) | (54,495,931 | ) | ||||
| ||||||||
Net assets: | ||||||||
Beginning of year | 2,258,300,223 | 2,312,796,154 | ||||||
| ||||||||
End of year | $ | 1,738,581,654 | $ | 2,258,300,223 | ||||
| ||||||||
See accompanying Notes to Financial Statements which are an integral part of the financial statements.
| 12 | Invesco Select Risk: Moderate Investor Fund |
The following schedule presents financial highlights for a share of the Fund outstanding throughout the periods indicated.
Net asset value, beginning of period | Net investment income(a) | Net gains (losses) on securities (both realized and unrealized) | Total from investment operations | Dividends from net investment income | Distributions from net realized gains | Total distributions | Net asset value, end of period | Total return(b) | Net assets, end of period (000’s omitted) | Ratio of expenses to average net assets with fee waivers and/or expenses absorbed(c) | Ratio of expenses to average net assets without fee waivers and/or expenses absorbed(d) | Ratio of net investment income to average net assets | Portfolio turnover (e) | |||||||||||||||||||||||||||||||||||||||||||
Class A | ||||||||||||||||||||||||||||||||||||||||||||||||||||||||
Year ended 12/31/22 | $12.15 | $0.17 | $(2.32 | ) | $(2.15 | ) | $(0.16 | ) | $(0.26 | ) | $(0.42 | ) | $ 9.58 | (17.73 | )%(f) | $1,393,169 | 0.37 | %(f) | 0.37 | %(f) | 1.58 | %(f) | 22 | % | ||||||||||||||||||||||||||||||||
Year ended 12/31/21 | 11.95 | 0.13 | 1.06 | 1.19 | (0.26 | ) | (0.73 | ) | (0.99 | ) | 12.15 | 10.11 | (f) | 1,801,506 | 0.35 | (f) | 0.38 | (f) | 1.01 | (f) | 32 | |||||||||||||||||||||||||||||||||||
Year ended 12/31/20 | 11.96 | 0.16 | 1.14 | 1.30 | (0.18 | ) | (1.13 | ) | (1.31 | ) | 11.95 | 11.67 | (f) | 1,851,149 | 0.31 | (f) | 0.38 | (f) | 1.42 | (f) | 88 | |||||||||||||||||||||||||||||||||||
Eleven months ended 12/31/19 | 11.72 | 0.22 | 1.32 | 1.54 | (0.36 | ) | (0.94 | ) | (1.30 | ) | 11.96 | 13.13 | 1,156,291 | 0.40 | (g) | 0.47 | (g) | 1.95 | (g) | 16 | ||||||||||||||||||||||||||||||||||||
Year ended 01/31/19 | 12.66 | 0.20 | (0.80 | ) | (0.60 | ) | (0.21 | ) | (0.13 | ) | (0.34 | ) | 11.72 | (4.59 | ) | 1,037,833 | 0.41 | 0.48 | 1.61 | 40 | ||||||||||||||||||||||||||||||||||||
Year ended 01/31/18 | 11.06 | 0.14 | 1.69 | 1.83 | (0.23 | ) | – | (0.23 | ) | 12.66 | 16.59 | 1,169,055 | 0.41 | 0.49 | 1.20 | 6 | ||||||||||||||||||||||||||||||||||||||||
Class C | ||||||||||||||||||||||||||||||||||||||||||||||||||||||||
Year ended 12/31/22 | 11.84 | 0.08 | (2.25 | ) | (2.17 | ) | (0.08 | ) | (0.26 | ) | (0.34 | ) | 9.33 | (18.38 | ) | 162,701 | 1.13 | 1.13 | 0.82 | 22 | ||||||||||||||||||||||||||||||||||||
Year ended 12/31/21 | 11.66 | 0.03 | 1.04 | 1.07 | (0.16 | ) | (0.73 | ) | (0.89 | ) | 11.84 | 9.33 | 233,536 | 1.11 | 1.14 | 0.25 | 32 | |||||||||||||||||||||||||||||||||||||||
Year ended 12/31/20 | 11.72 | 0.07 | 1.09 | 1.16 | (0.09 | ) | (1.13 | ) | (1.22 | ) | 11.66 | 10.70 | 250,605 | 1.08 | 1.15 | 0.65 | 88 | |||||||||||||||||||||||||||||||||||||||
Eleven months ended 12/31/19 | 11.49 | 0.13 | 1.29 | 1.42 | (0.25 | ) | (0.94 | ) | (1.19 | ) | 11.72 | 12.44 | 273,048 | 1.16 | (g) | 1.23 | (g) | 1.19 | (g) | 16 | ||||||||||||||||||||||||||||||||||||
Year ended 01/31/19 | 12.41 | 0.10 | (0.78 | ) | (0.68 | ) | (0.11 | ) | (0.13 | ) | (0.24 | ) | 11.49 | (5.33 | ) | 358,746 | 1.17 | 1.24 | 0.86 | 40 | ||||||||||||||||||||||||||||||||||||
Year ended 01/31/18 | 10.85 | 0.05 | 1.65 | 1.70 | (0.14 | ) | – | (0.14 | ) | 12.41 | 15.69 | 409,418 | 1.16 | 1.25 | 0.43 | 6 | ||||||||||||||||||||||||||||||||||||||||
Class R | ||||||||||||||||||||||||||||||||||||||||||||||||||||||||
Year ended 12/31/22 | 12.05 | 0.14 | (2.30 | ) | (2.16 | ) | (0.13 | ) | (0.26 | ) | (0.39 | ) | 9.50 | (17.94 | ) | 135,035 | 0.63 | 0.63 | 1.32 | 22 | ||||||||||||||||||||||||||||||||||||
Year ended 12/31/21 | 11.85 | 0.09 | 1.07 | 1.16 | (0.23 | ) | (0.73 | ) | (0.96 | ) | 12.05 | 9.92 | 161,076 | 0.61 | 0.64 | 0.75 | 32 | |||||||||||||||||||||||||||||||||||||||
Year ended 12/31/20 | 11.88 | 0.13 | 1.12 | 1.25 | (0.15 | ) | (1.13 | ) | (1.28 | ) | 11.85 | 11.32 | 153,448 | 0.58 | 0.65 | 1.15 | 88 | |||||||||||||||||||||||||||||||||||||||
Eleven months ended 12/31/19 | 11.65 | 0.19 | 1.30 | 1.49 | (0.32 | ) | (0.94 | ) | (1.26 | ) | 11.88 | 12.84 | 131,445 | 0.66 | (g) | 0.73 | (g) | 1.69 | (g) | 16 | ||||||||||||||||||||||||||||||||||||
Year ended 01/31/19 | 12.59 | 0.16 | (0.79 | ) | (0.63 | ) | (0.18 | ) | (0.13 | ) | (0.31 | ) | 11.65 | (4.86 | ) | 116,637 | 0.66 | 0.73 | 1.36 | 40 | ||||||||||||||||||||||||||||||||||||
Year ended 01/31/18 | 11.00 | 0.11 | 1.68 | 1.79 | (0.20 | ) | – | (0.20 | ) | 12.59 | 16.33 | 123,884 | 0.66 | 0.74 | 0.96 | 6 | ||||||||||||||||||||||||||||||||||||||||
Class S | ||||||||||||||||||||||||||||||||||||||||||||||||||||||||
Year ended 12/31/22 | 12.16 | 0.18 | (2.32 | ) | (2.14 | ) | (0.17 | ) | (0.26 | ) | (0.43 | ) | 9.59 | (17.64 | ) | 19,994 | 0.28 | 0.28 | 1.67 | 22 | ||||||||||||||||||||||||||||||||||||
Year ended 12/31/21 | 11.96 | 0.14 | 1.07 | 1.21 | (0.28 | ) | (0.73 | ) | (1.01 | ) | 12.16 | 10.22 | 26,025 | 0.26 | 0.29 | 1.10 | 32 | |||||||||||||||||||||||||||||||||||||||
Period ended 12/31/20(h) | 10.46 | 0.11 | 2.38 | 2.49 | (0.19 | ) | (0.80 | ) | (0.99 | ) | 11.96 | 23.86 | 26,339 | 0.23 | (g) | 0.30 | (g) | 1.50 | (g) | 88 | ||||||||||||||||||||||||||||||||||||
Class Y | ||||||||||||||||||||||||||||||||||||||||||||||||||||||||
Year ended 12/31/22 | 12.25 | 0.19 | (2.34 | ) | (2.15 | ) | (0.18 | ) | (0.26 | ) | (0.44 | ) | 9.66 | (17.54 | ) | 25,613 | 0.13 | 0.13 | 1.82 | 22 | ||||||||||||||||||||||||||||||||||||
Year ended 12/31/21 | 12.04 | 0.16 | 1.08 | 1.24 | (0.30 | ) | (0.73 | ) | (1.03 | ) | 12.25 | 10.40 | 33,378 | 0.11 | 0.14 | 1.25 | 32 | |||||||||||||||||||||||||||||||||||||||
Year ended 12/31/20 | 12.03 | 0.19 | 1.15 | 1.34 | (0.20 | ) | (1.13 | ) | (1.33 | ) | 12.04 | 11.97 | 29,097 | 0.08 | 0.15 | 1.65 | 88 | |||||||||||||||||||||||||||||||||||||||
Eleven months ended 12/31/19 | 11.78 | 0.25 | 1.32 | 1.57 | (0.38 | ) | (0.94 | ) | (1.32 | ) | 12.03 | 13.39 | 18,433 | 0.16 | (g) | 0.23 | (g) | 2.19 | (g) | 16 | ||||||||||||||||||||||||||||||||||||
Year ended 01/31/19 | 12.73 | 0.23 | (0.82 | ) | (0.59 | ) | (0.23 | ) | (0.13 | ) | (0.36 | ) | 11.78 | (4.41 | ) | 15,732 | 0.17 | 0.24 | 1.85 | 40 | ||||||||||||||||||||||||||||||||||||
Year ended 01/31/18 | 11.12 | 0.20 | 1.67 | 1.87 | (0.26 | ) | – | (0.26 | ) | 12.73 | 16.91 | 17,618 | 0.17 | 0.25 | 1.63 | 6 | ||||||||||||||||||||||||||||||||||||||||
Class R5 | ||||||||||||||||||||||||||||||||||||||||||||||||||||||||
Year ended 12/31/22 | 12.15 | 0.20 | (2.32 | ) | (2.12 | ) | (0.19 | ) | (0.26 | ) | (0.45 | ) | 9.58 | (17.45 | ) | 9 | 0.05 | 0.05 | 1.90 | 22 | ||||||||||||||||||||||||||||||||||||
Year ended 12/31/21 | 11.95 | 0.17 | 1.07 | 1.24 | (0.31 | ) | (0.73 | ) | (1.04 | ) | 12.15 | 10.53 | 11 | 0.00 | 0.03 | 1.36 | 32 | |||||||||||||||||||||||||||||||||||||||
Year ended 12/31/20 | 11.95 | 0.20 | 1.14 | 1.34 | (0.21 | ) | (1.13 | ) | (1.34 | ) | 11.95 | 12.04 | 11 | 0.00 | 0.07 | 1.73 | 88 | |||||||||||||||||||||||||||||||||||||||
Period ended 12/31/19(i) | 12.03 | 0.17 | 1.08 | 1.25 | (0.39 | ) | (0.94 | ) | (1.33 | ) | 11.95 | 10.45 | 10 | 0.09 | (g) | 0.16 | (g) | 2.26 | (g) | 16 | ||||||||||||||||||||||||||||||||||||
Class R6 | ||||||||||||||||||||||||||||||||||||||||||||||||||||||||
Year ended 12/31/22 | 12.15 | 0.20 | (2.32 | ) | (2.12 | ) | (0.19 | ) | (0.26 | ) | (0.45 | ) | 9.58 | (17.45 | ) | 2,061 | 0.05 | 0.05 | 1.90 | 22 | ||||||||||||||||||||||||||||||||||||
Year ended 12/31/21 | 11.95 | 0.17 | 1.07 | 1.24 | (0.31 | ) | (0.73 | ) | (1.04 | ) | 12.15 | 10.53 | 2,767 | 0.00 | 0.03 | 1.36 | 32 | |||||||||||||||||||||||||||||||||||||||
Year ended 12/31/20 | 11.95 | 0.20 | 1.14 | 1.34 | (0.21 | ) | (1.13 | ) | (1.34 | ) | 11.95 | 12.04 | 2,147 | (0.01 | ) | 0.06 | 1.74 | 88 | ||||||||||||||||||||||||||||||||||||||
Period ended 12/31/19(i) | 12.03 | 0.18 | 1.08 | 1.26 | (0.40 | ) | (0.94 | ) | (1.34 | ) | 11.95 | 10.49 | 10 | 0.04 | (g) | 0.11 | (g) | 2.31 | (g) | 16 | ||||||||||||||||||||||||||||||||||||
| (a) | Calculated using average shares outstanding. |
| (b) | Includes adjustments in accordance with accounting principles generally accepted in the United States of America and as such, the net asset value for financial reporting purposes and the returns based upon those net asset values may differ from the net asset value and returns for shareholder transactions. Does not include sales charges and is not annualized for periods less than one year, if applicable. |
| (c) | In addition to the fees and expenses which the Fund bears directly, the Fund indirectly bears a pro rata share of the fees and expenses of the underlying funds in which the Fund invests. Because the underlying funds have varied expenses and fee levels and the Fund may own different proportions at different times, the amount of fees and expenses incurred indirectly by the Fund will vary. Estimated underlying fund expenses are not expenses that are incurred directly by the Fund. They are expenses that are incurred directly by the underlying funds and are deducted from the value of the funds the Fund invests in. The effect of the estimated underlying fund expenses that the Fund bears indirectly is included in the Fund’s total return. Estimated acquired fund fees from underlying funds were 0.48%, 0.52% and 0.58% for the years ended December 31, 2022, 2021 and 2020, respectively. |
| (d) | Does not include indirect expenses from affiliated fund fees and expenses of 0.56%, 0.57% and 0.58% for the eleven months ended December 31, 2019, and for the years ended January 31, 2019 and 2018, respectively. |
| (e) | Portfolio turnover is calculated at the fund level and is not annualized for periods less than one year, if applicable. For the year ended December 31, 2020, the portfolio turnover calculation excludes the value of securities purchased of $597,759,006 in connection with the acquisition of Invesco Moderate Allocation Fund into the Fund. |
| (f) | The total return, ratio of expenses to average net assets and ratio of net investment income (loss) to average net assets reflect actual 12b-1 fees of 0.24%, 0.24% and 0.23% for the years ended December 31, 2022, 2021 and 2020, respectively. |
| (g) | Annualized. |
| (h) | Commencement date of May 15, 2020. |
| (i) | Commencement date after the close of business on May 24, 2019. |
See accompanying Notes to Financial Statements which are an integral part of the financial statements.
| 13 | Invesco Select Risk: Moderate Investor Fund |
December 31, 2022
NOTE 1–Significant Accounting Policies
Invesco Select Risk: Moderate Investor Fund (the “Fund”) is a series portfolio of AIM Growth Series (Invesco Growth Series) (the “Trust”). The Trust is a Delaware statutory trust registered under the Investment Company Act of 1940, as amended (the “1940 Act”), as an open-end series management investment company authorized to issue an unlimited number of shares of beneficial interest. Information presented in these financial statements pertains only to the Fund. Matters affecting the Fund or each class will be voted on exclusively by the shareholders of the Fund or each class.
The Fund’s investment objective is to seek total return.
The Fund is a “fund of funds”, in that it invests in other mutual funds (“underlying funds”) advised by Invesco Advisers, Inc. (the “Adviser” or “Invesco”) and exchange-traded funds advised by Invesco Capital Management LLC (“Invesco Capital”). Invesco and Invesco Capital are affiliates of each other as they are indirect, wholly-owned subsidiaries of Invesco Ltd. Invesco may change the Fund’s asset class allocations, the underlying funds or the target weightings in the underlying funds without shareholder approval. The underlying funds may engage in a number of investment techniques and practices, which involve certain risks. Each underlying fund’s accounting policies are outlined in the underlying fund’s financial statements and are publicly available.
The Fund currently consists of seven different classes of shares: Class A, Class C, Class R, Class S, Class Y, Class R5 and Class R6. Class Y shares are available only to certain investors. Class A shares are sold with a front-end sales charge unless certain waiver criteria are met. Under certain circumstances, load waived shares may be subject to contingent deferred sales charges (“CDSC”). Class C shares are sold with a CDSC. Class R, Class S, Class Y, Class R5 and Class R6 shares are sold at net asset value. Class C shares held for eight years after purchase are eligible for automatic conversion into Class A shares of the same Fund (the “Conversion Feature”). The automatic conversion pursuant to the Conversion Feature will generally occur at the end of the month following the eighth anniversary after a purchase of Class C shares.
The Fund is an investment company and accordingly follows the investment company accounting and reporting guidance in accordance with Financial Accounting Standards Board Accounting Standards Codification Topic 946, Financial Services – Investment Companies.
The following is a summary of the significant accounting policies followed by the Fund in the preparation of its financial statements.
| A. | Security Valuations – Securities of investment companies listed or traded on an exchange are generally valued at the trade price or official closing price that day as of the close of the exchange where the security is principally traded, or lacking any trades or official closing price on a particular day, the security may be valued at the closing bid price on that day. Securities of investment companies that are not exchange-traded (e.g., open-end mutual funds) are valued using such company’s end-of-business-day net asset value per share. Securities in the underlying funds, including restricted securities, are valued in accordance with the valuation policy of such fund. The policies of the underlying funds affiliated with the Fund, as a result of having the same investment adviser, are set forth below. |
A security listed or traded on an exchange is generally valued at its trade price or official closing price that day as of the close of the exchange where the security is principally traded, or lacking any trades or official closing price on a particular day, the security may be valued at the closing bid price on that day. Securities traded in the over-the-counter market are valued based on prices furnished by independent pricing services or market makers. When such securities are valued using prices provided by an independent pricing service they may be considered fair valued. Futures contracts are valued at the daily settlement price set by an exchange on which they are principally traded. U.S. exchange-traded options are valued at the mean between the last bid and asked prices from the exchange on which they are principally traded. Non-U.S. exchange-traded options are valued at the final settlement price set by the exchange on which they trade. Options not listed on an exchange and swaps generally are valued using pricing provided from independent pricing services.
Variable rate senior loan interests are fair valued using quotes provided by an independent pricing service. Quotes provided by the pricing service may reflect appropriate factors such as ratings, tranche type, industry, company performance, spread, individual trading characteristics, institution-size trading in similar groups of securities and other market data.
Securities of investment companies that are not exchange-traded (e.g., open-end mutual funds) are valued using such company’s end-of-business-day net asset value per share.
Deposits, other obligations of U.S. and non-U.S. banks and financial institutions are valued at their daily account value.
Fixed income securities (including convertible debt securities) generally are valued on the basis of prices provided by independent pricing services. Prices provided by the pricing service may be determined without exclusive reliance on quoted prices, and may reflect appropriate factors such as institution-size trading in similar groups of securities, developments related to specific securities, dividend rate (for unlisted equities), yield (for debt obligations), quality, type of issue, coupon rate (for debt obligations), maturity (for debt obligations), individual trading characteristics and other market data. Pricing services generally value debt obligations assuming orderly transactions of institutional round lot size, but a fund may hold or transact in the same securities in smaller, odd lot sizes. Odd lots often trade at lower prices than institutional round lots, and their value may be adjusted accordingly. Debt obligations are subject to interest rate and credit risks. In addition, all debt obligations involve some risk of default with respect to interest and/or principal payments.
Foreign securities’ (including foreign exchange contracts) prices are converted into U.S. dollar amounts using the applicable exchange rates as of the close of the New York Stock Exchange (“NYSE”). If market quotations are available and reliable for foreign exchange-traded equity securities, the securities will be valued at the market quotations. The Adviser may use various pricing services to obtain market quotations as well as fair value prices. Because trading hours for certain foreign securities end before the close of the NYSE, closing market quotations may become not representative of market value in the Adviser’s judgment (“unreliable”). If, between the time trading ends on a particular security and the close of the customary trading session on the NYSE, a significant event occurs that makes the closing price of the security unreliable, the Adviser may fair value the security. If the event is likely to have affected the closing price of the security, the security will be valued at fair value in good faith in accordance with Board- approved policies and related Adviser procedures (“Valuation Procedures”). Adjustments to closing prices to reflect fair value may also be based on a screening process of an independent pricing service to indicate the degree of certainty, based on historical data, that the closing price in the principal market where a foreign security trades is not the current value as of the close of the NYSE. Foreign securities’ prices meeting the degree of certainty that the price is not reflective of current value will be priced at the indication of fair value from the independent pricing service. Multiple factors may be considered by the independent pricing service in determining adjustments to reflect fair value and may include information relating to sector indices, American Depositary Receipts and domestic and foreign index futures. Foreign securities may have additional risks including exchange rate changes, potential for sharply devalued currencies and high inflation, political and economic upheaval, the relative lack of issuer information, relatively low market liquidity and the potential lack of strict financial and accounting controls and standards.
Unlisted securities will be valued using prices provided by independent pricing services or by another method that the Adviser, in its judgment, believes better reflects the security’s fair value in accordance with the Valuation Procedures.
Securities for which market prices are not provided by any of the above methods may be valued based upon quotes furnished by independent sources. The last bid price may be used to value equity securities. The mean between the last bid and asked prices may be used to value debt obligations, including corporate loans.
Securities for which market quotations are not readily available are fair valued by the Adviser in accordance with the Valuation Procedures. If a fair value price provided by a pricing service is unreliable, the Adviser will fair value the security using the Valuation Procedures. Issuer specific events, market trends, bid/asked quotes of brokers and information providers and other market data may be reviewed in the course of making a good faith determination of a security’s fair value.
| 14 | Invesco Select Risk: Moderate Investor Fund |
The Fund may invest in securities that are subject to interest rate risk, meaning the risk that the prices will generally fall as interest rates rise and, conversely, the prices will generally rise as interest rates fall. Specific securities differ in their sensitivity to changes in interest rates depending on their individual characteristics. Changes in interest rates may result in increased market volatility, which may affect the value and/or liquidity of certain Fund investments.
Valuations change in response to many factors including the historical and prospective earnings of the issuer, the value of the issuer’s assets, general market conditions which are not specifically related to the particular issuer, such as real or perceived adverse economic conditions, changes in the general outlook for revenues or corporate earnings, changes in interest or currency rates, regional or global instability, natural or environmental disasters, widespread disease or other public health issues, war, acts of terrorism, significant governmental actions or adverse investor sentiment generally and market liquidity. Because of the inherent uncertainties of valuation, the values reflected in the financial statements may materially differ from the value received upon actual sale of those investments.
The price the Fund could receive upon the sale of any investment may differ from the Adviser’s valuation of the investment, particularly for securities that are valued using a fair valuation technique. When fair valuation techniques are applied, the Adviser uses available information, including both observable and unobservable inputs and assumptions, to determine a methodology that will result in a valuation that the Adviser believes approximates market value. Fund securities that are fair valued may be subject to greater fluctuation in their value from one day to the next than would be the case if market quotations were used. Because of the inherent uncertainties of valuation, and the degree of subjectivity in such decisions, the Fund could realize a greater or lesser than expected gain or loss upon the sale of the investment.
| B. | Securities Transactions and Investment Income – Securities transactions are accounted for on a trade date basis. Realized gains or losses on sales are computed on the basis of specific identification of the securities sold. Distributions from ordinary income from underlying funds, if any, are recorded as dividend income on the ex-dividend date. Distributions from gains from underlying funds, if any, are recorded as realized gains on the ex-dividend date. The following policies are followed by the underlying funds: Interest income (net of withholding tax, if any) is recorded on an accrual basis from settlement date and includes coupon interest and amortization of premium and accretion of discount on debt securities as applicable. Pay-in-kind interest income and non-cash dividend income received in the form of securities in-lieu of cash are recorded at the fair value of the securities received. Paydown gains and losses on mortgage and asset-backed securities are recorded as adjustments to interest income. |
The Fund may periodically participate in litigation related to the Fund’s investments. As such, the Fund may receive proceeds from litigation settlements. Any proceeds received are included in the Statement of Operations as realized gain (loss) for investments no longer held and as unrealized gain (loss) for investments still held.
The Fund allocates income and realized and unrealized capital gains and losses to a class based on the relative net assets of each class.
| C. | Distributions – Distributions from net investment income and net realized capital gain, if any, are generally declared and paid annually and recorded on the ex-dividend date. The Fund may elect to treat a portion of the proceeds from redemptions as distributions for federal income tax purposes. |
| D. | Federal Income Taxes – The Fund intends to comply with the requirements of Subchapter M of the Internal Revenue Code of 1986, as amended (the “Internal Revenue Code”), necessary to qualify as a regulated investment company and to distribute substantially all of the Fund’s taxable earnings to shareholders. As such, the Fund will not be subject to federal income taxes on otherwise taxable income (including net realized capital gain) that is distributed to shareholders. Therefore, no provision for federal income taxes is recorded in the financial statements. |
The Fund recognizes the tax benefits of uncertain tax positions only when the position is more likely than not to be sustained. Management has analyzed the Fund’s uncertain tax positions and concluded that no liability for unrecognized tax benefits should be recorded related to uncertain tax positions. Management is not aware of any tax positions for which it is reasonably possible that the total amounts of unrecognized tax benefits will change materially in the next 12 months.
The Fund files tax returns in the U.S. Federal jurisdiction and certain other jurisdictions. Generally, the Fund is subject to examinations by such taxing authorities for up to three years after the filing of the return for the tax period.
| E. | Expenses – Expenses included in the accompanying financial statements reflect the expenses of the Fund and do not include any expenses of the underlying funds. The effects of the underlying funds expenses are included in the realized and unrealized gain/loss on the investments in the underlying funds. Estimated expenses of the underlying funds are discussed further within the Financial Highlights. |
Fees provided for under the Rule 12b-1 plan of a particular class of the Fund and which are directly attributable to that class are charged to the operations of such class. Transfer agency fees and expenses and other shareholder recordkeeping fees and expenses attributable to Class R5 and Class R6 are allocated based on relative net assets of Class R5 and Class R6. Transfer agency fees and expenses and other shareholder recordkeeping fees and expenses relating to all other classes are allocated among those classes based on relative net assets. All other expenses are allocated among the classes based on relative net assets.
| F. | Accounting Estimates – The preparation of financial statements in conformity with accounting principles generally accepted in the United States of America (“GAAP”) requires management to make estimates and assumptions that affect the reported amounts of assets and liabilities at the date of the financial statements and the reported amounts of revenues and expenses during the reporting period including estimates and assumptions related to taxation. Actual results could differ from those estimates by a significant amount. In addition, the Fund monitors for material events or transactions that may occur or become known after the period-end date and before the date the financial statements are released to print. |
| G. | Indemnifications – Under the Trust’s organizational documents, each Trustee, officer, employee or other agent of the Trust is indemnified against certain liabilities that may arise out of the performance of their duties to the Fund. Additionally, in the normal course of business, the Fund enters into contracts, including the Fund’s servicing agreements, that contain a variety of indemnification clauses. The Fund’s maximum exposure under these arrangements is unknown as this would involve future claims that may be made against the Fund that have not yet occurred. The risk of material loss as a result of such indemnification claims is considered remote. |
| H. | Securities Lending – The Fund may lend portfolio securities having a market value up to one-third of the Fund’s total assets. Such loans are secured by collateral equal to no less than the market value of the loaned securities determined daily by the securities lending provider. Such collateral will be cash or debt securities issued or guaranteed by the U.S. Government or any of its sponsored agencies. Cash collateral received in connection with these loans is invested in short-term money market instruments or affiliated, unregistered investment companies that comply with Rule 2a-7 under the 1940 Act and money market funds (collectively, “affiliated money market funds”) and is shown as such on the Schedule of Investments. The Fund bears the risk of loss with respect to the investment of collateral. It is the Fund’s policy to obtain additional collateral from or return excess collateral to the borrower by the end of the next business day, following the valuation date of the securities loaned. Therefore, the value of the collateral held may be temporarily less than the value of the securities on loan. When loaning securities, the Fund retains certain benefits of owning the securities, including the economic equivalent of dividends or interest generated by the security. Lending securities entails a risk of loss to the Fund if, and to the extent that, the market value of the securities loaned were to increase and the borrower did not increase the collateral accordingly, and the borrower failed to return the securities. The securities loaned are subject to termination at the option of the borrower or the Fund. Upon termination, the borrower will return to the Fund the securities loaned and the Fund will return the collateral. Upon the failure of the borrower to return the securities, collateral may be liquidated and the securities may be purchased on the open market to replace the loaned securities. The Fund could experience delays and costs in gaining access to the collateral and the securities may lose value during the delay which could result in potential losses to the Fund. Some of these losses may be indemnified by the lending agent. The Fund bears the risk of any deficiency in the amount of the collateral available for return to the borrower due to any loss on the collateral invested. Dividends received on cash collateral investments for securities lending transactions, which are |
| 15 | Invesco Select Risk: Moderate Investor Fund |
net of compensation to counterparties, are included in Dividends from affiliated underlying funds on the Statement of Operations. The aggregate value of securities out on loan, if any, is shown as a footnote on the Statement of Assets and Liabilities.
The Adviser serves as an affiliated securities lending agent for the Fund. The Bank of New York Mellon also serves as a lending agent. To the extent the Fund utilizes the Adviser as an affiliated securities lending agent, the Fund conducts its securities lending in accordance with, and in reliance upon, no-action letters issued by the SEC staff that provide guidance on how an affiliate may act as a direct agent lender and receive compensation for those services in a manner consistent with the federal securities laws. For the year ended December 31, 2022, the Fund paid the Adviser $21,142 in fees for securities lending agent services. Fees paid to the Adviser for securities lending agent services, if any, are included in Dividends from affiliated underlying funds on the Statement of Operations.
| I. | Foreign Currency Translations – Foreign currency is valued at the close of the NYSE based on quotations posted by banks and major currency dealers. Portfolio securities and other assets and liabilities denominated in foreign currencies are translated into U.S. dollar amounts at the date of valuation. Purchases and sales of portfolio securities (net of foreign taxes withheld on disposition) and income items denominated in foreign currencies are translated into U.S. dollar amounts on the respective dates of such transactions. The Fund does not separately account for the portion of the results of operations resulting from changes in foreign exchange rates on investments and the fluctuations arising from changes in market prices of securities held. The combined results of changes in foreign exchange rates and the fluctuation of market prices on investments (net of estimated foreign tax withholding) are included with the net realized and unrealized gain or loss from investments in the Statement of Operations. Reported net realized foreign currency gains or losses arise from (1) sales of foreign currencies, (2) currency gains or losses realized between the trade and settlement dates on securities transactions, and (3) the difference between the amounts of dividends, interest, and foreign withholding taxes recorded on the Fund’s books and the U.S. dollar equivalent of the amounts actually received or paid. Net unrealized foreign currency gains and losses arise from changes in the fair values of assets and liabilities, other than investments in securities at fiscal period end, resulting from changes in exchange rates. |
The Fund may invest in foreign securities, which may be subject to foreign taxes on income, gains on investments or currency repatriation, a portion of which may be recoverable. Foreign taxes, if any, are recorded based on the tax regulations and rates that exist in the foreign markets in which the Fund invests and are shown in the Statement of Operations.
| J. | Forward Foreign Currency Contracts – The Fund may engage in foreign currency transactions either on a spot (i.e. for prompt delivery and settlement) basis, or through forward foreign currency contracts, to manage or minimize currency or exchange rate risk. |
The Fund may also enter into forward foreign currency contracts for the purchase or sale of a security denominated in a foreign currency in order to “lock in” the U.S. dollar price of that security, or the Fund may also enter into forward foreign currency contracts that do not provide for physical exchange of the two currencies on the settlement date, but instead are settled by a single cash payment calculated as the difference between the agreed upon exchange rate and the spot rate at settlement based upon an agreed upon notional amount (non-deliverable forwards).
A forward foreign currency contract is an obligation between two parties (“Counterparties”) to purchase or sell a specific currency for an agreed-upon price at a future date. The use of forward foreign currency contracts for hedging does not eliminate fluctuations in the price of the underlying securities the Fund owns or intends to acquire but establishes a rate of exchange in advance. Fluctuations in the value of these contracts are measured by the difference in the contract date and reporting date exchange rates and are recorded as unrealized appreciation (depreciation) until the contracts are closed. When the contracts are closed, realized gains (losses) are recorded. Realized and unrealized gains (losses) on the contracts are included in the Statement of Operations. The primary risks associated with forward foreign currency contracts include failure of the Counterparty to meet the terms of the contract and the value of the foreign currency changing unfavorably. These risks may be in excess of the amounts reflected in the Statement of Assets and Liabilities.
| K. | Futures Contracts – The Fund may enter into futures contracts to manage exposure to interest rate, equity and market price movements and/or currency risks. A futures contract is an agreement between two parties (“Counterparties”) to purchase or sell a specified underlying security, currency or commodity (or delivery of a cash settlement price, in the case of an index future) for a fixed price at a future date. The Fund currently invests only in exchange-traded futures and they are standardized as to maturity date and underlying financial instrument. Initial margin deposits required upon entering into futures contracts are satisfied by the segregation of specific securities or cash as collateral at the futures commission merchant (broker). During the period the futures contracts are open, changes in the value of the contracts are recognized as unrealized gains or losses by recalculating the value of the contracts on a daily basis. Subsequent or variation margin payments are received or made depending upon whether unrealized gains or losses are incurred. These amounts are reflected as receivables or payables on the Statement of Assets and Liabilities. When the contracts are closed or expire, the Fund recognizes a realized gain or loss equal to the difference between the proceeds from, or cost of, the closing transaction and the Fund’s basis in the contract. The net realized gain (loss) and the change in unrealized gain (loss) on futures contracts held during the period is included on the Statement of Operations. The primary risks associated with futures contracts are market risk and the absence of a liquid secondary market. If the Fund were unable to liquidate a futures contract and/or enter into an offsetting closing transaction, the Fund would continue to be subject to market risk with respect to the value of the contracts and continue to be required to maintain the margin deposits on the futures contracts. Futures contracts have minimal Counterparty risk since the exchange’s clearinghouse, as Counterparty to all exchange-traded futures, guarantees the futures against default. Risks may exceed amounts recognized in the Statement of Assets and Liabilities. |
| L. | Leverage Risk – Leverage exists when the Fund can lose more than it originally invests because it purchases or sells an instrument or enters into a transaction without investing an amount equal to the full economic exposure of the instrument or transaction. |
| M. | Collateral – To the extent the Fund has designated or segregated a security as collateral and that security is subsequently sold, it is the Fund’s practice to replace such collateral no later than the next business day. |
| N. | Other Risks – Investments in ETFs generally present the same primary risks as an investment in a conventional mutual fund that has the same investment objective, strategy and policies. Investments in ETFs further involve the same risks associated with a direct investment in the types of securities, commodities and/or currencies included in the indices the ETFs are designed to replicate. In addition, shares of an ETF may trade at a market price that is higher or lower than their net asset value and an active trading market in such shares may not develop or continue. Moreover, trading of an ETF’s shares may be halted if the listing exchange’s officials deem such action to be appropriate, the shares are de-listed from the exchange, or the activation of market-wide “circuit breakers” (which are tied to large decreases in stock prices) halts stock trading generally. |
| O. | COVID-19 Risk – The COVID-19 strain of coronavirus has resulted in instances of market closures and dislocations, extreme volatility, liquidity constraints and increased trading costs. Efforts to contain its spread have resulted in travel restrictions, disruptions of healthcare systems, business operations (including business closures) and supply chains, layoffs, lower consumer demand and employee availability, and defaults and credit downgrades, among other significant economic impacts that have disrupted global economic activity across many industries. Such economic impacts may exacerbate other pre-existing political, social and economic risks locally or globally and cause general concern and uncertainty. The full economic impact and ongoing effects of COVID-19 (or other future epidemics or pandemics) at the macro-level and on individual businesses are unpredictable and may result in significant and prolonged effects on the Fund’s performance. |
NOTE 2–Advisory Fees and Other Fees Paid to Affiliates
The Trust has entered into a master investment advisory agreement with the Adviser. Under the terms of the investment advisory agreement, the Fund does not pay an advisory fee. However, the Fund pays advisory fees to the Adviser indirectly as a shareholder of the underlying funds.
| 16 | Invesco Select Risk: Moderate Investor Fund |
Under the terms of a master sub-advisory agreement between the Adviser and each of Invesco Asset Management Deutschland GmbH, Invesco Asset Management Limited, Invesco Asset Management (Japan) Limited, Invesco Hong Kong Limited, Invesco Senior Secured Management, Inc. and Invesco Canada Ltd. and separate sub-advisory agreements with Invesco Capital Management LLC and Invesco Asset Management (India) Private Limited (collectively, the “Affiliated Sub-Advisers”) the Adviser, not the Fund, will pay 40% of the fees paid to the Adviser to any such Affiliated Sub-Adviser(s) that provide(s) discretionary investment management services to the Fund based on the percentage of assets allocated to such Affiliated Sub-Adviser(s). Invesco has also entered into a sub-advisory agreement with OppenheimerFunds, Inc. to provide discretionary management services to the Fund.
Effective May 1, 2022 through at least April 30, 2024, the Adviser has contractually agreed to reimburse expenses of all shares to the extent necessary to limit total annual fund operating expenses after expense reimbursement (excluding certain items discussed below) of Class A, Class C, Class R, Class S, Class Y, Class R5 and Class R6 shares to 0.47%, 1.22%, 0.72%, 0.37%, 0.22%, 0.22% and 0.22%, respectively, of the Fund’s average daily net assets (the “expense limits”). Prior to May 1, 2022, the Adviser had contractually agreed to reimburse expenses of all shares to the extent necessary to limit total annual fund operating expenses after expense reimbursement (excluding certain items discussed below) of Class A, Class C, Class R, Class S, Class Y, Class R5 and Class R6 shares to 0.47%, 1.23%, 0.72%, 0.37%, 0.22%, 0.17% and 0.12%, respectively, of the Fund’s average daily net assets. In determining the Adviser’s obligation to reimburse expenses, the following expenses are not taken into account, and could cause total annual fund operating expenses after expense reimbursement to exceed the numbers reflected above: (1) interest; (2) taxes; (3) dividend expenses on short sales; (4) extraordinary or non-routine items, including litigation expenses; and (5) expenses that the Fund has incurred but did not actually pay because of an expense offset arrangement. Unless Invesco continues the expense reimbursement agreement, it will terminate on April 30, 2024. During its term, the expense reimbursement agreement cannot be terminated or amended to increase the expense limits or reduce the expense reimbursement without approval of the Board of Trustees. The Adviser did not reimburse expenses during the period under these expense limits.
The Trust has entered into a master administrative services agreement with Invesco pursuant to which the Fund has agreed to pay Invesco for certain administrative costs incurred in providing accounting services to the Fund. For the year ended December 31, 2022, expenses incurred under the agreement are shown in the Statement of Operations as Administrative services fees. Invesco has entered into a sub-administration agreement whereby State Street Bank and Trust Company (“SSB”) serves as fund accountant and provides certain administrative services to the Fund. Pursuant to a custody agreement with the Trust on behalf of the Fund, SSB also serves as the Fund’s custodian.
The Trust has entered into a transfer agency and service agreement with Invesco Investment Services, Inc. (“IIS”) pursuant to which the Fund has agreed to pay IIS a fee for providing transfer agency and shareholder services to the Fund and reimburse IIS for certain expenses incurred by IIS in the course of providing such services. IIS may make payments to intermediaries that provide omnibus account services, sub-accounting services and/or networking services. All fees payable by IIS to intermediaries that provide omnibus account services or sub-accounting services are charged back to the Fund, subject to certain limitations approved by the Trust’s Board of Trustees. For the year ended December 31, 2022, expenses incurred under the agreement are shown in the Statement of Operations as Transfer agent fees.
The Trust has entered into master distribution agreements with Invesco Distributors, Inc. (“IDI”) to serve as the distributor for the Class A, Class C, Class R, Class S, Class Y, Class R5 and Class R6 shares of the Fund. The Trust has adopted plans pursuant to Rule 12b-1 under the 1940 Act with respect to the Fund’s Class A, Class C, Class R and Class S shares (collectively, the “Plans”). The Fund, pursuant to the Class A Plan, reimburses IDI for its allocated share of expenses incurred for the period, up to a maximum annual rate of 0.25% of the average daily net assets of Class A shares. The Fund pursuant to the Class C, Class R and Class S Plan, pays IDI compensation at the annual rate of 1.00% of the average daily net assets of Class C shares, 0.50% of the average daily net assets of Class R shares and 0.15% of the average daily net assets of Class S shares. The fees are accrued daily and paid monthly. Of the Plan payments, up to 0.25% of the average daily net assets of Class A, Class C and Class R shares and 0.15% of the average daily net assets of Class S shares may be paid to furnish continuing personal shareholder services to customers who purchase and own shares of such classes. Any amounts not paid as a service fee under the Plans would constitute an asset-based sales charge. Rules of the Financial Industry Regulatory Authority (“FINRA”) impose a cap on the total sales charges, including asset-based sales charges, that may be paid by any class of shares of the Fund. For the year ended December 31, 2022, expenses incurred under the Plans are shown in the Statement of Operations as Distribution fees.
Front-end sales commissions and CDSC (collectively, the “sales charges”) are not recorded as expenses of the Fund. Front-end sales commissions are deducted from proceeds from the sales of Fund shares prior to investment in Class A shares of the Fund. CDSC are deducted from redemption proceeds prior to remittance to the shareholder. During the year ended December 31, 2022, IDI advised the Fund that IDI retained $229,904 in front-end sales commissions from the sale of Class A shares and $37,250 and $4,101 from Class A and Class C shares, respectively, for CDSC imposed upon redemptions by shareholders.
The underlying Invesco Funds pay no distribution fees for Class R6 shares and the Funds pay no sales loads or other similar compensation to IDI for acquiring underlying fund shares.
Certain officers and trustees of the Trust are officers and directors of the Adviser, IIS and/or IDI.
NOTE 3–Additional Valuation Information
GAAP defines fair value as the price that would be received to sell an asset or paid to transfer a liability in an orderly transaction between market participants at the measurement date, under current market conditions. GAAP establishes a hierarchy that prioritizes the inputs to valuation methods, giving the highest priority to readily available unadjusted quoted prices in an active market for identical assets (Level 1) and the lowest priority to significant unobservable inputs (Level 3), generally when market prices are not readily available. Based on the valuation inputs, the securities or other investments are tiered into one of three levels. Changes in valuation methods may result in transfers in or out of an investment’s assigned level:
| Level 1 - | Prices are determined using quoted prices in an active market for identical assets. | |
| Level 2 - | Prices are determined using other significant observable inputs. Observable inputs are inputs that other market participants may use in pricing a security. These may include quoted prices for similar securities, interest rates, prepayment speeds, credit risk, yield curves, loss severities, default rates, discount rates, volatilities and others. | |
| Level 3 - | Prices are determined using significant unobservable inputs. In situations where quoted prices or observable inputs are unavailable (for example, when there is little or no market activity for an investment at the end of the period), unobservable inputs may be used. Unobservable inputs reflect the Adviser’s assumptions about the factors market participants would use in determining fair value of the securities or instruments and would be based on the best available information. |
The following is a summary of the tiered valuation input levels, as of December 31, 2022. The level assigned to the securities valuations may not be an indication of the risk or liquidity associated with investing in those securities. Because of the inherent uncertainties of valuation, the values reflected in the financial statements may materially differ from the value received upon actual sale of those investments.
| Level 1 | Level 2 | Level 3 | Total | |||||||||||||
| ||||||||||||||||
Investments in Securities | ||||||||||||||||
| ||||||||||||||||
Affiliated Issuers | $ | 1,733,473,423 | $ | – | $– | $ | 1,733,473,423 | |||||||||
| ||||||||||||||||
Money Market Funds | 2,518,470 | 46,269,523 | – | 48,787,993 | ||||||||||||
| ||||||||||||||||
Total Investments in Securities | 1,735,991,893 | 46,269,523 | – | 1,782,261,416 | ||||||||||||
| ||||||||||||||||
| 17 | Invesco Select Risk: Moderate Investor Fund |
| Level 1 | Level 2 | Level 3 | Total | |||||||||||||
| ||||||||||||||||
Other Investments - Liabilities* | ||||||||||||||||
| ||||||||||||||||
Futures Contracts | $ | (4,210,165 | ) | $ | – | $– | $ | (4,210,165 | ) | |||||||
| ||||||||||||||||
Total Investments | $ | 1,731,781,728 | $ | 46,269,523 | $– | $ | 1,778,051,251 | |||||||||
| ||||||||||||||||
| * | Unrealized appreciation (depreciation). |
NOTE 4–Derivative Investments
The Fund may enter into an International Swaps and Derivatives Association Master Agreement (“ISDA Master Agreement”) under which a fund may trade OTC derivatives. An OTC transaction entered into under an ISDA Master Agreement typically involves a collateral posting arrangement, payment netting provisions and close-out netting provisions. These netting provisions allow for reduction of credit risk through netting of contractual obligations. The enforceability of the netting provisions of the ISDA Master Agreement depends on the governing law of the ISDA Master Agreement, among other factors.
For financial reporting purposes, the Fund does not offset OTC derivative assets or liabilities that are subject to ISDA Master Agreements in the Statement of Assets and Liabilities.
Value of Derivative Investments at Period-End
The table below summarizes the value of the Fund’s derivative investments, detailed by primary risk exposure, held as of December 31, 2022:
| Value | ||||||||||||
|
| |||||||||||
| Derivative Liabilities | Equity Risk | Interest Rate Risk | Total | |||||||||
| ||||||||||||
Unrealized depreciation on futures contracts – Exchange-Traded(a) | $ | (282,898 | ) | $ | (3,927,267 | ) | $ | (4,210,165 | ) | |||
| ||||||||||||
Derivatives not subject to master netting agreements | 282,898 | 3,927,267 | 4,210,165 | |||||||||
| ||||||||||||
Total Derivative Liabilities subject to master netting agreements | $ | – | $ | – | $ | – | ||||||
| ||||||||||||
(a) The daily variation margin receivable (payable) at period-end is recorded in the Statement of Assets and Liabilities.
Effect of Derivative Investments for the year ended December 31, 2022
The table below summarizes the gains (losses) on derivative investments, detailed by primary risk exposure, recognized in earnings during the period:
Location of Gain (Loss) on Statement of Operations | ||||||||||||
|
| |||||||||||
Equity Risk | Interest Rate Risk | Total | ||||||||||
| ||||||||||||
Realized Gain (Loss): | ||||||||||||
Futures contracts | $ | (1,766,736 | ) | $ | (9,381,519 | ) | $ | (11,148,255 | ) | |||
| ||||||||||||
Change in Net Unrealized Appreciation (Depreciation): | ||||||||||||
Futures contracts | (539,373 | ) | (3,381,980 | ) | (3,921,353 | ) | ||||||
| ||||||||||||
Total | $ | (2,306,109 | ) | $ | (12,763,499 | ) | $ | (15,069,608 | ) | |||
| ||||||||||||
| Futures Contracts | ||||||||||||
| ||||||||||||
Average notional value | $ | 116,601,172 | ||||||||||
| ||||||||||||
NOTE 5–Expense Offset Arrangement(s)
The expense offset arrangement is comprised of transfer agency credits which result from balances in demand deposit accounts used by the transfer agent for clearing shareholder transactions. For the year ended December 31, 2022, the Fund received credits from this arrangement, which resulted in the reduction of the Fund’s total expenses of $22,230.
NOTE 6–Trustees’ and Officers’ Fees and Benefits
Trustees’ and Officers’ Fees and Benefits include amounts accrued by the Fund to pay remuneration to certain Trustees and Officers of the Fund. Trustees have the option to defer compensation payable by the Fund, and Trustees’ and Officers’ Fees and Benefits also include amounts accrued by the Fund to fund such deferred compensation amounts. Those Trustees who defer compensation have the option to select various Invesco Funds in which their deferral accounts shall be deemed to be invested. Finally, certain current Trustees were eligible to participate in a retirement plan that provided for benefits to be paid upon retirement to Trustees over a period of time based on the number of years of service. The Fund may have certain former Trustees who also participate in a retirement plan and receive benefits under such plan. Trustees’ and Officers’ Fees and Benefits include amounts accrued by the Fund to fund such retirement benefits. Obligations under the deferred compensation and retirement plans represent unsecured claims against the general assets of the Fund.
NOTE 7–Cash Balances
The Fund is permitted to temporarily carry a negative or overdrawn balance in its account with SSB, the custodian bank. Such balances, if any at period-end, are shown in the Statement of Assets and Liabilities under the payable caption Amount due custodian. To compensate the custodian bank for such overdrafts, the overdrawn Fund may either (1) leave funds as a compensating balance in the account so the custodian bank can be compensated by earning the additional interest; or (2) compensate by paying the custodian bank at a rate agreed upon by the custodian bank and Invesco, not to exceed the contractually agreed upon rate. The Fund may not purchase additional securities when any borrowings from banks or broker-dealers exceed 5% of the Fund’s total assets, or when any borrowings from an Invesco Fund are outstanding.
| 18 | Invesco Select Risk: Moderate Investor Fund |
NOTE 8–Distributions to Shareholders and Tax Components of Net Assets
Tax Character of Distributions to Shareholders Paid During the Fiscal Years Ended December 31, 2022 and 2021:
| 2022 | 2021 | |||||||||||
| ||||||||||||
Ordinary income* | $ | 27,025,156 | $ | 131,795,360 | ||||||||
| ||||||||||||
Long-term capital gain | 44,566,788 | 37,496,702 | ||||||||||
| ||||||||||||
Total distributions | $ | 71,591,944 | $ | 169,292,062 | ||||||||
| ||||||||||||
| * | Includes short-term capital gain distributions, if any. |
Tax Components of Net Assets at Period-End:
| 2022 | ||||
| ||||
Undistributed ordinary income | $ | 3,853,021 | ||
| ||||
Net unrealized appreciation (depreciation) – investments | (75,144,504 | ) | ||
| ||||
Net unrealized appreciation – foreign currencies | 76,837 | |||
| ||||
Temporary book/tax differences | (156,323 | ) | ||
| ||||
Capital loss carryforward | (10,429,892 | ) | ||
| ||||
Shares of beneficial interest | 1,820,382,515 | |||
| ||||
Total net assets | $ | 1,738,581,654 | ||
| ||||
The difference between book-basis and tax-basis unrealized appreciation (depreciation) is due to differences in the timing of recognition of gains and losses on investments for tax and book purposes. The Fund’s net unrealized appreciation (depreciation) difference is attributable primarily to wash sales, derivative instruments and partnerships.
The temporary book/tax differences are a result of timing differences between book and tax recognition of income and/or expenses. The Fund’s temporary book/tax differences are the result of the trustee deferral of compensation and retirement plan benefits.
Capital loss carryforward is calculated and reported as of a specific date. Results of transactions and other activity after that date may affect the amount of capital loss carryforward actually available for the Fund to utilize. The ability to utilize capital loss carryforward in the future may be limited under the Internal Revenue Code and related regulations based on the results of future transactions.
The Fund has a capital loss carryforward as of December 31, 2022, as follows:
Capital Loss Carryforward* | ||||||||||
| Expiration | Short-Term | Long-Term | Total | |||||||
| ||||||||||
Not subject to expiration | $ | 10,429,892 | $– | $ | 10,429,892 | |||||
| ||||||||||
NOTE 9–Investment Transactions
The aggregate amount of investment securities (other than short-term securities, U.S. Government obligations and money market funds, if any) purchased and sold by the Fund during the year ended December 31, 2022 was $405,001,083 and $485,651,138, respectively. Cost of investments, including any derivatives, on a tax basis includes the adjustments for financial reporting purposes as of the most recently completed federal income tax reporting period-end.
Unrealized Appreciation (Depreciation) of Investments on a Tax Basis | ||||
Aggregate unrealized appreciation of investments | $ 95,391,232 | |||
| ||||
Aggregate unrealized (depreciation) of investments | (170,535,736 | ) | ||
| ||||
Net unrealized appreciation (depreciation) of investments | $ (75,144,504 | ) | ||
| ||||
Cost of investments for tax purposes is $1,853,195,755.
NOTE 10–Reclassification of Permanent Differences
Primarily as a result of differing book/tax treatment of equalization, foreign currency transactions, distributions and partnerships, on December 31, 2022, undistributed net investment income was decreased by $629,441, undistributed net realized gain (loss) was decreased by $13,388,559 and shares of beneficial interest was increased by $14,018,000. This reclassification had no effect on the net assets of the Fund.
NOTE 11–Share Information
| Summary of Share Activity | ||||||||||||||||
| ||||||||||||||||
| Year ended | Year ended | |||||||||||||||
| December 31, 2022(a) | December 31, 2021 | |||||||||||||||
| Shares | Amount | Shares | Amount | |||||||||||||
| ||||||||||||||||
Sold: | ||||||||||||||||
Class A | 14,338,320 | $ | 150,222,629 | 15,093,559 | $ | 190,917,093 | ||||||||||
| ||||||||||||||||
Class C | 2,744,369 | 27,692,460 | 2,887,900 | 35,544,182 | ||||||||||||
| ||||||||||||||||
Class R | 2,457,707 | 25,351,396 | 2,305,611 | 28,896,248 | ||||||||||||
| ||||||||||||||||
Class S | 39,119 | 410,243 | 60,610 | 764,835 | ||||||||||||
| ||||||||||||||||
Class Y | 850,293 | 8,835,459 | 1,001,438 | 12,750,740 | ||||||||||||
| ||||||||||||||||
Class R6 | 12,901 | 133,952 | 89,751 | 1,138,355 | ||||||||||||
| ||||||||||||||||
| 19 | Invesco Select Risk: Moderate Investor Fund |
| Summary of Share Activity | ||||||||||||||||
| ||||||||||||||||
| Year ended | Year ended | |||||||||||||||
| December 31, 2022(a) | December 31, 2021 | |||||||||||||||
| Shares | Amount | Shares | Amount | |||||||||||||
| ||||||||||||||||
Issued as reinvestment of dividends: | ||||||||||||||||
Class A | 5,872,144 | $ | 56,726,114 | 11,037,840 | $ | 132,122,928 | ||||||||||
| ||||||||||||||||
Class C | 601,320 | 5,658,501 | 1,403,294 | 16,376,440 | ||||||||||||
| ||||||||||||||||
Class R | 551,404 | 5,282,453 | 994,955 | 11,810,122 | ||||||||||||
| ||||||||||||||||
Class S | 88,826 | 858,948 | 165,907 | 1,987,564 | ||||||||||||
| ||||||||||||||||
Class Y | 103,039 | 1,003,601 | 192,790 | 2,326,981 | ||||||||||||
| ||||||||||||||||
Class R6 | 9,589 | 92,627 | 18,175 | 217,551 | ||||||||||||
| ||||||||||||||||
Automatic conversion of Class C shares to Class A shares: | ||||||||||||||||
Class A | 2,019,476 | 21,054,232 | 2,113,154 | 26,639,254 | ||||||||||||
| ||||||||||||||||
Class C | (2,078,985 | ) | (21,054,232 | ) | (2,171,681 | ) | (26,639,254 | ) | ||||||||
| ||||||||||||||||
Reacquired: | ||||||||||||||||
Class A | (25,067,732 | ) | (261,248,151 | ) | (34,931,431 | ) | (444,160,133 | ) | ||||||||
| ||||||||||||||||
Class C | (3,555,243 | ) | (36,130,312 | ) | (3,888,057 | ) | (47,930,080 | ) | ||||||||
| ||||||||||||||||
Class R | (2,159,937 | ) | (22,452,167 | ) | (2,877,307 | ) | (35,929,233 | ) | ||||||||
| ||||||||||||||||
Class S | (182,712 | ) | (1,930,639 | ) | (289,355 | ) | (3,665,985 | ) | ||||||||
| ||||||||||||||||
Class Y | (1,026,712 | ) | (10,817,848 | ) | (886,805 | ) | (11,303,377 | ) | ||||||||
| ||||||||||||||||
Class R6 | (35,023 | ) | (416,764 | ) | (59,833 | ) | (747,218 | ) | ||||||||
| ||||||||||||||||
Net increase (decrease) in share activity | (4,417,837 | ) | $ | (50,727,498 | ) | (7,739,485 | ) | $ | (108,882,987 | ) | ||||||
| ||||||||||||||||
| (a) | There is an entity that is a record owner of more than 5% of the outstanding shares of the Fund and owns 10% of the outstanding shares of the Fund. IDI has an agreement with this entity to sell Fund shares. The Fund, Invesco and/or Invesco affiliates may make payments to this entity, which is considered to be related to the Fund, for providing services to the Fund, Invesco and/or Invesco affiliates including but not limited to services such as, securities brokerage, distribution, third party record keeping and account servicing. The Fund has no knowledge as to whether all or any portion of the shares owned of record by this entity are also owned beneficially. |
| 20 | Invesco Select Risk: Moderate Investor Fund |
Report of Independent Registered Public Accounting Firm
To the Board of Trustees of AIM Growth Series (Invesco Growth Series) and Shareholders of Invesco Select Risk: Moderate Investor Fund
Opinion on the Financial Statements
We have audited the accompanying statement of assets and liabilities, including the schedule of investments, of Invesco Select Risk: Moderate Investor Fund (one of the funds constituting AIM Growth Series (Invesco Growth Series), referred to hereafter as the “Fund”) as of December 31, 2022, the related statement of operations for the year ended December 31, 2022, the statement of changes in net assets for each of the two years in the period ended December 31, 2022, including the related notes, and the financial highlights for each of the periods indicated in the table below (collectively referred to as the “financial statements”). In our opinion, the financial statements present fairly, in all material respects, the financial position of the Fund as of December 31, 2022, the results of its operations for the year then ended, the changes in its net assets for each of the two years in the period ended December 31, 2022 and the financial highlights for each of the periods indicated in the table below, in conformity with accounting principles generally accepted in the United States of America.
Financial Highlights |
For each of the three years in the period ended December 31, 2022 and the eleven months ended December 31, 2019 for Class A, Class C, Class R and Class Y. |
| For each of the three years in the period ended December 31, 2022 and the period May 24, 2019 (commencement of operations) through December 31, 2019 for Class R5 and Class R6. |
For each of the two years in the period ended December 31, 2022 and the period May 15, 2020 (commencement of operations) through December 31, 2020 for Class S. |
The financial statements of Oppenheimer Portfolio Series: Moderate Investor Fund (subsequently renamed Invesco Select Risk: Moderate Investor Fund) as of and for the year ended January 31, 2019 and the financial highlights for each of the periods ended on or prior to January 31, 2019 (not presented herein, other than the financial highlights) were audited by other auditors whose report dated March 25, 2019 expressed an unqualified opinion on those financial statements and financial highlights.
Basis for Opinion
These financial statements are the responsibility of the Fund’s management. Our responsibility is to express an opinion on the Fund’s financial statements based on our audits. We are a public accounting firm registered with the Public Company Accounting Oversight Board (United States) (PCAOB) and are required to be independent with respect to the Fund in accordance with the U.S. federal securities laws and the applicable rules and regulations of the Securities and Exchange Commission and the PCAOB.
We conducted our audits of these financial statements in accordance with the standards of the PCAOB. Those standards require that we plan and perform the audit to obtain reasonable assurance about whether the financial statements are free of material misstatement, whether due to error or fraud.
Our audits included performing procedures to assess the risks of material misstatement of the financial statements, whether due to error or fraud, and performing procedures that respond to those risks. Such procedures included examining, on a test basis, evidence regarding the amounts and disclosures in the financial statements. Our audits also included evaluating the accounting principles used and significant estimates made by management, as well as evaluating the overall presentation of the financial statements. Our procedures included confirmation of securities owned as of December 31, 2022 by correspondence with the custodian, transfer agent and brokers; when replies were not received from brokers, we performed other auditing procedures. We believe that our audits provide a reasonable basis for our opinion.
/s/PricewaterhouseCoopers LLP
Houston, Texas
February 22, 2023
We have served as the auditor of one or more of the investment companies in the Invesco group of investment companies since at least 1995. We have not been able to determine the specific year we began serving as auditor.
| 21 | Invesco Select Risk: Moderate Investor Fund |
Calculating your ongoing Fund expenses
Example
As a shareholder of the Fund, you incur two types of costs: (1) transaction costs, which may include sales charges (loads) on purchase payments or contingent deferred sales charges on redemptions, if any; and (2) ongoing costs, including management fees, distribution and/or service (12b-1) fees, and other Fund expenses. This example is intended to help you understand your ongoing costs (in dollars) of investing in the Fund and to compare these costs with ongoing costs of investing in other mutual funds. The example is based on an investment of $1,000 invested at the beginning of the period and held for the entire period July 1, 2022 through December 31, 2022.
In addition to the fees and expenses which the Fund bears directly, the Fund indirectly bears a pro-rata share of the fees and expenses of the underlying funds in which the Fund invests. The amount of fees and expenses incurred indirectly by the Fund will vary because the underlying funds have varied expenses and fee levels and the Fund may own different proportions of the underlying funds at different times. Estimated underlying fund expenses are not expenses that are incurred directly by the Fund. They are expenses that are incurred directly by the underlying funds and are deducted from the value of the underlying funds the Fund invests in. The effect of the estimated underlying fund expenses that the Fund bears indirectly are included in the Fund’s total return.
Actual expenses
The table below provides information about actual account values and actual expenses. You may use the information in this table, together with the amount you invested, to estimate the expenses that you paid over the period. Simply divide your account value by $1,000 (for example, an $8,600 account value divided by $1,000 = 8.6), then multiply the result by the number in the table under the heading entitled “Actual Expenses Paid During Period” to estimate the expenses you paid on your account during this period.
Hypothetical example for comparison purposes
The table below also provides information about hypothetical account values and hypothetical expenses based on the Fund’s actual expense ratio and an assumed rate of return of 5% per year before expenses, which is not the Fund’s actual return.
The hypothetical account values and expenses may not be used to estimate the actual ending account balance or expenses you paid for the period. You may use this information to compare the ongoing costs of investing in the Fund and other funds. To do so, compare this 5% hypothetical example with the 5% hypothetical examples that appear in the shareholder reports of the other funds.
Please note that the expenses shown in the table are meant to highlight your ongoing costs only and do not reflect any transaction costs, such as sales charges (loads) on purchase payments or contingent deferred sales charges on redemptions, if any. Therefore, the hypothetical information is useful in comparing ongoing costs only, and will not help you determine the relative total costs of owning different funds. In addition, expenses shown in the table do not include the expenses of the underlying funds, which are borne indirectly by the Fund. If transaction costs and indirect expenses were included, your costs would have been higher.
| ACTUAL | HYPOTHETICAL (5% annual return before expenses) | |||||||||||
| Beginning Account Value (07/01/22) | Ending Account Value (12/31/22)1 | Expenses Paid During Period2 | Ending Account Value (12/31/22) | Expenses Paid During Period2 | Annualized Ratio | |||||||
Class A | $1,000.00 | $1,008.60 | $1.92 | $1,023.29 | $1.94 | 0.38% | ||||||
Class C | 1,000.00 | 1,004.50 | 5.76 | 1,019.46 | 5.80 | 1.14 | ||||||
Class R | 1,000.00 | 1,007.90 | 3.24 | 1,021.98 | 3.26 | 0.64 | ||||||
Class S | 1,000.00 | 1,009.60 | 1.47 | 1,023.74 | 1.48 | 0.29 | ||||||
Class Y | 1,000.00 | 1,009.10 | 0.71 | 1,024.50 | 0.71 | 0.14 | ||||||
Class R5 | 1,000.00 | 1,010.00 | 0.30 | 1,024.90 | 0.31 | 0.06 | ||||||
Class R6 | 1,000.00 | 1,010.00 | 0.30 | 1,024.90 | 0.31 | 0.06 | ||||||
| 1 | The actual ending account value is based on the actual total return of the Fund for the period July 1, 2022 through December 31, 2022, after actual expenses and will differ from the hypothetical ending account value which is based on the Fund’s expense ratio and a hypothetical annual return of 5% before expenses. |
| 2 | Expenses are equal to the Fund’s annualized expense ratio as indicated above multiplied by the average account value over the period, multiplied by 184/365 to reflect the most recent fiscal half year. |
| 22 | Invesco Select Risk: Moderate Investor Fund |
Form 1099-DIV, Form 1042-S and other year–end tax information provide shareholders with actual calendar year amounts that should be included in their tax returns. Shareholders should consult their tax advisers.
The following distribution information is being provided as required by the Internal Revenue Code or to meet a specific state’s requirement.
The Fund designates the following amounts or, if subsequently determined to be different, the maximum amount allowable for its fiscal year ended December 31, 2022:
| Federal and State Income Tax | ||||||
Long-Term Capital Gain Distributions | $ | 44,566,788 | ||||
Qualified Dividend Income* | 39.90 | % | ||||
Corporate Dividends Received Deduction* | 24.59 | % | ||||
U.S. Treasury Obligations* | 10.98 | % | ||||
Qualified Business Income* | 1.87 | % | ||||
Business Interest Income* | 38.15 | % | ||||
| * The above percentages are based on ordinary income dividends paid to shareholders during the Fund’s fiscal year. | ||||||
| Non-Resident Alien Shareholders | ||||||
Short-Term Capital Gain Distributions | $ | 827,166 | ||||
| 23 | Invesco Select Risk: Moderate Investor Fund |
The address of each trustee and officer is AIM Growth Series (Invesco Growth Series) (the “Trust”), 11 Greenway Plaza, Suite 1000, Houston, Texas 77046-1173. The trustees serve for the life of the Trust, subject to their earlier death, incapacitation, resignation, retirement or removal as more specifically provided in the Trust’s organizational documents. Each officer serves for a one year term or until their successors are elected and qualified. Column two below includes length of time served with predecessor entities, if any.
Name, Year of Birth and Position(s) Held with the Trust | Trustee and/or Officer Since | Principal Occupation(s) During Past 5 Years | Number of Funds in Fund Complex Overseen by Trustee | Other Directorship(s) Held by Trustee During Past 5 Years | ||||
| Interested Trustee | ||||||||
Martin L. Flanagan1 - 1960 Trustee and Vice Chair | 2007 | Executive Director, Chief Executive Officer and President, Invesco Ltd. (ultimate parent of Invesco and a global investment management firm); Trustee and Vice Chair, The Invesco Funds; Vice Chair, Investment Company Institute; and Member of Executive Board, SMU Cox School of Business
Formerly: Advisor to the Board, Invesco Advisers, Inc. (formerly known as Invesco Institutional (N.A.), Inc.); Chairman and Chief Executive Officer, Invesco Advisers, Inc. (registered investment adviser); Director, Chairman, Chief Executive Officer and President, Invesco Holding Company (US), Inc. (formerly IVZ Inc.) (holding company), Invesco Group Services, Inc. (service provider) and Invesco North American Holdings, Inc. (holding company); Director, Chief Executive Officer and President, Invesco Holding Company Limited (parent of Invesco and a global investment management firm); Director, Invesco Ltd.; Chairman, Investment Company Institute and President, Co-Chief Executive Officer, Co-President, Chief Operating Officer and Chief Financial Officer, Franklin Resources, Inc. (global investment management organization) | 189 | None |
| 1 | Mr. Flanagan is considered an interested person (within the meaning of Section 2(a)(19) of the 1940 Act) of the Trust because he is an officer of the Adviser to the Trust, and an officer and a director of Invesco Ltd., ultimate parent of the Adviser. |
| T-1 | Invesco Select Risk: Moderate Investor Fund |
Trustees and Officers–(continued)
Name, Year of Birth and Position(s) Held with the Trust | Trustee and/or Officer Since | Principal Occupation(s) During Past 5 Years | Number of Funds in Fund Complex Overseen by Trustee | Other Directorship(s) Held by Trustee During Past 5 Years | ||||
| Independent Trustees | ||||||||
Beth Ann Brown - 1968 Trustee (2019) and Chair (August 2022) | 2019 | Independent Consultant
Formerly: Head of Intermediary Distribution, Managing Director, Strategic Relations, Managing Director, Head of National Accounts, Senior Vice President, National Account Manager and Senior Vice President, Key Account Manager, Columbia Management Investment Advisers LLC; Vice President, Key Account Manager, Liberty Funds Distributor, Inc.; and Trustee of certain Oppenheimer Funds | 189 | Director, Board of Directors of Caron Engineering Inc.; Advisor, Board of Advisors of Caron Engineering Inc.; President and Director, Acton Shapleigh Youth Conservation Corps (non-profit) Formerly: President and Director Director of Grahamtastic Connection (non-profit) | ||||
Cynthia Hostetler - 1962 Trustee | 2017 | Non-Executive Director and Trustee of a number of public and private business corporations
Formerly: Director, Aberdeen Investment Funds (4 portfolios); Director, Artio Global Investment LLC (mutual fund complex); Director, Edgen Group, Inc. (specialized energy and infrastructure products distributor); Director, Genesee & Wyoming, Inc. (railroads); Head of Investment Funds and Private Equity, Overseas Private Investment Corporation; President, First Manhattan Bancorporation, Inc.; and Attorney, Simpson Thacher & Bartlett LLP | 189 | Resideo Technologies, Inc. (smart home technology); Vulcan Materials Company (construction materials company); Trilinc Global Impact Fund; Textainer Group Holdings, (shipping container leasing company); Investment Company Institute (professional organization); and Independent Directors Council (professional organization) | ||||
Eli Jones - 1961 Trustee | 2016 | Professor and Dean Emeritus, Mays Business School - Texas A&M University
Formerly: Dean of Mays Business School-Texas A&M University; Professor and Dean, Walton College of Business, University of Arkansas and E.J. Ourso College of Business, Louisiana State University; and Director, Arvest Bank | 189 | Insperity, Inc. (formerly known as Administaff) (human resources provider); and Member of Regional Board of Directors and Board of Directors, First Financial Bancorp (regional bank) | ||||
Elizabeth Krentzman - 1959 Trustee | 2019 | Formerly: Principal and Chief Regulatory Advisor for Asset Management Services and U.S. Mutual Fund Leader of Deloitte & Touche LLP; General Counsel of the Investment Company Institute (trade association); National Director of the Investment Management Regulatory Consulting Practice, Principal, Director and Senior Manager of Deloitte & Touche LLP; Assistant Director of the Division of Investment Management - Office of Disclosure and Investment Adviser Regulation of the U.S. Securities and Exchange Commission and various positions with the Division of Investment Management – Office of Regulatory Policy of the U.S. Securities and Exchange Commission; Associate at Ropes & Gray LLP; and Trustee of certain Oppenheimer Funds | 189 | Formerly: Member of the Cartica Funds Board of Directors (private investment fund); Trustee of the University of Florida National Board Foundation; and Member of the University of Florida Law Center Association, Inc. Board of Trustees, Audit Committee and Membership Committee | ||||
Anthony J. LaCava, Jr. - 1956 Trustee | 2019 | Formerly: Director and Member of the Audit Committee, Blue Hills Bank (publicly traded financial institution) and Managing Partner, KPMG LLP | 189 | Blue Hills Bank; Chairman, Bentley University; Member, Business School Advisory Council; and Nominating Committee, KPMG LLP | ||||
Prema Mathai-Davis - 1950 Trustee | 2001 | Retired
Formerly: Co-Founder & Partner of Quantalytics Research, LLC, (a FinTech Investment Research Platform for the Self-Directed Investor); Trustee of YWCA Retirement Fund; CEO of YWCA of the USA; Board member of the NY Metropolitan Transportation Authority; Commissioner of the NYC Department of Aging; and Board member of Johns Hopkins Bioethics Institute | 189 | Member of Board of Positive Planet US (non-profit) and HealthCare Chaplaincy Network (non-profit) |
| T-2 | Invesco Select Risk: Moderate Investor Fund |
Trustees and Officers–(continued)
Name, Year of Birth and Position(s) Held with the Trust | Trustee and/or Officer Since | Principal Occupation(s) During Past 5 Years | Number of Funds in Fund Complex Overseen by Trustee | Other Directorship(s) Held by Trustee During Past 5 Years | ||||
| Independent Trustees–(continued) | ||||||||
Joel W. Motley - 1952 Trustee | 2019 | Director of Office of Finance, Federal Home Loan Bank System; Managing Director of Carmona Motley Inc. (privately held financial advisor); Member of the Council on Foreign Relations and its Finance and Budget Committee; Chairman Emeritus of Board of Human Rights Watch and Member of its Investment Committee; and Member of Investment Committee Board of Historic Hudson Valley (non-profit cultural organization); Member of the Board, Blue Ocean Acquisition Corp.; and Member of the Vestry and the Investment Committee of Trinity Church Wall Street.
Formerly: Managing Director of Public Capital Advisors, LLC (privately held financial advisor); Managing Director of Carmona Motley Hoffman, Inc. (privately held financial advisor); Trustee of certain Oppenheimer Funds; and Director of Columbia Equity Financial Corp. (privately held financial advisor) | 189 | Member of Board of Trust for Mutual Understanding (non-profit promoting the arts and environment); Member of Board of Greenwall Foundation (bioethics research foundation) and its Investment Committee; Member of Board of Friends of the LRC (non- profit legal advocacy); and Board Member and Investment Committee Member of Pulitzer Center for Crisis Reporting (non-profit journalism) | ||||
Teresa M. Ressel - 1962 Trustee | 2017 | Non-executive director and trustee of a number of public and private business corporations
Formerly: Chief Executive Officer, UBS Securities LLC (investment banking); Chief Operating Officer, UBS AG Americas (investment banking); Sr. Management Team Olayan America, The Olayan Group (international investor/commercial/industrial); Assistant Secretary for Management & Budget and Designated Chief Financial Officer, U.S. Department of Treasury and Director, ON Semiconductor Corporation (semiconductor manufacturing) | 189 | None | ||||
Robert C. Troccoli - 1949 Trustee | 2016 | Retired
Formerly: Adjunct Professor, University of Denver – Daniels College of Business; and Managing Partner, KPMG LLP | 189 | None | ||||
Daniel S. Vandivort - 1954 Trustee | 2019 | President, Flyway Advisory Services LLC (consulting and property management)
Formerly: President and Chief Investment Officer, previously Head of Fixed Income, Weiss Peck and Greer/Robeco Investment Management; Trustee and Chair, Weiss Peck and Greer Funds Board; and various capacities at CS First Boston including Head of Fixed Income at First Boston Asset Management. | 189 | Formerly: Trustee and Governance Chair, Oppenheimer Funds; Treasurer, Chairman of the Audit and Finance Committee, Huntington Disease Foundation of America | ||||
| T-3 | Invesco Select Risk: Moderate Investor Fund |
Trustees and Officers–(continued)
Name, Year of Birth and Position(s) Held with the Trust | Trustee and/or Officer Since | Principal Occupation(s) During Past 5 Years | Number of Funds in Fund Complex Overseen by Trustee | Other Directorship(s) Held by Trustee During Past 5 Years | ||||
| Officers | ||||||||
Sheri Morris - 1964 President and Principal Executive Officer | 1999 | Director, Invesco Trust Company; Head of Global Fund Services, Invesco Ltd.; President and Principal Executive Officer, The Invesco Funds; Vice President, Invesco Exchange-Traded Fund Trust, Invesco Exchange-Traded Fund Trust II, Invesco India Exchange-Traded Fund Trust, Invesco Actively Managed Exchange-Traded Fund Trust, Invesco Actively Managed Exchange-Traded Commodity Fund Trust and Invesco Exchange-Traded Self-Indexed Fund Trust; and Vice President, OppenheimerFunds, Inc.
Formerly: Vice President, Treasurer and Principal Financial Officer, The Invesco Funds; Vice President, Invesco AIM Advisers, Inc., Invesco AIM Capital Management, Inc. and Invesco AIM Private Asset Management, Inc.; Assistant Vice President and Assistant Treasurer, The Invesco Funds; Vice President and Assistant Vice President, Invesco Advisers, Inc.; Assistant Vice President, Invesco AIM Capital Management, Inc. and Invesco AIM Private Asset Management, Inc.; Treasurer, Invesco Exchange-Traded Fund Trust, Invesco Exchange-Traded Fund Trust II, Invesco India Exchange-Traded Fund Trust and Invesco Actively Managed Exchange-Traded Fund Trust; and Senior Vice President, Invesco Advisers, Inc. (formerly known as Invesco Institutional (N.A.), Inc.) (registered investment adviser) | N/A | N/A | ||||
Jeffrey H. Kupor - 1968 Senior Vice President, Chief Legal Officer and Secretary | 2018 | Head of Legal of the Americas, Invesco Ltd.; Senior Vice President and Secretary, Invesco Advisers, Inc. (formerly known as Invesco Institutional (N.A.), Inc.) (registered investment adviser); Secretary, Invesco Distributors, Inc. (formerly known as Invesco AIM Distributors, Inc.); Vice President and Secretary, Invesco Investment Services, Inc. (formerly known as Invesco AIM Investment Services, Inc.); Senior Vice President, Chief Legal Officer and Secretary, The Invesco Funds; Secretary and General Counsel, Invesco Investment Advisers LLC (formerly known as Van Kampen Asset Management); Secretary and General Counsel, Invesco Capital Markets, Inc. (formerly known as Van Kampen Funds Inc.); Chief Legal Officer, Invesco Exchange-Traded Fund Trust, Invesco Exchange-Traded Fund Trust II, Invesco India Exchange-Traded Fund Trust, Invesco Actively Managed Exchange-Traded Fund Trust, Invesco Actively Managed Exchange-Traded Commodity Fund Trust and Invesco Exchange-Traded Self-Indexed Fund Trust;; Secretary and Vice President, Harbourview Asset Management Corporation; Secretary and Vice President, OppenheimerFunds, Inc. and Invesco Managed Accounts, LLC; Secretary and Senior Vice President, OFI Global Institutional, Inc.; Secretary and Vice President, OFI SteelPath, Inc.; Secretary and Vice President, Oppenheimer Acquisition Corp.; Secretary and Vice President, Shareholder Services, Inc.; and Secretary and Vice President, Trinity Investment Management Corporation
Formerly: Senior Vice President, Invesco Distributors, Inc.; Secretary and Vice President, Jemstep, Inc.; Head of Legal, Worldwide Institutional, Invesco Ltd.; Secretary and General Counsel, INVESCO Private Capital Investments, Inc.; Senior Vice President, Secretary and General Counsel, Invesco Management Group, Inc. (formerly known as Invesco AIM Management Group, Inc.); Assistant Secretary, INVESCO Asset Management (Bermuda) Ltd.; Secretary and General Counsel, Invesco Private Capital, Inc.; Assistant Secretary and General Counsel, INVESCO Realty, Inc.; Secretary and General Counsel, Invesco Senior Secured Management, Inc.; Secretary, Sovereign G./P. Holdings Inc.; Secretary, Invesco Indexing LLC; and Secretary, W.L. Ross & Co., LLC | N/A | N/A | ||||
Andrew R. Schlossberg - 1974 Senior Vice President | 2019 | Senior Vice President, Invesco Group Services, Inc.; Head of the Americas and Senior Managing Director, Invesco Ltd.; Director and Senior Vice President, Invesco Advisers, Inc. (formerly known as Invesco Institutional (N.A.), Inc.) (registered investment adviser); Director and Chairman, Invesco Investment Services, Inc. (formerly known as Invesco AIM Investment Services, Inc.) (registered transfer agent); Senior Vice President, The Invesco Funds; and Director, Invesco Investment Advisers LLC (formerly known as Van Kampen Asset Management)
Formerly: Director, President and Chairman, Invesco Insurance Agency, Inc.; Director, Invesco UK Limited; Director and Chief Executive, Invesco Asset Management Limited and Invesco Fund Managers Limited; Assistant Vice President, The Invesco Funds; Senior Vice President, Invesco Advisers, Inc. (formerly known as Invesco Institutional (N.A.), Inc.) (registered investment adviser); Director and Chief Executive, Invesco Administration Services Limited and Invesco Global Investment Funds Limited; Director, Invesco Distributors, Inc.; Head of EMEA, Invesco Ltd.; President, Invesco Actively Managed Exchange-Traded Commodity Fund Trust, Invesco Actively Managed Exchange-Traded Fund Trust, Invesco Exchange-Traded Fund Trust, Invesco Exchange-Traded Fund Trust II and Invesco India Exchange-Traded Fund Trust; and Managing Director and Principal Executive Officer, Invesco Capital Management LLC | N/A | N/A |
| T-4 | Invesco Select Risk: Moderate Investor Fund |
Trustees and Officers–(continued)
Name, Year of Birth and Position(s) Held with the Trust | Trustee and/or Officer Since | Principal Occupation(s) During Past 5 Years | Number of Funds in Fund Complex Overseen by Trustee | Other Directorship(s) Held by Trustee During Past 5 Years | ||||
| Officers–(continued) | ||||||||
John M. Zerr - 1962 Senior Vice President | 2006 | Chief Operating Officer of the Americas; Senior Vice President, Invesco Advisers, Inc. (formerly known as Invesco Institutional (N.A.), Inc.) (registered investment adviser); Senior Vice President, Invesco Distributors, Inc. (formerly known as Invesco AIM Distributors, Inc.); Director and Vice President, Invesco Investment Services, Inc. (formerly known as Invesco AIM Investment Services, Inc.) Senior Vice President, The Invesco Funds; Managing Director, Invesco Capital Management LLC; Director, Invesco Investment Advisers LLC (formerly known as Van Kampen Asset Management); Senior Vice President, Invesco Capital Markets, Inc. (formerly known as Van Kampen Funds Inc.); Manager, Invesco Indexing LLC; Manager, Invesco Specialized Products, LLC; Member, Invesco Canada Funds Advisory Board; Director, President and Chief Executive Officer, Invesco Corporate Class Inc. (corporate mutual fund company); and Director, Chairman, President and Chief Executive Officer, Invesco Canada Ltd. (formerly known as Invesco Trimark Ltd./Invesco Trimark Ltèe) (registered investment adviser and registered transfer agent); President, Invesco, Inc.; President, Invesco Global Direct Real Estate Feeder GP Ltd.; President, Invesco IP Holdings (Canada) Ltd; President, Invesco Global Direct Real Estate GP Ltd.; President, Invesco Financial Services Ltd. / Services Financiers Invesco Ltée; and Director and Chairman, Invesco Trust Company
Formerly: President, Trimark Investments Ltd/Services Financiers Invesco Ltee; Director and Senior Vice President, Invesco Insurance Agency, Inc.; Director and Senior Vice President, Invesco Management Group, Inc. (formerly known as Invesco AIM Management Group, Inc.); Secretary and General Counsel, Invesco Management Group, Inc. (formerly known as Invesco AIM Management Group, Inc.); Secretary, Invesco Investment Services, Inc. (formerly known as Invesco AIM Investment Services, Inc.); Chief Legal Officer and Secretary, The Invesco Funds; Secretary and General Counsel, Invesco Investment Advisers LLC (formerly known as Van Kampen Asset Management); Secretary and General Counsel, Invesco Capital Markets, Inc. (formerly known as Van Kampen Funds Inc.); Chief Legal Officer, Invesco Exchange-Traded Fund Trust, Invesco Exchange-Traded Fund Trust II, Invesco India Exchange-Traded Fund Trust, Invesco Actively Managed Exchange-Traded Fund Trust, Invesco Actively Managed Exchange-Traded Commodity Fund Trust and Invesco Exchange-Traded Self-Indexed Fund Trust; Secretary, Invesco Indexing LLC; Director, Secretary, General Counsel and Senior Vice President, Van Kampen Exchange Corp.; Director, Vice President and Secretary, IVZ Distributors, Inc. (formerly known as INVESCO Distributors, Inc.); Director and Vice President, INVESCO Funds Group, Inc.; Director and Vice President, Van Kampen Advisors Inc.; Director, Vice President, Secretary and General Counsel, Van Kampen Investor Services Inc.; Director and Secretary, Invesco Distributors, Inc. (formerly known as Invesco AIM Distributors, Inc.); Director, Senior Vice President, General Counsel and Secretary, Invesco AIM Advisers, Inc. and Van Kampen Investments Inc.; Director, Vice President and Secretary, Fund Management Company; Director, Senior Vice President, Secretary, General Counsel and Vice President, Invesco AIM Capital Management, Inc.; and Chief Operating Officer and General Counsel, Liberty Ridge Capital, Inc. (an investment adviser) | N/A | N/A | ||||
Gregory G. McGreevey - 1962 Senior Vice President | 2012 | Senior Managing Director, Invesco Ltd.; Director, Chairman, President, and Chief Executive Officer, Invesco Advisers, Inc. (formerly known as Invesco Institutional (N.A.), Inc.) (registered investment adviser); Director, Invesco Mortgage Capital, Inc. and Invesco Senior Secured Management, Inc.; Senior Vice President, The Invesco Funds; President, SNW Asset Management Corporation and Invesco Managed Accounts, LLC; Chairman and Director, Invesco Private Capital, Inc.; Chairman and Director, INVESCO Private Capital Investments, Inc.; Chairman and Director, INVESCO Realty, Inc.; and Senior Vice President, Invesco Group Services, Inc.
Formerly: Senior Vice President, Invesco Management Group, Inc. and Invesco Advisers, Inc.; Assistant Vice President, The Invesco Funds | N/A | N/A | ||||
Adrien Deberghes - 1967 Principal Financial Officer, Treasurer and Vice President | 2020 | Head of the Fund Office of the CFO and Fund Administration; Vice President, Invesco Advisers, Inc.; Principal Financial Officer, Treasurer and Vice President, The Invesco Funds; Vice President, Invesco Exchange-Traded Fund Trust, Invesco Exchange-Traded Fund Trust II, Invesco India Exchange-Traded Fund Trust, Invesco Actively Managed Exchange-Traded Fund Trust, Invesco Actively Managed Exchange-Traded Commodity Fund Trust and Invesco Exchange-Traded Self-Indexed Fund Trust
Formerly: Senior Vice President and Treasurer, Fidelity Investments | N/A | N/A | ||||
Crissie M. Wisdom - 1969 Anti-Money Laundering Compliance Officer | 2013 | Anti-Money Laundering and OFAC Compliance Officer for Invesco U.S. entities including: Invesco Advisers, Inc. and its affiliates, Invesco Capital Markets, Inc., Invesco Distributors, Inc., Invesco Investment Services, Inc., The Invesco Funds, Invesco Capital Management, LLC, Invesco Trust Company; and Fraud Prevention Manager for Invesco Investment Services, Inc. | N/A | N/A |
| T-5 | Invesco Select Risk: Moderate Investor Fund |
Trustees and Officers–(continued)
Name, Year of Birth and Position(s) Held with the Trust | Trustee and/or Officer Since | Principal Occupation(s) During Past 5 Years | Number of Funds in Fund Complex Overseen by Trustee | Other Directorship(s) Held by Trustee During Past 5 Years | ||||
| Officers–(continued) | ||||||||
Todd F. Kuehl - 1969 Chief Compliance Officer and Senior Vice President | 2020 | Chief Compliance Officer, Invesco Advisers, Inc. (registered investment adviser); and Chief Compliance Officer and Senior Vice President, The Invesco Funds
Formerly: Managing Director and Chief Compliance Officer, Legg Mason (Mutual Funds); Chief Compliance Officer, Legg Mason Private Portfolio Group (registered investment adviser) | N/A | N/A | ||||
| James Bordewick, Jr. - 1959 Senior Vice President and Senior Officer | 2022 | Senior Vice President and Senior Officer, The Invesco Funds
Formerly: Chief Legal Officer, KingsCrowd, Inc. (research and analytical platform for investment in private capital markets); Chief Operating Officer and Head of Legal and Regulatory, Netcapital (private capital investment platform); Managing Director, General Counsel of asset management and Chief Compliance Officer for asset management and private banking, Bank of America Corporation; Chief Legal Officer, Columbia Funds and BofA Funds;
Senior Vice President and Associate General Counsel, MFS Investment Management; Chief Legal Officer, MFS Funds; Associate, Ropes & Gray; and Associate, Gaston Snow & Ely Bartlett | N/A | N/A |
The Statement of Additional Information of the Trust includes additional information about the Fund’s Trustees and is available upon request, without charge, by calling 1.800.959.4246. Please refer to the Fund’s Statement of Additional Information for information on the Fund’s sub-advisers.
| Office of the Fund | Investment Adviser | Distributor | Auditors | |||
| 11 Greenway Plaza, Suite 1000 | Invesco Advisers, Inc. | Invesco Distributors, Inc. | PricewaterhouseCoopers LLP | |||
| Houston, TX 77046-1173 | 1555 Peachtree Street, N.E. | 11 Greenway Plaza, Suite 1000 | 1000 Louisiana Street, Suite 5800 | |||
| Atlanta, GA 30309 | Houston, TX 77046-1173 | Houston, TX 77002-5021 | ||||
| Counsel to the Fund | Counsel to the Independent Trustees | Transfer Agent | Custodian | |||
| Stradley Ronon Stevens & Young, LLP | Sidley Austin LLP | Invesco Investment Services, Inc. | State Street Bank and Trust Company | |||
| 2005 Market Street, Suite 2600 | 787 Seventh Avenue | 11 Greenway Plaza, Suite 1000 | 225 Franklin Street | |||
| Philadelphia, PA 19103-7018 | New York, NY 10019 | Houston, TX 77046-1173 | Boston, MA 02110-2801 | |||
| T-6 | Invesco Select Risk: Moderate Investor Fund |
(This page intentionally left blank)
(This page intentionally left blank)

Go paperless with eDelivery
Visit invesco.com/edelivery to enjoy the convenience and security of anytime electronic access to your investment documents.
With eDelivery, you can elect to have any or all of the following materials delivered straight to your inbox to download, save and print from your own computer:
∎ Fund reports and prospectuses
∎ Quarterly statements
∎ Daily confirmations
∎ Tax forms
Invesco mailing information
Send general correspondence to Invesco Investment Services, Inc., P.O. Box 219078, Kansas City, MO 64121-9078.
Important notice regarding delivery of security holder documents
To reduce Fund expenses, only one copy of most shareholder documents may be mailed to shareholders with multiple accounts at the same address (Householding). Mailing of your shareholder documents may be householded indefinitely unless you instruct us otherwise. If you do not want the mailing of these documents to be combined with those for other members of your household, please contact Invesco Investment Services, Inc. at 800 959 4246 or contact your financial institution. We will begin sending you individual copies for each account within 30 days after receiving your request.
Fund holdings and proxy voting information
The Fund provides a complete list of its portfolio holdings four times each year, at the end of each fiscal quarter. For the second and fourth quarters, the list appears, respectively, in the Fund’s semiannual and annual reports to shareholders. For the first and third quarters, the Fund files the list with the Securities and Exchange Commission (SEC) as an exhibit to its reports on Form N-PORT. The most recent list of portfolio holdings is available at invesco.com/completeqtrholdings. Shareholders can also look up the Fund’s Form N-PORT filings on the SEC website, sec.gov. The SEC file numbers for the Fund are shown below.
A description of the policies and procedures that the Fund uses to determine how to vote proxies relating to portfolio securities is available without charge, upon request, from our Client Services department at 800 959 4246, or at invesco.com/corporate/about-us/esg. The information is also available on the SEC website, sec.gov.
Information regarding how the Fund voted proxies related to its portfolio securities during the most recent 12-month period ended June 30 is available at invesco.com/proxysearch. This information is also available on the SEC website, sec.gov.
Invesco Advisers, Inc. is an investment adviser; it provides investment advisory services to individual and institutional clients and does not sell securities. Invesco Distributors, Inc. is the US distributor for Invesco Ltd.’s retail mutual funds, exchange-traded funds and institutional money market funds. Both are wholly owned, indirect subsidiaries of Invesco Ltd.

| SEC file number(s): 811-02699 and 002-57526 | Invesco Distributors, Inc. | O-OPSMI-AR-1 |

| Annual Report to Shareholders | December 31, 2022 |
Invesco Select Risk: Moderately Conservative Investor Fund
Nasdaq:
A: CAAMX ∎ C: CACMX ∎ R: CMARX ∎ S: CMASX ∎ Y: CAAYX ∎ R5: CMAIX ∎ R6: CNSSX
Management’s Discussion of Fund Performance
For the fiscal year ended December 31, 2022, Class A shares of Invesco Select Risk: Moderately Conservative Investor Fund (the Fund), at net asset value (NAV), underperformed the Custom Invesco Select Risk: Moderately Conservative Index. |
| |||
Your Fund’s long-term performance appears later in this report. | ||||
Fund vs. Indexes | ||||
Total returns, 12/31/21 to 12/31/22, at net asset value (NAV). Performance shown does not include applicable contingent deferred sales charges (CDSC) or front-end sales charges, which would have reduced performance. |
| |||
Class A Shares | -16.69 | % | ||
Class C Shares | -17.29 | |||
Class R Shares | -16.90 | |||
Class S Shares | -16.66 | |||
Class Y Shares | -16.49 | |||
Class R5 Shares | -16.40 | |||
Class R6 Shares | -16.33 | |||
Bloomberg Global Aggregate USD Hedged Indexq | -11.22 | |||
Custom Invesco Select Risk: Moderately Conservative Index∎ | -13.89 | |||
MSCI All Country World Indexq | -18.36 | |||
Source(s): qRIMES Technologies Corp.; ∎Invesco, RIMES Technologies Corp.
| ||||
Market conditions and your Fund
Global equity markets declined in the first half of 2022 amid volatility sparked by Russia’s invasion of Ukraine, rising commodity prices, rampant global inflation and central banks shifting toward tighter monetary policy. Russia’s invasion exacerbated inflationary pressures, disrupting already strained supply chains, and increasing shortages of oil, gas and raw materials, with the price of oil rising sharply.
Inflation headwinds continued into the third quarter of 2022. The US Federal Reserve (the Fed), the European Central Bank and the Bank of England all raised interest rates. In contrast, the People’s Bank of China lowered its policy rate and the Bank of Japan kept rates the same. Emerging market equities, hampered by the strong US dollar, underperformed developed market equities.
Global equity markets posted gains for the fourth quarter of 2022, after better inflation data sparked a rally in October and November. However, investor sentiment worsened in December after central banks signaled continued interest rate hikes into 2023 as inflation remained above target levels. International stocks outperformed US stocks in the fourth quarter, led by results in Europe and the UK. Emerging market equities also posted gains for the fourth quarter of 2022, boosted by China, which eased its zero-COVID-19 policy and started to reopen even as COVID-19 infections surged.
Despite the rebound in the fourth quarter of 2022, at the end of the fiscal year ended December 31, 2022, trailing one-year returns for developed market equities and emerging market equities were both in negative territory.
Strategic asset class exposures in the Fund are obtained through underlying representative
mutual funds and exchange-traded funds targeting pre-defined risk levels. From an absolute Fund performance perspective, the portfolio’s allocation to variable rate fixed income was the leading contributor to positive performance. The remaining allocations to equity, fixed income and alternative assets were all detractors from absolute Fund performance as the portfolio produced a negative return for the fiscal year.
From a relative Fund performance perspective, the portfolio underperformed its custom benchmark, the Custom Invesco Select Risk: Moderately Conservative Investor Index, during the fiscal year. Underperformance was driven mainly by style selection within the fixed income and small- and mid-cap equity allocations. Within the fixed income allocation, the Invesco 1-30 Laddered Treasury ETF and Invesco Taxable Municipal Bond ETF were the leading detractors. Within the equity allocation, the Invesco Discovery Mid Cap Growth Fund was the primary detractor.
Conversely, allocations to other fixed income funds and allocations to style-specific equities were the leading contributors to relative performance during the fiscal year. Within the allocations, the Invesco Variable Rate Investment Grade ETF, Invesco Master Loan Fund, Invesco S&P 500 Low Volatility ETF and Invesco S&P 500 Pure Value ETF were the leading contributors.
Please note that some of the Fund’s underlying funds use derivatives, including futures and total return swaps, which may create economic leverage in the underlying funds. Therefore, some of the performance of the strategy, both positive and negative, can be attributed to these instruments. Derivatives can be a cost-effective way to gain exposure to asset classes. However, derivatives may amplify traditional investment risks through
the creation of leverage and may be less liquid than traditional securities.
Thank you for your continued investment in the Invesco Select Risk: Moderately Conservative Investor Fund.
Portfolio manager(s):
Jeffrey Bennett
Jacob Borbidge
Duy Nguyen
The views and opinions expressed in management’s discussion of Fund performance are those of Invesco Advisers, Inc. and its affiliates. These views and opinions are subject to change at any time based on factors such as market and economic conditions. These views and opinions may not be relied upon as investment advice or recommendations, or as an offer for a particular security. The information is not a complete analysis of every aspect of any market, country, industry, security or the Fund. Statements of fact are from sources considered reliable, but Invesco Advisers, Inc. makes no representation or warranty as to their completeness or accuracy. Although historical performance is no guarantee of future results, these insights may help you understand our investment management philosophy.
See important Fund and, if applicable, index disclosures later in this report.
| 2 | Invesco Select Risk: Moderately Conservative Investor Fund |
Your Fund’s Long-Term Performance
Results of a $10,000 Investment – Oldest Share Class(es)
Fund and index data from 12/31/12

1 Source: RIMES Technologies Corp.
2 Source: Invesco, RIMES Technologies Corp.
Past performance cannot guarantee future results.
The data shown in the chart include reinvested distributions, applicable sales charges and Fund expenses including management
fees. Index results include reinvested dividends, but they do not reflect sales charges. Performance of the peer group, if applicable, reflects fund expenses and management fees;
performance of a market index does not. Performance shown in the chart does not reflect deduction of taxes a shareholder would pay on Fund distributions or sale of Fund shares.
| 3 | Invesco Select Risk: Moderately Conservative Investor Fund |
��
Average Annual Total Returns |
| |||
As of 12/31/22, including maximum applicable sales charges |
| |||
Class A Shares | ||||
Inception (4/29/05) | 3.39 | % | ||
10 Years | 2.31 | |||
5 Years | 0.33 | |||
1 Year | -21.25 | |||
Class C Shares | ||||
Inception (4/29/05) | 3.39 | % | ||
10 Years | 2.28 | |||
5 Years | 0.72 | |||
1 Year | -18.09 | |||
Class R Shares | ||||
Inception (4/29/05) | 3.47 | % | ||
10 Years | 2.64 | |||
5 Years | 1.24 | |||
1 Year | -16.90 | |||
Class S Shares | ||||
Inception (6/3/11) | 3.56 | % | ||
10 Years | 3.00 | |||
5 Years | 1.58 | |||
1 Year | -16.66 | |||
Class Y Shares | ||||
Inception (10/3/08) | 4.54 | % | ||
10 Years | 3.16 | |||
5 Years | 1.73 | |||
1 Year | -16.49 | |||
Class R5 Shares | ||||
Inception (4/29/05) | 4.02 | % | ||
10 Years | 3.21 | |||
5 Years | 1.79 | |||
1 Year | -16.40 | |||
Class R6 Shares | ||||
10 Years | 3.07 | % | ||
5 Years | 1.81 | |||
1 Year | -16.33 | |||
Class R6 shares incepted on April 4, 2017. Performance shown prior to that date is that of Class A shares and includes the 12b-1 fees applicable to Class A shares.
The performance data quoted represent past performance and cannot guarantee future results; current performance may be lower or higher. Please visit invesco.com/ performance for the most recent month-end performance. Performance figures reflect reinvested distributions, changes in net asset value and the effect of the maximum sales charge unless otherwise stated. Performance figures do not reflect deduction of taxes a shareholder would pay on Fund distributions or sale of Fund shares. Investment return and principal value will fluctuate so that you may have a gain or loss when you sell shares.
Class A share performance reflects the maximum 5.50% sales charge, and Class C share performance reflects the applicable contingent deferred sales charge (CDSC) for the period involved. The CDSC on Class C shares is 1% for the first year after purchase. Class R, Class S, Class Y, Class R5 and Class R6 shares do not have
a front-end sales charge or a CDSC; therefore, performance is at net asset value.
The performance of the Fund’s share classes will differ primarily due to different sales charge structures and class expenses.
Fund performance reflects any applicable fee waivers and/or expense reimbursements. Had the adviser not waived fees and/or reimbursed expenses currently or in the past, returns would have been lower. See current prospectus for more information.
| 4 | Invesco Select Risk: Moderately Conservative Investor Fund |
Invesco Select Risk: Moderately Conservative Investor Fund’s investment objective is total return consistent with a lower level of risk relative to the broad stock market.
| ∎ | Unless otherwise stated, information presented in this report is as of December 31, 2022, and is based on total net assets. |
| ∎ | Unless otherwise noted, all data is provided by Invesco. |
| ∎ | To access your Fund’s reports/prospectus, visit invesco.com/fundreports. |
About indexes used in this report
| ∎ | The Bloomberg Global Aggregate USD Hedged Index tracks fixed-income performance of regions around the world while hedging the currency back to the US dollar. |
| ∎ | The Custom Invesco Select Risk: Moderately Conservative Index is composed of 40% MSCI All Country World Index and 60% Bloomberg Global Aggregate USD Hedged Index. |
| ∎ | The MSCI All Country World Index is an unmanaged index considered representative of large- and mid-cap stocks across developed and emerging markets. The index is computed using the net return, which withholds applicable taxes for non-resident investors. |
| ∎ | The Fund is not managed to track the performance of any particular index, including the index(es) described here, and consequently, the performance of the Fund may deviate significantly from the performance of the index(es). |
| ∎ | A direct investment cannot be made in an index. Unless otherwise indicated, index results include reinvested dividends, and they do not reflect sales charges. Performance of the peer group, if applicable, reflects fund expenses; performance of a market index does not. |
This report must be accompanied or preceded by a currently effective Fund prospectus, which contains more complete information, including sales charges and expenses. Investors should read it carefully before investing. |
| NOT FDIC INSURED | MAY LOSE VALUE | NO BANK GUARANTEE |
| 5 | Invesco Select Risk: Moderately Conservative Investor Fund |
Fund Information
Portfolio Composition*
| By fund type | % of total investments | ||||
Fixed Income Funds | 56.61 | % | |||
Equity Funds | 38.14 | ||||
Alternative Funds | 5.03 | ||||
Money Market Funds | 0.22 | ||||
| * | Based on the Schedule of Investments, which classifies each underlying fund and other investments into broad asset classes based on their predominant investments. |
The Fund’s holdings are subject to change, and there is no assurance that the Fund will continue to hold any particular security. Data presented here are as of December 31, 2022.
| 6 | Invesco Select Risk: Moderately Conservative Investor Fund |
December 31, 2022
Invesco Select Risk: Moderately Conservative Investor Fund
Schedule of Investments in Affiliated Issuers–99.95%(a)
% of Net Assets 12/31/22 | Value 12/31/21 | Purchases at Cost | Proceeds from Sales | Change in Unrealized Appreciation (Depreciation) | Realized Gain (Loss) | Dividend Income | Shares 12/31/22 | Value 12/31/22 | ||||||||||||||||||||||||||||
Alternative Funds–5.02% | ||||||||||||||||||||||||||||||||||||
Invesco Global Real Estate Income Fund, Class R6(b) | 1.92 | % | $ | 6,832,193 | $ | 1,145,268 | $ | (767,578 | ) | $ | (1,568,852 | ) | $ | 39,072 | $ | 94,184 | 726,048 | $ | 5,619,614 | |||||||||||||||||
Invesco Macro Allocation Strategy Fund, Class R6(c) | 3.10 | % | 12,205,700 | 991,721 | (2,771,805 | ) | (896,234 | ) | (434,769 | ) | – | 1,209,390 | 9,094,613 | |||||||||||||||||||||||
Total Alternative Funds | 19,037,893 | 2,136,989 | (3,539,383 | ) | (2,465,086 | ) | (395,697 | ) | 94,184 | 14,714,227 | ||||||||||||||||||||||||||
Domestic Equity Funds–20.93% | ||||||||||||||||||||||||||||||||||||
Invesco Discovery Mid Cap Growth Fund, Class R6(c) | 2.89 | % | 16,600,843 | 3,638,709 | (7,082,591 | ) | (3,518,960 | ) | (1,155,204 | ) | — | 335,156 | 8,482,797 | |||||||||||||||||||||||
Invesco Main Street Small Cap Fund, Class R6 | 1.54 | % | 5,624,496 | 355,189 | (588,983 | ) | (875,555 | ) | (14,947 | ) | 27,507 | 251,548 | 4,500,200 | |||||||||||||||||||||||
Invesco Russell 1000® Dynamic Multifactor ETF | 5.17 | % | 16,154,541 | 5,400,388 | (3,723,205 | ) | (2,416,840 | ) | (275,099 | ) | 243,678 | 352,580 | 15,139,785 | |||||||||||||||||||||||
Invesco S&P 500® Low Volatility ETF | 4.27 | % | 9,006,795 | 7,354,299 | (2,884,616 | ) | (972,181 | ) | 19,911 | 255,435 | 195,997 | 12,524,208 | ||||||||||||||||||||||||
Invesco S&P 500® Pure Growth ETF | 3.59 | % | 13,878,913 | 3,951,788 | (3,402,785 | ) | (3,884,354 | ) | (27,741 | ) | 80,644 | 69,361 | 10,515,821 | |||||||||||||||||||||||
Invesco S&P 500® Pure Value ETF | 2.43 | % | 7,489,546 | 2,470,590 | (2,537,138 | ) | (648,968 | ) | 345,856 | 167,802 | 91,304 | 7,119,886 | ||||||||||||||||||||||||
Invesco S&P SmallCap Low Volatility ETF | 1.04 | % | 5,734,588 | 139,845 | (2,143,291 | ) | (1,244,678 | ) | 549,674 | 95,063 | 67,991 | 3,036,138 | ||||||||||||||||||||||||
Total Domestic Equity Funds | 74,489,722 | 23,310,808 | (22,362,609 | ) | (13,561,536 | ) | (557,550 | ) | 870,129 | 61,318,835 | ||||||||||||||||||||||||||
Fixed Income Funds–56.59% | ||||||||||||||||||||||||||||||||||||
Invesco 1-30 Laddered Treasury ETF | 14.32 | % | 37,830,314 | 21,629,153 | (7,712,233 | ) | (8,680,149 | ) | (1,110,569 | ) | 782,128 | 1,460,373 | 41,956,516 | |||||||||||||||||||||||
Invesco Core Plus Bond Fund, Class R6 | 14.04 | % | 51,799,306 | 3,931,903 | (5,503,742 | ) | (8,374,424 | ) | (731,035 | ) | 1,598,996 | 4,513,942 | 41,122,008 | |||||||||||||||||||||||
Invesco Fundamental High Yield® Corporate Bond ETF | 4.00 | % | 17,155,842 | 422,874 | (3,964,006 | ) | (1,550,478 | ) | (360,076 | ) | 455,608 | 683,654 | 11,704,156 | |||||||||||||||||||||||
Invesco Income Fund, Class R6 | 1.72 | % | 10,394,838 | 502,556 | (4,908,570 | ) | (970,562 | ) | 13,658 | 240,216 | 734,587 | 5,031,920 | ||||||||||||||||||||||||
Invesco International Bond Fund, Class R6(b) | 3.19 | % | 21,220,026 | 755,997 | (10,055,634 | ) | (968,408 | ) | (1,247,343 | ) | 60,368 | 2,169,214 | 9,327,619 | |||||||||||||||||||||||
Invesco Master Loan Fund, Class R6 | 5.11 | % | 17,007,538 | 1,864,461 | (2,914,115 | ) | (901,568 | ) | (77,530 | ) | 1,074,910 | 988,373 | 14,978,786 | |||||||||||||||||||||||
Invesco Taxable Municipal Bond ETF | 8.95 | % | 45,510,013 | 3,175,113 | (13,456,089 | ) | (6,775,987 | ) | (2,222,962 | ) | 979,044 | 1,020,229 | 26,230,088 | |||||||||||||||||||||||
Invesco Variable Rate Investment Grade ETF | 5.26 | % | 11,337,119 | 8,775,424 | (4,480,176 | ) | (180,785 | ) | (36,323 | ) | 370,382 | 623,847 | 15,415,259 | |||||||||||||||||||||||
Total Fixed Income Funds | 212,254,996 | 41,057,481 | (52,994,565 | ) | (28,402,361 | ) | (5,772,180 | ) | 5,561,652 | 165,766,352 | ||||||||||||||||||||||||||
Foreign Equity Funds–17.19% | ||||||||||||||||||||||||||||||||||||
Invesco EQV Emerging Markets All Cap Fund, Class R6(d) | 1.49 | % | — | 5,284,015 | (792,629 | ) | (104,755 | ) | (23,164 | ) | 76,361 | 141,076 | 4,363,467 | |||||||||||||||||||||||
Invesco Developing Markets Fund, Class R6 | 2.11 | % | 13,103,674 | 1,685,908 | (5,541,001 | ) | (634,873 | ) | (2,439,892 | ) | 71,805 | 176,799 | 6,173,816 | |||||||||||||||||||||||
Invesco Global Fund, Class R6(b) | 5.79 | % | 28,629,662 | 8,395,370 | (9,187,205 | ) | (8,253,953 | ) | (516,202 | ) | – | 224,222 | 16,978,069 | |||||||||||||||||||||||
Invesco Global Infrastructure Fund, Class R6 | 0.99 | % | 4,028,327 | 119,305 | (922,681 | ) | (443,243 | ) | 114,445 | 61,632 | 249,239 | 2,896,153 | ||||||||||||||||||||||||
Invesco International Select Equity Fund, Class R6 | 1.27 | % | 9,313,876 | 834,350 | (4,239,700 | ) | (705,785 | ) | (1,494,060 | ) | 37,099 | 409,347 | 3,708,681 | |||||||||||||||||||||||
Invesco International Small-Mid Company Fund, Class R6(b) | 1.00 | % | 6,733,606 | 803,628 | (2,735,650 | ) | (1,460,935 | ) | (403,523 | ) | 12,508 | 75,007 | 2,929,006 | |||||||||||||||||||||||
Invesco RAFI™ Strategic Developed ex-US ETF | 1.99 | % | 3,699,040 | 3,934,906 | (1,081,836 | ) | (680,203 | ) | (32,113 | ) | 175,513 | 217,416 | 5,839,794 | |||||||||||||||||||||||
Invesco S&P Emerging Markets Low Volatility ETF | 1.53 | % | – | 5,215,376 | (99,959 | ) | (611,388 | ) | (9,463 | ) | 124,481 | 195,331 | 4,494,566 | |||||||||||||||||||||||
Invesco S&P International Developed Low Volatility ETF | 1.02 | % | 7,543,112 | 240,652 | (4,131,110 | ) | (1,001,309 | ) | 331,599 | 168,798 | 111,387 | 2,982,944 | ||||||||||||||||||||||||
Total Foreign Equity Funds | 73,051,297 | 26,513,510 | (28,731,771 | ) | (13,896,444 | ) | (4,472,373 | ) | 728,197 | 50,366,496 | ||||||||||||||||||||||||||
Money Market Funds–0.22% | ||||||||||||||||||||||||||||||||||||
Invesco Government & Agency Portfolio, Institutional Class, | 0.08 | % | 1,125,363 | 27,709,947 | (28,608,025 | ) | – | – | 4,984 | 227,285 | 227,285 | |||||||||||||||||||||||||
See accompanying Notes to Financial Statements which are an integral part of the financial statements.
| 7 | Invesco Select Risk: Moderately Conservative Investor Fund |
Invesco Select Risk: Moderately Conservative Investor Fund (continued)
Schedule of Investments in Affiliated Issuers–99.95%(a)
% of Net Assets 12/31/22 | Value 12/31/21 | Purchases at Cost | Proceeds from Sales | Change in Unrealized Appreciation (Depreciation) | Realized Gain (Loss) | Dividend Income | Shares 12/31/22 | Value 12/31/22 | ||||||||||||||||||||||||||||
Money Market Funds–(continued) | ||||||||||||||||||||||||||||||||||||
Invesco Liquid Assets Portfolio, Institutional Class, 4.42%(e) | 0.05 | % | $ | 639,870 | $ | 19,792,823 | $ | (20,278,550 | ) | $ | 4 | $ | 733 | $ | 4,399 | 154,834 | $ | 154,880 | ||||||||||||||||||
Invesco Treasury Portfolio, Institutional Class, 4.20%(e) | 0.09 | % | 1,286,129 | 31,668,511 | (32,694,886 | ) | – | – | 6,801 | 259,754 | 259,754 | |||||||||||||||||||||||||
Total Money Market Funds | 3,051,362 | 79,171,281 | (81,581,461 | ) | 4 | 733 | 16,184 | 641,919 | ||||||||||||||||||||||||||||
TOTAL INVESTMENTS IN AFFILIATED ISSUERS (excluding investments purchased with cash collateral from securities on loan) (Cost $314,566,838) | 99.95 | % | 381,885,270 | 172,190,069 | (189,209,789 | ) | (58,325,423 | ) | (11,197,067 | ) | 7,270,346 | 292,807,829 | ||||||||||||||||||||||||
Investments Purchased with Cash Collateral from Securities on Loan | ||||||||||||||||||||||||||||||||||||
Money Market Funds–0.00% | ||||||||||||||||||||||||||||||||||||
Invesco Private Government Fund, 4.28%(e)(f) | – | 1,306,080 | 52,859,588 | (54,165,668 | ) | – | – | 35,251 | (g) | – | – | |||||||||||||||||||||||||
Invesco Private Prime Fund, 4.46%(e)(f) | – | 2,978,648 | 122,990,239 | (125,966,910 | ) | – | (1,977 | ) | 96,172 | (g) | – | – | ||||||||||||||||||||||||
Total Investments Purchased with Cash Collateral from Securities on Loan (Cost $0) | 0.00 | % | 4,284,728 | 175,849,827 | (180,132,578 | ) | – | (1,977 | ) | 131,423 | – | |||||||||||||||||||||||||
TOTAL INVESTMENTS IN AFFILIATED ISSUERS (Cost $314,566,838) | 99.95 | % | $ | 386,169,998 | $ | 348,039,896 | $ | (369,342,367 | ) | $ | (58,325,423 | ) | $ | (11,199,044 | )(h) | $ | 7,401,769 | $ | 292,807,829 | |||||||||||||||||
OTHER ASSETS LESS LIABILITIES | 0.05 | % | 142,774 | |||||||||||||||||||||||||||||||||
NET ASSETS | 100.00 | % | $ | 292,950,603 | ||||||||||||||||||||||||||||||||
Investment Abbreviations:
ETF - Exchange-Traded Fund
Notes to Schedule of Investments:
| (a) | Each underlying fund and the Fund are affiliated by either having the same investment adviser or an investment adviser under common control with the Fund’s investment adviser. |
| (b) | Amounts include a return of capital distribution reclassification which reduces dividend income and increases realized gain (loss) and/or change in unrealized appreciation (depreciation). |
| (c) | Non-income producing security. |
| (d) | Effective February 28, 2022, the underlying fund’s name changed. |
| (e) | The rate shown is the 7-day SEC standardized yield as of December 31, 2022. |
| (f) | The security has been segregated to satisfy the commitment to return the cash collateral received in securities lending transactions upon the borrower’s return of the securities loaned. See Note 1H. |
| (g) | Represents the income earned on the investment of cash collateral, which is included in securities lending income on the Statement of Operations. Does not include rebates and fees paid to lending agent or premiums received from borrowers, if any. |
| (h) | Includes capital gains distributions from affiliated underlying funds as follows: |
| Fund Name | Capital Gain | |||
Invesco Global Fund | $ | 2,089,603 | ||
Invesco International Small-Mid Company Fund | 8,120 | |||
See accompanying Notes to Financial Statements which are an integral part of the financial statements.
| 8 | Invesco Select Risk: Moderately Conservative Investor Fund |
Statement of Assets and Liabilities
December 31, 2022
Assets: | ||||
Investments in affiliated underlying funds, at value (Cost $314,566,838) | $ | 292,807,829 | ||
| ||||
Cash | 4,502 | |||
| ||||
Receivable for: | ||||
Investments sold - affiliated underlying funds | 882,659 | |||
| ||||
Fund shares sold | 309,322 | |||
| ||||
Dividends - affiliated underlying funds | 450,671 | |||
| ||||
Investment for trustee deferred compensation and retirement plans | 44,349 | |||
| ||||
Other assets | 42,106 | |||
| ||||
Total assets | 294,541,438 | |||
| ||||
Liabilities: | ||||
Payable for: | ||||
Investments purchased - affiliated underlying funds | 441,474 | |||
| ||||
Fund shares reacquired | 906,444 | |||
| ||||
Accrued fees to affiliates | 143,406 | |||
| ||||
Accrued trustees’ and officers’ fees and benefits | 3,136 | |||
| ||||
Accrued other operating expenses | 45,232 | |||
| ||||
Trustee deferred compensation and retirement plans | 51,143 | |||
| ||||
Total liabilities | 1,590,835 | |||
| ||||
Net assets applicable to shares outstanding | $ | 292,950,603 | ||
| ||||
Net assets consist of: | ||||
Shares of beneficial interest | $ | 328,564,348 | ||
| ||||
Distributable earnings (loss) | (35,613,745 | ) | ||
| ||||
| $ | 292,950,603 | |||
| ||||
Net Assets: | ||||
Class A | $ | 248,676,878 | ||
| ||||
Class C | $ | 16,083,594 | ||
| ||||
Class R | $ | 8,954,951 | ||
| ||||
Class S | $ | 1,567,148 | ||
| ||||
Class Y | $ | 17,526,154 | ||
| ||||
Class R5 | $ | 96,181 | ||
| ||||
Class R6 | $ | 45,697 | ||
| ||||
Shares outstanding, no par value, with an unlimited number of shares authorized: |
| |||
Class A | 26,143,109 | |||
| ||||
Class C | 1,711,694 | |||
| ||||
Class R | 945,713 | |||
| ||||
Class S | 164,540 | |||
| ||||
Class Y | 1,845,668 | |||
| ||||
Class R5 | 10,065 | |||
| ||||
Class R6 | 4,782 | |||
| ||||
Class A: | ||||
Net asset value per share | $ | 9.51 | ||
| ||||
Maximum offering price per share | $ | 10.06 | ||
| ||||
Class C: |
| |||
Net asset value and offering price per share | $ | 9.40 | ||
| ||||
Class R: |
| |||
Net asset value and offering price per share | $ | 9.47 | ||
| ||||
Class S: |
| |||
Net asset value and offering price per share | $ | 9.52 | ||
| ||||
Class Y: |
| |||
Net asset value and offering price per share | $ | 9.50 | ||
| ||||
Class R5: |
| |||
Net asset value and offering price per share | $ | 9.56 | ||
| ||||
Class R6: |
| |||
Net asset value and offering price per share | $ | 9.56 | ||
| ||||
See accompanying Notes to Financial Statements which are an integral part of the financial statements.
| 9 | Invesco Select Risk: Moderately Conservative Investor Fund |
Statement of Operations
For the year ended December 31, 2022
Investment income: | ||||
Dividends from affiliated underlying funds (includes net securities lending income of $59,626) | $ | 7,329,972 | ||
| ||||
Interest | 53,487 | |||
| ||||
Total investment income | 7,383,459 | |||
| ||||
Expenses: | ||||
Administrative services fees | 48,114 | |||
| ||||
Custodian fees | 4,472 | |||
| ||||
Distribution fees: | ||||
Class A | 692,388 | |||
| ||||
Class C | 191,252 | |||
| ||||
Class R | 42,885 | |||
| ||||
Class S | 2,565 | |||
| ||||
Transfer agent fees – A, C, R, S and Y | 400,041 | |||
| ||||
Transfer agent fees – R5 | 44 | |||
| ||||
Transfer agent fees – R6 | 15 | |||
| ||||
Trustees’ and officers’ fees and benefits | 19,750 | |||
| ||||
Registration and filing fees | 96,100 | |||
| ||||
Reports to shareholders | 14,999 | |||
| ||||
Professional services fees | 33,451 | |||
| ||||
Other | 18,761 | |||
| ||||
Total expenses | 1,564,837 | |||
| ||||
Less: Expense offset arrangement(s) | (2,245 | ) | ||
| ||||
Net expenses | 1,562,592 | |||
| ||||
Net investment income | 5,820,867 | |||
| ||||
Realized and unrealized gain (loss) from: | ||||
Net realized gain (loss) from: | ||||
Affiliated underlying fund shares | (13,296,767 | ) | ||
| ||||
Capital gain distributions from affiliated underlying fund shares | 2,097,723 | |||
| ||||
| (11,199,044 | ) | |||
| ||||
Change in net unrealized appreciation (depreciation) of affiliated underlying fund shares | (58,325,423 | ) | ||
| ||||
Net realized and unrealized gain (loss) | (69,524,467 | ) | ||
| ||||
Net increase (decrease) in net assets resulting from operations | $ | (63,703,600 | ) | |
| ||||
See accompanying Notes to Financial Statements which are an integral part of the financial statements.
| 10 | Invesco Select Risk: Moderately Conservative Investor Fund |
Statement of Changes in Net Assets
For the years ended December 31, 2022 and 2021
| 2022 | 2021 | |||||||
| ||||||||
Operations: | ||||||||
Net investment income | $ | 5,820,867 | $ | 4,405,432 | ||||
| ||||||||
Net realized gain (loss) | (11,199,044 | ) | 19,137,130 | |||||
| ||||||||
Change in net unrealized appreciation (depreciation) | (58,325,423 | ) | 1,848,210 | |||||
| ||||||||
Net increase (decrease) in net assets resulting from operations | (63,703,600 | ) | 25,390,772 | |||||
| ||||||||
Distributions to shareholders from distributable earnings: | ||||||||
Class A | (11,115,426 | ) | (15,934,233 | ) | ||||
| ||||||||
Class C | (608,915 | ) | (1,040,411 | ) | ||||
| ||||||||
Class R | (356,214 | ) | (452,945 | ) | ||||
| ||||||||
Class S | (70,925 | ) | (101,131 | ) | ||||
| ||||||||
Class Y | (846,632 | ) | (630,289 | ) | ||||
| ||||||||
Class R5 | (4,459 | ) | (5,184 | ) | ||||
| ||||||||
Class R6 | (1,871 | ) | (1,886 | ) | ||||
| ||||||||
Total distributions from distributable earnings | (13,004,442 | ) | (18,166,079 | ) | ||||
| ||||||||
Return of capital: | ||||||||
Class A | (178,713 | ) | - | |||||
| ||||||||
Class C | (7,293 | ) | - | |||||
| ||||||||
Class R | (4,918 | ) | - | |||||
| ||||||||
Class S | (1,166 | ) | - | |||||
| ||||||||
Class Y | (14,568 | ) | - | |||||
| ||||||||
Class R5 | (76 | ) | - | |||||
| ||||||||
Class R6 | (27 | ) | - | |||||
| ||||||||
Total return of capital | �� | (206,761 | ) | - | ||||
| ||||||||
Total distributions | (13,211,203 | ) | (18,166,079 | ) | ||||
| ||||||||
Share transactions–net: | ||||||||
Class A | (17,524,674 | ) | 25,701,760 | |||||
| ||||||||
Class C | (3,969,209 | ) | (3,419,010 | ) | ||||
| ||||||||
Class R | 1,003,513 | 1,979,083 | ||||||
| ||||||||
Class S | (39,358 | ) | (49,735 | ) | ||||
| ||||||||
Class Y | 9,072,926 | 1,775,486 | ||||||
| ||||||||
Class R5 | 9,458 | 99,654 | ||||||
| ||||||||
Class R6 | 11,888 | 28,671 | ||||||
| ||||||||
Net increase (decrease) in net assets resulting from share transactions | (11,435,456 | ) | 26,115,909 | |||||
| ||||||||
Net increase (decrease) in net assets | (88,350,259 | ) | 33,340,602 | |||||
| ||||||||
Net assets: | ||||||||
Beginning of year | 381,300,862 | 347,960,260 | ||||||
| ||||||||
End of year | $ | 292,950,603 | $ | 381,300,862 | ||||
| ||||||||
See accompanying Notes to Financial Statements which are an integral part of the financial statements.
| 11 | Invesco Select Risk: Moderately Conservative Investor Fund |
The following schedule presents financial highlights for a share of the Fund outstanding throughout the periods indicated.
Net asset value, beginning of period | Net investment income(a)(b) | Net gains (losses) on securities (both realized and unrealized) | Total from investment operations | Dividends from net investment income | Distributions from net realized gains | Return of capital | Total distributions | Net asset value, end of period | Total return (c) | Net assets, end of period (000’s omitted) | Ratio of expenses to average net assets with fee waivers and/or expenses absorbed(d) | Ratio of expenses to average net assets without fee waivers and/or expenses absorbed | Ratio of net investment income to average net assets(b) | Portfolio turnover (e) | ||||||||||||||||||||||||||||||||||||||||||||||
Class A | ||||||||||||||||||||||||||||||||||||||||||||||||||||||||||||
Year ended 12/31/22 | $11.93 | $0.19 | $(2.18 | ) | $(1.99 | ) | $(0.18 | ) | $(0.24 | ) | $(0.01 | ) | $(0.43 | ) | $ 9.51 | (16.69 | )% | $248,677 | 0.44 | % | 0.44 | % | 1.83 | % | 29 | % | ||||||||||||||||||||||||||||||||||
Year ended 12/31/21 | 11.69 | 0.15 | 0.69 | 0.84 | (0.23 | ) | (0.37 | ) | – | (0.60 | ) | 11.93 | 7.26 | 331,992 | 0.44 | 0.44 | 1.25 | 28 | ||||||||||||||||||||||||||||||||||||||||||
Year ended 12/31/20 | 11.47 | 0.20 | 0.94 | 1.14 | (0.27 | ) | (0.65 | ) | – | (0.92 | ) | 11.69 | 10.23 | 300,116 | 0.47 | 0.47 | 1.81 | 86 | ||||||||||||||||||||||||||||||||||||||||||
Year ended 12/31/19 | 10.68 | 0.35 | 1.18 | 1.53 | (0.35 | ) | (0.39 | ) | – | (0.74 | ) | 11.47 | 14.39 | 257,703 | 0.48 | 0.48 | 3.01 | 28 | ||||||||||||||||||||||||||||||||||||||||||
Year ended 12/31/18 | 11.63 | 0.28 | (0.80 | ) | (0.52 | ) | (0.28 | ) | (0.15 | ) | – | (0.43 | ) | 10.68 | (4.50 | ) | 210,248 | 0.50 | 0.50 | 2.43 | 23 | |||||||||||||||||||||||||||||||||||||||
Class C | ||||||||||||||||||||||||||||||||||||||||||||||||||||||||||||
Year ended 12/31/22 | 11.79 | 0.11 | (2.15 | ) | (2.04 | ) | (0.11 | ) | (0.24 | ) | – | (0.35 | ) | 9.40 | (17.29 | ) | 16,084 | 1.19 | 1.19 | 1.08 | 29 | |||||||||||||||||||||||||||||||||||||||
Year ended 12/31/21 | 11.55 | 0.06 | 0.68 | 0.74 | (0.13 | ) | (0.37 | ) | – | (0.50 | ) | 11.79 | 6.53 | 24,758 | 1.19 | 1.19 | 0.50 | 28 | ||||||||||||||||||||||||||||||||||||||||||
Year ended 12/31/20 | 11.34 | 0.12 | 0.92 | 1.04 | (0.18 | ) | (0.65 | ) | – | (0.83 | ) | 11.55 | 9.40 | 27,569 | 1.22 | 1.22 | 1.06 | 86 | ||||||||||||||||||||||||||||||||||||||||||
Year ended 12/31/19 | 10.57 | 0.26 | 1.16 | 1.42 | (0.26 | ) | (0.39 | ) | – | (0.65 | ) | 11.34 | 13.45 | 33,282 | 1.23 | 1.23 | 2.26 | 28 | ||||||||||||||||||||||||||||||||||||||||||
Year ended 12/31/18 | 11.51 | 0.19 | (0.79 | ) | (0.60 | ) | (0.19 | ) | (0.15 | ) | – | (0.34 | ) | 10.57 | (5.21 | ) | 57,060 | 1.25 | 1.25 | 1.68 | 23 | |||||||||||||||||||||||||||||||||||||||
Class R | ||||||||||||||||||||||||||||||||||||||||||||||||||||||||||||
Year ended 12/31/22 | 11.88 | 0.16 | (2.16 | ) | (2.00 | ) | (0.16 | ) | (0.24 | ) | (0.01 | ) | (0.41 | ) | 9.47 | (16.90 | ) | 8,955 | 0.69 | 0.69 | 1.58 | 29 | ||||||||||||||||||||||||||||||||||||||
Year ended 12/31/21 | 11.64 | 0.12 | 0.69 | 0.81 | (0.20 | ) | (0.37 | ) | – | (0.57 | ) | 11.88 | 7.02 | 10,020 | 0.69 | 0.69 | 1.00 | 28 | ||||||||||||||||||||||||||||||||||||||||||
Year ended 12/31/20 | 11.42 | 0.18 | 0.93 | 1.11 | (0.24 | ) | (0.65 | ) | – | (0.89 | ) | 11.64 | 9.99 | 7,877 | 0.72 | 0.72 | 1.56 | 86 | ||||||||||||||||||||||||||||||||||||||||||
Year ended 12/31/19 | 10.64 | 0.32 | 1.17 | 1.49 | (0.32 | ) | (0.39 | ) | – | (0.71 | ) | 11.42 | 14.05 | 7,777 | 0.73 | 0.73 | 2.76 | 28 | ||||||||||||||||||||||||||||||||||||||||||
Year ended 12/31/18 | 11.58 | 0.25 | (0.79 | ) | (0.54 | ) | (0.25 | ) | (0.15 | ) | – | (0.40 | ) | 10.64 | (4.68 | ) | 7,410 | 0.75 | 0.75 | 2.18 | 23 | |||||||||||||||||||||||||||||||||||||||
Class S | ||||||||||||||||||||||||||||||||||||||||||||||||||||||||||||
Year ended 12/31/22 | 11.95 | 0.20 | (2.19 | ) | (1.99 | ) | (0.19 | ) | (0.24 | ) | (0.01 | ) | (0.44 | ) | 9.52 | (16.66 | ) | 1,567 | 0.34 | 0.34 | 1.93 | 29 | ||||||||||||||||||||||||||||||||||||||
Year ended 12/31/21 | 11.70 | 0.16 | 0.70 | 0.86 | (0.24 | ) | (0.37 | ) | – | (0.61 | ) | 11.95 | 7.46 | 2,009 | 0.34 | 0.34 | 1.35 | 28 | ||||||||||||||||||||||||||||||||||||||||||
Year ended 12/31/20 | 11.48 | 0.22 | 0.93 | 1.15 | (0.28 | ) | (0.65 | ) | – | (0.93 | ) | 11.70 | 10.33 | 2,012 | 0.37 | 0.37 | 1.91 | 86 | ||||||||||||||||||||||||||||||||||||||||||
Year ended 12/31/19 | 10.70 | 0.36 | 1.17 | 1.53 | (0.36 | ) | (0.39 | ) | – | (0.75 | ) | 11.48 | 14.39 | 1,877 | 0.38 | 0.38 | 3.11 | 28 | ||||||||||||||||||||||||||||||||||||||||||
Year ended 12/31/18 | 11.64 | 0.29 | (0.79 | ) | (0.50 | ) | (0.29 | ) | (0.15 | ) | – | (0.44 | ) | 10.70 | (4.31 | ) | 1,814 | 0.40 | 0.40 | 2.53 | 23 | |||||||||||||||||||||||||||||||||||||||
Class Y | ||||||||||||||||||||||||||||||||||||||||||||||||||||||||||||
Year ended 12/31/22 | 11.92 | 0.21 | (2.17 | ) | (1.96 | ) | (0.21 | ) | (0.24 | ) | (0.01 | ) | (0.46 | ) | 9.50 | (16.49 | ) | 17,526 | 0.19 | 0.19 | 2.08 | 29 | ||||||||||||||||||||||||||||||||||||||
Year ended 12/31/21 | 11.67 | 0.18 | 0.70 | 0.88 | (0.26 | ) | (0.37 | ) | – | (0.63 | ) | 11.92 | 7.63 | 12,372 | 0.19 | 0.19 | 1.50 | 28 | ||||||||||||||||||||||||||||||||||||||||||
Year ended 12/31/20 | 11.45 | 0.23 | 0.93 | 1.16 | (0.29 | ) | (0.65 | ) | – | (0.94 | ) | 11.67 | 10.52 | 10,363 | 0.22 | 0.22 | 2.06 | 86 | ||||||||||||||||||||||||||||||||||||||||||
Year ended 12/31/19 | 10.67 | 0.37 | 1.18 | 1.55 | (0.38 | ) | (0.39 | ) | – | (0.77 | ) | 11.45 | 14.59 | 9,457 | 0.23 | 0.23 | 3.26 | 28 | ||||||||||||||||||||||||||||||||||||||||||
Year ended 12/31/18 | 11.62 | 0.31 | (0.80 | ) | (0.49 | ) | (0.31 | ) | (0.15 | ) | – | (0.46 | ) | 10.67 | (4.27 | ) | 6,268 | 0.25 | 0.25 | 2.68 | 23 | |||||||||||||||||||||||||||||||||||||||
Class R5 | ||||||||||||||||||||||||||||||||||||||||||||||||||||||||||||
Year ended 12/31/22 | 11.99 | 0.22 | (2.18 | ) | (1.96 | ) | (0.22 | ) | (0.24 | ) | (0.01 | ) | (0.47 | ) | 9.56 | (16.40 | ) | 96 | 0.12 | 0.12 | 2.15 | 29 | ||||||||||||||||||||||||||||||||||||||
Year ended 12/31/21 | 11.74 | 0.19 | 0.69 | 0.88 | (0.26 | ) | (0.37 | ) | – | (0.63 | ) | 11.99 | 7.65 | 109 | 0.15 | 0.15 | 1.54 | 28 | ||||||||||||||||||||||||||||||||||||||||||
Year ended 12/31/20 | 11.52 | 0.24 | 0.93 | 1.17 | (0.30 | ) | (0.65 | ) | – | (0.95 | ) | 11.74 | 10.51 | 11 | 0.19 | 0.19 | 2.09 | 86 | ||||||||||||||||||||||||||||||||||||||||||
Year ended 12/31/19 | 10.73 | 0.38 | 1.18 | 1.56 | (0.38 | ) | (0.39 | ) | – | (0.77 | ) | 11.52 | 14.69 | 11 | 0.19 | 0.20 | 3.30 | 28 | ||||||||||||||||||||||||||||||||||||||||||
Year ended 12/31/18 | 11.68 | 0.31 | (0.80 | ) | (0.49 | ) | (0.31 | ) | (0.15 | ) | – | (0.46 | ) | 10.73 | (4.18 | ) | 10 | 0.21 | 0.21 | 2.72 | 23 | |||||||||||||||||||||||||||||||||||||||
Class R6 | ||||||||||||||||||||||||||||||||||||||||||||||||||||||||||||
Year ended 12/31/22 | 11.98 | 0.22 | (2.17 | ) | (1.95 | ) | (0.22 | ) | (0.24 | ) | (0.01 | ) | (0.47 | ) | 9.56 | (16.33 | ) | 46 | 0.12 | 0.12 | 2.15 | 29 | ||||||||||||||||||||||||||||||||||||||
Year ended 12/31/21 | 11.74 | 0.19 | 0.68 | 0.87 | (0.26 | ) | (0.37 | ) | – | (0.63 | ) | 11.98 | 7.56 | 41 | 0.15 | 0.15 | 1.54 | 28 | ||||||||||||||||||||||||||||||||||||||||||
Year ended 12/31/20 | 11.52 | 0.24 | 0.93 | 1.17 | (0.30 | ) | (0.65 | ) | – | (0.95 | ) | 11.74 | 10.51 | 12 | 0.19 | 0.19 | 2.09 | 86 | ||||||||||||||||||||||||||||||||||||||||||
Year ended 12/31/19 | 10.73 | 0.38 | 1.18 | 1.56 | (0.38 | ) | (0.39 | ) | – | (0.77 | ) | 11.52 | 14.69 | 10 | 0.19 | 0.20 | 3.30 | 28 | ||||||||||||||||||||||||||||||||||||||||||
Year ended 12/31/18 | 11.67 | 0.31 | (0.79 | ) | (0.48 | ) | (0.31 | ) | (0.15 | ) | – | (0.46 | ) | 10.73 | (4.10 | ) | 9 | 0.21 | 0.21 | 2.72 | 23 | |||||||||||||||||||||||||||||||||||||||
| (a) | Calculated using average shares outstanding. |
| (b) | Net investment income (loss) is affected by the timing of the declaration of dividends by the underlying funds in which the Fund invests. Ratio of net investment income (loss) does not include net investment income of the underlying funds in which the Fund invests. |
| (c) | Includes adjustments in accordance with accounting principles generally accepted in the United States of America and as such, the net asset value for financial reporting purposes and the returns based upon those net asset values may differ from the net asset value and returns for shareholder transactions. Does not include sales charges and is not annualized for periods less than one year, if applicable. |
| (d) | In addition to the fees and expenses which the Fund bears directly, the Fund indirectly bears a pro rata share of the fees and expenses of the underlying funds in which the Fund invests. Because the underlying funds have varied expenses and fee levels and the Fund may own different proportions at different times, the amount of fees and expenses incurred indirectly by the Fund will vary. Estimated underlying fund expenses are not expenses that are incurred directly by the Fund. They are expenses that are incurred directly by the underlying funds and are deducted from the value of the funds the Fund invests in. The effect of the estimated underlying fund expenses that the Fund bears indirectly is included in the Fund’s total return. Estimated acquired fund fees from underlying funds 0.45%, 0.49%, 0.51%, 0.51% and 0.53% for the years ended December 31, 2022, 2021, 2020, 2019, and 2018, respectively. |
| (e) | Portfolio turnover is calculated at the fund level and is not annualized for periods less than one year, if applicable. |
See accompanying Notes to Financial Statements which are an integral part of the financial statements.
| 12 | Invesco Select Risk: Moderately Conservative Investor Fund |
December 31, 2022
NOTE 1–Significant Accounting Policies
Invesco Select Risk: Moderately Conservative Investor Fund (the “Fund”) is a series portfolio of AIM Growth Series (Invesco Growth Series) (the “Trust”). The Trust is a Delaware statutory trust registered under the Investment Company Act of 1940, as amended (the “1940 Act”), as an open-end series management investment company authorized to issue an unlimited number of shares of beneficial interest. Information presented in these financial statements pertains only to the Fund. Matters affecting the Fund or each class will be voted on exclusively by the shareholders of the Fund or each class.
The Fund’s investment objective is total return consistent with a lower level of risk relative to the broad stock market.
The Fund is a “fund of funds”, in that it invests in other mutual funds (“underlying funds”) advised by Invesco Advisers, Inc. (the “Adviser” or “Invesco”) and exchange-traded funds advised by Invesco Capital Management LLC (“Invesco Capital”), an affiliate of Invesco, or other unaffiliated advisers. The Adviser may change the Fund’s asset class allocations, the underlying funds or the target weightings in the underlying funds without shareholder approval. The underlying funds may engage in a number of investment techniques and practices, which involve certain risks. Each underlying fund’s accounting policies are outlined in the underlying fund’s financial statements and are publicly available.
The Fund currently consists of seven different classes of shares: Class A, Class C, Class R, Class S, Class Y, Class R5 and Class R6. Class Y shares are available only to certain investors. Class A shares are sold with a front-end sales charge unless certain waiver criteria are met. Under certain circumstances, load waived shares may be subject to contingent deferred sales charges (“CDSC”). Class C shares are sold with a CDSC. Class R, Class S, Class Y, Class R5 and Class R6 shares are sold at net asset value. Class C shares held for eight years after purchase are eligible for automatic conversion into Class A shares of the same Fund (the “Conversion Feature”). The automatic conversion pursuant to the Conversion Feature will generally occur at the end of the month following the eighth anniversary after a purchase of Class C shares.
The Fund is an investment company and accordingly follows the investment company accounting and reporting guidance in accordance with Financial Accounting Standards Board Accounting Standards Codification Topic 946, Financial Services – Investment Companies.
The following is a summary of the significant accounting policies followed by the Fund in the preparation of its financial statements.
| A. | Security Valuations - Securities of investment companies listed or traded on an exchange are generally valued at the trade price or official closing price that day as of the close of the exchange where the security is principally traded, or lacking any trades or official closing price on a particular day, the security may be valued at the closing bid price on that day. Securities of investment companies that are not exchange-traded (e.g., open-end mutual funds) are valued using such company’s end-of-business-day net asset value per share. Securities in the underlying funds, including restricted securities, are valued in accordance with the valuation policy of such fund. The policies of the underlying funds affiliated with the Fund, as a result of having the same investment adviser, are set forth below. |
A security listed or traded on an exchange is generally valued at its trade price or official closing price that day as of the close of the exchange where the security is principally traded, or lacking any trades or official closing price on a particular day, the security may be valued at the closing bid price on that day. Securities traded in the over-the-counter market are valued based on prices furnished by independent pricing services or market makers. When such securities are valued using prices provided by an independent pricing service they may be considered fair valued. Futures contracts are valued at the daily settlement price set by an exchange on which they are principally traded. U.S. exchange-traded options are valued at the mean between the last bid and asked prices from the exchange on which they are principally traded. Non-U.S. exchange-traded options are valued at the final settlement price set by the exchange on which they trade. Options not listed on an exchange and swaps generally are valued using pricing provided from independent pricing services.
Variable rate senior loan interests are fair valued using quotes provided by an independent pricing service. Quotes provided by the pricing service may reflect appropriate factors such as ratings, tranche type, industry, company performance, spread, individual trading characteristics, institution-size trading in similar groups of securities and other market data.
Securities of investment companies that are not exchange-traded (e.g., open-end mutual funds) are valued using such company’s end-of-business-day net asset value per share.
Deposits, other obligations of U.S. and non-U.S. banks and financial institutions are valued at their daily account value.
Fixed income securities (including convertible debt securities) generally are valued on the basis of prices provided by independent pricing services. Prices provided by the pricing service may be determined without exclusive reliance on quoted prices, and may reflect appropriate factors such as institution-size trading in similar groups of securities, developments related to specific securities, dividend rate (for unlisted equities), yield (for debt obligations), quality, type of issue, coupon rate (for debt obligations), maturity (for debt obligations), individual trading characteristics and other market data. Pricing services generally value debt obligations assuming orderly transactions of institutional round lot size, but a fund may hold or transact in the same securities in smaller, odd lot sizes. Odd lots often trade at lower prices than institutional round lots, and their value may be adjusted accordingly. Debt obligations are subject to interest rate and credit risks. In addition, all debt obligations involve some risk of default with respect to interest and/or principal payments.
Swap agreements are fair valued using an evaluated quote, if available, provided by an independent pricing service. Evaluated quotes provided by the pricing service are valued based on a model which may include end-of-day net present values, spreads, ratings, industry, company performance and returns of referenced assets. Centrally cleared swap agreements are valued at the daily settlement price determined by the relevant exchange or clearinghouse.
Foreign securities’ (including foreign exchange contracts) prices are converted into U.S. dollar amounts using the applicable exchange rates as of the close of the New York Stock Exchange (“NYSE”). If market quotations are available and reliable for foreign exchange-traded equity securities, the securities will be valued at the market quotations. The Adviser may use various pricing services to obtain market quotations as well as fair value prices. Because trading hours for certain foreign securities end before the close of the NYSE, closing market quotations may become not representative of market value in the Adviser’s judgment (“unreliable”). If, between the time trading ends on a particular security and the close of the customary trading session on the NYSE, a significant event occurs that makes the closing price of the security unreliable, the Adviser may fair value the security. If the event is likely to have affected the closing price of the security, the security will be valued at fair value in good faith in accordance with Board- approved policies and related Adviser procedures (“Valuation Procedures”). Adjustments to closing prices to reflect fair value may also be based on a screening process of an independent pricing service to indicate the degree of certainty, based on historical data, that the closing price in the principal market where a foreign security trades is not the current value as of the close of the NYSE. Foreign securities’ prices meeting the degree of certainty that the price is not reflective of current value will be priced at the indication of fair value from the independent pricing service. Multiple factors may be considered by the independent pricing service in determining adjustments to reflect fair value and may include information relating to sector indices, American Depositary Receipts and domestic and foreign index futures. Foreign securities may have additional risks including exchange rate changes, potential for sharply devalued currencies and high inflation, political and economic upheaval, the relative lack of issuer information, relatively low market liquidity and the potential lack of strict financial and accounting controls and standards.
Unlisted securities will be valued using prices provided by independent pricing services or by another method that the Adviser, in its judgment, believes better reflects the security’s fair value in accordance with the Valuation Procedures.
Securities for which market prices are not provided by any of the above methods may be valued based upon quotes furnished by independent sources. The last bid price may be used to value equity securities. The mean between the last bid and asked prices may be used to value debt obligations, including corporate loans.
| 13 | Invesco Select Risk: Moderately Conservative Investor Fund |
Securities for which market quotations are not readily available are fair valued by the Adviser in accordance with the Valuation Procedures. If a fair value price provided by a pricing service is unreliable, the Adviser will fair value the security using the Valuation Procedures. Issuer specific events, market trends, bid/asked quotes of brokers and information providers and other market data may be reviewed in the course of making a good faith determination of a security’s fair value.
The Fund may invest in securities that are subject to interest rate risk, meaning the risk that the prices will generally fall as interest rates rise and, conversely, the prices will generally rise as interest rates fall. Specific securities differ in their sensitivity to changes in interest rates depending on their individual characteristics. Changes in interest rates may result in increased market volatility, which may affect the value and/or liquidity of certain Fund investments.
Valuations change in response to many factors including the historical and prospective earnings of the issuer, the value of the issuer’s assets, general market conditions which are not specifically related to the particular issuer, such as real or perceived adverse economic conditions, changes in the general outlook for revenues or corporate earnings, changes in interest or currency rates, regional or global instability, natural or environmental disasters, widespread disease or other public health issues, war, acts of terrorism, significant governmental actions or adverse investor sentiment generally and market liquidity. Because of the inherent uncertainties of valuation, the values reflected in the financial statements may materially differ from the value received upon actual sale of those investments.
The price the Fund could receive upon the sale of any investment may differ from the Adviser’s valuation of the investment, particularly for securities that are valued using a fair valuation technique. When fair valuation techniques are applied, the Adviser uses available information, including both observable and unobservable inputs and assumptions, to determine a methodology that will result in a valuation that the Adviser believes approximates market value. Fund securities that are fair valued may be subject to greater fluctuation in their value from one day to the next than would be the case if market quotations were used. Because of the inherent uncertainties of valuation, and the degree of subjectivity in such decisions, the Fund could realize a greater or lesser than expected gain or loss upon the sale of the investment.
| B. | Securities Transactions and Investment Income - Securities transactions are accounted for on a trade date basis. Realized gains or losses on sales are computed on the basis of specific identification of the securities sold. Distributions from ordinary income from underlying funds, if any, are recorded as dividend income on the ex-dividend date. Distributions from gains from underlying funds, if any, are recorded as realized gains on the ex-dividend date. The following policies are followed by the underlying funds: Interest income (net of withholding tax, if any) is recorded on an accrual basis from settlement date and includes coupon interest and amortization of premium and accretion of discount on debt securities as applicable. Pay-in-kind interest income and non-cash dividend income received in the form of securities in-lieu of cash are recorded at the fair value of the securities received. Paydown gains and losses on mortgage and asset-backed securities are recorded as adjustments to interest income. |
The Fund may periodically participate in litigation related to the Fund’s investments. As such, the Fund may receive proceeds from litigation settlements. Any proceeds received are included in the Statement of Operations as realized gain (loss) for investments no longer held and as unrealized gain (loss) for investments still held.
The Fund allocates income and realized and unrealized capital gains and losses to a class based on the relative net assets of each class.
| C. | Distributions - Distributions from net investment income, if any, are declared and paid quarterly and are recorded on the ex-dividend date. Distributions from net realized capital gain, if any, are generally declared and paid annually and recorded on the ex-dividend date. The Fund may elect to treat a portion of the proceeds from redemptions as distributions for federal income tax purposes. |
| D. | Federal Income Taxes - The Fund intends to comply with the requirements of Subchapter M of the Internal Revenue Code of 1986, as amended (the “Internal Revenue Code”), necessary to qualify as a regulated investment company and to distribute substantially all of the Fund’s taxable earnings to shareholders. As such, the Fund will not be subject to federal income taxes on otherwise taxable income (including net realized capital gain) that is distributed to shareholders. Therefore, no provision for federal income taxes is recorded in the financial statements. |
The Fund recognizes the tax benefits of uncertain tax positions only when the position is more likely than not to be sustained. Management has analyzed the Fund’s uncertain tax positions and concluded that no liability for unrecognized tax benefits should be recorded related to uncertain tax positions. Management is not aware of any tax positions for which it is reasonably possible that the total amounts of unrecognized tax benefits will change materially in the next 12 months.
The Fund files tax returns in the U.S. Federal jurisdiction and certain other jurisdictions. Generally, the Fund is subject to examinations by such taxing authorities for up to three years after the filing of the return for the tax period.
| E. | Expenses - Expenses included in the accompanying financial statements reflect the expenses of the Fund and do not include any expenses of the underlying funds. The effects of the underlying funds expenses are included in the realized and unrealized gain/loss on the investments in the underlying funds. Estimated expenses of the underlying funds are discussed further within the Financial Highlights. |
Fees provided for under the Rule 12b-1 plan of a particular class of the Fund and which are directly attributable to that class are charged to the operations of such class. Transfer agency fees and expenses and other shareholder recordkeeping fees and expenses attributable to Class R5 and Class R6 are allocated based on relative net assets of Class R5 and Class R6. Transfer agency fees and expenses and other shareholder recordkeeping fees and expenses relating to all other classes are allocated among those classes based on relative net assets. All other expenses are allocated among the classes based on relative net assets.
| F. | Accounting Estimates - The preparation of financial statements in conformity with accounting principles generally accepted in the United States of America (“GAAP”) requires management to make estimates and assumptions that affect the reported amounts of assets and liabilities at the date of the financial statements and the reported amounts of revenues and expenses during the reporting period including estimates and assumptions related to taxation. Actual results could differ from those estimates by a significant amount. In addition, the Fund monitors for material events or transactions that may occur or become known after the period-end date and before the date the financial statements are released to print. |
| G. | Indemnifications - Under the Trust’s organizational documents, each Trustee, officer, employee or other agent of the Trust is indemnified against certain liabilities that may arise out of the performance of their duties to the Fund. Additionally, in the normal course of business, the Fund enters into contracts, including the Fund’s servicing agreements, that contain a variety of indemnification clauses. The Fund’s maximum exposure under these arrangements is unknown as this would involve future claims that may be made against the Fund that have not yet occurred. The risk of material loss as a result of such indemnification claims is considered remote. |
| H. | Securities Lending - The Fund may lend portfolio securities having a market value up to one-third of the Fund’s total assets. Such loans are secured by collateral equal to no less than the market value of the loaned securities determined daily by the securities lending provider. Such collateral will be cash or debt securities issued or guaranteed by the U.S. Government or any of its sponsored agencies. Cash collateral received in connection with these loans is invested in short-term money market instruments or affiliated, unregistered investment companies that comply with Rule 2a-7 under the 1940 Act and money market funds (collectively, “affiliated money market funds”) and is shown as such on the Schedule of Investments. The Fund bears the risk of loss with respect to the investment of collateral. It is the Fund’s policy to obtain additional collateral from or return excess collateral to the borrower by the end of the next business day, following the valuation date of the securities loaned. Therefore, the value of the collateral held may be temporarily less than the value of the securities on loan. When loaning securities, the Fund retains certain benefits of owning the securities, including the economic equivalent of dividends or interest generated by the security. Lending securities entails a risk of loss to the Fund if, and to the extent that, the market value of the securities loaned were to increase and the borrower did not increase the collateral accordingly, and the borrower failed to return the securities. The securities loaned are subject to termination at the option of the borrower or the Fund. Upon termination, the borrower will return to the Fund the securities loaned and the Fund will return the collateral. Upon the failure of the borrower to return the securities, collateral may be liquidated and the securities may be purchased on the open market to replace the loaned securities. The Fund could experience delays and costs in gaining access to the collateral and the securities may lose value during the delay which could result in potential losses to the Fund. Some of these losses may be indemnified by the lending agent. The Fund bears the risk of any deficiency in the amount of the collateral available for |
| 14 | Invesco Select Risk: Moderately Conservative Investor Fund |
| return to the borrower due to any loss on the collateral invested. Dividends received on cash collateral investments for securities lending transactions, which are net of compensation to counterparties, are included in Dividends from affiliated underlying funds on the Statement of Operations. The aggregate value of securities out on loan, if any, is shown as a footnote on the Statement of Assets and Liabilities. |
The Adviser serves as an affiliated securities lending agent for the Fund. The Bank of New York Mellon also serves as a lending agent. To the extent the Fund utilizes the Adviser as an affiliated securities lending agent, the Fund conducts its securities lending in accordance with, and in reliance upon, no-action letters issued by the SEC staff that provide guidance on how an affiliate may act as a direct agent lender and receive compensation for those services in a manner consistent with the federal securities laws. For the year ended December 31, 2022, the Fund paid the Adviser $770 in fees for securities lending agent services. Fees paid to the Adviser for securities lending agent services, if any, are included in Dividends from affiliated underlying funds on the Statement of Operations.
| I. | Other Risks - Certain of the underlying funds are non-diversified and can invest a greater portion of their assets in the obligations or securities of a small number of issuers or any single issuer than a diversified fund can. A change in the value of one or a few issuers’ securities will therefore affect the value of an underlying fund more than would occur in a diversified fund. |
Investments in ETFs generally present the same primary risks as an investment in a conventional mutual fund that has the same investment objective, strategy and policies. Investments in ETFs further involve the same risks associated with a direct investment in the types of securities, commodities and/or currencies included in the indices the ETFs are designed to replicate. In addition, shares of an ETF may trade at a market price that is higher or lower than their net asset value and an active trading market in such shares may not develop or continue. Moreover, trading of an ETF’s shares may be halted if the listing exchange’s officials deem such action to be appropriate, the shares are de-listed from the exchange, or the activation of market-wide “circuit breakers” (which are tied to large decreases in stock prices) halts stock trading generally.
| J. | COVID-19 Risk - The COVID-19 strain of coronavirus has resulted in instances of market closures and dislocations, extreme volatility, liquidity constraints and increased trading costs. Efforts to contain its spread have resulted in travel restrictions, disruptions of healthcare systems, business operations (including business closures) and supply chains, layoffs, lower consumer demand and employee availability, and defaults and credit downgrades, among other significant economic impacts that have disrupted global economic activity across many industries. Such economic impacts may exacerbate other pre-existing political, social and economic risks locally or globally and cause general concern and uncertainty. The full economic impact and ongoing effects of COVID-19 (or other future epidemics or pandemics) at the macro-level and on individual businesses are unpredictable and may result in significant and prolonged effects on the Fund’s performance. |
NOTE 2–Advisory Fees and Other Fees Paid to Affiliates
The Trust has entered into a master investment advisory agreement with the Adviser. Under the terms of the investment advisory agreement, the Fund does not pay an advisory fee. However, the Fund pays advisory fees to the Adviser indirectly as a shareholder of the underlying funds.
Under the terms of a master sub-advisory agreement between the Adviser and each of Invesco Asset Management Deutschland GmbH, Invesco Asset Management Limited, Invesco Asset Management (Japan) Limited, Invesco Hong Kong Limited, Invesco Senior Secured Management, Inc. and Invesco Canada Ltd. (collectively, the “Affiliated Sub-Advisers”) the Adviser, not the Fund, will pay 40% of the fees paid to the Adviser to any such Affiliated Sub-Adviser(s) that provide(s) discretionary investment management services to the Fund based on the percentage of assets allocated to such Affiliated Sub-Adviser(s).
The Adviser has contractually agreed, through June 30, 2023, to reimburse expenses of all shares to the extent necessary to limit total annual fund operating expenses after expense reimbursement (excluding certain items discussed below) of Class A, Class C, Class R, Class S, Class Y, Class R5 and Class R6 shares to 1.50%, 2.25%, 1.75%, 1.40%, 1.25%, 1.25% and 1.25%, respectively, of the Fund’s average daily net assets (the “expense limits”). In determining the Adviser’s obligation to reimburse expenses, the following expenses are not taken into account, and could cause the total annual fund operating expenses after expense reimbursement to exceed the numbers reflected above: (1) interest; (2) taxes; (3) dividend expense on short sales; (4) extraordinary or non-routine items, litigation expenses; and (5) expenses that the Fund has incurred but did not actually pay because of an expense offset arrangement. Unless Invesco continues the expense reimbursement agreement, it will terminate on June 30, 2023. During its term, the expense reimbursement agreement cannot be terminated or amended to increase the expense limits or reduce the expense reimbursement without approval of the Board of Trustees. The Adviser did not reimburse expenses during the period under these expense limits.
The Trust has entered into a master administrative services agreement with Invesco pursuant to which the Fund has agreed to pay Invesco for certain administrative costs incurred in providing accounting services to the Fund. For the year ended December 31, 2022, expenses incurred under the agreement are shown in the Statement of Operations as Administrative services fees. Invesco has entered into a sub-administration agreement whereby State Street Bank and Trust Company (“SSB”) serves as fund accountant and provides certain administrative services to the Fund. Pursuant to a custody agreement with the Trust on behalf of the Fund, SSB also serves as the Fund’s custodian.
The Trust has entered into a transfer agency and service agreement with Invesco Investment Services, Inc. (“IIS”) pursuant to which the Fund has agreed to pay IIS a fee for providing transfer agency and shareholder services to the Fund and reimburse IIS for certain expenses incurred by IIS in the course of providing such services. IIS may make payments to intermediaries that provide omnibus account services, sub-accounting services and/or networking services. All fees payable by IIS to intermediaries that provide omnibus account services or sub-accounting services are charged back to the Fund, subject to certain limitations approved by the Trust’s Board of Trustees. For the year ended December 31, 2022, expenses incurred under the agreement are shown in the Statement of Operations as Transfer agent fees.
The Trust has entered into master distribution agreements with Invesco Distributors, Inc. (“IDI”) to serve as the distributor for the Class A, Class C, Class R, Class S, Class Y, Class R5 and Class R6 shares of the Fund. The Trust has adopted plans pursuant to Rule 12b-1 under the 1940 Act with respect to the Fund’s Class A, Class C, Class R and Class S shares (collectively, the “Plans”). The Fund, pursuant to the Plans, pays IDI compensation at the annual rate of 0.25% of the Fund’s average daily net assets of Class A shares, 1.00% of the average daily net assets of Class C shares, 0.50% of the average daily net assets of Class R shares and 0.15% of the average daily net assets of Class S shares. The fees are accrued daily and paid monthly. Of the Plan payments, up to 0.25% of the average daily net assets of Class A, Class C and Class R shares and 0.15% of the average daily net assets of Class S shares may be paid to furnish continuing personal shareholder services to customers who purchase and own shares of such classes. Any amounts not paid as a service fee under the Plans would constitute an asset-based sales charge. Rules of the Financial Industry Regulatory Authority (“FINRA”) impose a cap on the total sales charges, including asset-based sales charges, that may be paid by any class of shares of the Fund. For the year ended December 31, 2022, expenses incurred under the Plans are shown in the Statement of Operations as Distribution fees.
Front-end sales commissions and CDSC (collectively, the “sales charges”) are not recorded as expenses of the Fund. Front-end sales commissions are deducted from proceeds from the sales of Fund shares prior to investment in Class A shares of the Fund. CDSC are deducted from redemption proceeds prior to remittance to the shareholder. During the year ended December 31, 2022, IDI advised the Fund that IDI retained $29,302 in front-end sales commissions from the sale of Class A shares and $13,789 and $2,124 from Class A and Class C shares, respectively, for CDSC imposed upon redemptions by shareholders.
The underlying Invesco Funds pay no distribution fees for Class R6 shares and the Funds pay no sales loads or other similar compensation to IDI for acquiring underlying fund shares.
Certain officers and trustees of the Trust are officers and directors of the Adviser, IIS and/or IDI.
NOTE 3–Additional Valuation Information
GAAP defines fair value as the price that would be received to sell an asset or paid to transfer a liability in an orderly transaction between market participants at the measurement date, under current market conditions. GAAP establishes a hierarchy that prioritizes the inputs to valuation methods, giving the highest priority to readily
| 15 | Invesco Select Risk: Moderately Conservative Investor Fund |
available unadjusted quoted prices in an active market for identical assets (Level 1) and the lowest priority to significant unobservable inputs (Level 3), generally when market prices are not readily available. Based on the valuation inputs, the securities or other investments are tiered into one of three levels. Changes in valuation methods may result in transfers in or out of an investment’s assigned level:
| Level 1 - | Prices are determined using quoted prices in an active market for identical assets. | |
| Level 2 - | Prices are determined using other significant observable inputs. Observable inputs are inputs that other market participants may use in pricing a security. These may include quoted prices for similar securities, interest rates, prepayment speeds, credit risk, yield curves, loss severities, default rates, discount rates, volatilities and others. | |
| Level 3 - | Prices are determined using significant unobservable inputs. In situations where quoted prices or observable inputs are unavailable (for example, when there is little or no market activity for an investment at the end of the period), unobservable inputs may be used. Unobservable inputs reflect the Adviser’s assumptions about the factors market participants would use in determining fair value of the securities or instruments and would be based on the best available information. |
The following is a summary of the tiered valuation input levels, as of December 31, 2022. The level assigned to the securities valuations may not be an indication of the risk or liquidity associated with investing in those securities. Because of the inherent uncertainties of valuation, the values reflected in the financial statements may materially differ from the value received upon actual sale of those investments.
| Level 1 | Level 2 | Level 3 | Total | |||||||||
| ||||||||||||
Investments in Securities | ||||||||||||
| ||||||||||||
Affiliated Issuers | $ | 292,165,910 | $– | $– | $ | 292,165,910 | ||||||
| ||||||||||||
Money Market Funds | 641,919 | – | – | 641,919 | ||||||||
| ||||||||||||
Total Investments | $ | 292,807,829 | $– | $– | $ | 292,807,829 | ||||||
| ||||||||||||
NOTE 4–Expense Offset Arrangement(s)
The expense offset arrangement is comprised of transfer agency credits which result from balances in demand deposit accounts used by the transfer agent for clearing shareholder transactions. For the year ended December 31, 2022, the Fund received credits from this arrangement, which resulted in the reduction of the Fund’s total expenses of $2,245.
NOTE 5–Trustees’ and Officers’ Fees and Benefits
Trustees’ and Officers’ Fees and Benefits include amounts accrued by the Fund to pay remuneration to certain Trustees and Officers of the Fund. Trustees have the option to defer compensation payable by the Fund, and Trustees’ and Officers’ Fees and Benefits also include amounts accrued by the Fund to fund such deferred compensation amounts. Those Trustees who defer compensation have the option to select various Invesco Funds in which their deferral accounts shall be deemed to be invested. Finally, certain current Trustees were eligible to participate in a retirement plan that provided for benefits to be paid upon retirement to Trustees over a period of time based on the number of years of service. The Fund may have certain former Trustees who also participate in a retirement plan and receive benefits under such plan. Trustees’ and Officers’ Fees and Benefits include amounts accrued by the Fund to fund such retirement benefits. Obligations under the deferred compensation and retirement plans represent unsecured claims against the general assets of the Fund.
NOTE 6–Cash Balances
The Fund is permitted to temporarily carry a negative or overdrawn balance in its account with SSB, the custodian bank. Such balances, if any at period-end, are shown in the Statement of Assets and Liabilities under the payable caption Amount due custodian. To compensate the custodian bank for such overdrafts, the overdrawn Fund may either (1) leave funds as a compensating balance in the account so the custodian bank can be compensated by earning the additional interest; or (2) compensate by paying the custodian bank at a rate agreed upon by the custodian bank and Invesco, not to exceed the contractually agreed upon rate. The Fund may not purchase additional securities when any borrowings from banks or broker-dealers exceed 5% of the Fund’s total assets, or when any borrowings from an Invesco Fund are outstanding.
NOTE 7–Distributions to Shareholders and Tax Components of Net Assets
Tax Character of Distributions to Shareholders Paid During the Fiscal Years Ended December 31, 2022 and 2021:
| 2022 | 2021 | |||||||||||
| ||||||||||||
Ordinary income* | $ | 6,057,918 | $ | 16,251,362 | ||||||||
| ||||||||||||
Long-term capital gain | 6,946,524 | 1,914,717 | ||||||||||
| ||||||||||||
Return of capital | 206,761 | – | ||||||||||
| ||||||||||||
Total distributions | $ | 13,211,203 | $ | 18,166,079 | ||||||||
| ||||||||||||
| * | Includes short-term capital gain distributions, if any. |
Tax Components of Net Assets at Period-End:
| 2022 | ||||
| ||||
Net unrealized appreciation (depreciation) – investments | $ | (27,834,306 | ) | |
| ||||
Temporary book/tax differences | (39,121 | ) | ||
| ||||
Capital loss carryforward | (7,740,318 | ) | ||
| ||||
Shares of beneficial interest | 328,564,348 | |||
| ||||
Total net assets | $ | 292,950,603 | ||
| ||||
The difference between book-basis and tax-basis unrealized appreciation (depreciation) is due to differences in the timing of recognition of gains and losses on investments for tax and book purposes. The Fund’s net unrealized appreciation (depreciation) difference is attributable primarily to wash sales and partnerships.
The temporary book/tax differences are a result of timing differences between book and tax recognition of income and/or expenses. The Fund’s temporary book/tax differences are the result of the trustee deferral of compensation and retirement plan benefits.
| 16 | Invesco Select Risk: Moderately Conservative Investor Fund |
Capital loss carryforward is calculated and reported as of a specific date. Results of transactions and other activity after that date may affect the amount of capital loss carryforward actually available for the Fund to utilize. The ability to utilize capital loss carryforward in the future may be limited under the Internal Revenue Code and related regulations based on the results of future transactions.
The Fund has a capital loss carryforward as of December 31, 2022, as follows:
| Capital Loss Carryforward* | ||||||||||||
| ||||||||||||
| Expiration | Short-Term | Long-Term | Total | |||||||||
| ||||||||||||
Not subject to expiration | $ | 3,454,437 | $ | 4,285,881 | $ | 7,740,318 | ||||||
| ||||||||||||
| * | Capital loss carryforward is reduced for limitations, if any, to the extent required by the Internal Revenue Code and may be further limited depending upon a variety of factors, including the realization of net unrealized gains or losses as of the date of any reorganization. |
NOTE 8–Investment Transactions
The aggregate amount of investment securities (other than short-term securities, U.S. Government obligations and money market funds, if any) purchased and sold by the Fund during the year ended December 31, 2022 was $93,018,788 and $107,628,328, respectively. Cost of investments, including any derivatives, on a tax basis includes the adjustments for financial reporting purposes as of the most recently completed federal income tax reporting period-end.
| Unrealized Appreciation (Depreciation) of Investments on a Tax Basis | ||||
| ||||
Aggregate unrealized appreciation of investments | $ | 12,251,000 | ||
| ||||
Aggregate unrealized (depreciation) of investments | (40,085,306 | ) | ||
| ||||
Net unrealized appreciation (depreciation) of investments | $ | (27,834,306 | ) | |
| ||||
Cost of investments for tax purposes is $320,642,135.
NOTE 9–Reclassification of Permanent Differences
Primarily as a result of differing book/tax treatment of distributions and return of capital distributions, on December 31, 2022, undistributed net investment income was increased by $143,298, undistributed net realized gain (loss) was increased by $63,463 and shares of beneficial interest was decreased by $206,761. This reclassification had no effect on the net assets of the Fund.
NOTE 10–Share Information
| Summary of Share Activity | ||||||||||||||||
| ||||||||||||||||
| Year ended | Year ended | |||||||||||||||
| December 31, 2022(a) | December 31, 2021 | |||||||||||||||
| Shares | Amount | Shares | Amount | |||||||||||||
| ||||||||||||||||
Sold: | ||||||||||||||||
Class A | 3,913,981 | $ | 40,339,954 | 5,446,631 | $ | 65,972,089 | ||||||||||
| ||||||||||||||||
Class C | 444,004 | 4,579,693 | 492,238 | 5,862,630 | ||||||||||||
| ||||||||||||||||
Class R | 349,475 | 3,601,407 | 345,361 | 4,149,561 | ||||||||||||
| ||||||||||||||||
Class S | 1,564 | 16,200 | 4,800 | 59,558 | ||||||||||||
| ||||||||||||||||
Class Y | 1,101,986 | 12,109,546 | 389,216 | 4,682,496 | ||||||||||||
| ||||||||||||||||
Class R5 | 588 | 6,032 | 9,308 | 113,682 | ||||||||||||
| ||||||||||||||||
Class R6 | 2,713 | 27,965 | 2,398 | 29,180 | ||||||||||||
| ||||||||||||||||
Issued as reinvestment of dividends: | ||||||||||||||||
Class A | 1,079,790 | 10,546,978 | 1,259,071 | 14,963,129 | ||||||||||||
| ||||||||||||||||
Class C | 60,731 | 583,120 | 84,391 | 989,281 | ||||||||||||
| ||||||||||||||||
Class R | 36,972 | 358,613 | 38,102 | 450,409 | ||||||||||||
| ||||||||||||||||
Class S | 7,364 | 72,091 | 8,495 | 101,131 | ||||||||||||
| ||||||||||||||||
Class Y | 82,662 | 807,223 | 45,779 | 543,603 | ||||||||||||
| ||||||||||||||||
Class R5 | 417 | 4,089 | 383 | 4,579 | ||||||||||||
| ||||||||||||||||
Class R6 | 152 | 1,485 | 111 | 1,328 | ||||||||||||
| ||||||||||||||||
Automatic conversion of Class C shares to Class A shares: | ||||||||||||||||
Class A | 158,199 | 1,636,174 | 225,877 | 2,728,054 | ||||||||||||
| ||||||||||||||||
Class C | (160,206 | ) | (1,636,174 | ) | (228,581 | ) | (2,728,054 | ) | ||||||||
| ||||||||||||||||
| 17 | Invesco Select Risk: Moderately Conservative Investor Fund |
| Summary of Share Activity | ||||||||||||||||
| ||||||||||||||||
| Year ended December 31, 2022(a) | Year ended December 31, 2021 | |||||||||||||||
| Shares | Amount | Shares | Amount | |||||||||||||
| ||||||||||||||||
Reacquired: | ||||||||||||||||
Class A | (6,830,674 | ) | $ | (70,047,780 | ) | (4,789,672 | ) | $ | (57,961,512 | ) | ||||||
| ||||||||||||||||
Class C | (732,401 | ) | (7,495,848 | ) | (634,657 | ) | (7,542,867 | ) | ||||||||
| ||||||||||||||||
Class R | (284,285 | ) | (2,956,507 | ) | (216,817 | ) | (2,620,887 | ) | ||||||||
| ||||||||||||||||
Class S | (12,505 | ) | (127,649 | ) | (17,072 | ) | (210,424 | ) | ||||||||
| ||||||||||||||||
Class Y | (377,272 | ) | (3,843,843 | ) | (284,740 | ) | (3,450,613 | ) | ||||||||
| ||||||||||||||||
Class R5 | (63 | ) | (663 | ) | (1,517 | ) | (18,607 | ) | ||||||||
| ||||||||||||||||
Class R6 | (1,496 | ) | (17,562 | ) | (151 | ) | (1,837 | ) | ||||||||
| ||||||||||||||||
Net increase (decrease) in share activity | (1,158,304 | ) | $ | (11,435,456 | ) | 2,178,954 | $ | 26,115,909 | ||||||||
| ||||||||||||||||
| (a) | There are entities that are record owners of more than 5% of the outstanding shares of the Fund and in the aggregate own 35% of the outstanding shares of the Fund. IDI has an agreement with these entities to sell Fund shares. The Fund, Invesco and/or Invesco affiliates may make payments to these entities, which are considered to be related to the Fund, for providing services to the Fund, Invesco and/or Invesco affiliates including but not limited to services such as securities brokerage, distribution, third party record keeping and account servicing. The Fund has no knowledge as to whether all or any portion of the shares owned of record by these entities are also owned beneficially. |
In addition, 3% of the outstanding shares of the Fund are owned by the Adviser or an affiliate of the Adviser.
| 18 | Invesco Select Risk: Moderately Conservative Investor Fund |
Report of Independent Registered Public Accounting Firm
To the Board of Trustees of AIM Growth Series (Invesco Growth Series) and Shareholders of Invesco Select Risk: Moderately Conservative Investor Fund
Opinion on the Financial Statements
We have audited the accompanying statement of assets and liabilities, including the schedule of investments, of Invesco Select Risk: Moderately Conservative Investor Fund (one of the funds constituting AIM Growth Series (Invesco Growth Series), referred to hereafter as the “Fund”) as of December 31, 2022, the related statement of operations for the year ended December 31, 2022, the statement of changes in net assets for each of the two years in the period ended December 31, 2022, including the related notes, and the financial highlights for each of the five years in the period ended December 31, 2022 (collectively referred to as the “financial statements”). In our opinion, the financial statements present fairly, in all material respects, the financial position of the Fund as of December 31, 2022, the results of its operations for the year then ended, the changes in its net assets for each of the two years in the period ended December 31, 2022 and the financial highlights for each of the five years in the period ended December 31, 2022 in conformity with accounting principles generally accepted in the United States of America.
Basis for Opinion
These financial statements are the responsibility of the Fund’s management. Our responsibility is to express an opinion on the Fund’s financial statements based on our audits. We are a public accounting firm registered with the Public Company Accounting Oversight Board (United States) (PCAOB) and are required to be independent with respect to the Fund in accordance with the U.S. federal securities laws and the applicable rules and regulations of the Securities and Exchange Commission and the PCAOB.
We conducted our audits of these financial statements in accordance with the standards of the PCAOB. Those standards require that we plan and perform the audit to obtain reasonable assurance about whether the financial statements are free of material misstatement, whether due to error or fraud.
Our audits included performing procedures to assess the risks of material misstatement of the financial statements, whether due to error or fraud, and performing procedures that respond to those risks. Such procedures included examining, on a test basis, evidence regarding the amounts and disclosures in the financial statements. Our audits also included evaluating the accounting principles used and significant estimates made by management, as well as evaluating the overall presentation of the financial statements. Our procedures included confirmation of securities owned as of December 31, 2022 by correspondence with the custodian and transfer agent. We believe that our audits provide a reasonable basis for our opinion.
/s/PricewaterhouseCoopers LLP
Houston, Texas
February 22, 2023
We have served as the auditor of one or more of the investment companies in the Invesco group of investment companies since at least 1995. We have not been able to determine the specific year we began serving as auditor.
| 19 | Invesco Select Risk: Moderately Conservative Investor Fund |
Calculating your ongoing Fund expenses
Example
As a shareholder of the Fund, you incur two types of costs: (1) transaction costs, which may include sales charges (loads) on purchase payments or contingent deferred sales charges on redemptions, if any; and (2) ongoing costs, including management fees, distribution and/or service (12b-1) fees, and other Fund expenses. This example is intended to help you understand your ongoing costs (in dollars) of investing in the Fund and to compare these costs with ongoing costs of investing in other mutual funds. The example is based on an investment of $1,000 invested at the beginning of the period and held for the entire period July 1, 2022 through December 31, 2022.
In addition to the fees and expenses which the Fund bears directly, the Fund indirectly bears a pro-rata share of the fees and expenses of the underlying funds in which the Fund invests. The amount of fees and expenses incurred indirectly by the Fund will vary because the underlying funds have varied expenses and fee levels and the Fund may own different proportions of the underlying funds at different times. Estimated underlying fund expenses are not expenses that are incurred directly by the Fund. They are expenses that are incurred directly by the underlying funds and are deducted from the value of the underlying funds the Fund invests in. The effect of the estimated underlying fund expenses that the Fund bears indirectly are included in the Fund’s total return.
Actual expenses
The table below provides information about actual account values and actual expenses. You may use the information in this table, together with the amount you invested, to estimate the expenses that you paid over the period. Simply divide your account value by $1,000 (for example, an $8,600 account value divided by $1,000 = 8.6), then multiply the result by the number in the table under the heading entitled “Actual Expenses Paid During Period” to estimate the expenses you paid on your account during this period.
Hypothetical example for comparison purposes
The table below also provides information about hypothetical account values and hypothetical expenses based on the Fund’s actual expense ratio and an assumed rate of return of 5% per year before expenses, which is not the Fund’s actual return.
The hypothetical account values and expenses may not be used to estimate the actual ending account balance or expenses you paid for the period. You may use this information to compare the ongoing costs of investing in the Fund and other funds. To do so, compare this 5% hypothetical example with the 5% hypothetical examples that appear in the shareholder reports of the other funds.
Please note that the expenses shown in the table are meant to highlight your ongoing costs only and do not reflect any transaction costs, such as sales charges (loads) on purchase payments or contingent deferred sales charges on redemptions, if any. Therefore, the hypothetical information is useful in comparing ongoing costs only, and will not help you determine the relative total costs of owning different funds. In addition, if these transaction costs were included, your costs would have been higher.
| ACTUAL | HYPOTHETICAL (5% annual return before expenses) | |||||||||||
Beginning Account Value (07/01/22) | Ending Account Value (12/31/22)1 | Expenses Paid During Period2 | Ending Account Value (12/31/22) | Expenses Paid During Period2 | Annualized Ratio | |||||||
Class A | $1,000.00 | $996.10 | $2.21 | $1,022.99 | $2.24 | 0.44% | ||||||
Class C | 1,000.00 | 993.20 | 5.98 | 1,019.21 | 6.06 | 1.19 | ||||||
Class R | 1,000.00 | 995.80 | 3.47 | 1,021.73 | 3.52 | 0.69 | ||||||
Class S | 1,000.00 | 996.60 | 1.71 | 1,023.49 | 1.73 | 0.34 | ||||||
Class Y | 1,000.00 | 998.40 | 0.96 | 1,024.25 | 0.97 | 0.19 | ||||||
Class R5 | 1,000.00 | 998.90 | 0.55 | 1,024.65 | 0.56 | 0.11 | ||||||
Class R6 | 1,000.00 | 998.90 | 0.55 | 1,024.65 | 0.56 | 0.11 | ||||||
| 1 | The actual ending account value is based on the actual total return of the Fund for the period July 1, 2022 through December 31, 2022, after actual expenses and will differ from the hypothetical ending account value which is based on the Fund’s expense ratio and a hypothetical annual return of 5% before expenses. |
| 2 | Expenses are equal to the Fund’s annualized expense ratio as indicated above multiplied by the average account value over the period, multiplied by 184/365 to reflect the most recent fiscal half year. |
| 20 | Invesco Select Risk: Moderately Conservative Investor Fund |
Form 1099-DIV, Form 1042-S and other year–end tax information provide shareholders with actual calendar year amounts that should be included in their tax returns. Shareholders should consult their tax advisers.
The following distribution information is being provided as required by the Internal Revenue Code or to meet a specific state’s requirement.
The Fund designates the following amounts or, if subsequently determined to be different, the maximum amount allowable for its fiscal year ended December 31, 2022:
| Federal and State Income Tax | |||||
Long-Term Capital Gain Distributions | $6,946,524 | |||||
Qualified Dividend Income* | 24.14 | % | ||||
Corporate Dividends Received Deduction* | 15.18 | % | ||||
U.S. Treasury Obligations* | 15.53 | % | ||||
Qualified Business Income* | 1.36 | % | ||||
Business Interest Income* | 51.30 | % | ||||
| * The above percentages are based on ordinary income dividends paid to shareholders during the Fund’s fiscal year. | |||
| Non-Resident Alien Shareholders | |||||
Short-Term Capital Gain Distributions | $ | 309,576 | ||||
| 21 | Invesco Select Risk: Moderately Conservative Investor Fund |
The address of each trustee and officer is AIM Growth Series (Invesco Growth Series) (the “Trust”), 11 Greenway Plaza, Suite 1000, Houston, Texas 77046-1173. The trustees serve for the life of the Trust, subject to their earlier death, incapacitation, resignation, retirement or removal as more specifically provided in the Trust’s organizational documents. Each officer serves for a one year term or until their successors are elected and qualified. Column two below includes length of time served with predecessor entities, if any.
Name, Year of Birth and Position(s) Held with the Trust | Trustee and/or Officer Since | Principal Occupation(s) During Past 5 Years | Number of Funds in Fund Complex Overseen by Trustee | Other Directorship(s) Held by Trustee During Past 5 Years | ||||
| Interested Trustee | ||||||||
Martin L. Flanagan1 – 1960 Trustee and Vice Chair | 2007 | Executive Director, Chief Executive Officer and President, Invesco Ltd. (ultimate parent of Invesco and a global investment management firm); Trustee and Vice Chair, The Invesco Funds; Vice Chair, Investment Company Institute; and Member of Executive Board, SMU Cox School of Business
Formerly: Advisor to the Board, Invesco Advisers, Inc. (formerly known as Invesco Institutional (N.A.), Inc.); Chairman and Chief Executive Officer, Invesco Advisers, Inc. (registered investment adviser); Director, Chairman, Chief Executive Officer and President, Invesco Holding Company (US), Inc. (formerly IVZ Inc.) (holding company), Invesco Group Services, Inc. (service provider) and Invesco North American Holdings, Inc. (holding company); Director, Chief Executive Officer and President, Invesco Holding Company Limited (parent of Invesco and a global investment management firm); Director, Invesco Ltd.; Chairman, Investment Company Institute and President, Co-Chief Executive Officer, Co-President, Chief Operating Officer and Chief Financial Officer, Franklin Resources, Inc. (global investment management organization) | 189 | None |
| 1 | Mr. Flanagan is considered an interested person (within the meaning of Section 2(a)(19) of the 1940 Act) of the Trust because he is an officer of the Adviser to the Trust, and an officer and a director of Invesco Ltd., ultimate parent of the Adviser. |
| T-1 | Invesco Select Risk: Moderately Conservative Investor Fund |
Trustees and Officers–(continued)
Name, Year of Birth and Position(s) Held with the Trust | Trustee and/or Officer Since | Principal Occupation(s) During Past 5 Years | Number of Funds in Fund Complex Overseen by Trustee | Other Directorship(s) Held by Trustee During Past 5 Years | ||||
| Independent Trustees | ||||||||
Beth Ann Brown - 1968 Trustee (2019) and Chair (August 2022) | 2019 | Independent Consultant
Formerly: Head of Intermediary Distribution, Managing Director, Strategic Relations, Managing Director, Head of National Accounts, Senior Vice President, National Account Manager and Senior Vice President, Key Account Manager, Columbia Management Investment Advisers LLC; Vice President, Key Account Manager, Liberty Funds Distributor, Inc.; and Trustee of certain Oppenheimer Funds | 189 | Director, Board of Directors of Caron Engineering Inc.; Advisor, Board of Advisors of Caron Engineering Inc.; President and Director, Acton Shapleigh Youth Conservation Corps (non-profit) Formerly: President and Director Director of Grahamtastic Connection (non-profit) | ||||
Cynthia Hostetler - 1962 Trustee | 2017 | Non-Executive Director and Trustee of a number of public and private business corporations
Formerly: Director, Aberdeen Investment Funds (4 portfolios); Director, Artio Global Investment LLC (mutual fund complex); Director, Edgen Group, Inc. (specialized energy and infrastructure products distributor); Director, Genesee & Wyoming, Inc. (railroads); Head of Investment Funds and Private Equity, Overseas Private Investment Corporation; President, First Manhattan Bancorporation, Inc.; and Attorney, Simpson Thacher & Bartlett LLP | 189 | Resideo Technologies, Inc. (smart home technology); Vulcan Materials Company (construction materials company); Trilinc Global Impact Fund; Textainer Group Holdings, (shipping container leasing company); Investment Company Institute (professional organization); and Independent Directors Council (professional organization) | ||||
Eli Jones - 1961 Trustee | 2016 | Professor and Dean Emeritus, Mays Business School - Texas A&M University
Formerly: Dean of Mays Business School-Texas A&M University; Professor and Dean, Walton College of Business, University of Arkansas and E.J. Ourso College of Business, Louisiana State University; and Director, Arvest Bank | 189 | Insperity, Inc. (formerly known as Administaff) (human resources provider); and Member of Regional Board of Directors and Board of Directors, First Financial Bancorp (regional bank) | ||||
Elizabeth Krentzman - 1959 Trustee | 2019 | Formerly: Principal and Chief Regulatory Advisor for Asset Management Services and U.S. Mutual Fund Leader of Deloitte & Touche LLP; General Counsel of the Investment Company Institute (trade association); National Director of the Investment Management Regulatory Consulting Practice, Principal, Director and Senior Manager of Deloitte & Touche LLP; Assistant Director of the Division of Investment Management - Office of Disclosure and Investment Adviser Regulation of the U.S. Securities and Exchange Commission and various positions with the Division of Investment Management – Office of Regulatory Policy of the U.S. Securities and Exchange Commission; Associate at Ropes & Gray LLP; and Trustee of certain Oppenheimer Funds | 189 | Formerly: Member of the Cartica Funds Board of Directors (private investment fund); Trustee of the University of Florida National Board Foundation; and Member of the University of Florida Law Center Association, Inc. Board of Trustees, Audit Committee and Membership Committee | ||||
Anthony J. LaCava, Jr. - 1956 Trustee | 2019 | Formerly: Director and Member of the Audit Committee, Blue Hills Bank (publicly traded financial institution) and Managing Partner, KPMG LLP | 189 | Blue Hills Bank; Chairman, Bentley University; Member, Business School Advisory Council; and Nominating Committee, KPMG LLP | ||||
Prema Mathai-Davis - 1950 Trustee | 2001 | Retired
Formerly: Co-Founder & Partner of Quantalytics Research, LLC, (a FinTech Investment Research Platform for the Self-Directed Investor); Trustee of YWCA Retirement Fund; CEO of YWCA of the USA; Board member of the NY Metropolitan Transportation Authority; Commissioner of the NYC Department of Aging; and Board member of Johns Hopkins Bioethics Institute | 189 | Member of Board of Positive Planet US (non-profit) and HealthCare Chaplaincy Network (non-profit) |
| T-2 | Invesco Select Risk: Moderately Conservative Investor Fund |
Trustees and Officers–(continued)
Name, Year of Birth and Position(s) Held with the Trust | Trustee and/or Officer Since | Principal Occupation(s) During Past 5 Years | Number of Funds in Fund Complex Overseen by Trustee | Other Directorship(s) Held by Trustee During Past 5 Years | ||||
| Independent Trustees–(continued) | ||||||||
Joel W. Motley - 1952 Trustee | 2019 | Director of Office of Finance, Federal Home Loan Bank System; Managing Director of Carmona Motley Inc. (privately held financial advisor); Member of the Council on Foreign Relations and its Finance and Budget Committee; Chairman Emeritus of Board of Human Rights Watch and Member of its Investment Committee; and Member of Investment Committee Board of Historic Hudson Valley (non-profit cultural organization); Member of the Board, Blue Ocean Acquisition Corp.; and Member of the Vestry and the Investment Committee of Trinity Church Wall Street.
Formerly: Managing Director of Public Capital Advisors, LLC (privately held financial advisor); Managing Director of Carmona Motley Hoffman, Inc. (privately held financial advisor); Trustee of certain Oppenheimer Funds; and Director of Columbia Equity Financial Corp. (privately held financial advisor) | 189 | Member of Board of Trust for Mutual Understanding (non-profit promoting the arts and environment); Member of Board of Greenwall Foundation (bioethics research foundation) and its Investment Committee; Member of Board of Friends of the LRC (non-profit legal advocacy); and Board Member and Investment Committee Member of Pulitzer Center for Crisis Reporting (non-profit journalism) | ||||
Teresa M. Ressel - 1962 Trustee | 2017 | Non-executive director and trustee of a number of public and private business corporations
Formerly: Chief Executive Officer, UBS Securities LLC (investment banking); Chief Operating Officer, UBS AG Americas (investment banking); Sr. Management Team Olayan America, The Olayan Group (international investor/commercial/industrial); Assistant Secretary for Management & Budget and Designated Chief Financial Officer, U.S. Department of Treasury and Director, ON Semiconductor Corporation (semiconductor manufacturing) | 189 | None | ||||
Robert C. Troccoli - 1949 Trustee | 2016 | Retired
Formerly: Adjunct Professor, University of Denver - Daniels College of Business; and Managing Partner, KPMG LLP | 189 | None | ||||
Daniel S. Vandivort - 1954 Trustee | 2019 | President, Flyway Advisory Services LLC (consulting and property management)
Formerly: President and Chief Investment Officer, previously Head of Fixed Income, Weiss Peck and Greer/Robeco Investment Management; Trustee and Chair, Weiss Peck and Greer Funds Board; and various capacities at CS First Boston including Head of Fixed Income at First Boston Asset Management. | 189 | Formerly: Trustee and Governance Chair, Oppenheimer Funds; Treasurer, Chairman of the Audit and Finance Committee, Huntington Disease Foundation of America | ||||
| T-3 | Invesco Select Risk: Moderately Conservative Investor Fund |
Trustees and Officers–(continued)
Name, Year of Birth and Position(s) Held with the Trust | Trustee and/or Officer Since | Principal Occupation(s) During Past 5 Years | Number of Funds in Fund Complex Overseen by Trustee | Other Directorship(s) Held by Trustee During Past 5 Years | ||||
| Officers | ||||||||
Sheri Morris - 1964 President and Principal Executive Officer | 1999 | Director, Invesco Trust Company; Head of Global Fund Services, Invesco Ltd.; President and Principal Executive Officer, The Invesco Funds; Vice President, Invesco Exchange-Traded Fund Trust, Invesco Exchange-Traded Fund Trust II, Invesco India Exchange-Traded Fund Trust, Invesco Actively Managed Exchange-Traded Fund Trust, Invesco Actively Managed Exchange-Traded Commodity Fund Trust and Invesco Exchange-Traded Self-Indexed Fund Trust; and Vice President, OppenheimerFunds, Inc.
Formerly: Vice President, Treasurer and Principal Financial Officer, The Invesco Funds; Vice President, Invesco AIM Advisers, Inc., Invesco AIM Capital Management, Inc. and Invesco AIM Private Asset Management, Inc.; Assistant Vice President and Assistant Treasurer, The Invesco Funds; Vice President and Assistant Vice President, Invesco Advisers, Inc.; Assistant Vice President, Invesco AIM Capital Management, Inc. and Invesco AIM Private Asset Management, Inc.; Treasurer, Invesco Exchange-Traded Fund Trust, Invesco Exchange-Traded Fund Trust II, Invesco India Exchange-Traded Fund Trust and Invesco Actively Managed Exchange-Traded Fund Trust; and Senior Vice President, Invesco Advisers, Inc. (formerly known as Invesco Institutional (N.A.), Inc.) (registered investment adviser) | N/A | N/A | ||||
Jeffrey H. Kupor - 1968 Senior Vice President, Chief Legal Officer and Secretary | 2018 | Head of Legal of the Americas, Invesco Ltd.; Senior Vice President and Secretary, Invesco Advisers, Inc. (formerly known as Invesco Institutional (N.A.), Inc.) (registered investment adviser); Secretary, Invesco Distributors, Inc. (formerly known as Invesco AIM Distributors, Inc.); Vice President and Secretary, Invesco Investment Services, Inc. (formerly known as Invesco AIM Investment Services, Inc.); Senior Vice President, Chief Legal Officer and Secretary, The Invesco Funds; Secretary and General Counsel, Invesco Investment Advisers LLC (formerly known as Van Kampen Asset Management); Secretary and General Counsel, Invesco Capital Markets, Inc. (formerly known as Van Kampen Funds Inc.); Chief Legal Officer, Invesco Exchange-Traded Fund Trust, Invesco Exchange-Traded Fund Trust II, Invesco India Exchange-Traded Fund Trust, Invesco Actively Managed Exchange-Traded Fund Trust, Invesco Actively Managed Exchange-Traded Commodity Fund Trust and Invesco Exchange-Traded Self-Indexed Fund Trust;; Secretary and Vice President, Harbourview Asset Management Corporation; Secretary and Vice President, OppenheimerFunds, Inc. and Invesco Managed Accounts, LLC; Secretary and Senior Vice President, OFI Global Institutional, Inc.; Secretary and Vice President, OFI SteelPath, Inc.; Secretary and Vice President, Oppenheimer Acquisition Corp.; Secretary and Vice President, Shareholder Services, Inc.; and Secretary and Vice President, Trinity Investment Management Corporation
Formerly: Senior Vice President, Invesco Distributors, Inc.; Secretary and Vice President, Jemstep, Inc.; Head of Legal, Worldwide Institutional, Invesco Ltd.; Secretary and General Counsel, INVESCO Private Capital Investments, Inc.; Senior Vice President, Secretary and General Counsel, Invesco Management Group, Inc. (formerly known as Invesco AIM Management Group, Inc.); Assistant Secretary, INVESCO Asset Management (Bermuda) Ltd.; Secretary and General Counsel, Invesco Private Capital, Inc.;Assistant Secretary and General Counsel, INVESCO Realty, Inc.; Secretary and General Counsel, Invesco Senior Secured Management, Inc.; Secretary, Sovereign G./P. Holdings Inc.; Secretary, Invesco Indexing LLC; and Secretary, W.L. Ross & Co., LLC | N/A | N/A | ||||
Andrew R. Schlossberg - 1974 Senior Vice President | 2019 | Senior Vice President, Invesco Group Services, Inc.; Head of the Americas and Senior Managing Director, Invesco Ltd.; Director and Senior Vice President, Invesco Advisers, Inc. (formerly known as Invesco Institutional (N.A.), Inc.) (registered investment adviser); Director and Chairman, Invesco Investment Services, Inc. (formerly known as Invesco AIM Investment Services, Inc.) (registered transfer agent); Senior Vice President, The Invesco Funds; and Director, Invesco Investment Advisers LLC (formerly known as Van Kampen Asset Management)
Formerly: Director, President and Chairman, Invesco Insurance Agency, Inc.; Director, Invesco UK Limited; Director and Chief Executive, Invesco Asset Management Limited and Invesco Fund Managers Limited; Assistant Vice President, The Invesco Funds; Senior Vice President, Invesco Advisers, Inc. (formerly known as Invesco Institutional (N.A.), Inc.) (registered investment adviser); Director and Chief Executive, Invesco Administration Services Limited and Invesco Global Investment Funds Limited; Director, Invesco Distributors, Inc.; Head of EMEA, Invesco Ltd.; President, Invesco Actively Managed Exchange-Traded Commodity Fund Trust, Invesco Actively Managed Exchange-Traded Fund Trust, Invesco Exchange-Traded Fund Trust, Invesco Exchange-Traded Fund Trust II and Invesco India Exchange-Traded Fund Trust; and Managing Director and Principal Executive Officer, Invesco Capital Management LLC | N/A | N/A |
| T-4 | Invesco Select Risk: Moderately Conservative Investor Fund |
Trustees and Officers–(continued)
Name, Year of Birth and Position(s) Held with the Trust | Trustee and/or Officer Since | Principal Occupation(s) During Past 5 Years | Number of Funds in Fund Complex Overseen by Trustee | Other Directorship(s) Held by Trustee During Past 5 Years | ||||
| Officers–(continued) | ||||||||
John M. Zerr - 1962 Senior Vice President | 2006 | Chief Operating Officer of the Americas; Senior Vice President, Invesco Advisers, Inc. (formerly known as Invesco Institutional (N.A.), Inc.) (registered investment adviser); Senior Vice President, Invesco Distributors, Inc. (formerly known as Invesco AIM Distributors, Inc.); Director and Vice President, Invesco Investment Services, Inc. (formerly known as Invesco AIM Investment Services, Inc.) Senior Vice President, The Invesco Funds; Managing Director, Invesco Capital Management LLC; Director, Invesco Investment Advisers LLC (formerly known as Van Kampen Asset Management); Senior Vice President, Invesco Capital Markets, Inc. (formerly known as Van Kampen Funds Inc.); Manager, Invesco Indexing LLC; Manager, Invesco Specialized Products, LLC; Member, Invesco Canada Funds Advisory Board; Director, President and Chief Executive Officer, Invesco Corporate Class Inc. (corporate mutual fund company); and Director, Chairman, President and Chief Executive Officer, Invesco Canada Ltd. (formerly known as Invesco Trimark Ltd./Invesco Trimark Ltèe) (registered investment adviser and registered transfer agent); President, Invesco, Inc.; President, Invesco Global Direct Real Estate Feeder GP Ltd.; President, Invesco IP Holdings (Canada) Ltd; President, Invesco Global Direct Real Estate GP Ltd.; President, Invesco Financial Services Ltd. / Services Financiers Invesco Ltée; and Director and Chairman, Invesco Trust Company
Formerly: President, Trimark Investments Ltd/Services Financiers Invesco Ltee; Director and Senior Vice President, Invesco Insurance Agency, Inc.; Director and Senior Vice President, Invesco Management Group, Inc. (formerly known as Invesco AIM Management Group, Inc.); Secretary and General Counsel, Invesco Management Group, Inc. (formerly known as Invesco AIM Management Group, Inc.); Secretary, Invesco Investment Services, Inc. (formerly known as Invesco AIM Investment Services, Inc.); Chief Legal Officer and Secretary, The Invesco Funds; Secretary and General Counsel, Invesco Investment Advisers LLC (formerly known as Van Kampen Asset Management); Secretary and General Counsel, Invesco Capital Markets, Inc. (formerly known as Van Kampen Funds Inc.); Chief Legal Officer, Invesco Exchange-Traded Fund Trust, Invesco Exchange-Traded Fund Trust II, Invesco India Exchange-Traded Fund Trust, Invesco Actively Managed Exchange-Traded Fund Trust, Invesco Actively Managed Exchange-Traded Commodity Fund Trust and Invesco Exchange-Traded Self-Indexed Fund Trust; Secretary, Invesco Indexing LLC; Director, Secretary, General Counsel and Senior Vice President, Van Kampen Exchange Corp.; Director, Vice President and Secretary, IVZ Distributors, Inc. (formerly known as INVESCO Distributors, Inc.); Director and Vice President, INVESCO Funds Group, Inc.; Director and Vice President, Van Kampen Advisors Inc.; Director, Vice President, Secretary and General Counsel, Van Kampen Investor Services Inc.; Director and Secretary, Invesco Distributors, Inc. (formerly known as Invesco AIM Distributors, Inc.); Director, Senior Vice President, General Counsel and Secretary, Invesco AIM Advisers, Inc. and Van Kampen Investments Inc.; Director, Vice President and Secretary, Fund Management Company; Director, Senior Vice President, Secretary, General Counsel and Vice President, Invesco AIM Capital Management, Inc.; and Chief Operating Officer and General Counsel, Liberty Ridge Capital, Inc. (an investment adviser) | N/A | N/A | ||||
Gregory G. McGreevey - 1962 Senior Vice President | 2012 | Senior Managing Director, Invesco Ltd.; Director, Chairman, President, and Chief Executive Officer, Invesco Advisers, Inc. (formerly known as Invesco Institutional (N.A.), Inc.) (registered investment adviser); Director, Invesco Mortgage Capital, Inc. and Invesco Senior Secured Management, Inc.; Senior Vice President, The Invesco Funds; President, SNW Asset Management Corporation and Invesco Managed Accounts, LLC; Chairman and Director, Invesco Private Capital, Inc.; Chairman and Director, INVESCO Private Capital Investments, Inc.; Chairman and Director, INVESCO Realty, Inc.; and Senior Vice President, Invesco Group Services, Inc.
Formerly: Senior Vice President, Invesco Management Group, Inc. and Invesco Advisers, Inc.; Assistant Vice President, The Invesco Funds | N/A | N/A | ||||
Adrien Deberghes- 1967 Principal Financial Officer, Treasurer and Vice President | 2020 | Head of the Fund Office of the CFO and Fund Administration; Vice President, Invesco Advisers, Inc.; Principal Financial Officer, Treasurer and Vice President, The Invesco Funds; Vice President, Invesco Exchange-Traded Fund Trust, Invesco Exchange-Traded Fund Trust II, Invesco India Exchange-Traded Fund Trust, Invesco Actively Managed Exchange-Traded Fund Trust, Invesco Actively Managed Exchange-Traded Commodity Fund Trust and Invesco Exchange-Traded Self-Indexed Fund Trust
Formerly: Senior Vice President and Treasurer, Fidelity Investments | N/A | N/A | ||||
Crissie M. Wisdom - 1969 Anti-Money Laundering Compliance Officer | 2013 | Anti-Money Laundering and OFAC Compliance Officer for Invesco U.S. entities including: Invesco Advisers, Inc. and its affiliates, Invesco Capital Markets, Inc., Invesco Distributors, Inc., Invesco Investment Services, Inc., The Invesco Funds, Invesco Capital Management, LLC, Invesco Trust Company; and Fraud Prevention Manager for Invesco Investment Services, Inc. | N/A | N/A |
| T-5 | Invesco Select Risk: Moderately Conservative Investor Fund |
Trustees and Officers–(continued)
Name, Year of Birth and Position(s) Held with the Trust | Trustee and/or Officer Since | Principal Occupation(s) During Past 5 Years | Number of Funds in Fund Complex Overseen by Trustee | Other Directorship(s) Held by Trustee During Past 5 Years | ||||
| Officers–(continued) | ||||||||
Todd F. Kuehl - 1969 Chief Compliance Officer and Senior Vice President | 2020 | Chief Compliance Officer, Invesco Advisers, Inc. (registered investment adviser); and Chief Compliance Officer and Senior Vice President, The Invesco Funds
Formerly: Managing Director and Chief Compliance Officer, Legg Mason (Mutual Funds); Chief Compliance Officer, Legg Mason Private Portfolio Group (registered investment adviser) | N/A | N/A | ||||
James Bordewick, Jr. - 1959 Senior Vice President and Senior Officer | 2022 | Senior Vice President and Senior Officer, The Invesco Funds
Formerly: Chief Legal Officer, KingsCrowd, Inc. (research and analytical platform for investment in private capital markets); Chief Operating Officer and Head of Legal and Regulatory, Netcapital (private capital investment platform); Managing Director, General Counsel of asset management and Chief Compliance Officer for asset management and private banking, Bank of America Corporation; Chief Legal Officer, Columbia Funds and BofA Funds;
Senior Vice President and Associate General Counsel, MFS Investment Management; Chief Legal Officer, MFS Funds; Associate, Ropes & Gray; and Associate, Gaston Snow & Ely Bartlett | N/A | N/A |
The Statement of Additional Information of the Trust includes additional information about the Fund’s Trustees and is available upon request, without charge, by calling 1.800.959.4246. Please refer to the Fund’s Statement of Additional Information for information on the Fund’s sub-advisers.
| Office of the Fund | Investment Adviser | Distributor | Auditors | |||
| 11 Greenway Plaza, Suite 1000 | Invesco Advisers, Inc. | Invesco Distributors, Inc. | PricewaterhouseCoopers LLP | |||
| Houston, TX 77046-1173 | 1555 Peachtree Street, N.E. | 11 Greenway Plaza, Suite 1000 | 1000 Louisiana Street, Suite 5800 | |||
| Atlanta, GA 30309 | Houston, TX 77046-1173 | Houston, TX 77002-5021 | ||||
| Counsel to the Fund | Counsel to the Independent Trustees | Transfer Agent | Custodian | |||
| Stradley Ronon Stevens & Young, LLP | Sidley Austin LLP | Invesco Investment Services, Inc. | State Street Bank and Trust Company | |||
| 2005 Market Street, Suite 2600 | 787 Seventh Avenue | 11 Greenway Plaza, Suite 1000 | 225 Franklin Street | |||
| Philadelphia, PA 19103-7018 | New York, NY 10019 | Houston, TX 77046-1173 | Boston, MA 02110-2801 | |||
| T-6 | Invesco Select Risk: Moderately Conservative Investor Fund |

Go paperless with eDelivery
Visit invesco.com/edelivery to enjoy the convenience and security of anytime electronic access to your investment documents.
With eDelivery, you can elect to have any or all of the following materials delivered straight to your inbox to download, save and print from your own computer:
∎ Fund reports and prospectuses
∎ Quarterly statements
∎ Daily confirmations
∎ Tax forms
Invesco mailing information
Send general correspondence to Invesco Investment Services, Inc., P.O. Box 219078, Kansas City, MO 64121-9078.
Important notice regarding delivery of security holder documents
To reduce Fund expenses, only one copy of most shareholder documents may be mailed to shareholders with multiple accounts at the same address (Householding). Mailing of your shareholder documents may be householded indefinitely unless you instruct us otherwise. If you do not want the mailing of these documents to be combined with those for other members of your household, please contact Invesco Investment Services, Inc. at 800 959 4246 or contact your financial institution. We will begin sending you individual copies for each account within 30 days after receiving your request.
Fund holdings and proxy voting information
The Fund provides a complete list of its portfolio holdings four times each year, at the end of each fiscal quarter. For the second and fourth quarters, the list appears, respectively, in the Fund’s semiannual and annual reports to shareholders. For the first and third quarters, the Fund files the list with the Securities and Exchange Commission (SEC) as an exhibit to its reports on Form N-PORT. The most recent list of portfolio holdings is available at invesco.com/completeqtrholdings. Shareholders can also look up the Fund’s Form N-PORT filings on the SEC website, sec.gov. The SEC file numbers for the Fund are shown below.
A description of the policies and procedures that the Fund uses to determine how to vote proxies relating to portfolio securities is available without charge, upon request, from our Client Services department at 800 959 4246, or at invesco.com/corporate/about-us/esg. The information is also available on the SEC website, sec.gov.
Information regarding how the Fund voted proxies related to its portfolio securities during the most recent 12-month period ended June 30 is available at invesco.com/proxysearch. This information is also available on the SEC website, sec.gov.
Invesco Advisers, Inc. is an investment adviser; it provides investment advisory services to individual and institutional clients and does not sell securities. Invesco Distributors, Inc. is the US distributor for Invesco Ltd.’s retail mutual funds, exchange-traded funds and institutional money market funds. Both are wholly owned, indirect subsidiaries of Invesco Ltd.

| SEC file number(s): 811-02699 and 002-57526 | Invesco Distributors, Inc. | CAL-AR-1 |

| Annual Report to Shareholders | December 31, 2022 | |
Invesco Small Cap Growth Fund
Nasdaq:
A: GTSAX ∎ C: GTSDX ∎ R: GTSRX ∎ Y: GTSYX ∎ Investor: GTSIX ∎ R5: GTSVX ∎ R6: GTSFX
Management’s Discussion of Fund Performance
| ||||
For the fiscal year ended December 31, 2022, Class A shares of Invesco Small Cap Growth Fund (the Fund), at net asset value (NAV), underperformed the Russell 2000 Growth Index, the Fund’s style-specific benchmark. |
| |||
Your Fund’s long-term performance appears later in this report. |
| |||
Fund vs. Indexes |
| |||
Total returns, 12/31/21 to 12/31/22, at net asset value (NAV). Performance shown does not include applicable contingent deferred sales charges (CDSC) or front-end sales charges, which would have reduced performance. |
| |||
Class A Shares | -35.60 | % | ||
Class C Shares | -36.10 | |||
Class R Shares | -35.79 | |||
Class Y Shares | -35.44 | |||
Investor Class Shares | -35.58 | |||
Class R5 Shares | -35.39 | |||
Class R6 Shares | -35.35 | |||
S&P 500 Index▼ (Broad Market Index) | -18.11 | |||
Russell 2000 Growth Index▼ (Style-Specific Index) | -26.36 | |||
Lipper Small-Cap Growth Funds Index∎ (Peer Group Index) | -26.54 | |||
Source(s): ▼RIMES Technologies Corp.; ∎Lipper Inc. | ||||
Market conditions and your Fund
Equity markets declined in the first quarter of 2022 amid volatility sparked by Russia’s invasion of Ukraine, rising commodity prices, rampant global inflation and the US Federal Reserve’s (the Fed) shift toward tighter monetary policy. Russia’s invasion exacerbated inflation pressures, disrupting already strained supply chains and increasing shortages of oil, gas and raw materials. The price of oil rose sharply, with crude prices reaching their highest price per barrel since 2008.1 Inflation continued to be a top concern for consumers, investors and the Fed. To combat inflation, the Fed raised the federal funds rate by one-quarter percentage point in March and indicated it would “taper” its asset purchase program quickly.2
As the war in Ukraine continued and corporate earnings in high-profile names like Netflix reported slowing growth and profits, the equity markets sold off for much of April 2022. The downward direction of the equity markets continued into the second quarter of 2022 amid substantial inflation, rising interest rates and an increasing likelihood of a US recession. Driven by higher food and energy prices, the consumer price index rose by yet another 40-year high to 8.6% for the twelve months ended May 2022.3 Oil prices peaked near $122 per barrel in early June, resulting in skyrocketing gasoline prices; the national average price reached a record high, above $5 per gallon in early June.1 In an effort to tame inflation, the Fed raised the benchmark federal funds rate three more times, by 0.50% in May, by 0.75% in June and another 0.75% in July, which were the largest increases in nearly 30 years.2 US equity markets rose in July and August until Fed chairman Jerome Powell’s hawkish comments at an economic policy symposium held in
Jackson Hole, which sparked a sharp selloff at month-end. The Fed reiterated that it would continue taking aggressive action to curb inflation, even though such measures could “bring pain to households and businesses,” and the Fed raised the benchmark federal funds rate by another 0.75% in September.2
After experiencing a sharp drop in September 2022, US equity markets rebounded in October and November,4 despite mixed data on the economy and corporate earnings. However, the Fed’s message of continued rate hikes until data shows inflation meaningfully declining, sent markets lower in December.4 As energy prices declined,1 the rate of inflation slowed modestly in the fourth quarter.3 Corporate earnings generally met expectations, though companies provided cautious future guidance. With inflation still at multidecade highs and little evidence of a slowing economy, the Fed raised its target rate by 0.75% in November and by 0.50% in December, marking its highest level in over a decade.2
In this environment, US stocks had negative double-digit returns for the fiscal year of -18.11%, as measured by the S&P 500 Index.4
Given this environment, the Fund produced a negative return and underperformed its style-specific benchmark, the Russell 2000 Growth Index, during the fiscal year. A challenging macro-economic environment brought about by COVID-19 driven supply-chain disruptions and followed by Russia’s invasion of Ukraine meant that inflation would stay higher for longer and central banks would need to aggressively raise interest rates to combat record inflation levels. As a result of more persistent inflation and the Fed’s shift in interest rate policy, small caps and growth-oriented equities sold off as investors scrambled to reposition portfolios more defensively.
At a sector level, relative Fund performance was negatively impacted by stock selection in several sectors including health care, industrials, materials, information technology (IT), consumer staples and consumer discretionary. Stock selection in the energy sector was also a headwind, but the portfolio’s underweight relative to the benchmark was a bigger detractor to Fund performance as energy companies broadly experienced strong performance as supply-chain constraints and the ongoing war in Ukraine pushed energy prices higher. Active positioning relative to the benchmark in the IT and consumer staples sectors were also head-winds during the fiscal year. Alternatively, the leading contributors to relative Fund performance included stock selection in the financials, communication services, real estate and utilities sectors. An underweight in the real estate sector and the portfolio’s ancillary cash position also provided a boost to relative Fund performance during the fiscal year.
On an individual stock basis, the leading absolute detractor from Fund performance was Kornit Digital. Kornit Digital develops industrial and commercial printing solutions for apparel. Disappointing guidance driven by a slower pace of consumable purchases and the timing of new system deliveries weighed on stock performance. Additionally, rising interest rates and elevated geopolitical risks caused investor sentiment to sour on this higher-growth higher-valuation business. We sold our position during the fiscal year to reallocate capital into businesses with higher quality and more stable revenues.
Semiconductor company, Ambarella, after putting together a string of solid quarterly marks, reported in-line results and disappointing guidance due to supply-chain issues in the first half of 2022. Specifically, Ambarella’s long-time wafer supplier, Samsung reported that Ambarella’s supply would be constrained in the second quarter and could not quantify the impact for the second half of the fiscal year, which made the near-term outlook for the company much less compelling. We exited our position in this company during the fiscal year as a result.
Another leading absolute detractor from Fund performance was Ranpak Holdings, which makes paper packing material machines and proprietary paper products. Initial headwinds faced by Ranpak Holdings were due to enterprise software implementation downtime and supply-chain bottlenecks. Subsequently, with roughly 40-45% of the company’s sales coming from Europe, the fallout from the Ukraine war caused significant disruptions to the business. In an effort to reduce exposure to names with significant ties to Europe, we decided to exit our position in this company during the fiscal year.
The leading contributor to absolute Fund performance during the fiscal year was Halozyme Therapeutics, which is a biotechnology firm focused on the development of
| 2 | Invesco Small Cap Growth Fund |
novel oncology therapies used on human enzymes with the aim of altering tumors. Halozyme Therapetics’ share price received a boost after its acquisition of Antares (not a fund holding) and the subsequent solid reported earnings and revenue that beat analyst estimates. Revenue growth was 80.1%, which boosted third quarter adjusted earnings that were up 35% year-over-year. Management’s forward guidance was also upbeat due to robust demand for several of its therapies.
Another leading contributor to absolute Fund performance was LPL Financial, which did relatively well in the fiscal year versus other interest rate-sensitive stocks due to its ability to provide good interest rate exposure with less credit risk than a bank, while also delivering strong growth in assets under management as more registered investment advisors join the LPL platform. This is a continuation of trends that have been ongoing for several quarters.
Valmont Industries was also among the top absolute contributors to Fund performance during the fiscal year. Valmont Industries makes highly engineered steel structures and sells them to a variety of end markets, all of which are seeing solid demand growth and appear to have multi-year growth drivers relatively insulated from the broader economy. Valmont Industries also delivered decent earnings and modestly raised fourth quarter guidance.
We wish to remind you that all positioning changes are based on bottom-up stock selection, while disciplined portfolio construction acts as a risk control and ensures alignment with small-cap market sector exposure with modest over- and under-weights. The portfolio tends to have higher quality and larger market cap biases relative to its style-specific benchmark. Structural underweights include real estate investment trusts and pharma/biotech. To manage the risk of binary events, companies with either phase III clinical data showing proven efficacy or an existing revenue stream are preferred. Relative to the style-specific benchmark, the Fund’s largest sector overweights were in IT and consumer discretionary sectors. The largest sector underweights are in materials, energy and health care sectors.
The war in Ukraine has continued to drive market uncertainty and persistent inflationary pressure. The Fed continues to aggressively raise interest rates to combat inflation, causing meaningful slowing in housing and significantly tighter financial conditions. We believe, the US economy could enter a recession in 2023, as we expect the Fed will continue raising rates to combat inflation despite the weakening economy given the labor market remains healthy. We anticipate earnings expectations to further decline as we enter the new year and our overall outlook remains guarded. In this environment, we have repositioned the portfolio into high-quality, stable revenue and energy stocks and away from long-duration growth and cyclical revenue stocks.
Thank you for your commitment to the Invesco Small Cap Growth Fund and for sharing our long-term investment horizon.
| 1 | Source: Bloomberg LP |
| 2 | Source: US Federal Reserve |
| 3 | Source: US Bureau of Labor Statistics |
| 4 | Source: Lipper Inc. |
Portfolio manager(s):
Juan Hartsfield - Lead
Clay Manley
Justin Sander
The views and opinions expressed in management’s discussion of Fund performance are those of Invesco Advisers, Inc. and its affiliates. These views and opinions are subject to change at any time based on factors such as market and economic conditions. These views and opinions may not be relied upon as investment advice or recommendations, or as an offer for a particular security. The information is not a complete analysis of every aspect of any market, country, industry, security or the Fund. Statements of fact are from sources considered reliable, but Invesco Advisers, Inc. makes no representation or warranty as to their completeness or accuracy. Although historical performance is no guarantee of future results, these insights may help you understand our investment management philosophy.
See important Fund and, if applicable, index disclosures later in this report.
| 3 | Invesco Small Cap Growth Fund |
Your Fund’s Long-Term Performance
Results of a $10,000 Investment — Oldest Share Class(es)
Fund and index data from 12/31/12
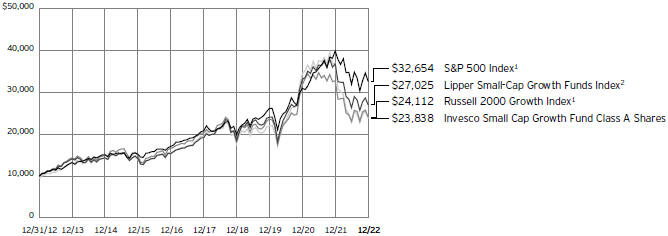
1 Source: RIMES Technologies Corp.
2 Source: Lipper Inc.
Past performance cannot guarantee future results.
The data shown in the chart include reinvested distributions, applicable sales charges and Fund expenses including management
fees. Index results include reinvested dividends, but they do not reflect sales charges. Performance of the peer group, if applicable, reflects fund expenses and management fees;
performance of a market index does not. Performance shown in the chart does not reflect deduction of taxes a shareholder would pay on Fund distributions or sale of Fund shares.
| 4 | Invesco Small Cap Growth Fund |
Average Annual Total Returns |
| |||
As of 12/31/22, including maximum applicable sales charges |
| |||
Class A Shares | ||||
Inception (10/18/95) | 9.47 | % | ||
10 Years | 9.08 | |||
5 Years | 3.01 | |||
1 Year | -39.13 | |||
Class C Shares | ||||
Inception (5/3/99) | 7.91 | % | ||
10 Years | 9.04 | |||
5 Years | 3.39 | |||
1 Year | -36.67 | |||
Class R Shares | ||||
Inception (6/3/02) | 7.99 | % | ||
10 Years | 9.41 | |||
5 Years | 3.91 | |||
1 Year | -35.79 | |||
Class Y Shares | ||||
Inception (10/3/08) | 10.62 | % | ||
10 Years | 9.97 | |||
5 Years | 4.44 | |||
1 Year | -35.44 | |||
Investor Class Shares | ||||
Inception (4/7/06) | 7.82 | % | ||
10 Years | 9.72 | |||
5 Years | 4.22 | |||
1 Year | -35.58 | |||
Class R5 Shares | ||||
Inception (3/15/02) | 8.19 | % | ||
10 Years | 10.10 | |||
5 Years | 4.55 | |||
1 Year | -35.39 | |||
Class R6 Shares | ||||
Inception (9/24/12) | 10.13 | % | ||
10 Years | 10.20 | |||
5 Years | 4.64 | |||
1 Year | -35.35 | |||
The performance data quoted represent past performance and cannot guarantee future results; current performance may be lower or higher. Please visit invesco.com/performance for the most recent month-end performance. Performance figures reflect reinvested distributions, changes in net asset value and the effect of the maximum sales charge unless otherwise stated. Performance figures do not reflect deduction of taxes a shareholder would pay on Fund distributions or sale of Fund shares. Investment return and principal value will fluctuate so that you may have a gain or loss when you sell shares.
Class A share performance reflects the maximum 5.50% sales charge, and Class C share performance reflects the applicable contingent deferred sales charge (CDSC) for the period involved. The CDSC on Class C shares is 1% for the first year after purchase. Class R, Class Y, Investor Class, Class R5 and Class R6 shares do not have a front-end sales charge or a CDSC; therefore, performance is at net asset value.
The performance of the Fund’s share classes will differ primarily due to different sales charge structures and class expenses.
Fund performance reflects any applicable fee waivers and/or expense reimbursements. Had the adviser not waived fees and/or reimbursed expenses currently or in the past, returns would have been lower. See current prospectus for more information.
| 5 | Invesco Small Cap Growth Fund |
Invesco Small Cap Growth Fund’s investment objective is long-term growth of capital.
| ∎ | Unless otherwise stated, information presented in this report is as of December 31, 2022, and is based on total net assets. |
| ∎ | Unless otherwise noted, all data is provided by Invesco. |
| ∎ | To access your Fund’s reports/prospectus, visit invesco.com/fundreports. |
About indexes used in this report
| ∎ | The S&P 500® Index is an unmanaged index considered representative of the US stock market. |
| ∎ | The Russell 2000® Growth Index is an unmanaged index considered representative of small-cap growth stocks. The Russell 2000 Growth Index is a trademark/service mark of the Frank Russell Co. Russell® is a trademark of the Frank Russell Co. |
| ∎ | The Lipper Small-Cap Growth Funds Index is an unmanaged index considered representative of small-cap growth funds tracked by Lipper. |
| ∎ | The Fund is not managed to track the performance of any particular index, including the index(es) described here, and consequently, the performance of the Fund may deviate significantly from the performance of the index(es). |
| ∎ | A direct investment cannot be made in an index. Unless otherwise indicated, index results include reinvested dividends, and they do not reflect sales charges. Performance of the peer group, if applicable, reflects fund expenses; performance of a market index does not. |
This report must be accompanied or preceded by a currently effective Fund prospectus, which contains more complete information, including sales charges and expenses. Investors should read it carefully before investing. |
| NOT FDIC INSURED | MAY LOSE VALUE | NO BANK GUARANTEE |
| 6 | Invesco Small Cap Growth Fund |
Fund Information
Portfolio Composition
| By sector | % of total net assets | ||||
Health Care | 22.41 | % | |||
Information Technology | 22.11 | ||||
Industrials | 18.15 | ||||
Consumer Discretionary | 13.01 | ||||
Financials | 5.88 | ||||
Energy | 5.16 | ||||
Consumer Staples | 4.48 | ||||
Communication Services | 2.30 | ||||
Other Sectors, Each Less than 2% of Net Assets | 4.62 | ||||
Money Market Funds Plus Other Assets Less Liabilities | 1.88 | ||||
Top 10 Equity Holdings*
| % of total net assets | |||||||
| 1. | Halozyme Therapeutics, Inc. | 2.22 | % | ||||
| 2. | Valmont Industries, Inc. | 2.16 | |||||
| 3. | AECOM | 2.05 | |||||
| 4. | Evoqua Water Technologies Corp. | 1.91 | |||||
| 5. | Impinj, Inc. | 1.67 | |||||
| 6. | Iridium Communications, Inc. | 1.58 | |||||
| 7. | Clean Harbors, Inc. | 1.51 | |||||
| 8. | Performance Food Group Co. | 1.47 | |||||
| 9. | Allegro MicroSystems, Inc. | 1.41 | |||||
| 10. | Texas Roadhouse, Inc. | 1.36 | |||||
The Fund’s holdings are subject to change, and there is no assurance that the Fund will continue to hold any particular security.
| * | Excluding money market fund holdings, if any. |
Data presented here are as of December 31, 2022.
| 7 | Invesco Small Cap Growth Fund |
December 31, 2022
| Shares | Value | |||||||
| ||||||||
Common Stocks & Other Equity Interests–98.12% |
| |||||||
Aerospace & Defense–1.57% | ||||||||
BWX Technologies, Inc. | 345,678 | $ | 20,076,978 | |||||
| ||||||||
Mercury Systems, Inc.(b)(c) | 351,979 | 15,747,541 | ||||||
| ||||||||
| 35,824,519 | ||||||||
| ||||||||
Air Freight & Logistics–0.73% | ||||||||
GXO Logistics, Inc.(b)(c) | 388,499 | 16,585,022 | ||||||
| ||||||||
Alternative Carriers–1.58% | ||||||||
Iridium Communications, Inc.(b) | 700,917 | 36,027,134 | ||||||
| ||||||||
Apparel, Accessories & Luxury Goods–0.99% |
| |||||||
Kontoor Brands, Inc.(c) | 564,417 | 22,571,036 | ||||||
| ||||||||
Application Software–8.11% | ||||||||
Altair Engineering, Inc., Class A(b)(c) | 469,261 | 21,337,298 | ||||||
| ||||||||
CCC Intelligent Solutions Holdings, Inc.(b)(c) | 1,645,329 | 14,314,362 | ||||||
| ||||||||
Clearwater Analytics Holdings, | 174,899 | 3,279,356 | ||||||
| ||||||||
Descartes Systems Group, Inc. (The) (Canada)(b) | 339,249 | 23,628,693 | ||||||
| ||||||||
Guidewire Software, Inc.(b)(c) | 299,275 | 18,722,644 | ||||||
| ||||||||
HashiCorp, Inc., Class A(b)(c) | 209,286 | 5,721,879 | ||||||
| ||||||||
Manhattan Associates, Inc.(b) | 196,795 | 23,890,913 | ||||||
| ||||||||
Paycor HCM, Inc.(b)(c) | 625,413 | 15,303,856 | ||||||
| ||||||||
Procore Technologies, Inc.(b)(c) | 388,127 | 18,311,832 | ||||||
| ||||||||
Sprout Social, Inc., Class A(b)(c) | 362,238 | 20,451,958 | ||||||
| ||||||||
Workiva, Inc.(b)(c) | 236,061 | 19,822,042 | ||||||
| ||||||||
| 184,784,833 | ||||||||
| ||||||||
Asset Management & Custody Banks–0.18% |
| |||||||
Blucora, Inc.(b) | 158,233 | 4,039,688 | ||||||
| ||||||||
Auto Parts & Equipment–1.83% | ||||||||
Fox Factory Holding Corp.(b)(c) | 252,523 | 23,037,673 | ||||||
| ||||||||
Gentherm, Inc.(b)(c) | 285,951 | 18,669,741 | ||||||
| ||||||||
| 41,707,414 | ||||||||
| ||||||||
Biotechnology–6.01% | ||||||||
Abcam PLC, ADR (United | 1,414,030 | 22,002,307 | ||||||
| ||||||||
Apellis Pharmaceuticals, Inc.(b)(c) | 191,293 | 9,891,761 | ||||||
| ||||||||
Cytokinetics, Inc.(b)(c) | 232,808 | 10,667,263 | ||||||
| ||||||||
Halozyme Therapeutics, Inc.(b)(c) | 889,647 | 50,620,914 | ||||||
| ||||||||
Intellia Therapeutics, Inc.(b)(c) | 159,568 | 5,567,328 | ||||||
| ||||||||
Karuna Therapeutics, Inc.(b)(c) | 51,115 | 10,044,097 | ||||||
| ||||||||
Mirati Therapeutics, Inc.(b)(c) | 126,311 | 5,723,151 | ||||||
| ||||||||
Natera, Inc.(b)(c) | 559,060 | 22,457,440 | ||||||
| ||||||||
| 136,974,261 | ||||||||
| ||||||||
Communications Equipment–1.31% |
| |||||||
Calix, Inc.(b) | 434,564 | 29,737,215 | ||||||
| ||||||||
Construction & Engineering–5.29% |
| |||||||
AECOM | 548,521 | 46,585,889 | ||||||
| ||||||||
Construction Partners, Inc., Class A(b) | 930,005 | 24,821,833 | ||||||
| ||||||||
Valmont Industries, Inc. | 148,733 | 49,181,541 | ||||||
| ||||||||
| 120,589,263 | ||||||||
| ||||||||
| Shares | Value | |||||||
| ||||||||
Data Processing & Outsourced Services–2.57% |
| |||||||
ExlService Holdings, Inc.(b) | 150,832 | $ | 25,555,466 | |||||
| ||||||||
Flywire Corp.(b)(c) | 748,526 | 18,316,431 | ||||||
| ||||||||
Verra Mobility Corp.(b)(c) | 1,063,006 | 14,701,373 | ||||||
| ||||||||
| 58,573,270 | ||||||||
| ||||||||
Distributors–0.98% | ||||||||
Pool Corp. | 73,786 | 22,307,721 | ||||||
| ||||||||
Diversified Metals & Mining–0.18% |
| |||||||
MP Materials Corp.(b)(c) | 164,327 | 3,989,860 | ||||||
| ||||||||
Education Services–0.59% | ||||||||
Stride, Inc.(b)(c) | 429,410 | 13,431,945 | ||||||
| ||||||||
Electronic Components–1.13% | ||||||||
Littelfuse, Inc. | 116,510 | 25,655,502 | ||||||
| ||||||||
Electronic Manufacturing Services–1.06% |
| |||||||
Flex Ltd.(b) | 1,120,118 | 24,037,732 | ||||||
| ||||||||
Environmental & Facilities Services–1.50% |
| |||||||
Clean Harbors, Inc.(b) | 300,360 | 34,277,083 | ||||||
| ||||||||
Financial Exchanges & Data–2.30% |
| |||||||
Morningstar, Inc. | 139,593 | 30,234,448 | ||||||
| ||||||||
TMX Group Ltd. (Canada) | 220,269 | 22,046,421 | ||||||
| ||||||||
| 52,280,869 | ||||||||
| ||||||||
Food Distributors–1.47% | ||||||||
Performance Food Group Co.(b) | 573,837 | 33,506,342 | ||||||
| ||||||||
Food Retail–0.61% | ||||||||
Grocery Outlet Holding Corp.(b)(c) | 475,562 | 13,881,655 | ||||||
| ||||||||
Gas Utilities–0.88% | ||||||||
New Jersey Resources Corp. | 405,305 | 20,111,234 | ||||||
| ||||||||
Health Care Equipment–6.53% | ||||||||
AtriCure, Inc.(b)(c) | 550,431 | 24,428,128 | ||||||
| ||||||||
Axonics, Inc.(b)(c) | 241,181 | 15,081,048 | ||||||
| ||||||||
Globus Medical, Inc., Class A(b)(c) | 296,510 | 22,021,798 | ||||||
| ||||||||
Inari Medical, Inc.(b)(c) | 390,587 | 24,825,710 | ||||||
| ||||||||
Insulet Corp.(b)(c) | 97,786 | 28,787,220 | ||||||
| ||||||||
iRhythm Technologies, Inc.(b)(c) | 195,012 | 18,266,774 | ||||||
| ||||||||
Mesa Laboratories, Inc.(c) | 91,919 | 15,277,857 | ||||||
| ||||||||
| 148,688,535 | ||||||||
| ||||||||
Health Care Facilities–1.15% | ||||||||
Acadia Healthcare Co., Inc.(b) | 317,540 | 26,139,893 | ||||||
| ||||||||
Health Care Services–2.07% | ||||||||
Chemed Corp. | 49,248 | 25,137,657 | ||||||
| ||||||||
Guardant Health, Inc.(b)(c) | 204,301 | 5,556,987 | ||||||
| ||||||||
R1 RCM, Inc.(b)(c) | 1,505,396 | 16,484,086 | ||||||
| ||||||||
| 47,178,730 | ||||||||
| ||||||||
Health Care Supplies–0.54% | ||||||||
Lantheus Holdings, Inc.(b) | 243,364 | 12,401,829 | ||||||
| ||||||||
Health Care Technology–1.47% | ||||||||
Doximity, Inc., Class A(b)(c) | 479,603 | 16,095,477 | ||||||
| ||||||||
See accompanying Notes to Financial Statements which are an integral part of the financial statements.
| 8 | Invesco Small Cap Growth Fund |
| Shares | Value | |||||||
| ||||||||
Health Care Technology–(continued) |
| |||||||
Evolent Health, Inc., Class A(b)(c) | 616,728 | $ | 17,317,722 | |||||
| ||||||||
| 33,413,199 | ||||||||
| ||||||||
Hotels, Resorts & Cruise Lines–2.03% |
| |||||||
Marriott Vacations Worldwide Corp. | 214,842 | 28,915,585 | ||||||
| ||||||||
Wyndham Hotels & Resorts, Inc. | 241,450 | 17,217,799 | ||||||
| ||||||||
| 46,133,384 | ||||||||
| ||||||||
Human Resource & Employment Services–0.75% |
| |||||||
ASGN, Inc.(b) | 210,022 | 17,112,593 | ||||||
| ||||||||
Industrial Machinery–3.92% | ||||||||
Chart Industries, Inc.(b)(c) | 144,733 | 16,677,584 | ||||||
| ||||||||
Evoqua Water Technologies Corp.(b) | 1,096,304 | 43,413,638 | ||||||
| ||||||||
Nordson Corp. | 122,553 | 29,133,299 | ||||||
| ||||||||
| 89,224,521 | ||||||||
| ||||||||
Industrial REITs–1.75% | ||||||||
EastGroup Properties, Inc. | 163,308 | 24,179,383 | ||||||
| ||||||||
Terreno Realty Corp. | 274,283 | 15,598,474 | ||||||
| ||||||||
| 39,777,857 | ||||||||
| ||||||||
Insurance Brokers–0.98% | ||||||||
BRP Group, Inc., Class A(b)(c) | 887,888 | 22,321,504 | ||||||
| ||||||||
Interactive Media & Services–0.72% |
| |||||||
Shutterstock, Inc.(c) | 312,513 | 16,475,685 | ||||||
| ||||||||
Internet & Direct Marketing Retail–0.45% |
| |||||||
Overstock.com, Inc.(b)(c) | 527,511 | 10,212,613 | ||||||
| ||||||||
Investment Banking & Brokerage–0.66% |
| |||||||
LPL Financial Holdings, Inc. | 69,953 | 15,121,740 | ||||||
| ||||||||
IT Consulting & Other Services–0.59% |
| |||||||
Perficient, Inc.(b) | 191,963 | 13,404,776 | ||||||
| ||||||||
Leisure Facilities–1.30% | ||||||||
Planet Fitness, Inc., Class A(b)(c) | 376,783 | 29,690,500 | ||||||
| ||||||||
Life Sciences Tools & Services–1.29% |
| |||||||
Repligen Corp.(b)(c) | 173,479 | 29,371,729 | ||||||
| ||||||||
Motorcycle Manufacturers–1.20% | ||||||||
Harley-Davidson, Inc. | 654,980 | 27,247,168 | ||||||
| ||||||||
Oil & Gas Equipment & Services–0.97% |
| |||||||
ChampionX Corp. | 758,446 | 21,987,350 | ||||||
| ||||||||
Oil & Gas Exploration & Production–4.19% |
| |||||||
Chord Energy Corp. | 152,669 | 20,886,646 | ||||||
| ||||||||
Matador Resources Co. | 510,628 | 29,228,347 | ||||||
| ||||||||
Permian Resources Corp.(c) | 1,838,431 | 17,281,251 | ||||||
| ||||||||
Range Resources Corp. | 566,683 | 14,178,409 | ||||||
| ||||||||
SM Energy Co. | 394,901 | 13,754,402 | ||||||
| ||||||||
| 95,329,055 | ||||||||
| ||||||||
Packaged Foods & Meats–2.40% | ||||||||
Freshpet, Inc.(b)(c) | 290,215 | 15,314,646 | ||||||
| ||||||||
Post Holdings, Inc.(b) | 225,677 | 20,369,606 | ||||||
| ||||||||
Simply Good Foods Co. (The)(b)(c) | 499,073 | 18,979,746 | ||||||
| ||||||||
| 54,663,998 | ||||||||
| ||||||||
Pharmaceuticals–3.35% | ||||||||
Arvinas, Inc.(b)(c) | 235,104 | 8,042,908 | ||||||
| ||||||||
| Shares | Value | |||||||
| ||||||||
Pharmaceuticals–(continued) | ||||||||
Harmony Biosciences Holdings, Inc.(b)(c) | 358,185 | $ | 19,735,993 | |||||
| ||||||||
Intra-Cellular Therapies, Inc.(b)(c) | 263,924 | 13,966,858 | ||||||
| ||||||||
Pacira BioSciences, Inc.(b)(c) | 395,237 | 15,260,101 | ||||||
| ||||||||
Prestige Consumer Healthcare, | 309,021 | 19,344,715 | ||||||
| ||||||||
| 76,350,575 | ||||||||
| ||||||||
Property & Casualty Insurance–1.76% |
| |||||||
Hanover Insurance Group, Inc. (The) | 158,533 | 21,422,564 | ||||||
| ||||||||
Selective Insurance Group, Inc. | 211,912 | 18,777,523 | ||||||
| ||||||||
| 40,200,087 | ||||||||
| ||||||||
Research & Consulting Services–2.23% |
| |||||||
CACI International, Inc., Class A(b) | 65,995 | 19,837,437 | ||||||
| ||||||||
Clarivate PLC(b) | 830,751 | 6,928,463 | ||||||
| ||||||||
KBR, Inc. | 455,383 | 24,044,223 | ||||||
| ||||||||
| 50,810,123 | ||||||||
| ||||||||
Restaurants–2.53% | ||||||||
Texas Roadhouse, Inc. | 339,128 | 30,843,691 | ||||||
| ||||||||
Wingstop, Inc.(c) | 195,124 | 26,852,965 | ||||||
| ||||||||
| 57,696,656 | ||||||||
| ||||||||
Semiconductor Equipment–0.53% |
| |||||||
MKS Instruments, Inc. | 141,330 | 11,974,891 | ||||||
| ||||||||
Semiconductors–5.55% | ||||||||
Allegro MicroSystems, Inc. | 1,071,816 | 32,175,916 | ||||||
| ||||||||
Diodes, Inc.(b) | 203,034 | 15,459,009 | ||||||
| ||||||||
Impinj, Inc.(b) | 347,692 | 37,961,013 | ||||||
| ||||||||
Lattice Semiconductor Corp.(b) | 362,717 | 23,533,079 | ||||||
| ||||||||
Power Integrations, Inc.(c) | 241,803 | 17,342,111 | ||||||
| ||||||||
| 126,471,128 | ||||||||
| ||||||||
Specialty Chemicals–0.85% | ||||||||
Element Solutions, Inc. | 1,067,560 | 19,418,916 | ||||||
| ||||||||
Specialty Stores–1.11% | ||||||||
National Vision Holdings, Inc.(b)(c) | 653,930 | 25,346,327 | ||||||
| ||||||||
Steel–0.12% | ||||||||
Cleveland-Cliffs, Inc.(b)(c) | 163,653 | 2,636,450 | ||||||
| ||||||||
Systems Software–1.26% | ||||||||
Gitlab, Inc., Class A(b)(c) | 262,558 | 11,930,636 | ||||||
| ||||||||
KnowBe4, Inc., Class A(b)(c) | 673,603 | 16,691,882 | ||||||
| ||||||||
| 28,622,518 | ||||||||
| ||||||||
Trading Companies & Distributors–1.28% |
| |||||||
WESCO International, Inc.(b) | 233,372 | 29,218,174 | ||||||
| ||||||||
Trucking–0.88% | ||||||||
Saia, Inc.(b)(c) | 95,410 | 20,005,569 | ||||||
| ||||||||
Water Utilities–0.84% | ||||||||
American States Water Co. | 205,990 | 19,064,375 | ||||||
| ||||||||
Total Common Stocks & Other Equity Interests |
| 2,234,606,046 | ||||||
| ||||||||
Money Market Funds–1.98% |
| |||||||
Invesco Government & Agency Portfolio, Institutional Class, 4.22%(d)(e) | 16,145,133 | 16,145,133 | ||||||
| ||||||||
Invesco Liquid Assets Portfolio, Institutional Class, 4.42%(d)(e) | 10,560,914 | 10,564,083 | ||||||
| ||||||||
See accompanying Notes to Financial Statements which are an integral part of the financial statements.
| 9 | Invesco Small Cap Growth Fund |
| Shares | Value | |||||||
| ||||||||
Money Market Funds–(continued) |
| |||||||
Invesco Treasury Portfolio, Institutional Class, 4.20%(d)(e) | 18,451,581 | $ | 18,451,581 | |||||
| ||||||||
Total Money Market Funds |
| 45,160,797 | ||||||
| ||||||||
TOTAL INVESTMENTS IN SECURITIES |
| 2,279,766,843 | ||||||
| ||||||||
Investments Purchased with Cash Collateral from Securities on Loan |
| |||||||
Money Market Funds–19.54% |
| |||||||
Invesco Private Government Fund, 4.28%(d)(e)(f) | 125,264,649 | 125,264,649 | ||||||
| ||||||||
| Shares | Value | |||||||
| ||||||||
Money Market Funds–(continued) |
| |||||||
Invesco Private Prime Fund, 4.46%(d)(e)(f) | 319,540,822 | $ | 319,636,680 | |||||
| ||||||||
Total Investments Purchased with Cash Collateral from Securities on Loan |
| 444,901,329 | ||||||
| ||||||||
TOTAL INVESTMENTS IN |
| 2,724,668,172 | ||||||
| ||||||||
OTHER ASSETS LESS LIABILITIES–(19.64)% |
| (447,201,958 | ) | |||||
| ||||||||
NET ASSETS–100.00% |
| $ | 2,277,466,214 | |||||
| ||||||||
Investment Abbreviations:
ADR – American Depositary Receipt
REIT – Real Estate Investment Trust
Notes to Schedule of Investments:
| (a) | Industry and/or sector classifications used in this report are generally according to the Global Industry Classification Standard, which was developed by and is the exclusive property and a service mark of MSCI Inc. and Standard & Poor’s. |
| (b) | Non-income producing security. |
| (c) | All or a portion of this security was out on loan at December 31, 2022. |
| (d) | Affiliated issuer. The issuer and/or the Fund is a wholly-owned subsidiary of Invesco Ltd., or is affiliated by having an investment adviser that is under common control of Invesco Ltd. The table below shows the Fund’s transactions in, and earnings from, its investments in affiliates for the fiscal year ended December 31, 2022. |
Value December 31, 2021 | Purchases at Cost | Proceeds from Sales | Change in Unrealized Appreciation | Realized Gain (Loss) | Value December 31, 2022 | Dividend Income | ||||||||||||||||||||||
| Investments in Affiliated Money Market Funds: | ||||||||||||||||||||||||||||
Invesco Government & Agency Portfolio, Institutional Class | $ | 32,241,983 | $ | 202,047,435 | $ | (218,144,285 | ) | $ | - | $ | - | $ | 16,145,133 | $ | 457,867 | |||||||||||||
Invesco Liquid Assets Portfolio, Institutional Class | 22,057,639 | 144,319,597 | (155,817,347 | ) | 5,064 | (870) | 10,564,083 | 320,289 | ||||||||||||||||||||
Invesco Treasury Portfolio, Institutional Class | 36,847,981 | 230,911,355 | (249,307,755 | ) | - | - | 18,451,581 | 510,499 | ||||||||||||||||||||
| Investments Purchased with Cash Collateral from Securities on Loan: | ||||||||||||||||||||||||||||
Invesco Private Government Fund | 206,465,257 | 777,796,345 | (858,996,953 | ) | - | - | 125,264,649 | 2,368,243* | ||||||||||||||||||||
Invesco Private Prime Fund | 480,543,174 | 1,704,322,126 | (1,865,291,471 | ) | 100,810 | (37,959) | 319,636,680 | 6,513,400* | ||||||||||||||||||||
Total | $ | 778,156,034 | $ | 3,059,396,858 | $ | (3,347,557,811 | ) | $ | 105,874 | $ | (38,829) | $ | 490,062,126 | $ | 10,170,298 | |||||||||||||
| * | Represents the income earned on the investment of cash collateral, which is included in securities lending income on the Statement of Operations. Does not include rebates and fees paid to lending agent or premiums received from borrowers, if any. |
| (e) | The rate shown is the 7-day SEC standardized yield as of December 31, 2022. |
| (f) | The security has been segregated to satisfy the commitment to return the cash collateral received in securities lending transactions upon the borrower’s return of the securities loaned. See Note 1I. |
See accompanying Notes to Financial Statements which are an integral part of the financial statements.
| 10 | Invesco Small Cap Growth Fund |
Statement of Assets and Liabilities
December 31, 2022
Assets: | ||||
Investments in unaffiliated securities, at value (Cost $2,119,183,543)* | $ | 2,234,606,046 | ||
| ||||
Investments in affiliated money market funds, at value (Cost $490,002,920) | 490,062,126 | |||
| ||||
Receivable for: | ||||
Fund shares sold | 3,593,164 | |||
| ||||
Dividends | 1,147,017 | |||
| ||||
Investment for trustee deferred compensation and retirement plans | 335,326 | |||
| ||||
Other assets | 80,313 | |||
| ||||
Total assets | 2,729,823,992 | |||
| ||||
Liabilities: | ||||
Payable for: | ||||
Fund shares reacquired | 5,447,088 | |||
| ||||
Amount due custodian | 63,244 | |||
| ||||
Amount due custodian - foreign currency, at value (Cost $328,370) | 328,957 | |||
| ||||
Collateral upon return of securities loaned | 444,847,188 | |||
| ||||
Accrued fees to affiliates | 1,163,315 | |||
| ||||
Accrued trustees’ and officers’ fees and benefits | 6,182 | |||
| ||||
Accrued other operating expenses | 128,477 | |||
| ||||
Trustee deferred compensation and retirement plans | 373,327 | |||
| ||||
Total liabilities | 452,357,778 | |||
| ||||
Net assets applicable to shares outstanding | $ | 2,277,466,214 | ||
| ||||
Net assets consist of: | ||||
Shares of beneficial interest | $ | 2,404,252,346 | ||
| ||||
Distributable earnings (loss) | (126,786,132 | ) | ||
| ||||
| $ | 2,277,466,214 | |||
| ||||
Net Assets: | ||||
Class A | $ | 541,921,681 | ||
| ||||
Class C | $ | 7,123,230 | ||
| ||||
Class R | $ | 63,160,502 | ||
| ||||
Class Y | $ | 129,517,851 | ||
| ||||
Investor Class | $ | 144,075,013 | ||
| ||||
Class R5 | $ | 737,830,236 | ||
| ||||
Class R6 | $ | 653,837,701 | ||
| ||||
Shares outstanding, no par value, with an unlimited number of shares authorized: |
| |||
Class A | 23,993,715 | |||
| ||||
Class C | 1,004,303 | |||
| ||||
Class R | 3,355,156 | |||
| ||||
Class Y | 5,300,230 | |||
| ||||
Investor Class | 5,760,965 | |||
| ||||
Class R5 | 25,334,720 | |||
| ||||
Class R6 | 22,132,392 | |||
| ||||
Class A: | ||||
Net asset value per share | $ | 22.59 | ||
| ||||
Maximum offering price per share | $ | 23.90 | ||
| ||||
Class C: | ||||
Net asset value and offering price per share | $ | 7.09 | ||
| ||||
Class R: | ||||
Net asset value and offering price per share | $ | 18.82 | ||
| ||||
Class Y: | ||||
Net asset value and offering price per share | $ | 24.44 | ||
| ||||
Investor Class: | ||||
Net asset value and offering price per share | $ | 25.01 | ||
| ||||
Class R5: | ||||
Net asset value and offering price per share | $ | 29.12 | ||
| ||||
Class R6: | ||||
Net asset value and offering price per share | $ | 29.54 | ||
| ||||
| * | At December 31, 2022, securities with an aggregate value of $433,594,398 were on loan to brokers. |
See accompanying Notes to Financial Statements which are an integral part of the financial statements.
| 11 | Invesco Small Cap Growth Fund |
Statement of Operations
For the year ended December 31, 2022
Investment income: | ||||
Dividends (net of foreign withholding taxes of $391,935) | $ | 14,864,824 | ||
| ||||
Dividends from affiliated money market funds (includes net securities lending income of $629,347) | 1,918,002 | |||
| ||||
Total investment income | 16,782,826 | |||
| ||||
Expenses: | ||||
Advisory fees | 18,252,588 | |||
| ||||
Administrative services fees | 400,436 | |||
| ||||
Custodian fees | 26,111 | |||
| ||||
Distribution fees: | ||||
Class A | 1,612,775 | |||
| ||||
Class C | 92,508 | |||
| ||||
Class R | 365,222 | |||
| ||||
Investor Class | 373,788 | |||
| ||||
Transfer agent fees – A, C, R, Y and Investor | 2,147,742 | |||
| ||||
Transfer agent fees – R5 | 861,262 | |||
| ||||
Transfer agent fees – R6 | 253,130 | |||
| ||||
Trustees’ and officers’ fees and benefits | 38,196 | |||
| ||||
Registration and filing fees | 182,484 | |||
| ||||
Reports to shareholders | 52,107 | |||
| ||||
Professional services fees | 67,274 | |||
| ||||
Other | 22,418 | |||
| ||||
Total expenses | 24,748,041 | |||
| ||||
Less: Fees waived and/or expense offset arrangement(s) | (79,396 | ) | ||
| ||||
Net expenses | 24,668,645 | |||
| ||||
Net investment income (loss) | (7,885,819 | ) | ||
| ||||
Realized and unrealized gain (loss) from: | ||||
Net realized gain (loss) from: | ||||
Unaffiliated investment securities | (238,491,039 | ) | ||
| ||||
Affiliated investment securities | (38,829 | ) | ||
| ||||
Foreign currencies | (11,935 | ) | ||
| ||||
| (238,541,803 | ) | |||
| ||||
Change in net unrealized appreciation (depreciation) of: | ||||
Unaffiliated investment securities | (1,152,783,506 | ) | ||
| ||||
Affiliated investment securities | 105,874 | |||
| ||||
Foreign currencies | (592 | ) | ||
| ||||
| (1,152,678,224 | ) | |||
| ||||
Net realized and unrealized gain (loss) | (1,391,220,027 | ) | ||
| ||||
Net increase (decrease) in net assets resulting from operations | $ | (1,399,105,846 | ) | |
| ||||
See accompanying Notes to Financial Statements which are an integral part of the financial statements.
| 12 | Invesco Small Cap Growth Fund |
Statement of Changes in Net Assets
For the years ended December 31, 2022 and 2021
| 2022 | 2021 | |||||||
| ||||||||
Operations: | ||||||||
Net investment income (loss) | $ | (7,885,819 | ) | $ | (26,494,192 | ) | ||
| ||||||||
Net realized gain (loss) | (238,541,803 | ) | 1,001,871,425 | |||||
| ||||||||
Change in net unrealized appreciation (depreciation) | (1,152,678,224 | ) | (666,041,368 | ) | ||||
| ||||||||
Net increase (decrease) in net assets resulting from operations | (1,399,105,846 | ) | 309,335,865 | |||||
| ||||||||
Distributions to shareholders from distributable earnings: | ||||||||
Class A | (19,053,290 | ) | (275,936,062 | ) | ||||
| ||||||||
Class C | (735,601 | ) | (8,582,087 | ) | ||||
| ||||||||
Class R | (2,614,949 | ) | (35,223,437 | ) | ||||
| ||||||||
Class Y | (4,238,695 | ) | (73,341,959 | ) | ||||
| ||||||||
Investor Class | (4,575,585 | ) | (64,327,342 | ) | ||||
| ||||||||
Class R5 | (19,883,252 | ) | (335,205,984 | ) | ||||
| ||||||||
Class R6 | (17,908,330 | ) | (217,106,044 | ) | ||||
| ||||||||
Total distributions from distributable earnings | (69,009,702 | ) | (1,009,722,915 | ) | ||||
| ||||||||
Share transactions–net: | ||||||||
Class A | (86,561,713 | ) | 140,560,393 | |||||
| ||||||||
Class C | (2,682,507 | ) | 1,528,656 | |||||
| ||||||||
Class R | (8,308,052 | ) | 1,007,244 | |||||
| ||||||||
Class Y | (45,751,085 | ) | 24,362,032 | |||||
| ||||||||
Investor Class | (11,353,774 | ) | 43,079,148 | |||||
| ||||||||
Class R5 | (227,541,022 | ) | 99,863,661 | |||||
| ||||||||
Class R6 | 95,968,061 | 263,617,470 | ||||||
| ||||||||
Net increase (decrease) in net assets resulting from share transactions | (286,230,092 | ) | 574,018,604 | |||||
| ||||||||
Net increase (decrease) in net assets | (1,754,345,640 | ) | (126,368,446 | ) | ||||
| ||||||||
Net assets: | ||||||||
Beginning of year | 4,031,811,854 | 4,158,180,300 | ||||||
| ||||||||
End of year | $ | 2,277,466,214 | $ | 4,031,811,854 | ||||
| ||||||||
See accompanying Notes to Financial Statements which are an integral part of the financial statements.
| 13 | Invesco Small Cap Growth Fund |
The following schedule presents financial highlights for a share of the Fund outstanding throughout the periods indicated.
| Net asset value, beginning of period | Net investment income (loss)(a) | Net gains on securities | Total from investment operations | Distributions from net realized gains | Net asset of period | Total return (b) | Net assets, end of period (000’s omitted) | Ratio of net assets | Ratio of fee waivers | Ratio of net investment to average | Portfolio turnover (c) | |||||||||||||||||||||||||||||||||||||
Class A | ||||||||||||||||||||||||||||||||||||||||||||||||
Year ended 12/31/22 | $36.33 | $(0.14 | ) | $(12.79 | ) | $(12.93 | ) | $ (0.81 | ) | $22.59 | (35.60 | )% | $ 541,922 | 1.16 | % | 1.16 | % | (0.54 | )% | 44 | % | |||||||||||||||||||||||||||
Year ended 12/31/21 | 47.78 | (0.43 | ) | 3.12 | 2.69 | (14.14 | ) | 36.33 | 7.33 | 988,307 | 1.14 | 1.14 | (0.86 | ) | 35 | |||||||||||||||||||||||||||||||||
Year ended 12/31/20 | 35.35 | (0.35 | ) | 19.40 | 19.05 | (6.62 | ) | 47.78 | 57.00 | 1,047,921 | 1.15 | 1.15 | (0.90 | ) | 51 | |||||||||||||||||||||||||||||||||
Year ended 12/31/19 | 31.02 | (0.09 | ) | 7.59 | 7.50 | (3.17 | ) | 35.35 | 24.32 | 499,603 | 1.17 | 1.17 | (0.25 | ) | 31 | |||||||||||||||||||||||||||||||||
Year ended 12/31/18 | 37.31 | (0.18 | ) | (3.08 | ) | (3.26 | ) | (3.03 | ) | 31.02 | (9.04 | ) | 502,315 | 1.18 | 1.18 | (0.47 | ) | 21 | ||||||||||||||||||||||||||||||
Class C | ||||||||||||||||||||||||||||||||||||||||||||||||
Year ended 12/31/22 | 12.36 | (0.11 | ) | (4.35 | ) | (4.46 | ) | (0.81 | ) | 7.09 | (36.10 | ) | 7,123 | 1.91 | 1.91 | (1.29 | ) | 44 | ||||||||||||||||||||||||||||||
Year ended 12/31/21 | 25.63 | (0.41 | ) | 1.28 | 0.87 | (14.14 | ) | 12.36 | 6.55 | (d) | 15,850 | 1.86 | (d) | 1.86 | (d) | (1.58 | )(d) | 35 | ||||||||||||||||||||||||||||||
Year ended 12/31/20 | 21.39 | (0.38 | ) | 11.24 | 10.86 | (6.62 | ) | 25.63 | 55.86 | (d) | 21,567 | 1.87 | (d) | 1.87 | (d) | (1.62 | )(d) | 51 | ||||||||||||||||||||||||||||||
Year ended 12/31/19 | 19.95 | (0.23 | ) | 4.84 | 4.61 | (3.17 | ) | 21.39 | 23.32 | 3,686 | 1.92 | 1.92 | (1.00 | ) | 31 | |||||||||||||||||||||||||||||||||
Year ended 12/31/18 | 25.33 | (0.32 | ) | (2.03 | ) | (2.35 | ) | (3.03 | ) | 19.95 | (9.72 | ) | 11,053 | 1.93 | 1.93 | (1.22 | ) | 21 | ||||||||||||||||||||||||||||||
Class R | ||||||||||||||||||||||||||||||||||||||||||||||||
Year ended 12/31/22 | 30.57 | (0.17 | ) | (10.77 | ) | (10.94 | ) | (0.81 | ) | 18.82 | (35.79 | ) | 63,161 | 1.41 | 1.41 | (0.79 | ) | 44 | ||||||||||||||||||||||||||||||
Year ended 12/31/21 | 42.52 | (0.50 | ) | 2.69 | 2.19 | (14.14 | ) | 30.57 | 7.07 | 112,217 | 1.39 | 1.39 | (1.11 | ) | 35 | |||||||||||||||||||||||||||||||||
Year ended 12/31/20 | 32.08 | (0.39 | ) | 17.45 | 17.06 | (6.62 | ) | 42.52 | 56.59 | 137,020 | 1.40 | 1.40 | (1.15 | ) | 51 | |||||||||||||||||||||||||||||||||
Year ended 12/31/19 | 28.46 | (0.17 | ) | 6.96 | 6.79 | (3.17 | ) | 32.08 | 24.01 | 118,302 | 1.42 | 1.42 | (0.50 | ) | 31 | |||||||||||||||||||||||||||||||||
Year ended 12/31/18 | 34.58 | (0.26 | ) | (2.83 | ) | (3.09 | ) | (3.03 | ) | 28.46 | (9.27 | ) | 124,450 | 1.43 | 1.43 | (0.72 | ) | 21 | ||||||||||||||||||||||||||||||
Class Y | ||||||||||||||||||||||||||||||||||||||||||||||||
Year ended 12/31/22 | 39.11 | (0.08 | ) | (13.78 | ) | (13.86 | ) | (0.81 | ) | 24.44 | (35.44 | ) | 129,518 | 0.91 | 0.91 | (0.29 | ) | 44 | ||||||||||||||||||||||||||||||
Year ended 12/31/21 | 50.24 | (0.32 | ) | 3.33 | 3.01 | (14.14 | ) | 39.11 | 7.61 | 274,782 | 0.89 | 0.89 | (0.61 | ) | 35 | |||||||||||||||||||||||||||||||||
Year ended 12/31/20 | 36.83 | (0.26 | ) | 20.29 | 20.03 | (6.62 | ) | 50.24 | 57.38 | 301,301 | 0.90 | 0.90 | (0.65 | ) | 51 | |||||||||||||||||||||||||||||||||
Year ended 12/31/19 | 32.14 | (0.00 | ) | 7.86 | 7.86 | (3.17 | ) | 36.83 | 24.59 | 217,477 | 0.92 | 0.92 | 0.00 | 31 | ||||||||||||||||||||||||||||||||||
Year ended 12/31/18 | 38.43 | (0.08 | ) | (3.18 | ) | (3.26 | ) | (3.03 | ) | 32.14 | (8.77 | ) | 216,750 | 0.93 | 0.93 | (0.22 | ) | 21 | ||||||||||||||||||||||||||||||
Investor Class | ||||||||||||||||||||||||||||||||||||||||||||||||
Year ended 12/31/22 | 40.08 | (0.14 | ) | (14.12 | ) | (14.26 | ) | (0.81 | ) | 25.01 | (35.58 | )(e) | 144,075 | 1.13 | (e) | 1.13 | (e) | (0.51 | )(e) | 44 | ||||||||||||||||||||||||||||
Year ended 12/31/21 | 51.24 | (0.42 | ) | 3.40 | 2.98 | (14.14 | ) | 40.08 | 7.41 | (e) | 246,961 | 1.05 | (e) | 1.05 | (e) | (0.77 | )(e) | 35 | ||||||||||||||||||||||||||||||
Year ended 12/31/20 | 37.52 | (0.33 | ) | 20.67 | 20.34 | (6.62 | ) | 51.24 | 57.11 | (e) | 249,837 | 1.07 | (e) | 1.07 | (e) | (0.82 | )(e) | 51 | ||||||||||||||||||||||||||||||
Year ended 12/31/19 | 32.76 | (0.08 | ) | 8.01 | 7.93 | (3.17 | ) | 37.52 | 24.34 | 187,171 | 1.13 | 1.13 | (0.21 | ) | 31 | |||||||||||||||||||||||||||||||||
Year ended 12/31/18 | 39.21 | (0.19 | ) | (3.23 | ) | (3.42 | ) | (3.03 | ) | 32.76 | (9.01 | ) | 168,567 | 1.18 | 1.18 | (0.47 | ) | 21 | ||||||||||||||||||||||||||||||
Class R5 | ||||||||||||||||||||||||||||||||||||||||||||||||
Year ended 12/31/22 | 46.32 | (0.06 | ) | (16.33 | ) | (16.39 | ) | (0.81 | ) | 29.12 | (35.39 | ) | 737,830 | 0.81 | 0.81 | (0.19 | ) | 44 | ||||||||||||||||||||||||||||||
Year ended 12/31/21 | 56.89 | (0.31 | ) | 3.88 | 3.57 | (14.14 | ) | 46.32 | 7.71 | 1,445,168 | 0.79 | 0.79 | (0.51 | ) | 35 | |||||||||||||||||||||||||||||||||
Year ended 12/31/20 | 41.01 | (0.24 | ) | 22.74 | 22.50 | (6.62 | ) | 56.89 | 57.56 | 1,564,134 | 0.80 | 0.80 | (0.55 | ) | 51 | |||||||||||||||||||||||||||||||||
Year ended 12/31/19 | 35.45 | 0.05 | 8.68 | 8.73 | (3.17 | ) | 41.01 | 24.75 | 1,156,887 | 0.80 | 0.80 | 0.12 | 31 | |||||||||||||||||||||||||||||||||||
Year ended 12/31/18 | 42.02 | (0.04 | ) | (3.50 | ) | (3.54 | ) | (3.03 | ) | 35.45 | (8.69 | ) | 1,192,199 | 0.81 | 0.81 | (0.10 | ) | 21 | ||||||||||||||||||||||||||||||
Class R6 | ||||||||||||||||||||||||||||||||||||||||||||||||
Year ended 12/31/22 | 46.94 | (0.04 | ) | (16.55 | ) | (16.59 | ) | (0.81 | ) | 29.54 | (35.35 | ) | 653,838 | 0.74 | 0.74 | (0.12 | ) | 44 | ||||||||||||||||||||||||||||||
Year ended 12/31/21 | 57.42 | (0.26 | ) | 3.92 | 3.66 | (14.14 | ) | 46.94 | 7.80 | 948,527 | 0.70 | 0.70 | (0.42 | ) | 35 | |||||||||||||||||||||||||||||||||
Year ended 12/31/20 | 41.31 | (0.20 | ) | 22.93 | 22.73 | (6.62 | ) | 57.42 | 57.70 | 836,400 | 0.71 | 0.71 | (0.46 | ) | 51 | |||||||||||||||||||||||||||||||||
Year ended 12/31/19 | 35.66 | 0.09 | 8.73 | 8.82 | (3.17 | ) | 41.31 | 24.86 | 497,160 | 0.71 | 0.71 | 0.21 | 31 | |||||||||||||||||||||||||||||||||||
Year ended 12/31/18 | 42.20 | 0.00 | (3.51 | ) | (3.51 | ) | (3.03 | ) | 35.66 | (8.58 | ) | 353,791 | 0.71 | 0.71 | 0.00 | 21 | ||||||||||||||||||||||||||||||||
| (a) | Based on average shares outstanding. |
| (b) | Includes adjustments in accordance with accounting principles generally accepted in the United States of America and as such, the net asset value for financial reporting purposes and the returns based upon those net asset values may differ from the net asset value and returns for shareholder transactions. Does not include sales charges and is not annualized for periods less than one year, if applicable. |
| (c) | Portfolio turnover is calculated at the fund level and is not annualized for periods less than one year, if applicable. |
| (d) | The total return, ratio of expenses to average net assets and ratio of net investment income to average net assets reflect actual 12b-1 fees of 0.97% for Class C for the years ended December 31, 2021 and 2020, respectively. |
| (e) | The total return, ratio of expenses to average net assets and ratio of net investment income to average net assets reflect actual 12b-1 fees of 0.22%, 0.16% and 0.17% for Investor Class for the years ended December 31, 2022, 2021 and 2020, respectively. |
See accompanying Notes to Financial Statements which are an integral part of the financial statements.
| 14 | Invesco Small Cap Growth Fund |
December 31, 2022
NOTE 1–Significant Accounting Policies
Invesco Small Cap Growth Fund (the “Fund”) is a series portfolio of AIM Growth Series (Invesco Growth Series) (the “Trust”). The Trust is a Delaware statutory trust registered under the Investment Company Act of 1940, as amended (the “1940 Act”), as an open-end series management investment company authorized to issue an unlimited number of shares of beneficial interest. Information presented in these financial statements pertains only to the Fund. Matters affecting the Fund or each class will be voted on exclusively by the shareholders of the Fund or each class.
The Fund’s investment objective is long-term growth of capital.
The Fund currently consists of seven different classes of shares: Class A, Class C, Class R, Class Y, Investor Class, Class R5 and Class R6. Class Y and Investor Class shares are available only to certain investors. Class A shares are sold with a front-end sales charge unless certain waiver criteria are met. Under certain circumstances, load waived shares may be subject to contingent deferred sales charges (“CDSC”). Class C shares are sold with a CDSC. Class R, Class Y, Investor Class, Class R5 and Class R6 shares are sold at net asset value. Class C shares held for eight years after purchase are eligible for automatic conversion into Class A shares of the same Fund (the “Conversion Feature”). The automatic conversion pursuant to the Conversion Feature will generally occur at the end of the month following the eighth anniversary after a purchase of Class C shares.
Effective as of the close of business on March 18, 2002, the Fund’s shares were offered on a limited basis to certain investors.
The Fund is an investment company and accordingly follows the investment company accounting and reporting guidance in accordance with Financial Accounting Standards Board Accounting Standards Codification Topic 946, Financial Services – Investment Companies.
The following is a summary of the significant accounting policies followed by the Fund in the preparation of its financial statements.
| A. | Security Valuations – Securities, including restricted securities, are valued according to the following policy. |
A security listed or traded on an exchange is generally valued at its trade price or official closing price that day as of the close of the exchange where the security is principally traded, or lacking any trades or official closing price on a particular day, the security may be valued at the closing bid price on that day. Securities traded in the over-the-counter market are valued based on prices furnished by independent pricing services or market makers. When such securities are valued using prices provided by an independent pricing service they may be considered fair valued. Futures contracts are valued at the daily settlement price set by an exchange on which they are principally traded. U.S. exchange-traded options are valued at the mean between the last bid and asked prices from the exchange on which they are principally traded. Non-U.S. exchange-traded options are valued at the final settlement price set by the exchange on which they trade. Options not listed on an exchange and swaps generally are valued using pricing provided from independent pricing services.
Securities of investment companies that are not exchange-traded (e.g., open-end mutual funds) are valued using such company’s end-of-business-day net asset value per share.
Deposits, other obligations of U.S. and non-U.S. banks and financial institutions are valued at their daily account value.
Fixed income securities (including convertible debt securities) generally are valued on the basis of prices provided by independent pricing services. Prices provided by the pricing service may be determined without exclusive reliance on quoted prices, and may reflect appropriate factors such as institution-size trading in similar groups of securities, developments related to specific securities, dividend rate (for unlisted equities), yield (for debt obligations), quality, type of issue, coupon rate (for debt obligations), maturity (for debt obligations), individual trading characteristics and other market data. Pricing services generally value debt obligations assuming orderly transactions of institutional round lot size, but a fund may hold or transact in the same securities in smaller, odd lot sizes. Odd lots often trade at lower prices than institutional round lots, and their value may be adjusted accordingly. Debt obligations are subject to interest rate and credit risks. In addition, all debt obligations involve some risk of default with respect to interest and/or principal payments.
Foreign securities’ (including foreign exchange contracts) prices are converted into U.S. dollar amounts using the applicable exchange rates as of the close of the New York Stock Exchange (“NYSE”). If market quotations are available and reliable for foreign exchange-traded equity securities, the securities will be valued at the market quotations. Invesco Advisers, Inc. (the “Adviser” or “Invesco”) may use various pricing services to obtain market quotations as well as fair value prices. Because trading hours for certain foreign securities end before the close of the NYSE, closing market quotations may become not representative of market value in the Adviser’s judgment (“unreliable”). If, between the time trading ends on a particular security and the close of the customary trading session on the NYSE, a significant event occurs that makes the closing price of the security unreliable, the Adviser may fair value the security. If the event is likely to have affected the closing price of the security, the security will be valued at fair value in good faith in accordance with Board- approved policies and related Adviser procedures (“Valuation Procedures”). Adjustments to closing prices to reflect fair value may also be based on a screening process of an independent pricing service to indicate the degree of certainty, based on historical data, that the closing price in the principal market where a foreign security trades is not the current value as of the close of the NYSE. Foreign securities’ prices meeting the degree of certainty that the price is not reflective of current value will be priced at the indication of fair value from the independent pricing service. Multiple factors may be considered by the independent pricing service in determining adjustments to reflect fair value and may include information relating to sector indices, American Depositary Receipts and domestic and foreign index futures. Foreign securities may have additional risks including exchange rate changes, potential for sharply devalued currencies and high inflation, political and economic upheaval, the relative lack of issuer information, relatively low market liquidity and the potential lack of strict financial and accounting controls and standards.
Unlisted securities will be valued using prices provided by independent pricing services or by another method that the Adviser, in its judgment, believes better reflects the security’s fair value in accordance with the Valuation Procedures.
Securities for which market prices are not provided by any of the above methods may be valued based upon quotes furnished by independent sources. The last bid price may be used to value equity securities. The mean between the last bid and asked prices may be used to value debt obligations, including corporate loans.
Securities for which market quotations are not readily available are fair valued by the Adviser in accordance with the Valuation Procedures. If a fair value price provided by a pricing service is unreliable, the Adviser will fair value the security using the Valuation Procedures. Issuer specific events, market trends, bid/asked quotes of brokers and information providers and other market data may be reviewed in the course of making a good faith determination of a security’s fair value.
The Fund may invest in securities that are subject to interest rate risk, meaning the risk that the prices will generally fall as interest rates rise and, conversely, the prices will generally rise as interest rates fall. Specific securities differ in their sensitivity to changes in interest rates depending on their individual characteristics. Changes in interest rates may result in increased market volatility, which may affect the value and/or liquidity of certain Fund investments.
Valuations change in response to many factors including the historical and prospective earnings of the issuer, the value of the issuer’s assets, general market conditions which are not specifically related to the particular issuer, such as real or perceived adverse economic conditions, changes in the general outlook for revenues or corporate earnings, changes in interest or currency rates, regional or global instability, natural or environmental disasters, widespread disease or other public health issues, war, acts of terrorism, significant governmental actions or adverse investor sentiment generally and market liquidity. Because of the inherent uncertainties of valuation, the values reflected in the financial statements may materially differ from the value received upon actual sale of those investments.
The price the Fund could receive upon the sale of any investment may differ from the Adviser’s valuation of the investment, particularly for securities that are valued using a fair valuation technique. When fair valuation techniques are applied, the Adviser uses available information, including both observable and unobservable inputs and assumptions, to determine a methodology that will result in a valuation that the Adviser believes approximates market value. Fund securities that are fair valued may be subject to greater fluctuation in their value from one day to the next than would be the case if market quotations were used.
| 15 | Invesco Small Cap Growth Fund |
Because of the inherent uncertainties of valuation, and the degree of subjectivity in such decisions, the Fund could realize a greater or lesser than expected gain or loss upon the sale of the investment.
| B. | Securities Transactions and Investment Income – Securities transactions are accounted for on a trade date basis. Realized gains or losses on sales are computed on the basis of specific identification of the securities sold. Interest income (net of withholding tax, if any) is recorded on an accrual basis from settlement date and includes coupon interest and amortization of premium and accretion of discount on debt securities as applicable. Dividend income (net of withholding tax, if any) is recorded on the ex-dividend date. |
The Fund may periodically participate in litigation related to Fund investments. As such, the Fund may receive proceeds from litigation settlements. Any proceeds received are included in the Statement of Operations as realized gain (loss) for investments no longer held and as unrealized gain (loss) for investments still held.
Brokerage commissions and mark ups are considered transaction costs and are recorded as an increase to the cost basis of securities purchased and/or a reduction of proceeds on a sale of securities. Such transaction costs are included in the determination of net realized and unrealized gain (loss) from investment securities reported in the Statement of Operations and the Statement of Changes in Net Assets and the net realized and unrealized gains (losses) on securities per share in the Financial Highlights. Transaction costs are included in the calculation of the Fund’s net asset value and, accordingly, they reduce the Fund’s total returns. These transaction costs are not considered operating expenses and are not reflected in net investment income reported in the Statement of Operations and the Statement of Changes in Net Assets, or the net investment income per share and the ratios of expenses and net investment income reported in the Financial Highlights, nor are they limited by any expense limitation arrangements between the Fund and the investment adviser.
The Fund allocates income and realized and unrealized capital gains and losses to a class based on the relative net assets of each class.
| C. | Country Determination – For the purposes of making investment selection decisions and presentation in the Schedule of Investments, the investment adviser may determine the country in which an issuer is located and/or credit risk exposure based on various factors. These factors include the laws of the country under which the issuer is organized, where the issuer maintains a principal office, the country in which the issuer derives 50% or more of its total revenues, the country that has the primary market for the issuer’s securities and its “country of risk” as determined by a third party service provider, as well as other criteria. Among the other criteria that may be evaluated for making this determination are the country in which the issuer maintains 50% or more of its assets, the type of security, financial guarantees and enhancements, the nature of the collateral and the sponsor organization. Country of issuer and/or credit risk exposure has been determined to be the United States of America, unless otherwise noted. |
| D. | Distributions – Distributions from net investment income and net realized capital gain, if any, are generally declared and paid annually and recorded on the ex-dividend date. The Fund may elect to treat a portion of the proceeds from redemptions as distributions for federal income tax purposes. |
| E. | Federal Income Taxes – The Fund intends to comply with the requirements of Subchapter M of the Internal Revenue Code of 1986, as amended (the “Internal Revenue Code”), necessary to qualify as a regulated investment company and to distribute substantially all of the Fund’s taxable earnings to shareholders. As such, the Fund will not be subject to federal income taxes on otherwise taxable income (including net realized capital gain) that is distributed to shareholders. Therefore, no provision for federal income taxes is recorded in the financial statements. |
The Fund recognizes the tax benefits of uncertain tax positions only when the position is more likely than not to be sustained. Management has analyzed the Fund’s uncertain tax positions and concluded that no liability for unrecognized tax benefits should be recorded related to uncertain tax positions. Management is not aware of any tax positions for which it is reasonably possible that the total amounts of unrecognized tax benefits will change materially in the next 12 months.
The Fund files tax returns in the U.S. Federal jurisdiction and certain other jurisdictions. Generally, the Fund is subject to examinations by such taxing authorities for up to three years after the filing of the return for the tax period.
| F. | Expenses – Fees provided for under the Rule 12b-1 plan of a particular class of the Fund are charged to the operations of such class. Transfer agency fees and expenses and other shareholder recordkeeping fees and expenses attributable to Class R5 and Class R6 are allocated based on relative net assets of Class R5 and Class R6. Sub-accounting fees attributable to Class R5 are charged to the operations of the class. Transfer agency fees and expenses and other shareholder recordkeeping fees and expenses relating to all other classes are allocated among those classes based on relative net assets. All other expenses are allocated among the classes based on relative net assets. |
| G. | Accounting Estimates – The preparation of financial statements in conformity with accounting principles generally accepted in the United States of America (“GAAP”) requires management to make estimates and assumptions that affect the reported amounts of assets and liabilities at the date of the financial statements and the reported amounts of revenues and expenses during the reporting period including estimates and assumptions related to taxation. Actual results could differ from those estimates by a significant amount. In addition, the Fund monitors for material events or transactions that may occur or become known after the period-end date and before the date the financial statements are released to print. |
| H. | Indemnifications – Under the Trust’s organizational documents, each Trustee, officer, employee or other agent of the Trust is indemnified against certain liabilities that may arise out of the performance of their duties to the Fund. Additionally, in the normal course of business, the Fund enters into contracts, including the Fund’s servicing agreements, that contain a variety of indemnification clauses. The Fund’s maximum exposure under these arrangements is unknown as this would involve future claims that may be made against the Fund that have not yet occurred. The risk of material loss as a result of such indemnification claims is considered remote. |
| I. | Securities Lending – The Fund may lend portfolio securities having a market value up to one-third of the Fund’s total assets. Such loans are secured by collateral equal to no less than the market value of the loaned securities determined daily by the securities lending provider. Such collateral will be cash or debt securities issued or guaranteed by the U.S. Government or any of its sponsored agencies. Cash collateral received in connection with these loans is invested in short-term money market instruments or affiliated, unregistered investment companies that comply with Rule 2a-7 under the 1940 Act and money market funds (collectively, “affiliated money market funds”) and is shown as such on the Schedule of Investments. The Fund bears the risk of loss with respect to the investment of collateral. It is the Fund’s policy to obtain additional collateral from or return excess collateral to the borrower by the end of the next business day, following the valuation date of the securities loaned. Therefore, the value of the collateral held may be temporarily less than the value of the securities on loan. When loaning securities, the Fund retains certain benefits of owning the securities, including the economic equivalent of dividends or interest generated by the security. Lending securities entails a risk of loss to the Fund if, and to the extent that, the market value of the securities loaned were to increase and the borrower did not increase the collateral accordingly, and the borrower failed to return the securities. The securities loaned are subject to termination at the option of the borrower or the Fund. Upon termination, the borrower will return to the Fund the securities loaned and the Fund will return the collateral. Upon the failure of the borrower to return the securities, collateral may be liquidated and the securities may be purchased on the open market to replace the loaned securities. The Fund could experience delays and costs in gaining access to the collateral and the securities may lose value during the delay which could result in potential losses to the Fund. Some of these losses may be indemnified by the lending agent. The Fund bears the risk of any deficiency in the amount of the collateral available for return to the borrower due to any loss on the collateral invested. Dividends received on cash collateral investments for securities lending transactions, which are net of compensation to counterparties, are included in Dividends from affiliated money market funds on the Statement of Operations. The aggregate value of securities out on loan, if any, is shown as a footnote on the Statement of Assets and Liabilities. |
The Adviser serves as an affiliated securities lending agent for the Fund. The Bank of New York Mellon also serves as a lending agent. To the extent the Fund utilizes the Adviser as an affiliated securities lending agent, the Fund conducts its securities lending in accordance with, and in reliance upon, no-action letters issued by the SEC staff that provide guidance on how an affiliate may act as a direct agent lender and receive compensation for those services in a manner
| 16 | Invesco Small Cap Growth Fund |
consistent with the federal securities laws. For the year ended December 31, 2022, the Fund paid the Adviser $35,432 in fees for securities lending agent services. Fees paid to the Adviser for securities lending agent services, if any, are included in Dividends from affiliated money market funds on the Statement of Operations.
| J. | COVID-19 Risk – The COVID-19 strain of coronavirus has resulted in instances of market closures and dislocations, extreme volatility, liquidity constraints and increased trading costs. Efforts to contain its spread have resulted in travel restrictions, disruptions of healthcare systems, business operations (including business closures) and supply chains, layoffs, lower consumer demand and employee availability, and defaults and credit downgrades, among other significant economic impacts that have disrupted global economic activity across many industries. Such economic impacts may exacerbate other pre-existing political, social and economic risks locally or globally and cause general concern and uncertainty. The full economic impact and ongoing effects of COVID-19 (or other future epidemics or pandemics) at the macro-level and on individual businesses are unpredictable and may result in significant and prolonged effects on the Fund’s performance. |
NOTE 2–Advisory Fees and Other Fees Paid to Affiliates
The Trust has entered into a master investment advisory agreement with the Adviser. Under the terms of the investment advisory agreement, the Fund accrues daily and pays monthly an advisory fee to the Adviser based on the annual rate of the Fund’s average daily net assets as follows:
| Average Daily Net Assets | Rate | |||
| ||||
First $500 million | 0.725% | |||
| ||||
Next $500 million | 0.700% | |||
| ||||
Next $500 million | 0.675% | |||
| ||||
Over $1.5 billion | 0.650% | |||
| ||||
For the year ended December 31, 2022, the effective advisory fee rate incurred by the Fund was 0.68%.
Under the terms of a master sub-advisory agreement between the Adviser and each of Invesco Asset Management Deutschland GmbH, Invesco Asset Management Limited, Invesco Asset Management (Japan) Limited, Invesco Hong Kong Limited, Invesco Senior Secured Management, Inc. and Invesco Canada Ltd. and separate sub-advisory agreements with Invesco Capital Management LLC and Invesco Asset Management (India) Private Limited (collectively, the “Affiliated Sub-Advisers”) the Adviser, not the Fund, will pay 40% of the fees paid to the Adviser to any such Affiliated Sub-Adviser(s) that provide(s) discretionary investment management services to the Fund based on the percentage of assets allocated to such Affiliated Sub-Adviser(s).
The Adviser has contractually agreed, through at least June 30, 2023, to waive advisory fees and/or reimburse expenses to the extent necessary to limit total annual fund operating expenses after fee waiver and/or expense reimbursement (excluding certain items discussed below) of Class A, Class C, Class R, Class Y, Investor Class, Class R5 and Class R6 shares to 2.00%, 2.75%, 2.25%, 1.75%, 2.00%, 1.75% and 1.75%, respectively, of the Fund’s average daily net assets (the “expense limits”). In determining the Adviser’s obligation to waive advisory fees and/or reimburse expenses, the following expenses are not taken into account, and could cause the total annual fund operating expenses after fee waiver and/or expense reimbursement to exceed the numbers reflected above: (1) interest; (2) taxes; (3) dividend expense on short sales; (4) extraordinary or non-routine items, including litigation expenses; and (5) expenses that the Fund has incurred but did not actually pay because of an expense offset arrangement. Acquired Fund Fees and Expenses are not operating expenses of the Fund directly, but are fees and expenses, including management fees of the investment companies in which the Fund invests. As a result, the total annual fund operating expenses after expense reimbursement may exceed the expense limits above. Unless Invesco continues the fee waiver agreement, it will terminate on June 30, 2023. During its term, the fee waiver agreement cannot be terminated or amended to increase the expense limits or reduce the advisory fee waiver without approval of the Board of Trustees. The Adviser did not waive fees and/or reimburse expenses during the period under these expense limits.
Further, the Adviser has contractually agreed, through at least June 30, 2024, to waive the advisory fee payable by the Fund in an amount equal to 100% of the net advisory fees the Adviser receives from the affiliated money market funds on investments by the Fund of uninvested cash (excluding investments of cash collateral from securities lending) in such affiliated money market funds.
For the year ended December 31, 2022, the Adviser waived advisory fees of $73,683.
The Trust has entered into a master administrative services agreement with Invesco pursuant to which the Fund has agreed to pay Invesco for certain administrative costs incurred in providing accounting services to the Fund. For the year ended December 31, 2022, expenses incurred under the agreement are shown in the Statement of Operations as Administrative services fees. Invesco has entered into a sub-administration agreement whereby State Street Bank and Trust Company (“SSB”) serves as fund accountant and provides certain administrative services to the Fund. Pursuant to a custody agreement with the Trust on behalf of the Fund, SSB also serves as the Fund’s custodian.
The Trust has entered into a transfer agency and service agreement with Invesco Investment Services, Inc. (“IIS”) pursuant to which the Fund has agreed to pay IIS a fee for providing transfer agency and shareholder services to the Fund and reimburse IIS for certain expenses incurred by IIS in the course of providing such services. IIS may make payments to intermediaries that provide omnibus account services, sub-accounting services and/or networking services. All fees payable by IIS to intermediaries that provide omnibus account services or sub-accounting services are charged back to the Fund, subject to certain limitations approved by the Trust’s Board of Trustees. For the year ended December 31, 2022, expenses incurred under the agreement are shown in the Statement of Operations as Transfer agent fees.
The Trust has entered into master distribution agreements with Invesco Distributors, Inc.(“IDI”) to serve as the distributor for the Class A, Class C, Class R, Class Y and Class R6 shares of the Fund. The Trust has adopted plans pursuant to Rule 12b-1 under the 1940 Act with respect to the Fund’s Class A, Class C and Class R shares (collectively the “Plan”). The Fund, pursuant to the Plans, reimburses IDI for its allocated share of expenses incurred for the period, up to a maximum annual rate of 0.25% of the average daily net assets of Class A shares and up to a maximum annual rate of 1.00% of the average daily net assets of Class C shares and up to a maximum annual rate of 0.25% of the average daily net assets of Investor Class shares. The Fund pursuant to the Class R Plan, pays IDI compensation at the annual rate of 0.50% of the average daily net assets of Class R shares. The fees are accrued daily and paid monthly. Of the Plan payments, up to 0.25% of the average daily net assets of each class of shares may be paid to furnish continuing personal shareholder services to customers who purchase and own shares of such classes. Any amounts not paid as a service fee under the Plan would constitute an asset-based sales charge. Rules of the Financial Industry Regulatory Authority (“FINRA”) impose a cap on the total sales charges, including asset-based sales charges, that may be paid by any class of shares of the Fund. For the year ended December 31, 2022, expenses incurred under the Plans are shown in the Statement of Operations as Distribution fees.
Front-end sales commissions and CDSC (collectively, the “sales charges”) are not recorded as expenses of the Fund. Front-end sales commissions are deducted from proceeds from the sales of Fund shares prior to investment in Class A shares of the Fund. CDSC are deducted from redemption proceeds prior to remittance to the shareholder. During the year ended December 31, 2022, IDI advised the Fund that IDI retained $22,733 in front-end sales commissions from the sale of Class A shares and $169 and $141 from Class A and Class C shares, respectively, for CDSC imposed upon redemptions by shareholders.
For the year ended December 31, 2022, the Fund incurred $51,164 in brokerage commissions with Invesco Capital Markets, Inc., an affiliate of the Adviser and IDI, for portfolio transactions executed on behalf of the Fund.
Certain officers and trustees of the Trust are officers and directors of the Adviser, IIS and/or IDI.
| 17 | Invesco Small Cap Growth Fund |
NOTE 3–Additional Valuation Information
GAAP defines fair value as the price that would be received to sell an asset or paid to transfer a liability in an orderly transaction between market participants at the measurement date, under current market conditions. GAAP establishes a hierarchy that prioritizes the inputs to valuation methods, giving the highest priority to readily available unadjusted quoted prices in an active market for identical assets (Level 1) and the lowest priority to significant unobservable inputs (Level 3), generally when market prices are not readily available. Based on the valuation inputs, the securities or other investments are tiered into one of three levels. Changes in valuation methods may result in transfers in or out of an investment’s assigned level:
| Level 1 - | Prices are determined using quoted prices in an active market for identical assets. | |
| Level 2 - | Prices are determined using other significant observable inputs. Observable inputs are inputs that other market participants may use in pricing a security. These may include quoted prices for similar securities, interest rates, prepayment speeds, credit risk, yield curves, loss severities, default rates, discount rates, volatilities and others. | |
| Level 3 - | Prices are determined using significant unobservable inputs. In situations where quoted prices or observable inputs are unavailable (for example, when there is little or no market activity for an investment at the end of the period), unobservable inputs may be used. Unobservable inputs reflect the Advisor’s assumptions about the factors market participants would use in determining fair value of the securities or instruments and would be based on the best available information. |
The following is a summary of the tiered valuation input levels, as of December 31, 2022. The level assigned to the securities valuations may not be an indication of the risk or liquidity associated with investing in those securities. Because of the inherent uncertainties of valuation, the values reflected in the financial statements may materially differ from the value received upon actual sale of those investments.
| Level 1 | Level 2 | Level 3 | Total | |||||||||||||
| ||||||||||||||||
Investments in Securities | ||||||||||||||||
| ||||||||||||||||
Common Stocks & Other Equity Interests | $ | 2,234,606,046 | $ | – | $– | $ | 2,234,606,046 | |||||||||
| ||||||||||||||||
Money Market Funds | 45,160,797 | 444,901,329 | – | 490,062,126 | ||||||||||||
| ||||||||||||||||
Total Investments | $ | 2,279,766,843 | $ | 444,901,329 | $– | $ | 2,724,668,172 | |||||||||
| ||||||||||||||||
NOTE 4–Expense Offset Arrangement(s)
The expense offset arrangement is comprised of transfer agency credits which result from balances in demand deposit accounts used by the transfer agent for clearing shareholder transactions. For the year ended December 31, 2022, the Fund received credits from this arrangement, which resulted in the reduction of the Fund’s total expenses of $5,713.
NOTE 5–Trustees’ and Officers’ Fees and Benefits
Trustees’ and Officers’ Fees and Benefits include amounts accrued by the Fund to pay remuneration to certain Trustees and Officers of the Fund. Trustees have the option to defer compensation payable by the Fund, and Trustees’ and Officers’ Fees and Benefits also include amounts accrued by the Fund to fund such deferred compensation amounts. Those Trustees who defer compensation have the option to select various Invesco Funds in which their deferral accounts shall be deemed to be invested. Finally, certain current Trustees were eligible to participate in a retirement plan that provided for benefits to be paid upon retirement to Trustees over a period of time based on the number of years of service. The Fund may have certain former Trustees who also participate in a retirement plan and receive benefits under such plan. Trustees’ and Officers’ Fees and Benefits include amounts accrued by the Fund to fund such retirement benefits. Obligations under the deferred compensation and retirement plans represent unsecured claims against the general assets of the Fund.
NOTE 6–Cash Balances
The Fund is permitted to temporarily carry a negative or overdrawn balance in its account with SSB, the custodian bank. Such balances, if any at period-end, are shown in the Statement of Assets and Liabilities under the payable caption Amount due custodian. To compensate the custodian bank for such overdrafts, the overdrawn Fund may either (1) leave funds as a compensating balance in the account so the custodian bank can be compensated by earning the additional interest; or (2) compensate by paying the custodian bank at a rate agreed upon by the custodian bank and Invesco, not to exceed the contractually agreed upon rate. The Fund may not purchase additional securities when any borrowings from banks or broker-dealers exceed 5% of the Fund’s total assets, or when any borrowings from an Invesco Fund are outstanding.
NOTE 7–Distributions to Shareholders and Tax Components of Net Assets
Tax Character of Distributions to Shareholders Paid During the Fiscal Years Ended December 31, 2022 and 2021:
| 2022 | 2021 | |||||||||||
| ||||||||||||
Ordinary income* | $ | 9,442,460 | $ | 224,331,378 | ||||||||
| ||||||||||||
Long-term capital gain | 59,567,242 | 785,391,537 | ||||||||||
| ||||||||||||
Total distributions | $ | 69,009,702 | $ | 1,009,722,915 | ||||||||
| ||||||||||||
| * | Includes short-term capital gain distributions, if any. |
Tax Components of Net Assets at Period-End:
| 2022 | ||||
| ||||
Net unrealized appreciation – investments | $ | 114,915,493 | ||
| ||||
Net unrealized appreciation (depreciation) – foreign currencies | (588 | ) | ||
| ||||
Temporary book/tax differences | (268,956 | ) | ||
| ||||
Capital loss carryforward | (241,432,081 | ) | ||
| ||||
Shares of beneficial interest | 2,404,252,346 | |||
| ||||
Total net assets | $ | 2,277,466,214 | ||
| ||||
| 18 | Invesco Small Cap Growth Fund |
The difference between book-basis and tax-basis unrealized appreciation (depreciation) is due to differences in the timing of recognition of gains and losses on investments for tax and book purposes. The Fund’s net unrealized appreciation (depreciation) difference is attributable primarily to wash sales.
The temporary book/tax differences are a result of timing differences between book and tax recognition of income and/or expenses. The Fund’s temporary book/tax differences are the result of the trustee deferral of compensation and retirement plan benefits.
Capital loss carryforward is calculated and reported as of a specific date. Results of transactions and other activity after that date may affect the amount of capital loss carryforward actually available for the Fund to utilize. The ability to utilize capital loss carryforward in the future may be limited under the Internal Revenue Code and related regulations based on the results of future transactions.
The Fund has a capital loss carryforward as of December 31, 2022, as follows:
Capital Loss Carryforward* | ||||||||||
| Expiration | Short-Term | Long-Term | Total | |||||||
| ||||||||||
Not subject to expiration | $ | 241,432,081 | $– | $ | 241,432,081 | |||||
| ||||||||||
| * | Capital loss carryforward is reduced for limitations, if any, to the extent required by the Internal Revenue Code and may be further limited depending upon a variety of factors, including the realization of net unrealized gains or losses as of the date of any reorganization. |
NOTE 8–Investment Transactions
The aggregate amount of investment securities (other than short-term securities, U.S. Government obligations and money market funds, if any) purchased and sold by the Fund during the year ended December 31, 2022 was $1,178,817,528 and $1,504,017,721, respectively. Cost of investments, including any derivatives, on a tax basis includes the adjustments for financial reporting purposes as of the most recently completed federal income tax reporting period-end.
Unrealized Appreciation (Depreciation) of Investments on a Tax Basis | ||||
Aggregate unrealized appreciation of investments | $ 445,921,813 | |||
| ||||
Aggregate unrealized (depreciation) of investments | (331,006,320 | ) | ||
| ||||
Net unrealized appreciation of investments | $ 114,915,493 | |||
| ||||
Cost of investments for tax purposes is $2,609,752,679.
NOTE 9–Reclassification of Permanent Differences
Primarily as a result of differing book/tax treatment of net operating losses, on December 31, 2022, undistributed net investment income (loss) was increased by $7,915,648, undistributed net realized gain (loss) was increased by $249,211 and shares of beneficial interest was decreased by $8,164,859. This reclassification had no effect on the net assets of the Fund.
NOTE 10–Share Information
| Summary of Share Activity | ||||||||||||||||
| ||||||||||||||||
| Year ended | Year ended | |||||||||||||||
| December 31, 2022(a) | December 31, 2021 | |||||||||||||||
| Shares | Amount | Shares | Amount | |||||||||||||
| ||||||||||||||||
Sold: | ||||||||||||||||
Class A | 2,050,024 | $ | 53,737,900 | 2,304,765 | $ | 116,462,004 | ||||||||||
| ||||||||||||||||
Class C | 86,200 | 759,175 | 48,052 | 1,275,128 | ||||||||||||
| ||||||||||||||||
Class R | 529,867 | 11,515,638 | 357,189 | 15,726,335 | ||||||||||||
| ||||||||||||||||
Class Y | 1,224,289 | 34,836,061 | 801,374 | 42,195,873 | ||||||||||||
| ||||||||||||||||
Investor Class | 340,253 | 10,041,542 | 234,809 | 12,299,844 | ||||||||||||
| ||||||||||||||||
Class R5 | 2,993,457 | 97,805,958 | 4,331,136 | 261,926,783 | ||||||||||||
| ||||||||||||||||
Class R6 | 7,354,616 | 277,105,301 | 4,687,715 | 284,661,030 | ||||||||||||
| ||||||||||||||||
Issued as reinvestment of dividends: | ||||||||||||||||
Class A | 821,377 | 18,653,474 | 7,840,075 | 269,306,056 | ||||||||||||
| ||||||||||||||||
Class C | 101,950 | 726,904 | 709,116 | 8,289,565 | ||||||||||||
| ||||||||||||||||
Class R | 138,134 | 2,614,872 | 1,218,527 | 35,215,428 | ||||||||||||
| ||||||||||||||||
Class Y | 161,679 | 3,972,442 | 1,831,659 | 67,716,421 | ||||||||||||
| ||||||||||||||||
Investor Class | 173,272 | 4,357,868 | 1,605,616 | 60,836,805 | ||||||||||||
| ||||||||||||||||
Class R5 | 673,059 | 19,707,176 | 7,565,468 | 331,291,845 | ||||||||||||
| ||||||||||||||||
Class R6 | 599,710 | 17,811,382 | 4,873,813 | 216,251,105 | ||||||||||||
| ||||||||||||||||
Automatic conversion of Class C shares to Class A shares: | ||||||||||||||||
Class A | 48,178 | 1,244,909 | 55,274 | 2,785,916 | ||||||||||||
| ||||||||||||||||
Class C | (142,388 | ) | (1,244,908 | ) | (106,937 | ) | (2,785,916 | ) | ||||||||
| ||||||||||||||||
| 19 | Invesco Small Cap Growth Fund |
| Summary of Share Activity | ||||||||||||||||
| ||||||||||||||||
| Year ended | Year ended | |||||||||||||||
| December 31, 2022(a) | December 31, 2021 | |||||||||||||||
| Shares | Amount | Shares | Amount | |||||||||||||
| ||||||||||||||||
Reacquired: | ||||||||||||||||
Class A | (6,127,843 | ) | $ | (160,197,996 | ) | (4,929,239 | ) | $ | (247,993,583 | ) | ||||||
| ||||||||||||||||
Class C | (323,593 | ) | (2,923,678 | ) | (209,712 | ) | (5,250,121 | ) | ||||||||
| ||||||||||||||||
Class R | (984,049 | ) | (22,438,562 | ) | (1,127,142 | ) | (49,934,519 | ) | ||||||||
| ||||||||||||||||
Class Y | (3,112,393 | ) | (84,559,588 | ) | (1,603,134 | ) | (85,550,262 | ) | ||||||||
| ||||||||||||||||
Investor Class | (913,660 | ) | (25,753,184 | ) | (555,577 | ) | (30,057,501 | ) | ||||||||
| ||||||||||||||||
Class R5 | (9,531,038 | ) | (345,054,156 | ) | (8,191,619 | ) | (493,354,967 | ) | ||||||||
| ||||||||||||||||
Class R6 | (6,029,135 | ) | (198,948,622 | ) | (3,921,753 | ) | (237,294,665 | ) | ||||||||
| ||||||||||||||||
Net increase (decrease) in share activity | (9,868,034 | ) | $ | (286,230,092 | ) | 17,819,475 | $ | 574,018,604 | ||||||||
| ||||||||||||||||
| (a) | There are entities that are record owners of more than 5% of the outstanding shares of the Fund and in the aggregate own 30% of the outstanding shares of the Fund. IDI has an agreement with these entities to sell Fund shares. The Fund, Invesco and/or Invesco affiliates may make payments to these entities, which are considered to be related to the Fund, for providing services to the Fund, Invesco and/or Invesco affiliates including but not limited to services such as securities brokerage, distribution, third party record keeping and account servicing. The Fund has no knowledge as to whether all or any portion of the shares owned of record by these entities are also owned beneficially. |
| 20 | Invesco Small Cap Growth Fund |
Report of Independent Registered Public Accounting Firm
To the Board of Trustees of AIM Growth Series (Invesco Growth Series) and Shareholders of Invesco Small Cap Growth Fund
Opinion on the Financial Statements
We have audited the accompanying statement of assets and liabilities, including the schedule of investments, of Invesco Small Cap Growth Fund (one of the funds constituting AIM Growth Series (Invesco Growth Series), referred to hereafter as the “Fund”) as of December 31, 2022, the related statement of operations for the year ended December 31, 2022, the statement of changes in net assets for each of the two years in the period ended December 31, 2022, including the related notes, and the financial highlights for each of the five years in the period ended December 31, 2022 (collectively referred to as the “financial statements”). In our opinion, the financial statements present fairly, in all material respects, the financial position of the Fund as of December 31, 2022, the results of its operations for the year then ended, the changes in its net assets for each of the two years in the period ended December 31, 2022 and the financial highlights for each of the five years in the period ended December 31, 2022 in conformity with accounting principles generally accepted in the United States of America.
Basis for Opinion
These financial statements are the responsibility of the Fund’s management. Our responsibility is to express an opinion on the Fund’s financial statements based on our audits. We are a public accounting firm registered with the Public Company Accounting Oversight Board (United States) (PCAOB) and are required to be independent with respect to the Fund in accordance with the U.S. federal securities laws and the applicable rules and regulations of the Securities and Exchange Commission and the PCAOB.
We conducted our audits of these financial statements in accordance with the standards of the PCAOB. Those standards require that we plan and perform the audit to obtain reasonable assurance about whether the financial statements are free of material misstatement, whether due to error or fraud.
Our audits included performing procedures to assess the risks of material misstatement of the financial statements, whether due to error or fraud, and performing procedures that respond to those risks. Such procedures included examining, on a test basis, evidence regarding the amounts and disclosures in the financial statements. Our audits also included evaluating the accounting principles used and significant estimates made by management, as well as evaluating the overall presentation of the financial statements. Our procedures included confirmation of securities owned as of December 31, 2022 by correspondence with the custodian, transfer agent and broker. We believe that our audits provide a reasonable basis for our opinion.
/s/PricewaterhouseCoopers LLP
Houston, Texas
February 22, 2023
We have served as the auditor of one or more of the investment companies in the Invesco group of investment companies since at least 1995. We have not been able to determine the specific year we began serving as auditor.
| 21 | Invesco Small Cap Growth Fund |
Calculating your ongoing Fund expenses
Example
As a shareholder of the Fund, you incur two types of costs: (1) transaction costs, which may include sales charges (loads) on purchase payments or contingent deferred sales charges on redemptions, if any; and (2) ongoing costs, including management fees, distribution and/or service (12b-1) fees, and other Fund expenses. This example is intended to help you understand your ongoing costs (in dollars) of investing in the Fund and to compare these costs with ongoing costs of investing in other mutual funds. The example is based on an investment of $1,000 invested at the beginning of the period and held for the entire period July 1, 2022 through December 31, 2022.
Actual expenses
The table below provides information about actual account values and actual expenses. You may use the information in this table, together with the amount you invested, to estimate the expenses that you paid over the period. Simply divide your account value by $1,000 (for example, an $8,600 account value divided by $1,000 = 8.6), then multiply the result by the number in the table under the heading entitled “Actual Expenses Paid During Period” to estimate the expenses you paid on your account during this period.
Hypothetical example for comparison purposes
The table below also provides information about hypothetical account values and hypothetical expenses based on the Fund’s actual expense ratio and an assumed rate of return of 5% per year before expenses, which is not the Fund’s actual return.
The hypothetical account values and expenses may not be used to estimate the actual ending account balance or expenses you paid for the period. You may use this information to compare the ongoing costs of investing in the Fund and other funds. To do so, compare this 5% hypothetical example with the 5% hypothetical examples that appear in the shareholder reports of the other funds.
Please note that the expenses shown in the table are meant to highlight your ongoing costs only and do not reflect any transaction costs, such as sales charges (loads) on purchase payments or contingent deferred sales charges on redemptions, if any. Therefore, the hypothetical information is useful in comparing ongoing costs only, and will not help you determine the relative total costs of owning different funds. In addition, if these transaction costs were included, your costs would have been higher.
| ACTUAL | HYPOTHETICAL (5% annual return before expenses) | |||||||||||
Beginning Account Value (07/01/22) | Ending Account Value (12/31/22)1 | Expenses Paid During Period2 | Ending Account Value (12/31/22) | Expenses Paid During Period2 | Annualized Expense Ratio | |||||||
Class A | $1,000.00 | $1,045.00 | $5.98 | $1,019.36 | $5.90 | 1.16% | ||||||
Class C | 1,000.00 | 1,040.60 | 9.82 | 1,015.58 | 9.70 | 1.91 | ||||||
Class R | 1,000.00 | 1,043.50 | 7.31 | 1,018.05 | 7.22 | 1.42 | ||||||
Class Y | 1,000.00 | 1,046.40 | 4.69 | 1,020.62 | 4.63 | 0.91 | ||||||
Investor Class | 1,000.00 | 1,045.30 | 5.72 | 1,019.61 | 5.65 | 1.11 | ||||||
Class R5 | 1,000.00 | 1,046.80 | 4.13 | 1,021.17 | 4.08 | 0.80 | ||||||
Class R6 | 1,000.00 | 1,047.20 | 3.82 | 1,021.48 | 3.77 | 0.74 | ||||||
| 1 | The actual ending account value is based on the actual total return of the Fund for the period July 1, 2022 through December 31, 2022, after actual expenses and will differ from the hypothetical ending account value which is based on the Fund’s expense ratio and a hypothetical annual return of 5% before expenses. |
| 2 | Expenses are equal to the Fund’s annualized expense ratio as indicated above multiplied by the average account value over the period, multiplied by 184/365 to reflect the most recent fiscal half year. |
| 22 | Invesco Small Cap Growth Fund |
Form 1099-DIV, Form 1042-S and other year-end tax information provide shareholders with actual calendar year amounts that should be included in their tax returns. Shareholders should consult their tax advisers.
The following distribution information is being provided as required by the Internal Revenue Code or to meet a specific state’s requirement.
The Fund designates the following amounts or, if subsequently determined to be different, the maximum amount allowable for its fiscal year ended December 31, 2022:
Federal and State Income Tax | ||||||||
Long-Term Capital Gain Distributions | $59,567,242 | |||||||
Qualified Dividend Income* | 4.05 | % | ||||||
Corporate Dividends Received Deduction* | 4.05 | % | ||||||
U.S. Treasury Obligations* | 0.00 | % | ||||||
Qualified Business Income* | 0.00 | % | ||||||
Business Interest Income* | 0.00 | % | ||||||
| * | The above percentages are based on ordinary income dividends paid to shareholders during the Fund’s fiscal year. |
Non-Resident Alien Shareholders | ||||||||
Short-Term Capital Gain Distributions | $9,442,460 | |||||||
| 23 | Invesco Small Cap Growth Fund |
The address of each trustee and officer is AIM Growth Series (Invesco Growth Series) (the “Trust”), 11 Greenway Plaza, Suite 1000, Houston, Texas 77046-1173. The trustees serve for the life of the Trust, subject to their earlier death, incapacitation, resignation, retirement or removal as more specifically provided in the Trust’s organizational documents. Each officer serves for a one year term or until their successors are elected and qualified. Column two below includes length of time served with predecessor entities, if any.
Name, Year of Birth and Position(s) Held with the Trust | Trustee and/or Officer Since | Principal Occupation(s) During Past 5 Years | Number of Funds in Fund Complex Overseen by | Other Directorship(s) Held by Trustee During Past 5 Years | ||||
| Interested Trustee | ||||||||
| Martin L. Flanagan1 - 1960 Trustee and Vice Chair | 2007 | Executive Director, Chief Executive Officer and President, Invesco Ltd. (ultimate parent of Invesco and a global investment management firm); Trustee and Vice Chair, The Invesco Funds; Vice Chair, Investment Company Institute; and Member of Executive Board, SMU Cox School of Business
Formerly: Advisor to the Board, Invesco Advisers, Inc. (formerly known as Invesco Institutional (N.A.), Inc.); Chairman and Chief Executive Officer, Invesco Advisers, Inc. (registered investment adviser); Director, Chairman, Chief Executive Officer and President, Invesco Holding Company (US), Inc. (formerly IVZ Inc.) (holding company), Invesco Group Services, Inc. (service provider) and Invesco North American Holdings, Inc. (holding company); Director, Chief Executive Officer and President, Invesco Holding Company Limited (parent of Invesco and a global investment management firm); Director, Invesco Ltd.; Chairman, Investment Company Institute and President, Co-Chief Executive Officer, Co-President, Chief Operating Officer and Chief Financial Officer, Franklin Resources, Inc. (global investment management organization) | 189 | None |
| 1 | Mr. Flanagan is considered an interested person (within the meaning of Section 2(a)(19) of the 1940 Act) of the Trust because he is an officer of the Adviser to the Trust, and an officer and a director of Invesco Ltd., ultimate parent of the Adviser. |
| T-1 | Invesco Small Cap Growth Fund |
Trustees and Officers–(continued)
Name, Year of Birth and Position(s) Held with the Trust | Trustee and/or Officer Since | Principal Occupation(s) During Past 5 Years | Number of Funds in Fund Complex Overseen by Trustee | Other Directorship(s) Held by Trustee During Past 5 Years | ||||
| Independent Trustees | ||||||||
Beth Ann Brown - 1968 Trustee (2019) and Chair (August 2022) | 2019 | Independent Consultant
Formerly: Head of Intermediary Distribution, Managing Director, Strategic Relations, Managing Director, Head of National Accounts, Senior Vice President, National Account Manager and Senior Vice President, Key Account Manager, Columbia Management Investment Advisers LLC; Vice President, Key Account Manager, Liberty Funds Distributor, Inc.; and Trustee of certain Oppenheimer Funds | 189 | Director, Board of Directors of Caron Engineering Inc.; Advisor, Board of Advisors of Caron Engineering Inc.; President and Director, Acton Shapleigh Youth Conservation Corps (non-profit) Formerly: President and Director Director of Grahamtastic Connection (non-profit) | ||||
Cynthia Hostetler - 1962 Trustee | 2017 | Non-Executive Director and Trustee of a number of public and private business corporations
Formerly: Director, Aberdeen Investment Funds (4 portfolios); Director, Artio Global Investment LLC (mutual fund complex); Director, Edgen Group, Inc. (specialized energy and infrastructure products distributor); Director, Genesee & Wyoming, Inc. (railroads); Head of Investment Funds and Private Equity, Overseas Private Investment Corporation; President, First Manhattan Bancorporation, Inc.; and Attorney, Simpson Thacher & Bartlett LLP | 189 | Resideo Technologies, Inc. (smart home technology); Vulcan Materials Company (construction materials company); Trilinc Global Impact Fund; Textainer Group Holdings, (shipping container leasing company); Investment Company Institute (professional organization); and Independent Directors Council (professional organization) | ||||
Eli Jones - 1961 Trustee | 2016 | Professor and Dean Emeritus, Mays Business School - Texas A&M University
Formerly: Dean of Mays Business School-Texas A&M University; Professor and Dean, Walton College of Business, University of Arkansas and E.J. Ourso College of Business, Louisiana State University; and Director, Arvest Bank | 189 | Insperity, Inc. (formerly known as Administaff) (human resources provider); and Member of Regional Board of Directors and Board of Directors, First Financial Bancorp (regional bank) | ||||
| Elizabeth Krentzman - 1959 Trustee | 2019 | Formerly: Principal and Chief Regulatory Advisor for Asset Management Services and U.S. Mutual Fund Leader of Deloitte & Touche LLP; General Counsel of the Investment Company Institute (trade association); National Director of the Investment Management Regulatory Consulting Practice, Principal, Director and Senior Manager of Deloitte & Touche LLP; Assistant Director of the Division of Investment Management - Office of Disclosure and Investment Adviser Regulation of the U.S. Securities and Exchange Commission and various positions with the Division of Investment Management – Office of Regulatory Policy of the U.S. Securities and Exchange Commission; Associate at Ropes & Gray LLP; and Trustee of certain Oppenheimer Funds | 189 | Formerly: Member of the Cartica Funds Board of Directors (private investment fund); Trustee of the University of Florida National Board Foundation; and Member of the University of Florida Law Center Association, Inc. Board of Trustees, Audit Committee and Membership Committee | ||||
| Anthony J. LaCava, Jr. - 1956 Trustee | 2019 | Formerly: Director and Member of the Audit Committee, Blue Hills Bank (publicly traded financial institution) and Managing Partner, KPMG LLP | 189 | Blue Hills Bank; Chairman, Bentley University; Member, Business School Advisory Council; and Nominating Committee, KPMG LLP | ||||
| Prema Mathai-Davis - 1950 Trustee | 2001 | Retired
Formerly: Co-Founder & Partner of Quantalytics Research, LLC, (a FinTech Investment Research Platform for the Self-Directed Investor); Trustee of YWCA Retirement Fund; CEO of YWCA of the USA; Board member of the NY Metropolitan Transportation Authority; Commissioner of the NYC Department of Aging; and Board member of Johns Hopkins Bioethics Institute | 189 | Member of Board of Positive Planet US (non-profit) and HealthCare Chaplaincy Network (non-profit) |
| T-2 | Invesco Small Cap Growth Fund |
Trustees and Officers–(continued)
Name, Year of Birth and Position(s) Held with the Trust | Trustee and/or Officer Since | Principal Occupation(s) During Past 5 Years | Number of Funds in Fund Complex | Other Directorship(s) Held by Trustee During Past 5 Years | ||||
| Independent Trustees–(continued) | ||||||||
Joel W. Motley - 1952 Trustee | 2019 | Director of Office of Finance, Federal Home Loan Bank System; Managing Director of Carmona Motley Inc. (privately held financial advisor); Member of the Council on Foreign Relations and its Finance and Budget Committee; Chairman Emeritus of Board of Human Rights Watch and Member of its Investment Committee; and Member of Investment Committee Board of Historic Hudson Valley (non-profit cultural organization); Member of the Board, Blue Ocean Acquisition Corp.; and Member of the Vestry and the Investment Committee of Trinity Church Wall Street.
Formerly: Managing Director of Public Capital Advisors, LLC (privately held financial advisor); Managing Director of Carmona Motley Hoffman, Inc. (privately held financial advisor); Trustee of certain Oppenheimer Funds; and Director of Columbia Equity Financial Corp. (privately held financial advisor) | 189 | Member of Board of Trust for Mutual Understanding (non-profit promoting the arts and environment); Member of Board of Greenwall Foundation (bioethics research foundation) and its Investment Committee; Member of Board of Friends of the LRC (non-profit legal advocacy); and Board Member and Investment Committee Member of Pulitzer Center for Crisis Reporting (non-profit journalism) | ||||
Teresa M. Ressel - 1962 Trustee | 2017 | Non-executive director and trustee of a number of public and private business corporations
Formerly: Chief Executive Officer, UBS Securities LLC (investment banking); Chief Operating Officer, UBS AG Americas (investment banking); Sr. Management Team Olayan America, The Olayan Group (international investor/commercial/industrial); Assistant Secretary for Management & Budget and Designated Chief Financial Officer, U.S. Department of Treasury and Director, ON Semiconductor Corporation (semiconductor manufacturing) | 189 | None | ||||
Robert C. Troccoli - 1949 Trustee | 2016 | Retired
Formerly: Adjunct Professor, University of Denver – Daniels College of Business; and Managing Partner, KPMG LLP | 189 | None | ||||
Daniel S. Vandivort - 1954 Trustee | 2019 | President, Flyway Advisory Services LLC (consulting and property management)
Formerly: President and Chief Investment Officer, previously Head of Fixed Income, Weiss Peck and Greer/Robeco Investment Management; Trustee and Chair, Weiss Peck and Greer Funds Board; and various capacities at CS First Boston including Head of Fixed Income at First Boston Asset Management. | 189 | Formerly: Trustee and Governance Chair, Oppenheimer Funds; Treasurer, Chairman of the Audit and Finance Committee, Huntington Disease Foundation of America | ||||
| T-3 | Invesco Small Cap Growth Fund |
Trustees and Officers–(continued)
Name, Year of Birth and Position(s) Held with the Trust | Trustee and/or Officer Since | Principal Occupation(s) During Past 5 Years | Number of Funds in Fund Complex Overseen by Trustee | Other Directorship(s) Held by Trustee During Past 5 Years | ||||
| Officers | ||||||||
Sheri Morris - 1964 President and Principal Executive Officer | 1999 | Director, Invesco Trust Company; Head of Global Fund Services, Invesco Ltd.; President and Principal Executive Officer, The Invesco Funds; Vice President, Invesco Exchange-Traded Fund Trust, Invesco Exchange-Traded Fund Trust II, Invesco India Exchange-Traded Fund Trust, Invesco Actively Managed Exchange-Traded Fund Trust, Invesco Actively Managed Exchange-Traded Commodity Fund Trust and Invesco Exchange-Traded Self-Indexed Fund Trust; and Vice President, OppenheimerFunds, Inc.
Formerly: Vice President, Treasurer and Principal Financial Officer, The Invesco Funds; Vice President, Invesco AIM Advisers, Inc., Invesco AIM Capital Management, Inc. and Invesco AIM Private Asset Management, Inc.; Assistant Vice President and Assistant Treasurer, The Invesco Funds; Vice President and Assistant Vice President, Invesco Advisers, Inc.; Assistant Vice President, Invesco AIM Capital Management, Inc. and Invesco AIM Private Asset Management, Inc.; Treasurer, Invesco Exchange-Traded Fund Trust, Invesco Exchange-Traded Fund Trust II, Invesco India Exchange-Traded Fund Trust and Invesco Actively Managed Exchange-Traded Fund Trust; and Senior Vice President, Invesco Advisers, Inc. (formerly known as Invesco Institutional (N.A.), Inc.) (registered investment adviser) | N/A | N/A | ||||
Jeffrey H. Kupor - 1968 Senior Vice President, Chief Legal Officer and Secretary | 2018 | Head of Legal of the Americas, Invesco Ltd.; Senior Vice President and Secretary, Invesco Advisers, Inc. (formerly known as Invesco Institutional (N.A.), Inc.) (registered investment adviser); Secretary, Invesco Distributors, Inc. (formerly known as Invesco AIM Distributors, Inc.); Vice President and Secretary, Invesco Investment Services, Inc. (formerly known as Invesco AIM Investment Services, Inc.); Senior Vice President, Chief Legal Officer and Secretary, The Invesco Funds; Secretary and General Counsel, Invesco Investment Advisers LLC (formerly known as Van Kampen Asset Management); Secretary and General Counsel, Invesco Capital Markets, Inc. (formerly known as Van Kampen Funds Inc.); Chief Legal Officer, Invesco Exchange-Traded Fund Trust, Invesco Exchange-Traded Fund Trust II, Invesco India Exchange-Traded Fund Trust, Invesco Actively Managed Exchange-Traded Fund Trust, Invesco Actively Managed Exchange-Traded Commodity Fund Trust and Invesco Exchange-Traded Self-Indexed Fund Trust;; Secretary and Vice President, Harbourview Asset Management Corporation; Secretary and Vice President, OppenheimerFunds, Inc. and Invesco Managed Accounts, LLC; Secretary and Senior Vice President, OFI Global Institutional, Inc.; Secretary and Vice President, OFI SteelPath, Inc.; Secretary and Vice President, Oppenheimer Acquisition Corp.; Secretary and Vice President, Shareholder Services, Inc.; and Secretary and Vice President, Trinity Investment Management Corporation
Formerly: Senior Vice President, Invesco Distributors, Inc.; Secretary and Vice President, Jemstep, Inc.; Head of Legal, Worldwide Institutional, Invesco Ltd.; Secretary and General Counsel, INVESCO Private Capital Investments, Inc.; Senior Vice President, Secretary and General Counsel, Invesco Management Group, Inc. (formerly known as Invesco AIM Management Group, Inc.); Assistant Secretary, INVESCO Asset Management (Bermuda) Ltd.; Secretary and General Counsel, Invesco Private Capital, Inc.; Assistant Secretary and General Counsel, INVESCO Realty, Inc.; Secretary and General Counsel, Invesco Senior Secured Management, Inc.; Secretary, Sovereign G./P. Holdings Inc.; Secretary, Invesco Indexing LLC; and Secretary, W.L. Ross & Co., LLC | N/A | N/A | ||||
Andrew R. Schlossberg - 1974 Senior Vice President | 2019 | Senior Vice President, Invesco Group Services, Inc.; Head of the Americas and Senior Managing Director, Invesco Ltd.; Director and Senior Vice President, Invesco Advisers, Inc. (formerly known as Invesco Institutional (N.A.), Inc.) (registered investment adviser); Director and Chairman, Invesco Investment Services, Inc. (formerly known as Invesco AIM Investment Services, Inc.) (registered transfer agent); Senior Vice President, The Invesco Funds; and Director, Invesco Investment Advisers LLC (formerly known as Van Kampen Asset Management)
Formerly: Director, President and Chairman, Invesco Insurance Agency, Inc.; Director, Invesco UK Limited; Director and Chief Executive, Invesco Asset Management Limited and Invesco Fund Managers Limited; Assistant Vice President, The Invesco Funds; Senior Vice President, Invesco Advisers, Inc. (formerly known as Invesco Institutional (N.A.), Inc.) (registered investment adviser); Director and Chief Executive, Invesco Administration Services Limited and Invesco Global Investment Funds Limited; Director, Invesco Distributors, Inc.; Head of EMEA, Invesco Ltd.; President, Invesco Actively Managed Exchange-Traded Commodity Fund Trust, Invesco Actively Managed Exchange-Traded Fund Trust, Invesco Exchange-Traded Fund Trust, Invesco Exchange-Traded Fund Trust II and Invesco India Exchange-Traded Fund Trust; and Managing Director and Principal Executive Officer, Invesco Capital Management LLC | N/A | N/A |
| T-4 | Invesco Small Cap Growth Fund |
Trustees and Officers–(continued)
Name, Year of Birth and Position(s) Held with the Trust | Trustee and/or Officer Since | Principal Occupation(s) During Past 5 Years | Number of Funds in Fund Complex Overseen by Trustee | Other Directorship(s) Held by Trustee During Past 5 Years | ||||
| Officers–(continued) | ||||||||
John M. Zerr - 1962 Senior Vice President | 2006 | Chief Operating Officer of the Americas; Senior Vice President, Invesco Advisers, Inc. (formerly known as Invesco Institutional (N.A.), Inc.) (registered investment adviser); Senior Vice President, Invesco Distributors, Inc. (formerly known as Invesco AIM Distributors, Inc.); Director and Vice President, Invesco Investment Services, Inc. (formerly known as Invesco AIM Investment Services, Inc.) Senior Vice President, The Invesco Funds; Managing Director, Invesco Capital Management LLC; Director, Invesco Investment Advisers LLC (formerly known as Van Kampen Asset Management); Senior Vice President, Invesco Capital Markets, Inc. (formerly known as Van Kampen Funds Inc.); Manager, Invesco Indexing LLC; Manager, Invesco Specialized Products, LLC; Member, Invesco Canada Funds Advisory Board; Director, President and Chief Executive Officer, Invesco Corporate Class Inc. (corporate mutual fund company); and Director, Chairman, President and Chief Executive Officer, Invesco Canada Ltd. (formerly known as Invesco Trimark Ltd./Invesco Trimark Ltèe) (registered investment adviser and registered transfer agent); President, Invesco, Inc.; President, Invesco Global Direct Real Estate Feeder GP Ltd.; President, Invesco IP Holdings (Canada) Ltd; President, Invesco Global Direct Real Estate GP Ltd.; President, Invesco Financial Services Ltd. / Services Financiers Invesco Ltée; and Director and Chairman, Invesco Trust Company
Formerly: President, Trimark Investments Ltd/Services Financiers Invesco Ltee; Director and Senior Vice President, Invesco Insurance Agency, Inc.; Director and Senior Vice President, Invesco Management Group, Inc. (formerly known as Invesco AIM Management Group, Inc.); Secretary and General Counsel, Invesco Management Group, Inc. (formerly known as Invesco AIM Management Group, Inc.); Secretary, Invesco Investment Services, Inc. (formerly known as Invesco AIM Investment Services, Inc.); Chief Legal Officer and Secretary, The Invesco Funds; Secretary and General Counsel, Invesco Investment Advisers LLC (formerly known as Van Kampen Asset Management); Secretary and General Counsel, Invesco Capital Markets, Inc. (formerly known as Van Kampen Funds Inc.); Chief Legal Officer, Invesco Exchange-Traded Fund Trust, Invesco Exchange-Traded Fund Trust II, Invesco India Exchange-Traded Fund Trust, Invesco Actively Managed Exchange-Traded Fund Trust, Invesco Actively Managed Exchange-Traded Commodity Fund Trust and Invesco Exchange-Traded Self-Indexed Fund Trust; Secretary, Invesco Indexing LLC; Director, Secretary, General Counsel and Senior Vice President, Van Kampen Exchange Corp.; Director, Vice President and Secretary, IVZ Distributors, Inc. (formerly known as INVESCO Distributors, Inc.); Director and Vice President, INVESCO Funds Group, Inc.; Director and Vice President, Van Kampen Advisors Inc.; Director, Vice President, Secretary and General Counsel, Van Kampen Investor Services Inc.; Director and Secretary, Invesco Distributors, Inc. (formerly known as Invesco AIM Distributors, Inc.); Director, Senior Vice President, General Counsel and Secretary, Invesco AIM Advisers, Inc. and Van Kampen Investments Inc.; Director, Vice President and Secretary, Fund Management Company; Director, Senior Vice President, Secretary, General Counsel and Vice President, Invesco AIM Capital Management, Inc.; and Chief Operating Officer and General Counsel, Liberty Ridge Capital, Inc. (an investment adviser) | N/A | N/A | ||||
Gregory G. McGreevey - 1962 Senior Vice President | 2012 | Senior Managing Director, Invesco Ltd.; Director, Chairman, President, and Chief Executive Officer, Invesco Advisers, Inc. (formerly known as Invesco Institutional (N.A.), Inc.) (registered investment adviser); Director, Invesco Mortgage Capital, Inc. and Invesco Senior Secured Management, Inc.; Senior Vice President, The Invesco Funds; President, SNW Asset Management Corporation and Invesco Managed Accounts, LLC; Chairman and Director, Invesco Private Capital, Inc.; Chairman and Director, INVESCO Private Capital Investments, Inc.; Chairman and Director, INVESCO Realty, Inc.; and Senior Vice President, Invesco Group Services, Inc.
Formerly: Senior Vice President, Invesco Management Group, Inc. and Invesco Advisers, Inc.; Assistant Vice President, The Invesco Funds | N/A | N/A | ||||
Adrien Deberghes - 1967 Principal Financial Officer, Treasurer and Vice President | 2020 | Head of the Fund Office of the CFO and Fund Administration; Vice President, Invesco Advisers, Inc.; Principal Financial Officer, Treasurer and Vice President, The Invesco Funds; Vice President, Invesco Exchange-Traded Fund Trust, Invesco Exchange-Traded Fund Trust II, Invesco India Exchange-Traded Fund Trust, Invesco Actively Managed Exchange-Traded Fund Trust, Invesco Actively Managed Exchange-Traded Commodity Fund Trust and Invesco Exchange-Traded Self-Indexed Fund Trust
Formerly: Senior Vice President and Treasurer, Fidelity Investments | N/A | N/A | ||||
Crissie M. Wisdom - 1969 Anti-Money Laundering Compliance Officer | 2013 | Anti-Money Laundering and OFAC Compliance Officer for Invesco U.S. entities including: Invesco Advisers, Inc. and its affiliates, Invesco Capital Markets, Inc., Invesco Distributors, Inc., Invesco Investment Services, Inc., The Invesco Funds, Invesco Capital Management, LLC, Invesco Trust Company; and Fraud Prevention Manager for Invesco Investment Services, Inc. | N/A | N/A |
| T-5 | Invesco Small Cap Growth Fund |
Trustees and Officers–(continued)
Name, Year of Birth and Position(s) Held with the Trust | Trustee and/or Officer Since | Principal Occupation(s) During Past 5 Years | Number of Funds in Fund Complex Overseen by Trustee | Other Directorship(s) Held by Trustee During Past 5 Years | ||||
| Officers–(continued) | ||||||||
Todd F. Kuehl - 1969 Chief Compliance Officer and Senior Vice President | 2020 | Chief Compliance Officer, Invesco Advisers, Inc. (registered investment adviser); and Chief Compliance Officer and Senior Vice President, The Invesco Funds
Formerly: Managing Director and Chief Compliance Officer, Legg Mason (Mutual Funds); Chief Compliance Officer, Legg Mason Private Portfolio Group (registered investment adviser) | N/A | N/A | ||||
James Bordewick, Jr. - 1959 Senior Vice President and Senior Officer | 2022 | Senior Vice President and Senior Officer, The Invesco Funds
Formerly: Chief Legal Officer, KingsCrowd, Inc. (research and analytical platform for investment in private capital markets); Chief Operating Officer and Head of Legal and Regulatory, Netcapital (private capital investment platform); Managing Director, General Counsel of asset management and Chief Compliance Officer for asset management and private banking, Bank of America Corporation; Chief Legal Officer, Columbia Funds and BofA Funds;
Senior Vice President and Associate General Counsel, MFS Investment Management; Chief Legal Officer, MFS Funds; Associate, Ropes & Gray; and Associate, Gaston Snow & Ely Bartlett | N/A | N/A |
The Statement of Additional Information of the Trust includes additional information about the Fund’s Trustees and is available upon request, without charge, by calling 1.800.959.4246. Please refer to the Fund’s Statement of Additional Information for information on the Fund’s sub-advisers.
| Office of the Fund | Investment Adviser | Distributor | Auditors | |||
| 11 Greenway Plaza, Suite 1000 | Invesco Advisers, Inc. | Invesco Distributors, Inc. | PricewaterhouseCoopers LLP | |||
| Houston, TX 77046-1173 | 1555 Peachtree Street, N.E. | 11 Greenway Plaza, Suite 1000 | 1000 Louisiana Street, Suite 5800 | |||
| Atlanta, GA 30309 | Houston, TX 77046-1173 | Houston, TX 77002-5021 | ||||
| Counsel to the Fund | Counsel to the Independent Trustees | Transfer Agent | Custodian | |||
| Stradley Ronon Stevens & Young, LLP | Sidley Austin LLP | Invesco Investment Services, Inc. | State Street Bank and Trust Company | |||
| 2005 Market Street, Suite 2600 | 787 Seventh Avenue | 11 Greenway Plaza, Suite 1000 | 225 Franklin Street | |||
| Philadelphia, PA 19103-7018 | New York, NY 10019 | Houston, TX 77046-1173 | Boston, MA 02110-2801 | |||
| T-6 | Invesco Small Cap Growth Fund |
(This page intentionally left blank)
(This page intentionally left blank)

Go paperless with eDelivery
Visit invesco.com/edelivery to enjoy the convenience and security of anytime electronic access to your investment documents.
With eDelivery, you can elect to have any or all of the following materials delivered straight to your inbox to download, save and print from your own computer:
∎ Fund reports and prospectuses
∎ Quarterly statements
∎ Daily confirmations
∎ Tax forms
Invesco mailing information
Send general correspondence to Invesco Investment Services, Inc., P.O. Box 219078, Kansas City, MO 64121-9078.
Important notice regarding delivery of security holder documents
To reduce Fund expenses, only one copy of most shareholder documents may be mailed to shareholders with multiple accounts at the same address (Householding). Mailing of your shareholder documents may be householded indefinitely unless you instruct us otherwise. If you do not want the mailing of these documents to be combined with those for other members of your household, please contact Invesco Investment Services, Inc. at 800 959 4246 or contact your financial institution. We will begin sending you individual copies for each account within 30 days after receiving your request.
Fund holdings and proxy voting information
The Fund provides a complete list of its portfolio holdings four times each year, at the end of each fiscal quarter. For the second and fourth quarters, the list appears, respectively, in the Fund’s semiannual and annual reports to shareholders. For the first and third quarters, the Fund files the list with the Securities and Exchange Commission (SEC) as an exhibit to its reports on Form N-PORT. The most recent list of portfolio holdings is available at invesco.com/completeqtrholdings. Shareholders can also look up the Fund’s Form N-PORT filings on the SEC website, sec.gov. The SEC file numbers for the Fund are shown below.
A description of the policies and procedures that the Fund uses to determine how to vote proxies relating to portfolio securities is available without charge, upon request, from our Client Services department at 800 959 4246, or at invesco.com/corporate/about-us/esg. The information is also available on the SEC website, sec.gov.
Information regarding how the Fund voted proxies related to its portfolio securities during the most recent 12-month period ended June 30 is available at invesco.com/proxysearch. This information is also available on the SEC website, sec.gov.
Invesco Advisers, Inc. is an investment adviser; it provides investment advisory services to individual and institutional clients and does not sell securities. Invesco Distributors, Inc. is the US distributor for Invesco Ltd.’s retail mutual funds, exchange-traded funds and institutional money market funds. Both are wholly owned, indirect subsidiaries of Invesco Ltd.

| SEC file number(s): 811-02699 and 002-57526 | Invesco Distributors, Inc. | SCG-AR-1 |
| ITEM 2. | CODE OF ETHICS. |
There were no amendments to the Code of Ethics (the “Code”) that applies to the Registrant’s Principal Executive Officer (“PEO”) and Principal Financial Officer (“PFO”) during the period covered by the report. The Registrant did not grant any waivers, including implicit waivers, from any provisions of the Code to the PEO or PFO during the period covered by this report.
| ITEM 3. | AUDIT COMMITTEE FINANCIAL EXPERT. |
The Board of Trustees has determined that the Registrant has at least one audit committee financial expert serving on its Audit Committee. The Audit Committee financial experts are Cynthia Hostetler, Anthony J. LaCava, Jr., and Robert C. Troccoli. Cynthia Hostetler, Anthony J. LaCava, Jr., and Robert C. Troccoli are “independent” within the meaning of that term as used in Form N-CSR.
| ITEM 4. | PRINCIPAL ACCOUNTANT FEES AND SERVICES. |
Pursuant to PCAOB Rule 3526, Communication with Audit Committees Concerning Independence, PricewaterhouseCoopers LLC (“PwC”) advised the Registrant’s Audit Committee of the following two matters identified since the previous annual Form N-CSR filing that may be reasonably thought to bear on PwC’s independence. PwC advised the Audit Committee that one PwC Senior Associate and one PwC Partner each held financial interests directly in an investment company within the complex that includes the Funds as well as all registered investment companies advised by the Adviser and its affiliates, including other subsidiaries of the Adviser’s parent company, Invesco Ltd. (collectively the “Invesco Funds Investment Company Complex”) that were inconsistent with the requirements of Rule 2-01(c)(1) of SEC Regulation S-X. In reporting each matter to the Audit Committee, PwC noted, among other things, that the impermissible holdings were disposed of by the individuals, the individuals were not in the chain of command of the audit or the audit partners of the Funds, the financial interests were not material to the net worth of each individual or his or her respective immediate family members and the Funds’ audit engagement team was unaware of the impermissible holdings until after the matters were confirmed to be independence exceptions . In addition, PwC considered that the audit services performed by the PwC Senior Associate were reviewed by team members at least two levels higher than the individual and the individual did not have any decision making responsibility for matters that materially affected the audit and that the PwC Partner provided non-audit services that were not relied upon by the audit engagement team in the audits of the financial statements of the Funds. Based on the mitigating factors noted above, PwC advised the Audit Committee that it concluded, individually for each matter and in the aggregate, that its objectivity and impartiality with respect to all issues encompassed within the audit engagement has not been impaired and it believes that a reasonable investor with knowledge of all relevant facts and circumstances for the violations would conclude PwC is capable of exercising objective and impartial judgment on all issues encompassed within the audits of the financial statements of the Funds in the Registrant for the impacted periods.
(a) to (d)
Fees Billed by PwC Related to the Registrant
PwC billed the Registrant aggregate fees for services rendered to the Registrant for the last two fiscal years as shown in the following table. The Audit Committee pre-approved all audit and non-audit services provided to the Registrant.
| Fees Billed for Services Rendered to the Registrant for fiscal year end 2022 | Fees Billed for Services Rendered to the Registrant for fiscal year end 2021 | |||||||||
Audit Fees | $ | 565,550 | $ | 554,425 | ||||||
Audit-Related Fees | $ | 0 | $ | 0 | ||||||
Tax Fees(1) | $ | 418,564 | $ | 516,414 | ||||||
All Other Fees | $
| 0
|
| $
| 0
|
| ||||
Total Fees | $ | 984,114 | $ | 1,070,839 | ||||||
| (1) | Tax Fees for the fiscal years ended December 31, 2022 and December 31, 2021 includes fees billed for preparation of U.S. Tax Returns and Taxable Income calculations, including excise tax and year-to-date estimates for various book-to-tax differences. |
Fees Billed by PwC Related to Invesco and Invesco Affiliates
PwC billed Invesco Advisers, Inc. (“Invesco”), the Registrant’s adviser, and any entity controlling, controlled by or under common control with Invesco that provides ongoing services to the Registrant (“Invesco Affiliates”) aggregate fees for pre-approved non-audit services rendered to Invesco and Invesco Affiliates for the last two fiscal years as shown in the following table. The Audit Committee pre-approved all non-audit services provided to Invesco and Invesco Affiliates that were required to be pre-approved.
| Fees Billed for Non- Audit Services Rendered to Invesco and Invesco Affiliates for fiscal year end 2022 That Were Required to be Pre-Approved by the Registrant’s Audit Committee | Fees Billed for Non-Audit Services Rendered to Invesco and Invesco Affiliates for fiscal year end 2021 That Were Required to be Pre-Approved by the Registrant’s Audit Committee | |||||||||
Audit-Related Fees(1) | $ | 874,000 | $ | 801,000 | ||||||
Tax Fees | $ | 0 | $ | 0 | ||||||
All Other Fees | $
| 0
|
| $
| 0
|
| ||||
Total Fees | $ | 874,000 | $ | 801,000 | ||||||
| (1) | Audit-Related Fees for the fiscal years ended 2022 and 2021 include fees billed related to reviewing controls at a service organization. |
(e)(1)
PRE-APPROVAL OF AUDIT AND NON-AUDIT SERVICES
POLICIES AND PROCEDURES
As adopted by the Audit Committees
of the Invesco Funds (the “Funds”)
Last Amended March 29, 2017
| I. | Statement of Principles |
The Audit Committees (the “Audit Committee”) of the Boards of Trustees of the Funds (the “Board”) have adopted these policies and procedures (the “Procedures”) with respect to the pre-approval of audit and non-audit services to be provided by the Funds’ independent auditor (the “Auditor”) to the Funds, and to the Funds’ investment adviser(s) and any entity controlling, controlled by, or under common control with the investment adviser(s) that provides ongoing services to the Funds (collectively, “Service Affiliates”).
Under Section 202 of the Sarbanes-Oxley Act of 2002, all audit and non-audit services provided to the Funds by the Auditor must be preapproved by the Audit Committee. Rule 2-01 of Regulation S-X requires that the Audit Committee also pre-approve a Service Affiliate’s engagement of the Auditor for non-audit services if the engagement relates directly to the operations and financial reporting of the Funds (a “Service Affiliate’s Covered Engagement”).
These Procedures set forth the procedures and the conditions pursuant to which the Audit Committee may pre-approve audit and non-audit services for the Funds and a Service Affiliate’s Covered Engagement pursuant to rules and regulations of the Securities and Exchange Commission (“SEC”) and other organizations and regulatory bodies applicable to the Funds (“Applicable Rules”).1 They address both general pre-approvals without consideration of specific case-by-case services (“general pre-approvals”) and pre-approvals on a case-by-case basis (“specific pre-approvals”). Any services requiring pre-approval that are not within the scope of general pre-approvals hereunder are subject to specific pre-approval. These Procedures also address the delegation by the Audit Committee of pre-approval authority to the Audit Committee Chair or Vice Chair.
| II. | Pre-Approval of Fund Audit Services |
The annual Fund audit services engagement, including terms and fees, is subject to specific pre-approval by the Audit Committee. Audit services include the annual financial statement audit and other procedures required to be performed by an independent auditor to be able to form an opinion on the Funds’ financial statements. The Audit Committee will receive, review and consider sufficient information concerning a proposed Fund audit engagement to make a reasonable evaluation of the Auditor’s qualifications and independence. The Audit Committee will oversee the Fund audit services engagement as necessary, including approving any changes in terms, audit scope, conditions and fees.
In addition to approving the Fund audit services engagement at least annually and specifically approving any changes, the Audit Committee may generally or specifically pre-approve engagements for other audit services, which are those services that only an independent auditor reasonably can provide. Other audit services may include services associated with SEC registration statements, periodic reports and other documents filed with the SEC.
| 1 | Applicable Rules include, for example, New York Stock Exchange (“NYSE”) rules applicable to closed-end funds managed by Invesco and listed on NYSE. |
| III. | General and Specific Pre-Approval of Non-Audit Fund Services |
The Audit Committee will consider, at least annually, the list of General Pre-Approved Non-Audit Services which list may be terminated or modified at any time by the Audit Committee. To inform the Audit Committee’s review and approval of General Pre-Approved Non-Audit Services, the Funds’ Treasurer (or his or her designee) and Auditor shall provide such information regarding independence or other matters as the Audit Committee may request.
Any services or fee ranges that are not within the scope of General Pre-Approved Non-Audit Services have not received general pre-approval and require specific pre-approval. Each request for specific pre-approval by the Audit Committee for services to be provided by the Auditor to the Funds must be submitted to the Audit Committee by the Funds’ Treasurer (or his or her designee) and must include detailed information about the services to be provided, the fees or fee ranges to be charged, and other relevant information sufficient to allow the Audit Committee to consider whether to pre-approve such engagement, including evaluating whether the provision of such services will impair the independence of the Auditor and is otherwise consistent with Applicable Rules.
| IV. | Non-Audit Service Types |
The Audit Committee may provide either general or specific pre-approval of audit-related, tax or other services, each as described in more detail below.
| a. | Audit-Related Services |
“Audit-related services” are assurance and related services that are reasonably related to the performance of the audit or review of the Fund’s financial statements or that are traditionally performed by an independent auditor. Audit-related services include, among others, accounting consultations related to accounting, financial reporting or disclosure matters not classified as “Audit services”; assistance with understanding and implementing new accounting and financial reporting guidance from rulemaking authorities; services related to mergers, acquisitions or dispositions; compliance with ratings agency requirements and interfund lending activities; and assistance with internal control reporting requirements.
| b. | Tax Services |
“Tax services” include, but are not limited to, the review and signing of the Funds’ federal tax returns, the review of required distributions by the Funds and consultations regarding tax matters such as the tax treatment of new investments or the impact of new regulations. The Audit Committee will not approve proposed services of the Auditor which the Audit Committee believes are to be provided in connection with a service or transaction initially recommended by the Auditor, the sole business purpose of which may be tax avoidance and the tax treatment of which may not be supported in the Internal Revenue Code and related regulations. The Audit Committee will consult with the Funds’ Treasurer (or his or her designee) and may consult with outside counsel or advisers as necessary to ensure the consistency of tax services rendered by the Auditor with the foregoing policy. The Auditor shall not represent any Fund or any Service Affiliate before a tax court, district court or federal court of claims.
Each request to provide tax services under either the general or specific pre-approval of the Audit Committee will include a description from the Auditor in writing of (i) the scope of the service, the fee structure for the engagement, and any side letter or other amendment to the engagement letter, or any other agreement (whether oral, written, or otherwise) between the Auditor and the Funds, relating to the service; and (ii) any compensation arrangement or other agreement, such as a referral agreement, a referral fee or
fee-sharing arrangement, between the Auditor (or an affiliate of the Auditor) and any person (other than the Funds or Service Affiliates receiving the services) with respect to the promoting, marketing, or recommending of a transaction covered by the service. The Auditor will also discuss with the Audit Committee the potential effects of the services on the independence of the Auditor, and document the substance of its discussion with the Audit Committee.
| c. | Other Services |
The Audit Committee may pre-approve other non-audit services so long as the Audit Committee believes that the service will not impair the independence of the Auditor. Appendix I includes a list of services that the Auditor is prohibited from performing by the SEC rules. Appendix I also includes a list of services that would impair the Auditor’s independence unless the Audit Committee reasonably concludes that the results of the services will not be subject to audit procedures during an audit of the Funds’ financial statements.
| V. | Pre-Approval of Service Affiliate’s Covered Engagements |
Rule 2-01 of Regulation S-X requires that the Audit Committee pre-approve a Service Affiliate’s engagement of the Auditor for non-audit services if the engagement relates directly to the operations and financial reporting of the Funds, defined above as a “Service Affiliate’s Covered Engagement”.
The Audit Committee may provide either general or specific pre-approval of any Service Affiliate’s Covered Engagement, including for audit-related, tax or other services, as described above, if the Audit Committee believes that the provision of the services to a Service Affiliate will not impair the independence of the Auditor with respect to the Funds. Any Service Affiliate’s Covered Engagements that are not within the scope of General Pre-Approved Non-Audit Services have not received general pre-approval and require specific pre-approval.
Each request for specific pre-approval by the Audit Committee of a Service Affiliate’s Covered Engagement must be submitted to the Audit Committee by the Funds’ Treasurer (or his or her designee) and must include detailed information about the services to be provided, the fees or fee ranges to be charged, a description of the current status of the pre-approval process involving other audit committees in the Invesco investment company complex (as defined in Rule 2-201 of Regulation S-X) with respect to the proposed engagement, and other relevant information sufficient to allow the Audit Committee to consider whether the provision of such services will impair the independence of the Auditor from the Funds. Additionally, the Funds’ Treasurer (or his or her designee) and the Auditor will provide the Audit Committee with a statement that the proposed engagement requires pre-approval by the Audit Committee, the proposed engagement, in their view, will not impair the independence of the Auditor and is consistent with Applicable Rules, and the description of the proposed engagement provided to the Audit Committee is consistent with that presented to or approved by the Invesco audit committee.
Information about all Service Affiliate engagements of the Auditor for non-audit services, whether or not subject to pre-approval by the Audit Committee, shall be provided to the Audit Committee at least quarterly, to allow the Audit Committee to consider whether the provision of such services is compatible with maintaining the Auditor’s independence from the Funds. The Funds’ Treasurer and Auditor shall provide the Audit Committee with sufficiently detailed information about the scope of services provided and the fees for such services, to ensure that the Audit Committee can adequately consider whether the provision of such services is compatible with maintaining the Auditor’s independence from the Funds.
| VI. | Pre-Approved Fee Levels or Established Amounts |
Pre-approved fee levels or ranges for audit and non-audit services to be provided by the Auditor to the Funds, and for a Service Affiliate’s Covered Engagement, under general pre-approval or specific pre-approval will be set periodically by the Audit Committee. Any proposed fees exceeding 110% of the maximum pre-approved fee levels or ranges for such services or engagements will be promptly presented to the Audit Committee and will require specific pre-approval by the Audit Committee before payment of any additional fees is made.
| VII. | Delegation |
The Audit Committee hereby delegates, subject to the dollar limitations set forth below, specific authority to its Chair, or in his or her absence, Vice Chair, to pre-approve audit and non-audit services proposed to be provided by the Auditor to the Funds and/or a Service Affiliate’s Covered Engagement, between Audit Committee meetings. Such delegation does not preclude the Chair or Vice Chair from declining, on a case by case basis, to exercise his or her delegated authority and instead convening the Audit Committee to consider and pre-approve any proposed services or engagements.
Notwithstanding the foregoing, the Audit Committee must pre-approve: (a) any non-audit services to be provided to the Funds for which the fees are estimated to exceed $500,000; (b) any Service Affiliate’s Covered Engagement for which the fees are estimated to exceed $500,000; or (c) any cost increase to any previously approved service or engagement that exceeds the greater of $250,000 or 50% of the previously approved fees up to a maximum increase of $500,000.
| VIII. | Compliance with Procedures |
Notwithstanding anything herein to the contrary, failure to pre-approve any services or engagements that are not required to be pre-approved pursuant to the de minimis exception provided for in Rule 2-01(c)(7)(i)(C) of Regulation S-X shall not constitute a violation of these Procedures. The Audit Committee has designated the Funds’ Treasurer to ensure services and engagements are pre-approved in compliance with these Procedures. The Funds’ Treasurer will immediately report to the Chair of the Audit Committee, or the Vice Chair in his or her absence, any breach of these Procedures that comes to the attention of the Funds’ Treasurer or any services or engagements that are not required to be pre-approved pursuant to the de minimis exception provided for in Rule 2-01(c)(7)(i)(C) of Regulation S-X.
On at least an annual basis, the Auditor will provide the Audit Committee with a summary of all non-audit services provided to any entity in the investment company complex (as defined in section 2-01(f)(14) of Regulation S-X, including the Funds and Service Affiliates) that were not pre-approved, including the nature of services provided and the associated fees.
| IX. | Amendments to Procedures |
All material amendments to these Procedures must be approved in advance by the Audit Committee. Non-material amendments to these Procedures may be made by the Legal and Compliance Departments and will be reported to the Audit Committee at the next regularly scheduled meeting of the Audit Committee.
Appendix I
Non-Audit Services That May Impair the Auditor’s Independence
The Auditor is not independent if, at any point during the audit and professional engagement, the Auditor provides the following non-audit services:
| • | Management functions; |
| • | Human resources; |
| • | Broker-dealer, investment adviser, or investment banking services ; |
| • | Legal services; |
| • | Expert services unrelated to the audit; |
| • | Any service or product provided for a contingent fee or a commission; |
| • | Services related to marketing, planning, or opining in favor of the tax treatment of confidential transactions or aggressive tax position transactions, a significant purpose of which is tax avoidance; |
| • | Tax services for persons in financial reporting oversight roles at the Fund; and |
| • | Any other service that the Public Company Oversight Board determines by regulation is impermissible. |
An Auditor is not independent if, at any point during the audit and professional engagement, the Auditor provides the following non-audit services unless it is reasonable to conclude that the results of the services will not be subject to audit procedures during an audit of the Funds’ financial statements:
| • | Bookkeeping or other services related to the accounting records or financial statements of the audit client; |
| • | Financial information systems design and implementation; |
| • | Appraisal or valuation services, fairness opinions, or contribution-in-kind reports; |
| • | Actuarial services; and |
| • | Internal audit outsourcing services. |
(e)(2) There were no amounts that were pre-approved by the Audit Committee pursuant to the de minimus exception under Rule 2-01 of Regulation S-X.
(f) Not applicable.
(g) In addition to the amounts shown in the tables above, PwC billed Invesco and Invesco Affiliates aggregate fees of $8,440,000 for the fiscal year ended December 31, 2022 and $5,931,000 for the fiscal year ended December 31, 2021. In total, PwC billed the Registrant, Invesco and Invesco Affiliates aggregate non-audit fees of $9,732,564 for the fiscal year ended December 31, 2022 and $7,248,414 for the fiscal year ended December 31, 2021.
PwC provided audit services to the Investment Company complex of approximately $32 million.
(h) The Audit Committee also has considered whether the provision of non-audit services that were rendered to Invesco and Invesco Affiliates that were not required to be pre-approved pursuant to SEC regulations, if any, is compatible with maintaining PwC’s independence.
| ITEM 5. | AUDIT COMMITTEE OF LISTED REGISTRANTS. |
Not applicable.
| ITEM 6. | SCHEDULE OF INVESTMENTS. |
Investments in securities of unaffiliated issuers is included as part of the reports to stockholders filed under Item 1 of this Form.
| ITEM 7. | DISCLOSURE OF PROXY VOTING POLICIES AND PROCEDURES FOR CLOSED-END MANAGEMENT INVESTMENT COMPANIES. |
Not applicable.
| ITEM 8. | PORTFOLIO MANAGERS OF CLOSED-END MANAGEMENT COMPANIES. |
Not applicable.
| ITEM 9. | PURCHASES OF EQUITY SECURITIES BY CLOSED-END MANAGEMENT INVESTMENT COMPANY AND AFFILIATED PURCHASERS. |
Not applicable.
| ITEM 10. | SUBMISSION OF MATTERS TO A VOTE OF SECURITY HOLDERS. |
None.
| ITEM 11. | CONTROLS AND PROCEDURES. |
| (a) | As of February 10, 2023, an evaluation was performed under the supervision and with the participation of the officers of the Registrant, including the PEO and PFO, to assess the effectiveness of the Registrant’s disclosure controls and procedures, as that term is defined in Rule 30a-3(c) under the Investment Company Act of 1940 (the “Act”), as amended. Based on that evaluation, the Registrant’s officers, including the PEO and PFO, concluded that, as of February 10, 2023, the Registrant’s disclosure controls and procedures were reasonably designed to ensure: (1) that information required to be disclosed by the Registrant on Form N-CSR is recorded, processed, summarized and reported within the time periods specified by the rules and forms of the Securities and Exchange Commission; and (2) that material |
information relating to the Registrant is made known to the PEO and PFO as appropriate to allow timely decisions regarding required disclosure. |
| (b) | There have been no changes in the Registrant’s internal control over financial reporting (as defined in Rule 30a-3(d) under the Act) that occurred during the period covered by this report that have materially affected, or are reasonably likely to materially affect, the Registrant’s internal control over financial reporting. |
| ITEM 12. | DISCLOSURE OF SECURITIES LENDING ACTIVITIES FOR CLOSED-END MANAGEMENT INVESTMENT COMPANIES. |
Not applicable.
| ITEM 13. | EXHIBITS. |
SIGNATURES
Pursuant to the requirements of the Securities Exchange Act of 1934 and the Investment Company Act of 1940, the Registrant has duly caused this report to be signed on its behalf by the undersigned, thereunto duly authorized.
Registrant: AIM Growth Series (Invesco Growth Series)
By: | /s/ Sheri Morris | |
Sheri Morris | ||
Principal Executive Officer | ||
Date: | March 1, 2023 | |
Pursuant to the requirements of the Securities and Exchange Act of 1934 and the Investment Company Act of 1940, this report has been signed below by the following persons on behalf of the Registrant and in the capacities and on the dates indicated.
By: | /s/ Sheri Morris | |
Sheri Morris | ||
Principal Executive Officer | ||
Date: | March 1, 2023 | |
By: | /s/ Adrien Deberghes | |
Adrien Deberghes | ||
Principal Financial Officer | ||
Date: | March 1, 2023 | |