Exhibit 96.1

Blyvoor Gold Resources (Pty) Ltd
S-K 1300 Technical Report Summary on the Blyvoor Gold Mine, South Africa | i |
DATE AND SIGNATURE PAGE
This Report titled “S-K 1300 Technical Report Summary on the Blyvoor Gold Mine, South Africa” was prepared for Blyvoor Gold Resources (Pty) Ltd. The Report is compiled in accordance with the United States Securities and Exchange Commission Part 229 Standard Instructions for Filing Forms Regulation S-K subpart 1300. The effective date of this Report is 29 February 2024.
The Qualified Persons (“QPs”) responsible for this Report are Mr. Uwe Engelmann (Geology and Mineral Resources) and Mr. Daniel (Daan) van Heerden (Mineral Processing, Mineral Extraction, Economic Analysis and Mineral Reserves).
| /s/ U ENGELMANN | |
| U ENGELMANN | |
| BSc (Zoo. & Bot.), BSc Hons (Geol.) | |
| Pr.Sci.Nat., FGSSA | |
| DIRECTOR, MINXCON (PTY) LTD | |
| /s/ D VAN HEERDEN | |
| D VAN HEERDEN | |
| B Eng (Min.), MCom (Bus. Admin.), MMC | |
| Pr.Eng., FSAIMM, AMMSA | |
| DIRECTOR, MINXCON (PTY) LTD | |
Signed at Little Falls, Gauteng, South Africa, on 30 May 2024.
 | |
| RESOURCE | RESERVE | VALUE |
Blyvoor Gold Resources (Pty) Ltd
S-K 1300 Technical Report Summary on the Blyvoor Gold Mine, South Africa | ii |
INFORMATION RISK
This Report was prepared by Uwe Engelmann and Daniel van Heerden (the QPs) of Minxcon (Pty) Ltd (“Minxcon”). In the preparation of the Report, the QPs utilised information relating to operational methods and expectations provided to them by various sources. Where possible, the QPs have verified this information from independent sources after making due enquiry of all material issues that are required in order to comply with the requirements of the United States Securities and Exchange Commission Part 229 Standard Instructions for Filing Forms Regulation S-K subpart 1300. The authors of this report are not qualified to provide extensive commentary on legal issues associated with rights to the mineral properties and relied on the information provided to them by the issuer. No warranty or guarantee, be it express or implied, is made by the authors with respect to the completeness or accuracy of the legal aspects of this document.
OPERATIONAL RISKS
The business of mining and mineral exploration, development and production by their nature contain significant operational risks. The business depends upon, amongst other things, successful prospecting programmes and competent management. Profitability and asset values can be affected by unforeseen changes in operating circumstances and technical issues.
POLITICAL AND ECONOMIC RISK
Factors such as political and industrial disruption, currency fluctuation and interest rates could have an impact on future operations, and potential revenue streams can also be affected by these factors. The majority of these factors are, and will be, beyond the control of any operating entity.
FORWARD LOOKING STATEMENTS
Certain statements contained in this document other than statements of historical fact, contain forward-looking statements regarding the operations, economic performance or financial condition, including, without limitation, those concerning the economic outlook for the mining industry, expectations regarding commodity prices, exchange rates, production, cash costs and other operating results, growth prospects and the outlook of operations, including the completion and commencement of commercial operations of specific production projects, its liquidity and capital resources and expenditure, and the outcome and consequences of any pending litigation or enforcement proceedings.
Although the QPs believe that the expectations reflected in such forward-looking statements are reasonable, no assurance can be given that such expectations will prove to be correct. Accordingly, results may differ materially from those set out in the forward-looking statements as a result of, among other factors, changes in economic and market conditions, changes in the regulatory environment and other State actions, success of business and operating initiatives, fluctuations in commodity prices and exchange rates, and business and potential risk management.
| |
| RESOURCE | RESERVE | VALUE |
Blyvoor Gold Resources (Pty) Ltd
S-K 1300 Technical Report Summary on the Blyvoor Gold Mine, South Africa | iii |
TABLE OF CONTENTS
| Item 1 - Executive Summary | 1 |
| | I. | Permitting Requirements | | 1 |
| | II. | Geology and Mineral Deposit | | 1 |
| | III. | Status of Exploration | | 2 |
| | IV. | Mineral Resource and Mineral Reserve Estimates | | 2 |
| | V. | Development and Operations | | 3 |
| | VI. | Economic Analysis | | 4 |
| | VII. | Conclusions | | 6 |
| | VIII. | Recommendations | | 8 |
| Item 2 - Introduction | | 10 |
| | Item 2 (a) | - Issuer Receiving the Report; Authors | | 10 |
| | Item 2 (b) | - Terms of Reference and Purpose of the Report | | 10 |
| | Item 2 (c) | - Sources of Information and Data Contained in the Report | | 10 |
| | Item 2 (d) | - Qualified Persons’ Personal Inspection of the Property | | 10 |
| Item 3 - Property Description and Location | | 12 |
| | Item 3 (a) | - Location of the Property | | 12 |
| | Item 3 (b) | - Area of the Property | | 13 |
| | Item 3 (c) | - Mineral Deposit Tenure | | 14 |
| | Item 3 (d) | - Royalties and Payments | | 15 |
| | I. | Government Royalties | | 15 |
| | II. | Streaming Arrangement | | 15 |
| | Item 3 (e) | - Environmental Liabilities | | 16 |
| | Item 3 (f) | - Permits to Conduct Work | | 17 |
| | I. | Environmental Authorisation | | 17 |
| | II. | Water Use Licence | | 17 |
| | III. | Additional Environmental Permits | | 17 |
| | IV. | other | | 18 |
| | Item 3 (g) | - Other Significant Factors and Risks | | 18 |
| Item 4 - Accessibility, Climate, Local Resources, Infrastructure and Physiography | | 19 |
| | Item 4 (a) | - Topography, Elevation and Vegetation | | 19 |
| | Item 4 (b) | - Access to the Property | | 19 |
| | Item 4 (c) | - Climate and Length of Operating Season | | 19 |
| | Item 4 (d) | - Infrastructure | | 20 |
| | I. | Regional Infrastructure | | 20 |
| | II. | Mine Infrastructure | | 20 |
| Item 5 - History | | 22 |
| | Item 5 (a) | - Prior Ownership and Ownership Changes | | 22 |
| | Item 5 (b) | - Historical Exploration and Development | | 22 |
| Item 6 - Geological Setting, Mineralisation and Deposit | | 23 |
| | Item 6 (a) | - Regional Geology | | 23 |
| | Item 6 (b) | - Local and Property Geology | | 23 |
| | Item 6 (c) | - Mineralisation and Deposit Type | | 28 |
| Item 7 - Exploration | | 29 |
| | Item 7 (a) | - Non-drilling Work | | 29 |
| | I. | Survey Procedures and Parameters | | 29 |
| | II. | Sampling Methods and Sample Quality | | 31 |
| | III. | Sample Data | | 31 |
| | IV. | Results and Interpretation of Exploration Information | | 31 |
| | | | | | |
| |
| RESOURCE | RESERVE | VALUE |
Blyvoor Gold Resources (Pty) Ltd
S-K 1300 Technical Report Summary on the Blyvoor Gold Mine, South Africa | iv |
| | Item 7 (b) | - Drilling | | 32 |
| | I. | Type and Extent of Drilling | | 32 |
| | II. | Factors Influencing the Accuracy of Results | | 32 |
| | III. | Exploration Properties – Drill Hole Details | | 33 |
| | Item 7 (c) | - Hydrogeology | | 33 |
| | Item 7 (d) | - Geotechnical | | 33 |
| Item 8 - Sample Preparation, Analyses and Security | | 34 |
| | Item 8 (a) | - Sample Handling Prior to Dispatch | | 34 |
| | Item 8 (b) | - Sample Preparation and Analysis Procedures | | 34 |
| | Item 8 (c) | - Quality Assurance and Quality Control | | 35 |
| | Item 8 (d) | - Adequacy of Sample Preparation, Security and Analytical Procedures | | 36 |
| Item 9 - Data Verification | | 38 |
| | Item 9 (a) | - Data Verification Procedures | | 38 |
| | Item 9 (b) | - Limitations on/Failure to Conduct Data Verification | | 39 |
| | Item 9 (c) | - Adequacy of Data | | 39 |
| Item 10 - Mineral Processing and Metallurgical Testing | | 40 |
| | Item 10 (a) | - Nature and Extent of Testing and Analytical Procedures | | 40 |
| | Item 10 (b) | - Basis of Assumptions Regarding Recovery Estimates | | 40 |
| | Item 10 (c) | - Representativeness of Samples and Adequacy of Data | | 40 |
| | Item 10 (d) | - Deleterious Elements for Extraction | | 40 |
| Item 11 - Mineral Resource Estimates | | 41 |
| | Item 11 (a) | - Assumptions, Parameters and Methods Used for Resource Estimates | | 41 |
| | I. | Mineral Resource Estimation Procedures | | 41 |
| | II. | Initial Assessment | | 48 |
| | III. | Mineral Resource Classification | | 48 |
| | IV. | Mineral Resource Statement | | 49 |
| | Item 11 (b) | - Individual Grade of Metals | | 53 |
| | Item 11 (c) | - Factors Affecting Mineral Resource Estimates | | 53 |
| Item 12 - Mineral Reserve Estimates | | 54 |
| | Item 12 (a) | - Key Assumptions, Parameters and Methods | | 54 |
| | I. | Design Methodology | | 54 |
| | II. | Cut- Off Grade | | 54 |
| | III. | Modifying Factors | | 55 |
| | IV. | Mineral Resource to Mineral Reserve Conversion | | 55 |
| | V. | Mineral Resource to Mineral Reserve Reconciliation | | 57 |
| | Item 12 (b) | - Multiple Commodity Reserve | | 59 |
| | Item 12 (c) | - Factors Affecting Mineral Reserve Estimation | | 59 |
| Item 13 - Mining Methods | | 60 |
| | I. | Opening Up | | 60 |
| | II. | Development | | 60 |
| | III. | Conventional Stoping | | 61 |
| | IV. | Selective Bench Mining | | 61 |
| | Item 13 (a) | - Parameters Relevant to Mine Design | | 61 |
| | I. | Geotechnical and Hydrological Parameters | | 61 |
| | II. | Seismic Management | | 62 |
| | III. | Underground Access, Ore Flow and Material Handling | | 62 |
| | IV. | Ventilation and Cooling | | 65 |
| | | | | | |
| |
| RESOURCE | RESERVE | VALUE |
Blyvoor Gold Resources (Pty) Ltd
S-K 1300 Technical Report Summary on the Blyvoor Gold Mine, South Africa | v |
| | Item 13 (b) | - Production Rates, Expected Mine Life, Mining Unit Dimensions, and Mining Dilution | | 65 |
| | I. | Shift Cycle | | 65 |
| | II. | Production Rates | | 65 |
| | III. | Life of Mine Plan | | 66 |
| | IV. | Mining Performance | | 67 |
| | V. | Mining Unit Dimensions | | 69 |
| | VI. | Mine Design | | 70 |
| | VII. | Mineral Reserve Conversion Factors | | 73 |
| | Item 13 (c) | - Requirements for Stripping, Underground Development and Backfilling | | 74 |
| | I. | Underground Development | | 74 |
| | II. | Backfilling | | 75 |
| | Item 13 (d) | - Required Mining Fleet, Machinery and Personnel | | 75 |
| | I. | Mining Fleet and Machinery | | 75 |
| | II. | Personnel | | 76 |
| Item 14 - Recovery Methods | | 77 |
| | Item 14 (a) | - Flow Sheets and Process Recovery Methods | | 77 |
| | Item 14 (b) | - Plant Design, Equipment Characteristics and Specifications | | 78 |
| | Item 14 (c) | - Energy, Water and Process Materials Requirements | | 79 |
| | I. | Labour Requirements | | 79 |
| | II. | Reagents and Consumables | | 80 |
| Item 15 - Project Infrastructure | | 82 |
| | Item 15 (a) | - Infrastructure General Arrangement | | 82 |
| | I. | Surface Infrastructure Layout | | 82 |
| | II. | Shafts and Underground | | 82 |
| | Item 15 (b) | - Mining Operations | | 83 |
| | I. | Surface Operations | | 83 |
| | II. | Underground Operations | | 84 |
| | III. | Completed and Remaining Project Works – Infrastructure | | 85 |
| | Item 15 (c) | - Services | | 88 |
| Item 16 - Market Studies | | 89 |
| | Item 16 (a) | - Commodity Market Assessment | | 89 |
| | I. | World Gold Deposits and Reserves | | 89 |
| | II. | Gold Supply and Demand Fundamentals | | 89 |
| | III. | Gold Pricing | | 90 |
| | IV. | Gold Outlook | | 91 |
| | Item 16 (b) | - Contracts | | 91 |
| Item 17 - Environmental Studies, Permitting and Plans, Negotiations, or Agreements with Local Individuals or Groups | | 92 |
| | Item 17 (a) | - Relevant Environmental Issues and Results of Studies Done | | 92 |
| | I. | Land Use and Site | | 92 |
| | II. | Fauna and Flora | | 92 |
| | III. | Surface Instability | | 92 |
| | IV. | Ionising Radiation | | 93 |
| | V. | Acid Mine Drainage | | 93 |
| | VI. | Groundwater | | 93 |
| | Item 17 (b) | - Waste Disposal, Site Monitoring and Water Management | | 93 |
| | I. | Waste Disposal | | 93 |
| | II. | Site Monitoring – Water | | 93 |
| | III. | Site Monitoring – Sinkholes | | 94 |
| | IV. | Site Monitoring – Dust Fallout | | 94 |
| | V. | Site Monitoring – Radioactivity | | 94 |
| | VI. | Water Management | | 94 |
| | | | | | |
| |
| RESOURCE | RESERVE | VALUE |
Blyvoor Gold Resources (Pty) Ltd
S-K 1300 Technical Report Summary on the Blyvoor Gold Mine, South Africa | vi |
| | Item 17 (c) | - Permit Requirements | | 94 |
| | Item 17 (d) | - Social and Community-Related Requirements | | 94 |
| | Item 17 (e) | - Mine Closure Plans and Costs | | 95 |
| | Item 17 (f) | - Adequacy of Current Plans | | 96 |
| | Item 17 (g) | - Local Procurement and Hiring | | 96 |
| Item 18 - Capital and Operating Costs | | 97 |
| | Item 18 (a) | - Capital Costs | | 97 |
| | Item 18 (b) | - Operating Cost | | 100 |
| | I. | Financial Costs Indicators | | 107 |
| | Item 18 (c) | - Accuracy of Estimates | | 110 |
| Item 19 - Economic Analysis | | 111 |
| | Item 19 (a) | - Principal Assumptions | | 111 |
| | I. | Basis of Evaluation of the Mining Assets | | 111 |
| | II. | Macro-Economic Forecasts | | 111 |
| | III. | Working Capital | | 112 |
| | IV. | Recoveries | | 112 |
| | V. | Discount Rate | | 112 |
| | VI. | Cash Flow Forecast | | 113 |
| | Item 19 (b) | - Net Present Value | | 121 |
| | Item 19 (c) | - Regulatory Items | | 122 |
| | I. | Government Royalties | | 122 |
| | II. | Corporate Taxes | | 122 |
| | Item 19 (d) | - Sensitivity Analysis | | 122 |
| | Item 19 (e) | - Economic Analysis Conclusions | | 125 |
| Item 20 - Adjacent Properties | | 126 |
| Item 21 - Other Relevant Data and Information | | 129 |
| | Item 21 (a) | - Risk Assessment | | 129 |
| Item 22 - Interpretation and Conclusions | | 133 |
| Item 23 - Recommendations | | 135 |
| Item 24 - References | | 137 |
| Item 25 - Reliance on Information Provided by the Registrant | | 138 |
| | | | | | |
| |
| RESOURCE | RESERVE | VALUE |
Blyvoor Gold Resources (Pty) Ltd
S-K 1300 Technical Report Summary on the Blyvoor Gold Mine, South Africa | vii |
FIGURES
| Figure 1: Location of Blyvoor Mine | | 12 |
| Figure 2: Location of Blyvoor Gold Assets in Relation to the Orphans (Including Harmony Assets) | | 13 |
| Figure 3: Company Structure | | 15 |
| Figure 4: Location of Blyvoor in Relation to the Goldfields of the Witwatersrand Basin | | 24 |
| Figure 5: General Stratigraphy of the Upper Carletonville Goldfield | | 25 |
| Figure 6: Blyvoor Surface Geology Plan | | 27 |
| Figure 7: Blyvoor Simplified Geological Section Looking West | | 27 |
| Figure 8: Blyvoor Underground and Drillholes Plan, 2007 | | 32 |
| Figure 9: New Channel Sampling Data for the Carbon Leader Reef in Relation to 2024 Depletions. | | 38 |
| Figure 10: Carbon Leader Reef Eight Domains or Facies Zones Relative to Gold Content | | 42 |
| Figure 11: Carbon Leader Reef Eight Domains or Facies Zones Relative to Channel Width | | 43 |
| Figure 12: Middelvlei Reef Three Domains or Facies Zones Relative to Gold Content | | 43 |
| Figure 13: Middelvlei Reef Three Domains or Facies Zones Relative to Channel Width | | 44 |
| Figure 14: The Combined Carbon Leader Reef Block Model Filtered on cm.g/t | | 46 |
| Figure 15: The Combined Middelvlei Reef Block Model Filtered on cm.g/t | | 46 |
| Figure 16: Depletions Applied to the Carbon Leader Reef Block Model | | 47 |
| Figure 17: Depletions Applied to the Middelvlei Reef Block Models | | 47 |
| Figure 18: The Mineral Resource Classification for the Carbon Leader Reef | | 49 |
| Figure 19: The Mineral Resource Classification for the Middelvlei Reef | | 49 |
| Figure 20: Diluted Life of Mine Production Schedule by Reef Classification (2024) | | 56 |
| Figure 21: Development Design | | 60 |
| Figure 22: Schematic Representation of SBM Stoping | | 61 |
| Figure 23: Sectional Schematic of Blyvoor Shaft Systems | | 64 |
| Figure 24: Square Meter Production Profile by Reef Category | | 66 |
| Figure 25: Diluted Tonnes Delivered to Plant over Life of Mine | | 67 |
| Figure 26: Diluted Content Delivered to the Plant | | 67 |
| Figure 27: Pre- and Post- Intended Listing Planned Tonnes over 6 Years | | 68 |
| Figure 28: Pre- and Post- Intended Listing Planned Gold over 6 Years in Kilograms | | 68 |
| Figure 29: Actual Gold Produced vs Planned Gold over 6 years in Ounces | | 69 |
| Figure 30: Actual MCF vs Planned MCF over 6 years | | 69 |
| Figure 31: Planned Ledging and Stoping Design | | 71 |
| Figure 32: Development and Opening Up | | 72 |
| Figure 33: Opening-up Required | | 73 |
| Figure 34: Development Requirement over Life of Mine | | 74 |
| Figure 35: Opening Up Required Over Life of Mine | | 75 |
| Figure 36: Blyvoor Gold Block Process Flow Diagram | | 77 |
| Figure 37: PS Shaft Surface Infrastructure General Arrangement and Layout | | 83 |
| Figure 38: Capital Schedule | | 100 |
| Figure 39: Actual Stoping Operating Cost (excluding Labour) | | 101 |
| Figure 40: Stoping Crew Build-up | | 101 |
| Figure 41: Actual Development Cost (Excluding Labour) | | 102 |
| Figure 42: Development Labour Numbers | | 103 |
| Figure 43: Actual Engineering Operating Cost (excluding Labour) | | 104 |
| Figure 44: Actual Plant Operating Costs (excluding Labour and Power) | | 105 |
| Figure 45: Rehabilitation Payment Schedule | | 107 |
| Figure 46: Adjusted Operating Cost vs. Milled Tonnes | | 109 |
| |
| RESOURCE | RESERVE | VALUE |
Blyvoor Gold Resources (Pty) Ltd
S-K 1300 Technical Report Summary on the Blyvoor Gold Mine, South Africa | viii |
| Figure 47: AISC vs. Gold Price | | 109 |
| Figure 48: AIC vs. Gold Price | | 110 |
| Figure 49: Real-term Historic Gold Price | | 112 |
| Figure 50: Saleable Gold Ounces | | 114 |
| Figure 51: Undiscounted Monthly Cash Flow – 36 Months | | 115 |
| Figure 52: Undiscounted Cash Flow | | 115 |
| Figure 53: Project Sensitivity (NPV11.9%) | | 123 |
| Figure 54: Gold Mines of the Carletonville Goldfield | | 127 |
TABLES
| Table 1: Summary of Mining Right for Blyvoor Mine | | 14 |
| Table 2: Assessed Rehabilitation Liabilities attached to MR143GP as of February 2024 with Amended Splits | | 16 |
| Table 3: Historical Development Summary of the Mine | | 22 |
| Table 4: Raw Statistics for Gold Content for the 2023 and 2024 Datasets | | 41 |
| Table 5: Raw Statistics for Channel Width for the 2023 and 2024 Datasets | | 41 |
| Table 6: Carbon Leader Facies | | 42 |
| Table 7: Pay Limit Derivation Factors | | 48 |
| Table 8: Attributable Mineral Resources Inclusive of Mineral Reserves for the Carbon Leader Reef for Blyvoor Mine as at 29 February 2024 | | 50 |
| Table 9: Attributable Mineral Resources Exclusive of Mineral Reserves for the Carbon Leader Reef for Blyvoor Mine as at 29 February 2024 | | 51 |
| Table 10: Attributable Mineral Resources Inclusive of Mineral Reserves for the Middelvlei Reef for Blyvoor Mine as at 29 February 2024 | | 51 |
| Table 11: Attributable Mineral Resources Exclusive of Mineral Reserves for the Middelvlei Reef for Blyvoor Mine as at 29 February 2024 | | 52 |
| Table 12: Combined Total Attributable Mineral Resources Inclusive of Mineral Reserves for Blyvoor Mine as at 29 February 2024 | | 52 |
| Table 13: Combined Total Attributable Mineral Resources Exclusive of Mineral Reserves for Blyvoor Mine as at 29 February 2024 | | 53 |
| Table 14: Cut-off Calculation | | 54 |
| Table 15: Mineral Reserve Conversion Factors Summary | | 55 |
| Table 16: Mineral Reserves for the Carbon Leader Reef for Blyvoor Mine as at 29 February 2024 | | 56 |
| Table 17: Mineral Reserves for the Middelvlei Reef for Blyvoor Mine 29 February 2024 | | 57 |
| Table 18: Combined Total Mineral Reserves for Blyvoor Mine as at 29 February 2024 | | 57 |
| Table 19: Combined Mineral Resources for the Blyvoor Mine as at 29 February 2024 (Inclusive) | | 58 |
| Table 20: Combined Mineral Resources for the Blyvoor Mine as at 29 February 2024 (Exclusive) | | 58 |
| Table 21: Combined Mineral Resources for the Blyvoor Mine as at 29 February 2024 (In Life of Mine Plan) | | 58 |
| Table 22: Combined Mineral Reserves for Blyvoor Mine as at 29 February 2024 | | 58 |
| Table 23: Underground Operation Shift Cycle | | 65 |
| Table 24: Planned Development Advance Rates | | 66 |
| Table 25: Conventional Stoping and SBM Production Parameters | | 66 |
| Table 26: Development Dimensions | | 70 |
| Table 27: Development Parameters | | 70 |
| Table 28: Required Equipment | | 75 |
| Table 29: Equipment Schedule | | 76 |
| Table 30: Blyvoor Mine Mining Personnel for FY2025 | | 76 |
| |
| RESOURCE | RESERVE | VALUE |
Blyvoor Gold Resources (Pty) Ltd
S-K 1300 Technical Report Summary on the Blyvoor Gold Mine, South Africa | ix |
| Table 31: Plant Labour Complement | | 80 |
| Table 32: Reagent and Consumable Consumptions | | 81 |
| Table 33: Doornfontein - Blyvooruitzicht Boundary Connection Development | | 85 |
| Table 34: Gold Price Forecast (Nominal Terms) | | 90 |
| Table 35: Mining and Infrastructure Capital Cost Estimate | | 97 |
| Table 36: Plant Capital Summary | | 98 |
| Table 37: Capital Summary | | 99 |
| Table 38: Stoping Consumables Cost | | 100 |
| Table 39: Development Consumables Cost | | 102 |
| Table 40: Mining Operating Costs Summary | | 105 |
| Table 41: Plant Operating Costs Summary | | 106 |
| Table 42: Overhead and Selling Operating Costs Summary | | 106 |
| Table 43: Corporate Costs Summary | | 106 |
| Table 44: Project Cost Indicators | | 108 |
| Table 45: Macro-Economic Forecasts and Commodity Prices over the Life of Mine | | 112 |
| Table 46: Blyvoor Mine Cost of Equity | | 113 |
| Table 47: Southern African Gold Mining Companies’ Beta Values | | 113 |
| Table 48: Production Breakdown in Life of Mine | | 114 |
| Table 49: Annual Cash Flow – Techno-economic Inputs (First 17 Years) | | 117 |
| Table 50: Annual Cash Flow – Techno-economic Inputs (Remaining 17 Years) | | 117 |
| Table 51: Annual Real Cash Flow (First 17 Years) | | 118 |
| Table 52: Annual Real Cash Flow (Remaining 17 Years) | | 118 |
| Table 53: Annual Cash Flow – Techno-economic Inputs (First 5 Years – Half Yearly) | | 119 |
| Table 54: Annual Real Cash Flow (First 5 Years – Half Yearly) | | 120 |
| Table 55: Blyvoor Mine NPV Summary – Real Terms | | 121 |
| Table 56: Project Profitability Ratios | | 121 |
| Table 57: Sensitivity Analysis of Commodity Prices and Exchange Rate to NPV11.9% (USDm) | | 124 |
| Table 58: Sensitivity Analysis of Cash Operating Costs and Grade to NPV11.9% (USDm) | | 124 |
| Table 59: Blyvoor Mine Economic Analysis Summary – Real Terms | | 125 |
| Table 60: Risk Assessment | | 130 |
EQUATIONS
| Equation 1: Mining Tax Formula | | 122 |
| |
| RESOURCE | RESERVE | VALUE |
Blyvoor Gold Resources (Pty) Ltd
S-K 1300 Technical Report Summary on the Blyvoor Gold Mine, South Africa | x |
LIST OF UNITS AND ABBREVIATIONS
Units: The following units were used in this Report, and are in metric terms:-
| Unit | Definition |
| % | Per cent |
| %m/m | Percent of mass |
| %v/v | Percent of volume |
| / | Per |
| ± or ~ | Approximately |
| ° | Degrees |
| °C | Degrees Celsius |
| a | Year |
| Boz | Billion ounces |
| cm | Centimetre |
| cm.g/t | Centimetre grammes per tonne |
| d | Day |
| ft | Foot |
| g | Grammes |
| g/t | Grammes per tonne |
| Ga | Billion years (1,000,000,000 years) |
| ha | Hectares |
| hr | Hour |
| kg | Kilogram (1,000 g) |
| km | Kilometre (1,000 m) |
| km2 | Square kilometres |
| koz | Kilo ounces (1,000 oz) |
| kt | Kilotonnes (1,000 t) |
| ktpa | Kilotonnes per annum |
| ktpm | Kilo tonnes per month |
| kV | Kilovolt (1,000 volts) |
| kVA | Kilovolt ampere |
| kW | Kilowatt (1,000 W) |
| l | Litre |
| l/sec | Litres per second |
| m | Metre |
| M | Molarity |
| m/crew/month | Meter per crew per month |
| Unit | Definition |
| m/month | Meter per month |
| m2 | Square metres |
| m²/month | Square meter per month |
| m3 | Cubic metres |
| m3/s | Cubic meters per second |
| Ma | Million years (1,000,000 years) |
| mbs | Metres below sea level |
| min | Minute |
| Ml | Million litres (1,000,000 l) |
| mm | Millimetre |
| Mm3 | Million cubic meters |
| mo | Month |
| Moz | Million ounces (1,000,000 oz) |
| Mt | Million tonnes (1,000,000 t) |
| MVA | Megavolt ampere |
| MW | Megawatt (1,000,000 W) |
| MWh | Megawatt hour |
| oz | Troy Ounces |
| per man/month | Per man month |
| s | Second (time) |
| t | Tonne |
| t/m³ | Tonnes per cubic meter |
| t/man | Tonne per man |
| tpa | Tonnes per annum |
| tpd | Tonnes per day |
| tph | Tonnes per hour |
| tpm | Tonnes per month |
| V | Volts |
| W | Watt |
| x | By/Multiplied by |
| ZAR/ore t | South African Rand per ore tonne |
| μm | Micrometre |
Computation: It is noted that throughout the Report, tables may not compute due to rounding.
| |
| RESOURCE | RESERVE | VALUE |
Blyvoor Gold Resources (Pty) Ltd
S-K 1300 Technical Report Summary on the Blyvoor Gold Mine, South Africa | xi |
Abbreviations: The following abbreviations were used in this Report:-
| Abbreviation | Description |
| AGA | AngloGold Ashanti Limited |
| AIC | All-in Costs |
| AISC | All-in Sustainable Costs |
| ASG | Advanced Strike Gully |
| BEE | Black Economic Empowerment |
| BGMC | Blyvooruitzicht Gold Mining Company Limited (in provisional liquidation) |
| Blyvoor, Blyvoor Mine or Mine | Blyvoor Gold Mine |
| Blyvoor Capital | Blyvoor Gold Capital (Pty) Ltd |
| Blyvoor Gold | Blyvoor Gold (Pty) Ltd |
| Blyvoor Resources or Client or Company | Blyvoor Gold Resources (Pty) Ltd |
| BP | Boundary Pillar |
| CAE | CAE Mining (Datamine™) |
| CAPEX | Capital Expenditure |
| CAPM | Capital Asset Pricing Model |
| CCTV | Closed-circuit Television |
| CIL | Carbon-in-Leach |
| CIP | Carbon-in-Pulp |
| CL | Carbon Leader Reef |
| Coffey Mining | Coffey Mining (SA) Pty Ltd |
| CPI | Consumer Price Indices |
| Cwb | Köppen and Geiger classification acronym for subtropical highland climate or temperate oceanic climate with dry winters |
| CWC | Covalent Water Company (Pty) Ltd |
| DCF | Discounted Cash Flow |
| DMRE | Department of Mineral Resources and Energy |
| DRD | DRDGold Ltd |
| EA | Environmental Authorisation |
| EBIT | Earnings before Interest and Taxes |
| EBITDA | Earnings before Interest, Tax, Depreciation and Amortization |
| EIA | Environmental Impact Assessment |
| EMP | Environmental Management Programme |
| FCFE | Free Cash Flow to Equity |
| FCFF | Free Cash Flow to the Firm |
| FEL | Front-End Loader |
| FoG | Fall of Ground |
| FWRDWA | Far West Rand Dolomitic Water Association |
| FY | Financial Year |
| GDP | Gross Domestic Product |
| Guardrisk | Guardrisk Insurance Company Limited |
| H1 | First Half-year |
| H2 | Second Half-year |
| Harmony | Harmony Gold Mining Company Limited |
| HDSAs | Historically Disadvantaged South Africans |
| HRD | Human Resource Development |
| IPC | Intermediate Pump Chamber |
| IRL | In-Line Leach Reactor |
| IRR | Internal Rate of Return |
| JORC Code | 2012 Edition of the Australasian Code for Reporting of Exploration Results, Mineral Resources and Mineral Reserves |
| JPLs | Joint Provisional Liquidators |
| KE | Kriging Efficiencies |
| LED | Local Economic Development |
| LoM | Life of Mine |
| M&I | Measured and Indicated (Mineral Resources) |
| MCF | Mine Call Factor |
| Minxcon | Minxcon (Pty) Ltd |
| MPRDA | Mineral and Petroleum Resources Development Act, No 28 of 2002 |
| MR | Middelvlei Reef |
| MR143GP | Converted Mining Right GP 30/5/1/2/2/143 MR |
| NEMA | National Environmental Management Act, No. 107 of 1998 |
| No. | Number |
| NPV | Net Present Value |
| NWA | National Water Act, No. 36 of 1998 |
| OHMS | Open House Management Solutions |
| OPEX | Operating Expenditure |
| Orphans | Third party acquired components of the historical Mining Right 46/99 that were not grouped underpurchased by Blyvoor Gold Capital (Pty) Ltd or Blyvoor Gold Operations (Pty) Ltd |
| P100 or P80 | Per cent of sample or stream larger than or smaller than a specified value |
| |
| RESOURCE | RESERVE | VALUE |
Blyvoor Gold Resources (Pty) Ltd
S-K 1300 Technical Report Summary on the Blyvoor Gold Mine, South Africa | xii |
| Abbreviation | Description |
| PDC | Process Design Criteria |
| PEA | Preliminary Economic Assessment |
| PEM | Prospectivity Enhancement Multiplier |
| PFS | Pre-Feasibility Study |
| ProOptima | ProOptima Audit Services |
| PS Shaft | Peter Skeat Shaft, previously known as the No. 5 Shaft |
| PSD | Particle size distribution |
| PSSV Shaft | Peter Skeat Sub-vertical Shaft, previously known as the No. 5A Sub-vertical Shaft |
| QAQC | Quality Assurance and Quality Control |
| RoM | Run of Mine |
| RTO | Reverse Takeover |
| SAMREC Code | South African Code for the Reporting of Exploration Results, Mineral Resources and Mineral Reserves |
| SBM | Selective Blast Mining |
| SG | Specific Gravity |
| SIB | Stay in Business |
| S-K 1300 | United States Securities and Exchange Commission Part 229 Standard Instructions for Filing Forms Regulation S-K subpart 1300 |
| SLP | Social and Labour Plan |
| SoR | Slopes of Regression |
| STC | Secondary Tax on Dividends |
| TSF | Tailings Storage Facility |
| USD | United States Dollar |
| VALMIN Code | 2015 Edition of the Code and Guidelines for the Technical Assessment and/or Valuation of Mineral and Petroleum Assets and Securities for Independent Expert Reports |
| Village Main Reef | Village Main Reef Limited |
| ZAR | South African Rand |
| ZAR/USD | South African Rand: United States Dollar |
| ZARm | Million South African Rand |
| |
| RESOURCE | RESERVE | VALUE |
Blyvoor Gold Resources (Pty) Ltd
S-K 1300 Technical Report Summary on the Blyvoor Gold Mine, South Africa | 1 |
ITEM 1 - EXECUTIVE SUMMARY
The Blyvoor Gold Mine is an operating underground gold mine situated in the Carletonville Goldfield of the Witwatersrand Basin. The Mine occurs 14 km southwest of the town of Carletonville and 80 km southwest of Johannesburg, Gauteng Province, South Africa.
Gold mineralisation is hosted in the Middelvlei and Carbon Leader reefs and accessed through the Peter Skeat Shaft (or PS Shaft, previously known as the No. 5 Shaft), which recommenced operations in quarter 3 2019 after a hiatus from 2013. Mineralisation is extracted mostly through conventional mining methods; however, a Selective Blast Mining method (“SBM”) is applied to those carbon leader stopes that lend themselves to this method. Current mining rates do not exceed 30 ktpm, but it is planned to ramp up production to 80 ktpm. Extracted material is processed at a hard rock gold extraction carbon-in-pulp plant situated adjacent to PS Shaft. The plant has a nameplate processing capacity of 40 ktpm but is currently achieving some 22 ktpm due to mining constraints.
| I. | Permitting Requirements |
The Blyvoor Mine operates under a mining right GP 30/5/1/2/2/143 MR, encompassing 6,708.4273 ha and which is valid for gold mining until 16 February 2047. An Environmental Authorisation was granted on 19 February 2020 for the Mining Right Project Area inclusive of the underground operations. The water use licence for the Project was granted on 14 May 2024. The mining right is issued to Blyvoor Gold Capital (Pty) Ltd in which Blyvoor Gold Resources (Pty) Ltd holds 74% shareholding.
| II. | Geology and Mineral Deposit |
Blyvoor lies within the late Archaean Witwatersrand Basin. This basin comprises up to 7,000 m thick interbedded sequence of argillaceous and arenaceous sedimentary rocks mainly dipping at shallow angles towards the centre of the basin and extend laterally for some 350 km northeast-southwest and 120 km northwest-southeast on the Kaapvaal Craton. The upper portion of the basin-fill (Central Rand Group), which contains the sedimentary reefs or mineralised zones, outcrops at its northern extent near Johannesburg. Further west, south and east, the basin is overlain by a combination of up to 4,000 m of younger Archaean, Proterozoic and Mesozoic volcanic and sedimentary rocks. Locally, Blyvoor falls within the Carletonville Goldfield.
The majority of Blyvoor is structurally relatively undisturbed. In the western section, however, the area is structurally complex due to the presence of the Master Bedding Fault which rejuvenated older faults and formed new ones in close proximity to its plane. The Master Bedding Fault has eliminated a large percentage of the Carbon Leader to the north of Doornfontein No. 2 Shaft, but the Middelvlei is present over the whole lease area. Major structures in close proximity to historical mining activities at 35 Level and below, are the Boulder and Alpha Dykes. The Boulder Dyke has a downthrow of 40 m to 95 m to the north and strikes east-west.
Economic gold mineralisation in the Witwatersrand Basin sediments occurs typically within quartz pebble conglomerate reefs. The reefs are generally less than 2 m in thickness. Stratigraphically, most economic placers were found in the Central Rand Group at various stratigraphic levels and usually represent significant stratigraphic unconformities. At Blyvoor, two economic placer horizons were exploited. These are namely the Carbon Leader and Middelvlei Reefs and occur in quartzites of the Main Reef Conglomerate Formation of the Johannesburg Subgroup of the Central Rand Group. The auriferous conglomerates dip uniformly at 22°S.
| |
| RESOURCE | RESERVE | VALUE |
Blyvoor Gold Resources (Pty) Ltd
S-K 1300 Technical Report Summary on the Blyvoor Gold Mine, South Africa | 2 |
The Carbon Leader is a high grade, predominantly thin (<40 cm) carbon-rich reef and is the principle economic horizon at the Blyvoor Mine. Grades decrease towards the south and southwest. The origin of the carbon is in debate as to whether it originated hydrothermally or from algae. Within the deeper southern section of the project area (below 35 Level), carbon is scarcer and hence likely responsible for the decline in grade.
The Middelvlei Reef is the second economic horizon at the Blyvoor Mine and lies stratigraphically 50 m to 75 m above the Carbon Leader. Towards the south, the separation increases due to a minor angular unconformity. The Middelvlei Reef is characterised by lower grades than the Carbon Leader. Owing to the historical variable payability and presence of sedimentologically controlled pay shoots, the Middelvlei Reef has been mined in scattered payable areas.
| III. | Status of Exploration |
Exploration at Blyvoor is strictly of a historical nature as the Mine is a mature operation. Blyvoor’s life of mine is concentrated in close proximity to historical mining areas. Minxcon is of the opinion that no further exploration work is deemed necessary due to the fact that the no new ground is being explored. Data from adjacent operations is utilised in conjunction with available project data for interpretations and Mineral Resource estimations.
| IV. | Mineral Resource and Mineral Reserve Estimates |
Measured, Indicated and Inferred Mineral Resources are based on Ordinary Kriging. Estimation was performed in 2D space for the Carbon Leader and Middelvlei Reefs. Geological losses of 5%, 10% and 15% were applied to Measured, Indicated and Inferred Mineral Resources, respectively. The total Mineral Resources Excluding Mineral Reserves are detailed in the following table.
Combined Total Attributable Mineral Resources Exclusive of Mineral Reserves for Blyvoor Mine as at 29 February 2024
Mineral Resource
Classification | Stope Width | Stope Tonnes | Stope Grade | Stope Content | Gold Content |
| cm | Mt | g/t | cm.g/t | kg | Moz |
| Measured | 117 | 11,25 | 4,74 | 555 | 53 356 | 1,72 |
| Indicated | 117 | 2,75 | 3,45 | 403 | 9 478 | 0,30 |
| Total M&I | 117 | 14,00 | 4,50 | 526 | 62 834 | 2,02 |
Mineral Resource
Classification | Stope Width | Stope Tonnes | Stope Grade | Stope Content | Gold Content |
| cm | Mt | g/t | cm.g/t | kg | Moz |
| Inferred | 117 | 58.81 | 4.40 | 515 | 258,752 | 8.32 |
Notes:
| 1. | Mineral Resources are reported at a 300 cm.g/t (2.56 g/t over 117 cm stoping width equivalent) pay limit. |
| 2. | Depletions were applied. |
| 3. | Boundary pillars were excluded from the Mineral Resources, reported inclusive of internal pillars and shaft pillars. |
| 4. | A geological loss of 5% for Measured, 10% for Indicated and 15% for Inferred Mineral Resources has been applied. |
| 5. | Mineral Resources are 74% attributable to Blyvoor Gold Resources (Pty) Ltd and occur within the mining right perimeter. |
| 6. | Mineral Resources are Exclusive of Mineral Reserves. |
Inferred Mineral Resources inclusive and exclusive of Mineral Reserves are the same as there are no inferred Mineral Resources in the Mineral Reserve. Mineral Resources in the Measured and Indicated Mineral Resource classifications were converted into Proven and Probable Mineral Reserves, by applying the applicable modifying factors. The total Mineral Reserves for Blyvoor Mine as at 29 February 2024 are presented in the following table.
| |
| RESOURCE | RESERVE | VALUE |
Blyvoor Gold Resources (Pty) Ltd
S-K 1300 Technical Report Summary on the Blyvoor Gold Mine, South Africa | 3 |
Combined Total Mineral Reserves for Blyvoor Mine as at 29 February 2024
Mineral Reserve
Classification | Delivered Grade | Delivered Tonnes | Delivered Au Content |
g/t | Mt | kg | Moz |
| Mineral Reserves in LoM plan |
| Proved | 5.69 | 7.94 | 45,164.11 | 1.45 |
| Probable | 5.49 | 20.89 | 114,665.04 | 3.69 |
| Total | 5.54 | 28.83 | 159,829.15 | 5.14 |
| Mineral Reserves as 74% attributable to Blyvoor Resources |
| Proved | 5.69 | 5.88 | 33,421.44 | 1.07 |
| Probable | 5.49 | 15.46 | 84,852.13 | 2.73 |
| Total | 5.54 | 21.33 | 118,273.57 | 3.80 |
Notes:
| 1. | Mineral Reserves stated at a long term gold price of USD1,900/oz and a long term exchange rate of ZAR/USD 19.15. |
| 2. | Mineral Reserves are reported at a 496 cm.g/t cut-off grade applied. |
| 3. | Minimum remnant area of 1,000 m² applied. |
| 4. | Mining extraction of 80% applied to all remnants. |
| 5. | Pillar provision of 15% applied. |
| 6. | Stope width is the average SBM mining cut over a 117 cm mining width. |
Mineral Resources from the Measured and Indicated Mineral Resource Mineral Resources from the Measured and Indicated Mineral Resource Classifications were converted into Proven and Probable Mineral Reserves. The Mineral Reserve estimate consists of 30% Proven and 70% Probable Mineral Reserves on a gold content basis.
| V. | Development and Operations |
The Blyvoor Mine utilises conventional mining and Selective Bench Mining (“SBM”) to extract the Carbon Leader Reef and Middelvlei Reef from the PS Shaft Complex. Re-opening or re-equipping the current workings will continue while mining. The orepass system, footwall drives, crosscuts, and main surface shaft (PS Shaft) will access the workings. All stopes and development ends have been or will be refurbished to ensure safe access for men and material.
Men and material will be transported through PS Shaft and PSSV Shaft. Ore will be hoisted to 15 Level via cage hoisting, where the ore is then cross-trammed to PS Shaft and hoisted to surface. The re-establishment and extension of the 15-19 Level incline shaft to 21 Level will assist in reducing the cage-hoisting requirements within the PSSV shaft. Below 21 Level, ore will be transferred from active mining levels via a new orepass system to the newly established mid-shaft loading station at 27.5 Level in the PSSV. Ore will be hoisted from the mid-shaft loading station to 14 Level and then transferred on 15 level to the PS shaft ore loading system to be hoisted to surface.
The underground workings from 10 m above 29 Level at PSSV are flooded and are currently inaccessible. The Blyvoor PS Shaft project consisted of re-opening the PS Shaft Complex and returning the operation to a targeted steady state production of 80 ktpm. Numerous activities have been initiated and/or completed since cessation of the operation, including transfer of the mining right to Blyvoor Gold, award of an Environmental Authorisation, Mineral Resource update, mine planning, operating cost estimates, capital cost estimates and financial modelling. The mine has subsequently successfully been returned to production.
The process plant has been operating at a consistent recovery of 91.5%, and this can be expected to continue as long as the ore mineralogy does not change. The average processing rate for the past 12 months was 15.5 ktpm, and there are indications that higher processing rates can be achieved with operational improvements.
| |
| RESOURCE | RESERVE | VALUE |
Blyvoor Gold Resources (Pty) Ltd
S-K 1300 Technical Report Summary on the Blyvoor Gold Mine, South Africa | 4 |
The evaluator performed an independent mineral asset economic analysis on the Blyvoor Mine and the diluted Indicated and Measured Mineral Resources in the LoM plan, for conversion to Mineral Reserves. The Discounted Cash Flow, or DCF, is based on the production schedule and all costs and capital associated to develop, mine and process the orebody. Relevant taxation and other operating factors, such as recoveries and stay-in-business costs were incorporated into the economic analysis to produce a cash flow over the life cycle of the Mine. The effective date of the economic analysis is 29 February 2024.
Both the ZAR/USD exchange rate and USD commodity prices are in real money terms. The table below illustrates the forecasts for the first three years as well as the long-term forecast used in the financial model. Both the price forecast and the short-term exchange rate forecast are taken as the median of various analyst and bank forecasts, with the long-term prices calculated in-house. The medium and long-term exchange rate forecast was calculated in-house using the inflation adjusted purchasing price parity of the ZAR to USD. The long-term gold price was estimated as the real term average between the two gold price support levels over the past 10 years, i.e. USD1,900/oz. The inflation rate forecasts were sourced from the International Monetary Fund (“IMF”).
Macro-Economic Forecasts and Commodity Prices over the Life of Mine
| Basis | Item | Unit | 2024 | 2025 | 2026 | 2027 | 2028 | LT |
| Calendar Years (Real) | Gold Price | USD/oz | 2,086 | 2,040 | 1,900 | 1,900 | 1,900 | 1,900 |
| Financial Years (Real) | Gold Price | USD/oz | N/A | 2,078 | 2,016 | 1,900 | 1,900 | 1,900 |
| Calendar Years (Real) | Exchange Rate | ZAR/USD | 18.80 | 18.10 | 18.45 | 18.80 | 19.15 | 19.15 |
| Financial Years (Real) | Exchange Rate | ZAR/USD | N/A | 18.68 | 18.16 | 18.51 | 18.86 | 19.15 |
| Calendar Years | US Inflation | % | 2.8% | 2.4% | 2.2% | 2.1% | 2.1% | 2.1% |
| Financial Years | US Inflation | % | N/A | 2.8% | 2.4% | 2.2% | 2.1% | 2.1% |
| Calendar Years | SA Inflation | % | 4.8% | 4.5% | 4.5% | 4.5% | 4.5% | 4.5% |
| Financial Years | SA Inflation | % | N/A | 4.8% | 4.5% | 4.5% | 4.5% | 4.5% |
Source: Median of various Banks and Broker forecasts (Consensus, March 2024); Minxcon; IMF.
Costs reported for the Blyvoor Mine, which consists of mining, plant and other operating costs, as well as government royalty payments are displayed in the table to follow. Other costs in the Adjusted Operating Costs category include the central and technical services, general and administration, human resources, and other services costs. Other costs for the AISC category include the corporate management costs. The costs are displayed per milled tonne as well as per recovered gold ounce. A combination of budget costs and actual costs were considered for the financial analysis. Operating costs are inclusive of a 5% contingency, while capital costs are inclusive of a 15% contingency.
| |
| RESOURCE | RESERVE | VALUE |
Blyvoor Gold Resources (Pty) Ltd
S-K 1300 Technical Report Summary on the Blyvoor Gold Mine, South Africa | 5 |
Project Cost Indicators
| Item | Unit | Blyvoor Gold |
| Net Turnover | USD/Milled tonne | 308 |
| Mine Cost | USD/Milled tonne | 78 |
| Plant Costs | USD/Milled tonne | 24 |
| Other Costs | USD/Milled tonne | 21 |
| Royalties | USD/Milled tonne | 14 |
| Operating Costs | USD/Milled tonne | 137 |
| SIB | USD/Milled tonne | 15 |
| Reclamation | USD/Milled tonne | 0 |
| Other Costs | USD/Milled tonne | 0 |
| All-in Sustaining Costs (AISC) | USD/Milled tonne | 152 |
| Expansion Capital | USD/Milled tonne | 8 |
| Other Cash Costs | USD/Milled tonne | 0 |
| All-in Costs (AIC) | USD/Milled tonne | 161 |
| All-in Cost Margin | % | 48% |
| EBITDA* | USD/Milled tonne | 171 |
| EBITDA Margin | % | 55% |
| Gold Recovered | oz | 4,853,618 |
| Net Turnover | USD/Gold oz | 1,833 |
| Mine Cost | USD/Gold oz | 466 |
| Plant Costs | USD/Gold oz | 141 |
| Other Costs | USD/Gold oz | 126 |
| Royalties | USD/Gold oz | 82 |
| Operating Costs | USD/Gold oz | 815 |
| SIB Capex | USD/Gold oz | 87 |
| Reclamation | USD/Gold oz | 1 |
| Other Costs | USD/Gold oz | 2 |
| All-in Sustaining Costs (AISC) | USD/Gold oz | 905 |
| Expansion Capital | USD/Gold oz | 49 |
| Other Cash Costs | USD/Gold oz | 0 |
| All-in Costs (AIC) | USD/Gold oz | 954 |
| EBITDA* | USD/Gold oz | 1,015 |
Notes:
| 1. | * EBITDA excludes capital expenditure. |
| 2. | Costs Includes Contingencies |
The total capital including the sustaining capital amounts to USD665 million over the mine life. The Mine is in ramp-up phase from 15 ktpm to 40 ktpm in the initial period and 80 ktpm within 7 years. Initial capital has been spent, with additional capital being sustaining and expansion capital.
The capital planned for year 1 (FY25) of USD28.4 million and for year 2 (FY26) of USD44.2 million is not fully offset by free cash flows from the operation in these years and results in a peak funding requirement of USD29 million in month 20 (October 2025).
The production profile and mine development plan shown in this report relies on access to these funds to achieve the stated results. The evaluator has been informed that the funding is intended to be raised during a listing of Blyvoor Gold Capital (Pty) Ltd’s holding company, which is anticipated for August or September 2024.
For the DCF, the grade, gold price and exchange rate have the most significant impact on the sensitivity of the Mine followed by the mining operating costs. The Mine is least sensitive to capital and plant and other operating costs.
The value derived for the income approach only reflects the diluted Indicated and Measured Mineral Resources in the LoM plan, for conversion to Mineral Reserves. The Mineral Reserve is economically viable with a best estimated NPV of USD539 million (USD399 million attributable to Blyvoor Gold Resources (Pty)
| |
| RESOURCE | RESERVE | VALUE |
Blyvoor Gold Resources (Pty) Ltd
S-K 1300 Technical Report Summary on the Blyvoor Gold Mine, South Africa | 6 |
Ltd) at a real discount rate of 11.9%. The IRR of the Project is 96%, however the mine is already in operation with initial capital already spent. The following table shows a summary of the economic analysis.
Blyvoor Mine Economic Analysis Summary – Real Terms
| Item |
Unit |
Blyvoor Mine | Blyvoor Gold
Resources (Pty) Ltd
Attributable |
| NPV @ 0% | USD million | 2,974 | 2,201 |
| NPV @ 2% | USD million | 2,064 | 1,527 |
| NPV @ 4% | USD million | 1,485 | 1,099 |
| NPV @ 5% | USD million | 1,275 | 944 |
| NPV @ 6% | USD million | 1,104 | 817 |
| NPV @ 8% | USD million | 845 | 626 |
| NPV @ 10% | USD million | 664 | 491 |
| NPV @ 11.9% | USD million | 539 | 399 |
| NPV @ 12% | USD million | 533 | 395 |
| NPV @ 14% | USD million | 436 | 323 |
| IRR | % | | 96.2% |
| All-in Cost Margin | % | | 48% |
| Peak Funding Requirement | USD million | | 29 |
| Payback | Months | | 33 |
| Break-even Gold Price | USD/oz. | | 954 |
Legal Aspects and Tenure
Blyvoor Capital are in possession of all necessary permit licences and authorisations for the current operations, the most significant of these being an environmental authorisation, environmental management programme and a water use licence.
Geology and Mineral Resources
The geology and structure of the mine is well understood. The operation is a typical mature Witwatersrand Gold Mine with years of historical data. New sampling data as at 29 February 2024 was provided for facies 3 on the Middelvlei Reef and facies 5 for the Carbon Leader Reef. Therefore, new estimates in 2024 were only produced for these two facies using the same estimation approach applied in 2023. New depletions as of 29 February 2024 were applied to the Carbon Leader and Middelvlei reefs.
There has been no significant change in the Mineral Resource Classification and grade between 2023 and 2024 for both the Carbon Leader and Middelvlei reefs.
Mining
With SBM only mining 25% of the Carbon Leader reef, conventional mining is the main mining method. SBM has been validated as a mining technique, but face availability is required if one needs to get the same advance as conventional mining. The mining process makes sense, mining close to the shaft area, in areas that require little opening up and redevelopment. To ensure that all planned mining areas are available, ongoing reconnaissance has been planned. The existing mining infrastructure must be made accessible before the mine plan can go forward. Activities for opening up have been planned and are currently underway. Until the orepass system feeding ore to the mid-shaft hoisting arrangement is finished, cage hoisting in the PS Sub-vertical Shaft above 27 Level to 15 Level (roughly 548 m) is planned. The mine plan only targets measured and indicated Mineral Resources inferred Mineral Resources do not provide any economic benefit.
Engineering and Infrastructure
| |
| RESOURCE | RESERVE | VALUE |
Blyvoor Gold Resources (Pty) Ltd
S-K 1300 Technical Report Summary on the Blyvoor Gold Mine, South Africa | 7 |
The PS Shaft operation is well-established and equipped. Repairs have been conducted on equipment and infrastructure that had been damaged and/or vandalised since the operation’s closure and this infrastructure has been restored to service. The established equipment and infrastructure includes offices, change houses, lamp room, Eskom and Blyvoor electrical sub-stations, winding plants, main ventilation fans, shafts, pumping infrastructure, as well as a sewage plant.
Refurbishment and re-equipping of the power supply and electrical distribution infrastructure has been completed and recommissioned.
Potable water is sourced from Rand Water. A supply line has been installed and connected to the existing supply line leading onto the Blyvoor Mine lease area.
Service water will mainly be sourced from underground and the estimated available 25 Ml/day of fissure water ingress is deemed sufficient for the planned production rates.
Owing to PSSV Shaft being flooded from 10 m above 29 Level, ore cannot be hoisted from the installed loading station located on 43 Level. Commissioning of the mid-shaft loading station on 27.5 Level has been completed and the completion of an orepass system will be required to facilitate rock hoisting above 27 Level in PSSV Shaft with the rock winder.
Ventilation of the underground workings is a critical part of the mining operation. A review of the initial mining plan has been conducted by a ventilation specialist and it has been deemed that utilisation of only one ventilation fan and no refrigeration will be required during production above 31 Level. When mining at a production rate of 80 ktpm below 31 Level refrigeration will be required together with the utilisation of the second installed main ventilation fan.
Once mining moves further away from the PS Shaft Complex, establishment of ventilation fans at the historic Doornfontein No. 2 Shaft and the Blyvooruitzicht No. 3 Ventilation Shaft will be required.
Dewatering of the underground workings will commence one year prior to mining proceeding below 2 Level. Initial dewatering will be conducted with submersible pumps through PSSV Shaft and PS Shaft. Once the permanent pump stations and associated infrastructure below 31 Level were replaced and recommissioned, this infrastructure and equipment will be utilised to dewater the underground workings. The selected pumping equipment and infrastructure will have sufficient capacity for the required dewatering and sufficient capital has been allowed for the acquisition thereof.
Re-equipping and recommissioning of Incline shafts in the old Blyvooruitzicht section will be required to sustain the targeted production rates. This will include rails, sleepers, winders, ore tipping arrangements and all services required for mining and re-equipping of the old workings. Sufficient capital has been allowed for this purpose.
Processing
The process plant has been operating at an average recovery of 91.5%, and this can be expected to continue as long as the ore mineralogy does not change. The average processing rate for the 12 months ending March 2024 was 16.0 ktpm, and there are indications that higher processing rates can be achieved with operational improvements.
Economic Analysis
The Blyvoor Mine plan including only the diluted Indicated and Measured Mineral Resources in the LoM plan, for conversion to Mineral Reserves is financially feasible. The updated Mineral Reserve can therefore be declared. The DCF value of USD539 million for the Blyvoor Mine (USD399 million attributable to Blyvoor Gold
| |
| RESOURCE | RESERVE | VALUE |
Blyvoor Gold Resources (Pty) Ltd
S-K 1300 Technical Report Summary on the Blyvoor Gold Mine, South Africa | 8 |
Resources (Pty) Ltd) was calculated at a real discount rate of 11.9%. A high IRR of 96% was calculated based on a peak funding requirement of USD29 million, with initial capital already spent.
Blyvoor Mine has an all-in cost margin of 48%, which is high compared to similar mines. All-in sustaining costs for the Blyvoor Mine amount to USD152/milled t, which equates to USD905/oz. All-in costs for the Blyvoor Mine amount to USD161/milled t, which equates to USD954/oz. Funding of USD29 million is required in month 20 (October 2025) as the expansion capital in the first two years is not fully offset by internally generated free cash flow. The payback period was calculated as 33 months.
The Mine is most sensitive to grade, commodity prices and exchange rate. The Mine is least sensitive to capital and other plant and other operating costs.
The Project has a break-even gold price of USD954/oz including capital.
Legal Aspects and Tenure
Blyvoor Capital are in possession of all necessary permit licences and authorisations for the current operations, the most significant of these being a mining right, environmental authorisation, environmental management programme and a water use licence. In light of no material risks for the current operations, an environmental audit undertaken for 2024 noted minor areas for improvement. Submission of the provisional Air Emissions Licence first quarterly report is pending. It is imperative that a contingency or action plan should be put in place to facilitate future compliance and improvement of on-site environmental and sustainability principles as set out in the MPRDA, NEMA and NEMAQA.
Geology and Mineral Resources
As mining progresses, channel width information should be compared to current channel width estimates as the channel width data is spatially not as well spread as the cm.g/t datasets. The channel width data can then be remodelled for more complete channel width modelling. The current model does; however, utilise the cm.g/t data to produce a cm.g/t estimate and report resources at a stope width of 117cm which is typically thicker than the current channel widths estimated. CW data is being collected with the new sampling being conducted in the mining areas and this will be incorporated into the modelling in future.
It is recommended that the facies modelling of the Middelvlei Reef be reviewed with further Mineral Resource updates to refine the estimation for future mine planning.
Reconciliations of mined grades with block model grades should be performed.
Mining
Ongoing reconnaissance should be conducted to assess the availability and condition of planned underground access and workings beyond the fifth year. If the reconnaissance identifies inaccessible areas, it may be necessary to revise the plan accordingly. The reconnaissance must be utilised to revise the capital estimate for shaft refurbishment, dewatering, pump stations, substations, mining equipment, and rail-bound equipment. For the later years of operation, a comprehensive ventilation plan that includes refrigeration should be developed. To determine the ventilation requirements beyond the first five years of mining, simulations of ventilation should be conducted. To optimise extraction and support techniques, ongoing rock engineering investigations and re-modelling are necessary. Considering seismic activities, it is recommended that a risk register and seismic monitoring continue, and plans be implemented.
| |
| RESOURCE | RESERVE | VALUE |
Blyvoor Gold Resources (Pty) Ltd
S-K 1300 Technical Report Summary on the Blyvoor Gold Mine, South Africa | 9 |
Engineering and Infrastructure
Cage hoisting is a difficult and time-consuming process, although it has been estimated that sufficient cage hoisting capacity (22.5 ktpm) exists. Delays in the commissioning a new orepass system feeding ore to the new commissioned 27.5 Level mid-shaft loading station may constitute a risk and fast tracking the establishment is being considered. Proper controls and management of the cage hoisting process will be required during the cage hoisting phase, as congestion on shaft stations can easily cause delays and production constraints.
Investigations need to be conducted to fully understand the requirements for re-equipping the old Blyvooruitzicht section Incline shafts. A ventilation study and simulation need to be conducted to fully understand the ventilation and cooling requirements once mining in the extremities of the project areas as well as when mining proceeds below 31 Level.
Considering the criticality of dewatering the flooded workings, it is recommended that the commencement of the detailed study work regarding the dewatering system and associated infrastructure be expedited. This is required to ensure timeous establishment of the pump system and infrastructure and prevent any delay of mining below 29 Level.
Processing
The plant expansion design study was completed in May 2023 and planned commissioning must be informed by the mining planning. A new TSF must be planned for in 20 years to allow for deposition at that time.
| |
| RESOURCE | RESERVE | VALUE |
Blyvoor Gold Resources (Pty) Ltd
S-K 1300 Technical Report Summary on the Blyvoor Gold Mine, South Africa | 10 |
ITEM 2 - INTRODUCTION
Item 2 (a) - Issuer Receiving the Report; Authors
Minxcon (Pty) Ltd (“Minxcon”) was commissioned by Blyvoor Gold Resources (Pty) Ltd (“Blyvoor Resources” or “the Company”) to compile a Technical Report Summary (“TRS”) Blyvoor Gold Mine (“Blyvoor Mine”, “Blyvoor” or the “Mine”), situated in Gauteng Province, South Africa. The Mine is owned and operated by, and was commissioned by, Blyvoor Gold Capital (Pty) Ltd (“Blyvoor Capital”).
The authors of this TRS are Uwe Engelmann and Daniel van Heerden, each of which is a Qualified Person (“QP”). Mr. Engelmann was responsible for Sections 1-11 and jointly for 20-25 of this TRS, while Mr. van Heerden was responsible for Sections 12-19 and jointly for 20-25 of this TRS.
Item 2 (b) - Terms of Reference and Purpose of the Report
Minxcon was commissioned to prepare the TRS on the Mine in accordance with the United States Securities and Exchange Commission Part 229 Standard Instructions for Filing Forms Regulation S-K subpart 1300 (“S-K 1300”). This TRS follows the guidelines as prescribed by S-K 1300, and only such terms as defined in §229.1300-1305 were utilised. The TRS is structured in accordance with the format prescribed in §229.601(b)(96).
Blyvoor is an operating underground mine with ore processed at an on-site plant. The purpose of this TRS is to present the Mineral Resources and Mineral Reserves of the Mine as of the Company financial year end 29 February 2024. The Mineral Resources and Mineral Reserves are stated at the effective date of 29 February 2024.
The basis for the Mineral Reserves stated in this TRS is a life of mine plan, which constitutes a study with detail and accuracy levels better than the requirements for a pre-feasibility study. The QP has reviewed the life of mine plan and is satisfied that it has demonstrated that, at the time of reporting, the extraction of the Mineral Reserve is economically viable under reasonable investment and market assumptions. The life of mine plan is technically achievable and is the basis of determining the Mineral Reserve.
All monetary figures in this TRS are expressed in United States Dollars (“USD”).
Item 2 (c) - Sources of Information and Data Contained in the Report
The following sources of information were supplied to Minxcon by Blyvoor Gold personnel to complete the scope of work and to compile this Report:-
| ● | Minxcon has accepted information supplied by Blyvoor Gold regarding the permits and licences as valid and complete, as provided by Mr Dave Whittaker. |
| ● | Reliance was made on documentation prepared by Digby Wells Environmental for calculations on environmental liabilities. |
| ● | Tax information, i.e. tax losses and unredeemed capital expenditure was provided by Blyvoor Gold and are regarded as valid. |
| ● | The Rand Refinery agreement was provided by Blyvoor Gold. |
| ● | Blyvoor Gold provided the rehabilitation liabilities as approved by the DMRE. |
Additional information was sourced from those references listed in Item 24 and are duly referenced in the text where appropriate.
Item 2 (d) - Qualified Persons’ Personal Inspection of the Property
The Qualified Person (“QP”, as such term is defined S-K 1300) for this TRS are Mr. U. Engelmann and Mr. D. van Heerden.
| |
| RESOURCE | RESERVE | VALUE |
Blyvoor Gold Resources (Pty) Ltd
S-K 1300 Technical Report Summary on the Blyvoor Gold Mine, South Africa | 11 |
Mr. van Heerden and Mr. Engelmann undertook an underground site visit on 11 March 2021 accompanied by various Blyvoor Gold staff members to inspect the mining start up and geology on 15 Level. On 10 February 2023, Mr. Eben Jansen (Processing Engineer, Minxcon) and Mr. Mardus Jansen van Vuuren (Plant Superintendent, Minxcon) undertook a visit to the site to investigate the plant with the specific task to investigate the milling capacity and make recommendations for improvement. They were accompanied by Blyvoor Plant Manager. Mr van Heerden conducted a later site visit on 19 May 2023 accompanied by various Blyvoor Gold staff members to inspect the recent mining activities on 15 Level and 27 Level.
| |
| RESOURCE | RESERVE | VALUE |
Blyvoor Gold Resources (Pty) Ltd
S-K 1300 Technical Report Summary on the Blyvoor Gold Mine, South Africa | 12 |
ITEM 3 - PROPERTY DESCRIPTION AND LOCATION
Item 3 (a) - Location of the Property
As illustrated in Figure 1, the Mine is located some 14 km by road southwest of the town of Carletonville, in the south-western extremity of the Gauteng Province, South Africa, and within the Oberholzer Magisterial District. The town of Fochville lies 30 km due southeast and Westonaria 42 km due northeast. To the northeast, Johannesburg can be accessed over a well-established road network of 80 km. The Mine is centred on the co-ordinates (WGS84 system) 26°25’31“S, 27°20’42“E.
Figure 1: Location of Blyvoor Mine
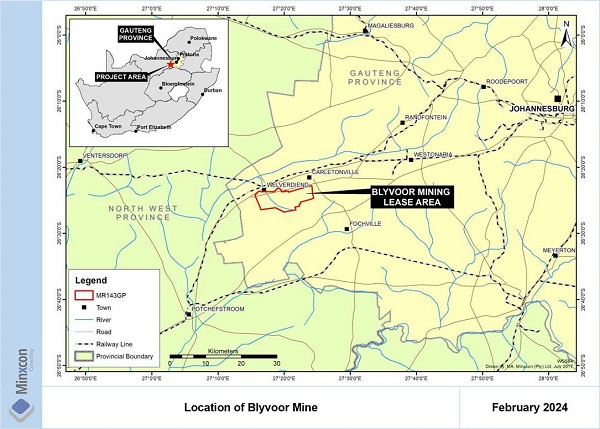
Figure 2 illustrates the Blyvoor assets in relation to other assets in the area.
| |
| RESOURCE | RESERVE | VALUE |
Blyvoor Gold Resources (Pty) Ltd
S-K 1300 Technical Report Summary on the Blyvoor Gold Mine, South Africa | 13 |
Figure 2: Location of Blyvoor Gold Assets in Relation to the Orphans (Including Harmony Assets)
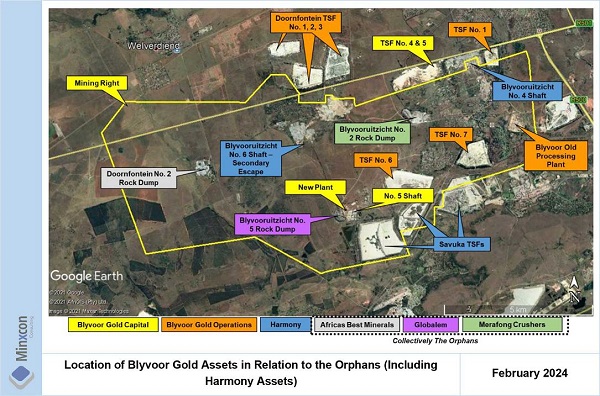
The yellow areas in the Figure 2 indicate the Blyvoor Gold Capital (Pty) Ltd assets, who mines the mining right area (project area). The orange areas indicate Blyvoor Operations (Pty) Ltd assets, who intend to process tailings. The blue areas indicate the Anglo Gold Ashanti Limited (“AGA”) assets that were purchased from the provisional liquidator and which were subsequently sold to Harmony Gold Mining Company Limited (“Harmony”) in 2020. Harmony is currently pumping in order to protect the integrity of the underground pillar between the Blyvoor PSSV Shaft underground workings and their neighbouring Savuka Gold Mine.
Item 3 (b) - Area of the Property
Blyvoor Gold holds the Peter Skeat Shaft (“PS Shaft”, previously known as the No. 5 Shaft) and the mining right covering the underground gold mining operation of the Blyvooruitzicht Gold Mining Company Ltd (in provisional liquidation) (“BGMC”). The mining right covers an area of 6,708.4273 hectares. Gold mineralisation is accessed via the PS Shaft, which recommenced operations in quarter 2 2019 after operation shutdown from 2013.
The Mine is in a prolific gold mining area within the Carletonville Goldfield. The region hosts several well-established gold mines and is well serviced by all amenities. The Mine is operated by an owners team. Gold mineralisation hosted in the Middelvlei and Carbon Leader reefs is extracted via conventional mining methods, however the Selective Blast Mining method (“SBM”) is applied to those carbon leader stopes / panels that lend themselves to this method. Current mining rates do not exceed 30 ktpm, but it is planned to ramp up production to 80 ktpm. Extracted material is processed at a hard rock gold extraction carbon-in-pulp (“CIP”) plant situated adjacent to PS Shaft. The plant has a nameplate processing capacity of 40 ktpm but is currently achieving some 15 ktpm. The underground workings from 10 m above 29 Level at Peter Skeat Sub-vertical Shaft (“PSSV Shaft”, previously known as the No. 5A Sub-vertical Shaft) are flooded and are currently inaccessible.
| |
| RESOURCE | RESERVE | VALUE |
Blyvoor Gold Resources (Pty) Ltd
S-K 1300 Technical Report Summary on the Blyvoor Gold Mine, South Africa | 14 |
Item 3 (c) - Mineral Deposit Tenure
Mining rights are issued by the South African Department of Mineral Resources and Energy (“DMRE”, previously Department of Mineral Resources) in accordance with the Mineral and Petroleum Resources Development Act, No 28 of 2002 (“MPRDA”).
The Blyvoor Mine is encompassed under a converted mining right GP 30/5/1/2/2/143 MR (“MR143GP”) issued in the name of Blyvoor Gold Capital (Pty) Ltd. Table 1 provides a summary of the details of MR143GP.
Table 1: Summary of Mining Right for Blyvoor Mine
Right Number | Holding Company | Farm | Area | Commodity | Commencement Date | Expiry Date |
| ha |
| MR143GP | Blyvoor Gold
Capital (Pty) Ltd | Various portions of the farms Blyvooruitzicht 116 IQ, Doornfontein 118 IQ, and Varkenslaagte 119 IQ | 6,708.4273 | Gold | 17 Feb 2017 | 16 Feb 2047 |
The QPs have viewed a copy of MR143GP and are satisfied with its validity and authenticity. The QPs have not identified any threat to the mining right with continued annual obligations to tenement security and conformance to government notices and directives.
An amendment application in terms of Section 102 of the MPRDA has been submitted to the DMRE on 30 March 2023 to include additional commodities (silver, nickel, copper, platinum group metals), and to include the mining of tailings material from 2028.
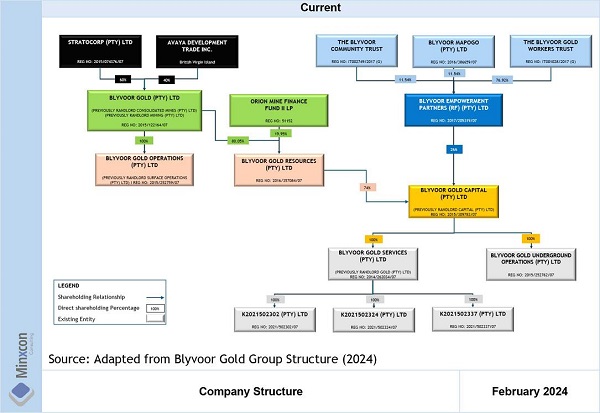
The mineral right MR143GP is held by Blyvoor Capital, a registered subsidiary (74%) of Blyvoor Resources. The remaining 26% ownership of Blyvoor Capital is held by Blyvoor Empowerment Partners (RF) (Pty) Ltd, which represents Black persons as defined in terms of the Black Economic Empowerment (“BEE”) Act and as set out in the Mining Charter. The MR143GP was issued prior to gazetting of the 2018 Mining Charter which requires mines to hold a 30% BEE representation, thus the 26% BEE requirement of the previous Charter remains in force.
The current and post-transaction company structure is illustrated in Figure 3.
| |
| RESOURCE | RESERVE | VALUE |
Blyvoor Gold Resources (Pty) Ltd
S-K 1300 Technical Report Summary on the Blyvoor Gold Mine, South Africa | 15 |
Figure 3: Company Structure
Several servitudes and usufructs for services are required for the operation. These services include water, electricity, and pumping, amongst others. Servitudes and usufructs were surveyed and registered for all operational areas of the Mine. The usufructs have a validity period of 99 years under ownership to Blyvoor Gold.
Item 3 (d) - Royalties and Payments
The current Mineral and Petroleum Resources Royalty Act came into effect on 1 March 2010. The law requires all companies extracting minerals in South Africa to pay royalties at a rate of between 0.5% and 7% based on gross sales. Companies are taxed on either the refined or unrefined formula:-
| ● | Refined mineral formula = 0.5 + [EBIT/Gross sales x 12.5] x 100 |
| ● | Unrefined mineral formula = 0.5 + [EBIT/Gross sales x 9] x 100 |
The refined mineral formula has been used for Blyvoor Mine as the gold is refined to at least 99.5% purity at Rand Refinery, and the Company sells the refined product at spot prices.
Blyvoor also has a streaming arrangement in place with Nomad Royalty Company Ltd. whereby gold is to be sold to Nomad Royalty Company Ltd. (the purchaser) at a fixed price of USD572/oz for gold volumes amounting to the following:-
| ● | For the first 300,000 oz delivered to the purchaser:- |
| |
| RESOURCE | RESERVE | VALUE |
Blyvoor Gold Resources (Pty) Ltd
S-K 1300 Technical Report Summary on the Blyvoor Gold Mine, South Africa | 16 |
| ○ | 10% of production to be delivered to the purchaser, capped at 16,000 oz delivered/ 160,000 oz produced per annum. |
| ○ | Thereafter, 5% of the production in excess of 160,000 oz per annum for that year. |
| ● | After the purchaser has received 300,000 oz, with production capped at 10,320,000 oz:- |
| ○ | 0.5% of production to be delivered to the purchaser, capped at 500 oz delivered or 100,000 oz produced per calendar year. |
| ○ | Thereafter, 0% of the remaining production for that year (i.e. no charge). |
Item 3 (e) - Environmental Liabilities
In terms of Regulation 54(2) of the MPRDA, Blyvoor Gold is required to make financial provision for the interim and final rehabilitation activities on the site. The provision is required to be reviewed annually for adequacy and amended to compensate for new activities and/or inflation.
The rehabilitation liability provision was updated by Digby Wells in May 2023. These costs have been reviewed and escalated to 2024 terms by Minxcon. As per discussion with Blyvoor management, the DMRE has accepted the escalated costs, but has not requested an updated payment plan. The apportioned of the escalated liabilities to the three entities/groupings are set out in Table 2.
Table 2: Assessed Rehabilitation Liabilities attached to MR143GP as of February 2024 with Amended Splits
Description | DMRE Financial Provision Assessment | Percentage of Liability |
| ZARm |
| Blyvoor Gold Capital (Pty) Ltd | 125.3 | 25% |
| Blyvoor Gold Operations (Pty) Ltd | 213.5 | 43% |
| Orphans | 153.7 | 32% |
| Total | 492.5 | 100.0% |
In October 2020 Blyvoor Gold Capital (Pty) Ltd applied to the DMRE to amend the closure liability funding by consolidating all existing guarantees and funding arrangements into a single financial guarantee through Guardrisk. The existing guarantees of ZAR39.2 million, guarantees provided in 2020 of ZAR35.2 million and the Trust Fund balance of ZAR55.8 million would all be consolidated into a new guarantee of ZAR130.2 million, with the remaining ZAR236.1 million to be funded through guarantees over a period of eight years. This arrangement was accepted by the DMRE in a letter dated 26 October 2020, and a Guardrisk guarantee in the amount of ZAR130.2 million was provided to the DMRE on 22 October 2020.
A payment schedule was provided to Minxcon detailing a period of 18 years to fully fund the guarantees of ZAR366.3 million. The available funds transferred to Guardrisk are sufficient to fully fund premiums to Guardrisk for four years. The payment schedule was apportioned between Blyvoor Gold Capital (Pty) Ltd and Blyvoor Gold Operations (Pty) Ltd. The payment schedule has been updated for the escalated ZAR492.5 million.
Blyvoor Gold, through the granting of the EA, has commenced the process of formally reverting the accountability of the Orphans liability to the new owners of the assets through Section 102 applications. In addition, the liability associated with Blyvoor Gold Operations (Pty) Ltd is intended to be separated through a Section 102 Amendment of the Mining Right.
Once these developments are concluded, Blyvoor Gold Capital (Pty) Ltd will have a total liability of ZAR125.2 million). In the unlikely event that the Orphans liability cannot be passed on to the new owners of the assets and Blyvoor Gold Capital (Pty) Ltd and Blyvoor Gold Operations (Pty) Ltd carry the entire Orphans liability, then the total liability will remain at ZAR492.5 million. The payment plan already in place, which Blyvoor Gold Capital (Pty) Ltd and Blyvoor Gold Operations (Pty) Ltd are currently funding, already provides for a ZAR366 million liability, with the payment plan updated for the higher ZAR492.5 million. Any success in
| |
| RESOURCE | RESERVE | VALUE |
Blyvoor Gold Resources (Pty) Ltd
S-K 1300 Technical Report Summary on the Blyvoor Gold Mine, South Africa | 17 |
reducing the overall liability through the allocation of liabilities to the owners of the Orphans will result in a reduction of cost.
Item 3 (f) - Permits to Conduct Work
Further permits or plans relating to the planned operations are described in the sections to follow that are required to be in place by the EA ((DMR Ref No. GP30/5/1/2/3/2/1 (143) EM) noted in condition 1, 2, 11, and 19.
| I. | Environmental Authorisation |
An Environmental Authorisation (“EA”) as part of the MR143GP was granted on 19 February 2020 by the DMRE to Blyvoor Gold for the current operations in terms of the National Environmental Management Act, No. 107 of 1998 (“NEMA”). Environmental Impact Assessment (“EIA”) and Environmental Management Programme (“EMPr”) reports support this authorisation. Annual audits are required to be undertaken annually by external environmental auditors against the approved EA and EMPr and submitted to the DMRE.
A water use licence (“WUL”) no. 10/C23E/GJACEFGI/14399 in terms of the National Water Act, No. 36 of 1998 (“NWA”) was issued to Blyvoor Capital for the Mine on 14 May 2024 and is valid for until 14 May 2044. This supersedes the previously issued WUL no. 08/C23E/AEFGJ/1000 issued 19 July 2011 for and valid until 19 July 2021. The objective of the new WUL was to be as close as possible to the previous licence with regards to operations, extraction, and deposition. Wastewater treatment plants for the Blyvoor Village was removed from the new application as they are not owned by Blyvoor Gold. Also removed from the application were Blyvoor TSF No. 1, emergency return water dam and PS Shaft Rock Dump. It should be noted that when operations were ceased in 2013, AGA approached the courts to compel the Department of Water and Sanitation (“DWS”) to issue the directive allowing AGA to pump water from underground in order to protect their down-dip operations from the threat of being flooded unexpectedly. Following the sale of AGA’s assets to Harmony, the latter through their subsidiary Covalent Water Company (“CWC”), are currently pumping water from Blyvooruitzicht No. 4 Shaft and Blyvooruitzicht No. 6 Shaft under a directive from the Department of Water and Sanitation.
Operations are continuing normally, and the Mine continues to attend the quarterly DWS forum stakeholder meeting for the Mooi River under the Wonderfontein Catchment Area. DWS continues to conduct routine inspections of the mine, however the subsequent inspection report from the last inspection, dated 28 September 2023 has not been issued.
Blyvoor Gold continues to work closely with Harmony regarding water issues.
| III. | Additional Environmental Permits |
A waste management licence in terms of the National Environmental Management: Waste Act, No. 59 of 2008 forms part of the EA which was granted on 19 February 2020.
Blvoor Capital has a valid provisional Atmospheric Emissions Licence (“PAEL”), reference number (PAEL/GP/WR-BGC/04/09/2023-6545-VAR) issued 10 November 2023 in terms of the National Environmental Management: Air Quality Act, No. 39 of 2004 (“NEMAQA”) issued by Department of Environment, Forestry and Fisheries (DFFE) for the entire mining right area. This PAEL will allow for 12 months of monitoring from the date of commissioning of the listed activities, during which time emission measurements are required to be made and submitted to the authorities. Subject to these measurements being within legal limits and meeting all PAEL conditions for six consecutive months, an Atmospheric Emissions Licence (“AEL”) valid for five years will be issued. It should be noted that condition 8.2.1 of the PAEL stipulates submission of
| |
| RESOURCE | RESERVE | VALUE |
Blyvoor Gold Resources (Pty) Ltd
S-K 1300 Technical Report Summary on the Blyvoor Gold Mine, South Africa | 18 |
quarterly reports (“three months after commencement of the listed activities”). The first quarterly report submission is pending and condition 10.1. further stipulates that “failure to comply with any of the licence and relevant statutory conditions and/or requirements is an offence, and the licence holder, if convicted, will be subjected to those penalties as set out in section 52 of the AQA.”
A valid Certificate of Registration (“COR”) issued 15 January 2024 to Blyvoor Capital by the National Nuclear Regulator (“NNR”) in terms of the National Nuclear Regulatory Act, 1999, relating to the tailings project is in place and applicant should ensure adherence to the conditions of authorisation of Part 1 and specified NNR requirements in Part 2.The QPs are not aware of any further permits in addition to those described above, which are required for the operations.
The QPs are not aware of any past material violations or fines.
Blvoor Capital to develop an auditable maintenance plan to ensure that all critical environmental equipment is maintained as required and a discussion on the implementation and compliance with the maintenance plan be included in the annual audit reports.
Additionally, an alien management programme to control alien invasive plant species and must entail the identification of areas where such infestation occurs and the extent.
Item 3 (g) - Other Significant Factors and Risks
From the evidence available, it is the opinion of the QPs that operations continue as a valid EA and WUL is in place. It is noted that as the Project currently stands, Blyvoor Ops will not hold all the authorisations it requires to independently conduct the Project. Notwithstanding, Blyvoor Ops can still be held liable for arising environmental impacts. Condition No. 4.8 of the EA (DMR Ref No. GP30/5/1/2/3/2/1 (143) EM) states, “Non-compliance with any condition of this EA or EMPr may result in the issuing of a directive in terms of section 28 and or a compliance notice in terms of section 31L of the NEMA.” Regulation 34 of the Environmental Impact Assessment (“EIA”) Regulations (GNR 982 of 4 December 2014 as amended) provides as follows “Auditing of compliance with environmental authorisation, environmental management programme and closure plan.” The QPs recommends that a contingency or action plan be put in place to facilitate future compliance and improvement of on-site environmental management.
As noted previously, Blyvoor Ops will initially rely on the existing Blyvoor Capital rights and permits with respect to the Mining Right, the EA and water use licence under a duly signed agreement for this purpose.
The QPs are not aware of any past material violations or fines. There is reasonable basis to believe that all governmental requirements for the Project have been obtained or can be obtained. The Project owners and operators must adhere to environmental and sustainability principles as set out in the MPRDA. The QPs are not aware of any factors or risks that may affect access, title or right or the ability to perform work on the property.
| |
| RESOURCE | RESERVE | VALUE |
Blyvoor Gold Resources (Pty) Ltd
S-K 1300 Technical Report Summary on the Blyvoor Gold Mine, South Africa | 19 |
ITEM 4 - ACCESSIBILITY, CLIMATE, LOCAL RESOURCES, INFRASTRUCTURE AND PHYSIOGRAPHY
Item 4 (a) - Topography, Elevation and Vegetation
The surface topography of the mining lease area is characterised by undulating hills and forms part of the northern slopes of the Gatsrand Ridge. Elevations vary from some 1,400 m to 1,680 m above mean sea level. One distinct watercourse carries seasonal rainwater from the higher catchment areas across the eastern side of the property to the Wonderfonteinspruit.
According to Golder Associates (2016), the area is located in the Gauteng Shale Mountain Bushveld and Carletonville Dolomite Grassland vegetation types. The vegetation is characterised by short (3–6 m), semi-open thicket, dominated by a variety of woody species. The understory is dominated by a variety of grasses. Some of the ridges form plateaus that support scrubby grassland. Carletonville Dolomite Grassland occurs on undulating plains dissected by rocky chert ridges. The grassland is sour in nature due to severely frosty winters, combined with regular burning. Trees and shrubs typically occur on rocky outcrops and protected areas. Typical grassland is restricted to the exposed sites in the irregular, undulating landscape. This veld type is not suited for crop production due to the shallow and rocky nature of the soils. Grazing of livestock is limited due to the dominance of sour grass species, which results in a low nutrient status of the fodder during winter. This area is typical of the transitional-type grassland between the high inland plateau and the bushveld of the lower inland plateau, with the resultant low incidence of tree species.
It is noted that the mining site has largely been disturbed by mining activities over the decades. Several exotic and invasive species occur on the mine property usually associated with areas such as the TSFs and developed mining areas.
Item 4 (b) - Access to the Property
The Blyvoor mining right area is directly accessible through the R501 main tarred road that connects Carletonville and Potchefstroom. The R501 runs along the northern boundary of the mining property and traverses the lease area to the west. The R501 regional road leading from the N12 national road past the town of Carletonville and in a western direction on to Potchefstroom. From the R501, the Mine is accessed through a direct tarred road onto the lease area that branches off the R501. This road is in a relatively good state of repair and no work or design will be required on this road. Numerous all-weather gravel roads provide access to various sites on the Mine.
Oberholzer is the closest railway station, located approximately 12 km northeast of PS Shaft and just north of Carletonville, and is situated on the Johannesburg-Klerksdorp railway line. The O.R. Tambo and Lanseria International Airports in the Johannesburg area support high volumes of daily domestic and international flights. The Carletonville Aerodrome is located some 5 km north of PS Shaft.
Item 4 (c) - Climate and Length of Operating Season
The climate in Carletonville is warm and temperate and classified as Cwb by Köppen and Geiger (climate-data.org). Cwb is characterised by a subtropical highland climate or temperate oceanic climate with dry winters, where the ‘C’ refers to mild temperature, the ‘w’ refers to dry winter and the ‘b’ refers to warm summers. Temperatures are warm to mild with an average annual temperature of 15.9°C in Carletonville (climate-data.org). The dominant wind direction in the vicinity of Blyvoor is northwest to northeast. There are no major climatic conditions that will hinder mining activities. Operations can continue year-round.
The Blyvoor Mine is located in the Highveld climatic zone, which receives average annual precipitation of about 900 mm on its eastern border to about 650 mm in the west. Rainfall occurs mainly in the summer
| |
| RESOURCE | RESERVE | VALUE |
Blyvoor Gold Resources (Pty) Ltd
S-K 1300 Technical Report Summary on the Blyvoor Gold Mine, South Africa | 20 |
months from October to March in the form of showers and thundershowers. Maximum rainfall occurs in January, and winters are typically dry. The average annual rainfall at Carletonville is 660 mm (climate-data.org). Several distinct watercourses carry seasonal rainwater from the higher catchment areas across the property to the Wonderfonteinspruit (Golder Associates, 2016).
Item 4 (d) - Infrastructure
| I. | Regional Infrastructure |
The local Carletonville region is a well-established mining area. Skilled and semi-skilled labour are readily available, along with all service requirements. The nearby towns of Carletonville and Fochville provide a full range of urban amenities, including medical and educational facilities, financial, retail, and commercial services. Telephone and mobile phone services are reliable, as are the high-speed internet facilities.
Power supply in the general area is well-established. The Mine was previously supplied with power through two independent 132 kV overhead lines. These lines remain live and feed directly from the Carmel and Elandsrand sub-stations. Sufficient power supply capacity is available in the region and Blyvoor has secured a 40 MVA power supply capacity allocation from Eskom. Owing to the removal of the sub-station by Eskom when the Mine was liquidated, the Eskom consumer sub-station at PS Shaft required re-equipping and re-commissioning. Blyvoor Gold has completed this re-equipping and commissioning of the PS Shaft substation. Power supply infrastructure and capacity has been re-established to its pre-liquidation state and is thus deemed sufficient for the planned LoM production profile.
Potable water is sourced from the Rand Water Board Utility through the Merafong Municipality supply infrastructure. Installation of potable water supply lines to the PS Shaft surface infrastructure were completed. Servitudes for the pipelines were submitted, approved, and registered.
Water in underground workings in the West Rand, and particularly the Carletonville area, is well reported. The Covalent Water Company (Pty) Ltd (“CWC”), have taken over the pumping of water to surface from the existing Blyvooruitzicht No. 4 Shaft and Blyvooruitzicht No. 6 Shaft. PSSV Shaft has been allowed to flood to just above 29 Level where the water level is maintained. CWC will continue to pump ±20 Ml/day from the Blyvooruitzicht No. 4 Shaft and Blyvooruitzicht No. 6 Shaft.
An estimated 5 Ml bypassing the CWC pumps is being pumped from the basin by the neighbouring Savuka Gold Mine. The production water requirements at Blyvoor PS Shaft, is 1.5 Ml/day at present and will ramp up to 8 Ml/day by month 102. Service water requirements will further increase to a maximum of 6 Ml/day by month 100 and remain at this level whilst producing the planned 80 ktpm of ore. The existing fissure water ingress into PS Shaft as well as water from the dewatering activities below 27 Level, once dewatering has commenced, will be captured into and circulate in the mines’ water reticulation system. Considering the ±20 Ml/day pumped by CWC and the 5 Ml/day pumped by the neighbouring Savuka Gold Mine, the total groundwater ingress into the Blyvoor mining area amounts to 25 Ml/day. As most of the service water will be recirculated underground, sufficient ingress groundwater will be available to sustain the maximum planned production rate.
The operation is located in close proximity of the town of Carletonville. The town and several old mining villages surrounding the operation provides accommodation opportunities for employees.
Most of the surface infrastructure of PS Shaft, except for the electrical supply infrastructure and surface winder electrical systems, was in a fair to good condition prior to the commencement of the Blyvoor Gold
| |
| RESOURCE | RESERVE | VALUE |
Blyvoor Gold Resources (Pty) Ltd
S-K 1300 Technical Report Summary on the Blyvoor Gold Mine, South Africa | 21 |
reinstatement project. Areas such as offices, change houses, workshops, stores, lamp room, winder house, and shaft headgear required minor repairs, maintenance, and replacement of all electrical (copper) cabling. This has been completed and the surface infrastructure is now fully operational except for the refurbishment of the second surface fan.
A complete electrical refurbishment of all the cabling, infrastructure and equipment was required for the Blyvoor Gold reinstatement project. This included, but was not limited to, the two winders, one surface fan and surface buildings including offices, change houses, medical stabilisation facility, time and attendance facility and lamp room, amongst others. This has all been completed during the execution of the PS Shaft reinstatement project.
PS Shaft and PSSV Shaft has been accessed down to 27 Level. PS Shaft has been fully repaired and recommissioned. PSSV Shaft still requires some repair work to fully restore the shaft to operation. The two Man winders in PSSV Shaft were recommissioned. Both Man winders (East and West) were relicensed for use and the relicensing of the rock winder is in progress. This completed commissioning and relicensing of the man winders allow for production activities and for necessary repairs and maintenance to take place in the operating portion of this shaft and enables one to complete the recommissioning of the PSSV Shaft rock winder.
The No. 1A Sub-vertical Shaft was operational down to 19 Level at the time that operations ceased in 2013. Blyvoor Gold requires this shaft as an emergency secondary escape route. The shaft is now capable of being used down to 23 Level with the use of a reinstated single drum winder equipped with a capsule to be utilised for the transport of persons in an emergency.
It is planned to refurbish the No.1a sub shaft between 15 Level and 23 Level to include for the transport of men and material between these two levels once completed this will also replace the capsule arrangement currently serving as part of the emergency secondary escape route.
No. 6 Shaft is currently operated and maintained down to 9 Level by CWC. This is to enable CWC to conduct the necessary dewatering that takes place a No. 6 Shaft as well as the associated maintenance of the shaft to 9 Level. Blyvoor utilises No. 6 Shaft down to 15 Level as a secondary escape route to surface in the event of an emergency and the PS Shaft is out of commission. Blyvoor plans to refurbish 1 compartment in the No.6 Shaft between 9 Level and 15 Level to ensure that ongoing maintenance and use as a second escape route from 15 Level to surface is ensured into the future..
| |
| RESOURCE | RESERVE | VALUE |
Blyvoor Gold Resources (Pty) Ltd
S-K 1300 Technical Report Summary on the Blyvoor Gold Mine, South Africa | 22 |
ITEM 5 - HISTORY
Item 5 (a) - Prior Ownership and Ownership Changes
Table 3 provides an overview of the history of the Blyvoor Mine.
Table 3: Historical Development Summary of the Mine
| Year | Event |
| 1932 | First geophysical survey. |
| 1937 | BGMC and Blyvooruitzicht Gold Mine are founded, the first to mine gold of the West Wits Line. Current MR143GP lease area was divided into Blyvooruitzicht Gold Mine in the east owned by Rand Mines and Doornfontein Gold Mine in the west, owned by Goldfields South Africa. |
| 1942 | Production started at Blyvooruitzicht Gold Mine. |
| 1947 | Doornfontein Gold Mining Company begins sinking the Annan Shaft. |
| 1948 | Work begins sinking No. 1 Shaft (now Blyvooruitzicht No. 6 Shaft). All mining is on the Carbon Leader Reef. |
| 1950 | Blyvooruitzicht declared the most profitable mine in the country. |
| 1951 | Blyvooruitzicht produces the greatest amount of gold globally. |
| 1953 | Yields are over 20 g/t. |
| 1956 | Doornfontein begins producing uranium, continuing through to 1965. |
| 1957-1961 | Doornfontein No. 1 Shaft sunk. |
| 1960-1964 | Doornfontein No. 2 Shaft sunk. |
| 1965 | Doornfontein No. 2 Shaft commissioned. |
| 1966-1969 | Doornfontein No. 2 Sub-vertical Shaft sunk. |
| 1971 | Barlow Rand Ltd purchased Rand Mines. 37.6 t of gold produced at Blyvooruitzicht Gold Mine. |
| 1960-1970s | Blyvoor Village boast having highest earning per capita in the world. |
| 1979 | Mining of Middelvlei Reef begins. Average grades are less than half the Carbon Leader. |
| 1980 | Doornfontein extends its lease to the southeast and begins sinking No. 3 Shaft (now PS Shaft). |
| 1984-1987 | PSSV Shaft sunk. |
| 1988 | PSSV Shaft commissioned. Development starts. |
| 1991 | PS Shaft stoping operations begin and blending of surface waste with ore. |
| 1992 | No. 2 Shaft and No. 2 Sub-vertical Shafts are closed. Contractors doing mining. |
| 1995 | Underground mining averages 50 ktpm at a grade of 5.3 g/t. |
| 1996 | Doornfontein Gold Mine officially merged with Blyvooruitzicht Gold Mine. |
| 1996 | Tribute area purchased from AGA. |
| 1997 | Purchase of Blyvooruitzicht Gold Mine by DRDGold Ltd (“DRD”). |
| 1996-2012 | Doornfontein mined at <40 ktpm at 5.3 g/t recovered for the next 17 years. Total <8 Mt. |
| 1937-2005 | Blyvooruitzicht total historical production = 1,160 t gold. |
| 2011 | Purchase of Blyvooruitzicht Gold Mine by Village Main Reef Limited (“Village Main Reef”). |
| 2013 | Village Main Reef placed into business rescue and BGMC into liquidation. |
| 2014 | Goldrich purchases and partially strips old plant. |
| 2014 | Blyvoor Gold Capital (Pty) Ltd purchases Blyvooruitzicht metallurgical plant. |
| 2015 | Blyvoor Gold Operations (Pty) Ltd purchases the six TSFs. |
| 2016 | Blyvoor Gold Capital (Pty) Ltd purchases PS Shaft Complex and the mining right. |
Item 5 (b) - Historical Exploration and Development
An overview of historical exploration and development is presented in Table 3, with exploration further details presented in Item 7. All exploration is deemed historical.
By the end of 1983, after 50 years of operation, Blyvooruitzicht Gold Mine had milled over 60 Mt of ore, with an average 50-year grade of over 35 g/t and a recovered grade of over 17 g/t. By 2002, the Mine (excluding Doornfontein pre-1996) had mined over 100 Mt of ore at an average grade of 11.3 g/t. In 2005, Blyvooruitzicht’s total historical gold production was in excess of 1,160 t of gold (Whittaker, 2016). For the period 1942 to present, 38.2 Moz of gold were recovered. An additional 19.5 Moz was recovered from Doornfontein Gold Mine before the merger with BGMC.
| |
| RESOURCE | RESERVE | VALUE |
Blyvoor Gold Resources (Pty) Ltd
S-K 1300 Technical Report Summary on the Blyvoor Gold Mine, South Africa | 23 |
ITEM 6 - GEOLOGICAL SETTING, MINERALISATION AND DEPOSIT
Item 6 (a) - Regional Geology
Blyvoor lies within the late Archaean (2.7-2.8 Ga) Witwatersrand Basin. This basin comprises up to 7,000 m thick interbedded sequence of argillaceous and arenaceous sedimentary rocks mainly dipping at shallow angles towards the centre of the basin and extend laterally for some 350 km northeast-southwest and 120 km northwest-southeast on the Kaapvaal Craton. The upper portion of the basin-fill (Central Rand Group), which contains the sedimentary reefs or mineralised zones, outcrops at its northern extent near Johannesburg. Further west, south and east the basin is overlain by a combination of up to 4,000 m of younger Archaean, Proterozoic and Mesozoic volcanic and sedimentary rocks.
The basin units were folded along a northeast to southwest axis into an asymmetrical synclinorium. The sediments consist mainly of quartzites and shales and less prevalent, but generally economically important, gold-bearing conglomeratic zones occur on regional unconformities. These are commonly referred to as “reefs” or placers. The reefs occur in goldfields that are geographically separated. These are namely the Welkom, Klerksdorp, Carletonville, West Rand, Central Rand, East Rand, South Rand, and Evander Goldfields.
The location of Blyvoor in relation to the Witwatersrand Basin is illustrated in Figure 4. The regional goldfields are also depicted in the image.
Item 6 (b) - Local and Property Geology
Locally, Blyvoor falls within the Carletonville Goldfield, or Far West Wits Line, that, in addition to gold, produced uranium and pyrite (for sulphuric acid production) as by-products. The goldfield is stratigraphically subdivided into the Blyvooruitzicht, Main, Randfontein, Luipaardsvlei, Krugersdorp, Booysens, Kimberly and Elsburg Formations (SACS, 2006). Per Robb and Robb (1998), each formation is characterised by a regionally persistent basal unconformity-bound conglomerate and overlain by quartzites, grits and pebble bands, while argillaceous quartzites and shales are confined to the Booysens and Robinson Formations.
As described by McCarthy (2006), at the base of the Central Rand Group, the Blyvooruitzicht Formation quartzites and sporadic conglomerates occur and is disconformably overlain by the Main Formation. The base of the Main Formation in the Carletonville Goldfield is defined by the Carbon Leader Reef. The Carbon Leader is overlain by a siliceous quartzite of the Main Formation up to 3.5 m thick. Quartzites with intercalated conglomerates of the Randfontein and Luipaardsvlei Formations overlie the Middelvlei Reef. The Krugersdorp Formation quartzites grade upwards into the upward-coarsening Booysens Formation shale. The thin conglomerate of the sporadically developed Kleinfontein Reef forms the base of the quartzitic-conglomeritic Kimberley Formation. In the western sector, the Channel Shale is locally present. The Libanon Reef occurs on a marked disconformity within the Kimberley Formation. Quartzites of the following Elsburg Formation coarsen upwards. Several conglomerate horizons are developed in the Mondeor Formation.
| |
| RESOURCE | RESERVE | VALUE |
Blyvoor Gold Resources (Pty) Ltd
S-K 1300 Technical Report Summary on the Blyvoor Gold Mine, South Africa | 24 |
Figure 4: Location of Blyvoor in Relation to the Goldfields of the Witwatersrand Basin
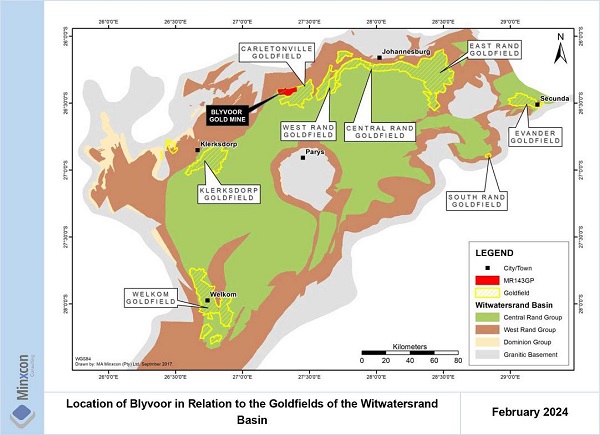
The Central Rand Group is unconformably overlain by the basal volcanic rocks of the Ventersdorp Supergroup, the latter interfingering with sediments of the Venterspost Conglomerate Formation that contains the VCR. In the upper Central Rand Group and Venterspost Formation, sediment deposition was controlled by fault-related uplift to the east, with sediments derived from the north in the eastern section (Robb and Robb, 1998).
A schematic illustration of the stratigraphy across the Carletonville Goldfield as it occurs in the Blyvoor area is provided in Figure 5.
Numerous economically viable conglomerate horizons occur in this goldfield within the Central Rand Group, which in turn is unconformably overlain by the Venterspost Conglomerate Formation (colloquially called the Ventersdorp Contact Reef or “VCR”) at the base of the Ventersdorp Supergroup. Three principal economic horizons are exploited, namely the Carbon Leader and Middelvlei Reef and the VCR. The Carbon Leader and the Middelvlei Reef are the most important economic horizons, both of which occur within the lowermost Randfontein Formation.
At the Blyvoor Mine property, the two most important lithologies exposed include the upper zone of the Jeppestown Subgroup and the two basal formations of the Johannesburg Subgroup. The upper portion of the Jeppestown Subgroup, the Roodepoort Formation consists of well laminated dark grey shales with an upward-coarsening and increase of quartzite content. At the base of the Johannesburg Formation, the lower square pebble zone of the Maraisburg Quartzite Formation consists of dark grey, fine grained argillaceous quartzite. The middle square pebble zone is a mature, light grey to slightly green tinged, cross-bedded quartzite. The overlying top square pebble zone is a thin, dark grey, argillaceous quartzite.
| |
| RESOURCE | RESERVE | VALUE |
Blyvoor Gold Resources (Pty) Ltd
S-K 1300 Technical Report Summary on the Blyvoor Gold Mine, South Africa | 25 |
Figure 5: General Stratigraphy of the Upper Carletonville Goldfield
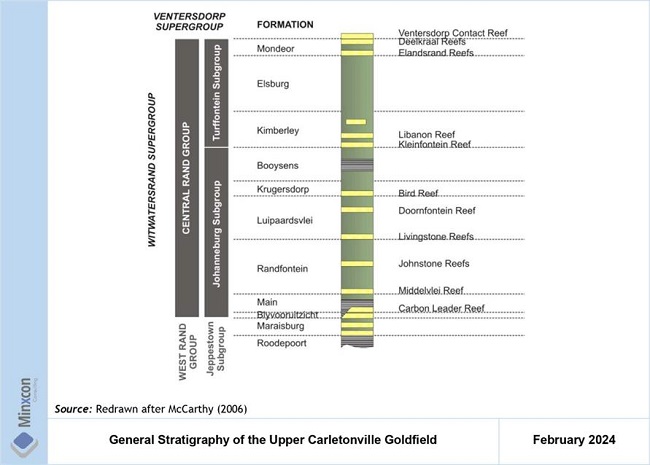
Directly below the North Leader Reef is a fairly mature, medium grained, cross-bedded quartzite. Containing sporadic gold, the North Leader Reef is an oligomictic, small pebble conglomerate, less than 15 cm thick and stratigraphically situated 0-15 m below the Carbon Leader Reef, with this separation increasing southwards due to a minor angular unconformity. The North Leader has only been mined in isolated areas where the parting between this reef and the Carbon Leader permits extraction of both horizons with minimum internal dilution. The footwall of the Carbon Leader is alternating coarse grained siliceous and argillaceous quartzites.
Overlying the Carbon Leader is a mature, light grey, fine-grained siliceous quartzite, above which is the Rice Pebble Conglomerate, a dark pyritic quartzite with small white quartz pebbles. Some 2 m above the Carbon Leader is a dark grey to khaki coloured chlorite-rich argillite called the Green Bar, the lower part of which tends to be laminated and the upper part massive. If exposed during mining, the laminated nature of the Green Bar can cause support problems. The hanging wall of the Green Bar is a mature grey to light grey cross-bedded quartzite with thin semi argillaceous horizons. Approximately 15 m above the Green Bar, the lower hanging wall small pebble conglomerates are moderately mineralised and interbedded with coarse-grained, grey quartzites.
The footwall of the Middelvlei Reef comprises coarse-grained to gritty, dark grey to brown, cross-bedded quartzites, with scattered pebbles and thin lenticular conglomerate horizons. The hanging wall comprises grey to very grey quartzites with occasional poorly packed small pebble conglomerates.
Malmani dolomites of the Transvaal Supergroup, striking east-west and dipping 7°S, occur over the northwest of Blyvoor. The thickness of the dolomite varies from 850 m in the north to over 1,300 m in the south. The southeast of the Mine property is overlain by units of the Pretoria Group, comprising mainly
| |
| RESOURCE | RESERVE | VALUE |
Blyvoor Gold Resources (Pty) Ltd
S-K 1300 Technical Report Summary on the Blyvoor Gold Mine, South Africa | 26 |
Rooihoogte Formation chert breccia at the base with overlying Timeball Hill quartzites and shales. These lithologies strike northeast-southwest and dip 15°S.
Local structural features that occur at the property are as follows:
| ○ | The majority of Blyvoor is structurally relatively undisturbed. In the western section, however, the area is structurally complex due to the presence of the Master Bedding Fault which rejuvenated older faults and formed new ones in close proximity to its plane. The Master Bedding Fault has eliminated a large percentage of the Carbon Leader to the north and west of Doornfontein No. 2 Shaft but the Middelvlei is present over the whole lease area. Along with an Erosion channel In the western area, the Carbon Leader is eliminated by a northwest-southeast striking, 1,900 m wide erosional channel. The erosion channel is truncated to the north by the Master Bedding Fault. Its eastern boundary is well defined by mining, while the western boundary is less certain and has only been defined by drilling. |
| ○ | The major structure on the Mine is an angular unconformity between the Witwatersrand quartzites, dipping at 22°S, and the overlying, 850-1,300 m thick Malmani dolomites of the Transvaal Sequence. At the base of the dolomite is the Black Reef Formation, which dips 7°S. |
| ○ | Major structures in close proximity to historical mining activities below 35 Level are the Boulder and Alpha Dykes. The Boulder Dyke has a downthrow of 40 m to 95 m to the north and strikes east-west. |
| ○ | Large areas of the Mine are underlain by dolomite and were subjected to various types of surface instability as a result of dewatering. Various groundwater compartments are developed across the goldfield, bounded generally by impermeable dykes. Groundwater occurs in the inter-connected conduits within the dolomite. At Blyvoor, the Oberholzer groundwater compartment occurs in the east and the Turffontein groundwater compartment in the west. Impermeable dykes comprise boundaries of the compartments in the east and west, while basement granite-gneiss forms a barrier to the north and the younger Pretoria Group rocks form a similar barrier on the south. Mining within the Oberholzer compartment has resulted in the dewatering of the compartment and hence a significant lowering of the water table. |
| ○ | Within each compartment, the water level is flat or near horizontal, the height of which is controlled by the level of a spring (or eye) which occurs at the western end of each compartment. The eye emerges on the surface at the position where the dyke intersects the deepest drainage feature in the area, namely the Wonderfonteinspruit. |
| ○ | Underground, the major ingress occurs in the vicinity of the sub-outcrops of the reefs against the overlying Black Reef Formation at the base of the Transvaal Supergroup. Fissure water is predominately confined to the western part of the property and is associated with post-Transvaal tear faults. Major water intersections also occur in the vicinity of the sub-outcrops of the reefs against the overlying Black Reef Formation. |
| ○ | Methane intersections tend to be associated with dykes, especially in the deeper sections of the mine. |
A plan of the surface geology at Blyvoor is provided in Figure 6. A simplified geological section at the Mine is depicted in Figure 7.
| |
| RESOURCE | RESERVE | VALUE |
Blyvoor Gold Resources (Pty) Ltd
S-K 1300 Technical Report Summary on the Blyvoor Gold Mine, South Africa | 27 |
Figure 6: Blyvoor Surface Geology Plan
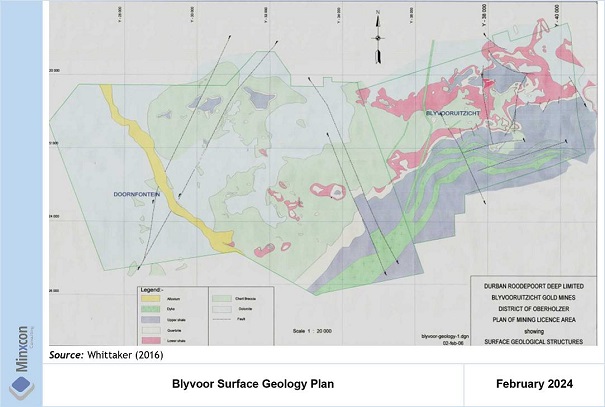
Figure 7: Blyvoor Simplified Geological Section Looking West
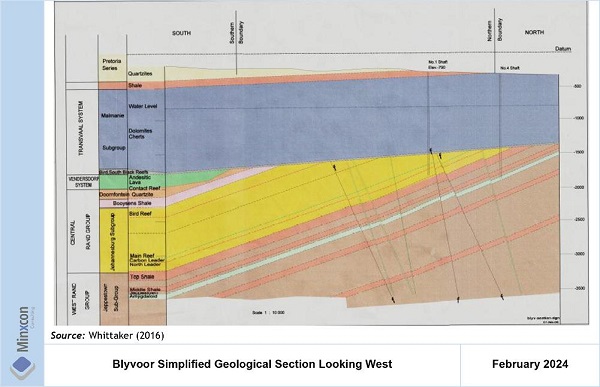
| |
| RESOURCE | RESERVE | VALUE |
Blyvoor Gold Resources (Pty) Ltd
S-K 1300 Technical Report Summary on the Blyvoor Gold Mine, South Africa | 28 |
Item 6 (c) - Mineralisation and Deposit Type
Gold and uranium deposits in the Witwatersrand Basin are hosted by quartz-pebble conglomerates, which are developed on laterally continuous unconformity surfaces. These reefs are generally characterised by shallow dips of between 10° to 25° and thicknesses of 1.0 m to 2.5 m that make them suitable for exploitation by means of typical narrow stoping techniques.
The gold deposits of the Witwatersrand Basin are considered to be associated with coalesced fluvial braid-plains, where gold was concentrated within braided stream gravels developed on unconformities which were correlated around the basin. Most early theories on the origin of gold believed the gold to be deposited syngenetically (placer theory) with the conglomerates or by epigenetic means (hydrothermal origin), but subsequent research concluded that metamorphism caused the post depositional local redistribution of gold (modified placer theory). Generally, gold occurs in native form often associated with pyrite (less commonly pyrrhotite) and carbon, with quartz as the main gangue mineral.
At Blyvoor, two economic placer horizons were exploited. These are namely the Carbon Leader and Middelvlei Reefs and occur in quartzites of the Main Reef Conglomerate Formation of the Johannesburg Subgroup of the Central Rand Group. The auriferous conglomerates dip uniformly at 22°S.
The Carbon Leader is a high grade, predominantly thin (<40 cm) carbon-rich reef and is the principle economic horizon at Blyvoor. The origin of the carbon is in debate as to whether it originated hydrothermally or from algae. Within the deeper southern section of the Mine, carbon is scarcer and hence likely responsible for the decline in grade. In the western area, the Carbon Leader is eliminated by a northwest-southeast striking, 1,900 m wide erosional channel. The erosion channel is truncated to the north by the Master Bedding Fault. Its eastern boundary is well defined by mining, while the western boundary is less certain and has only been defined by drilling.
The Carbon Leader is divided into seven facies areas, namely F1 to F7, based on channel width and carbon content. Four types of Carbon Leader are recognised:-
Grade generally decreases down dip (south) and towards the west associated with a reduction in carbon.
The Middelvlei Reef is the second economic horizon at Blyvoor and lies stratigraphically 50 m to 75 m above the Carbon Leader. Towards the south, the separation increases due to a minor angular unconformity. The Middelvlei Reef is characterised by lower grades than the Carbon Leader. Owing to the variable payability and presence of sedimentologically controlled pay shoots, the Middelvlei Reef has been mined in scattered payable areas and is present over the whole lease area.
On the Middelvlei Reef, facies areas have similarly been identified using grade, channel direction and reef characteristics.
| |
| RESOURCE | RESERVE | VALUE |
Blyvoor Gold Resources (Pty) Ltd
S-K 1300 Technical Report Summary on the Blyvoor Gold Mine, South Africa | 29 |
ITEM 7 - EXPLORATION
Exploration at Blyvoor is strictly of a historical nature as the Mine is a mature operation. Blyvoor Gold’s LoM is concentrated near historical mining areas. Minxcon is of the opinion that no further exploration work is deemed necessary since no new ground is being explored. Data from adjacent operations is utilised in conjunction with available project data for interpretations and Mineral Resource estimations.
It is noted that sampling information is recorded over the whole of the Blyvoor Mine area. All exploration aspects as covered in this section are historical in nature.
Two types of sampling techniques are utilised on all South African gold mines and were historically utilised on the Blyvoor operations. These constitute:-
| 1. | a wide-spaced drilling grid, achieved by means of advance drilling; and |
| 2. | a close-spaced sampling grid achieved by means of face chip sample sections. |
The former is not deemed to be relevant in the generation of Mineral Resource models in carbon rich reefs due to core and associated gold loss, whilst the latter is more often used for the maintenance of grade control models. However, chip sample sections are usually utilised for Mineral Resource estimation for reefs where a wide drilling grid is not easily achieved (due to depth or due to primary development occurring in the reef horizon itself), or where the local variability of mineralisation has proven to be very high, and this variability is not evidenced in the wide-spaced drilling grid due to poor core recovery friability of the carbon seams resulting in significant gold loss and under-evaluation. Carbon-rich reefs such as the Carbon Leader and Middelvlei Reefs are typical candidates for this thus supporting the use of chip sampling in their Mineral Resource estimation. Chip sampling is normally spaced on approximately a 6 m x 6 m sampling grid. This is a well-accepted and entrenched sampling technique utilised on all typical narrow-reef Witwatersrand gold mines in South Africa.
Item 7 (a) - Non-drilling Work
| I. | Survey Procedures and Parameters |
Underground Chip Sampling
A large volume of underground chip sampling data (in excess of 0.5 million data points) is available for Blyvoor. The sampling procedures pertaining to drilling as described are of historical relevance only and have not been reviewed for the current Report as drillhole sampling is not currently taking place.
The database used to estimate the Mineral Resource is sourced from underground development and stope chip sampling. The sampling coverage target was based on a face sample position every 36 m2. The sampling coverage was reviewed and graphed on a monthly basis. The sample coverage steadily decreased from one sample per 20.7 m2 in July 2009 to 54.6 m2 in April 2010. The data available for July 2010 – March 2011 indicates that the target was achieved. The sampling coverage for the period from July 2010 to June 2011 is shown in Figure 15. For that twelve-month period, the average value was one sample per 34.2 m2, with only August and December 2010 total mine not obtaining the target of one sample per 36 m2. The periods 2008-2009 and 2009-2010 recorded total mine averages of 28.5 m² and 31.0 m² per samples, respectively. Over the three-year period, the best sampling coverage was of Blyvooruitzicht No. 4 Shaft, likely as a result of a lower face advance compared to the other shafts.
The sampler liaised with the geologist prior to going underground to ascertain working places that required sampling, thereby ensuring sampling of all panels at regular intervals. The plans for the working areas to be sampled would be geologically scrutinised to identify features such as faults and dykes, off-reef mining, and
| |
| RESOURCE | RESERVE | VALUE |
Blyvoor Gold Resources (Pty) Ltd
S-K 1300 Technical Report Summary on the Blyvoor Gold Mine, South Africa | 30 |
survey pegs to be used. The responsible mining personnel would be contacted to ensure that the working places are available and obtain permission to work in the area.
Development sampling was conducted at 2 m intervals. Stope panel sampling was done every 3 m for the Middelvlei Reef and 5 m intervals for the Carbon Leader, with a duplicate sample taken on the bottom contact due to the high mineralisation associated with basal contact of the Carbon Leader with the footwall quartzite.
Prior to entering the panel, the stope face was checked to ensure the support was to standard. The applicable survey pegs were located, and the peg to face distance measured and recorded in a field book. The panel gully was sampled from hanging wall to footwall, ensuring all mineralised zones were included in the sample. The mining face from the advanced strike gully (“ASG”) was inspected, to correlate the mineralised reef horizons with the first section, at 2.5 m from the side of the ASG. Using tapes from the survey pegs, the position was measured and marked. The mining face was tested for loose rocks, made safe and washed down to remove contamination. The face was opened to solid rock and washed down again.
The sampler marked two parallel lines, 10 cm apart, with a wax crayon or paint, from hanging wall to footwall at 90° to the dip of the reef plane, defining the sample section. The individual sample sections were marked according to geology and grade (i.e. mineralisation), bottom contact, top contact, internal channels, internal quartzites, footwall waste, and hanging wall waste. Two centimetres of waste below and above the mineralisation bottom and top contacts were included in the mineralised sample. The minimum and maximum individual sample lengths were 8 cm and 15 cm, respectively.
Two clino-rulers were used to measure the individual sample section at right angles to dip (true width). The individual widths were recorded to the nearest centimetre, recorded in the field book, and checked with an independent face width measurement taken 0 m to 1 m from the face. A stope width was measured 1.5 m from the stope face at 90° to the reef dip.
Sampler assistants wore safety equipment, including goggles and gloves, and chipped individual samples from the bottom to the top so as to prevent contamination. This process was constantly monitored to verify that no foreign rock entered the sample dish. This was achieved by shielding the sample area being chipped with a plastic bag. Samples were chipped to an even depth throughout the sample area to obtain a representative sample. Overseen by the sampler, the sample packer placed the sample in a plastic bag and allocated the corresponding ticket number to the sample before closing the bag to prevent any spillage or losses. The equipment was cleaned of fines before proceeding to the next sample. After the sample had been chipped, the chipped area was re-measured and if any width discrepancies were identified, they were corrected in the field book for that respective sample before proceeding to the next section.
Mineralised horizons were correlated from section to section, recording internal waste, geological features (such as dykes, faults, reef folding, partings, sills), as well as off-reef mining (Reef in Hanging or RIH, and Reef in Footwall or RIF). The position (or areas) of these features was measured in relation to the previous section. The strike, dip and throw and type of faults and dykes were measured and recorded in the field book.
At the end of the shift, collected samples were counted and compared to the amount logged in the field book. On proceeding back to the station, the sampler followed the sampling team to ensure that no samples were lost along the way and to ensure the whole crew arrived safely at the station, where the samples were re-counted. At surface, the samples were again checked and placed in a secure locked bin. The samples were then transported daily to the assay laboratory for analysis.
| |
| RESOURCE | RESERVE | VALUE |
Blyvoor Gold Resources (Pty) Ltd
S-K 1300 Technical Report Summary on the Blyvoor Gold Mine, South Africa | 31 |
On returning to the office, all underground sampling data was captured in an electronic format. The software used was a sampling reporting programme specially developed by CAE consultants for Blyvooruitzicht Gold Mine. With regard to the sampling database, CAE developed a sampling system into which all sampling information on Blyvooruitzicht was captured and used between 1999 and 2013. This system was in place on the Mine for some time. CAE scripted an interface between the sampling system and Datamine Studio 3™ software, in which Mineral Resource estimation was undertaken (Minxcon, 2012). The sampling database was managed by the mine owners at that time.
Individual sample locations were coordinated, using two survey pegs, peg to face measurements and offset distances. A sampling report and sketch were produced per stope sampled. The grade (g/t and cm.g/t), channel width, stope width, off-reef mining, hanging wall and footwall dilution were recorded per section and reported per panel. A sketch printout was produced in plan and cross section showing sample positions and geological structures per section. The individual underground sampling data points were composited per reef horizon over the reef width. Hanging wall and footwall widths were also recorded. This information was validated by the Chief Geologist prior to being transferred to a secure sampling database.
For each panel sampled, cm.g/t, g/t, stope width, footwall, hanging wall, number of sections and date of sample were plotted on 1:200 stope sheet, along with off-reef mining. All faults and dykes were plotted on 1:200 stope sheet and shown to the relevant geologist to update the geological structure.
Planned Task Observations were conducted on the samplers by the geologists and grade control officers to ensure the sampling was conducted to standard.
Geophysical Surveying
A magnetometer survey was conducted on the property between 1930 and 1932 by Dr. Krahmann, which successfully identified the presence of the magnetic Jeppestown shales in the area. To the QP’s knowledge no additional geophysical surveys over the Project Area were conducted nor are they required due to the mature nature of the Mine.
Geological Mapping
The locations of several sedimentological facies were mapped for both the Carbon Leader and the Middelvlei Reef. Historically, these were used for boundaries during grade and channel width interpolation. Geological mapping is strictly underground in the form of production geological mapping which would utilise survey pegs for the purposes of mapping offsets and plotting on production plans. No exploration mapping is required.
| II. | Sampling Methods and Sample Quality |
Blyvoor is an operational mine. No exploration sampling is currently undertaken.
No exploration sampling is currently undertaken.
| IV. | Results and Interpretation of Exploration Information |
Blyvoor Mine hosts a typical Witwatersrand orebody, which is well understood. Further, Blyvoor Mine has been in operation since the 1930s and the local geology is well defined.
| |
| RESOURCE | RESERVE | VALUE |
Blyvoor Gold Resources (Pty) Ltd
S-K 1300 Technical Report Summary on the Blyvoor Gold Mine, South Africa | 32 |
Item 7 (b) - Drilling
| I. | Type and Extent of Drilling |
Blyvoor has restarted the operation. Historical drilling was conducted from surface during the 1930s and the data does not form part of the database utilised for Mineral Resource estimation, except for the Middelvlei surface drillholes drilled west of PS Shaft. No in-stope drillhole data has been used in the evaluation of the Mineral Resources of Blyvoor since at least the 2011 estimate. This is due to the poor representivity of the drillhole sampling as a result of gold loss associated with the high carbon content of the reefs in question, as well as the excellent coverage and significant volume of chip sample data, which would provide comparatively superior information for this deposit.
Goldfields has created, and is custodian of, a regional plan of the West Wits Line showing all operators and underground workings. On this compilation plan is reflected the location of drillholes that the authors of the plan were able to source over several years. As shown in the plan dated 30 June 2007, six historic drillholes were drilled in the western undeveloped portion of the current Blyvoor lease area. These are namely drillholes E8C, E8D, E8F, E8H, E8J and E9 and are illustrated in Figure 8. Drillhole E9A was drilled just outside of the current Blyvoor lease boundary. Due to the lack of data in the western portion of the mine, these drillholes were included in the estimation, these are currently in Inferred areas, and data is currently extrapolated from chip samples up to 2 km away, prior to the inclusion of these samples.
Figure 8: Blyvoor Underground and Drillholes Plan, 2007
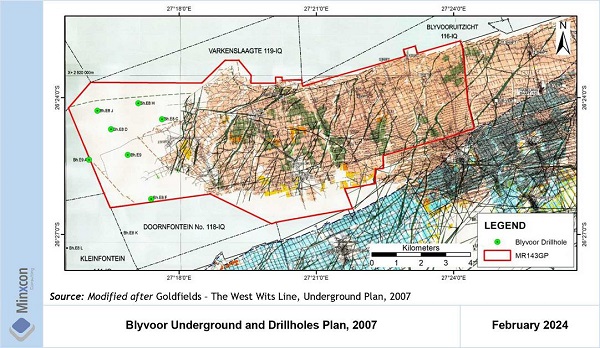
Diamond drilling on Blyvoor is additionally utilised to confirm structural interpretations and reef positions within already well-informed areas.
| II. | Factors Influencing the Accuracy of Results |
Drill Sample Recovery
Generally, the industry standard is that if a reef intersection had excessive core loss it would be marked as incomplete and would not be utilised in evaluation, hence the use of the chip sampling for the purposes of
| |
| RESOURCE | RESERVE | VALUE |
Blyvoor Gold Resources (Pty) Ltd
S-K 1300 Technical Report Summary on the Blyvoor Gold Mine, South Africa | 33 |
Mineral Resource estimation. The carbon content of the reefs at Blyvoor is very high; thus, the chance of core loss and poor recoveries is greatly enhanced. Consequently, the chance of under-evaluating Mineral Resources by using such drilling is very high.
Logging
The nature of logging of the historical drilled material is not known to the authors of this Report.
Relationship Between Mineralisation Widths
The Mine is a mature operation and no exploration results are reported. Historically in the goldfield, drillholes were drilled perpendicular to the reef to ensure intersection. The downhole length and true width are not known.
| III. | Exploration Properties – Drill Hole Details |
This section is not applicable to the Blyvoor Mine as it is an operating gold mine with sufficient drillhole data and underground sampling to declare Measured and Indicated Mineral Resources and Mineral Reserves.
Item 7 (c) - Hydrogeology
A groundwater specialist study was undertaken most recently in October 2018 in support of an EIA for the Mine. Blyvoor is a mature mine with known inflow of water determined by years of pumping, i.e. inflow is 25 Ml per day of which 6 ML is pumped from Blyvooruitzicht No. 6 Shaft, 14 Ml per day from Blyvooruitzicht No. 4 Shaft and the balance of 5 Ml /day from Savuka. Inflows are measured by pumping to maintain a constant level.
Samples are taken on an ad hoc basis to SANAS accredited laboratories. Harmony / CWC take samples of the water discharged out of the basin monthly with results given to DWS on a monthly basis and reported in annual presentation at the DWS Wonderfontein Forum.
Water enters the basin through the unconformity between the dolomites and the Witwatersrand sequences, and through geological structures, especially the post-Transvaal tear structures.
Item 7 (d) - Geotechnical
Blyvoor Mine commenced operations over a century ago. Exploration work and geotechnical investigations to test rock properties are not relevant for definition of Mineral Resources for this property.
| |
| RESOURCE | RESERVE | VALUE |
Blyvoor Gold Resources (Pty) Ltd
S-K 1300 Technical Report Summary on the Blyvoor Gold Mine, South Africa | 34 |
ITEM 8 - SAMPLE PREPARATION, ANALYSES AND SECURITY
The samples discussed in this section pertains to the chip sampling which is utilised in Mineral Resource estimation.
Item 8 (a) - Sample Handling Prior to Dispatch
Once the samples had been collected, placed in plastic bags, and ticketed, the bags were immediately stapled closed. The sampler was responsible for the security of the sample from the time the sample was collected until it was delivered to the shaft head. On surface, the sampler verified that no samples had been misplaced and secured the samples in a lockable bin. The samples were then transported daily through a vehicle by mine personnel directly to the Blyvoor laboratory for analysis. Samples were checked against samplers’ books and laboratory sheets. The samples were secured in the laboratory and processed within 24 hours. Surveillance equipment was also installed in the laboratory and live streamed to the Mine’s security control room. Currently the samples are transported to the survey office, which is locked overnight and then transported to the onsite laboratory in the morning.
Item 8 (b) - Sample Preparation and Analysis Procedures
Sample Preparation and Analysis
All sample preparation and analyses were done by the Blyvooruitzicht laboratory during and prior to DRD’s tenure. Gold analyses were conducted at the Blyvooruitzicht laboratory using fire assay. Strict sample preparation was followed as per laboratory procedure No. 5 and analysis conducted to appropriate industry standards.
Since the reinstatement of Blyvoor Mine in 2021, samples were prepared and assayed by Super Laboratory Services. The procedure for preparation of a pulp for fire assay by SLS is summarised below:
| 1. | Samples are dried under an infrared drier or in a drying oven at a temperature of at least 110 degrees Celsius until no visible signs of moisture are apparent. The sample is checks for signs of moisture by turning the sample with a clean rod, spatula, spoon, or other suitable mixing implement. |
| 2. | Crush the sample using a primary crusher. The sample is crushed to obtain a product that is at least >80% - 25mm. |
| 3. | The sample is split through a Jones riffle splitter to obtain a workable mass of approximately 2kg. |
| 5. | The sample is crushed in a Keegor secondary crusher. The setting of the crusher ensures that a crushed sample passes through a 6mm screen, and that the fineness of the product is at least >80% -10mm. |
| 6. | The sample is split using a Jones riffle splitter to obtain a workable mass of 250 to 500g. |
| 7. | The sample is pulverised using either a vertical spindle pulveriser of a LM 2 or six-pot swing mill to obtain a produce of fineness >70% - 75um. |
| 8. | For each pulveriser, at least one sample is selected for grading out of every group of no more than fifty samples that were processed. Grade the selected sample and record the findings. |
| 9. | Should the selected sample fail to meet the requirements, the entire group of samples shall be re-pulverised. |
| 10. | The sample is then mixed by means of either a clean plastic sheet or clean cocktail mixer, and a grab sample taken for packing. The sample is packed into a suitable container such as a paper or plastic bag along with the client’s sample ticket. |
| |
| RESOURCE | RESERVE | VALUE |
Blyvoor Gold Resources (Pty) Ltd
S-K 1300 Technical Report Summary on the Blyvoor Gold Mine, South Africa | 35 |
Bulk Density Determination
Blyvooruitzicht used a standard density figure for Mineral Resource and Reserve estimation. This figure was checked by measuring the density of 234 footwall, hanging wall and reef (Middelvlei Reef and Carbon Leader) samples. There were no significant changes in the geology and rock quality since these measurements were taken and the official figure of 2.737 g/cm3 is still considered an appropriate density for Mineral Resource estimation.
Item 8 (c) - Quality Assurance and Quality Control
Given the historical nature of the Mine, limited quality assurance and quality control (“QAQC”) data is available, as the bulk of the sampling was undertaken prior to the introduction of mineral reporting codes and requirements for detailed QAQC practices and audits. Prior to 1996, the sampling conducted at the Doornfontein area of the Blyvooruitzicht lease area would were analysed at the neighbouring Goldfields laboratory, which is not accredited and for which no QAQC data is available.
More recently, no standards, blanks or duplicates were inserted into the sample stream before dispatch to the assay laboratory, however Blyvooruitzicht relied on routine quality control procedures implemented at the assay laboratory. Laboratory internal QAQC and round robin checks were regularly conducted by the assay laboratory during the ownership period of DRD and Village Main Reef. The assay laboratory produced quality assurance data to ensure that the analysis conducted had the accuracy and precision appropriate for Mineral Resource and Mineral Reserve declarations.
The following historical procedures were adhered to:-
| ● | As routine, approximately 10% of all mine assays were checked. As these 10% were randomly selected, they constituted a valid statistical sample of the totality of mine assays. Any errors found in the checks would also be present in the 90% of mine assays which were not checked. Checked assays were compared with routine mine assays and graphically displayed on an Assay Factor graph. |
| ● | Head Grade and Residue Samples (Internal Checks): All head grade and residue samples were assayed in duplicate (twin streams). Different furnaces, muffles and balances were used for each stream to provide a control on accuracy. The difference between the duplicate values were plotted as Assay Control plots. |
| ● | Duplicate values were compared on a control fan which indicated whether the values obtained are within acceptable limits. The difference between duplicate values was plotted on control charts for analysis. New charts were prepared monthly. |
| ● | Head Grade and Residue Samples (External Checks): Round Robin analyses of head grade and residue samples were undertaken to provide external checks. Four participating laboratories all supplied a head grade and a residue sample. Participating laboratories over time included Blyvooruitzicht, Driefontein (not accredited), MAED Metallurgical Laboratories (Pty) Ltd (not accredited) in Brakpan, Gauteng, Super Laboratory Services (SANAS ISO 17025 accreditation number T0494) in Springs, Gauteng, and Ready Lead Assay Laboratory (SANAS accreditation number T0689) in Springs, Gauteng. All laboratories supplied a head grade and a residue sample. The samples were analysed, and the laboratories submitted their results for statistical evaluation. Graphic representations of results were forwarded to the respective mines, displayed on Intermine Exchange graphs. |
| ● | Belt Samples: 10% of all belt samples were routinely checked. All assays were parted (routine and checks) and the data obtained graphed on charts designated Bin Check. |
| ● | Fire Assays: A reference sample was randomly processed daily, and the results plotted on a fire assay reference graph. New charts were prepared monthly. |
| ● | Top pan balances were checked daily by utilising a known mass. Micro balances were calibrated by either external or internal calibration masses where the instruments allowed. |
| |
| RESOURCE | RESERVE | VALUE |
Blyvoor Gold Resources (Pty) Ltd
S-K 1300 Technical Report Summary on the Blyvoor Gold Mine, South Africa | 36 |
| ● | The Atomic Absorption Instrument was calibrated daily, and a high and low reference sample was checked before samples were processed. |
| ● | Carbon blank samples were processed, and corrections were made when required. |
| ● | Charges of flux were analysed by fire assay as a check that there was no gold present in the flux. |
The Blyvooruitzicht laboratory was not an accredited laboratory, however the laboratory was audited in April 2005 by ProOptima Audit Services (“ProOptima”). ProOptima concluded that the laboratory was efficiently and effectively managed and that it achieved a high level of compliance to the applicable standards, laws, and regulations through a disciplined and systematic approach.
It is also noted that surface dump sampling using both Blyvooruitzicht laboratory and ALS Chemex, an independent, SANAS-accredited laboratory, had previously confirmed that the level of accuracy and precision were high.
Minxcon is not aware of subsequent laboratory audits. Annually, however, quality controls were actively monitored, and all relevant data was supplied to Coffey Mining on an annual basis for analysis. No significant changes had been made to the laboratory procedures and assay data was considered comparable to that of previous years.
In 2012, the Blyvooruitzicht and Buffelsfontein laboratories merged at the Buffelsfontein site and as a result, Blyvooruitzicht no longer has an assay laboratory. Post the laboratory merger, SGS (Randfontein) was used as the reference laboratory.
Super Laboratory Services has been assaying all samples since the reinstatement of the operation. Samples were initially analysed at the Springs laboratory, while the new laboratory was commissioned on site. Super Laboratory Services, in Springs, is ISO 17025 accredited (accreditation number T0494). Certified reference material, AMIS0705 and AMIS0780 are inserted in batches with chip samples. The results are suitable for estimation as most of the results fall within two-standard deviations from the mean, and all results are within three-standard deviations from the mean.
Item 8 (d) - Adequacy of Sample Preparation, Security and Analytical Procedures
This section sets out the opinion of the QPs regarding the adequacy of sample preparation, security, and analytical procedures.
Annually from 2002 to 2011, Coffey Mining reviewed the graphical analyses of the QAQC results and the results from the round robin check assays. It was found that the analyses demonstrate that the Blyvooruitzicht laboratory results can be considered reliable. Further, Coffey Mining found that the measures used to ensure accuracy and precision of analysis were considered appropriate for the purposes of Mineral Resource and Mineral Reserve estimations.
Details pertaining to the grinding and pulverisation of the chip samples is not available due to the historical nature of the sampling. It is, however, assumed that the mine standard as applied in South Africa of 80% passing 75 μm was utilised as a preparation guide. The sheer volume of the sampling and the coarse nature of the gold associated with carbon seams and the high sampling grades obtained attests to adequate sample preparation.
It is the opinion of the QP responsible for the Mineral Resources of this Report that the database utilised for the Mineral Resource estimation is adequate and appropriate based on the following:-
| ● | the Mineral Resources were audited by an independent consultancy / QP at the time of operation; |
| ● | the Blyvooruitzicht Gold Mine was a reputable gold mining operation following the sampling protocols and practices recognised by the South African mining industry; |
| |
| RESOURCE | RESERVE | VALUE |
Blyvoor Gold Resources (Pty) Ltd
S-K 1300 Technical Report Summary on the Blyvoor Gold Mine, South Africa | 37 |
| ● | the Mine has been operating since the early 1940s with historical production substantiating the grades produced by the two orebodies; |
| ● | the sheer number of samples utilised; and |
| ● | the QP of this Report responsible for Mineral Resources is familiar with these sampling principles having been a Mineral Resource Manager on similar “Witwatersrand gold” operations which utilised the same practices. |
| |
| RESOURCE | RESERVE | VALUE |
Blyvoor Gold Resources (Pty) Ltd
S-K 1300 Technical Report Summary on the Blyvoor Gold Mine, South Africa | 38 |
ITEM 9 - DATA VERIFICATION
Item 9 (a) - Data Verification Procedures
Minxcon performed a comprehensive review of the historical sampling databases for both the Middelvlei and Carbon Leader reefs as part of the 2021 estimates (Minxcon, 2021). Details of the changes made by Minxcon as part of the 2021 estimation process is contained in the 2021 Minxcon report (Minxcon, 2021). Therefore, data verification for the estimates completed in 2024 only focused on new sampling and depletion information received from Blyvoor Mine. New channel sampling and depletion files for facies 3 Middelvlei Reef and facies 5 Carbon Leader reef was reviewed spatially relative to mine plans. The data plots were then provided to Mr. Dave Whittaker from Blyvoor Mine to confirm the completeness and spatial correctness of the data. An example of the new 2024 channel sampling data for the Carbon Leader Reef relative to the 2024 depletions is illustrated in Figure 9. Furthermore, statistics of the new Carbon Leader and Middelvlei reef sampling data was compared to the previous estimation datasets. Spatial post class plots of cm.g/t and channel width data were utilised to identify potential erroneous new data.
Figure 9: New Channel Sampling Data for the Carbon Leader Reef in Relation to 2024 Depletions.
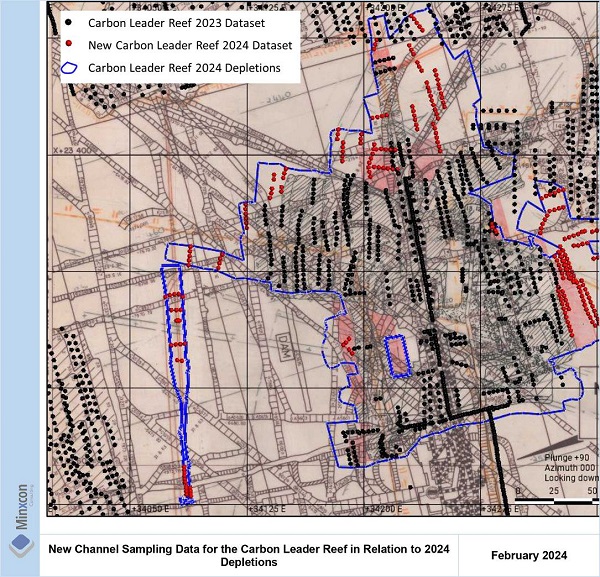
| |
| RESOURCE | RESERVE | VALUE |
Blyvoor Gold Resources (Pty) Ltd
S-K 1300 Technical Report Summary on the Blyvoor Gold Mine, South Africa | 39 |
Item 9 (b) - Limitations on/Failure to Conduct Data Verification
The QPs reviewed several historical production sampling sheets to assess adherence to historical standards and that data was correctly incorporated into the digital database. No transcription errors were found in the checked sample sheets. The sheer volume of available data precludes an exhaustive review of all sampling data. Minxcon is of the opinion that the historical standards under the various owners were carried over between the various owners and were adhered to, and that the digital database (based on the data reviewed) is representative of the captured hardcopy historical production chip sample sheets.
Item 9 (c) - Adequacy of Data
It is the view of the QP responsible for the Mineral Resources of this Report, Mr. Uwe Engelmann, that the volume and spacing of chip sample data on both the Carbon Leader and Middelvlei Reefs are adequate for the purposes of conducting Mineral Resource estimations in line with the requirement as outlined by the requirements of S-K 1300.
| |
| RESOURCE | RESERVE | VALUE |
Blyvoor Gold Resources (Pty) Ltd
S-K 1300 Technical Report Summary on the Blyvoor Gold Mine, South Africa | 40 |
ITEM 10 - MINERAL PROCESSING AND METALLURGICAL TESTING
Item 10 (a) - Nature and Extent of Testing and Analytical Procedures
The plant currently treats RoM from the main orebodies. The ore is free milling, and the mineralogy has not changed to a significant degree. Sufficient information from current production has been used to determine the provide reasonable confidence of production performance.
Item 10 (b) - Basis of Assumptions Regarding Recovery Estimates
The processing efficiencies are based on current production, and are well in line with the budget, with 2022 and 2023 recovery averaging 91.5% against the 2022 budget of 92.0%. The actual recovery of previous operations, processing the RoM from the same location, has been higher than the budget recovery since 2020, approaching 94%. The budgeted recovery of 92.0% for 2023 can be assumed to continue, with improvements expected until the plant capacity expansion is complete. The budgeted recovery for the larger capacity plant is 94%.
Item 10 (c) - Representativeness of Samples and Adequacy of Data
The samples measured from current production are considered reliable and representative. As a result, they can be used to adequately predict future performance.
The QPs are of the opinion the Blyvoor Gold Mine plant recoveries are well understood as they are based on the actual current production figures.
Item 10 (d) - Deleterious Elements for Extraction
No deleterious elements were identified which could otherwise negatively affect the processing plant and for which the plant has not been provided with adequate processing capacity thereof.
Blyvoor Gold ores are free milling in that 92% of the gold is recovered through direct cyanidation and the use of oxygen pre-treatment injection methods. The process includes detoxification capacity to render cyanide below allowable threshold. Rainwater run-off from the tailings dam is channelled within bund walls to a sump from where it is returned to the plant as makeup water.
| |
| RESOURCE | RESERVE | VALUE |
Blyvoor Gold Resources (Pty) Ltd
S-K 1300 Technical Report Summary on the Blyvoor Gold Mine, South Africa | 41 |
ITEM 11 - MINERAL RESOURCE ESTIMATES
Item 11 (a) - Assumptions, Parameters and Methods Used for Resource Estimates
| I. | Mineral Resource Estimation Procedures |
Geological modelling in the form of facies modelling and construction of reef polygons that exclude major structures and historical mining was conducted by Mr Dave Whittaker at Blyvoor Mine for both reefs. Item 11 (a) iii: Domaining provides a detailed discussion of the facies models developed for the Carbon Leader and Middelvlei reefs.
Table 4 shows statistics of the 2024 database versus the data utilised in the 2023 estimate. New data was only added to facies 3 for the Middelvlei Reef (497 data points) and facies 5 for the Carbon Leader Reef (261 data points). No major change is observed in the mean grade for the two reefs.
The statistics for the gold content for Carbon Leader and Middelvlei Reef are presented in Table 4.
Table 4: Raw Statistics for Gold Content for the 2023 and 2024 Datasets
| | 2023 Dataset | 2024 Dataset | Difference | 2023 Dataset | 2024 Dataset | Difference |
| Reef | Carbon Leader | Carbon Leader | Carbon Leader | Middelvlei | Middelvlei | Middelvlei |
| Variable | cm.g/t | cm.g/t | cm.g/t | cm.g/t | cm.g/t | cm.g/t |
| Count | 360,002.0 | 360,263.0 | 0.07% | 138,091.0 | 138,588.0 | 0.36% |
| Mean | 1,881.4 | 1,882.0 | 0.03% | 814.9 | 813.8 | -0.14% |
| Standard deviation | 3,367.1 | 3,367.5 | 0.01% | 1,247.8 | 1,246.3 | -0.12% |
| CV | 1.8 | 1.8 | -0.02% | 1.5 | 1.5 | 0.02% |
| Minimum | 1.0 | 1.0 | 0.00% | 1.0 | 1.0 | 0.00% |
| Lower quartile | 321.0 | 321.8 | 0.23% | 216.0 | 216.0 | 0.00% |
| Median | 905.0 | 905.0 | 0.00% | 470.0 | 469.0 | -0.21% |
| Upper quartile | 2,178.0 | 2,178.8 | 0.04% | 966.0 | 964.0 | -0.21% |
| Maximum | 443,143.0 | 443,143.0 | 0.00% | 121,144.0 | 121,144.0 | 0.00% |
The raw statistics for channel width comparing the 2023 to the 2024 Middelvlei Reef and Carbon Leader Reef datasets are presented in Table 5 for comparison. Outliers are capped prior to estimation. For example, the outlier of 749 cm in facies 3 of the Middelvlei Reef was capped to 118 cm.
Table 5: Raw Statistics for Channel Width for the 2023 and 2024 Datasets
| | 2023 Dataset | 2024 Dataset | % Difference | 2023 Dataset | 2024 Dataset | % Difference |
| Reef | Carbon Leader | Carbon Leader | Carbon Leader | Middelvlei | Middelvlei | Middelvlei |
| Variable | CW | CW | CW | CW | CW | CW |
| Count | 254,176.0 | 254,437.0 | 0.10% | 99,849.0 | 100,346.0 | 0.50% |
| Mean | 22.4 | 22.4 | 0.02% | 35.7 | 36.0 | 0.78% |
| Standard deviation | 21.0 | 21.0 | 0.02% | 30.3 | 30.6 | 1.13% |
| CV | 0.9 | 0.9 | 0.00% | 0.8 | 0.9 | 0.34% |
| Minimum | 1.0 | 1.0 | 0.00% | 1.0 | 1.0 | 0.00% |
| Lower quartile | 10.0 | 10.0 | 0.00% | 10.0 | 10.0 | 0.00% |
| Median | 14.0 | 14.0 | 0.00% | 26.0 | 26.0 | 0.00% |
| Upper quartile | 26.0 | 26.0 | 0.00% | 54.0 | 54.0 | 0.00% |
| |
| RESOURCE | RESERVE | VALUE |
Blyvoor Gold Resources (Pty) Ltd
S-K 1300 Technical Report Summary on the Blyvoor Gold Mine, South Africa | 42 |
Domaining was conducted making use of hard estimation boundaries representing historical mine reef facies descriptions on both the Carbon Leader and Middelvlei Reefs. Segregation of populations was based upon delineable populations of samples exhibiting distinctive gold content and channel width characteristics. Gold grade was the primary basis for domaining of the Middelvlei Reef, while channel width and carbon content variations in conjunction with gold content were utilised for the definition of the Carbon Leader facies.
The Carbon Leader is divided into eight facies, (Table 6), based on channel width and carbon content. Four types of Carbon Leader are recognised:-
Table 6: Carbon Leader Facies
Facies | Ave Channel Width | Ave Grade | Description |
| cm | cm.g/t |
| F1 | 21 | 2,980 | Carbon Seam Reef | High grade carbon seam mined out apart from isolated pillars |
| F2A | 30 | 710 | Low Grade Channel | More than one reef horizon |
| F2B | 27 | 1,846 | High Grade Channel | separated by internal quartzite. |
| F3 | 22 | 1,514 | Thick Single Reef | |
| F4 | 36 | 1,671 | Channel Facies | More than one reef horizon separated by internal quartzite. |
| F5 | 20 | 1,738 | Thick Single Reef | - |
| F6 | 15 | 1,426 | Thin Single Reef | - |
| F7 | 16 | 1,497 | Thick Single Reef | - |
Gold grade in the Carbon Leader Reef generally decreases down dip (south) and towards the west and is associated with a reduction in carbon. The eight facies defined for the Carbon Leader Reef are presented relative to gold content in Figure 10.
Figure 10: Carbon Leader Reef Eight Domains or Facies Zones Relative to Gold Content
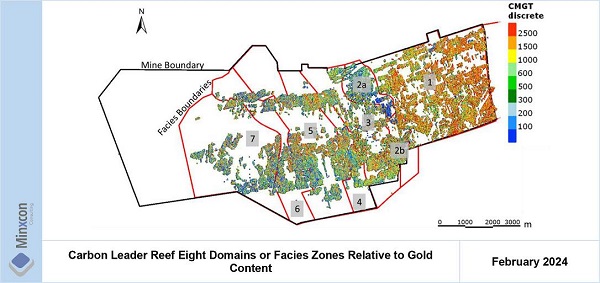
| |
| RESOURCE | RESERVE | VALUE |
Blyvoor Gold Resources (Pty) Ltd
S-K 1300 Technical Report Summary on the Blyvoor Gold Mine, South Africa | 43 |
The eight domains or facies zones were defined for the Carbon Leader Reef are presented relative to channel width in Figure 11.
Figure 11: Carbon Leader Reef Eight Domains or Facies Zones Relative to Channel Width
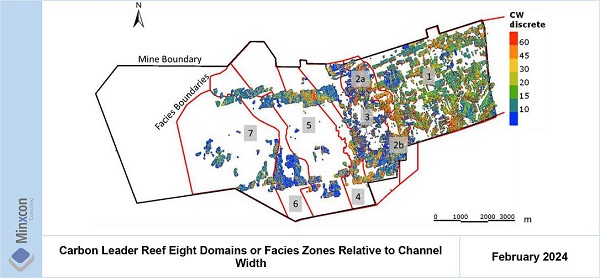
The Middelvlei Reef is the second economic horizon at Blyvoor and lies stratigraphically 50 m to 75 m above the Carbon Leader. Towards the south, the separation increases due to a minor angular unconformity. The Middelvlei Reef is characterised by lower grades than the Carbon Leader. Owing to the variable payability and presence of sedimentologically controlled pay shoots, the Middelvlei Reef has been mined in scattered payable areas and is present over the whole lease area. Three facies for the Middelvlei Reef were identified using grade, channel direction and reef characteristics. The three facies defined for the Middelvlei Reef are presented relative to gold content in Figure 12.
Figure 12: Middelvlei Reef Three Domains or Facies Zones Relative to Gold Content
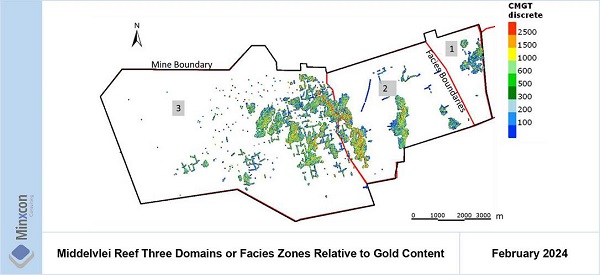
The three domains or facies zones defined for the Middelvlei Reef are presented relative to channel width in Figure 13.
| |
| RESOURCE | RESERVE | VALUE |
Blyvoor Gold Resources (Pty) Ltd
S-K 1300 Technical Report Summary on the Blyvoor Gold Mine, South Africa | 44 |
Figure 13: Middelvlei Reef Three Domains or Facies Zones Relative to Channel Width
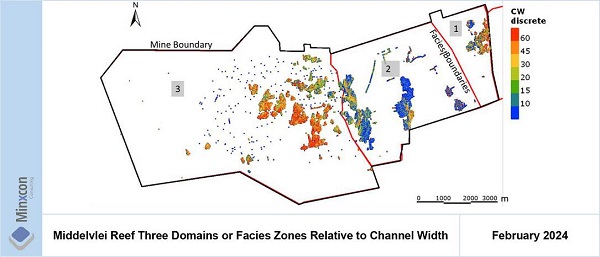
Owing to the high carbon content and high grade of the reefs on Blyvoor, as well as the associated friability and potential for gold loss or gain, a more conservative data capping strategy is applied. Relative to each facies zone, data is capped at the mean + (2X Standard Deviations), which equates to between the 96th and 97th percentile, whereas many operations cap data on the 99th percentile.
The raw point data was regularised on a 15 m x 15 m grid and basic statistics conducted. The raw was then capped and basic statistics conducted.
Full reef composites were received from Blyvoor Gold Mine. This data was used to estimate channel widths and gold accumulation (cm.g/t). Mineral Resources are reported at a minimum stope width of 117 cm which is typically higher than the estimated channel widths, thereby allowing for additional dilution.
| vi. | Geostatistical Analysis and Variography |
Three separate 2D block models were generated for each reef during the estimation process corresponding to each of the Mineral Resource categories and their associated parameters. The Measured category block models were modelled on a 15 m x 15 m x 1 m block size, using the respective capped point data variogram search distance per facies zone. Only estimates for facies 3 on the Middelvlei Reef and facies 5 for the Carbon Leader Reef were run in 2024, all other facies remained the same as reported in 2023. The estimation procedures and estimation parameters as employed previously by the Mine were employed.
Point data was regularised to a 15 m x 15 m x 1 m grid spacing. The regularised data was used to produce variogram models used for estimating Indicated and Inferred Mineral Resources. The Indicated category block models were modelled on a 30 m x 30 m block size, using the respective capped regularised data variogram search distance per facies zone.
The Inferred category block models were modelled on a 60 m x 60 m x 1 m block size, using the respective capped regularised data variogram search distance per facies zone. The search distances were exaggerated to 3,000 m in order to ensure the entire lease area was covered. All other search parameters were the same as utilised for the Indicated models.
| |
| RESOURCE | RESERVE | VALUE |
Blyvoor Gold Resources (Pty) Ltd
S-K 1300 Technical Report Summary on the Blyvoor Gold Mine, South Africa | 45 |
| vii. | Block Model Creation and Grade Interpolation |
Three separate 2D block models were generated for each reef during the estimation process corresponding to each of the Mineral Resource categories and their associated parameters. The Measured category block models were modelled on a 15 m x 15 m x 1 m block size, using the respective capped point data variogram search distance per facies zone. Point data was regularised to a 15 m x 15 m x 1 m grid spacing. This data was used to create variogram models that were used for estimating Indicated and Inferred Mineral Resources. The Indicated category block models were modelled on a 30 m x 30 m block size, using the respective capped regularised data variogram search distance per facies zone. The Inferred category block models were modelled on a 60 m x 60 m x 1 m block size, using the respective capped regularised data variogram search distance per facies zone. The search distances were exaggerated to 3,000 m in order to ensure the entire lease area was covered.
Facies received from Blyvoor Mine were used as hard boundaries during estimation. This ensures that only samples falling within specific facies were utilised for estimation. Variograms were generated for all of the facies allowing for ordinary kriging to be performed. QPs utilised Leapfrog Edge software for running the estimates. The block models were then combined in Datamine Studio RM and depletions applied to the Block Models.
Blyvooruitzicht used a standard density figure for Mineral Resource and Reserve estimation. This figure was checked by measuring the density of 234 footwall, hanging wall and reef (Middelvlei Reef and Carbon Leader) samples. There were no significant changes in the geology and rock quality since these measurements were taken and the official figure of 2.737 g/cm3 is still considered an appropriate density for Mineral Resource estimation.
Ordinary Kriging (“OK”) was utilised for estimating cm.g/t as well as channel width (“CW”) based on the variogram models using Leapfrog Edge. Additional estimations using an Inverse Distance Squared estimation method was used as checks for the OK estimates. Estimates for facies 3 on the Middelvlei Reef and facies 5 for the Carbon Leader Reef were run in 2024 for cm.g/t and cw. Variograms utilised in the 2021 estimates were checked and used in 2024. The optimal samples required for estimation stayed the same in 2024 and are based on Kriging Neighbourhood analysis completed in 2021 (Minxcon, 2021). Sample search parameters were based on the variogram ranges per domain and the minimum and maximum number of samples were selected to ensure that a minimum of 15 samples for search volume one and 10 for search volume two and three were used in the estimation. Three separate block models were generated for each reef during the estimation process corresponding to each of the Mineral Resource categories and their associated parameters. The extent of the 15 m x15 m estimate was employed as the Measured model, the extents of the 30 m x 30 m regularised model as the Indicated model, whilst the remainder of the facies as informed by the 60 m x 60 m was defined as Inferred. All three block models per reef were then combined in Datamine Studio RM to generate final reef block models. In addition, depletions and classification were applied in Datamine Studio RM. The final combined Carbon Leader block model filtered on cm.g/t is illustrated in Figure 14.
| |
| RESOURCE | RESERVE | VALUE |
Blyvoor Gold Resources (Pty) Ltd
S-K 1300 Technical Report Summary on the Blyvoor Gold Mine, South Africa | 46 |
Figure 14: The Combined Carbon Leader Reef Block Model Filtered on cm.g/t
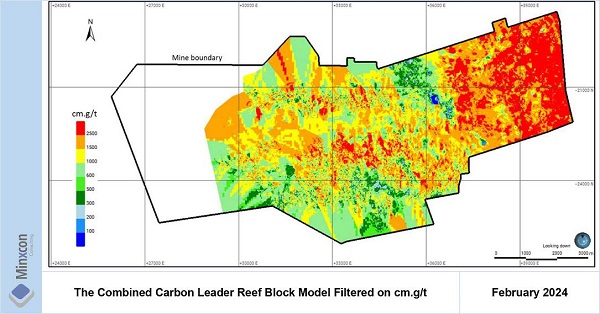
The final Middelvlei block model filtered on cm.g/t is illustrated in Figure 15.
Figure 15: The Combined Middelvlei Reef Block Model Filtered on cm.g/t
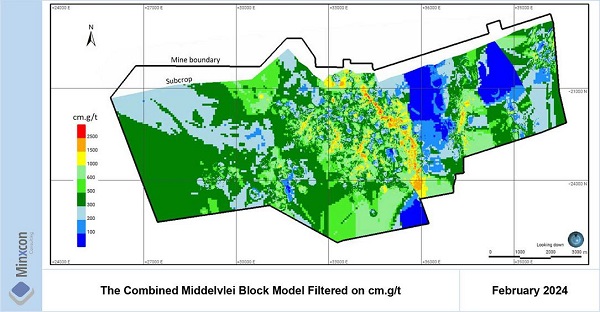
Depletion strings utilised in the 2021 estimates (Minxcon, 2021) were applied to the combined block models using Datamine Studio RM. The depletion strings delineate areas where fault losses and historical mining is located (labelled as “Outside”), boundary pillars (“BP”) and current mineable areas. In addition, new depletions as of 29 February 2024 for the Middelvlei and Carbon Leader reefs were received from Blyvoor Mine and applied to the block models. New mining that occurred between 01 March 2023 and 29 February
| |
| RESOURCE | RESERVE | VALUE |
Blyvoor Gold Resources (Pty) Ltd
S-K 1300 Technical Report Summary on the Blyvoor Gold Mine, South Africa | 47 |
2024 is labelled as “MINED” in the 2024 block models. The final depletions applied to the 2024 estimates for the Carbon Leader and Middelvlei reefs are illustrated in Figure 16 and Figure 17, respectively.
Figure 16: Depletions Applied to the Carbon Leader Reef Block Model
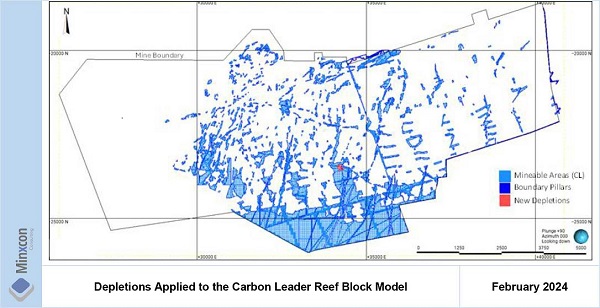
Figure 17: Depletions Applied to the Middelvlei Reef Block Models
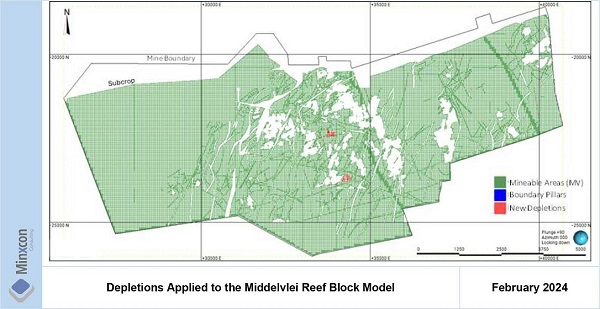
| xi. | Block Model Validation |
The estimates were validated against the samples by swath analyses. Swaths were generated along the X and Y axis. Samples and block model estimates were queried within each swath, and the mean statistic compared.The swaths do demonstrate some smoothing of the estimate relative to data. Only the Measured 15 m x 15 m estimate versus raw data is shown, as this shows the estimate most closely related to the data. Swaths are shown per domain as hard boundary domained estimation is performed.
| |
| RESOURCE | RESERVE | VALUE |
Blyvoor Gold Resources (Pty) Ltd
S-K 1300 Technical Report Summary on the Blyvoor Gold Mine, South Africa | 48 |
The swaths for Middelvlei Reef, do show under estimation relative to data, particularly in a West-east swath direction (swaths in Y). This smoothing can be attributed to distinct north south trends of isolated narrow pay shoots associated with the Middelvlei Reef. In Whitaker’s 2016 CPR document, the underestimation of the Mineral Resource estimates is attributed to the lenticular nature of the orebody, oblique direction of the pay shoot compared to swath direction and the selective mining which has taken place, resulting in preferential sampling of high-grade areas. The swaths are generated at an oblique angle to the pay shoots and will thus show a mixture of high-grade data with a larger low-grade area and vice versa. In addition, it is recommended that more detailed domaining is undertaken for Middelvlei Reef, historically higher resolution domains were defined for Middelvlei Reef, this can be reviewed, this may help alleviate the mixing of high and low-grade areas that is apparent in the swaths.
The Swaths for Carbon Leader agree well with the original data, with some smoothing noticeable. The Carbon Leader swaths display a better correlation to data than is seen for Middelvlei, this is attributed to the more numerous domains defined for Carbon Leader which separates corridors of similar grade. While the Middelvlei Reef consists of larger domains which contain localised areas of very high or very low grade, which combined with the larger domains, and swaths at oblique angles may show some over smoothing relative to data.
The QP undertook an initial assessment of the mineralised body to determine the reasonable prospects of eventual economic extraction (“RPEEE”).
Economic, metallurgical, and mining parameters were used to derive the pay limit. The parameters are tabulated in Table 7. The gold price utilised is the 90% percentile of the real term gold price since 1980. The MCF and costs are the reserve cut-off costs and MCF but with a 10% improvement to account for potential improvements in future.
Table 7: Pay Limit Derivation Factors
| Description | Unit | Value 2023 |
| Gold Price | USD/oz | 1,850 |
| Exchange Rate | ZAR/USD | 17.50 |
| Gold Price | ZAR/kg | 1,040,881 |
| Stoping Width | cm | 117 |
| Operating Cost | ZAR/milled tonne | 2,039 |
| Dilution | % | 0 |
| MCF | % | 80 |
| PRF | % | 94.5 |
| Cut-off | cm.g/t | 300 |
All underground Mineral Resources are stated at a pay limit of 300 cm.g/t. The QP deems the total Mineral Resource as stated in this TRS to have RPEEE.
| III. | Mineral Resource Classification |
The extent of the 15 m x15 m estimate was employed as the Measured model, the extents of the 30 m x 30 m regularised model as the Indicated model, whilst the remainder of the facies as informed by the 60 m x 60 m was defined as Inferred. All three models per reef were then added together to generate final reef block models. The extent of the classification compared very well with the previous classification employed at Blyvoor, with minor changes where data was corrected and removed. The Mineral Resource classification for the Carbon Leader is depicted in Figure 18.
| |
| RESOURCE | RESERVE | VALUE |
Blyvoor Gold Resources (Pty) Ltd
S-K 1300 Technical Report Summary on the Blyvoor Gold Mine, South Africa | 49 |
Figure 18: The Mineral Resource Classification for the Carbon Leader Reef
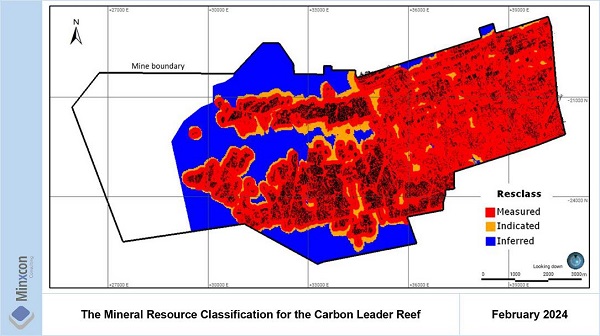
The Mineral Resource classification for the Middelvlei is depicted in Figure 19.
Figure 19: The Mineral Resource Classification for the Middelvlei Reef
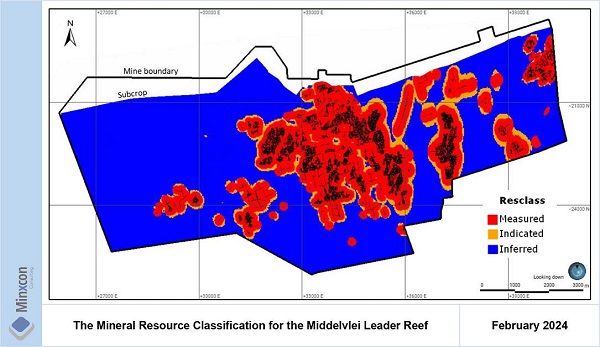
| IV. | Mineral Resource Statement |
Two-dimensional polygons representing unmined areas and remnant pillars were used to deplete the block models. All unmined ground was classified as ‘Mineable’ or ‘BP’ (Boundary Pillar) in the block models. In addition, new 2D polygons representing new mining up until 29 February 2024 were provided by Blyvoor
| |
| RESOURCE | RESERVE | VALUE |
Blyvoor Gold Resources (Pty) Ltd
S-K 1300 Technical Report Summary on the Blyvoor Gold Mine, South Africa | 50 |
Mine and used to deplete the block models and classified as ‘Mined’. Microsoft Excel™ was used to tabulate the resources; only blocks classified as ‘Mineable’ were reported as Mineral Resources. Blocks with an area of less than 250 m2 were excluded from the Mineral Resource.
The reporting of Mineral Resources made use of the Mineral Resource Classification derived from the block model to define resource categories. Minxcon determined area and gold accumulation per estimated block (15 m X 15 m) and determined if the block was above cut-off per individual block. A mean dip correction factor representing a global mean dip of 22°was utilised to calculate a true dip related polygon area. A diluted stoping width of 117 cm was applied to calculate a true volume per polygon and a mean Specific Gravity (“SG”) of 2.737 t/m³ was utilised to convert the volume to tonnes. The SG of 2.737 t/m³ is based upon historical Blyvooruitzicht laboratory testwork. A degree of geological loss is already accounted for in the blocking process, where geological losses attributable to faulting and intrusives are excluded. An additional geological loss of 5% for Measured, 10% for indicated and 15% for Inferred Mineral Resource Categories is applied to the Mineral Resource. These geological losses would take cognisance of any further unforeseen faulting and possible pillars that would be required.
The Mineral Resources are report as inclusive and exclusive of Mineral Reserves and are 74% attributable to Blyvoor Resources.
The Mineral Resources for the Carbon Leader Reef for Blyvoor Mine as of 29 February 2024 are presented in Table 8 (Inclusive of Mineral Reserves) and Table 10 (Excluding Mineral Reserves).
Table 8: Attributable Mineral Resources Inclusive of Mineral Reserves for the Carbon Leader Reef for Blyvoor Mine as at 29 February 2024
Mineral Resource
Classification | Stope Width | Stope Tonnes | Stope Grade | Stope Content | Gold Content |
| cm | Mt | g/t | cm.g/t | kg | Moz |
| Measured | 117 | 12.09 | 10.76 | 1,259 | 130,102 | 4.18 |
| Indicated | 117 | 1.79 | 8.72 | 1,021 | 15,620 | 0.50 |
| Total M&I | 117 | 13.88 | 10.50 | 1,228 | 145,722 | 4.69 |
Mineral Resource
Classification | Stope Width | Stope Tonnes | Stope Grade | Stope Content | Gold Content |
| cm | Mt | g/t | cm.g/t | kg | Moz |
| Inferred | 117 | 6.56 | 8.37 | 979 | 54,917 | 1.77 |
Notes:
| 1. | Mineral Resources are reported at a 300 cm.g/t (2.56 g/t over 117 cm stoping width equivalent) pay limit. |
| 2. | Depletions were applied. |
| 3. | Boundary pillars were excluded from the Mineral Resources, reported inclusive of internal pillars and shaft pillars. |
| 4. | A geological loss of 5% for Measured, 10% for Indicated and 15% for Inferred Mineral Resources has been applied. |
| 5. | Mineral Resources are 74% attributable to Blyvoor Resources and occur within the mining right perimeter. |
| 6. | Mineral Resources are Inclusive of Mineral Reserves. |
| |
| RESOURCE | RESERVE | VALUE |
Blyvoor Gold Resources (Pty) Ltd
S-K 1300 Technical Report Summary on the Blyvoor Gold Mine, South Africa | 51 |
Table 9: Attributable Mineral Resources Exclusive of Mineral Reserves for the Carbon Leader Reef for Blyvoor Mine as at 29 February 2024
Mineral Resource
Classification | Stope Width | Stope Tonnes | Stope Grade | Stope Content | Gold Content |
| cm | Mt | g/t | cm.g/t | kg | Moz |
| Measured | 117 | 2.21 | 8.57 | 1,002 | 18,963 | 0.61 |
| Indicated | 117 | 0.27 | 3.15 | 368 | 835 | 0.03 |
| Total M&I | 117 | 2.48 | 7.99 | 935 | 19,799 | 0.64 |
Mineral Resource
Classification | Stope Width | Stope Tonnes | Stope Grade | Stope Content | Gold Content |
| cm | Mt | g/t | cm.g/t | kg | Koz |
| Inferred | 117 | 6.56 | 8.37 | 979 | 54,917 | 1.77 |
Notes:
| 1. | Mineral Resources are reported at a 300 cm.g/t (2.56 g/t over 117 cm stoping width equivalent) pay limit. |
| 2. | Depletions were applied. |
| 3. | Boundary pillars were excluded from the Mineral Resources, reported inclusive of internal pillars and shaft pillars. |
| 4. | A geological loss of 5% for Measured, 10% for Indicated and 15% for Inferred Mineral Resources has been applied. |
| 5. | Mineral Resources are 74% attributable to Blyvoor Resources and occur within the mining right perimeter. |
| 6. | Mineral Resources are Exclusive of Mineral Reserves. |
The Mineral Resources for the Middelvlei Reef for Blyvoor Mine as of 29 February 2024 are presented in Table 10 (Inclusive of Mineral Reserves) and Table 11 (Excluding Mineral Reserves).
Table 10: Attributable Mineral Resources Inclusive of Mineral Reserves for the Middelvlei Reef for Blyvoor Mine as at 29 February 2024
Mineral Resource
Classification | Stope Width | Stope Tonnes | Stope Grade | Stope Content | Gold Content |
| cm | Mt | g/t | cm.g/t | kg | Moz |
| Measured | 117 | 18.69 | 5.05 | 591 | 94,461 | 3.04 |
| Indicated | 117 | 4.23 | 4.62 | 541 | 19,553 | 0.63 |
| Total M&I | 117 | 22.93 | 4.98 | 582 | 114,013 | 3.67 |
Mineral Resource
Classification | Stope Width | Stope Tonnes | Stope Grade | Stope Content | Gold Content |
| cm | Mt | g/t | cm.g/t | kg | Moz |
| Inferred | 117 | 52.24 | 3.90 | 456 | 203,837 | 6.55 |
Notes:
| 1. | Mineral Resources are reported at a 300 cm.g/t (2.56 g/t over 117 cm stoping width equivalent) pay limit. |
| 2. | Depletions were applied. |
| 3. | Boundary pillars were excluded from the Mineral Resources, reported inclusive of internal pillars and shaft pillars. |
| 4. | A geological loss of 5% for Measured, 10% for Indicated and 15% for Inferred Mineral Resources has been applied. |
| 5. | All Mineral Resources are 74% attributable to Blyvoor Resources and occur within the mining right perimeter. |
| 6. | Mineral Resources are Inclusive of Mineral Reserves. |
| |
| RESOURCE | RESERVE | VALUE |
Blyvoor Gold Resources (Pty) Ltd
S-K 1300 Technical Report Summary on the Blyvoor Gold Mine, South Africa | 52 |
Table 11: Attributable Mineral Resources Exclusive of Mineral Reserves for the Middelvlei Reef for Blyvoor Mine as at 29 February 2024
Mineral Resource
Classification | Stope Width | Stope Tonnes | Stope Grade | Stope Content | Gold Content |
| cm | Mt | g/t | cm.g/t | kg | Moz |
| Measured | 117 | 9.04 | 3.80 | 445 | 34,393 | 1.11 |
| Indicated | 117 | 2.48 | 3.48 | 407 | 8,643 | 0.28 |
| Total M&I | 117 | 11.52 | 3.75 | 439 | 43,036 | 1.38 |
Mineral Resource
Classification | Stope Width | Stope Tonnes | Stope Grade | Stope Content | Gold Content |
| cm | Mt | g/t | cm.g/t | kg | Moz |
| Inferred | 117 | 52.24 | 3.90 | 456 | 203,837 | 6.55 |
Notes:
| 1. | Mineral Resources are reported at a 300 cm.g/t (2.56 g/t over 117 cm stoping width equivalent) pay limit. |
| 2. | Depletions were applied. |
| 3. | Boundary pillars were excluded from the Mineral Resources, reported inclusive of internal pillars and shaft pillars. |
| 4. | A geological loss of 5% for Measured, 10% for Indicated and 15% for Inferred Mineral Resources has been applied. |
| 5. | Mineral Resources are 74% attributable to Blyvoor Resources and occur within the mining right perimeter. |
| 6. | Mineral Resources are Exclusive of Mineral Reserves. |
The Combined total Mineral Resources for Blyvoor Mine as at 29 February 2024 are presented in Table 12 (Inclusive of Mineral Reserves) and Table 13 (Excluding Mineral Reserves).
Table 12: Combined Total Attributable Mineral Resources Inclusive of Mineral Reserves for Blyvoor Mine as at 29 February 2024
Mineral Resource
Classification | Stope Width | Stope Tonnes | Stope Grade | Stope Content | Gold Content |
| cm | Mt | g/t | cm.g/t | kg | Moz |
| Measured | 117 | 30.79 | 7.29 | 853 | 224,563 | 7.22 |
| Indicated | 117 | 6.02 | 5.84 | 683 | 35,172 | 1.13 |
| Total M&I | 117 | 36.81 | 7.05 | 825 | 259,735 | 8.35 |
Mineral Resource
Classification | Stope Width | Stope Tonnes | Stope Grade | Stope Content | Gold Content |
| cm | Mt | g/t | cm.g/t | kg | Moz |
| Inferred | 117 | 58.81 | 4.40 | 515 | 258,754 | 8.32 |
Notes:
| 1. | Mineral Resources are reported at a 300 cm.g/t (2.56 g/t over 117 cm stoping width equivalent) pay limit. |
| 2. | Depletions were applied. |
| 3. | Boundary pillars were excluded from the Mineral Resources, reported inclusive of internal pillars and shaft pillars. |
| 4. | A geological loss of 5% for Measured, 10% for Indicated and 15% for Inferred Mineral Resources has been applied. |
| 5. | All Mineral Resources are 74% attributable to Blyvoor Resources and occur within the mining right perimeter. |
| 6. | Mineral Resources are Inclusive of Mineral Reserves. |
| |
| RESOURCE | RESERVE | VALUE |
Blyvoor Gold Resources (Pty) Ltd
S-K 1300 Technical Report Summary on the Blyvoor Gold Mine, South Africa | 53 |
Table 13: Combined Total Attributable Mineral Resources Exclusive of Mineral Reserves for Blyvoor Mine as at 29 February 2024
Mineral Resource
Classification | Stope Width | Stope Tonnes | Stope Grade | Stope Content | Gold Content |
| cm | Mt | g/t | cm.g/t | kg | Moz |
| Measured | 117 | 11,25 | 4,74 | 555 | 53 356 | 1,72 |
| Indicated | 117 | 2,75 | 3,45 | 403 | 9 478 | 0,30 |
| Total M&I | 117 | 14,00 | 4,50 | 526 | 62 834 | 2,02 |
Mineral Resource
Classification | Stope Width | Stope Tonnes | Stope Grade | Stope Content | Gold Content |
| cm | Mt | g/t | cm.g/t | kg | Moz |
| Inferred | 117 | 58.81 | 4.40 | 515 | 258,754 | 8.32 |
Notes:
| 1. | Mineral Resources are reported at a 300 cm.g/t (2.56 g/t over 117 cm stoping width equivalent) pay limit. |
| 2. | Depletions were applied. |
| 3. | Boundary pillars were excluded from the Mineral Resources, reported inclusive of internal pillars and shaft pillars. |
| 4. | A geological loss of 5% for Measured, 10% for Indicated and 15% for Inferred Mineral Resources has been applied. |
| 5. | Mineral Resources are 74% attributable to Blyvoor Resources and occur within the mining right perimeter. |
| 6. | Mineral Resources are Exclusive of Mineral Reserves. |
Item 11 (b) - Individual Grade of Metals
Mineral Resources for gold were estimated for the Blyvoor Gold Mine. No other metals or minerals were estimated for the Project.
Item 11 (c) - Factors Affecting Mineral Resource Estimates
No socio-economic, legal, or political modifying factors were taken into account in the estimation of Mineral Resources for Blyvoor Gold Mine. QPs are not aware of any known environmental, permitting, legal, title, taxation, socio-economic, marketing, and political or other factors that will materially affect the Mineral Resource estimates.
All underground Mineral Resources are stated at a pay limit of 300 cm.g/t. Both the Carbon Leader and Middelvlei reefs have extensively been mined in the past at Blyvoor Mine. The QPs are of the opinion that there is sufficient data density and confidence in the data over Blyvoor Mine to define Measured, Indicated and Inferred Mineral Resources.
| |
| RESOURCE | RESERVE | VALUE |
Blyvoor Gold Resources (Pty) Ltd
S-K 1300 Technical Report Summary on the Blyvoor Gold Mine, South Africa | 54 |
ITEM 12 - MINERAL RESERVE ESTIMATES
Item 12 (a) - Key Assumptions, Parameters and Methods
The LoM planning was completed in line with current operational planning to produce 80 ktpm of ore tonnes feed to plant. Only diluted Indicated and Measured Mineral Resources in the LoM plan were considered for conversion to Mineral Reserves. LoM as referred to in this TRS is remaining at 29 February 2024.
Inferred Mineral Resources were excluded from the economic assessment for Mineral Reserve estimates. The LoM plan aims to produce 80 ktpm of ore tonnes feed to plant from Measured and Indicated Mineral Resources only.
The LoM plan was developed utilising the 2D Mineral Resource model, estimates as completed by Minxcon. The mine design and scheduling utilise the updated 2024 Mineral Resource model.
The 2D block model within the MR143GP lease area and proposed mining areas is illustrated in Item 11 (a). The Carbon Leader Reef has been mined extensively. The Middelvlei Reef has been exposed to some mining activities, however the area contains additional resources to be extracted, while taking cognisance of economic parameters.
The initial mine planning files provided by Blyvoor Gold to Minxcon were in the form of manual paper drawn mine plans. These plans were scanned, the existing development and panels digitised in ArcGIS software and converted into the local coordinate system WG27. The mine design utilised the existing development and panels as mined-out areas, which were digitised and used as a starting point for new development. Blyvoor Gold provided a detailed LoM plan and schedule utilising Blyvoor’s determined mine design criteria; this plan was duplicated by Minxcon in the design process and sequencing logic.
The design process involved LoM planning and scheduling completed in Surpac and MineSched software reporting production outputs, and Mineral Resource categories from the 2D model used to report the Mineral Resource. The production schedule output is reported as in situ Mineral Resources within the mine plan. The extraction of these Mineral Resources is adjusted by applying modifying factors to estimate the actual grade and gold content delivered to the processing facility.
A cut-off of 496 cm.g/t for both the Carbon Leader Reef and Middelvlei Reef has been used to determine the mining areas to be included in the LoM plan, the design used the previous cut-off and did not update the cut-off. The assumptions and calculation to determine the cut-off are detailed in Table 14.
Table 14: Cut-off Calculation
| Description | Unit | Value 2023 |
| Gold Price | USD/oz | 1,650 |
| Exchange Rate | ZAR/USD | 17.50 |
| Gold Price | ZAR/kg | 928,353 |
| Stoping Width | cm | 117 |
| Operating Cost | ZAR/milled tonne | 2,266 |
| Sundries Dilution | % | 12.8 |
| Discrepancies | % | 10.4 |
| MCF | % | 75% |
| PRF | % | 95% |
| Cut-off | cm.g/t | 496 |
| |
| RESOURCE | RESERVE | VALUE |
Blyvoor Gold Resources (Pty) Ltd
S-K 1300 Technical Report Summary on the Blyvoor Gold Mine, South Africa | 55 |
Mineral Reserve conversion factors are the consideration of mining factors used to convert Mineral Resources to Mineral Reserves. These factors are applied to adjust the in situ Mineral Resources in the LoM planning to realistic and accurate mill feed, volumes, and grade. The Mineral Reserve conversion factors applied to the Mineral Resources in the LoM plan, are detailed in Table 15. All Mineral Reserve conversion factors have been applied equally to the Carbon Leader and Middelvlei Reefs.
Table 15: Mineral Reserve Conversion Factors Summary
| Description | Units | Conventional Mining | SBM Mining |
| Geological Losses (applied to Mineral Resources) | | | |
| Measured | % | 5 | 5 |
| Indicated | % | 10 | 10 |
| Inferred | % | 15 | 15 |
| Pillar Provision and Mining Extraction | | | |
| Pillar Provision | % | 5 | 15 |
| Mining Extraction | % | 0 | 80 |
| Dilution | | | |
| Sundries Dilution | % | 12.4 | 32.8 |
| Discrepancy Dilution | % | 10.8 | 22.6 |
| Mine Call Factor | | | |
| Mine Call Factor Year 1 | % | 70 | 70 |
| Mine Call Factor Year 2 | % | 75 | 75 |
| Mine Call Factor Year 3 onward | % | 80 | 80 |
Notes:
| 1. | The Mineral Reserve conversion factors are applied to individual mining blocks within the mining schedule. |
| 2. | Pillar Provision has been applied to all polygon estimation mining block in the schedule. |
| 3. | Mining extraction has been applied to all polygon estimation mining blocks in the schedule. |
The following additional factors were considered:-
| ● | Processing and Metallurgical: The plant with a RoM capacity of 40 ktpm consists of crushing, ball milling, gravity concentration, leach and carbon-in-pulp, elution and gold room related circuits to produce gold doré. Tailings will be deposited onto the existing No. 6 TSF by means of daywall deposition. The by-month average grade of the total residue, for the twelve-month period ending February 2024, is 0.401 g/t. |
| ● | Infrastructure: No infrastructure constraints have been identified. |
| ● | Economic and Marketing: No economic factors affecting the Mineral Reserve have been identified. |
| ● | Legal, Environmental, Social and Governmental: No legal, environmental, social, and governmental factors affecting the Mineral Reserves have been identified. |
| IV. | Mineral Resource to Mineral Reserve Conversion |
All Mineral Reserves have been categorised and reported in accordance with the guidelines of §229.1302(e)(2) of S-K 1300. Only Indicated and Measured Mineral Resources in the LoM plan were considered for conversion to Mineral Reserves. Inferred Mineral Resources have been excluded from the LoM plan for economic assessment for Mineral Reserve estimates. Only diluted Measured and Indicated Mineral Resources have been converted into Proven and Probable Mineral Reserves. Mineral Reserves have been reported separately in the Proven and Probable Mineral Reserve categories. Inferred Mineral Resources have not been incorporated with the Proven and Probable Mineral Reserves.
The Mineral Resources as estimated by the QP as at 29 February 2024 were utilised for the updated 2024 Mineral Reserve estimation. The QP has depleted the previous Mineral Resources with updated mining faces to the period ending 29 February 2024.
| |
| RESOURCE | RESERVE | VALUE |
Blyvoor Gold Resources (Pty) Ltd
S-K 1300 Technical Report Summary on the Blyvoor Gold Mine, South Africa | 56 |
The depleted Mineral Resources as at 29 February 2024, was utilised with the 2024 LoM plan as detailed in Item 13 (b). The QP utilised the 29 February 2024 LoM plan with the depleted Mineral Resources to conduct an updated Mineral Reserve estimation, which accounts for the mining depletions from 29 February 2024.
A new mine design and schedule was conducted for the Mineral Reserve estimation as at 29 February 2024 as illustrated in Figure 20.
Figure 20: Diluted Life of Mine Production Schedule by Reef Classification (2024)

The Mineral Reserves for the Carbon Leader Reef for Blyvoor Mine as at 29 February 2024 are detailed in Table 16.
Table 16: Mineral Reserves for the Carbon Leader Reef for Blyvoor Mine as at 29 February 2024
Mineral Reserve
Classification | Delivered Grade | Delivered Tonnes | Delivered Au Content |
| g/t | Mt | kg | Moz |
| Mineral Reserves in LoM plan |
| Proved | 8.14 | 3.58 | 29,125.05 | 0.94 |
| Probable | 6.85 | 10.64 | 72,948.25 | 2.35 |
| Total | 7.18 | 14.22 | 102,073.30 | 3.28 |
| Mineral Reserves as 74% attributable to Blyvoor Resources | | |
| Proved | 8.14 | 2.65 | 21,552.54 | 0.69 |
| Probable | 6.85 | 7.88 | 53,981.71 | 1.74 |
| Total | 7.18 | 10.52 | 75,534.24 | 2.43 |
Notes:
| 1. | Mineral Reserves stated at a long term gold price of USD1,900/oz and a long term exchange rate of ZAR/USD 19.15. |
| 2. | Mineral Reserves are reported at a 496 cm.g/t cut-off grade applied. |
| 3. | Minimum remnant area of 1,000 m² applied. |
| 4. | Mining extraction of 80% applied to all remnants. |
| 5. | Pillar provision of 15% applied. |
| 6. | Stope width is the average SBM mining cut over a 117 cm mining width. |
The Mineral Reserves for the Middelvlei Reef for Blyvoor Mine as at 29 February 2024 are detailed in Table 17.
| |
| RESOURCE | RESERVE | VALUE |
Blyvoor Gold Resources (Pty) Ltd
S-K 1300 Technical Report Summary on the Blyvoor Gold Mine, South Africa | 57 |
Table 17: Mineral Reserves for the Middelvlei Reef for Blyvoor Mine 29 February 2024
Mineral Reserve
Classification | Delivered Grade | Delivered Tonnes | Delivered Au Content |
| g/t | Mt | kg | Moz |
| Mineral Reserves in LoM plan |
| Proved | 3.68 | 4.36 | 16,039.06 | 0.52 |
| Probable | 4.07 | 10.24 | 41,716.79 | 1.34 |
| Total | 3.95 | 14.61 | 57,755.85 | 1.86 |
| Mineral Reserves as 74% attributable to Blyvoor Resources |
| Proved | 3.68 | 3.23 | 11,868.91 | 0.38 |
| Probable | 4.07 | 7.58 | 30,870.42 | 0.99 |
| Total | 3.95 | 10.81 | 42,739.33 | 1.37 |
Notes:
| 1. | Mineral Reserves stated at a long term gold price of USD1,900/oz and a long term exchange rate of ZAR/USD 19.15. |
| 2. | Mineral Reserves are reported at a 496 cm.g/t cut-off grade applied. |
| 3. | Minimum remnant area of 1,000 m² applied. |
| 4. | Mining extraction of 80% applied to all remnants. |
| 5. | Pillar provision of 15% applied. |
| 6. | Stope width is the average SBM mining cut over a 117cm mining width. |
The combined total Mineral Reserves for Blyvoor Mine as at 29 February 2024 are presented in Table 18.
Table 18: Combined Total Mineral Reserves for Blyvoor Mine as at 29 February 2024
Mineral Reserve
Classification | Delivered Grade | Delivered Tonnes | Delivered Au Content |
| g/t | Mt | kg | Moz |
| Mineral Reserves in LoM plan | |
| Proved | 5.69 | 7.94 | 45,164.11 | 1.45 |
| Probable | 5.49 | 20.89 | 114,665.04 | 3.69 |
| Total | 5.54 | 28.83 | 159,829.15 | 5.14 |
| Mineral Reserves as 74% attributable to Blyvoor Resources | | |
| Proved | 5.69 | 5.88 | 33,421.44 | 1.07 |
| Probable | 5.49 | 15.46 | 84,852.13 | 2.73 |
| Total | 5.54 | 21.33 | 118,273.57 | 3.80 |
Notes:
| 1. | Mineral Reserves stated at a long term gold price of USD1,900/oz and a long term exchange rate of ZAR/USD 19.15. |
| 2. | Mineral Reserves are reported at a 496 cm.g/t cut-off grade applied. |
| 3. | Minimum remnant area of 1,000 m² applied. |
| 4. | Mining extraction of 80% applied to all remnants. |
| 5. | Pillar provision of 15% applied. |
| 6. | Stope width is the average SBM mining cut over a 117 cm mining width. |
Mineral Resources from the Measured and Indicated Mineral Resource Classifications were converted into Proven and Probable Mineral Reserves. The Mineral Reserve estimate consists of 28% Proven and 72% Probable Mineral Reserves on a gold content basis.
It is important to note that the “Mineral Resources Exclusive” + “Mineral Reserves” will not add up to “Mineral Resources Inclusive”. Mineral Reserve conversion factors (modifying factors) have been applied to the Mineral Resources in the LoM Plan to determine the “Mineral Reserves”, which are not applied to Mineral Resources not in the LoM Plan (“Exclusive”).
| V. | Mineral Resource to Mineral Reserve Reconciliation |
The Measured and Indicated Mineral Resources (Inclusive) are detailed in Table 19, while the Measured and Indicated Mineral Resources (Exclusive) are detailed in
Table 20. The difference between the Inclusive Mineral Resources and the Exclusive Mineral Resources is that the Exclusive Mineral Resources excludes the Mineral Resource utilised in LoM Plan.
| |
| RESOURCE | RESERVE | VALUE |
Blyvoor Gold Resources (Pty) Ltd
S-K 1300 Technical Report Summary on the Blyvoor Gold Mine, South Africa | 58 |
Table 19: Combined Mineral Resources for the Blyvoor Mine as at 29 February 2024 (Inclusive)
Mineral Resource Classification | Mineral Resources | 74% attributable to Blyvoor Resources |
Stope Grade | Stope Tonnes | Gold Content | Stope Grade | Stope Tonnes | Gold Content |
| g/t | Mt | kg | Moz | g/t | Mt | kg | Moz |
| Measured | 7.29 | 41.60 | 303,463 | 9.76 | 7.29 | 30.79 | 224,563 | 7.22 |
| Indicated | 5.84 | 8.14 | 47,530 | 1.53 | 5.84 | 6.02 | 35,172 | 1.13 |
| Total M&I | 7.05 | 49.74 | 350,993 | 11.28 | 7.06 | 36.81 | 259,735 | 8.35 |
Table 20: Combined Mineral Resources for the Blyvoor Mine as at 29 February 2024 (Exclusive)
Mineral Resource Classification | Mineral Resources | 74% attributable to Blyvoor Resources |
Stope Grade | Stope Tonnes | Gold Content | Stope Grade | Stope Tonnes | Gold Content |
| g/t | Mt | kg | Moz | g/t | Mt | kg | Moz |
| Measured | 4,74 | 15.21 | 72 103 | 2.32 | 4,74 | 11.25 | 53 356 | 1.72 |
| Indicated | 3,45 | 3.71 | 12 808 | 0.41 | 3,45 | 2.75 | 9 478 | 0.30 |
| Total M&I | 4,50 | 18.92 | 84 911 | 2.73 | 4,50 | 14.00 | 62 834 | 2.02 |
The Measured and Indicated Mineral Resources with geological losses applied (In LoM Plan) are detailed in Table 21.
Table 21: Combined Mineral Resources for the Blyvoor Mine as at 29 February 2024 (In Life of Mine Plan)
Mineral Resource Classification | Mineral Resources | 74% attributable to Blyvoor Resources |
Stope Grade | Stope Tonnes | Gold Content | Stope Grade | Stope Tonnes | Gold Content |
| g/t | Mt | kg | Moz | g/t | Mt | kg | Moz |
| Measured | 8.77 | 26.40 | 231,360 | 7.44 | 8.77 | 19.53 | 171,207 | 5.50 |
| Indicated | 7.85 | 4.42 | 34,722 | 1.12 | 7.85 | 3.27 | 25,694 | 0.83 |
| Total M&I | 8.63 | 30.82 | 266,082 | 8.56 | 8.63 | 22.81 | 196,901 | 6.33 |
The reason for the Mineral Resources (LoM) not utilising the total Mineral Resources, is due to the application of a 5 km radius distance constraint from the PS Shaft as well as the application of a Mineral Reserve cut-off of 496 cm.g/t which is higher than the Mineral Resource cut-off grade of 300 cm.g/t.
The Proved and Probable Mineral Reserves are detailed in Table 22. Mineral Reserve conversion factors are applied to convert the Mineral Resources utilised in the LoM Plan in Table 21 to the Mineral Reserves in Table 22.
Table 22: Combined Mineral Reserves for Blyvoor Mine as at 29 February 2024
Mineral Reserve Classification | Mineral Reserves | 74% attributable to Blyvoor Resources |
Delivered Grade | Delivered Tonnes | Delivered Au Content | Delivered Grade | Delivered Tonnes | Delivered Au Content |
| g/t | Mt | kg | Moz | g/t | Mt | kg | Moz |
| Proved | 5.69 | 7.94 | 45,164 | 1.45 | 5.69 | 5.88 | 33,421 | 1.07 |
| Probable | 5.49 | 20.89 | 114,665 | 3.69 | 5.47 | 15.46 | 84,852 | 2.73 |
| Total | 5.54 | 28.83 | 159,829 | 5.14 | 5.54 | 21.33 | 118,274 | 3.80 |
| |
| RESOURCE | RESERVE | VALUE |
Blyvoor Gold Resources (Pty) Ltd
S-K 1300 Technical Report Summary on the Blyvoor Gold Mine, South Africa | 59 |
Tonnes - The Mineral Reserve tonnes are less than the Mineral Resource utilised in the Life of Mine Plan tonnes due to the application of the Pillar Provision factor and the Mining Extraction factor. The Reserve tonnes are increased (diluted) with additional waste by applying Dilution factors.
Grade - The Mineral Reserve grade is lower than the Mineral Resource utilised in the Life of Mine Plan grade due to the application of the Mine Call Factor and the application of Dilution factors.
Content - The Mineral Reserve gold content is less than the Mineral Resource utilised in the Life of Mine Plan gold content due to the application of the Mine Call Factor, Mining Extraction factor and the Pillar Provision factor.
Item 12 (b) - Multiple Commodity Reserve
Gold is the only commodity within the Blyvoor mining areas that is present in significant concentrations.
Item 12 (c) - Factors Affecting Mineral Reserve Estimation
No socio-economic, legal or political modifying factors have been taken into account in the estimation of Mineral Reserves for the Blyvoor Mine. The QPs are not aware of any known environmental, permitting, legal, title, taxation, socio-economic, marketing, and political or other factors that will materially affect the Mineral Reserve estimates. No material issues have been identified for the Blyvoor Mine.
The Mineral Reserve conversion factors detailed in Table 15 were applied to the Mineral Resource for conversion to Mineral Reserves. The classification of Mineral Reserves can be affected by changes in the status of the factors. In particular, the gold price will affect the viability of the mineralised target.
| |
| RESOURCE | RESERVE | VALUE |
Blyvoor Gold Resources (Pty) Ltd
S-K 1300 Technical Report Summary on the Blyvoor Gold Mine, South Africa | 60 |
ITEM 13 - MINING METHODS
The mining strategy for the Blyvoor Mine is to extract both the Carbon Leader Reef and Middelvlei Reef utilising the PS Shaft Complex through conventional mining method and Selective Bench Mining (“SBM”). The current workings were re-opened or opening up development with reequipping has been done and will continue whilst mining.
Beginning in March 2026, SBM will constitute 25% of the mining on the Carbon Leader reef, which corresponds to approximately two crews per level.
Re-opening of existing haulages, cross-cuts, travelling ways, orepasses and raises and refers to existing development to be established. The haulages and other access ways require assessing, repair and replacement of support according to the Blyvoor Mine standard. The cleaning of haulage drains to allow flow of water and the replacement of old and sub-standard rails and sleepers may be required. The replacement or repair of services may also be required. This includes the replacement or repair of water supply and pumping columns, main level haulages and cross-cut isolation valves, power supply cables and circuit breakers.
All new development ends that are required will be developed by conventional methods. The required development consists of footwall drives, crosscuts, traveling ways, raises and orepasses. A basic layout of the development is illustrated in Figure 21.
Figure 21: Development Design
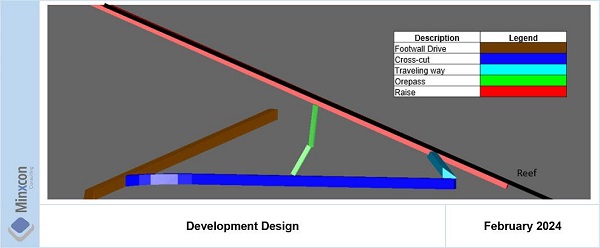
The footwall drive/haulage is an underground entry or passageway that is designed for the transport of personnel or equipment from the shaft towards the underground workings and transporting the ore towards the shaft. The footwall drives are developed off-reef. From the footwall drive, a crosscut is developed horizontally perpendicular to the drive and towards the orebody. Once the reef is intersected, a horizontal reef drive is installed along the strike of the orebody. A traveling way is also developed from the crosscut towards the orebody to provide entry exclusively for personnel to travel from the crosscut into the workings. A raise is developed on-reef from the reef drive following the dip of the orebody from one level towards the next to provide access to the stoping panels for men and materials and for the extraction of ore. A raise
| |
| RESOURCE | RESERVE | VALUE |
Blyvoor Gold Resources (Pty) Ltd
S-K 1300 Technical Report Summary on the Blyvoor Gold Mine, South Africa | 61 |
follows the line (dip) of the reef connecting one working level to another. An orepass is located between two operating levels and allows gravitational movement of ore from a higher mining location to the level below, namely the on-reef raise to the crosscut, from where it will be transported to the shaft and hoisted to surface.
The mining method that will be employed at the PS Shaft Complex will be by conventional stoping. The conventional stoping consists of a stoping width of 117 cm and a panel length of 25 m. Conventional mining is a mining method whereby the drilling is conducted by means of handheld drills. The cleaning of the stopes is conducted by face, strike gully and centre gully scraping into orepasses that are connected to the underlying cross-cut.
| IV. | Selective Bench Mining |
The SBM consists of a stoping width of 117 cm and a panel length of 25 m. SBM (Blast 1 & Blast 2 separately) makes use of 2 blasts to separate the valuable reef material from waste rock in the blasting operation at the stope faces in the mining of tabular ore bodies. In bench mining or SBM, the waste rock is blasted separately by creating a ’secondary footwall’ above or below the reef and advancing the blast in the waste region by one meter per blast. The reef above the true footwall or below the hanging wall is then lifted or dropped and collected. The ore is shattered but not displaced and only the reef material is transported to the surface. The principle of this mining method is stowing or packing of waste material in the mined-out area behind the advancing stope face. A schematic representation of SBM stoping is illustrated in Figure 22.
Figure 22: Schematic Representation of SBM Stoping
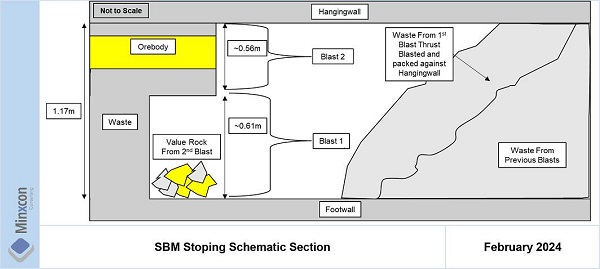
Item 13 (a) - Parameters Relevant to Mine Design
| I. | Geotechnical and Hydrological Parameters |
The mining operation has historically been mined through conventional mining methods. Rock engineering and seismic monitoring services for Blyvooruitzicht Gold Mine were undertaken by OHMS between 2003 and 2013. During these years it was established that most seismic events are mainly associated with major geological features.
| |
| RESOURCE | RESERVE | VALUE |
Blyvoor Gold Resources (Pty) Ltd
S-K 1300 Technical Report Summary on the Blyvoor Gold Mine, South Africa | 62 |
The rock mass characteristics are not unique to Blyvoor. The adjacent mines that mine at similar and greater depths, experience similar and more severe response characteristics.
The Blyvoor Rock Engineer determined that mining of remnants and stabilising pillars require specific rock engineering strategies which considers the mining layout, mining method and support designs. It is envisaged that the mining of remnants will be associated with geological structures and potential poor ground conditions, which will require additional development to re-establish the mining faces.
Currently Carbon Leader Reef is supported, inter alia, with Rapid yield hydraulic props (“RYHP”). Stability Pillars are left adjacent to the active structures. Due to the high stress presence, opening up new development and re-opening up existing development will require various types of support, i.e., grouted long anchors, omni prop sets and arch sets.
The details pertaining to the Blyvoor support standard management is described in the RYHP’s New Standard document available from the Blyvoor Rock Engineering Department.
The geotechnical studies and work associated with remnant and pillar mining will be addressed by the Blyvoor Rock Engineer as data pertaining to underground structures and the ground conditions is obtained through reconnaissance and opening-up. This information will further inform the geotechnical model and support design requirements.
No new hydrological studies were undertaken for the targeted mining areas. There is an ingress of significant volumes of groundwater into the underground workings of the area (approximately 25 Ml/day). Neighbouring mines currently pump the water to surface. Blyvoor is flooded up to 10 m above 29 Level, above which water is not expected to rise since Harmony is pumping excess water to surface discharge to protect their downstream operations. Blyvoor Gold’s deeper levels will require dewatering before operations can continue at those depths, and provision has been made in the capital schedule for dewatering.
Blyvoor Mine has a detailed seismic management plan in place. The seismic management plan addresses the following parameters:-
| ● | delineation of geological structures; |
| ● | identification of hazardous geological structures; |
| ● | evaluation of mine design criteria; |
| ● | evaluation of mining sequences; |
| ● | controlled centralised blasting systems; and |
| ● | rock engineering analysis and recommendations. |
The details pertaining to the Blyvoor seismic management is described in the Blyvoor Mine Seismic Management document available from the Blyvoor Rock Engineering Department.
The institute of mine seismology (“IMS”) is currently monitoring the seismic activity on Blyvoor Mine and is currently providing Blyvoor Mine with morning, afternoon and daily reports.
| III. | Underground Access, Ore Flow and Material Handling |
PS Shaft, PSSV and No. 1A Sub-vertical orepass system will be used in the planned mining operations. The shaft system provides access to the current workings and to future workings. The No. 6 Shaft is utilised as a second egress to surface as per agreement with the current owner, CWC (subsidiary of Harmony). No. 6 Shaft is equipped to be capable of being utilised as a second egress. The general shaft layout for the greater Blyvoor mining area is illustrated in Figure 23.
| |
| RESOURCE | RESERVE | VALUE |
Blyvoor Gold Resources (Pty) Ltd
S-K 1300 Technical Report Summary on the Blyvoor Gold Mine, South Africa | 63 |
The current mining infrastructure, namely the existing main surface shaft (No. 5 PS Shaft), underground sub-shafts (No. 5A Sub-vertical PSSV Shaft and No. 1A Sub-vertical Shaft and orepass system, existing footwall drives and crosscuts will be utilised as access to the workings. All the existing excavations required to access the underground workings (stopes and development ends) have been, or will be, refurbished as necessary to provide safe access for men and material.
Men and material will be transported via PS Shaft and PSSV Shaft. Ore will be hoisted to 15 Level via cage hoisting, where the ore is then cross-trammed to PS Shaft and hoisted to surface. The re-establishment and extension of the 15-19 Level incline shaft to 21 Level will assist in reducing the cage-hoisting requirements within the PSSV shaft. Below 21 Level, ore will be transferred from active mining levels via a new orepass system to the newly established mid-shaft loading station at 27.5 Level in the PSSV.
Ore from 23 Level and 25 Level will initially be cage hoisted to 15 Level until the orepass system, between 23 Level and 25 Level to the current mid shaft loading arrangement on 27 Level, is completed.
Ore from 17 Level, 19 Level and 21 Level will be hoisted via an existing incline system between 19 Level and 15 Level. This ore will then be cross trammed to the existing ore handling arrangements and the PS shaft. The incline shaft is required to be furnished down to 19 Level and then deepened and equipped between 19 Level to 21 Level
Ore will be hoisted from the mid-shaft loading station on 27.5 Level to 14 LEvel and then transferred on 15 level to the PS shaft ore loading system to be hoisted to surface.
| |
| RESOURCE | RESERVE | VALUE |
Blyvoor Gold Resources (Pty) Ltd
S-K 1300 Technical Report Summary on the Blyvoor Gold Mine, South Africa | 64 |
Figure 23: Sectional Schematic of Blyvoor Shaft Systems
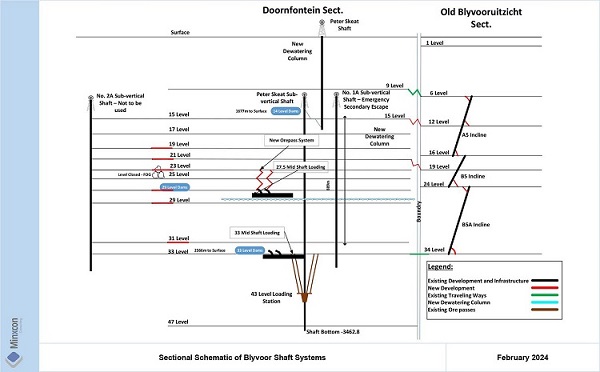
| |
| RESOURCE | RESERVE | VALUE |
Blyvoor Gold Resources (Pty) Ltd
S-K 1300 Technical Report Summary on the Blyvoor Gold Mine, South Africa | 65 |
| IV. | Ventilation and Cooling |
Blume Burton Engineering (Pty) Ltd (“BBE”) has since done a ventilation and cooling study. It has been indicated that cooling will be required as early as year 2. Provision has thus been made from their recommendations and cost estimations for cooling of the underground workings.
Up to 2013, prior to mine closure, the PS Shaft and Blyvooruitzicht No. 6 Shaft were ventilated by two surface fans handling approximately 400 m³/s. Both fans were in use to support mining at depths of +3,200 mbs. With the proximity of the working places relative to PSSV Shaft in regard to the initial years of the LoM plan, it is assumed that during the first four years of production, one fan delivering ±200 m³/s will be sufficient at production rates of 40 ktpm and a second ventilation fan will be required at 80 ktpm to ventilate and cool the underground workings.
Allowance has been made for nine air cooling units, each with a cooling capacity of 100 kW, which is sufficient for cooling six stoping panels. The air cooling units will be utilised to facilitate spot cooling between the working places as and where required whilst mining above 31 Level.
Item 13 (b) - Production Rates, Expected Mine Life, Mining Unit Dimensions, and Mining Dilution
The underground mining operation consists of one nine-hour shift per day for drilling and blasting activities. Cleaning activities are performed on a nine-hour night shift. The initial operational cycle, for mining areas in proximity of the shaft is detailed in Table 23.
Table 23: Underground Operation Shift Cycle
| Item | Unit | Value |
| Days per Month | Days | 23 |
| Shifts | Shifts | 2 |
| Hours per Shift | hours | 9 |
| Travelling Time In | min | 20 |
| Pre-shift Meeting | min | 10 |
| Pre-shift Check List | min | 15 |
| Post Production | min | 20 |
| Travelling Time Out | min | 20 |
| Total Non-productive shift time | hours | 1.42 |
| Total effective face time per shift | hours | 7.58 |
| Total effective face time per month | hours | 174.3 |
The operating cycle for the Blyvoor Mine consists of a single day shift for drilling and blasting activities. The effective face time per shift is 7.58 hours (7 hours and 35 minutes).
The typical mining cycle will be as follows:-
| ● | Dayshift – support, drill and blast; and |
| ● | Nightshift – clean, sweep and prepare the face for the dayshift activities. |
The planned development ends for the operation consists of footwall drives, crosscuts, on-reef drives, raises or winzes, ore passes and traveling ways. The proposed development rates are detailed in Table 24 for each development type, which are aligned to typical Wits rates and standards.
| |
| RESOURCE | RESERVE | VALUE |
Blyvoor Gold Resources (Pty) Ltd
S-K 1300 Technical Report Summary on the Blyvoor Gold Mine, South Africa | 66 |
Table 24: Planned Development Advance Rates
Description | Planned Advance Per Day | Planned Advance Per Month |
| m | m |
| Opening Up | 3.9 | 90 |
| Footwall Drive | 1.3 | 30 |
| Crosscut | 1.3 | 30 |
| Travelling Way | 0.7 | 15 |
| Reef Drives, Raises or Winzes | 0.9 | 20 |
| Orepass | 0.9 | 20 |
| Decline | 0.7 | 15 |
Stoping will be conducted on a single panel system for conventional mining. A practical and logical production ramp-up is planned to be utilised to allow for an appropriate increase in the number of active stopes over time. The stoping production parameters for conventional stoping and SBM are detailed in Table 25.
Table 25: Conventional Stoping and SBM Production Parameters
| Item | Unit | Conventional | SBM |
| Panel Length average | m | 25 | 25 |
| Stoping Width | m | 1.17 | 1.17 |
| Ore Cut | m | 1.17 | 0.56 |
| Face Advance | m/crew/month | 12.8 | 12.8 (two panels) |
| Square Meters Produced | m²/crew/month | 320 | 320 |
| Blasting Shifts | no/shift | 1.0 | 1 |
| Advanced Strike Gully | m | 1.4 m wide and 2.5 m high | 1.4 m wide and 2.5 m high |
| Tonnes Produced (Ore to Plant) | Tonnes/crew/month | 1,025 | 490 |
A LoM of approximately 34 years is envisaged, providing for the entire Mineral Reserves to be depleted. The Mineral Reserves includes only Measured and Indicated Mineral Resources. A one-year ramp up to approximately 20 ktpm has been planned. The steady state production ramp up rate is planned for seven years up to approximately 80 ktpm. The square meter production profile by Reef Category is illustrated in Figure 24.
Figure 24: Square Meter Production Profile by Reef Category
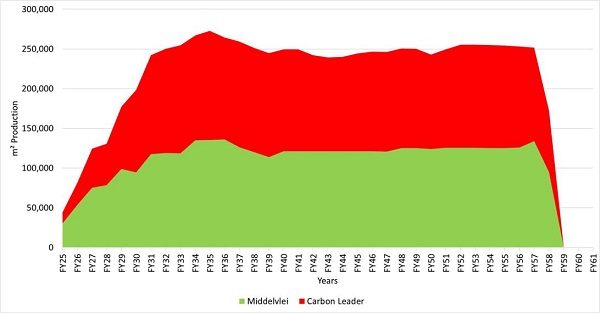
| |
| RESOURCE | RESERVE | VALUE |
Blyvoor Gold Resources (Pty) Ltd
S-K 1300 Technical Report Summary on the Blyvoor Gold Mine, South Africa | 67 |
The diluted LoM production schedule is illustrated in Figure 25.
Figure 25: Diluted Tonnes Delivered to Plant over Life of Mine
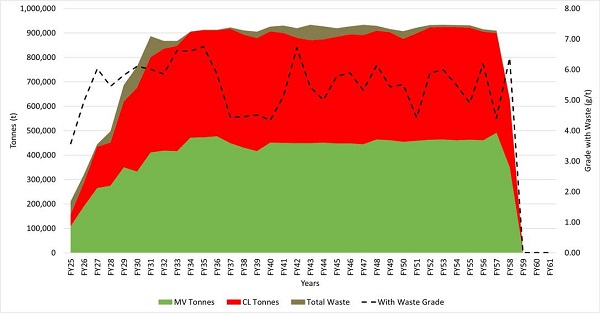
A total of 28.83 Mt of Measured and Indicated Mineral Resources at a grade of 5.54 g/t is included in the LoM plan. The content delivered to the plant from the Blyvoor Mine is illustrated in Figure 26.
Figure 26: Diluted Content Delivered to the Plant
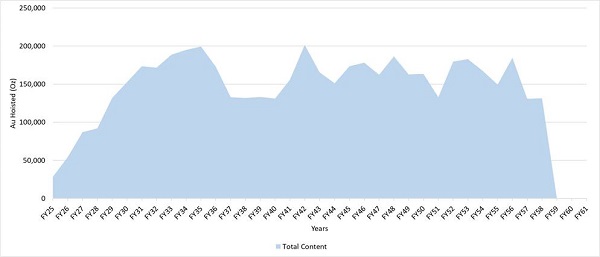
The LoM plan includes a total of 5.14 Moz of gold from the Measured and Indicated Mineral Resource classifications.
Blyvoor Mine planned pre- and post- intended listing LoM plans over 6 years is illustrated in Figure 27, and a clear ramp up in tonnes can be seen.
| |
| RESOURCE | RESERVE | VALUE |
Blyvoor Gold Resources (Pty) Ltd
S-K 1300 Technical Report Summary on the Blyvoor Gold Mine, South Africa | 68 |
Figure 27: Pre- and Post- Intended Listing Planned Tonnes over 6 Years
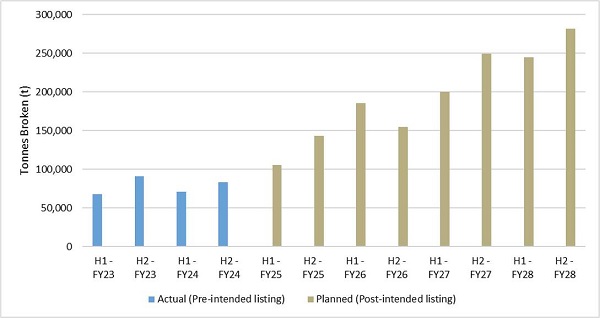
The gold planned pre- and post- intended listing for the 6-year LoM plan is illustrated in Figure 28 and Figure 29 respectively. A clear ramp-up can be seen in these figures.
Figure 28: Pre- and Post- Intended Listing Planned Gold over 6 Years in Kilograms
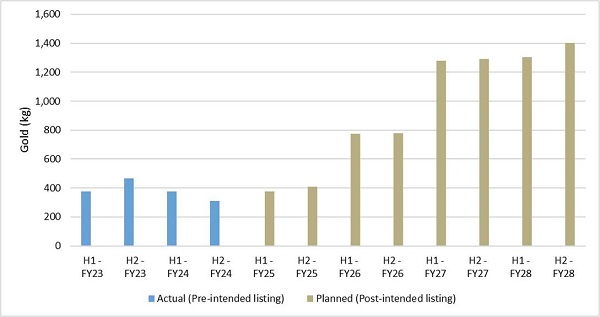
| |
| RESOURCE | RESERVE | VALUE |
Blyvoor Gold Resources (Pty) Ltd
S-K 1300 Technical Report Summary on the Blyvoor Gold Mine, South Africa | 69 |
Figure 29: Actual Gold Produced vs Planned Gold over 6 years in Ounces
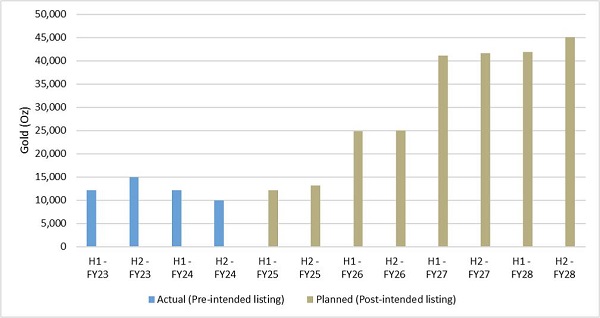
The pre- and post- intended listing planned MCF % are illustrated in Figure 30.
Figure 30: Actual MCF vs Planned MCF over 6 years
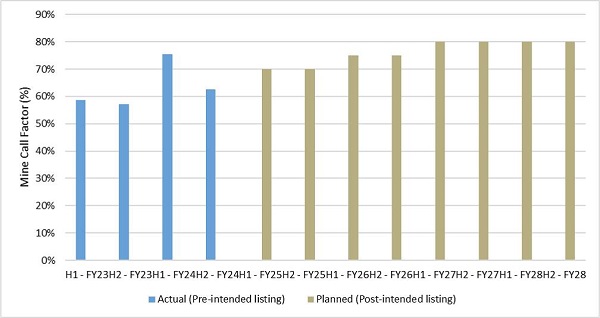
The development ends for the operation consist of footwall drives, crosscuts, on-reef drives, raises or winzes, orepasses and traveling ways. The design dimensions to be utilised underground are shown in Table 26.
| |
| RESOURCE | RESERVE | VALUE |
Blyvoor Gold Resources (Pty) Ltd
S-K 1300 Technical Report Summary on the Blyvoor Gold Mine, South Africa | 70 |
Table 26: Development Dimensions
Development End | Width | Height |
m | m |
| Footwall Drive | 3.0 | 3.4 |
| Crosscut | 3.0 | 3.4 |
| Travelling Way | 2.5 | 3.4 |
| Raise/Winze | 1.4 | 2.5 |
| Orepass | 2.0 | 2.0 |
| Decline | 5.0 | 4.0 |
The development parameters are summarised in Table 27.
Table 27: Development Parameters
| Description | Value |
| Footwall Drive Spacing | 80 m below reef in direction of strike. |
| Stations Spacing | 90 m vertical spacing. |
| Crosscut Spacing | Crosscuts are developed at right angles to the footwall drives and spaced at 160 m intervals. |
| Raise Inclination | The orebody dips at 22 degrees and the raises are developed along dip at right angles to strike. Diagonal development is only done to accommodate stoping where major geological structure creates the requirement. |
| Orepass | Orepasses are developed at 55° to the horizontal, usually from the crosscuts to the reef horizon. The ore passes spaced to intersect reef at either 25 m, 50 m or 75 m, the spacing is also influenced by geological intrusions. |
| Travelling Way | Travelling ways are developed at 34° to the horizontal. |
| Horizontal Development | Horizontal development (footwall drives and crosscuts) to be cleaned with rail bound hydropower loaders or LHDs loading into hoppers. |
| Inclined Development | < 34 degrees to be cleaned with scrapers and electric scraper winches and >34 degrees to be by means of gravitation. |
The ledging and stoping for the operations is detailed in Figure 31. Ledging will be done conventionally up to a ledging limit of 8 m, at a width of 117 cm. The brown strings indicate opening-up of existing haulages and crosscuts. Ledging is required once newly developed raises are completed prior to stoping. In areas where existing infrastructure permits, stoping commences without the need for ledging.
| |
| RESOURCE | RESERVE | VALUE |
Blyvoor Gold Resources (Pty) Ltd
S-K 1300 Technical Report Summary on the Blyvoor Gold Mine, South Africa | 71 |
Figure 31: Planned Ledging and Stoping Design
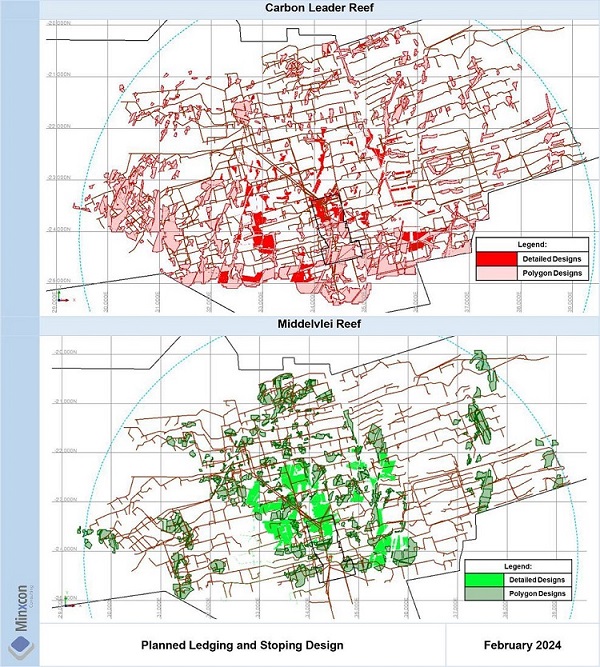
The development layout is illustrated separately in Figure 32 for the Carbon Leader Reef and the Middelvlei Reef. The brown strings illustrate the existing development and are utilised to access both reefs. Newly planned development (green, red, yellow, pink and blue strings) is also illustrated.
| |
| RESOURCE | RESERVE | VALUE |
Blyvoor Gold Resources (Pty) Ltd
S-K 1300 Technical Report Summary on the Blyvoor Gold Mine, South Africa | 72 |
Figure 32: Development and Opening Up
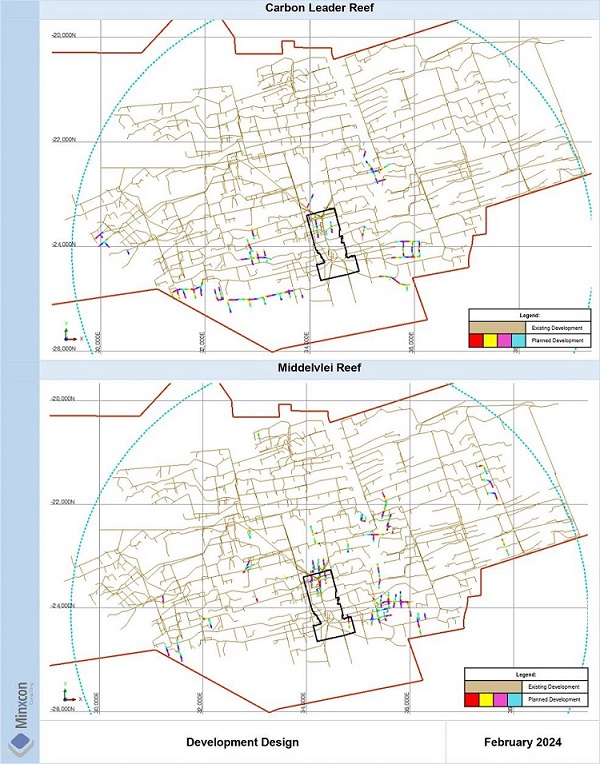
The opening-up required for both the Carbon Leader and Middelvlei Reefs is illustrated in Figure 33.
| |
| RESOURCE | RESERVE | VALUE |
Blyvoor Gold Resources (Pty) Ltd
S-K 1300 Technical Report Summary on the Blyvoor Gold Mine, South Africa | 73 |
Figure 33: Opening-up Required
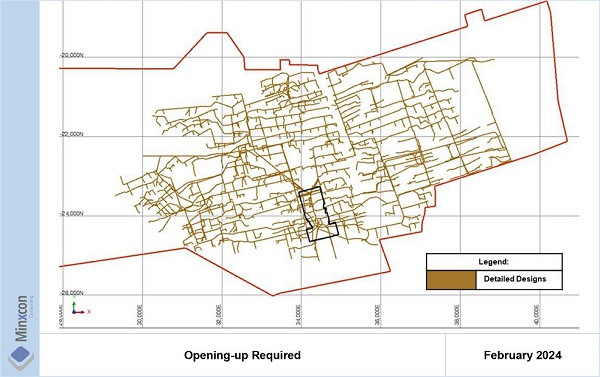
| VII. | Mineral Reserve Conversion Factors |
Mineral Reserve conversion factors are applied to convert the Mineral Resources to Mineral Reserves. The applied Mineral Reserve conversion factors are detailed as follows:-
| ● | Geological Losses: Geological losses of 5%, 10% and 15% has been applied to Mineral Resources in the Measured, Indicated and Inferred categories, respectively. Geological losses have been applied equally to the Carbon Leader and Middelvlei Reefs. |
| ● | Pillar Provision: A pillar provision of 15% has been applied to all Mineral Resources blocks with the polygon estimation and a 5% pillar loss to the detailed design. The Mineral Resource blocks within the polygon estimation do not form part of the initial five years of the LoM plan. The pillar provision allows for potential rock mechanic pillars which will be left in situ in strategic areas for the purpose of local and regional support within the planned mining areas. |
| ● | Mining Extraction: A mining extraction of 80% has been applied to Mineral Resource blocks within the polygon estimation. The Mineral Resource blocks within the polygon estimation do not form part of the initial five years of the LoM plan. Mining extraction accounts for a portion of ground left behind due to unanticipated ground conditions or restricted access to a block. |
| ● | Sundries Dilution: Sundries dilution accounts for off-reef mining, winch beds, gullies, slyping and overbreak. Off-reef mining accounts for waste material included as ore due to minor geological features displacing the reef. Dilution from winch beds due to the increased size of the required excavation into the footwall. The ASGs are developed into the footwall for each stope to provide capacity for scraping. Overbreak and slyping occur as a result of the explosive charge damaging the hanging wall and/or sidewall. A sundries dilution of 12.4% and 32.8% has been applied for Conventional Mining and SBM respectively. |
| ● | Discrepancies Dilution: Discrepancies comprise of Fall of Ground (“FoG”), scaling and waste development trammed as reef. These discrepancies account for dilution not measured or estimated. A discrepancy dilution of 10.8% and 22.6% has been applied for Conventional Mining and SBM respectively. |
| |
| RESOURCE | RESERVE | VALUE |
Blyvoor Gold Resources (Pty) Ltd
S-K 1300 Technical Report Summary on the Blyvoor Gold Mine, South Africa | 74 |
| ● | Mine Call Factor (“MCF”): The MCF applied at Blyvoor is 70% for year one and 75% for year two, and 80% from year three onwards. |
Item 13 (c) - Requirements for Stripping, Underground Development and Backfilling
| I. | Underground Development |
New development is required to open up sufficient ground for stoping to produce the required planned production rate. Development of haulages, crosscuts, travelling ways, on-reef raises, and orepasses will be done conventionally using handheld hydro-powered drilling machines. The required development for the total operation is illustrated in Figure 34. Once opening-up has advanced sufficiently, the new development will commence. Raises are included in Figure 34.
Figure 34: Development Requirement over Life of Mine
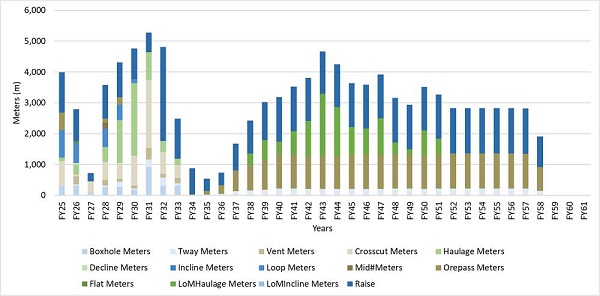
Blyvoor Mine is an existing mine with existing underground infrastructure. The existing development requires re-equipping or re-opening. The amount of re-opening required for the total LoM is 283,792 m. The required opening-up over the LoM is illustrated in Figure 35.
| |
| RESOURCE | RESERVE | VALUE |
Blyvoor Gold Resources (Pty) Ltd
S-K 1300 Technical Report Summary on the Blyvoor Gold Mine, South Africa | 75 |
Figure 35: Opening Up Required Over Life of Mine
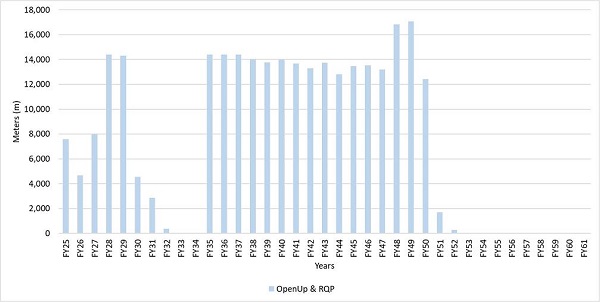
The Blyvoor Mine currently does not have any requirements for backfilling within any of the mining areas. If future depth extensions are planned, it may require an investigation into backfill requirements.
Item 13 (d) - Required Mining Fleet, Machinery and Personnel
| I. | Mining Fleet and Machinery |
The machine fleet for Blyvoor was specified for conventional stoping and development. The fleet primarily includes hydropower drills, face, and gully scrapers, mobile powerpacks, locos, hoppers and hydropower loaders and LHDs. The required equipment is detailed in Table 28.
Table 28: Required Equipment
| Description | Specification |
| Mono Winch | 22 kW – Complete with Guard and Signalling System |
| Face Winch | 37 kW – Complete with Guard and Signalling System |
| Gully Winch | 55 kW – Complete with Guard and Signalling System |
| Raise Winch | 55 kW – Complete with Guard and Signalling System |
| Hydro Power Drill - Stoping | Sulsa and/or HPE Hydropower Drills |
| Hydro Power Drill - Development | Sulsa and/or HPE Hydropower Drills |
| Mobile Powerpacks | HPE Hydropower Powerpacks |
| Locos | 10 Tonne Trident loco complete with battery and charger |
| Hoppers | 2.5 m³ Wide door hoppers |
| Rail Bound Loaders | Hydropower loaders |
| LHDs | 2 Ton LHDs |
The fleet requirement was based on an initial ramp up state production rate of 40 ktpm followed by an 80 ktpm steady state production rate. The equipment requirements are detailed in Table 29. The equipment required for the 80 ktpm production rate has been specified as additional to the equipment already acquired for the 40 ktpm production rate.
| |
| RESOURCE | RESERVE | VALUE |
Blyvoor Gold Resources (Pty) Ltd
S-K 1300 Technical Report Summary on the Blyvoor Gold Mine, South Africa | 76 |
Table 29: Equipment Schedule
Description | Units | Equipment Required | Additional Equipment Required |
| 40 ktpm | 80 ktpm |
| Face Winch | No. | 88 | 124 |
| Gully Winch | No. | 88 | 124 |
| Centre Gully Winch | No. | 30 | 42 |
| Hydropower Drill - Stoping | No. | 270 | 270 |
| Hydropower Drill - Development | No. | 100 | 100 |
| Locos | No. | 15 | 12 |
| Hoppers (inclusive of cage hoisting) | No. | 180 | 144 |
| Man Carriages | No | 8 | 8 |
| Hydropower Loaders | No. | 10 | 10 |
| LHDs | No. | 4 | 0 |
The mining personnel for FY2025 on Blyvoor Mine is detailed in Table 30. More information regarding the increase in personnel and crews over the LoM can be found within the operating cost section.
Table 30: Blyvoor Mine Mining Personnel for FY2025
| Designation | FY2025 |
| Mine Overseer | 3 |
| Shift Overseer | 15 |
| Miner | 30 |
| Construction Foreman | 1 |
| Boilermaker | 1 |
| Plate Layer | 1 |
| Jumper Issuer | 1 |
| Stope Team Leader | 75 |
| Development Team Leader | 25 |
| Rock Drill Operator (“RDO”) | 170 |
| RDO Assts | 145 |
| Tramming Team Leader | 17 |
| Loco drivers | 110 |
| Vacuum T/Leader | 5 |
| Rail Upgrade T/Leader | 7 |
| Equipping T/Leader | 7 |
| Rigging T/Leader | 13 |
| Construction T/Leader | 4 |
| Stope Team Member | 211 |
| Stores | 10 |
| Water Jet Operator | 6 |
| LHD Drivers | 23 |
| Loader Driver | 19 |
| Clerk | 2 |
| Development Team Members | 21 |
| Winch Driver | 124 |
| Underground Assistant | 203 |
| Blasting Asst | 2 |
| Miners assistant | 44 |
| Rigger Team Leader | 6 |
| Total | 1,301 |
Source: Blyvoor Mine
| |
| RESOURCE | RESERVE | VALUE |
Blyvoor Gold Resources (Pty) Ltd
S-K 1300 Technical Report Summary on the Blyvoor Gold Mine, South Africa | 77 |
ITEM 14 - RECOVERY METHODS
Item 14 (a) - Flow Sheets and Process Recovery Methods
The Blyvoor Gold Mine plant consists of a conventional crushing, milling, carousel CIP, batch elution and smelting running at 34 ktpm. The crushing and milling circuits are designed to process RoM. The CIP is currently used exclusively for treatment of RoM at a rate of up to 40 ktpm. A process flow diagram is depicted in Figure 47. The plant expansions will increase the treatment of RoM at a rate of 80 ktpm.
The plant consists of the following circuits:-
| ● | primary crushing - jaw crushing; |
| ● | secondary crushing - cone crushing in closed circuit with a screen; |
| ● | primary milling - two off ball mills in closed circuit with cyclones; |
| ● | gravity concentration - Falcon concentrator; |
| ● | intensive leach for gravity concentrate; |
| ● | leaching - carousel carbon-in-pulp (CIP); |
| ● | elution and electrowinning - Zadra batch mode; |
| ● | carbon regeneration - re-activation induction furnace; |
| ● | reagent make-up and dosing circuits; and |
| ● | water recycling and storage. |
Figure 36: Blyvoor Gold Block Process Flow Diagram
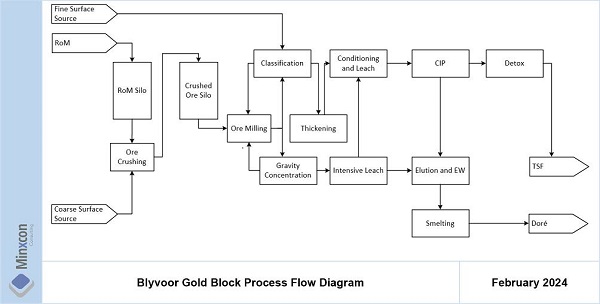
The plant capacity expansion consists of the following additions and changes:-
| ● | tertiary crushing - cone crushing in closed circuit with a screen; |
| ● | primary milling - one off ball mils in open circuit; |
| ● | secondary milling - two off current ball mills in closed circuit with improved cyclones; |
| ● | thickening - one-off additional concentrate thickener similar to the current concentrate thickener; |
| |
| RESOURCE | RESERVE | VALUE |
Blyvoor Gold Resources (Pty) Ltd
S-K 1300 Technical Report Summary on the Blyvoor Gold Mine, South Africa | 78 |
| ● | leaching - three-off additional leaching tanks and three off additional carousel carbon-in-pulp tanks (CIP); |
| ● | elution - one-off additional elution tank |
| ● | electrowinning - one-off additional electrowinning cell; |
| ● | casting - one-off additional induction furnace; and |
| ● | carbon regeneration - one-off additional re-activation kiln. |
The overall recoveries varied between 86.6% and 92.9% with an average of 91.5%. The gravity gold recovery was bypassed during this time and remains so currently. The plant is expected to maintain a similar recovery in the future when treating current Blyvoor RoM material without the plant expansions. After the planned capacity expansion, the recovery could improve to an average of approximately 94%.
There is a fully equipped assay laboratory which is located adjacent to the plant. The mine laboratory services are provided on a service contract by Super Laboratory Services and is not accredited, however plans indicate that accreditation is in progress, as it does have the necessary equipment required to prepare and analyse mine and plant samples. The sample preparation areas are demarcated for low grade and high-grade areas, especially where cross-contamination is a risk.
Good housekeeping standards are applied in the sample crushing and preparation and fire assay areas. As part of its external verification process the mine laboratory does not send samples away. However, to test their precision and accuracy, the laboratory makes use of standard reference material which it sources from AMIS from South Africa. The laboratory has acquired an electronic tracking system which will be installed by August 2023. This would lead to the implementation of a Laboratory Information Management system (LIMS) that reduces human error.
The current TSF will support deposition until 2043, after which a new TSF must be commissioned since the current dam will have reached its end of life based on capacity and not the rate of rise. A new TSF design and construction has been estimated and is specified in the capital cost section herein.
Item 14 (b) - Plant Design, Equipment Characteristics and Specifications
The plant was designed by Darrell Tonkin and constructed by Blyvoor Gold to treat RoM ore from the Blyvoor Gold mine. The ore is fed over 1,150 mm x 700 mm jaw crusher to reduce the top size from -300 mm to less than 80 mm. Tramp iron magnets (located ahead of the crushers) remove scrap iron before it enters the cone crushers. A metal detector is installed to detect any residual metal that is in the feed which might have failed to be picked up by the magnet. The crushed ore is stored in two 600 t silos from where material is fed to the ball mills.
The cone crusher has a feed opening of approximately 1,000 mm. The crushers can operate independently and feed a NMS Industries vibrating screen unit. The screened product which is smaller than 14 mm is delivered to the mill feed silos. The equipment quality is good and good maintenance is applied (an observation made during the site visit).
There are two 12 ft x 16 ft ball mills which operate in parallel. Each feed belt has a mill feed mass meter which is used to control and measure the mill feed rate. A new primary ball mill, 12 ft x 18 ft will be part of the planned expansion and will be operated in open circuit with discharge fed to the two existing mills in parallel. The crushed ore silos each have a capacity of 600 t, providing the primary mills with about 19 hours of operation at an expected throughput rate of 32 tph.
The plant expansion will increase the milling throughput to 80 ktpm, 125 tph. This will be the duty of the primary mill, when commissioned. The two parallel mills currently are operated in closed circuit with a set of 6/4AH metal Cavex cyclones.
| |
| RESOURCE | RESERVE | VALUE |
Blyvoor Gold Resources (Pty) Ltd
S-K 1300 Technical Report Summary on the Blyvoor Gold Mine, South Africa | 79 |
No free gold tests were performed. The gravity circuit is currently bypassed.
Oxygen generated from a Pressure Swing Absorption (PSA) oxygen plant is added into the first CIL tank; liquid oxygen is also available in the event of the oxygen plant being out of circuit for maintenance or breakdowns. There is a TAC 1000 cyanide online analyser which measures and controls cyanide addition. This process control system, in conjunction with oxygen injection, has reduced cyanide consumption.
Elution of the gold from the loaded carbon and subsequent electrowinning is done on site. There is one Zadra type 6 t elution column which operates in parallel with the two electrowinning cells.
During electrowinning the gold is deposited on steel wool cathodes within the elution column, and the loaded cathodes are removed on a planned cycle and acid digested. The resultant gold solids from acid digestion are smelted into bars. The granular activated carbon is regenerated in an induction furnace before it is recirculated back to the CIP section. Loaded carbon is acid treated. Carbon reactivation has remained acceptable. The gold, in the form of doré bars, is delivered, as required by South African gold-mining law, to Rand Refinery for sampling and refining.
Power is supplied from the national grid, but a fully automated diesel driven power plant is available when power trips occur. The diesel power generation set capacity is only sufficient to operate the thickener. The plant expansion included a larger capacity generator to ensure the TSF lines pumping can continue.
The plant tailings from CIP are deposited to a TSF, located close to the plant. The maximum amount of tailings water is pumped back to the metallurgical plant for re-use. Daily management and operation of the tailing deposition area is performed by the mine.
Item 14 (c) - Energy, Water and Process Materials Requirements
Table 31 summarises the current labour complement for the Blyvoor Gold Plant. The Electrical Engineer is not included in the above table as he is shared between the plant and the mine. All the plant employees are adequately trained and from observation around the plant, as well as the condition of equipment. The higher labour complement is in part due to the manual control nature of the plant. The plant does not have a central process control system, but there are local controls in areas such as mill feed control, cyanide addition.
| |
| RESOURCE | RESERVE | VALUE |
Blyvoor Gold Resources (Pty) Ltd
S-K 1300 Technical Report Summary on the Blyvoor Gold Mine, South Africa | 80 |
Table 31: Plant Labour Complement
| Section | Position | Number |
| Plant Senior Staff | Plant Manager | 1 |
| Asst. Plant Manager | 1 |
| Plant Staff | Plant Metallurgist | 1 |
| Plant Foreman | 1 |
| Metallurgical Technician | 1 |
| Plant Operators | 4 |
| Mill Clerk | 1 |
| Elution Supervisor | 1 |
| Senior Smelting Assistant | 1 |
| Senior Lab. Assistant | 1 |
| Primary Crusher | Senior Crusher Attendants | 2 |
| Crusher Attendants | 13 |
| Secondary Crusher | Senior Crusher Attendants | 1 |
| Crusher Attendants | 5 |
| Crusher Attendants | 1 |
| Gravity &Smelting Assistants | 3 |
| Milling | Mill Attendants | 4 |
| Mill Attendants | 10 |
| Elution | Senior Elution Assistant | 1 |
| Elution Assistants | 2 |
| Elution Attendants | 3 |
| Tailings | Supervisor | 1 |
| Slimes Dam Attendants | 3 |
| Pump Attendants | 3 |
| Leaching & CIP | Leach & CIP Attendants | 4 |
| Leach & CIP Attendants | 6 |
| Leach & CIP Attendants | 1 |
| Water | Water Works Attendant | 1 |
| Water Works Attendant | 2 |
| Water Works Attendant | 1 |
| Metallurgical Lab and Sample preparation | Laboratory Assistants | 2 |
| Laboratory Assistants | 1 |
| Sub Total | | 83 |
| Engineering | Mechanical Engineer | 1 |
| Foreman | 1 |
| Fitter | 5 |
| B/Maker | 4 |
| Plumber | 1 |
| Rubber Liner | 1 |
| Assistant Fitter | 5 |
| B/maker Assistant | 4 |
| Lubricator | 1 |
| R/Liner Assistant | 1 |
| Plumber’s Assistant | 1 |
| Electrician | 1 |
| Assistant Electricians | 1 |
| Sub Total | | 27 |
| Total | | 114 |
Source: Blyvoor Mine
| II. | Reagents and Consumables |
The reagent and consumable consumptions are shown in Table 32. The forecasted consumptions are not expected to change significantly. Water requirement must be sufficient to produce a slurry at 48% solid content. At 34 ktpm RoM, the water volume required is 49,000 m3 per month for processing. At 80 ktpm RoM, the water volume required is 115,000 m3 per month for processing.
| |
| RESOURCE | RESERVE | VALUE |
Blyvoor Gold Resources (Pty) Ltd
S-K 1300 Technical Report Summary on the Blyvoor Gold Mine, South Africa | 81 |
Table 32: Reagent and Consumable Consumptions
| Item | Unit | Average Past Year |
| Grinding Media and CIP Reagents | | |
| Balls- 80 mm | kg/t | 1.57 |
| Lime | kg/t | 0.40 |
| Flocculant | kg/t | 0.03 |
| Carbon | kg/t | 0.04 |
| Sodium Cyanide | kg/t | 0.43 |
| Hydrochloric Acid | kg/t | 0.14 |
| Elution Consumables | | |
| Steel Wool | kg/t Carbon | 0.25 |
| Caustic Soda | kg/t | 0.17 |
Source: Blyvoor Mine
Electricity will be sourced from Eskom through its existing transmission infrastructure. The installed electrical capacity was calculated for the equipment list with the rated power for each, and total 6,851 kW. The expected load for each type of equipment is between 75% and 90% of the installed capacity. Total expected load is 5,265 kW. Water for the process plant will be drawn from neighbouring underground workings.
| |
| RESOURCE | RESERVE | VALUE |
Blyvoor Gold Resources (Pty) Ltd
S-K 1300 Technical Report Summary on the Blyvoor Gold Mine, South Africa | 82 |
ITEM 15 - PROJECT INFRASTRUCTURE
Item 15 (a) - Infrastructure General Arrangement
| I. | Surface Infrastructure Layout |
PS Shaft is a historically operated mine and is thus very well-established in terms of infrastructure. The surface infrastructure is in place and in a fair to good condition and has been repaired/upgraded during the execution the PS Shaft project. The infrastructure includes mine offices, mine parking area, change houses, lamp room and time and attendance, workshops, stores, headgear, winder house, sub-stations, main vent fans, explosives receiving bay, sewage plant, ore conveyor, and access road. The general arrangement and layout of this infrastructure is illustrated in Figure 37.
| II. | Shafts and Underground |
The PS Shaft Complex consists of a system of vertical hoisting and ventilation shafts. These include PS Shaft (surface to 17 Level), PSSV Shaft (15 Level to 47½ Level), No. 1A Sub-vertical Shaft and a Sub-vent Shaft in the vicinity of PSSV Shaft. No. 1A Sub-vertical Shaft will be equipped with a winch and pod and utilised as an emergency secondary escape only. A sectional schematic indicating the layout of the shaft and underground workings are illustrated in Figure 23.
| |
| RESOURCE | RESERVE | VALUE |
Blyvoor Gold Resources (Pty) Ltd
S-K 1300 Technical Report Summary on the Blyvoor Gold Mine, South Africa | 83 |
Figure 37: PS Shaft Surface Infrastructure General Arrangement and Layout
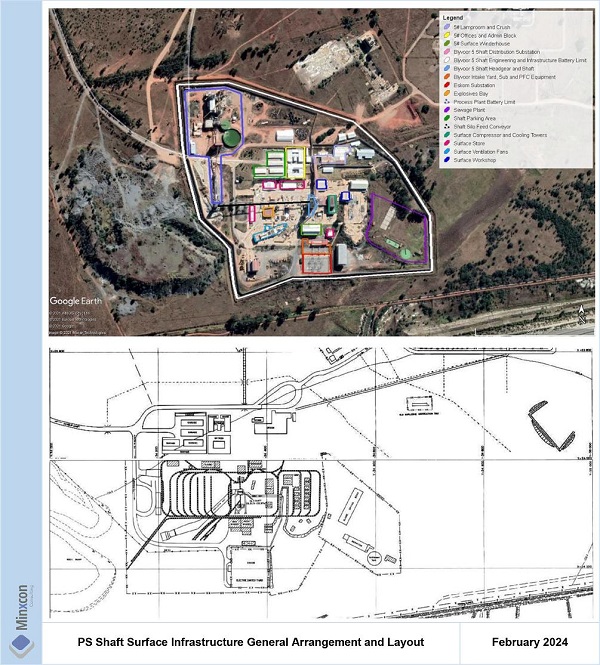
Item 15 (b) - Mining Operations
The PS Shaft Complex is a well-established mining operation that was still in operation during 2013. The operation is thus well equipped and set up. The majority of the required refurbishments, repairs and maintenance on infrastructure and equipment has been completed and recommissioned. The majority of outstanding work entails the re-equipping of the planned levels and workings.
Surface operations for the PS Shaft include the man and rock winding plants, two main ventilation fans, electrical intake/distribution sub-station, shaft headgear and ore conveyor and surface buildings and facilities.
| |
| RESOURCE | RESERVE | VALUE |
Blyvoor Gold Resources (Pty) Ltd
S-K 1300 Technical Report Summary on the Blyvoor Gold Mine, South Africa | 84 |
The shaft bank area is well-established and equipped with numerous stores and workshops in place. The bank also includes an extensive rail network for the transport of material and equipment on the bank area as well as a salvage and reclamation yard and explosives delivery bay.
The rock winder is equipped with two 10 t skips while the man winder is equipped with two, three deck cages with a capacity of 120 persons each. During ore hoisting, ore will be tipped into bins located in the headgear that will in turn feed onto the ore conveyor that will transport ore to the existing silo and eventually to the process plant.
The two main ventilation fans where previously utilised for the ventilation of the total underground workings. During the ramp up phase of the project to 40 ktpm, only one of the main fans is required for the ventilation of the underground workings. The second main ventilation fan will be required when production ramps up to 80 ktpm. This will be the case while mining takes place in close proximity to the PS Shaft Complex. Once mining moves to the extremities of the PS Shaft Complex additional main surface ventilation fans will be required. It is planned to initially install two fans at Doornfontein No. 2 Shaft and during the later phases of the project an additional two main surface fans at Blyvooruitzicht No. 3 Vent Shaft. This should ensure sufficient and effective ventilation and cooling of the planned underground workings. A diesel-driven emergency standby ventilation fan is also available at PS Shaft to provide emergency ventilation in case of a power failure.
Previously compressed air was supplied to refuge chambers and limited pneumatic equipment from a mobile compressor located on 15 Level and 27 Level. A new compressor as well as a compressed air column from surface to the underground workings was installed and supplies compressed are to the underground workings.
| II. | Underground Operations |
Planned mining for the project will initially take place on 15 Level and 27 Level. Ore from 15 Level is trammed to the 15 Level orepass feeding the loading bins of PS Shaft. From here the ore is loaded into the skips and hoisted to surface by the rock winder. On the levels below 15 Level ore will initially be trammed to PSSV Shaft from where hoppers will be hoisted to 15 Level. A new orepass system will be developed from 23 level to 27 Level that will feed the 27.5 Level mid-shaft loading station. Allowance has been made for the development of a new orepass system at PSSV Shaft from 23 Level down to 27.5 Level. In addition to the orepass system, a mid-shaft loading station has been developed, equipped and commissioned at 27.5 Level.
When mining commences below 29 Level, dewatering of the flooded workings below 27.5 Level will be required. Once the water level has lowered to below 34 Level, the existing permanent main pump station on 34 Level will be re-established. The settlers and mud pumps associated with this pump station is located at 33 ½ Level. Another pump station is located at 44 Level. This pump station together with the original mid-shaft loading station at 43 Level will be re-established. Dewatering of the underground operations will then be done from these pump stations. This will enable ore that is mined below 29 Level to be hoisted from the 43 Level loading station to 15 Level within PSSV Shaft.
Shafts and Hoisting
Owing to the flooding of the PSSV Shaft basin with CWC maintaining the water level 10 m above 29 Level, the existing rock loading arrangements in the PSSV Shaft, which are situated below 43 Level, are currently submerged under water and alternative loading arrangements will be required.
| |
| RESOURCE | RESERVE | VALUE |
Blyvoor Gold Resources (Pty) Ltd
S-K 1300 Technical Report Summary on the Blyvoor Gold Mine, South Africa | 85 |
A new loading arrangement has been developed and installed on 27.5 Level. Cage hoisting with hoppers will be required in PSSV Shaft above 27 Level and up to 15 Level until the development of the orepass system feeding the newly commissioned mid-shaft loading station is complete. Once development of the orepass system has been completed, hoisting will commence with the PSSV Shaft rock winder.
Once mining commences on 29 Level, connecting development will be required on 29 Level between No. 1A Sub-vertical Shaft and PSSV Shaft. This is due to historical development on 29 Level only being completed to just beyond the 29 Level station (±8 m) at PSSV Shaft and not having holed into the 29 Level haulage leading from No. 1A Sub-vertical Shaft. Subsequent to dewatering of PSSV Shaft and the re-establishment of the original loading station on 43 Level, ore below 27 Level will be transferred through a new orepass system at PSSV Shaft to the 43 Level loading station for hoisting. This includes the upgrading of the winders of this shaft. It is planned to refurbish the No.1a sub shaft between 15 Level and 23 Level to include for the transport of men and material between these two levels once completed this will also replace the capsule arrangement currently serving as part of the emergency secondary escape route.
No. 6 Shaft is currently operated and maintained down to 9 Level by CWC. This is to enable CWC to conduct the necessary dewatering that takes place a No. 6 Shaft as well as the associated maintenance of the shaft to 9 Level. Blyvoor utilises No. 6 Shaft down to 15 Level as a secondary escape route to surface in the event of an emergency and the PS Shaft is out of commission. Blyvoor plans to refurbish 1 compartment in the No.6 Shaft between 9 Level and 15 Level to ensure that ongoing maintenance and use as a second escape route from 15 Level to surface is ensured into the future.
The old Blyvooruitzicht and Doornfontein sections have a boundary pillar between them. In order to access the old Blyvooruitzicht section from PSSV Shaft development is required through the boundary pillar. This is planned on 15 Level and 21 Level on the Doornfontein side. Currently two holings between the two sections exist. The existing interconnecting levels have a slight elevation difference, and this will be the case for the newly planned interconnections as well. The existing interconnections levels and their elevation differences are listed in Table 33. Interconnecting development will be done at a gradient that will allow for efficient tramming.
Table 33: Doornfontein - Blyvooruitzicht Boundary Connection Development
| Status | Level | Unit | Elevation Difference |
| Historic Doornfontein | Historic Blyvooruitzicht |
| Existing - Traveling Way | 9 Level | 6 Level | m | 25 |
| Existing - Cross Tram Level | 33 Level | 34 Level | m | 71 |
| Planned - Cross Tram Level | 15 Level | 12 Level | m | 6 |
| Planned - Cross Tram Level | 21 Level | 19 Level | m | 7 |
| III. | Completed and Remaining Project Works – Infrastructure |
Shafts and Hoisting
The following has been completed:-
| ● | surface power supply and electrical reticulation; |
| ● | winder refurbishment completed – PS Shaft (man and rock winders) and PSSV Shaft (East and West man winders); |
| ● | PS Shaft man and rock winders were recommissioned, cleared for service by DMRE Chief Inspector of Machinery and re-licensed; |
| |
| RESOURCE | RESERVE | VALUE |
Blyvoor Gold Resources (Pty) Ltd
S-K 1300 Technical Report Summary on the Blyvoor Gold Mine, South Africa | 86 |
| ● | PSSV Shaft East and West man winders were recommissioned, cleared for service by the DMRE Chief Inspector of Machinery and re-licensed; |
| ● | PSSV Shaft rock winder has been recommissioned and re-licensed; |
| ● | Development, construction and commissioning of the 27.5 Level mid-shaft loading station; |
| ● | re-licensing of PS Shaft rock winder and PSSV Shaft East man winder; |
| ● | PS Shaft, shaft repairs completed and shaft re-instated; |
| ● | power established in PSSV Shaft winder to 25 Level and 27 Level; |
| ● | housekeeping and refurbishment of change houses, surface area completed; |
| ● | Traffic control measures completed; |
| ● | opening up of 15 Level haulage; |
| ● | purchase and delivery of hydro mining equipment; and |
| ● | construction and commissioning of process plant. |
Remaining Project Works
Remaining Infrastructure Project Works
| ● | Re-instatement of PGSV Infrastructure:- |
| ○ | on-going re-equipping of underground workings; |
| ○ | completion of orepass system feeding ore to the completed 27.5 Level mid-shaft loading station; and |
| ○ | dewatering of flooded workings and recommissioning of main pump stations on 34 Level, 14 Level and the IPC in PS Shaft as well as the settlers on 33½ Level. |
| ● | New Infrastructure Projects required for increased production requirements, or for production beyond the initial 5 years of the plan:- |
| ○ | establish connecting development from the Doornfontein section to old Blyvooruitzicht section; |
| ○ | re-establish services to old Blyvooruitzicht section (power, water and communications); |
| ○ | establish main surface ventilation fans at the historic Doornfontein No. 2 Shaft and the Blyvooruitzicht No. 3 Ventilation Shaft; |
| ○ | re-equip A6, A5, B5 and B5A Incline shafts and their winders; and |
| ○ | establish shaft tips in above mentioned incline shafts. |
Shaft Dewatering
The existing underground pumping infrastructure below 29 level at PSSV Shaft is flooded with the water being allowed to rise to just below 29 Level .
Once it is required to mine below 27 Level dewatering of the flooded lower levels will commence to below 41 Level with the use of submersible pumps. Dewatering is to commence in month 24 and will take a period of 12 months to ensure access can be gained to the required levels in month 36. Allowance has been made for two submersible pumps with a rating of 1000 kW and a flow rate of 200 m³/h at a head of 820 m. In conjunction with the dewatering, re-equipping of all shaft infrastructure, level infrastructure, permanent pump stations and sub-stations will have to be established to supply services to the future mining areas.
Once pumping commences the water will be pumped vertically through the PSSV Shaft to 14 Level and from there to the PS Shaft IPC and subsequently to surface through PS Shaft. The main portion of the existing permanent underground pumping infrastructure at PS Shaft Complex is situated below 33 Level in PSSV Shaft. This includes a settling arrangement on 33 ½ Level and main pump stations on 34 Level and 44 Level.
The historic installed pumping infrastructure consists of two multistage pumps installed in series, pumping in reverse cascade from 44 Level to similar intermediate pump stations on 41 Level and 38 Level, finally
| |
| RESOURCE | RESERVE | VALUE |
Blyvoor Gold Resources (Pty) Ltd
S-K 1300 Technical Report Summary on the Blyvoor Gold Mine, South Africa | 87 |
delivering the water to large storage dam facilities on 34 Level. Once the refurbishment of the permanent pump stations and other infrastructure has been completed the submersible pumps will be removed from the shaft and pumping will commence from 34 Level with the permanent pump station pumps, the water will be pumped to 14 Level from where the water will be pumped to surface through the IPC located in PS Shaft.
Information obtained from a Village Main Reef report dated June 2013 two months prior to closure, stated that a dam had been constructed on 29 Level (PSSV Shaft) to enable the recirculation of approximately 1 Ml of service water per day which will be utilised for initial production purposes below 27 Level.
Historically the pump station on 34 Level in PSSV Shaft section is equipped with 3 x 11 stage Sulzer pumps with a rated head of ±1,100 m. Similar pumps will be installed once the main pump station is recommissioned.
Mining Logistics
All mining levels are or will be equipped with a workshop and battery bay to service rail-bound equipment and mining areas on each level. The mining areas will be supplied with mobile hydro power packs that will directly supply pressurised water to the active mining areas for rock drill operation.
Underground Ventilation and Cooling
A review has been done on the detailed 5-year mining plan by a ventilation specialist. Mining will take place on 27 Level and above during the first 5 years and 3 months and proceed below 27 Level thereafter. Opening up or re-equipping of Levels below 27 Level commences from year 4.
Blyvoor Mine at PS Shaft, is relatively shallow compared to other the mines in the Carletonville area where the neighbouring workings are between 3,000 mbs and 4,000 mbs. Blyvoor will be mining, according to the plan at elevations of 2,383 m. The greater stoping depths of the neighbouring mines in the region require refrigeration for their stoping operations whilst historically at Blyvoor cooling was only introduced at depth below 2,500 mbs (below 31 Level).
From the above information, it was previously assumed that minimal to no refrigeration will be required whilst mining above 31 Level and that spot cooling would be implemented as and where necessary. Blume Burton Engineering (Pty) Ltd (“BBE”) has since done a ventilation and cooling study. It has been indicated that cooling will be required as early as year 2. Provision has thus been made from their recommendations and cost estimations for cooling of the underground workings.
Up to 2013, prior to mine closure, the PS Shaft and Blyvooruitzicht No. 6 Shaft were ventilated by two surface fans handling approximately 400 m³/s. Both fans were in use to support mining at depths of +3,200 mbs. With the proximity of the working places relative to PSSV Shaft in regard to the initial years of the LoM plan, it is assumed that during the first four years of production, one fan delivering ±200 m³/s will be sufficient at production rates of 40 ktpm and a second ventilation fan will be required at 80 ktpm to ventilate and cool the underground workings.
Allowance has been made for nine air cooling units, each with a cooling capacity of 100 kW, which is sufficient for cooling six stoping panels. The air cooling units will be utilised to facilitate spot cooling between the working places as and where required whilst mining above 31 Level.
| |
| RESOURCE | RESERVE | VALUE |
Blyvoor Gold Resources (Pty) Ltd
S-K 1300 Technical Report Summary on the Blyvoor Gold Mine, South Africa | 88 |
Item 15 (c) - Services
Power Supply
Power was previously supplied to PS Shaft through two 132 kV overhead lines that feed from the Elandsrand and Carmel sub-stations respectively. These lines are connected and live. The Eskom switching yard and consumer sub-station at Blyvoor was stripped by Eskom as well as damaged and vandalised, and thus needed to be fully re-equipped and re-commissioned. This work has been completed during the execution of the Blyvoor Gold PS Shaft project.
The Blyvoor intake and distribution sub-station is be fed from the Eskom consumer sub-station located at PS Shaft. This distribution sub-station was vandalised and stripped of major components. The repairs and commissioning of the intake substation have subsequently been completed and the various areas such as the winding plants, surface fans, surface compressor, workshops, stores, offices, general shaft surface areas, process plant and the underground workings are fed from this distribution sub-station.
The underground workings are fed with two HT feeder cables that will create a ring feed system for the underground workings. Allowance has been made for the refurbishment and re-commissioning of five underground sub-stations that will facilitate the control and distribution of power throughout the underground workings. These sub-stations will be located on 17, 21, 25 and 29 Levels. Power has currently been restored to 14 Level, 15 Level and 27 Level. The remainder of the power reticulation into the production sections is required.
Backup power supply capacity has been secured in the form of diesel generator sets. The generator sets were purchased and the facility to house them completed. Blyvoor Gold needs to apply for capital funding to install these generators. Blyvoor is also in the process of developing a solar farm project.
Water Supply
Water is supplied to the project from three main sources. Potable water is purchased from Rand Water through Merafong. A supply line has been installed from the project and ties into the existing main line connected to the Blyvoor lease area. Make up water to the PS Shaft process plant is currently sourced from municipal supply.
Service water for the underground mining section is sourced from the underground workings and fissure water. Once production commences at Blyvoor PS Shaft, the water required for production purposes is anticipated to be approximately 1.5 Ml/day at commencement of mining and will ramp up to 8 Ml/day by month 50. Service water requirements will further increase to a maximum of 6 Ml/day by month 100 and remain at this level whilst producing the planned 80 ktpm of ore. The existing fissure water ingress into PS Shaft and water from the dewatering activities below 27 Level, once dewatering has commenced, will be captured into, and circulate in the underground mines’ water reticulation system. Considering the ±20 Ml/day pumped by CWC and the 5 Ml/day pumped by the neighbouring Savuka Gold Mine, the total groundwater ingress into the Blyvoor mining area amounts to 25 Ml/day. As the majority of service water will be recirculated underground it is evident that sufficient ingress groundwater will be available to sustain the maximum planned production rate.
Allowance has been made for the anticipated pumping and water distribution infrastructure and equipment.
| |
| RESOURCE | RESERVE | VALUE |
Blyvoor Gold Resources (Pty) Ltd
S-K 1300 Technical Report Summary on the Blyvoor Gold Mine, South Africa | 89 |
ITEM 16 - MARKET STUDIES
Item 16 (a) - Commodity Market Assessment
The following sections provide an overview of the gold market. The QPs have reviewed these studies and analyses and are satisfied that the results support the assumptions in the TRS.
The following gold market conditions for the year 2023 have been identified by the World Gold Council, as extracted from their Gold Demand Trends report and other World Gold Council data.
| ● | Gold demand (excluding over-the-counter transactions (“OTC”)) decreased 5% year-on-year (“y-o-y”) to 4,448 t, on a par with recent Pre-Covid years. Q4 2024 demand was 1,150 t, a drop of 12% y-o-y compared to the record demand of 1,337 t in Q4 2023. |
| ● | Total annual gold supply increased by 3% y-o-y to 4,898 t, supported by improved mine production that saw a five-year high, but remaining below the record 2018, and high levels of recycling driven by high gold prices. |
| ● | The gold price averaged USD1,941/oz in 2023, rising substantially form the average of USD1,825/oz in 2022. The year closed 2023 at a record-high year-end gold price of USD2078/oz. |
| ● | The average global All-In Sustaining Costs (“AISC”) rose to USD1,343/oz in Q3 2023, an increase of 3% quarter-on-quarter (“q-o-q”) and 5% increase y-o-y. |
| I. | World Gold Deposits and Reserves |
The global minable gold reserves are dominated by Australia, Russia and South Africa due to the higher-grade deposits found in these regions, with averages generally well above the global average of approximately 1.0 g/t. Africa continues to be home to some of the highest grade (and highest risk) projects in the world. The average grade differs significantly (33%) between producing and undeveloped deposits. This has important implications on future gold production, and at a gold price reaching low levels, many of these projects will simply not be economically feasible. Gold reserves globally total some 1,835 Billion oz Au (USGS, 2024).
| II. | Gold Supply and Demand Fundamentals |
Gold supply increased in 2023, with marginally increased mine production and significant increase in recycling:-
| ● | Mine Production: Global mine production improved for a third consecutive year with a marginal increase of approximately 1% to 3,644 t in 2023 (World Gold Council, 2024a). Of this, China, Russia and Australia each contributed 10-12% (USGS, 2024). Canada and the United States are the fifth and sixth largest producers. Kazakhstan and South Africa notably ramped up output through the year, both with an increase of approximately 12%-13%. South Africa overtook Ghana as the largest producer in Africa. |
| ● | Net Producer Hedging: According to the World Gold Council (2024a), the global hedge book increased 17 t over 2023 ending at 190 t. Industry sentiments towards hedging have adjusted over the past two decades, with new hedging positions mainly either made opportunistically in the short-term, and small in size, or from companies with project or debt finance requirements. The high spot price environment of 2023 combined with the attractive forward premiums for gold due to high interest rate environment has incentivised forward selling of gold. |
| ● | Recycling: Each quarter saw a y-o-y increase in recycling. Recycled gold supply in 2023 increased by 9% y-o-y to 1,237 t, remaining still 30% below the 2009 all-time high, despite a record annual average gold price in 2023. Distress selling of old jewellery is far less than in 2009 and there has not been sufficient build-up of old, unwanted or broken jewellery by consumers since the previous all- |
| |
| RESOURCE | RESERVE | VALUE |
Blyvoor Gold Resources (Pty) Ltd
S-K 1300 Technical Report Summary on the Blyvoor Gold Mine, South Africa | 90 |
time high price cycle and the flushing out of this jewellery in previous high recycling cycles (World Gold Council, 2024a).
The 2023 gold demand contracted by 5% after a stellar year for demand in 2022, with demand of 4,448 t excluding OTC and 4,899 t including OTC and stock flows. This was driven by another year of strong central bank purchases, boosted by slower ETF outflows, as described by the World Gold Council (2024a). The World Gold Council highlights the following for the year 2023 across the demand sectors:-
| ● | Investment: In 2023, investment demand (excluding OTC) decreased 10% to a 10-year low of 945 t. The investment demand picture changes when including OTC and “other” demand, which added 450 t in demand, notably from Turkey. Exchange traded fund (“ETF”) holdings fell by a 244 t (versus 110 t in 2022). Gold bars and coins demand contracted by 3% to 1,189 t. |
| ● | Technology: Hampered demand for consumer electronics in response to deteriorating global economic conditions drove down gold demand for technological applicationswith a full-year decline of 4% below 300 t for the first time in decades. Q4 saw some promising recovery in demand with a 12% increase y-o-y after three consecutive quarters of decreased demand. |
| ● | Jewellery: Jewellery consumption remained steady increasing very marginally to 2,093 t despite record gold prices. China was the primary driver of growth, with an increase in jewellery demand of 17% y-o-y. |
| ● | Central Banks: Gold is politically independent and bears no credit risk. Some central banks have been pursuing an overt policy of de-dollarisation. Gold is a safe haven as the international monetary system shifting towards multipolarity, thus will continue to be an important reserve asset for central banks. Annual buying in the sector exceeded 1,000t for a second consecutive year in 2023 with demand of 1,037 t. The People’s Bank of China was the largest single gold buyer in 2023 followed by the National Bank of Poland. The National Bank of Kazakhstan and the Central Bank of Uzbekistan were the two largest sellers of gold. The net purchases by central banks far outweighed the sales. |
The average annual gold price in 2023 was USD1,941/oz up from USD1,800/oz in 2022, which is a new average record (World Gold Council, 2024a). The appeal of gold is undermined by increased bond yields for institutional and retail investors as a secure hedging asset as the opportunity cost of holding gold is increased. According to the Australian Office of the Chief Economist (2023), the inverse relationship between real bond yields and gold prices has weakened notably since the invasion of Ukraine by Russia. Prices have risen owing to increased safe-haven demand, which has persisted as price driver offsetting the effect of increased interest rates.
Price support in 2023 has come from increased purchases by central banks, economic uncertainty and geopolitical risk. The conflict between Israel and Hamas has driven price increases to levels exceeding USD2,000/oz in October 2023. Falling US treasury yields and a weakening US dollar also provided price support for gold.
Consensus opinion has the real gold price reducing over the short to medium term (Table 34).
Table 34: Gold Price Forecast (Nominal Terms)
| | Unit | 2024 | 2025 | 2026 |
| Gold | USD/oz | 2,086 | 2,089 | 1,975 |
Source: Consensus (March 2024)
| |
| RESOURCE | RESERVE | VALUE |
Blyvoor Gold Resources (Pty) Ltd
S-K 1300 Technical Report Summary on the Blyvoor Gold Mine, South Africa | 91 |
According to the Australian Office of the Chief Economist (2023), prices are expected to decrease throughout 2024, should US economic activity slow, but avoid recession. Official sector buying is expected to continue into 2024 at strong levels due to continued geopolitical risk driving safe-haven demand. If US and global economic activity declines significantly and interest rate cuts are implemented, stronger support can be expected for the gold price through lower interest rates, weaker US dollar and increased ETF demand. It should be noted the US Fed is not currently expected to cut interest rates.
Gold supply is forecast by the Australian Office of the Chief Economist (2023) to stabilise above 4,800 t per year into 2025. Increases in mine production is forecast to be offset by decreases in gold recycling. Mine production is forecast to increase by an average of 1.4% by 2025 to approximately 3,780 t of gold with new operations coming online from the likes of Canada, the US, Chile and Brazil. Chinese production is forecast to decrease over the same period due to continued implementation of environmental regulations and industry consolidation. Recycling is forecast to decrease on average by 5.4% per year by 2025, partially offsetting the increase in supply from mining operations. In the short-term, gold prices are forecast to remain at elevated levels exceeding USD2,000/oz with. Consensus forecast has the 2024 average gold price of USD2,086/oz stay relatively unchanged at USD2,089/oz for 2025, before falling to USD1,975/oz in 2026. According to Consensus Economics (2024), the perceived safe-haven status of gold remains attractive in the current volatile global climate. The climate remains uncertain in regions with geo-political tension, such as the Middle East and Eastern Europe. In addition, the US elections may result in a shift in US economic policy.
Item 16 (b) - Contracts
Rand Refinery, who is contracted to refine the gold doré produced at the Blyvoor Mine, is the largest gold refinery in the world and has historically refined 95% to 99% of all gold produced in South Africa. The payability depends on the quality of gold doré delivered, ranging from 99.9% for gold doré containing 90% or more gold content to 95% for gold doré containing 30% or less. Gold doré containing 80% - 89.9% gold content provides a payability of 99.8%. Blyvoor produces gold doré containing on average 85% gold content, hence Minxcon applied a payability of 99.8%. Refer to Section Item 3 (d) II for more information on the stream arrangement also in place.
| |
| RESOURCE | RESERVE | VALUE |
Blyvoor Gold Resources (Pty) Ltd
S-K 1300 Technical Report Summary on the Blyvoor Gold Mine, South Africa | 92 |
ITEM 17 - ENVIRONMENTAL STUDIES, PERMITTING AND PLANS, NEGOTIATIONS, OR AGREEMENTS WITH LOCAL INDIVIDUALS OR GROUPS
Item 17 (a) - Relevant Environmental Issues and Results of Studies Done
The Mine has been in operation since 1937 and is also located in an area that hosts numerous similar gold workings. Prior to mining activities, the land was utilised mainly for grazing. Minimal crop farming was carried out due to the nature of the terrain in the lease area.
During refurbishment, surface and underground infrastructure and installations were assessed for safety, stability, and appropriate working conditions. Refurbishment of infrastructure took place within brownfield footprints on areas already disturbed by prior infrastructure and/or mining activities.
There is sufficient capacity to store initial waste rock from underground workings and tailings from the treatment process. TSF No. 6 is sited in a strategic area where minimal additional impact is likely to occur. Drainage systems and pollution control dams are in place. Waste rock will be deposited on an existing rock dump which is sited away from sensitive areas. The prevention of contaminated water flowing into streams and water course is controlled by the use of pollution control dams, sited at strategic points.
Several protected plant species occur on site, including Vaalbos, Hibiscus and Wild Heliotrope. A large number of invader species were identified, as well as a few exotic species, including Australian Blackwood and Lantana. The local fauna mainly comprises small terrestrial animals such as hedgehogs, tortoises, hares, and reptiles, in addition to a variety of bird species. Although no threatened species occur locally, endangered animals in the area include the aardvark, aardwolf, and civet.
Large areas of the surface are underlain by dolomite and were subjected to various types of surface instability as a result of the historical dewatering of compartments and poor water management. Surface instability consists of the formation of rapidly forming sinkholes that may have catastrophic consequences, or it may consist of gradually forming doline subsidence or depressions which have associated perimeter tension cracks.
On dewatering of a compartment, materials of the blanketing layer may mobilise into a receptacle at depth. This action eventually stabilises, and arching conditions develop in the profile. This meta-stable condition may be disturbed by the development of additional mobilising agencies such as concentrated ingress of surface water or earth tremors. Historically, BGMC maintained drawings and records showing the locations and characteristics of such ground movements.
On eventual closure of a mine and the associated cessation of pumping, the water table will rise and may return to its original level prior to dewatering. Partial water table recharge may also take place as a consequence of a period of excessive rainfall. The subsequent rise in water level may initiate a renewed cycle of ground movement in the form of sinkholes and more gradual surface settlements.
The Far West Rand Dolomitic Water Association (“FWRDWA”) is composed of mines on the Far West Rand who are dewatering dolomitic groundwater compartments as part of their mining operations. The main role of the FWRDWA is to undertake measures to promote the safety of the affected area through controls,
| |
| RESOURCE | RESERVE | VALUE |
Blyvoor Gold Resources (Pty) Ltd
S-K 1300 Technical Report Summary on the Blyvoor Gold Mine, South Africa | 93 |
surveys, investigations, and monitoring. A system involving the individual mines and the Oberholzer Geological Centre is in place for the patrolling of areas, detection of movement areas and follow-up investigations, remedial action and reports. Reports on all movement incidents are sent to the State Coordinating Technical Committee on Sinkholes and Subsidences for information and action where required.
In addition to the above, the placement of water/effluent storage could cause standing water on dolomitic areas this could result in subsidence or collapse. Placement of such infrastructures have therefore been well considered.
Uranium and thorium occur in association with the gold deposits in the region. Ionizing radiation emitted from these radio nuclides and their daughter products can be hazardous to health. Radioactive TSF footprints may emanate radon, making them unsuitable for residential developments. The philosophy of radiation protection is based on the concept of limiting exposure (including exposure to water) and will need to be implemented at the Mine and for post-closure. Blyvoor currently is not discharging pumping water.
The potential exists for acid generation in sulphide rich tailings. The mined material is exposed to the environment with the natural processes of oxidation, biological activity, and leaching by infiltration water. Natural leaching of the contained minerals, with or without acid generation, can carry deleterious substances downstream into the receiving environments.
There is an ingress of significant volumes of groundwater into the underground workings of the area. Neighbouring mines pump water to surface. Blyvoor is flooded to 10 m above 29 Level, above which water is not expected to rise since Harmony/CWC are pumping excess water to surface discharge to protect their downstream operations. These deeper levels will require dewatering before operations can continue at those depths.
Item 17 (b) - Waste Disposal, Site Monitoring and Water Management
Hazardous waste including used oil and grease, and oil sludges from oil separators, is temporarily stored in a central collection point (in a bunded area), such as the on-site salvage yard. The waste will then be removed by a reputable company for recycling disposal.
Scrap metal is sent to the salvage yard and will be removal by an approved scrap dealer for recycling.
A wastewater treatment plant is operational to treat sewerage. The plant is located at PS Shaft and uses the activated sludge process and is designed to handle 1 Ml/day. Treated effluent is discharged to the Wonderfonteinspruit or used for irrigation of vegetated areas on the current TSFs.
| II. | Site Monitoring – Water |
Pre-mine closure in 2013, water samples were collected on a monthly basis on two sites upstream and downstream from the wastewater treatment plant, and underground. Typically, daily samples were collected from discharge water and upstream of discharge points, and the underground pumped water. Regular water monitoring was conducted on underground pumped water. Samples were analysed for pH, TDS, chlorides, hardness, iron, aluminium, suspended solids, cyanide and manganese.
| |
| RESOURCE | RESERVE | VALUE |
Blyvoor Gold Resources (Pty) Ltd
S-K 1300 Technical Report Summary on the Blyvoor Gold Mine, South Africa | 94 |
Ongoing surface and groundwater monitoring programmes are required now that the Blyvoor operations have recommenced and a valid WUL is in place. Currently, CWC (Harmony), who are performing the dewatering activities are undertaking monitoring on a small portion of the Mining Right Area as illustrated in Figure 2 in Item 3(a).
| III. | Site Monitoring – Sinkholes |
Blyvoor Gold intends to initiate a subsidence monitoring programme at the PS Shaft Complex.
| IV. | Site Monitoring – Dust Fallout |
A dust monitoring programme has been in place at the Mine since 2018 and has been compliant during that period. A total of seven sites are analysed on a monthly basis by a SANAS-accredited laboratory. Monitoring is based on the American Society of Testing and Materials standard method for collection and analysis of dust fall (ASTM D1739), with modifications. SANS 1929:2005 has been used to evaluate the level of dust deposition.
| V. | Site Monitoring – Radioactivity |
A monitoring programme for radioactivity was implemented in 2020.
A stormwater management system is in place at the plant with bunding. Water is pumped into a process steel water dam. Stormwater from the Mine site, which flows down a tributary into a Harmony Dam, also impacts on the Doorndraai Dam.
The Mine lies within the catchment of a tributary of the Mooi River, or Western Deep Spruit. In about 1985, a river diversion structure was constructed by the FWRDWA on the Western Deep Spruit just inside the mine property, below the main road between Blyvooruitzicht Gold Mine and West Driefontein Mine. The purpose of the diversion is to take static and low flow water away from the dolomite areas downstream. The design ensures that a moderate and more constant flow of water is made available to the downstream environment. The low flows are diverted, and this results in water being available for other users downstream. The low flows would disappear into the dolomites should the diversion structure not be in place. Diverted water is discharged into the same canal that takes the stormwater from the residential and office areas. Excess water pumped from underground and treated sewage water, is also discharged into the canal system.
Item 17 (c) - Permit Requirements
Permit requirements for the Mine are detailed in Item 3 (f). Blyvoor Mine aims to remain compliant with legislation and all regulations applicable to the mine site.
Item 17 (d) - Social and Community-Related Requirements
As part of the MPRDA requirements for the application for a mining right, the applicant company is required to submit a SLP for the project, which must be updated every 5 years. Programmes with regards to Human Resource Development (“HRD”), Local Economic Development (“LED”) and the Management of Downscaling and Retrenchment are outlined in the SLP. An SLP progress report is required to be submitted to the DMRE regional department annually.
Blyvoor Mine has an updated SLP for 2022 to 2026 period that was submitted and accepted by DMRE for this reporting period.
The SLP is compiled in line with the following principles:-
| ● | defined area of influence extends out to a 10–15 km radius from the project area; |
| |
| RESOURCE | RESERVE | VALUE |
Blyvoor Gold Resources (Pty) Ltd
S-K 1300 Technical Report Summary on the Blyvoor Gold Mine, South Africa | 95 |
| ● | promote the employment of locals from the Merafong City Local Municipality wherever possible; |
| ● | promote local procurement of goods and services wherever possible; |
| ● | support diversification of the local economy; and |
| ● | support LED projects that are feasible and sustainable. |
At least 70% of the workforce will be locally recruited from the Merafong City Local Municipality and the West Rand District Municipality, with the remaining 30% anticipated to be recruited from the rest of South Africa.
A training and development programme has been implemented to ensure employees are competent in their positions. Adult basic education and training, or ABET, is undertaken. Training and development objectives focus on literacy and numeracy skills development for all employees; ABET training is also offered to community members. A skills audit will be undertaken 6-12 months, to align training and development initiatives with the needs of the workforce.
Two internal and two external learnerships in equipment operations will be provided annually from the first year of production.
It is intended that portable skills training will initially be offered through an accredited and reputable institution.
A detailed career progression plan is provided in the SLP. It is intended that a mentorship plan will be linked to the talent pool and individual development plans, and also to performance assessment outcomes and individual training and development needs. Employee bursaries relevant to their career development will be offered. HDSA employees will be particularly encouraged to apply. Bursaries will also be made available to applicants from neighbouring communities. Internships will be offered to external students from neighbouring communities.
The employment equity plan aims to include into the workforce 10% women and 40% HDSA participation in management.
The following LED projects are proposed, as per the SLP:-
| ● | training on all mining related skills which will include community members aimed at future employment opportunities; |
| ● | provision of financial assistance towards refurbishment of the Ekuphakameni Wastewater Treatment Works, and assistance with running of the plant; |
| ● | clean storm water channels in the Blyvoor Village; |
| ● | reinstate and maintain the waste management service in the Blyvoor Village; and |
| ● | provide financial assistance to the Blyvoor schools and orphanage for mutually identified and agreed to projects and needs. |
Financial provision for the HRD programme, LED programme, and process of management of downscaling and retrenchment projects is calculated in the 2017 SLP to a total amount of ZAR62,320,000 over five years; the new figure is under revision for the next 5-year period.
Item 17 (e) - Mine Closure Plans and Costs
The ultimate closure objective will be to return the disturbed land as close to its initial natural state as practically possible, and thus maintain the overall ecological and environmental balance. Decommissioning will require final rehabilitation of infrastructure and reclaimed TSF footprints, and groundwater risk mitigation.
| |
| RESOURCE | RESERVE | VALUE |
Blyvoor Gold Resources (Pty) Ltd
S-K 1300 Technical Report Summary on the Blyvoor Gold Mine, South Africa | 96 |
Residual effects of salinisation and compaction will persist after removal of a TSF, processing plant or shaft infrastructure, which may limit return of these areas to their pre-mining land capability and land use. Testing and remediation measures to decontaminate the site would need to be implemented, and it should be ensured that the site is free draining and appropriately vegetated to yield a self-sustaining plant cover.
During and after mine closure, the demolition of surface infrastructure and services will be confined to those that cannot be effectively utilised. All surface shafts will be sealed (2000 EMP). Decommissioning of infrastructure and final site rehabilitation may generate noise and dust and will require active management. Mine infrastructure may qualify as heritage infrastructure by the time that the mine is closed. A heritage assessment will thus be required prior to any demolition activities.
Mine closure planning and execution will include detailed human resource planning, including retrenchment considerations, and the opportunity for re-training employees to enhance employment and livelihood prospects post mine closure. Mine closure management measures as outlined in the SLP will be adhered to. Staff numbers will gradually be reduced during the decommissioning and closure phase.
Detailed closure planning is described in the approved EIA, and associated costs are included in the liabilities described in Item 3 (e).
Item 17 (f) - Adequacy of Current Plans
It is the opinion of the QPs that Blyvoor Mine has adequate plans, protocols and execution strategies in place to remain compliant with social and environmental obligations. No risks were identified.
Item 17 (g) - Local Procurement and Hiring
The main priority of Blyvoor with respect to procurement of goods and services is to procure such goods and services from within South Africa. The Company further emphasises the procurement of goods and services from local businesses. This approach recognises the importance of providing benefits to the local community by creating sustainable business opportunities with local enterprises, as well as of the need to work with and build capacity of local suppliers in a way that enables them to become more competitive and profitable. Nonetheless, the cost, quality, and availability of goods and services are an important consideration when a procurement decision is being made. If goods or services are not available within South Africa or if there is a significant benefit to buying outside of South Africa, Blyvoor would buy elsewhere.
The Company preferentially recruits South African persons with the level of skill and experience required of the relevant position. In particular, the Company’s recruitment approach reflects the reality that local communities have expectations about participating in new job opportunities, particularly at the semi-skilled and unskilled levels.
| |
| RESOURCE | RESERVE | VALUE |
Blyvoor Gold Resources (Pty) Ltd
S-K 1300 Technical Report Summary on the Blyvoor Gold Mine, South Africa | 97 |
ITEM 18 - CAPITAL AND OPERATING COSTS
Item 18 (a) - Capital Costs
Mining and Infrastructure
Blyvoor Gold compiled a capital cost estimate for the recommissioning of the Blyvoor Gold Project. The execution of the project commenced in June 2018. A large portion of the capital has been spent to date. Plant construction was completed in January 2021.
The project is targeting initially to achieve some 40 ktpm production and then increasing up to 80 ktpm which will be require additional capital to be spent. A capital estimation has been completed for the mining infrastructure and equipment required to meet the increased targeted production demand.
The mining and infrastructure capital budget was compiled by Blyvoor. The budget provides for the direct mining capital requirements excluding expansion capital for the initial 5 years of the operation from the effective date of this report. An additional estimation was done for any additional capital requirements not included in the Blyvoor 5-year budget as well as for the capital requirements after year 5. A summary of the capital estimation for direct mining and infrastructure is listed in Table 35.
Table 35: Mining and Infrastructure Capital Cost Estimate
Mining and
Infrastructure Capital | Over LoM | LoM | Year 1 | Year 2 | Year 3 |
| Unit |
| UG Pump Stations | USDm | 4.30 | 0.00 | 0.19 | 0.00 |
| Stopes | USDm | 2.50 | 0.20 | 0.73 | 0.20 |
| Shafts | USDm | 29.50 | 5.50 | 7.33 | 7.01 |
| UG Substations | USDm | 8.70 | 0.90 | 1.44 | 0.75 |
| Surface Substations | USDm | 15.60 | 2.52 | 4.40 | 0.30 |
| UG Power Reticulation | USDm | 5.00 | 0.00 | 0.00 | 0.00 |
| Winders | USDm | 0.20 | 0.17 | 0.04 | 0.00 |
| Fans | USDm | 15.40 | 0.00 | 4.59 | 2.25 |
| Compressed Air | USDm | 0.10 | 0.00 | 0.00 | 0.03 |
| Refrigeration Plant | USDm | 4.80 | 0.00 | 0.00 | 0.00 |
| UG Workshops | USDm | 0.20 | 0.15 | 0.07 | 0.00 |
| Battery Bays | USDm | 1.00 | 0.00 | 0.00 | 0.00 |
| Haulages & X-Cuts | USDm | 3.20 | 0.16 | 0.17 | 2.87 |
| UG Material & Ore Transport | USDm | 27.20 | 3.55 | 6.02 | 5.70 |
| Lamp room | USDm | 10.40 | 1.83 | 1.35 | 1.16 |
| Loading Station | USDm | 2.00 | 0.12 | 0.38 | 0.40 |
| Stope Equipping | USDm | 5.50 | 0.52 | 1.28 | 1.25 |
| General Infrastructure | USDm | 0.60 | 0.00 | 0.00 | 0.61 |
| Production | USDm | 4.30 | 0.00 | 0.19 | 0.00 |
| Sevices | USDm | 2.50 | 0.20 | 0.73 | 0.20 |
| Environmental & Vent | USDm | 29.50 | 5.50 | 7.33 | 7.01 |
| Winder house | USDm | 8.70 | 0.90 | 1.44 | 0.75 |
| P&G’s / EPCM | USDm | 15.60 | 2.52 | 4.40 | 0.30 |
| Chairlift | USDm | 5.00 | 0.00 | 0.00 | 0.00 |
| Total | USDm | 136.20 | 15.63 | 27.99 | 22.52 |
Processing
Capital costs supplied by Blyvoor Gold were verified to be sufficient to enhance the RoM processing capacity to 80 ktpm. This requires adherence to planned execution within a time frame of approximately two years from the date of this report. Specifically, the estimated costs were verified to be relevant for planned spend
| |
| RESOURCE | RESERVE | VALUE |
Blyvoor Gold Resources (Pty) Ltd
S-K 1300 Technical Report Summary on the Blyvoor Gold Mine, South Africa | 98 |
to equip the current process plant with the required additional capacity for crushing, milling, thickening, leaching, adsorption (CIP), desorption (elution), carbon regeneration, electrowinning and smelting.
The provision for additional TSF capacity 25 years from the date of this report is based on current costs for a similar TSF capacity. The justification for additional TSF capacity stems from an enlarged processing requirement of 30.2 Mt against a previous 20.7 Mt. Should tailings be reprocessed, the requirement for provisioning of additional TSF capacity may not be required. The plant capital summary is detailed in Table 36.
Table 36: Plant Capital Summary
| Plant Capital | Over LoM | LoM | Year 1 | Year 2 | Year 3 |
| Plant Expansion | USDm | 7.9 | 0.2 | 3.7 | 4.0 |
| TSF Expansion | USDm | 20.9 | 0.0 | 0.0 | 0.0 |
| Wet screen and Tertiary Crusher | USDm | 1.1 | 0.0 | 1.1 | 0.0 |
| Workshop & Change House | USDm | 0.3 | 0.3 | 0.0 | 0.0 |
| Total Direct Plant Capital | USDm | 30.2 | 0.5 | 4.8 | 4.0 |
Other Capital Expenditure and Capital Cost Summary
A renewals and replacement or stay in business (SIB) capital cost was also included for the mining and the plant. The cost is based on a percentage of the operating cost. The mining SIB capital is based on 5% of the mining operating cost and is be phased in from year 3 of operation. The plant SIB is based on 5% of the plant operating cost and is similarly phased in starting in year 3 of operation. A 15% contingency was also applied to capital.
It should be noted that waste development has been capitalised to either expansion capital (15 ktpm to 80 ktpm) and sustaining capital (currently at 15 ktpm, and all capitalised cost once 80 ktpm reached).
Table 37 details the capital summary over the LoM, Year 1 (FY25), Year 2 (FY26) and Year 3 (FY27).
| |
| RESOURCE | RESERVE | VALUE |
Blyvoor Gold Resources (Pty) Ltd
S-K 1300 Technical Report Summary on the Blyvoor Gold Mine, South Africa | 99 |
Table 37: Capital Summary
| Capital Expenditure | Over LoM | LoM | Year 1 | Year 2 | Year 3 |
| Mining Capital | Unit | | | | |
| UG Pump Stations | USDm | 4.3 | 0.0 | 0.2 | 0.0 |
| Stope Equipping | USDm | 2.5 | 0.2 | 0.7 | 0.2 |
| Shafts | USDm | 29.5 | 5.5 | 7.3 | 7.0 |
| Electrical Reticulation | USDm | 8.7 | 0.9 | 1.4 | 0.8 |
| Winders | USDm | 15.6 | 2.5 | 4.4 | 0.3 |
| Fans | USDm | 5.0 | 0.0 | 0.0 | 0.0 |
| Compressed Air | USDm | 0.2 | 0.2 | 0.0 | 0.0 |
| Refrigeration Plant | USDm | 15.4 | 0.0 | 4.6 | 2.3 |
| UG Logistics Services | USDm | 0.1 | 0.0 | 0.0 | 0.0 |
| UG Material & Ore Transport | USDm | 4.8 | 0.0 | 0.0 | 0.0 |
| Lamp room | USDm | 0.2 | 0.2 | 0.1 | 0.0 |
| Loading Station | USDm | 1.0 | 0.0 | 0.0 | 0.0 |
| General Infrastructure | USDm | 3.2 | 0.2 | 0.2 | 2.9 |
| Production | USDm | 27.2 | 3.6 | 6.0 | 5.7 |
| Services | USDm | 10.4 | 1.8 | 1.3 | 1.2 |
| Environmental & Vent | USDm | 2.0 | 0.1 | 0.4 | 0.4 |
| P&G’s / EPCM | USDm | 5.5 | 0.5 | 1.3 | 1.3 |
| Chairlift | USDm | 0.6 | 0.0 | 0.0 | 0.6 |
| Capitalised Expansion CAPEX | USDm | 36.1 | 6.9 | 4.0 | 4.7 |
| Total Direct Mining Capital | USDm | 172.3 | 22.6 | 32.0 | 27.2 |
| Capitalised Sustaining CAPEX | USDm | 280.1 | 2.4 | 2.2 | 4.1 |
| Renewals and Replacement Capital | USDm | 108.9 | 0.0 | 0.0 | 0.9 |
| Stay in Business Mining Capital | USDm | 389.0 | 2.4 | 2.2 | 5.0 |
| Mining Capital Contingency | USDm | 36.2 | 2.8 | 4.5 | 3.9 |
| Total Mining Capital | USDm | 597.5 | 27.8 | 38.8 | 36.2 |
| Plant Capital | | | | | |
| Plant Expansion | USDm | 7.9 | 0.2 | 3.7 | 4.0 |
| TSF Expansion | USDm | 20.9 | 0.0 | 0.0 | 0.0 |
| Wet screen and Trertiary Crusher | USDm | 1.1 | 0.0 | 1.1 | 0.0 |
| Workshop & Change House | USDm | 0.3 | 0.3 | 0.0 | 0.0 |
| Total Direct Plant Capital | USDm | 30.2 | 0.5 | 4.8 | 4.0 |
| Stay in Business Plant Capital | USDm | 32.5 | 0.0 | 0.0 | 0.4 |
| Plant Capital Contingency | USDm | 4.5 | 0.1 | 0.7 | 0.6 |
| Total Plant Capital | USDm | 67.2 | 0.6 | 5.5 | 4.9 |
| Total Expansion Capital | USDm | 202.5 | 23.1 | 36.8 | 31.2 |
| Total SIB Capital | USDm | 421.5 | 2.4 | 2.2 | 5.4 |
| Total Capital Contingencies | USDm | 40.7 | 2.9 | 5.2 | 4.5 |
| Total Capital | USDm | 664.7 | 28.4 | 44.2 | 41.1 |
Capital Expenditure Schedule
The capital schedule over the LoM is illustrated in Figure 38. The total capital including the sustaining capital and contingencies amounts to USD665 million over the LoM.
The capital planned for year 1 (FY25) of USD28.4 million and for year 2 (FY25) of USD44.2 million is not fully offset by free cash flows in these years and results in a peak funding requirement of USD29 million in month 20 (October 2025).
The production profile and mine development plan shown in this report relies on access to these funds to achieve the stated results. The Competent Valuator has been informed that the funding is intended to be raised by way of a fund raising with the listing of the Company’s holding company, which is anticipated for August or September 2024.
| |
| RESOURCE | RESERVE | VALUE |
Blyvoor Gold Resources (Pty) Ltd
S-K 1300 Technical Report Summary on the Blyvoor Gold Mine, South Africa | 100 |
Figure 38: Capital Schedule
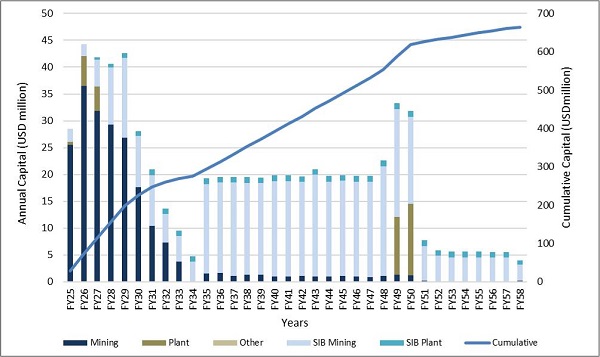
Item 18 (b) - Operating Cost
Minxcon reviewed the Blyvoor actual costs over 2023 along with the provided budgets to determine appropriate costing to be used in the financial modelling. The following section provides an overview of the costs utilised.
Mining
Stoping costs were reviewed on a ZAR/m2. The actual 12-month average stoping costs excluding labour is ZAR1,104/m2. It was noted that the actual stoping costs reported included capital items and inefficiencies due to current ramp-up. Minxcon workshopped the operating cost with the Blyvoor management team and calculated a stoping cost of ZAR793/m2 as illustrated in Table 38.
Table 38: Stoping Consumables Cost
| Stoping Consumables | Unit | Cost |
| Consumables | ZAR/m2 | 184 |
| Drill & Blast | ZAR/m2 | 258 |
| Support | ZAR/m2 | 350 |
| Total | ZAR/m2 | 793 |
Figure 39 illustrates the actual stoping costs excluding labour along with the actual m2 achieved for the 12 months to February 2024.
| |
| RESOURCE | RESERVE | VALUE |
Blyvoor Gold Resources (Pty) Ltd
S-K 1300 Technical Report Summary on the Blyvoor Gold Mine, South Africa | 101 |
Figure 39: Actual Stoping Operating Cost (excluding Labour)
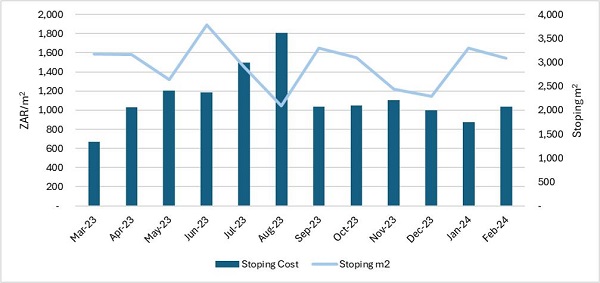
The stoping labour operating costs was calculated from first principles considering the required crews to achieve the planned m2 in the LoM plan. Current operating costs would skew the costs significantly as the mine currently has 19 crews employed, but only 13 panels open. This is indicative of an operation in ramp-up with additional crews in training or preparing new stopes. The stoping crews were therefore scheduled considering a monthly crew production rate of 320 m2 with at least two additional crews employed before they are required to account for training time. Figure 40 illustrates the stoping crew build-up over the LoM that forms the basis of the stoping labour operating costs. The average stoping labour operating cost over the LoM was calculated at ZAR1,331/m2 (~USD69/m2).
Figure 40: Stoping Crew Build-up
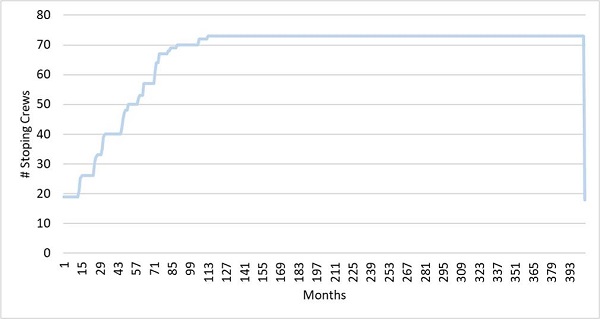
| |
| RESOURCE | RESERVE | VALUE |
Blyvoor Gold Resources (Pty) Ltd
S-K 1300 Technical Report Summary on the Blyvoor Gold Mine, South Africa | 102 |
The development costs were reviewed on a ZAR/m basis. The development costs excluding labour, i.e. consumables, was budgeted for various development types as set out in Table 39. The actual 12-month average development costs excluding labour is ZAR10,050/m (~USD530/m) for all development. Minxcon opted to use the more accurate budget development costs as these are costed per development type and the actual costs also include some capital items.
Table 39: Development Consumables Cost
Development Consumables | Unit | Flat Development | T/Way | Ore Pass | Raise |
| Consumables | ZAR/m | 9,673 | 2,533 | 1,113 | 1,405 |
| Drill & Blast | ZAR/m | 1,375 | 1,125 | 1,407 | 1,161 |
| Total | ZAR/m | 11,048 | 3,658 | 2,520 | 2,566 |
Figure 41 illustrates the actual and budget development costs excluding labour along with the actual development meters achieved for the eleven months to February 2024. March 2023 was excluded as it included significant capital.
Figure 41: Actual Development Cost (Excluding Labour)
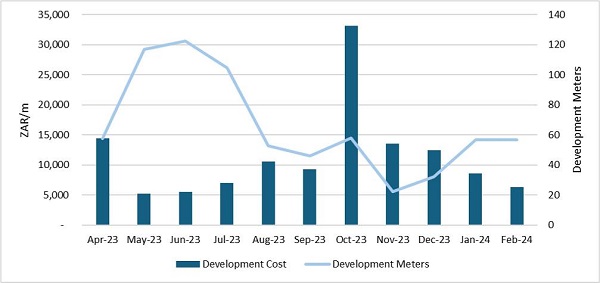
Similar to the stoping labour, the development labour operating costs were calculated from first principles considering the required crews to achieve the planned meters in the LoM plan. The various development types were scheduled in the LoM plan with the advance per month per development type determining the number of crews required, and in turn the development labour numbers. The development schedule is erratic; hence the number of crews were averaged for three-year periods to allow for a more stable labour compliment. Figure 42 illustrates the calculated development labour numbers over the LoM. The average development labour cost is ZAR9,179/m (USD481/m) over the LoM.
| |
| RESOURCE | RESERVE | VALUE |
Blyvoor Gold Resources (Pty) Ltd
S-K 1300 Technical Report Summary on the Blyvoor Gold Mine, South Africa | 103 |
Figure 42: Development Labour Numbers
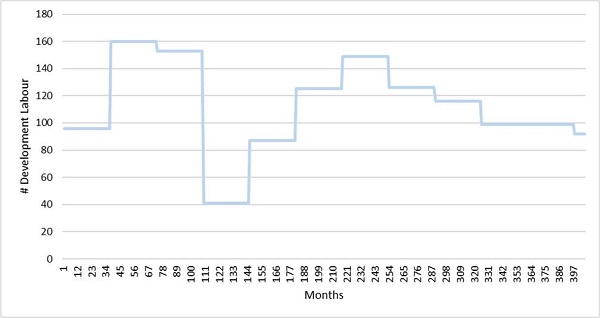
The opening up costs were reviewed on a ZAR/m basis. The opening up costs excluding labour, i.e. consumables, was budgeted at ZAR9,673/m (~USD507/m). The budget number was estimated from first principles and accepted as sufficiently accurate for financial modelling. Actual opening up costs reported on-mine averaged approximately ZAR11,100/m and was not considered as this cost includes some capital items and are based on contractor figures. The opening up will be completed by the owner team going forward. The labour for opening up applied in the financial model was similarly calculated from first principles by the mine at ZAR8,231/m (~USD431/m).
Tramming or underground material transport labour was calculated using the current actual labour costs at the current underground logistics capacity of 25 ktpm. The average tramming labour was calculated at ZAR144/t (~USD7.5/t).
The engineering consumable costs were reviewed on a ZAR/t (treated tonne) basis. The engineering costs averaged ZAR180/t in the 12 months to February 2024. Minxcon opted to use the actual cost of ZAR180/t (~USD9.5/t) for financial modelling. An additional ZAR4.6/t (~USD0.2/t) was calculated for refrigeration from month 60. Figure 43 illustrates the actual engineering operating costs excluding labour.
| |
| RESOURCE | RESERVE | VALUE |
Blyvoor Gold Resources (Pty) Ltd
S-K 1300 Technical Report Summary on the Blyvoor Gold Mine, South Africa | 104 |
Figure 43: Actual Engineering Operating Cost (excluding Labour)
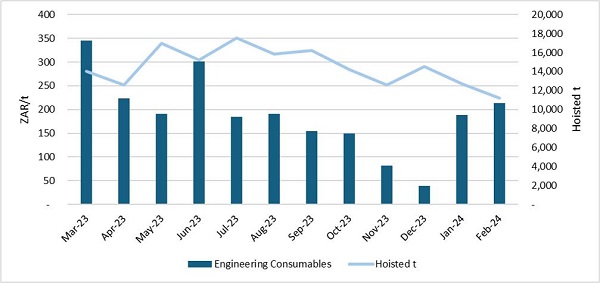
The fixed engineering labour and the fixed mining labour was based on the current and planned engineering and mining management labour. The variable engineering labour was calculated on a ZAR/t basis considering the current engineering team and the current achieved tonnes. The engineering labour was calculated at ZAR124/t (~USD6.5/t).
Power cost for the Blyvoor operations has been estimated based on current consumption and the associate ZAR/kWh unit costs sourced from actual electrical bills. A first principle estimate has been done to determine the increase in power consumption with the ramp up of production and the expansion of the operation and the supporting infrastructure. The estimate was completed on the hand of a project load list and the estimated usage time to determine the total kWh consumption. The ZAR/kWh unit cost was then applied to the consumption to obtain the monthly power costs.
Based on the load list, the monthly power cost estimate was apportioned and allocated to mining and processing based on the percentage of average consumption of each. The allocation to mining and processing amounted to 67% and 33% respectively.
Similar to the power costs, water costs for the Blyvoor operations were estimated based on current consumption and the associate ZAR/m³ unit costs sourced from actual water supply bills. A first principles estimate has been done to determine the increase in water consumption with the ramp up of production and the expansion of the operation and the supporting infrastructure. The estimate was completed based on the estimated project water consumption. The ZAR/m³ unit cost was then applied to the consumption to obtain the monthly water costs.
Other mining and engineering consumables were calculated from actual costs and applied on a ZAR/t basis. Table 40 details the weighted average mining driven operating costs. It should be noted that waste development has been capitalised to either expansion capital (15 ktpm to 80 ktpm) and sustaining capital (currently at 15 ktpm, and all capitalised cost once 80 ktpm reached).
| |
| RESOURCE | RESERVE | VALUE |
Blyvoor Gold Resources (Pty) Ltd
S-K 1300 Technical Report Summary on the Blyvoor Gold Mine, South Africa | 105 |
Table 40: Mining Operating Costs Summary
| Description | Unit | Cost |
| Fixed Mining Labour | USD/Month | 19,000 |
| Fixed Engineering Labour | USD/Month | 84,000 |
| Total Fixed Mining | USD/Month | 103,000 |
| Power | USD/t | 16.0 |
| Stoping | USD/Stope m2 | 111.0 |
| Reef Development | USD/m | 630.0 |
| Waste Development - Flat Ends | USD/m | 1,041.0 |
| Waste Development - T/Way | USD/m | 665.0 |
| Waste Development - Boxholes/Orepass | USD/m | 611.0 |
| Development Opening Up | USD/m | 938.0 |
| General Mining Consumables | USD/t | 2.1 |
| Engineering Labour | USD/t | 6.5 |
| Water | USD/t | 0.4 |
| Engineering Stores/Consumables and Major Items | USD/t | 9.7 |
| Tramming Labour | USD/t | 7.5 |
| Capitalised Expansion CAPEX | USD/t | -1.3 |
| Capitalised Sustaining CAPEX | USD/t | -9.7 |
| Total Variable Mining | USD/t | 73.0 |
Processing
The processing costs were reviewed on a ZAR/t treated basis. The processing costs excluding labour, i.e. consumables, was budgeted at ZAR210/t. The actual FY24 processing costs excluding labour is higher at ZAR256/t for processing. Minxcon reviewed and accepted the budgeted processing costs, which are based on six-months actual costs costs for maintenance with additional contingencies and actual reagents costs, hence the ZAR210/t (~USD11/t) was considered for financial modelling. The split between reagents and plant engineering is USD6.0/t and USD5.0/t, respectively. Figure 41 illustrates the actual and budget processing costs excluding labour along with the actual treated tonnes in FY24.
Figure 44: Actual Plant Operating Costs (excluding Labour and Power)
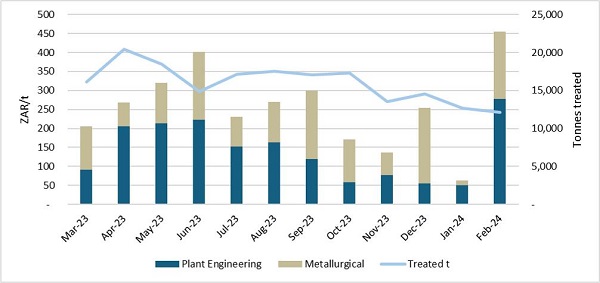
The plant labour and the plant contractors (TSF monitoring) were based on the current and planned labour numbers and averages ZAR4.6 million per month at steady state (~USD238,000 per month) ramping up from ZAR2.3 miliion per month (~USD121,000 per month). Table 41 details the average plant operating cost.
| |
| RESOURCE | RESERVE | VALUE |
Blyvoor Gold Resources (Pty) Ltd
S-K 1300 Technical Report Summary on the Blyvoor Gold Mine, South Africa | 106 |
Table 41: Plant Operating Costs Summary
| Description | Unit | Cost |
| Plant Contractors | USD/Month | 4,000 |
| Labour | USD/Month | 218,000 |
| Total Fixed Plant | USD/Month | 222,000 |
| Reagents | USD/t | 5.0 |
| Maintenance and Engineering | USD/t | 6.0 |
| Power | USD/t | 8.0 |
| Total Variable Plant | USD/t | 19.0 |
Overheads and Other Costs
Table 42 details the average overhead and selling costs over the LoM. The overhead costs are calculated as per Blyvoor’s budget and are reflective of the actual expected expenditure. The selling costs are as per the 2023 Rand Refinery contract in place (unchanged at effective date) as well as actual helicopter charges.
Table 42: Overhead and Selling Operating Costs Summary
| Description | Unit | Cost |
| On-mine Overheads | USD/Month | 151,000 |
| Community Costs (SLP) | USD/Month | 45,000 |
| Outsourced Services | USD/Month | 59,000 |
| Engineering Contractors | USD/Month | 102,000 |
| Central Services Labour | USD/Month | 325,000 |
| Total Fixed Central Services | USD/Month | 682,000 |
| Refining fee | USD/kg | 14.2 |
| Location fee | USD/payable oz | 1.0 |
| Helicopter Charges (4x per month) | USD/trip | 690 |
| Administration Fee | USD/kg | 0.1 |
| Overhead Consumables | USD/t | 9.6 |
| Total Variable Central Services | USD/t | 10.0 |
The average corporate overhead costs over the LoM are detailed in Table 43 as per Blyvoor’s budget.
Table 43: Corporate Costs Summary
| Description | Unit | Cost |
| Audit fees | USD/Month | 9,000 |
| Legal | USD/Month | 17,000 |
| Total Fixed Corporate | USD/Month | 26,000 |
The rehabilitation liability payment schedule is illustrated in Figure 45, with the 2020 costs already sunk and not forming part of the cash flow.
| |
| RESOURCE | RESERVE | VALUE |
Blyvoor Gold Resources (Pty) Ltd
S-K 1300 Technical Report Summary on the Blyvoor Gold Mine, South Africa | 107 |
Figure 45: Rehabilitation Payment Schedule
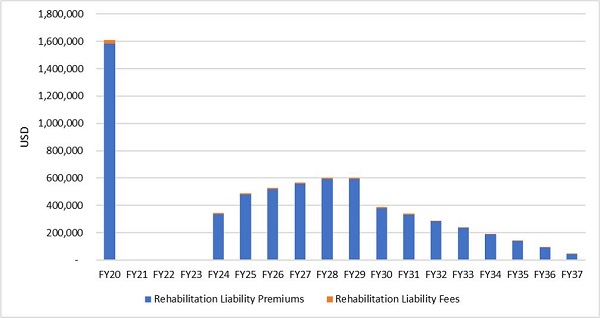
A 5% contingency allowance has been made for all operating costs and capitalised operating expenditure and a 15% contingency has been applied to all capital expenditure. The lower contingency on the operating costs reflect that the majority of operating costs are based on actual operating costs on the mine. The higher contingency on the capital expenditure reflects the lower level of confidence in the accuracy of capital estimates.
A sensitivity to the operating cost applied is included in Item 19 (d).
| I. | Financial Costs Indicators |
The operating costs in the financial model were reported into different categories as defined by the World Gold Council. The Adjusted Operating Cost represents the cash cost incurred at each processing stage, from mining through to recoverable metal delivered to market, and, if any, less net by-product credits. In addition, royalty taxes are included in Adjusted Operating Costs. Costs are reported as “per oz” of gold. The operating margin is defined as metal price received minus Adjusted Operating Costs. AISC is the sum of net Adjusted Operating Costs (Operating), Sustaining Capital, reclamation costs and other non-direct operating costs. The AISC margin is defined as metal price received per ore tonne or gold ounce minus the AISC, over the metal price received. AIC is the sum of the AISC, all non-sustaining capital costs (including expansion capital) and non-current operational costs. The AIC margin is defined as metal price received per ore tonne or gold ounce minus the AIC, over the metal price received.
Costs reported for the Mine on this basis are displayed per plant feed tonne as well as per recovered gold ounce in Table 44. It should be noted that a 5% contingency was applied to all operating costs and a 15% contingency was applied to capital costs. A sensitivity analysis to increase in OPEX and CAPEX is included in Item 19 (d).
| |
| RESOURCE | RESERVE | VALUE |
Blyvoor Gold Resources (Pty) Ltd
S-K 1300 Technical Report Summary on the Blyvoor Gold Mine, South Africa | 108 |
Table 44: Project Cost Indicators
| Item | Unit | Blyvoor Gold |
| Net Turnover | USD/Milled tonne | 308 |
| Mine Cost | USD/Milled tonne | 78 |
| Plant Costs | USD/Milled tonne | 24 |
| Other Costs | USD/Milled tonne | 21 |
| Royalties | USD/Milled tonne | 14 |
| Operating Costs | USD/Milled tonne | 137 |
| SIB | USD/Milled tonne | 15 |
| Reclamation | USD/Milled tonne | 0 |
| Other Costs | USD/Milled tonne | 0 |
| All-in Sustaining Costs (AISC) | USD/Milled tonne | 152 |
| Expansion Capital | USD/Milled tonne | 8 |
| Other Cash Costs | USD/Milled tonne | 0 |
| All-in Costs (AIC) | USD/Milled tonne | 161 |
| All-in Cost Margin | % | 48% |
| EBITDA* | USD/Milled tonne | 171 |
| EBITDA Margin | % | 55% |
| Gold Recovered | oz | 4,853,618 |
| Net Turnover | USD/Gold oz | 1,833 |
| Mine Cost | USD/Gold oz | 466 |
| Plant Costs | USD/Gold oz | 141 |
| Other Costs | USD/Gold oz | 126 |
| Royalties | USD/Gold oz | 82 |
| Operating Costs | USD/Gold oz | 815 |
| SIB Capex | USD/Gold oz | 87 |
| Reclamation | USD/Gold oz | 1 |
| Other Costs | USD/Gold oz | 2 |
| All-in Sustaining Costs (AISC) | USD/Gold oz | 905 |
| Expansion Capital | USD/Gold oz | 49 |
| Other Cash Costs | USD/Gold oz | 0 |
| All-in Costs (AIC) | USD/Gold oz | 954 |
| EBITDA* | USD/Gold oz | 1,015 |
Notes:
| 1. | * EBITDA excludes capital expenditure. |
| 2. | Costs Includes Contingencies |
Blyvoor Mine has an AISC of USD152/milled tonne equating to USD905/oz. The AIC for Blyvoor Mine is USD161/milled tonne which equates to USD954/oz.
Figure 46 illustrates the Adjusted Operating Cost per year against the milled tonnes over the LoM. The Adjusted Operating Costs over the LoM averaged USD137/milled tonne.
| |
| RESOURCE | RESERVE | VALUE |
Blyvoor Gold Resources (Pty) Ltd
S-K 1300 Technical Report Summary on the Blyvoor Gold Mine, South Africa | 109 |
Figure 46: Adjusted Operating Cost vs. Milled Tonnes
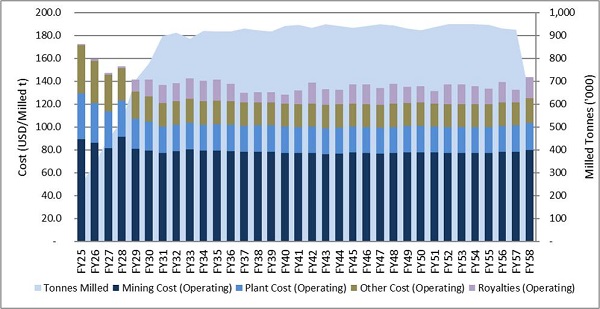
The AISC is displayed in Figure 47 per recovered ounce together with the average gold price of USD1,909/oz that was used in the financial model.
Figure 47: AISC vs. Gold Price
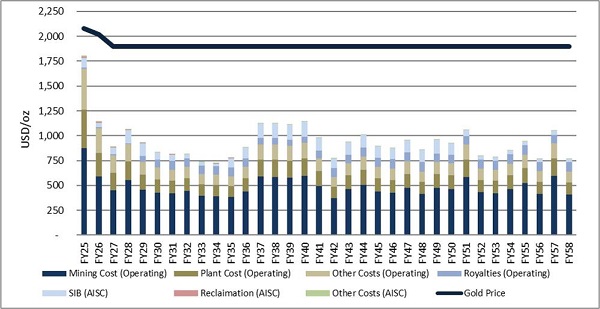
Figure 48 illustrates the AIC per recovered ounce together with the average gold price of USD1,909/oz that was used in the financial model.
| |
| RESOURCE | RESERVE | VALUE |
Blyvoor Gold Resources (Pty) Ltd
S-K 1300 Technical Report Summary on the Blyvoor Gold Mine, South Africa | 110 |
Figure 48: AIC vs. Gold Price
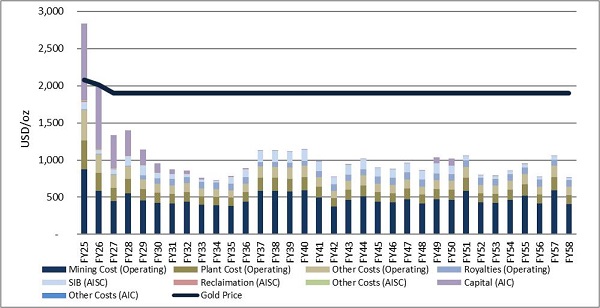
Item 18 (c) - Accuracy of Estimates
Blyvoor Mine is an operating mine. Costs are a combination of actual costs and costs from the mine budgets and are deemed accurate to within a 10% to 15% range for the operating costs and 15% to 25% for the capital costs overall. The basis of this TRS is a life of mine plan, which is of sufficient detail to support declaration of Mineral Reserves.
| |
| RESOURCE | RESERVE | VALUE |
Blyvoor Gold Resources (Pty) Ltd
S-K 1300 Technical Report Summary on the Blyvoor Gold Mine, South Africa | 111 |
ITEM 19 - ECONOMIC ANALYSIS
The purpose of this section is to demonstrate the economic viability of the Mine Plan in order to declare updated Mineral Reserves.
Value relates to a specific point in time. The effective date for the economic analysis is 29 February 2024.
The evaluator performed an independent economic analysis on the Mine’s diluted Indicated and Measured Mineral Resources for conversion to Mineral Reserves. The Mine has a budget plan based on a compliant mine plan with Indicated and Measured Mineral Resources. Thus, the income approach was applied on the total mineable reserve incorporated in the detailed mine plan as the primary economic analysis methodology in determining the economic viability for conversion to Mineral Reserves.
Item 19 (a) - Principal Assumptions
The scope of this economic analysis exercise was to determine the financial viability of the diluted Indicated and Measured Mineral Resources in the LoM plan, for conversion to Mineral Reserves. This is illustrated by using the DCF method on a Free cash flow to firm (“FCFF”) basis, to calculate the net present value (“NPV”) and subsequently, the intrinsic value of the Mine in real terms. The NPV is derived from post-royalties and tax, pre-debt real cash flows, after taking into account operating costs, capital expenditures for the mining operations and the processing plant and using forecast macro-economic parameters.
| I. | Basis of Evaluation of the Mining Assets |
In generating the financial model and deriving the economic analysis, the following were considered:-
| ● | This Report details the optimised cash flow model with economic input parameters. |
| ● | The cash flow model is in constant money terms and completed in ZAR. |
| ● | The cash flow model is subsequently converted to USD terms using the exchange rate forecast. |
| ● | The DCF economic analysis was set up in financial years with the model staring in March 2024, hence the first year includes 12 months. |
| ● | A hurdle rate of 11.89% (in real terms) was calculated for the discount factor. |
| ● | The impact of the Mineral Royalties Act using the formula for refined metals. |
| ● | The impact of existing streaming agreements was considered. |
| ● | Sensitivity analyses were performed to ascertain the impact of discount factors, commodity prices, exchange rate, grade, working costs and capital expenditures. |
| ● | Economic analysis of the tax entity was performed on a stand-alone basis. |
| ● | The full value of the operation was reported for Blyvoor Mine as well as oftributable values to the Company, i.e. 74%. |
| ● | The value which is being reported on does not consider the possible value-enhancing effects of an optimal structure, i.e. of the most appropriate mix of equity and debt. |
| II. | Macro-Economic Forecasts |
The following section includes the macro-economic and commodity price forecasts for the operation over the LoM. Forecast data is based on projections for the different commodity prices and the country-specific macro-economic parameters and is in financial years from March to February starting March 2024.
Both the ZAR/USD exchange rate and USD commodity prices are in real money terms. Table 45 illustrates the forecasts for the first three years as well as the long-term forecast used in the financial model. The price forecast and short-term exchange rate is taken as the median of various analyst and bank forecasts,
| |
| RESOURCE | RESERVE | VALUE |
Blyvoor Gold Resources (Pty) Ltd
S-K 1300 Technical Report Summary on the Blyvoor Gold Mine, South Africa | 112 |
with the long-term prices calculated in-house. The medium and long-term exchange rate forecast was calculated in-house using the inflation adjusted purchasing price parity of the ZAR to USD. The inflation rate forecasts were sourced from the International Monetary Fund (“IMF”).
Table 45: Macro-Economic Forecasts and Commodity Prices over the Life of Mine
| Basis | Item | Unit | 2024 | 2025 | 2026 | 2027 | 2028 | LT |
| Calendar Years (Real) | Gold Price | USD/oz | 2,086 | 2,040 | 1,900 | 1,900 | 1,900 | 1,900 |
| Financial Years (Real) | Gold Price | USD/oz | N/A | 2,078 | 2,016 | 1,900 | 1,900 | 1,900 |
| Calendar Years (Real) | Exchange Rate | ZAR/USD | 18.80 | 18.10 | 18.45 | 18.80 | 19.15 | 19.15 |
| Financial Years (Real) | Exchange Rate | ZAR/USD | N/A | 18.68 | 18.16 | 18.51 | 18.86 | 19.15 |
| Calendar Years | US Inflation | % | 2.8% | 2.4% | 2.2% | 2.1% | 2.1% | 2.1% |
| Financial Years | US Inflation | % | N/A | 2.8% | 2.4% | 2.2% | 2.1% | 2.1% |
| Calendar Years | SA Inflation | % | 4.8% | 4.5% | 4.5% | 4.5% | 4.5% | 4.5% |
| Financial Years | SA Inflation | % | N/A | 4.8% | 4.5% | 4.5% | 4.5% | 4.5% |
Source: Median of various Banks and Broker forecasts (Consensus, March 2024); Minxcon; IMF.
Figure 49 illustrates the 20-year real-terms historic gold price. For the past ten years, the gold price has found support between USD1,600/oz and USD2,200/oz with the price maintaining a level of more than USD1,800 for the past three years. The long-term gold price was estimated as the real term average between the two gold price support levels over the past 10 years, i.e. USD1,900/oz.
Figure 49: Real-term Historic Gold Price
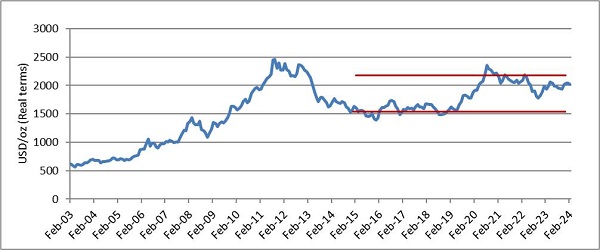
The creditors’ days were assumed at 30 days and debtors’ days (for payment of Gold delivered) were calculated at 7 days.
The ore from the Blyvoor Mine operation is treated at the existing Blyvoor Plant; the expected recovery ranges between 90% and 97% depending on the feed grade. The average recovery over the LoM is 94%. The recovery is detailed in the processing Section of this TRS.
The QPs used the FCFF to calculate the value of the company on a 100% equity basis and hence used the Capital Asset Pricing Model (“CAPM”) to calculate the discount rate. The following were considered:-
| ● | The South African risk-free rate (10 years and longer bond yield) of 11.67% was considered acceptable. |
| |
| RESOURCE | RESERVE | VALUE |
Blyvoor Gold Resources (Pty) Ltd
S-K 1300 Technical Report Summary on the Blyvoor Gold Mine, South Africa | 113 |
| ● | A market risk premium of 6.00%, a rate generally considered as being the investor’s expectation for investing in equity rather than a risk-free government bond, was used. |
| ● | The Beta of a stock is normally used to reflect the stock price’s volatility over and above other general equity investments in the country of listing. A Beta of 0.88 was calculated for Blyvoor Mine. This specific risk was calculated using an average weighting on ranked criteria based on the most crucial elements in a mining project. |
| ● | This resulted in a nominal based cost of equity of 16.93% to value the Project which equals a real cost of equity of 11.89%. |
| ● | The calculated discount rate is detailed in Table 46 below. A NPV sensitivity to various discount rates is also reported. |
Table 46: Blyvoor Mine Cost of Equity
| Items | Rate |
| Risk-Free Rate | 11.67% |
| Risk Premium of Market | 6.00% |
| Base Beta (Project Premium) | 0.88 |
| Nominal Cost of Equity (CAPM) | 16.93% |
| Real Cost of Equity (CAPM) | 11.89% |
Beta is a measure of the volatility or systematic risk of a security or a portfolio in comparison to the market as a whole. The QPs calculated an operation Beta for Blyvoor Mine using an in-house model. The model considers several operational criteria and assigns weights to these factors. Operation-specific scores are allocated to each of the factors, and a Beta is calculated. A Beta of 0.88 was calculated for Blyvoor Mine. The Beta was benchmarked against the South African gold mining companies listed on the Johannesburg Stock Exchange, or JSE, in order to determine if the calculated Beta for Blyvoor Mine can be deemed appropriate. The Unlevered Betas of South African gold mining companies were found to range between 0.76 (Pan African Resources) and 1.53 (Harmony). The calculated Beta of 0.88 for Blyvoor Mine falls within this range and is closest to Pan African Resources, with the same Beta of 0.76. The calculated Beta of 0.88 is therefore deemed appropriate. Table 47 shows the Betas of South African gold mining companies considered.
Table 47: Southern African Gold Mining Companies’ Beta Values
| Gold Company | Unlevered Betas | Levered Betas | Exchange |
| Gold Fields | 1.20 | 1.24 | JSE |
| Harmony | 1.53 | 1.56 | JSE |
| Pan African Resources | 0.76 | 0.78 | LSE |
| DRD Gold | 1.12 | 0.97 | JSE |
| Mean | 1.12 | 1.10 | |
| Median | 1.16 | 1.11 | |
Source: InfrontAnalytics (Mar 2024)
The saleable product tonnes per year are illustrated in Figure 50. The average recovery over the LoM is 94.5% for an average recovered gold grade of 5.24 g/t.
| |
| RESOURCE | RESERVE | VALUE |
Blyvoor Gold Resources (Pty) Ltd
S-K 1300 Technical Report Summary on the Blyvoor Gold Mine, South Africa | 114 |
Figure 50: Saleable Gold Ounces
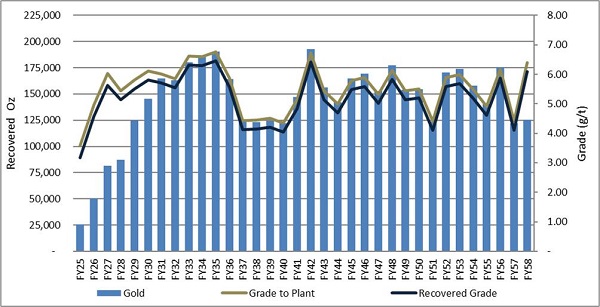
A breakdown of the tonnes and ounces used in the LoM are displayed in Table 48. There is currently no Inferred Mineral Resources included for the purpose of the economic analysis. It should be noted that Blyvoor currently does not separate ore tonnes from waste tonnes, hence the waste tonnes also report to plant diluting the ore tonnes further.
Table 48: Production Breakdown in Life of Mine
| Item | Project | Blyvoor Gold |
| Waste Tonnes Mined | kt | 954 |
| Ore Tonnes Mined | kt | 27,875 |
| Total Tonnes Mined | kt | 28,829 |
| Average Mined Grade | g/t | 5.54 |
| Total Oz in Mine Plan | koz | 5,139 |
| Grade Delivered to Plant | g/t | 5.54 |
| Recovered grade | g/t | 5.24 |
| Yield/Recovery | % | 94.5% |
| Total Oz Recovered | koz | 4,854 |
Figure 51 illustrates the monthly and cumulative cash flow over the first 36 months of the LoM from the effective date. There is a peak funding requirement of USD29 million in month 20 (October 2025). The capital planned for year 1 (FY25) of USD28.5 million and year 2 (FY26) of USD44.2 million is not fully offset by free cash flow in the same years.
The production profile and mine development plan shown in this report relies on access to these funds to achieve the stated results. The evaluator has been informed that the funding is intended to be raised during a listing of Blyvoor Gold Resources (Pty) Ltd, which is anticipated for August or September 2024.
| |
| RESOURCE | RESERVE | VALUE |
Blyvoor Gold Resources (Pty) Ltd
S-K 1300 Technical Report Summary on the Blyvoor Gold Mine, South Africa | 115 |
Figure 51: Undiscounted Monthly Cash Flow – 36 Months
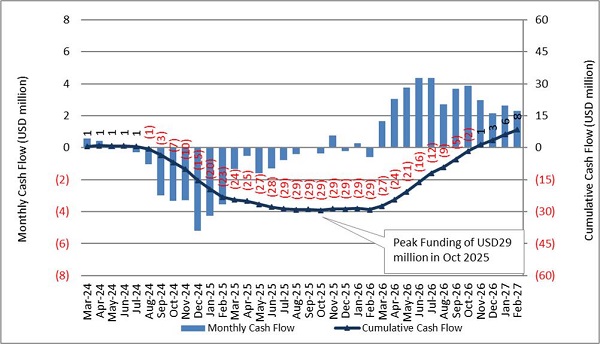
The annual cash flow before capital expenditure, total capital expenditure and cumulative cash flow forecast for the mine over the LoM is illustrated in Figure 52. Table 49 through Table 52 illustrate the detailed annual cash flow for the Mine in real terms over the LoM. Table 53 and Table 54 illustrate the detailed annual cash flow for the Mine in real terms for the first five years in six-month intervals starting March – August in the H1 period and September – February in the H2 period, starting March 2024.
Figure 52: Undiscounted Cash Flow
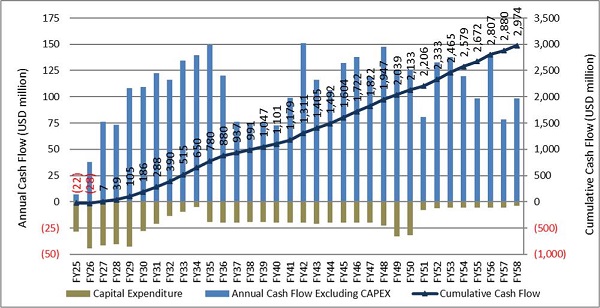
| |
| RESOURCE | RESERVE | VALUE |
Blyvoor Gold Resources (Pty) Ltd
S-K 1300 Technical Report Summary on the Blyvoor Gold Mine, South Africa | 116 |
| |
| RESOURCE | RESERVE | VALUE |
Blyvoor Gold Resources (Pty) Ltd
S-K 1300 Technical Report Summary on the Blyvoor Gold Mine, South Africa | 117 |
Table 49: Annual Cash Flow – Techno-economic Inputs (First 17 Years)
| Project Title: | Blyvoor Gold |
| Client: | Blyvoor Capital |
| Project Code: | M24-003 |
| | |
| Project Duration | | Unit | Totals | | | | | | | | | | | | | | | | | |
| Financial Years | | | | 2025 | 2026 | 2027 | 2028 | 2029 | 2030 | 2031 | 2032 | 2033 | 2034 | 2035 | 2036 | 2037 | 2038 | 2039 | 2040 | 2041 |
| Financial Years | | years | 34 | 1 | 2 | 3 | 4 | 5 | 6 | 7 | 8 | 9 | 10 | 11 | 12 | 13 | 14 | 15 | 16 | 17 |
| Macro-Economic Factors (Real Terms) 1 | | | | | | | | | | | | | | | | | |
| Currency | | ZAR /USD | 19.08 | 18.68 | 18.16 | 18.51 | 18.86 | 19.15 | 19.15 | 19.15 | 19.15 | 19.15 | 19.15 | 19.15 | 19.15 | 19.15 | 19.15 | 19.15 | 19.149 | 19.149 |
| Inflation | ZAR Inflation Rate | % | 4.51% | 4.80% | 4.50% | 4.50% | 4.50% | 4.50% | 4.50% | 4.50% | 4.50% | 4.50% | 4.50% | 4.50% | 4.50% | 4.50% | 4.50% | 4.50% | 4.50% | 4.50% |
| Inflation | US Inflation Rate | % | 2.13% | 2.80% | 2.40% | 2.20% | 2.10% | 2.10% | 2.10% | 2.10% | 2.10% | 2.10% | 2.10% | 2.10% | 2.10% | 2.10% | 2.10% | 2.10% | 2.10% | 2.10% |
| Commodities | | | | | | | | | | | | | | | | | | | | |
| Commodity prices | Gold | USD/oz. | 1,909 | 2,078 | 2,016 | 1,900 | 1,900 | 1,900 | 1,900 | 1,900 | 1,900 | 1,900 | 1,900 | 1,900 | 1,900 | 1,900 | 1,900 | 1,900 | 1,900 | 1,900 |
| Commodity prices | Fixed Price Streaming Arrangement | USD/oz. | 572 | 572 | 572 | 572 | 572 | 572 | 572 | 572 | 572 | 572 | 572 | 572 | 572 | 572 | 572 | 572 | 572 | 572 |
| Operating Statistics | | | | | | | | | | | | | | | | | | | |
| Tonnes Produced | | | | | | | | | | | | | | | | | | | | |
| ROM | | tonnes | 28,829,067 | 248,220 | 340,046 | 448,949 | 526,175 | 704,806 | 777,746 | 897,553 | 912,681 | 886,930 | 919,104 | 918,181 | 917,020 | 931,653 | 921,526 | 918,033 | 941,295 | 945,616 |
| ROM | (Max) | tonnes/mnth | 79,127 | 20,458 | 28,337 | 37,412 | 43,848 | 58,734 | 64,812 | 74,796 | 76,057 | 73,911 | 76,592 | 76,515 | 76,418 | 77,638 | 76,794 | 76,503 | 78,441 | 78,801 |
| Mill Head grade | Gold Grade | g/t | 5.54 | 3.58 | 4.96 | 6.03 | 5.45 | 5.82 | 6.11 | 6.01 | 5.85 | 6.62 | 6.60 | 6.75 | 5.86 | 4.44 | 4.45 | 4.52 | 4.34 | 5.13 |
| Tonnes to mill | | tonnes | 28,829,067 | 248,220 | 340,046 | 448,949 | 526,175 | 704,806 | 777,746 | 897,553 | 912,681 | 886,930 | 919,104 | 918,181 | 917,020 | 931,653 | 921,526 | 918,033 | 941,295 | 945,616 |
| Recovered Grade | | | | | | | | | | | | | | | | | | | | |
| Recovered grade | Precious Metals | g/t | 5.24 | 3.18 | 4.56 | 5.63 | 5.15 | 5.51 | 5.80 | 5.71 | 5.55 | 6.31 | 6.30 | 6.45 | 5.56 | 4.13 | 4.15 | 4.21 | 4.04 | 4.83 |
| Metal recovered | | | | | | | | | | | | | | | | | | | | |
| Metal recovered | Gold | kg | 150,964 | 789 | 1,551 | 2,528 | 2,708 | 3,885 | 4,513 | 5,124 | 5,065 | 5,601 | 5,789 | 5,920 | 5,099 | 3,851 | 3,825 | 3,869 | 3,799 | 4,566 |
| Metal Recovered | Gold | oz | 4,853,618 | 25,359 | 49,879 | 81,273 | 87,054 | 124,908 | 145,081 | 164,756 | 162,830 | 180,071 | 186,118 | 190,345 | 163,926 | 123,797 | 122,984 | 124,385 | 122,145 | 146,803 |
| First tranche Cumulative Production | Gold | oz | 243,715 | 2,536 | 7,524 | 15,651 | 24,357 | 36,847 | 51,355 | 67,593 | 83,735 | 100,738 | 118,044 | 135,561 | 151,758 | 164,137 | 176,436 | 188,874 | 201,089 | 215,769 |
| First tranche <160koz | Gold | oz | 160,000 | 2,536 | 4,988 | 8,127 | 8,705 | 12,491 | 14,508 | 16,000 | 16,000 | 16,000 | 16,000 | 16,000 | 16,000 | 12,380 | 12,298 | 12,438 | 12,214 | 14,680 |
| First tranche >160koz | Gold | oz | 160,000 | - | - | - | - | - | - | 238 | 141 | 1,004 | 1,306 | 1,517 | 196 | - | - | - | - | - |
| Second tranche 100koz | Gold | oz | 100,000 | - | - | - | - | - | - | - | - | - | - | - | - | - | - | - | - | - |
| Total Gold at Fixed Price | Gold | oz | 251,715 | 2,536 | 4,988 | 8,127 | 8,705 | 12,491 | 14,508 | 16,238 | 16,141 | 17,004 | 17,306 | 17,517 | 16,196 | 12,380 | 12,298 | 12,438 | 12,214 | 14,680 |
| Sales Split | | | | | | | | | | | | | | | | | | | | |
| Metal recovered | Gold - Open Market | oz | 4,601,903 | 22,823 | 44,891 | 73,146 | 78,349 | 112,417 | 130,573 | 148,518 | 146,688 | 163,067 | 168,812 | 172,827 | 147,729 | 111,417 | 110,685 | 111,946 | 109,930 | 132,123 |
| Metal recovered | Fixed Price Streaming Arrangement | oz | 251,715 | 2,536 | 4,988 | 8,127 | 8,705 | 12,491 | 14,508 | 16,238 | 16,141 | 17,004 | 17,306 | 17,517 | 16,196 | 12,380 | 12,298 | 12,438 | 12,214 | 14,680 |
Note: Numbers in red are not totals but are intended as production flags to determine production sold at fixed price as per streaming arrangement.
Table 50: Annual Cash Flow – Techno-economic Inputs (Remaining 17 Years)
| Project Title: | Blyvoor Gold |
| Client: | Blyvoor Capital |
| Project Code: | M24-003 |
| | | | | | | | | | | | | | | | | | | | | |
| Project Duration | | Unit | Totals | | | | | | | | | | | | | | | | | |
| Financial Years | | | 2059 | 2042 | 2043 | 2044 | 2045 | 2046 | 2047 | 2048 | 2049 | 2050 | 2051 | 2052 | 2053 | 2054 | 2055 | 2056 | 2057 | 2058 |
| Financial Years | | years | 34 | 18 | 19 | 20 | 21 | 22 | 23 | 24 | 25 | 26 | 27 | 28 | 29 | 30 | 31 | 32 | 33 | 34 |
| Macro-Economic Factors (Real Terms) | | 1 | | | | | | | | | | | | | | | | | |
| Currency | | ZAR /USD | 19.08 | 19.149 | 19.149 | 19.149 | 19.149 | 19.149 | 19.149 | 19.149 | 19.149 | 19.149 | 19.149 | 19.149 | 19.149 | 19.149 | 19.149 | 19.149 | 19.149 | 19.149 |
| Inflation | ZAR Inflation Rate | % | 4.51% | 4.50% | 4.50% | 4.50% | 4.50% | 4.50% | 4.50% | 4.50% | 4.50% | 4.50% | 4.50% | 4.50% | 4.50% | 4.50% | 4.50% | 4.50% | 4.50% | 4.50% |
| Inflation | US Inflation Rate | % | 2.13% | 2.10% | 2.10% | 2.10% | 2.10% | 2.10% | 2.10% | 2.10% | 2.10% | 2.10% | 2.10% | 2.10% | 2.10% | 2.10% | 2.10% | 2.10% | 2.10% | 2.10% |
| Commodities | | | | | | | | | | | | | | | | | | | | |
| Commodity prices | Gold | USD/oz. | 1,909 | 1,900 | 1,900 | 1,900 | 1,900 | 1,900 | 1,900 | 1,900 | 1,900 | 1,900 | 1,900 | 1,900 | 1,900 | 1,900 | 1,900 | 1,900 | 1,900 | 1,900 |
| Commodity prices | Fixed Price Streaming Arrangement | USD/oz. | 572 | 572 | 572 | 572 | 572 | 572 | 572 | 572 | 572 | 572 | 572 | 572 | 572 | 572 | 572 | 572 | 572 | 572 |
| Operating Statistics | | | 1 | | | | | | | | | | | | | | | | | |
| Tonnes Produced | | | | | | | | | | | | | | | | | | | | |
| ROM | | tonnes | 28,829,067 | 934,100 | 948,375 | 941,348 | 934,247 | 942,230 | 948,723 | 944,676 | 931,613 | 922,625 | 936,774 | 947,769 | 949,529 | 948,449 | 946,822 | 930,236 | 924,798 | 641,217 |
| ROM | (Max) | tonnes/mnth | 79,127 | 77,842 | 79,031 | 78,446 | 77,854 | 78,519 | 79,060 | 78,723 | 77,634 | 76,885 | 78,065 | 78,981 | 79,127 | 79,037 | 78,902 | 77,520 | 77,067 | 53,435 |
| Mill Head grade | Gold Grade | g/t | 5.54 | 6.72 | 5.43 | 5.00 | 5.78 | 5.89 | 5.32 | 6.14 | 5.43 | 5.51 | 4.42 | 5.89 | 5.99 | 5.49 | 4.91 | 6.18 | 4.40 | 6.39 |
| Tonnes to mill | | tonnes | 28,829,067 | 934,100 | 948,375 | 941,348 | 934,247 | 942,230 | 948,723 | 944,676 | 931,613 | 922,625 | 936,774 | 947,769 | 949,529 | 948,449 | 946,822 | 930,236 | 924,798 | 641,217 |
| Recovered Grade | | | | | | | | | | | | | | | | | | | | |
| Recovered grade | Precious Metals | g/t | 5.24 | 6.41 | 5.13 | 4.70 | 5.48 | 5.58 | 5.02 | 5.84 | 5.13 | 5.20 | 4.11 | 5.59 | 5.69 | 5.18 | 4.60 | 5.88 | 4.10 | 6.08 |
| Metal recovered | | | | | | | | | | | | | | | | | | | | |
| Metal recovered | Gold | kg | 150,964 | 5,989 | 4,864 | 4,421 | 5,116 | 5,259 | 4,759 | 5,512 | 4,778 | 4,800 | 3,854 | 5,296 | 5,401 | 4,916 | 4,359 | 5,466 | 3,790 | 3,901 |
| Metal Recovered | Gold | oz | 4,853,618 | 192,563 | 156,386 | 142,146 | 164,491 | 169,091 | 153,007 | 177,231 | 153,631 | 154,326 | 123,898 | 170,271 | 173,661 | 158,050 | 140,153 | 175,749 | 121,836 | 125,419 |
| First tranche Cumulative Production | Gold | oz | 243,715 | 233,397 | 243,715 | 243,715 | 243,715 | 243,715 | 243,715 | 243,715 | 243,715 | 243,715 | 243,715 | 243,715 | 243,715 | 243,715 | 243,715 | 243,715 | 243,715 | 243,715 |
| First tranche <160koz | Gold | oz | 160,000 | 16,000 | 10,318 | - | - | - | - | - | - | - | - | - | - | - | - | - | - | - |
| First tranche >160koz | Gold | oz | 160,000 | 1,628 | - | - | - | - | - | - | - | - | - | - | - | - | - | - | - | - |
| Second tranche 100koz | Gold | oz | 100,000 | - | 500 | 500 | 500 | 500 | 500 | 500 | 500 | 500 | 500 | 500 | 500 | 500 | 500 | 500 | 500 | 500 |
| Total Gold at Fixed Price | Gold | oz | 251,715 | 17,628 | 10,818 | 500 | 500 | 500 | 500 | 500 | 500 | 500 | 500 | 500 | 500 | 500 | 500 | 500 | 500 | 500 |
| Sales Split | | | | | | | | | | | | | | | | | | | | |
| Metal recovered | Gold - Open Market | oz | 4,601,903 | 174,935 | 145,568 | 141,646 | 163,991 | 168,591 | 152,507 | 176,731 | 153,131 | 153,826 | 123,398 | 169,771 | 173,161 | 157,550 | 139,653 | 175,249 | 121,336 | 124,919 |
| Metal recovered | Fixed Price Streaming Arrangement | oz | 251,715 | 17,628 | 10,818 | 500 | 500 | 500 | 500 | 500 | 500 | 500 | 500 | 500 | 500 | 500 | 500 | 500 | 500 | 500 |
Note: Numbers in red are not totals but are intended as production flags to determine production sold at fixed price as per streaming arrangement.
| |
| RESOURCE | RESERVE | VALUE |
Blyvoor Gold Resources (Pty) Ltd
S-K 1300 Technical Report Summary on the Blyvoor Gold Mine, South Africa | 118 |
Table 51: Annual Real Cash Flow (First 17 Years)
| Project Title: | Blyvoor Gold |
| Client: | Blyvoor Capital |
| Project Code: | M24-003 |
| Project Duration | | Unit | Totals | | | | | | | | | | | | | | | | | |
| Financial Years | | | 2059 | 2025 | 2026 | 2027 | 2028 | 2029 | 2030 | 2031 | 2032 | 2033 | 2034 | 2035 | 2036 | 2037 | 2038 | 2039 | 2040 | 2041 |
| Financial Years | | years | 34 | 1 | 2 | 3 | 4 | 5 | 6 | 7 | 8 | 9 | 10 | 11 | 12 | 13 | 14 | 15 | 16 | 17 |
| Financial | | | | | | | | | | | | | | | | | | | | |
| Revenue | | USD | 8,879,098,695 | 48,782,811 | 93,189,167 | 143,338,467 | 153,534,233 | 220,295,322 | 255,873,703 | 290,889,602 | 287,364,342 | 318,914,279 | 329,980,528 | 337,714,908 | 289,369,909 | 218,335,705 | 216,902,097 | 219,373,026 | 215,422,746 | 258,911,974 |
| Revenue | Gold - Open Market | USD | 8,735,405,593 | 47,335,178 | 90,341,790 | 138,698,947 | 148,564,700 | 213,164,894 | 247,591,689 | 281,620,157 | 278,149,884 | 309,207,713 | 320,101,353 | 327,715,094 | 280,124,168 | 211,268,705 | 209,881,499 | 212,272,451 | 208,450,032 | 250,531,618 |
| Revenue | Fixed Price Streaming Arrangement | USD | 143,693,102 | 1,447,633 | 2,847,377 | 4,639,520 | 4,969,533 | 7,130,428 | 8,282,014 | 9,269,445 | 9,214,459 | 9,706,566 | 9,879,174 | 9,999,813 | 9,245,741 | 7,067,000 | 7,020,598 | 7,100,576 | 6,972,715 | 8,380,356 |
| Mining cost | | | (2,259,369,396) | (22,200,140) | (29,299,566) | (36,648,774) | (47,949,248) | (56,940,335) | (61,562,667) | (69,052,149) | (71,922,687) | (71,182,016) | (72,685,577) | (72,768,922) | (72,253,424) | (72,746,997) | (72,044,032) | (71,663,661) | (72,775,896) | (72,814,113) |
| Direct Cash Costs | Fixed Cost | USD | (44,289,990) | (1,263,271) | (1,381,035) | (1,354,841) | (1,329,792) | (1,309,615) | (1,309,615) | (1,309,615) | (1,309,615) | (1,309,615) | (1,309,615) | (1,309,615) | (1,309,615) | (1,309,615) | (1,309,615) | (1,309,615) | (1,309,615) | (1,309,615) |
| Direct Cash Costs | Variable Cost | USD | (2,107,490,387) | (19,879,719) | (26,523,313) | (33,548,753) | (44,336,158) | (52,919,275) | (57,321,496) | (64,454,336) | (67,188,182) | (66,482,782) | (67,914,744) | (67,994,120) | (67,503,169) | (67,973,239) | (67,303,749) | (66,941,491) | (68,000,762) | (68,037,159) |
| Direct Cash Costs | Contingeny | USD | (107,589,019) | (1,057,150) | (1,395,217) | (1,745,180) | (2,283,298) | (2,711,445) | (2,931,556) | (3,288,198) | (3,424,890) | (3,389,620) | (3,461,218) | (3,465,187) | (3,440,639) | (3,464,143) | (3,430,668) | (3,412,555) | (3,465,519) | (3,467,339) |
| Plant cost | | | (682,479,863) | (9,854,657) | (11,860,651) | (14,287,629) | (16,766,168) | (18,731,519) | (19,570,617) | (20,948,865) | (21,122,887) | (20,826,651) | (21,196,784) | (21,186,162) | (21,172,810) | (21,341,142) | (21,224,649) | (21,184,462) | (21,452,060) | (21,501,774) |
| Direct Cash Costs | Fixed Cost | USD | (95,681,610) | (1,501,883) | (1,748,889) | (3,007,013) | (2,951,418) | (2,906,636) | (2,906,636) | (2,906,636) | (2,906,636) | (2,906,636) | (2,906,636) | (2,906,636) | (2,906,636) | (2,906,636) | (2,906,636) | (2,906,636) | (2,906,636) | (2,906,636) |
| Direct Cash Costs | Variable Cost | USD | (554,299,211) | (7,883,505) | (9,546,970) | (10,600,252) | (13,016,361) | (14,932,906) | (15,732,048) | (17,044,664) | (17,210,399) | (16,928,270) | (17,280,777) | (17,270,662) | (17,257,946) | (17,418,262) | (17,307,316) | (17,269,043) | (17,523,898) | (17,571,245) |
| Direct Cash Costs | Contingeny | USD | (32,499,041) | (469,269) | (564,793) | (680,363) | (798,389) | (891,977) | (931,934) | (997,565) | (1,005,852) | (991,745) | (1,009,371) | (1,008,865) | (1,008,229) | (1,016,245) | (1,010,698) | (1,008,784) | (1,021,527) | (1,023,894) |
| Other Costs | | | (613,563,566) | (10,786,790) | (13,006,050) | (14,845,108) | (15,461,633) | (17,126,064) | (17,890,221) | (18,912,446) | (19,012,946) | (18,728,776) | (19,012,535) | (18,960,033) | (18,861,304) | (18,902,174) | (18,749,688) | (18,673,625) | (18,904,917) | (18,983,753) |
| Direct Cash Costs | Other Cost Fixed | USD | (294,669,409) | (7,431,342) | (8,375,927) | (9,029,183) | (8,901,038) | (8,765,980) | (8,765,980) | (8,765,980) | (8,765,980) | (8,765,980) | (8,765,980) | (8,765,980) | (8,765,980) | (8,765,980) | (8,765,980) | (8,765,980) | (8,765,980) | (8,765,980) |
| Direct Cash Costs | Other Costs Variable | USD | (285,060,770) | (2,513,846) | (3,548,926) | (4,607,400) | (5,284,368) | (6,971,980) | (7,699,749) | (8,876,799) | (9,019,408) | (8,795,665) | (9,112,806) | (9,109,699) | (9,062,566) | (9,148,384) | (9,050,054) | (9,018,424) | (9,238,703) | (9,313,784) |
| Direct Cash Costs | Contingeny | USD | (28,986,509) | (497,259) | (596,243) | (681,829) | (709,270) | (786,898) | (823,286) | (882,139) | (889,269) | (878,082) | (893,939) | (893,784) | (891,427) | (895,718) | (890,802) | (889,220) | (900,234) | (903,988) |
| Direct Cash Costs | Rehabilitation | USD | (4,846,879) | (344,343) | (484,954) | (526,696) | (566,956) | (601,206) | (601,206) | (387,528) | (338,288) | (289,049) | (239,809) | (190,570) | (141,331) | (92,091) | (42,852) | 0 | 0 | 0 |
| Direct Cash Costs | | | (3,555,412,825) | (42,841,587) | (54,166,267) | (65,781,510) | (80,177,050) | (92,797,919) | (99,023,506) | (108,913,460) | (112,058,519) | (110,737,444) | (112,894,895) | (112,915,117) | (112,287,538) | (112,990,313) | (112,018,369) | (111,521,748) | (113,132,873) | (113,299,640) |
| Production Costs | Expansion Capital expenditure | USD | (202,365,476) | (23,183,196) | (36,786,316) | (31,880,192) | (25,701,505) | (23,186,001) | (15,219,639) | (8,863,134) | (6,305,867) | (3,177,939) | (24,998) | (784,714) | (943,136) | (417,832) | (566,564) | (616,360) | (280,364) | (215,404) |
| Production Costs | Contingency | USD | (40,754,055) | (2,906,404) | (5,224,509) | (4,519,639) | (3,565,975) | (3,643,529) | (2,452,317) | (1,586,188) | (1,022,176) | (529,235) | (5,265) | (711,600) | (739,445) | (707,512) | (706,852) | (704,968) | (719,445) | (718,820) |
| Production Costs | SIB | USD | (421,479,625) | (2,412,102) | (2,217,729) | (5,383,988) | (11,340,871) | (15,792,359) | (10,432,046) | (10,464,339) | (6,354,724) | (5,858,628) | (4,727,390) | (17,766,023) | (17,867,802) | (18,436,817) | (18,233,902) | (18,125,414) | (18,819,935) | (18,876,791) |
| Production Costs | | USD | (4,220,011,981) | (71,343,289) | (98,394,821) | (107,565,330) | (120,785,401) | (135,419,808) | (127,127,507) | (129,827,121) | (125,741,286) | (120,303,246) | (117,652,548) | (132,177,454) | (131,837,921) | (132,552,473) | (131,525,686) | (130,968,490) | (132,952,618) | (133,110,655) |
| Fully Allocated Costs | Royalty Act No 28 of 2008 | USD | (396,428,097) | (243,914) | (465,946) | (716,692) | (767,671) | (7,258,542) | (11,553,667) | (14,314,050) | (14,341,269) | (15,945,714) | (16,499,026) | (16,885,745) | (14,024,012) | (7,928,940) | (7,889,227) | (8,143,831) | (7,649,327) | (11,333,269) |
| Fully Allocated Costs | Other Fixed Costs | | (10,814,397) | (310,506) | (329,321) | (328,423) | (322,351) | (317,460) | (317,460) | (317,460) | (317,460) | (317,460) | (317,460) | (317,460) | (317,460) | (317,460) | (317,460) | (317,460) | (317,460) | (317,460) |
| Fully Allocated Costs | | USD | (4,627,254,474) | (71,897,710) | (99,190,087) | (108,610,445) | (121,875,423) | (142,995,809) | (138,998,634) | (144,458,631) | (140,400,015) | (136,566,420) | (134,469,035) | (149,380,659) | (146,179,393) | (140,798,873) | (139,732,373) | (139,429,781) | (140,919,405) | (144,761,384) |
| EBITDA | | USD | 4,916,443,376 | 5,386,803 | 38,227,634 | 76,511,841 | 72,267,161 | 119,921,402 | 144,979,070 | 167,344,633 | 160,647,094 | 191,913,662 | 200,269,146 | 207,596,586 | 162,740,899 | 97,098,992 | 96,677,042 | 99,389,988 | 94,323,086 | 133,961,606 |
| EBIT | | USD | 4,251,844,221 | (23,114,899) | (6,000,920) | 34,728,022 | 31,658,810 | 77,299,513 | 116,875,069 | 146,430,971 | 146,964,327 | 182,347,860 | 195,511,493 | 188,334,248 | 143,190,516 | 77,536,832 | 77,169,724 | 79,943,245 | 74,503,341 | 114,150,591 |
| Taxation | | USD | (1,278,006,669) | 0 | 0 | 0 | 0 | (11,072,910) | (35,387,670) | (44,841,407) | (45,082,677) | (56,576,730) | (60,864,239) | (58,292,491) | (43,765,487) | (22,650,816) | (22,550,371) | (23,451,362) | (21,668,949) | (34,409,697) |
| Income after tax | | USD | 2,973,837,552 | (23,114,899) | (6,000,920) | 34,728,022 | 31,658,810 | 66,226,603 | 81,487,398 | 101,589,564 | 101,881,650 | 125,771,130 | 134,647,255 | 130,041,757 | 99,425,029 | 54,886,016 | 54,619,354 | 56,491,883 | 52,834,392 | 79,740,893 |
| Working capital changes | | USD | 1 | 1,552,966 | (83,782) | (210,765) | 945,326 | (278,656) | (194,999) | 119,353 | 317,651 | (704,624) | (39,494) | (142,893) | 881,893 | 1,421,166 | (44,733) | (82,908) | 201,874 | (820,986) |
| Cash Flow | | | | | | | | | | | | | | | | | | | | |
| Net Cash Flow | Annual cash flow | USD | 2,973,837,552 | (21,561,933) | (6,084,702) | 34,517,257 | 32,604,137 | 65,947,947 | 81,292,399 | 101,708,917 | 102,199,300 | 125,066,506 | 134,607,760 | 129,898,864 | 100,306,923 | 56,307,182 | 54,574,620 | 56,408,976 | 53,036,266 | 78,919,907 |
Table 52: Annual Real Cash Flow (Remaining 17 Years)
| Project Title: | Blyvoor Gold |
| Client: | Blyvoor Capital |
| Project Code: | M24-003 |
| Project Duration | | Unit | Totals | | | | | | | | | | | | | | | | | |
| Financial Years | | | 2059 | 2042 | 2043 | 2044 | 2045 | 2046 | 2047 | 2048 | 2049 | 2050 | 2051 | 2052 | 2053 | 2054 | 2055 | 2056 | 2057 | 2058 |
| Financial Years | | years | 34 | 18 | 19 | 20 | 21 | 22 | 23 | 24 | 25 | 26 | 27 | 28 | 29 | 30 | 31 | 32 | 33 | 34 |
| Financial | | | | | | | | | | | | | | | | | | | | |
| Revenue | | USD | 8,879,098,695 | 341,774,473 | 282,201,924 | 268,874,990 | 311,244,575 | 319,967,768 | 289,469,000 | 335,401,834 | 290,651,570 | 291,969,785 | 234,272,827 | 322,205,117 | 328,633,495 | 299,031,423 | 265,095,230 | 332,591,743 | 230,362,767 | 237,157,355 |
| Revenue | Gold - Open Market | USD | 8,735,405,593 | 331,711,340 | 276,026,322 | 268,589,562 | 310,959,147 | 319,682,340 | 289,183,572 | 335,116,406 | 290,366,142 | 291,684,357 | 233,987,399 | 321,919,689 | 328,348,067 | 298,745,995 | 264,809,802 | 332,306,315 | 230,077,339 | 236,871,927 |
| Revenue | Fixed Price Streaming Arrangement | USD | 143,693,102 | 10,063,133 | 6,175,602 | 285,428 | 285,428 | 285,428 | 285,428 | 285,428 | 285,428 | 285,428 | 285,428 | 285,428 | 285,428 | 285,428 | 285,428 | 285,428 | 285,428 | 285,428 |
| Mining cost | | | (2,259,369,396) | (72,118,377) | (72,327,839) | (72,228,359) | (72,365,605) | (72,585,522) | (72,687,400) | (72,934,192) | (72,562,724) | (71,850,652) | (72,578,602) | (73,158,513) | (73,213,804) | (73,164,632) | (73,092,628) | (72,598,474) | (72,386,555) | (51,005,316) |
| Direct Cash Costs | Fixed Cost | USD | (44,289,990) | (1,309,615) | (1,309,615) | (1,309,615) | (1,309,615) | (1,309,615) | (1,309,615) | (1,309,615) | (1,309,615) | (1,309,615) | (1,309,615) | (1,309,615) | (1,309,615) | (1,309,615) | (1,309,615) | (1,309,615) | (1,309,615) | (982,211) |
| Direct Cash Costs | Variable Cost | USD | (2,107,490,387) | (67,374,553) | (67,574,041) | (67,479,298) | (67,610,009) | (67,819,453) | (67,916,480) | (68,151,520) | (67,797,741) | (67,119,577) | (67,812,863) | (68,365,160) | (68,417,817) | (68,370,986) | (68,302,412) | (67,831,788) | (67,629,962) | (47,594,280) |
| Direct Cash Costs | Contingeny | USD | (107,589,019) | (3,434,208) | (3,444,183) | (3,439,446) | (3,445,981) | (3,456,453) | (3,461,305) | (3,473,057) | (3,455,368) | (3,421,460) | (3,456,124) | (3,483,739) | (3,486,372) | (3,484,030) | (3,480,601) | (3,457,070) | (3,446,979) | (2,428,825) |
| Plant cost | | | (682,479,863) | (21,369,297) | (21,533,509) | (21,452,675) | (21,370,982) | (21,462,824) | (21,537,516) | (21,490,958) | (21,340,686) | (21,237,281) | (21,400,058) | (21,526,536) | (21,546,789) | (21,534,369) | (21,515,652) | (21,324,840) | (21,262,285) | (15,344,119) |
| Direct Cash Costs | Fixed Cost | USD | (95,681,610) | (2,906,636) | (2,906,636) | (2,906,636) | (2,906,636) | (2,906,636) | (2,906,636) | (2,906,636) | (2,906,636) | (2,906,636) | (2,906,636) | (2,906,636) | (2,906,636) | (2,906,636) | (2,906,636) | (2,906,636) | (2,906,636) | (2,179,977) |
| Direct Cash Costs | Variable Cost | USD | (554,299,211) | (17,445,076) | (17,601,468) | (17,524,484) | (17,446,681) | (17,534,149) | (17,605,284) | (17,560,944) | (17,417,828) | (17,319,346) | (17,474,372) | (17,594,827) | (17,614,116) | (17,602,287) | (17,584,461) | (17,402,736) | (17,343,160) | (12,433,470) |
| Direct Cash Costs | Contingeny | USD | (32,499,041) | (1,017,586) | (1,025,405) | (1,021,556) | (1,017,666) | (1,022,039) | (1,025,596) | (1,023,379) | (1,016,223) | (1,011,299) | (1,019,050) | (1,025,073) | (1,026,038) | (1,025,446) | (1,024,555) | (1,015,469) | (1,012,490) | (730,672) |
| Other Costs | | | (613,563,566) | (18,933,117) | (19,025,269) | (18,934,066) | (18,894,440) | (18,981,501) | (19,023,947) | (19,017,798) | (18,852,357) | (18,762,738) | (18,861,856) | (19,039,019) | (19,061,616) | (19,028,402) | (18,986,401) | (18,870,109) | (18,738,176) | (13,734,690) |
| Direct Cash Costs | Other Cost Fixed | USD | (294,669,409) | (8,765,980) | (8,765,980) | (8,765,980) | (8,765,980) | (8,765,980) | (8,765,980) | (8,765,980) | (8,765,980) | (8,765,980) | (8,765,980) | (8,765,980) | (8,765,980) | (8,765,980) | (8,765,980) | (8,765,980) | (8,765,980) | (6,718,491) |
| Direct Cash Costs | Other Costs Variable | USD | (285,060,770) | (9,265,560) | (9,353,324) | (9,266,464) | (9,228,725) | (9,311,640) | (9,352,064) | (9,346,208) | (9,188,646) | (9,103,294) | (9,197,692) | (9,366,419) | (9,387,940) | (9,356,308) | (9,316,307) | (9,205,552) | (9,079,901) | (6,362,166) |
| Direct Cash Costs | Contingeny | USD | (28,986,509) | (901,577) | (905,965) | (901,622) | (899,735) | (903,881) | (905,902) | (905,609) | (897,731) | (893,464) | (898,184) | (906,620) | (907,696) | (906,114) | (904,114) | (898,577) | (892,294) | (654,033) |
| Direct Cash Costs | Rehabilitation | USD | (4,846,879) | 0 | 0 | 0 | 0 | 0 | 0 | 0 | 0 | 0 | 0 | 0 | 0 | 0 | 0 | 0 | 0 | 0 |
| Direct Cash Costs | | | (3,555,412,825) | (112,420,791) | (112,886,618) | (112,615,101) | (112,631,028) | (113,029,846) | (113,248,862) | (113,442,948) | (112,755,767) | (111,850,670) | (112,840,516) | (113,724,069) | (113,822,209) | (113,727,403) | (113,594,681) | (112,793,423) | (112,387,016) | (80,084,125) |
| Production Costs | Expansion Capital expenditure | USD | (202,365,476) | (384,921) | (187,878) | (278,731) | (388,191) | (265,160) | (167,519) | (271,869) | (9,787,162) | (12,117,983) | (70,483) | (13,969) | (9,030) | (9,961) | (11,365) | (25,659) | (30,311) | (192,122) |
| Production Costs | Contingency | USD | (40,754,055) | (713,376) | (775,737) | (717,306) | (723,528) | (716,258) | (713,040) | (851,586) | (2,243,446) | (2,399,587) | (145,666) | (54,819) | (41,396) | (41,396) | (41,396) | (41,380) | (41,331) | (28,928) |
| Production Costs | SIB | USD | (421,479,625) | (18,556,973) | (20,019,923) | (18,751,450) | (18,769,205) | (18,762,409) | (18,804,523) | (21,481,117) | (21,208,972) | (17,318,204) | (7,541,769) | (5,816,655) | (5,556,920) | (5,552,909) | (5,546,970) | (5,498,102) | (5,478,749) | (3,703,915) |
| Production Costs | | USD | (4,220,011,981) | (132,076,061) | (133,870,155) | (132,362,589) | (132,511,952) | (132,773,672) | (132,933,944) | (136,047,520) | (145,995,348) | (143,686,444) | (120,598,434) | (119,609,511) | (119,429,555) | (119,331,669) | (119,194,412) | (118,358,564) | (117,937,408) | (84,009,090) |
| Fully Allocated Costs | Royalty Act No 28 of 2008 | USD | (396,428,097) | (17,088,724) | (13,252,154) | (12,239,970) | (15,562,229) | (15,998,388) | (13,944,753) | (16,770,092) | (13,000,359) | (13,297,119) | (10,239,919) | (16,110,256) | (16,431,675) | (14,951,571) | (12,972,145) | (16,629,587) | (10,120,446) | (11,857,868) |
| Fully Allocated Costs | Other Fixed Costs | | (10,814,397) | (317,460) | (317,460) | (317,460) | (317,460) | (317,460) | (317,460) | (317,460) | (317,460) | (317,460) | (317,460) | (317,460) | (317,460) | (317,460) | (317,460) | (317,460) | (317,460) | (317,460) |
| Fully Allocated Costs | | USD | (4,627,254,474) | (149,482,245) | (147,439,769) | (144,920,019) | (148,391,640) | (149,089,521) | (147,196,157) | (153,135,072) | (159,313,166) | (157,301,023) | (131,155,813) | (136,037,227) | (136,178,690) | (134,600,700) | (132,484,017) | (135,305,611) | (128,375,313) | (96,184,418) |
| EBITDA | | USD | 4,916,443,376 | 211,947,499 | 155,745,692 | 143,702,458 | 182,733,858 | 190,622,074 | 161,957,925 | 204,871,334 | 164,577,984 | 166,504,536 | 110,874,933 | 192,053,332 | 198,062,152 | 170,034,989 | 138,210,944 | 202,851,273 | 107,537,845 | 144,897,903 |
| EBIT | | USD | 4,251,844,221 | 192,292,229 | 134,762,155 | 123,954,971 | 162,852,934 | 170,878,247 | 142,272,843 | 182,266,762 | 131,338,404 | 134,668,762 | 103,117,014 | 186,167,890 | 192,454,805 | 164,430,723 | 132,611,213 | 197,286,132 | 101,987,454 | 140,972,937 |
| Taxation | | USD | (1,278,006,669) | (59,569,192) | (41,021,700) | (37,573,815) | (50,078,840) | (52,659,152) | (43,451,794) | (56,268,868) | (39,713,981) | (40,823,893) | (31,077,147) | (57,819,596) | (59,847,864) | (50,822,912) | (40,581,194) | (61,423,225) | (30,759,567) | (43,899,124) |
| Income after tax | | USD | 2,973,837,552 | 132,723,037 | 93,740,455 | 86,381,156 | 112,774,094 | 118,219,095 | 98,821,050 | 125,997,894 | 91,624,423 | 93,844,869 | 72,039,868 | 128,348,294 | 132,606,941 | 113,607,811 | 92,030,020 | 135,862,907 | 71,227,887 | 97,073,814 |
| Working capital changes | | USD | 1 | (1,657,938) | 1,178,951 | 234,331 | (811,321) | (136,075) | 602,052 | (865,711) | 804,433 | (96,130) | 1,184,000 | (1,617,210) | (115,602) | 560,290 | 640,442 | (1,357,174) | 1,928,743 | (2,403,987) |
| Cash Flow | | | | | | | | | | | | | | | | | | | | |
| Net Cash Flow | Annual cash flow | USD | 2,973,837,552 | 131,065,099 | 94,919,406 | 86,615,487 | 111,962,774 | 118,083,020 | 99,423,102 | 125,132,183 | 92,428,856 | 93,748,739 | 73,223,868 | 126,731,084 | 132,491,339 | 114,168,101 | 92,670,462 | 134,505,732 | 73,156,630 | 94,669,826 |
| |
| RESOURCE | RESERVE | VALUE |
Blyvoor Gold Resources (Pty) Ltd
S-K 1300 Technical Report Summary on the Blyvoor Gold Mine, South Africa | 119 |
Table 53: Annual Cash Flow – Techno-economic Inputs (First 5 Years – Half Yearly)
| Project Title: | Blyvoor Gold |
| Client: | Blyvoor Capital |
| Project Code: | M24-003 |
| |
| |
| Project Duration | | Unit | Totals | | | | | | | | | | |
| Financial Years | | | 2058 | 2025 | 2025 | 2026 | 2026 | 2027 | 2027 | 2028 | 2028 | 2029 | 2029 |
| Financial Years | | years | | H1 - FY25 | H2 - FY25 | H1 - FY26 | H2 - FY26 | H1 - FY27 | H2 - FY27 | H1 - FY28 | H2 - FY28 | H1 - FY29 | H2 - FY29 |
| Macro-Economic Factors (Real Terms) | | | | | | | | | | | | |
| Currency | | ZAR /USD | 18.67 | 18.68 | 18.68 | 18.16 | 18.16 | 18.51 | 18.51 | 18.86 | 18.86 | 19.15 | 19.15 |
| Inflation | ZAR Inflation Rate | % | 4.56% | 4.80% | 4.80% | 4.50% | 4.50% | 4.50% | 4.50% | 4.50% | 4.50% | 4.50% | 4.50% |
| Inflation | US Inflation Rate | % | 2.32% | 2.80% | 2.80% | 2.40% | 2.40% | 2.20% | 2.20% | 2.10% | 2.10% | 2.10% | 2.10% |
| Commodities | | | | | | | | | | | | | |
| Commodity prices | Gold | USD/oz. | 1,959 | 2,078 | 2,078 | 2,016 | 2,016 | 1,900 | 1,900 | 1,900 | 1,900 | 1,900 | 1,900 |
| Commodity prices | Fixed Price Streaming Arrangement | USD/oz. | 572 | 572 | 572 | 572 | 572 | 572 | 572 | 572 | 572 | 572 | 572 |
| Operating Statistics | | | | | | | | | | | | |
| Tonnes Produced | | | | | | | | | | | | | |
| ROM | | tonnes | 2,268,195 | 105,096 | 143,123 | 185,158 | 154,887 | 199,739 | 249,210 | 244,797 | 281,378 | 349,147 | 355,660 |
| ROM | (Max) | tonnes/mnth | 29,638 | 8,758 | 11,927 | 15,430 | 12,907 | 16,645 | 20,768 | 20,400 | 23,448 | 29,096 | 29,638 |
| Mill Head grade | Gold Grade | g/t | 5.40 | 4.00 | 3.27 | 4.58 | 5.43 | 6.70 | 5.50 | 5.64 | 5.29 | 5.61 | 6.02 |
| Tonnes to mill | | tonnes | 2,268,195 | 105,096 | 143,123 | 185,158 | 154,887 | 199,739 | 249,210 | 244,797 | 281,378 | 349,147 | 355,660 |
| Recovered Grade | | | | | | | | | | | | | |
| Recovered grade | Precious Metals | g/t | 5.19 | 4.11 | 4.17 | 5.64 | 6.57 | 5.89 | 5.98 | 5.42 | 4.94 | 5.27 | 5.11 |
| Metal recovered | | | | | | | | | | | | | |
| Metal recovered | Gold | kg | 11,504 | 378 | 411 | 773 | 778 | 1,278 | 1,294 | 1,305 | 1,402 | 1,853 | 2,032 |
| Metal Recovered | Gold | oz | 369,875 | 12,147 | 13,212 | 24,861 | 25,018 | 41,081 | 41,595 | 41,965 | 45,089 | 59,580 | 65,328 |
| First tranche Cumulative Production | Gold | oz | 270,661 | 1,215 | 2,536 | 5,022 | 7,524 | 11,632 | 15,791 | 19,988 | 24,497 | 30,455 | 36,988 |
| First tranche <160koz | Gold | oz | 160,000 | 1,215 | 1,321 | 2,486 | 2,502 | 4,108 | 4,159 | 4,196 | 4,509 | 5,958 | 6,533 |
| First tranche >160koz | Gold | oz | 160,000 | - | - | - | - | - | - | - | - | - | - |
| Second tranche 100koz | Gold | oz | 100,000 | - | - | - | - | - | - | - | - | - | - |
| Total Gold at Fixed Price | Gold | oz | 36,988 | 1,215 | 1,321 | 2,486 | 2,502 | 4,108 | 4,159 | 4,196 | 4,509 | 5,958 | 6,533 |
| Sales Split | | | | | | | | | | | | | |
| Metal recovered | Gold - Open Market | oz | 332,888 | 10,933 | 11,890 | 22,375 | 22,516 | 36,973 | 37,435 | 37,768 | 40,580 | 53,622 | 58,795 |
| Metal recovered | Fixed Price Streaming Arrangement | oz | 36,988 | 1,215 | 1,321 | 2,486 | 2,502 | 4,108 | 4,159 | 4,196 | 4,509 | 5,958 | 6,533 |
Note: Numbers in red are not totals but are intended as production flags to determine production sold at fixed price as per streaming arrangement.
| |
| RESOURCE | RESERVE | VALUE |
Blyvoor Gold Resources (Pty) Ltd
S-K 1300 Technical Report Summary on the Blyvoor Gold Mine, South Africa | 120 |
Table 54: Annual Real Cash Flow (First 5 Years – Half Yearly)
| Project Title: | Blyvoor Gold |
| Client: | Blyvoor Capital |
| Project Code: | M24-003 |
| |
| |
| Project Duration | | Unit | Totals | | | | | | | | | | |
| Financial Years | | | 2058 | 2025 | 2025 | 2026 | 2026 | 2027 | 2027 | 2028 | 2028 | 2029 | 2029 |
| Financial Years | | years | | H1 - FY25 | H2 - FY25 | H1 - FY26 | H2 - FY26 | H1 - FY27 | H2 - FY27 | H1 - FY28 | H2 - FY28 | H1 - FY29 | H2 - FY29 |
| Financial | | | | | | | | | | | | | |
| Revenue | | USD | 661,613,437 | 23,367,925 | 25,414,886 | 46,447,956 | 46,741,211 | 72,452,941 | 73,358,964 | 74,011,750 | 79,522,483 | 105,078,893 | 115,216,429 |
| Revenue | Gold - Open Market | USD | 640,498,887 | 22,674,480 | 24,660,697 | 45,028,748 | 45,313,042 | 70,107,814 | 70,984,511 | 71,616,168 | 76,948,532 | 101,677,742 | 111,487,152 |
| Revenue | Fixed Price Streaming Arrangement | USD | 21,114,550 | 693,445 | 754,188 | 1,419,208 | 1,428,168 | 2,345,127 | 2,374,453 | 2,395,582 | 2,573,951 | 3,401,150 | 3,729,278 |
| Mining cost | | | (193,423,171) | (10,668,060) | (11,628,718) | (14,731,831) | (14,801,772) | (17,168,419) | (19,515,564) | (22,754,670) | (25,200,884) | (28,086,544) | (28,866,708) |
| Direct Cash Costs | Fixed Cost | USD | (6,638,556) | (631,636) | (631,636) | (690,518) | (690,518) | (677,421) | (677,421) | (664,896) | (664,896) | (654,808) | (654,808) |
| Direct Cash Costs | Variable Cost | USD | (177,573,987) | (9,528,422) | (10,443,334) | (13,339,798) | (13,406,408) | (15,673,455) | (17,908,831) | (21,006,218) | (23,335,946) | (26,094,282) | (26,837,296) |
| Direct Cash Costs | Contingeny | USD | (9,210,627) | (508,003) | (553,748) | (701,516) | (704,846) | (817,544) | (929,313) | (1,083,556) | (1,200,042) | (1,337,454) | (1,374,605) |
| Plant cost | | | (71,500,624) | (4,510,925) | (5,343,732) | (6,113,939) | (5,746,712) | (6,849,431) | (7,438,197) | (8,085,770) | (8,680,398) | (9,328,298) | (9,403,222) |
| Direct Cash Costs | Fixed Cost | USD | (12,115,839) | (750,942) | (750,942) | (874,444) | (874,444) | (1,503,507) | (1,503,507) | (1,475,709) | (1,475,709) | (1,453,318) | (1,453,318) |
| Direct Cash Costs | Variable Cost | USD | (55,979,994) | (3,545,178) | (4,338,327) | (4,948,355) | (4,598,614) | (5,019,761) | (5,580,491) | (6,225,025) | (6,791,337) | (7,430,775) | (7,502,131) |
| Direct Cash Costs | Contingeny | USD | (3,404,792) | (214,806) | (254,463) | (291,140) | (273,653) | (326,163) | (354,200) | (385,037) | (413,352) | (444,205) | (447,772) |
| Other Costs | | | (71,227,674) | (5,196,134) | (5,590,656) | (6,663,812) | (6,342,238) | (7,165,229) | (7,681,907) | (7,541,350) | (7,920,284) | (8,526,093) | (8,599,971) |
| Direct Cash Costs | Other Cost Fixed | USD | (42,503,470) | (3,715,671) | (3,715,671) | (4,187,964) | (4,187,964) | (4,514,591) | (4,514,591) | (4,450,519) | (4,450,519) | (4,382,990) | (4,382,990) |
| Direct Cash Costs | Other Costs Variable | USD | (22,928,452) | (1,069,055) | (1,444,791) | (1,927,593) | (1,621,333) | (2,058,629) | (2,550,703) | (2,461,739) | (2,822,629) | (3,450,810) | (3,521,170) |
| Direct Cash Costs | Contingeny | USD | (3,271,596) | (239,236) | (258,023) | (305,778) | (290,465) | (328,661) | (353,265) | (345,613) | (363,657) | (391,690) | (395,208) |
| Direct Cash Costs | Rehabilitation | USD | (2,524,155) | (172,171) | (172,171) | (242,477) | (242,477) | (263,348) | (263,348) | (283,478) | (283,478) | (300,603) | (300,603) |
| Direct Cash Costs | | | (336,151,469) | (20,375,119) | (22,563,106) | (27,509,582) | (26,890,722) | (31,183,080) | (34,635,669) | (38,381,790) | (41,801,566) | (45,940,935) | (46,869,901) |
| Production Costs | Expansion Capital expenditure | USD | (138,988,315) | (2,394,197) | (20,323,471) | (20,276,671) | (16,356,492) | (17,132,519) | (13,630,368) | (10,804,198) | (14,882,070) | (11,473,550) | (11,714,778) |
| Production Costs | Contingency | USD | (19,825,040) | (153,454) | (2,748,348) | (2,901,050) | (2,312,314) | (2,518,452) | (1,982,833) | (1,428,849) | (2,136,825) | (1,798,280) | (1,844,634) |
| Production Costs | SIB | USD | (37,322,559) | (674,886) | (1,843,029) | (1,276,784) | (871,206) | (1,168,626) | (4,359,314) | (5,314,306) | (6,036,033) | (8,012,695) | (7,765,681) |
| Production Costs | | USD | (532,287,382) | (23,597,657) | (47,477,954) | (51,964,087) | (46,430,733) | (52,002,676) | (54,608,184) | (55,929,143) | (64,856,494) | (67,225,460) | (68,194,994) |
| Fully Allocated Costs | Royalty Act No 28 of 2008 | USD | (9,478,877) | (121,957) | (121,957) | (232,973) | (232,973) | (358,346) | (358,346) | (383,836) | (383,836) | (3,642,327) | (3,642,327) |
| Fully Allocated Costs | Other Fixed Costs | | (1,608,061) | (155,253) | (155,253) | (164,660) | (164,660) | (164,212) | (164,212) | (161,175) | (161,175) | (158,730) | (158,730) |
| Fully Allocated Costs | | USD | (543,374,320) | (23,874,867) | (47,755,165) | (52,361,720) | (46,828,367) | (52,525,233) | (55,130,742) | (56,474,154) | (65,401,506) | (71,026,517) | (71,996,051) |
| EBITDA | | USD | 314,375,030 | 2,715,596 | 2,574,569 | 18,540,741 | 19,452,855 | 40,747,304 | 38,200,738 | 35,084,949 | 37,175,906 | 55,336,901 | 64,545,472 |
| EBIT | | USD | 118,239,117 | (506,942) | (22,340,279) | (5,913,764) | (87,156) | 19,927,707 | 18,228,222 | 17,537,596 | 14,120,978 | 34,052,376 | 43,220,379 |
| Taxation | | USD | (11,072,910) | 0 | 0 | 0 | 0 | 0 | 0 | 0 | 0 | 0 | (11,072,910) |
| Income after tax | | USD | 107,166,207 | (506,942) | (22,340,279) | (5,913,764) | (87,156) | 19,927,707 | 18,228,222 | 17,537,596 | 14,120,978 | 34,052,376 | 32,147,468 |
| Working capital changes | | USD | 0 | 1,424,613 | 263,307 | (150,561) | (107,839) | (471,134) | 504,389 | 573,875 | 323,130 | (317,575) | (242,737) |
| Cash Flow | | | | | | | | | | | | | |
| Net Cash Flow | Annual cash flow | USD | 108,965,676 | 917,671 | (22,076,972) | (6,064,325) | (194,995) | 19,456,574 | 18,732,612 | 18,111,472 | 14,444,107 | 33,734,801 | 31,904,732 |
| |
| RESOURCE | RESERVE | VALUE |
Blyvoor Gold Resources (Pty) Ltd
S-K 1300 Technical Report Summary on the Blyvoor Gold Mine, South Africa | 121 |
Item 19 (b) - Net Present Value
Minxcon’s in-house DCF model was employed to illustrate the NPV for the Mine in real terms. The NPV was derived from post Government royalties and tax, pre-debt real cash flows, using the techno-economic parameters, commodity price and macro-economic projections. This economic analysis is based on a free cash flow and measures the economic viability of the diluted Indicated and Measured Mineral Resources in the LoM plan, for conversion to Mineral Reserves under a defined set of realistically assumed modifying factors.
Table 55 illustrates the Mine NPV at various discount rates with a best estimated value of USD539 million (USD399 million attributable to Blyvoor Resources) at a real calculated discount rate of 11.9%. The IRR of the Project is 96%, however the mine is already in operation with initial capital already spent. Capital considered is only expansion and sustaining capital. The Project is financially viable; hence an updated Mineral Reserve can be declared.
Table 55: Blyvoor Mine NPV Summary – Real Terms
| Real Discount Rate | Unit | Blyvoor Mine | Blyvoor Resources
Attributable |
| NPV @ 0% | USDm | 2,974 | 2,201 |
| NPV @ 2% | USDm | 2,064 | 1,527 |
| NPV @ 4% | USDm | 1,485 | 1,099 |
| NPV @ 5% | USDm | 1,275 | 944 |
| NPV @ 6% | USDm | 1,104 | 817 |
| NPV @ 8% | USDm | 845 | 626 |
| NPV @ 10% | USDm | 664 | 491 |
| NPV @ 11.9% | USDm | 539 | 399 |
| NPV @ 12% | USDm | 533 | 395 |
| NPV @ 14% | USDm | 436 | 323 |
| IRR | % | | 96% |
The profitability ratios for the Project are displayed in Table 56. The Project has a current LoM of 34 years, with a break-even gold price of USD954/oz. The peak funding requirement was calculated at USD29 million with a payback period of production of 33 months. It is important to stress that the mine is currently in ramp-up phase from 15 ktpm to 40 ktpm, with expansion planned to 80 ktpm within 8 years. Current negative cash flow is due to expansion capital and low efficiencies from the ramp-up.
Table 56: Project Profitability Ratios
| Item | Unit | Reserve |
| Internal Rate of Return (IRR) | % | 96.2% |
| Total ounces in Mine plan | koz | 5,139 |
| In-situ Mining Inventory Valuation | ZAR/oz | 2,007 |
| In-situ Mining Inventory Valuation | USD/oz | 105 |
| LoM | Years | 34 |
| Average Payback Period | Months | 33 |
| Peak Funding Requirement | ZARm | 545 |
| Peak Funding Requirement | USDm | 29 |
| Break-even Feed Grade (Excluding Capex) | g/t | 2.47 |
| Break-even Feed Grade (Including Capex) | g/t | 2.89 |
| Break-even Gold Price (Excluding Capex) | USD/oz | 818 |
| Break-even Gold Price (Including Capex) | USD/oz | 954 |
| |
| RESOURCE | RESERVE | VALUE |
Blyvoor Gold Resources (Pty) Ltd
S-K 1300 Technical Report Summary on the Blyvoor Gold Mine, South Africa | 122 |
Item 19 (c) - Regulatory Items
As described in Item 3 (d) mining royalties are charged in terms of the MPRDA. The refined mineral formula was used for the Blyvoor Mine economic analysis.
Gold mining companies in South Africa are taxed according to the gold mine formula. Owing to the nature of the orebodies in South Africa, i.e., deep orebodies that require significant capital coupled with a fluctuating gold price, the government identified the vulnerability of gold mining companies during periods when margins are squeezed. The tax rates based on the formula decline when the company shows lower profits thereby giving the company the necessary breathing space during a difficult operating environment.
The gold mining formula is provided as Equation 1.
Equation 1: Mining Tax Formula
Where x = the ratio, expressed as a percentage, calculated as follows:-
| | Taxable income from gold mining | |
| | Total revenue (turnover) from gold mining | |
and y = calculated percentage which represents the rate of tax to be levied.
The rate of normal tax on taxable income other than that derived from mining for gold is 27%.
For all mines, capital expenditure incurred may be redeemed immediately against mining profits. All qualifying mining capital expenditure is deducted from taxable mining income to the extent that it does not result in an assessed loss. Accounting depreciation is eliminated when calculating the South African mining income tax. Excess capital expenditure and tax losses are carried forward as unredeemed capital and assessed losses and are from future mining taxable income. As per the provided 2024 tax calculations, Blyvoor Mine has unredeemed capital allowance in the amount of ZAR879,041,171 and assessed losses of ZAR446,962,553, unaudited, which were considered for the financial model. This is significantly different from previous year. Blyvoor confirmed the previous numbers were incorrect as they included revaluations.
Item 19 (d) - Sensitivity Analysis
Based on the real cash flow calculated in the financial model, Minxcon performed single-parameter sensitivity analyses to ascertain the impact on the NPV, the results of which are graphically illustrated in Figure 53. The bars represent various inputs into the model; each being increased or decreased by 15%. The red bars indicate a negative 15% change in the input while the blue bars indicate a positive 15% change in the input. The left-hand side of the graph indicates a negative change to the NPV while the right-hand side of the graph indicating a positive change to the NPV. For the DCF the grade, commodity prices and exchange rate have the biggest impact on the sensitivity of the Project followed by the mining cost. The project is least sensitive to capital and plant and other operating costs.
| |
| RESOURCE | RESERVE | VALUE |
Blyvoor Gold Resources (Pty) Ltd
S-K 1300 Technical Report Summary on the Blyvoor Gold Mine, South Africa | 123 |
Figure 53: Project Sensitivity (NPV11.9%)
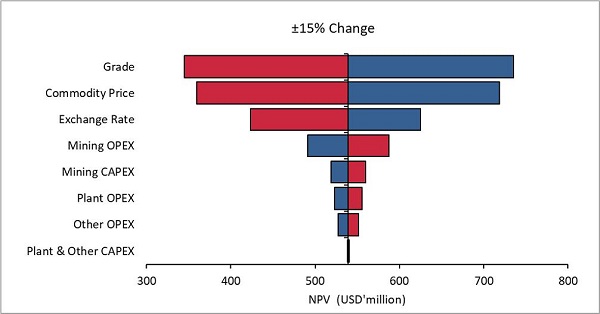
A sensitivity analysis was also conducted on the exchange rate and the commodity prices to better indicate the effect these two factors have on the NPV as well as the total costs and the grade. This is displayed in Table 57 and Table 58.
| |
| RESOURCE | RESERVE | VALUE |
Blyvoor Gold Resources (Pty) Ltd
S-K 1300 Technical Report Summary on the Blyvoor Gold Mine, South Africa | 124 |
Table 57: Sensitivity Analysis of Commodity Prices and Exchange Rate to NPV11.9% (USDm)
| | Exchange Rate (ZAR/USD) | 16.00 | 16.50 | 17.00 | 17.50 | 18.00 | 18.50 | 19.08 | 19.50 | 20.00 | 20.50 | 21.00 | 21.50 | 22.00 |
Gold Price
(USD/oz) | Change % | -16.2% | -13.5% | -10.9% | -8.3% | -5.7% | -3.1% | 0.0% | 2.2% | 4.8% | 7.4% | 10.0% | 12.7% | 15.3% |
| 1,300 | -31.9% | 11 | 39 | 64 | 89 | 111 | 131 | 154 | 168 | 185 | 202 | 217 | 231 | 244 |
| 1,400 | -26.6% | 81 | 109 | 133 | 156 | 177 | 197 | 219 | 233 | 250 | 265 | 279 | 295 | 308 |
| 1,500 | -21.4% | 149 | 176 | 199 | 220 | 242 | 261 | 282 | 296 | 314 | 329 | 343 | 357 | 370 |
| 1,600 | -16.2% | 215 | 240 | 264 | 285 | 305 | 325 | 346 | 360 | 376 | 391 | 405 | 421 | 434 |
| 1,700 | -10.9% | 281 | 304 | 327 | 349 | 369 | 388 | 408 | 422 | 439 | 455 | 469 | 483 | 496 |
| 1,800 | -5.7% | 343 | 368 | 391 | 412 | 432 | 450 | 472 | 486 | 502 | 517 | 531 | 545 | 558 |
| 1,909 | 0.0% | 413 | 436 | 458 | 479 | 501 | 519 | 539 | 553 | 569 | 584 | 600 | 613 | 626 |
| 2,001 | 4.8% | 470 | 493 | 516 | 538 | 558 | 576 | 596 | 610 | 627 | 642 | 656 | 670 | 683 |
| 2,101 | 10.1% | 532 | 558 | 580 | 600 | 619 | 638 | 660 | 674 | 689 | 704 | 718 | 732 | 746 |
| 2,201 | 15.3% | 596 | 620 | 641 | 662 | 682 | 702 | 722 | 736 | 751 | 766 | 782 | 796 | 808 |
| 2,301 | 20.5% | 658 | 681 | 703 | 726 | 745 | 764 | 784 | 798 | 815 | 830 | 844 | 857 | 870 |
| 2,401 | 25.8% | 720 | 744 | 767 | 788 | 807 | 826 | 847 | 861 | 877 | 892 | 906 | 919 | 932 |
| 2,501 | 31.0% | 784 | 807 | 829 | 850 | 869 | 889 | 910 | 923 | 939 | 953 | 968 | 981 | 994 |
| 2,601 | 36.3% | 846 | 869 | 891 | 912 | 933 | 951 | 971 | 985 | 1,000 | 1,015 | 1,030 | 1,043 | 1,056 |
Note: Sensitivity illustrates average gold prices and not constant gold prices.
Table 58: Sensitivity Analysis of Cash Operating Costs and Grade to NPV11.9% (USDm)
| | Grade delivered to plant (g/t) | 3.88 | 4.16 | 4.44 | 4.71 | 4.99 | 5.27 | 5.54 | 5.82 | 6.10 | 6.38 | 6.65 | 6.93 | 7.21 |
OPEX
(ZAR/Milled t) | | -30.0% | -25.0% | -20.0% | -15.0% | -10.0% | -5.0% | 0.0% | 5.0% | 10.0% | 15.0% | 20.0% | 25.0% | 30.0% |
| 161 | 30.0% | -25 | 47 | 117 | 186 | 253 | 318 | 385 | 449 | 516 | 580 | 645 | 711 | 776 |
| 154 | 25.0% | 5 | 77 | 147 | 213 | 279 | 346 | 410 | 474 | 541 | 605 | 670 | 736 | 801 |
| 148 | 20.0% | 34 | 105 | 174 | 240 | 305 | 371 | 435 | 502 | 566 | 631 | 697 | 762 | 827 |
| 142 | 15.0% | 63 | 133 | 200 | 266 | 333 | 397 | 461 | 527 | 592 | 656 | 723 | 787 | 852 |
| 136 | 10.0% | 92 | 161 | 228 | 292 | 358 | 422 | 489 | 553 | 617 | 684 | 748 | 813 | 880 |
| 130 | 5.0% | 121 | 187 | 254 | 319 | 384 | 448 | 514 | 578 | 643 | 709 | 774 | 839 | 906 |
| 124 | 0.0% | 149 | 215 | 279 | 345 | 409 | 475 | 539 | 604 | 670 | 735 | 800 | 867 | 932 |
| 117 | -5.0% | 175 | 241 | 306 | 371 | 435 | 501 | 565 | 630 | 696 | 761 | 826 | 892 | 957 |
| 111 | -10.0% | 202 | 267 | 333 | 396 | 462 | 526 | 591 | 657 | 722 | 787 | 853 | 918 | 983 |
| 105 | -15.0% | 229 | 293 | 358 | 422 | 488 | 552 | 617 | 683 | 748 | 813 | 879 | 944 | 1,009 |
| 99 | -20.0% | 255 | 320 | 384 | 450 | 514 | 578 | 644 | 709 | 773 | 840 | 905 | 970 | 1,035 |
| 93 | -25.0% | 281 | 346 | 410 | 475 | 539 | 604 | 670 | 734 | 800 | 866 | 931 | 996 | 1,061 |
| 86 | -30.0% | 308 | 372 | 437 | 501 | 565 | 631 | 696 | 760 | 827 | 892 | 957 | 1,022 | 1,087 |
Note: OPEX excludes Royalties in Sensitivity Analysis as the Royalties are dependent on operating margins.
| |
| RESOURCE | RESERVE | VALUE |
Blyvoor Gold Resources (Pty) Ltd
S-K 1300 Technical Report Summary on the Blyvoor Gold Mine, South Africa | 125 |
Item 19 (e) - Economic Analysis Conclusions
The value derived for the income approach only reflects the diluted Indicated and Measured Mineral Resources in the LoM plan, for conversion to Mineral Reserves. It is noted that Mineral Resources that are not Mineral Reserves do not have demonstrated economic viability. The Mineral Reserve is economically viable with a best estimated NPV of USD539 million (USD399 million attributable to Blyvoor Resources) at a real discount rate of 11.9%. The high IRR of 96% can be attributed to the fact that there is a peak funding requirement of USD29 million even though most of the capital has already been spent, expansion capital is planned which is not fully offset by the free cash flow. The all-in cost margin is 48% with a break-even gold price of USD954/oz. Table 59 shows a summary of the economic analysis.
Table 59: Blyvoor Mine Economic Analysis Summary – Real Terms
| Item | Unit | Blyvoor Mine | Blyvoor Resources Attributable |
| NPV @ 0% | USD million | 2,974 | 2,201 |
| NPV @ 2% | USD million | 2,064 | 1,527 |
| NPV @ 4% | USD million | 1,485 | 1,099 |
| NPV @ 5% | USD million | 1,275 | 944 |
| NPV @ 6% | USD million | 1,104 | 817 |
| NPV @ 8% | USD million | 845 | 626 |
| NPV @ 10% | USD million | 664 | 491 |
| NPV @ 11.9% | USD million | 539 | 399 |
| NPV @ 12% | USD million | 533 | 395 |
| NPV @ 14% | USD million | 436 | 323 |
| IRR | % | | 96.2% |
| All-in Cost Margin | % | | 48% |
| Peak Funding Requirement | USD million | | 29 |
| Payback | Months | | 33 |
| Break-even Gold Price | USD/oz. | | 954 |
| |
| RESOURCE | RESERVE | VALUE |
Blyvoor Gold Resources (Pty) Ltd
S-K 1300 Technical Report Summary on the Blyvoor Gold Mine, South Africa | 126 |
ITEM 20 - Adjacent Properties
The Carletonville Goldfield contains some of the largest and deepest underground mines in the world. In 2015, the five deepest operating mines in the world were located in this goldfield. The goldfield is the most significant gold deposit in the history of mining, and by 1986 had produced some 20,000 t of gold with a further 2,000 t sourced from the Deelkraal and Elandsrand (Kusasalethu) mines (Engelbrecht, 1986). Some 3,614 t of gold were sourced from the Carbon Leader Reef, at an average grade of 20.9 g/t Au.
Several gold mines occur in close proximity to each other, including Blyvoor, Tau Tona, Savuka, Mponeng, Driefontein and Kusasalethu. The relative location of these is illustrated in Figure 54.
The prolific Mponeng Mine, formerly known as the Western Deep Levels South Shaft, is the deepest mine in the world at 3,891 m depth, with economic reef horizons mined at depths of between 3,160 m and 3,740 m below surface through a twin-shaft system (Harmony, 2023). The mine, inclusive of all assets and liabilities, was held by AGA and sold to Harmony in February 2020 (AGA, 2020), with the sale concluded in September 2020. Both the VCR and Carbon Leader Reef are targeted. Ore is treated and smelted at the Mponeng Plant where it initially undergoes semi-autogenous milling after which a conventional gold leach process incorporating liquid oxygen injection is applied. Gold is extracted by carbon-in-pulp (“CIP”) technology. Mponeng Gold Mine is undergoing expansion to extend the life of mine beyond 2040. Some 195,669 oz of gold were recovered in financial year 2022 (Harmony, 2023).
Tau Tona Mine, or Western Deep 3 Shaft, of AGA is the second deepest mine in the world and commenced operations in 1962. Savuka, which lies immediately south of the Blyvoor mining right area, was included in the Tau Tona operation in 2013. Tau Tona and Savuka exploited mainly the Carbon Leader Reef and to a lesser extent the VCR. Tau Tona employed a longwall mining method through a three-shaft system, supported by secondary and tertiary shafts at depths of between 1,850 m and 3,450 m. The mining depth was extended to 3,900 mbs with the addition of a secondary shaft. Owing to poor ground conditions, seismicity and Savuka being exhausted, Tau Tona was placed on orderly closure in late 2017. The operations formed part of the 2020 sale transaction to Harmony (AGA, 2020).
| |
| RESOURCE | RESERVE | VALUE |
Blyvoor Gold Resources (Pty) Ltd
S-K 1300 Technical Report Summary on the Blyvoor Gold Mine, South Africa | 127 |
Figure 54: Gold Mines of the Carletonville Goldfield
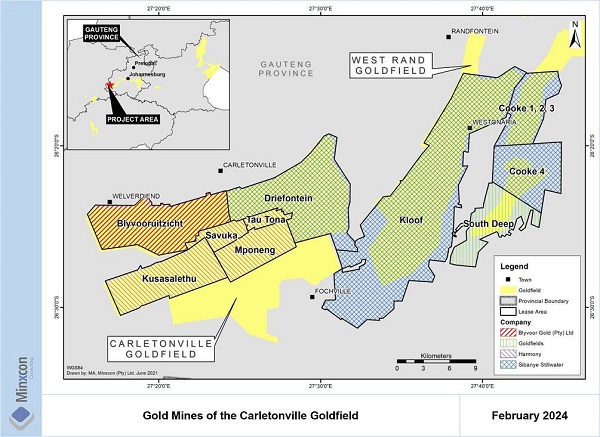
The Driefontein Mine of Sibanye Stillwater was formed from the amalgamation of the East Driefontein and West Driefontein mines in 1999 and is the fourth deepest mine in the world at 3,400 m. Driefontein operates under new order mining rights covering a total of 8,561 ha, exploiting the Carbon Leader Reef, VCR and Middelvlei Reef. It is an underground mine with a LoM until 2028, with surface reserves represented by rock dumps and TSFs that have accumulated throughout the operating history of the mine. Driefontein uses a scattered-conventional breast mining and pillar extraction and has six operating shaft systems (of a total of nine shaft complexes) at depths of between 700 m and 3,420 m, as well as three metallurgical plants. In 2019, the mines produced 164,640 oz of gold (Sibanye Stillwater, 2019, 2021).
Kusasalethu Mine (formerly Elandskraal, an amalgamation of Elandsrand and Deelkraal mines) was purchased by Harmony from AGA in 2001. It is the fifth deepest mine in the world at 3,388 m. The mine comprises twin vertical and twin sub-vertical shaft systems. The sub-vertical shafts, which access the deeper parts of the VCR, were extended to a depth of 3,600 m by the Kusasalethu deepening project. Conventional mining methods are employed, and ore is treated at the Kusasalethu Plant (Harmony, 2020). In financial year 2020, the mine produced 96,934 oz of gold (Harmony, 2020).
The mines as described are all located in the Carletonville Goldfield and typically target mineralisation of the same style. Blyvoor Mine targets the Carbon Leader and Middelvlei Reef, which are not targeted by all mines as described in this Section. Neighbouring property mineralisation is not necessarily indicative of mineralisation at the Blyvoor property.
| |
| RESOURCE | RESERVE | VALUE |
Blyvoor Gold Resources (Pty) Ltd
S-K 1300 Technical Report Summary on the Blyvoor Gold Mine, South Africa | 128 |
The QPs have relied on the information as is presented by the referenced sources. Verification has been limited to that data which is made available publicly and has been limited to cross-referencing information presented by the individual sources.
| |
| RESOURCE | RESERVE | VALUE |
Blyvoor Gold Resources (Pty) Ltd
S-K 1300 Technical Report Summary on the Blyvoor Gold Mine, South Africa | 129 |
ITEM 21 - OTHER RELEVANT DATA AND INFORMATION
Item 21 (a) - Risk Assessment
A risk assessment to consider and quantify risks associated with the Mine was conducted by the QPs based on a simplified approach. The result is not designed to be a definitive assessment of the risks, but is rather a tool to articulate and evaluate those risks as identified by persons present at the risk assessment session. All items were reviewed and assessed using the risk severity criteria shown below:-
| | ● | Green | – | Low risk (score 1-5); |
| | | | | |
| | ● | Yellow | – | Medium risk (score 6-12); |
| | | | | |
| | ● | Orange | – | Significant risk (score 13-20); and |
| | | | | |
| | ● | Red | – | High risk (score greater than 21). |
Following the identification and rating of the inherent risks, controls or mitigations were identified that are already in place or are well-understood in terms of the specific risk identified. Based on the effectiveness of the controls, the likelihood and consequences of the risk were re-evaluated, which resulted in the residual risk profile of the Project.
The risk profile contains several indicators that will be useful in guiding the stakeholders in identifying appropriate actions that need to be taken in a subsequent action plan. These indicators include high levels of likelihood, consequence, and exposure, as well as borderline or defective controls.
The outcome of the risk assessment is provided in Table 60 where only items of substantial residual risk after implementation of mitigation measures are shown. There is a risk that operations may be suspended or fines may be issued to the operations as they are currently operating without a valid water use licence. It is imperative that the Company adopt the governing laws as the primary guiding principles, rather than departmental recommendations, for operations to avoid potential legal implications. The Company is currently updating the additional information required in order to resubmit the application in the third quarter of 2023.
| |
| RESOURCE | RESERVE | VALUE |
Blyvoor Gold Resources (Pty) Ltd
S-K 1300 Technical Report Summary on the Blyvoor Gold Mine, South Africa | 130 |
Table 60: Risk Assessment
Risk Category | Risk | Description / Cause | Risk Rating | Mitigation/Control | Residual Risk |
Mining | Not achieving planned ounces | Current achieved mine call factor is lower than the planned mine call factor. | 20 | Improved MCF has been recorded. Collective effort are underway to improve and attain optimal MCF through: 1. Mining less Carbon seam facies and more conglomerate; 2. Increased sample width and reduce sample height to prevent over evaluation; 3. Introduce cutter sampling techniques opposed to manual hand sampling; and 4. Bonus incentives based on sweepings recovery 5. Introduction of vacuum machines for all carbon leader panels. | 3 |
Geotechnical | Delays in production as a result of seismicity | The Blyvoor Mine has a history of seismic activity. Seismicity is often associated with deep mines and remnant mining such as the Blyvoor Mine. | 18 | Mine planning to incorporate additional seismic management through adjusted mining sequencing, additional and adapted support implementation as guided by rock engineering department. High risk areas to be identified. Rock engineering modelling will be completed for these areas to determine the risk and the additional support measures that shall be implemented. Sequential grid mining will need to be implemented. | 9 |
Mining | Constrained face availability | Dependent on timeous opening up, development and ledging and dependent on no seismic disruptions. | 17 | Focused management controls to be implemented. | 5 |
Mining | Lower than planned plant feed grade | Tramming unforeseen additional waste. No waste:ore separation infrastructure is currently in place effectively diluting plant feed. | 17 | Implementation of dedicated waste ore pass systems to be considered. | 1 |
Refrigeration | Excessive heat in planned working areas. | Historical ventilation districts may not cater for the ventilation of scattered and widely distributed working places causing insufficient ventilation of these areas. Single haulage access on all levels restrict air flow and ventilation capacity. | 17 | A full and comprehensive ventilation study and plan should be drafted and implemented prior to mining commencing in scattered and widespread areas around the PS Shaft Complex. Portable cooling units to be deployed in isolated distant areas as necessary. Allowance has been made in capital costs for the installation of two cooling plants on 17 Level and 34 Level. | 3 |
Ventilation | Insufficient ventilation due to scattered and widespread planned mining areas | Historical ventilation districts may not cater for the ventilation of scattered and widely distributed working places causing insufficient ventilation of these areas. Single haulage access on all levels restrict air flow and ventilation capacity. | 17 | A full and comprehensive ventilation study and plan should be drafted and implemented prior to mining commencing in scattered and widespread areas around the PS Shaft Complex. Allowance has been made in capital costs for the installation of two surface ventilation fans each at No. 2 Shaft and No. 3 Vent Shaft. | 3 |
| |
| RESOURCE | RESERVE | VALUE |
Blyvoor Gold Resources (Pty) Ltd
S-K 1300 Technical Report Summary on the Blyvoor Gold Mine, South Africa | 131 |
Risk Category | Risk | Description / Cause | Risk Rating | Mitigation/Control | Residual Risk |
Infrastructure | Delay in obtaining access below 29 Level and the planned ramp up to 80 ktpm | Delays in the establishment of the planned dewatering system. | 14 | Ensure pumping commences when required. Capital allowance has been made for the re-equipping of required pump stations and the associated pumping systems. Detailed design work to commence as soon as possible to increase the confidence in the cost and dewatering plan. | 6 |
| Mining | Not achieving planned tramming targets. | The mine is targeting up to 13 crews per level, which may cause logistical challenges. | 13 | Optimise logistics management and tramming equipment. | 5 |
| Mining | Not achieving planned face advance | The mine is targeting a face advance of 12.8m on average, which may be challenging. | 13 | Focused management controls to be implemented. | 5 |
| Mining | Under performing against mine plan | Lack of alignment between short term mine planning and long term mine planning. | 13 | Improved short term mine planning and more focused management controls. | 5 |
| Mining | Planned production ramp-up not being achieved. | The planned production ramp-up is dependant on a number of significant infrastructure projects to be completed timeously. | 13 | Quality planning and management of the infrastructure projects are crucial. Key factors to be managed strictly include: employment of sufficient skilled labour, timeous completion of detailed design work, associated capital cost estimates and procurement of long lead items. | 5 |
| Processing | Not achieving planned production throughput and recoveries of 40 ktpm and 94% respectively. | Various plant operating parameters have not been optimised fully, as required for achievement of full processing potential. | 13 | Every process section must be audited to determine optimisation actions. External consultants should be invited to advise and assist with process change implementations. | 2 |
| Mining | Failure to achieve production build up and maintain steady state production | The majority of planned mining areas within the first five years has been confirmed by reconnaissance. Planned areas post the initial five year plan has not been confirmed due to a lack of access and would require significant opening up of existing haulages. | 13 | Capital projects and opening up operations to be executed timeously to ensure access to planned mining areas and to allow for reconnaissance of the planned mining areas. | 3 |
| Mining | Not achieving planned face advance | Blyvoor is a remnant mine. The scattered nature of the planned mining areas and small mining blocks, may not provide sufficient face length and effective face time to achieve the planned face advance | 13 | Adjusting planned face advances downward and planning for additional panels will mitigate potential lower face advances. | 6 |
| Financial | Costs higher that budget | Inefficient cost control and systems | 12 | Implementation of improved cost management systems. | 2 |
| Mining | Not achieving planned hoisting target at 15-19 Incline and 19 - 21 Incline Shafts. | Inefficient nature of incline shaft operation may result in not achieving planned hoisting targets. | 8 | Considering reopening the 1A Sub Shaft form 15 level to 23 level. Additional ore passes between levels will reduce storage capacity constraints. A dedicated ore pass system will increase hoisting efficiency. | 5 |
| |
| RESOURCE | RESERVE | VALUE |
Blyvoor Gold Resources (Pty) Ltd
S-K 1300 Technical Report Summary on the Blyvoor Gold Mine, South Africa | 132 |
Risk Category | Risk | Description / Cause | Risk Rating | Mitigation/Control | Residual Risk |
| Infrastructure | Insufficient capital provision | The level of detail for planned accesses in the old Blyvooruitzicht section is low. Little information is available to determine the work required to replace or refurbish existing infrastructure. The current condition of these accesses is unknown. | 8 | The current condition of planned future underground infrastructure that is required needs to be determined. Reconnaissance of the planned infrastructure will inform the capital requirements. | 1 |
| Processing | Insufficient TSF Capacity | The current Mineral Reserve of approximately 31 Mt is more than the 21 Mt capacity of TSF No. 6. | 8 | Additional tailings storage capacity will only be required in 26 years. The footprints of the old TSF No. 4 and TSF No. 5 are available for the construction of a new TSF. High level capital provision has been made for the additional capacity. | 3 |
| Resources | Channel width estimation could be inaccurate for calculations in isolated mining areas. | Erroneous channel widths were removed from the estimation dataset in 2021, resulting in gaps within channel width model. | 3 | Conduct channel width sampling within affected areas, and update channel width model. | 1 |
| Infrastructure | Reduced hoisting capacity during cage hoisting period | Additional hoppers required during the cage hoisting period may cause congestion on the shaft stations as the stations were not designed for this process. | 3 | Logistics associated with cage hoisting should be properly managed. Development and establishment of the 27.5 level loading station is nearing completion that will remove the need for cage hoisting. | 1 |
| |
| RESOURCE | RESERVE | VALUE |
Blyvoor Gold Resources (Pty) Ltd
S-K 1300 Technical Report Summary on the Blyvoor Gold Mine, South Africa | 133 |
ITEM 22 - INTERPRETATION AND CONCLUSIONS
Legal Aspects and Tenure
The Mine operates under a valid mining right MR143GP supported by an awarded an EA, EMPr and WUL. As noted previously, Blyvoor Ops will initially rely on the existing Blyvoor Capital rights and permits with respect to the Mining Right, the EA, EMPr and WUL under a duly signed agreement for this purpose. Notwithstanding, Blyvoor Ops can still be held liable for arising environmental impacts.
The QPs are not aware of any past material violations or fines. There is reasonable basis to believe that all governmental requirements for the Project have been obtained or can be obtained. The Project owners and operators must adhere to environmental and sustainability principles as set out in the MPRDA and NEMA. The QPs are not aware of any factors or risks that may affect access, title or right or the ability to perform work on the property.
Mineral Resources
The geology and structure of the mine is well understood. The operation is a typical mature Witwatersrand Gold Mine with years of historical data. New sampling data as at 29 February 2024 was provided for facies 3 on the Middelvlei Reef and facies 5 for the Carbon Leader Reef. Therefore, new estimates in 2024 were only produced for these two facies using the same estimation approach applied in 2021. New depletions as of 29 February 2024 were applied to the Carbon Leader and Middelvlei reefs.
There has been no significant change in the Mineral Resource Classification and grade between 2021 and 2023 for both the Carbon Leader and Middelvlei reefs.
Mining
With SBM only mining 25% of the Carbon Leader reef, conventional mining is the main mining method. SBM has been validated as a mining technique, but requires two panel per SBM crew in order to achieve the same advance as a conventional crew. its viability in a large-scale operation has not yet been established. The mining process makes sense, mining close to the shaft area, in areas that require little opening up and redevelopment. To ensure that all planned mining areas are available, ongoing reconnaissance has been planned. The existing mining infrastructure must be made accessible before the mine plan can go forward. Activities for opening up have been planned and are currently underway. Until the development of the orepass system feeding the newly commissioned mid-shaft hoisting arrangement is finished, cage hoisting in the PS Sub-vertical Shaft is planned above 27 Level and up to 15 Level (roughly 548 m). The mine plan only targets measured and indicated Mineral Resources inferred Mineral Resources do not provide any economic benefit.
Engineering and Infrastructure
The PS Shaft operation is well-established and equipped. Repairs have been conducted on equipment and infrastructure that had been damaged and/or vandalised since the operation’s closure and this infrastructure has been restored to service. The established equipment and infrastructure includes offices, change houses, lamp room, Eskom and Blyvoor electrical sub-stations, winding plants, main ventilation fans, shafts, pumping infrastructure, as well as a sewage plant.
Refurbishment and re-equipping of the power supply and electrical distribution infrastructure has been completed and recommissioned.
Potable water is sourced from Merafong Municipality. A supply line has been installed and connected to the existing supply line leading onto the Blyvoor Mine lease area. Service water will mainly be sourced from
| |
| RESOURCE | RESERVE | VALUE |
Blyvoor Gold Resources (Pty) Ltd
S-K 1300 Technical Report Summary on the Blyvoor Gold Mine, South Africa | 134 |
underground and the estimated available 25 Ml/day of fissure water ingress is deemed sufficient for the planned production rates.
Owing to PSSV Shaft being flooded from 10 m above 29 Level, ore cannot be hoisted from the installed loading station located on 43 Level. Commissioning of the orepass system feeding ore to the newly commissioned mid-shaft loading station on 27.5 Level will be required to facilitate rock hoisting in PSSV Shaft with the rock winder.
Ventilation and cooling of the underground workings is a critical part of the mining operation. A study has been completed by BBE to determine the ventilation and cooling requirements for the operation. The recommendations have been provided for to ensure efficient and effective ventilation and cooling of the underground workings.
Once mining moves further away from the PS Shaft Complex, establishment of ventilation fans at the historic Doornfontein No. 2 Shaft and the Blyvooruitzicht No. 3 Ventilation Shaft will be required. Dewatering of the underground workings will commence one year prior to mining proceeding below 27 Level. Initial dewatering will be conducted with submersible pumps through PSSV Shaft and PS Shaft. Once the permanent pump stations and associated infrastructure below 31 Level has been re-instated and recommissioned, this infrastructure and equipment will be utilised to dewater the underground workings. The selected pumping equipment and infrastructure will have sufficient capacity for the required dewatering and sufficient capital has been allowed for the acquisition thereof.
Re-equipping and recommissioning of Incline shafts in the old Blyvooruitzicht section will be required to sustain the targeted production rates. This will include rails, sleepers, winders, ore tipping arrangements and all services required for mining and re-equipping of the old workings. Sufficient capital has been allowed for this purpose.
Processing
The process plant has been operating at a consistent recovery of 91.5%, and this can be expected to continue as long as the ore mineralogy does not change, or plant enhancements are made. The average processing rate for the 12 months ending March 2024 was 16.0 ktpm. The process plant has a processing capacity of 40.0 ktpm. Currently, the plant is treating all of the material supplied by the underground operation and will continue to do so until RoM supplied exceeds 40.0 ktpm, at which time the planned process plant capacity increase will be required.
Economic Analysis
The Blyvoor Mine plan including only the diluted Indicated and Measured Mineral Resources in the LoM plan, for conversion to Mineral Reserves is financially feasible. The updated Mineral Reserve can therefore be declared. The DCF value of USD539 million for the Blyvoor Mine (USD399 million attributable to Blyvoor Resources) was calculated at a real discount rate of 11.9%. A high IRR of 96% was calculated based on a funding requirement of USD29 million, with initial capital already spent.
Blyvoor Mine has an all-in cost margin of 48%, which is high compared to similar mines. All-in sustaining costs for the Blyvoor Mine amount to USD152/milled t, which equates to USD905/oz. All-in costs for the Blyvoor Mine amount to USD161/milled t, which equates to USD954/oz. Funding of USD29 million is required in month 20 (October 2025) as the expansion capital in the first two years is not fully offset by internally generated free cash flow. The payback period was calculated as 33 months.
The Mine is most sensitive to grade, commodity prices and exchange rate. The Mine is least sensitive to capital and other plant and other operating costs. The Project has a break-even gold price of USD954/oz including capital.
| |
| RESOURCE | RESERVE | VALUE |
Blyvoor Gold Resources (Pty) Ltd
S-K 1300 Technical Report Summary on the Blyvoor Gold Mine, South Africa | 135 |
ITEM 23 - RECOMMENDATIONS
Legal Aspects and Tenure
Blyvoor Capital are in possession of all necessary permit licences and authorisations for the current operations, the most significant of these being a mining right, environmental authorisation, environmental management programme and a water use licence. In light of no material risks for the current operations, an environmental audit undertaken for 2024 noted minor areas for improvement. Submission of the PAEL first quarterly report is pending. It is imperative that a contingency or action plan should be put in place to facilitate future compliance and improvement of on-site environmental and sustainability principles as set out in the MPRDA, NEMA and NEMAQA.
Mineral Resources
As mining progresses, channel width information should be compared to current channel width estimates as the channel width data is spatially not as well spread as the cm.g/t datasets. The channel width data can then be remodelled for more complete channel width modelling. The current model does; however, utilise the cm.g/t data to produce a cm.g/t estimate and report resources at a stope width of 117cm which is typically thicker than the current channel widths estimated. CW data is being collected with the new sampling being conducted in the mining areas and this will be incorporated into the modelling in future.
It is recommended that the facies modelling of the Middelvlei Reef be reviewed with further Mineral Resource updates to refine the estimation for future mine planning.
Reconciliations of mined grades with block model grades should be performed.
Mining
Ongoing reconnaissance should be conducted to assess the availability and condition of planned underground access and workings beyond the fifth year. If the reconnaissance identifies inaccessible areas, it may be necessary to revise the plan accordingly. The reconnaissance must be utilised to revise the capital estimate for shaft refurbishment, dewatering, pump stations, substations, mining equipment, and rail-bound equipment. For the later years of operation, a comprehensive ventilation plan that includes refrigeration should be developed. To determine the ventilation requirements beyond the first five years of mining, simulations of ventilation should be conducted. To optimise extraction and support techniques, ongoing rock engineering investigations and re-modelling are necessary. Considering the seismic activities, it is recommended that a risk register and seismic monitoring continue, and plans be implemented.
Engineering and Infrastructure
Cage hoisting is a difficult and time-consuming process and although it has been estimated that sufficient cage hoisting capacity (22.5 ktpm) exists and this arrangement will be temporary. Delays in the commissioning of the new orepass system supplying ore to the commissioned 27.5 Level mid-shaft loading station may constitute a risk and fast tracking the establishment is being considered. Proper controls and management of the cage hoisting process will however be required during the cage hoisting phase, as congestion on shaft stations can easily cause delays and production constraints.
Investigations need to be conducted to fully understand the requirements for re-equipping the old Blyvooruitzicht section incline shafts. A ventilation study and simulation need to be conducted to fully understand the ventilation and cooling requirements once mining in the extremities of the project areas as well as when mining proceeds below 31 Level.
Considering the criticality of dewatering the flooded workings, it is recommended that the commencement of the detailed study work regarding the dewatering system and associated infrastructure be expedited.
| |
| RESOURCE | RESERVE | VALUE |
Blyvoor Gold Resources (Pty) Ltd
S-K 1300 Technical Report Summary on the Blyvoor Gold Mine, South Africa | 136 |
This is required to ensure timeous establishment of the pump system and infrastructure and prevent any delay of mining below 29 Level.
Processing
The plant expansion design study was completed in May 2023 and planned commissioning must be informed by the mining planning. A new TSF must be planned for in 20 years to allow for deposition at that time.
| |
| RESOURCE | RESERVE | VALUE |
Blyvoor Gold Resources (Pty) Ltd
S-K 1300 Technical Report Summary on the Blyvoor Gold Mine, South Africa | 137 |
ITEM 24 - REFERENCES
| 1. | AngloGold Ashanti (2020). Annual Report Pursuant to Section 13 or 15(D) of the Securities Exchange Act of 1934. United States Securities and Exchange Commission. As filed on 27 March 2020. |
| 2. | Australian Government, Office of the Chief Economist (2023). Department of Industry, Science, Energy and Resources. Resources and Energy Quarterly, December 2023. |
| 3. | climate-data.org (2023). Carletonville Climate. Accessed at https://en.climate-data.org/africa/south-africa/gauteng/carletonville-1029/. |
| 4. | Engelbrecht, C.J. (1986). The West Wits Line, in Witwatersrand gold –100 years (ed. E. S. A. Antrobus), 199–223, Johannesburg, Geological Society of South Africa. |
| 5. | Golder Associates (2016). Randlord Capital (Pty) Ltd - Blyvoor Gold Operations (Pty) Ltd. EMP Update for Tailings Reclamation & Underground Mining at Blyvooruitzicht Gold Mine. Report Number: 1656096-307570-3. October 2016. 116pp. |
| 6. | Harmony (2020). Mineral Resources and Mineral Reserves Report 2020. 142pp. |
| 7. | Harmony (2023). Webpage: Mponeng. Accessed on 12 June 2023 at https://www.harmony.co.za/operations/south-africa/underground/mponeng/. |
| 8. | McCarthy, T.S. (2006). The Witwatersrand Supergroup. In: Johnson, M.R., Anhaeusser, C.R. and Thomas, R.J. (Eds), The Geology of South Africa, Chapter 7. Geological Society of South Africa, Council for Geoscience, Pretoria. p155-186. |
| 9. | Minxcon, 2021. P20_029a_Blyvoor_PFS, Blyvoor Gold Mine |
| 10. | Plant expansion 19042023.pdf |
| 11. | Plant mass balance.xlsx |
| 12. | Process description 18-05-14.docx |
| 13. | Process Design Criteria 18-05-10.xlsx |
| 14. | Robb, L.J. and Robb, V.M. (1998). Gold in the Witwatersrand Basin. In: Wilson, M.G.C. and Anhaeusser, C.R. (Eds), The Mineral Resources of South Africa, Handbook 16. Geological Society of South Africa, Council for Geoscience, Pretoria. P294-349. |
| 15. | South African Committee for Stratigraphy (SACS) (2006). Stratigraphic Terminology and Nomenclature for South Africa. |
| 16. | Sibanye Stillwater (2019). Mineral Resource and Mineral Reserve Report 2019. 169pp. |
| 17. | Sibanye Stillwater (2021). Driefontein http://www.sibanyestillwater.com/our-business/southern-africa/gold/driefontein/overview. Accessed on 10 February 2021. |
| 18. | United States Geological Survey (2024). Gold Data Sheet - Mineral Commodity Summaries 2024, 31 January 2024. |
| 19. | World Gold Council (2024). Gold Demand Trends, Full Year and Q4 2023. London, United Kingdom. Published: January 2024. |
| |
| RESOURCE | RESERVE | VALUE |
Blyvoor Gold Resources (Pty) Ltd
S-K 1300 Technical Report Summary on the Blyvoor Gold Mine, South Africa | 138 |
ITEM 25 - RELIANCE ON INFORMATION PROVIDED BY THE REGISTRANT
The QPs have accepted information supplied by Blyvoor Resources regarding the permits and licences as valid and complete, which is included in Item 3 of this TRS. The QPs consider such reliance reasonable because the information constitutes legal and environmental matters outside the expertise of the QPs.
| |
| RESOURCE | RESERVE | VALUE |