Exhibit 96.2
Blyvoor Gold Operations (Pty) Ltd
S-K 1300 Technical Report Summary on the Blyvoor Tailings Retreatment Project, South Africa | i |
DATE AND SIGNATURE PAGE
This Report titled “S-K 1300 Technical Report Summary on the Blyvoor Tailings Retreatment Project, South Africa” was prepared for Blyvoor Gold Operations (Pty) Ltd. The Report is compiled in accordance with the United States Securities and Exchange Commission Part 229 Standard Instructions for Filing Forms Regulation S-K subpart 1300. The effective date of this Report is 29 February 2024.
The Qualified Persons (“QPs”) responsible for this Report are Mr. Uwe Engelmann (Geology and Mineral Resources) and Mr. Daniel (Daan) van Heerden (Mineral Processing, Mineral Extraction, Economic Analysis and Mineral Reserves).
| /s/ U. ENGELMANN | |
| U. ENGELMANN | |
| BSc (Zoo. & Bot.), BSc Hons (Geol.) | |
| Pr.Sci.Nat., FGSSA | |
| DIRECTOR, MINXCON (PTY) LTD | |
| /s/ D. VAN HEERDEN | |
| D. VAN HEERDEN | |
| B Eng (Min.), MCom (Bus. Admin.), MMC | |
| Pr.Eng., FSAIMM, AMMSA | |
| DIRECTOR, MINXCON (PTY) LTD | |
Signed at Little Falls, Gauteng, South Africa, on 31 May 2024.
 | |
| RESOURCE | RESERVE | VALUE |
Blyvoor Gold Operations (Pty) Ltd
S-K 1300 Technical Report Summary on the Blyvoor Tailings Retreatment Project, South Africa | ii |
INFORMATION RISK
This Report was prepared by Uwe Engelmann and Daniel van Heerden (the QPs) of Minxcon (Pty) Ltd (“Minxcon”). In the preparation of the Report, the QPs utilised information relating to operational methods and expectations provided to them by various sources. Where possible, the QPs have verified this information from independent sources after making due enquiry of all material issues that are required in order to comply with the requirements of the United States Securities and Exchange Commission Part 229 Standard Instructions for Filing Forms Regulation S-K subpart 1300. The authors of this report are not qualified to provide extensive commentary on legal issues associated with rights to the mineral properties and relied on the information provided to them by the issuer. No warranty or guarantee, be it express or implied, is made by the authors with respect to the completeness or accuracy of the legal aspects of this document.
OPERATIONAL RISKS
The business of mining and mineral exploration, development and production by their nature contain significant operational risks. The business depends upon, amongst other things, successful prospecting programmes and competent management. Profitability and asset values can be affected by unforeseen changes in operating circumstances and technical issues.
POLITICAL AND ECONOMIC RISK
Factors such as political and industrial disruption, currency fluctuation and interest rates could have an impact on future operations, and potential revenue streams can also be affected by these factors. The majority of these factors are, and will be, beyond the control of any operating entity.
FORWARD LOOKING STATEMENTS
Certain statements contained in this document other than statements of historical fact, contain forward-looking statements regarding the operations, economic performance or financial condition, including, without limitation, those concerning the economic outlook for the mining industry, expectations regarding commodity prices, exchange rates, production, cash costs and other operating results, growth prospects and the outlook of operations, including the completion and commencement of commercial operations of specific production projects, its liquidity and capital resources and expenditure, and the outcome and consequences of any pending litigation or enforcement proceedings.
Although the QPs believe that the expectations reflected in such forward-looking statements are reasonable, no assurance can be given that such expectations will prove to be correct. Accordingly, results may differ materially from those set out in the forward-looking statements as a result of, among other factors, changes in economic and market conditions, changes in the regulatory environment and other State actions, success of business and operating initiatives, fluctuations in commodity prices and exchange rates, and business and potential risk management.
| |
| RESOURCE | RESERVE | VALUE |
Blyvoor Gold Operations (Pty) Ltd
S-K 1300 Technical Report Summary on the Blyvoor Tailings Retreatment Project, South Africa | iii |
TABLE OF CONTENTS
| Item 1 - Executive Summary | 1 |
| | I. | Permitting Requirements | | 1 |
| | II. | Geology and Mineral Deposit | | 1 |
| | III. | Status of Exploration | | 1 |
| | IV. | Mineral Resource and Mineral Reserve Estimates | | 2 |
| | V. | Development and Operations | | 2 |
| | VI. | Economic Analysis | | 3 |
| | VII. | Conclusions | | 6 |
| | VIII. | Recommendations | | 7 |
| Item 2 - Introduction | | 9 |
| | Item 2 (a) | - Issuer Receiving the Report; Authors | | 9 |
| | Item 2 (b) | - Terms of Reference and Purpose of the Report | | 9 |
| | Item 2 (c) | - Sources of Information and Data Contained in the Report | | 9 |
| | Item 2 (d) | - Qualified Persons’ Personal Inspection of the Property | | 9 |
| Item 3 - Property Description and Location | | 11 |
| | Item 3 (a) | - Location of the Property | | 11 |
| | Item 3 (b) | - Area of the Property | | 11 |
| | Item 3 (c) | - Mineral Deposit Tenure | | 12 |
| | Item 3 (d) | - Royalties and Payments | | 14 |
| | Item 3 (e) | - Environmental Liabilities | | 15 |
| | Item 3 (f) | - Permits to Conduct Work | | 15 |
| | I. | Water Use Licence | | 15 |
| | II. | Additional Environmental Permits | | 15 |
| | III. | Other | | 16 |
| | Item 3 (g) | - Other Significant Factors and Risks | | 16 |
| Item 4 - Accessibility, Climate, Local Resources, Infrastructure and Physiography | | 17 |
| | Item 4 (a) | - Topography, Elevation and Vegetation | | 17 |
| | Item 4 (b) | - Access to the Property | | 17 |
| | Item 4 (c) | - Climate and Length of Operating Season | | 17 |
| | Item 4 (d) | - Infrastructure | | 18 |
| Item 5 - History | | 19 |
| | Item 5 (a) | - Prior Ownership and Ownership Changes | | 19 |
| | Item 5 (b) | - Historical Exploration and Development | | 19 |
| Item 6 - Geological Setting, Mineralisation and Deposit | | 20 |
| | Item 6 (a) | - Regional Geology | | 20 |
| | Item 6 (b) | - Local and Property Geology | | 20 |
| | Item 6 (c) | - Mineralisation and Deposit Type | | 22 |
| Item 7 - Exploration | | 23 |
| | Item 7 (a) | - Non-drilling Work | | 23 |
| | Item 7 (b) | - Drilling | | 23 |
| | I. | Type and Extent of Drilling | | 23 |
| | II. | Sampling | | 24 |
| | III. | Logging | | 28 |
| | Item 7 (c) | - Hydrogeology | | 28 |
| | Item 7 (d) | - Geotechnical | | 28 |
| Item 8 - Sample Preparation, Analyses and Security | | 29 |
| | Item 8 (a) | - Sample Handling Prior to Dispatch | | 29 |
| | | | | | |
| |
| RESOURCE | RESERVE | VALUE |
Blyvoor Gold Operations (Pty) Ltd
S-K 1300 Technical Report Summary on the Blyvoor Tailings Retreatment Project, South Africa | iv |
| | Item 8 (b) | - Sample Preparation and Analysis Procedures | | 29 |
| | Item 8 (c) | - Quality Assurance and Quality Control | | 30 |
| | Item 8 (d) | - Adequacy of Sample Preparation, Security and Analytical Procedures | | 31 |
| Item 9 - Data Verification | | 33 |
| | Item 9 (a) | - Data Verification Procedures | | 33 |
| | Item 9 (b) | - Limitations on/Failure to Conduct Data Verification | | 33 |
| | Item 9 (c) | - Adequacy of Data | | 33 |
| Item 10 - Mineral Processing and Metallurgical Testing | | 34 |
| | Item 10 (a) | - Nature and Extent of Testing and Analytical Procedures | | 34 |
| | Item 10 (b) | - Basis of Assumptions Regarding Recovery Estimates | | 34 |
| | Item 10 (c) | - Representativeness of Samples and Adequacy of Data | | 34 |
| | Item 10 (d) | - Deleterious Elements for Extraction | | 35 |
| Item 11 - Mineral Resource Estimates | | 36 |
| | Item 11 (a) | - Assumptions, Parameters and Methods Used for Resource Estimates | | 36 |
| | I. | Mineral Resource Estimation Procedures | | 36 |
| | II. | Initial Assessment | | 45 |
| | III. | Mineral Resource Classification | | 45 |
| | IV. | Mineral Resource Statement | | 45 |
| | Item 11 (b) | - Individual Grade of Metals | | 47 |
| | Item 11 (c) | - Factors Affecting Mineral Resource Estimates | | 47 |
| Item 12 - Mineral Reserve Estimates | | 48 |
| | Item 12 (a) | - Key Assumptions, Parameters and Methods | | 48 |
| | I. | Estimation and Modelling Techniques | | 48 |
| | II. | Quality Parameters Applied | | 48 |
| | III. | Modifying Factors | | 49 |
| | IV. | Mineral Reserve Statement | | 49 |
| | Item 12 (b) | - Multiple Commodity Reserve | | 50 |
| | Item 12 (c) | - Factors Affecting Mineral Reserve Estimation | | 50 |
| Item 13 - Mining Methods | | 51 |
| | I. | Mining Layout | | 51 |
| | II. | Mining Strategy | | 51 |
| | Item 13 (a) | - Parameters Relevant to Mine Design | | 52 |
| | Item 13 (b) | - Production Rates, Expected Mine Life, Mining Unit Dimensions, and Mining Dilution | | 53 |
| | I. | Life of Project Production Schedule (Measured and Indicated Mineral Resources) | | 53 |
| | Item 13 (c) | - Requirements for Stripping, Underground Development and Backfilling | | 54 |
| | Item 13 (d) | - Required Mining Fleet, Machinery and Personnel | | 55 |
| | I. | Mining Fleet and Machinery | | 55 |
| | II. | Personnel | | 55 |
| Item 14 - Recovery Methods | | 56 |
| | Item 14 (a) | - Flow Sheets and Process Recovery Methods | | 56 |
| | Item 14 (b) | - Plant Design, Equipment Characteristics and Specifications | | 57 |
| | Item 14 (c) | - Energy, Water and Process Materials Requirements | | 58 |
| | I. | Labour Requirements | | 58 |
| | II. | Reagents and Consumables | | 58 |
| Item 15 - Project Infrastructure | | 59 |
| | Item 15 (a) | - Available Infrastructure | | 59 |
| | Item 15 (b) | - Required Infrastructure | | 59 |
| Item 16 - Market Studies | | 64 |
| | Item 16 (a) | - Commodity Market Assessment | | 64 |
| | | | | | |
| |
| RESOURCE | RESERVE | VALUE |
Blyvoor Gold Operations (Pty) Ltd
S-K 1300 Technical Report Summary on the Blyvoor Tailings Retreatment Project, South Africa | v |
| | I. | World Gold Deposits and Reserves | | 64 |
| | II. | Gold Supply and Demand Fundamentals | | 64 |
| | III. | Gold Pricing | | 65 |
| | IV. | Gold Outlook | | 66 |
| | Item 16 (b) | - Contracts | | 66 |
| Item 17 - Environmental Studies, Permitting and Plans, Negotiations, or Agreements with Local Individuals or Groups | | 67 |
| | Item 17 (a) | - Relevant Environmental Issues and Results of Studies Done | | 67 |
| | Item 17 (b) | - Waste Disposal, Site Monitoring and Water Management | | 68 |
| | I. | Waste Disposal | | 68 |
| | II. | Site Monitoring | | 69 |
| | III. | Water Management | | 69 |
| | Item 17 (c) | - Permit Requirements | | 69 |
| | Item 17 (d) | - Social and Community-Related Requirements | | 69 |
| | Item 17 (e) | - Mine Closure Plans and Costs | | 70 |
| | Item 17 (f) | - Adequacy of Current Plans | | 70 |
| | Item 17 (g) | - Local Procurement and Hiring | | 70 |
| Item 18 - Capital and Operating Costs | | 71 |
| | Item 18 (a) | - Capital Costs | | 71 |
| | Item 18 (b) | - Operating Cost | | 74 |
| | I. | Financial Costs Indicators | | 78 |
| | Item 18 (c) | - Accuracy of Estimates | | 81 |
| Item 19 - Economic Analysis | | 82 |
| | Item 19 (a) | - Principal Assumptions | | 82 |
| | I. | Basis of Evaluation of the Mining Assets | | 82 |
| | II. | Macro-Economic Forecasts | | 82 |
| | III. | Working Capital | | 83 |
| | IV. | Recoveries | | 83 |
| | V. | Discount Rate | | 83 |
| | VI. | Cash Flow Forecast | | 84 |
| | Item 19 (b) | - Net Present Value | | 88 |
| | Item 19 (c) | - Regulatory Items | | 88 |
| | I. | Government Royalties | | 88 |
| | II. | Corporate Taxes | | 89 |
| | Item 19 (d) | - Sensitivity Analysis | | 89 |
| | Item 19 (e) | - Economic Analysis Conclusions | | 92 |
| Item 20 - Adjacent Properties | | 93 |
| Item 21 - Other Relevant Data and Information | | 94 |
| | Item 21 (a) | - Risk Assessment | | 94 |
| Item 22 - Interpretation and Conclusions | | 95 |
| Item 23 - Recommendations | | 97 |
| Item 24 - References | | 98 |
| Item 25 - Reliance on Information Provided by the Registrant | | 99 |
| | | | | | |
| |
| RESOURCE | RESERVE | VALUE |
Blyvoor Gold Operations (Pty) Ltd
S-K 1300 Technical Report Summary on the Blyvoor Tailings Retreatment Project, South Africa | vi |
FIGURES
| Figure 1: Location of Project Area | | 12 |
| Figure 2: Company Structure | | 13 |
| Figure 3: TSF No. 1, 6 and 7 Sections | | 21 |
| Figure 4: Doornfontein TSF Sections | | 22 |
| Figure 5: Drillhole Collars for TSF No. 1 | | 25 |
| Figure 6: Drillhole Collars for TSF No. 6 | | 25 |
| Figure 7: Drillhole Collars for TSF No. 7 | | 26 |
| Figure 8: Drillhole Collars for Doornfontein TSF No. 1 | | 26 |
| Figure 9: Drillhole Collars for Doornfontein TSF No. 2 | | 27 |
| Figure 10: Drillhole Collars for Doornfontein TSF No. 3 | | 27 |
| Figure 11: Outlier Analysis for TSF No. 6 | | 37 |
| Figure 12: Outlier Analysis for TSF No. 7 | | 37 |
| Figure 13: Mineral Resource Estimation for TSF No. 1 | | 39 |
| Figure 14: Mineral Resource Estimation for TSF No. 6 | | 40 |
| Figure 15: Mineral Resource Estimation for TSF No. 7 | | 41 |
| Figure 16: Mineral Resource Estimation for Doornfontein TSF No. 1 | | 42 |
| Figure 17: Mineral Resource Estimation for Doornfontein TSF No. 2 | | 43 |
| Figure 18: Mineral Resource Estimation for Doornfontein TSF No. 3 | | 44 |
| Figure 19: Blyvoor TSF No. 6 and TSF No. 7 Mineral Resource Model | | 46 |
| Figure 20: Blyvoor Ops Tailings Retreatment Project Layout | | 51 |
| Figure 21: Blyvoor TSF No. 6 and TSF No. 7 Mining Areas and Grade Distribution | | 52 |
| Figure 22: Diluted Tonnes Delivered to Plant | | 53 |
| Figure 23: Diluted Content Delivered to Plant | | 54 |
| Figure 24: Block Flow Diagram of the Tailings Reclaim and Treatment Process | | 56 |
| Figure 25: Project Onsite Power Distribution System | | 60 |
| Figure 26: New TSF Footprints | | 62 |
| Figure 27: Capital Schedule | | 74 |
| Figure 28: Contractor Mining Operating Cost Comparison | | 75 |
| Figure 29: Monthly Salary per Job Grade | | 77 |
| Figure 30: Rehabilitation Payment Schedule | | 78 |
| Figure 31: Adjusted Operating Cost vs. Feed Tonnes | | 80 |
| Figure 32: AISC vs. Gold Price | | 80 |
| Figure 33: AIC vs. Gold Price | | 81 |
| Figure 34: Real-term Historic Gold Price | | 83 |
| Figure 35: Saleable Gold Ounces | | 85 |
| Figure 36: Undiscounted Cash Flow | | 86 |
| Figure 37: Project Sensitivity (NPV11.4%) | | 90 |
| |
| RESOURCE | RESERVE | VALUE |
Blyvoor Gold Operations (Pty) Ltd
S-K 1300 Technical Report Summary on the Blyvoor Tailings Retreatment Project, South Africa | vii |
TABLES
| Table 1: Co-ordinate Locations and Surface Areas Covered by Each TSF | | 11 |
| Table 2: Registered Usufructs to Blyvoor Ops | | 14 |
| Table 3: Historical Exploration | | 19 |
| Table 4: Drillhole and Sample Summary | | 24 |
| Table 5: Bulk Density Measurements Conducted in 2007 | | 30 |
| Table 6: Classical Statistics for the TSFs | | 36 |
| Table 7: Variogram Parameters for TSF No. 6 and TSF No. 7 | | 37 |
| Table 8: Estimation Parameters for the 2020 Mineral Resource Estimation | | 38 |
| Table 9: Classification Criteria Applied | | 45 |
| Table 10: Mineral Resources for Blyvoor Gold Mine TSFs as at 29 February 2024 | | 46 |
| Table 11: Pay-Limit Calculation | | 48 |
| Table 12: Mineral Reserve Conversion Factors Applied | | 49 |
| Table 13: Mineral Reserves for Blyvoor TSF No. 6 and TSF No. 7 as at 29 February 2024 | | 49 |
| Table 14: Summary of Reagent Consumption | | 58 |
| Table 15: Gold Price Forecast (Nominal Terms) | | 65 |
| Table 16: Mining and Shared Infrastructure Capital Cost Estimation Summary | | 71 |
| Table 17: Plant Capital Summary | | 72 |
| Table 18: Other Capital | | 72 |
| Table 19: Capital Summary | | 73 |
| Table 20: Blyvoor TSF No. 6 and TSF No. 7 Contractor Mining Operating Cost | | 75 |
| Table 21: Summary of Operating Cost | | 76 |
| Table 22: Summary of Reagent Cost | | 76 |
| Table 23: Overhead and Selling Operating Costs Summary | | 77 |
| Table 24: Corporate Costs Summary | | 77 |
| Table 25: Project Cost Indicators | | 79 |
| Table 26: Cost Benchmarks to TSF Retreatment Operations | | 79 |
| Table 27: Macro-Economic Forecasts and Commodity Prices over the Life of Mine | | 83 |
| Table 28: Project Cost of Equity | | 84 |
| Table 29 Southern African Gold Mining Companies’ Beta Values | | 84 |
| Table 30: Production Breakdown in Life of Mine | | 85 |
| Table 31: Annual Cash Flow - Techno-economic Inputs (LoM) | | 87 |
| Table 32: Annual Real Cash Flow (LoM) | | 87 |
| Table 33: Project NPV Summary - Real Terms | | 88 |
| Table 34: Project Profitability Ratios | | 88 |
| Table 35: Grade Sensitivity - MI | | 90 |
| Table 36: Sensitivity Analysis of Commodity Prices and Exchange Rate to NPV11.4% (USDm) | | 91 |
| Table 37: Sensitivity Analysis of Cash Operating Costs and Non-Sustaining Capital Expenditure to NPV11.4% (USDm) | | 91 |
| Table 38: Blyvoor Mine Economic Analysis Summary - Real Terms | | 92 |
EQUATIONS
| Equation 1: Mining Tax Formula | | 89 |
| |
| RESOURCE | RESERVE | VALUE |
Blyvoor Gold Operations (Pty) Ltd
S-K 1300 Technical Report Summary on the Blyvoor Tailings Retreatment Project, South Africa | viii |
LIST OF UNITS AND ABBREVIATIONS
Units: The following units were used in this Report, and are in metric terms:-
| Unit | Definition |
| % | per cent |
| ° | degrees |
| °C | degrees Celsius |
| Ga | billion years |
| km | kilometre |
| kt | kilo-tonne |
| ktpm | Kilo-tonnes per month |
| M | meter |
| m3 | cubic meters |
| Ma | million years |
| mbs | metres below sea level |
| mm | millimetre |
| Mm3 | million cubic meters |
| Mt | million tonnes |
| t | tonne |
| t/m3 | tonnes per cubic meters |
| tpd | tonnes per day |
| kVA | Kilovolt-ampere |
| MVA | Megavolt-ampere |
| V | Volt |
| kV | Kilovolt |
| m³/day | Cubic meters per day |
| m³/month | Cubic meters per month |
| Ml/day | Megalitre per day |
Computation: It is noted that throughout the Report, tables may not compute due to rounding.
| |
| RESOURCE | RESERVE | VALUE |
Blyvoor Gold Operations (Pty) Ltd
S-K 1300 Technical Report Summary on the Blyvoor Tailings Retreatment Project, South Africa | ix |
Abbreviations: The following abbreviations were used in this Report:-
| Item | Description |
| AGA | AngloGold Ashanti Limited |
| AIC | All-in Costs |
| AISC | All-in Sustainable Costs |
| BEE | Black Economic Empowerment |
| BGMC | Blyvooruitzicht Gold Mining Company Limited (in provisional liquidation) |
| Blyvoor Capital | Blyvoor Gold Capital (Pty) Ltd |
| Blyvoor Ops or the Company | Blyvoor Gold Operations (Pty) Ltd |
| CAPEX | Capital Expenditure |
| CAPM | Capital Asset Pricing Model |
| CIL | Carbon-in-Leach |
| CN | Cyanide |
| CPR | Competent Persons’ Report |
| Cwb | Köppen and Geiger classification acronym for subtropical highland climate or temperate oceanic climate with dry winters |
| CWC | Covalent Water Company (Pty) Ltd |
| DCF | Discounted Cash Flow |
| DMRE | Department of Mineral Resources and Energy |
| DRD | DRDGold Ltd |
| EA | Environmental Authorisation |
| EBIT | Earnings before Interest and Taxes |
| EBITDA | Earnings before Interest, Tax, Depreciation and Amortization |
| EW | Electrowinning |
| FCFF | Free Cash Flow to the Firm |
| FY | Financial Year |
| Harmony | Harmony Gold Mining Company Limited |
| HCl | Hydrochloric Acid |
| HNO3 | Nitric Acid |
| IRR | Internal Rate of Return |
| LoM | Life of Mine |
| MCC | Motor Control Centre |
| Minxcon | Minxcon (Pty) Ltd |
| MPRDA | Minerals and Petroleum Resources Development Act, 2002 (Act No 28 of 2002) |
| MR143GP | Converted Mining Right GP 30/5/1/2/2/143 MR |
| NEMA | National Environmental Management Act, No. 107 of 1998 |
| No. | Number |
| NPV | Net Present Value |
| OHL | Overhead Line |
| OPEX | Operating Expenditure |
| PFS | Pre-feasibility Study |
| Project | Blyvoor Gold Tailings Retreatment Project |
| QAQC | Quality Assurance and Quality Control |
| SAMREC Code | South African Code for the Reporting of Exploration Results, Mineral Resources and Mineral Reserves (2016 Edition) |
| SIB | Stay in Business |
| S-K 1300 | United States Securities and Exchange Commission Part 229 Standard Instructions for Filing Forms Regulation S-K subpart 1300 |
| SLD | Single Line Diagram |
| SLP | Social and Labour Plan |
| SMBS | Sodium Metabisulphite |
| STC | Secondary Tax on Dividends |
| TRS | Technical Report Summary |
| TSF | Tailings Storage Facility |
| U/F | Underflow |
| USD | United States Dollar |
| VAT | Value Added Tax |
| Village Main Reef | Village Main Reef Limited |
| ZAR | South African Rand |
| ZAR/USD | South African Rand: United States Dollar |
| ZARm | Million South African Rand |
| |
| RESOURCE | RESERVE | VALUE |
Blyvoor Gold Operations (Pty) Ltd
S-K 1300 Technical Report Summary on the Blyvoor Tailings Retreatment Project, South Africa | 1 |
ITEM 1 - EXECUTIVE SUMMARY
The Blyvoor Gold Tailings Retreatment Project (“Project”) targets the re-treatment of the tailings storage facilities (“TSFs”) from the historical Blyvooruitzicht and Doornfontein mines that contain gold, with minor uranium and sulphide. The Project it situated 14 km southwest of the town of Carletonville and 80 km southwest of Johannesburg, Gauteng Province, South Africa.
The tailings material occurs on Blyvooruitzicht TSF No. 1 (or TSF No. 1), Blyvooruitzicht TSF No. 6 (or TSF No. 6), Blyvooruitzicht TSF No. 7 (“TSF No. 7”), Doornfontein TSF No. 1, Doornfontein TSF No. 2 and Doornfontein TSF No. 3. The Project specifically aims to remine TSF No. 6 and TSF No. 7 at a newly established plant, with the newly reprocessed tailings being deposited onto an extended TSF No. 7 footprint. At a later stage, the Doornfontein TSFs will be remined with reprocessed tailings deposited onto the then vacant TSF No. 6 footprint.
The Project Area represents a disturbed site that has hosted mining-related activities for decades. Dolomitic lithologies underlie the TSFs, thus triggering the requirement for barriers in the form of appropriate linings. No further sensitive areas are identified within, or related to, the site.
| I. | Permitting Requirements |
The TSFs are currently all under ownership of Blyvoor Gold Operations (Pty) Ltd (or Blyvoor Ops), which is a wholly owned subsidiary of Blyvoor Gold (Pty) Ltd. In the case of the TSFs, Blyvoor Ops is the legal title holder to the immovable property (usufruct, servitudes and old plant structures) as well as movable property (TSFs). An Environmental Authorisation was granted on 19 February 2020 for tailings reclamation for TSF No. 6 and TSF No. 7, deposition onto TSF No. 6 (thereafter onto the available footprint of the reclaimed TSF No. 7), and TSF care and maintenance activities for a 15-year life of mine (TSF No. 1, Doornfontein TSF 1, Doornfontein TSF No. 2 and Doornfontein TSF No. 3). In accordance with the granted Environmental Authorisation, TSF No. 6 and TSF No. 7 are sanctioned for remining activities (under listing notice GNR 921) and deposition onto these footprints. Whilst these TSFs are being mined first in the mining sequence, application can be made to include the remainder of the TSFs in the current Environmental Authorisation. A water use licence inclusive of TSF reclamation activities was granted 14 May 2024.
| II. | Geology and Mineral Deposit |
The Project Area lies within Witwatersrand Basin which is synonymous to numerous current and historical gold mining operations. The TSFs represent layered man-made deposits of treated tailings material derived from ore extracted at the historic Blyvooruitzicht and Doornfontein gold mines, at which the Carbon Leader and Middelvlei Reefs economic placer horizons were exploited. The gold content represents the residue gold which was not extracted in the initial processing of the primary ores.
| III. | Status of Exploration |
The surface operations have undergone various states of exploration and drilling on the Blyvoor TSFs No. 1, 6, 7 and Doornfontein TSFs No. 1, 2, 3 (2007, 2008, 2010, 2015, 2016). The most recent exploration programme concluding in November 2020 served to infill the existing drilling in TSFs No. 6 and 7 and enable the definition of Measured and Indicated Mineral Resources in both. No additional drilling was performed on the other TSFs.
| |
| RESOURCE | RESERVE | VALUE |
Blyvoor Gold Operations (Pty) Ltd
S-K 1300 Technical Report Summary on the Blyvoor Tailings Retreatment Project, South Africa | 2 |
| IV. | Mineral Resource and Mineral Reserve Estimates |
Mineral Resources were estimated for Blyvoor TSF No. 1, Doornfontein TSFs No. 1, 2 and 3 on existing data. An inverse distance to the power of 2 was utilised, and due to the limited data, lack of confidence in the QAQC and sampling procedures, an Inferred Mineral Resource was defined for all four of these facilities. Blyvoor TSFs No. 6 and 7 were re-estimated with updated information that included the infill drilling data. For TSF No. 6 previously only 13 drillholes were available and thus new drilling enables complete coverage of the TSF. TSF No. 7 had undergone detailed drilling in previous drilling programmes and the 2020 programme served to infill the drilling grid and increase the confidence in the existing database. Both TSFs were estimated with Ordinary Kriging.
The mine plan mines the total TSF No. 6 and TSF No. 7, including Inferred Mineral Resources attributed to TSF No. 6 and TSF No. 7 (totalling 16 koz). These are not reflected in the Mineral Reserves as they are considered to fall within the Inferred Mineral Resource category. These ounces are however, not reflected in the Mineral Resource table as they will be entirely mined out.
The in situ Mineral Resources declared for the TSFs are shown in the following table. TSF No.6 and TSF No. 7 have been shown as zero as there is no residual Mineral Resource excluding Mineral Reserves for these two TSFs.
Mineral Resources for Blyvoor Gold Mine TSFs as at 29 February 2024
| TSF | Mineral Resource
Classification | Tonnes | Grade | Au Content |
| Mt | g/t | kg | koz |
| TSF No. 6 and No. 7 | Measured and Indicated | 0.0 | 0.0 | 0.0 | 0.0 |
| TSF No. 1 | Inferred | 7.2 | 0.25 | 1,816 | 58 |
| Doornfontein TSF No. 1 | Inferred | 23.7 | 0.31 | 7,278 | 234 |
| Doornfontein TSF No. 2 | Inferred | 9.3 | 0.32 | 2,994 | 96 |
| Doornfontein TSF No. 3 | Inferred | 18.1 | 0.24 | 4,268 | 137 |
| Total Inferred | | 58.32 | 0.28 | 16,357 | 526 |
Notes:
| | 1. | No cut-off applied. |
| | 2. | No geological loss applied. |
| | 3. | Mineral Resources are 100% attributable to Blyvoor Ops. |
| | 4. | Mineral Resources are exclusive of Mineral Reserves. |
The Blyvoor TSF No. 6 and TSF No. 7 Mineral Reserves, as delivered to the plant, are detailed in the table below. The Mineral Reserve contains 816 koz of gold in the Probable Mineral Reserve classification, from the Measured and Indicated Mineral Resources, after having applied modifying factors for conversion from Mineral Resources to Mineral Reserves.
Mineral Reserves for Blyvoor TSF No. 6 and TSF No. 7 as at 29 February 2024
| TSF | Mineral Reserve
Classification | Tonnes | Grade | Au Content |
| kt | g/t | kg | koz |
| TSF No. 6 | Probable | 44,868 | 0.29 | 13,199 | 424 |
| TSF No. 7 | Probable | 39,408 | 0.31 | 12,187 | 392 |
| Total | Probable | 84,276 | 0.30 | 25,385 | 816 |
Notes:
| | 1. | Mineral Reserve cut-off of 0.14g/t was applied, but the entire TSF’s average will be more than the cut-off, therefore everything is mined. |
| | 2. | Mineral Reserves are 100% attributable to Blyvoor Ops. |
| V. | Development and Operations |
The mining method planned to be used for the reclamation of the TSF No. 6 and TSF No. 7 is hydraulic mining. The mining strategy involves a 12-month ramp up to 500 ktpm steady state-production. Mining will commence with targeting the high-grade areas located at upper portion of TSF No. 6 (Phase 1). Upon
| |
| RESOURCE | RESERVE | VALUE |
Blyvoor Gold Operations (Pty) Ltd
S-K 1300 Technical Report Summary on the Blyvoor Tailings Retreatment Project, South Africa | 3 |
completion of the first mining cut on TSF No. 6, mining will move to TSF No. 7 (Phase 2). The entire TSF No. 7 will be mined to create capacity for the new planned TSF. Lastly, the remainder of TSF No. 6 will be mined (Phase 3). A life of Project of 15 years is anticipated.
The process plant will accept reclaimed tailings from the hydro-mining operation and recover gold with a conventional carbon-in-leach cyanidation process. Leached gold will be adsorbed on activated carbon and stripped in an elution stage. The eluted gold will be plated and smelted into doré bars, sent to Rand Refinery for final smelting and then sold. Newly generated tailings will be deposited on a newly constructed TSF adjacent to the old plant and TSF No. 7. The new TSF footprint includes dolomite rock which was encountered at 3 m in one borehole and 60 m with another. This necessitated the development of a dolomite risk mitigation plan and further geotechnical studies to ensure a stable foundation for the new TSF.
Access to the Project Area is well established on an extensive paved road network surrounding the Project Area. The location of most of the Project’s infrastructure will be located on the old Blyvoor process plant site. This site has mostly been demolished with only derelict civil structures remaining and all infrastructure to support the Project will have to be re-established.
Grid power is available to the Project Area via a 22 kV overhead line running past the Project site and feeds from an Eskom consumer substation located 2.7 km east of the Project. Indications are that the power supply capacity on this line is 20 MVA. Power supply to the Project Area will have to be re-established by tying into the available line and feeding the Project intake and distribution substations. Power will be distributed to the various areas of consumption across the operation. A load estimate has been conducted based on the engineering design and equipment required for the Project. The Project notified maximum demand was estimated to be 8.4 MVA. Sufficient allocation is thus available for the Project.
It is intended that water supply to the Project will be sourced from the Blyvooruitzicht No. 4 Shaft. The Covalent Water Company (a subsidiary of Harmony) conducts dewatering of the old Blyvooruitzicht underground workings. This water is pumped to surface at a rate of 14,000 m³/day and released into a channel that flows into the Mooi River through the Wonderfonteinspruit. The Project will purchase water from the Covalent Water Company which will serve as make-up water for the Project and will augment the return water from the re-deposition of the re-treated tailings. A Project static water balance was conducted and it was estimated that during the dry season (April to September) a total of 14,000 m³/day of make-up water will be required for the Project and will be sufficient to service the hydraulic mining and processing facilities. Further sources of water include dirty surface run-off water collected. Capital provision has been made for the re-establishment of all supporting infrastructure to efficiently manage and operate the tailings retreatment Project.
The evaluator performed an independent mineral asset economic analysis on the Project and the diluted Indicated and Measured Mineral Resources in the LoM plan, for conversion to Mineral Reserves. The Discounted Cash Flow, or DCF, is based on the production schedule and all costs and capital associated to develop, mine and process the orebody. Relevant taxation and other operating factors, such as recoveries and stay-in-business costs were incorporated into the economic analysis to produce a cash flow over the life cycle of the Mine. The effective date of the economic analysis is 29 February 2024.
Both the ZAR/USD exchange rate and USD commodity prices are in real money terms. The table below illustrates the forecasts for the first three years as well as the long-term forecast used in the financial model. Both the price forecast and the short-term exchange rate forecast are taken as the median of various analyst and bank forecasts, with the long-term prices calculated in-house. The medium and long-term exchange rate forecast was calculated in-house using the inflation adjusted purchasing price parity of the
| |
| RESOURCE | RESERVE | VALUE |
Blyvoor Gold Operations (Pty) Ltd
S-K 1300 Technical Report Summary on the Blyvoor Tailings Retreatment Project, South Africa | 4 |
ZAR to USD. The long-term gold price was estimated as the real term average between the two gold price support levels over the past 10 years, i.e. USD1,900/oz. The inflation rate forecasts were sourced from the International Monetary Fund (“IMF”).
Macro-Economic Forecasts and Commodity Prices over the Life of Mine
| Basis | Item | Unit | 2024 | 2025 | 2026 | 2027 | 2028 | LT |
| Calendar Years (Real) | Gold Price | USD/oz | 2,086 | 2,040 | 1,900 | 1,900 | 1,900 | 1,900 |
| Financial Years (Real) | Gold Price | USD/oz | N/A | 2,078 | 2,016 | 1,900 | 1,900 | 1,900 |
| Calendar Years (Real) | Exchange Rate | ZAR/USD | 18.80 | 18.10 | 18.45 | 18.80 | 19.15 | 19.15 |
| Financial Years (Real) | Exchange Rate | ZAR/USD | N/A | 18.68 | 18.16 | 18.51 | 18.86 | 19.15 |
| Calendar Years | US Inflation | % | 2.8% | 2.4% | 2.2% | 2.1% | 2.1% | 2.1% |
| Financial Years | US Inflation | % | N/A | 2.8% | 2.4% | 2.2% | 2.1% | 2.1% |
| Calendar Years | SA Inflation | % | 4.8% | 4.5% | 4.5% | 4.5% | 4.5% | 4.5% |
| Financial Years | SA Inflation | % | N/A | 4.8% | 4.5% | 4.5% | 4.5% | 4.5% |
Source: Median of various Banks and Broker forecasts (Consensus, March 2024); Minxcon; IMF
Costs reported for the Project, which consists of hydro mining, plant and other operating costs are displayed in the following table. Other costs in the Adjusted Operating Costs category include the central and technical services, general and administration, human resources, and other services costs. Other costs for the AISC category include the corporate management costs. The costs are displayed per feed tonne as well as per recovered gold ounce. Costs are primarily based on the December 2020 PFS which have been escalated to current terms as at effective date of 29 February 2024 using appropriate escalation indices from the Steel and Engineering Industries Federation of Southern Africa (“SEIFSA”) Price and Index Pages (“PIPS”).
Project Cost Indicators
| Item | Unit | Blyvoor Tailings |
| Net Turnover | USD/Feed tonne | 9.80 |
| Mine Cost | USD/Feed tonne | 0.18 |
| Plant Costs | USD/Feed tonne | 4.23 |
| Other Costs | USD/Feed tonne | 0.33 |
| Royalties | USD/Feed tonne | 0.00 |
| Operating Costs | USD/Feed tonne | 4.74 |
| SIB | USD/Feed tonne | 0.11 |
| Reclamation | USD/Feed tonne | 0.09 |
| Other Costs | USD/Feed tonne | 0.14 |
| All-in Sustaining Costs (AISC) | USD/Feed tonne | 5.07 |
| Expansion Capital | USD/Feed tonne | 0.35 |
| Other Cash Costs | USD/Feed tonne | 0.00 |
| All-in Costs (AIC) | USD/Feed tonne | 5.42 |
| All-in Cost Margin | % | 34% |
| EBITDA* | USD/Feed tonne | 4.82 |
| EBITDA Margin | % | 49% |
| Gold Recovered | oz | 436,825 |
| Net Turnover | USD/Gold oz | 1,891 |
| Mine Cost | USD/Gold oz | 35 |
| Plant Costs | USD/Gold oz | 816 |
| Other Costs | USD/Gold oz | 64 |
| Royalties | USD/Gold oz | 0 |
| Operating Costs | USD/Gold oz | 915 |
| SIB Capex | USD/Gold oz | 20 |
| Reclamation | USD/Gold oz | 20 |
| Other Costs | USD/Gold oz | 26 |
| All-in Sustaining Costs (AISC) | USD/Gold oz | 982 |
| Expansion Capital | USD/Gold oz | 262 |
| Other Cash Costs | USD/Gold oz | 0 |
| All-in Costs (AIC) | USD/Gold oz | 1,244 |
| EBITDA* | USD/Gold oz | 926 |
Notes:
| | 1. | * EBITDA excludes capital expenditure. |
| | 2. | Costs Include Contingencies |
| |
| RESOURCE | RESERVE | VALUE |
Blyvoor Gold Operations (Pty) Ltd
S-K 1300 Technical Report Summary on the Blyvoor Tailings Retreatment Project, South Africa | 5 |
The Project cash flow is illustrated in the figure below. The total capital including the sustaining capital amounts to USD124 million over the mine life. The Mine has a peak funding requirement of USD91 million on a cumulative annual cash flow basis. The payback period of the Project is 3.0 years from start of production.
Undiscounted Cash Flow

The value derived for the income approach only reflects the diluted Indicated and Measured Mineral Resources in the LoM plan, for conversion to Mineral Reserves. The Mineral Reserve is economically viable with a best estimated NPV of USD56 million (USD56 million attributable to Blyvoor Ops) at a real discount rate of 11.4%. The IRR of the Project was calculated 27.0%. The Project has an all-in cost margin of 34% with a break-even gold price of USD1,244/oz. The following table shows a summary of the economic analysis.
Project Economic Analysis Summary - Real Terms
Item | Unit | Blyvoor Ops | Blyvoor Ops
Attributable |
| NPV @ 0% | USD million | 196 | 196 |
| NPV @ 2% | USD million | 159 | 159 |
| NPV @ 4% | USD million | 128 | 128 |
| NPV @ 5% | USD million | 115 | 115 |
| NPV @ 6% | USD million | 103 | 103 |
| NPV @ 8% | USD million | 83 | 83 |
| NPV @ 10% | USD million | 66 | 66 |
| NPV @ 11.4% | USD million | 56 | 56 |
| NPV @ 12% | USD million | 52 | 52 |
| NPV @ 14% | USD million | 196 | 196 |
| IRR | % | | 27% |
| All-in Cost Margin | % | | 34% |
| Peak Funding Requirement (Annualised) | USD million | | 91 |
| Payback | Years | | 3.0 |
| Break-even Gold Price | USD/oz. | | 1,244 |
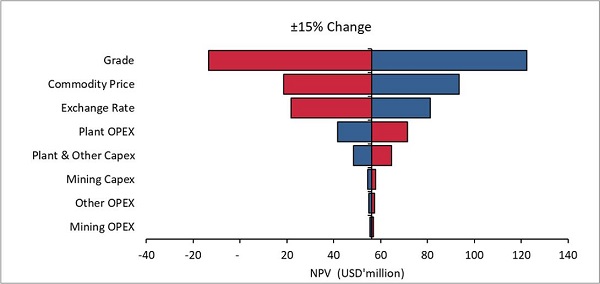
For the DCF, the grade, gold price and exchange rate have the most significant impact on the sensitivity of the Project followed by the mining operating costs as illustrated in the figure below. The Project is least sensitive to capital and plant and other operating costs.
| |
| RESOURCE | RESERVE | VALUE |
Blyvoor Gold Operations (Pty) Ltd
S-K 1300 Technical Report Summary on the Blyvoor Tailings Retreatment Project, South Africa | 6 |
Project Sensitivity (NPV11.4%)
Legal Aspects and Tenure
The reclamation of TSF No. 6 and TSF No. 7 is authorised through a granted EA, EMPr and WUL including TSF reclamation activities. The underlying geology across the area comprises amongst others dolomitic units, and appropriate linings are required over the footprint of newly established TSF sites.
Geology and Mineral Resources
TSFs No. 6 and 7 are sufficiently drilled to enable the classification of Measured and Indicated Mineral Resources. It is believed that the variability of the gold distribution is adequately represented by the information obtained from the drillholes. The greatest variability exists vertically, for this reason the block model was estimated at a very high resolution vertically to adequately capture the variability that is expected in a layered deposit such as a TSF. Some grade variability is evident in TSFs No. 6 and 7. Some of the older drilling has limited surface coverage and QAQC information, however the more recent infill drilling on TSF No. 6 and 7 with detailed QAQC and sampling detail serves to increase the confidence and confirm the grades achieved in these areas.
Blyvoor TSF No. 1 and Doornfontein TSFs No. 1, 2 and 3 are all stated as Inferred Mineral Resources, due to a limited number of drillholes in each of these TSFs. Upgrading these to Indicated Mineral Resources would require additional drilling to increase the confidence in the data.
The densities utilised in the estimation process are the historical density figures. These figures are in line with the average densities for Witwatersrand gold mine TSFs. Check density tests were conducted during the 2020 drilling campaign, but the results were inconclusive with TSF No. 6 and TSF No. 7 returning lower than expected densities with average dry densities of 1.34 t/m3 and 1.43 t/m3 respectively. It was therefore deemed prudent to use the historical densities of 1.53 t/m3 and 1.51 t/m3 respectively, which were deemed more in line with average TSF material densities.
Mining
The mining sequence is strategical, ensuring that the ramp up to steady state production, is in line with the planned processing plant capacity. A 12-month ramp up to steady state production of 500 ktpm is considered
| |
| RESOURCE | RESERVE | VALUE |
Blyvoor Gold Operations (Pty) Ltd
S-K 1300 Technical Report Summary on the Blyvoor Tailings Retreatment Project, South Africa | 7 |
practical and achievable. The mining sequence allows for the creation of sufficient capacity on the new planned TSF footprint.
The mine plan targets only Measured and Indicated Mineral Resources, with an anticipated LoM of 15 years. The Project has upside potential in the upgrading and inclusion of Inferred Mineral Resources in the LoM plan. An additional 510 koz of gold could potentially be included in the LoM plan by upgrading the Inferred Mineral Resources to Indicated and Measured Mineral Resources. The inclusion would add an additional ten years to the LoM.
Engineering and Infrastructure
Although the Project is located on historic operations most of the infrastructure required to support the Project has been decommissioned or reclaimed. Sufficient provision has been made with regards to mining and shared infrastructure to re-establish the Project Area and to enable the Project to be managed and operated efficiently.
Processing
Metallurgical testwork indicates recovery is a function of feed grade, and a residue grade of 0.14 g/t can be expected with a CIL process. Tailings can be treated at a rate of 500 ktpm, and the new TSF design can accommodate this rate of deposition. The new TSF will have enough capacity to store the entire volume of TSF No. 6 and TSF No. 7 during the initial 15-year life.
Economic Analysis
The Project plan including only the diluted Indicated and Measured Mineral Resources in the LoM plan, for conversion to Mineral Reserves is financially feasible. The updated Mineral Reserve can therefore be declared. The DCF value of USD56 million for the Project (USD56 million attributable to Blyvoor Ops) was calculated at a real discount rate of 11.4%. The Project has an IRR of 27.0% calculated based on a funding requirement of USD91 million.
The Project financials are most sensitive to grade, commodity prices, and exchange rate. The Project financials are least sensitive to mining capital expenditure and mining and other operating costs.
The all-in sustaining costs for the Project amounts to USD5.07/feed tonne over the LoM, which equates to USD982/oz. The all-in cost for the Project was calculated as USD5.42/feed tonne over the LoM, which equates to USD1,244/oz. The Project therefore has a break-even gold price of USD1,244/oz including capital with an all-in cost margin of 34% over the LoM, which is comparable to similar gold tailings retreatment operations in the Witwatersrand Basin.
Legal Aspects and Tenure
In light of no material risks for the current operations, it is recommended that consideration be given to their environmental audit report outcomes and ensure action plans are in place to deal with non-conformances that may affect the TSF project execution. The Project owners and operators must adhere to environmental and sustainability principles as set out in the MPRDA and NEMA.
Geology and Mineral Resources
Blyvoor TSF No. 1 and Doornfontein TSFs No. 1, 2 and 3 are all stated as Inferred Mineral Resources due to a limited number of drillholes in each of these TSFs. In addition, this older drilling information have limited
| |
| RESOURCE | RESERVE | VALUE |
Blyvoor Gold Operations (Pty) Ltd
S-K 1300 Technical Report Summary on the Blyvoor Tailings Retreatment Project, South Africa | 8 |
QAQC and sampling information and thus have a lower level of confidence. Additional infill drilling is recommended, to add additional Measured and Indicated tonnes that could be considered for extraction along with TSFs No. 6 and 7. This conversion to Measured and Indicated Mineral Resources, if the drilling is successful, would allow for additional conversion into Mineral Reserves for a further possible 8 years of Project life.
It is recommended that with further study work additional density testwork be done to confirm the historical density figures.
Mining
It is recommended that additional drilling is conducted to upgrade Inferred Mineral Resources to Indicated and Measured Mineral Resources for potential inclusion in the Mineral Reserve estimate. Drilling on the remaining TSFs may be conducted while producing from TSF No. 6 and TSF No. 7.
Engineering and Infrastructure
Although sufficient provision has been made for the required infrastructure to support the Project at the planned production rate it will be required to refine the detailed designs for the construction phase and to refine the associated capital and operating cost estimations. Communications should commence with CWC to negotiate the purchase of water, and the associated costs of doing so, from their dewatering at Blyvooruitzicht No. 4 Shaft.
Processing
Complete detailed design of the new TSF that incorporates a Dolomite Risk Mitigation Plan.
| |
| RESOURCE | RESERVE | VALUE |
Blyvoor Gold Operations (Pty) Ltd
S-K 1300 Technical Report Summary on the Blyvoor Tailings Retreatment Project, South Africa | 9 |
ITEM 2 - INTRODUCTION
Item 2 (a) - Issuer Receiving the Report; Authors
Minxcon (Pty) Ltd (“Minxcon”) was commissioned by Blyvoor Gold Operations (Pty) Ltd (“Blyvoor Ops” or “the Company”) to compile a Technical Report Summary (“TRS”) on the Blyvoor Gold Tailings Retreatment Project (“Project”), situated in Gauteng Province, South Africa.
The authors of this TRS are Uwe Engelmann and Daniel van Heerden, both of whom are Qualified Persons (“QP”). Mr. Engelmann was responsible for Sections 1-11 and jointly for Sections 20-25 of this TRS, while Mr. van Heerden was responsible for Sections 12-19 and jointly for Sections 20-25 of this TRS.
Item 2 (b) - Terms of Reference and Purpose of the Report
Minxcon was commissioned to prepare the TRS on the Mine in accordance with the United States Securities and Exchange Commission Part 229 Standard Instructions for Filing Forms Regulation S-K subpart 1300 (“S-K 1300”). This TRS follows the guidelines as prescribed by S-K 1300, and only such terms as defined in §229.1300-1305 have been utilised. The TRS is structured in accordance with the format prescribed in §229.601(b)(96).
The Project targets the retreatment of tailings storage facilities (“TSFs”) that contain gold, with minor uranium and sulphide. The purpose of this TRS is to present the Mineral Resources and Mineral Reserves of the Project as at the Company financial year end 29 February 2024. The Mineral Resources and Mineral Reserves are stated at the effective date of 29 February 2024.
The basis for the Mineral Reserves stated in this TRS is a pre-feasibility study (“PFS”). The PFS was completed in 2020, with monetary values escalated to current terms as at 29 February 2024. The PFS is still deemed valid.
No TRS has previously been filed by Blyvoor Ops for the Project in terms of S-K 1300.
All monetary figures in this TRS are expressed in United States Dollars (“USD”).
Item 2 (c) - Sources of Information and Data Contained in the Report
Minxcon has relied on the following reports/opinions:-
| ● | Leyden (2020) for the legal and tenure standing and requirements relating to the Project; and |
| ● | Geotheta Geotechnical Consultants report titled: “Geotechnical Study for Proposed New TSF” for geotechnical detail and design work. |
Minxcon has verified the information as far as possible. Additional information was sourced from those references listed in 0 and are duly referenced in the text where appropriate.
Item 2 (d) - Qualified Persons’ Personal Inspection of the Property
The Qualified Persons (“QP”, as such term is defined in S-K 1300) for this TRS are Mr. U. Engelmann and Mr. D. van Heerden.
Mr. Engelmann conducted a site visit on 1 July 2020 accompanied by representative of Blyvoor Ops team. The site visit was aimed at conducting a physical assessment and inspection of the Project Area, assisting with setting up an exploration drilling programme, and providing guidance on the sampling for the purposes of conducting assay testwork and metallurgical testwork. During the site visit TSF No. 6, TSF No. 7, the old Blyvoor processing facility and the proposed new TSF location were inspected. On 21 September 2020 a team from Minxcon reinvestigated the site and assessed infrastructure provision. Mr van Heerden conducted
| |
| RESOURCE | RESERVE | VALUE |
Blyvoor Gold Operations (Pty) Ltd
S-K 1300 Technical Report Summary on the Blyvoor Tailings Retreatment Project, South Africa | 10 |
a site visit on 15 January 2021 and was accompanied by the Blyvoor Op’s Mineral Resources Manager. TSF No. 6 and TSF No. 7 and the proposed process plant location were visited. No more recent site visits have taken place.
| |
| RESOURCE | RESERVE | VALUE |
Blyvoor Gold Operations (Pty) Ltd
S-K 1300 Technical Report Summary on the Blyvoor Tailings Retreatment Project, South Africa | 11 |
ITEM 3 - PROPERTY DESCRIPTION AND LOCATION
The Project comprises the following TSFs that were created during the operation of the underground Blyvooruitzicht and Doornfontein gold mines that targeted the Middelvlei Reef and Carbon Leader Reef in the Far West Rand Goldfield. The TSFs contain gold, with minor uranium and sulphide:-
| ● | Blyvooruitzicht TSF No. 1 (“TSF No. 1”); |
| ● | Blyvooruitzicht TSF No. 6 (“TSF No. 6”); |
| ● | Blyvooruitzicht TSF No. 7 (“TSF No. 7”); |
| ● | Doornfontein TSF No. 2; and |
The Project aims to remine TSF No. 6 and TSF No. 7 at a newly established plant, with newly reprocessed tailings being deposited onto an extended TSF No. 7 footprint. At a later stage, the Doornfontein TSFs will be remined with reprocessed tailings deposited onto the vacant TSF No. 6 footprint. The adjacent Blyvoor underground gold mine are depositing tailings onto TSF No. 6 since late 2019. This was not considered in the evaluation of the Mineral Resources and Mineral Reserves of the TSF.
The Project will require the construction of a new TSF (as an eastern extension to the current TSF no. 7 area) that will be utilised for the deposition of tailings material subsequent to the processing of the reclaimed tailings.
Item 3 (a) - Location of the Property
The town of Carletonville lies immediately north of TSF No. 1, in the southwestern extremity of the Gauteng Province, South Africa. The town of Fochville lies 14 km due southeast. To the northeast, Johannesburg can be accessed over a road network of 80 km.
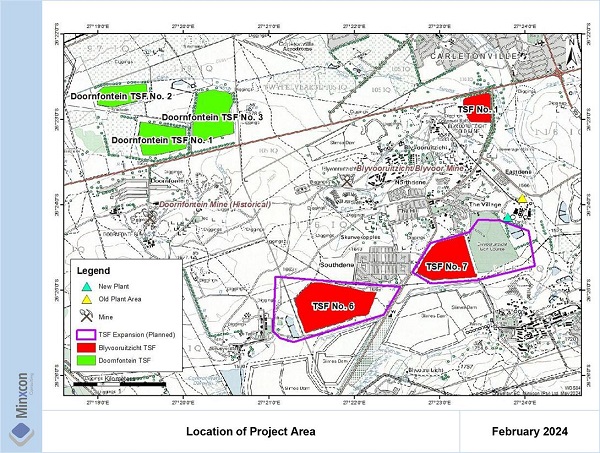
The TSFs, illustrated in Figure 1, are centred on the co-ordinates (WGS84 system) displayed in Table 1.
Table 1: Co-ordinate Locations and Surface Areas Covered by Each TSF
| TSF | Centre Co-ordinates (WGS84) | Footprint | Property |
| Latitude | Longitude | km2 |
| TSF No. 1 | 26°22’53.96”S | 27°23’28.28”E | 0.29 | RE of Portion 15 and Portion 26, Blyvooruitzicht 116 IQ |
| TSF No. 6 | 26°25’12.83”S | 27°21’38.97”E | 1.14 | RE of Portion 1, Blyvooruitzicht 116 IQ |
| TSF No. 7 | 26°24’41.22”S | 27°23’04.26”E | 0.75 | RE of Portion 70 and Portion 66, Blyvooruitzicht 116 IQ |
| Doornfontein TSF No. 1 | 26°23’15.58”S | 27°19’39.80”E | 0.53 | Portion 26, Varkenslaagte 119 IQ |
| Doornfontein TSF No. 2 | 26°22’43.43”S | 27°19’12.91”E | 0.38 | Portion 27, Varkenslaagte 119 IQ |
| Doornfontein TSF No. 3 | 26°22’58.76”S | 27°20’19.39”E | 0.74 | Portion 28, Varkenslaagte 119 IQ |
Item 3 (b) - Area of the Property
The TSFs are located on the farms Blyvooruitzicht 116 IQ and Varkenslaagte 119 IQ. The TSF surface areas and the farms on which they are located are depicted in Table 1.
The extension of TSF No. 7 will cover an additional area of some 2.2 km2 and the new plant area is planned over a footprint area of some 0.3 km2, situated immediately northeast of the extension. These areas are further described in Item 15.
| |
| RESOURCE | RESERVE | VALUE |
Blyvoor Gold Operations (Pty) Ltd
S-K 1300 Technical Report Summary on the Blyvoor Tailings Retreatment Project, South Africa | 12 |
Figure 1: Location of Project Area
Item 3 (c) - Mineral Deposit Tenure
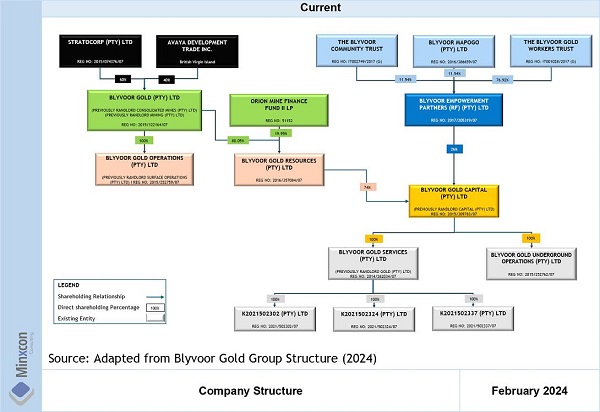
The TSFs are currently all under ownership of Blyvoor Ops, which is currently a wholly owned subsidiary of Blyvoor Gold (Pty) Ltd. Blyvoor Ops is the legal title holder to the immovable property. The current and post-transaction company structure is illustrated in Figure 2.
| |
| RESOURCE | RESERVE | VALUE |
Blyvoor Gold Operations (Pty) Ltd
S-K 1300 Technical Report Summary on the Blyvoor Tailings Retreatment Project, South Africa | 13 |
Figure 2: Company Structure
Mining rights in South Africa are issued by the Department of Mineral Resources and Energy (“DMRE”) in accordance with the Mineral and Petroleum Resources Development Act, No 28 of 2002 (“MPRDA”). However, as described by Leyden (2020), “Historic Dumps are not regulated under the MPRDA and, as a consequence, mining rights under the MPRDA cannot be granted over such dumps. The Blyvoor Mining Right therefore does not give Blyvoor Gold Capital the right to mine the TSFs save for that portion of TSF No. 6 which constitutes a New Dump [which constitutes a residue stockpile]. The right to mine Historic Dumps is derived from the common law ownership of such dumps.”
The regulatory framework regarding TSF reclamation is governed by the dates on which the TSF was created, and the final tailings deposited thereon. All the Project TSFs were initially established in the period 1948-1969 and prior to the enactment of the MPRDA, i.e. prior to 2004. Deposition onto all TSFs, with the exception of TSF No. 6, ceased in the 1980s to 1990s.
Rights to reclaim the TSF material requires an Environmental Authorisation (“EA”) in terms of the National Environmental Management Act, No. 107 of 1998 (“NEMA”). An application for an EA relating to mining right number MR143GP was submitted on 13 February 2019 by Blyvoor Gold Capital (Pty) Ltd (“Blyvoor Capital”), a subsidiary of Blyvoor Gold (Pty) Ltd. Mining Right MR143GP covers the underground Blyvoor Mine (the historical Blyvooruitzicht Mine) upon which lease area the Blyvoor TSFs are located. Application was included in this application for the tailings mining operations, which includes the TSFs and associated infrastructure, under Blyvoor Ops. The EA was granted on 19 February 2020 under reference number GP 30/5/1/2/3/2/1 (143) EM with an approved environmental management programme (“EMP”), dated February 2019 compiled by Digby Wells that serves as an update and realignment from the previously approved EMP, dated 2000, with subsequent unapproved 2007 and 2012 amendments to refocus on current activities. Under the EA, the following TSF-related activities have been approved:-
| |
| RESOURCE | RESERVE | VALUE |
Blyvoor Gold Operations (Pty) Ltd
S-K 1300 Technical Report Summary on the Blyvoor Tailings Retreatment Project, South Africa | 14 |
| ● | TSF reclamation (TSF No. 6 and TSF No. 7); |
| ● | Deposition onto TSF No. 6 (thereafter onto the available footprint of the reclaimed TSF No. 7); and |
| ● | TSF care and maintenance activities for a 15-year life of mine (“LoM”; TSF No. 1, Doornfontein TSF 1, Doornfontein TSF No. 2 and Doornfontein TSF No. 3 will be held in care and maintenance for the 15-year LoM). |
In accordance with the granted EA, TSF No. 6 and TSF No. 7 are sanctioned for remining activities (under listing notice GNR 921) and deposition onto these footprints. Whilst these TSFs are being mined first in the mining sequence, application can be made to include the remainder of the TSFs in the current EA. Application is also required to alter or extend the footprint of TSF No. 7.
The approved EA allows for care and maintenance of TSF No. 1, Doornfontein TSF 1, Doornfontein TSF No. 2 and Doornfontein TSF No. 3. Application for amendment to include reclamation (mining) of these TSFs is required to be submitted and approved prior to remining of these TSFs. Blyvoor Ops will make such application whilst mining at TSF No. 6 and TSF No. 7 is taking place. These applications are considered an administrative procedure in the normal course of business.
Leyden (2020), describes that the properties on which the TSFs are situated are owned by a third party, Blyvooruitzicht Gold Mining Company Limited (in provisional liquidation) (“BGMC”). Blyvoor Ops has registered usufructs as listed in Table 2. The usufructs have a validity period of 99 years. Blyvoor Ops has further servitudes registered, including services and roads to the former BGMC treatment plant, and services from TSF No. 1 to main road at the Doornfontein TSFs.
Table 2: Registered Usufructs to Blyvoor Ops
| Usufruct over | Farm | Portion | Comment |
| Doornfontein TSF No. 1 | Varkenslaagte 119 IQ | 26 | Registered to Blyvoor Ops |
| Doornfontein TSF No. 2 | Varkenslaagte 119 IQ | 27 |
| Doornfontein TSF No. 3 | Varkenslaagte 119 IQ | 28 |
| Blyvoor TSF No. 1 | Blyvooruitzicht 116 IQ | Re Portion 15, 26 |
| Blyvoor TSF No. 7 | Blyvooruitzicht 116 IQ | Re Portion 70 and 66 |
| Blyvoor TSF No. 7 Golf Course | Blyvooruitzicht 116 IQ | Portion 66 |
Blyvoor TSF No. 6 | Blyvooruitzicht 116 IQ | | Registered to Blyvoor Capital |
The QPs have not identified any threat to the current EA with continued annual obligations to tenement security and conformance to government notices and directives. Blyvoor Ops will initially rely on the existing Blyvoor Capital rights and permits with respect to the Mining Right, the EA and water use licence under a duly signed agreement for this purpose.
Item 3 (d) - Royalties and Payments
The current Mineral and Petroleum Resources Royalty Act came into effect on 1 March 2010. The law requires all companies extracting minerals in South Africa to pay royalties at a rate of between 0.5% and 7% based on gross sales. Companies are taxed on either the refined or unrefined formula:-
| ● | Refined mineral formula = 0.5 + [EBIT/Gross sales x 12.5] x 100 |
| ● | Unrefined mineral formula = 0.5 + [EBIT/Gross sales x 9] x 100 |
Historic TSFs are not regulated by the MPRDA, which means that royalty payments are not applicable. With the exception of a portion of TSF No. 6, all the remaining TSFs are historic TSFs. No practical split could be made for TSF No. 6 between historic deposition and recent deposition. The QPs therefore treated all TSFs as historic.
| |
| RESOURCE | RESERVE | VALUE |
Blyvoor Gold Operations (Pty) Ltd
S-K 1300 Technical Report Summary on the Blyvoor Tailings Retreatment Project, South Africa | 15 |
Item 3 (e) - Environmental Liabilities
In terms of Regulation 54(2) of the MPRDA, financial provision is required for the interim and final rehabilitation activities on the site. The provision is required to be reviewed annually for adequacy and amended to compensate for new activities and/or inflation.
Blyvoor Capital has made provision for the rehabilitation liability estimated in January 2019 which include both surface and underground mining assets, the TSFs as well as historic defunct assets totalling ZAR366 million. Digby Wells updated this estimation to ZAR464 million in 2023, which has been escalated by one year to ZAR492 million by Minxcon for financial modelling purposes. Blyvoor Ops will need to reimburse Blyvoor Capital for their share of guarantees funded as they relate to the TSFs, as well as fund their share of liabilities. The QPs apportioned a payment schedule provided by Blyvoor Capital to Blyvoor Ops for the economic analysis. Blyvoor Ops’ share of the liabilities is estimated to be ZAR319 million which will be funded through guarantees.
There are currently no mechanisms in place regarding unplanned closure, however provision for unplanned closure is factored into the rehabilitation liability.
Item 3 (f) - Permits to Conduct Work
Further permits or plans relating to the planned operations are described in the sections to follow that are required to be in place by the EA ((DMR Ref No. GP30/5/1/2/3/2/1 (143) EM) noted in condition 1, 2, 11, and 19.
A water use licence (“WUL”) no. 10/C23E/GJACEFGI/14399 in terms of the National Water Act, No. 36 of 1998 (“NWA”) was issued to Blyvoor Capital for the Mine on 14 May 2024 and is valid until 14 May 2044. This supersedes the previously issued WUL no. 08/C23E/AEFGJ/1000 issued 19 July 2011 and valid until 19 July 2021. The objective of the new WUL was to be as close as possible to the previous licence with regards to operations, extraction, and deposition. Although some of the infrastructure may not be applicable to the TRS project, wastewater treatment plants for the Blyvoor Village was removed from the new application as they are not owned by Blyvoor Gold. Also removed from the application were Blyvoor TSF No. 1, emergency return water dam and PS Shaft Rock Dump.
| II. | Additional Environmental Permits |
Blvoor Capital has a valid provisional Atmospheric Emissions Licence (“PAEL”), reference number (PAEL/GP/WR-BGC/04/09/2023-6545-VAR) issued 10 November 2023 in terms of the National Environmental Management: Air Quality Act, No. 39 of 2004 (“NEMAQA”) issued by Department of Environment, Forestry and Fisheries for the entire mining right area. This PAEL will allow for 12 months of monitoring from the date of commissioning of the listed activities, during which time emission measurements are required to be made and submitted to the authorities. Subject to these measurements being within legal limits and meeting all PAEL conditions for six consecutive months, an Atmospheric Emissions Licence (“AEL”) valid for five years will be issued. The TSF project need not apply for a separate AEL but should engage with DFFE to establish if the re-treatment of tailings will trigger an additional listed activity other than Subcategory 4:17 noted and if so, a subsequent variation of the PAEL undertaken.
A valid Certificate of Registration (“COR”) issued 15 January 2024 to Blyvoor Capital National Nuclear Regulator (“NNR”) in terms of the National Nuclear Regulatory Act, 1999, relating to the tailings project is in place and applicant should ensure adherence to the conditions of authorisation of Part 1 and specified NNR requirements in Part 2.
| |
| RESOURCE | RESERVE | VALUE |
Blyvoor Gold Operations (Pty) Ltd
S-K 1300 Technical Report Summary on the Blyvoor Tailings Retreatment Project, South Africa | 16 |
As noted by Leyden (2020), “Under the Tailings Operational Agreement Blyvoor Capital has agreed to support Blyvoor Operations to ceed or obtain its own permits, approvals and licenses”. This includes permits, approvals and licenses such as a WUL, an AEL and a NNR COR.
The QPs are not aware of any further permits in addition to those described above, which are required for the operations.
Blvoor Capital to develop an auditable maintenance plan to ensure that all critical environmental equipment is maintained as required and a discussion on the implementation and compliance with the maintenance plan be included in the annual audit reports.
Additionally, an alien management programme to control alien invasive plant species and must entail the identification of areas where such infestation occurs and the extent.
Item 3 (g) - Other Significant Factors and Risks
From the evidence available, it is the opinion of the QPs that mining at TSF No. 6 and TSF No. 7 can commence as a valid EA and WUL is in place. It is noted that as the Project currently stands, Blyvoor Ops will not hold all the authorisations it requires to independently conduct the Project. Notwithstanding, Blyvoor Ops can still be held liable for arising environmental impacts. Condition No. 4.8 of the EA (DMR Ref No. GP30/5/1/2/3/2/1 (143) EM) states, “Non-compliance with any condition of this EA or EMPr may result in the issuing of a directive in terms of section 28 and or a compliance notice in terms of section 31L of the NEMA.” Regulation 34 of the Environmental Impact Assessment (“EIA”) Regulations (GNR 982 of 4 December 2014 as amended) provides as follows “Auditing of compliance with environmental authorisation, environmental management programme and closure plan.” The Blyvoor Capital Environmental Audit Report (unpublished draft report, dated 17 May 2024) by Shangoni Management Services (Pty) Ltd) noted that Blyvoor Capital demonstrated a low level of compliance against the management commitments and should ensure adequate implementation of mitigation measures in compliance with EMP and the EA granted for its activities.
As noted previously, Blyvoor Ops will initially rely on the existing Blyvoor Capital rights and permits with respect to the Mining Right, the EA and water use licence under a duly signed agreement for this purpose.
The QPs are not aware of any past material violations or fines. There is reasonable basis to believe that all governmental requirements for the Project have been obtained or can be obtained. The Project owners and operators must adhere to environmental and sustainability principles as set out in the MPRDA.
The QPs are not aware of any further factors or risks that may affect access, title or right or the ability to perform work on the property.
| |
| RESOURCE | RESERVE | VALUE |
Blyvoor Gold Operations (Pty) Ltd
S-K 1300 Technical Report Summary on the Blyvoor Tailings Retreatment Project, South Africa | 17 |
ITEM 4 - ACCESSIBILITY, CLIMATE, LOCAL RESOURCES, INFRASTRUCTURE AND PHYSIOGRAPHY
Item 4 (a) - Topography, Elevation and Vegetation
The surface topography of the mining lease area is characterised by undulating hills and forms part of the northern slopes of the Gatsrand Ridge. Elevations vary from some 1,400 m to 1,680 m above mean sea level. One distinct watercourse carries seasonal rainwater from the higher catchment areas across the eastern side of the property to the Wonderfonteinspruit.
The mine area is located in the Gauteng Shale Mountain Bushveld and Carletonville Dolomite Grassland vegetation types (Mucina & Rutherford (2006) as noted in the EMP Update for Tailings Reclamation & Underground Mining at Blyvooruitzicht Gold, dated February 2017 by Golder Associates. The vegetation is characterised by short (3–6 m), semi-open thicket, dominated by a variety of woody species. The understory is dominated by a variety of grasses. Some of the ridges form plateaus that support scrubby grassland. Carletonville Dolomite Grassland occurs on undulating plains dissected by rocky chert ridges. The grassland is sour in nature due to severely frosty winters, combined with regular burning. Trees and shrubs typically occur on rocky outcrops and protected areas. Typical grassland is restricted to the exposed sites in the irregular, undulating landscape. This veld type is not suited for crop production due to the shallow and rocky nature of the soils. Grazing of livestock is limited due to the dominance of sour grass species, which results in a low nutrient status of the fodder during winter.
This area is typical of the transitional-type grassland between the high inland plateau and the bushveld of the lower inland plateau, with the resultant low incidence of tree species. The vegetation type in question is considered vulnerable and has a conservation target of 24%. However, only a small portion of it is protected, and 23% is being transformed, primarily through cultivation (17%), urbanization (4%), forestry (1%), and mining (1%). The 2000 EMP in 2000 identified 16 types of trees, shrubs, and grass at the Blyvooruitzicht section, 22 types of grass at the Doornfontein section, and 33 tree, shrub, and flowering plant species at the Doornfontein section inclusive of exotic and invasive species on mine property.
Item 4 (b) - Access to the Property
The Project Area is directly accessible via the R501 main tarred road that connects Carletonville and Potchefstroom. The R501 regional road leading from the N12 national road past the town of Carletonville and in a western direction on to Potchefstroom. From the R501, the Mine is accessed via a direct tarred road onto the lease area that branches off the R501. This road is in a relatively good state of repair and no work or design will be required on this road. Numerous all-weather gravel roads provide access to the various TSFs and Project sites.
Oberholzer is the closest railway station, located approximately 12 km northeast of the Project Area and just north of Carletonville, and is situated on the Johannesburg-Klerksdorp railway line. The O.R. Tambo and Lanseria International Airports in the Johannesburg area support high volumes of daily domestic and international flights. The Carletonville Aerodrome is located some 5 km north of the Project Area.
Item 4 (c) - Climate and Length of Operating Season
The climate in Carletonville is warm and temperate and classified as Cwb by Köppen and Geiger (climate-data.org). Cwb is characterised by a subtropical highland climate or temperate oceanic climate with dry winters, where the ‘C’ refers to mild temperature, the ‘w’ refers to dry winter and the ‘b’ refers to warm summers. Temperatures are warm to mild with an average annual temperature of 15.9°C in Carletonville (climate-data.org). The dominant wind direction in the vicinity of the Project Area is northwest to
| |
| RESOURCE | RESERVE | VALUE |
Blyvoor Gold Operations (Pty) Ltd
S-K 1300 Technical Report Summary on the Blyvoor Tailings Retreatment Project, South Africa | 18 |
northeast. There are no major climatic conditions that will hinder mining activities. Operations can continue year-round.
The Project Area is located in the Highveld climatic zone, which receives average annual precipitation of about 900 mm on its eastern border to about 650 mm in the west. Rainfall occurs mainly in the summer months from October to March in the form of showers and thundershowers. Maximum rainfall occurs in January, and winters are typically dry. The average annual rainfall at Carletonville is 660 mm (climate-data.org). Several distinct watercourses carry seasonal rainwater from the higher catchment areas across the property to the Wonderfonteinspruit (Golder Associates, 2016).
Item 4 (d) - Infrastructure
The local Carletonville region is a well-established mining area. Skilled and semi-skilled labour are readily available, along with all service requirements. The nearby towns of Carletonville and Fochville provide a full range of urban amenities, including medical and educational facilities, financial, retail, and commercial services. Telephone and mobile phone services are reliable, as are the high-speed internet facilities.
Power supply in the general area is well-established. Historically the Blyvoor process plant was supplied by a single 22 kV overhead line (“OHL”) that is fed from an Eskom consumer substation located 2.7 km east of the project area. 3 x 22 kV OHL’s fed from this line and supplied power to the Blyvoor process plant intake substation The line feeding from the Eskom consumer substation is still in place and only a short new OHL needs to be established from this line to the new project intake substation. The historical Blyvoor process facility was significantly larger than the new tailings retreatment plant with a much larger power supply requirement. Supply to the tailings retreatment project will thus be more than sufficient. The reliability of the power supply from Eskom throughout the country is however questionable with rolling blackouts (load shedding) occurring regularly due to the utility’s constraints in generating capacity.
Potable water can be sourced from the Rand Water Board Utility through the Merafong Municipality supply infrastructure which is available on the property. Potable water will be supplied from the project main service water supply. The water will be treated through a potable water treatment plant.
Water in underground workings in the West Rand, and particularly the Carletonville area, is well reported. The Covalent Water Company (Pty) Ltd (“CWC”), pump water to surface from the existing Blyvooruitzicht No. 4 Shaft and Blyvooruitzicht No. 6 Shaft. CWC have been granted servitudes at Blyvooruitzicht No. 4 Shaft and Blyvooruitzicht No. 6 Shaft for access to the existing pumping infrastructure. CWC currently has no use for the water pumped from the underground workings and releases the water into a channel that in turn flows into the Mooi River. The water quality is such that it does not require to be treated prior to releasing it into the river. The water capacity available as well as the quality of the water is ideal for the Project and it is thus planned that the tailings retreatment operation will purchase water from CWC that has been dewatered from Blyvooruitzicht No. 4 shaft (in closest proximity to the project – 2.4 km northwest).
In the unlikely event of a shortfall of water, make-up water can be purchased from Rand Water.
| |
| RESOURCE | RESERVE | VALUE |
Blyvoor Gold Operations (Pty) Ltd
S-K 1300 Technical Report Summary on the Blyvoor Tailings Retreatment Project, South Africa | 19 |
ITEM 5 - HISTORY
Item 5 (a) - Prior Ownership and Ownership Changes
The farm Blyvooruitzicht was initially farmed by one Pieter Daniel Roux. Following successful exploration over the property in the early 1930s, Rand Mines showed interest in the new potential goldfield and acquired ground on the farm Blyvooruitzicht No. 640. This ground belonged to a deceased estate administered by Standard Bank. BGMC was registered on 10 June 1937. At that time, what is currently the MR143GP lease area was divided into Blyvooruitzicht Gold Mine in the east owned by Rand Mines and Doornfontein Gold Mine in the west, owned by Goldfields South Africa.
In June of 1971, Barlow Rand Ltd purchased Rand Mines. In 1995, Blyvooruitzicht Gold Mine and Doornfontein Gold Mine merged to form the greater Blyvooruitzicht Gold Mine under Rand Mines. In 1997, DRDGold Ltd (“DRD”) purchased the greater Blyvooruitzicht Gold Mine from Rand Mines. In November 2011, DRD sold its shareholding in BGMC to Village Main Reef.
Village Main Reef was placed into business rescue in 2013 and most of their assets were placed into liquidation. BGMC was placed under provisional liquidation in August 2013. In 2014-2016, Blyvoor Capital and Blyvoor Ops purchased assets from the liquidators of BGMC. Resulting from the liquidation, AngloGold Ashanti Limited (“AGA”) (now under Harmony) purchased Blyvooruitzicht No. 4 Shaft and Blyvooruitzicht No. 6 Shaft and took over water pumping activities through these shafts through their subsidiary CWC. This action was necessary to protect their down dip mines, being Savuka, Tau Tona and Mponeng.
In 2015, Blyvoor Ops purchased all TSFs excluding TSF No. 4 and No. 5 footprints – (these TSF’s tailings were previously reprocessed).
Item 5 (b) - Historical Exploration and Development
Mining commenced at Blyvoor Mine in the 1930s and continued until the mine went into liquidation in 2013. Table 3 presents the historical/previous (pre-2020) exploration across the TSFs. Also, in 2015 Blyvoor Capital purchased the Blyvooruitzicht processing plant. This facility was later transferred to Blyvoor Ops.
Table 3: Historical Exploration
| Year | TSF | Total Number of Drillholes | Total Meterage | Company |
| m |
| 2007 | TSF No. 1 | 5 | 99.00 | DRD Gold |
| TSF No. 6 | 13 | 402.00 | DRD Gold |
| TSF No. 7 | 6 | 265.00 | DRD Gold |
| Doornfontein TSF No. 1 | 5 | 168.00 | DRD Gold |
| Doornfontein TSF No. 2 | 5 | 88.50 | DRD Gold |
| Doornfontein TSF No. 3 | 5 | 93.00 | DRD Gold |
| 2008 | TSF No. 7 | 12 | 432.00 | DRD Gold |
| 2010 | TSF No. 7 | 20 | 793.00 | DRD Gold |
| 2015 | TSF No. 7 | 14 | 578.00 | Blyvoor Gold |
| 2016 | TSF No. 7 | 7 | 289.00 | Blyvoor Gold |
For the period 1942 to mine closure in 2013, 38.1 Moz of gold was recovered from Blyvooruitzicht Gold Mine. An additional 0.2 Moz was recovered from Blyvoor Mine from end 2019 to 2023. An additional 19.5 Moz was recovered from Doornfontein Gold Mine before the merger with BGMC.
| |
| RESOURCE | RESERVE | VALUE |
Blyvoor Gold Operations (Pty) Ltd
S-K 1300 Technical Report Summary on the Blyvoor Tailings Retreatment Project, South Africa | 20 |
ITEM 6 - GEOLOGICAL SETTING, MINERALISATION AND DEPOSIT
Item 6 (a) - Regional Geology
The Project Area lies within the late Archaean (2.7-2.8 Ga) Witwatersrand Basin. This basin comprises up to 7,000 m thick interbedded sequence of argillaceous and arenaceous sedimentary rocks mainly dipping at shallow angles towards the centre of the basin and extend laterally for some 350 km northeast-southwest and 120 km northwest-southeast on the Kaapvaal Craton. The upper portion of the basin-fill (Central Rand Group), which contains the sedimentary reefs or mineralised zones, outcrops at its northern extent near Johannesburg. Further west, south and east the basin is overlain by a combination of up to 4,000 m of younger Archaean, Proterozoic and Mesozoic volcanic and sedimentary rocks.
Economically important, gold-bearing conglomeratic zones generally occur on regional unconformities. These are commonly referred to as “reefs” or placers. The reefs occur in goldfields that are geographically separated. These are namely the Welkom, Klerksdorp, Carletonville, West Rand, Central Rand, East Rand, South Rand, and Evander Goldfields. Locally, the Project falls within the Carletonville Goldfield, or Far West Wits Line, that, in addition to gold, produced uranium and pyrite (for sulphuric acid production) as by-products.
Item 6 (b) - Local and Property Geology
The TSFs represent man-made deposits of treated tailings material derived from ore extracted at the historical Blyvooruitzicht and Doornfontein gold mines. The gold content represents the residue gold which was not extracted in the initial processing of the primary ores.
At Blyvoor, two economic placer horizons were exploited. These are namely the Carbon Leader and Middelvlei Reefs and occur in quartzites of the Main Reef Conglomerate Formation of the Johannesburg Subgroup of the Central Rand Group. The Carbon Leader is a high grade, carbon-rich reef and is the principle economic horizon at Blyvoor. The Middelvlei Reef is the second economic horizon at Blyvoor and lies stratigraphically 50 m to 75 m above the Carbon Leader. The Middelvlei Reef is characterised by lower grades than the Carbon Leader.
Cross sections of the TSFs No. 1, 6 and 7 are illustrated inFigure 3.
| |
| RESOURCE | RESERVE | VALUE |
Blyvoor Gold Operations (Pty) Ltd
S-K 1300 Technical Report Summary on the Blyvoor Tailings Retreatment Project, South Africa | 21 |
Figure 3: TSF No. 1, 6 and 7 Sections
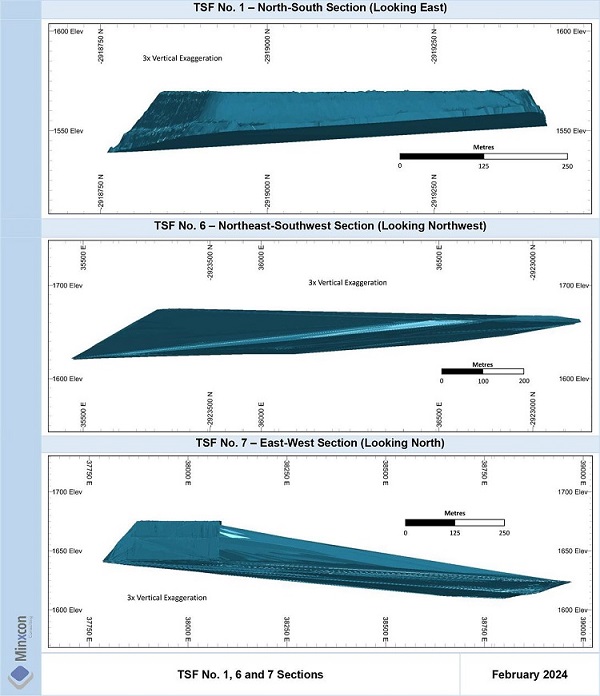
Cross sections of the Doornfontein TSFs are illustrated in Figure 4.
| |
| RESOURCE | RESERVE | VALUE |
Blyvoor Gold Operations (Pty) Ltd
S-K 1300 Technical Report Summary on the Blyvoor Tailings Retreatment Project, South Africa | 22 |
Figure 4: Doornfontein TSF Sections

As the TSFs are man-made, the requirements for a stratigraphic column as required in terms of paragraph (b)(96)(iii)(B)(6) of S-K 1300 are not appropriate or applicable.
Item 6 (c) - Mineralisation and Deposit Type
The TSFs are a man-made stratified deposit from the residue product of processing of gold ores of the Witwatersrand Supergroup. They comprise fine grained material that contains gold mineralisation which was not extracted during previous metallurgical processes. The TSFs were formed by pumping milled and treated material into paddocks on top of dams and allowing the tailings to dry. As such, the geological model for these deposits is a layered deposit.
| |
| RESOURCE | RESERVE | VALUE |
Blyvoor Gold Operations (Pty) Ltd
S-K 1300 Technical Report Summary on the Blyvoor Tailings Retreatment Project, South Africa | 23 |
ITEM 7 - EXPLORATION
Item 7 (a) - Non-Drilling Work
No satellite or aerial photographic interpretation, geophysical surveys, or other exploration have been undertaken over the TSFs.
Item 7 (b) - Drilling
| I. | Type and Extent of Drilling |
A total of six phases of auger drilling were undertaken on TSF No. 7, two phases on TSF No. 6 and only one phase on TSF No. 1, Doornfontein TSF No. 1, Doornfontein TSF No. 2 and Doornfontein TSF No. 3.
In 2007, Dump and Dune (Pty) Ltd conducted the drilling on all six TSFs using a lightweight and man portable handheld auger, which is powered by a 1,400 kW hydraulic motor. A core barrels and extension rods length utilised were 1.5 m, 3 m or 4.5 m. The core barrel comprised a rotating spiral encased in a counter rotating stainless steel core barrel of 50 mm diameter. All drilling, sampling and bagging was done under the supervision of the project geologist on site, who accompanied the drill crew at all times (Whittaker, 2017).
The typical auger drilling procedure was executed as follows:-
| ● | At each site a platform box is dug into the surface down to approximately 20 cm to stabilise the rods during drilling and removal of topsoil; |
| ● | Drilling to 1.5 m depth using the 1.5 m core barrel. The sample is collected by extracting the barrel and using the hydraulic motor to reverse the auger and redirect the material into a plastic sample bag. This happened in 2 to 3 stages as the entire 1.5 m sample could not fit into the core barrel; |
| ● | The 3 m core barrel was then utilised; |
| ● | Thereafter the 4.5 m core barrel was inserted and produced the third 1.5 m sample; and |
| ● | On top of the 4.5 m core barrel, the 1.5 m extension rod was attached, then the 3m extension, thereafter the 4.5 m extension and so on to continue advancement at 1.5 m increments. |
Depth to end of tailings could not be determined accurately as the exact point of bottom intersection was not known unless bedrock was encountered. If soil was penetrated the exact depth of soil could not be calculated due to material expansion in the auger and unknown loss from the base of the auger on withdrawal. Depth estimations were made according to the amount of material in the bags after separating tailings and sub-soil. Accuracy is estimated at better than 0.5 m. Once completed, each drillhole was marked with an aluminium tag with the drillhole number for later surveying (the 2020 drillholes were marked with a 1.5-meter PVC pipe with the hole number clearly marked using paint marker). Auger drillholes were drilled perpendicular to the surface of the TSF. Most drillholes did not penetrate to the underlying soil or bedrock. Some drillholes could not be completed due to collapsing sidewalls. On completion, the drillhole positions were surveyed. Their positions were not permanently marked as this would have interfered with ongoing operations, i.e., TSFs were being ploughed for rehabilitation and dust control, while TSF No. 6 was at the time an active deposition site in 2007 (Whittaker, 2016). Minxcon is of the opinion that the other drilling campaign (2008, 2010, 2015, 2016) followed the same procedure as the same drilling company was involved. No down hole surveys were conducted.
The same procedures were employed during the 2020 drilling programme. All the drillholes were drilled by means of auger drilling to a depth of less than 50 m, it is reasonable to assume that these drillholes are approximately vertical due to the stratified nature of deposition. The geometry of the mineralisation is also considered in the geological modelling and Mineral Resource estimation process.
| |
| RESOURCE | RESERVE | VALUE |
Blyvoor Gold Operations (Pty) Ltd
S-K 1300 Technical Report Summary on the Blyvoor Tailings Retreatment Project, South Africa | 24 |
Drilling was conducted in six phases and sampling was conducted under the supervision of experienced personnel (DEJ Whittaker and A&B Global Mining Consultants) with standard operating procedures in place. Samples were collected at an interval of 1.5 m.
During sampling, the first two 1.5 m samples, i.e. down to 3 m depth, were collected by laying the rods horizontally on trestles and reversing the motor to discharge the samples directly into plastic bags. The auger was then removed from the outer sleeve over a plastic sheet and cleaned and the material added to the sample. Material from the longer 4.5 m rods was sampled manually by rotating the inner spiral in the opposite direction with a hand crank. The first part of the sample is collected from the nose of the core barrel, the remainder from the plastic sheet on extraction of the inner auger as above. Sleeve, auger and sheet were cleaned with brushes after each sample. All reasonable measures were taken to ensure full sample recovery. Each sample bag was numbered with permanent marker pen and a sample ticket containing the dump name, drillhole number, sample number and ticket number attached. This was placed within a miniature Ziploc bag to protect it against damage and stapled to the sample bag. Bags were sealed within a half hour of sample extraction.
No data pertaining to the sample recoveries and results are recorded as part of the auger drilling programmes. No splitting of samples was carried out during any drilling campaigns. Data pertaining to the sample reject is not available.
Minxcon is not aware of any other factors that may have resulted in sample bias.
A summary of the drillholes and samples taken at each TSF is presented in Table 4.
Table 4: Drillhole and Sample Summary
| TSF | Total Drillholes | Total Metres Drilled | Total Samples |
| No. | m | No. |
| TSF No. 1 | 5 | 99.0 | 66 |
| TSF No. 6 | 61 | 2,012.0 | 1,375 |
| TSF No. 7 | 66 | 2,702.0 | 1,810 |
| Doornfontein TSF No. 1 | 5 | 168.0 | 112 |
| Doornfontein TSF No. 2 | 5 | 88.5 | 59 |
| Doornfontein TSF No. 3 | 5 | 93.0 | 62 |
The auger drillhole collar positions on TSF No. 1, TSF No. 6 and TSF No. 7 are presented in Figure 5, Figure 6 and Figure 7, respectively.
The auger drillhole collar positions on Doornfontein TSF No. 1, Doornfontein TSF No. 2 and Doornfontein TSF No. 3 are presented in Figure 8, Figure 9 and Figure 10 respectively respectively.
| |
| RESOURCE | RESERVE | VALUE |
Blyvoor Gold Operations (Pty) Ltd
S-K 1300 Technical Report Summary on the Blyvoor Tailings Retreatment Project, South Africa | 25 |
Figure 5: Drillhole Collars for TSF No. 1
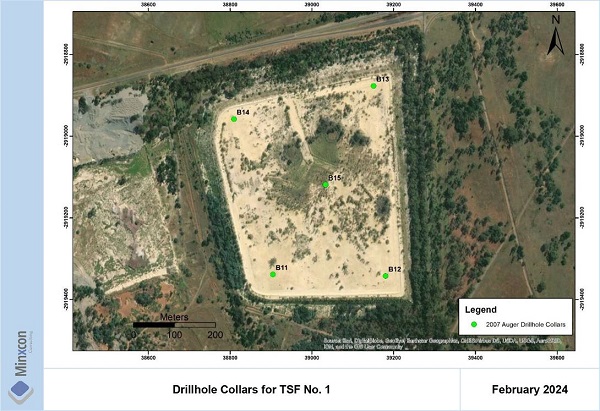
Figure 6: Drillhole Collars for TSF No. 6

| |
| RESOURCE | RESERVE | VALUE |
Blyvoor Gold Operations (Pty) Ltd
S-K 1300 Technical Report Summary on the Blyvoor Tailings Retreatment Project, South Africa | 26 |
Figure 7: Drillhole Collars for TSF No. 7
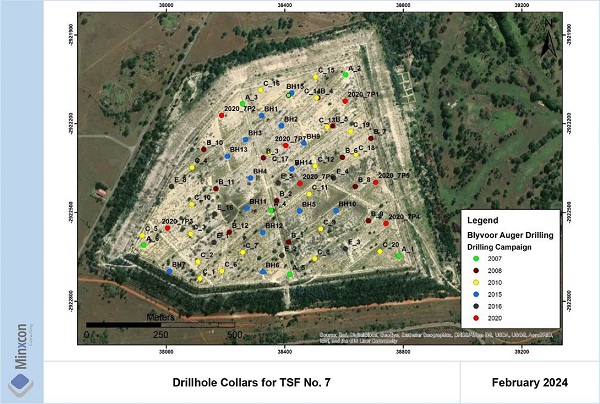
Figure 8: Drillhole Collars for Doornfontein TSF No. 1
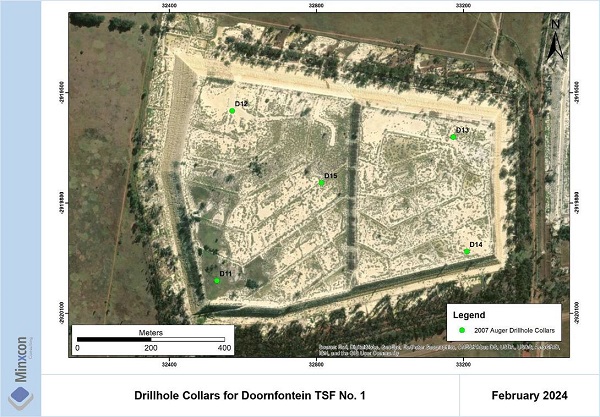
| |
| RESOURCE | RESERVE | VALUE |
Blyvoor Gold Operations (Pty) Ltd
S-K 1300 Technical Report Summary on the Blyvoor Tailings Retreatment Project, South Africa | 27 |
Figure 9: Drillhole Collars for Doornfontein TSF No. 2
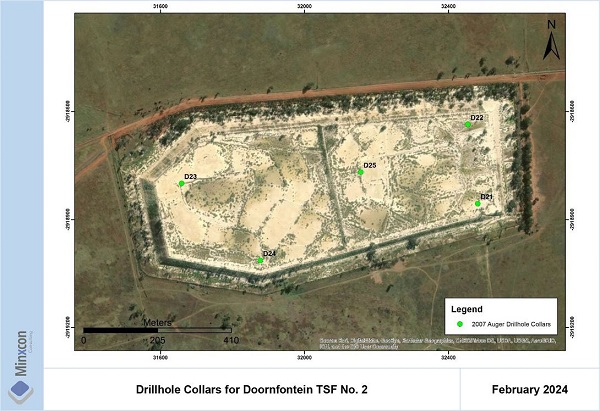
Figure 10: Drillhole Collars for Doornfontein TSF No. 3
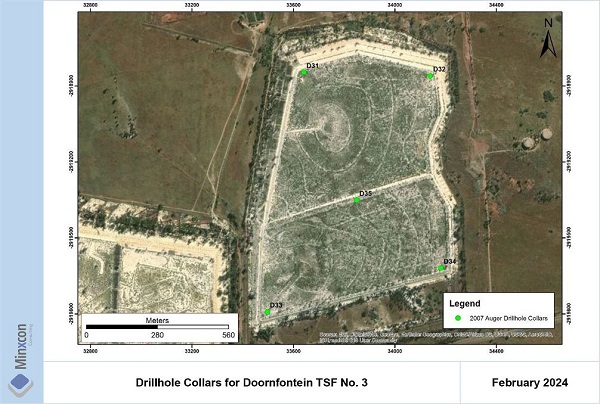
| |
| RESOURCE | RESERVE | VALUE |
Blyvoor Gold Operations (Pty) Ltd
S-K 1300 Technical Report Summary on the Blyvoor Tailings Retreatment Project, South Africa | 28 |
No detailed logging was conducted on the drillholes as the tailings are very uniform in terms of macroscopic features, colour and grain size. Lithological logs (“from” and “to” depth, colour and lithology) are available for the 2010 and 2016 drilling campaigns, of which the 2016 logs were the most detailed. The logging undertaken is suitable for this type of deposit and may be utilised for Mineral Resource estimation. Basic logs were compiled for the 2020 drilling that detailed TSF material as well as soil intersections, which could be utilised in delineating the base of the TSFs.
Item 7 (c) - Hydrogeology
The TSFs are manmade deposits that occur above ground. Hydrogeological characterisation is not deemed applicable by the QPs to this type of deposit.
Item 7 (d) - Geotechnical
The TSFs are manmade deposits. Geotechnical testing is not deemed applicable by the QPs to this type of deposit.
| |
| RESOURCE | RESERVE | VALUE |
Blyvoor Gold Operations (Pty) Ltd
S-K 1300 Technical Report Summary on the Blyvoor Tailings Retreatment Project, South Africa | 29 |
ITEM 8 - Sample Preparation, Analyses and Security
Item 8 (a) - Sample Handling Prior to Dispatch
During the 2007 drilling and sampling campaign, each sample bag was numbered with a permanent marker pen and a sample ticket containing TSF name, drillhole number and sample numbers was attached. A sample ticket was placed within a miniature Ziploc bag to protect it against damage and then stapled to the sample bag. Sample bags were sealed within a half hour of sample extraction. All samples were transported to and stored in a secure and locked facility on the Blyvoor Gold Mine premises until they were dispatched in a closed vehicle to ALS Chemex Laboratories.
Data pertaining to the 2008 and 2010 sample security and chain of custody is not available. Minxcon is of the opinion that the retention policy and storage of physical samples would have been similar to the 2007 drilling campaign. During 2015 and 2016, drilling and sampling was overseen by A&B Global Mining consultants who handed the samples to the client daily for safe keeping before being dispatched to the laboratory. For the 2020 drilling, a detailed chain of custody form was completed, in triplicate each time samples changed hands. It was signed off by the site geologist to the driver transporting the samples, who signed it off to the laboratory assistant. The completed chain of custody was filed and stored.
Item 8 (b) - Sample Preparation and Analysis Procedures
During 2007 auger drilling, all samples collected were dispatched to ALS Chemex Laboratories for analysis. ALS Chemex Laboratories is in Edenvale, Gauteng and is a SANAS certified Laboratory, in accordance with the recognised internal standard ISO/IEC 17025:2005, with accreditation number T0387. Samples were assayed for gold by fire assay, Uranium by XRF, Total Sulphur by Leco Furnace and Infrared Spectroscopy for Sulphur. This laboratory is accredited for both the gold and uranium assays.
No record of the laboratory or analytical method utilised for gold analysis in 2008 and 2010. It is believed that Blyvooruitzicht internal laboratory was used.
During 2015 and 2016 drilling, samples were dispatched to Super Laboratory Services (Pty) Ltd in Springs, Gauteng for gold analysis. Super Laboratory Services (Pty) Ltd is a SANAS certified Laboratory, in accordance with the recognised internal standard ISO/IEC 17025:2005, with accreditation number T0494. Samples were assayed for Au by fire assay.
The 2020 drilling was submitted to SGS Randfontein which is a SANAS certified Laboratory, in accordance with the recognised internal standard ISO/IEC 17025:2005, with accreditation number T0265. Samples were assayed for Au by fire assay Au by lead fusion, followed by AAS finish.
The standard method for sample preparation technique that was carried out at ALS Chemex Laboratories is summarised as follows:-
| ● | All samples received were weighed and the weight was recorded. |
| ● | Samples were then pulverised for quality control test. |
| ● | Crushing to fineness of 70% less than 2.0 mm. |
| ● | The crushed material was riffle split. |
| ● | The split sample was then pulverised to 85% less than 75 µm. |
| ● | Sample was split again, and a duplicate sample was taken out of the split sample. |
Data pertaining to the 2008, 2010, 2015 and 2016 sample preparation techniques are not available.
| |
| RESOURCE | RESERVE | VALUE |
Blyvoor Gold Operations (Pty) Ltd
S-K 1300 Technical Report Summary on the Blyvoor Tailings Retreatment Project, South Africa | 30 |
Bulk Density Determination
In 2007, Geostrada Engineering Materials Laboratory conducted bulk density sampling over all six TSF using a Troxler Roadreader™ nuclear moisture / density gauge, Model 3430. This method uses a radiometric method rather than a mass/volume physical measurement. The methodology had been verified at Crown Gold Recoveries (DRDGold), where tonnage reconciliation exercises are routinely conducted (Whittaker, 2016). The procedure and results for the bulk density measurements is described in the Surface Mineral Resource audit report by Whittaker 2016. The bulk density measurements were averaged per TSF (Table 5).
Table 5: Bulk Density Measurements Conducted in 2007
| TSF | Density | Ave. Density | Ave. Density |
| kg/m3 | kg/m3 | kg/m3 | kg/m3 | kg/m3 | kg/m3 | kg/m3 | kg/m3 | t/m3 |
| TSF No. 1 | 1,464 | 1,423 | 1,515 | - | - | - | - | 1,467 | 1.47 |
| TSF No. 6 | 1,536 | 1,522 | 1,515 | 1549 | - | - | - | 1,531 | 1.53 |
| TSF No. 7 | 1,490 | 1,507 | 1,547 | 1498 | 1677 | 1433 | 1439 | 1,513 | 1.51 |
| Doornfontein TSF No. 1 | 1,494 | 1,400 | 1,444 | - | - | - | - | 1,446 | 1.45 |
| Doornfontein TSF No. 2 | 1,484 | 1,386 | 1,419 | - | - | - | - | 1,430 | 1.43 |
| Doornfontein TSF No. 3 | 1,444 | 1,446 | 1,582 | - | - | - | - | 1,491 | 1.49 |
During the 2020 drilling programme, density measurements were taken on the old Blyvoor TSF No. 6 and TSF No. 7. Samples were collected and the wet and dry densities calculated at each of the planned drill collars. A total of 55 samples were collected, 48 on TSF No. 6 and 7 on TSF No. 7 respectively. The samples were taken utilising the “pipe” method which uses low volume mass/volume physical measurements. Unfortunately, the results were inconclusive with TSF No. 6 returning an average dry density of 1.34 t/m3 and TSF No. 7 an average dry density of 1.43 t/m3, which were deemed too low for this material, suggesting that an error must have occurred in the process of density measurements. For this reason, the historical density figures were used for this estimation. It is however, recommended that with further study work the historical densities be checked using a nuclear densitometer or soil density gauge.
Item 8 (c) - Quality Assurance and Quality Control
External QAQC samples (one high grade CRM, one low grade CRM, blank and duplicates) were inserted in the 2007, 2008 and 2020 sampling campaign. No QAQC data is available for 2007, 2008 and 2010 sampling campaign. In 2016, samples were analysed in duplicate whereas in 2015 only internal laboratory QAQC was implemented.
During 2007 drilling campaign, a standard QAQC programme was followed, where two certified reference materials (“CRMs”) were inserted per 16 auger samples and blank and duplicate sample for every 16th auger sample.
A total of 17 high grade AMIS0029 were utilised during sampling and no major issues were identified as all samples reported above 10 g/t (upper laboratory detection limit), Minxcon is of the opinion that that AMIS0029 was not a representative CRM of the material being sampled. A high-grade CRM of approximately 0.5 g/t to 1.0 g/t should have been utilised, that is more comparable to the expected grades. A total of 20 low grade AMIS0045 samples were utilised of which three samples failed beyond three standard deviations on the lower side of the mean. One blank sample fails the QAQC with the assay value of 0.35 g/t and this might be due to sample swop or contamination at the laboratory. Duplicate samples show an excellent correlation coefficient (R2) of 0.9943. ALS sample analysis vs Blyvoor sample analysis QAQC shows a poor correlation coefficient (R2) of 0.6751. Due to the results consistently under or overreporting the results, it can be concluded that there is no significance bias, but low reproducibility (precision) of the results between laboratories.
| |
| RESOURCE | RESERVE | VALUE |
Blyvoor Gold Operations (Pty) Ltd
S-K 1300 Technical Report Summary on the Blyvoor Tailings Retreatment Project, South Africa | 31 |
No QAQC data is available for the 2008 and 2010 drilling campaign (TSF No. 7). It is presumed that the sample analysis was undertaken at the Blyvooruitzicht internal Laboratory.
For the 2015 drilling campaign (TSF No. 7), data pertaining to the CRMs, blanks and duplicate utilised during sampling process were not available at the time of reporting. The CRMs used by Superlabs internal QAQC were not representative of the TSF material being sampled and a lower grade CRM, duplicate and blank samples should have been inserted in the sampling sequences. A total of nine low AMI0208 samples were utilised at Superlabs of which all samples pass the QAQC within one standard deviation. For AMIS0430 QAQC, all samples are within one standard deviation on the lower side of the mean. A locally prepared reference standard (Chips 2) with a value of 2.02 g/t was utilised at Superlabs. A total of 26 chips and two reference samples were analysed and they all fall within the specified limit.
Limited data pertaining to the QAQC followed during 2016 drilling campaign (TSF No. 7) is available. The duplicate results presented a good correlation coefficient (R2) of 0.9349. The original duplicate results from the laboratory were not available to Minxcon at the time of reporting. No other QAQC data is available.
For the 2020 drilling campaign, QAQC Standards (two different types), laboratory duplicates and blanks were inserted in the sample sequence as every 10th sample alternating in order, respectively. For every batch of samples sent to the laboratory, at least 5% of those samples were sent as check samples to a referee laboratory. These samples were selected at random.
During the drilling, 36 duplicates, 35 blanks, 29 referee samples and 72 standards were inserted as part of the QAQC procedures. As part of the SGS laboratories internal QAQC programme, 53 blanks, 82 standards and 63 blanks were inserted. The bulk of the standards used are representative of the expected grades being assayed, except for one. However, the results are acceptable with minimal failures for all standards. The blank analysis for 2020 show one failure with the remainder plotting within expected ranges. For the Blyvoor sample run, a certified blank (AMIS 577), made from silica powder with a gold value of zero, was selected. The blank material used for SGS’s internal QAQC was not specified. A good correlation of original with duplicate is observed from the results of the duplicate analysis for both internal SGS duplicates and duplicates submitted as part of the drilling campaign.
Plotting of the analysis results revealed only eight failures in the database. A slight positive bias is seen in the standards. The results plot within acceptable limits and do not constitute a significant error. Referee samples from ALS against the original SGS results showed a good correlation with original assays, except for three samples plotting outside a 10% confidence envelope.
The QAQC results and procedures followed during the 2020 campaign show results are suitable for inclusion into the estimation database.
Item 8 (d) - Adequacy of Sample Preparation, Security and Analytical Procedures
This section sets out the opinion of the QPs regarding the adequacy of sample preparation, security, and analytical procedures.
Appropriate QAQC samples were inserted during the 2007 and 2020 sampling campaign. Data pertaining to the 2008 and 2010 QAQC is not available. The 2015 and 2016 campaign relied on the internal laboratory QAQC procedures and the certified material were not representative of the deposit (Whittaker, 2016). Despite lack of QAQC data in 2015 and 2016, Minxcon is of the opinion that sampling was conducted to best industry standard techniques. Detailed Sampling and QAQC procedures are available for the 2020 programme.
| |
| RESOURCE | RESERVE | VALUE |
Blyvoor Gold Operations (Pty) Ltd
S-K 1300 Technical Report Summary on the Blyvoor Tailings Retreatment Project, South Africa | 32 |
It is the opinion of the QP responsible for the Mineral Resources of this Report that the database utilised for the Mineral Resource estimation is adequate and appropriate. It is the QP’s opinion that the bulk density determination method was conducted according to industry best practice and therefore deemed reliable to use for the Mineral Resource estimation.
| |
| RESOURCE | RESERVE | VALUE |
Blyvoor Gold Operations (Pty) Ltd
S-K 1300 Technical Report Summary on the Blyvoor Tailings Retreatment Project, South Africa | 33 |
ITEM 9 - DATA VERIFICATION
Item 9 (a) - Data Verification Procedures
The databases for all TSFs were supplied in the form of Microsoft Excel™ spreadsheets. The drillhole databases included collar file, assay file, survey files as well as lithological logs for both TSF No. 6 (2020 drilling campaign) and TSF No. 7 (2010, 2016 and 2020 drilling campaign). Original laboratory certificates for 2008, 2010 and 2016 drilling campaign were not available for cross validation.
The QP cross-validated the 2007, 2015 and 2020 assay database with the original laboratory certificates as supplied by the Company. The QP found no copy and paste, or transcription errors between the databases. In addition, the QP cross checked and validated the data (lithological and assay logs) in Datamine Studio EM™ software as far as possible.
Historical Audits and reviews were conducted by Coffey Mining from 2002 - 2011, Minxcon in 2012 and DEJ Whittaker in 2016 and no risk or concerns were raised.
Item 9 (b) - Limitations on/Failure to Conduct Data Verification
No data verification limitations were encountered.
Item 9 (c) - Adequacy of Data
It is the view of the QP responsible for the Mineral Resources of this Report, Mr Engelmann, that the Project data is adequate for the purposes of conducting Mineral Resource estimation in line with the requirement as outlined by the requirements of S-K 1300.
| |
| RESOURCE | RESERVE | VALUE |
Blyvoor Gold Operations (Pty) Ltd
S-K 1300 Technical Report Summary on the Blyvoor Tailings Retreatment Project, South Africa | 34 |
ITEM 10 - MINERAL PROCESSING AND METALLURGICAL TESTING
Item 10 (a) - Nature and Extent of Testing and Analytical Procedures
Auger drilling was completed on the TSFs to obtain samples for metallurgical testwork. Several drilling campaigns have been done in the past and used for different tests. Testwork was done by Superlabs, Maelgwyn Mineral Services (“Maelgwyn”) and SGS in 2015, 2016 and 2017, respectively. Superlabs conducted bottle roll leach tests with activated carbon to simulate a carbon-in-leach (CIL) processing route. Maelgwyn used their proprietary Aachen reactor to simulate a CIL process with pre-oxidation step. SGS conducted a diagnostic leach test to determine the gold distribution among the minerals in the sample.
The tests were used to estimate the expected recovery and major reagent consumptions. As expected, the recovery was found to be higher for higher grade samples.
The consumption rates of the two major reagents (cyanide and lime) were also estimated from the Superlabs and Maelgwyn testwork.
Cyanide consumption for the bottle roll tests undertaken by Superlabs was significantly higher than the CIL tests preceded with oxidation done by Maelgwyn. This is expected as the dissolved oxygen is known to increase the speed of the gold cyanidation reaction. As the large-scale plant will also employ a similar pre-oxidation step as the Maelgwyn testwork, this average cyanide consumption was used as the estimate for the full-scale plant.
The lime consumption was more similar between the two laboratories and an average of all the tests was taken as estimate for the full-scale plant.
Item 10 (b) - Basis of Assumptions Regarding Recovery Estimates
The samples from the auger drilling in TSF No. 7 are assumed to be representative of both TSF No. 6 and 7 as they were produced from the same mining area, and the measured Mineral Reserve grade for the two TSFs are similar at 0.32 g/t and 0.31 g/t, respectively. Some grade and recovery variations are expected, but the model used to fit the experimental data is assumed to adequately account for this. Despite that the assumption may not necessarily be accurate in respect of a common mining area, the measured Mineral Reserve grade supports this claim. It is however recommended to perform additional testwork to increase the confidence level of the claim of similarity. The well-tested and widely used CIL process was selected to recover the gold from the TSF material. This process will also incorporate an oxidation step before cyanidation to improve leaching kinetics and lower the cyanide consumption as indicated in the Maelgwyn tests.
Other operations that treat similar surface stockpiles also use the CIL technology, but some of these operations incorporate a grinding step prior to pre-oxidation and leaching. The material from TSF No. 6 and TSF No. 7 is expected to be sufficiently fine, and the lower grade does not warrant the additional expensive grinding step. Testwork has been performed and supports the plant design proposal which excludes re-grinding.
Item 10 (c) - Representativeness of Samples and Adequacy of Data
The samples measured from current production are considered reliable and representative. As a result, they can be used to adequately predict future performance.
The QPs are of the opinion that TSF gold recoveries are well understood as they are based on various comparable operations in the region which employ a similar process plant design, and which do not differ in many respects from the process plant design employed to recover gold from RoM originating from
| |
| RESOURCE | RESERVE | VALUE |
Blyvoor Gold Operations (Pty) Ltd
S-K 1300 Technical Report Summary on the Blyvoor Tailings Retreatment Project, South Africa | 35 |
underground gold mining operations. Blyvoor Capital currently operates such a process plant which is designed to achieve acceptable recovery of gold from reef ore which is sourced from underground mining operations.
Item 10 (d) - Deleterious Elements for Extraction
No deleterious elements have been identified which could otherwise negatively affect the processing plant and for which the plant has not been provided with adequate processing capacity thereof. During 2007 over-sized material and carbon were removed. Representative particle size distribution was used for the plant design. The process includes detoxification capacity to render cyanide below allowable threshold. Rainwater run-off from the tailings dam is channelled within bund walls to a sump from where it is returned to the plant as makeup water.
| |
| RESOURCE | RESERVE | VALUE |
Blyvoor Gold Operations (Pty) Ltd
S-K 1300 Technical Report Summary on the Blyvoor Tailings Retreatment Project, South Africa | 36 |
ITEM 11 - MINERAL RESOURCE ESTIMATES
Item 11 (a) - Assumptions, Parameters and Methods Used for Resource Estimates
| I. | Mineral Resource Estimation Procedures |
| i. | Geological Drillholes and Statistics |
The databases for all TSFs were supplied as Microsoft Excel™ spreadsheets. The drillhole databases included collar file, assay file, survey files as well as lithological logs for both TSF No. 6 (2020 drilling campaign) and TSF No. 7 (2010, 2016 and 2020 drilling campaigns). The 2007 and 2008 drillhole data had limited detail. The database for Mineral Resource estimation was visually checked for errors and inconsistency and validated in Datamine Studio EM™ as well as Leapfrog Edge™ software. The gold (Au) field was also checked for zero and null values and replaced with 0.0005 (half the detection limit). Geological drillholes and statistics per TSFs are presented in Table 6.
Table 6: Classical Statistics for the TSFs
TSF ID | No of
Drillholes | No
Samples | Minimum | Maximum | Mean | Std
Deviation |
| g/t | g/t | g/t |
| TSF No. 1 | 5 | 66 | 0.09 | 0.60 | 0.26 | 0.09 |
| TSF No. 6 | 61 | 1,375 | 0.02 | 2.15 | 0.32 | 0.12 |
| TSF No. 7 | 66 | 1,810 | 0 | 2.28 | 0.32 | 0.19 |
| Doornfontein TSF No. 1 | 5 | 112 | 0.0005 | 0.83 | 0.31 | 0.14 |
| Doornfontein TSF No. 2 | 5 | 59 | 0.13 | 1.21 | 0.31 | 0.20 |
| Doornfontein TSF No. 3 | 5 | 62 | 0.04 | 0.46 | 0.23 | 0.10 |
Block models were created considering the drillhole spacing and sample size. Mineral Resource estimation was completed in in Datamine Studio EM™ software for TSF No. 1 and Doornfontein TSF’s. Leapfrog Edge™ was utilised for TSF No. 6 and TSF No. 7.
Based on the statistical analysis and limited number of samples it was decided not to cap or cut the data for use in the estimation for TSF No. 1 or Doornfontein TSFs No. 1, 2 or 3. TSFs No. 6 and 7 had a large enough database to warrant outlier analysis. The probability plot for TSF No. 6 is illustrated in Figure 11 and TSF No. 7 in Figure 12. Both domains were capped at 1.5 g/t for the estimation.
| |
| RESOURCE | RESERVE | VALUE |
Blyvoor Gold Operations (Pty) Ltd
S-K 1300 Technical Report Summary on the Blyvoor Tailings Retreatment Project, South Africa | 37 |
| Figure 11: Outlier Analysis for TSF No. 6 | | Figure 12: Outlier Analysis for TSF No. 7 |
| | | |
 | | 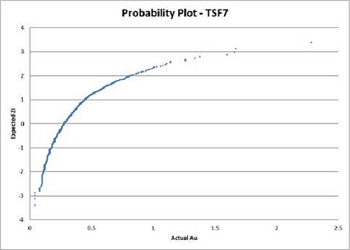 |
The drillhole data for all TSFs was composited on a 1.5 m composite which is the standard sub-sampling length for all TSFs.
Variograms could be generated for TSF No. 6 and No. 7; the parameters are detailed in Table 7. An attempt was made at generating and modelling semi-variograms for the remaining TSFs with the associated drillhole composite, however the lack of data and relatively wide drillhole spacing (>300 m grid) between drillholes precluded the generation of valid variograms.
Table 7: Variogram Parameters for TSF No. 6 and TSF No. 7
| Domain | | TSF No. 6 | TSF No. 7 |
| Direction | Dip | 0 | 0 |
| Dip Azimuth | 0 | 0 |
| Pitch | 39.4 | 21.4 |
| Model space | | Log | Log |
| Variance | | 0.99 | 0.99 |
| Nugget | | 0.54 | 0.089 |
| Sill | | 0.489 | 0.006 |
| Structure | | Spherical | Spherical |
| Major Range | | 212.1 | 260.8 |
| Semi-major Range | | 181.5 | 170.2 |
| Minor Range | | 3 | 3 |
Bulk density determination is described in Item 8 (b).
| vii. | Estimation Parameters |
The estimation parameters are shown in Table 8. The search volume was utilised for TSF No. 6 and No. 7 to aid in Mineral Resource classification. The search range 2 is 1.5 X the variogram range and search range 3 is 2 X the variogram range.
| |
| RESOURCE | RESERVE | VALUE |
Blyvoor Gold Operations (Pty) Ltd
S-K 1300 Technical Report Summary on the Blyvoor Tailings Retreatment Project, South Africa | 38 |
Table 8: Estimation Parameters for the 2020 Mineral Resource Estimation
TSF | | Search Distance | Minimum
No. of
Samples | Maximum
No. of
Samples | Minimum
Drillholes | Estimation
Technique |
| Search Volume | X | Y | Z |
| TSF No. 1 | Search Range 1 | 600 | 600 | 6 | 5 | 30 | 2 | IDW2 |
| TSF No. 6 | Search Range 1 | 212 | 212 | 3 | 9 | 15 | 3 | OK |
| Search Range 2 | 318 | 318 | 4.5 | 6 | 15 | 3 | OK |
| Search Range 3 | 424 | 424 | 6 | 3 | 15 | 2 | OK |
| TSF No. 7 | Search Range 1 | 261 | 170 | 3 | 9 | 15 | 3 | OK |
| Search Range 2 | 391 | 255 | 4.5 | 6 | 15 | 3 | OK |
| Search Range 3 | 522 | 340 | 6 | 3 | 15 | 2 | OK |
| Doornfontein TSF No. 1 | Search Range 1 | 600 | 600 | 6 | 5 | 30 | 2 | IDW2 |
| Doornfontein TSF No. 2 | Search Range 1 | 600 | 600 | 6 | 5 | 30 | 2 | IDW2 |
| Doornfontein TSF No. 3 | Search Range 1 | 750 | 750 | 6 | 5 | 30 | 2 | IDW2 |
| viii. | Mineral Resource Estimation |
The estimation results for TSF No.1 are shown in Figure 13. The estimations for TSF No. 6 and No. 7 are illustrated in Figure 14 and Figure 15, these were both conducted in Leapfrog EdgeTM, all other estimates were performed in Datamine RMTM. The estimates for Doornfontein TSFs No. 1, 2 and 3 are illustrated in Figure 16, Figure 17 and Figure 18 respectively.
| |
| RESOURCE | RESERVE | VALUE |
Blyvoor Gold Operations (Pty) Ltd
S-K 1300 Technical Report Summary on the Blyvoor Tailings Retreatment Project, South Africa | 39 |
Figure 13: Mineral Resource Estimation for TSF No. 1
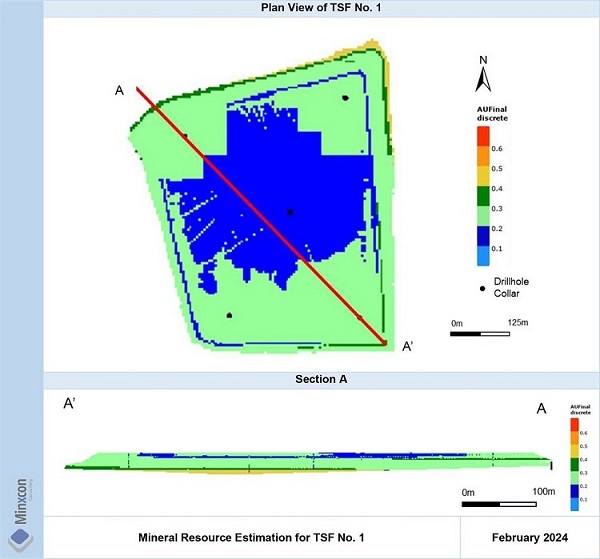
| |
| RESOURCE | RESERVE | VALUE |
Blyvoor Gold Operations (Pty) Ltd
S-K 1300 Technical Report Summary on the Blyvoor Tailings Retreatment Project, South Africa | 40 |
Figure 14: Mineral Resource Estimation for TSF No. 6

| |
| RESOURCE | RESERVE | VALUE |
Blyvoor Gold Operations (Pty) Ltd
S-K 1300 Technical Report Summary on the Blyvoor Tailings Retreatment Project, South Africa | 41 |
Figure 15: Mineral Resource Estimation for TSF No. 7
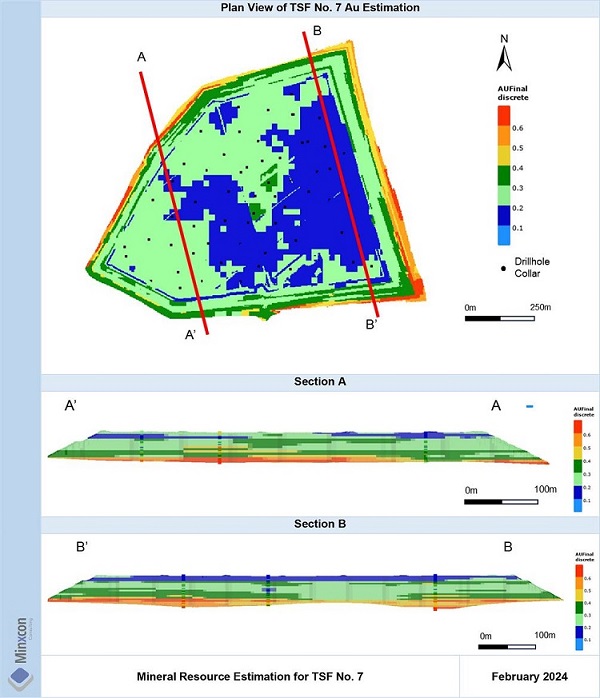
| |
| RESOURCE | RESERVE | VALUE |
Blyvoor Gold Operations (Pty) Ltd
S-K 1300 Technical Report Summary on the Blyvoor Tailings Retreatment Project, South Africa | 42 |
Figure 16: Mineral Resource Estimation for Doornfontein TSF No. 1
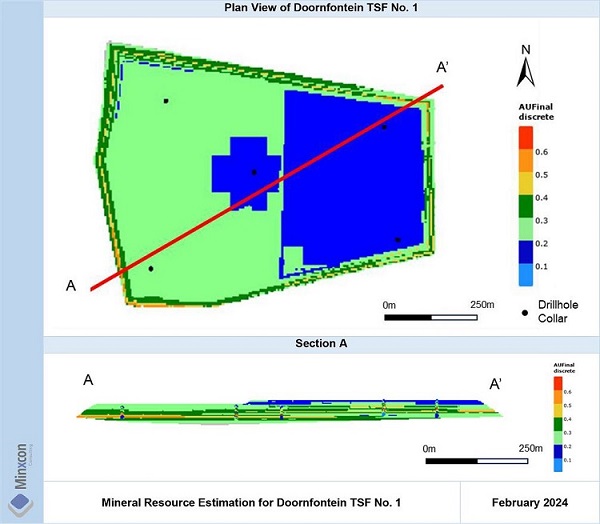
| |
| RESOURCE | RESERVE | VALUE |
Blyvoor Gold Operations (Pty) Ltd
S-K 1300 Technical Report Summary on the Blyvoor Tailings Retreatment Project, South Africa | 43 |
Figure 17: Mineral Resource Estimation for Doornfontein TSF No. 2

| |
| RESOURCE | RESERVE | VALUE |
Blyvoor Gold Operations (Pty) Ltd
S-K 1300 Technical Report Summary on the Blyvoor Tailings Retreatment Project, South Africa | 44 |
Figure 18: Mineral Resource Estimation for Doornfontein TSF No. 3
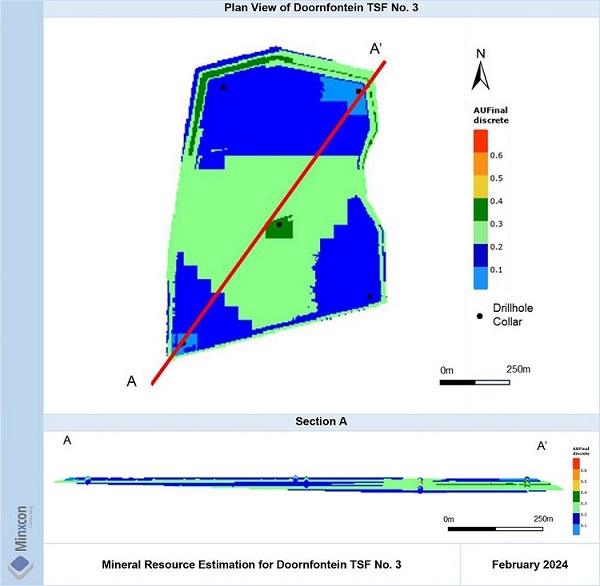
| ix. | Mineral Resource Validation |
As part of reconciliation of model to drillhole data, swath plots for were created with 200 m swaths running from north to south and east to east as well as 20 m vertical swath for TSF No. 1, Doornfontein TSF No. 1, Doornfontein TSF No. 2 and Doornfontein TSF No. 3.
Doornfontein TSF No. 1 swath plot present good correlation between the model and data. The swath plots for Doornfontein TSF No. 2 present good correlation between the model and data. The swath plot for Doornfontein TSF No. 3 show best correlation between the model and data. Swaths plots were also generated for the ordinary krig estimates versus an Inverse distance estimate for TSF No. 6 and 7. A good correlation with data is shown with both domains, particularly vertically.
| |
| RESOURCE | RESERVE | VALUE |
Blyvoor Gold Operations (Pty) Ltd
S-K 1300 Technical Report Summary on the Blyvoor Tailings Retreatment Project, South Africa | 45 |
The QP undertook an initial assessment of the deposits to determine the reasonable prospects of eventual economic extraction (“RPEEE”).
Due to the TSFs occurring on the surface and the ease of extraction, there are sufficient expectations for economic extraction.
There are no social, environmental or governance issues identified for the Project that could have a material modification to the planned Mineral Resource estimation programme, or that are likely to remain material despite the implementation of proposed mitigation measures.
The QP deems the total Mineral Resource as stated in this TRS to have RPEEE.
| III. | Mineral Resource Classification |
The Mineral Resource classification is a function of the confidence of the whole process from drilling, sampling, geological understanding and geostatistical relationships. The following aspects or parameters were considered for Mineral Resource classification:-
| 3. | distance between samples; |
| 4. | number of samples used to estimate a specific block; and |
The classification criteria applied is displayed in Table 9.
Table 9: Classification Criteria Applied
Mineral Resource
Category | Variogram
Range | Minimum
Drillholes | Minimum Distance
between Samples | Regression
Slope |
| Measured | 1X | 3 | 80 m | 0.6 |
| Indicated | 1.5X | 3 | 140 m | |
| Inferred | 2X | 2 | | |
This criterion is applied to TSF No. 6 and 7. While for TSF No.1, Doornfontein TSF No.1, 2 and 3, an Inferred Mineral Resource is defined due to limited samples and lack of historical sampling and QAQC data. The Measured and Indicated Mineral Resources for TSF No. 6 and No. 7 are mined out completely and are thus not presented in the Mineral Resources statement exclusive of Mineral Reserves.
| IV. | Mineral Resource Statement |
The Mineral Resources are declared with no cut-off applied as most of the TSF’s are expected to be totally reclaimed due to the nonselective hydraulic mining methodology and the average grades of the TSFs have a higher grade than the calculated pay limit of 0.14 g/t. No geological loss or modifying factors are applied for Mineral Resource purposes. Tonnages are stated in metric tonnes, columns may not add up due to rounding. Mineral Resources are reported as falling within the boundary limits of the mineral licenses. Inferred Mineral Resources have a low level of confidence and while it would be reasonable to expect that the majority of Inferred Mineral Resources would upgrade to Indicated Mineral Resources with continued exploration, due to the uncertainty of Inferred Mineral Resources, it should not be assumed that such upgrading would occur.
| |
| RESOURCE | RESERVE | VALUE |
Blyvoor Gold Operations (Pty) Ltd
S-K 1300 Technical Report Summary on the Blyvoor Tailings Retreatment Project, South Africa | 46 |
The mine plan mines the total TSF No. 6 and TSF No. 7, as depicted in Figure 19, including 16 koz of Inferred Mineral Resources attributed to TSF No. 6 and TSF No. 7. These 16 koz are not reflected in the Mineral Reserves as they are considered to fall within the Inferred Mineral Resource category.
Figure 19: Blyvoor TSF No. 6 and TSF No. 7 Mineral Resource Model
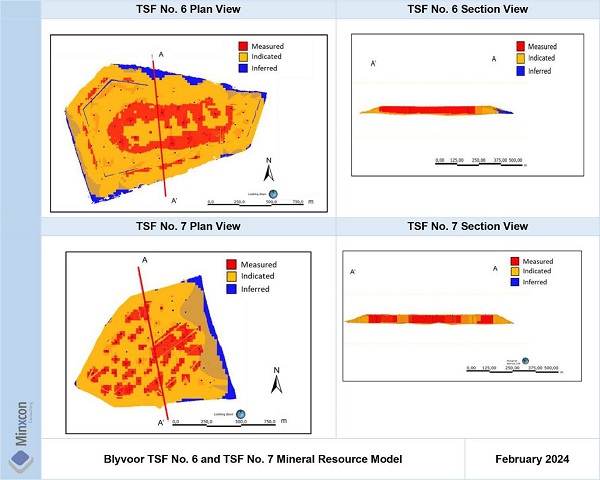
Consequently, there will be no further contributions to Mineral Resource base from TSF No. 6 and TSF No.7. and have therefore been shown as zero as there is no residual Mineral Resource excluding Mineral Reserves for these two TSFs.
The in situ Mineral Resources for the TSFs as at 29 February 2024 are presented in Table 10. The Mineral Resources are reported as exclusive of Mineral Reserves and are 100% attributable to Blyvoor Ops.
Table 10: Mineral Resources for Blyvoor Gold Mine TSFs as at 29 February 2024
TSF | Mineral Resource Classification | Tonnes | Grade | Au Content |
| Mt | g/t | kg | koz |
| TSF No. 6 and No. 7 | Measured and Indicated | 0.0 | 0.0 | 0.0 | 0.0 |
| TSF No. 1 | Inferred | 7.2 | 0.25 | 1,816 | 58 |
| Doornfontein TSF No. 1 | Inferred | 23.7 | 0.31 | 7,278 | 234 |
| Doornfontein TSF No. 2 | Inferred | 9.3 | 0.32 | 2,994 | 96 |
| Doornfontein TSF No. 3 | Inferred | 18.1 | 0.24 | 4,268 | 137 |
| Total Inferred | | 58.32 | 0.28 | 16,357 | 526 |
Notes:
| 2. | No geological loss applied. |
| |
| RESOURCE | RESERVE | VALUE |
Blyvoor Gold Operations (Pty) Ltd
S-K 1300 Technical Report Summary on the Blyvoor Tailings Retreatment Project, South Africa | 47 |
| 3. | Mineral Resources are 100% attributable to Blyvoor Ops. |
| 4. | Mineral Resources are exclusive of Mineral Reserves. |
Item 11 (b) - Individual Grade of Metals
Mineral Resources for gold have been estimated for the TSFs. No other metals or minerals have been estimated for the Project.
Item 11 (c) - Factors Affecting Mineral Resource Estimates
The QPs are not aware of any known environmental, permitting, legal, title, taxation, socio-economic, marketing, and political or other factors that will materially affect the Mineral Resource estimates. There are no modifying factors, by-products or deleterious elements currently identified.
The QPs are of the opinion that there is sufficient data density and confidence in the data to define Measured, Indicated and Inferred Mineral Resources. The total Measured and Indicated Mineral Resources are converted to Mineral Reserves, thus are not presented in the Mineral Resource estimation.
| |
| RESOURCE | RESERVE | VALUE |
Blyvoor Gold Operations (Pty) Ltd
S-K 1300 Technical Report Summary on the Blyvoor Tailings Retreatment Project, South Africa | 48 |
ITEM 12 - MINERAL RESERVE ESTIMATES
Item 12 (a) - Key Assumptions, Parameters and Methods
| I. | Estimation and Modelling Techniques |
The mining design and schedule was completed using the Mineral Resource model as presented in this TRS. The Mineral Resources in the LoM plan include only Measured and Indicated Mineral Resources. The Mineral Resources are adjusted with Mineral Reserve conversion factors to convert the Mineral Resources into Mineral Reserves.
Only Measured and Indicated Mineral Resources were included in the Mineral Reserve statement. Mineral Reserves are reported for the TSF No. 6 and TSF No. 7. Only material from TSF No. 6 and TSF No. 7 was included in the estimation. The Mineral Reserves are reported as material delivered to the processing plant before recovery. Mineral Resources in the Measured and Indicated categories were converted into Mineral Reserves in the Proved and Probable categories, having considered confidence in the Mineral Resources and the modifying factors applied.
Minxcon used the updated Blyvoor TSF No. 6 and TSF No. 7 Mineral Resource model as at 29 February 2024. The Mineral Resource models used in the mine design and schedule of TSF No. 6 and TSF No. 7 are illustrated in Figure 21.
| II. | Quality Parameters Applied |
Hydro mining will be employed, which entails re-mining the entire TSF and therefore no cut-off were applied to the TSF’s planned to be mined although the entire TSF’s will exceed the pay-limit which was used for the cut-off. The Mineral Resources in the LoM plans are above the calculated pay limit. The pay-limit calculation as per the 2020 PFS is detailed in Table 11.
Table 11: Pay-Limit Calculation
| Type | Description | Unit | Value |
| Production | Production Rate | ktpm | 500 |
| Cost Assumptions | | | |
| Cost | Mining Cost | ZAR/t | 2.57 |
| Cost | Processing | ZAR/t | 56.00 |
| Cost | Other | ZAR/t | 1.50 |
| Total Cost | | | 60.07 |
| Price Assumptions | | | |
| Price | Exchange Rate | ZAR/USD | 17.00 |
| Price | Gold price - Au | USD/oz | 1,500 |
| Pay limit Calculation | Description | Unit | Value |
| Pay limit | Plant recovery | % | 55% |
| Pay limit | Dilution | % | 2% |
| Pay limit | Ore loss | % | 1% |
| Pay limit | Mine call factor | % | 95% |
| Pay limit | Pay limit | g/t Au | 0.14 |
The mining strategy involves targeting the highest-grade area first, which is the upper portion of TSF No. 6. Mining then moves to TSF No. 7, depleting the entire dam. The grade of TSF No. 7 is slightly lower than the grade in the upper portion of TSF No. 6, but higher than the grade in the lower portion of TSF No. 6. This strategy will ensure that a more constant grade profile is maintained throughout the project.
| |
| RESOURCE | RESERVE | VALUE |
Blyvoor Gold Operations (Pty) Ltd
S-K 1300 Technical Report Summary on the Blyvoor Tailings Retreatment Project, South Africa | 49 |
All relevant processing, metallurgical, infrastructure, economic, marketing, legal, environmental, social and governmental factors have been taken into consideration for the conversion from Mineral Resources to Mineral Reserves, however these factors have had no material impact on the Mineral Reserve estimation. No minimum mining dimension has been applied due to the selected mining method. Hydro mining of the TSFs does not require a minimum mining dimension to be applied.
The Mineral Reserve conversion factors applied to the Mineral Resources to convert to Mineral Reserves are detailed in Table 12. Mineral Reserve conversion factors have been applied equally to Measured Mineral Resources and to Indicated Mineral Resources. The Mineral Reserve conversion factors applied have been derived from industry standards associated with hydro mining of TSFs.
Table 12: Mineral Reserve Conversion Factors Applied
| Mining Conversion Factor | Unit | Value |
| Dilution | % | 2 |
| Ore Losses | % | 1 |
| Mine Call Factor | % | 95 |
Dilution accounts for any material that may be mined with the TSF material, such as soil, which has no gold content and dilutes the grade of the mined material. This may occur during mining of TSF No. 7 at the contact of the bottom of the TSF and the soil.
Ore loss has been applied to account for material containing gold that is lost during the mining process. This may occur during the washing and flow of the TSF slurry product along trenches and sumps where fines could be lost.
The following additional factors were considered:-
| ● | Processing and Metallurgical: The recovery method selected is conventional CIL as used by most TSF retreatment projects. The recovery applied is a function of the grade and the average recovery applied to the project for Measured and Indicated Mineral Resources is 54%. |
| ● | Infrastructure: No infrastructure constraints were identified. |
| ● | Economic and Marketing: No economic factors affecting the Mineral Reserve have been identified. |
| ● | Legal, Environmental, Social and Governmental: No legal, environmental, social, and governmental factors affecting the Mineral Reserves were identified. |
| IV. | Mineral Reserve Statement |
All Mineral Reserves were categorised and reported in accordance with the guidelines of §229.1302(e)(2) of S-K 1300.
The Mineral Resources within the LoM plan were adjusted with mining dilution, increasing the tonnage and thereby diluting the grade. Ore loss reduces the tonnes and content in the Mineral Resource. Dilution does not influence the gold content but increases the mined tonnes, diluting the grade. The mine call factor reduces the content that is available to be recovered. TSF No. 6 and TSF No. 7 Mineral Reserves, as delivered to plant and as at 29 February 2024, are detailed in Table 13.
Table 13: Mineral Reserves for Blyvoor TSF No. 6 and TSF No. 7 as at 29 February 2024
TSF | Mineral Reserve Classification | Tonnes | Grade | Au Content |
| kt | g/t | kg | koz |
| TSF No. 6 | Probable | 44,868 | 0.29 | 13,199 | 424 |
| TSF No. 7 | Probable | 39,408 | 0.31 | 12,187 | 392 |
| Total | Probable | 84,276 | 0.30 | 25,385 | 816 |
Notes:
| |
| RESOURCE | RESERVE | VALUE |
Blyvoor Gold Operations (Pty) Ltd
S-K 1300 Technical Report Summary on the Blyvoor Tailings Retreatment Project, South Africa | 50 |
| 1. | Mineral Reserve cut-off of 0.14g/t was applied, but the entire TSF’s average will be more than the cut-off, therefore everything is mined. |
| 2. | Mineral Reserves are 100% attributable to Blyvoor Ops. |
The Mineral Reserve contains 816 koz of gold in the Probable Mineral Reserve classification, derived from Measured and Indicated Mineral Resources, after having applied modifying factors for conversion from Mineral Resources to Mineral Reserves.
TSF No. 6 contains Measured Mineral Resources of 30,782 kt at a grade of 0.30 g/t containing 298.70 koz of gold which have been converted into Probable Mineral Reserves. A total of 14,086 kt at a grade of 0.28 g/t containing 125.65 koz of gold from the Indicated Mineral Resource classification has been converted into Probable Mineral Reserves.
TSF No. 7 contains Measured Mineral Resources of 18,224 kt at a grade of 0.29 g/t containing 171.26 koz of gold which have been converted into Probable Mineral Reserves. A total of 21,184 kt at a grade of 0.32 g/t containing 220.55 koz of gold from the Indicated Mineral Resource classification has been converted into Probable Mineral Reserves.
Item 12 (b) - Multiple Commodity Reserve
Gold is the only commodity within the Blyvoor mining areas that is present in significant concentrations.
Item 12 (c) - Factors Affecting Mineral Reserve Estimation
No socio-economic, legal or political modifying factors were taken into account in the estimation of Mineral Reserves for the Blyvoor Mine. The QPs are not aware of any known environmental, permitting, legal, title, taxation, socio-economic, marketing, and political or other factors that will materially affect the Mineral Reserve estimates. No material issues were identified for the Project.
The Mineral Reserve conversion factors detailed in Table 12 were applied to the Mineral Resource for conversion to Mineral Reserves. The classification of Mineral Reserves can be affected by changes in the status of the factors. In particular, the gold price will affect the viability of the mineralised target.
| |
| RESOURCE | RESERVE | VALUE |
Blyvoor Gold Operations (Pty) Ltd
S-K 1300 Technical Report Summary on the Blyvoor Tailings Retreatment Project, South Africa | 51 |
ITEM 13 - MINING METHODS
The mining method that will be used for the reclamation of TSF No. 6 and TSF No. 7 is hydraulic mining. Hydraulic mining involves the use of high-pressure water monitors (water jets) to erode the TSF in strategic sections or cuts.
The hydro mining units can be either manually controlled or remote operated. Units can be mounted in a stationary position or trackless to allow for mining flexibility in terms of manoeuvrability. The product which is converted into a slurry by the water jets, is washed downstream of the unit for collection in a sump. The slurry is pumped from the sump via a slurry pipeline to the processing plant.
The mining layout for the depletion of TSF No. 6 and TSF No. 7 is illustrated in Figure 20. Mining of TSF No. 6 and TSF No. 7 will be conducted sequentially to create capacity for depositing the newly retreated TSF material.
Figure 20: Blyvoor Ops Tailings Retreatment Project Layout
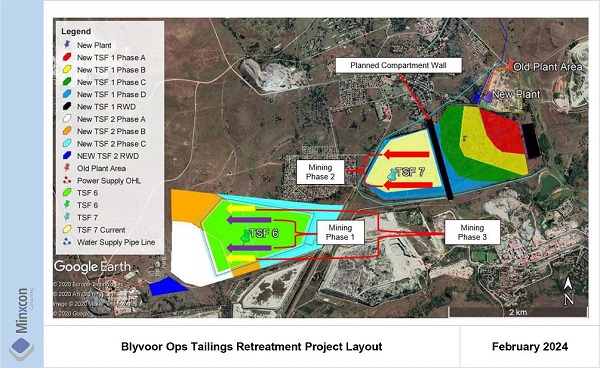
The mining strategy involves a 12-month ramp up to 500 ktpm steady state-production. Mining will commence with targeting the high-grade areas located at the upper portion of TSF No. 6 (Phase 1). Upon completion of the first mining cut on TSF No. 6, mining will move to TSF No. 7 (Phase 2). The entire TSF No. 7 will be mined to create capacity for the new planned deposition of retreated TSF material.
The final mining phase involves taking a second cut from TSF No. 6 (Phase 3), depleting the remainder of this TSF. The planned mining areas and grade distribution of TSF No. 6 and TSF No. 7 is illustrated in Figure 21.
| |
| RESOURCE | RESERVE | VALUE |
Blyvoor Gold Operations (Pty) Ltd
S-K 1300 Technical Report Summary on the Blyvoor Tailings Retreatment Project, South Africa | 52 |
Figure 21: Blyvoor TSF No. 6 and TSF No. 7 Mining Areas and Grade Distribution
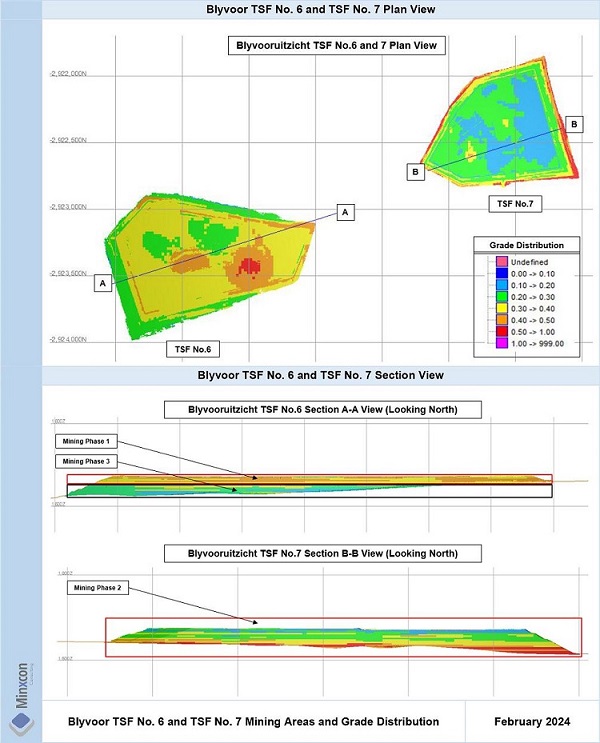
Item 13 (a) - Parameters Relevant to Mine Design
There are no geotechnical, hydrological or further parameters to those provided in Table 11 relevant to the mine design, as the TSFs represent surface, manmade deposits.
| |
| RESOURCE | RESERVE | VALUE |
Blyvoor Gold Operations (Pty) Ltd
S-K 1300 Technical Report Summary on the Blyvoor Tailings Retreatment Project, South Africa | 53 |
Item 13 (b) - Production Rates, Expected Mine Life, Mining Unit Dimensions, and Mining Dilution
| I. | Life of Project Production Schedule (Measured and Indicated Mineral Resources) |
A ramp up to 500 ktpm steady state production is planned over a 12-month period. A life of project of 15 years is anticipated. The diluted tonnes delivered to the plant is illustrated in Figure 22. The diluted content delivered to the plant is illustrated in Figure 23. Only Measured and Indicated Mineral Resources have been included in the LoM plan. A total of 816 koz is contained in the LoM plan.
Figure 22: Diluted Tonnes Delivered to Plant
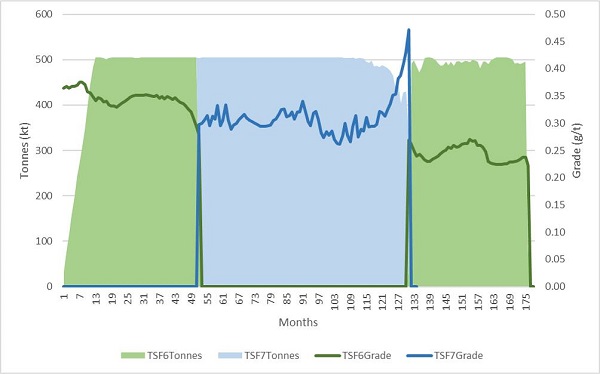
| |
| RESOURCE | RESERVE | VALUE |
Blyvoor Gold Operations (Pty) Ltd
S-K 1300 Technical Report Summary on the Blyvoor Tailings Retreatment Project, South Africa | 54 |
Figure 23: Diluted Content Delivered to Plant
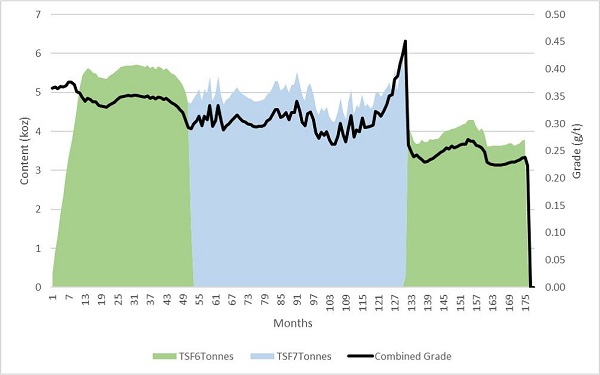
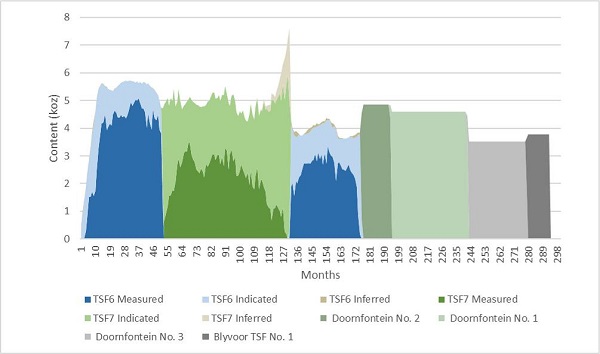
Item 13 (c) - Requirements for Stripping, Underground Development and Backfilling
The Project targets the remining of manmade TSFs. No stripping, underground development or backfilling are required.
| |
| RESOURCE | RESERVE | VALUE |
Blyvoor Gold Operations (Pty) Ltd
S-K 1300 Technical Report Summary on the Blyvoor Tailings Retreatment Project, South Africa | 55 |
Item 13 (d) - Required Mining Fleet, Machinery and Personnel
| I. | Mining Fleet and Machinery |
The required equipment associated with the hydro mining of the TSFs will be provided by the selected mining contractor. The primary mining equipment will consist of water monitors, high pressure water system and slurry transfer system.
Ancillary mining equipment will be provided by the mining contractor as required. The ancillary mining equipment will consist of excavators, front end loaders, tractor loader backhoe (“TLB”) and utility vehicles.
Mining personnel requirements for the project will be determined by the mining contractor.
| |
| RESOURCE | RESERVE | VALUE |
Blyvoor Gold Operations (Pty) Ltd
S-K 1300 Technical Report Summary on the Blyvoor Tailings Retreatment Project, South Africa | 56 |
ITEM 14 - RECOVERY METHODS
Item 14 (a) - Flow Sheets and Process Recovery Methods
The well-tested and widely used CIL process was selected to recover the gold from the TSF material. This process will also incorporate an oxidation step before cyanidation to improve leaching kinetics and lower the cyanide consumption as indicated in the Maelgwyn tests. Other operations that treat similar surface stockpiles also use the CIL technology, but some of these operations incorporate a grinding step prior to pre-oxidation and leaching. The material from TSF No. 6 is expected to be similar to that of TSF No. 7, which has been subjected to particle size distribution verification. The result showed a sufficiently fine size distribution. Thus, the grade does not warrant an additional and expensive re-grinding operation. The plant will consist of the circuits illustrated in Figure 24.
Figure 24: Block Flow Diagram of the Tailings Reclaim and Treatment Process
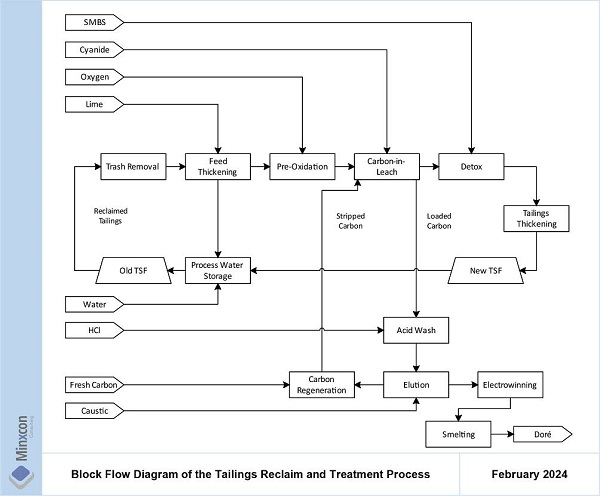
The process will involve washing the old tailings material from the TSFs and pumping it to a treatment plant. The slurry will be thickened and processed through the CIL route with a pre-oxidation step and a cyanide destruction step after leaching to detoxify the new tailings material. Gold adsorbed on activated carbon in the CIL stages will be stripped in an elution stage, and the eluted gold will be plated on steel cathodes in the electrowinning (EW) cells. The cathodes will be calcined, smelted, and cast into doré bars.
| |
| RESOURCE | RESERVE | VALUE |
Blyvoor Gold Operations (Pty) Ltd
S-K 1300 Technical Report Summary on the Blyvoor Tailings Retreatment Project, South Africa | 57 |
The hydro-mining will produce a slurry of all the material on the TSF including vegetation and other waste. Larger trash material will be removed at the hydro-mining site next to the TSF and slurry will be pumped to the process plant. Another stage of trash removal will be located at the process plant to remove the finer trash and would also catch coarse carbon granules.
Screening tailings will be thickened from a density of 1.21 t/m3 to 1.45 t/m3 with the recovered water being recycled back to the mining operation. Lime will also be added to the thickener to ensure the correct pH before leaching. The thickened tailings will be subjected to an oxygen assisted oxidation step through high shear reactors of the Aachen-type. From the oxidation tanks, the slurry will overflow into the leach train where cyanide is added. The leach train will consist of eight leach tanks where tailings slurry will flow from the first tank to the last, and activated carbon will flow counter-current to the slurry from the last tank to the first. Barren, carbon free slurry will be mixed with sodium metabisulphite (SMBS) to lower the residual free cyanide concentration before it is sent to the new TSF.
Loaded carbon will be removed from the first tank of the leach train and washed with a dilute solution of hydrochloric acid (HCl) to remove contaminants that could interfere the subsequent elution step. Acid washed carbon will be sent to an elution step where the adsorbed gold was stripped at high temperature in a sodium hydroxide (Caustic Soda) solution. The gold solution from the elution step will be passed through an electrowinning cell where the dissolved gold is plated on steel wool cathodes. The cathodes will be heated in a calcine where the iron and other less noble metals are oxidized and then the mixture will be smelted into doré bars and slag.
Stripped carbon from the elution step will be passed through a regeneration kiln to remove any organic contaminants and maintain its activity for gold adsorption. Fresh carbon will be added here, and the resulting stream will be screened to remove carbon fines.
There is a fully equipped assay laboratory which is located adjacent to the plant. The mine laboratory services are provided on a service contract by Super Laboratory Services and is not accredited, however plans indicate that accreditation is in progress, as it does have the necessary equipment required to prepare and analyse mine and plant samples. The sample preparation areas are demarcated for low grade and high-grade areas, especially where cross-contamination is a risk.
Good housekeeping standards are applied in the sample crushing and preparation and fire assay areas. As part of its external verification process the mine laboratory does not send samples away. However, to test their precision and accuracy, the laboratory makes use of standard reference material which it sources from AMIS from South Africa. The laboratory has acquired and installed an electronic tracking system. This facilitates implementation of a Laboratory Information Management system (LIMS) that reduces human error.
Item 14 (b) - Plant Design, Equipment Characteristics and Specifications
The process plant is designed to treat 500 ktpm through two identical 250 ktpm circuits. The acid wash, elution, EW, smelting and carbon regeneration sections are common to both circuits. New tailings will be deposited onto a new TSF facility that will be built adjacent to the process plant. The new TSF footprint will initially cover an old golf course, and it will later expand over the footprint of TSF No. 7.
A new TSF was designed by Tailex Management Services (Tailex); this is further described in Item 15 (b). The basin and walls of the new TSF will be lined with a geomembrane liner (liner) as per applicable regulations and standards. Drains will be installed on top of the liner and a seepage detection system underneath the membrane. Cyclones will be used to separate the coarse and fines fractions of the tailings, and the fines will be deposited in the basin while the coarse material will be used to raise the walls of the TSF in an upstream fashion.
| |
| RESOURCE | RESERVE | VALUE |
Blyvoor Gold Operations (Pty) Ltd
S-K 1300 Technical Report Summary on the Blyvoor Tailings Retreatment Project, South Africa | 58 |
The mining of TSF No. 6 will allow its footprint to be used to deposit tailings again.
The process plant will be constructed next to the old process plant. Some of the equipment will be located at the mining operation next to the old TSFs, such as the sump pumps and trash screens. The plant layout is planned around two identical leach trains starting with the trash screens and thickeners, followed by the conditioning tanks, CIL tanks and detox tank. Shared infrastructure house in the centre of these two trains are the tower crane CIL office (Control Room) and Motor Control Centre (MCC). Reagent receipt and storage is to the side to allow easy access for trucks.
Item 14 (c) - Energy, Water and Process Materials Requirements
The operation of the plant is expected to be done by the Project owner, while mining and security will be outsourced. The plant manager will be the contract manager for these two business partners. Production and Maintenance will report to a Plant Superintendent and a Maintenance Engineer, while the Finance and HR functions will report directly to the Plant Manager.
| II. | Reagents and Consumables |
The reagent and consumable consumptions are shown in Table 14. The forecasted consumptions are not expected to change significantly. Some of the higher consumptions of reagents was due to the high retention times of approximately 72 hours in the CIL circuit. This mainly affects carbon consumption due to the long exposure to agitation and abrasion in the CIL tanks, as well as cyanide consumption. Major reagents will be delivered to site through existing road infrastructure and stored on-site. Sodium cyanide (cyanide) will be delivered to site in liquid form with bulk tankers. The tankers will be offloaded into appropriate storage vessels. Lime will be supplied in bulk tankers and stored in a silo before being mixed with water before addition into the process. Oxygen will be delivered to site as liquid oxygen and the storage vessel will be provided and maintained by the supplier. SMBS will be delivered in bagged before being added to a mixing vessel. Water requirement must be sufficient to produce a slurry at 48% solid content. At 500 ktpm RoM, the water volume required is 715,000 m3 per month for processing.
Table 14: Summary of Reagent Consumption
| Item | Unit | Average Consumption Rate |
| CIL Reagents | | |
| Lime | kg/t | 0.35 |
| Flocculant | kg/t | 0.025 |
| Carbon | kg/t | 0.042 |
| Sodium Cyanide | kg/t | 0.422 |
| Hydrochloric Acid | kg/t | 0.140 |
| Elution Consumables | | |
| Steel Wool | kg/t Carbon | 0.244 |
| Caustic Soda | kg/t | 0.166 |
Electricity will be sourced from Eskom through its existing transmission infrastructure. The installed electrical capacity was calculated for the equipment list with the rated power for each, and total 6,851 kW. The expected load for each type of equipment is between 75% and 90% of the installed capacity. Total expected load is 5,265 kW. Water for the process plant will be drawn from neighbouring underground workings.
| |
| RESOURCE | RESERVE | VALUE |
Blyvoor Gold Operations (Pty) Ltd
S-K 1300 Technical Report Summary on the Blyvoor Tailings Retreatment Project, South Africa | 59 |
ITEM 15 - PROJECT INFRASTRUCTURE
Item 15 (a) - Available Infrastructure
The Project and specifically the associated process plant, mining and supporting infrastructure will be located on the footprint of the old Blyvoor process plant. The plant has been demolished with only some old derelict civil structures remaining. Supporting infrastructure in the area is well established and in a reasonable state of repair. Minimal to no work will be required to recommission some of the decommissioned infrastructure.
Available infrastructure of the project area consists of the following:-
| ● | service roads around TSF No. 6 and TSF No. 7; |
| ● | municipal water supply (For use as potable water) in close proximity to Project; |
| ● | old Blyvoor process plant area (disturbed footprint – mostly old unusable civil structures); |
| ● | dirty water catchment trenches at old Blyvoor process plant; |
| ● | Eskom consumer substation in close proximity to Project Area; and |
| ● | 22 kV overhead power supply lines running past Project Area. |
The old Blyvoor process plant was well equipped with infrastructure and services. These however fell into disrepair once the operation was closed and most of the on-site infrastructure and services were dismantled or demolished.
As the areas are already disturbed, the old Blyvoor process plant area will be utilised to establish the new tailings retreatment plant and supporting infrastructure and services to the Project.
Item 15 (b) - Required Infrastructure
Power Supply
Grid power supply to the Project will be sourced from a 22 kV line that runs past the old Blyvoor process plant area. This line previously supplied the old Blyvoor plant. The OHL feeds from an Eskom consumer substation located 2.7 km east of the Project process plant. All onsite power supply infrastructure has been decommissioned and reclaimed. It is thus required to completely re-establish power to the Project. Provision has been made for the construction of a new 22 kV OHL that will tie into the existing OHL that runs past the Project Area. The new OHL will feed the Project intake yard where provision has been made for the installation of a 15 MVA 22 kV / 11 kV transformer. This transformer will in turn feed the Project’s 11 kV distribution substation. The Project distribution substation will feed the following areas:-
| ● | transformers supplying the office, admin area, workshops, stores, changing facilities and other amenities; |
| ● | tailings reclamation equipment (Hydro Mining equipment) at both TSF No. 6 and TSF No. 7; |
| ● | service water supply pumpstation located at the Blyvooruitzicht No. 4 Shaft dewatering line; |
| ● | hydro mining service water supply system; and |
| ● | various water management pump stations (TSF return water dam, pollution control dam). |
The Project onsite power distribution system layout is illustrated in Figure 25.
| |
| RESOURCE | RESERVE | VALUE |
Blyvoor Gold Operations (Pty) Ltd
S-K 1300 Technical Report Summary on the Blyvoor Tailings Retreatment Project, South Africa | 60 |
Figure 25: Project Onsite Power Distribution System
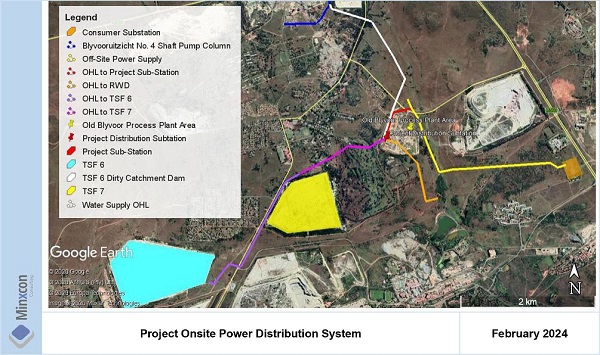
A load list was drafted for the Project to estimate both the power supply capacity / notified maximum demand (“NMD”) for the Project as well as the power consumption of the Project. The NMD for the Project is estimated to be 8.4 MVA at steady state production. The available capacity is indicated to be 20 MVA and is thus more than sufficient for the project. Power consumption is estimated to be 3.3 MWh per month for the Project.
Water Supply
Water supply will mainly be sourced from CWC that is conducting dewatering of the old Blyvooruitzicht underground workings at a rate of 15,000 m³/day. Further available sources will include dirty run-off rainwater that will be collected as part of surface water management activities and existing unequipped boreholes on the Project Area.
Water supply and management infrastructure provided for includes:-
| ● | Water supply pump and piping system drawing from the CWC pump column; |
| | | |
| ● | Project reservoir; |
| | | |
| ● | Process make-up water pond; |
| | | |
| ● | Project pollution control dam (“PCD”) and associated pumping and piping system; |
| | | |
| ● | New TSF return water dam (“RWD”) and associated pumping and piping system; |
| | | |
| ● | Low pressure water supply pumping and piping system for hydro-mining; and |
| | | |
| ● | High pressure pumping system required for mining as well as the slurry pumping system feeding the process plant - provided for and included in the mining contractor costs. |
The bulk of the Project service and process make-up water will be drawn from the CWC pump column located 2.3 km northwest of the Project Area. Water will be supplied to the Project reservoir located adjacent to the process plant and administrative area. From here water will be distributed to the process plant make-up water pond, hydro-mining operations and a potable water treatment plant that will feed the
| |
| RESOURCE | RESERVE | VALUE |
Blyvoor Gold Operations (Pty) Ltd
S-K 1300 Technical Report Summary on the Blyvoor Tailings Retreatment Project, South Africa | 61 |
Project Area. Further provisions include lined dirty run-off water collection trenches that will feed the Project pollution control dam from where water will be pumped to the process plant for use as process make-up and mining service water. Lined clean run-off diversion trenches have also been provided to divert clean run-off water away from the potentially contaminated Project water.
Surface Facilities
All facilities that formed part of the old Blyvoor process plant has been demolished. Provision has thus been made for all supporting facilities required for the efficient management and operation of the Project. facilities provided include:-
| ● | mobile prefabricated administrative office space; |
| ● | changing facilities and laundry; |
| ● | potable water treatment plant; |
| ● | fuel storage and refuelling facility |
| ● | power supply and distribution infrastructure; |
| ● | water supply, distribution and management infrastructure; |
| ● | upgraded project access and service roads; |
| ● | security fencing for the general project areas; |
| ● | communications and information technology equipment and infrastructure; |
| ● | high security fencing for the process plant; and |
| ● | access control facilities. |
New Tailings Storage Facility
A new TSF, designed to concept level by Tailex, would be built in four phases starting next to the Project process plant and expanding toward the existing TSF No. 7 footprint. This design makes provision for a storage capacity of 70 Mt of tailings material, which would not be enough for all the material from TSF No. 6 and TSF No. 7 which amounts to 85 Mt. In order to completely mine both TSF No. 6 and TSF No. 7 it would be required to increase the TSF capacity. The design was adjusted with a modified / larger starter wall, modified and larger footprint as well as greater height of the new TSF. A geotechnical study was also commissioned to investigate the potential risk that dolomites might pose to the new TSF as the area is known to be dolomitic in nature.
The footprint of the new TSF was modified to both avoid areas where dolomites are particularly shallow and ensure sufficient distance from residential properties. The footprint was also expanded to include the entire current footprint of TSF No. 7, where the previous design did not include the entire TSF No. 7 footprint. These modifications produced a similar footprint area of 215 ha compared to the concept design. The starter wall of the concept design had a height of 15 m. This has been increased to 20 m to accommodate a higher rate of raise, as the concept design assumed a production rate of 250 ktpm, and the current plan requires 500 ktpm. The final height of 60 m has also been increased to 65 m to give a storage capacity of 85 Mt that would be sufficient for the planned LoM production.
| |
| RESOURCE | RESERVE | VALUE |
Blyvoor Gold Operations (Pty) Ltd
S-K 1300 Technical Report Summary on the Blyvoor Tailings Retreatment Project, South Africa | 62 |
As per the concept design the new TSF will be constructed in four phases. The first phase (red polygon) would entail the construction of a starter wall with an outer slope of 1:3 and an inner slope of 1:2. The phases of the new TSFs are illustrated in Figure 26.
Figure 26: New TSF Footprints
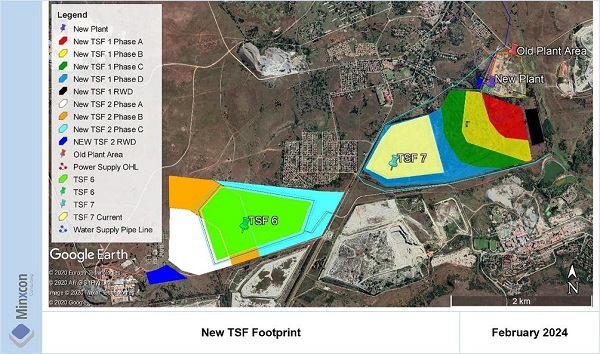
The crest will be 4 m wide and will be sufficiently compacted to have a suitable density and shear strength. The starter wall will also have an anchor key at its base to ensure sufficient stability of the starter wall.
The available geotechnical information does indicate that there may be a possibility that seepage could occur through the foundation soils and underlying rock. There is no clay covering the site and the in situ soils may produce a limited amount of seepage into subsoils. For this reason, it will be necessary to consider the installation of a geomembrane liner on the base of the storage area. Further investigation and studies of the in situ soils must be planned at detailed design stage to finalise the liner requirement to accord with accepted standards and a permeability target of 10 -9 m/s.
The following is presumed to be an acceptable barrier system for the site and nature of operations:- stripping of all topsoil across footprint;
| ● | removal of material required for starter wall embankment; |
| ● | clear and grub entire footprint; |
| ● | rip and compact in situ soils to smooth finish; |
| ● | installation of suitable geofabric as protection layer; |
| ● | installation of 2 mm good quality smooth HDPE geomembrane to floor of TSF; |
| ● | installation of 2 mm good quality double sided textured/ribbed HDPE geomembrane to walls and underflow wall sections; and |
| ● | increased density of drainage system both beneath and above liner. |
The basin and walls of the new TSF will be lined. with Class C type lining system as per SANS 10286. Drains will be installed on top of the liner and a seepage detection system underneath the membrane. Cyclones
| |
| RESOURCE | RESERVE | VALUE |
Blyvoor Gold Operations (Pty) Ltd
S-K 1300 Technical Report Summary on the Blyvoor Tailings Retreatment Project, South Africa | 63 |
will be used to separate the coarse and fines fractions of the tailings, and the fines will be deposited in the basin while the coarse material will be used to raise the walls of the TSF in an upstream fashion.
Phases 2 to 4 (yellow, green, and blue) will see further expansion of the TSF using cyclone underflow tailings in the walls and cyclone overflow material in the basin. Raises of 3 m will be done and a berm with a width of 5 m every 15 m. The facility will have a factor of safety of 1.5 at its final height of 65 m.
| |
| RESOURCE | RESERVE | VALUE |
Blyvoor Gold Operations (Pty) Ltd
S-K 1300 Technical Report Summary on the Blyvoor Tailings Retreatment Project, South Africa | 64 |
ITEM 16 - MARKET STUDIES
Item 16 (a) - Commodity Market Assessment
The following sections provide an overview of the gold market. The QPs have reviewed these studies and analyses and are satisfied that the results support the assumptions in the TRS.
The following gold market conditions for the year 2023 have been identified by the World Gold Council, as extracted from their Gold Demand Trends report and other World Gold Council data.
| ● | Gold demand (excluding over-the-counter transactions (“OTC”)) decreased 5% year-on-year (“y-o-y”) to 4,448 t, on a par with recent Pre-Covid years. Q4 2024 demand was 1,150 t, a drop of 12% y-o-y compared to the record demand of 1,337 t in Q4 2023. |
| | | |
| ● | Total annual gold supply increased by 3% y-o-y to 4,898 t, supported by improved mine production that saw a five-year high, but remaining below the record 2018, and high levels of recycling driven by high gold prices. |
| | | |
| ● | The gold price averaged USD1,941/oz in 2023, rising substantially form the average of USD1,825/oz in 2022. The year closed 2023 at a record-high year-end gold price of USD2078/oz. |
| | | |
| ● | The average global All-In Sustaining Costs (“AISC”) rose to USD1,343/oz in Q3 2023, an increase of 3% quarter-on-quarter (“q-o-q”) and 5% increase y-o-y. |
| I. | World Gold Deposits and Reserves |
The global minable gold reserves are dominated by Australia, Russia and South Africa due to the higher-grade deposits found in these regions, with averages generally well above the global average of approximately 1.0 g/t. Africa continues to be home to some of the highest grade (and highest risk) projects in the world. The average grade differs significantly (33%) between producing and undeveloped deposits. This has important implications on future gold production, and at a gold price reaching low levels, many of these projects will simply not be economically feasible. Gold reserves globally total some 1,835 Billion oz Au (USGS, 2024).
| II. | Gold Supply and Demand Fundamentals |
Gold supply increased in 2023, with marginally increased mine production and significant increase in recycling:-
| ● | Mine Production: Global mine production improved for a third consecutive year with a marginal increase of approximately 1% to 3,644 t in 2023 (World Gold Council, 2024). Of this, China, Russia and Australia each contributed 10-12% (USGS, 2024). Canada and the United States are the fifth and sixth largest producers. Kazakhstan and South Africa notably ramped up output through the year, both with an increase of approximately 12%-13%. South Africa overtook Ghana as the largest producer in Africa. |
| | | |
| ● | Net Producer Hedging: According to the World Gold Council (2024), the global hedge book increased 17 t over 2023 ending at 190 t. Industry sentiments towards hedging have adjusted over the past two decades, with new hedging positions mainly either made opportunistically in the short-term, and small in size, or from companies with project or debt finance requirements. The high spot price environment of 2023 combined with the attractive forward premiums for gold due to high interest rate environment has incentivised forward selling of gold. |
| | | |
| ● | Recycling: Each quarter saw a y-o-y increase in recycling. Recycled gold supply in 2023 increased by 9% y-o-y to 1,237 t, remaining still 30% below the 2009 all-time high, despite a record annual average gold price in 2023. Distress selling of old jewellery is far less than in 2009 and there has not been sufficient build-up of old, unwanted or broken jewellery by consumers since the previous all- |
| |
| RESOURCE | RESERVE | VALUE |
Blyvoor Gold Operations (Pty) Ltd
S-K 1300 Technical Report Summary on the Blyvoor Tailings Retreatment Project, South Africa | 65 |
time high price cycle and the flushing out of this jewellery in previous high recycling cycles (World Gold Council, 2024).
The 2023 gold demand contracted by 5% after a stellar year for demand in 2022, with demand of 4,448 t excluding OTC and 4,899 t including OTC and stock flows. This was driven by another year of strong central bank purchases, boosted by slower ETF outflows, as described by the World Gold Council (2024). The World Gold Council highlights the following for the year 2023 across the demand sectors:-
| ● | Investment: In 2023, investment demand (excluding OTC) decreased 10% to a 10-year low of 945 t. The investment demand picture changes when including OTC and “other” demand, which added 450 t in demand, notably from Turkey. Exchange traded fund (“ETF”) holdings fell by a 244 t (versus 110 t in 2022). Gold bars and coins demand contracted by 3% to 1,189 t. |
| ● | Technology: Hampered demand for consumer electronics in response to deteriorating global economic conditions drove down gold demand for technological applicationswith a full-year decline of 4% below 300 t for the first time in decades. Q4 saw some promising recovery in demand with a 12% increase y-o-y after three consecutive quarters of decreased demand. |
| ● | Jewellery: Jewellery consumption remained steady increasing very marginally to 2,093 t despite record gold prices. China was the primary driver of growth, with an increase in jewellery demand of 17% y-o-y. |
| ● | Central Banks: Gold is politically independent and bears no credit risk. Some central banks have been pursuing an overt policy of de-dollarisation. Gold is a safe haven as the international monetary system shifting towards multipolarity, thus will continue to be an important reserve asset for central banks. Annual buying in the sector exceeded 1,000t for a second consecutive year in 2023 with demand of 1,037 t. The People’s Bank of China was the largest single gold buyer in 2023 followed by the National Bank of Poland. The National Bank of Kazakhstan and the Central Bank of Uzbekistan were the two largest sellers of gold. The net purchases by central banks far outweighed the sales. |
The average annual gold price in 2023 was USD1,941/oz up from USD1,800/oz in 2022, which is a new average record (World Gold Council, 2024). The appeal of gold is undermined by increased bond yields for institutional and retail investors as a secure hedging asset as the opportunity cost of holding gold is increased. According to the Australian Office of the Chief Economist (2023), the inverse relationship between real bond yields and gold prices has weakened notably since the invasion of Ukraine by Russia. Prices have risen owing to increased safe-haven demand, which has persisted as price driver offsetting the effect of increased interest rates.
Price support in 2023 has come from increased purchases by central banks, economic uncertainty and geopolitical risk. The conflict between Israel and Hamas has driven price increases to levels exceeding USD2,000/oz in October 2023. Falling US treasury yields and a weakening US dollar also provided price support for gold.
Consensus opinion has the real gold price reducing over the short to medium term (Table 15).
Table 15: Gold Price Forecast (Nominal Terms)
| | Unit | 2024 | 2025 | 2026 |
| Gold | USD/oz | 2,086 | 2,089 | 1,975 |
Source: Consensus (March 2024)
| |
| RESOURCE | RESERVE | VALUE |
Blyvoor Gold Operations (Pty) Ltd
S-K 1300 Technical Report Summary on the Blyvoor Tailings Retreatment Project, South Africa | 66 |
According to the Australian Office of the Chief Economist (2023), prices are expected to decrease throughout 2024, should US economic activity slow, but avoid recession. Official sector buying is expected to continue into 2024 at strong levels due to continued geopolitical risk driving safe-haven demand. If US and global economic activity declines significantly and interest rate cuts are implemented, stronger support can be expected for the gold price through lower interest rates, weaker US dollar and increased ETF demand. It should be noted the US Fed is not currently expected to cut interest rates.
Gold supply is forecast by the Australian Office of the Chief Economist (2023) to stabilise above 4,800 t per year into 2025. Increases in mine production is forecast to be offset by decreases in gold recycling. Mine production is forecast to increase by an average of 1.4% by 2025 to approximately 3,780 t of gold with new operations coming online from the likes of Canada, the US, Chile and Brazil. Chinese production is forecast to decrease over the same period due to continued implementation of environmental regulations and industry consolidation. Recycling is forecast to decrease on average by 5.4% per year by 2025, partially offsetting the increase in supply from mining operations.In the short term, gold prices are forecast to remain at elevated levels exceeding USD2,000/oz with. Consensus forecast has the 2024 average gold price of USD2,086/oz stay relatively unchanged at USD2,089/oz for 2025, before falling to USD1,975/oz in 2026. According to Consensus Economics (2024), the perceived safe-haven status of gold remains attractive in the current volatile global climate. The climate remains uncertain in regions with geo-political tension, such as the Middle East and Eastern Europe. In addition, the US elections may result in a shift in US economic policy.
Item 16 (b) - Contracts
Rand Refinery, who is contracted to refine the gold doré produced at the Blyvoor Mine, is the largest gold refinery in the world and has historically refined 95% to 99% of all gold produced in South Africa. Rand Refinery will also refine gold from the Blyvoor TSF retreatment operations. The payability depends on the quality of gold doré delivered, ranging from 99.9% for gold doré containing 90% or more gold content to 95% for gold doré containing 30% or less. Minxcon applied a payability of 99.5%.
| |
| RESOURCE | RESERVE | VALUE |
Blyvoor Gold Operations (Pty) Ltd
S-K 1300 Technical Report Summary on the Blyvoor Tailings Retreatment Project, South Africa | 67 |
ITEM 17 - ENVIRONMENTAL STUDIES, PERMITTING AND PLANS, NEGOTIATIONS, OR AGREEMENTS WITH LOCAL INDIVIDUALS OR GROUPS
Item 17 (a) - Relevant Environmental Issues and Results of Studies Done
Prior to mining activities, the land was utilised mainly for grazing. Several protected plant species occur on site, which will require protection during construction and operational phases. Many invader species are present. Local fauna mainly comprises small terrestrial animals such as hedgehogs, tortoises, hares and reptiles, in addition to a variety of bird species. Although no threatened species occur locally, endangered animals in the area include the aardvark, aardwolf and civet.
As identified by the geotechnical study, areas of the surface are underlain by dolomite, which regionally have been subjected to various types of surface instability as a result of the historical dewatering of compartments and poor water management. The current TSFs are not lined, and it is planned that future TSFs expressions will be lined with appropriate liners in terms of GNR636 to prevent seepage of water and potential contaminants into underlying strata.
An Environmental Management Programme was completed by Digby Wells Environmental (“Digby Wells”) in February 2019 on behalf of by Blyvoor Capital This was in support of an EA application for tailings reclamation (TSF No. 6 and TSF No. 7) and underground mining at Blyvoor Gold Mine. The EA was granted in February 2020. Impacts relating to the following activities were reviewed relating to the tailings reclamation project:-
| ● | No impacts were identified for the refurbishment phase. |
| | | |
| ● | Operational phase:- |
| ○ | TSF re-mining (Blyvoor TSF No. 1, 6 and 7, and Doornfontein TSFs No. 1, 2 and 3); |
| | | |
| | ○ | short-term tailings deposition onto TSF No. 6; |
| | | |
| ○ | long-term deposition onto new TSF (a new TSF will need to be designed, sited and appropriately permitted, for which an Environmental Impact Assessment will be triggered). |
| | | |
| ○ | operation of the metallurgical plant; |
| | | |
| | ○ | mine water management; and |
| | | |
| ○ | TSF No. 1 and Doornfontein TSFs No. 1, 2 and 3 care and maintenance (will be held in care and maintenance for a number of years prior to being remined). |
| ○ | final rehabilitation of infrastructure and reclaimed TSF footprints; and |
| | | |
| ○ | groundwater risk mitigation. |
Golder identified the following positive impacts:-
| ● | The six TSFs form prominent features in the local topography. Re-mining will leave a cleared footprint largely at natural ground level, resulting in positive impacts on topography and visual aspects. |
| ● | TSF re-mining will remove groundwater contamination sources and should contribute to overall groundwater and surface water quality improvement. |
| ● | Local communities are likely to experience benefits from community development initiatives, |
| ● | During decommissioning, some of the shaft and TSF infrastructure will be removed/rehabilitated as far as practically possible resulting in a positive impact on the site’s overall topography and visual aspects during the final project phases. |
The following potentially significant impacts were identified:-
| |
| RESOURCE | RESERVE | VALUE |
Blyvoor Gold Operations (Pty) Ltd
S-K 1300 Technical Report Summary on the Blyvoor Tailings Retreatment Project, South Africa | 68 |
| ● | Failure to actively manage and regularly inspect the TSFs to ensure that they remain competent, could result in erosion related impacts on surface water. |
| ● | Saline seepage through the base of the TSFs has the potential to create localised contamination of the underlying soils which, over time, may migrate into groundwater resources at a local level. |
| ● | Reasonable measures must be taken in new TSF development to limit seepage through the base of the TSF to avoid unnecessary future groundwater contamination. |
| ● | Short-term dust impacts will result during the recovery process. |
Mitigation measures to be implemented were identified as follows:-
| ● | Capture, contain, treat and recycle all contaminated water arising from TSF reclamation and processing operations on site and to prevent the discharge of contaminated water to the environment. |
| ● | Maintain the groundwater levels in the basin at an environmentally safe level, to prevent any contamination of water from mine workings with the upper dolomitic aquifer. |
| ● | Limit exacerbating saline seepage through the base of the TSFs. |
| ● | Ensure structural stability at the tailings deposition site (TSF No. 6) to prevent any safety risk to neighbouring communities. |
| ● | Maximise dust control of off the TSF surfaces to ensure that applicable standards for dust fall rates are not exceeded. |
| ● | Site, design, construct and operate any future infrastructure in accordance with the latest requirements of environmental legislation. |
| ● | Ensure minimal visual and noise disturbances on neighbouring communities. |
Golder further identified measures to ensure TSF stability as well as mitigate saline seepage.
Blyvoor Ops currently does not subscribe to any ESG standards or guidelines. Preparatory work on site complies with current mine, health and safety standards. The Company aims to adopt policies and procedures in line with similar tailings reclamation projects and standards equivalent to those recommended by the Chamber of Mines.
There are no environmental factors that could materially impact the likelihood of eventual economic extraction.
Item 17 (b) - Waste Disposal, Site Monitoring and Water Management
General domestic waste will be collected in bins and skips on site and transported to the Merafong Municipal landfill site. Hazardous waste including used oil and grease will be temporarily stored in a central collection point (in a bunded area). The waste will then be removed by a reputable company for recycling disposal.
Scrap metal will be sent to the salvage yard to be removed by an approved scrap dealer for recycling.
A wastewater treatment plant is operational to treat sewerage for the immediately adjacent Blyvoor Mine. The tailings project will utilise this system. The plant is located at PS Shaft and uses the activated sludge process and is designed to handle 1 Ml/day. Treated effluent is discharged to the Wonderfonteinspruit or used for irrigation of vegetated areas on the current TSFs.
| |
| RESOURCE | RESERVE | VALUE |
Blyvoor Gold Operations (Pty) Ltd
S-K 1300 Technical Report Summary on the Blyvoor Tailings Retreatment Project, South Africa | 69 |
Surface and groundwater monitoring programmes will be required, for which the responsibility will be assumed by the Blyvoor Mine. Currently, this is the responsibility of CWC (Harmony), who are performing the dewatering activities at the adjacent Blyvoor underground mine.
A dust monitoring programme must be implemented for the reclamation project. Currently, the adjacent Blyvoor underground mine conducts dust monitoring based on the American Society of Testing and Materials standard method for collection and analysis of dust fall (ASTM D1739), with modifications. SANS 1929:2005 is used to evaluate the level of dust deposition.
The area is prone to sinkhole formation. In the period between 2009 and 2012, some ten sinkholes had formed in the immediate vicinity. A subsidence monitoring programme at the site is planned by the Blyvoor Mine.
A radioactivity monitoring programme was implemented in 2020 by the Blyvoor underground mine.
Water management systems including stormwater management are required. Item 15 (b) expands on further requirements that have been considered.
The Project lies within the catchment of a tributary of the Mooi River, or Western Deep Spruit. A river diversion structure was constructed just inside the mine property mainly to take static and low flow water away from the dolomite areas downstream. The design ensures that a moderate and more constant flow of water is made available to the downstream environment. The low flows are diverted, and this results in water being available for other users downstream. The low flows would disappear into the dolomites should the diversion structure not be in place. Diverted water is discharged into the same canal that takes the stormwater from the residential and office areas.
Item 17 (c) - Permit Requirements
Permit requirements for the Project are detailed in Item 3 (f).
Item 17 (d) - Social and Community-Related Requirements
In terms of the MPRDA, the holder of a mining right must promote social and economic development through targeted initiatives and projects. A social and labour plan (“SLP”) is required to be submitted and approved as part of the mining right application process and be updated every five years. As required in Section 3 of the MPRDA, public participation processes with interested and affected parties had been conducted during the mining right application processes. The SLP is held in association with the mining right and currently executed through Blyvoor Capital in synergy with the MR143GP is valid from 2022 to 2026. However, as the historic TSFs are not governed by the MPRDA, and SLP is not applicable to the tailings retreatment project. The QPs recommend that opinion should be sought regarding the social obligations relating to the “new dump” portion of TSF No. 6 that was deposited after promulgation of the MPRDA.
Blyvoor Ops will aim to preferentially source labour from the local community for employment at the proposed operations.
There are no known social or political issues that may have an impact on any aspect of the proposed operation.
| |
| RESOURCE | RESERVE | VALUE |
Blyvoor Gold Operations (Pty) Ltd
S-K 1300 Technical Report Summary on the Blyvoor Tailings Retreatment Project, South Africa | 70 |
Item 17 (e) - Mine Closure Plans and Costs
There is currently no planning for early or timeous mine closure for the Project. Mining companies are required to make financial provision for mining-related environmental rehabilitation. Upon closure, the mine area will need to be monitored and rehabilitated in accordance with approved environmental permits.
The TSF sites are currently not rehabilitated. For the first nine years of the operation, no ongoing rehabilitation is planned as TSF No. 6 and TSF No. 7 are reprocessed and a new TSF site established. Once depleted, it is planned to rehabilitate the TSF sites. As they currently are not rehabilitated to any degree, the later rehabilitation of the sites is envisaged to improve the environmental and aesthetic condition and impact of the TSFs.
Residual effects of salinisation and compaction will persist after removal of a TSF, processing plant or infrastructure, which may limit return of these areas to their pre-mining land capability and land use. Testing and remediation measures to decontaminate the site would need to be implemented, and it should be ensured that the site is free draining and appropriately vegetated to yield a self-sustaining plant cover.
During and after mine closure, the demolition of surface infrastructure and services will be confined to those that cannot be effectively utilised. Decommissioning of infrastructure and final site rehabilitation may generate noise and dust and will require active management.
Mine closure planning and execution will include detailed human resource planning, including retrenchment considerations, and the opportunity for re-training employees to enhance employment and livelihood prospects post mine closure. Staff numbers will gradually be reduced during the decommissioning and closure phase.
Although detailed closure planning has not been undertaken, costs are considered in the liabilities described in Item 3 (e).
Item 17 (f) - Adequacy of Current Plans
The Project relies on various licences and permissions held by the adjacent Blyvoor underground mine. While there is overlap between these two operations, including shared ownership. The QPs takes note that Blyvoor Ops will initially rely on the existing Blyvoor Capital rights and permits with respect to the Mining Right, the EA and WUL under a duly signed agreement for this purpose.
Item 17 (g) - Local Procurement and Hiring
The main priority of Blyvoor Ops with respect to procurement of goods and services is to procure such goods and services from within South Africa. The Company further emphasises the procurement of goods and services from local businesses. This approach recognises the importance of providing benefits to the local community by creating sustainable business opportunities with local enterprises, as well as the need to work with and build capacity of local suppliers in a way that enables them to become more competitive and profitable. Nonetheless, the cost, quality, and availability of goods and services are an important consideration when a procurement decision is being made. If goods or services are not available within South Africa or if there is a significant benefit to buying outside of South Africa, Blyvoor would buy elsewhere.
Blyvoor Ops preferentially recruits South African persons with the level of skill and experience required of the relevant position. In particular, the Company’s recruitment approach reflects the reality that local communities have expectations about participating in new job opportunities, particularly at the semi-skilled and unskilled levels.
| |
| RESOURCE | RESERVE | VALUE |
Blyvoor Gold Operations (Pty) Ltd
S-K 1300 Technical Report Summary on the Blyvoor Tailings Retreatment Project, South Africa | 71 |
ITEM 18 - Capital and Operating Costs
Item 18 (a) - Capital Costs
The Project capital cost estimation was completed by Minxcon to a PFS level of accuracy in December 2020. The capital costs were escalated to current terms as at effective date of 29 February 2024 using appropriate escalation indices from the Steel and Engineering Industries Federation of Southern Africa (“SEIFSA”) Price and Index Pages (“PIPS”). The costs reported in this report have been converted to USD from ZAR estimations at the appropriate exchange rate. The USD-term costs have reduced year-on-year as the exchange rate difference offset the increase in ZAR costs.
Mining and Infrastructure
Mining and shared infrastructure capital cost has been estimated based on the required infrastructure to successfully establish, manage and operation the project. Cost have been estimated to a PFS level of accuracy and are based on a combination of supplier quotations, benchmarked costs and escalated historical cost available. The capital cost estimation has been subdivided into the project work breakdown structure (“WBS”) areas. A summary of the mining and shared infrastructure capital is listed in Table 16.
Table 16: Mining and Shared Infrastructure Capital Cost Estimation Summary
| Item | Total Cost |
| USD ‘000 |
| Buildings | 387.58 |
| Civil | 1,966.66 |
| De-Bushing/Grubbing | 14.47 |
| Fleet | 189.75 |
| Instrumentation, IT & Comms | 117.95 |
| Mechanical | 253.07 |
| Offices and Buildings | 36.70 |
| Overheads | 1,688.04 |
| Power Supply and Distribution | 3,448.72 |
| Roads and Access | 561.30 |
| Security and Access Control | 363.94 |
| Site Preparations | 37.06 |
| Steel and Platework | 6.54 |
| Study Work and Detail Design | 94.61 |
| Tools and Equipment | 16.75 |
| Water Management | 162.92 |
| Water Supply | 7,272.82 |
| Workshops and Stores | 90.55 |
| EPCM | 656.28 |
| Total | 17,365.70 |
The main contributing items to the mining and shared infrastructure capital cost estimate include:-
| ● | Power supply and distribution infrastructure – re-establishing grid connection, establishment of intake and distribution substations and distribution of power across the project area; |
| | | |
| ● | Water supply and distribution infrastructure – water supply and distribution pump and piping systems and main water reservoir; |
| | | |
| ● | Water management Infrastructure – surface water management pumping and piping systems, project PCD and water catchment and diversion trenches; |
| | | |
| ● | Mining contractor equipment – hydro-mining high pressure pumping system and slurry delivery system; |
| | | |
| ● | Indirect CAPEX – Provision for the mining contractor’s site establishment, mobilisation and de-mobilisation and a provision for EPCM costs at 12% of total direct capital costs |
| |
| RESOURCE | RESERVE | VALUE |
Blyvoor Gold Operations (Pty) Ltd
S-K 1300 Technical Report Summary on the Blyvoor Tailings Retreatment Project, South Africa | 72 |
Processing
The installed equipment is the largest contributor to the process plant capital cost as shown Table 17. These costs were estimated from supplier quotes for all major equipment. EPCM was taken as 12.5% of the Direct Plant Costs. The first fill cost for reagents was calculated as the reagent cost for 1 month.
The TSF will be built in phases with the first and last phase being the most expensive. The first phase includes the starter wall and most of the lining and draining material. The final phase is the longest in duration and includes the bulk of the regular expansion and replacement items.
Table 17: Plant Capital Summary
Item | Total Cost |
| USD ‘000 |
| Equipment | 14,505 |
| Erection of items | 2,943 |
| Structural and Buildings | 3,484 |
| Civils | 3,920 |
| Piping and ducting | 5,187 |
| Electrical | 3,632 |
| Instruments | 2,907 |
| Plant Direct Sub-Total | 36,580 |
| EPCM | 4,389 |
| First Fill | 1,114 |
| Plant Sub total | 42,080 |
| Phase 1 | 10,332 |
| Phase 2 | 5,461 |
| Phase 3 | 6,651 |
| Phase 4 | 12,690 |
| TSF Sub total | 35,134 |
| Total Project | 77,214 |
Other Capital Expenditure and Capital Cost Summary
Other capital included for the Project are capitalised overheads for the construction year based on the corporate cost, as well as a budget for further study work prior to project execution. The other capitals are summarised in Table 18.
Table 18: Other Capital
| | Total Cost |
| Item | USD ‘000 |
| Capitalised Overheads | 0.57 |
| Study work | 1.05 |
| Other Capital Total | 1.62 |
A renewals and replacement or stay in business (“SIB”) capital cost was also included for the processing plant, but not for hydro mining as this would be the responsibility of the contractor. The cost is based on a percentage of the operating cost. The plant SIB is based on 5% of the plant operating cost and is similarly phased in starting in year 3 of operation. A 15% contingency was also applied to capital. Table 19 details the capital summary over the LoM.
| |
| RESOURCE | RESERVE | VALUE |
Blyvoor Gold Operations (Pty) Ltd
S-K 1300 Technical Report Summary on the Blyvoor Tailings Retreatment Project, South Africa | 73 |
Table 19: Capital Summary
| Capital Expenditure | Over LoM | LoM |
| Mining Capital | Unit | |
| Hydro Mining Infrastructure - TSF 7 (at 500ktpm) | USDm | 0.78 |
| Hydro Mining TSF 6 and Shared Infrastructure (Ramp up to 500ktpm in 12 months) | USDm | 16.58 |
| Total Direct Mining Capital | USDm | 17.37 |
| Mining Capital Contingency | USDm | 2.60 |
| Total Mining Capital | USDm | 19.97 |
| Plant Capital | | |
| Plant Direct Sub-Total | USDm | 36.58 |
| EPCM | USDm | 4.39 |
| First Fill | USDm | 1.11 |
| TSF - Phase 1 | USDm | 10.33 |
| TSF - Phase 2 | USDm | 5.46 |
| TSF - Phase 3 | USDm | 6.65 |
| TSF - Phase 4 | USDm | 12.69 |
| Total Direct Plant Capital | USDm | 77.21 |
| Stay in Business Plant Capital | USDm | 8.94 |
| Plant Capital Contingency | USDm | 15.82 |
| Total Plant Capital | USDm | 102.08 |
| Other Non-Direct Capital | | |
| Capitalised Overheads | USDm | 0.57 |
| Study work | USDm | 1.05 |
| Total Other Capital | USDm | 1.62 |
| Other Capital Contingency | USDm | 0.24 |
| Total Non-Direct Capital | USDm | 1.86 |
| Total Initial Capital | USDm | 96.31 |
| Total SIB Capital | USDm | 8.94 |
| Total Capital Contingencies | USDm | 18.67 |
| Total Capital | USDm | 123.92 |
Capital Expenditure Schedule
The capital schedule over the LoM is illustrated in Figure 27. The total capital including the sustaining capital and contingencies amounts to USD124 million over the LoM.
| |
| RESOURCE | RESERVE | VALUE |
Blyvoor Gold Operations (Pty) Ltd
S-K 1300 Technical Report Summary on the Blyvoor Tailings Retreatment Project, South Africa | 74 |
Figure 27: Capital Schedule
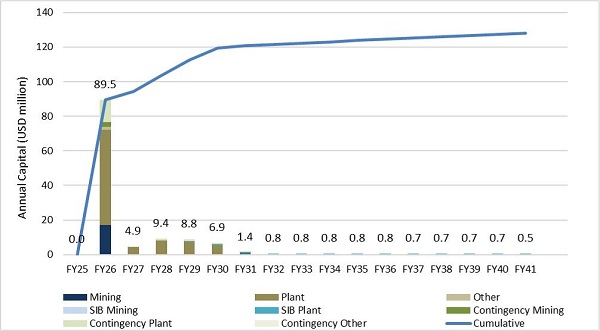
Item 18 (b) - Operating Cost
The Project operating cost estimation was completed by Minxcon to a PFS level of accuracy in December 2020. The operating costs were escalated to current terms as at effective date of 29 February 2024 using appropriate escalation indices from the Steel and Engineering Industries Federation of Southern Africa (“SEIFSA”) Price and Index Pages (“PIPS”).
| |
| RESOURCE | RESERVE | VALUE |
Blyvoor Gold Operations (Pty) Ltd
S-K 1300 Technical Report Summary on the Blyvoor Tailings Retreatment Project, South Africa | 75 |
Mining
Hydro mining of the Blyvoor TSF No. 6 and TSF No. 7 will be conducted by a mining contractor. The provision of the primary mining equipment, ancillary mining equipment, labour and consumables required for the project, will be the responsibility of the mining contractor.
The mining operating costs have been derived from contractor quotations for a 500 ktpm steady state operation. A mining operating cost comparison between the contractor rates obtained is detailed in Figure 28.
Mining Contractor 4 conducted a site visit at the planned project area and was selected as the preferred mining contractor. The costs were escalated to current terms as at effective date 29 February 2024. The escalated mining operating costs are detailed in Table 20.
Figure 28: Contractor Mining Operating Cost Comparison
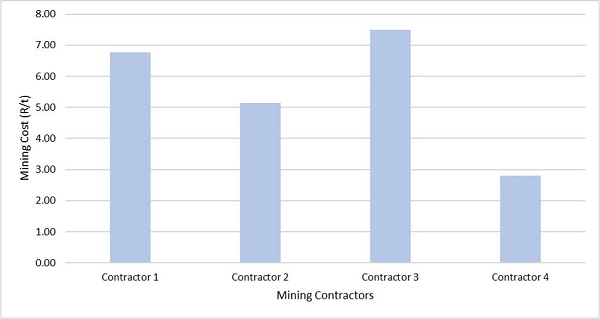
Table 20: Blyvoor TSF No. 6 and TSF No. 7 Contractor Mining Operating Cost
| Cost Element | Unit | Value |
| Labour | USD/t | 0.11 |
| Plant | USD/t | 0.01 |
| Material | USD/t | 0.02 |
| Fuel | USD/t | 0.01 |
| Contingency | % | 20 |
| Total | USD/t | 0.18 |
The contractor operating cost is inclusive of labour, maintenance and consumables required for the hydro mining of the TSF’s. A 20% contingency has been applied to the mining operating cost. The contingency has been applied to allow for a 15%-25% accuracy range in the provided contractor operating cost.
Processing
Processing cost was estimated from experimental data, design calculations, previous studies, and benchmarking. The total variable and fixed operating cost were respectively USD 2.98/t and USD 0.84/t to give a total operating cost of USD 3.82/t, as seen in Table 21.
| |
| RESOURCE | RESERVE | VALUE |
Blyvoor Gold Operations (Pty) Ltd
S-K 1300 Technical Report Summary on the Blyvoor Tailings Retreatment Project, South Africa | 76 |
Table 21: Summary of Operating Cost
Item | Cost |
| USD (‘000)/month | USD/t |
| Reagents | 932 | 1.86 |
| Water | 204 | 0.41 |
| Power | 354 | 0.71 |
| Variable Sub-total | 1,491 | 2.98 |
| Labour | 126 | 0.25 |
| Fixed Consumables | 52 | 0.10 |
| Equipment lease | 24 | 0.05 |
| Laboratory | 23 | 0.05 |
| Maintenance costs | 144 | 0.29 |
| Tailings deposition | 51 | 0.10 |
| Fixed Sub-total | 420 | 0.84 |
| Total | 1,911 | 3.82 |
The largest component of the operating cost is the costs of the reagents that are further broken down in Table 22. The cyanide consumption was calculated from the experimental results and then corrected for a minor loss of free cyanide that is inevitable in the final leach tank. The same experimental results were also used to estimate the lime consumption. The SMBS and oxygen consumption was based on previous studies. Activated carbon, HCl and Caustic Soda consumption was taken from industry benchmarks that run similar operations.
Table 22: Summary of Reagent Cost
Item | Total Cost | Consumption | Unit Cost |
| USD (‘000)/month | USD/t | Unit | Rate | Unit | Price |
| Cyanide | 428 | 0.86 | kg/t | 0.422 | USD/t | 1,682 |
| Lime | 53 | 0.11 | kg/t | 0.350 | USD/t | 251 |
| Activated Carbon | 52 | 0.10 | kg/t | 0.042 | USD/t | 2,051 |
| Caustic Soda | 48 | 0.10 | kg/t | 0.166 | USD/t | 477 |
| HCl | 17 | 0.03 | kg/t | 0.140 | USD/t | 199 |
| Oxygen | 113 | 0.23 | kg/t | 1.200 | USD/t | 157 |
| Flocculent | 29 | 0.06 | kg/t | 0.025 | USD/t | 1,896 |
| SMBS | 171 | 0.34 | kg/t | 0.500 | USD/t | 568 |
The labour costs were calculated from the required complement with each grade having a renumeration per grade as in Figure 29. The cost per grade was taken from previous studies.
| |
| RESOURCE | RESERVE | VALUE |
Blyvoor Gold Operations (Pty) Ltd
S-K 1300 Technical Report Summary on the Blyvoor Tailings Retreatment Project, South Africa | 77 |
Figure 29: Monthly Salary per Job Grade
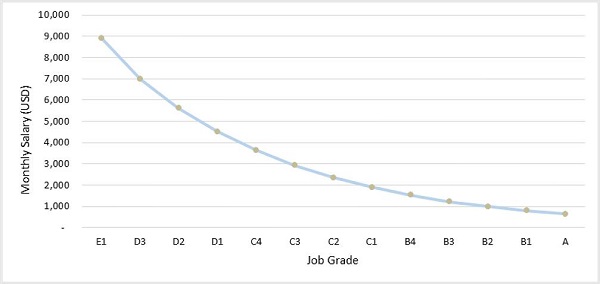
Yearly maintenance cost was taken as 10% of the installed equipment cost of USD 1.514 million as per Mintek’s guide by Rummer (1992).
Overheads and Other Costs
Table 23 details the average overhead and selling costs over the LoM. The overhead costs are calculated as per the PFS budget estimation. The selling costs are as per the 2023 Rand Refinery contract in place with Blyvoor Mine, which has remained unchanged as at effective date, as well as actual helicopter charges.
Table 23: Overhead and Selling Operating Costs Summary
| Description | Unit | Cost |
| Services & On Mine Overheads | USD/Month | 30,000 |
| Helicopter Transport | USD/Month | 3,000 |
| Electrical Maintenance | USD/Month | 4,000 |
| Mining Tech Services (Overheads) | USD/Month | 17,000 |
| Total Fixed Central Services | USD/Month | 54,000 |
| Refining Fee | USD/kg | 14.20 |
| Location Fee | USD/payable oz | 0.92 |
| Administration Transfer Fee | USD/kg | 0.53 |
| Power | USD/t | 0.17 |
| Water (Supply and Dewatering) | USD/t | 0.01 |
| General Engineering Maintenance Consumables | USD/t | 0.003 |
| Total Variable Central Services | USD/t | 0.19 |
The average corporate overhead costs over the LoM are detailed in Table 24 as per PFS budget escalated to effective date.
Table 24: Corporate Costs Summary
| Description | Unit | Cost |
| Professional Fees | USD/Month | 11,000 |
| Off-mine G&A | USD/Month | 5,000 |
| Head Office Salaries | USD/Month | 49,000 |
| Total Fixed Corporate | USD/Month | 65,000 |
The rehabilitation liability payment schedule is illustrated in Figure 30, with the 2020 costs already sunk and not forming part of the cash flow.
| |
| RESOURCE | RESERVE | VALUE |
Blyvoor Gold Operations (Pty) Ltd
S-K 1300 Technical Report Summary on the Blyvoor Tailings Retreatment Project, South Africa | 78 |
Figure 30: Rehabilitation Payment Schedule
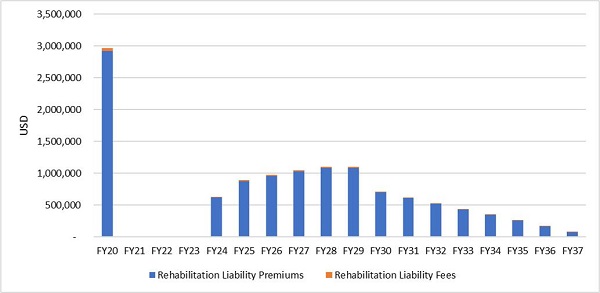
An additional contingency of 10% was applied to the processing and other operating costs. A sensitivity to the operating cost applied is included in Item 19 (d).
| I. | Financial Costs Indicators |
The operating costs in the financial model were reported into different categories as defined by the World Gold Council. The Adjusted Operating Cost represents the cash cost incurred at each processing stage, from mining through to recoverable metal delivered to market, and, if any, less net by-product credits. In addition, royalty taxes are included in Adjusted Operating Costs. Costs are reported as “per oz” of gold. The operating margin is defined as metal price received minus Adjusted Operating Costs. AISC is the sum of net Adjusted Operating Costs (Operating), Sustaining Capital, reclamation costs and other non-direct operating costs. The AISC margin is defined as metal price received per ore tonne or gold ounce minus the AISC, over the metal price received. AIC is the sum of the AISC, all non-sustaining capital costs (including expansion capital) and non-current operational costs. The AIC margin is defined as metal price received per ore tonne or gold ounce minus the AIC, over the metal price received.
Costs reported for the mine on this basis are displayed per plant feed tonne as well as per recovered gold ounce in Table 25. Costs reported are inclusive of contingencies. An additional renewals and replacement cost have been included, calculated as 3% of the total plant operating cost. A sensitivity analysis to increase in OPEX and CAPEX is included in Item 19 (d).
| |
| RESOURCE | RESERVE | VALUE |
Blyvoor Gold Operations (Pty) Ltd
S-K 1300 Technical Report Summary on the Blyvoor Tailings Retreatment Project, South Africa | 79 |
Table 25: Project Cost Indicators
| Item | Unit | Blyvoor Tailings |
| Net Turnover | USD/Feed tonne | 9.80 |
| Mine Cost | USD/Feed tonne | 0.18 |
| Plant Costs | USD/Feed tonne | 4.23 |
| Other Costs | USD/Feed tonne | 0.33 |
| Royalties | USD/Feed tonne | 0.00 |
| Operating Costs | USD/Feed tonne | 4.74 |
| SIB | USD/Feed tonne | 0.11 |
| Reclamation | USD/Feed tonne | 0.09 |
| Other Costs | USD/Feed tonne | 0.14 |
| All-in Sustaining Costs (AISC) | USD/Feed tonne | 5.07 |
| Expansion Capital | USD/Feed tonne | 0.35 |
| Other Cash Costs | USD/Feed tonne | 0.00 |
| All-in Costs (AIC) | USD/Feed tonne | 5.42 |
| All-in Cost Margin | % | 34% |
| EBITDA* | USD/Feed tonne | 4.82 |
| EBITDA Margin | % | 49% |
| Gold Recovered | oz | 436,825 |
| Net Turnover | USD/Gold oz | 1,891 |
| Mine Cost | USD/Gold oz | 35 |
| Plant Costs | USD/Gold oz | 816 |
| Other Costs | USD/Gold oz | 64 |
| Royalties | USD/Gold oz | 0 |
| Operating Costs | USD/Gold oz | 915 |
| SIB Capex | USD/Gold oz | 20 |
| Reclamation | USD/Gold oz | 20 |
| Other Costs | USD/Gold oz | 26 |
| All-in Sustaining Costs (AISC) | USD/Gold oz | 982 |
| Expansion Capital | USD/Gold oz | 262 |
| Other Cash Costs | USD/Gold oz | 0 |
| All-in Costs (AIC) | USD/Gold oz | 1,244 |
| EBITDA* | USD/Gold oz | 926 |
Notes:
| 1. | * EBITDA excludes capital expenditure. |
| 2. | Costs Include Contingencies |
The Project has an AISC of USD5.07/plant feed tonne equating to USD982/oz. The AIC for the Project is USD5.42/milled tonne which equates to USD1,244/oz. The AISC costs are very similar to FWGR on USD/t basis which is also of a similar size (Table 26). The AISC on USD/oz basis is higher as the grade is lower, and is closer to Central Plant Tailings and Phoenix Surface Operations which have a similar grade.
Table 26: Cost Benchmarks to TSF Retreatment Operations
Cost Benchmarking | Annual RoM | Annual Gold
Production | Recovered
Grade | AISC | AISC |
| Mt | Oz | g/t | ZAR/t | USD/oz |
| Central Plant Tailings | 5.10 | 22,345 | 0.14 | 80 | 1034 |
| Phoenix Surface Operations | 7.76 | 30,672 | 0.13 | 72 | 1036 |
| Harmony MWS | 23.76 | 91,178 | 0.13 | 136 | 1202 |
| Ergo | 23.10 | 131,432 | 0.19 | 147 | 1454 |
| FWGR | 6.20 | 49,416 | 0.24 | 112 | 794 |
| Mean | 12.14 | 53,534 | 0.15 | 104 | 1,170 |
| Median | 15.43 | 60,925 | 0.14 | 108 | 1,119 |
| Blyvoor TSF Ops | 5.62 | 29,122 | 0.16 | 97 | 982 |
Source: 2021 Annual Reports/Results (Escalated to 2024 terms)
| Note: | *Average values over the LoM |
Figure 31 illustrates the Adjusted Operating Cost per year against the milled tonnes over the LoM. The Adjusted Operating Costs over the LoM averaged USD4.74/plant feed tonne.
| |
| RESOURCE | RESERVE | VALUE |
Blyvoor Gold Operations (Pty) Ltd
S-K 1300 Technical Report Summary on the Blyvoor Tailings Retreatment Project, South Africa | 80 |
Figure 31: Adjusted Operating Cost vs. Feed Tonnes

The AISC is displayed in Figure 32 per recovered ounce together with the average gold price of USD1,900/oz that was used in the financial model. The Project becomes marginal toward the end of the LoM as the grade becomes lower.
Figure 32: AISC vs. Gold Price

Figure 33 illustrates the AIC per recovered ounce together with the average gold price of USD1,900/oz that was used in the financial model.
| |
| RESOURCE | RESERVE | VALUE |
Blyvoor Gold Operations (Pty) Ltd
S-K 1300 Technical Report Summary on the Blyvoor Tailings Retreatment Project, South Africa | 81 |
Figure 33: AIC vs. Gold Price
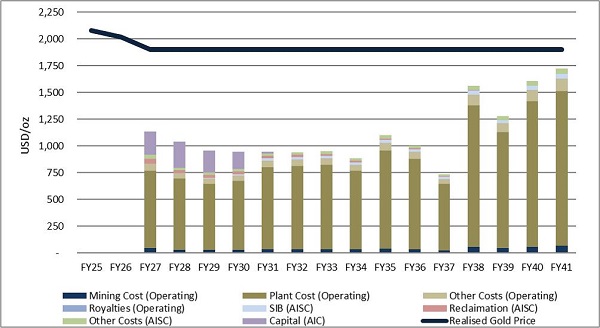
Item 18 (c) - Accuracy of Estimates
The Project economics are based on a PFS, escalated to current terms as at the effective date. Costs are therefore mostly based PFS level estimates and are deemed accurate to within a 15% to 25% range for the operating costs and 15% to 25% for the capital costs overall. The basis of this TRS is a life of mine plan, which is of sufficient detail to support declaration of Mineral Reserves.
| |
| RESOURCE | RESERVE | VALUE |
Blyvoor Gold Operations (Pty) Ltd
S-K 1300 Technical Report Summary on the Blyvoor Tailings Retreatment Project, South Africa | 82 |
ITEM 19 - Economic Analysis
The purpose of this section is to demonstrate the economic viability of the mine plan in order to declare updated Mineral Reserves.
Value relates to a specific point in time. The effective date for the economic analysis is 29 February 2024.
The evaluator performed an independent economic analysis on the Mine’s diluted Indicated and Measured Mineral Resources for conversion to Mineral Reserves. The Mine has a budget plan based on a compliant mine plan with Indicated and Measured Mineral Resources. Thus, the income approach was applied on the total mineable reserve incorporated in the detailed mine plan as the primary economic analysis methodology in determining the economic viability for conversion to Mineral Reserves.
Item 19 (a) - Principal Assumptions
The scope of this economic analysis exercise was to determine the financial viability of the diluted Indicated and Measured Mineral Resources in the LoM plan, for conversion to Mineral Reserves. This is illustrated by using the DCF method on a Free cash flow to firm (“FCFF”) basis, to calculate the net present value (“NPV”) and subsequently, the intrinsic value of the Mine in real terms. The NPV is derived from post-royalties and tax, pre-debt real cash flows, after taking into account operating costs, capital expenditures for the mining operations and the processing plant and using forecast macro-economic parameters.
| I. | Basis of Evaluation of the Mining Assets |
In generating the financial model and deriving the economic analysis, the following were considered:-
| ● | This Report details the optimised cash flow model with economic input parameters. |
| ● | The cash flow model is in constant money terms and completed in ZAR. |
| ● | The cash flow model is subsequently converted to USD terms using the exchange rate forecast. |
| ● | The DCF economic analysis was set up in financial years with the model staring in March 2024, hence the first year includes 12 months. |
| ● | The DCF analysis was based on the schedule, recoveries, operating costs and capital costs from the PFS escalated to current terms, also described in preceding sections of this TRS. |
| ● | A hurdle rate of 11.35% (in real terms) was calculated for the discount factor. |
| ● | The impact of existing streaming agreements was considered. |
| ● | Sensitivity analyses were performed to ascertain the impact of discount factors, commodity prices, exchange rate, grade, working costs and capital expenditures. |
| ● | Economic analysis of the tax entity was performed on a stand-alone basis. |
| ● | The full value of the operation was reported for the Project as the attributable values to the Company is 100%. |
| ● | The value which is being reported on does not take into account the possible value-enhancing effects of an optimal structure, i.e. of the most appropriate mix of equity and debt. |
| II. | Macro-Economic Forecasts |
The following section includes the macro-economic and commodity price forecasts for the operation over the LoM. Forecast data is based on projections for the different commodity prices and the country-specific macro-economic parameters and is in financial years from March to February starting March 2024.
Both the ZAR/USD exchange rate and USD commodity prices are in real money terms. Table 27 illustrates the forecasts for the first three years as well as the long-term forecast used in the financial model. The price forecast and short-term exchange rate is taken as the median of various analyst and bank forecasts,
| |
| RESOURCE | RESERVE | VALUE |
Blyvoor Gold Operations (Pty) Ltd
S-K 1300 Technical Report Summary on the Blyvoor Tailings Retreatment Project, South Africa | 83 |
with the long-term prices calculated in-house. The medium and long-term exchange rate forecast was calculated in-house using the inflation adjusted purchasing price parity of the ZAR to USD. The inflation rate forecasts were sourced from the International Monetary Fund (“IMF”).
Table 27: Macro-Economic Forecasts and Commodity Prices over the Life of Mine
| Basis | Item | Unit | 2024 | 2025 | 2026 | 2027 | 2028 | LT |
| Calendar Years (Real) | Gold Price | USD/oz | 2,086 | 2,040 | 1,900 | 1,900 | 1,900 | 1,900 |
| Financial Years (Real) | Gold Price | USD/oz | N/A | 2,078 | 2,016 | 1,900 | 1,900 | 1,900 |
| Calendar Years (Real) | Exchange Rate | ZAR/USD | 18.80 | 18.10 | 18.45 | 18.80 | 19.15 | 19.15 |
| Financial Years (Real) | Exchange Rate | ZAR/USD | N/A | 18.68 | 18.16 | 18.51 | 18.86 | 19.15 |
| Calendar Years | US Inflation | % | 2.8% | 2.4% | 2.2% | 2.1% | 2.1% | 2.1% |
| Financial Years | US Inflation | % | N/A | 2.8% | 2.4% | 2.2% | 2.1% | 2.1% |
| Calendar Years | SA Inflation | % | 4.8% | 4.5% | 4.5% | 4.5% | 4.5% | 4.5% |
| Financial Years | SA Inflation | % | N/A | 4.8% | 4.5% | 4.5% | 4.5% | 4.5% |
Source: Median of various Banks and Broker forecasts (Consensus, March 2024); Minxcon; IMF.
Figure 34 illustrates the 20-year real-terms historic gold price. For the past ten years, the gold price has found support between USD1,600/oz and USD2,200/oz with the price maintaining a level of more than USD1,800 for the past three years. The long-term gold price was estimated as the real term average between the two gold price support levels over the past 10 years, i.e. USD1,900/oz.
Figure 34: Real-term Historic Gold Price
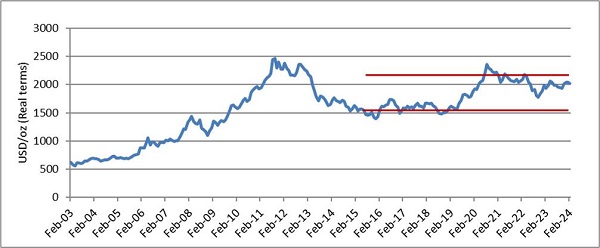
The creditors’ days were assumed at 30 days and debtors’ days (for payment of Gold delivered) were calculated at 7 days.
A simple model was fitted to the experimental data to feed into the financial model. The model is given by the Equation 1, in the processing Section of this TRS.
Where R is recovery in percentage, F is the feed grade in g/t and k is a constant of 0.14 g/t which fit the data the best. The achieved recoveries over the LoM range between 40% and 62% with an average recovery of 54%. The recovery is detailed in the processing Section of this TRS.
The QPs used the FCFF to calculate the value of the company on a 100% equity basis and hence used the Capital Asset Pricing Model (“CAPM”) to calculate the discount rate. The following were considered:-
| |
| RESOURCE | RESERVE | VALUE |
Blyvoor Gold Operations (Pty) Ltd
S-K 1300 Technical Report Summary on the Blyvoor Tailings Retreatment Project, South Africa | 84 |
| ● | The South African risk-free rate (10 years and longer bond yield) of 11.67% was considered acceptable. |
| ● | A market risk premium of 6.00%, a rate generally considered as being the investor’s expectation for investing in equity rather than a risk-free government bond, was used. |
| ● | The Beta of a stock is normally used to reflect the stock price’s volatility over and above other general equity investments in the country of listing. A Beta of 0.78 was calculated for the Project. This specific risk was calculated using an average weighting on ranked criteria based on the most crucial elements in a mining project. |
| ● | This resulted in a nominal based cost of equity of 16.37% to value the Project which equals a real cost of equity of 11.35%. |
| ● | The calculated discount rate is detailed in Table 28. A NPV sensitivity to various discount rates is also reported. |
Table 28: Project Cost of Equity
| Items | Rate |
| Risk-Free Rate | 11.67% |
| Risk Premium of Market | 6.00% |
| Base Beta (Project Premium) | 0.78 |
| Nominal Cost of Equity (CAPM) | 16.37% |
| Real Cost of Equity (CAPM) | 11.35% |
Beta is a measure of the volatility or systematic risk of a security or a portfolio in comparison to the market as a whole. The QPs calculated an operation Beta for the Project using an in-house model. The model considers several operational criteria and assigns weights to these factors. Operation-specific scores are allocated to each of the factors, and a Beta is calculated. A Beta of 0.78 was calculated for the Project. The Beta was benchmarked against the South African gold mining companies listed on the Johannesburg Stock Exchange(“JSE”), in order to determine if the calculated Beta for Blyvoor TSF Project can be deemed appropriate. The Unlevered Betas of South African gold mining companies were found to range between 0.76 (Pan African Resources) and 1.53 (Harmony). The calculated Beta of 0.78 falls within this range and is closest to Pan African Resources, with a Beta of 0.76. The calculated Beta of 0.78 is therefore deemed appropriate. Table 29 shows the Betas of South African gold mining companies considered.
Table 29 Southern African Gold Mining Companies’ Beta Values
| Gold Company | Unlevered Betas | Levered Betas | Exchange |
| Gold Fields | 1.20 | 1.24 | JSE |
| Harmony | 1.53 | 1.56 | JSE |
| Pan African Resources | 0.76 | 0.78 | LSE |
| DRD Gold | 1.12 | 0.97 | JSE |
| Mean | 1.12 | 1.10 | |
| Median | 1.16 | 1.11 | |
Source: InfrontAnalytics (Mar 2024)
The saleable product tonnes per year are illustrated in Figure 35. The average recovery over the LoM is 53.5% for an average recovered gold grade of 0.16 g/t.
| |
| RESOURCE | RESERVE | VALUE |
Blyvoor Gold Operations (Pty) Ltd
S-K 1300 Technical Report Summary on the Blyvoor Tailings Retreatment Project, South Africa | 85 |
Figure 35: Saleable Gold Ounces
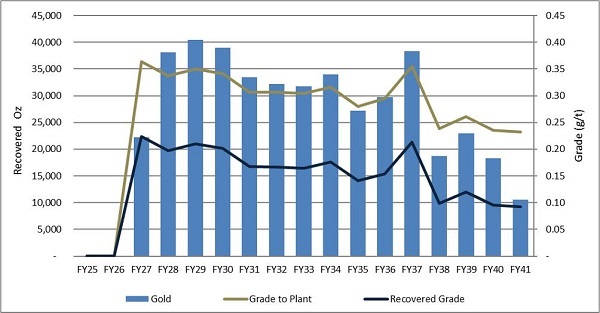
A breakdown of the tonnes and ounces used in the LoM are displayed in Table 30. There is currently no Inferred Mineral Resources included for the purpose of the economic analysis.
Table 30: Production Breakdown in Life of Mine
| Item | Project | Blyvoor Tailings |
| Ore Tonnes Mined | kt | 84,276 |
| Average Mined Grade | g/t | 0.301 |
| Total Oz in Mine Plan | oz | 816,159 |
| Grade Delivered to Plant | g/t | 0.301 |
| Recovered grade | g/t | 0.161 |
| Yield/Recovery | % | 53.5% |
| Total Oz Recovered | oz | 436,825 |
The annual cash flow before capital expenditure, total capital expenditure and cumulative cash flow forecast for the mine over the LoM is illustrated in Figure 36. Table 31 and Table 32 illustrate the detailed annual cash flow for the Mine in real terms over the LoM.
| |
| RESOURCE | RESERVE | VALUE |
Blyvoor Gold Operations (Pty) Ltd
S-K 1300 Technical Report Summary on the Blyvoor Tailings Retreatment Project, South Africa | 86 |
Figure 36: Undiscounted Cash Flow
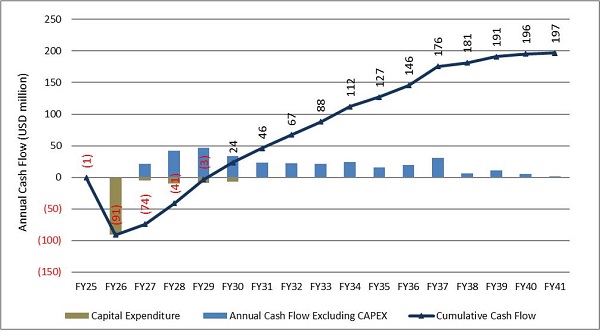
| |
| RESOURCE | RESERVE | VALUE |
Blyvoor Gold Operations (Pty) Ltd
S-K 1300 Technical Report Summary on the Blyvoor Tailings Retreatment Project, South Africa | 87 |
Table 31: Annual Cash Flow – Techno-economic Inputs (LoM)
| Project Title: | Blyvoor Tailings |
| Client: | Blyvoor Gold Operations (Pty) Ltd |
| Project Code: | M24-003b |
| | |
| Project Duration | | Unit | Totals | FY25 | FY26 | FY27 | FY28 | FY29 | FY30 | FY31 | FY32 | FY33 | FY34 | FY35 | FY36 | FY37 | FY38 | FY39 | FY40 | FY41 |
| Calendar Years | | | | 2025 | 2026 | 2027 | 2028 | 2029 | 2030 | 2031 | 2032 | 2033 | 2034 | 2035 | 2036 | 2037 | 2038 | 2039 | 2040 | 2041 |
| Financial Years | | years | 15 | -1 | 0 | 1 | 2 | 3 | 4 | 5 | 6 | 7 | 8 | 9 | 10 | 11 | 12 | 13 | 14 | 15 |
| Macro-Economic Factors (Real Terms) 1 |
| Currency | | ZAR /USD | 19.01 | 18.679 | 18.159 | 18.510 | 18.858 | 19.149 | 19.149 | 19.149 | 19.149 | 19.149 | 19.149 | 19.149 | 19.149 | 19.149 | 19.149 | 19.149 | 19.149 | 19.149 |
| Inflation | ZAR Inflation Rate | % | 4.50% | | | 4.50% | 4.50% | 4.50% | 4.50% | 4.50% | 4.50% | 4.50% | 4.50% | 4.50% | 4.50% | 4.50% | 4.50% | 4.50% | 4.50% | 4.50% |
| Inflation | US Inflation Rate | % | 2.11% | | | 2.20% | 2.10% | 2.10% | 2.10% | 2.10% | 2.10% | 2.10% | 2.10% | 2.10% | 2.10% | 2.10% | 2.10% | 2.10% | 2.10% | 2.10% |
| Commodities | | | 1 | | | | | | | | | | | | | | | | | |
| Commodity prices | Gold | USD/oz. | 1,900 | | | 1,900 | 1,900 | 1,900 | 1,900 | 1,900 | 1,900 | 1,900 | 1,900 | 1,900 | 1,900 | 1,900 | 1,900 | 1,900 | 1,900 | 1,900 |
| Operating Statistics | | | 1 | | | | | | | | | | | | | | | | | |
| ROM | | tonnes | 84,275,810 | - | - | 3,084,002 | 6,048,896 | 6,054,998 | 6,055,022 | 6,056,803 | 6,058,691 | 6,058,382 | 6,058,702 | 6,056,973 | 5,961,742 | 5,386,557 | 5,921,741 | 5,935,126 | 5,981,952 | 3,556,223 |
| ROM | (Max) | tonnes/mnth | 504,892 | - | - | 257,000 | 504,075 | 504,583 | 504,585 | 504,734 | 504,891 | 504,865 | 504,892 | 504,748 | 496,812 | 448,880 | 493,478 | 494,594 | 498,496 | 296,352 |
| Mill Head grade | Gold Grade | g/t | 0.30 | - | - | 0.36 | 0.34 | 0.35 | 0.34 | 0.31 | 0.31 | 0.30 | 0.32 | 0.28 | 0.29 | 0.36 | 0.24 | 0.26 | 0.24 | 0.23 |
| Tonnes to mill | | tonnes | 84,275,810 | - | - | 3,084,002 | 6,000,000 | 6,000,000 | 6,000,000 | 6,215,719 | 6,000,000 | 6,000,000 | 6,000,000 | 6,000,000 | 6,000,000 | 5,581,047 | 5,921,741 | 5,935,126 | 5,981,952 | 3,556,223 |
| Recovered Grade | | | 1 | | | | | | | | | | | | | | | | | |
| Recovered grade | Precious Metals | g/t | 0.16 | - | - | 0.22 | 0.20 | 0.21 | 0.20 | 0.17 | 0.17 | 0.16 | 0.18 | 0.14 | 0.15 | 0.21 | 0.10 | 0.12 | 0.10 | 0.09 |
| Metal recovered | | | | | | | | | | | | | | | | | | | | 40% |
| Metal recovered | Gold | kg | 13,587 | - | - | 690 | 1,185 | 1,259 | 1,211 | 1,039 | 1,000 | 986 | 1,057 | 847 | 924 | 1,191 | 584 | 714 | 570 | 328 |
| Metal recovered | Gold | oz | 436,825 | - | - | 22,186 | 38,087 | 40,493 | 38,931 | 33,416 | 32,150 | 31,712 | 33,990 | 27,225 | 29,714 | 38,303 | 18,767 | 22,966 | 18,339 | 10,546 |
Table 32: Annual Real Cash Flow (LoM)
| Project Title: | Blyvoor Tailings |
| Client: | Blyvoor Gold Operations (Pty) Ltd |
| Project Code: | M24-003b |
| Project Duration | | Unit | Totals | FY25 | FY26 | FY27 | FY28 | FY29 | FY30 | FY31 | FY32 | FY33 | FY34 | FY35 | FY36 | FY37 | FY38 | FY39 | FY40 | FY41 |
| Calendar Years | | | | 2025 | 2026 | 2027 | 2028 | 2029 | 2030 | 2031 | 2032 | 2033 | 2034 | 2035 | 2036 | 2037 | 2038 | 2039 | 2040 | 2041 |
| Financial Years | | years | 15 | -1 | 0 | 1 | 2 | 3 | 4 | 5 | 6 | 7 | 8 | 9 | 10 | 11 | 12 | 13 | 14 | 15 |
| Financial1 |
| Revenue | | USD | 829,967,996 | - | - | 42,153,380 | 72,365,528 | 76,936,887 | 73,968,419 | 63,489,821 | 61,085,929 | 60,253,531 | 64,580,217 | 51,727,339 | 56,456,454 | 72,775,869 | 35,656,483 | 43,636,284 | 34,844,287 | 20,037,569 |
| Revenue | Gold | USD | 829,967,996 | 0 | 0 | 42,153,380 | 72,365,528 | 76,936,887 | 73,968,419 | 63,489,821 | 61,085,929 | 60,253,531 | 64,580,217 | 51,727,339 | 56,456,454 | 72,775,869 | 35,656,483 | 43,636,284 | 34,844,287 | 20,037,569 |
| Mining cost | | | (15,341,579) | 0 | 0 | (939,559) | (1,081,433) | (1,066,098) | (1,066,102) | (1,066,416) | (1,066,749) | (1,066,694) | (1,066,750) | (1,066,446) | (1,049,679) | (948,406) | (1,042,636) | (1,044,993) | (1,053,237) | (716,380) |
| Direct Cash Costs | Variable Cost | USD | (15,341,579) | 0 | 0 | (939,559) | (1,081,433) | (1,066,098) | (1,066,102) | (1,066,416) | (1,066,749) | (1,066,694) | (1,066,750) | (1,066,446) | (1,049,679) | (948,406) | (1,042,636) | (1,044,993) | (1,053,237) | (716,380) |
| Plant cost | | | (356,088,606) | 0 | 0 | (16,086,041) | (25,428,363) | (25,042,531) | (25,042,531) | (25,744,835) | (25,042,531) | (25,042,531) | (25,042,531) | (25,042,531) | (25,042,531) | (23,678,568) | (24,787,748) | (24,831,324) | (24,983,772) | (15,250,240) |
| Direct Cash Costs | Fixed Cost | USD | (73,698,724) | 0 | 0 | (5,180,803) | (5,085,017) | (5,007,861) | (5,007,861) | (5,007,861) | (5,007,861) | (5,007,861) | (5,007,861) | (5,007,861) | (5,007,861) | (5,007,861) | (5,007,861) | (5,007,861) | (5,007,861) | (3,338,574) |
| Direct Cash Costs | Variable Cost | USD | (250,018,191) | 0 | 0 | (9,442,871) | (18,031,676) | (17,758,076) | (17,758,076) | (18,396,535) | (17,758,076) | (17,758,076) | (17,758,076) | (17,758,076) | (17,758,076) | (16,518,110) | (17,526,455) | (17,566,070) | (17,704,659) | (10,525,281) |
| Direct Cash Costs | Contingeny | USD | (32,371,691) | 0 | 0 | (1,462,367) | (2,311,669) | (2,276,594) | (2,276,594) | (2,340,440) | (2,276,594) | (2,276,594) | (2,276,594) | (2,276,594) | (2,276,594) | (2,152,597) | (2,253,432) | (2,257,393) | (2,271,252) | (1,386,385) |
| Other Costs | | | (36,768,465) | (633,680) | (892,443) | (2,501,718) | (3,016,911) | (3,054,169) | (3,051,835) | (2,692,581) | (2,557,872) | (2,466,605) | (2,379,392) | (2,278,676) | (2,191,780) | (2,032,025) | (1,978,893) | (1,908,925) | (1,911,176) | (1,219,783) |
| Direct Cash Costs | Other Cost Fixed | USD | (9,544,419) | 0 | 0 | (670,944) | (658,540) | (648,547) | (648,547) | (648,547) | (648,547) | (648,547) | (648,547) | (648,547) | (648,547) | (648,547) | (648,547) | (648,547) | (648,547) | (432,365) |
| Direct Cash Costs | Other Costs Variable | USD | (15,772,800) | 0 | 0 | (722,201) | (1,135,609) | (1,122,173) | (1,120,052) | (1,150,934) | (1,110,847) | (1,110,252) | (1,113,344) | (1,104,159) | (1,107,539) | (1,044,682) | (1,078,756) | (1,086,839) | (1,088,885) | (676,529) |
| Direct Cash Costs | Contingeny | USD | (2,531,722) | 0 | 0 | (139,315) | (179,415) | (177,072) | (176,860) | (179,948) | (175,939) | (175,880) | (176,189) | (175,271) | (175,609) | (169,323) | (172,730) | (173,539) | (173,743) | (110,889) |
| Direct Cash Costs | Rehabilitation | USD | (8,919,525) | (633,680) | (892,443) | (969,259) | (1,043,348) | (1,106,376) | (1,106,376) | (713,152) | (622,539) | (531,925) | (441,312) | (350,699) | (260,085) | (169,472) | (78,859) | 0 | 0 | 0 |
| Direct Cash Costs | | | (408,198,650) | (633,680) | (892,443) | (19,527,318) | (29,526,707) | (29,162,798) | (29,160,469) | (29,503,833) | (28,667,152) | (28,575,830) | (28,488,673) | (28,387,653) | (28,283,990) | (26,658,999) | (27,809,276) | (27,785,242) | (27,948,184) | (17,186,403) |
| Production Costs | Initial Capital expenditure | USD | (99,694,692) | 0 | (73,960,740) | (4,219,152) | (8,139,872) | (7,348,527) | (5,508,727) | (517,674) | 0 | 0 | 0 | 0 | 0 | 0 | 0 | 0 | 0 | 0 |
| Production Costs | Contingency | USD | (19,370,456) | 0 | (15,510,364) | (632,873) | (1,220,981) | (1,102,279) | (826,309) | (77,651) | 0 | 0 | 0 | 0 | 0 | 0 | 0 | 0 | 0 | 0 |
| Production Costs | SIB | USD | (8,873,769) | 0 | 0 | 0 | 0 | (375,638) | (563,457) | (772,345) | (751,276) | (751,276) | (751,276) | (751,276) | (751,276) | (710,357) | (743,632) | (744,940) | (749,513) | (457,507) |
| Production Costs | | USD | (536,137,567) | (633,680) | (90,363,547) | (24,379,342) | (38,887,560) | (37,989,242) | (36,058,961) | (30,871,503) | (29,418,428) | (29,327,106) | (29,239,949) | (29,138,929) | (29,035,266) | (27,369,356) | (28,552,909) | (28,530,181) | (28,697,698) | (17,643,911) |
| Fully Allocated Costs | Other Fixed Costs | USD | (11,525,139) | 0 | 0 | (810,183) | (795,204) | (783,138) | (783,138) | (783,138) | (783,138) | (783,138) | (783,138) | (783,138) | (783,138) | (783,138) | (783,138) | (783,138) | (783,138) | (522,092) |
| Fully Allocated Costs | Contingeny | USD | (1,577,280) | 0 | 0 | (72,220) | (113,561) | (112,217) | (112,005) | (115,093) | (111,085) | (111,025) | (111,334) | (110,416) | (110,754) | (104,468) | (107,876) | (108,684) | (108,889) | (67,653) |
| Fully Allocated Costs | | USD | (547,662,706) | (633,680) | (90,363,547) | (25,261,746) | (39,796,325) | (38,884,597) | (36,954,105) | (31,769,734) | (30,312,651) | (30,221,269) | (30,134,422) | (30,032,483) | (29,929,158) | (28,256,963) | (29,443,923) | (29,422,004) | (29,589,724) | (18,233,656) |
| EBITDA | | USD | 408,666,927 | (633,680) | (892,443) | 21,743,659 | 41,930,056 | 46,878,734 | 43,912,807 | 33,087,756 | 31,524,554 | 30,783,538 | 35,197,071 | 22,446,131 | 27,278,573 | 45,229,263 | 6,956,193 | 14,959,221 | 6,004,076 | 2,261,420 |
| EBIT | | USD | 282,305,290 | (633,680) | (90,363,547) | 16,891,634 | 32,569,203 | 38,052,290 | 37,014,314 | 31,720,086 | 30,773,278 | 30,032,262 | 34,445,795 | 21,694,855 | 26,527,297 | 44,518,906 | 6,212,560 | 14,214,281 | 5,254,563 | 1,803,913 |
| Taxation | | USD | (84,592,816) | 0 | 0 | 0 | 0 | 0 | (10,142,810) | (9,705,502) | (9,424,454) | (9,186,659) | (10,613,707) | (6,496,886) | (8,059,521) | (13,899,238) | (1,506,110) | (4,091,039) | (1,194,198) | (272,692) |
| Income after tax | | USD | 196,135,194 | (633,680) | (90,363,547) | 16,891,634 | 32,569,203 | 38,052,290 | 26,871,505 | 22,014,584 | 21,348,825 | 20,845,603 | 23,832,088 | 15,197,969 | 18,467,775 | 30,619,668 | 4,706,450 | 10,123,242 | 4,060,364 | 1,531,221 |
| Working capital changes | | USD | 1 | 0 | 0 | 104,288 | 172,158 | (112,522) | 56,756 | 255,999 | (9,642) | 15,910 | (82,719) | 245,714 | (91,796) | (428,380) | 805,302 | (148,923) | 180,850 | (367,701) |
| Cash Flow | | | | | | | | | | | | | | | | | | | | |
| Net Cash Flow | Annual cash flow | USD | 196,135,194 | (633,680) | (90,363,547) | 16,995,923 | 32,741,360 | 37,939,768 | 26,928,260 | 22,270,583 | 21,339,183 | 20,861,513 | 23,749,370 | 15,443,683 | 18,375,980 | 30,191,287 | 5,511,752 | 9,974,319 | 4,241,215 | 1,163,521 |
| |
| RESOURCE | RESERVE | VALUE |
Blyvoor Gold Operations (Pty) Ltd
S-K 1300 Technical Report Summary on the Blyvoor Tailings Retreatment Project, South Africa | 88 |
Item 19 (b) - Net Present Value
Minxcon’s in-house DCF model was employed to illustrate the NPV for the Mine in real terms. The NPV was derived from post Government royalties and tax, pre-debt real cash flows, using the techno-economic parameters, commodity price and macro-economic projections. This economic analysis is based on a free cash flow and measures the economic viability of the diluted Indicated and Measured Mineral Resources in the LoM plan, for conversion to Mineral Reserves under a defined set of realistically assumed modifying factors.
Table 33 illustrates the Mine NPV at various discount rates with a best estimated value of USD56 million (USD56 million attributable to Blyvoor Ops) at a real calculated discount rate of 11.4%. The IRR of the Project is 27.0%. The Project is financially viable; hence an updated Mineral Reserve can be declared.
Table 33: Project NPV Summary – Real Terms
| Real Discount Rate | Unit | Blyvoor Ops | Blyvoor Ops
Attributable |
| NPV @ 0% | USDm | 196 | 196 |
| NPV @ 2% | USDm | 159 | 159 |
| NPV @ 4% | USDm | 128 | 128 |
| NPV @ 5% | USDm | 115 | 115 |
| NPV @ 6% | USDm | 103 | 103 |
| NPV @ 8% | USDm | 83 | 83 |
| NPV @ 10% | USDm | 66 | 66 |
| NPV @ 11.4% | USDm | 56 | 56 |
| NPV @ 12% | USDm | 52 | 52 |
| NPV @ 14% | USDm | 40 | 40 |
| IRR | % | | 27.0% |
The profitability ratios for the Project are displayed in Table 34. The Project has a current LoM of 15 years, with a break-even gold price of USD1,244/oz. The peak funding requirement was calculated at USD91 million on a cumulative cash flow basis with a payback period of production of 3.0 years.
Table 34: Project Profitability Ratios
| Item | Unit | Reserve |
| Internal Rate of Return (IRR) | % | 27.0% |
| Total ounces in Mine plan | oz | 816,159 |
| In-situ Mining Inventory Valuation | ZAR/oz | 1,350 |
| In-situ Mining Inventory Valuation | USD/oz | 71 |
| LoM | Years | 15 |
| Average Payback Period | Years | 3.0 |
| Peak Funding Requirement | ZARm | 1,653 |
| Peak Funding Requirement | USDm | 91 |
| Break-even Feed Grade (Excluding Capex) | g/t | 0.15 |
| Break-even Feed Grade (Including Capex) | g/t | 0.20 |
| Break-even Gold Price (Excluding Capex) | USD/oz | 961 |
| Break-even Gold Price (Including Capex) | USD/oz | 1,244 |
Item 19 (c) - Regulatory Items
The government royalties are described in Item 3 (d). Historic TSFs are not regulated by the MPRDA, which means that royalty payments are not applicable.
| |
| RESOURCE | RESERVE | VALUE |
Blyvoor Gold Operations (Pty) Ltd
S-K 1300 Technical Report Summary on the Blyvoor Tailings Retreatment Project, South Africa | 89 |
Gold mining companies in South Africa are taxed according to the gold mine formula. Owing to the nature of the orebodies in South Africa, i.e. deep orebodies that require significant capital coupled with a fluctuating gold price, the government identified the vulnerability of gold mining companies during periods when margins are squeezed. The tax rates based on the formula decline when the company shows lower profits thereby giving the company the necessary breathing space during a difficult operating environment.
The gold mining formula is provided as Equation 1.
Equation 1: Mining Tax Formula
Where x = the ratio, expressed as a percentage, calculated as follows:-
| | Taxable income from gold mining | |
| | Total revenue (turnover) from gold mining | |
and y = calculated percentage which represents the rate of tax to be levied.
The rate of normal tax on taxable income other than that derived from mining for gold is 27%.
For all mines, capital expenditure incurred may be redeemed immediately against mining profits. All qualifying mining capital expenditure is deducted from taxable mining income to the extent that it does not result in an assessed loss. Accounting depreciation is eliminated when calculating the South African mining tax income. Excess capital expenditure and tax losses are carried forward as unredeemed capital and assessed losses to be claimed from future mining taxable income. Minxcon is not aware of any tax losses which could be utilised for the evaluation.
Item 19 (d) - Sensitivity Analysis
Based on the real cash flow calculated in the financial model, Minxcon performed single-parameter sensitivity analyses to ascertain the impact on the NPV, the results of which are graphically illustrated in Figure 37. The bars represent various inputs into the model; each being increased or decreased by 15%. The bars represent various inputs into the model; each being increased or decreased by 15%. The red bars indicate a negative 15% change in the input while the blue bars indicate a positive 15% change in the input. The left-hand side of the graph indicates a negative change to the NPV while the right-hand side of the graph indicating a positive change to the NPV. For the DCF, the grade has the biggest impact on the sensitivity of the Project followed by the gold price, exchange rate and then plant operating costs. The Project is least sensitive to mining capital and operating costs.
| |
| RESOURCE | RESERVE | VALUE |
Blyvoor Gold Operations (Pty) Ltd
S-K 1300 Technical Report Summary on the Blyvoor Tailings Retreatment Project, South Africa | 90 |
Figure 37: Project Sensitivity (NPV11.4%)

With grade being the most sensitive parameter, Minxcon performed a single parameter sensitivity analysis on grade as per Table 35 for the Reserve LoM plan. The tables illustrate a resultant change in recovery as the grade changes, as well as a NPV and IRR sensitivity.
Table 35: Grade Sensitivity - MI
| Grade (g/t) | % Change to Grade | Resultant Average Recovery | NPV11.4%Sensitivity | IRR Sensitivity |
| 0.241 | -20.0% | 41.9% | -40 | N/A |
| 0.249 | -17.5% | 43.7% | -26 | 0.2% |
| 0.256 | -15.0% | 45.3% | -13 | 6.9% |
| 0.264 | -12.5% | 46.9% | -1 | 11.5% |
| 0.271 | -10.0% | 48.4% | 11 | 15.2% |
| 0.279 | -7.5% | 49.8% | 22 | 18.6% |
| 0.286 | -5.0% | 51.1% | 34 | 21.5% |
| 0.294 | -2.5% | 52.3% | 45 | 24.3% |
| 0.301 | 0.0% | 53.5% | 56 | 27.0% |
| 0.309 | 2.5% | 54.7% | 68 | 29.7% |
| 0.316 | 5.0% | 55.7% | 79 | 32.1% |
| 0.324 | 7.5% | 56.8% | 90 | 34.5% |
| 0.331 | 10.0% | 57.7% | 101 | 36.8% |
| 0.339 | 12.5% | 58.7% | 111 | 39.1% |
| 0.346 | 15.0% | 59.6% | 122 | 41.4% |
| 0.354 | 17.5% | 60.4% | 133 | 43.6% |
| 0.361 | 20.0% | 61.3% | 144 | 45.8% |
A sensitivity analysis was also conducted on the exchange rate and the commodity prices to better indicate the effect these two factors have on the NPV as well as the operating costs and the capital. This is displayed in Table 36 and Table 37 respectively.
| |
| RESOURCE | RESERVE | VALUE |
Blyvoor Gold Operations (Pty) Ltd
S-K 1300 Technical Report Summary on the Blyvoor Tailings Retreatment Project, South Africa | 91 |
Table 36: Sensitivity Analysis of Commodity Prices and Exchange Rate to NPV11.4% (USDm)
| | Exchange Rate
(ZAR/USD) | 16.00 | 16.50 | 17.00 | 17.50 | 18.00 | 18.50 | 19.09 | 19.50 | 20.00 | 20.50 | 21.00 | 21.50 | 22.00 |
Gold Price
(USD/oz) | Change % | -17.6% | -14.8% | -11.9% | -9.1% | -6.2% | -3.4% | | 2.3% | 5.1% | 8.0% | 10.8% | 13.7% | 16.5% |
| 1,300 | -31.6% | -75 | -66 | -56 | -48 | -40 | -34 | -26 | -22 | -16 | -11 | -7 | -2 | 2 |
| 1,400 | -26.3% | -57 | -47 | -39 | -32 | -25 | -18 | -11 | -7 | -2 | 3 | 8 | 12 | 16 |
| 1,500 | -21.1% | -40 | -31 | -23 | -16 | -10 | -4 | 3 | 7 | 12 | 17 | 21 | 26 | 30 |
| 1,600 | -15.8% | -24 | -16 | -9 | -2 | 4 | 10 | 17 | 21 | 26 | 31 | 35 | 39 | 43 |
| 1,700 | -10.5% | -9 | -2 | 5 | 12 | 18 | 24 | 30 | 34 | 39 | 43 | 48 | 52 | 56 |
| 1,800 | -5.3% | 5 | 12 | 19 | 25 | 32 | 37 | 43 | 47 | 52 | 56 | 61 | 65 | 69 |
| 1,900 | 0.0% | 19 | 26 | 33 | 39 | 45 | 50 | 56 | 60 | 66 | 70 | 74 | 78 | 82 |
| 2,000 | 5.3% | 32 | 40 | 46 | 52 | 58 | 63 | 70 | 74 | 78 | 83 | 87 | 91 | 94 |
| 2,100 | 10.5% | 46 | 52 | 59 | 65 | 71 | 77 | 83 | 86 | 91 | 95 | 99 | 103 | 107 |
| 2,200 | 15.8% | 59 | 65 | 72 | 79 | 84 | 89 | 95 | 99 | 104 | 108 | 112 | 116 | 120 |
| 2,300 | 21.1% | 71 | 79 | 85 | 91 | 97 | 102 | 108 | 112 | 116 | 121 | 125 | 129 | 133 |
| 2,400 | 26.3% | 85 | 92 | 98 | 104 | 110 | 115 | 121 | 125 | 129 | 133 | 138 | 142 | 146 |
| 2,500 | 31.6% | 98 | 105 | 111 | 117 | 122 | 128 | 133 | 137 | 142 | 147 | 151 | 155 | 159 |
| 2,600 | 36.8% | 111 | 117 | 124 | 129 | 135 | 140 | 146 | 151 | 156 | 160 | 164 | 168 | 171 |
Note: Sensitivity illustrates average gold prices and not constant gold prices.
Table 37: Sensitivity Analysis of Cash Operating Costs and Non-Sustaining Capital Expenditure to NPV11.4% (USDm)
| | Capital (USDm) | 155 | 149 | 143 | 137 | 131 | 125 | 119 | 113 | 107 | 101 | 95 | 89 | 83 |
OPEX
(USD/Feed t) | | 30.0% | 25.0% | 20.0% | 15.0% | 10.0% | 5.0% | | -5.0% | -10.0% | -15.0% | -20.0% | -25.0% | -30.0% |
| 6.16 | 30.0% | 2 | 5 | 9 | 12 | 16 | 19 | 23 | 26 | 29 | 32 | 36 | 39 | 42 |
| 5.92 | 25.0% | 8 | 12 | 15 | 18 | 21 | 25 | 28 | 32 | 35 | 38 | 41 | 45 | 48 |
| 5.69 | 20.0% | 14 | 17 | 21 | 24 | 28 | 31 | 34 | 37 | 40 | 44 | 47 | 51 | 54 |
| 5.45 | 15.0% | 20 | 23 | 26 | 30 | 33 | 37 | 40 | 43 | 46 | 49 | 53 | 56 | 59 |
| 5.21 | 10.0% | 26 | 29 | 33 | 36 | 39 | 42 | 45 | 48 | 52 | 55 | 59 | 62 | 65 |
| 4.97 | 5.0% | 31 | 35 | 38 | 41 | 44 | 48 | 51 | 54 | 57 | 61 | 64 | 67 | 70 |
| 4.74 | 0.0% | 37 | 40 | 44 | 47 | 50 | 53 | 56 | 60 | 63 | 66 | 69 | 72 | 75 |
| 4.50 | -5.0% | 43 | 46 | 49 | 52 | 55 | 59 | 62 | 66 | 69 | 72 | 75 | 78 | 81 |
| 4.26 | -10.0% | 48 | 51 | 55 | 58 | 61 | 64 | 68 | 71 | 74 | 77 | 80 | 83 | 86 |
| 4.03 | -15.0% | 54 | 57 | 60 | 63 | 66 | 70 | 73 | 76 | 79 | 82 | 85 | 88 | 91 |
| 3.79 | -20.0% | 59 | 62 | 66 | 69 | 72 | 76 | 79 | 82 | 85 | 88 | 91 | 94 | 97 |
| 3.55 | -25.0% | 65 | 68 | 71 | 74 | 78 | 81 | 84 | 87 | 90 | 93 | 96 | 99 | 102 |
| 3.32 | -30.0% | 70 | 73 | 77 | 80 | 83 | 86 | 89 | 92 | 95 | 98 | 101 | 104 | 107 |
| |
| RESOURCE | RESERVE | VALUE |
Blyvoor Gold Operations (Pty) Ltd
S-K 1300 Technical Report Summary on the Blyvoor Tailings Retreatment Project, South Africa | 92 |
Item 19 (e) - Economic Analysis Conclusions
The value derived for the income approach only reflects the diluted Indicated and Measured Mineral Resources in the LoM plan, for conversion to Mineral Reserves. It is noted that Mineral Resources that are not Mineral Reserves do not have demonstrated economic viability. The Mineral Reserve is economically viable with a best estimated NPV of USD56 million (USD56 million attributable to Blyvoor Ops) at a real discount rate of 11.4%. The IRR of the Project was calculated 27.0%, which is not particularly high. The Project has a peak funding requirement of the Project was calculated as USD91 million on a cumulative annual cash flow basis. The Project has an all-in cost margin is 34% with a break-even gold price of USD1,244/oz. Table 38 shows a summary of the economic analysis.
Table 38: Blyvoor Mine Economic Analysis Summary – Real Terms
| Item | Unit | Blyvoor Operations | Blyvoor Ops Attributable |
| NPV @ 0% | USD million | 196 | 196 |
| NPV @ 2% | USD million | 159 | 159 |
| NPV @ 4% | USD million | 128 | 128 |
| NPV @ 6% | USD million | 115 | 115 |
| NPV @ 8% | USD million | 103 | 103 |
| NPV @ 10% | USD million | 83 | 83 |
| NPV @ 11.4% | USD million | 66 | 66 |
| NPV @ 12% | USD million | 56 | 56 |
| NPV @ 14% | USD million | 52 | 52 |
| IRR | % | | 27% |
| All-in Cost Margin | % | | 34% |
| Peak Funding Requirement (Annualised) | USD million | – | 91 |
| Payback | Years | | 3.0 |
| Break-even Gold Price | USD/oz. | | 1,244 |
| |
| RESOURCE | RESERVE | VALUE |
Blyvoor Gold Operations (Pty) Ltd
S-K 1300 Technical Report Summary on the Blyvoor Tailings Retreatment Project, South Africa | 93 |
ITEM 20 - ADJACENT PROPERTIES
The Carletonville Goldfield contains some of the largest and deepest underground mines in the world. In 2015, the five deepest operating mines in the world were located in this goldfield. The goldfield is the most significant gold deposit in the history of mining, and by 1986 had produced some 20,000 t of gold with a further 2,000 t sourced from the Deelkraal and Elandsrand (Kusasalethu) mines (Engelbrecht et al, 1986). Some 3,614 t of gold were sourced from the Carbon Leader Reef, at an average grade of 20.9 g/t Au. A number of gold mines occur in close proximity to each other, including Blyvoor, Tau Tona, Savuka, Mponeng, Driefontein and Kusasalethu. A number of TSFs occur on the neighbouring properties and are being retreated, including by Sibanye and Harmony. Mining, processing and deposition vary. Further, TSFs are manmade and thus contained commodities that occur at various TSFs cannot necessarily be comparable.
Verification has been limited to that data which is made available publicly and has been limited to cross-referencing information presented by the individual sources.
| |
| RESOURCE | RESERVE | VALUE |
Blyvoor Gold Operations (Pty) Ltd
S-K 1300 Technical Report Summary on the Blyvoor Tailings Retreatment Project, South Africa | 94 |
ITEM 21 - OTHER RELEVANT DATA AND INFORMATION
Item 21 (a) - Risk Assessment
A risk assessment to consider and quantify risks associated with the Mine was conducted by the QPs based on a simplified approach. The result is designed to be a tool to articulate and evaluate those risks as identified by persons present at the risk assessment session. No moderate or major residual risks have been identified in association with the Project.
| |
| RESOURCE | RESERVE | VALUE |
Blyvoor Gold Operations (Pty) Ltd
S-K 1300 Technical Report Summary on the Blyvoor Tailings Retreatment Project, South Africa | 95 |
ITEM 22 - INTERPRETATION AND CONCLUSIONS
Legal Aspects and Tenure
The reclamation of TSF No. 6 and TSF No. 7 is authorised through a granted EA, EMPr and WUL including TSF reclamation activities. The underlying geology across the area comprises amongst others dolomitic units, and appropriate linings are required over the footprint of newly established TSF sites.
Mineral Resources
TSF No. 1 and Doornfontein TSFs No. 1, 2 and 3 are all stated as Inferred Mineral Resources due to a limited number of drillholes in each of these TSFs. Upgrade to Indicated Mineral Resources would require additional drilling to increase the confidence in the data.
Historical, but deemed reliable, density figures were utilised for the Mineral Resource estimation.
Mining
The mining sequence is strategic, ensuring that the ramp up to steady state production, in line with the planned processing plant capacity. A 12-month ramp up to steady state production of 500 ktpm is considered practical and achievable. The mining sequence allows for the creation of sufficient capacity on the new planned TSF footprint. The mine plan targets only Measured and Indicated Mineral Resources, with an anticipated LoM of 15 years.
The Project has upside potential in the inclusion of the Inferred Mineral Resources in the LoM plan. Additional drilling would be required to upgrade the Inferred Mineral Resources to Indicated and Measured Mineral Resources. The Inferred Mineral Resources could potentially add 510 koz of gold to the Measured and Indicated Mineral Resource categories, and extend the LoM with ten years.
Engineering and Infrastructure
Although the Project is located on historic operations most of the infrastructure required to support the Project has been decommissioned or reclaimed. Sufficient provision has been made with regards to mining and shared infrastructure to re-establish the Project area and to enable the Project to be managed and operated efficiently.
Processing
Metallurgical testwork indicates recovery is a function of feed grade, and a residue grade of 0.14 g/t can be expected with a CIL process. Tailings can be treated at a rate of 500 ktpm, and the new TSF can accommodate this rate. The new TSF will have enough capacity to store the entire volume of TSF No. 6 and TSF No. 7.
Economic Analysis
The Project plan including only the diluted Indicated and Measured Mineral Resources in the LoM plan, for conversion to Mineral Reserves is financially feasible. The updated Mineral Reserve can therefore be declared. The DCF value of USD56 million for the Project (USD56 million attributable to Blyvoor Ops) was calculated at a real discount rate of 11.4%. The Project has an IRR of 27.0% calculated based on a funding requirement of USD91 million.
The Project financials are most sensitive to grade, commodity prices, and exchange rate. The Project financials are least sensitive to mining capital expenditure and mining and other operating costs.
The all-in sustaining costs for the Project amount to USD5.07/feed tonne over the LoM, which equates to USD982/oz. The all-in cost for the Project was calculated as USD5.42/feed t over the LoM, which equates
| |
| RESOURCE | RESERVE | VALUE |
Blyvoor Gold Operations (Pty) Ltd
S-K 1300 Technical Report Summary on the Blyvoor Tailings Retreatment Project, South Africa | 96 |
to USD1,244/oz. The Project therefore has a break-even gold price of USD1,244/oz including capital with an all-in cost margin of 34% over the LoM, which is comparable to similar mines.
| |
| RESOURCE | RESERVE | VALUE |
Blyvoor Gold Operations (Pty) Ltd
S-K 1300 Technical Report Summary on the Blyvoor Tailings Retreatment Project, South Africa | 97 |
ITEM 23 - RECOMMENDATIONS
Legal Aspects and Tenure
In light of no material risks for the current operations, it is recommended that consideration be given environmental audit report outcomes and ensure action plans are in place to deal with non-conformances. The Project owners and operators must adhere to environmental and sustainability principles as set out in the MPRDA and NEMA.
Mineral Resources
TSF No. 1 and Doornfontein TSFs No. 1, 2 and 3 are all stated as Inferred Mineral Resources due to a limited number of drillholes in each of these TSFs. In addition, these older holes have limited QAQC and sampling information and thus have a lower level of confidence. Additional infill drilling is recommended, to add Measured and Indicated tonnes that could be considered for extraction along with TSFs No. 6 and No. 7.
It is recommended that, with further study work, additional check density measurements be done using a nuclear densitometer or soil density gauge.
Mining
It is recommended that additional drilling is conducted to upgrade Mineral Resources in the Inferred classification to Indicated and Measured Mineral Resources, which may be included in the Mineral Reserve estimation. Additional drilling can be conducted during production to upgrade Inferred Mineral Resources.
Engineering and Infrastructure
Although sufficient provision has been made for the required infrastructure to support the Project at the planned production it will be required to refine designs to increase the confidence in the practicality of the provided infrastructure as well as in the associated capital and operating cost estimations. Provision has been made for further study work to obtain more detailed engineering designs to ultimately enhance the accuracy of the capital cost estimate.
Communications should commence with the CWC to negotiate the purchase of water and the associated costs from their dewatering at Blyvooruitzicht No. 4 Shaft.
Processing
A detailed design of the new TSF that incorporates a Dolomite Risk Mitigation Plan should be completed.
| |
| RESOURCE | RESERVE | VALUE |
Blyvoor Gold Operations (Pty) Ltd
S-K 1300 Technical Report Summary on the Blyvoor Tailings Retreatment Project, South Africa | 98 |
ITEM 24 - REFERENCES
| ● | ABGM (2016). Independent Competent Person’s Mineral Resource Statement on the Blyvooruitzicht |
| ● | AngloGold Ashanti (2018a). Operational Profile 2018 – Mponeng, West Wits, South Africa. 8pp. |
| ● | Australian Government, Office of the Chief Economist (2023). Department of Industry, Science, Energy and Resources. Resources and Energy Quarterly, December 2023. |
| ● | climate-data.org (2023). Carletonville Climate. Accessed through https://en.climate-data.org/africa/south-africa/gauteng/carletonville-1029/. |
| ● | Engelbrecht, C.J. (1986). The West Wits Line, in Witwatersrand gold –100 years (ed. E. S. A. Antrobus), 199–223, Johannesburg, Geological Society of South Africa. |
| ● | DRA Conceptual Capital Estimation, 2016. |
| ● | DRDGold (2014). Integrated Annual Report |
| ● | DRDGold (2016). Integrated Annual Report |
| ● | DRDGold (2018). Integrated Annual Report |
| ● | DRDGold (2020). Integrated Annual Report |
| | ● | Driefontein Overview. http://www.sibanyestillwater.com/our-business/southern-africa/gold/driefontein/overview |
| ● | Leyden, P. (2020). [Draft] Limited Legal Due Diligence Report Blyvoor Gold Tailings Retreatment Project May 2020 (Updated as at 12 October 2020). Herbert Smith Freehills South Africa LLP. |
| ● | Maelgwyn, Report 16-026. July 2016. Leach optimisation testwork, including Aachen pre-oxidation, on gold bearing tailings material from the Blyvooruitzicht Project |
| ● | Minxcon (2017). Operating Cost Review: Tailings Retreatment. P2017-028a |
| ● | Minxcon (2020). Blyvoor Gold Operations (Pty) Ltd (on Behalf of the Blyvoor Joint Venture). Scoping Study, Blyvoor Gold Tailing Retreatment Project, Carletonville. April 2020. 104pp. |
| ● | Rummer, W.T. (1992). Handbook on the estimation of Metallurgical Process Costs, Second Edition |
| ● | SGS Metallurgical Report No: 16/870 Rev 2 (2017) |
| ● | Super Laboratory Services testwork results from December 2015. |
| ● | Tailex (2017). Blyvooruitzicht Retreatment Tailings Storage Facility Study. TMS-BVG-001 |
| ● | Tailings Storage Facility 7. January 2016. V2. 46pp. |
| ● | United States Geological Survey (2024). Gold Data Sheet - Mineral Commodity Summaries 2024, January 2024. |
| ● | Whittaker D, E, J (2016). Independent Audit of the Blyvoor Gold (Pty) Ltd Surface Mineral Resources. For Randlord Surface Operations. 6 December 2016. 88pp. |
| ● | World Gold Council (2024). Gold Demand Trends, Full Year and Q4 2023. London, United Kingdom. Published: January 2024. |
| |
| RESOURCE | RESERVE | VALUE |
Blyvoor Gold Operations (Pty) Ltd
S-K 1300 Technical Report Summary on the Blyvoor Tailings Retreatment Project, South Africa | 99 |
ITEM 25 - RELIANCE ON INFORMATION PROVIDED BY THE REGISTRANT
The QPs have relied on information supplied by Blyvoor Ops, notably legal information in Leyden (2020), on the rights to retreat the TSFs. The QPs consider such reliance reasonable because the information constitutes legal and environmental matters outside the expertise of the QPs.
| |
| RESOURCE | RESERVE | VALUE |