UNITED STATES
SECURITIES AND EXCHANGE COMMISSION
WASHINGTON, D. C. 20549
FORM N-CSR
Investment Company Act file number: 811-02671
DWS Municipal Trust
(Exact Name of Registrant as Specified in Charter)
345 Park Avenue
New York, NY 10154-0004
(Address of Principal Executive Offices) (Zip Code)
Registrant’s Telephone Number, including Area Code: (212) 250-3220
Paul Schubert
60 Wall Street
New York, NY 10005
(Name and Address of Agent for Service)
| Date of fiscal year end: | 5/31 |
| Date of reporting period: | 5/31/2012 |
| ITEM 1. | REPORT TO STOCKHOLDERS |
MAY 31, 2012 Annual Report to Shareholders |
| DWS Strategic High Yield Tax-Free Fund |
 |
Contents
4 Portfolio Management Review 9 Performance Summary 12 Investment Portfolio 38 Statement of Assets and Liabilities 40 Statement of Operations 41 Statement of Cash Flows 42 Statement of Changes in Net Assets 43 Financial Highlights 48 Notes to Financial Statements 59 Report of Independent Registered Public Accounting Firm 60 Information About Your Fund's Expenses 61 Tax Information 62 Summary of Management Fee Evaluation by Independent Fee Consultant 66 Board Members and Officers 71 Account Management Resources |
This report must be preceded or accompanied by a prospectus. To obtain a summary prospectus, if available, or prospectus for any of our funds, refer to the Account Management Resources information provided in the back of this booklet. We advise you to consider the fund's objectives, risks, charges and expenses carefully before investing. The summary prospectus and prospectus contain this and other important information about the fund. Please read the prospectus carefully before you invest.
Bond investments are subject to interest-rate and credit risks. When interest rates rise, bond prices generally fall. Credit risk refers to the ability of an issuer to make timely payments of principal and interest. Investments in lower-quality and non-rated securities present greater risk of loss than investments in higher-quality securities. The fund invests in inverse floaters, which are derivatives that involve leverage and could magnify the fund's gains or losses. Although the fund seeks income that is federally tax-free, a portion of the fund's distributions may be subject to federal, state and local taxes, including the alternative minimum tax. See the prospectus for details.
DWS Investments is part of Deutsche Bank's Asset Management division and, within the U.S., represents the retail asset management activities of Deutsche Bank AG, Deutsche Bank Trust Company Americas, Deutsche Investment Management Americas Inc. and DWS Trust Company.
NOT FDIC/NCUA INSURED NO BANK GUARANTEE MAY LOSE VALUE NOT A DEPOSIT NOT INSURED BY ANY FEDERAL GOVERNMENT AGENCY
Overview of Market and Fund Performance
All performance information below is historical and does not guarantee future results. Returns shown are for Class A shares, unadjusted for sales charges. Investment return and principal fluctuate, so your shares may be worth more or less when redeemed. Current performance may differ from performance data shown. Please visit www.dws-investments.com for the most recent month-end performance of all share classes. Fund performance includes reinvestment of all distributions. Unadjusted returns do not reflect sales charges and would have been lower if they had. Please refer to pages 9 through 11 for more complete performance information.
The municipal market overall provided exceptionally strong returns over the fund's most recent fiscal period ended May 31, 2012. DWS Strategic High Yield Tax-Free Fund posted a return of 13.88% for the period. The overall municipal bond market, as measured by the unmanaged Barclays Municipal Bond Index, delivered a total return of 10.40% for the same period.
| "The municipal market overall provided exceptionally strong returns over the fund's most recent fiscal period." |
Throughout the period, the U.S. Federal Reserve Board (the Fed) kept short-term rates anchored near zero, in keeping with its announced intentions through at least late 2014. By contrast, longer-term U.S. Treasury rates were quite volatile as they responded to headlines surrounding the sovereign debt crisis in Europe and investors eagerly followed the stream of U.S. economic data. However, the overall trend with U.S. Treasury rates was downward, and taxable rates reached all-time lows late in the period as concerns over the viability of the euro heightened. Municipals overall benefited from the declining rate environment, as well as from relatively low new issue supply. Mutual fund flows were consistently positive beginning in late 2011, and retail buyers were supportive of municipals as well for most of the period. Along the municipal yield curve, the two-year bond yield decreased 11 basis points from 0.44% to 0.33%, while the 30-year yield fell 122 basis points from 4.30% to 3.08%, resulting in a total flattening of 111 basis points. (See the Municipal Bond Yield Curve graph on the following page for municipal bond yield changes from the beginning to the end of the period.) Credit spreads — the yield differential provided by lower-quality issues vs. AAA-rated issues — generally narrowed for the 12 months as investors sought incremental yield and fears of a municipal credit crisis continued to dissipate.
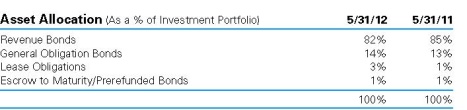
About Municipal Bonds A municipal bond is a bond issued by a state or local government, or one of its agencies. Issuers may include cities, counties, public utility districts and school districts, as well as publicly owned airports or seaports, redevelopment agencies and special purpose districts. For most municipal bonds, interest income received by holders is exempt from the federal income tax and from the income tax of the state in which it is issued. For general obligation bonds, payments of principal and interest are secured by the full faith and credit of the issuer and usually supported by the issuer's taxing power. For revenue bonds, principal and interest are secured by revenues from tolls, rents or other fees gained from the facility that was built with the bond issue proceeds. Projects financed by revenue bonds may include toll roads, bridges, airports, water and sewage treatment facilities, hospitals, and subsidized housing. Many of these bonds are issued by special authorities created for that particular purpose. The historical default rate for municipal bonds is significantly lower than that of corporate bonds. As with corporate bonds, municipal bonds are graded by ratings agencies such as Standard & Poor's and Moody's Investors Service, on a scale from "AAA", or the highest quality, down to more speculative levels. |
Municipal Bond Yield Curve (as of 5/31/11 and 5/31/12) |
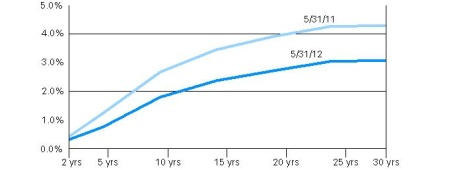 |
This chart is for illustrative purposes only and is not intended to represent the yield of any DWS fund. Performance is historical and does not guarantee future results.
Positive and Negative Contributors to Fund Performance
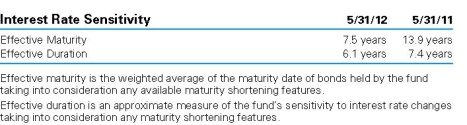
With a relatively steep yield curve as the period began, we had a tilt in the portfolio towards longer-term issues in the 20-to-30-year maturity range. This exposure added to relative performance, as longer-term issues benefited the most from the declining interest rate environment over the period.
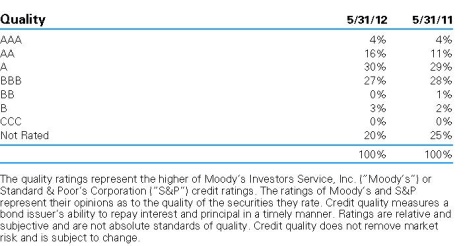
The fund has had significant exposure to municipal issues rated below- investment-grade, which boosted relative performance as credit spreads narrowed over the period. In addition, within the investment grade portion of the fund, we have maintained significant exposure to issues in the BBB or A ranges. This helped performance relative to the benchmark as credit spreads narrowed and prices rose for many of these issues. With respect to specific sectors, the fund's substantial exposure to health-care-related issues was a leading contributor to performance.
During the period, we hedged a portion of the fund's assets against interest rate changes using LIBOR (London Interbank Offered Rate, a benchmark for taxable interest rates) swaps. With a LIBOR swap, we in effect take a short position against the taxable market in order to manage the fund's overall duration and interest rate sensitivity. This hurt fund returns as the taxable market, as reflected by LIBOR, outperformed municipals across most maturities during the period, meaning that the value of the short position declined.
Outlook and Positioning
Municipal bond yields are at attractive levels on a historical basis vs. U.S. Treasury bonds. To illustrate, at the end of May 2012, the 10-year municipal bond yield of 1.79% was 113% of the comparable-maturity U.S. Treasury bond yield before taking into account the tax advantage of municipals. The 30-year municipal yield of 3.08% was 116% of the comparable U.S. Treasury yield. While the municipal yield curve has flattened in recent quarters, longer-term issues continue to carry a substantial yield advantage and we are continuing to focus purchases on bonds with maturities in the 20-to-25-year range.
While the economic climate remains uncertain, many state and local governments have shown progress in enacting necessary spending cuts and tax increases. Nonetheless, the expertise we bring to researching municipal sectors and individual issues continues to be of critical importance. We monitor the fund's holdings and will not hesitate to take appropriate action if there are signs of credit deterioration. We will continue to take a prudent approach to investing in the municipal market that emphasizes careful security selection and broad diversification, while seeking to maintain an attractive dividend and minimize capital gain distributions.
Portfolio Management Team
Philip G. Condon, Managing Director
Lead Portfolio Manager of the fund. Joined the fund in 1987.
• Head of US Retail Fixed Income Funds.
• Joined Deutsche Asset Management in 1983.
• Over 34 years of investment industry experience.
• BA and MBA, University of Massachusetts at Amherst.
Rebecca L. Flinn, Director
Portfolio Manager of the fund. Joined the fund in 1998.
• Joined Deutsche Asset Management in 1986.
• Over 24 years of investment industry experience.
• BA, University of Redlands, California.
A. Gene Caponi, CFA, Managing Director
Portfolio Manager of the fund. Joined the fund in 2009.
• Joined Deutsche Asset Management in 1998.
• Prior experience as an investment analyst and banker at T. Rowe Price Associates, Lehman Brothers, The Sanwa Bank and Ayco/American Express.
• Over 20 years of investment industry experience.
• BS, State University of New York, Oswego; MBA, State University of New York at Albany.
The views expressed reflect those of the portfolio management team only through the end of the period of the report as stated on the cover. The management team's views are subject to change at any time based on market and other conditions and should not be construed as a recommendation. Past performance is no guarantee of future results. Current and future portfolio holdings are subject to risk.
Terms to Know
The Barclays Municipal Bond Index is an unmanaged, market-value-weighted measure of municipal bonds issued across the United States. Index issues have a credit rating of at least Baa and a maturity of at least two years. Index returns do not reflect fees or expenses and it is not possible to invest directly into an index.
Sovereign debt is debt that is issued by a national government.
The yield curve is a graph with a left-to-right line that shows how high or low yields are, from the shortest to the longest maturities. Typically (and when the yield curve is characterized as "steep," this is especially true), the line rises from left to right as investors who are willing to tie up their money for a longer period are rewarded with higher yields.
One basis point equals 1/100 of a percentage point.
Short position is the sale of a borrowed security with the expectation that it will fall in value, while a long position is the purchase of a security with the expectation that it will increase in value.
Average Annual Total Returns as of 5/31/12 | ||||||||||||||||||||
| Unadjusted for Sales Charge | 1-Year | 3-Year | 5-Year | 10-Year | ||||||||||||||||
| Class A | 13.88 | % | 9.89 | % | 5.22 | % | 5.41 | % | ||||||||||||
| Class B | 13.02 | % | 9.07 | % | 4.41 | % | 4.60 | % | ||||||||||||
| Class C | 13.03 | % | 9.07 | % | 4.44 | % | 4.62 | % | ||||||||||||
Barclays Municipal Bond Index+ | 10.40 | % | 7.32 | % | 5.87 | % | 5.40 | % | ||||||||||||
| Adjusted for the Maximum Sales Charge | ||||||||||||||||||||
Class A (max 2.75% load) | 10.74 | % | 8.87 | % | 4.63 | % | 5.12 | % | ||||||||||||
Class B (max 4.00% CDSC) | 10.02 | % | 8.51 | % | 4.24 | % | 4.60 | % | ||||||||||||
Class C (max 1.00% CDSC) | 13.03 | % | 9.07 | % | 4.44 | % | 4.62 | % | ||||||||||||
Barclays Municipal Bond Index+ | 10.40 | % | 7.32 | % | 5.87 | % | 5.40 | % | ||||||||||||
| No Sales Charges | Life of Institutional Class* | |||||||||||||||||||
| Class S | 14.15 | % | 10.15 | % | 5.46 | % | 5.60 | % | N/A | |||||||||||
| Institutional Class | 14.17 | % | 10.21 | % | 5.50 | % | N/A | 5.51 | % | |||||||||||
Barclays Municipal Bond Index+ | 10.40 | % | 7.32 | % | 5.87 | % | 5.40 | % | 5.16 | % | ||||||||||
* Institutional Class shares commenced operations on August 19, 2002. The performance shown for the index is for the time period of August 31, 2002 through May 31, 2012, which is based on the performance period of the life of Institutional Class.
Performance in the Average Annual Total Returns table(s) above and the Growth of an Assumed $10,000 Investment line graph that follows is historical and does not guarantee future results. Investment return and principal fluctuate, so your shares may be worth more or less when redeemed. Current performance may differ from performance data shown. Please visit www.dws-investments.com for the Fund's most recent month-end performance. Fund performance includes reinvestment of all distributions. Unadjusted returns do not reflect sales charges and would have been lower if they had.
The gross expense ratios of the Fund, as stated in the fee table of the prospectus dated October 1, 2011 are 1.08%, 1.87%, 1.82%, 0.94% and 0.82% for Class A, Class B, Class C, Class S and Institutional Class shares, respectively, and may differ from the expense ratios disclosed in the Financial Highlights tables in this report.
Index returns do not reflect any fees or expenses and it is not possible to invest directly into an index.
Performance figures do not reflect the deduction of taxes that a shareholder would pay on fund distributions or the redemption of fund shares.
A portion of the Fund's distributions may be subject to federal, state and local taxes and the alternative minimum tax.
Growth of an Assumed $10,000 Investment (Adjusted for Maximum Sales Charge) |
 |
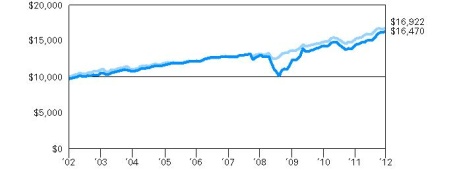 |
| Yearly periods ended May 31 |
The Fund's growth of an assumed $10,000 investment is adjusted for the maximum sales charge of 2.75%. This results in a net initial investment of $9,725.
The growth of $10,000 is cumulative.
Performance of other share classes will vary based on the sales charges and the fee structure of those classes.
+ The Barclays Municipal Bond Index is an unmanaged, market-value-weighted measure of municipal bonds issued across the United States. Index issues have a credit rating of at least Baa and a maturity of at least two years.
| Net Asset Value and Distribution Information | ||||||||||||||||||||
| Class A | Class B | Class C | Class S | Institutional Class | ||||||||||||||||
Net Asset Value: 5/31/12 | $ | 12.78 | $ | 12.78 | $ | 12.79 | $ | 12.79 | $ | 12.79 | ||||||||||
| 5/31/11 | $ | 11.78 | $ | 11.78 | $ | 11.79 | $ | 11.79 | $ | 11.79 | ||||||||||
Distribution Information: Twelve Months as of 5/31/12: Income Dividends | $ | .59 | $ | .50 | $ | .50 | $ | .62 | $ | .63 | ||||||||||
| Capital Gain Distributions | $ | .002 | $ | .002 | $ | .002 | $ | .002 | $ | .002 | ||||||||||
| May Income Dividend | $ | .0462 | $ | .0380 | $ | .0382 | $ | .0489 | $ | .0489 | ||||||||||
SEC 30-day Yield++ as of 5/31/12 | 3.05 | % | 2.39 | % | 2.39 | % | 3.38 | % | 3.38 | % | ||||||||||
Tax Equivalent Yield++ as of 5/31/12 | 4.69 | % | 3.68 | % | 3.68 | % | 5.20 | % | 5.20 | % | ||||||||||
Current Annualized Distribution Rate++ as of 5/31/12 | 4.34 | % | 3.57 | % | 3.58 | % | 4.59 | % | 4.59 | % | ||||||||||
++ The SEC yield is net investment income per share earned over the month ended May 31, 2012 shown as an annualized percentage of the maximum offering price per share on the last day of the period. The SEC yield is computed in accordance with a standardized method prescribed by the Securities and Exchange Commission. The SEC yield would have been 3.00%, 2.33%, 2.34%, 3.19% and 3.31% for Classes A, B, C, S and Institutional shares, respectively, had certain expenses not been reduced. Tax equivalent yield is based on the Fund's yield and a marginal federal income rate of 35%. Current annualized distribution rate is the latest monthly dividend shown as an annualized percentage of net asset value on May 31, 2012. Distribution rate simply measures the level of dividends and is not a complete measure of performance. The current annualized distribution rate would have been 4.29%, 3.51%, 3.53%, 4.40% and 4.52% for Classes A, B, C, S and Institutional shares, respectively, had certain expenses not been reduced. Yields and distribution rates are historical, not guaranteed and will fluctuate.
Morningstar Rankings — High-Yield Municipal Funds Category as of 5/31/12 | ||||
| Period | Rank | Number of Fund Classes Tracked | Percentile Ranking (%) | |
Class A 1-Year | 117 | of | 163 | 71 |
| 3-Year | 121 | of | 142 | 85 |
| 5-Year | 9 | of | 125 | 7 |
| 10-Year | 17 | of | 87 | 19 |
Class B 1-Year | 141 | of | 163 | 86 |
| 3-Year | 136 | of | 142 | 95 |
| 5-Year | 34 | of | 125 | 27 |
| 10-Year | 54 | of | 87 | 62 |
Class C 1-Year | 140 | of | 163 | 85 |
| 3-Year | 135 | of | 142 | 95 |
| 5-Year | 32 | of | 125 | 25 |
| 10-Year | 50 | of | 87 | 57 |
Class S 1-Year | 109 | of | 163 | 67 |
| 3-Year | 111 | of | 142 | 78 |
| 5-Year | 5 | of | 125 | 4 |
| 10-Year | 11 | of | 87 | 12 |
Institutional Class 1-Year | 108 | of | 163 | 66 |
| 3-Year | 109 | of | 142 | 76 |
| 5-Year | 4 | of | 125 | 3 |
Source: Morningstar, Inc. Rankings are historical and do not guarantee future results. Rankings are based on total return unadjusted for sales charges with distributions reinvested. If sales charges had been included, rankings might have been less favorable.
| Principal Amount ($) | Value ($) | |||||||
| Municipal Bonds and Notes 93.0% | ||||||||
| Alabama 0.1% | ||||||||
| Montgomery, AL, Medical Clinic Board, Health Care Facility Revenue, Jackson Hospital & Clinic, 5.25%, 3/1/2036 | 2,000,000 | 2,023,900 | ||||||
| Arizona 1.2% | ||||||||
| Arizona, Salt Verde Financial Corp., Gas Revenue, 5.25%, 12/1/2025 | 4,000,000 | 4,328,240 | ||||||
| Maricopa County, AZ, Pollution Control Corp. Revenue, El Paso Electric Co. Project, Series B, 7.25%, 4/1/2040 | 3,930,000 | 4,695,878 | ||||||
| Pima County, AZ, Industrial Development Revenue, Tucson Electric Power: | ||||||||
| 5.75%, 9/1/2029 | 2,250,000 | 2,393,280 | ||||||
| Series A, 6.375%, 9/1/2029 | 5,000,000 | 5,120,550 | ||||||
| Tempe, AZ, Industrial Development Authority Revenue, Tempe Life Care Village, Inc.: | ||||||||
| Series A, 6.25%, 12/1/2042 | 1,535,000 | 1,612,932 | ||||||
| Series A, 6.25%, 12/1/2046 | 1,400,000 | 1,465,814 | ||||||
| Yavapai County, AZ, Industrial Development Authority, Solid Waste Disposal Revenue, Waste Management, Inc. Project, Series A-1, 144A, AMT, 4.9%, 3/1/2028 | 5,000,000 | 5,242,650 | ||||||
| 24,859,344 | ||||||||
| California 10.9% | ||||||||
| California, Bay Area Toll Authority, Toll Bridge Revenue, San Francisco Bay Area: | ||||||||
| Series E-1, 0.13%***, 4/1/2045, LOC: Bank of Tokyo-Mitsubishi UFJ | 18,600,000 | 18,600,000 | ||||||
| Series F-1, 5.125%, 4/1/2039 | 10,000,000 | 11,056,300 | ||||||
| Series F-1, 5.5%, 4/1/2043 | 10,000,000 | 11,121,800 | ||||||
| California, M-S-R Energy Authority, Series B, 7.0%, 11/1/2034 | 8,750,000 | 11,420,237 | ||||||
| California, Morongo Band of Mission Indians, Enterprise Casino Revenue, Series B, 144A, 6.5%, 3/1/2028 | 5,000,000 | 5,077,500 | ||||||
| California, State General Obligation: | ||||||||
| 5.0%, 2/1/2032 | 10,000,000 | 11,138,300 | ||||||
| 5.0%, 8/1/2034 | 5,185,000 | 5,540,069 | ||||||
| 5.0%, 9/1/2041 | 5,000,000 | 5,373,100 | ||||||
| 5.5%, 3/1/2040 | 5,130,000 | 5,800,440 | ||||||
| California, State General Obligation, Various Purposes: | ||||||||
| 5.0%, 11/1/2032 | 10,000,000 | 10,932,600 | ||||||
| 5.0%, 6/1/2037 | 10,000,000 | 10,469,900 | ||||||
| 5.0%, 11/1/2037 | 9,145,000 | 9,744,180 | ||||||
| 5.0%, 12/1/2037 | 5,000,000 | 5,256,000 | ||||||
| 5.0%, 4/1/2038 | 2,650,000 | 2,788,622 | ||||||
| 5.25%, 10/1/2032 | 10,000,000 | 11,352,800 | ||||||
| 5.25%, 4/1/2035 | 6,135,000 | 6,893,715 | ||||||
| 5.75%, 4/1/2031 | 23,360,000 | 27,293,590 | ||||||
| California, State Health Facilities Financing Authority Revenue, Catholic Healthcare West, Series C, 0.12%***, 3/1/2047, LOC: Bank of Montreal | 1,000,000 | 1,000,000 | ||||||
| California, State Public Works Board, Lease Revenue, Capital Projects: | ||||||||
| Series A-1, 6.0%, 3/1/2035 | 10,175,000 | 11,884,196 | ||||||
| Series I-1, 6.375%, 11/1/2034 | 5,000,000 | 5,996,750 | ||||||
| California, Statewide Communities Development Authority Revenue, Kaiser Permanente, Series A, 5.0%, 4/1/2042 | 2,645,000 | 2,865,990 | ||||||
| Long Beach, CA, Bond Finance Authority, Natural Gas Purchase Revenue, Series A, 5.25%, 11/15/2023 | 620,000 | 673,153 | ||||||
| Los Angeles, CA, Department of Water & Power Revenue, Power Systems, Series A-3, 0.13%***, 7/1/2035, SPA: Scotiabank | 2,150,000 | 2,150,000 | ||||||
| San Buenaventura, CA, Community Memorial Health Systems, 7.5%, 12/1/2041 | 3,250,000 | 3,861,228 | ||||||
| San Diego, CA, Community College District, Election of 2006, 5.0%, 8/1/2036 | 2,050,000 | 2,321,051 | ||||||
| San Francisco City & County, CA, Redevelopment Agency, Leland Polk Senior Community, Series A, AMT, 0.26%***, 12/1/2019, LOC: Citibank NA | 2,790,000 | 2,790,000 | ||||||
| San Francisco, CA, City & County Public Utilities Commission, Water Revenue, Series A, 5.125%, 11/1/2039 | 10,400,000 | 11,704,888 | ||||||
| San Francisco, CA, City & County Redevelopment Financing Authority, Tax Allocation, Mission Bay South Redevelopment, Series D, 7.0%, 8/1/2041 | 1,400,000 | 1,584,324 | ||||||
| Vernon, CA, Electric Systems Revenue, Series A, 5.5%, 8/1/2041 | 2,240,000 | 2,355,606 | ||||||
| 219,046,339 | ||||||||
| Colorado 1.8% | ||||||||
| Colorado, E-470 Public Highway Authority Revenue: | ||||||||
| Series C, 5.375%, 9/1/2026 | 2,000,000 | 2,144,980 | ||||||
| Series A-1, 5.5%, 9/1/2024, INS: NATL | 3,500,000 | 3,793,160 | ||||||
| Colorado, Health Facilities Authority Revenue, Christian Living Communities Project, Series A, 5.75%, 1/1/2037 | 1,000,000 | 1,018,860 | ||||||
| Colorado, Health Facilities Authority Revenue, Covenant Retirement Communities, Inc., 5.0%, 12/1/2035 | 11,750,000 | 11,287,050 | ||||||
| Colorado, Health Facilities Authority Revenue, Valley View Hospital Association, 5.75%, 5/15/2036 | 2,000,000 | 2,129,820 | ||||||
| Colorado, Housing & Finance Authority, Single Family Mortgage, "I", Series B3, 0.17%***, 11/1/2021, LOC: Fannie Mae, Freddie Mac | 1,075,000 | 1,075,000 | ||||||
| Colorado, Public Energy Authority, Natural Gas Purchased Revenue, 6.25%, 11/15/2028, GTY: Merrill Lynch & Co., Inc. | 6,365,000 | 7,651,812 | ||||||
| Colorado, Regional Transportation District, Private Activity Revenue, Denver Transit Partners, 6.0%, 1/15/2041 | 2,000,000 | 2,240,360 | ||||||
| Colorado, State Health Facilities Authority Revenue, Christian Living Community, 6.375%, 1/1/2041 | 1,615,000 | 1,736,771 | ||||||
| Montrose, CO, Memorial Hospital Revenue, 6.375%, 12/1/2023 | 2,355,000 | 2,504,590 | ||||||
| 35,582,403 | ||||||||
| Connecticut 1.6% | ||||||||
| Connecticut, Harbor Point Infrastructure Improvement District, Special Obligation Revenue, Harbor Point Project, Series A, 7.875%, 4/1/2039 | 20,000,000 | 22,634,400 | ||||||
| Connecticut, Mohegan Tribe Indians Gaming Authority, Priority Distribution, 144A, 5.25%, 1/1/2033 | 3,000,000 | 2,434,590 | ||||||
| Hamden, CT, Facility Revenue, Whitney Center Project, Series A, 7.625%, 1/1/2030 | 1,200,000 | 1,305,144 | ||||||
| Mashantucket, CT, Mashantucket Western Pequot Tribe, Special Revenue, Series A, 144A, 6.5%, 9/1/2031* | 7,295,000 | 2,907,860 | ||||||
| Mashantucket, CT, Project Revenue, Mashantucket Western Pequot Tribe: | ||||||||
| Series B, 144A, Zero Coupon, 9/1/2010* | 2,000,000 | 649,180 | ||||||
| Series B, 144A, Zero Coupon, 9/1/2011* | 2,000,000 | 649,180 | ||||||
| Series B, 144A, Zero Coupon, 9/1/2012* | 2,000,000 | 649,180 | ||||||
| Series B, 144A, Zero Coupon, 9/1/2013* | 2,000,000 | 614,980 | ||||||
| Series B, 144A, Zero Coupon, 9/1/2014* | 2,000,000 | 581,180 | ||||||
| Mashantucket, CT, Sports, Expo & Entertainment Revenue, Mashantucket Western Pequot Tribe, Series B, 144A, 5.7%, 9/1/2012* | 1,000,000 | 386,800 | ||||||
| 32,812,494 | ||||||||
| Florida 6.8% | ||||||||
| Bayside, FL, Sales & Special Tax Revenue, Community Development District, Series A, 6.3%, 5/1/2018 | 295,000 | 286,498 | ||||||
| Florida, Capital Region Community Development District, Capital Improvement Revenue, Series A, 7.0%, 5/1/2039 | 6,175,000 | 5,745,776 | ||||||
| Florida, Harbourage at Braden River Community Development District, Capital Improvement Revenue, Series A, 6.125%, 5/1/2034 | 1,380,000 | 1,385,713 | ||||||
| Florida, Middle Village Community Development District, Special Assessment, Series A, 6.0%, 5/1/2035 | 8,500,000 | 7,844,735 | ||||||
| Florida, Special Assessment Revenue, East Park Community Development District, Series A, 7.5%, 5/1/2039* | 1,715,000 | 1,298,186 | ||||||
| Florida, Tolomato Community Development District, Special Assessment, 5.4%, 5/1/2037 | 17,085,000 | 14,772,545 | ||||||
| Florida, Village Community Development District No. 9, Special Assessment Revenue: | ||||||||
| 5.5%, 5/1/2042 | 1,575,000 | 1,641,544 | ||||||
| 7.0%, 5/1/2041 | 1,995,000 | 2,283,597 | ||||||
| Highlands County, FL, Health Facilities Authority Revenue, Adventist Health System: | ||||||||
| Series G, 5.125%, 11/15/2020 | 970,000 | 1,086,235 | ||||||
| Series G, Prerefunded, 5.125%, 11/15/2020 | 30,000 | 35,832 | ||||||
| Series G, Prerefunded, 5.125%, 11/15/2021 | 70,000 | 83,609 | ||||||
| Series G, 5.125%, 11/15/2022 | 2,205,000 | 2,434,959 | ||||||
| Series G, Prerefunded, 5.125%, 11/15/2022 | 75,000 | 89,581 | ||||||
| Series G, 5.125%, 11/15/2023 | 2,245,000 | 2,463,461 | ||||||
| Series G, Prerefunded, 5.125%, 11/15/2023 | 180,000 | 214,994 | ||||||
| Hillsborough County, FL, Industrial Development Authority Revenue, Health Facilities, University Community Hospital, Series A, Prerefunded, 5.625%, 8/15/2029 | 6,625,000 | 8,465,425 | ||||||
| Lee County, FL, Airport Revenue, Series A, AMT, 5.375%, 10/1/2032 | 1,750,000 | 1,897,893 | ||||||
| Martin County, FL, Health Facilities Authority, Martin Memorial Medical Center, 5.5%, 11/15/2042 | 3,040,000 | 3,227,446 | ||||||
| Miami Beach, FL, Health Facilities Authority, Mount Sinai Medical Center: | ||||||||
| 144A, 6.75%, 11/15/2029 | 7,005,000 | 7,574,717 | ||||||
| 144A, Prerefunded, 6.75%, 11/15/2029 | 1,095,000 | 1,258,900 | ||||||
| Miami-Dade County, FL, Aviation Revenue, Miami International Airport: | ||||||||
| Series A, AMT, 5.25%, 10/1/2033, INS: AGC | 10,000,000 | 10,620,800 | ||||||
| Series A-1, 5.5%, 10/1/2041 | 5,000,000 | 5,642,000 | ||||||
| Miami-Dade County, FL, Double Barreled Aviation, 5.0%, 7/1/2041 | 5,000,000 | 5,529,500 | ||||||
| Miami-Dade County, FL, Water & Sewer Systems Revenue, 5.0%, 10/1/2034 | 3,650,000 | 4,057,960 | ||||||
| Orange County, FL, Health Facilities Authority Revenue, Orlando Regional Healthcare, Series C, 5.25%, 10/1/2035 | 5,000,000 | 5,365,150 | ||||||
| Orlando, FL, Greater Aviation Authority, Airport Facilities Revenue, Jet Blue Airways Corp., AMT, 6.5%, 11/15/2036 | 1,000,000 | 1,014,300 | ||||||
| Palm Beach County, FL, Health Facilities Authority Revenue, Waterford Project, 5.375%, 11/15/2022 | 2,600,000 | 2,699,996 | ||||||
| Palm Beach County, FL, Health Facilities Authority, Retirement Community Revenue, Acts Retirement-Life Communities, Inc., 5.5%, 11/15/2033 | 9,000,000 | 9,662,940 | ||||||
| Port St. Lucie, FL, Special Assessment Revenue, Southwest Annexation District 1, Series B, 5.0%, 7/1/2027, INS: NATL | 2,500,000 | 2,590,600 | ||||||
| Seminole Tribe, FL, Special Obligation Revenue: | ||||||||
| Series A, 144A, 5.5%, 10/1/2024 | 8,000,000 | 8,365,440 | ||||||
| Series A, 144A, 5.75%, 10/1/2022 | 9,500,000 | 10,138,020 | ||||||
| South Miami, FL, Health Facilities Authority Hospital Revenue, Baptist Health South Florida Group: | ||||||||
| 5.0%, 8/15/2024 | 1,000,000 | 1,123,100 | ||||||
| 5.0%, 8/15/2025 | 5,000,000 | 5,597,050 | ||||||
| 136,498,502 | ||||||||
| Georgia 4.0% | ||||||||
| Americus-Sumter County, GA, Hospital & Healthcare Revenue, Hospital Authority, South Georgia Methodist, Series A, 6.375%, 5/15/2029 | 3,000,000 | 3,000,720 | ||||||
| Atlanta, GA, Airport Revenue, Series C, AMT, 5.0%, 1/1/2037 | 935,000 | 1,003,021 | ||||||
| Atlanta, GA, Tax Allocation, Beltline Project, Series B, 7.375%, 1/1/2031 | 4,915,000 | 5,432,205 | ||||||
| Atlanta, GA, Tax Allocation, Princeton Lakes Project, 144A, 5.5%, 1/1/2031 | 1,045,000 | 1,055,764 | ||||||
| Atlanta, GA, Water & Wastewater Revenue: | ||||||||
| Series B, 5.375%, 11/1/2039, INS: AGMC | 10,000,000 | 11,288,300 | ||||||
| Series A, 6.25%, 11/1/2034 | 10,000,000 | 12,013,800 | ||||||
| De Kalb County, GA, Hospital Authority Revenue, Anticipation Certificates, Dekalb Medical Center, Inc. Project, 6.125%, 9/1/2040 | 7,500,000 | 8,312,475 | ||||||
| De Kalb County, GA, Water & Sewer Revenue: | ||||||||
| Series A, 5.25%, 10/1/2032 | 820,000 | 947,871 | ||||||
| Series A, 5.25%, 10/1/2033 | 1,365,000 | 1,569,573 | ||||||
| Series A, 5.25%, 10/1/2036 | 4,635,000 | 5,258,083 | ||||||
| Series A, 5.25%, 10/1/2041 | 8,985,000 | 10,124,388 | ||||||
| Georgia, Glynn-Brunswick Memorial Hospital Authority Revenue, Anticipation Certificates-Southeast Health, Series A, 5.625%, 8/1/2034 | 5,500,000 | 5,932,410 | ||||||
| Georgia, Main Street Natural Gas, Inc., Gas Project Revenue: | ||||||||
| Series A, 5.0%, 3/15/2019 (a) | 10,000,000 | 11,363,700 | ||||||
| Series A, 5.5%, 9/15/2024 | 2,440,000 | 2,701,226 | ||||||
| 80,003,536 | ||||||||
| Guam 0.8% | ||||||||
| Government of Guam, General Obligation, Series A, 7.0%, 11/15/2039 | 10,155,000 | 11,325,567 | ||||||
| Government of Guam, Waterworks Authority, Water & Wastewater System Revenue, 5.5%, 7/1/2016 | 1,300,000 | 1,338,688 | ||||||
| Guam, Power Authority Revenue, Series A, 5.5%, 10/1/2030 | 3,000,000 | 3,138,420 | ||||||
| 15,802,675 | ||||||||
| Hawaii 1.7% | ||||||||
| Hawaii, State Airports Systems Revenue, Series A, 5.0%, 7/1/2034 | 15,000,000 | 16,367,700 | ||||||
| Hawaii, State Department of Budget & Finance, Special Purpose Revenue, 15 Craigside Project, Series A, 9.0%, 11/15/2044 | 2,000,000 | 2,389,540 | ||||||
| Hawaii, State Department of Budget & Finance, Special Purpose Revenue, Hawaiian Electric Co., Inc.: | ||||||||
| Series B, AMT, 4.6%, 5/1/2026, INS: FGIC | 11,790,000 | 12,151,835 | ||||||
| 6.5%, 7/1/2039, GTY: Hawaiian Electric Co., Inc. | 2,500,000 | 2,902,175 | ||||||
| 33,811,250 | ||||||||
| Illinois 7.5% | ||||||||
| Channahon, IL, Morris Hospital Revenue, Series D, 0.17%***, 12/1/2032, LOC: U.S. Bank NA | 2,850,000 | 2,850,000 | ||||||
| Chicago, IL, Board of Education, Series A, 5.5%, 12/1/2039 | 10,000,000 | 11,452,300 | ||||||
| Chicago, IL, Board of Education, Dedicated Revenues, Series A-2, 0.16%***, 3/1/2026, LOC: Northern Trust Co. | 5,900,000 | 5,900,000 | ||||||
| Chicago, IL, General Obligation: | ||||||||
| Series A, 5.0%, 1/1/2033 | 10,000,000 | 11,036,300 | ||||||
| Series A, 5.25%, 1/1/2029, INS: AGMC | 175,000 | 183,410 | ||||||
| Series A, 5.25%, 1/1/2035 | 4,050,000 | 4,478,125 | ||||||
| Chicago, IL, O'Hare International Airport Revenue, Third Lien: | ||||||||
| Series A, 5.75%, 1/1/2039 | 9,955,000 | 11,566,914 | ||||||
| Series B, 6.0%, 1/1/2041 | 12,095,000 | 14,255,893 | ||||||
| Chicago, IL, Waterworks Revenue, 5.0%, 11/1/2042 | 4,410,000 | 4,936,113 | ||||||
| Illinois, Finance Authority Revenue, Elmhurst Memorial Healthcare, Series A, 5.625%, 1/1/2037 | 11,000,000 | 11,679,800 | ||||||
| Illinois, Finance Authority Revenue, Friendship Village of Schaumburg: | ||||||||
| Series A, 5.625%, 2/15/2037 | 5,000,000 | 4,787,450 | ||||||
| 7.25%, 2/15/2045 | 4,000,000 | 4,280,240 | ||||||
| Illinois, Finance Authority Revenue, Park Place of Elmhurst: | ||||||||
| Series D-3, 6.25%, 8/15/2015 | 1,505,000 | 1,504,880 | ||||||
| Series A, 8.125%, 5/15/2040 | 8,000,000 | 8,261,280 | ||||||
| Illinois, Finance Authority Revenue, Roosevelt University Project, 6.5%, 4/1/2044 | 5,000,000 | 5,487,450 | ||||||
| Illinois, Finance Authority Revenue, Rush University Medical Center, Series B, 5.75%, 11/1/2028, INS: NATL | 1,250,000 | 1,394,750 | ||||||
| Illinois, Finance Authority Revenue, Swedish Covenant Hospital, Series A, 6.0%, 8/15/2038 | 7,830,000 | 8,691,926 | ||||||
| Illinois, Finance Authority Revenue, The Admiral at Lake Project: | ||||||||
| Series D-3, 6.0%, 5/15/2017 | 1,000,000 | 1,000,480 | ||||||
| Series A, 7.75%, 5/15/2030 | 1,675,000 | 1,864,375 | ||||||
| Series A, 8.0%, 5/15/2040 | 1,000,000 | 1,118,310 | ||||||
| Series A, 8.0%, 5/15/2046 | 3,500,000 | 3,914,085 | ||||||
| Illinois, Finance Authority Revenue, Three Crowns Park Plaza: | ||||||||
| Series A, 5.875%, 2/15/2026 | 1,225,000 | 1,256,666 | ||||||
| Series A, 5.875%, 2/15/2038 | 500,000 | 506,410 | ||||||
| Illinois, Metropolitan Pier & Exposition Authority, Dedicated State Tax Revenue, McCormick Place, Series B, 5.0%, 6/15/2050, INS: AGMC | 8,000,000 | 8,443,840 | ||||||
| Illinois, Municipal Electric Agency, Power Supply Revenue: | ||||||||
| Series A, 5.25%, 2/1/2023, INS: FGIC, NATL | 3,500,000 | 3,987,235 | ||||||
| Series A, 5.25%, 2/1/2024, INS: FGIC, NATL | 2,500,000 | 2,829,100 | ||||||
| Illinois, Railsplitter Tobacco Settlement Authority, 6.0%, 6/1/2028 | 6,405,000 | 7,362,612 | ||||||
| Illinois, State Finance Authority Revenue, Ascension Health Credit Group: | ||||||||
| Series A, 5.0%, 11/15/2032 | 2,435,000 | 2,725,788 | ||||||
| Series A, 5.0%, 11/15/2037 | 1,715,000 | 1,876,450 | ||||||
| Illinois, State Finance Authority Revenue, Trinity Health Corp., Series L, 5.0%, 12/1/2030 | 1,500,000 | 1,640,535 | ||||||
| 151,272,717 | ||||||||
| Indiana 0.5% | ||||||||
| Indiana, Health & Educational Facility Financing Authority, Hospital Revenue, Community Foundation Northwest, 5.5%, 3/1/2037 | 1,750,000 | 1,813,735 | ||||||
| Indiana, Hospital & Healthcare Revenue, Health Facilities Finance Authority, Greenwood Village South Project, 5.625%, 5/15/2028 | 1,000,000 | 907,400 | ||||||
| North Manchester, IN, Peabody Retirement Community Project Revenue, Series A, 2.755%, 7/1/2033 (b) | 3,000,000 | 1,019,550 | ||||||
| Vigo County, IN, Hospital Authority Revenue, Union Hospital, Inc.: | ||||||||
| 144A, 5.5%, 9/1/2027 | 1,000,000 | 1,022,750 | ||||||
| 8.0%, 9/1/2041 | 4,000,000 | 4,716,920 | ||||||
| 9,480,355 | ||||||||
| Iowa 0.6% | ||||||||
| Altoona, IA, Urban Renewal Tax Increment Revenue, Annual Appropriation: | ||||||||
| 6.0%, 6/1/2034 | 1,000,000 | 1,074,310 | ||||||
| 6.0%, 6/1/2039 | 2,000,000 | 2,138,440 | ||||||
| Cedar Rapids, IA, First Mortgage Revenue, Cottage Grove Place, Series A, 5.875%, 7/1/2028 | 5,335,000 | 3,949,874 | ||||||
| Iowa, Finance Authority Retirement Community Revenue, Edgewater LLC Project, 6.5%, 11/15/2027 | 5,000,000 | 4,904,450 | ||||||
| 12,067,074 | ||||||||
| Kansas 0.6% | ||||||||
| Lenexa, KS, Health Care Facility Revenue, 5.5%, 5/15/2039 | 6,340,000 | 6,252,128 | ||||||
| Lenexa, KS, Health Care Facility Revenue, Lakeview Village, Inc. Project, 7.25%, 5/15/2039 | 1,200,000 | 1,313,460 | ||||||
| Wichita, KS, Hospital Revenue, Facilities Improvement, Series III-A, 5.0%, 11/15/2034 | 3,410,000 | 3,647,166 | ||||||
| Wyandotte County, KS, Unified Government Special Obligation Revenue, Sales Tax, Series B, 5.0%, 12/1/2020 | 1,345,000 | 1,426,399 | ||||||
| 12,639,153 | ||||||||
| Kentucky 1.1% | ||||||||
| Kentucky, Economic Development Finance Authority, Hospital Facilities Revenue, Owensboro Medical Health Systems, Series A, 6.5%, 3/1/2045 | 15,000,000 | 17,439,900 | ||||||
| Kentucky, Economic Development Finance Authority, Louisville Arena Project Revenue, Series A-1, 6.0%, 12/1/2033, INS: AGC | 3,635,000 | 4,012,277 | ||||||
| Louisville & Jefferson County, KY, Metropolitan Government Health Systems Revenue, Norton Healthcare, Inc., 5.0%, 10/1/2030 | 1,000,000 | 1,031,940 | ||||||
| 22,484,117 | ||||||||
| Louisiana 2.2% | ||||||||
| DeSoto Parish, LA, Environmental Improvement Revenue, International Paper Co. Project: | ||||||||
| Series A, AMT, 5.0%, 11/1/2018 | 1,260,000 | 1,346,285 | ||||||
| Series A, AMT, 5.75%, 9/1/2031 | 5,000,000 | 5,269,850 | ||||||
| Louisiana, Local Government Environmental Facilities & Community Development, Westlake Chemical Corp., Series A, 6.5%, 8/1/2029 | 6,055,000 | 7,002,183 | ||||||
| Louisiana, Local Government Environmental Facilities, Community Development Authority Revenue, 6.75%, 11/1/2032 | 6,000,000 | 6,679,140 | ||||||
| Louisiana, Public Facilities Authority Revenue, Ochsner Clinic Foundation Project, 6.75%, 5/15/2041 | 2,500,000 | 2,929,900 | ||||||
| Louisiana, Public Facilities Authority, Hospital Revenue, Lafayette General Medical Center, 5.5%, 11/1/2040 | 5,000,000 | 5,404,050 | ||||||
| Louisiana, St. John Baptist Parish Revenue, Marathon Oil Corp., Series A, 5.125%, 6/1/2037 | 15,000,000 | 15,646,050 | ||||||
| 44,277,458 | ||||||||
| Maine 0.5% | ||||||||
| Maine, Health & Higher Educational Facilities Authority Revenue, Maine General Medical Center, 6.75%, 7/1/2036 | 9,000,000 | 10,336,500 | ||||||
| Maryland 1.9% | ||||||||
| Anne Arundel County, MD, Special Obligation, National Business Park North Project, 6.1%, 7/1/2040 | 2,200,000 | 2,313,652 | ||||||
| Maryland, State Economic Development Corp. Revenue, Senior Lien Project, Chesapeake Bay: | ||||||||
| Series A, 5.0%, 12/1/2031 | 7,000,000 | 4,688,670 | ||||||
| Series B, 5.25%, 12/1/2031 | 3,400,000 | 2,375,512 | ||||||
| Maryland, State Health & Higher Educational Facilities Authority Revenue, Adventist Healthcare, Series A, 6.125%, 1/1/2036 | 3,250,000 | 3,670,810 | ||||||
| Maryland, State Health & Higher Educational Facilities Authority Revenue, Doctors Community Hospital, Inc., 5.75%, 7/1/2038 | 6,250,000 | 6,658,750 | ||||||
| Maryland, State Health & Higher Educational Facilities Authority Revenue, Mercy Medical Center: | ||||||||
| Series A, 5.0%, 7/1/2037 | 5,005,000 | 5,100,295 | ||||||
| 6.25%, 7/1/2031 | 2,500,000 | 2,936,250 | ||||||
| Maryland, State Health & Higher Educational Facilities Authority Revenue, Washington County Hospital: | ||||||||
| 5.75%, 1/1/2033 | 2,660,000 | 2,827,155 | ||||||
| 6.0%, 1/1/2028 | 6,100,000 | 6,633,262 | ||||||
| 37,204,356 | ||||||||
| Massachusetts 3.6% | ||||||||
| Boston, MA, Industrial Development Financing Authority Revenue, Crosstown Center Project: | ||||||||
| AMT, 6.5%, 9/1/2035 | 8,805,000 | 6,748,152 | ||||||
| AMT, 8.0%, 9/1/2035* | 960,000 | 327,264 | ||||||
| Massachusetts, Development Finance Agency, Senior Living Facility Revenue, Groves-Lincoln: | ||||||||
| Series A, 7.75%, 6/1/2039 | 1,250,000 | 941,875 | ||||||
| Series A, 7.875%, 6/1/2044 | 1,250,000 | 941,950 | ||||||
| Massachusetts, Hospital & Healthcare Revenue, Health & Educational Facilities Authority, Civic Investments, Series A, Prerefunded, 9.0%, 12/15/2015, GTY: Harvard Pilgrim Health Care | 2,400,000 | 2,545,032 | ||||||
| Massachusetts, Industrial Development Revenue, Development Finance Agency, Series A, 7.1%, 7/1/2032 | 3,525,000 | 3,293,231 | ||||||
| Massachusetts, Project Revenue, Health & Educational Facilities Authority, Jordan Hospital, Series E, 6.75%, 10/1/2033 | 7,450,000 | 7,607,791 | ||||||
| Massachusetts, State Development Finance Agency Revenue, Linden Ponds, Inc. Facility: | ||||||||
| Series B, 11/15/2056* | 430,598 | 2,222 | ||||||
| Series A-2, 5.5%, 11/15/2046 | 86,572 | 53,617 | ||||||
| Series A-1, 6.25%, 11/15/2039 | 1,621,881 | 1,202,527 | ||||||
| Massachusetts, State Development Finance Agency Revenue, Masonic Nursing Home, Series B, 0.12%***, 7/1/2032, LOC: TD Bank NA | 2,500,000 | 2,500,000 | ||||||
| Massachusetts, State Development Finance Agency Revenue, Partners Healthcare System, Inc., Series L, 5.0%, 7/1/2036 | 6,070,000 | 6,720,765 | ||||||
| Massachusetts, State Development Finance Agency Revenue, Tufts Medical Center, Inc., Series I, 7.25%, 1/1/2032 | 2,250,000 | 2,728,417 | ||||||
| Massachusetts, State Health & Educational Facilities Authority Revenue, Caregroup Healthcare System: | ||||||||
| Series E-1, 5.0%, 7/1/2028 | 1,500,000 | 1,593,135 | ||||||
| Series E-1, 5.125%, 7/1/2038 | 1,500,000 | 1,562,715 | ||||||
| Massachusetts, State Health & Educational Facilities Authority Revenue, Jordan Hospital, Series B, 6.875%, 10/1/2015 | 3,195,000 | 3,203,563 | ||||||
| Massachusetts, State Health & Educational Facilities Authority Revenue, Milford Regional Medical Center: | ||||||||
| Series E, 5.0%, 7/15/2022 | 2,250,000 | 2,328,503 | ||||||
| Series E, 5.0%, 7/15/2032 | 3,250,000 | 3,235,537 | ||||||
| Series E, 5.0%, 7/15/2037 | 2,750,000 | 2,660,103 | ||||||
| Massachusetts, State Health & Educational Facilities Authority Revenue, South Shore Hospital: | ||||||||
| Series F, 5.625%, 7/1/2019 | 370,000 | 370,773 | ||||||
| Series F, 5.75%, 7/1/2029 | 1,480,000 | 1,481,761 | ||||||
| Massachusetts, State Health & Educational Facilities Authority Revenue, Suffolk University, Series A, 5.75%, 7/1/2039 | 7,145,000 | 7,846,996 | ||||||
| Massachusetts, State Industrial Finance Agency, JHC Assisted Living Corp., Series A, 144A, 0.19%***, 12/1/2029, LOC: TD Bank NA | 2,500,000 | 2,500,000 | ||||||
| Massachusetts, State Port Authority Special Facilities Revenue, Delta Air Lines, Inc. Project: | ||||||||
| Series A, AMT, 5.5%, 1/1/2016, INS: AMBAC | 5,000,000 | 4,999,950 | ||||||
| Series A, AMT, 5.5%, 1/1/2018, INS: AMBAC | 4,000,000 | 3,956,360 | ||||||
| 71,352,239 | ||||||||
| Michigan 3.0% | ||||||||
| Dearborn, MI, Economic Development Corp. Revenue, Limited Obligation, Henry Ford Village: | ||||||||
| 7.0%, 11/15/2038 | 4,500,000 | 4,602,645 | ||||||
| 7.125%, 11/15/2043 | 1,500,000 | 1,540,230 | ||||||
| Detroit, MI, Sales & Special Tax Revenue, Downtown Development Authority, Zero Coupon, 7/1/2012 | 3,150,000 | 3,140,519 | ||||||
| Detroit, MI, Sewer Disposal Revenue, Series D, 0.914%**, 7/1/2032, INS: AGMC | 1,590,000 | 1,152,496 | ||||||
| Detroit, MI, Water Supply Systems Revenue, Series A, 5.75%, 7/1/2037 | 7,590,000 | 8,252,303 | ||||||
| Kalamazoo, MI, Economic Development Corp. Revenue, Limited Obligation, Heritage Community: | ||||||||
| 5.375%, 5/15/2027 | 1,000,000 | 945,910 | ||||||
| 5.5%, 5/15/2036 | 1,000,000 | 907,440 | ||||||
| Michigan, State Finance Authority Revenue, Trinity Health Corp., 5.0%, 12/1/2031 | 10,910,000 | 12,265,240 | ||||||
| Michigan, State Grant Anticipation Bonds, 5.25%, 9/15/2023, INS: AGMC | 7,500,000 | 8,487,375 | ||||||
| Michigan, State Hospital Finance Authority Revenue, Henry Ford Health Hospital, 5.75%, 11/15/2039 | 6,315,000 | 6,997,651 | ||||||
| Michigan, State Hospital Finance Authority, Trinity Health Credit Group, Series C, 5.0%, 12/1/2034 | 4,950,000 | 5,534,298 | ||||||
| Oakland County, MI, Economic Development Corp., Limited Obligation Revenue, Motion Picture Studios, Recovery Zone Project, Series A, 144A, 7.0%, 8/1/2040 | 6,000,000 | 6,145,080 | ||||||
| 59,971,187 | ||||||||
| Minnesota 0.2% | ||||||||
| Minnesota, Tobacco Securitization Authority, Tobacco Settlement Revenue, Series B, 5.25%, 3/1/2031 | 4,000,000 | 4,463,480 | ||||||
| Mississippi 1.0% | ||||||||
| Lowndes County, MS, Solid Waste Disposal & Pollution Control Revenue, Weyerhaeuser Co. Project, Series A, 6.8%, 4/1/2022 | 5,500,000 | 6,281,385 | ||||||
| Warren County, MS, Gulf Opportunity Zone, International Paper Co.: | ||||||||
| Series A, 5.375%, 12/1/2035 | 1,000,000 | 1,073,430 | ||||||
| Series A, 5.5%, 9/1/2031 | 4,250,000 | 4,449,495 | ||||||
| Series A, 5.8%, 5/1/2034, GTY: International Paper Co. | 4,000,000 | 4,334,640 | ||||||
| Series A, 6.5%, 9/1/2032 | 2,620,000 | 2,942,679 | ||||||
| 19,081,629 | ||||||||
| Missouri 0.7% | ||||||||
| Cass County, MO, Hospital Revenue, 5.5%, 5/1/2027 | 2,000,000 | 2,047,040 | ||||||
| Kansas City, MO, Industrial Development Authority, Health Facilities Revenue, First Mortgage, Bishop Spencer, Series A, 6.5%, 1/1/2035 | 1,000,000 | 1,015,550 | ||||||
| Kirkwood, MO, Industrial Development Authority, Retirement Community Revenue, Aberdeen Heights: | ||||||||
| Series A, 8.25%, 5/15/2039 | 1,000,000 | 1,172,420 | ||||||
| Series A, 8.25%, 5/15/2045 | 2,850,000 | 3,335,412 | ||||||
| Missouri, State Health & Educational Facilities Authority, Lutheran Senior Services, 6.0%, 2/1/2041 | 2,250,000 | 2,480,512 | ||||||
| St. Louis, MO, Lambert-St. Louis International Airport Revenue, Series A-1, 6.625%, 7/1/2034 | 4,085,000 | 4,780,390 | ||||||
| 14,831,324 | ||||||||
| Nebraska 0.4% | ||||||||
| Douglas County, NE, Hospital Authority No. 002 Revenue, Health Facilities, Immanuel Obligation Group, 5.625%, 1/1/2040 | 1,500,000 | 1,647,240 | ||||||
| Lancaster County, NE, Hospital Authority No.1, Health Facilities Revenue, Immanuel Obligation Group, 5.625%, 1/1/2040 | 2,500,000 | 2,745,400 | ||||||
| Nebraska, Central Plains Energy Project Revenue, Project No. 1, Series A, 5.25%, 12/1/2021 | 3,000,000 | 3,258,240 | ||||||
| 7,650,880 | ||||||||
| Nevada 0.6% | ||||||||
| Clark County, NV, School District, Series A, 5.0%, 6/15/2022, INS: FGIC, NATL | 4,830,000 | 5,701,139 | ||||||
| Nevada, Director State Department of Business & Industry, Las Vegas Monorail Project, Second Tier, 7.375%, 1/1/2030* | 6,000,000 | 60 | ||||||
| Reno, NV, Hospital Revenue, Renown Regional Medical Center Project, Series A, 5.0%, 6/1/2027 | 5,000,000 | 5,169,850 | ||||||
| Sparks, NV, Local Improvement Districts, Limited Obligation District No. 3, 6.75%, 9/1/2027 | 2,000,000 | 2,053,940 | ||||||
| 12,924,989 | ||||||||
| New Hampshire 1.3% | ||||||||
| New Hampshire, Health & Education Facilities Authority Revenue, Havenwood-Heritage Heights: | ||||||||
| Series A, 5.35%, 1/1/2026 | 1,035,000 | 1,039,627 | ||||||
| Series A, 5.4%, 1/1/2030 | 550,000 | 543,213 | ||||||
| New Hampshire, Health & Education Facilities Authority Revenue, Wentworth-Douglas Hospital, Series A, 7.0%, 1/1/2038 | 5,325,000 | 6,349,743 | ||||||
| New Hampshire, Senior Care Revenue, Health & Educational Facilities Authority, New Hampshire Catholic Charities, 5.8%, 8/1/2022 | 2,760,000 | 2,763,119 | ||||||
| New Hampshire, Senior Care Revenue, Health & Educational Facilities Authority, Rivermead at Peterborough: | ||||||||
| 5.5%, 7/1/2013 | 615,000 | 615,959 | ||||||
| 5.625%, 7/1/2018 | 1,615,000 | 1,616,437 | ||||||
| New Hampshire, State Business Finance Authority Revenue, Elliot Hospital Obligation Group, Series A, 6.125%, 10/1/2039 | 5,000,000 | 5,323,400 | ||||||
| New Hampshire, State Business Finance Authority, Solid Waste Disposal Revenue, Waste Management, Inc. Project, AMT, 5.2%, 5/1/2027 | 4,000,000 | 4,315,240 | ||||||
| New Hampshire, State Health & Education Facilities Authority Revenue, Rivermead Retirement Community: | ||||||||
| Series A, 6.625%, 7/1/2031 | 700,000 | 760,361 | ||||||
| Series A, 6.875%, 7/1/2041 | 2,825,000 | 3,093,290 | ||||||
| 26,420,389 | ||||||||
| New Jersey 4.4% | ||||||||
| Middlesex County, NJ, Pollution Control Authority Revenue, Pollution Control Amerada, 6.05%, 9/15/2034 | 1,000,000 | 1,037,020 | ||||||
| New Jersey, Economic Development Authority Revenue, Cigarette Tax, Prerefunded, 5.75%, 6/15/2034 | 1,165,000 | 1,290,902 | ||||||
| New Jersey, Economic Development Authority Revenue, Motor Vehicle Surplus Revenue, Series A, 5.0%, 7/1/2023, INS: NATL | 1,770,000 | 1,900,166 | ||||||
| New Jersey, Economic Development Authority Revenue, United Methodist Homes, Series A-2, 6.625%, 7/1/2033 | 2,500,000 | 2,583,025 | ||||||
| New Jersey, Health Care Facilities Financing Authority Revenue, St. Joseph's Health Care System, 6.625%, 7/1/2038 | 5,785,000 | 6,721,187 | ||||||
| New Jersey, Industrial Development Revenue, Economic Development Authority, Harrogate, Inc., Series A, 5.875%, 12/1/2026 | 1,425,000 | 1,425,143 | ||||||
| New Jersey, State Economic Development Authority Revenue, 5.0%, 6/15/2028 | 450,000 | 491,373 | ||||||
| New Jersey, State Health Care Facilities Financing Authority Revenue, Saint Barnabas Health, Series A, 5.625%, 7/1/2032 | 3,500,000 | 3,794,875 | ||||||
| New Jersey, State Transportation Trust Fund Authority, Transportation Systems: | ||||||||
| Series B, 5.25%, 6/15/2036 | 18,665,000 | 21,262,421 | ||||||
| Series B, 5.5%, 6/15/2031 | 9,100,000 | 10,649,639 | ||||||
| Series A, 5.5%, 6/15/2041 | 7,000,000 | 8,126,720 | ||||||
| New Jersey, State Turnpike Authority Revenue, Series A, 5.0%, 1/1/2035 (d) | 2,625,000 | 2,935,222 | ||||||
| New Jersey, Tobacco Settlement Financing Corp.: | ||||||||
| Series 1A, 4.75%, 6/1/2034 | 16,240,000 | 12,606,787 | ||||||
| Series 1-A, 5.0%, 6/1/2029 | 15,965,000 | 14,435,872 | ||||||
| 89,260,352 | ||||||||
| New Mexico 0.4% | ||||||||
| Farmington, NM, Pollution Control Revenue, Public Service Co. of New Mexico, Series C, 5.9%, 6/1/2040 | 7,500,000 | 8,180,475 | ||||||
| New York 4.0% | ||||||||
| Albany, NY, Industrial Development Agency, Civic Facility Revenue, St. Peter's Hospital Project: | ||||||||
| Series A, 5.25%, 11/15/2027 | 3,000,000 | 3,245,610 | ||||||
| Series A, 5.75%, 11/15/2022 | 1,500,000 | 1,714,995 | ||||||
| Hudson, NY, Yards Infrastructure Corp. Revenue: | ||||||||
| Series A, 5.25%, 2/15/2047 | 5,000,000 | 5,526,950 | ||||||
| Series A, 5.75%, 2/15/2047 | 7,000,000 | 8,073,380 | ||||||
| Nassau, NY, Health Care Corp. Revenue, 0.16%***, 8/1/2029, LOC: TD Bank NA | 4,460,000 | 4,460,000 | ||||||
| New York, State Dormitory Authority Revenues, Non-State Supported Debt, New York Law School, 0.15%***, 7/1/2038, LOC: TD Bank NA | 2,050,000 | 2,050,000 | ||||||
| New York, State Dormitory Authority Revenues, NYU Hospital Center, Series B, 5.25%, 7/1/2024 | 870,000 | 946,221 | ||||||
| New York, State Dormitory Authority Revenues, Orange Regional Medical Center, 6.125%, 12/1/2029 | 2,000,000 | 2,175,540 | ||||||
| New York, State Dormitory Authority, Personal Income Tax Revenue, Series C, 5.0%, 3/15/2041 | 10,000,000 | 11,250,800 | ||||||
| New York, State Energy Research & Development Authority, Consolidated Edison Co. of New York, Inc.: | ||||||||
| Series A-1, 144A, 0.15%***, 5/1/2039, LOC: Mizuho Corporate Bank | 1,150,000 | 1,150,000 | ||||||
| Series A-2, 144A, 0.18%***, 5/1/2039, LOC: Mizuho Corporate Bank | 800,000 | 800,000 | ||||||
| New York, State Liberty Development Corp. Revenue, World Trade Center Port Authority Construction: | ||||||||
| 5.0%, 12/15/2041 | 4,260,000 | 4,743,297 | ||||||
| 5.25%, 12/15/2043 | 8,000,000 | 9,116,560 | ||||||
| New York & New Jersey, Port Authority, Special Obligation Revenue, JFK International Air Terminal LLC, 6.0%, 12/1/2042 | 5,795,000 | 6,448,386 | ||||||
| New York City, NY, Industrial Development Agency, Special Facility Revenue, American Airlines, JFK International Airport: | ||||||||
| AMT, 7.75%, 8/1/2031, GTY: AMR Corp. | 1,470,000 | 1,512,909 | ||||||
| AMT, 8.0%, 8/1/2028, GTY: AMR Corp. | 3,000,000 | 3,081,420 | ||||||
| New York City, NY, Industrial Development Agency, Special Facility Revenue, British Airways PLC Project, AMT, 7.625%, 12/1/2032 | 1,500,000 | 1,544,430 | ||||||
| Orange County, NY, Senior Care Revenue, Industrial Development Agency, The Glen Arden Project, 5.7%, 1/1/2028 | 1,250,000 | 982,350 | ||||||
| Port Authority of New York & New Jersey, AMT, 5.0%, 10/1/2034 | 10,000,000 | 11,084,700 | ||||||
| 79,907,548 | ||||||||
| North Carolina 0.3% | ||||||||
| Charlotte, NC, Airport Revenue, Series A, 5.0%, 7/1/2039 | 1,450,000 | 1,594,971 | ||||||
| North Carolina, Electric Revenue, Municipal Power Agency, Series F, Prerefunded, 5.5%, 1/1/2016 | 1,000,000 | 1,030,490 | ||||||
| North Carolina, Medical Care Commission, Retirement Facilities Revenue, First Mortgage, Southminster Project, Series A, 5.625%, 10/1/2027 | 2,500,000 | 2,416,350 | ||||||
| 5,041,811 | ||||||||
| North Dakota 0.1% | ||||||||
| Grand Forks, ND, Health Care System Revenue, Altru Health System, 5.0%, 12/1/2032 | 2,000,000 | 2,138,020 | ||||||
| Ohio 0.5% | ||||||||
| Cleveland, OH, Airport Systems Revenue, Series A, 5.0%, 1/1/2030 | 1,000,000 | 1,080,160 | ||||||
| Hamilton County, OH, Health Care Revenue, Life Enriching Communities Project: | ||||||||
| 6.125%, 1/1/2031 | 2,100,000 | 2,227,932 | ||||||
| 6.625%, 1/1/2046 | 2,500,000 | 2,755,825 | ||||||
| Ohio, State Higher Educational Facility Commission Revenue, Summa Health Systems Project, Series 2010, 5.75%, 11/15/2040 | 3,000,000 | 3,245,250 | ||||||
| 9,309,167 | ||||||||
| Oklahoma 0.4% | ||||||||
| Tulsa County, OK, Industrial Authority, Senior Living Community Revenue, Montereau, Inc. Project, Series A, 7.25%, 11/1/2045 | 6,500,000 | 7,158,255 | ||||||
| Oregon 0.6% | ||||||||
| Clackamas County, OR, North Clackamas School District No. 12, Series B, 5.0%, 6/15/2023, INS: AGMC (a) | 10,420,000 | 12,228,287 | ||||||
| Pennsylvania 2.5% | ||||||||
| Cumberland County, PA, Municipal Authority Revenue, Asbury Obligation Group, 6.125%, 1/1/2045 | 4,350,000 | 4,537,572 | ||||||
| Lancaster County, PA, Hospital Authority Revenue, Brethren Village Project, Series A, 6.375%, 7/1/2030 | 1,000,000 | 1,062,470 | ||||||
| Montgomery County, PA, Industrial Development Authority Revenue, Whitemarsh Continuing Care, 6.25%, 2/1/2035 | 2,400,000 | 2,423,736 | ||||||
| Northampton County, PA, Hospital Authority Revenue, St. Luke's Hospital Project: | ||||||||
| Series A, 5.375%, 8/15/2028 | 3,500,000 | 3,694,005 | ||||||
| Series A, 5.5%, 8/15/2035 | 6,500,000 | 6,842,680 | ||||||
| Pennsylvania, Economic Development Finance Authority, U.S. Airways Group, Series B, 8.0%, 5/1/2029, GTY: U.S. Airways, Inc. | 1,000,000 | 1,091,860 | ||||||
| Pennsylvania, Economic Development Financing Authority, Sewer Sludge Disposal Revenue, Philadelphia Biosolids Facility, 6.25%, 1/1/2032 | 1,500,000 | 1,661,925 | ||||||
| Pennsylvania, State Turnpike Commission Revenue, Series A, 6.5%, 12/1/2036 | 6,385,000 | 7,717,550 | ||||||
| Philadelphia, PA, Airport Revenue, Series A, 5.0%, 6/15/2035 | 7,085,000 | 7,570,393 | ||||||
| Philadelphia, PA, Gas Works Revenue, 5.25%, 8/1/2040 | 3,000,000 | 3,153,210 | ||||||
| Philadelphia, PA, Hospitals & Higher Education Facilities Authority Revenue, Temple University Health Systems, Series A, 5.0%, 7/1/2034 | 10,000,000 | 10,015,100 | ||||||
| 49,770,501 | ||||||||
| Puerto Rico 5.1% | ||||||||
| Commonwealth of Puerto Rico, Aqueduct & Sewer Authority Revenue, Series A, 6.0%, 7/1/2038 | 25,750,000 | 27,509,240 | ||||||
| Commonwealth of Puerto Rico, General Obligation, Series A, 6.0%, 7/1/2038 | 7,200,000 | 7,790,760 | ||||||
| Commonwealth of Puerto Rico, Public Improvement, Series B, 6.5%, 7/1/2037 | 10,000,000 | 11,340,500 | ||||||
| Puerto Rico, Electric Power Authority Revenue: | ||||||||
| Series TT, 5.0%, 7/1/2032 | 5,500,000 | 5,624,740 | ||||||
| Series TT, 5.0%, 7/1/2037 | 4,000,000 | 4,045,440 | ||||||
| Series XX, 5.25%, 7/1/2040 | 6,665,000 | 6,856,952 | ||||||
| Puerto Rico, Public Buildings Authority Revenue, Government Facilities, Series M, 6.25%, 7/1/2022 | 5,000,000 | 5,804,500 | ||||||
| Puerto Rico, Sales Tax Financing Corp., Sales Tax Revenue: | ||||||||
| Series A, 5.375%, 8/1/2039 | 4,570,000 | 4,895,384 | ||||||
| Series A, 5.75%, 8/1/2037 | 2,130,000 | 2,366,451 | ||||||
| Series A, 6.5%, 8/1/2044 | 10,000,000 | 11,806,500 | ||||||
| Puerto Rico, Sales Tax Financing Corp., Sales Tax Revenue, Convertible Capital Appreciation: | ||||||||
| Series A, Step-up Coupon, 0% to 8/1/2016, 6.75% to 8/1/2032 | 10,000,000 | 10,274,900 | ||||||
| Series A, Step-up Coupon, 0% to 8/1/2019, 6.25% to 8/1/2033 | 5,130,000 | 4,478,439 | ||||||
| 102,793,806 | ||||||||
| South Carolina 0.7% | ||||||||
| Greenwood County, SC, Hospital Revenue, Self Regional Healthcare, Series B, 5.0%, 10/1/2031 | 1,000,000 | 1,091,210 | ||||||
| Hardeeville, SC, Assessment Revenue, Anderson Tract Municipal Improvement District: | ||||||||
| Series B, 7.5%, 11/1/2015 | 802,000 | 791,534 | ||||||
| Series A, 7.75%, 11/1/2039 | 4,917,000 | 4,507,512 | ||||||
| South Carolina, Jobs Economic Development Authority Revenue, Bon Secours Health System, Series B, 5.625%, 11/15/2030 | 3,960,000 | 3,981,384 | ||||||
| South Carolina, Jobs Economic Development Authority, Hospital Facilities Revenue, Palmetto Health Alliance, 5.75%, 8/1/2039 | 3,595,000 | 3,951,696 | ||||||
| 14,323,336 | ||||||||
| South Dakota 0.5% | ||||||||
| South Dakota, State Health & Educational Facilities Authority Revenue, Avera Health: | ||||||||
| Series B, 5.25%, 7/1/2038 | 3,000,000 | 3,193,110 | ||||||
| Series B, 5.5%, 7/1/2035 | 5,000,000 | 5,430,750 | ||||||
| South Dakota, State Health & Educational Facilities Authority Revenue, Sanford Health, 5.0%, 11/1/2027 | 1,000,000 | 1,067,050 | ||||||
| 9,690,910 | ||||||||
| Tennessee 2.8% | ||||||||
| Clarksville, TN, Natural Gas Acquisition Corp., Gas Revenue: | ||||||||
| 5.0%, 12/15/2017 | 2,500,000 | 2,697,125 | ||||||
| 5.0%, 12/15/2018 | 2,160,000 | 2,331,051 | ||||||
| Elizabethton, TN, Hospital & Healthcare Revenue, Health & Educational Facilities Board, Series B, Prerefunded, 8.0%, 7/1/2033 | 3,000,000 | 3,105,270 | ||||||
| Jackson, TN, Hospital Revenue, Jackson-Madison Project, 5.625%, 4/1/2038 | 3,000,000 | 3,263,430 | ||||||
| Johnson City, TN, Health & Educational Facilities, Board Hospital Revenue, First Mortgage, Mountain States Health Alliance, Series A, 5.5%, 7/1/2036 | 18,795,000 | 19,534,395 | ||||||
| Johnson City, TN, Health & Educational Facilities, Board Hospital Revenue, Mountain States Health Alliance, 6.5%, 7/1/2038 | 3,570,000 | 4,144,984 | ||||||
| Johnson City, TN, Hospital & Healthcare Revenue, Health & Educational Facilities Board Hospital, Series A, Prerefunded, 7.5%, 7/1/2033 | 5,000,000 | 5,173,450 | ||||||
| Tennessee, Energy Acquisition Corp., Gas Revenue: | ||||||||
| Series C, 5.0%, 2/1/2027 | 6,435,000 | 6,716,660 | ||||||
| Series A, 5.25%, 9/1/2018 | 8,000,000 | 8,997,760 | ||||||
| 55,964,125 | ||||||||
| Texas 11.7% | ||||||||
| Abilene, TX, Hospital & Healthcare Revenue, Health Facilities, Sears Methodist Retirement Facilities, Series A, 7.0%, 11/15/2033 | 3,500,000 | 2,778,895 | ||||||
| Abilene, TX, Senior Care Revenue, Health Facilities Development, Sears Methodist Retirement Facilities, Series A, 5.9%, 11/15/2025 | 2,411,000 | 1,839,087 | ||||||
| Austin, TX, Austin-Bergstrom Landhost Enterprises, Inc., Airport Hotel Project, Series A, 3.375%, 4/1/2027 (c) | 4,910,000 | 2,757,652 | ||||||
| Bexar County, TX, Health Facilities Development Corp. Revenue, Army Retirement Residence Project, 6.2%, 7/1/2045 | 6,000,000 | 6,567,540 | ||||||
| Brazos River, TX, Harbor Navigation District, Brazoria County Environmental Health, Dow Chemical Co. Project: | ||||||||
| Series B-2, 4.95%, 5/15/2033 | 4,000,000 | 4,171,880 | ||||||
| Series A-3, AMT, 5.125%, 5/15/2033 | 9,000,000 | 9,453,150 | ||||||
| Brazos River, TX, Pollution Control Authority Revenue, Series D-1, 144A, AMT, 8.25%, 5/1/2033 | 7,000,000 | 1,053,500 | ||||||
| Cass County, TX, Industrial Development Corp., Environmental Improvement Revenue, International Paper Co. Projects, Series A, 9.25%, 3/1/2024 | 2,000,000 | 2,570,400 | ||||||
| Central Texas, Regional Mobility Authority Revenue, Capital Appreciation: | ||||||||
| Zero Coupon, 1/1/2030 | 5,000,000 | 2,013,950 | ||||||
| Zero Coupon, 1/1/2032 | 3,500,000 | 1,221,815 | ||||||
| Central Texas, Regional Mobility Authority Revenue, Senior Lien, 6.0%, 1/1/2041 | 5,455,000 | 6,127,001 | ||||||
| Houston, TX, Airport Systems Revenue, Series B, 5.0%, 7/1/2032 | 1,490,000 | 1,668,383 | ||||||
| Houston, TX, Airport Systems Revenue, Special Facilities Continental Airlines, Inc. Terminal Projects, AMT, 6.625%, 7/15/2038 | 2,000,000 | 2,182,020 | ||||||
| Houston, TX, Transportation/Tolls Revenue, Special Facilities, Continental Airlines, Inc., Series E, AMT, 6.75%, 7/1/2029 | 10,100,000 | 10,143,430 | ||||||
| La Vernia, TX, Higher Education Finance Corp. Revenue, Lifeschools of Dallas: | ||||||||
| Series A, 7.25%, 8/15/2031 | 1,275,000 | 1,464,108 | ||||||
| Series A, 7.5%, 8/15/2041 | 1,785,000 | 2,070,761 | ||||||
| Lewisville, TX, Combination Contract Revenue, 144A, 6.75%, 10/1/2032 | 15,750,000 | 16,557,503 | ||||||
| Matagorda County, TX, Navigation District No. 1, Pollution Control Revenue, AEP Texas Central Co. Project, Series A, 4.4%, 5/1/2030, INS: AMBAC | 11,000,000 | 11,162,250 | ||||||
| Matagorda County, TX, Navigation District No. 1, Pollution Control Revenue, Central Power & Light Co. Project, Series A, 6.3%, 11/1/2029 | 3,000,000 | 3,465,150 | ||||||
| North Texas, Tollway Authority Revenue: | ||||||||
| First Tier, Series A, 5.625%, 1/1/2033 | 1,000,000 | 1,107,160 | ||||||
| Second Tier, Series F, 5.75%, 1/1/2038 | 17,500,000 | 19,050,150 | ||||||
| First Tier, 6.0%, 1/1/2043 | 5,000,000 | 5,781,200 | ||||||
| First Tier, Series A, 6.25%, 1/1/2039 | 9,525,000 | 10,869,644 | ||||||
| San Antonio, TX, Convention Center Hotel Finance Corp., Contract Revenue, Empowerment Zone, Series A, AMT, 5.0%, 7/15/2039, INS: AMBAC | 8,000,000 | 8,021,280 | ||||||
| Tarrant County, TX, Cultural Education Facilities Finance Corp., Hospital Revenue, Baylor Health Care System Project, Series E, 0.16%***, 11/15/2050, LOC: Wells Fargo Bank NA | 5,600,000 | 5,600,000 | ||||||
| Tarrant County, TX, Cultural Education Facilities Finance Corp., Retirement Facility, Mirador Project: | ||||||||
| Series A, 8.125%, 11/15/2039 | 1,000,000 | 1,064,610 | ||||||
| Series A, 8.25%, 11/15/2044 | 3,430,000 | 3,678,675 | ||||||
| Texas, Dallas/Fort Worth International Airport Revenue: | ||||||||
| Series B, 5.0%, 11/1/2035 | 5,740,000 | 6,273,131 | ||||||
| Series D, 5.0%, 11/1/2035 | 2,715,000 | 2,967,169 | ||||||
| Series A, 5.25%, 11/1/2038 | 15,000,000 | 16,696,500 | ||||||
| Texas, Industrial Development Revenue, Waste Disposal Authority, Series A, AMT, 6.1%, 8/1/2024 | 5,000,000 | 5,032,700 | ||||||
| Texas, Love Field Airport Modernization Corp., Special Facilities Revenue, Southwest Airlines Co. Project, 5.25%, 11/1/2040 | 7,445,000 | 7,784,566 | ||||||
| Texas, Municipal Gas Acquisition & Supply Corp. I, Gas Supply Revenue: | ||||||||
| Series D, 5.625%, 12/15/2017 | 12,060,000 | 13,356,209 | ||||||
| Series D, 6.25%, 12/15/2026 | 16,875,000 | 20,107,744 | ||||||
| Texas, SA Energy Acquisition Public Facility Corp., Gas Supply Revenue, 5.5%, 8/1/2020 | 10,000,000 | 11,421,100 | ||||||
| Texas, Uptown Development Authority, Tax Increment Contract Revenue, Infrastructure Improvement Facilities, 5.5%, 9/1/2029 | 1,000,000 | 1,087,620 | ||||||
| Travis County, TX, Health Facilities Development Corp. Revenue, Westminster Manor Health: | ||||||||
| 7.0%, 11/1/2030 | 1,530,000 | 1,760,739 | ||||||
| 7.125%, 11/1/2040 | 3,580,000 | 4,070,890 | ||||||
| 234,999,562 | ||||||||
| Virginia 0.6% | ||||||||
| Virginia, Marquis Community Development Authority Revenue: | ||||||||
| Series C, Zero Coupon, 9/1/2041 | 7,906,000 | 757,316 | ||||||
| Series B, 5.625%, 9/1/2041 | 5,332,000 | 4,582,214 | ||||||
| Virginia, Mosaic District Comunity Development Authority Revenue, Series A, 6.875%, 3/1/2036 | 2,000,000 | 2,210,680 | ||||||
| Virginia, Peninsula Ports Authority, Residential Care Facility Revenue, Virginia Baptist Homes, Series C, 5.4%, 12/1/2033 | 2,600,000 | 1,932,762 | ||||||
| Virginia, State Small Business Financing Authority Revenue, Elizabeth River Crossings LLC Project, AMT, 6.0%, 1/1/2037 | 2,000,000 | 2,203,420 | ||||||
| 11,686,392 | ||||||||
| Washington 1.8% | ||||||||
| Klickitat County, WA, Public Hospital District No. 2 Revenue, Skyline Hospital, 6.5%, 12/1/2038 | 3,205,000 | 3,249,229 | ||||||
| Washington, Electric Revenue, Public Power Supply System, Nuclear Project No. 3, Series B, 7.125%, 7/1/2016 | 2,500,000 | 3,130,200 | ||||||
| Washington, Port of Seattle Revenue, Series A, 5.0%, 8/1/2033 | 1,500,000 | 1,709,610 | ||||||
| Washington, State Health Care Facilities Authority Revenue, Series C, 5.375%, 8/15/2028, INS: Radian | 2,970,000 | 3,089,899 | ||||||
| Washington, State Health Care Facilities Authority Revenue, Virginia Mason Medical Center: | ||||||||
| Series B, 5.75%, 8/15/2037, INS: ACA | 6,675,000 | 7,015,225 | ||||||
| Series A, 6.125%, 8/15/2037 | 16,000,000 | 17,212,640 | ||||||
| 35,406,803 | ||||||||
| West Virginia 0.7% | ||||||||
| West Virginia, State Hospital Finance Authority Revenue, Charleston Medical Center, Series A, 5.625%, 9/1/2032 | 3,080,000 | 3,340,660 | ||||||
| West Virginia, State Hospital Finance Authority Revenue, Thomas Health Systems: | ||||||||
| 6.5%, 10/1/2028 | 7,000,000 | 7,233,450 | ||||||
| 6.5%, 10/1/2038 | 3,000,000 | 3,054,060 | ||||||
| 13,628,170 | ||||||||
| Wisconsin 1.2% | ||||||||
| Wisconsin, Hospital & Healthcare Revenue, Health & Educational Facilities Authority, Aurora Health Care, Inc., 6.875%, 4/15/2030 | 5,000,000 | 5,140,150 | ||||||
| Wisconsin, State Health & Educational Facilities Authority Revenue, Aurora Health Care, Inc., Series A, 5.625%, 4/15/2039 | 8,160,000 | 8,917,901 | ||||||
| Wisconsin, State Health & Educational Facilities Authority Revenue, Beaver Dam Community Hospitals, Inc., Series A, 6.75%, 8/15/2034 | 2,500,000 | 2,563,275 | ||||||
| Wisconsin, State Health & Educational Facilities Authority Revenue, Ministry Health Care, Series C, 5.0%, 8/15/2032 | 5,035,000 | 5,477,425 | ||||||
| Wisconsin, State Health & Educational Facilities Authority Revenue, St. John's Communities, Inc., Series A, 7.625%, 9/15/2039 | 1,000,000 | 1,141,220 | ||||||
| Wisconsin, State Health & Educational Facilities Authority, Oakwood Village, Series B, 0.14%***, 8/15/2030, LOC: M&I Marshall & Ilsley | 1,690,000 | 1,690,000 | ||||||
| 24,929,971 | ||||||||
| Multi-State 0.1% | ||||||||
| Non-Profit Preferred Funding Trust I, Series A1, 4.22%, 9/15/2037 | 3,014,629 | 2,893,622 | ||||||
Total Municipal Bonds and Notes (Cost $1,719,832,161) | 1,866,209,403 | |||||||
| Municipal Inverse Floating Rate Notes (e) 14.2% | ||||||||
| California 0.2% | ||||||||
| San Diego County, CA, Water Authority Revenue, Certificates of Participation, Series 2008-A, 5.0%, 5/1/2027, INS: AGMC (f) | 2,126,587 | 2,393,088 | ||||||
| San Diego County, CA, Water Authority Revenue, Certificates of Participation, Series 2008-A, 5.0%, 5/1/2028, INS: AGMC (f) | 1,935,078 | 2,177,579 | ||||||
| Trust: San Diego County, CA, Water Utility Improvements, Certificates of Participation, Series 2008-1104, 144A, 9.163%, 11/1/2015 Leverage Factor at purchase date: 2 to 1 | ||||||||
| 4,570,667 | ||||||||
| Hawaii 0.6% | ||||||||
| Hawaii, State General Obligation, Series DK, 5.0%, 5/1/2027 (f) | 10,000,000 | 11,900,800 | ||||||
| Trust: Hawaii, State General Obligation, Series 2867, 144A, 17.78%, 5/1/2016, Leverage Factor at purchase date: 4 to 1 | ||||||||
| Louisiana 0.6% | ||||||||
| Louisiana, State Gas & Fuels Tax Revenue, Series B, 5.0%, 5/1/2033 (f) | 3,026,513 | 3,507,910 | ||||||
| Louisiana, State Gas & Fuels Tax Revenue, Series B, 5.0%, 5/1/2034 (f) | 3,304,152 | 3,829,710 | ||||||
| Louisiana, State Gas & Fuels Tax Revenue, Series B, 5.0%, 5/1/2035 (f) | 3,666,834 | 4,250,079 | ||||||
| Trust: Louisiana, State Gas & Fuels Tax Revenue, Series 3806, 144A, 9.288%, 5/1/2018, Leverage Factor at purchase date: 2 to 1 | ||||||||
| 11,587,699 | ||||||||
| Nevada 2.2% | ||||||||
| Clark County, NV, School District, Series C, 5.0%, 6/15/2021 (f) | 7,851,481 | 9,159,180 | ||||||
| Clark County, NV, School District, Series C, 5.0%, 6/15/2022 (f) | 8,203,602 | 9,569,948 | ||||||
| Clark County, NV, School District, Series C, 5.0%, 6/15/2023 (f) | 5,298,193 | 6,180,631 | ||||||
| Trust: Clark County, NV, School Improvements, Series 2008-1153, 144A, 9.201%, 6/15/2015, Leverage Factor at purchase date: 2 to 1 | ||||||||
| Las Vegas Valley, NV, General Obligation, Water District, Series A, 5.0%, 2/1/2035 (f) | 9,150,000 | 9,994,999 | ||||||
| Las Vegas Valley, NV, General Obligation, Water District, Series A, 5.0%, 2/1/2036 (f) | 9,605,000 | 10,492,018 | ||||||
| Trust: Las Vegas Valley, NV, General Obligation, Water District, 144A, 9.288%, 2/1/2016, Leverage Factor at purchase date: 2 to 1 | ||||||||
| 45,396,776 | ||||||||
| New York 2.0% | ||||||||
| New York, State Dormitory Authority Revenues, Personal Income Tax Revenue, Series A, 5.0%, 3/15/2023 (f) | 5,095,207 | 5,959,195 | ||||||
| Trust: New York, State Dormitory Authority Revenues, Secondary Issues, Series 1955-2, 144A, 17.854%, 3/15/2015, Leverage Factor at purchase date: 4 to 1 | ||||||||
| New York, State Dormitory Authority, Personal Income Tax Revenue, Series F, 5.0%, 2/15/2035 (f) | 10,000,000 | 11,392,200 | ||||||
| Trust: New York, State Dormitory Authority Revenues, Series 4688, 144A, 9.28%, 3/15/2024, Leverage Factor at purchase date: 2 to 1 | ||||||||
| New York, State Environmental Facilities Corp., Clean Drinking Water, Series A, 5.0%, 6/15/2025 (f) | 4,000,000 | 4,715,594 | ||||||
| New York, State Environmental Facilities Corp., Clean Drinking Water, Series A, 5.0%, 6/15/2026 (f) | 3,000,000 | 3,536,695 | ||||||
| New York, State Environmental Facilities Corp., Clean Drinking Water, Series A, 5.0%, 6/15/2027 (f) | 3,000,000 | 3,536,696 | ||||||
| Trust: New York, State Environmental Facilities Corp., Clean Drinking Water, Series 2870, 144A, 16.231%, 12/15/2015, Leverage Factor at purchase date: 3.6 to 1 | ||||||||
| New York City, NY, Transitional Finance Authority Revenue, Series C-1, 5.0%, 11/1/2027 (f) | 10,000,000 | 11,556,000 | ||||||
| Trust: New York City, NY, Transitional Finance Authority Revenue, Series 2072, 144A, 11.15%, 11/1/2027, Leverage Factor at purchase date: 2.5 to 1 | ||||||||
| 40,696,380 | ||||||||
| Ohio 0.7% | ||||||||
| Ohio, State Higher Educational Facilities Commission Revenue, Cleveland Clinic Health, Series A, 5.125%, 1/1/2028 (f) | 4,522,767 | 4,962,268 | ||||||
| Ohio, State Higher Educational Facilities Commission Revenue, Cleveland Clinic Health, Series A, 5.25%, 1/1/2033 (f) | 7,712,913 | 8,462,418 | ||||||
| Trust: Ohio, State Higher Educational Revenue, Series 3139, 144A, 14.379%, 1/1/2016, Leverage Factor at purchase date: 3 to 1 | ||||||||
| 13,424,686 | ||||||||
| Pennsylvania 2.2% | ||||||||
| Pennsylvania, State General Obligation, Series A, 5.0%, 8/1/2023 (f) | 21,790,000 | 25,566,850 | ||||||
| Trust: Pennsylvania, State General Obligation, Series R-11505-1, 144A, 43.77%, 8/1/2015, Leverage Factor at purchase date: 10 to 1 | ||||||||
| Pennsylvania, State Revenue Bond, Series A, 5.0%, 8/1/2024 (f) | 15,475,000 | 17,853,621 | ||||||
| Trust: Pennsylvania, State Revenue Bond, Series 2720, 144A, 12.606%, 8/1/2015, Leverage Factor at purchase date: 3 to 1 | ||||||||
| 43,420,471 | ||||||||
| Tennessee 0.9% | ||||||||
| Nashville & Davidson County, TN, Metropolitan Government, 5.0%, 1/1/2024 (f) | 14,996,415 | 17,556,765 | ||||||
| Trust: Nashville & Davidson County, TN, Metropolitan Government, Series 2631-1, 144A, 17.866%, 1/1/2016, Leverage Factor at purchase date: 4 to 1 | ||||||||
| Texas 2.9% | ||||||||
| Conroe, TX, Independent School District, School Building, 5.0%, 2/15/2024 (f) | 3,710,000 | 4,207,103 | ||||||
| Conroe, TX, Independent School District, School Building, 5.0%, 2/15/2025 (f) | 4,315,000 | 4,893,167 | ||||||
| Trust: Conroe, TX, Independent School District, Series 2487, 144A, 17.748%, 2/15/2014, Leverage Factor at purchase date: 4 to 1 | ||||||||
| Harris County, TX, Flood Control District, Series A, 5.0%, 10/1/2034 (f) | 5,500,000 | 6,298,985 | ||||||
| Trust: Harris County, TX, Flood Control District, Series 4692, 144A, 9.38%, 10/11/2018, Leverage Factor at purchase date: 2 to 1 | ||||||||
| San Antonio, TX, Electric & Gas Revenue, 5.0%, 2/1/2024 (f) | 15,000,000 | 17,587,800 | ||||||
| Trust: San Antonio, TX, Electric & Gas Revenue, Series 2957, 144A, 13.52%, 2/1/2016, Leverage Factor at purchase date: 3 to 1 | ||||||||
| Texas, North East Independent School District, School Building, Series A, 5.0%, 8/1/2024 (f) | 10,000,000 | 11,827,500 | ||||||
| Trust: Texas, North East Independent School District, Series 2355, 144A, 22.16%, 8/1/2015, Leverage Factor at purchase date: 5 to 1 | ||||||||
| Texas, State Transportation Commission Revenue, 5.0%, 4/1/2026 (f) | 12,500,000 | 14,377,750 | ||||||
| Trust: Texas, State Transportation Commission Revenue, Series 2563, 144A, 22.04%, 4/1/2015, Leverage Factor at purchase date: 5 to 1 | ||||||||
| 59,192,305 | ||||||||
| Washington 1.9% | ||||||||
| Washington, Energy Northwest Electric Revenue, Columbia Generating Station, Series A, 5.0%, 7/1/2024 (f) | 10,000,000 | 11,353,500 | ||||||
| Trust: Washington, Energy Northwest Electric Revenue, Series 2301, 144A, 22.16%, 7/1/2014, Leverage Factor at purchase date: 5 to 1 | ||||||||
| Washington, State General Obligation, Series A, 5.0%, 7/1/2025 (f) | 10,000,000 | 11,545,000 | ||||||
| Trust: Washington, State General Obligation, Series 2154, 144A, 22.16%, 7/1/2015, Leverage Factor at purchase date: 5 to 1 | ||||||||
| Washington, State General Obligation, Series 2007A, 5.0%, 7/1/2023, INS: AGMC (f) | 10,000,000 | 11,454,700 | ||||||
| Trust: Washington, State General Obligation, Series 2302, 144A, 22.16%, 7/1/2014, Leverage Factor at purchase date: 5 to 1 | ||||||||
| Washington, State Public Power Supply System, Nuclear Project No. 2, 10.09%, 7/1/2012 | 3,000,000 | 3,026,280 | ||||||
| 37,379,480 | ||||||||
Total Municipal Inverse Floating Rate Notes (Cost $255,255,986) | 285,126,029 | |||||||
| % of Net Assets | Value ($) | |||||||
Total Investment Portfolio (Cost $1,975,088,147)+ | 107.2 | 2,151,335,432 | ||||||
| Other Assets and Liabilities, Net | (7.2 | ) | (144,705,440 | ) | ||||
| Net Assets | 100.0 | 2,006,629,992 | ||||||
The following table represents bonds that are in default:
| Security | Coupon | Maturity Date | Principal Amount ($) | Acquisition Cost ($) | Value ($) | ||||||||||||
| Austin, TX, Austin-Bergstrom Landhost Enterprises, Inc., Airport Hotel Project, Series A (c) | 3.375 | % | 4/1/2027 | 4,910,000 | 4,910,000 | 2,757,652 | |||||||||||
| Boston, MA, Industrial Development Financing Authority Revenue, Crosstown Center Project, AMT* | 8.0 | % | 9/1/2035 | 960,000 | 960,000 | 327,264 | |||||||||||
| Florida, Special Assessment Revenue, East Park Community Development District, Series A* | 7.5 | % | 5/1/2039 | 1,715,000 | 1,715,000 | 1,298,186 | |||||||||||
| Mashantucket, CT, Mashantucket Western Pequot Tribe, Special Revenue, Series A, 144A* | 6.5 | % | 9/1/2031 | 7,295,000 | 7,628,882 | 2,907,860 | |||||||||||
| Mashantucket, CT, Project Revenue, Mashantucket Western Pequot Tribe, Series B, 144A* | Zero Coupon | 9/1/2010 | 2,000,000 | 1,385,088 | 649,180 | ||||||||||||
| Mashantucket, CT, Project Revenue, Mashantucket Western Pequot Tribe, Series B, 144A* | Zero Coupon | 9/1/2011 | 2,000,000 | 1,305,909 | 649,180 | ||||||||||||
| Mashantucket, CT, Project Revenue, Mashantucket Western Pequot Tribe, Series B, 144A* | Zero Coupon | 9/1/2012 | 2,000,000 | 1,228,854 | 649,180 | ||||||||||||
| Mashantucket, CT, Project Revenue, Mashantucket Western Pequot Tribe, Series B, 144A* | Zero Coupon | 9/1/2013 | 2,000,000 | 1,154,117 | 614,980 | ||||||||||||
| Mashantucket, CT, Project Revenue, Mashantucket Western Pequot Tribe, Series B, 144A* | Zero Coupon | 9/1/2014 | 2,000,000 | 1,081,820 | 581,180 | ||||||||||||
| Mashantucket, CT, Sports, Expo & Entertainment Revenue, Mashantucket Western Pequot Tribe, Series B, 144A* | 5.7 | % | 9/1/2012 | 1,000,000 | 998,477 | 386,800 | |||||||||||
| Nevada, Director State Department of Business & Industry, Las Vegas Monorail Project, Second Tier* | 7.375 | % | 1/1/2030 | 6,000,000 | 5,798,546 | 60 | |||||||||||
| North Manchester, IN, Peabody Retirement Community Project Revenue, Series A (b) | 2.755 | % | 7/1/2033 | 3,000,000 | 2,910,069 | 1,019,550 | |||||||||||
| 31,076,762 | 11,841,072 | ||||||||||||||||
* Non-income producing security.
** Floating rate securities' yields vary with a designated market index or market rate, such as the coupon-equivalent of the U.S. Treasury Bill rate. These securities are shown at their current rate as of May 31, 2012.
*** Variable rate demand notes are securities whose interest rates are reset periodically at market levels. These securities are often payable on demand and are shown at their current rates as of May 31, 2012.
+ The cost for federal income tax purposes was $1,971,048,095. At May 31, 2012, net unrealized appreciation for all securities based on tax cost was $180,287,337. This consisted of aggregate gross unrealized appreciation for all securities in which there was an excess of value over tax cost of $214,645,304 and aggregate gross unrealized depreciation for all securities in which there was an excess of tax cost over value of $34,357,967.
(a) At May 31, 2012, this security has been pledged, in whole or in part, as collateral for open interest rate swaps.
(b) Partial interest-paying security. The rate shown represents 38% of the original coupon rate.
(c) Partial interest-paying security. The rate shown represents 50% of the original coupon rate.
(d) When-issued security.
(e) Securities represent the underlying municipal obligations of inverse floating rate obligations held by the Fund.
(f) Security forms part of the below tender option bond trust. Principal Amount and Value shown take into account the leverage factor.
144A: Security exempt from registration under Rule 144A of the Securities Act of 1933. These securities may be resold in transactions exempt from registration, normally to qualified institutional buyers.
ACA: ACA Financial Guaranty Corp.
AGC: Assured Guaranty Corp.
AGMC: Assured Guaranty Municipal Corp.
AMBAC: Ambac Financial Group, Inc.
AMT: Subject to alternative minimum tax.
FGIC: Financial Guaranty Insurance Co.
GTY: Guaranty Agreement
INS: Insured
LOC: Letter of Credit
NATL: National Public Finance Guarantee Corp.
Prerefunded: Bonds which are prerefunded are collateralized usually by U.S. Treasury securities which are held in escrow and used to pay principal and interest on tax-exempt issues and to retire the bonds in full at the earliest refunding date.
Radian: Radian Asset Assurance, Inc.
SPA: Standby Bond Purchase Agreement
At May 31, 2012, open interest rate swap contracts were as follows:
Effective/ Expiration Date | Notional Amount ($) | Cash Flows Paid by the Fund | Cash Flows Received by the Fund | Value ($) | Upfront Payments Paid/ (Received) ($) | Unrealized Depreciation ($) | ||||||||||||
4/23/2013 4/23/2031 | 28,300,000 | 1 | Fixed — 2.78% | Floating — LIBOR | (1,744,364 | ) | — | (1,744,364 | ) | |||||||||
2/28/2013 2/28/2032 | 22,300,000 | 1 | Fixed — 2.74% | Floating — LIBOR | (1,299,450 | ) | — | (1,299,450 | ) | |||||||||
4/22/2013 4/22/2033 | 17,700,000 | 2 | Fixed — 2.899% | Floating — LIBOR | (1,419,827 | ) | — | (1,419,827 | ) | |||||||||
4/24/2013 4/24/2033 | 17,700,000 | 1 | Fixed — 2.855% | Floating — LIBOR | (1,291,838 | ) | — | (1,291,838 | ) | |||||||||
5/10/2013 5/10/2033 | 14,600,000 | 3 | Fixed — 2.815% | Floating — LIBOR | (957,509 | ) | — | (957,509 | ) | |||||||||
10/25/2012 10/25/2033 | 5,300,000 | 1 | Fixed — 3.09% | Floating — LIBOR | (657,506 | ) | — | (657,506 | ) | |||||||||
4/25/2013 4/25/2034 | 5,750,000 | 1 | Fixed — 2.92% | Floating — LIBOR | (483,444 | ) | — | (483,444 | ) | |||||||||
| Total unrealized depreciation | (7,853,938 | ) | ||||||||||||||||
Counterparties:
1 JPMorgan Chase Securities, Inc.
2 Merrill Lynch & Co., Inc.
3 Barclays Bank PLC
LIBOR: London Interbank Offered Rate
For information on the Fund's policy and additional disclosures regarding interest rate swap contracts, please refer to Note B in the accompanying Notes to Financial Statements.
Fair Value Measurements
Various inputs are used in determining the value of the Fund's investments. These inputs are summarized in three broad levels. Level 1 includes quoted prices in active markets for identical securities. Level 2 includes other significant observable inputs (including quoted prices for similar securities, interest rates, prepayment speeds and credit risk). Level 3 includes significant unobservable inputs (including the Fund's own assumptions in determining the fair value of investments). The inputs or methodology used for valuing securities are not necessarily an indication of the risk associated with investing in those securities.
The following is a summary of the inputs used as of May 31, 2012 in valuing the Fund's investments. For information on the Fund's policy regarding the valuation of investments, please refer to the Security Valuation section of Note A in the accompanying Notes to Financial Statements.
| Assets | Level 1 | Level 2 | Level 3 | Total | ||||||||||||
| Municipal Investments (g) | $ | — | $ | 2,151,335,432 | $ | — | $ | 2,151,335,432 | ||||||||
| Total | $ | — | $ | 2,151,335,432 | $ | — | $ | 2,151,335,432 | ||||||||
| Liabilities | ||||||||||||||||
| Derivatives (h) | $ | — | $ | (7,853,938 | ) | $ | — | $ | (7,853,938 | ) | ||||||
| Total | $ | — | $ | (7,853,938 | ) | $ | — | $ | (7,853,938 | ) | ||||||
There have been no transfers between Level 1 and Level 2 fair value measurements during the year ended May 31, 2012.
(g) See Investment Portfolio for additional detailed categorizations.
(h) Derivatives include unrealized appreciation (depreciation) on swap contracts.
The accompanying notes are an integral part of the financial statements.
| as of May 31, 2012 | ||||
| Assets | ||||
| Investments in securities, at value (cost $1,975,088,147) | $ | 2,151,335,432 | ||
| Cash | 1,320,117 | |||
| Receivable for investments sold | 915,000 | |||
| Receivable for Fund shares sold | 5,159,757 | |||
| Interest receivable | 31,472,702 | |||
| Due from Advisor | 141,317 | |||
| Other assets | 85,768 | |||
| Total assets | 2,190,430,093 | |||
| Liabilities | ||||
| Payable for investments purchased — when-issued security | 2,919,705 | |||
| Payable for Fund shares redeemed | 3,032,818 | |||
| Payable for floating rate notes issued | 166,354,570 | |||
| Unrealized depreciation on swap contracts | 7,853,938 | |||
| Distributions payable | 1,662,364 | |||
| Accrued management fee | 833,163 | |||
| Accrued Trustees' fees | 15,120 | |||
| Other accrued expenses and payables | 1,128,423 | |||
| Total liabilities | 183,800,101 | |||
| Net assets, at value | $ | 2,006,629,992 | ||
| Net Assets Consist of | ||||
| Undistributed net investment income | 623,018 | |||
Net unrealized appreciation (depreciation) on: Investments | 176,247,285 | |||
| Swap contracts | (7,853,938 | ) | ||
| Accumulated net realized gain (loss) | (89,655,897 | ) | ||
| Paid-in capital | 1,927,269,524 | |||
| Net assets, at value | $ | 2,006,629,992 | ||
The accompanying notes are an integral part of the financial statements.
Statement of Assets and Liabilities as of May 31, 2012 (continued) | ||||
| Net Asset Value | ||||
Class A Net Asset Value and redemption price per share ($568,763,217 ÷ 44,508,931 outstanding shares of capital stock outstanding, $.01 par value, unlimited number of shares authorized) | $ | 12.78 | ||
| Maximum offering price per share (100 ÷ 97.25 of $12.78) | $ | 13.14 | ||
Class B Net Asset Value offering and redemption price per share ($7,573,205 ÷ 592,554 outstanding shares of beneficial interest, $.01 par value, unlimited number of shares authorized) | $ | 12.78 | ||
Class C Net Asset Value offering and redemption price per share ($187,546,561 ÷ 14,667,547 shares of capital stock outstanding, $.01 par value, unlimited number of shares authorized) | $ | 12.79 | ||
Class S Net Asset Value offering and redemption price per share ($1,022,806,495 ÷ 79,964,670 shares of capital stock outstanding, $.01 par value, unlimited number of shares authorized) | $ | 12.79 | ||
Institutional Class Net Asset Value offering and redemption price per share ($219,940,514 ÷ 17,191,206 shares of capital stock outstanding, $.01 par value, unlimited number of shares authorized) | $ | 12.79 | ||
The accompanying notes are an integral part of the financial statements.
| for the year ended May 31, 2012 | ||||
| Investment Income | ||||
Income: Interest | $ | 103,606,973 | ||
Expenses: Management fee | 8,719,223 | |||
| Administration fee | 1,754,090 | |||
| Services to shareholders | 2,545,822 | |||
| Distribution and service fees | 2,897,494 | |||
| Custodian fee | 21,677 | |||
| Professional fees | 103,521 | |||
| Reports to shareholders | 106,817 | |||
| Registration fees | 154,273 | |||
| Trustees' fees and expenses | 56,856 | |||
| Interest expense and fees on floating rate notes issued | 1,206,841 | |||
| Other | 93,350 | |||
| Total expenses before expense reductions | 17,659,964 | |||
| Expense reductions | (1,739,805 | ) | ||
| Total expenses after expense reductions | 15,920,159 | |||
| Net investment income | 87,686,814 | |||
| Realized and Unrealized Gain (Loss) | ||||
Net realized gain (loss) from: Investments | (6,314,226 | ) | ||
| Swap contracts | (34,157,008 | ) | ||
| (40,471,234 | ) | |||
Change in net unrealized appreciation (depreciation) on: Investments | 185,816,068 | |||
| Swap contracts | (2,430,446 | ) | ||
| 183,385,622 | ||||
| Net gain (loss) | 142,914,388 | |||
| Net increase (decrease) in net assets resulting from operations | $ | 230,601,202 | ||
The accompanying notes are an integral part of the financial statements.
| for the year ended May 31, 2012 | ||||
Increase (Decrease) in Cash: Cash Flows from Operating Activities | ||||
| Net increase (decrease) in net assets resulting from operations | $ | 230,601,202 | ||
Adjustments to reconcile net increase (decrease) in net assets resulting from operations to net cash provided (used) by operating activities: Purchases of long-term investments | (817,487,620 | ) | ||
| Net amortization of premium/ (accretion of discount) | (457,771 | ) | ||
| Proceeds from sales and maturities of long-term investments | 548,819,730 | |||
| (Increase) decrease in interest receivable | (4,894,175 | ) | ||
| (Increase) decrease in other assets | (98,524 | ) | ||
| (Increase) decrease in receivable for investments sold | (225,000 | ) | ||
| Increase (decrease) in payable for investments purchased — when-issued security | 932,925 | |||
| Increase (decrease) in other accrued expenses and payables | 101,332 | |||
| Change in net unrealized (appreciation) depreciation on investments | (185,816,068 | ) | ||
| Change in net unrealized (appreciation) depreciation on swap contracts | 2,430,446 | |||
| Net realized (gain) loss from investments | 6,314,226 | |||
| Cash provided (used) by operating activities | $ | (219,779,297 | ) | |
| Cash Flows from Financing Activities | ||||
| Proceeds from shares sold | 637,752,083 | |||
| Payments for shares redeemed | (397,039,055 | ) | ||
| Distributions paid (net of reinvestment of distributions) | (19,636,268 | ) | ||
| Cash provided (used) by financing activities | 221,076,760 | |||
| Increase (decrease) in cash | 1,297,463 | |||
| Cash at beginning of period | 22,654 | |||
| Cash at end of period | $ | 1,320,117 | ||
| Supplemental Disclosure of Non-Cash Financing Activities | ||||
| Reinvestment of distributions | $ | 66,713,950 | ||
| Interest expense and fees on floating rate notes issued | $ | (1,206,841 | ) | |
The accompanying notes are an integral part of the financial statements.
| Years Ended May 31, | ||||||||
| Increase (Decrease) in Net Assets | 2012 | 2011 | ||||||
Operations: Net investment income | $ | 87,686,814 | $ | 87,656,053 | ||||
| Net realized gain (loss) | (40,471,234 | ) | (24,472,710 | ) | ||||
| Change in net unrealized appreciation (depreciation) | 183,385,622 | (48,109,768 | ) | |||||
| Net increase (decrease) in net assets resulting from operations | 230,601,202 | 15,073,575 | ||||||
Distributions to shareholders from: Net investment income: Class A | (24,121,528 | ) | (23,841,800 | ) | ||||
| Class B | (332,071 | ) | (435,703 | ) | ||||
| Class C | (6,475,023 | ) | (6,706,335 | ) | ||||
| Class S | (45,795,733 | ) | (44,814,440 | ) | ||||
| Institutional Class | (9,411,689 | ) | (7,896,277 | ) | ||||
Net realized gains: Class A | (92,519 | ) | — | |||||
| Class B | (1,533 | ) | — | |||||
| Class C | (29,083 | ) | — | |||||
| Class S | (168,012 | ) | — | |||||
| Institutional Class | (34,589 | ) | — | |||||
| Total distributions | (86,461,780 | ) | (83,694,555 | ) | ||||
Fund share transactions: Proceeds from shares sold | 636,890,711 | 571,021,261 | ||||||
| Reinvestment of distributions | 66,713,950 | 59,974,975 | ||||||
| Payments for shares redeemed | (398,454,411 | ) | (640,862,996 | ) | ||||
| Net increase (decrease) in net assets from Fund share transactions | 305,150,250 | (9,866,760 | ) | |||||
| Increase (decrease) in net assets | 449,289,672 | (78,487,740 | ) | |||||
| Net assets at beginning of year | 1,557,340,320 | 1,635,828,060 | ||||||
| Net assets at end of year (including undistributed net investment income of $623,018 and $835,334, respectively) | $ | 2,006,629,992 | $ | 1,557,340,320 | ||||
The accompanying notes are an integral part of the financial statements.
| Years Ended May 31, | |||||||||||||||||||||
| Class A | 2012 | 2011 | 2010 | 2009 | 2008 | ||||||||||||||||
| Selected Per Share Data | |||||||||||||||||||||
| Net asset value, beginning of period | $ | 11.78 | $ | 12.23 | $ | 11.21 | $ | 12.46 | $ | 12.83 | |||||||||||
Income from investment operations: Net investment income | .59 | .61 | .62 | .64 | .59 | ||||||||||||||||
| Net realized and unrealized gain (loss) | 1.00 | (.45 | ) | 1.02 | (1.25 | ) | (.37 | ) | |||||||||||||
| Total from investment operations | 1.59 | .16 | 1.64 | (.61 | ) | .22 | |||||||||||||||
Less distributions from: Net investment income | (.59 | ) | (.61 | ) | (.62 | ) | (.64 | ) | (.59 | ) | |||||||||||
| Net realized gains | (.00 | )* | — | — | (.00 | )* | — | ||||||||||||||
| Total distributions | (.59 | ) | (.61 | ) | (.62 | ) | (.64 | ) | (.59 | ) | |||||||||||
| Net asset value, end of period | $ | 12.78 | $ | 11.78 | $ | 12.23 | $ | 11.21 | $ | 12.46 | |||||||||||
Total Return (%)a,b | 13.88 | 1.37 | 14.96 | (4.48 | ) | 1.73 | |||||||||||||||
| Ratios to Average Net Assets and Supplemental Data | |||||||||||||||||||||
| Net assets, end of period ($ millions) | 569 | 432 | 464 | 275 | 334 | ||||||||||||||||
Ratio of expenses before expense reductions (including interest expense) (%)c | 1.03 | 1.08 | 1.05 | 1.39 | 1.60 | ||||||||||||||||
Ratio of expenses after expense reductions (including interest expense) (%)c | .99 | 1.03 | 1.03 | 1.31 | 1.57 | ||||||||||||||||
| Ratio of expenses after expense reductions (excluding interest expense) (%) | .92 | .94 | .93 | .92 | .94 | ||||||||||||||||
| Ratio of net investment income (%) | 4.92 | 5.35 | 5.31 | 6.10 | 4.67 | ||||||||||||||||
| Portfolio turnover rate (%) | 29 | 30 | 28 | 82 | 70 | ||||||||||||||||
a Total return does not reflect the effect of any sales charges. b Total return would have been lower had certain expenses not been reduced. c Interest expense represents interest and fees on short-term floating rate notes issued in conjunction with inverse floating rate securities. Interest income from such transactions is included in income from investment operations. * Amount is less than $.005. | |||||||||||||||||||||
| Years Ended May 31, | |||||||||||||||||||||
| Class B | 2012 | 2011 | 2010 | 2009 | 2008 | ||||||||||||||||
| Selected Per Share Data | |||||||||||||||||||||
| Net asset value, beginning of period | $ | 11.78 | $ | 12.23 | $ | 11.21 | $ | 12.46 | $ | 12.84 | |||||||||||
Income from investment operations: Net investment income | .50 | .52 | .53 | .56 | .49 | ||||||||||||||||
| Net realized and unrealized gain (loss) | 1.00 | (.45 | ) | 1.02 | (1.25 | ) | (.38 | ) | |||||||||||||
| Total from investment operations | 1.50 | .07 | 1.55 | (.69 | ) | .11 | |||||||||||||||
Less distributions from: Net investment income | (.50 | ) | (.52 | ) | (.53 | ) | (.56 | ) | (.49 | ) | |||||||||||
| Net realized gains | (.00 | )* | — | — | (.00 | )* | — | ||||||||||||||
| Total distributions | (.50 | ) | (.52 | ) | (.53 | ) | (.56 | ) | (.49 | ) | |||||||||||
| Net asset value, end of period | $ | 12.78 | $ | 11.78 | $ | 12.23 | $ | 11.21 | $ | 12.46 | |||||||||||
Total Return (%)a,b | 13.02 | .61 | 14.10 | (5.19 | ) | .88 | |||||||||||||||
| Ratios to Average Net Assets and Supplemental Data | |||||||||||||||||||||
| Net assets, end of period ($ millions) | 8 | 9 | 12 | 14 | 28 | ||||||||||||||||
Ratio of expenses before expense reductions (including interest expense) (%)c | 1.80 | 1.87 | 1.82 | 2.17 | 2.37 | ||||||||||||||||
Ratio of expenses after expense reductions (including interest expense) (%)c | 1.74 | 1.78 | 1.77 | 2.06 | 2.32 | ||||||||||||||||
| Ratio of expenses after expense reductions (excluding interest expense) (%) | 1.67 | 1.69 | 1.67 | 1.67 | 1.69 | ||||||||||||||||
| Ratio of net investment income (%) | 4.19 | 4.59 | 4.57 | 5.35 | 3.92 | ||||||||||||||||
| Portfolio turnover rate (%) | 29 | 30 | 28 | 82 | 70 | ||||||||||||||||
a Total return does not reflect the effect of any sales charges. b Total return would have been lower had certain expenses not been reduced. c Interest expense represents interest and fees on short-term floating rate notes issued in conjunction with inverse floating rate securities. Interest income from such transactions is included in income from investment operations. * Amount is less than $.005. | |||||||||||||||||||||
| Years Ended May 31, | |||||||||||||||||||||
| Class C | 2012 | 2011 | 2010 | 2009 | 2008 | ||||||||||||||||
| Selected Per Share Data | |||||||||||||||||||||
| Net asset value, beginning of period | $ | 11.79 | $ | 12.24 | $ | 11.22 | $ | 12.47 | $ | 12.84 | |||||||||||
Income from investment operations: Net investment income | .50 | .52 | .53 | .56 | .49 | ||||||||||||||||
| Net realized and unrealized gain (loss) | 1.00 | (.45 | ) | 1.02 | (1.25 | ) | (.37 | ) | |||||||||||||
| Total from investment operations | 1.50 | .07 | 1.55 | (.69 | ) | .12 | |||||||||||||||
Less distributions from: Net investment income | (.50 | ) | (.52 | ) | (.53 | ) | (.56 | ) | (.49 | ) | |||||||||||
| Net realized gains | (.00 | )* | — | — | (.00 | )* | — | ||||||||||||||
| Total distributions | (.50 | ) | (.52 | ) | (.53 | ) | (.56 | ) | (.49 | ) | |||||||||||
| Net asset value, end of period | $ | 12.79 | $ | 11.79 | $ | 12.24 | $ | 11.22 | $ | 12.47 | |||||||||||
Total Return (%)a,b | 13.03 | .61 | 14.11 | (5.17 | ) | .98 | |||||||||||||||
| Ratios to Average Net Assets and Supplemental Data | |||||||||||||||||||||
| Net assets, end of period ($ millions) | 188 | 141 | 154 | 87 | 87 | ||||||||||||||||
Ratio of expenses before expense reductions (including interest expense) (%)c | 1.77 | 1.82 | 1.84 | 2.16 | 2.31 | ||||||||||||||||
Ratio of expenses after expense reductions (including interest expense) (%)c | 1.74 | 1.78 | 1.78 | 2.06 | 2.31 | ||||||||||||||||
| Ratio of expenses after expense reductions (excluding interest expense) (%) | 1.67 | 1.69 | 1.68 | 1.67 | 1.68 | ||||||||||||||||
| Ratio of net investment income (%) | 4.16 | 4.60 | 4.56 | 5.35 | 3.93 | ||||||||||||||||
| Portfolio turnover rate (%) | 29 | 30 | 28 | 82 | 70 | ||||||||||||||||
a Total return does not reflect the effect of any sales charges. b Total return would have been lower had certain expenses not been reduced. c Interest expense represents interest and fees on short-term floating rate notes issued in conjunction with inverse floating rate securities. Interest income from such transactions is included in income from investment operations. * Amount is less than $.005. | |||||||||||||||||||||
| Years Ended May 31, | |||||||||||||||||||||
| Class S | 2012 | 2011 | 2010 | 2009 | 2008 | ||||||||||||||||
| Selected Per Share Data | |||||||||||||||||||||
| Net asset value, beginning of period | $ | 11.79 | $ | 12.24 | $ | 11.22 | $ | 12.47 | $ | 12.85 | |||||||||||
Income from investment operations: Net investment income | .62 | .64 | .65 | .67 | .62 | ||||||||||||||||
| Net realized and unrealized gain (loss) | 1.00 | (.45 | ) | 1.02 | (1.25 | ) | (.38 | ) | |||||||||||||
| Total from investment operations | 1.62 | .19 | 1.67 | (.58 | ) | .24 | |||||||||||||||
Less distributions from: Net investment income | (.62 | ) | (.64 | ) | (.65 | ) | (.67 | ) | (.62 | ) | |||||||||||
| Net realized gains | (.00 | )* | — | — | (.00 | )* | — | ||||||||||||||
| Total distributions | (.62 | ) | (.64 | ) | (.65 | ) | (.67 | ) | (.62 | ) | |||||||||||
| Net asset value, end of period | $ | 12.79 | $ | 11.79 | $ | 12.24 | $ | 11.22 | $ | 12.47 | |||||||||||
Total Return (%)a | 14.15 | 1.63 | 15.22 | (4.23 | ) | 1.90 | |||||||||||||||
| Ratios to Average Net Assets and Supplemental Data | |||||||||||||||||||||
| Net assets, end of period ($ millions) | 1,023 | 832 | 858 | 645 | 787 | ||||||||||||||||
Ratio of expenses before expense reductions (including interest expense) (%)b | .90 | .94 | .98 | 1.30 | 1.53 | ||||||||||||||||
Ratio of expenses after expense reductions (including interest expense) (%)b | .74 | .78 | .78 | 1.06 | 1.32 | ||||||||||||||||
| Ratio of expenses after expense reductions (excluding interest expense) (%) | .67 | .69 | .68 | .67 | .69 | ||||||||||||||||
| Ratio of net investment income (%) | 5.17 | 5.60 | 5.56 | 6.35 | 4.92 | ||||||||||||||||
| Portfolio turnover rate (%) | 29 | 30 | 28 | 82 | 70 | ||||||||||||||||
a Total return would have been lower had certain expenses not been reduced. b Interest expense represents interest and fees on short-term floating rate notes issued in conjunction with inverse floating rate securities. Interest income from such transactions is included in income from investment operations. * Amount is less than $.005. | |||||||||||||||||||||
| Years Ended May 31, | |||||||||||||||||||||
| Institutional Class | 2012 | 2011 | 2010 | 2009 | 2008 | ||||||||||||||||
| Selected Per Share Data | |||||||||||||||||||||
| Net asset value, beginning of period | $ | 11.79 | $ | 12.24 | $ | 11.22 | $ | 12.48 | $ | 12.85 | |||||||||||
Income from investment operations: Net investment income | .63 | .64 | .66 | .67 | .62 | ||||||||||||||||
| Net realized and unrealized gain (loss) | 1.00 | (.45 | ) | 1.02 | (1.26 | ) | (.37 | ) | |||||||||||||
| Total from investment operations | 1.63 | .19 | 1.68 | (.59 | ) | .25 | |||||||||||||||
Less distributions from: Net investment income | (.63 | ) | (.64 | ) | (.66 | ) | (.67 | ) | (.62 | ) | |||||||||||
| Net realized gains | (.00 | )* | — | — | (.00 | )* | — | ||||||||||||||
| Total distributions | (.63 | ) | (.64 | ) | (.66 | ) | (.67 | ) | (.62 | ) | |||||||||||
| Net asset value, end of period | $ | 12.79 | $ | 11.79 | $ | 12.24 | $ | 11.22 | $ | 12.48 | |||||||||||
| Total Return (%) | 14.17 | a | 1.66 | a | 15.33 | a | (4.26 | )a | 2.00 | ||||||||||||
| Ratios to Average Net Assets and Supplemental Data | |||||||||||||||||||||
| Net assets, end of period ($ millions) | 220 | 143 | 147 | 28 | 6 | ||||||||||||||||
Ratio of expenses before expense reductions (including interest expense) (%)b | .79 | .82 | .79 | 1.13 | 1.32 | ||||||||||||||||
Ratio of expenses after expense reductions (including interest expense) (%)b | .74 | .75 | .76 | 1.06 | 1.32 | ||||||||||||||||
| Ratio of expenses after expense reductions (excluding interest expense) (%) | .67 | .66 | .66 | .67 | .69 | ||||||||||||||||
| Ratio of net investment income (%) | 5.16 | 5.62 | 5.58 | 6.35 | 4.92 | ||||||||||||||||
| Portfolio turnover rate (%) | 29 | 30 | 28 | 82 | 70 | ||||||||||||||||
a Total return would have been lower had certain expenses not been reduced. b Interest expense represents interest and fees on short-term floating rate notes issued in conjunction with inverse floating rate securities. Interest income from such transactions is included in income from investment operations. * Amount is less than $.005. | |||||||||||||||||||||
A. Organization and Significant Accounting Policies
DWS Strategic High Yield Tax-Free Fund (the "Fund") is a diversified series of DWS Municipal Trust (the "Trust"), which is registered under the Investment Company Act of 1940, as amended (the "1940 Act"), as an open-end management investment company organized as a Massachusetts business trust.
The Fund offers multiple classes of shares which provide investors with different purchase options. Class A shares are offered to investors subject to an initial sales charge. Class B shares of the Fund are closed to new purchases, except exchanges or the reinvestment of dividends or other distributions. Class B shares were offered to investors without an initial sales charge and are subject to higher ongoing expenses than Class A shares and a contingent deferred sales charge payable upon certain redemptions. Class B shares automatically convert to Class A shares six years after issuance. Class C shares are offered to investors without an initial sales charge but are subject to higher ongoing expenses than Class A shares and a contingent deferred sales charge payable upon certain redemptions within one year of purchase. Class C shares do not automatically convert into another class. Institutional Class shares are offered to a limited group of investors, are not subject to initial or contingent deferred sales charges and have lower ongoing expenses than other classes. Class S shares are not subject to initial or contingent deferred sales charges and are generally not available to new investors except under certain circumstances.
Investment income, realized and unrealized gains and losses, and certain fund-level expenses and expense reductions, if any, are borne pro rata on the basis of relative net assets by the holders of all classes of shares, except that each class bears certain expenses unique to that class such as distribution and service fees, services to shareholders and certain other class-specific expenses. Differences in class-level expenses may result in payment of different per share dividends by class. All shares of the Fund have equal rights with respect to voting subject to class-specific arrangements.
The Fund's financial statements are prepared in accordance with accounting principles generally accepted in the United States of America which require the use of management estimates. Actual results could differ from those estimates. The policies described below are followed consistently by the Fund in the preparation of its financial statements.
Security Valuation. Investments are stated at value determined as of the close of regular trading on the New York Stock Exchange on each day the exchange is open for trading.
Various inputs are used in determining the value of the Fund's investments. These inputs are summarized in three broad levels. Level 1 includes quoted prices in active markets for identical securities. Level 2 includes other significant observable inputs (including quoted prices for similar securities, interest rates, prepayment speeds, and credit risk). Level 3 includes significant unobservable inputs (including the Fund's own assumptions in determining the fair value of investments). The inputs or methodology used for valuing securities are not necessarily an indication of the risk associated with investing in those securities.
Municipal debt securities are valued at prices supplied by independent pricing services approved by the Fund's Board, whose valuations are intended to reflect the mean between the bid and asked prices. If the pricing services are unable to provide valuations, the securities are valued at the mean of the most recent bid and asked quotations or evaluated prices, as applicable, obtained from one or more broker-dealers. Such services may use various pricing techniques which take into account appropriate factors such as yield, quality, coupon rate, maturity, type of issue, trading characteristics and other data, as well as broker quotes. These securities are generally categorized as Level 2.
Swap contracts are valued daily based upon prices supplied by a Board approved pricing vendor, if available, and otherwise are valued at the price provided by the broker-dealer. Swap contracts are generally categorized as Level 2.
Securities and other assets for which market quotations are not readily available or for which the above valuation procedures are deemed not to reflect fair value are valued in a manner that is intended to reflect their fair value as determined in accordance with procedures approved by the Board and are generally categorized as Level 3. In accordance with the Fund's valuation procedures, factors used in determining value may include, but are not limited to, the type of the security; the size of the holding; the initial cost of the security; the existence of any contractual restrictions on the security's disposition; the price and extent of public trading in similar securities of the issuer or of comparable companies; quotations or evaluated prices from broker-dealers and/or pricing services; information obtained from the issuer, analysts, and/or the appropriate stock exchange (for exchange-traded securities); an analysis of the company's or issuer's financial statements; an evaluation of the forces that influence the issuer and the market(s) in which the security is purchased and sold and with respect to debt securities; the maturity, coupon, creditworthiness, currency denomination and the movement of the market in which the security is normally traded. The value determined under these procedures may differ from published values for the same securities.
Disclosure about the classification of fair value measurements is included in a table following the Fund's Investment Portfolio.
Inverse Floaters. The Fund invests in inverse floaters. Inverse floaters are debt instruments with a weekly floating rate of interest that bears an inverse relationship to changes in the short-term interest rate market. Inverse floaters are created by depositing a fixed-rate municipal bond into a special purpose trust (the "Trust"). In turn the Trust issues a short-term floating rate note and an inverse floater. The income stream from the underlying bond in the Trust is divided between the floating rate note and the inverse floater. The income provided by the inverse floater bears an inverse relationship with the short-term rate paid to the floating rate note holder. The short-term floating rate note is issued in a face amount equal to some fraction of the underlying bond's par amount and is paid to a third party, usually a tax-exempt money market fund, at rates that generally reset weekly. The inverse floater earns all of the interest from the underlying fixed-rate bond less the amount of interest paid on the floating rate note and the expenses of the Trust. The inverse floater represents an investment in the underlying bond on a leveraged basis; the Fund bears all of the price risk of the underlying bond in the Trust and receives all the benefits from any potential appreciation of the underlying bond's value. The floating rate notes issued by the Trust are valued at cost, which approximates fair value.
By holding the inverse floater, the Fund has the right to collapse the Trust by causing the holders of the floating rate instrument to tender their notes at par and have the broker transfer the underlying bond to the Fund. The floating rate note holder can also elect to tender the note for redemption at par at each reset date. The Fund accounts for these transactions as a form of secured borrowing, by reflecting the value of the underlying bond in the investments of the Fund and the amount owed to the floating rate note holder as a liability under the caption "Payable for floating rate notes issued" in the Statement of Assets and Liabilities. Income earned on the underlying bond is included in interest income, and interest paid on the floaters and the expenses of the Trust are included in "Interest expense and fees on floating rate notes issued" in the Statement of Operations.
The Fund may enter into shortfall and forbearance agreements by which the Fund agrees to reimburse the Trust, in certain circumstances, for the difference between the liquidation value of the underlying bond held by the Trust and the liquidation value of the floating rate notes plus any shortfalls in interest cash flows. This could potentially expose the Fund to losses in excess of the value of the Fund's inverse floater investments. In addition, the value of inverse floaters may decrease significantly when interest rates increase. The market for inverse floaters may be more volatile and less liquid than other municipal bonds of comparable maturity. The Trust could be terminated outside of the Fund's control, resulting in a reduction of leverage and disposal of portfolio investments at inopportune times and prices. Investments in inverse floaters generally involve greater risk than in an investment in fixed-rate bonds.
The weighted average outstanding daily balance of the floating rate notes issued during the year ended May 31, 2012 was $166,354,570, with a weighted average interest rate of 0.73%.
When-Issued/Delayed Delivery Securities. The Fund may purchase securities with delivery or payment to occur at a later date beyond the normal settlement period. At the time the Fund enters into a commitment to purchase a security, the transaction is recorded and the value of the transaction is reflected in the net asset value. The price of such security and the date when the security will be delivered and paid for are fixed at the time the transaction is negotiated. The value of the security may vary with market fluctuations. At the time the Fund enters into a purchase transaction it is required to segregate cash or other liquid assets at least equal to the amount of the commitment.
Certain risks may arise upon entering into when-issued or delayed delivery transaction from the potential inability of counterparties to meet the terms of their contracts or if the issuer does not issue the securities due to political, economic, or other factors. Additionally, losses may arise due to changes in the value of the underlying securities.
Federal Income Taxes. The Fund's policy is to comply with the requirements of the Internal Revenue Code, as amended, which are applicable to regulated investment companies and to distribute all of its taxable and tax-exempt income to its shareholders.
Under the Regulated Investment Company Modernization Act of 2010, net capital losses may be carried forward indefinitely, and their character is retained as short-term and/or long-term. Previously, net capital losses were carried forward for eight years and treated as short-term losses. As a transition rule, the Act requires that post-enactment net capital losses be used before pre-enactment net capital losses.
At May 31, 2012, the Fund had net tax basis capital loss carryforwards of approximately $93,436,000, including $31,294,000 of pre-enactment losses which may be applied against any realized net taxable capital gains of each succeeding year until fully utilized or until May 31, 2013 ($2,355,000), May 31, 2014 ($2,294,000), May 31, 2015 ($234,000), May 31, 2017 ($3,436,000), May 31, 2018 ($19,507,000) and May 31, 2019 ($3,468,000), the respective expiration dates, whichever occurs first, and approximately $62,142,000 of post-enactment losses, which may be applied against realized net taxable capital gains indefinitely, including short-term losses ($40,507,000) and long-term losses ($21,635,000).
The Fund has reviewed the tax positions for the open tax years as of May 31, 2012 and has determined that no provision for income tax is required in the Fund's financial statements. The Fund's federal tax returns for the prior three fiscal years remain open subject to examination by the Internal Revenue Service.
Distribution of Income and Gains. Net investment income of the Fund is declared as a daily dividend and is distributed to shareholders monthly. Net realized gains from investment transactions, in excess of available capital loss carryforwards, would be taxable to the Fund if not distributed, and, therefore, will be distributed to shareholders at least annually.
The timing and characterization of certain income and capital gain distributions are determined annually in accordance with federal tax regulations which may differ from accounting principles generally accepted in the United States of America. These differences primarily relate to investments in swap contracts, certain securities sold at a loss and accretion of market discount on debt securities. As a result, net investment income (loss) and net realized gain (loss) on investment transactions for a reporting period may differ significantly from distributions during such period. Accordingly, the Fund may periodically make reclassifications among certain of its capital accounts without impacting the net asset value of the Fund.
At May 31, 2012, the Fund's components of distributable earnings (accumulated losses) on a tax basis were as follows:
| Undistributed tax-exempt income | $ | 3,101,102 | ||
| Undistributed ordinary income* | $ | 86,127 | ||
| Capital loss carryforwards | $ | (93,436,000 | ) | |
| Net unrealized appreciation (depreciation) on investments | $ | 180,287,337 |
In addition, the tax character of distributions paid to shareholders by the Fund is summarized as follows:
| Years Ended May 31, | ||||||||
| 2012 | 2011 | |||||||
| Distributions from tax-exempt income | $ | 86,136,044 | $ | 83,694,555 | ||||
| Distributions from ordinary income* | $ | 325,736 | $ | — | ||||
* For tax purposes, short-term capital gain distributions are considered ordinary income distributions.
Expenses. Expenses of the Trust arising in connection with a specific fund are allocated to that fund. Other Trust expenses which cannot be directly attributed to a fund are apportioned among the funds in the Trust.
Contingencies. In the normal course of business, the Fund may enter into contracts with service providers that contain general indemnification clauses. The Fund's maximum exposure under these arrangements is unknown as this would involve future claims that may be made against the Fund that have not yet been made. However, based on experience, the Fund expects the risk of loss to be remote.
Other. Investment transactions are accounted for on a trade date plus one basis for daily net asset value calculations. However, for financial reporting purposes, investment transactions are reported on trade date. Interest income is recorded on the accrual basis. Realized gains and losses from investment transactions are recorded on an identified cost basis and may include proceeds from litigation. All premiums and discounts are amortized/accreted for financial reporting purposes, with the exception of securities in default of principal.
Statement of Cash Flows. Information on financial transactions which have been settled through the receipt and disbursement of cash is presented in the Statement of Cash Flows. The cash amount shown in the Statement of Cash Flows represents the cash position at the Fund's custodian bank at May 31, 2012.
B. Derivative Instruments
Interest Rate Swap Contracts. For the year ended May 31, 2012, the Fund invested in interest rate swap contracts to manage the duration of the Investment Portfolio. The use of interest rate swaps is a highly specialized activity that involves investment techniques and risks different from those associated with ordinary portfolio security transactions. In an interest rate swap, the Fund agrees to pay to the other party to the interest rate swap (which is known as the "counterparty") a fixed rate payment in exchange for the counterparty agreeing to pay to the Fund a variable rate payment, or the Fund agrees to receive from the counterparty a fixed rate payment in exchange for the counterparty agreeing to receive from the Fund a variable rate payment, the accruals for which would begin at a specified date in the future (the "effective date"). The payment obligations are based on the notional amount of the swap. Certain risks may arise when entering into swap transactions including counterparty default, liquidity or unfavorable changes in interest rates. In connection with these agreements, securities and or cash may be identified as collateral in accordance with the terms of the swap agreements to provide assets of value and recourse in the event of default. The maximum counterparty credit risk is the net present value of the cash flows to be received from or paid to the counterparty over the term of the interest rate swap contract, to the extent that this amount is beneficial to the Fund, in addition to any related collateral posted to the counterparty by the Fund. This risk may be partially reduced by a master netting arrangement between the Fund and the counterparty. The Fund generally intends, but is not obligated, to terminate its interest rate swaps before the effective date. Payments received or made are recorded as realized gain or loss in the Statement of Operations. The value of the swap is adjusted daily based upon a price supplied by a Board approved pricing vendor and the change in value is recorded as unrealized appreciation or depreciation. An upfront payment, if any, made by the Fund is recorded as an asset in the Statement of Assets and Liabilities. An upfront payment, if any, received by the Fund is recorded as a liability in the Statement of Assets and Liabilities. Payments received or made at the end of the measurement period are recorded as realized gain or loss in the Statement of Operations.
A summary of the open interest rate swap contracts as of May 31, 2012 is included in a table following the Fund's Investment Portfolio. For the year ended May 31, 2012, the investment in interest rate swap contracts had a total notional amount generally indicative of a range from $98,750,000 to $126,950,000.
The following table summarizes the value of the Fund's derivative instruments held as of May 31, 2012 and the related location in the accompanying Statement of Assets and Liabilities, presented by primary underlying risk exposure:
| Liability Derivative | Swap Contracts | |||
| Interest Rate Contracts (a) | $ | (7,853,938 | ) | |
The above derivative is located in the following Statement of Assets and Liabilities account:
(a) Unrealized depreciation on swap contracts
Additionally, the amount of unrealized and realized gains and losses on derivative instruments recognized in Fund earnings during the year ended May 31, 2012 and the related location in the accompanying Statement of Operations is summarized in the following tables by primary underlying risk exposure:
| Realized Gain (Loss) | Swap Contracts | |||
| Interest Rate Contracts (a) | $ | (34,157,008 | ) | |
The above derivative is located in the following Statement of Operations account:
(a) Net realized gain (loss) from swap contracts
| Change in Net Unrealized Appreciation (Depreciation) | Swap Contracts | |||
| Interest Rate Contracts (a) | $ | (2,430,446 | ) | |
The above derivative is located in the following Statement of Operations account:
(a) Change in net unrealized appreciation (depreciation) on swap contracts
C. Purchases and Sales of Securities
During the year ended May 31, 2012, purchases and sales of investment securities (excluding short-term investments) aggregated $817,487,620 and $548,819,730, respectively.
D. Related Parties
Management Agreement. Under the Investment Management Agreement with Deutsche Investment Management Americas Inc. ("DIMA" or the "Advisor"), an indirect, wholly owned subsidiary of Deutsche Bank AG, the Advisor directs the investments of the Fund in accordance with its investment objectives, policies and restrictions. The Advisor determines the securities, instruments and other contracts relating to investments to be purchased, sold or entered into by the Fund.
Under the Investment Management Agreement with the Advisor, the Fund pays a monthly management fee based on the Fund's average daily net assets, computed and accrued daily and payable monthly, at the following annual rates:
| First $300 million of the Fund's average daily net assets | .565 | % | ||
| Next $200 million of such net assets | .515 | % | ||
| Next $500 million of such net assets | .490 | % | ||
| Over $1 billion of such net assets | .470 | % |
Accordingly, for the year ended May 31, 2012, the fee pursuant to the Investment Management Agreement was equivalent to an annual effective rate of 0.50% of the Fund's average daily net assets.
For the period from June 1, 2011 through September 30, 2011, the Advisor had contractually agreed to waive its fees and/or reimburse certain operating expenses of the Fund to the extent necessary to maintain the operating expenses (excluding certain expenses such as extraordinary expenses, taxes, brokerage and interest) of each class as follows:
| Class A | .93% |
| Class B | 1.68% |
| Class C | 1.68% |
| Class S | .68% |
| Institutional Class | .68% |
In addition, for the period from June 1, 2011 through September 30, 2011, the Advisor had voluntarily agreed to waive its fees and/or reimburse certain operating expenses of Institutional Class shares to the extent necessary to maintain the operating expenses (excluding certain expenses such as extraordinary expenses, taxes, brokerage and interest) at 0.66%.
For the period from October 1, 2011 through September 30, 2012, the Advisor has contractually agreed to waive its fees and/or reimburse certain operating expenses of the Fund to the extent necessary to maintain the operating expenses (excluding certain expenses such as extraordinary expenses, taxes, brokerage and interest) of each class as follows:
| Class A | .92% |
| Class B | 1.67% |
| Class C | 1.67% |
| Class S | .67% |
| Institutional Class | .67% |
Administration Fee. Pursuant to an Administrative Services Agreement, DIMA provides most administrative services to the Fund. For all services provided under the Administrative Services Agreement, the Fund pays the Advisor an annual fee ("Administration Fee") of 0.10% of the Fund's average daily net assets, computed and accrued daily and payable monthly. For the year ended May 31, 2012, the Administration Fee was $1,754,090, of which $168,709 is unpaid.
Service Provider Fees. DWS Investments Service Company ("DISC"), an affiliate of the Advisor, is the transfer agent, dividend-paying agent and shareholder service agent for the Fund. Pursuant to a sub-transfer agency agreement between DISC and DST Systems, Inc. ("DST"), DISC has delegated certain transfer agent, dividend-paying agent and shareholder service agent functions to DST. DISC compensates DST out of the shareholder servicing fee it receives from the Fund. For the year ended May 31, 2012, the amounts charged to the Fund by DISC were as follows:
| Services to Shareholders | Total Aggregated | Waived | ||||||
| Class A | $ | 51,362 | $ | 51,362 | ||||
| Class B | 2,059 | 2,059 | ||||||
| Class C | 19,839 | 19,839 | ||||||
| Class S | 544,521 | 544,521 | ||||||
| Institutional Class | 7,297 | 7,297 | ||||||
| $ | 625,078 | $ | 625,078 | |||||
In addition, for the year ended May 31, 2012, the Advisor reimbursed the Fund $874,392 and $87,947 of non-affiliated sub-recordkeeping fees for Class S and Institutional Class shares, respectively.
Distribution and Service Fees. Under the Fund's Class B and Class C 12b-1 Plans, DWS Investments Distributors, Inc. ("DIDI"), an affiliate of the Advisor, receives a fee ("Distribution Fee") of 0.75% of average daily net assets of each of Class B and C shares. In accordance with the Fund's Underwriting and Distribution Services Agreement, DIDI enters into related selling group agreements with various firms at various rates for sales of Class B and C shares. For the year ended May 31, 2012, the Distribution Fee was as follows:
| Distribution Fee | Total Aggregated | Unpaid at May 31, 2012 | ||||||
| Class B | $ | 60,676 | $ | 4,846 | ||||
| Class C | 1,190,681 | 117,554 | ||||||
| $ | 1,251,357 | $ | 122,400 | |||||
In addition, DIDI provides information and administrative services for a fee ("Service Fee") to Class A, B and C shareholders at an annual rate of up to 0.25% of average daily net assets for each such class. DIDI in turn has various agreements with financial services firms that provide these services and pay these fees based upon the assets of shareholder accounts the firms service. For the year ended May 31, 2012, the Service Fee was as follows:
| Service Fee | Total Aggregated | Waived | Unpaid at May 31, 2012 | Annual Effective Rate | ||||||||||||
| Class A | $ | 1,229,020 | $ | 120,269 | $ | 206,632 | .22 | % | ||||||||
| Class B | 20,223 | 2,594 | 3,261 | .22 | % | |||||||||||
| Class C | 396,894 | 29,525 | 65,279 | .23 | % | |||||||||||
| $ | 1,646,137 | $ | 152,388 | $ | 275,172 | |||||||||||
Underwriting Agreement and Contingent Deferred Sales Charge. DIDI is the principal underwriter for the Fund. Underwriting commissions paid in connection with the distribution of Class A shares for the year ended May 31, 2012 aggregated $107,782.
In addition, DIDI receives any contingent deferred sales charge ("CDSC") from Class B share redemptions occurring within six years of purchase and Class C share redemptions occurring within one year of purchase. There is no such charge upon redemption of any share appreciation or reinvested dividends. The CDSC is based on declining rates, ranging from 4% to 1% for Class B and 1% for Class C, of the value of the shares redeemed. For the year ended May 31, 2012, the CDSC for Class B and Class C shares aggregated $9,194 and $30,092, respectively. A deferred sales charge of up to 0.50% is assessed on certain redemptions of Class A shares. For the year ended May 31, 2012, DIDI received $10,204 for Class A shares.
Typesetting and Filing Service Fees. Under an agreement with DIMA, DIMA is compensated for providing typesetting and certain regulatory filing services to the Fund. For the year ended May 31, 2012, the amount charged to the Fund by DIMA included in the Statement of Operations under "reports to shareholders" aggregated $24,888, of which $11,562 is unpaid.
Trustees' Fees and Expenses. The Fund paid retainer fees to each Trustee not affiliated with the Advisor, plus specified amounts to the Board Chairperson and to each committee Chairperson.
E. Investing in High-Yield Securities
The Fund's performance could be hurt if a security declines in credit quality or goes into default, or if an issuer does not make timely payments of interest or principal. Because the issuers of high-yield debt securities or junk bonds (debt securities rated below the fourth-highest category) may be in uncertain financial health, the risk of loss from default by the issuer is significantly greater. Prices and yields of high-yield securities will fluctuate over time and, during periods of economic uncertainty, volatility of high-yield securities may adversely affect a fund's net asset value. Because the Fund may invest in securities not paying current interest or in securities already in default, these risks may be more pronounced.
F. Line of Credit
The Fund and other affiliated funds (the "Participants") share in a $375 million revolving credit facility provided by a syndication of banks. The Fund may borrow for temporary or emergency purposes, including the meeting of redemption requests that otherwise might require the untimely disposition of securities. The Participants are charged an annual commitment fee which is allocated based on net assets, among each of the Participants. Interest is calculated at a rate per annum equal to the sum of the Federal Funds Rate plus 1.25 percent plus if LIBOR exceeds the Federal Funds Rate the amount of such excess. The Fund may borrow up to a maximum of 33 percent of its net assets under the agreement. The Fund had no outstanding loans at May 31, 2012.
G. Share Transactions
The following table summarizes share and dollar activity in the Fund:
| Year Ended May 31, 2011 | ||||||||||||||||
| Shares | Dollars | Shares | Dollars | |||||||||||||
| Shares sold | ||||||||||||||||
| Class A | 17,923,012 | $ | 219,391,109 | 16,110,700 | $ | 193,018,839 | ||||||||||
| Class B | 31,563 | 387,221 | 11,371 | 137,257 | ||||||||||||
| Class C | 4,611,538 | 56,693,015 | 3,601,297 | 43,367,351 | ||||||||||||
| Class S | 22,807,791 | 280,386,448 | 20,949,342 | 249,135,026 | ||||||||||||
| Institutional Class | 6,562,428 | 80,032,918 | 7,179,126 | 85,362,788 | ||||||||||||
| $ | 636,890,711 | $ | 571,021,261 | |||||||||||||
| Shares issued to shareholders in reinvestment of distributions | ||||||||||||||||
| Class A | 1,661,358 | $ | 20,349,935 | 1,602,869 | $ | 19,088,650 | ||||||||||
| Class B | 18,896 | 230,791 | 24,060 | 286,691 | ||||||||||||
| Class C | 384,537 | 4,711,860 | 385,339 | 4,590,267 | ||||||||||||
| Class S | 2,627,937 | 32,224,284 | 2,512,790 | 29,939,383 | ||||||||||||
| Institutional Class | 749,058 | 9,197,080 | 509,567 | 6,069,984 | ||||||||||||
| $ | 66,713,950 | $ | 59,974,975 | |||||||||||||
| Shares redeemed | ||||||||||||||||
| Class A | (11,781,406 | ) | $ | (144,122,408 | ) | (18,989,043 | ) | $ | (223,572,492 | ) | ||||||
| Class B | (185,830 | ) | (2,280,462 | ) | (283,211 | ) | (3,378,596 | ) | ||||||||
| Class C | (2,313,504 | ) | (28,141,906 | ) | (4,624,470 | ) | (54,279,870 | ) | ||||||||
| Class S | (16,007,581 | ) | (195,733,240 | ) | (23,044,069 | ) | (272,715,446 | ) | ||||||||
| Institutional Class | (2,283,757 | ) | (28,176,395 | ) | (7,506,226 | ) | (86,916,592 | ) | ||||||||
| $ | (398,454,411 | ) | $ | (640,862,996 | ) | |||||||||||
| Net increase (decrease) | ||||||||||||||||
| Class A | 7,802,964 | $ | 95,618,636 | (1,275,474 | ) | $ | (11,465,003 | ) | ||||||||
| Class B | (135,371 | ) | (1,662,450 | ) | (247,780 | ) | (2,954,648 | ) | ||||||||
| Class C | 2,682,571 | 33,262,969 | (637,834 | ) | (6,322,252 | ) | ||||||||||
| Class S | 9,428,147 | 116,877,492 | 418,063 | 6,358,963 | ||||||||||||
| Institutional Class | 5,027,729 | 61,053,603 | 182,467 | 4,516,180 | ||||||||||||
| $ | 305,150,250 | $ | (9,866,760 | ) | ||||||||||||
To the Trustees of DWS Municipal Trust and the Shareholders of DWS Strategic High Yield Tax-Free Fund:
In our opinion, the accompanying statement of assets and liabilities, including the investment portfolio, and the related statements of operations, of cash flows and of changes in net assets and the financial highlights present fairly, in all material respects, the financial position of DWS Strategic High Yield Tax-Free Fund (the "Fund") at May 31, 2012, and the results of its operations, its cash flows, the changes in its net assets and the financial highlights for each of the periods indicated therein, in conformity with accounting principles generally accepted in the United States of America. These financial statements and financial highlights (hereafter referred to as "financial statements") are the responsibility of the Fund's management. Our responsibility is to express an opinion on these financial statements based on our audits. We conducted our audits of these financial statements in accordance with the standards of the Public Company Accounting Oversight Board (United States). Those standards require that we plan and perform the audit to obtain reasonable assurance about whether the financial statements are free of material misstatement. An audit includes examining, on a test basis, evidence supporting the amounts and disclosures in the financial statements, assessing the accounting principles used and significant estimates made by management, and evaluating the overall financial statement presentation. We believe that our audits, which included confirmation of securities at May 31, 2012 by correspondence with the custodian and brokers, provide a reasonable basis for our opinion.
Boston, Massachusetts July 25, 2012 | PricewaterhouseCoopers LLP |
As an investor of the Fund, you incur two types of costs: ongoing expenses and transaction costs. Ongoing expenses include management fees, distribution and service (12b-1) fees and other Fund expenses. Examples of transaction costs include sales charges (loads) and account maintenance fees, which are not shown in this section. The following tables are intended to help you understand your ongoing expenses (in dollars) of investing in the Fund and to help you compare these expenses with the ongoing expenses of investing in other mutual funds. In the most recent six-month period, the Fund limited these expenses; had it not done so, expenses would have been higher. The example in the table is based on an investment of $1,000 invested at the beginning of the six-month period and held for the entire period (December 1, 2011 to May 31, 2012).
The tables illustrate your Fund's expenses in two ways:
•Actual Fund Return. This helps you estimate the actual dollar amount of ongoing expenses (but not transaction costs) paid on a $1,000 investment in the Fund using the Fund's actual return during the period. To estimate the expenses you paid over the period, simply divide your account value by $1,000 (for example, an $8,600 account value divided by $1,000 = 8.6), then multiply the result by the number in the "Expenses Paid per $1,000" line under the share class you hold.
•Hypothetical 5% Fund Return. This helps you to compare your Fund's ongoing expenses (but not transaction costs) with those of other mutual funds using the Fund's actual expense ratio and a hypothetical rate of return of 5% per year before expenses. Examples using a 5% hypothetical fund return may be found in the shareholder reports of other mutual funds. The hypothetical account values and expenses may not be used to estimate the actual ending account balance or expenses you paid for the period.
Please note that the expenses shown in these tables are meant to highlight your ongoing expenses only and do not reflect any transaction costs. The "Expenses Paid per $1,000" line of the tables is useful in comparing ongoing expenses only and will not help you determine the relative total expense of owning different funds. An account maintenance fee of $6.25 per quarter for Class S shares may apply for certain accounts whose balances do not meet the applicable minimum initial investment. This fee is not included in these tables. If it was, the estimate of expenses paid for Class S shares during the period would be higher, and account value during the period would be lower, by this amount.
Expenses and Value of a $1,000 Investment for the six months ended May 31, 2012 (Unaudited) | ||||||||||||||||||||
| Actual Fund Return | Class A | Class B | Class C | Class S | Institutional Class | |||||||||||||||
| Beginning Account Value 12/1/11 | $ | 1,000.00 | $ | 1,000.00 | $ | 1,000.00 | $ | 1,000.00 | $ | 1,000.00 | ||||||||||
| Ending Account Value 5/31/12 | $ | 1,092.50 | $ | 1,088.40 | $ | 1,088.40 | $ | 1,093.80 | $ | 1,092.90 | ||||||||||
| Expenses Paid per $1,000* | $ | 5.18 | $ | 9.08 | $ | 9.08 | $ | 3.87 | $ | 3.87 | ||||||||||
| Hypothetical 5% Fund Return | Class A | Class B | Class C | Class S | Institutional Class | |||||||||||||||
| Beginning Account Value 12/1/11 | $ | 1,000.00 | $ | 1,000.00 | $ | 1,000.00 | $ | 1,000.00 | $ | 1,000.00 | ||||||||||
| Ending Account Value 5/31/12 | $ | 1,020.05 | $ | 1,016.30 | $ | 1,016.30 | $ | 1,021.30 | $ | 1,021.30 | ||||||||||
| Expenses Paid per $1,000* | $ | 5.00 | $ | 8.77 | $ | 8.77 | $ | 3.74 | $ | 3.74 | ||||||||||
* Expenses are equal to the Fund's annualized expense ratio for each share class, multiplied by the average account value over the period, multiplied by 183 (the number of days in the most recent six-month period), then divided by 366.
| Annualized Expense Ratios | Class A | Class B | Class C | Class S | Institutional Class | |||||||||||||||
DWS Strategic High Yield Tax-Free Fund+ | .99 | % | 1.74 | % | 1.74 | % | .74 | % | .74 | % | ||||||||||
+ Includes interest expense and fees on short-term floating rate notes issued in conjunction with inverse floating rate securities of 0.07% for each class.
For more information, please refer to the Fund's prospectus.
Of the dividends paid from net investment income for the taxable year ended May 31, 2012, 100% are designated as exempt interest dividends for federal income tax purposes.
Please consult a tax advisor if you have questions about federal or state income tax laws, or on how to prepare your tax returns. If you have specific questions about your account, please call (800) 621-1048.
September 26, 2011
Pursuant to an Order entered into by Deutsche Investment Management Americas and affiliates (collectively, "DeAM") with the Attorney General of New York, I, Thomas H. Mack, have been appointed the Independent Fee Consultant for the DWS Funds (formerly the DWS Scudder Funds). My duties include preparing an annual written evaluation of the management fees DeAM charges the Funds, considering among other factors the management fees charged by other mutual fund companies for like services, management fees DeAM charges other clients for like services, DeAM's costs of supplying services under the management agreements and related profit margins, possible economies of scale if a Fund grows larger, and the nature and quality of DeAM's services, including fund performance. This report summarizes my evaluation for 2011, including my qualifications, the evaluation process for each of the DWS Funds, consideration of certain complex-level factors, and my conclusions. I served in substantially the same capacity in 2007, 2008, 2009 and 2010.
Qualifications
For more than 35 years I have served in various professional capacities within the investment management business. I have held investment analysis and advisory positions, including securities analyst, portfolio strategist and director of investment policy with a large investment firm. I have also performed business management functions, including business development, financial management and marketing research and analysis.
Since 1991, I have been an independent consultant within the asset management industry. I have provided services to over 125 client organizations, including investment managers, mutual fund boards, product distributors and related organizations. Over the past ten years I have completed a number of assignments for mutual fund boards, specifically including assisting boards with management contract renewal.
I hold a Master of Business Administration degree, with highest honors, from Harvard University and Master of Science and Bachelor of Science (highest honors) degrees from the University of California at Berkeley. I am an independent director and audit committee financial expert for two closed-end mutual funds and have served in various leadership and financial oversight capacities with non-profit organizations.
Evaluation of Fees for each DWS Fund
My work focused primarily on evaluating, fund-by-fund, the fees charged to each of the 109 mutual fund portfolios in the DWS Fund family. For each Fund, I considered each of the key factors mentioned above, as well as any other relevant information. In doing so I worked closely with the Funds' Independent Directors in their annual contract renewal process, as well as in their approval of contracts for several new funds (documented separately).
In evaluating each Fund's fees, I reviewed comprehensive materials provided by or on behalf of DeAM, including expense information prepared by Lipper Analytical, comparative performance information, profitability data, manager histories, and other materials. I also accessed certain additional information from the Lipper and Morningstar databases and drew on my industry knowledge and experience.
To facilitate evaluating this considerable body of information, I prepared for each Fund a document summarizing the key data elements in each area as well as additional analytics discussed below. This made it possible to consider each key data element in the context of the others.
In the course of contract renewal, DeAM agreed to implement a number of fee and expense adjustments requested by the Independent Directors which will favorably impact future fees and expenses, and my evaluation includes the effects of these changes.
Fees and Expenses Compared with Other Funds
The competitive fee and expense evaluation for each fund focused on two primary comparisons:
The Fund's contractual management fee (the advisory fee plus the administration fee where applicable) compared with those of a group of typically 12-15 funds in the same Lipper investment category (e.g. Large Capitalization Growth) having similar distribution arrangements and being of similar size.
The Fund's total expenses compared with a broader universe of funds from the same Lipper investment category and having similar distribution arrangements.
These two comparisons provide a view of not only the level of the fee compared with funds of similar scale but also the total expense the Fund bears for all the services it receives, in comparison with the investment choices available in the Fund's investment category and distribution channel. The principal figure-of-merit used in these comparisons was the subject Fund's percentile ranking against peers.
DeAM's Fees for Similar Services to Others
DeAM provided management fee schedules for all of its US domiciled fund and non-fund investment management accounts in any of the investment categories where there is a DWS Fund. These similar products included the other DWS Funds, non-fund pooled accounts, institutional accounts and sub-advisory accounts. Using this information, I calculated for each Fund the fee that would be charged to each similar product, at the subject Fund's asset level.
Evaluating information regarding non-fund products is difficult because there are varying levels of services required for different types of accounts, with mutual funds generally requiring considerably more regulatory and administrative types of service as well as having more frequent cash flows than other types of accounts. Also, while mutual fund fees for similar fund products can be expected to be similar, there will be some differences due to different pricing conditions in different distribution channels (e.g. retail funds versus those used in variable insurance products), differences in underlying investment processes and other factors.
Costs and Profit Margins
DeAM provided a detailed profitability analysis for each Fund. After making some adjustments so that the presentation would be more comparable to the available industry figures, I reviewed profit margins from investment management alone, from investment management plus other fund services (excluding distribution) provided to the Funds by DeAM (principally shareholder services), and DeAM profits from all sources, including distribution. A later section comments on overall profitability.
Economies of Scale
Economies of scale — an expected decline in management cost per dollar of fund assets as fund assets grow — are very rarely quantified and documented because of inherent difficulties in collecting and analyzing relevant data. However, in virtually every investment category that I reviewed, larger funds tend to have lower fees and lower total expenses than smaller funds. To see how each DWS Fund compares with this industry observation, I reviewed:
The trend in Fund assets over the last five years and the accompanying trend in total expenses. This shows if the Fund has grown and, if so, whether total expense (management fees as well as other expenses) have declined as a percent of assets.
Whether the Fund has break-points in its management fee schedule, the extent of the fee reduction built into the schedule and the asset levels where the breaks take effect, and in the case of a sub-advised Fund how the Fund's break-points compare with those of the sub-advisory fee schedule.
How the Fund's contractual fee schedule compares with trends in the industry data. To accomplish this, I constructed a chart showing how actual latest-fiscal-year contractual fees of the Fund and of other similar funds relate to average fund assets, with the subject Fund's contractual fee schedule superimposed.
Quality of Service — Performance
The quality-of-service evaluation focused on investment performance, which is the principal result of the investment management service. Each Fund's performance was reviewed over the past 1, 3, 5 and 10 years, as applicable, and compared with that of other funds in the same investment category and with a suitable market index.
In addition, I calculated and reviewed risk-adjusted returns relative to an index of similar mutual funds' returns and a suitable market index. The risk-adjusted returns analysis provides a way of determining the extent to which the Fund's return comparisons are mainly the product of investment value-added (or lack thereof) or alternatively taking considerably more or less risk than is typical in its investment category.
I also received and considered the history of portfolio manager changes for each Fund, as this provided an important context for evaluating the performance results.
Complex-Level Considerations
While this evaluation was conducted mainly at the individual fund level, there are some issues relating to the reasonableness of fees that can alternatively be considered across the whole fund complex:
I reviewed DeAM's profitability analysis for all DWS Funds, with a view toward determining if the allocation procedures used were reasonable and how profit levels compared with public data for other investment managers.
I considered whether DeAM and affiliates receive any significant ancillary or "fall-out" benefits that should be considered in interpreting the direct profitability results. These would be situations where serving as the investment manager of the Funds is beneficial to another part of the Deutsche Bank organization.
I considered how aggregated DWS Fund expenses had varied over the years, by asset class and in the context of trends in asset levels.
I reviewed the structure of the DeAM organization, trends in staffing levels, and information on compensation of investment management and other professionals compared with industry data.
Findings
Based on the process and analysis discussed above, which included reviewing a wide range of information from management and external data sources and considering among other factors the fees DeAM charges other clients, the fees charged by other fund managers, DeAM's costs and profits associated with managing the Funds, economies of scale, possible fall-out benefits, and the nature and quality of services provided, in my opinion the management fees charged the DWS Funds are reasonable.

Thomas H. Mack
President, Thomas H. Mack & Co., Inc.
The following table presents certain information regarding the Board Members and Officers of the fund as of May 31, 2012. Each Board Member's year of birth is set forth in parentheses after his or her name. Unless otherwise noted, (i) each Board Member has engaged in the principal occupation(s) noted in the table for at least the most recent five years, although not necessarily in the same capacity; and (ii) the address of each Independent Board Member is c/o Paul K. Freeman, Independent Chairman, DWS Funds, PO Box 101833, Denver, CO 80250-1833. Except as otherwise noted below, the term of office for each Board Member is until the election and qualification of a successor, or until such Board Member sooner dies, resigns, is removed or as otherwise provided in the governing documents of the fund. Because the fund does not hold an annual meeting of shareholders, each Board Member will hold office for an indeterminate period. The Board Members may also serve in similar capacities with other funds in the fund complex. The Length of Time Served represents the year in which the Board Member joined the Board of one or more DWS funds now overseen by the Board.
| Independent Board Members | ||||
Name, Year of Birth, Position with the Fund and Length of Time Served1 | Business Experience and Directorships During the Past Five Years | Number of Funds in DWS Fund Complex Overseen | Other Directorships Held by Board Member | |
Paul K. Freeman (1950) Chairperson since 2009 Board Member since 1993 | Consultant, World Bank/Inter-American Development Bank; Executive and Governing Council of the Independent Directors Council (Chairman of Education Committee); formerly: Project Leader, International Institute for Applied Systems Analysis (1998-2001); Chief Executive Officer, The Eric Group, Inc. (environmental insurance) (1986-1998) | 105 | — | |
John W. Ballantine (1946) Board Member since 1999 | Retired; formerly, Executive Vice President and Chief Risk Management Officer, First Chicago NBD Corporation/The First National Bank of Chicago (1996-1998); Executive Vice President and Head of International Banking (1995-1996). Directorships: Chairman of the Board, Healthways, Inc. (provider of disease and care management services); Portland General Electric (utility company); Stockwell Capital Investments PLC (private equity); former Directorships: First Oak Brook Bancshares, Inc. and Oak Brook Bank; Prisma Energy International | 105 | — | |
Henry P. Becton, Jr. (1943) Board Member since 1990 | Vice Chair and former President, WGBH Educational Foundation. Directorships: Public Radio International; Public Radio Exchange (PRX); The PBS Foundation; North Bennett Street School (Boston); former Directorships: Association of Public Television Stations; Boston Museum of Science; American Public Television; Concord Academy; New England Aquarium; Mass. Corporation for Educational Telecommunications; Committee for Economic Development; Public Broadcasting Service; Connecticut College | 105 | Lead Director, Becton Dickinson and Company2 (medical technology company); Lead Director, Belo Corporation2 (media company) | |
Dawn-Marie Driscoll (1946) Board Member since 1987 | President, Driscoll Associates (consulting firm); Executive Fellow, Center for Business Ethics, Bentley University; formerly, Partner, Palmer & Dodge (1988-1990); Vice President of Corporate Affairs and General Counsel, Filene's (1978-1988). Directorships: Director of ICI Mutual Insurance Company (since 2007); Advisory Board, Center for Business Ethics, Bentley University; Trustee, Southwest Florida Community Foundation (charitable organization); former Directorships: Investment Company Institute (audit, executive, nominating committees) and Independent Directors Council (governance, executive committees) | 105 | Trustee, Sun Capital Advisers, Inc. (22 open-end mutual funds advised by Sun Capital Advisers, Inc.) (since 2007) | |
Keith R. Fox, CFA (1954) Board Member since 1996 | Managing General Partner, Exeter Capital Partners (a series of private investment funds) (since 1986). Directorships: Progressive International Corporation (kitchen goods importer and distributor); BoxTop Media Inc. (advertising); The Kennel Shop (retailer); former Chairman, National Association of Small Business Investment Companies | 105 | Trustee, Sun Capital Advisers, Inc. (22 open-end mutual funds advised by Sun Capital Advisers, Inc.) (since 2011) | |
Kenneth C. Froewiss (1945) Board Member since 2001 | Adjunct Professor of Finance, NYU Stern School of Business (September 2009-present; Clinical Professor from 1997-September 2009); Member, Finance Committee, Association for Asian Studies (2002-present); Director, Mitsui Sumitomo Insurance Group (US) (2004-present); prior thereto, Managing Director, J.P. Morgan (investment banking firm) (until 1996) | 105 | — | |
Richard J. Herring (1946) Board Member since 1990 | Jacob Safra Professor of International Banking and Professor, Finance Department, The Wharton School, University of Pennsylvania (since July 1972); Co-Director, Wharton Financial Institutions Center (since July 2000); Co-Chair, U.S. Shadow Financial Regulatory Committee; Executive Director, Financial Economists Roundtable; formerly: Vice Dean and Director, Wharton Undergraduate Division (July 1995-June 2000); Director, Lauder Institute of International Management Studies (July 2000-June 2006) | 105 | Director, Japan Equity Fund, Inc. (since September 2007), Thai Capital Fund, Inc. (since September 2007), Singapore Fund, Inc. (since September 2007), Independent Director of Barclays Bank Delaware (since September 2010) | |
William McClayton (1944) Board Member since 2004 | Private equity investor (since October 2009); previously, Managing Director, Diamond Management & Technology Consultants, Inc. (global consulting firm) (2001-2009); Directorship: Board of Managers, YMCA of Metropolitan Chicago; formerly: Senior Partner, Arthur Andersen LLP (accounting) (1966-2001); Trustee, Ravinia Festival | 105 | — | |
Rebecca W. Rimel (1951) Board Member since 1995 | President and Chief Executive Officer, The Pew Charitable Trusts (charitable organization) (1994 to present); Trustee, Washington College (2011 to present); formerly: Executive Vice President, The Glenmede Trust Company (investment trust and wealth management) (1983-2004); Board Member, Investor Education (charitable organization) (2004-2005); Trustee, Executive Committee, Philadelphia Chamber of Commerce (2001-2007); Trustee, Pro Publica (charitable organization) (2007-2010); Trustee, Thomas Jefferson Foundation (charitable organization) (1994 to 2012) | 105 | Director, CardioNet, Inc.2 (health care) (2009- present); Director, Viasys Health Care2 (January 2007- June 2007) | |
William N. Searcy, Jr. (1946) Board Member since 1993 | Private investor since October 2003; formerly: Pension & Savings Trust Officer, Sprint Corporation2 (telecommunications) (November 1989-September 2003) | 105 | Trustee, Sun Capital Advisers, Inc. (22 open-end mutual funds advised by Sun Capital Advisers, Inc.) (since 1998) | |
Jean Gleason Stromberg (1943) Board Member since 1997 | Retired. Formerly, Consultant (1997-2001); Director, Financial Markets U.S. Government Accountability Office (1996-1997); Partner, Fulbright & Jaworski, L.L.P. (law firm) (1978-1996). Directorships: The William and Flora Hewlett Foundation; former Directorships: Service Source, Inc., Mutual Fund Directors Forum (2002-2004), American Bar Retirement Association (funding vehicle for retirement plans) (1987-1990 and 1994-1996) | 105 | — | |
Robert H. Wadsworth (1940) Board Member since 1999 | President, Robert H. Wadsworth & Associates, Inc. (consulting firm) (1983 to present); Director, National Horizon, Inc. (non-profit organization); Director and Treasurer, The Phoenix Boys Choir Association | 108 | — | |
Officers4 | ||
Name, Year of Birth, Position with the Fund and Length of Time Served5 | Principal Occupation(s) During Past 5 Years and Other Directorships Held | |
W. Douglas Beck, CFA6 (1967) President, 2011-present | Managing Director3, Deutsche Asset Management (2006-present); President of DWS family of funds and Head of Product Management, U.S. for DWS Investments; formerly, Executive Director, Head of Product Management (2002-2006) and President (2005-2006) of the UBS Funds at UBS Global Asset Management; Co-Head of Manager Research/Managed Solutions Group, Merrill Lynch (1998-2002) | |
John Millette7 (1962) Vice President and Secretary, 1999-present | Director3, Deutsche Asset Management | |
Paul H. Schubert6 (1963) Chief Financial Officer, 2004-present Treasurer, 2005-present | Managing Director3, Deutsche Asset Management (since July 2004); formerly, Executive Director, Head of Mutual Fund Services and Treasurer for UBS Family of Funds (1998-2004); Vice President and Director of Mutual Fund Finance at UBS Global Asset Management (1994-1998) | |
Caroline Pearson7 (1962) Chief Legal Officer, 2010-present | Managing Director3, Deutsche Asset Management; formerly, Assistant Secretary for DWS family of funds (1997-2010) | |
Melinda Morrow6 (1970) Vice President, May 2012-present | Director3, Deutsche Asset Management | |
Rita Rubin6 (1970) Assistant Secretary, 2009-2012* | Director3 and Senior Counsel, Deutsche Asset Management (since October 2007); formerly, Vice President, Morgan Stanley Investment Management (2004-2007) | |
Paul Antosca7 (1957) Assistant Treasurer, 2007-present | Director3, Deutsche Asset Management | |
Jack Clark7 (1967) Assistant Treasurer, 2007-present | Director3, Deutsche Asset Management | |
Diane Kenneally7 (1966) Assistant Treasurer, 2007-present | Director3, Deutsche Asset Management | |
John Caruso6 (1965) Anti-Money Laundering Compliance Officer, 2010-present | Managing Director3, Deutsche Asset Management | |
Robert Kloby6 (1962) Chief Compliance Officer, 2006-present | Managing Director3, Deutsche Asset Management | |
1 The length of time served represents the year in which the Board Member joined the board of one or more DWS funds currently overseen by the Board.
2 A publicly held company with securities registered pursuant to Section 12 of the Securities Exchange Act of 1934.
3 Executive title, not a board directorship.
4 As a result of their respective positions held with the Advisor, these individuals are considered "interested persons" of the Advisor within the meaning of the 1940 Act. Interested persons receive no compensation from the fund.
5 The length of time served represents the year in which the officer was first elected in such capacity for one or more DWS funds.
6 Address: 60 Wall Street, New York, NY 10005.
7 Address: One Beacon Street, Boston, MA 02108.
* Effective May 18, 2012, Rita Rubin no longer serves as Assistant Secretary to the fund.
The fund's Statement of Additional Information ("SAI") includes additional information about the Board Members. The SAI is available, without charge, upon request. If you would like to request a copy of the SAI, you may do so by calling the following toll-free number: (800) 621-1048.
| For More Information | The automated telephone system allows you to access personalized account information and obtain information on other DWS funds using either your voice or your telephone keypad. Certain account types within Classes A, B, C and S also have the ability to purchase, exchange or redeem shares using this system. For more information, contact your financial advisor. You may also access our automated telephone system or speak with a DWS Investments representative by calling the appropriate number below: For shareholders of Classes A, B, C and Institutional Class: (800) 621-1048 For shareholders of Class S: (800) 728-3337 | |
| Web Site | www.dws-investments.com View your account transactions and balances, trade shares, monitor your asset allocation, and change your address, 24 hours a day. Obtain prospectuses and applications, blank forms, interactive worksheets, news about DWS funds, subscription to fund updates by e-mail, retirement planning information, and more. | |
| Written Correspondence | DWS Investments PO Box 219151 Kansas City, MO 64121-9151 | |
| Proxy Voting | The fund's policies and procedures for voting proxies for portfolio securities and information about how the fund voted proxies related to its portfolio securities during the 12-month period ended June 30 are available on our Web site — www.dws-investments.com (click on "proxy voting"at the bottom of the page) — or on the SEC's Web site — www.sec.gov. To obtain a written copy of the fund's policies and procedures without charge, upon request, call us toll free at (800) 621-1048. | |
| Portfolio Holdings | Following the fund's fiscal first and third quarter-end, a complete portfolio holdings listing is filed with the SEC on Form N-Q. This form will be available on the SEC's Web site at www.sec.gov, and it also may be reviewed and copied at the SEC's Public Reference Room in Washington, D.C. Information on the operation of the SEC's Public Reference Room may be obtained by calling (800) SEC-0330. The fund's portfolio holdings are also posted on www.dws-investments.com from time to time. Please see the fund's current prospectus for more information. | |
| Principal Underwriter | If you have questions, comments or complaints, contact: DWS Investments Distributors, Inc. 222 South Riverside Plaza Chicago, IL 60606-5808 (800) 621-1148 | |
| Investment Management | Deutsche Investment Management Americas Inc. ("DIMA" or the "Advisor"), which is part of Deutsche Asset Management, is the investment advisor for the fund. DIMA and its predecessors have more than 80 years of experience managing mutual funds and DIMA provides a full range of investment advisory services to both institutional and retail clients. DIMA is an indirect, wholly owned subsidiary of Deutsche Bank AG. Deutsche Bank AG is a major global banking institution engaged in a wide variety of financial services, including investment management, retail, private and commercial banking, investment banking and insurance. DWS Investments is the retail brand name in the U.S. for the asset management activities of Deutsche Bank AG and DIMA. As such, DWS is committed to delivering the investing expertise, insight and resources of this global investment platform to American investors. | |
| Class A | Class B | Class C | Class S | Institutional Class | ||
| Nasdaq Symbol | NOTAX | NOTBX | NOTCX | SHYTX | NOTIX | |
| CUSIP Number | 23337W-105 | 23337W-204 | 23337W-303 | 23337W-501 | 23337W-600 | |
| Fund Number | 152 | 252 | 352 | 2008 | 512 |
Notes
Notes
Notes
Notes
Notes
Notes

| ITEM 2. | CODE OF ETHICS |
As of the end of the period covered by this report, the registrant has adopted a code of ethics, as defined in Item 2 of Form N-CSR, that applies to its Principal Executive Officer and Principal Financial Officer. There have been no amendments to, or waivers from, a provision of the code of ethics during the period covered by this report that would require disclosure under Item 2. A copy of the code of ethics is filed as an exhibit to this Form N-CSR. | |
| ITEM 3. | AUDIT COMMITTEE FINANCIAL EXPERT |
| The fund’s audit committee is comprised solely of trustees who are "independent" (as such term has been defined by the Securities and Exchange Commission ("SEC") in regulations implementing Section 407 of the Sarbanes-Oxley Act (the "Regulations")). The fund’s Board of Trustees has determined that there are several "audit committee financial experts" (as such term has been defined by the Regulations) serving on the fund’s audit committee including Mr. William McClayton, the chair of the fund’s audit committee. An “audit committee financial expert” is not an “expert” for any purpose, including for purposes of Section 11 of the Securities Act of 1933 and the designation or identification of a person as an “audit committee financial expert” does not impose on such person any duties, obligations or liability that are greater than the duties, obligations and liability imposed on such person as a member of the audit committee and board of directors in the absence of such designation or identification. | |
| ITEM 4. | PRINCIPAL ACCOUNTANT FEES AND SERVICES |
DWS STRATEGIC HIGH YIELD TAX FREE FUND
FORM N-CSR DISCLOSURE RE: AUDIT FEES
Services that the Fund’s Independent Registered Public Accounting Firm Billed to the Fund
| Fiscal Year Ended May 31, | Audit Fees Billed to Fund | Audit-Related Fees Billed to Fund | Tax Fees Billed to Fund | All Other Fees Billed to Fund | ||||||||||||
| 2012 | $ | 81,417 | $ | 0 | $ | 0 | $ | 0 | ||||||||
| 2011 | $ | 81,417 | $ | 0 | $ | 0 | $ | 0 | ||||||||
Services that the Fund’s Independent Registered Public Accounting Firm Billed to the Adviser and Affiliated Fund Service Providers
The following table shows the amount of fees billed by PWC to Deutsche Investment Management Americas Inc. (“DeIM” or the “Adviser”), and any entity controlling, controlled by or under common control with DeIM (“Control Affiliate”) that provides ongoing services to the Fund (“Affiliated Fund Service Provider”), for engagements directly related to the Fund’s operations and financial reporting, during the Fund’s last two fiscal years.
| Fiscal Year Ended May 31, | Audit-Related Fees Billed to Adviser and Affiliated Fund Service Providers | Tax Fees Billed to Adviser and Affiliated Fund Service Providers | All Other Fees Billed to Adviser and Affiliated Fund Service Providers | |||||||||
| 2012 | $ | 0 | $ | 56,300 | $ | 0 | ||||||
| 2011 | $ | 0 | $ | 0 | $ | 0 | ||||||
The “Tax Fees Billed to the Advisor” were billed for services associated with foreign tax filings.
Non-Audit Services
The following table shows the amount of fees that PWC billed during the Fund’s last two fiscal years for non-audit services. The Audit Committee pre-approved all non-audit services that PWC provided to the Adviser and any Affiliated Fund Service Provider that related directly to the Fund’s operations and financial reporting. The Audit Committee requested and received information from PWC about any non-audit services that PWC rendered during the Fund’s last fiscal year to the Adviser and any Affiliated Fund Service Provider. The Committee considered this information in evaluating PWC’s independence.
| Fiscal Year Ended May 31, | Total Non-Audit Fees Billed to Fund (A) | Total Non-Audit Fees billed to Adviser and Affiliated Fund Service Providers (engagements related directly to the operations and financial reporting of the Fund) (B) | Total Non-Audit Fees billed to Adviser and Affiliated Fund Service Providers (all other engagements) (C) | Total of (A), (B) and (C) | ||||||||||||
| 2012 | $ | 0 | $ | 56,300 | $ | 0 | $ | 56,300 | ||||||||
| 2011 | $ | 0 | $ | 0 | $ | 0 | $ | 0 | ||||||||
Audit Committee Pre-Approval Policies and Procedures. Generally, each Fund’s Audit Committee must pre approve (i) all services to be performed for a Fund by a Fund’s Independent Registered Public Accounting Firm and (ii) all non-audit services to be performed by a Fund’s Independent Registered Public Accounting Firm for the DIMA Entities with respect to operations and financial reporting of the Fund, except that the Chairperson or Vice Chairperson of each Fund’s Audit Committee may grant the pre-approval for non-audit services described in items (i) and (ii) above for non-prohibited services for engagements of less than $100,000. All such delegated pre approvals shall be presented to each Fund’s Audit Committee no later than the next Audit Committee meeting.
There were no amounts that were approved by the Audit Committee pursuant to the de minimis exception under Rule 2-01 of Regulation S-X.
According to the registrant’s principal Independent Registered Public Accounting Firm, substantially all of the principal Independent Registered Public Accounting Firm's hours spent on auditing the registrant's financial statements were attributed to work performed by full-time permanent employees of the principal Independent Registered Public Accounting Firm.
***
PwC advised the Fund's Audit Committee that it had identified one matter that it determined could be inconsistent with the SEC's auditor independence rules (Rule 2-01(c) of Regulation S-X). As part of a "Global Migration Support" engagement in which PwC's UK network affiliate ("PwC-UK") provided assistance to Deutsche Bank ("DB") with respect to processing internship applications for DB employees seeking short term assignments with DB in the UK, PwC-UK paid application fees on behalf of DB for six applicants at 170 pounds each (1,020 pounds in total). PwC advised the Committee that it believes that this matter did not affect its objectivity or its impartial judgment in conducting its audit and issuing a report on the financial statements of the Fund as the Fund's independent auditor and confirmed its independence under the SEC’s auditor independence rules. In reaching this conclusion, PwC noted that the engagement team was not aware of the payment of the application fees by PwC-UK and that DB reimbursed PwC-UK for the fees.
| ITEM 5. | AUDIT COMMITTEE OF LISTED REGISTRANTS | |
| Not applicable | ||
| ITEM 6. | SCHEDULE OF INVESTMENTS | |
| Not applicable | ||
| ITEM 7. | DISCLOSURE OF PROXY VOTING POLICIES AND PROCEDURES FOR CLOSED-END MANAGEMENT INVESTMENT COMPANIES | |
| Not applicable | ||
| ITEM 8. | PORTFOLIO MANAGERS OF CLOSED-END MANAGEMENT INVESTMENT COMPANIES | |
| Not applicable | ||
| ITEM 9. | PURCHASES OF EQUITY SECURITIES BY CLOSED-END MANAGEMENT INVESTMENT COMPANY AND AFFILIATED PURCHASERS | |
| Not applicable | ||
| ITEM 10. | SUBMISSION OF MATTERS TO A VOTE OF SECURITY HOLDERS | |
| There were no material changes to the procedures by which shareholders may recommend nominees to the Fund’s Board. The primary function of the Nominating and Governance Committee is to identify and recommend individuals for membership on the Board and oversee the administration of the Board Governance Guidelines. Shareholders may recommend candidates for Board positions by forwarding their correspondence by U.S. mail or courier service to Paul K. Freeman, Independent Chairman, DWS Funds, P.O. Box 101833, Denver, CO 80250-1833. | ||
| ITEM 11. | CONTROLS AND PROCEDURES | |
| (a) | The Chief Executive and Financial Officers concluded that the Registrant’s Disclosure Controls and Procedures are effective based on the evaluation of the Disclosure Controls and Procedures as of a date within 90 days of the filing date of this report. | |
| (b) | There have been no changes in the registrant’s internal control over financial reporting that occurred during the second fiscal quarter of the period covered by this report that has materially affected, or is reasonably likely to materially affect, the registrant’s internal controls over financial reporting. | |
| ITEM 12. | EXHIBITS | |
| (a)(1) | Code of Ethics pursuant to Item 2 of Form N-CSR is filed and attached hereto as EX-99.CODE ETH. | |
| (a)(2) | Certification pursuant to Rule 30a-2(a) under the Investment Company Act of 1940 (17 CFR 270.30a-2(a)) is filed and attached hereto as Exhibit 99.CERT. | |
| (b) | Certification pursuant to Rule 30a-2(b) under the Investment Company Act of 1940 (17 CFR 270.30a-2(b)) is furnished and attached hereto as Exhibit 99.906CERT. | |
Form N-CSR Item F
SIGNATURES
Pursuant to the requirements of the Securities Exchange Act of 1934 and the Investment Company Act of 1940, the registrant has duly caused this report to be signed on its behalf by the undersigned, thereunto duly authorized.
| Registrant: | DWS Strategic High Yield Tax-Free Fund, a series of DWS Municipal Trust |
| By: | /s/W. Douglas Beck W. Douglas Beck President |
| Date: | July 30, 2012 |
Pursuant to the requirements of the Securities Exchange Act of 1934 and the Investment Company Act of 1940, this report has been signed below by the following persons on behalf of the registrant and in the capacities and on the dates indicated.
| By: | /s/W. Douglas Beck W. Douglas Beck President |
| Date: | July 30, 2012 |
| By: | /s/Paul Schubert Paul Schubert Chief Financial Officer and Treasurer |
| Date: | July 30, 2012 |