UNITED STATES
SECURITIES AND EXCHANGE COMMISSION
WASHINGTON, D. C. 20549
FORM N-CSR
Investment Company Act file number: 811-02671
DWS Municipal Trust
(Exact Name of Registrant as Specified in Charter)
345 Park Avenue
New York, NY 10154-0004
(Address of Principal Executive Offices) (Zip Code)
Registrant’s Telephone Number, including Area Code: (212) 250-3220
Paul Schubert
60 Wall Street
New York, NY 10005
(Name and Address of Agent for Service)
| Date of fiscal year end: | 5/31 |
| Date of reporting period: | 5/31/2013 |
| ITEM 1. | REPORT TO STOCKHOLDERS |
MAY 31, 2013 Annual Report to Shareholders |
| DWS Managed Municipal Bond Fund |
 |
Contents
4 Letter to Shareholders 5 Portfolio Management Review 12 Performance Summary 15 Investment Portfolio 47 Statement of Assets and Liabilities 49 Statement of Operations 50 Statement of Cash Flows 51 Statement of Changes in Net Assets 52 Financial Highlights 57 Notes to Financial Statements 68 Report of Independent Registered Public Accounting Firm 69 Information About Your Fund's Expenses 70 Tax Information 71 Summary of Management Fee Evaluation by Independent Fee Consultant 75 Board Members and Officers 80 Account Management Resources |
This report must be preceded or accompanied by a prospectus. To obtain a summary prospectus, if available, or prospectus for any of our funds, refer to the Account Management Resources information provided in the back of this booklet. We advise you to consider the fund's objectives, risks, charges and expenses carefully before investing. The summary prospectus and prospectus contain this and other important information about the fund. Please read the prospectus carefully before you invest.
Bond investments are subject to interest-rate and credit risks. When interest rates rise, bond prices generally fall. Credit risk refers to the ability of an issuer to make timely payments of principal and interest. Investments in lower-quality ("junk bonds") and non-rated securities present greater risk of loss than investments in higher-quality securities. The fund invests in inverse floaters, which are derivatives that involve leverage and could magnify the fund's gains or losses. Although the fund seeks income that is exempt from federal income taxes, a portion of the fund's distributions may be subject to federal, state and local taxes, including the alternative minimum tax. See the prospectus for details.
DWS Investments is part of the Deutsche Asset & Wealth Management division of Deutsche Bank AG.
NOT FDIC/NCUA INSURED NO BANK GUARANTEE MAY LOSE VALUE NOT A DEPOSIT NOT INSURED BY ANY FEDERAL GOVERNMENT AGENCY
Dear Investor:
The first half of 2013 brought welcome evidence that the U.S. economic recovery is gaining traction. Consumer confidence reached its highest level since 2007, U.S. stock market indexes marked a series of record highs and the housing market continues its recovery.
According to Asoka Wohrmann, co-chief investment officer for Deutsche Asset & Wealth Management, "The revival of the employment market, good asset performance with rising home and share prices, and an expansive monetary policy gives further growth momentum to the real economy. Accordingly, U.S. economic growth could accelerate in the coming months."
Nevertheless, concerns about the European and emerging-market economies persist. Closer to home, the outlook remains guarded when it comes to the eventual end of government intervention in the bond market and the full effects of reduced government spending on employment.
Where does this leave you? That depends on a variety of factors, including your overall portfolio allocation. Given the uncertainties in today's bond and stock markets, it may be time for a thoughtful evaluation of your strategy.
Talk with a trusted advisor to determine whether any adjustments may be in order, given your specific objectives and risk tolerance. We believe even the most sophisticated investor can benefit from the assistance of a trusted, objective financial professional.
Remember that Deutsche Asset & Wealth Management gives you access to Deutsche Bank's global network of economists, analysts and investment professionals. Insights are always at your fingertips at dws-investments.com.
Best regards,


Douglas Beck, CFA President, DWS Funds |
Overview of Market and Fund Performance
All performance information below is historical and does not guarantee future results. Returns shown are for Class A shares, unadjusted for sales charges. Investment return and principal fluctuate, so your shares may be worth more or less when redeemed. Current performance may differ from performance data shown. Please visit www.dws-investments.com for the most recent month-end performance of all share classes. Fund performance includes reinvestment of all distributions. Unadjusted returns do not reflect sales charges and would have been lower if they had. Please refer to pages 12 through 14 for more complete performance information.
DWS Managed Municipal Bond Fund posted a return of 4.01% over the 12 months ended May 31, 2013, while the overall municipal bond market, as measured by the unmanaged Barclays Municipal Bond Index, delivered a total return of 3.05% for the same period. The average fund in the Morningstar Muni National Long category returned 3.80% for the 12 months.
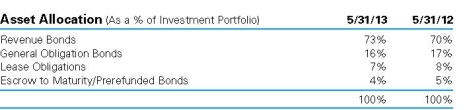
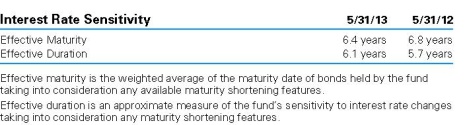
Investment Strategy The fund invests in a wide variety of municipal bonds. These include general obligation bonds, for which payments of principal and interest are secured by the full faith and credit of the issuer and usually supported by the issuer's taxing power. In addition, securities held may include revenue bonds, for which principal and interest are secured by revenues from tolls, rents or other fees gained from the facility that was built with the bond issue proceeds. The fund's management team seeks to hold municipal bonds that appear to offer the best opportunity to meet the fund's objective of earning tax-exempt income. A number of factors influence the performance of municipal bonds. These include supply and demand, the direction of overall interest rates, and the perceived credit risk associated with an individual municipal issuer. In selecting securities, the managers weigh the impact of the economic outlook and potential interest rate movements on municipal bonds as well as characteristics specific to securities such as coupons, maturity dates and call dates, and supply and demand of the municipal market. Finally, the managers may seek to take advantage if they believe the municipal yield curve presents an opportunity to gain incremental income with limited additional interest rate risk. Although portfolio management may adjust the fund's duration (a measure of sensitivity to interest rates) over a wider range, they generally intend to keep it similar to that of the Barclays Municipal Bond Index, generally between five and nine years. |
As the period began, with the U.S. Federal Reserve Board (the Fed) maintaining short-term rates anchored near zero, fixed-income markets were closely following developments in the European debt crisis as well as the stream of U.S. economic data. Europe would soon become less of a fulcrum for market sentiment as the European Central Bank (ECB) implemented strong measures to support refinancing by troubled governments. As the period progressed, U.S. housing data seemed to confirm that prices had finally reached a bottom and were beginning to strengthen. In addition, with employment data continuing to disappoint, there was speculation that the Fed would announce further bond purchases under quantitative easing. This speculation was borne out at the Fed's mid-September meeting. The net result was an increased willingness on the part of investors to assume credit risk in exchange for yields higher than the extraordinarily low rates offered from U.S. Treasuries.
As November 2012 approached, U.S. fixed-income markets were focused primarily on the presidential election, against a backdrop of wrangling over solutions to the country's fiscal dilemma. The strong demand municipals experienced over the prior several months continued as investors sought tax-exempt income that was attractive relative to taxable U.S. Treasury yields. However, December 2012 saw a retreat in municipal demand levels as institutional investors engaged in selling to lock in gains before year-end and amid some concern over proposals to limit the tax exemption on municipals as part of any budget deal.
As 2013 unfolded, the interest rate environment became less favorable for bond prices overall. Investors shrugged off the lack of meaningful progress in the budget standoff, and U.S. Treasury rates began to trend somewhat higher on optimism over prospects for the economy. Municipals experienced their greatest yield increases and price weakness in the last weeks of the fiscal period. Economic data continued to strengthen and there was mounting speculation that the Fed would begin to scale back its bond purchases that had helped keep longer-term rates in check. In addition, a rising stock market attracted strong investor interest, perhaps drawing flows that may have otherwise gone towards fixed-income securities. Municipal bond funds experienced large outflows as investors found the historically low yields on offer unappealing and sought to minimize exposure to rising interest rates.
Municipal Bond Yield Curve (as of 5/31/13 and 5/31/12) |
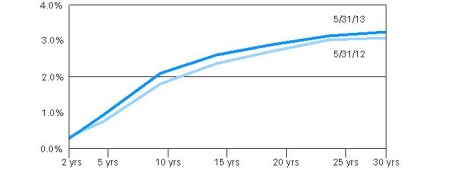 |
This chart is for illustrative purposes only and is not intended to represent the yield of any DWS fund. Performance is historical and does not guarantee future results.
Throughout the period ended May 31, 2013, the Fed kept short-term rates anchored near zero. Along the municipal yield curve, the two-year bond yield decreased 4 basis points over the full 12 months, from 0.33% to 0.29%, while the 30-year yield rose 16 basis points, from 3.08% to 3.24%, resulting in a total steepening of 20 basis points. However, the middle of the yield curve experienced the brunt of the impact of curve steepening, with increases of 30 and 24 basis points for the 10-year and 15-year bond, respectively. (See the graph above for municipal bond yield changes from the beginning to the end of the period.) Credit spreads — the yield differential provided by lower-quality issues vs. AAA-rated issues — generally narrowed for the 12 months as investors sought incremental yield.
| "As economic data continued to strengthen in 2013, there was increasing speculation that the U.S. Federal Reserve Board (the Fed) would begin to scale back its bond purchases." |
Positive and Negative Contributors to Fund Performance
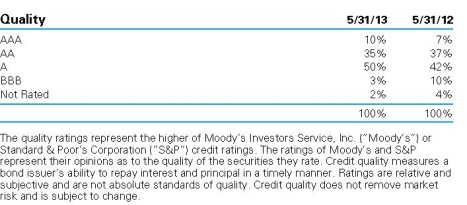
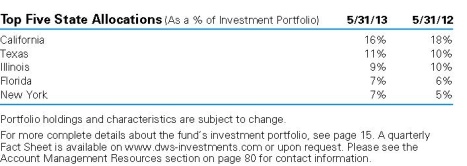
With a relatively steep yield curve as the period began, we had a tilt in the portfolio towards longer-term issues in the 20-to-30-year maturity range. This exposure added to relative performance as longer-term issues provided incremental income. In addition, with credit spreads at attractive levels, we maintained significant exposure to lower-quality issues in the BBB or A range. This helped performance relative to the benchmark as credit spreads narrowed and prices rose for many of these issues. In particular, exposure to airport revenue bonds and healthcare-related issues added to performance. In addition, the fund had a significant position in California state general obligation bonds, which outperformed as California succeeded in addressing its budgetary imbalance by raising revenue, leading to a ratings upgrade.
Performance relative to the benchmark was constrained to a degree by some of our long-standing, higher-coupon holdings as they rolled down into the 10-to-15-year area of the yield curve, which was most impacted by interest rate increases.
For some of the period, we hedged a portion of the fund's assets against interest rate changes using LIBOR (London Interbank Offered Rate, a benchmark for taxable interest rates) swaps. With a LIBOR swap, we in effect take a short position against the taxable market in order to manage the fund's overall duration and interest rate sensitivity. This helped the fund's return as municipal rates decreased and LIBOR rates increased during the period the hedge was on.
Outlook and Positioning
Municipal yields, while reasonably attractive relative to U.S. Treasuries, remain at very low levels by historical standards despite the recent uptick in rates. At the end of May 2013, the 10-year municipal bond yield of 2.09% was 98% of the comparable-maturity U.S. Treasury bond yield before taking into account the tax advantage of municipals. The 30-year municipal yield of 3.24% was 99% of the comparable U.S. Treasury yield. Longer-term issues continue to carry a substantial yield advantage and we are continuing to focus purchases on bonds with maturities in the 20-to-30-year range, while seeking exposure to premium coupon issues that can provide a degree of protection against rising interest rates. While credit spreads have narrowed over the last several quarters, we continue to see opportunities, mostly among issues in the A-quality range.
The national economic backdrop continues to show gradual improvement, and many state and local governments have continued to show progress in stabilizing their finances. Nonetheless, there remain troubled pockets, and there are also significant uncertainties with respect to the ongoing U.S. budget negotiations as well as Europe's sovereign debt crisis. As a result we believe the expertise we bring to researching municipal sectors and individual issues continues to be of critical importance. For new purchases, we are taking a very cautious approach with respect to general obligation bonds issued by localities, given uncertain levels of state support going forward.
Portfolio Management Team
Philip G. Condon, Managing Director
Co-Lead Portfolio Manager of the fund. Joined the fund in 1990.
• Head of US Retail Fixed Income.
• Joined Deutsche Asset & Wealth Management in 1983.
• BA and MBA, University of Massachusetts at Amherst.
Ashton P. Goodfield, CFA, Managing Director
Co-Lead Portfolio Manager of the fund. Joined the fund in 1998.
• Joined Deutsche Asset & Wealth Management in 1986.
• BA, Duke University.
Matthew J. Caggiano, CFA, Managing Director
Portfolio Manager of the fund. Joined the fund in 1999.
• Joined Deutsche Asset & Wealth Management in 1989.
• BS, Pennsylvania State University; MS, Boston College.
Michael J. Generazo, Director
Portfolio Manager of the fund. Joined the fund in 2010.
• Joined Deutsche Asset & Wealth Management in 1999.
• BS, Bryant College; MBA, Suffolk University.
The views expressed reflect those of the portfolio management team only through the end of the period of the report as stated on the cover. The management team's views are subject to change at any time based on market and other conditions and should not be construed as a recommendation. Past performance is no guarantee of future results. Current and future portfolio holdings are subject to risk.
Terms to Know
The Barclays Municipal Bond Index is an unmanaged, market-value-weighted measure of municipal bonds issued across the United States. Index issues have a credit rating of at least Baa and a maturity of at least two years.
Index returns do not reflect fees or expenses and it is not possible to invest directly into an index.
The Morningstar Muni National Long category consists of funds that invest in municipal bonds issued by various state and local governments to fund public projects and are free from federal taxes. These funds spread their assets across many states and sectors and focus on bond durations of seven years or more.
Quantitative easing is a government monetary policy often used when interest rates are at or near zero. With this policy government or other securities are purchased from the market, causing the price of the securities purchased to rise and the yield or interest rates on the securities purchased to fall. For the companies whose bonds the central banks are willing to purchase, it means having to pay lower interest rates on new bonds issued to replace existing bonds that have matured. With lower borrowing costs, the central banks hope that consumers will be encouraged to spend more, thus helping the overall economy, and improving the balance sheets for the companies providing the goods and services on which consumers are spending their money.
The yield curve is a graph with a left-to-right line that shows how high or low yields are, from the shortest to the longest maturities. Typically (and when the yield curve is characterized as "steep," this is especially true), the line rises from left to right as investors who are willing to tie up their money for a longer period are rewarded with higher yields.
One basis point equals 1/100 of a percentage point.
Credit quality measures a bond issuer's ability to repay interest and principal in a timely manner. Rating agencies assign letter designations, such as AAA, AA and so forth. The lower the rating the higher the probability of default. Credit quality does not remove market risk and is subject to change.
Credit spread is the additional yield provided by municipal bonds rated AA and below vs. municipals rated AAA with comparable effective maturity.
Duration, which is expressed in years, measures the sensitivity of the price of a bond or bond fund to a change in interest rates.
Sovereign debt is debt that is issued by a national government.
| Class A | 1-Year | 5-Year | 10-Year | |||||||||
Average Annual Total Returns as of 5/31/13 | ||||||||||||
| Unadjusted for Sales Charge | 4.01 | % | 6.04 | % | 4.63 | % | ||||||
| Adjusted for the Maximum Sales Charge (max 2.75% load) | 1.15 | % | 5.45 | % | 4.34 | % | ||||||
Barclays Municipal Bond Index† | 3.05 | % | 5.70 | % | 4.68 | % | ||||||
| Class B | 1-Year | 5-Year | 10-Year | |||||||||
Average Annual Total Returns as of 5/31/13 | ||||||||||||
| Unadjusted for Sales Charge | 3.14 | % | 5.15 | % | 3.81 | % | ||||||
| Adjusted for the Maximum Sales Charge (max 4.00% CDSC) | 0.14 | % | 4.99 | % | 3.81 | % | ||||||
Barclays Municipal Bond Index† | 3.05 | % | 5.70 | % | 4.68 | % | ||||||
| Class C | 1-Year | 5-Year | 10-Year | |||||||||
Average Annual Total Returns as of 5/31/13 | ||||||||||||
| Unadjusted for Sales Charge | 3.21 | % | 5.24 | % | 3.84 | % | ||||||
| Adjusted for the Maximum Sales Charge (max 1.00% CDSC) | 3.21 | % | 5.24 | % | 3.84 | % | ||||||
Barclays Municipal Bond Index† | 3.05 | % | 5.70 | % | 4.68 | % | ||||||
| Class S | 1-Year | 5-Year | 10-Year | |||||||||
Average Annual Total Returns as of 5/31/13 | ||||||||||||
| No Sales Charges | 4.19 | % | 6.21 | % | 4.86 | % | ||||||
Barclays Municipal Bond Index† | 3.05 | % | 5.70 | % | 4.68 | % | ||||||
| Institutional Class | 1-Year | 5-Year | 10-Year | |||||||||
Average Annual Total Returns as of 5/31/13 | ||||||||||||
| No Sales Charges | 4.25 | % | 6.30 | % | 4.89 | % | ||||||
Barclays Municipal Bond Index† | 3.05 | % | 5.70 | % | 4.68 | % | ||||||
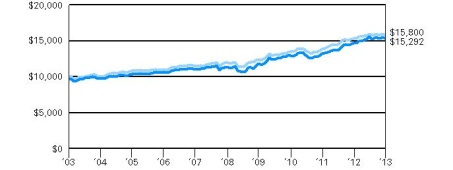
Performance in the Average Annual Total Returns table(s) above and the Growth of an Assumed $10,000 Investment line graph that follows is historical and does not guarantee future results. Investment return and principal fluctuate, so your shares may be worth more or less when redeemed. Current performance may differ from performance data shown. Please visit www.dws-investments.com for the Fund's most recent month-end performance. Fund performance includes reinvestment of all distributions. Unadjusted returns do not reflect sales charges and would have been lower if they had.
The gross expense ratios of the Fund, as stated in the fee table of the prospectus dated October 1, 2012 are 0.82%, 1.63%, 1.59%, 0.64% and 0.56% for Class A, Class B, Class C, Class S and Institutional Class shares, respectively, and may differ from the expense ratios disclosed in the Financial Highlights tables in this report.
Index returns do not reflect any fees or expenses and it is not possible to invest directly into an index.
Performance figures do not reflect the deduction of taxes that a shareholder would pay on Fund distributions or the redemption of Fund shares.
A portion of the Fund's distributions may be subject to federal, state and local taxes and the alternative minimum tax.
Growth of an Assumed $10,000 Investment (Adjusted for Maximum Sales Charge) |
 |
 |
| Yearly periods ended May 31 |
The Fund's growth of an assumed $10,000 investment is adjusted for the maximum sales charge of 2.75%. This results in a net initial investment of $9,725.
The growth of $10,000 is cumulative.
Performance of other share classes will vary based on the sales charges and the fee structure of those classes.
† The Barclays Municipal Bond Index covers the U.S.-dollar-denominated long-term tax-exempt bond market. The index has four main sectors: state and local general obligation bonds, revenue bonds, insured bonds, and pre-refunded bonds.
| Class A | Class B | Class C | Class S | Institutional Class | ||||||||||||||||
| Net Asset Value | ||||||||||||||||||||
| 5/31/13 | $ | 9.40 | $ | 9.40 | $ | 9.40 | $ | 9.41 | $ | 9.40 | ||||||||||
| 5/31/12 | $ | 9.40 | $ | 9.40 | $ | 9.40 | $ | 9.41 | $ | 9.40 | ||||||||||
Distribution Information as of 5/31/13 | ||||||||||||||||||||
| Income Dividends, Twelve Months | $ | .37 | $ | .29 | $ | .30 | $ | .39 | $ | .39 | ||||||||||
| May Income Dividend | $ | .0289 | $ | .0235 | $ | .0226 | $ | .0303 | $ | .0311 | ||||||||||
| Capital Gain Distributions, Twelve Months | $ | .004 | $ | .004 | $ | .004 | $ | .004 | $ | .004 | ||||||||||
SEC 30-day Yield‡‡ | 1.88 | % | 1.12 | % | 1.14 | % | 2.10 | % | 2.20 | % | ||||||||||
Tax Equivalent Yield‡‡ | 2.89 | % | 1.72 | % | 1.75 | % | 3.23 | % | 3.38 | % | ||||||||||
Current Annualized Distribution Rate‡‡ | 3.69 | % | 3.00 | % | 2.89 | % | 3.86 | % | 3.97 | % | ||||||||||
‡‡ The SEC yield is net investment income per share earned over the month ended May 31, 2013, shown as an annualized percentage of the maximum offering price per share on the last day of the period. The SEC yield is computed in accordance with a standardized method prescribed by the Securities and Exchange Commission. Tax equivalent yield is based on the Fund's yield and a marginal federal income tax rate of 35%. Current annualized distribution rate is the latest monthly dividend shown as a percentage of net asset value on May 31, 2013. Distribution rate simply measures the level of dividends and is not a complete measure of performance. Yields and distribution rates are historical, not guaranteed and will fluctuate.
| Principal Amount ($) | Value ($) | |||||||
| Municipal Bonds and Notes 94.9% | ||||||||
| Alabama 0.9% | ||||||||
| Alabama, State Public School & College Authority, Capital Improvement, 5.0%, 12/1/2023 | 35,000,000 | 40,784,100 | ||||||
| Tuscaloosa County, AL, Industrial Development Authority, Gulf Opportunity Zone, Hunt Refining Project, Series C, 0.15%**, 12/1/2027, LOC: Bank of Nova Scotia | 10,000,000 | 10,000,000 | ||||||
| 50,784,100 | ||||||||
| Alaska 0.2% | ||||||||
| Alaska, State Industrial Development & Export Authority Revenue, Providence Health Services, Series A, 5.5%, 10/1/2041 | 11,000,000 | 12,582,020 | ||||||
| Arizona 1.5% | ||||||||
| Arizona, Salt Verde Financial Corp., Gas Revenue: | ||||||||
| 5.0%, 12/1/2032 | 1,600,000 | 1,783,008 | ||||||
| 5.0%, 12/1/2037 | 8,405,000 | 9,303,411 | ||||||
| Arizona, State Health Facilities Authority Revenue, Banner Health System: | ||||||||
| Series A, 5.0%, 1/1/2043 | 7,000,000 | 7,650,300 | ||||||
| Series D, 5.375%, 1/1/2032 | 12,000,000 | 13,225,200 | ||||||
| Arizona, Water Infrastructure Finance Authority Revenue, Water Quality, Series A, 5.0%, 10/1/2030 | 6,250,000 | 7,346,625 | ||||||
| Phoenix, AZ, Civic Improvement Corp., Airport Revenue: | ||||||||
| Series A, 5.0%, 7/1/2040 | 22,775,000 | 24,420,949 | ||||||
| Series A, 5.25%, 7/1/2033 | 20,885,000 | 23,111,550 | ||||||
| 86,841,043 | ||||||||
| Arkansas 0.1% | ||||||||
| North Little Rock, AR, Electric Revenue, Series A, ETM, 6.5%, 7/1/2015, INS: NATL | 8,335,000 | 8,847,519 | ||||||
| California 14.5% | ||||||||
| Banning, CA, Water & Sewer Revenue, 1989 Water System Improvement Project, ETM, 8.0%, 1/1/2019, INS: AMBAC | 520,000 | 605,654 | ||||||
| Banning, CA, Water & Sewer Revenue, Water System Reference & Improvement Project, ETM, 8.0%, 1/1/2019, INS: AMBAC | 285,000 | 346,021 | ||||||
| California, Bay Area Toll Authority, Toll Bridge Revenue, San Francisco Bay Area: | ||||||||
| Series F-1, 5.5%, 4/1/2043 | 13,000,000 | 14,798,160 | ||||||
| Series F-1, 5.625%, 4/1/2044 | 11,500,000 | 13,008,685 | ||||||
| California, Educational Facilities Authority Revenue, University of Southern California, Series A, 5.0%, 10/1/2038 | 6,925,000 | 7,839,654 | ||||||
| California, Golden State Tobacco Securitization Corp., Tobacco Settlement Revenue, Series A, 5.0%, 6/1/2045, INS: AGC | 10,275,000 | 10,688,261 | ||||||
| California, Health Facilities Financing Authority Revenue, Adventist Health System, Series A, 5.75%, 9/1/2039 | 5,000,000 | 5,745,800 | ||||||
| California, Health Facilities Financing Authority Revenue, Catholic Healthcare West: | ||||||||
| Series A, 6.0%, 7/1/2034 | 10,000,000 | 11,892,100 | ||||||
| Series A, 6.0%, 7/1/2039 | 7,500,000 | 8,919,075 | ||||||
| California, Infrastructure & Economic Development Bank Revenue, California Independent Systems Operator Corp., Series A, 6.25%, 2/1/2039 | 7,800,000 | 8,380,242 | ||||||
| California, M-S-R Energy Authority, Series B, 7.0%, 11/1/2034 | 15,315,000 | 21,251,094 | ||||||
| California, Port of Oakland, Series P, AMT, 5.0%, 5/1/2033 | 7,590,000 | 8,294,200 | ||||||
| California, State General Obligation: | ||||||||
| Series B, 144A, 0.11%**, 5/1/2040, LOC: JPMorgan Chase Bank NA | 1,000,000 | 1,000,000 | ||||||
| 5.0%, 2/1/2032 | 35,000,000 | 39,102,000 | ||||||
| 5.0%, 9/1/2032 | 10,000,000 | 10,876,500 | ||||||
| 5.0%, 2/1/2033 | 8,000,000 | 8,905,840 | ||||||
| 5.25%, 4/1/2035 | 15,340,000 | 17,382,674 | ||||||
| 6.0%, 4/1/2038 | 22,915,000 | 27,153,588 | ||||||
| 6.25%, 11/1/2034 | 20,655,000 | 25,336,869 | ||||||
| California, State General Obligation, Various Purposes: | ||||||||
| 5.0%, 6/1/2023, INS: AGMC | 25,000,000 | 28,579,500 | ||||||
| 5.0%, 12/1/2031, INS: NATL | 1,045,000 | 1,083,038 | ||||||
| Prerefunded, 5.125%, 11/1/2024 | 5,000,000 | 5,102,400 | ||||||
| 5.25%, 9/1/2026 | 18,765,000 | 22,086,968 | ||||||
| 5.25%, 9/1/2030 | 5,000,000 | 5,767,200 | ||||||
| 5.25%, 10/1/2032 | 25,000,000 | 28,672,500 | ||||||
| 6.0%, 11/1/2039 | 50,000,000 | 60,068,000 | ||||||
| 6.5%, 4/1/2033 | 58,440,000 | 72,034,313 | ||||||
| California, State Housing Finance Agency, Multi-Family Housing Revenue: | ||||||||
| Series C, AMT, 0.11%**, 8/1/2040, LOC: Fannie Mae, Freddie Mac | 4,625,000 | 4,625,000 | ||||||
| Series C, AMT, 0.14%**, 2/1/2037, LOC: Fannie Mae, Freddie Mac | 2,200,000 | 2,200,000 | ||||||
| California, State Kindergarten, Series B4, 0.1%**, 5/1/2034, LOC: Citibank NA | 6,130,000 | 6,130,000 | ||||||
| California, State Public Works Board, Lease Revenue, Capital Projects, Series I-1, 6.375%, 11/1/2034 | 10,000,000 | 12,286,100 | ||||||
| California, State Public Works Board, Lease Revenue, Department of Corrections, Series C, Prerefunded, 5.5%, 6/1/2021 | 2,500,000 | 2,566,125 | ||||||
| California, State Public Works Board, Lease Revenue, Department of General Services, Buildings 8 & 9, Series A, 6.125%, 4/1/2029 | 2,000,000 | 2,406,220 | ||||||
| California, State Public Works Board, Lease Revenue, Department of Mental Health: | ||||||||
| Series A, Prerefunded, 5.5%, 6/1/2021 | 5,275,000 | 5,552,043 | ||||||
| Series A, Prerefunded, 5.5%, 6/1/2022 | 1,400,000 | 1,473,528 | ||||||
| California, State Revenue Lease, Public Works Board, Department of Corrections: | ||||||||
| Series C, 5.0%, 6/1/2025 | 2,500,000 | 2,546,025 | ||||||
| Series C, Prerefunded, 5.5%, 6/1/2020 | 5,000,000 | 5,132,250 | ||||||
| California, State University Revenue, Series A, 5.25%, 11/1/2038 | 10,000,000 | 11,224,500 | ||||||
| California, Statewide Communities Development Authority Revenue, Kaiser Permanente, Kaiser Foundation, Series A, 5.0%, 4/1/2042 | 5,295,000 | 5,753,229 | ||||||
| East Bay, CA, Municipal Utility District, Wastewater Systems Revenue, Series A, 5.0%, 6/1/2037, INS: AMBAC | 13,085,000 | 14,703,091 | ||||||
| Foothill, CA, Eastern Corridor Agency, Toll Road Revenue: | ||||||||
| Series A, ETM, Zero Coupon, 1/1/2015 | 10,000,000 | 9,925,200 | ||||||
| Series A, ETM, Zero Coupon, 1/1/2017 | 5,000,000 | 4,859,850 | ||||||
| Series A, ETM, Zero Coupon, 1/1/2018 | 21,890,000 | 20,868,831 | ||||||
| Irvine, CA, Unified School District Special Tax, Community Facilities District, Series 1-B, 0.13%**, 9/1/2051, LOC: Bank of America NA | 12,570,000 | 12,570,000 | ||||||
| Los Angeles, CA, Community College District, Election of 2008, Series C, 5.25%, 8/1/2039 | 12,000,000 | 14,115,480 | ||||||
| Los Angeles, CA, Department of Airports Revenue, Series A, 5.25%, 5/15/2039 | 5,000,000 | 5,703,250 | ||||||
| Los Angeles, CA, Department of Airports Revenue, Los Angeles International Airport, Series A, 5.0%, 5/15/2040 | 25,000,000 | 27,744,750 | ||||||
| Murrieta Valley, CA, School District General Obligation, Unified School District, Series A, Zero Coupon, 9/1/2014, INS: FGIC, NATL | 4,235,000 | 4,190,914 | ||||||
| Oakland, CA, Special Assessment Revenue, Oakland Convention Centers, 5.5%, 10/1/2014, INS: AMBAC | 2,000,000 | 2,100,680 | ||||||
| Orange County, CA, Airport Revenue: | ||||||||
| Series A, 5.25%, 7/1/2039 | 16,000,000 | 17,683,200 | ||||||
| Series B, 5.25%, 7/1/2039 | 12,000,000 | 13,262,400 | ||||||
| Roseville, CA, School District General Obligation, Junior High, Series B, Zero Coupon, 8/1/2015, INS: FGIC, NATL | 1,000,000 | 983,240 | ||||||
| Sacramento, CA, Municipal Utility District, Electric Revenue: | ||||||||
| Series U, 5.0%, 8/15/2026, INS: AGMC | 10,455,000 | 11,712,109 | ||||||
| Series U, 5.0%, 8/15/2028, INS: AGMC | 8,175,000 | 9,060,271 | ||||||
| San Diego County, CA, Regional Airport Authority Revenue, Series A, 5.0%, 7/1/2034 | 7,000,000 | 7,582,680 | ||||||
| San Diego, CA, Community College District General Obligation, Election of 2002, 5.25%, 8/1/2033 | 5,000,000 | 5,933,400 | ||||||
| San Diego, CA, Community College District, Election of 2006, 5.0%, 8/1/2036 | 6,100,000 | 6,871,711 | ||||||
| San Diego, CA, School District General Obligation, Series A, Zero Coupon, 7/1/2014, INS: FGIC, NATL | 1,000,000 | 994,870 | ||||||
| San Francisco, CA, City & County Airports Commission, International Airport Revenue: | ||||||||
| Series 32-G, 5.0%, 5/1/2026, INS: FGIC, NATL | 8,565,000 | 9,416,961 | ||||||
| Series F, 5.0%, 5/1/2035 | 27,500,000 | 30,022,575 | ||||||
| Series E, 6.0%, 5/1/2039 | 35,000,000 | 42,372,400 | ||||||
| San Francisco, CA, City & County Certificates of Participation, Multiple Capital Improvement Projects, Series A, 5.25%, 4/1/2031 | 7,860,000 | 8,846,666 | ||||||
| San Joaquin County, CA, County General Obligation Lease, Facilities Project, 5.5%, 11/15/2013, INS: NATL | 1,390,000 | 1,416,549 | ||||||
| San Joaquin Hills, CA, Transportation/Tolls Revenue, Transportation Corridor Agency, Toll Road Revenue, Series A, Zero Coupon, 1/15/2014, INS: NATL | 14,905,000 | 14,667,265 | ||||||
| Walnut, CA, Energy Center Authority Revenue, Series A, 5.0%, 1/1/2040 | 10,000,000 | 10,641,900 | ||||||
| 835,065,599 | ||||||||
| Colorado 4.0% | ||||||||
| Colorado, E-470 Public Highway Authority Revenue: | ||||||||
| Series B, Zero Coupon, 9/1/2016, INS: NATL | 5,000,000 | 4,624,200 | ||||||
| Series A-1, 5.5%, 9/1/2024, INS: NATL | 4,000,000 | 4,319,400 | ||||||
| Colorado, Health Facilities Authority Revenue, Covenant Retirement Communities, Inc., 5.0%, 12/1/2035 | 15,000,000 | 15,312,300 | ||||||
| Colorado, Public Energy Authority, Natural Gas Purchase Revenue, 6.5%, 11/15/2038, GTY: Merrill Lynch & Co., Inc. | 30,000,000 | 40,362,600 | ||||||
| Colorado, State Building Excellent Schools Today, Certificates of Participation, Series G, 5.0%, 3/15/2032 | 8,630,000 | 9,583,097 | ||||||
| Colorado, Transportation/Tolls Revenue: | ||||||||
| Series B, Zero Coupon, 9/1/2014, INS: NATL | 6,380,000 | 6,217,438 | ||||||
| Series B, Zero Coupon, 9/1/2015, INS: NATL | 17,120,000 | 16,293,275 | ||||||
| Series B, Zero Coupon, 9/1/2017, INS: NATL | 8,000,000 | 7,157,680 | ||||||
| Series B, Zero Coupon, 9/1/2018, INS: NATL | 20,560,000 | 17,707,711 | ||||||
| Series B, Zero Coupon, 9/1/2019, INS: NATL | 36,500,000 | 29,970,880 | ||||||
| Series B, Zero Coupon, 9/1/2020, INS: NATL | 7,000,000 | 5,481,350 | ||||||
| Series A, 5.75%, 9/1/2014, INS: NATL | 14,700,000 | 15,444,702 | ||||||
| Colorado Springs, CO, Utilities Revenue, System Improvement, Series A, 0.12%**, 11/1/2038, SPA: Bank of America NA | 3,700,000 | 3,700,000 | ||||||
| Douglas County, CO, School District General Obligation, 7.0%, 12/15/2013, INS: NATL | 2,500,000 | 2,590,750 | ||||||
| University of Colorado, Enterprise Revenue, 5.25%, 6/1/2036 | 11,500,000 | 13,235,580 | ||||||
| University of Colorado, Hospital Authority Revenue, Series A, 5.0%, 11/15/2042 | 36,010,000 | 39,191,124 | ||||||
| 231,192,087 | ||||||||
| Connecticut 1.0% | ||||||||
| Connecticut, Harbor Point Infrastructure Improvement District, Special Obligation Revenue, Harbor Point Project, Series A, 7.875%, 4/1/2039 | 13,000,000 | 14,721,720 | ||||||
| Connecticut, State Health & Educational Facilities Authority Revenue, Hartford Healthcare, Series A, 5.0%, 7/1/2041 | 20,000,000 | 21,333,600 | ||||||
| Connecticut, State Health & Educational Facilities Authority Revenue, Stamford Hospital, Series J, 5.125%, 7/1/2035 | 18,000,000 | 19,636,380 | ||||||
| 55,691,700 | ||||||||
| Delaware 0.1% | ||||||||
| Delaware, State Economic Development Authority Revenue, YMCA Delaware Project, 0.12%**, 5/1/2036, LOC: PNC Bank NA | 4,785,000 | 4,785,000 | ||||||
| District of Columbia 0.7% | ||||||||
| District of Columbia, Income Tax Secured Revenue, Series G, 5.0%, 12/1/2036 | 27,475,000 | 30,901,682 | ||||||
| District of Columbia, National Public Radio Revenue, Series A, 5.0%, 4/1/2035 | 5,000,000 | 5,428,350 | ||||||
| District of Columbia, Water & Sewer Revenue, Public Utility Revenue, 5.5%, 10/1/2023, INS: AGMC | 5,000,000 | 6,333,850 | ||||||
| 42,663,882 | ||||||||
| Florida 6.2% | ||||||||
| Broward County, FL, Airport Systems Revenue, Series Q-1, 5.0%, 10/1/2037 | 39,000,000 | 42,694,860 | ||||||
| Clearwater, FL, Water & Sewer Revenue, Series A, 5.25%, 12/1/2039 | 2,000,000 | 2,225,860 | ||||||
| Florida, Capital Trust Agency Housing Revenue, Atlantic Housing Foundation, Series A, 0.15%**, 7/15/2024, LIQ: Fannie Mae | 19,000,000 | 19,000,000 | ||||||
| Florida, Jacksonville Electric Authority, Water & Sewer Revenue, Series A, 5.0%, 10/1/2032 | 5,000,000 | 5,606,150 | ||||||
| Florida, Village Center Community Development District, Utility Revenue, ETM, 6.0%, 11/1/2018, INS: FGIC | 1,250,000 | 1,473,162 | ||||||
| Fort Pierce, FL, Utilities Authority Revenue, Series B, Zero Coupon, 10/1/2018, INS: AMBAC | 2,000,000 | 1,769,880 | ||||||
| Hillsborough County, FL, Industrial Development Authority Revenue, University Community Hospital, ETM, 6.5%, 8/15/2019, INS: NATL | 1,000,000 | 1,221,290 | ||||||
| Lee County, FL, Airport Revenue, Series A, AMT, 5.375%, 10/1/2032 | 1,750,000 | 1,907,850 | ||||||
| Marco Island, FL, Utility Systems Revenue: | ||||||||
| Series A, 5.0%, 10/1/2034 | 1,000,000 | 1,093,860 | ||||||
| Series A, 5.0%, 10/1/2040 | 1,000,000 | 1,085,120 | ||||||
| Melbourne, FL, Water & Sewer Revenue, ETM, Zero Coupon, 10/1/2016, INS: FGIC | 1,350,000 | 1,316,075 | ||||||
| Miami-Dade County, FL, Aviation Revenue: | ||||||||
| Series A, AMT, 5.0%, 10/1/2030 | 7,355,000 | 8,039,677 | ||||||
| Series A, AMT, 5.0%, 10/1/2031 | 3,495,000 | 3,800,288 | ||||||
| Series A, AMT, 5.0%, 10/1/2032 | 9,050,000 | 9,781,602 | ||||||
| Series B, 5.0%, 10/1/2035, INS: AGMC | 15,000,000 | 16,756,950 | ||||||
| Series A, 5.5%, 10/1/2041 | 30,000,000 | 33,825,000 | ||||||
| Miami-Dade County, FL, Aviation Revenue, Miami International Airport: | ||||||||
| Series C, AMT, 5.25%, 10/1/2022, INS: AGMC | 20,000,000 | 22,988,400 | ||||||
| Series A-1, 5.375%, 10/1/2035 | 1,000,000 | 1,117,560 | ||||||
| Series A-1, 5.375%, 10/1/2041 | 19,290,000 | 21,465,526 | ||||||
| Miami-Dade County, FL, Double Barreled Aviation, 5.0%, 7/1/2041 | 6,700,000 | 7,283,838 | ||||||
| Miami-Dade County, FL, Transit Sales Surtax Revenue, 5.0%, 7/1/2037 | 16,500,000 | 18,201,810 | ||||||
| Miami-Dade County, FL, Water & Sewer Systems Revenue, 5.0%, 10/1/2034 | 17,800,000 | 19,676,654 | ||||||
| North Brevard County, FL, Hospital District Revenue, Parrish Medical Center Project, 5.75%, 10/1/2043 | 10,000,000 | 10,950,500 | ||||||
| Orange County, FL, Health Facilities Authority Revenue: | ||||||||
| Series 2006-A, 6.25%, 10/1/2016, INS: NATL | 1,100,000 | 1,199,726 | ||||||
| Series 2006-A, ETM, 6.25%, 10/1/2016, INS: NATL | 70,000 | 79,402 | ||||||
| Orange County, FL, Health Facilities Authority Revenue, Orlando Regional Healthcare System: | ||||||||
| Series B, 5.25%, 12/1/2029, INS: AGMC | 6,500,000 | 7,232,940 | ||||||
| Series A, 6.25%, 10/1/2018, INS: NATL | 500,000 | 611,940 | ||||||
| Series C, 6.25%, 10/1/2021, INS: NATL | 6,000,000 | 7,300,560 | ||||||
| Orange County, FL, Health Facilities Authority, Orlando Regional Facilities, Series A, ETM, 6.25%, 10/1/2016, INS: NATL | 2,830,000 | 3,210,097 | ||||||
| Orlando & Orange County, FL, Expressway Authority Revenue: | ||||||||
| Series C, 5.0%, 7/1/2035 | 16,215,000 | 17,627,975 | ||||||
| Series A, 5.0%, 7/1/2040 | 11,895,000 | 12,846,600 | ||||||
| Palm Beach County, FL, Airport Systems Revenue: | ||||||||
| 5.75%, 10/1/2013, INS: NATL | 3,770,000 | 3,837,332 | ||||||
| 5.75%, 10/1/2014, INS: NATL | 755,000 | 805,842 | ||||||
| Palm Beach County, FL, Criminal Justice Facilities Revenue, 7.2%, 6/1/2015, INS: FGIC, NATL | 110,000 | 123,345 | ||||||
| Port St. Lucie, FL, Utility System Revenue: | ||||||||
| 5.0%, 9/1/2035, INS: AGC | 2,600,000 | 2,878,018 | ||||||
| 5.25%, 9/1/2035, INS: AGC | 3,000,000 | 3,425,880 | ||||||
| Sunrise, FL, Water & Sewer Revenue, Utility Systems, ETM, 5.5%, 10/1/2018, INS: AMBAC | 12,500,000 | 14,649,875 | ||||||
| Tallahassee, FL, Energy System Revenue, 5.5%, 10/1/2016, INS: AMBAC | 1,005,000 | 1,155,830 | ||||||
| Tampa, FL, Sports Authority Revenue, Sales Tax-Tampa Bay Arena Project, 5.75%, 10/1/2020, INS: NATL | 2,075,000 | 2,281,276 | ||||||
| Tampa, FL, Utility Tax Revenue: | ||||||||
| Zero Coupon, 10/1/2014, INS: AMBAC | 375,000 | 371,250 | ||||||
| ETM, Zero Coupon, 10/1/2014, INS: AMBAC | 2,790,000 | 2,778,115 | ||||||
| Tampa-Hillsborough County, FL, Expressway Authority, Series A, 5.0%, 7/1/2037 | 18,430,000 | 20,137,171 | ||||||
| 355,835,086 | ||||||||
| Georgia 4.8% | ||||||||
| Atlanta, GA, Airport Revenue: | ||||||||
| Series A, 5.0%, 1/1/2035 | 2,470,000 | 2,688,373 | ||||||
| Series B, 5.0%, 1/1/2037 | 720,000 | 798,610 | ||||||
| Atlanta, GA, Metropolitan Rapid Transit Authority, Sales Tax Revenue, 5.0%, 7/1/2039 | 5,000,000 | 5,594,900 | ||||||
| Atlanta, GA, Water & Sewer Revenue, Series A, 5.5%, 11/1/2019, INS: FGIC, NATL | 13,000,000 | 15,955,160 | ||||||
| Atlanta, GA, Water & Wastewater Revenue, Series B, 5.375%, 11/1/2039, INS: AGMC | 40,000,000 | 44,579,600 | ||||||
| Burke County, GA, Development Authority Pollution Control Revenue, Oglethorpe Power Corp. Vogtle Project: | ||||||||
| Series A, 5.3%, 1/1/2033, INS: AGMC | 10,000,000 | 11,258,300 | ||||||
| Series B, 5.5%, 1/1/2033 | 4,000,000 | 4,375,800 | ||||||
| Burke County, GA, Development Authority, Georgia Power Co., Plant Vogtle Project, AMT, 0.1%**, 11/1/2052 | 11,000,000 | 11,000,000 | ||||||
| De Kalb County, GA, Water & Sewer Revenue: | ||||||||
| Series A, 5.25%, 10/1/2032 | 2,180,000 | 2,507,109 | ||||||
| Series A, 5.25%, 10/1/2033 | 3,635,000 | 4,168,981 | ||||||
| Series A, 5.25%, 10/1/2036 | 11,115,000 | 12,651,982 | ||||||
| Series A, 5.25%, 10/1/2041 | 13,000,000 | 14,676,610 | ||||||
| Gainesville & Hall County, GA, Hospital Authority Revenue, Anticipation Certificates, Northeast Georgia Healthcare: | ||||||||
| Series A, 5.375%, 2/15/2040 | 8,225,000 | 8,941,891 | ||||||
| Series A, 5.5%, 2/15/2045 | 20,000,000 | 21,951,400 | ||||||
| Georgia, Main Street Natural Gas, Inc., Gas Project Revenue: | ||||||||
| Series A, 5.0%, 3/15/2019 | 17,440,000 | 20,126,806 | ||||||
| Series B, 5.0%, 3/15/2019 | 5,000,000 | 5,673,000 | ||||||
| Series A, 5.0%, 3/15/2020 | 2,700,000 | 3,114,450 | ||||||
| Series B, 5.0%, 3/15/2020 | 5,000,000 | 5,694,950 | ||||||
| Series A, 5.0%, 3/15/2022 | 17,340,000 | 19,930,249 | ||||||
| Series A, 5.5%, 9/15/2023 | 5,000,000 | 5,979,550 | ||||||
| Series A, 5.5%, 9/15/2024 | 4,635,000 | 5,578,686 | ||||||
| Series A, 5.5%, 9/15/2027 | 5,000,000 | 6,113,650 | ||||||
| Series A, 5.5%, 9/15/2028 | 5,000,000 | 6,072,150 | ||||||
| Georgia, Medical Center Hospital Authority Revenue, Anticipation Certificates, Columbus Regional Healthcare Systems, 6.5%, 8/1/2038, INS: AGC | 18,700,000 | 21,098,462 | ||||||
| Georgia, Municipal Electric Authority Power Revenue, Series W, 6.6%, 1/1/2018, INS: NATL | 8,575,000 | 9,483,264 | ||||||
| Georgia, State Municipal Electric Authority, Series GG, 5.0%, 1/1/2039 | 5,695,000 | 6,285,173 | ||||||
| Georgia, Water & Sewer Revenue, Municipal Electric Authority Power Revenue, Series W, ETM, 6.6%, 1/1/2018, INS: NATL | 100,000 | 116,620 | ||||||
| 276,415,726 | ||||||||
| Hawaii 0.6% | ||||||||
| Hawaii, State Airports Systems Revenue, Series A, 5.0%, 7/1/2039 | 16,800,000 | 18,165,840 | ||||||
| Hawaii, State Department of Budget & Finance, Special Purpose Revenue, Hawaiian Electric Co., Inc., 6.5%, 7/1/2039, GTY: Hawaiian Electric Co., Inc. | 6,000,000 | 7,035,780 | ||||||
| Honolulu City & County, HI, Wastewater Systems Revenue, Series A, 5.25%, 7/1/2036 | 10,285,000 | 11,803,580 | ||||||
| 37,005,200 | ||||||||
| Idaho 0.2% | ||||||||
| Idaho, Health Facilities Authority Revenue, St. Luke's Regional Medical Center, 6.75%, 11/1/2037 | 10,060,000 | 11,695,152 | ||||||
| Illinois 9.6% | ||||||||
| Channahon, IL, Morris Hospital Revenue, Series A, 0.13%**, 12/1/2034, LOC: U.S. Bank NA | 6,780,000 | 6,780,000 | ||||||
| Chicago, IL, Core City General Obligation, Zero Coupon, 1/1/2017, INS: FGIC, NATL | 20,000,000 | 18,833,000 | ||||||
| Chicago, IL, General Obligation: | ||||||||
| Series B, 5.125%, 1/1/2015, INS: AMBAC | 1,470,000 | 1,538,605 | ||||||
| Series B, Prerefunded, 5.125%, 1/1/2015, INS: AMBAC | 490,000 | 503,931 | ||||||
| Series A, 5.25%, 1/1/2035 | 10,125,000 | 10,990,283 | ||||||
| Chicago, IL, O'Hare International Airport Revenue: | ||||||||
| Series A-2, AMT, 5.75%, 1/1/2019, INS: AGMC | 12,975,000 | 13,369,310 | ||||||
| Series C, 6.5%, 1/1/2041 | 26,700,000 | 33,982,425 | ||||||
| Chicago, IL, O'Hare International Airport Revenue, Third Lien: | ||||||||
| Series A, 5.75%, 1/1/2039 | 13,650,000 | 15,684,533 | ||||||
| Series B, 6.0%, 1/1/2041 | 25,000,000 | 29,563,250 | ||||||
| Chicago, IL, Sales & Special Tax Revenue, 5.375%, 1/1/2014, INS: AMBAC | 1,105,000 | 1,136,636 | ||||||
| Chicago, IL, School District General Obligation Lease, Board of Education: | ||||||||
| Series A, 6.0%, 1/1/2016, INS: NATL | 11,025,000 | 12,452,958 | ||||||
| Series A, 6.0%, 1/1/2020, INS: NATL | 46,340,000 | 53,774,326 | ||||||
| Series A, 6.25%, 1/1/2015, INS: NATL | 15,225,000 | 15,948,188 | ||||||
| Chicago, IL, Water & Sewer Revenue, Zero Coupon, 11/1/2018, INS: AMBAC | 5,165,000 | 4,656,248 | ||||||
| Chicago, IL, Water Revenue, 5.0%, 11/1/2023, INS: AGMC | 10,000,000 | 11,710,100 | ||||||
| Cook County, IL, County General Obligation, 6.5%, 11/15/2014, INS: FGIC, NATL | 18,560,000 | 20,191,424 | �� | |||||
| Cook County, IL, Forest Preservation District, Series C, 5.0%, 12/15/2037 | 3,155,000 | 3,515,080 | ||||||
| Illinois, Finance Authority Revenue, Advocate Health Care Network: | ||||||||
| Series B, 5.375%, 4/1/2044 | 5,500,000 | 6,089,435 | ||||||
| Series A, 5.5%, 4/1/2044 | 5,500,000 | 6,200,755 | ||||||
| Series D, 6.5%, 11/1/2038 | 4,085,000 | 4,892,564 | ||||||
| Illinois, Finance Authority Revenue, Elmhurst Memorial Healthcare, Series A, 5.625%, 1/1/2037 | 8,000,000 | 8,836,880 | ||||||
| Illinois, Finance Authority Revenue, Memorial Health Systems: | ||||||||
| 5.5%, 4/1/2034 | 12,100,000 | 13,295,964 | ||||||
| 5.5%, 4/1/2039 | 4,800,000 | 5,232,240 | ||||||
| Illinois, Finance Authority Revenue, Northwest Community Hospital, Series A, 5.5%, 7/1/2038 | 22,990,000 | 24,763,908 | ||||||
| Illinois, Higher Education Revenue, Zero Coupon, 4/1/2015, INS: NATL | 3,300,000 | 3,243,900 | ||||||
| Illinois, Hospital & Healthcare Revenue, Health Facilities Authority: | ||||||||
| 6.25%, 8/15/2013, INS: NATL | 655,000 | 662,336 | ||||||
| Series A, 6.25%, 1/1/2015, INS: AMBAC | 5,050,000 | 5,289,875 | ||||||
| Illinois, Metropolitan Pier & Exposition Authority, Dedicated State Tax Revenue, McCormick Capital Appreciation: | ||||||||
| Zero Coupon, 6/15/2013, INS: NATL | 4,045,000 | 4,044,555 | ||||||
| ETM, Zero Coupon, 6/15/2013, INS: NATL | 3,520,000 | 3,519,718 | ||||||
| Illinois, Metropolitan Pier & Exposition Authority, Dedicated State Tax Revenue, McCormick Place Expansion: | ||||||||
| Series A, Zero Coupon, 6/15/2016, INS: FGIC, NATL | 7,035,000 | 6,779,418 | ||||||
| Series A, ETM, Zero Coupon, 6/15/2016, INS: FGIC, NATL | 2,965,000 | 2,901,608 | ||||||
| Illinois, Municipal Electric Agency Power Supply: | ||||||||
| Series A, 5.25%, 2/1/2023, INS: FGIC, NATL | 3,500,000 | 3,980,305 | ||||||
| Series A, 5.25%, 2/1/2024, INS: FGIC, NATL | 2,500,000 | 2,843,075 | ||||||
| Illinois, Pollution Control Revenue, Development Finance Authority, 5.85%, 1/15/2014, INS: AMBAC | 5,000,000 | 5,150,250 | ||||||
| Illinois, Project Revenue, Zero Coupon, 1/1/2014, INS: AGMC | 17,975,000 | 17,897,168 | ||||||
| Illinois, Railsplitter Tobacco Settlement Authority, 6.0%, 6/1/2028 | 17,315,000 | 20,679,304 | ||||||
| Illinois, Regional Transportation Authority: | ||||||||
| Series B, 5.75%, 6/1/2033, INS: NATL | 7,000,000 | 8,815,030 | ||||||
| Series A, 6.7%, 11/1/2021, INS: FGIC, NATL | 23,910,000 | 28,348,652 | ||||||
| Illinois, Sales & Special Tax Revenue: | ||||||||
| 6.25%, 12/15/2020, INS: AMBAC | 6,380,000 | 7,232,559 | ||||||
| Series P, 6.5%, 6/15/2013 | 405,000 | 405,996 | ||||||
| Illinois, Special Assessment Revenue, Metropolitan Pier and Exposition Authority, Series A, Zero Coupon, 12/15/2018, INS: NATL | 6,660,000 | 6,007,653 | ||||||
| Illinois, State Finance Authority Revenue, Ascension Health Credit Group: | ||||||||
| Series A, 5.0%, 11/15/2032 | 2,435,000 | 2,737,257 | ||||||
| Series A, 5.0%, 11/15/2037 | 3,440,000 | 3,800,237 | ||||||
| Illinois, State Finance Authority Revenue, OSF Healthcare Systems, Series A, 5.0%, 5/15/2041 | 13,155,000 | 14,111,237 | ||||||
| Illinois, State Finance Authority Revenue, Resurrection Health, Series C, 0.13%**, 5/15/2035, LOC: Barclays Bank PLC | 5,000,000 | 5,000,000 | ||||||
| Illinois, State Toll Highway Authority, Series A, 5.0%, 1/1/2038 | 14,695,000 | 16,180,518 | ||||||
| Lake Cook Kane & McHenry Counties, IL, School District General Obligation, 6.3%, 12/1/2017, INS: AGMC | 1,885,000 | 2,324,639 | ||||||
| Lake County, IL, Higher Education Revenue, District No. 117: | ||||||||
| Series B, Zero Coupon, 12/1/2013, INS: FGIC, NATL | 5,880,000 | 5,861,831 | ||||||
| Series B, Zero Coupon, 12/1/2014, INS: FGIC, NATL | 5,985,000 | 5,888,582 | ||||||
| Springfield, IL, Water Revenue, 5.0%, 3/1/2037 | 3,640,000 | 4,073,014 | ||||||
| University of Illinois, Health Services Facilities Systems, Series B, 0.13%**, 10/1/2026, LOC: JPMorgan Chase Bank NA | 10,600,000 | 10,600,000 | ||||||
| Will County, IL, County General Obligation: | ||||||||
| Series B, Zero Coupon, 12/1/2013, INS: FGIC, NATL | 12,030,000 | 12,013,038 | ||||||
| Series B, Zero Coupon, 12/1/2014, INS: FGIC, NATL | 10,255,000 | 10,188,855 | ||||||
| Will County, IL, School District General Obligation, Community Unit School District No. 365-U, Series B, ETM, Zero Coupon, 11/1/2015, INS: AGMC | 8,000,000 | 7,888,160 | ||||||
| 552,410,813 | ||||||||
| Indiana 1.3% | ||||||||
| Indiana, Electric Revenue, Municipal Power Agency, Series B, 5.5%, 1/1/2016, INS: NATL | 10,160,000 | 10,743,184 | ||||||
| Indiana, Finance Authority Hospital Revenue, Deaconess Hospital Obligation, Series A, 6.75%, 3/1/2039 | 5,230,000 | 6,121,349 | ||||||
| Indiana, Hospital & Healthcare Revenue, Health Facilities Financing Authority: | ||||||||
| ETM, 6.0%, 7/1/2013, INS: NATL | 1,230,000 | 1,235,916 | ||||||
| ETM, 6.0%, 7/1/2013, INS: NATL | 390,000 | 391,541 | ||||||
| ETM, 6.0%, 7/1/2014, INS: NATL | 410,000 | 428,364 | ||||||
| ETM, 6.0%, 7/1/2014, INS: NATL | 1,310,000 | 1,390,775 | ||||||
| ETM, 6.0%, 7/1/2015, INS: NATL | 440,000 | 478,130 | ||||||
| ETM, 6.0%, 7/1/2015, INS: NATL | 1,385,000 | 1,544,663 | ||||||
| 6.0%, 7/1/2016, INS: NATL | 465,000 | 520,860 | ||||||
| ETM, 6.0%, 7/1/2016, INS: NATL | 1,470,000 | 1,710,904 | ||||||
| 6.0%, 7/1/2017, INS: NATL | 490,000 | 559,242 | ||||||
| ETM, 6.0%, 7/1/2017, INS: NATL | 1,560,000 | 1,888,052 | ||||||
| 6.0%, 7/1/2018, INS: NATL | 520,000 | 605,155 | ||||||
| ETM, 6.0%, 7/1/2018, INS: NATL | 1,655,000 | 2,059,499 | ||||||
| Indiana, State Finance Authority Revenue, Community Foundation of Northwest Indiana, 5.0%, 3/1/2041 | 17,395,000 | 18,358,509 | ||||||
| Indiana, State Finance Authority, Hospital Revenue, Indiana University Health, Series D, 0.12%**, 3/1/2033, LOC: Northern Trust Co. | 6,115,000 | 6,115,000 | ||||||
| Indiana, State Finance Authority, Wastewater Utility Revenue, First Lien, Series A, 5.25%, 10/1/2038 | 8,000,000 | 9,081,360 | ||||||
| Indiana, Transportation/Tolls Revenue, Series A, 7.25%, 6/1/2015 | 1,350,000 | 1,429,582 | ||||||
| St. Joseph County, IN, Educational Facilities Revenue, Notre Dame du Lac Project, 5.0%, 3/1/2036 | 10,000,000 | 11,288,200 | ||||||
| 75,950,285 | ||||||||
| Iowa 0.0% | ||||||||
| Iowa, State Finance Authority, Single Family Revenue, Series C, AMT, 0.17%**, 1/1/2036, SPA: State Street Bank & Trust Co. | 1,700,000 | 1,700,000 | ||||||
| Kansas 0.7% | ||||||||
| Kansas, Pollution Control Revenue, Development Financing Authority, Series II, 5.5%, 11/1/2017 | 1,000,000 | 1,202,410 | ||||||
| Kansas, State Development Finance Authority Hospital Revenue, Adventist Health System: | ||||||||
| Series A, 5.0%, 11/15/2032 | 13,000,000 | 14,493,180 | ||||||
| Series A, 5.0%, 11/15/2034 | 8,465,000 | 9,382,352 | ||||||
| Olathe, KS, Health Facilities Revenue, Olathe Medical Center, Inc., 144A, 0.15%**, 9/1/2032, LOC: Bank of America NA | 12,655,000 | 12,655,000 | ||||||
| Wichita, KS, Hospital Revenue, Facilities Improvement, Series III-A, 5.0%, 11/15/2034 | 3,590,000 | 3,903,012 | ||||||
| 41,636,954 | ||||||||
| Kentucky 1.4% | ||||||||
| Kentucky, Economic Development Finance Authority, Health Systems Revenue, Norton Healthcare: | ||||||||
| Series C, 5.7%, 10/1/2013, INS: NATL | 5,495,000 | 5,591,602 | ||||||
| Series C, ETM, 5.7%, 10/1/2013, INS: NATL | 2,750,000 | 2,797,025 | ||||||
| Series C, 5.8%, 10/1/2014, INS: NATL | 3,420,000 | 3,510,733 | ||||||
| Series C, Prerefunded, 5.8%, 10/1/2014, INS: NATL | 1,710,000 | 1,758,718 | ||||||
| Series C, 5.85%, 10/1/2015, INS: NATL | 3,490,000 | 3,580,601 | ||||||
| Series C, Prerefunded, 5.85%, 10/1/2015, INS: NATL | 1,745,000 | 1,794,994 | ||||||
| Series C, 5.9%, 10/1/2016, INS: NATL | 4,330,000 | 4,440,155 | ||||||
| Series C, Prerefunded, 5.9%, 10/1/2016, INS: NATL | 2,170,000 | 2,232,539 | ||||||
| Kentucky, Economic Development Finance Authority, Hospital Facilities Revenue, Owensboro Medical Health Systems, Series A, 6.5%, 3/1/2045 | 11,000,000 | 12,858,340 | ||||||
| Kentucky, Economic Development Finance Authority, Louisville Arena Project Revenue, Series A-1, 6.0%, 12/1/2038, INS: AGC | 4,500,000 | 4,848,255 | ||||||
| Louisville & Jefferson County, KY, Metropolitan Government Health Systems Revenue, Norton Healthcare, Inc., 5.0%, 10/1/2030 | 15,000,000 | 15,684,600 | ||||||
| Louisville & Jefferson County, KY, Metropolitan Government Revenue, Catholic Health Initiatives, Series A, 5.0%, 12/1/2035 | 20,770,000 | 22,980,136 | ||||||
| 82,077,698 | ||||||||
| Louisiana 0.5% | ||||||||
| East Baton Rouge, LA, Sewer Commission Revenue, Series A, 5.25%, 2/1/2039 | 10,000,000 | 11,200,000 | ||||||
| Louisiana, Public Facilities Authority, Hospital Revenue, Lafayette General Medical Center, 5.5%, 11/1/2040 | 5,000,000 | 5,450,650 | ||||||
| Louisiana, St. John Baptist Parish Revenue, Marathon Oil Corp., Series A, 5.125%, 6/1/2037 | 12,000,000 | 12,666,960 | ||||||
| 29,317,610 | ||||||||
| Maine 0.2% | ||||||||
| Maine, Health & Higher Educational Facilities Authority Revenue, Series A, 5.0%, 7/1/2040 | 9,650,000 | 10,397,103 | ||||||
| Maryland 0.4% | ||||||||
| Maryland, State Economic Development Corp. Revenue, Senior Lien Project, Chesapeake Bay: | ||||||||
| Series A, 5.0%, 12/1/2016 | 860,000 | 748,200 | ||||||
| Series A, 5.0%, 12/1/2031 | 20,000,000 | 13,195,000 | ||||||
| Maryland, State Health & Higher Educational Facilities Authority Revenue, Adventist Health Care, Series A, 0.13%**, 1/1/2035, LOC: Union Bank NA | 3,250,000 | 3,250,000 | ||||||
| Maryland, State Health & Higher Educational Facilities Authority Revenue, Anne Arundel Health Systems, Series A, 6.75%, 7/1/2039 | 3,400,000 | 4,186,930 | ||||||
| 21,380,130 | ||||||||
| Massachusetts 3.7% | ||||||||
| Massachusetts, Bay Transportation Authority Revenue, Series B, 6.2%, 3/1/2016 | 7,065,000 | 7,599,750 | ||||||
| Massachusetts, Higher Education Revenue, College Building Authority Project, Series A, 7.5%, 5/1/2014 | 1,970,000 | 2,084,418 | ||||||
| Massachusetts, Industrial Development Revenue, Development Finance Agency, Series A, 7.1%, 7/1/2032 | 4,310,000 | 4,312,155 | ||||||
| Massachusetts, Port Authority Revenue, ETM, 13.0%, 7/1/2013 | 235,000 | 237,312 | ||||||
| Massachusetts, Sales & Special Tax Revenue, Federal Highway Grant, Series A, ETM, Zero Coupon, 12/15/2014 | 27,680,000 | 27,539,662 | ||||||
| Massachusetts, State College Building Authority Revenue: | ||||||||
| Series B, 5.0%, 5/1/2037 | 4,500,000 | 5,058,900 | ||||||
| Series B, 5.0%, 5/1/2043 | 4,125,000 | 4,600,324 | ||||||
| Massachusetts, State Department of Transportation, Metropolitan Highway Systems Revenue, Series B, 5.0%, 1/1/2032 | 28,800,000 | 31,791,744 | ||||||
| Massachusetts, State Development Finance Agency Revenue, Linden Ponds, Inc. Facility: | ||||||||
| Series A-2, 5.5%, 11/15/2046 | 63,235 | 50,699 | ||||||
| Series A-1, 6.25%, 11/15/2031 | 1,182,967 | 1,118,649 | ||||||
| Series B, 11/15/2056* | 314,524 | 2,214 | ||||||
| Massachusetts, State Development Finance Agency Revenue, Partners Healthcare System, Inc., Series L, 5.0%, 7/1/2036 | 13,680,000 | 15,240,888 | ||||||
| Massachusetts, State Health & Educational Facilities Authority Revenue, Hillcrest Extended Care Services, Inc., Series A, 0.17%**, 10/1/2026, LOC: Bank of America NA | 4,775,000 | 4,775,000 | ||||||
| Massachusetts, State Health & Educational Facilities Authority Revenue, Massachusetts Institute of Technology, Series K, 5.5%, 7/1/2022 | 9,000,000 | 11,678,400 | ||||||
| Massachusetts, State Health & Educational Facilities Authority Revenue, Suffolk University, Series A, 5.75%, 7/1/2039 | 14,285,000 | 15,837,922 | ||||||
| Massachusetts, State Port Authority Special Facilities Revenue, Delta Air Lines, Inc. Project: | ||||||||
| Series A, AMT, 5.5%, 1/1/2014, INS: AMBAC | 3,000,000 | 3,003,090 | ||||||
| Series A, AMT, 5.5%, 1/1/2015, INS: AMBAC | 3,000,000 | 3,002,970 | ||||||
| Series A, AMT, 5.5%, 1/1/2016, INS: AMBAC | 3,000,000 | 3,002,580 | ||||||
| Massachusetts, State School Building Authority, Sales Tax Revenue, Series B, 5.25%, 10/15/2035 | 12,000,000 | 13,922,760 | ||||||
| Massachusetts, State Water Resource Authority: | ||||||||
| Series B, 5.0%, 8/1/2041 | 5,500,000 | 6,149,715 | ||||||
| Series J, 5.5%, 8/1/2021, INS: AGMC | 5,685,000 | 7,193,572 | ||||||
| Massachusetts, Transportation/Tolls Revenue, Turnpike Authority, Series C, Zero Coupon, 1/1/2018, INS: NATL | 10,000,000 | 9,369,900 | ||||||
| Massachusetts, Water & Sewer Revenue, Water Authority, Series J, 5.5%, 8/1/2020, INS: AGMC | 14,315,000 | 17,939,272 | ||||||
| Massachusetts, Water & Sewer Revenue, Water Resource Authority, Series A, ETM, 6.5%, 7/15/2019 (a) | 13,710,000 | 16,027,401 | ||||||
| 211,539,297 | ||||||||
| Michigan 2.7% | ||||||||
| Detroit, MI, School District General Obligation, Series C, 5.25%, 5/1/2014, INS: FGIC | 1,000,000 | 1,042,240 | ||||||
| Detroit, MI, Sewer Disposal Revenue, Series B, 7.5%, 7/1/2033, INS: AGMC | 10,000,000 | 12,201,800 | ||||||
| Detroit, MI, Water & Sewer Revenue, Series A, Zero Coupon, 7/1/2015, INS: FGIC, NATL | 8,710,000 | 8,364,910 | ||||||
| Detroit, MI, Water Supply Systems Revenue, Series A, 5.75%, 7/1/2037 | 11,410,000 | 12,582,377 | ||||||
| Michigan, State Building Authority Revenue, Facilities Program: | ||||||||
| Series H, 5.125%, 10/15/2033 | 9,755,000 | 10,644,266 | ||||||
| Series I, 6.0%, 10/15/2038 | 9,000,000 | 10,716,390 | ||||||
| Michigan, State Grant Anticipation Bonds, 5.25%, 9/15/2023, INS: AGMC | 7,500,000 | 8,713,050 | ||||||
| Michigan, State Higher Education Facilities Authority, Limited Obligation, Hope College, Series B, 0.13%**, 4/1/2032, LOC: PNC Bank NA | 1,555,000 | 1,555,000 | ||||||
| Michigan, State Hospital Finance Authority Revenue, MidMichigan Health Obligation Group, Series A, 6.125%, 6/1/2039 | 4,000,000 | 4,585,960 | ||||||
| Michigan, State Hospital Finance Authority Revenue, Trinity Health, Series A, 6.5%, 12/1/2033 | 10,000,000 | 12,003,200 | ||||||
| Michigan, State Hospital Finance Authority, Trinity Health Credit Group, Series C, 5.0%, 12/1/2034 | 27,000,000 | 29,611,980 | ||||||
| Michigan, State Strategic Fund Ltd., Obligation Revenue, Consumers Energy Co., 0.13%**, 4/15/2018, LOC: JPMorgan Chase Bank NA | 17,000,000 | 17,000,000 | ||||||
| Royal Oak, MI, Hospital Finance Authority Revenue, William Beaumont Hospital, 8.25%, 9/1/2039 | 7,200,000 | 9,107,640 | ||||||
| Wayne County, MI, Airport Authority Revenue, Detroit Metropolitan Airport: | ||||||||
| Series A, 5.0%, 12/1/2037 | 9,255,000 | 10,091,282 | ||||||
| Series A, 5.0%, 12/1/2042 | 7,095,000 | 7,694,953 | ||||||
| 155,915,048 | ||||||||
| Minnesota 0.3% | ||||||||
| Minneapolis, MN, Health Care Systems Revenue, Fairview Health Services, Series A, 6.75%, 11/15/2032 | 6,440,000 | 7,773,402 | ||||||
| University of Minnesota, Higher Education Revenue: | ||||||||
| Series A, ETM, 5.75%, 7/1/2017 | 3,240,000 | 3,842,834 | ||||||
| Series A, ETM, 5.75%, 7/1/2018 (a) | 6,760,000 | 8,227,664 | ||||||
| 19,843,900 | ||||||||
| Mississippi 1.0% | ||||||||
| Mississippi, Development Bank Special Obligation, Department of Corrections, Series C, 5.25%, 8/1/2027 | 13,890,000 | 15,731,814 | ||||||
| Mississippi, State Business Finance Commission, Gulf Opportunity Zone, Chevron U.S.A., Inc. Project: | ||||||||
| Series B, 0.06%**, 12/1/2030, GTY: Chevron Corp. | 14,960,000 | 14,960,000 | ||||||
| Series B, 144A, 0.06%**, 11/1/2035, GTY: Chevron Corp. | 11,360,000 | 11,360,000 | ||||||
| Series K, 0.06%**, 11/1/2035, GTY: Chevron Corp. | 4,000,000 | 4,000,000 | ||||||
| Warren County, MS, Gulf Opportunity Zone, International Paper Co.: | ||||||||
| Series A, 5.5%, 9/1/2031 | 5,000,000 | 5,260,200 | ||||||
| Series A, 6.5%, 9/1/2032 | 7,420,000 | 8,457,613 | ||||||
| 59,769,627 | ||||||||
| Missouri 1.0% | ||||||||
| Cape Girardeau County, MO, Industrial Development Authority, Health Care Facilities Revenue, St. Francis Medical Center, Series A, 5.75%, 6/1/2039 | 2,150,000 | 2,384,608 | ||||||
| Cape Girardeau County, MO, Industrial Development Authority, St. Francis Medical Center, Series A, 5.0%, 6/1/2033 | 16,075,000 | 17,642,955 | ||||||
| Missouri, State Health & Educational Facilities Authority Revenue, Lutheran Senior Services, Series C, 5.0%, 2/1/2042 | 8,240,000 | 8,392,687 | ||||||
| Missouri, State Health & Educational Facilities Authority, Health Facilities Revenue, Lester E Cox Medical Centers, Series A, 5.0%, 11/15/2048 | 18,580,000 | 19,678,264 | ||||||
| St. Louis, MO, Industrial Development Authority Revenue, Convention Center Hotel, Zero Coupon, 7/15/2016, INS: AMBAC | 6,895,000 | 6,216,601 | ||||||
| St. Louis, MO, State General Obligation Lease, Industrial Development Authority, Convention Center Hotel, Zero Coupon, 7/15/2015, INS: AMBAC | 4,200,000 | 3,922,674 | ||||||
| 58,237,789 | ||||||||
| Montana 0.0% | ||||||||
| Forsyth, MT, Pollution Control Revenue, PacifiCorp Project, 0.09%**, 1/1/2018, LOC: JPMorgan Chase Bank NA | 2,200,000 | 2,200,000 | ||||||
| Nebraska 0.1% | ||||||||
| Omaha, NE, Public Power District Electric Revenue: | ||||||||
| Series A, 5.5%, 2/1/2033 | 1,000,000 | 1,139,880 | ||||||
| Series A, 5.5%, 2/1/2035 | 1,000,000 | 1,139,880 | ||||||
| Series A, 5.5%, 2/1/2039 | 1,000,000 | 1,139,880 | ||||||
| 3,419,640 | ||||||||
| Nevada 0.6% | ||||||||
| Clark County, NV, Airport Revenue: | ||||||||
| Series D-2B, 0.12%**, 7/1/2040, LOC: Royal Bank of Canada | 7,500,000 | 7,500,000 | ||||||
| Series B, 5.125%, 7/1/2036 | 5,000,000 | 5,460,100 | ||||||
| Las Vegas Monorail Co., Series A, 5.5%, 7/15/2019* (PIK) | 87,286 | 0 | ||||||
| Las Vegas Monorail Co., Series B, Step-up Coupon, 3.0% to 12/31/2015, 5.5% to 7/15/2055* (PIK) | 25,545 | 0 | ||||||
| Las Vegas Valley, NV, Water District, Series B, 5.0%, 6/1/2037 | 17,720,000 | 19,605,585 | ||||||
| 32,565,685 | ||||||||
| New Hampshire 0.2% | ||||||||
| New Hampshire, Health & Education Facilities Authority Revenue, Wentworth-Douglas Hospital, Series A, 6.5%, 1/1/2031 | 10,000,000 | 11,681,500 | ||||||
| New Jersey 3.7% | ||||||||
| New Jersey, Economic Development Authority Revenue, Cigarette Tax: | ||||||||
| Prerefunded, 5.5%, 6/15/2031 | 3,000,000 | 3,161,040 | ||||||
| Prerefunded, 5.75%, 6/15/2034 | 2,455,000 | 2,593,143 | ||||||
| New Jersey, Economic Development Authority Revenue, Motor Vehicle Surplus Revenue: | ||||||||
| Series A, 5.0%, 7/1/2022, INS: NATL | 7,140,000 | 7,460,015 | ||||||
| Series A, 5.0%, 7/1/2023, INS: NATL | 8,845,000 | 9,231,615 | ||||||
| New Jersey, Garden State Preservation Trust, Open Space & Farm Land, Series 2005-A, Prerefunded, 5.8%, 11/1/2023, INS: AGMC | 5,000,000 | 5,643,250 | ||||||
| New Jersey, Industrial Development Revenue, Economic Development Authority, Harrogate, Inc., Series A, 5.875%, 12/1/2026 | 1,000,000 | 1,000,660 | ||||||
| New Jersey, State Economic Development Authority Revenue, 5.0%, 6/15/2028 | 1,050,000 | 1,154,464 | ||||||
| New Jersey, State Economic Development Authority Revenue, School Facilities Construction: | ||||||||
| Series NN, 5.0%, 3/1/2030 | 27,000,000 | 30,236,760 | ||||||
| Series NN, 5.0%, 3/1/2031 | 14,775,000 | 16,455,952 | ||||||
| New Jersey, State Transportation Trust Fund Authority, Series A, 5.75%, 6/15/2020, INS: AMBAC | 11,000,000 | 13,612,720 | ||||||
| New Jersey, State Transportation Trust Fund Authority, Transportation Program, Series AA, 5.0%, 6/15/2038 | 12,565,000 | 13,694,091 | ||||||
| New Jersey, State Transportation Trust Fund Authority, Transportation Systems: | ||||||||
| Series B, 5.25%, 6/15/2036 | 15,940,000 | 17,790,953 | ||||||
| Series B, 5.5%, 6/15/2031 | 13,200,000 | 15,321,636 | ||||||
| Series A, 6.0%, 6/15/2035 | 6,000,000 | 7,156,620 | ||||||
| Series A, 6.0%, 12/15/2038 | 11,075,000 | 13,110,474 | ||||||
| Series A, Prerefunded, 6.0%, 12/15/2038 | 5,925,000 | 7,509,997 | ||||||
| New Jersey, State Turnpike Authority Revenue: | ||||||||
| Series A, 5.0%, 1/1/2035 | 6,025,000 | 6,575,504 | ||||||
| Series A, 5.0%, 1/1/2038 | 32,530,000 | 35,334,737 | ||||||
| Series E, 5.25%, 1/1/2040 | 5,250,000 | 5,760,982 | ||||||
| Series C, 6.5%, 1/1/2016, INS: AMBAC | 785,000 | 899,390 | ||||||
| Series C, ETM, 6.5%, 1/1/2016, INS: AMBAC | 425,000 | 490,429 | ||||||
| Series C-2005, ETM, 6.5%, 1/1/2016, INS: AMBAC | 425,000 | 490,429 | ||||||
| 214,684,861 | ||||||||
| New York 6.5% | ||||||||
| New York, Higher Education Revenue, Dormitory Authority, Series B, 5.25%, 5/15/2019, INS: FGIC | 6,000,000 | 6,732,900 | ||||||
| New York, Higher Education Revenue, Dormitory Authority, City University, Series B, 6.0%, 7/1/2014, INS: FGIC | 2,415,000 | 2,474,095 | ||||||
| New York, Metropolitan Transportation Authority Revenue: | ||||||||
| Series A, 5.0%, 11/15/2038 | 12,375,000 | 13,419,821 | ||||||
| Series E, 5.0%, 11/15/2042 | 10,140,000 | 10,968,945 | ||||||
| Series H, 5.0%, 11/15/2042 | 12,250,000 | 13,251,437 | ||||||
| New York, School District General Obligation, Dormitory Authority, City University, Series A, 5.5%, 5/15/2019 | 1,500,000 | 1,772,115 | ||||||
| New York, Senior Care Revenue, Dormitory Authority, City University, Series A, 5.25%, 5/15/2021 | 2,000,000 | 2,428,620 | ||||||
| New York, State Agency General Obligation Lease, Urban Development Corp., 5.7%, 4/1/2020 | 3,600,000 | 4,284,504 | ||||||
| New York, State Dormitory Authority, Personal Income Tax Revenue: | ||||||||
| Series F, 5.0%, 2/15/2035 | 5,000,000 | 5,642,950 | ||||||
| Series A, 5.0%, 3/15/2038 (a) | 8,750,000 | 9,804,550 | ||||||
| Series C, 5.0%, 3/15/2041 | 10,000,000 | 11,025,100 | ||||||
| New York, State General Obligation Lease, Urban Development Corp., State Facilities, 5.6%, 4/1/2015 | 3,185,000 | 3,376,419 | ||||||
| New York, State General Obligation, Tobacco Settlement Financing Corp., Series A-1, 5.25%, 6/1/2022, INS: AMBAC | 12,600,000 | 12,650,904 | ||||||
| New York, State Housing Finance Agency, 100 Maiden Lane Properties, Series A, 0.12%**, 5/15/2037, LIQ: Fannie Mae | 1,775,000 | 1,775,000 | ||||||
| New York, State Liberty Development Corp. Revenue, World Trade Center Port Authority Construction, 5.25%, 12/15/2043 | 40,000,000 | 44,986,400 | ||||||
| New York, State Thruway Authority Revenue, Series I, 5.0%, 1/1/2037 | 9,370,000 | 10,305,501 | ||||||
| New York, State Thruway Authority, Second Generation Highway & Bridge Trust Funding Authority: | ||||||||
| Series A, 5.0%, 4/1/2031 | 5,250,000 | 6,013,245 | ||||||
| Series A, 5.0%, 4/1/2032 | 4,000,000 | 4,561,600 | ||||||
| New York, Water & Sewer Revenue, Environmental Facilities Corp., State Water Pollution Control, Series E, 6.875%, 6/15/2014 | 1,260,000 | 1,266,968 | ||||||
| New York City, NY, Municipal Water Finance Authority, Water & Sewer Revenue: | ||||||||
| Series DD-1, 0.08%**, 6/15/2043, SPA: TD Bank NA | 5,325,000 | 5,325,000 | ||||||
| Series DD, 5.0%, 6/15/2035 | 32,000,000 | 36,308,800 | ||||||
| Series FF-2, 5.0%, 6/15/2040 | 2,270,000 | 2,483,607 | ||||||
| New York City, NY, Municipal Water Finance Authority, Water & Sewer Revenue, Second General Resolution: | ||||||||
| Series B, 0.07%**, 6/15/2032, SPA: California State Teacher's Retirement System | 5,760,000 | 5,760,000 | ||||||
| Series EE, 5.375%, 6/15/2043 | 11,250,000 | 12,781,350 | ||||||
| New York City, NY, Transitional Finance Authority Revenue, Future Tax Secured: | ||||||||
| Series A-1, 144A, 0.11%**, 11/15/2028, SPA: TD Bank NA | 16,100,000 | 16,100,000 | ||||||
| Series D-1, 5.0%, 11/1/2038 | 10,000,000 | 11,150,700 | ||||||
| New York, NY, General Obligation: | ||||||||
| Series D-1, 5.0%, 10/1/2033 | 25,000,000 | 28,316,750 | ||||||
| Series D-1, 5.0%, 10/1/2034 | 5,000,000 | 5,645,750 | ||||||
| Series F-1, 5.0%, 3/1/2037 | 31,475,000 | 35,525,203 | ||||||
| Series I-1, 5.375%, 4/1/2036 | 7,000,000 | 8,250,130 | ||||||
| New York, NY, Triborough Bridge & Tunnel Authority Revenues, Series C, 5.0%, 11/15/2038 | 32,375,000 | 36,354,859 | ||||||
| Troy, NY, Capital Resource Corp. Revenue, Rensselaer Polytechnic Institute, Series A, 5.125%, 9/1/2040 | 2,000,000 | 2,168,420 | ||||||
| 372,911,643 | ||||||||
| North Carolina 1.7% | ||||||||
| Charlotte, NC, Airport Revenue, Series A, 5.5%, 7/1/2034 | 1,500,000 | 1,727,850 | ||||||
| Charlotte, NC, Core City General Obligation, 5.5%, 8/1/2018 | 4,165,000 | 4,242,677 | ||||||
| Charlotte-Mecklenberg, NC, Hospital Authority, Health Care System Revenue, Series A, 5.0%, 1/15/2039 | 28,015,000 | 30,832,469 | ||||||
| North Carolina, Electric Revenue, Eastern Municipal Power Agency: | ||||||||
| 6.0%, 1/1/2018, INS: AMBAC | 8,775,000 | 10,593,356 | ||||||
| Series B, 6.0%, 1/1/2022, INS: NATL | 18,775,000 | 23,714,890 | ||||||
| North Carolina, Lower Cape Fear Water & Sewer Authority, Special Facility Revenue, Bladen Bluffs Project, Recovery Zone Facility, 0.15%**, 12/1/2034, LOC: Rabobank International | 4,020,000 | 4,020,000 | ||||||
| North Carolina, Medical Care Commission, Health Care Facilities Revenue, University Health System, Series D, 6.25%, 12/1/2033 | 17,000,000 | 20,217,590 | ||||||
| North Carolina, Municipal Power Agency, No. 1 Catawba Electric Revenue, Series A, 5.0%, 1/1/2030 | 5,410,000 | 5,969,610 | ||||||
| 101,318,442 | ||||||||
| North Dakota 0.2% | ||||||||
| Fargo, ND, Sanford Health Systems Revenue, 6.25%, 11/1/2031 | 9,260,000 | 11,371,373 | ||||||
| Ohio 1.8% | ||||||||
| Avon, OH, School District General Obligation, 6.5%, 12/1/2015, INS: AMBAC | 940,000 | 1,026,179 | ||||||
| Beavercreek, OH, School District General Obligation, Local School District, 6.6%, 12/1/2015, INS: FGIC, NATL | 1,190,000 | 1,291,341 | ||||||
| Cleveland, OH, Airport Systems Revenue, Series A, 5.0%, 1/1/2030 | 1,000,000 | 1,099,840 | ||||||
| Cleveland, OH, Sales & Special Tax Revenue, Urban Renewal Tax Increment, Rock & Roll Hall of Fame and Museum Project, 6.75%, 3/15/2018 | 760,000 | 761,102 | ||||||
| Cuyahoga County, OH, County General Obligation, 5.65%, 5/15/2018 | 500,000 | 564,810 | ||||||
| Fayette County, OH, School District General Obligation, Rattlesnake Improvement Area Project, 5.9%, 12/1/2013 | 5,000 | 5,000 | ||||||
| Finneytown, OH, Other General Obligation, Local School District, 6.2%, 12/1/2017, INS: FGIC, NATL | 320,000 | 360,294 | ||||||
| Franklin County, OH, School District General Obligation, 6.5%, 12/1/2013 | 145,000 | 149,121 | ||||||
| Hancock County, OH, Hospital Revenue, Blanchard Valley Regional Health Center, 6.5%, 12/1/2030 | 14,425,000 | 17,260,522 | ||||||
| Kent, OH, State University Revenues, General Receipts, Series A, 5.0%, 5/1/2037 | 8,440,000 | 9,330,758 | ||||||
| Liberty Benton, OH, School District General Obligation, Zero Coupon, 12/1/2014, INS: AMBAC | 570,000 | 557,169 | ||||||
| Lucas County, OH, Hospital Revenue, Promedica Healthcare, Series A, 6.5%, 11/15/2037 | 6,000,000 | 7,404,000 | ||||||
| Ohio, Akron Bath Copley Joint Township Hospital District, Children's Hospital Medical Center of Akron, 5.0%, 11/15/2038 | 15,645,000 | 16,952,609 | ||||||
| Ohio, American Municipal Power, Inc. Revenue, Fremont Energy Center Project, Series B, 5.0%, 2/15/2037 | 13,090,000 | 14,259,461 | ||||||
| Ohio, Higher Education Revenue, Case Western Reserve University: | ||||||||
| 6.0%, 10/1/2014 | 1,000,000 | 1,072,010 | ||||||
| Series B, 6.5%, 10/1/2020 | 2,250,000 | 2,706,188 | ||||||
| Ohio, School District General Obligation, 6.0%, 12/1/2019, INS: AMBAC | 475,000 | 550,050 | ||||||
| Ohio, State Higher Educational Facility Commission Revenue, Summa Health Systems Project: | ||||||||
| Series 2010, 5.25%, 11/15/2035, INS: AGMC | 7,500,000 | 8,052,450 | ||||||
| Series 2010, 5.5%, 11/15/2030, INS: AGMC | 4,000,000 | 4,405,720 | ||||||
| Ohio, State Hospital Facility Revenue, Cleveland Clinic Health System, Series B, 5.5%, 1/1/2039 | 13,600,000 | 15,146,864 | ||||||
| Wayne, OH, School District General Obligation, 6.6%, 12/1/2016, INS: AMBAC | 175,000 | 194,983 | ||||||
| Wooster, OH, School District General Obligation, Zero Coupon, 12/1/2013, INS: AGMC | 930,000 | 928,084 | ||||||
| 104,078,555 | ||||||||
| Oklahoma 0.6% | ||||||||
| Oklahoma, State Municipal Power Authority, Supply System Revenue, Series A, 6.0%, 1/1/2038 | 8,625,000 | 9,962,824 | ||||||
| Oklahoma, Water & Sewer Revenue, McGee Creek Authority, 6.0%, 1/1/2023, INS: NATL | 23,125,000 | 26,527,843 | ||||||
| 36,490,667 | ||||||||
| Oregon 0.4% | ||||||||
| Port of Portland, OR, Special Obligation Revenue, Horizon Air Industries, Inc. Project, AMT, 0.11%**, 6/15/2027, LOC: Bank of America NA | 10,300,000 | 10,300,000 | ||||||
| Yamhill County, OR, Hospital Authority, Friendsview Manor, 0.13%**, 12/1/2034, LOC: U.S. Bank NA | 11,500,000 | 11,500,000 | ||||||
| 21,800,000 | ||||||||
| Pennsylvania 2.3% | ||||||||
| Allegheny County, PA, Airport Revenue, Pittsburgh International Airport, Series A-1, AMT, 5.75%, 1/1/2014, INS: NATL | 10,500,000 | 10,822,875 | ||||||
| Allegheny County, PA, Hospital Development Authority Revenue, University of Pittsburgh Medical, 5.625%, 8/15/2039 | 11,800,000 | 13,202,430 | ||||||
| Beaver County, PA, Industrial Development Authority, First Energy General Corp., Series C, AMT, 0.11%**, 6/1/2028, GTY: FirstEnergy Solutions, LOC: Bank of Nova Scotia | 5,000,000 | 5,000,000 | ||||||
| Berks County, PA, Hospital & Healthcare Revenue, Municipal Authority, Reading Hospital & Medical Center Project, 5.7%, 10/1/2014, INS: NATL | 370,000 | 380,756 | ||||||
| Delaware County, PA, Industrial Development Authority, Solid Waste System Revenue, Scott Paper Co., Series E, 0.13%**, 12/1/2018, GTY: Kimberly-Clark Corp. | 3,300,000 | 3,300,000 | ||||||
| Exeter Township, PA, School District General Obligation, Zero Coupon, 5/15/2017, INS: FGIC, NATL | 3,700,000 | 3,500,459 | ||||||
| Montgomery County, PA, Redevelopment Authority, Forge Gate Apartments Project, Series A, 0.15%**, 8/15/2031, LIQ: Fannie Mae | 1,510,000 | 1,510,000 | ||||||
| Pennsylvania, Central Bradford Progress Authority Revenue, Guthrie Healthcare System, 5.375%, 12/1/2041 | 12,550,000 | 13,950,329 | ||||||
| Pennsylvania, Commonwealth Financing Authority Revenue: | ||||||||
| Series B, 5.0%, 6/1/2036 | 5,475,000 | 5,987,131 | ||||||
| Series B, 5.0%, 6/1/2042 | 13,975,000 | 15,204,381 | ||||||
| Pennsylvania, Sales & Special Tax Revenue, Convention Center Authority, Series A, ETM, 6.0%, 9/1/2019, INS: FGIC | 2,200,000 | 2,749,868 | ||||||
| Pennsylvania, State Turnpike Commission Revenue, Series B, 5.75%, 6/1/2039 | 32,000,000 | 35,637,440 | ||||||
| Pennsylvania, State Turnpike Commission Revenue, Motor License Fund, Series A, 6.0%, 12/1/2036 | 3,000,000 | 3,572,700 | ||||||
| Pennsylvania, Water & Sewer Revenue, 5.25%, 11/1/2014, INS: NATL | 780,000 | 811,309 | ||||||
| Philadelphia, PA, Airport Revenue, Series A, 5.0%, 6/15/2035 | 7,080,000 | 7,548,484 | ||||||
| Philadelphia, PA, Water & Wastewater Revenue: | ||||||||
| Series A, 5.25%, 1/1/2032 | 3,000,000 | 3,295,200 | ||||||
| Series A, 5.25%, 1/1/2036 | 2,500,000 | 2,726,025 | ||||||
| Pittsburgh, PA, Core City General Obligation, Series A, 5.5%, 9/1/2014, INS: AMBAC | 555,000 | 568,764 | ||||||
| Pittsburgh, PA, Water & Sewer System, ETM, 7.25%, 9/1/2014, INS: FGIC | 40,000 | 41,908 | ||||||
| Westmoreland County, PA, Project Revenue, Zero Coupon, 8/15/2017, INS: NATL | 6,230,000 | 5,826,608 | ||||||
| 135,636,667 | ||||||||
| Puerto Rico 0.9% | ||||||||
| Puerto Rico, Sales Tax Financing Corp., Sales Tax Revenue: | ||||||||
| Series A, 5.375%, 8/1/2039 | 13,650,000 | 14,342,464 | ||||||
| Series A, 6.5%, 8/1/2044 | 35,000,000 | 39,788,700 | ||||||
| 54,131,164 | ||||||||
| Rhode Island 0.8% | ||||||||
| Rhode Island, Health & Educational Building Corp., Higher Education Facility Revenue, Brown University, Series A, 5.0%, 9/1/2039 (a) | 13,000,000 | 14,428,050 | ||||||
| Rhode Island, Health & Educational Building Corp., Higher Education Facility Revenue, University of Rhode Island, Series A, 6.25%, 9/15/2034 | 10,000,000 | 11,727,300 | ||||||
| Rhode Island, Project Revenue, Convention Center Authority, Series B, 5.25%, 5/15/2015, INS: NATL | 9,480,000 | 9,786,962 | ||||||
| Rhode Island, Tobacco Settlement Financing Corp., Series A, 6.125%, 6/1/2032 | 7,750,000 | 7,826,725 | ||||||
| 43,769,037 | ||||||||
| South Carolina 0.8% | ||||||||
| Greenwood County, SC, Hospital Revenue, Self Regional Healthcare, 5.375%, 10/1/2039 | 7,500,000 | 8,227,500 | ||||||
| South Carolina, Jobs Economic Development Authority, Hospital Facilities Revenue, Palmetto Health Alliance: | ||||||||
| 5.75%, 8/1/2039 | 1,910,000 | 2,106,864 | ||||||
| Series C, Prerefunded, 7.0%, 8/1/2030 | 6,885,000 | 6,962,663 | ||||||
| South Carolina, Piedmont Municipal Power Agency, Electric Revenue: | ||||||||
| Series A, ETM, 6.5%, 1/1/2016, INS: FGIC | 430,000 | 494,754 | ||||||
| 6.75%, 1/1/2019, INS: FGIC, NATL | 2,065,000 | 2,604,997 | ||||||
| ETM, 6.75%, 1/1/2019, INS: FGIC | 1,460,000 | 1,885,794 | ||||||
| South Carolina, State Ports Authority Revenue, 5.25%, 7/1/2040 | 10,195,000 | 11,214,806 | ||||||
| South Carolina, State Public Service Authority Revenue, Santee Cooper: | ||||||||
| Series E, 5.0%, 1/1/2040 | 10,000,000 | 11,001,400 | ||||||
| Series A, 5.375%, 1/1/2028 | 2,500,000 | 2,927,025 | ||||||
| 47,425,803 | ||||||||
| South Dakota 0.1% | ||||||||
| South Dakota, State Health & Educational Facilities Authority Revenue, Sanford Health, 5.5%, 11/1/2040 | 3,000,000 | 3,304,920 | ||||||
| Tennessee 0.8% | ||||||||
| Jackson, TN, Hospital Revenue, Jackson-Madison Project: | ||||||||
| 5.5%, 4/1/2033 | 3,000,000 | 3,331,410 | ||||||
| 5.625%, 4/1/2038 | 4,550,000 | 5,060,738 | ||||||
| 5.75%, 4/1/2041 | 8,675,000 | 9,713,571 | ||||||
| Knox County, TN, Hospital & Healthcare Revenue, Sanders Alliance, 5.75%, 1/1/2014, INS: NATL | 2,000,000 | 2,062,700 | ||||||
| Shelby County, TN, General Obligation: | ||||||||
| Zero Coupon, 8/1/2014 | 4,920,000 | 4,900,123 | ||||||
| ETM, Zero Coupon, 8/1/2014 | 45,000 | 44,841 | ||||||
| Sullivan County, TN, Health, Educational & Housing Facilities Board, Hospital Revenue, Wellmont Health Systems Project, Series C, 5.25%, 9/1/2036 | 10,000,000 | 10,581,500 | ||||||
| Tennessee, Energy Acquisition Corp., Gas Revenue: | ||||||||
| Series A, 5.25%, 9/1/2019 | 7,000,000 | 8,093,610 | ||||||
| Series A, 5.25%, 9/1/2021 | 2,000,000 | 2,340,320 | ||||||
| 46,128,813 | ||||||||
| Texas 10.5% | ||||||||
| Austin, TX, Austin-Bergstrom Landhost Enterprises, Inc., Airport Hotel Project, Series A, 3.375%, 4/1/2027 (b) | 21,335,000 | 10,223,732 | ||||||
| Austin, TX, Electric Utility Systems Revenue, 5.0%, 11/15/2037 | 7,080,000 | 7,943,689 | ||||||
| Cypress and Fairbanks, TX, School District General Obligation, Cypress-Fairbanks Texas Independent School District, Series A, Zero Coupon, 2/15/2014 | 6,000,000 | 5,987,340 | ||||||
| Dallas, TX, Waterworks & Sewer Systems Revenue, 5.0%, 10/1/2037 | 4,600,000 | 5,110,968 | ||||||
| Harris County, TX, County General Obligation, Zero Coupon, 10/1/2017, INS: NATL | 3,910,000 | 3,749,455 | ||||||
| Harris County, TX, Health Facilities Development Corp., Hospital Revenue, Memorial Hermann Healthcare System, Series B, Prerefunded, 7.25%, 12/1/2035 | 5,000,000 | 6,638,000 | ||||||
| Harris County, TX, Port Houston Authority, Series D-1, 5.0%, 10/1/2035 | 18,290,000 | 21,520,014 | ||||||
| Houston, TX, Airport Systems Revenue: | ||||||||
| Series B, 5.0%, 7/1/2027, INS: FGIC, NATL | 21,030,000 | 23,442,562 | ||||||
| Series B, 5.0%, 7/1/2032 | 3,510,000 | 3,929,585 | ||||||
| Series A, 5.5%, 7/1/2039 | 10,000,000 | 11,454,400 | ||||||
| Houston, TX, Higher Education Finance Corp. Revenue, Rice University Project, Series A, 5.0%, 5/15/2040 | 11,185,000 | 12,494,204 | ||||||
| Houston, TX, Utility Systems Revenue, First Lien: | ||||||||
| Series D, 5.0%, 11/15/2036 | 7,000,000 | 7,825,160 | ||||||
| Series B, 5.0%, 11/15/2038 | 3,370,000 | 3,804,663 | ||||||
| North Texas, Tollway Authority Revenue: | ||||||||
| Series C, 5.25%, 1/1/2044 | 20,000,000 | 21,306,200 | ||||||
| First Tier, Series A, 5.625%, 1/1/2033 | 6,500,000 | 7,351,760 | ||||||
| Second Tier, Series F, 5.75%, 1/1/2033 | 12,210,000 | 13,536,494 | ||||||
| Second Tier, Series F, 5.75%, 1/1/2038 | 16,500,000 | 18,133,830 | ||||||
| First Tier, 6.0%, 1/1/2043 | 30,000,000 | 34,047,600 | ||||||
| North Texas, Tollway Authority Revenue, Special Project Systems: | ||||||||
| Series D, 5.0%, 9/1/2032 | 8,000,000 | 9,120,480 | ||||||
| Series A, 6.0%, 9/1/2041 | 6,675,000 | 8,023,083 | ||||||
| Red River, TX, Health Facilities Development Corp., Retirement Facility Revenue, Sears Methodist Retirement System, Inc., Obligation Group Project, Series A, 5.15%, 11/15/2027 | 2,274,000 | 2,145,474 | ||||||
| Tarrant County, TX, Cultural Education Facilities Finance Corp., Hospital Revenue, Scott & White Healthcare: | ||||||||
| 5.0%, 8/15/2036 | 4,585,000 | 5,044,555 | ||||||
| 5.0%, 8/15/2043 | 4,900,000 | 5,343,499 | ||||||
| 5.625%, 8/15/2035 | 10,000,000 | 11,448,600 | ||||||
| Tarrant County, TX, Cultural Education Facilities Finance Corp., State Health Resources, 5.0%, 11/15/2040 | 19,325,000 | 21,126,283 | ||||||
| Texas, Dallas/Fort Worth International Airport Revenue: | ||||||||
| Series B, 5.0%, 11/1/2035 | 11,470,000 | 12,425,222 | ||||||
| Series D, 5.0%, 11/1/2035 | 24,425,000 | 26,459,114 | ||||||
| Series D, AMT, 5.0%, 11/1/2038 | 19,355,000 | 20,101,716 | ||||||
| Series B, 5.0%, 11/1/2044 (c) | 22,760,000 | 24,355,248 | ||||||
| Series A, 5.25%, 11/1/2038 | 20,000,000 | 22,110,200 | ||||||
| Series A, AMT, 5.5%, 11/1/2019, INS: NATL | 20,000,000 | 20,414,600 | ||||||
| Texas, Electric Revenue: | ||||||||
| Zero Coupon, 9/1/2017, INS: NATL | 5,880,000 | 5,562,950 | ||||||
| ETM, Zero Coupon, 9/1/2017, INS: NATL | 120,000 | 115,628 | ||||||
| Texas, Electric Revenue, Municipal Power Agency, Zero Coupon, 9/1/2016, INS: NATL | 18,300,000 | 17,724,648 | ||||||
| Texas, Grapevine-Colleyville Independent School District Building: | ||||||||
| 5.0%, 8/15/2034 | 6,080,000 | 6,998,992 | ||||||
| 5.0%, 8/15/2035 | 6,130,000 | 7,042,083 | ||||||
| 5.0%, 8/15/2036 | 3,350,000 | 3,848,446 | ||||||
| Texas, Lower Colorado River Authority Revenue, Series A, 5.0%, 5/15/2036 | 19,500,000 | 21,378,240 | ||||||
| Texas, Lower Colorado River Authority, Transmission Contract Revenue, LCRA Transmission Services, 5.0%, 5/15/2040 | 20,000,000 | 21,536,800 | ||||||
| Texas, Municipal Gas Acquisition & Supply Corp. I, Gas Supply Revenue: | ||||||||
| Series B, 0.888%***, 12/15/2026 | 19,800,000 | 17,036,118 | ||||||
| Series D, 6.25%, 12/15/2026 | 20,000,000 | 25,331,000 | ||||||
| Texas, Municipal Power Agency, ETM, Zero Coupon, 9/1/2016, INS: NATL | 375,000 | 366,758 | ||||||
| Texas, SA Energy Acquisition Public Facility Corp., Gas Supply Revenue: | ||||||||
| 5.5%, 8/1/2021 | 5,575,000 | 6,563,113 | ||||||
| 5.5%, 8/1/2025 | 2,750,000 | 3,250,390 | ||||||
| Texas, Southwest Higher Education Authority, Inc., Southern Methodist University Project, 5.0%, 10/1/2035 | 2,400,000 | 2,723,064 | ||||||
| Texas, State Municipal Gas Acquisition & Supply Corp., III Gas Supply Revenue: | ||||||||
| 5.0%, 12/15/2030 | 2,250,000 | 2,393,055 | ||||||
| 5.0%, 12/15/2031 | 4,500,000 | 4,775,220 | ||||||
| 5.0%, 12/15/2032 | 12,000,000 | 12,704,880 | ||||||
| Texas, State Technical University Revenue, Series A, 5.0%, 8/15/2037 | 5,400,000 | 6,044,652 | ||||||
| Texas, State Transportation Commission, Turnpike Systems Revenue, Series A, 5.0%, 8/15/2041 | 23,425,000 | 24,998,926 | ||||||
| Texas, State Veterans Bonds, Series A, 0.11%**, 6/1/2043, LOC: Sumitomo Mitsui Banking | 7,000,000 | 7,000,000 | ||||||
| 604,012,693 | ||||||||
| Utah 0.0% | ||||||||
| Provo, UT, Electric Revenue, Series A, ETM, 10.375%, 9/15/2015, INS: AMBAC | 580,000 | 646,097 | ||||||
| Salt Lake City, UT, Core City General Obligation, 5.75%, 6/15/2014 | 25,000 | 25,115 | ||||||
| 671,212 | ||||||||
| Virginia 0.4% | ||||||||
| Roanoke, VA, Hospital & Healthcare Revenue, Industrial Development Authority, Roanoke Memorial Hospital, Series B, ETM, 6.125%, 7/1/2017, INS: NATL | 5,500,000 | 6,267,195 | ||||||
| Virginia Beach, VA, Hospital & Healthcare Revenue, Development Authority Hospital Facility First Mortgage, 5.125%, 2/15/2018, INS: AMBAC | 3,000,000 | 3,334,770 | ||||||
| Washington County, VA, Industrial Development Authority, Hospital Facility Revenue, Mountain States Health Alliance, Series C, 7.75%, 7/1/2038 | 7,760,000 | 9,434,530 | ||||||
| Winchester, VA, Hospital & Healthcare Revenue, Industrial Development Authority, 5.5%, 1/1/2015, INS: AMBAC | 2,490,000 | 2,596,697 | ||||||
| 21,633,192 | ||||||||
| Washington 2.9% | ||||||||
| Chelan County, WA, Electric Revenue, Public Utilities, Columbia River Rock, Zero Coupon, 6/1/2014, INS: NATL | 12,685,000 | 12,614,471 | ||||||
| Clark County, WA, School District General Obligation, Zero Coupon, 12/1/2017, INS: FGIC, NATL | 6,725,000 | 6,365,818 | ||||||
| Port of Seattle, WA, Airport Revenue: | ||||||||
| Series A, 5.0%, 8/1/2031 | 2,000,000 | 2,281,400 | ||||||
| Series A, 5.0%, 8/1/2032 | 2,500,000 | 2,834,775 | ||||||
| Series B, AMT, 6.0%, 2/1/2014, INS: NATL | 4,000,000 | 4,150,400 | ||||||
| Tacoma, WA, Electric System Revenue, Series A, 5.0%, 1/1/2038 (c) | 8,280,000 | 9,263,830 | ||||||
| Washington, State Economic Development Finance Authority, Solid Waste Disposal Revenue, Waste Management, Inc. Project, Series D, AMT, 0.16%**, 7/1/2030, LOC: JPMorgan Chase Bank NA | 20,000,000 | 20,000,000 | ||||||
| Washington, State General Obligation: | ||||||||
| Series 5, Zero Coupon, 1/1/2017, INS: FGIC, NATL | 4,535,000 | 4,375,005 | ||||||
| Series B, 5.0%, 2/1/2033 | 5,000,000 | 5,652,750 | ||||||
| Series 2011A, 5.0%, 8/1/2033 | 20,000,000 | 23,332,800 | ||||||
| Series A, 5.0%, 8/1/2035 | 12,190,000 | 13,769,458 | ||||||
| Washington, State Health Care Facilities Authority Revenue, Series C, 5.375%, 8/15/2028, INS: Radian | 5,240,000 | 5,514,995 | ||||||
| Washington, State Health Care Facilities Authority Revenue, Virginia Mason Medical Center, Series A, 6.125%, 8/15/2037 | 7,035,000 | 7,637,689 | ||||||
| Washington, State Health Care Facilities Authority, Swedish Health Services, Series A, Prerefunded, 6.75%, 11/15/2041 | 12,175,000 | 16,743,669 | ||||||
| Washington, State Higher Education Facilities Authority Revenue, Seattle University Project, Series A, 0.16%**, 5/1/2028, LOC: U.S. Bank NA | 7,780,000 | 7,780,000 | ||||||
| Washington, State Motor Vehicle Tax-Senior 520, Corridor Toll Program: | ||||||||
| Series C, 5.0%, 6/1/2032 | 7,725,000 | 8,807,813 | ||||||
| Series C, 5.0%, 6/1/2033 | 6,000,000 | 6,813,600 | ||||||
| Series C, 5.0%, 6/1/2041 | 11,000,000 | 12,252,240 | ||||||
| 170,190,713 | ||||||||
| West Virginia 0.2% | ||||||||
| Cabell County, WV, University Facilities, Provident Group Marshall Properties, Series A, 0.19%**, 7/1/2039, LOC: Bank of America NA | 9,995,000 | 9,995,000 | ||||||
| Wisconsin 1.8% | ||||||||
| Milwaukee County, WI, Airport Revenue, Series A, 5.0%, 12/1/2034 | 7,000,000 | 7,515,200 | ||||||
| Milwaukee, WI, Redevelopment Authority Lease Revenue, University of Wisconsin Kenilworth Project, 0.12%**, 9/1/2040, LOC: U.S. Bank NA | 4,230,000 | 4,230,000 | ||||||
| Wisconsin, Hospital & Healthcare Revenue, Health & Education Facilities Authority: | ||||||||
| Series B, ETM, 6.25%, 1/1/2022, INS: AMBAC | 3,245,000 | 3,991,090 | ||||||
| Series C, ETM, 6.25%, 1/1/2022, INS: AMBAC | 5,675,000 | 7,016,343 | ||||||
| Wisconsin, Hospital & Healthcare Revenue, Health & Educational Facilities Authority, Aurora Health Care, Inc., 6.875%, 4/15/2030 | 14,000,000 | 14,039,480 | ||||||
| Wisconsin, State Health & Educational Facilities Authority Revenue, Agnesian Healthcare, Inc., Series B, 5.0%, 7/1/2036 | 8,500,000 | 9,343,795 | ||||||
| Wisconsin, State Health & Educational Facilities Authority Revenue, Froedtert Health, Inc., Series A, 5.0%, 4/1/2042 | 11,040,000 | 11,932,474 | ||||||
| Wisconsin, State Health & Educational Facilities Authority Revenue, Ministry Health Care, Inc., Series C, 5.0%, 8/15/2032 | 6,940,000 | 7,601,174 | ||||||
| Wisconsin, State Health & Educational Facilities Authority Revenue, Oakwood Village East Lutheran Homes, Inc., Series B, 0.11%**, 8/15/2030, LOC: BMO Harris Bank NA | 4,450,000 | 4,450,000 | ||||||
| Wisconsin, State Health & Educational Facilities Authority Revenue, Prohealth Care, Inc. Obligation Group, 6.625%, 2/15/2039 | 7,335,000 | 8,467,670 | ||||||
| Wisconsin, State Health & Educational Facilities Authority Revenue, SSM Health Care Corp., Series A, 5.25%, 6/1/2034 | 2,000,000 | 2,195,460 | ||||||
| Wisconsin, State Health & Educational Facilities Authority Revenue, Thedacare, Inc., Series A, 5.5%, 12/15/2038 | 13,235,000 | 14,474,590 | ||||||
| Wisconsin, University Hospitals & Clinics Authority, Series A, 5.0%, 4/1/2038 | 7,295,000 | 8,004,220 | ||||||
| 103,261,496 | ||||||||
Total Municipal Bonds and Notes (Cost $5,016,035,681) | 5,482,262,444 | |||||||
| Municipal Inverse Floating Rate Notes (d) 11.2% | ||||||||
| California 2.3% | ||||||||
| California, San Francisco Bay Area Toll Authority, Toll Bridge Revenue, Series F, 5.0%, 4/1/2031 (e) | 10,700,000 | 12,231,816 | ||||||
| Trust: California, Bay Area Toll Authority, Toll Bridge Revenue, Series 1962-4, 144A, 13.648%, 4/1/2014, Leverage Factor at purchase date: 3 to 1 | ||||||||
| California, State Department of Water Resources Revenue, Central Valley Project, Series AE, 5.0%, 12/1/2023 (e) | 5,236,056 | 6,128,645 | ||||||
| California, State Department of Water Resources Revenue, Central Valley Project, Series AE, 5.0%, 12/1/2024 (e) | 3,742,268 | 4,380,210 | ||||||
| California, State Department of Water Resources Revenue, Central Valley Project, Series AE, 5.0%, 12/1/2025 (e) | 3,118,557 | 3,650,175 | ||||||
| Trust: California, State Department of Water Resources Revenue, Series 2705, 144A, 12.853%, 12/1/2023, Leverage Factor at purchase date: 3 to 1 | ||||||||
| California, University of California Revenues, Series O, 5.25%, 5/15/2039 (e) | 15,620,000 | 17,923,325 | ||||||
| Trust: California, University of California Revenues, Series 3368-2, 144A, 18.93%, 11/15/2016, Leverage Factor at purchase date: 4 to 1 | ||||||||
| Los Angeles, CA, Waste Water System Revenue, Series A, 5.375%, 6/1/2039 (e) | 30,000,000 | 34,446,600 | ||||||
| Trust: Los Angeles, CA, Series 3371-2, 144A, 19.430%, 12/1/2016, Leverage Factor at purchase date: 4 to 1 | ||||||||
| Los Angeles, CA, Community College District, Election of 2008, Series A, 6.0%, 8/1/2033 (e) | 30,000,000 | 36,762,300 | ||||||
| Trust: Los Angeles, CA, Community College District, Series R-11728, 144A, 27.48%, 8/1/2033, Leverage Factor at purchase date: 5 to 1 | ||||||||
| San Francisco, CA, Bay Area Rapid Transportation District, Election of 2004, Series B, 5.0%, 8/1/2032 (e) | 14,997,001 | 16,853,101 | ||||||
| Trust: San Francisco, CA, Bay Area Rapid Transportation District, Series 3161, 144A, 13.597%, 8/1/2015, Leverage Factor at purchase date: 3 to 1 | ||||||||
| 132,376,172 | ||||||||
| District of Columbia 0.5% | ||||||||
| District of Columbia, Income Tax Revenue, Series A, 5.5%, 12/1/2030 (e) | 22,000,000 | 26,589,420 | ||||||
| Trust: District of Columbia, Series 3369, 144A, 19.93%, 6/1/2017, Leverage Factor at purchase date: 4 to 1 | ||||||||
| Florida 1.2% | ||||||||
| Florida, State Turnpike Authority Revenue, Department of Transportation, Series A, 5.0%, 7/1/2021 (e) | 30,130,000 | 34,788,682 | ||||||
| Trust: Florida, State Turnpike Authority Revenue, Series 2514, 144A, 43.331%, 7/1/2015, Leverage Factor at purchase date: 10 to 1 | ||||||||
| Miami-Dade County, FL, Transit Sales Surtax Revenue, 5.0%, 7/1/2023, INS: AGMC (e) | 3,740,000 | 4,198,435 | ||||||
| Miami-Dade County, FL, Transit Sales Surtax Revenue, 5.0%, 7/1/2024, INS: AGMC (e) | 3,915,000 | 4,394,886 | ||||||
| Miami-Dade County, FL, Transit Sales Surtax Revenue, 5.0%, 7/1/2025, INS: AGMC (e) | 4,122,500 | 4,627,820 | ||||||
| Miami-Dade County, FL, Transit Sales Surtax Revenue, 5.0%, 7/1/2026, INS: AGMC (e) | 4,317,500 | 4,846,723 | ||||||
| Miami-Dade County, FL, Transit Sales Surtax Revenue, 5.0%, 7/1/2032, INS: AGMC (e) | 16,470,000 | 18,488,829 | ||||||
| Trust: Miami-Dade County, FL, Series 2008-1160, 144A, 9.331%, 1/1/2016, Leverage Factor at purchase date: 2 to 1 | ||||||||
| 71,345,375 | ||||||||
| Louisiana 0.2% | ||||||||
| Louisiana, State Gas & Fuels Tax Revenue, Series B, 5.0%, 5/1/2033 (e) | 3,023,487 | 3,412,540 | ||||||
| Louisiana, State Gas & Fuels Tax Revenue, Series B, 5.0%, 5/1/2034 (e) | 3,300,848 | 3,725,592 | ||||||
| Louisiana, State Gas & Fuels Tax Revenue, Series B, 5.0%, 5/1/2035 (e) | 3,663,166 | 4,134,533 | ||||||
| Trust: Louisiana, State Gas & Fuels Tax Revenue, Series 3806, 144A, 9.328%, 5/1/2018, Leverage Factor at purchase date: 2 to 1 | ||||||||
| 11,272,665 | ||||||||
| Massachusetts 1.5% | ||||||||
| Massachusetts, State Development Finance Agency Revenue, Harvard University, Series B-2, 5.25%, 2/1/2034 (e) | 20,000,000 | 23,502,200 | ||||||
| Trust: Massachusetts, State Development Finance Agency Revenue, Harvard University, Series 4691, 144A, 10.05%, 1/17/2019, Leverage Factor at purchase date: 2 to 1 | ||||||||
| Massachusetts, State General Obligation, Series A, 5.0%, 8/1/2027 (e) | 7,825,000 | 8,907,040 | ||||||
| Massachusetts, State General Obligation, Series A, 5.0%, 8/1/2033 (e) | 3,000,000 | 3,414,839 | ||||||
| Massachusetts, State General Obligation, Series A, 5.0%, 8/1/2038 (e) | 2,750,000 | 3,130,270 | ||||||
| Trust: Massachusetts, State General Obligation, Series 2008-1203, 144A, 15.025%, 8/1/2038, Leverage Factor at purchase date: 3 to 1 | ||||||||
| Massachusetts, State General Obligation, Series C, 5.0%, 8/1/2026, INS: AGMC (e) | 20,000,000 | 22,734,900 | ||||||
| Trust: Massachusetts, State General Obligation, Series 2022-1, 144A, 43.25%, 8/1/2015, Leverage Factor at purchase date: 10 to 1 | ||||||||
| Massachusetts, State General Obligation, Series C, 5.0%, 8/1/2027, INS: AGMC (e) | 20,000,000 | 22,734,900 | ||||||
| Trust: Massachusetts, State General Obligation, Series 2022-2, 144A, 43.25%, 8/1/2015, Leverage Factor at purchase date: 10 to 1 | ||||||||
| 84,424,149 | ||||||||
| Nevada 1.2% | ||||||||
| Clark County, NV, General Obligation, 5.0%, 6/1/2028 (e) | 6,252,645 | 7,032,045 | ||||||
| Clark County, NV, General Obligation, 5.0%, 6/1/2029 (e) | 6,565,277 | 7,383,647 | ||||||
| Clark County, NV, General Obligation, 5.0%, 6/1/2030 (e) | 6,372,122 | 7,166,416 | ||||||
| Trust: Clark County, NV, General Obligation, Series 3158, 144A, 13.593%, 6/1/2016, Leverage Factor at purchase date: 3 to 1 | ||||||||
| Clark County, NV, School District, Series C, 5.0%, 6/15/2021 (e) | 16,118,519 | 18,383,791 | ||||||
| Clark County, NV, School District, Series C, 5.0%, 6/15/2022 (e) | 16,841,398 | 19,208,262 | ||||||
| Clark County, NV, School District, Series C, 5.0%, 6/15/2023 (e) | 10,876,807 | 12,405,416 | ||||||
| Trust: Clark County, NV, School Improvements, Series 2008-1153, 144A, 9.331%, 6/15/2015, Leverage Factor at purchase date: 2 to 1 | ||||||||
| 71,579,577 | ||||||||
| New York 0.9% | ||||||||
| New York, State Dormitory Authority Revenues, Columbia University, 5.0%, 7/1/2038 (e) | 27,925,000 | 31,452,704 | ||||||
| Trust: New York, State Dormitory Authority Revenues, Secondary Issues, Series R-11722-1, 144A, 18.101%, 7/1/2016, Leverage Factor at purchase date: 4 to 1 | ||||||||
| New York, NY, General Obligation, Series C-1, 5.0%, 10/1/2024, INS: AGMC (e) | 19,425,000 | 22,450,442 | ||||||
| Trust: New York, NY, Series 2008-1131, 144A, 9.302%, 10/1/2015, Leverage Factor at purchase date: 2 to 1 | ||||||||
| 53,903,146 | ||||||||
| North Carolina 0.4% | ||||||||
| North Carolina, Capital Facilities Finance Agency Revenue, Duke University Project, Series B, 5.0%, 10/1/2038 (e) | 20,000,000 | 23,019,800 | ||||||
| Trust: North Carolina, Capital Facilities Finance Agency Revenue, Duke University Project, Series 3333, 144A, 17.9%, 10/1/2016, Leverage Factor at purchase date: 4 to 1 | ||||||||
| Ohio 0.7% | ||||||||
| Columbus, OH, General Obligation, Series A, 5.0%, 9/1/2021 (e) | 8,725,000 | 10,262,615 | ||||||
| Columbus, OH, General Obligation, Series A, 5.0%, 9/1/2022 (e) | 8,725,000 | 10,262,615 | ||||||
| Trust: Columbus, OH, General Obligation, Series 2365, 144A, 17.98%, 9/1/2015, Leverage Factor at purchase date: 4 to 1 | ||||||||
| Ohio, State Higher Educational Facilities Community Revenue, Cleveland Clinic Health, Series A, 5.125%, 1/1/2028 (e) | 6,032,233 | 6,625,246 | ||||||
| Ohio, State Higher Educational Facilities Community Revenue, Cleveland Clinic Health, Series A, 5.25%, 1/1/2033 (e) | 10,287,087 | 11,298,382 | ||||||
| Trust: Ohio, State Higher Educational Revenue, Series 3139, 144A, 14.459%, 1/1/2016, Leverage Factor at purchase date: 3 to 1 | ||||||||
| 38,448,858 | ||||||||
| Tennessee 1.3% | ||||||||
| Nashville & Davidson County, TN, Metropolitan Government, 5.0%, 1/1/2026 (e) | 20,800,000 | 24,502,608 | ||||||
| Trust: Nashville & Davidson County, TN, Metropolitan Government, Series 2631-2, 144A, 17.99%, 1/1/2016, Leverage Factor at purchase date: 4 to 1 | ||||||||
| Nashville & Davidson County, TN, Metropolitan Government, 5.0%, 1/1/2028 (e) | 21,610,075 | 25,455,091 | ||||||
| Trust: Nashville & Davidson County, TN, Metropolitan Government, Series 2631-4, 144A, 17.998%, 1/1/2016, Leverage Factor at purchase date: 4 to 1 | ||||||||
| Nashville & Davidson County, TN, Metropolitan Government, 5.0%, 1/1/2027 (e) | 21,793,305 | 25,673,923 | ||||||
| Trust: Nashville & Davidson County, TN, Metropolitan Government, Series 2631-3, 144A, 17.985%, 1/1/2016, Leverage Factor at purchase date: 4 to 1 | ||||||||
| 75,631,622 | ||||||||
| Texas 1.0% | ||||||||
| Dallas, TX, Water Works & Sewer Systems Revenue, 5.0%, 10/1/2035 (e) | 10,000,000 | 11,178,200 | ||||||
| Trust: Dallas, TX, Water Works & Sewer Systems Revenue, Series 3742, 144A, 9.33%, 4/1/2018, Leverage Factor at purchase date: 2 to 1 | ||||||||
| Harris County, TX, Flood Control District, Series A, 5.0%, 10/1/2034 (e) | 5,500,000 | 6,234,140 | ||||||
| Trust: Texas, Puttable Floating Option Tax Exempt Receipts, Series 4692, 144A, 9.52%, 10/1/2018, Leverage Factor at purchase date: 2 to 1 | ||||||||
| San Antonio, TX, Electric & Gas Revenue, 5.0%, 2/1/2022 (e) | 3,000,000 | 3,397,222 | ||||||
| San Antonio, TX, Electric & Gas Revenue, 5.0%, 2/1/2027 (e) | 7,425,000 | 8,408,125 | ||||||
| San Antonio, TX, Electric & Gas Revenue, 5.0%, 2/1/2028 (e) | 6,540,000 | 7,405,944 | ||||||
| San Antonio, TX, Electric & Gas Revenue, 5.0%, 2/1/2029 (e) | 7,000,000 | 7,926,852 | ||||||
| Trust: San Antonio, TX, Series 2008-1150, 144A, 9.332%, 8/1/2015, Leverage Factor at purchase date: 2 to 1 | ||||||||
| Texas, Water Development Board Revenue, Series B, 5.25%, 7/15/2026 (e) | 10,000,000 | 11,514,700 | ||||||
| Trust: Texas, Water Development Board, Series 2008-1173, 144A, 18.90%, 7/15/2015, Leverage Factor at purchase date: 4 to 1 | ||||||||
| 56,065,183 | ||||||||
Total Municipal Inverse Floating Rate Notes (Cost $574,164,223) | 644,655,967 | |||||||
| % of Net Assets | Value ($) | |||||||
Total Investment Portfolio (Cost $5,590,199,904)† | 106.1 | 6,126,918,411 | ||||||
| Other Assets and Liabilities, Net | (6.1 | ) | (353,165,515 | ) | ||||
| Net Assets | 100.0 | 5,773,752,896 | ||||||
The following table represents bonds that are in default:
| Security | Coupon | Maturity Date | Principal Amount ($) | Cost ($) | Value ($) | ||||||||||||
| Austin, TX, Austin-Bergstrom Landhost Enterprises, Inc., Airport Hotel Project, Series A (b) | 3.375 | % | 4/1/2027 | 21,335,000 | 21,336,663 | 10,223,732 | |||||||||||
* Non-income producing security.
** Variable rate demand notes are securities whose interest rates are reset periodically at market levels. These securities are often payable on demand and are shown at their current rates as of May 31, 2013.
*** Floating rate securities' yields vary with a designated market index or market rate, such as the coupon-equivalent of the U.S. Treasury Bill rate. These securities are shown at their current rate as of May 31, 2013.
† The cost for federal income tax purposes was $5,197,095,196. At May 31, 2013, net unrealized appreciation for all securities based on tax cost was $546,687,399. This consisted of aggregate gross unrealized appreciation for all securities in which there was an excess of value over tax cost of $583,800,379 and aggregate gross unrealized depreciation for all securities in which there was an excess of tax cost over value of $37,112,980.
(a) At May 31, 2013, this security has been pledged, in whole or in part, as collateral for tender option bond trust.
(b) Partial interest paying security. The rate shown represents 50% of the original coupon rate.
(c) When-issued security.
(d) Securities represent the underlying municipal obligations of inverse floating rate obligations held by the Fund.
(e) Security forms part of the below tender option bond trust. Principal Amount and Value shown take into account the leverage factor.
144A: Security exempt from registration under Rule 144A of the Securities Act of 1933. These securities may be resold in transactions exempt from registration, normally to qualified institutional buyers.
AGC: Assured Guaranty Corp.
AGMC: Assured Guaranty Municipal Corp.
AMBAC: Ambac Financial Group, Inc.
AMT: Subject to alternative minimum tax.
ETM: Bonds bearing the description ETM (escrow to maturity) are collateralized usually by U.S. Treasury securities which are held in escrow and used to pay principal and interest on bonds so designated.
FGIC: Financial Guaranty Insurance Co.
GTY: Guaranty Agreement
INS: Insured
LIQ: Liquidity Facility
LOC: Letter of Credit
NATL: National Public Finance Guarantee Corp.
PIK: Denotes that all or a portion of the income is paid in-kind in the form of additional principal.
Prerefunded: Bonds which are prerefunded are collateralized usually by U.S. Treasury securities which are held in escrow and used to pay principal and interest on tax-exempt issues and to retire the bonds in full at the earliest refunding date.
Radian: Radian Asset Assurance, Inc.
SPA: Standby Bond Purchase Agreement
Fair Value Measurements
Various inputs are used in determining the value of the Fund's investments. These inputs are summarized in three broad levels. Level 1 includes quoted prices in active markets for identical securities. Level 2 includes other significant observable inputs (including quoted prices for similar securities, interest rates, prepayment speeds and credit risk). Level 3 includes significant unobservable inputs (including the Fund's own assumptions in determining the fair value of investments). The inputs or methodology used for valuing securities are not necessarily an indication of the risk associated with investing in those securities.
The following is a summary of the inputs used as of May 31, 2013 in valuing the Fund's investments. For information on the Fund's policy regarding the valuation of investments, please refer to the Security Valuation section of Note A in the accompanying Notes to Financial Statements.
| Assets | Level 1 | Level 2 | Level 3 | Total | ||||||||||||
| Municipal Investments (f) | $ | — | $ | 6,126,918,411 | $ | — | $ | 6,126,918,411 | ||||||||
There have been no transfers between fair value measurement levels during the year ended May 31, 2013.
(f) See Investment Portfolio for additional detailed categorizations.
The accompanying notes are an integral part of the financial statements.
| as of May 31, 2013 | ||||
| Assets | ||||
| Investments in securities, at value (cost $5,590,199,904) | $ | 6,126,918,411 | ||
| Cash | 799,445 | |||
| Receivable for investments sold | 1,870,000 | |||
| Receivable for Fund shares sold | 13,959,051 | |||
| Interest receivable | 74,795,872 | |||
| Other assets | 113,393 | |||
| Total assets | 6,218,456,172 | |||
| Liabilities | ||||
| Payable for investments purchased — when-issued securities | 34,104,173 | |||
| Payable for Fund shares redeemed | 19,837,730 | |||
| Payable for floating rate notes issued | 383,135,816 | |||
| Distributions payable | 2,310,383 | |||
| Accrued management fee | 1,585,168 | |||
| Accrued Trustees' fees | 48,764 | |||
| Other accrued expenses and payables | 3,681,242 | |||
| Total liabilities | 444,703,276 | |||
| Net assets, at value | $ | 5,773,752,896 | ||
| Net Assets Consist of | ||||
| Undistributed net investment income | 1,403,241 | |||
| Net unrealized appreciation (depreciation) on investments | 536,718,507 | |||
| Accumulated net realized gain (loss) | (64,155,111 | ) | ||
| Paid-in capital | 5,299,786,259 | |||
| Net assets, at value | $ | 5,773,752,896 | ||
The accompanying notes are an integral part of the financial statements.
Statement of Assets and Liabilities as of May 31, 2013 (continued) | ||||
| Net Asset Value | ||||
Class A Net Asset Value and redemption price per share ($2,360,151,164 ÷ 251,206,038 outstanding shares of beneficial interest, $.01 par value, unlimited number of shares authorized) | $ | 9.40 | ||
| Maximum offering price per share (100 ÷ 97.25 of $9.40) | $ | 9.67 | ||
Class B Net Asset Value, offering and redemption price (subject to contingent deferred sales charge) per share ($2,863,541 ÷ 304,722 outstanding shares of beneficial interest, $.01 par value, unlimited number of shares authorized) | $ | 9.40 | ||
Class C Net Asset Value, offering and redemption price (subject to contingent deferred sales charge) per share ($319,470,049 ÷ 34,003,936 outstanding shares of beneficial interest, $.01 par value, unlimited number of shares authorized) | $ | 9.40 | ||
Class S Net Asset Value, offering and redemption price per share ($2,887,301,918 ÷ 306,894,810 outstanding shares of beneficial interest, $.01 par value, unlimited number of shares authorized) | $ | 9.41 | ||
Institutional Class Net Asset Value, offering and redemption price per share ($203,966,224 ÷ 21,700,243 outstanding shares of beneficial interest, $.01 par value, unlimited number of shares authorized) | $ | 9.40 | ||
The accompanying notes are an integral part of the financial statements.
| for the year ended May 31, 2013 | ||||
| Investment Income | ||||
Income: Interest | $ | 259,842,102 | ||
Expenses: Management fee | 17,673,221 | |||
| Administration fee | 5,482,448 | |||
| Services to shareholders | 5,461,567 | |||
| Distribution and service fees | 8,447,492 | |||
| Custodian fee | 56,408 | |||
| Professional fees | 161,114 | |||
| Reports to shareholders | 164,310 | |||
| Registration fees | 279,000 | |||
| Trustees' fees and expenses | 233,063 | |||
| Interest expense and fees on floating rate notes issued | 2,783,872 | |||
| Other | 217,545 | |||
| Total expenses | 40,960,040 | |||
| Net investment income | 218,882,062 | |||
| Realized and Unrealized Gain (Loss) | ||||
Net realized gain (loss) from: Investments | 24,717,093 | |||
| Swap contracts | (9,597,999 | ) | ||
| 15,119,094 | ||||
Change in net unrealized appreciation (depreciation) on: Investments | (46,276,758 | ) | ||
| Swap contracts | 17,702,527 | |||
| (28,574,231 | ) | |||
| Net gain (loss) | (13,455,137 | ) | ||
| Net increase (decrease) in net assets resulting from operations | $ | 205,426,925 | ||
The accompanying notes are an integral part of the financial statements.
| for the year ended May 31, 2013 | ||||
Increase (Decrease) in Cash: Cash Flows from Operating Activities | ||||
| Net increase (decrease) in net assets resulting from operations | $ | 205,426,925 | ||
Adjustments to reconcile net increase (decrease) in net assets resulting from operations to net cash provided (used) by operating activities: Purchases of long-term investments | (2,730,200,096 | ) | ||
| Net amortization of premium/ (accretion of discount) | (14,518,824 | ) | ||
| Proceeds from sales and maturities of long-term investments | 1,991,693,895 | |||
| (Increase) decrease in interest receivable | (5,738,775 | ) | ||
| (Increase) decrease in other assets | 4,398 | |||
| (Increase) decrease in receivable for investments sold | 400,000 | |||
| Increase (decrease) in payable for investments purchased — when-issued securities | 27,411,411 | |||
| Increase (decrease) in other accrued expenses and payables | 927,008 | |||
| Change in unrealized (appreciation) depreciation on investments | 46,276,758 | |||
| Change in unrealized (appreciation) depreciation on swaps contracts | (17,702,527 | ) | ||
| Net realized (gain) loss from investments | (24,717,093 | ) | ||
| Cash provided (used) by operating activities | $ | (520,736,920 | ) | |
| Cash Flows from Financing Activities | ||||
| Proceeds from shares sold | 1,450,414,051 | |||
| Payments for shares redeemed | (864,546,286 | ) | ||
| Distributions paid (net of reinvestment of distributions) | (64,394,964 | ) | ||
| Cash provided (used) by financing activities | 521,472,801 | |||
| Increase (decrease) in cash | 735,881 | |||
| Cash at beginning of period | 63,564 | |||
| Cash at end of period | $ | 799,445 | ||
| Supplemental Disclosure of Non-Cash Activities | ||||
| Reinvestment of distributions | $ | 155,654,695 | ||
| Interest expense and fees on floating rate notes issued | $ | (2,783,872 | ) | |
The accompanying notes are an integral part of the financial statements.
| Years Ended May 31, | ||||||||
| Increase (Decrease) in Net Assets | 2013 | 2012 | ||||||
Operations: Net investment income | $ | 218,882,062 | $ | 214,225,675 | ||||
| Net realized gain (loss) | 15,119,094 | (53,935,626 | ) | |||||
| Change in net unrealized appreciation (depreciation) | (28,574,231 | ) | 351,915,990 | |||||
| Net increase (decrease) in net assets resulting from operations | 205,426,925 | 512,206,039 | ||||||
Distributions to shareholders from: Net investment income: Class A | (90,228,876 | ) | (88,251,470 | ) | ||||
| Class B | (98,042 | ) | (135,652 | ) | ||||
| Class C | (9,025,287 | ) | (6,706,011 | ) | ||||
| Class S | (109,265,626 | ) | (112,146,159 | ) | ||||
| Institutional Class | (7,448,069 | ) | (4,210,985 | ) | ||||
Net realized gains: Class A | (1,034,762 | ) | (473,931 | ) | ||||
| Class B | (1,438 | ) | (888 | ) | ||||
| Class C | (130,667 | ) | (43,010 | ) | ||||
| Class S | (1,176,038 | ) | (582,403 | ) | ||||
| Institutional Class | (81,855 | ) | (24,028 | ) | ||||
| Total distributions | (218,490,660 | ) | (212,574,537 | ) | ||||
Fund share transactions: Proceeds from shares sold | 1,455,504,479 | 1,001,083,822 | ||||||
| Reinvestment of distributions | 155,654,695 | 142,962,372 | ||||||
| Payments for shares redeemed | (880,520,357 | ) | (706,492,889 | ) | ||||
| Net increase (decrease) in net assets from Fund share transactions | 730,638,817 | 437,553,305 | ||||||
| Increase (decrease) in net assets | 717,575,082 | 737,184,807 | ||||||
| Net assets at beginning of period | 5,056,177,814 | 4,318,993,007 | ||||||
| Net assets at end of period (including undistributed net investment income of $1,403,241 and $3,063,543, respectively) | $ | 5,773,752,896 | $ | 5,056,177,814 | ||||
The accompanying notes are an integral part of the financial statements.
| Years Ended May 31, | ||||||||||||||||||||
| Class A | 2013 | 2012 | 2011 | 2010 | 2009 | |||||||||||||||
| Selected Per Share Data | ||||||||||||||||||||
| Net asset value, beginning of period | $ | 9.40 | $ | 8.82 | $ | 9.08 | $ | 8.68 | $ | 8.85 | ||||||||||
Income from investment operations: Net investment income | .37 | .41 | .42 | .43 | .41 | |||||||||||||||
| Net realized and unrealized gain (loss) | (.00 | )* | .58 | (.26 | ) | .41 | (.14 | ) | ||||||||||||
| Total from investment operations | .37 | .99 | .16 | .84 | .27 | |||||||||||||||
Less distributions from: Net investment income | (.37 | ) | (.41 | ) | (.42 | ) | (.43 | ) | (.41 | ) | ||||||||||
| Net realized gains | (.00 | )* | . | (.00)* | (.00 | )* | (.01 | ) | (.03 | ) | ||||||||||
| Total distributions | (.37 | ) | (.41 | ) | (.42 | ) | (.44 | ) | (.44 | ) | ||||||||||
| Net asset value, end of period | $ | 9.40 | $ | 9.40 | $ | 8.82 | $ | 9.08 | $ | 8.68 | ||||||||||
Total Return (%)a | 4.01 | 11.48 | 1.88 | 9.80 | 3.38 | b | ||||||||||||||
| Ratios to Average Net Assets and Supplemental Data | ||||||||||||||||||||
| Net assets, end of period ($ millions) | 2,360 | 2,149 | 1,833 | 1,881 | 1,627 | |||||||||||||||
Ratio of expenses before expense reductions (including interest expense) (%)c | .80 | .82 | .83 | .81 | 1.11 | |||||||||||||||
Ratio of expenses after expense reductions (including interest expense) (%)c | .80 | .82 | .83 | .81 | 1.10 | |||||||||||||||
| Ratio of expenses after expense reductions (excluding interest expense) (%) | .75 | .76 | .75 | .74 | .74 | |||||||||||||||
| Ratio of net investment income (%) | 3.94 | 4.54 | 4.86 | 4.86 | 4.95 | |||||||||||||||
| Portfolio turnover rate (%) | 34 | 27 | 24 | 37 | 77 | |||||||||||||||
a Total return does not reflect the effect of any sales charges. b Total return would have been lower had certain expenses not been reduced. c Interest expense represents interest and fees on short-term floating rate notes issued in conjunction with inverse floating rate securities. Interest income from such transactions is included in income from investment operations. * Amount is less than $.005. | ||||||||||||||||||||
| Years Ended May 31, | ||||||||||||||||||||
| Class B | 2013 | 2012 | 2011 | 2010 | 2009 | |||||||||||||||
| Selected Per Share Data | ||||||||||||||||||||
| Net asset value, beginning of period | $ | 9.40 | $ | 8.82 | $ | 9.08 | $ | 8.68 | $ | 8.86 | ||||||||||
Income from investment operations: Net investment income | .29 | .33 | .35 | .35 | .34 | |||||||||||||||
| Net realized and unrealized gain (loss) | (.00 | )* | .58 | (.26 | ) | .41 | (.15 | ) | ||||||||||||
| Total from investment operations | .29 | .91 | .09 | .76 | .19 | |||||||||||||||
Less distributions from: Net investment income | (.29 | ) | (.33 | ) | (.35 | ) | (.35 | ) | (.34 | ) | ||||||||||
| Net realized gains | (.00 | )* | (.00 | )* | (.00 | )* | (.01 | ) | (.03 | ) | ||||||||||
| Total distributions | (.29 | ) | (.33 | ) | (.35 | ) | (.36 | ) | (.37 | ) | ||||||||||
| Net asset value, end of period | $ | 9.40 | $ | 9.40 | $ | 8.82 | $ | 9.08 | $ | 8.68 | ||||||||||
Total Return (%)a | 3.14 | 10.57 | 1.05 | 8.90 | 2.45 | b | ||||||||||||||
| Ratios to Average Net Assets and Supplemental Data | ||||||||||||||||||||
| Net assets, end of period ($ millions) | 3 | 3 | 4 | 6 | 7 | |||||||||||||||
Ratio of expenses before expense reductions (including interest expense) (%)c | 1.63 | 1.63 | 1.64 | 1.64 | 1.92 | |||||||||||||||
Ratio of expenses after expense reductions (including interest expense) (%)c | 1.63 | 1.63 | 1.64 | 1.64 | 1.89 | |||||||||||||||
| Ratio of expenses after expense reductions (excluding interest expense) (%) | 1.58 | 1.57 | 1.56 | 1.57 | 1.53 | |||||||||||||||
| Ratio of net investment income (%) | 3.12 | 3.74 | 4.04 | 4.03 | 4.16 | |||||||||||||||
| Portfolio turnover rate (%) | 34 | 27 | 24 | 37 | 77 | |||||||||||||||
a Total return does not reflect the effect of any sales charges. b Total return would have been lower had certain expenses not been reduced. c Interest expense represents interest and fees on short-term floating rate notes issued in conjunction with inverse floating rate securities. Interest income from such transactions is included in income from investment operations. * Amount is less than $.005. | ||||||||||||||||||||
| Years Ended May 31, | ||||||||||||||||||||
| Class C | 2013 | 2012 | 2011 | 2010 | 2009 | |||||||||||||||
| Selected Per Share Data | ||||||||||||||||||||
| Net asset value, beginning of period | $ | 9.40 | $ | 8.81 | $ | 9.08 | $ | 8.68 | $ | 8.85 | ||||||||||
Income from investment operations: Net investment income | .30 | .34 | .35 | .36 | .34 | |||||||||||||||
| Net realized and unrealized gain (loss) | (.00 | )* | .59 | (.27 | ) | .41 | (.14 | ) | ||||||||||||
| Total from investment operations | .30 | .93 | .08 | .77 | .20 | |||||||||||||||
Less distributions from: Net investment income | (.30 | ) | (.34 | ) | (.35 | ) | (.36 | ) | (.34 | ) | ||||||||||
| Net realized gains | (.00 | )* | (.00 | )* | (.00 | )* | (.01 | ) | (.03 | ) | ||||||||||
| Total distributions | (.30 | ) | (.34 | ) | (.35 | ) | (.37 | ) | (.37 | ) | ||||||||||
| Net asset value, end of period | $ | 9.40 | $ | 9.40 | $ | 8.81 | $ | 9.08 | $ | 8.68 | ||||||||||
Total Return (%)a | 3.21 | 10.77 | .98 | 8.98 | 2.61 | b | ||||||||||||||
| Ratios to Average Net Assets and Supplemental Data | ||||||||||||||||||||
| Net assets, end of period ($ millions) | 319 | 237 | 143 | 121 | 59 | |||||||||||||||
Ratio of expenses before expense reductions (including interest expense) (%)c | 1.58 | 1.59 | 1.61 | 1.60 | 1.88 | |||||||||||||||
Ratio of expenses after expense reductions (including interest expense) (%)c | 1.58 | 1.59 | 1.61 | 1.60 | 1.87 | |||||||||||||||
| Ratio of expenses after expense reductions (excluding interest expense) (%) | 1.53 | 1.53 | 1.53 | 1.53 | 1.52 | |||||||||||||||
| Ratio of net investment income (%) | 3.15 | 3.76 | 4.08 | 4.07 | 4.18 | |||||||||||||||
| Portfolio turnover rate (%) | 34 | 27 | 24 | 37 | 77 | |||||||||||||||
a Total return does not reflect the effect of any sales charges. b Total return would have been lower had certain expenses not been reduced. c Interest expense represents interest and fees on short-term floating rate notes issued in conjunction with inverse floating rate securities. Interest income from such transactions is included in income from investment operations. * Amount is less than $.005. | ||||||||||||||||||||
| Years Ended May 31, | ||||||||||||||||||||
| Class S | 2013 | 2012 | 2011 | 2010 | 2009 | |||||||||||||||
| Selected Per Share Data | ||||||||||||||||||||
| Net asset value, beginning of period | $ | 9.41 | $ | 8.83 | $ | 9.09 | $ | 8.69 | $ | 8.87 | ||||||||||
Income from investment operations: Net investment income | .39 | .42 | .44 | .44 | .43 | |||||||||||||||
| Net realized and unrealized gain (loss) | (.00 | )* | .58 | (.26 | ) | .41 | (.15 | ) | ||||||||||||
| Total from investment operations | .39 | 1.00 | .18 | .85 | .28 | |||||||||||||||
Less distributions from: Net investment income | (.39 | ) | (.42 | ) | (.44 | ) | (.44 | ) | (.43 | ) | ||||||||||
| Net realized gains | (.00 | )* | (.00 | )* | (.00 | )* | (.01 | ) | (.03 | ) | ||||||||||
| Total distributions | (.39 | ) | (.42 | ) | (.44 | ) | (.45 | ) | (.46 | ) | ||||||||||
| Net asset value, end of period | $ | 9.41 | $ | 9.41 | $ | 8.83 | $ | 9.09 | $ | 8.69 | ||||||||||
| Total Return (%) | 4.19 | 11.67 | 2.07 | 10.00 | 3.48 | a | ||||||||||||||
| Ratios to Average Net Assets and Supplemental Data | ||||||||||||||||||||
| Net assets, end of period ($ millions) | 2,887 | 2,549 | 2,301 | 2,081 | 1,818 | |||||||||||||||
Ratio of expenses before expense reductions (including interest expense) (%)b | .62 | .64 | .64 | .62 | .90 | |||||||||||||||
Ratio of expenses after expense reductions (including interest expense) (%)b | .62 | .64 | .64 | .62 | .89 | |||||||||||||||
| Ratio of expenses after expense reductions (excluding interest expense) (%) | .57 | .58 | .56 | .55 | .54 | |||||||||||||||
| Ratio of net investment income (%) | 4.12 | 4.72 | 5.05 | 5.05 | 5.16 | |||||||||||||||
| Portfolio turnover rate (%) | 34 | 27 | 24 | 37 | 77 | |||||||||||||||
a Total return would have been lower had certain expenses not been reduced. b Interest expense represents interest and fees on short-term floating rate notes issued in conjunction with inverse floating rate securities. Interest income from such transactions is included in income from investment operations. * Amount is less than $.005. | ||||||||||||||||||||
| Years Ended May 31, | ||||||||||||||||||||
| Institutional Class | 2013 | 2012 | 2011 | 2010 | 2009 | |||||||||||||||
| Selected Per Share Data | ||||||||||||||||||||
| Net asset value, beginning of period | $ | 9.40 | $ | 8.82 | $ | 9.08 | $ | 8.68 | $ | 8.85 | ||||||||||
Income from investment operations: Net investment income | .39 | .43 | .44 | .45 | .43 | |||||||||||||||
| Net realized and unrealized gain (loss) | (.00 | )* | .58 | (.26 | ) | .41 | (.14 | ) | ||||||||||||
| Total from investment operations | .39 | 1.01 | .18 | .86 | .29 | |||||||||||||||
Less distributions from: Net investment income | (.39 | ) | (.43 | ) | (.44 | ) | (.45 | ) | (.43 | ) | ||||||||||
| Net realized gains | (.00 | )* | (.00 | )* | (.00 | )* | (.01 | ) | (.03 | ) | ||||||||||
| Total distributions | (.39 | ) | (.43 | ) | (.44 | ) | (.46 | ) | (.46 | ) | ||||||||||
| Net asset value, end of period | $ | 9.40 | $ | 9.40 | $ | 8.82 | $ | 9.08 | $ | 8.68 | ||||||||||
| Total Return (%) | 4.25 | 11.79 | 2.13 | 10.09 | 3.61 | a | ||||||||||||||
| Ratios to Average Net Assets and Supplemental Data | ||||||||||||||||||||
| Net assets, end of period ($ millions) | 204 | 117 | 38 | 36 | 6 | |||||||||||||||
Ratio of expenses before expense reductions (including interest expense) (%)b | .57 | .56 | .59 | .57 | .90 | |||||||||||||||
Ratio of expenses after expense reductions (including interest expense) (%)b | .57 | .56 | .59 | .57 | .89 | |||||||||||||||
| Ratio of expenses after expense reductions (excluding interest expense) (%) | .52 | .50 | .51 | .50 | .54 | |||||||||||||||
| Ratio of net investment income (%) | 4.17 | 4.78 | 5.09 | 5.09 | 5.16 | |||||||||||||||
| Portfolio turnover rate (%) | 34 | 27 | 24 | 37 | 77 | |||||||||||||||
a Total returns would have been lower had certain expenses not been reduced. b Interest expense represents interest and fees on short-term floating rate notes issued in conjunction with inverse floating rate securities. Interest income from such transactions is included in income from investment operations. * Amount is less than $.005. | ||||||||||||||||||||
A. Organization and Significant Accounting Policies
DWS Managed Municipal Bond Fund (the "Fund") is a diversified series of DWS Municipal Trust (the "Trust"), which is registered under the Investment Company Act of 1940, as amended (the "1940 Act"), as an open-end management investment company organized as a Massachusetts business trust.
The Fund offers multiple classes of shares which provide investors with different purchase options. Class A shares are offered to investors subject to an initial sales charge. Class B shares of the Fund are closed to new purchases, except exchanges or the reinvestment of dividends or other distributions. Class B shares were offered to investors without an initial sales charge and are subject to higher ongoing expenses than Class A shares and a contingent deferred sales charge payable upon certain redemptions. Class B shares automatically convert to Class A shares six years after issuance. Class C shares are offered to investors without an initial sales charge but are subject to higher ongoing expenses than Class A shares and a contingent deferred sales charge payable upon certain redemptions within one year of purchase. Class C shares do not automatically convert into another class. Institutional Class shares are generally available only to qualified institutions, are not subject to initial or contingent deferred sales charges and generally have lower ongoing expenses than other classes. Class S shares are not subject to initial or contingent deferred sales charges and are only available to a limited group of investors.
Investment income, realized and unrealized gains and losses and certain fund-level expenses and expense reductions, if any, are borne pro rata on the basis of relative net assets by the holders of all classes of shares, except that each class bears certain expenses unique to that class such as distribution and services fees, services to shareholders and certain other class-specific expenses. Differences in class-level expenses may result in payment of different per share dividends by class. All shares of the Fund have equal rights with respect to voting subject to class-specific arrangements.
The Fund's financial statements are prepared in accordance with accounting principles generally accepted in the United States of America which require the use of management estimates. Actual results could differ from those estimates. The policies described below are followed consistently by the Fund in the preparation of its financial statements.
Security Valuation. Investments are stated at value determined as of the close of regular trading on the New York Stock Exchange on each day the exchange is open for trading.
Various inputs are used in determining the value of the Fund's investments. These inputs are summarized in three broad levels. Level 1 includes quoted prices in active markets for identical securities. Level 2 includes other significant observable inputs (including quoted prices for similar securities, interest rates, prepayment speeds, and credit risk). Level 3 includes significant unobservable inputs (including the Fund's own assumptions in determining the fair value of investments). The inputs or methodology used for valuing securities are not necessarily an indication of the risk associated with investing in those securities.
Municipal debt securities are valued at prices supplied by independent pricing services approved by the Fund's Board, whose valuations are intended to reflect the mean between the bid and asked prices. If the pricing services are unable to provide valuations, the securities are valued at the mean of the most recent bid and asked quotations or evaluated prices, as applicable, obtained from one or more broker-dealers. Such services may use various pricing techniques which take into account appropriate factors such as yield, quality, coupon rate, maturity, type of issue, trading characteristics and other data, as well as broker quotes. These securities are generally categorized as Level 2.
Swap contracts are valued daily based upon prices supplied by a Board approved pricing vendor, if available, and otherwise are valued at the price provided by the broker-dealer. Swap contracts are generally categorized as Level 2.
Securities and other assets for which market quotations are not readily available or for which the above valuation procedures are deemed not to reflect fair value are valued in a manner that is intended to reflect their fair value as determined in accordance with procedures approved by the Board and are generally categorized as Level 3. In accordance with the Fund's valuation procedures, factors used in determining value may include, but are not limited to, the type of the security; the size of the holding; the initial cost of the security; the existence of any contractual restrictions on the security's disposition; the price and extent of public trading in similar securities of the issuer or of comparable companies; quotations or evaluated prices from broker-dealers and/or pricing services; information obtained from the issuer, analysts, and/or the appropriate stock exchange (for exchange-traded securities); an analysis of the company's or issuer's financial statements; an evaluation of the forces that influence the issuer and the market(s) in which the security is purchased and sold and with respect to debt securities; the maturity, coupon, creditworthiness, currency denomination and the movement of the market in which the security is normally traded. The value determined under these procedures may differ from published values for the same securities.
Disclosure about the classification of fair value measurements is included in a table following the Fund's Investment Portfolio.
New Accounting Pronouncement. In January 2013, Accounting Standard Update 2013-01 (ASU 2013-01), Clarifying the Scope of Disclosures about Offsetting Assets and Liabilities, replaced Accounting Standards Update 2011-11 (ASU 2011-11), Disclosures about Offsetting Assets and Liabilities. ASU 2013-01 is effective for fiscal years beginning on or after January 1, 2013, and interim periods within those annual periods. ASU 2011-11 was intended to enhance disclosure requirements on the offsetting of financial assets and liabilities. The ASU 2013-01 limits the scope of the new balance sheet offsetting disclosures to derivatives, repurchase agreements, and securities lending transactions to the extent that they are (1) offset in the financial statements or (2) subject to an enforceable master netting arrangement or similar agreement. Management is currently evaluating the application of ASU 2013-01 and its impact, if any, on the Fund's financial statements.
Inverse Floaters. The Fund invests in inverse floaters. Inverse floaters are debt instruments with a weekly floating rate of interest that bears an inverse relationship to changes in the short-term interest rate market. Inverse floaters are created by depositing a fixed-rate municipal bond into a special purpose trust (the "Trust"). In turn the Trust issues a short-term floating rate note and an inverse floater. The income stream from the underlying bond in the Trust is divided between the floating rate note and the inverse floater. The income provided by the inverse floater bears an inverse relationship with the short-term rate paid to the floating rate note holder. The short-term floating rate note is issued in a face amount equal to some fraction of the underlying bond's par amount and is paid to a third party, usually a tax-exempt money market fund, at rates that generally reset weekly. The inverse floater earns all of the interest from the underlying fixed-rate bond less the amount of interest paid on the floating rate note and the expenses of the Trust. The inverse floater represents an investment in the underlying bond on a leveraged basis; the Fund bears all of the price risk of the underlying bond in the Trust and receives all the benefits from any potential appreciation of the underlying bond's value. The floating rate notes issued by the Trust are valued at cost, which approximates fair value.
By holding the inverse floater, the Fund has the right to collapse the Trust by causing the holders of the floating rate instrument to tender their notes at par and have the broker transfer the underlying bond to the Fund. The floating rate note holder can also elect to tender the note for redemption at par at each reset date. The Fund accounts for these transactions as a form of secured borrowing, by reflecting the value of the underlying bond in the investments of the Fund and the amount owed to the floating rate note holder as a liability under the caption "Payable for floating rate notes issued" in the Statement of Assets and Liabilities. Income earned on the underlying bond is included in interest income, and interest paid on the floaters and the expenses of the Trust are included in "Interest expense and fees on floating rate notes issued" in the Statement of Operations.
The Fund may enter into shortfall and forbearance agreements by which the Fund agrees to reimburse the Trust, in certain circumstances, for the difference between the liquidation value of the underlying bond held by the Trust and the liquidation value of the floating rate notes plus any shortfalls in interest cash flows. This could potentially expose the Fund to losses in excess of the value of the Fund's inverse floater investments. In addition, the value of inverse floaters may decrease significantly when interest rates increase. The market for inverse floaters may be more volatile and less liquid than other municipal bonds of comparable maturity. The Trust could be terminated outside of the Fund's control, resulting in a reduction of leverage and disposal of portfolio investments at inopportune times and prices. Investments in inverse floaters generally involve greater risk than in an investment in fixed-rate bonds. In connection with these agreements, securities and/or cash may be pledged as collateral.
The weighted average outstanding daily balance of the floating rate notes issued during the year ended May 31, 2013 was $383,135,816, with a weighted average interest rate of 0.73%.
When-Issued/Delayed Delivery Securities. The Fund may purchase securities with delivery or payment to occur at a later date beyond the normal settlement period. At the time the Fund enters into a commitment to purchase a security, the transaction is recorded and the value of the transaction is reflected in the net asset value. The price of such security and the date when the security will be delivered and paid for are fixed at the time the transaction is negotiated. The value of the security may vary with market fluctuations. At the time the Fund enters into a purchase transaction it is required to segregate cash or other liquid assets at least equal to the amount of the commitment.
Certain risks may arise upon entering into when-issued or delayed delivery transaction from the potential inability of counterparties to meet the terms of their contracts or if the issuer does not issue the securities due to political, economic, or other factors. Additionally, losses may arise due to changes in the value of the underlying securities.
Federal Income Taxes. The Fund's policy is to comply with the requirements of the Internal Revenue Code, as amended, which are applicable to regulated investment companies, and to distribute all of its taxable and tax-exempt income to its shareholders.
Under the Regulated Investment Company Modernization Act of 2010, net capital losses may be carried forward indefinitely, and their character is retained as short-term and/or long-term. Previously, net capital losses were carried forward for eight years and treated as short-term losses. As a transition rule, the Act requires that post-enactment net capital losses be used before pre-enactment net capital losses.
At May 31, 2013, the Fund had net tax basis capital loss carryforwards of approximately $68,894,000, including $1,746,000 of pre-enactment losses which may be applied against any realized net taxable capital gains of each succeeding year until fully utilized or until May 31, 2019, the expiration date, whichever occurs first, and approximately $67,148,000 of post-enactment short-term losses which may be applied against realized net taxable capital gains indefinitely.
The Fund has reviewed the tax positions for the open tax years as of May 31, 2013 and has determined that no provision for income tax is required in the Fund's financial statements. The Fund's federal tax returns for the prior three fiscal years remain open subject to examination by the Internal Revenue Service.
Distribution of Income and Gains. Net investment income of the Fund is declared as a daily dividend and is distributed to shareholders monthly. Net realized gains from investment transactions, in excess of available capital loss carryforwards, would be taxable to the Fund if not distributed, and, therefore, will be distributed to shareholders at least annually.
The timing and characterization of certain income and capital gain distributions are determined annually in accordance with federal tax regulations which may differ from accounting principles generally accepted in the United States of America. These differences primarily relate to investments in inverse floater transactions, certain securities sold at a loss and accretion of market discount on debt securities. As a result, net investment income (loss) and net realized gain (loss) on investment transactions for a reporting period may differ significantly from distributions during such period. Accordingly, the Fund may periodically make reclassifications among certain of its capital accounts without impacting the net asset value of the Fund.
At May 31, 2013, the Fund's components of distributable earnings (accumulated losses) on a tax basis were as follows:
| Undistributed tax-exempt income | $ | 3,275,054 | ||
Undistributed ordinary income* | $ | 438,570 | ||
| Capital loss carryforward | $ | (68,894,000 | ) | |
| Net unrealized appreciation (depreciation) on investments | $ | 546,687,399 |
In addition, the tax character of distributions paid to shareholders by the Fund is summarized as follows:
| Years Ended May 31, | ||||||||
| 2013 | 2012 | |||||||
| Distributions from tax-exempt income | $ | 216,065,900 | $ | 211,450,277 | ||||
| Distributions from ordinary income* | $ | 2,424,760 | $ | 1,124,260 | ||||
* For tax purposes, short-term capital gain distributions are considered ordinary income distributions.
Expenses. Expenses of the Trust arising in connection with a specific fund are allocated to that fund. Other Trust expenses which cannot be directly attributed to a fund are apportioned among the funds in the Trust based upon the relative net assets or other appropriate measures.
Contingencies. In the normal course of business, the Fund may enter into contracts with service providers that contain general indemnification clauses. The Fund's maximum exposure under these arrangements is unknown as this would involve future claims that may be made against the Fund that have not yet been made. However, based on experience, the Fund expects the risk of loss to be remote.
Other. Investment transactions are accounted for on a trade date plus one basis for daily net asset value calculations. However, for financial reporting purposes, investment transactions are reported on trade date. Interest income is recorded on the accrual basis. Realized gains and losses from investment transactions are recorded on an identified cost basis. All premiums and discounts are amortized/accreted for financial reporting purposes, with the exception of securities in default of principal.
Statement of Cash Flows. Information on financial transactions which have been settled through the receipt and disbursement of cash is presented in the Statement of Cash Flows. The cash amount shown in the Statement of Cash Flows represents the cash position at the Fund's custodian bank at May 31, 2013.
B. Derivative Instruments
Interest Rate Swap Contracts. For the year ended May 31, 2013, the Fund invested into interest rate swap contracts to manage the duration and interest rate sensitivity of the Investment Portfolio. The use of interest rate swaps is a highly specialized activity that involves investment techniques and risks different from those associated with ordinary portfolio security transactions. In an interest rate swap, the Fund agrees to pay to the other party to the interest rate swap (which is known as the "counterparty") a fixed rate payment in exchange for the counterparty agreeing to pay to the Fund a variable rate payment, or the Fund agrees to receive from the counterparty a fixed rate payment in exchange for the counterparty agreeing to receive from the Fund a variable rate payment, the accruals for which would begin at a specified date in the future (the "effective date"). The payment obligations are based on the notional amount of the swap. Certain risks may arise when entering into swap transactions including counterparty default, liquidity or unfavorable changes in interest rates. In connection with these agreements, securities and or cash may be identified as collateral in accordance with the terms of the swap agreements to provide assets of value and recourse in the event of default. The maximum counterparty credit risk is the net present value of the cash flows to be received from or paid to the counterparty over the term of the interest rate swap contract, to the extent that this amount is beneficial to the Fund, in addition to any related collateral posted to the counterparty by the Fund. This risk may be partially reduced by a master netting arrangement between the Fund and the counterparty. The Fund generally intends, but is not obligated, to terminate its interest rate swaps before the effective date. Payments received or made are recorded as realized gain or loss in the Statement of Operations. The value of the swap is adjusted daily based upon a price supplied by a Board approved pricing vendor and the change in value is recorded as unrealized appreciation or depreciation. An upfront payment, if any, made by the Fund is recorded as an asset in the Statement of Assets and Liabilities. An upfront payment, if any, received by the Fund is recorded as a liability in the Statement of Assets and Liabilities. Payments received or made at the end of the measurement period are recorded as realized gain or loss in the Statement of Operations.
There were no open interest rate swap contracts as of May 31, 2013. For the year ended May 31, 2013, the investment in interest rate swap contracts had a total notional amount generally indicative of a range from $0 to $255,950,000.
Additionally, the amount of unrealized and realized gains and losses on derivative instruments recognized in Fund earnings during the period ended May 31, 2013 and the related location in the accompanying Statement of Operations is summarized in the following tables by primary underlying risk exposure:
| Realized Gain (Loss) | Swap Contracts | |||
| Interest Rate Contracts (a) | $ | (9,597,999 | ) | |
The above derivative is located in the following Statement of Operations account:
(a) Net realized gain (loss) from swap contracts
| Change in Net Unrealized Appreciation (Depreciation) | Swap Contracts | |||
| Interest Rate Contracts (a) | $ | 17,702,527 | ||
The above derivative is located in the following Statement of Operations account:
(a) Change in net unrealized appreciation (depreciation) on swap contracts
C. Purchases and Sales of Securities
During the year ended May 31, 2013, purchases and sales of investment securities (excluding short-term investments) aggregated $2,730,200,096 and $1,991,693,895, respectively.
D. Related Parties
Management Agreement. Under the Investment Management Agreement with Deutsche Investment Management Americas Inc. ("DIMA" or the "Advisor"), an indirect, wholly owned subsidiary of Deutsche Bank AG, the Advisor directs the investments of the Fund in accordance with its investment objectives, policies and restrictions. The Advisor determines the securities, instruments and other contracts relating to investments to be purchased, sold or entered into by the Fund.
Under the Investment Management Agreement with the Advisor, the Fund pays a monthly management fee based on the Fund's average daily net assets, computed and accrued daily and payable monthly, at the following annual rates:
| First $250 million of the Fund's average daily net assets | .365 | % | ||
| Next $750 million of such net assets | .345 | % | ||
| Next $1.5 billion of such net assets | .325 | % | ||
| Next $2.5 billion of such net assets | .315 | % | ||
| Next $2.5 billion of such net assets | .295 | % | ||
| Next $2.5 billion of such net assets | .275 | % | ||
| Next $2.5 billion of such net assets | .255 | % | ||
| Over $12.5 billion of such net assets | .235 | % |
For the year ended May 31, 2013, the fee pursuant to the Investment Management Agreement was equivalent to an annual effective rate of 0.32% of the Fund's average daily net assets.
Administration Fee. Pursuant to an Administrative Services Agreement, DIMA provides most administrative services to the Fund. For all services provided under the Administrative Services Agreement, the Fund pays the Advisor a fee ("Administration Fee") of 0.10% of the Fund's average daily net assets, computed and accrued daily and payable monthly. For the year ended May 31, 2013, the Administration Fee was $5,482,448, of which $494,160 is unpaid.
Service Provider Fees. DWS Investments Service Company ("DISC"), an affiliate of the Advisor, is the transfer agent, dividend-paying agent and shareholder service agent of the Fund. Pursuant to a sub-transfer agency agreement between DISC and DST Systems, Inc. ("DST"), DISC has delegated certain transfer agent, dividend-paying agent and shareholder service agent functions to DST. DISC compensates DST out of the shareholder servicing fee it receives from the Fund. For the year ended May 31, 2013, the amounts charged to the Fund by DISC were as follows:
| Services to Shareholders | Total Aggregated | Unpaid at May 31, 2013 | ||||||
| Class A | $ | 318,510 | $ | 78,629 | ||||
| Class B | 1,235 | 285 | ||||||
| Class C | 30,432 | 8,263 | ||||||
| Class S | 705,222 | 177,656 | ||||||
| Institutional Class | 6,811 | 1,997 | ||||||
| $ | 1,062,210 | $ | 266,830 | |||||
Distribution and Service Fees. Under the Fund's Class B and Class C 12b-1 Plans, DWS Investments Distributors, Inc. ("DIDI"), an affiliate of the Advisor, receives a fee ("Distribution Fee") of 0.75% of average daily net assets of Class B and C shares. In accordance with the Fund's Underwriting and Distribution Services Agreement, DIDI enters into related selling group agreements with various firms at various rates for sales of Class B and C shares. For the year ended May 31, 2013, the Distribution Fee was as follows:
| Distribution Fee | Total Aggregated | Unpaid at May 31, 2013 | ||||||
| Class B | $ | 24,026 | $ | 1,867 | ||||
| Class C | 2,183,306 | 206,350 | ||||||
| $ | 2,207,332 | $ | 208,217 | |||||
In addition, DIDI provides information and administrative services for a fee ("Service Fee") to Class A, B and C shareholders at an annual rate of up to 0.25% of average daily net assets for each such class. DIDI in turn has various agreements with financial services firms that provide these services and pays these fees based upon the assets of shareholder accounts the firms service. For the year ended May 31, 2013, the Service Fee was as follows:
| Service Fee | Total Aggregated | Unpaid at May 31, 2013 | Annual Effective Rate | |||||||||
| Class A | $ | 5,506,561 | $ | 970,691 | .24 | % | ||||||
| Class B | 7,883 | 1,208 | .25 | % | ||||||||
| Class C | 725,716 | 133,922 | .25 | % | ||||||||
| $ | 6,240,160 | $ | 1,105,821 | |||||||||
Underwriting Agreement and Contingent Deferred Sales Charge. DIDI is the principal underwriter for the Fund. Underwriting commissions paid to DIDI in connection with the distribution of Class A shares for the year ended May 31, 2013 aggregated $283,781.
In addition, DIDI receives any contingent deferred sales charge ("CDSC") from Class B share redemptions occurring within six years of purchase and Class C share redemptions occurring within one year of purchase. There is no such charge upon redemption of any share appreciation or reinvested dividends. The CDSC is based on declining rates, ranging from 4% to 1% for Class B and 1% for Class C, of the value of the shares redeemed. For the year ended May 31, 2013, the CDSC for Class B and C shares aggregated $3,070 and $65,929, respectively. A deferred sales charge of up to 0.50% is assessed on certain redemptions of Class A shares. For the year ended May 31, 2013, DIDI received $41,295 for Class A shares.
Typesetting and Filing Service Fees. Under an agreement with DIMA, DIMA is compensated for providing typesetting and certain regulatory filing services to the Fund. For the year ended May 31, 2013, the amount charged to the Fund by DIMA included in the Statement of Operations under "reports to shareholders" aggregated $24,924, of which $11,111 is unpaid.
Trustees' Fees and Expenses. The Fund paid retainer fees to each Trustee not affiliated with the Advisor, plus specified amounts to the Board Chairperson and Vice Chairperson and to each committee Chairperson.
E. Line of Credit
The Fund and other affiliated funds (the "Participants") share in a $375 million revolving credit facility provided by a syndication of banks. The Fund may borrow for temporary or emergency purposes, including the meeting of redemption requests that otherwise might require the untimely disposition of securities. The Participants are charged an annual commitment fee which is allocated based on net assets, among each of the Participants. Interest is calculated at a rate per annum equal to the sum of the Federal Funds Rate plus 1.25 percent plus, if LIBOR exceeds the Federal Funds Rate, the amount of such excess. The Fund may borrow up to a maximum of 33 percent of its net assets under the agreement. The Fund had no outstanding loans at May 31, 2013.
F. Share Transactions
The following table summarizes share and dollar activity in the Fund:
| Year Ended May 31, 2013 | Year Ended May 31, 2012 | |||||||||||||||
| Shares | Dollars | Shares | Dollars | |||||||||||||
| Shares sold | ||||||||||||||||
| Class A | 51,664,613 | $ | 492,848,473 | 40,664,159 | $ | 370,789,938 | ||||||||||
| Class B | 10,256 | 97,492 | 8,787 | 80,838 | ||||||||||||
| Class C | 13,269,115 | 126,549,176 | 11,913,160 | 108,777,602 | ||||||||||||
| Class S | 74,007,978 | 706,295,817 | 44,986,024 | 410,020,474 | ||||||||||||
| Institutional Class | 13,657,554 | 129,713,521 | 12,280,424 | 111,414,970 | ||||||||||||
| $ | 1,455,504,479 | $ | 1,001,083,822 | |||||||||||||
| Shares issued to shareholders in reinvestment of distributions | ||||||||||||||||
| Class A | 7,899,704 | $ | 75,255,746 | 7,835,641 | $ | 71,302,377 | ||||||||||
| Class B | 9,454 | 90,071 | 13,258 | 120,422 | ||||||||||||
| Class C | 743,095 | 7,080,783 | 572,413 | 5,216,355 | ||||||||||||
| Class S | 6,937,441 | 66,184,838 | 6,867,551 | 62,576,708 | ||||||||||||
| Institutional Class | 738,708 | 7,043,257 | 409,859 | 3,746,510 | ||||||||||||
| $ | 155,654,695 | $ | 142,962,372 | |||||||||||||
| Shares redeemed | ||||||||||||||||
| Class A | (36,995,400 | ) | $ | (352,574,363 | ) | (27,833,329 | ) | $ | (253,023,678 | ) | ||||||
| Class B | (79,943 | ) | (759,850 | ) | (129,115 | ) | (1,164,342 | ) | ||||||||
| Class C | (5,264,670 | ) | (50,171,138 | ) | (3,482,289 | ) | (31,588,550 | ) | ||||||||
| Class S | (44,848,426 | ) | (427,771,466 | ) | (41,692,110 | ) | (379,578,940 | ) | ||||||||
| Institutional Class | (5,168,275 | ) | (49,243,540 | ) | (4,488,471 | ) | (41,137,379 | ) | ||||||||
| $ | (880,520,357 | ) | $ | (706,492,889 | ) | |||||||||||
| Net increase (decrease) | ||||||||||||||||
| Class A | 22,568,917 | $ | 215,529,856 | 20,666,471 | $ | 189,068,637 | ||||||||||
| Class B | (60,233 | ) | (572,287 | ) | (107,070 | ) | (963,082 | ) | ||||||||
| Class C | 8,747,540 | 83,458,821 | 9,003,284 | 82,405,407 | ||||||||||||
| Class S | 36,096,993 | 344,709,189 | 10,161,465 | 93,018,242 | ||||||||||||
| Institutional Class | 9,227,987 | 87,513,238 | 8,201,812 | 74,024,101 | ||||||||||||
| $ | 730,638,817 | $ | 437,553,305 | |||||||||||||
To the Trustees of DWS Municipal Trust and the Shareholders of DWS Managed Municipal Bond Fund:
In our opinion, the accompanying statement of assets and liabilities, including the investment portfolio, and the related statements of operations, of cash flows and of changes in net assets and the financial highlights present fairly, in all material respects, the financial position of DWS Managed Municipal Bond Fund (the "Fund") at May 31, 2013, and the results of its operations, its cash flows, the changes in its net assets and the financial highlights for each of the periods indicated therein, in conformity with accounting principles generally accepted in the United States of America. These financial statements and financial highlights (hereafter referred to as "financial statements") are the responsibility of the Fund's management. Our responsibility is to express an opinion on these financial statements based on our audits. We conducted our audits of these financial statements in accordance with the standards of the Public Company Accounting Oversight Board (United States). Those standards require that we plan and perform the audit to obtain reasonable assurance about whether the financial statements are free of material misstatement. An audit includes examining, on a test basis, evidence supporting the amounts and disclosures in the financial statements, assessing the accounting principles used and significant estimates made by management, and evaluating the overall financial statement presentation. We believe that our audits, which included confirmation of securities at May 31, 2013 by correspondence with the custodian and brokers, provide a reasonable basis for our opinion.
Boston, Massachusetts July 24, 2013 | PricewaterhouseCoopers LLP |
As an investor of the Fund, you incur two types of costs: ongoing expenses and transaction costs. Ongoing expenses include management fees, distribution and service (12b-1) fees and other Fund expenses. Examples of transaction costs include sales charges (loads) and account maintenance fees, which are not shown in this section. The following tables are intended to help you understand your ongoing expenses (in dollars) of investing in the Fund and to help you compare these expenses with the ongoing expenses of investing in other mutual funds. The example in the table is based on an investment of $1,000 invested at the beginning of the six-month period and held for the entire period (December 1, 2012 to May 31, 2013).
The tables illustrate your Fund's expenses in two ways:
•Actual Fund Return. This helps you estimate the actual dollar amount of ongoing expenses (but not transaction costs) paid on a $1,000 investment in the Fund using the Fund's actual return during the period. To estimate the expenses you paid over the period, simply divide your account value by $1,000 (for example, an $8,600 account value divided by $1,000 = 8.6), then multiply the result by the number in the "Expenses Paid per $1,000" line under the share class you hold.
•Hypothetical 5% Fund Return. This helps you to compare your Fund's ongoing expenses (but not transaction costs) with those of other mutual funds using the Fund's actual expense ratio and a hypothetical rate of return of 5% per year before expenses. Examples using a 5% hypothetical fund return may be found in the shareholder reports of other mutual funds. The hypothetical account values and expenses may not be used to estimate the actual ending account balance or expenses you paid for the period.
Please note that the expenses shown in these tables are meant to highlight your ongoing expenses only and do not reflect any transaction costs. The "Expenses Paid per $1,000" line of the tables is useful in comparing ongoing expenses only and will not help you determine the relative total expense of owning different funds. Subject to certain exceptions, an account maintenance fee of $20.00 assessed once per calendar year for Classes A, B, C and S shares may apply for accounts with balances less than $10,000. This fee is not included in these tables. If it was, the estimate of expenses paid for Classes A, B, C and S shares during the period would be higher, and account value during the period would be lower, by this amount.
Expenses and Value of a $1,000 Investment for the six months ended May 31, 2013 (Unaudited) | ||||||||||||||||||||
| Actual Fund Return | Class A | Class B | Class C | Class S | Institutional Class | |||||||||||||||
| Beginning Account Value 12/1/12 | $ | 1,000.00 | $ | 1,000.00 | $ | 1,000.00 | $ | 1,000.00 | $ | 1,000.00 | ||||||||||
| Ending Account Value 5/31/13 | $ | 981.80 | $ | 978.10 | $ | 978.00 | $ | 982.70 | $ | 983.00 | ||||||||||
| Expenses Paid per $1,000* | $ | 3.95 | $ | 7.64 | $ | 7.84 | $ | 3.11 | $ | 2.82 | ||||||||||
| Hypothetical 5% Fund Return | Class A | Class B | Class C | Class S | Institutional Class | |||||||||||||||
| Beginning Account Value 12/1/12 | $ | 1,000.00 | $ | 1,000.00 | $ | 1,000.00 | $ | 1,000.00 | $ | 1,000.00 | ||||||||||
| Ending Account Value 5/31/13 | $ | 1,020.94 | $ | 1,017.20 | $ | 1,017.00 | $ | 1,021.79 | $ | 1,022.09 | ||||||||||
| Expenses Paid per $1,000* | $ | 4.03 | $ | 7.80 | $ | 8.00 | $ | 3.18 | $ | 2.87 | ||||||||||
* Expenses are equal to the Fund's annualized expense ratio for each share class, multiplied by the average account value over the period, multiplied by 182 (the number of days in the most recent six-month period), then divided by 365.
| Annualized Expense Ratios | Class A | Class B | Class C | Class S | Institutional Class |
DWS Managed Municipal Bond Fund† | .80% | 1.55% | 1.59% | .63% | .57% |
† Includes interest expense and fees on short-term floating rate notes issued in conjunction with inverse floating rate securities of 0.05% for each class.
For more information, please refer to the Fund's prospectus.
For an analysis of the fees associated with an investment in the Fund or similar funds, please refer to http://apps.finra.org/fundanalyzer/1/fa.aspx.
Of the dividends paid from net investment income for the taxable year ended May 31, 2013, 100% are designated as exempt interest dividends for federal income tax purposes.
Please consult a tax advisor if you have questions about federal or state income tax laws, or on how to prepare your tax returns. If you have specific questions about your account, please call (800) 728-3337.
September 17, 2012
Pursuant to an Order entered into by Deutsche Investment Management Americas and affiliates (collectively, "DeAM") with the Attorney General of New York, I, Thomas H. Mack, have been appointed the Independent Fee Consultant for the DWS Funds (formerly the DWS Scudder Funds). My duties include preparing an annual written evaluation of the management fees DeAM charges the Funds, considering among other factors the management fees charged by other mutual fund companies for like services, management fees DeAM charges other clients for like services, DeAM's costs of supplying services under the management agreements and related profit margins, possible economies of scale if a Fund grows larger, and the nature and quality of DeAM's services, including fund performance. This report summarizes my evaluation for 2012, including my qualifications, the evaluation process for each of the DWS Funds, consideration of certain complex-level factors, and my conclusions. I served in substantially the same capacity in 2007, 2008, 2009, 2010 and 2011.
Qualifications
For more than 35 years I have served in various professional capacities within the investment management business. I have held investment analysis and advisory positions, including securities analyst, portfolio strategist and director of investment policy with a large investment firm. I have also performed business management functions, including business development, financial management and marketing research and analysis.
Since 1991, I have been an independent consultant within the asset management industry. I have provided services to over 125 client organizations, including investment managers, mutual fund boards, product distributors and related organizations. Over the past ten years I have completed a number of assignments for mutual fund boards, specifically including assisting boards with management contract renewal.
I hold a Master of Business Administration degree, with highest honors, from Harvard University and Master of Science and Bachelor of Science (highest honors) degrees from the University of California at Berkeley. I am an independent director and audit committee financial expert for two closed-end mutual funds and have served in various leadership and financial oversight capacities with non-profit organizations.
Evaluation of Fees for each DWS Fund
My work focused primarily on evaluating, fund-by-fund, the fees charged to each of the 103 mutual fund portfolios in the DWS Fund family. For each Fund, I considered each of the key factors mentioned above, as well as any other relevant information. In doing so I worked closely with the Funds' Independent Directors in their annual contract renewal process, as well as in their approval of contracts for several new funds (documented separately).
In evaluating each Fund's fees, I reviewed comprehensive materials provided by or on behalf of DeAM, including expense information prepared by Lipper Analytical, comparative performance information, profitability data, manager histories, and other materials. I also accessed certain additional information from the Lipper and Morningstar databases and drew on my industry knowledge and experience.
To facilitate evaluating this considerable body of information, I prepared for each Fund a document summarizing the key data elements in each area as well as additional analytics discussed below. This made it possible to consider each key data element in the context of the others.
In the course of contract renewal, DeAM agreed to implement a number of fee and expense adjustments requested by the Independent Directors which will favorably impact future fees and expenses, and my evaluation includes the effects of these changes.
Fees and Expenses Compared with Other Funds
The competitive fee and expense evaluation for each fund focused on two primary comparisons:
The Fund's contractual management fee (the advisory fee plus the administration fee where applicable) compared with those of a group of typically 12-15 funds in the same Lipper investment category (e.g. Large Capitalization Growth) having similar distribution arrangements and being of similar size.
The Fund's total expenses compared with a broader universe of funds from the same Lipper investment category and having similar distribution arrangements.
These two comparisons provide a view of not only the level of the fee compared with funds of similar scale but also the total expense the Fund bears for all the services it receives, in comparison with the investment choices available in the Fund's investment category and distribution channel. The principal figure-of-merit used in these comparisons was the subject Fund's percentile ranking against peers.
DeAM's Fees for Similar Services to Others
DeAM provided management fee schedules for all of its US domiciled fund and non-fund investment management accounts in any of the investment categories where there is a DWS Fund. These similar products included the other DWS Funds, non-fund pooled accounts, institutional accounts and sub-advisory accounts. Using this information, I calculated for each Fund the fee that would be charged to each similar product, at the subject Fund's asset level.
Evaluating information regarding non-fund products is difficult because there are varying levels of services required for different types of accounts, with mutual funds generally requiring considerably more regulatory and administrative types of service as well as having more frequent cash flows than other types of accounts. Also, while mutual fund fees for similar fund products can be expected to be similar, there will be some differences due to different pricing conditions in different distribution channels (e.g. retail funds versus those used in variable insurance products), differences in underlying investment processes and other factors.
Costs and Profit Margins
DeAM provided a detailed profitability analysis for each Fund. After making some adjustments so that the presentation would be more comparable to the available industry figures, I reviewed profit margins from investment management alone, from investment management plus other fund services (excluding distribution) provided to the Funds by DeAM (principally shareholder services), and DeAM profits from all sources, including distribution. A later section comments on overall profitability.
Economies of Scale
Economies of scale — an expected decline in management cost per dollar of fund assets as fund assets grow — are very rarely quantified and documented because of inherent difficulties in collecting and analyzing relevant data. However, in virtually every investment category that I reviewed, larger funds tend to have lower fees and lower total expenses than smaller funds. To see how each DWS Fund compares with this industry observation, I reviewed:
The trend in Fund assets over the last five years and the accompanying trend in total expenses. This shows if the Fund has grown and, if so, whether total expense (management fees as well as other expenses) have declined as a percent of assets.
Whether the Fund has break-points in its management fee schedule, the extent of the fee reduction built into the schedule and the asset levels where the breaks take effect, and in the case of a sub-advised Fund how the Fund's break-points compare with those of the sub-advisory fee schedule.
How the Fund's contractual fee schedule compares with trends in the industry data. To accomplish this, I constructed a chart showing how actual latest-fiscal-year contractual fees of the Fund and of other similar funds relate to average fund assets, with the subject Fund's contractual fee schedule superimposed.
Quality of Service — Performance
The quality-of-service evaluation focused on investment performance, which is the principal result of the investment management service. Each Fund's performance was reviewed over the past 1, 3, 5 and 10 years, as applicable, and compared with that of other funds in the same investment category and with a suitable market index.
In addition, I calculated and reviewed risk-adjusted returns relative to an index of similar mutual funds' returns and a suitable market index. The risk-adjusted returns analysis provides a way of determining the extent to which the Fund's return comparisons are mainly the product of investment value-added (or lack thereof) or alternatively taking considerably more or less risk than is typical in its investment category.
I also received and considered the history of portfolio manager changes for each Fund, as this provided an important context for evaluating the performance results.
Complex-Level Considerations
While this evaluation was conducted mainly at the individual fund level, there are some issues relating to the reasonableness of fees that can alternatively be considered across the whole fund complex:
I reviewed DeAM's profitability analysis for all DWS Funds, with a view toward determining if the allocation procedures used were reasonable and how profit levels compared with public data for other investment managers.
I considered whether DeAM and affiliates receive any significant ancillary or "fallout" benefits that should be considered in interpreting the direct profitability results. These would be situations where serving as the investment manager of the Funds is beneficial to another part of the Deutsche Bank organization.
I considered how aggregated DWS Fund expenses had varied over the years, by asset class and in the context of trends in asset levels.
I considered how aggregated DWS Fund performance measures relative to appropriate peers had varied by asset class and over time.
I reviewed the structure of the DeAM organization, trends in staffing levels, and information on compensation of investment management and other professionals compared with industry data.
Findings
Based on the process and analysis discussed above, which included reviewing a wide range of information from management and external data sources and considering among other factors the fees DeAM charges other clients, the fees charged by other fund managers, DeAM's costs and profits associated with managing the Funds, economies of scale, possible fall-out benefits, and the nature and quality of services provided, in my opinion the management fees charged the DWS Funds are reasonable.

Thomas H. Mack
President, Thomas H. Mack & Co., Inc.
The following table presents certain information regarding the Board Members and Officers of the fund. Each Board Member's year of birth is set forth in parentheses after his or her name. Unless otherwise noted, (i) each Board Member has engaged in the principal occupation(s) noted in the table for at least the most recent five years, although not necessarily in the same capacity; and (ii) the address of each Independent Board Member is c/o Kenneth C. Froewiss, Chairman, DWS Mutual Funds, P.O. Box 78, Short Hills, NJ 07078. Except as otherwise noted below, the term of office for each Board Member is until the election and qualification of a successor, or until such Board Member sooner dies, resigns, is removed or as otherwise provided in the governing documents of the fund. Because the fund does not hold an annual meeting of shareholders, each Board Member will hold office for an indeterminate period. The Board Members may also serve in similar capacities with other funds in the fund complex.
| Independent Board Members | ||||
Name, Year of Birth, Position with the Fund and Length of Time Served1 | Business Experience and Directorships During the Past Five Years | Number of Funds in DWS Fund Complex Overseen | Other Directorships Held by Board Member | |
Kenneth C. Froewiss (1945) Chairperson since 2013,9 and Board Member since 2001 | Adjunct Professor of Finance, NYU Stern School of Business (September 2009-present; Clinical Professor from 1997-September 2009); Member, Finance Committee, Association for Asian Studies (2002-present); Director, Mitsui Sumitomo Insurance Group (US) (2004-present); prior thereto, Managing Director, J.P. Morgan (investment banking firm) (until 1996) | 102 | — | |
William McClayton (1944) Vice Chairperson since 2013,9 and Board Member since 2004 | Private equity investor (since October 2009); previously, Managing Director, Diamond Management & Technology Consultants, Inc. (global consulting firm) (2001-2009); Directorship: Board of Managers, YMCA of Metropolitan Chicago; formerly: Senior Partner, Arthur Andersen LLP (accounting) (1966-2001); Trustee, Ravinia Festival | 102 | — | |
John W. Ballantine (1946) Board Member since 1999 | Retired; formerly, Executive Vice President and Chief Risk Management Officer, First Chicago NBD Corporation/The First National Bank of Chicago (1996-1998); Executive Vice President and Head of International Banking (1995-1996); former Directorships: Stockwell Capital Investments PLC (private equity); First Oak Brook Bancshares, Inc. and Oak Brook Bank; Prisma Energy International | 102 | Chairman of the Board, Healthways, Inc.2 (provider of disease and care management services) (2003- present); Portland General Electric2 (utility company) (2003- present) | |
Henry P. Becton, Jr. (1943) Board Member since 1990 | Vice Chair and former President, WGBH Educational Foundation. Directorships: Public Radio International; Public Radio Exchange (PRX); The PBS Foundation; North Bennett Street School (Boston); former Directorships: Association of Public Television Stations; Boston Museum of Science; American Public Television; Concord Academy; New England Aquarium; Mass. Corporation for Educational Telecommunications; Committee for Economic Development; Public Broadcasting Service; Connecticut College | 102 | Lead Director, Becton Dickinson and Company2 (medical technology company); Lead Director, Belo Corporation2 (media company) | |
Dawn-Marie Driscoll (1946) Board Member since 1987 | President, Driscoll Associates (consulting firm); Emeritus Executive Fellow, Center for Business Ethics, Bentley University; formerly, Partner, Palmer & Dodge (1988-1990); Vice President of Corporate Affairs and General Counsel, Filene's (1978-1988). Directorships: Director of ICI Mutual Insurance Company (since 2007); Advisory Board, Center for Business Ethics, Bentley University; Chairman of the Board of Trustees, Southwest Florida Community Foundation (charitable organization); former Directorships: Sun Capital Advisers Trust (mutual funds) (2007-2012), Investment Company Institute (audit, executive, nominating committees) and Independent Directors Council (governance, executive committees) | 102 | — | |
Keith R. Fox, CFA (1954) Board Member since 1996 | Managing General Partner, Exeter Capital Partners (a series of private investment funds) (since 1986). Directorships: Progressive International Corporation (kitchen goods importer and distributor); The Kennel Shop (retailer); former Chairman, National Association of Small Business Investment Companies; former Directorships: BoxTop Media Inc. (advertising); Sun Capital Advisers Trust (mutual funds) (2011-2012) | 102 | — | |
Paul K. Freeman (1950) Board Member since 1993, and Chairperson (2009-Jan. 8, 2013) | Consultant, World Bank/Inter-American Development Bank; Executive and Governing Council of the Independent Directors Council (Chairman of Education Committee); formerly: Project Leader, International Institute for Applied Systems Analysis (1998-2001); Chief Executive Officer, The Eric Group, Inc. (environmental insurance) (1986-1998); Directorships: Denver Zoo Foundation (December 2012-present); former Directorships: Prisma Energy International | 102 | — | |
Richard J. Herring (1946) Board Member since 1990 | Jacob Safra Professor of International Banking and Professor, Finance Department, The Wharton School, University of Pennsylvania (since July 1972); Co-Director, Wharton Financial Institutions Center (since July 2000); Co-Chair, U.S. Shadow Financial Regulatory Committee; Executive Director, Financial Economists Roundtable; formerly: Vice Dean and Director, Wharton Undergraduate Division (July 1995-June 2000); Director, Lauder Institute of International Management Studies (July 2000-June 2006) | 102 | Director, Japan Equity Fund, Inc. (since September 2007), Thai Capital Fund, Inc. (since 2007), Singapore Fund, Inc. (since September 2007), Independent Director of Barclays Bank Delaware (since September 2010) | |
Rebecca W. Rimel (1951) Board Member since 1995 | President and Chief Executive Officer, The Pew Charitable Trusts (charitable organization) (1994 to present); formerly: Executive Vice President, The Glenmede Trust Company (investment trust and wealth management) (1983-2004); Board Member, Investor Education (charitable organization) (2004-2005); Trustee, Executive Committee, Philadelphia Chamber of Commerce (2001-2007); Director, Viasys Health Care2 (January 2007-June 2007); Trustee, Thomas Jefferson Foundation (charitable organization) (1994-2012) | 102 | Director, Becton Dickinson and Company2 (medical technology company) (2012- present); Director, CardioNet, Inc.2 (health care) (2009- present) | |
William N. Searcy, Jr. (1946) Board Member since 1993 | Private investor since October 2003; formerly: Pension & Savings Trust Officer, Sprint Corporation2 (telecommunications) (November 1989-September 2003); Trustee, Sun Capital Advisers Trust (mutual funds) (1998-2012) | 102 | — | |
Jean Gleason Stromberg (1943) Board Member since 1997 | Retired. Formerly, Consultant (1997-2001); Director, Financial Markets U.S. Government Accountability Office (1996-1997); Partner, Fulbright & Jaworski, L.L.P. (law firm) (1978-1996). Directorships: The William and Flora Hewlett Foundation; former Directorships: Service Source, Inc., Mutual Fund Directors Forum (2002-2004), American Bar Retirement Association (funding vehicle for retirement plans) (1987-1990 and 1994-1996) | 102 | — | |
Robert H. Wadsworth (1940) Board Member since 1999 | President, Robert H. Wadsworth & Associates, Inc. (consulting firm) (1983 to present); Director, National Horizon, Inc. (non-profit organization); Director and Treasurer, The Phoenix Boys Choir Association | 105 | — | |
Interested Board Member and Officer4 | ||||
Name, Year of Birth, Position with the Fund and Length of Time Served1,6 | Business Experience and Directorships During the Past Five Years | Number of Funds in DWS Fund Complex Overseen | Other Directorships Held by Board Member | |
Michael J. Woods5 (1967) Board Member since 2013,9 and Executive Vice President since 20139 | Managing Director,3 Deutsche Asset & Wealth Management (2009-present); Head of the Americas Asset Management Business for Deutsche Bank, Member of the Asset and Wealth Management ("AWM") Extended Executive Committee, AWM Global Client Group Executive Committee and the AWM Active Asset Management Executive Committee; CEO and US Regional Head of DWS Investments; formerly: Sr. VP, Head of the Financial Intermediaries and Investments Group of Evergreen Investments (2007-2009), CEO and Vice Chairman of Board of Directors of XTF Global Asset Management (2006-2007), Managing Director — US Head of Sub-Advisory and Investment Only Business at Citigroup Asset Management (2000-2006). Mr. Woods is currently a board member of The Children's Village, The Big Brothers Big Sisters Organization, and The Mutual Fund Education Alliance. | 38 | — | |
Officers4 | ||
Name, Year of Birth, Position with the Fund and Length of Time Served6 | Business Experience and Directorships During the Past Five Years | |
W. Douglas Beck, CFA7 (1967) President, 2011-present | Managing Director,3 Deutsche Asset & Wealth Management (2006-present); President of DWS family of funds and Head of Product Management, U.S. for DWS Investments; formerly: Executive Director, Head of Product Management (2002-2006) and President (2005-2006) of the UBS Funds at UBS Global Asset Management; Co-Head of Manager Research/Managed Solutions Group, Merrill Lynch (1998-2002) | |
John Millette8 (1962) Vice President and Secretary, 1999-present | Director,3 Deutsche Asset & Wealth Management | |
Paul H. Schubert7 (1963) Chief Financial Officer, 2004-present Treasurer, 2005-present | Managing Director,3 Deutsche Asset & Wealth Management (since July 2004); formerly: Executive Director, Head of Mutual Fund Services and Treasurer for UBS Family of Funds (1998-2004); Vice President and Director of Mutual Fund Finance at UBS Global Asset Management (1994-1998) | |
Caroline Pearson8 (1962) Chief Legal Officer, 2010-present | Managing Director,3 Deutsche Asset & Wealth Management; formerly: Assistant Secretary for DWS family of funds (1997-2010) | |
Melinda Morrow7 (1970) Vice President, 2012-present | Director,3 Deutsche Asset & Wealth Management | |
Hepsen Uzcan8 (1974) Assistant Secretary, since 20139 | Vice President, Deutsche Asset & Wealth Management | |
Paul Antosca8 (1957) Assistant Treasurer, 2007-present | Director,3 Deutsche Asset & Wealth Management | |
Jack Clark8 (1967) Assistant Treasurer, 2007-present | Director,3 Deutsche Asset & Wealth Management | |
Diane Kenneally8 (1966) Assistant Treasurer, 2007-present | Director,3 Deutsche Asset & Wealth Management | |
John Caruso7 (1965) Anti-Money Laundering Compliance Officer, 2010-present | Managing Director,3 Deutsche Asset & Wealth Management | |
Robert Kloby7 (1962) Chief Compliance Officer, 2006-present | Managing Director,3 Deutsche Asset & Wealth Management | |
1 The length of time served represents the year in which the Board Member joined the board of one or more DWS funds currently overseen by the Board.
2 A publicly held company with securities registered pursuant to Section 12 of the Securities Exchange Act of 1934.
3 Executive title, not a board directorship.
4 As a result of their respective positions held with the Advisor, these individuals are considered "interested persons" of the Advisor within the meaning of the 1940 Act. Interested persons receive no compensation from the fund.
5 The mailing address of Mr. Woods is 60 Wall Street, New York, New York 10005. Mr. Woods is an interested Board Member by virtue of his positions with Deutsche Asset & Wealth Management. As an interested person, Mr. Woods receives no compensation from the fund. Mr. Woods is a board member of the following trusts and corporations: Cash Account Trust, DWS Market Trust, DWS Money Funds, DWS State Tax-Free Income Series, DWS Target Fund, DWS Value Series, Inc., DWS Variable Series II, Investors Cash Trust, Tax-Exempt California Money Market Fund, DWS Global High Income Fund, Inc., DWS High Income Opportunities Fund, Inc., DWS High Income Trust, DWS Multi-Market Income Trust, DWS Municipal Income Trust, DWS Strategic Income Trust and DWS Strategic Municipal Income Trust.
6 The length of time served represents the year in which the officer was first elected in such capacity for one or more DWS funds.
7 Address: 60 Wall Street, New York, NY 10005.
8 Address: One Beacon Street, Boston, MA 02108.
9 Effective as of January 9, 2013.
The fund's Statement of Additional Information ("SAI") includes additional information about the Board Members. The SAI is available, without charge, upon request. If you would like to request a copy of the SAI, you may do so by calling the following toll-free number: (800) 728-3337.
| For More Information | The automated telephone system allows you to access personalized account information and obtain information on other DWS funds using either your voice or your telephone keypad. Certain account types within Classes A, B, C and S also have the ability to purchase, exchange or redeem shares using this system. For more information, contact your financial advisor. You may also access our automated telephone system or speak with a DWS Investments representative by calling: (800) 728-3337 | |
| Web Site | www.dws-investments.com View your account transactions and balances, trade shares, monitor your asset allocation, and change your address, 24 hours a day. Obtain prospectuses and applications, blank forms, interactive worksheets, news about DWS funds, subscription to fund updates by e-mail, retirement planning information, and more. | |
| Written Correspondence | DWS Investments PO Box 219151 Kansas City, MO 64121-9151 | |
| Proxy Voting | The fund's policies and procedures for voting proxies for portfolio securities and information about how the fund voted proxies related to its portfolio securities during the 12-month period ended June 30 are available on our Web site — www.dws-investments.com (click on "proxy voting"at the bottom of the page) — or on the SEC's Web site — www.sec.gov. To obtain a written copy of the fund's policies and procedures without charge, upon request, call us toll free at (800) 728-3337. | |
| Portfolio Holdings | Following the fund's fiscal first and third quarter-end, a complete portfolio holdings listing is filed with the SEC on Form N-Q. This form will be available on the SEC's Web site at www.sec.gov, and it also may be reviewed and copied at the SEC's Public Reference Room in Washington, D.C. Information on the operation of the SEC's Public Reference Room may be obtained by calling (800) SEC-0330. The fund's portfolio holdings are also posted on www.dws-investments.com from time to time. Please see the fund's current prospectus for more information. | |
| Principal Underwriter | If you have questions, comments or complaints, contact: DWS Investments Distributors, Inc. 222 South Riverside Plaza Chicago, IL 60606-5808 (800) 621-1148 | |
| Investment Management | Deutsche Investment Management Americas Inc. ("DIMA" or the "Advisor"), which is part of Deutsche Asset & Wealth Management, is the investment advisor for the fund. DIMA and its predecessors have more than 80 years of experience managing mutual funds and DIMA provides a full range of investment advisory services to both institutional and retail clients. DIMA is an indirect, wholly owned subsidiary of Deutsche Bank AG. Deutsche Bank AG is a major global banking institution engaged in a wide variety of financial services, including investment management, retail, private and commercial banking, investment banking and insurance. DWS Investments is the retail brand name in the U.S. for the asset management activities of Deutsche Bank AG and DIMA. As such, DWS is committed to delivering the investing expertise, insight and resources of this global investment platform to American investors. | |
| Class A | Class B | Class C | Class S | Institutional Class | ||
| Nasdaq Symbol | SMLAX | SMLBX | SMLCX | SCMBX | SMLIX | |
| CUSIP Number | 23337W-709 | 23337W-808 | 23337W-881 | 23337W-865 | 23337W-857 | |
| Fund Number | 466 | 666 | 766 | 2066 | 544 |

| ITEM 2. | CODE OF ETHICS |
As of the end of the period covered by this report, the registrant has adopted a code of ethics, as defined in Item 2 of Form N-CSR, that applies to its Principal Executive Officer and Principal Financial Officer. There have been no amendments to, or waivers from, a provision of the code of ethics during the period covered by this report that would require disclosure under Item 2. A copy of the code of ethics is filed as an exhibit to this Form N-CSR. | |
| ITEM 3. | AUDIT COMMITTEE FINANCIAL EXPERT |
| The fund’s audit committee is comprised solely of trustees who are "independent" (as such term has been defined by the Securities and Exchange Commission ("SEC") in regulations implementing Section 407 of the Sarbanes-Oxley Act (the "Regulations")). The fund’s Board of Trustees has determined that there are several "audit committee financial experts" (as such term has been defined by the Regulations) serving on the fund’s audit committee including Mr. Paul K. Freeman, the chair of the fund’s audit committee. An “audit committee financial expert” is not an “expert” for any purpose, including for purposes of Section 11 of the Securities Act of 1933 and the designation or identification of a person as an “audit committee financial expert” does not impose on such person any duties, obligations or liability that are greater than the duties, obligations and liability imposed on such person as a member of the audit committee and board of directors in the absence of such designation or identification. | |
| ITEM 4. | PRINCIPAL ACCOUNTANT FEES AND SERVICES |
DWS MANAGED MUNICIPAL BOND FUND
FORM N-CSR DISCLOSURE RE: AUDIT FEES
The following table shows the amount of fees that PricewaterhouseCoopers, LLP (“PWC”), the Fund’s independent registered public accounting firm, billed to the Fund during the Fund’s last two fiscal years. The Audit Committee approved in advance all audit services and non-audit services that PWC provided to the Fund.
Services that the Fund’s Independent Registered Public Accounting Firm Billed to the Fund
| Fiscal Year Ended May 31, | Audit Fees Billed to Fund | Audit-Related Fees Billed to Fund | Tax Fees Billed to Fund | All Other Fees Billed to Fund | ||||||||||||
| 2013 | $ | 101,703 | $ | 0 | $ | 0 | $ | 0 | ||||||||
| 2012 | $ | 96,896 | $ | 0 | $ | 0 | $ | 0 | ||||||||
“All Other Fees Billed to Fund” were billed for services associated with foreign tax filing.
Services that the Fund’s Independent Registered Public Accounting Firm Billed to the Adviser and Affiliated Fund Service Providers
The following table shows the amount of fees billed by PWC to Deutsche Investment Management Americas Inc. (“DeIM” or the “Adviser”), and any entity controlling, controlled by or under common control with DeIM (“Control Affiliate”) that provides ongoing services to the Fund (“Affiliated Fund Service Provider”), for engagements directly related to the Fund’s operations and financial reporting, during the Fund’s last two fiscal years.
| Fiscal Year Ended May 31, | Audit-Related Fees Billed to Adviser and Affiliated Fund Service Providers | Tax Fees Billed to Adviser and Affiliated Fund Service Providers | All Other Fees Billed to Adviser and Affiliated Fund Service Providers | |||||||||
| 2013 | $ | 0 | $ | 51,500 | $ | 0 | ||||||
| 2012 | $ | 0 | $ | 56,300 | $ | 0 | ||||||
The “Tax Fees Billed to the Advisor” were billed for services associated with foreign tax filings.
Non-Audit Services
The following table shows the amount of fees that PWC billed during the Fund’s last two fiscal years for non-audit services.
The Audit Committee pre-approved all non-audit services that PWC provided to the Adviser and any Affiliated Fund Service Provider that related directly to the Fund’s operations and financial reporting. The Audit Committee requested and received information from PWC about any non-audit services that PWC rendered during the Fund’s last fiscal year to the Adviser and any Affiliated Fund Service Provider. The Committee considered this information in evaluating PWC’s independence.
| Fiscal Year Ended May 31, | Total Non-Audit Fees Billed to Fund (A) | Total Non-Audit Fees billed to Adviser and Affiliated Fund Service Providers (engagements related directly to the operations and financial reporting of the Fund) (B) | Total Non-Audit Fees billed to Adviser and Affiliated Fund Service Providers (all other engagements) (C) | Total of (A), (B) and (C) | ||||||||||||
| 2013 | $ | 0 | $ | 51,500 | $ | 0 | $ | 51,500 | ||||||||
| 2012 | $ | 0 | $ | 56,300 | $ | 0 | $ | 56,300 | ||||||||
Audit Committee Pre-Approval Policies and Procedures. Generally, each Fund’s Audit Committee must pre approve (i) all services to be performed for a Fund by a Fund’s Independent Registered Public Accounting Firm and (ii) all non-audit services to be performed by a Fund’s Independent Registered Public Accounting Firm for the DIMA Entities with respect to operations and financial reporting of the Fund, except that the Chairperson or Vice Chairperson of each Fund’s Audit Committee may grant the pre-approval for non-audit services described in items (i) and (ii) above for non-prohibited services for engagements of less than $100,000. All such delegated pre approvals shall be presented to each Fund’s Audit Committee no later than the next Audit Committee meeting.
There were no amounts that were approved by the Audit Committee pursuant to the de minimis exception under Rule 2-01 of Regulation S-X.
According to the registrant’s principal Independent Registered Public Accounting Firm, substantially all of the principal Independent Registered Public Accounting Firm's hours spent on auditing the registrant's financial statements were attributed to work performed by full-time permanent employees of the principal Independent Registered Public Accounting Firm.
***
PwC advised the Fund's Audit Committee that it had identified one matter that it determined could be inconsistent with the SEC's auditor independence rules (Rule 2-01(c) of Regulation S-X). As part of a "Global Migration Support" engagement in which PwC's UK network affiliate ("PwC-UK") provided assistance to Deutsche Bank ("DB") with respect to processing internship applications for DB employees seeking short term assignments with DB in the UK, PwC-UK paid application fees on behalf of DB for six applicants at 170 pounds each (1,020 pounds in total). PwC advised the Committee that it believes that this matter did not affect its objectivity or its impartial judgment in conducting its audit and issuing a report on the financial statements of the Fund as the Fund's independent auditor and confirmed its independence under the SEC’s auditor independence rules. In reaching this conclusion, PwC noted that the engagement team was not aware of the payment of the application fees by PwC-UK and that DB reimbursed PwC-UK for the fees.
| ITEM 5. | AUDIT COMMITTEE OF LISTED REGISTRANTS | |
| Not applicable | ||
| ITEM 6. | SCHEDULE OF INVESTMENTS | |
| Not applicable | ||
| ITEM 7. | DISCLOSURE OF PROXY VOTING POLICIES AND PROCEDURES FOR CLOSED-END MANAGEMENT INVESTMENT COMPANIES | |
| Not applicable | ||
| ITEM 8. | PORTFOLIO MANAGERS OF CLOSED-END MANAGEMENT INVESTMENT COMPANIES | |
| Not applicable | ||
| ITEM 9. | PURCHASES OF EQUITY SECURITIES BY CLOSED-END MANAGEMENT INVESTMENT COMPANY AND AFFILIATED PURCHASERS | |
| Not applicable | ||
| ITEM 10. | SUBMISSION OF MATTERS TO A VOTE OF SECURITY HOLDERS | |
| There were no material changes to the procedures by which shareholders may recommend nominees to the Fund’s Board. The primary function of the Nominating and Governance Committee is to identify and recommend individuals for membership on the Board and oversee the administration of the Board Governance Guidelines. Shareholders may recommend candidates for Board positions by forwarding their correspondence by U.S. mail or courier service to Kenneth C. Froewiss, Independent Chairman, DWS Mutual Funds, P.O. Box 78, Short Hills, NJ 07078. | ||
| ITEM 11. | CONTROLS AND PROCEDURES | |
| (a) | The Chief Executive and Financial Officers concluded that the Registrant’s Disclosure Controls and Procedures are effective based on the evaluation of the Disclosure Controls and Procedures as of a date within 90 days of the filing date of this report. | |
| (b) | There have been no changes in the registrant’s internal control over financial reporting that occurred during the second fiscal quarter of the period covered by this report that has materially affected, or is reasonably likely to materially affect, the registrant’s internal controls over financial reporting. | |
| ITEM 12. | EXHIBITS | |
| (a)(1) | Code of Ethics pursuant to Item 2 of Form N-CSR is filed and attached hereto as EX-99.CODE ETH. | |
| (a)(2) | Certification pursuant to Rule 30a-2(a) under the Investment Company Act of 1940 (17 CFR 270.30a-2(a)) is filed and attached hereto as Exhibit 99.CERT. | |
| (b) | Certification pursuant to Rule 30a-2(b) under the Investment Company Act of 1940 (17 CFR 270.30a-2(b)) is furnished and attached hereto as Exhibit 99.906CERT. | |
Form N-CSR Item F
SIGNATURES
Pursuant to the requirements of the Securities Exchange Act of 1934 and the Investment Company Act of 1940, the registrant has duly caused this report to be signed on its behalf by the undersigned, thereunto duly authorized.
| Registrant: | DWS Managed Municipal Bond Fund, a series of DWS Municipal Trust |
| By: | /s/W. Douglas Beck W. Douglas Beck President |
| Date: | July 29, 2013 |
Pursuant to the requirements of the Securities Exchange Act of 1934 and the Investment Company Act of 1940, this report has been signed below by the following persons on behalf of the registrant and in the capacities and on the dates indicated.
| By: | /s/W. Douglas Beck W. Douglas Beck President |
| Date: | July 29, 2013 |
| By: | /s/Paul Schubert Paul Schubert Chief Financial Officer and Treasurer |
| Date: | July 29, 2013 |