UNITED STATES
SECURITIES AND EXCHANGE COMMISSION
WASHINGTON, D. C. 20549
FORM N-CSRS
Investment Company Act file number: 811-02671
Deutsche DWS Municipal Trust
(Exact Name of Registrant as Specified in Charter)
875 Third Avenue
New York, NY 10022-6225
(Address of Principal Executive Offices) (Zip Code)
Registrant’s Telephone Number, including Area Code: (212) 454-4500
Diane Kenneally
100 Summer Street
Boston, MA 02110
(Name and Address of Agent for Service)
| Date of fiscal year end: | 5/31 |
| Date of reporting period: | 11/30/2020 |
| ITEM 1. | REPORT TO STOCKHOLDERS |
| (a) | |

November 30, 2020
Semiannual Report
to Shareholders
DWS Managed Municipal Bond Fund

This report must be preceded or accompanied by a prospectus. To obtain a summary prospectus, if available, or prospectus for any of our funds, refer to the Account Management Resources information provided in the back of this booklet. We advise you to consider the Fund’s objectives, risks, charges and expenses carefully before investing. The summary prospectus and prospectus contain this and other important information about the Fund. Please read the prospectus carefully before you invest.
Bond investments are subject to interest-rate, credit, liquidity and market risks to varying degrees. When interest rates rise, bond prices generally fall. Credit risk refers to the ability of an issuer to make timely payments of principal and interest. Investments in lower-quality (“junk bonds”) and non-rated securities present greater risk of loss than investments in higher-quality securities. Municipal securities are subject to the risk that litigation, legislation or other political events, local business or economic conditions or the bankruptcy of the issuer could have a significant effect on an issuer’s ability to make payments of principal and/or interest. The market for municipal bonds may be less liquid than for taxable bonds and there may be less information available on the financial condition of issuers of municipal securities than for public corporations. The Fund invests in inverse floaters, which are derivatives that involve leverage and could magnify the Fund’s gains or losses. Although the Fund seeks income that is exempt from federal income taxes, a portion of the Fund’s distributions may be subject to federal, state and local taxes, including the alternative minimum tax. Please read the prospectus for details.
War, terrorism, economic uncertainty, trade disputes, public health crises (including the recent pandemic spread of the novel coronavirus) and related geopolitical events could lead to increased market volatility, disruption to U.S. and world economies and markets and may have significant adverse effects on the Fund and its investments.
The brand DWS represents DWS Group GmbH & Co. KGaA and any of its subsidiaries such as DWS Distributors, Inc. which offers investment products or DWS Investment Management Americas, Inc. and RREEF America L.L.C. which offer advisory services.
NOT FDIC/NCUA INSURED NO BANK GUARANTEE MAY LOSE VALUE NOT A DEPOSIT NOT INSURED BY ANY FEDERAL GOVERNMENT AGENCY
| 2 | | | DWS Managed Municipal Bond Fund |
Dear Shareholder:
The outlook for economic recovery remains positive overall, buoyed by progress in the approval and distribution of coronavirus vaccines and a resolution of the 2020 elections. We still, however, have a long road ahead.
Restrictive measures are likely to remain in place, at least to some degree, until broad vaccine distribution is achieved. This suggests that full recovery might take some time. This view appears to be shared by the U.S. Federal Reserve (Fed). Despite more optimism on growth and employment, inflation is expected to remain below the 2% target. Only by 2023 are inflation and unemployment forecasts at levels that would reflect what the Fed would currently see as a full recovery.
The coming months should bring clarity regarding the Biden administration’s domestic and foreign policies. The first priority is likely to be another tranche of COVID-related fiscal support. In the first quarter, we anticipate passage of a bill built around further stimulus checks, funds for state and local governments, and enhancements to unemployment benefits, among other provisions.
Recovery suggests that long-term interest rates climb, at least modestly, and S&P earnings per share (EPS) could return to its prior peak in the second quarter of this year. That is a reasonable and constructive outlook, but it provides little help in forecasting equity returns for 2021. Fair or sustainable price-to-earnings ratios (PEs) on mid-cycle earnings remains uncertain.
As we move forward, not all sectors will benefit equally. For this reason, we believe that active management, with its close monitoring of developments, is critical. We believe that the close interaction between our portfolio managers and our CIO Office — which synthesizes the views of more than 900 DWS economists, analysts and investment professionals around the world — positions us to make strategic and tactical decisions.
We appreciate your trust and welcome the opportunity to help you navigate these unusual times. For ongoing updates to our market and economic outlook, please visit the ‘Insights’ section of dws.com.
Best regards,
 |
Hepsen Uzcan
President, DWS Funds |

Assumptions, estimates and opinions contained in this document constitute our judgment as of the date of the document and are subject to change without notice. Any projections are based on a number of assumptions as to market conditions and there can be no guarantee that any projected results will be achieved. Past performance is not a guarantee of future results.
| DWS Managed Municipal Bond Fund | | | 3 |
| Performance Summary | November 30, 2020 (Unaudited) |
| Class A | 6-Month‡ | 1-Year | 5-Year | 10-Year | ||||||||||||
| Average Annual Total Returns as of 11/30/20 | ||||||||||||||||
| Unadjusted for Sales Charge | 4.92% | 3.33% | 3.26% | 4.21% | ||||||||||||
| Adjusted for the Maximum Sales Charge (max 2.75% load) | 2.03% | 0.49% | 2.69% | 3.92% | ||||||||||||
| Bloomberg Barclays Municipal Bond Index† | 3.29% | 4.89% | 3.93% | 4.36% | ||||||||||||
| Average Annual Total Returns as of 9/30/20 (most recent calendar quarter end) |
| |||||||||||||||
| Unadjusted for Sales Charge | 1.71% | 3.08% | 3.73% | |||||||||||||
| Adjusted for the Maximum Sales Charge (max 2.75% load) | –1.08% | 2.50% | 3.44% | |||||||||||||
| Bloomberg Barclays Municipal Bond Index† | 4.09% | 3.84% | 3.99% | |||||||||||||
| Class C | 6-Month‡ | 1-Year | 5-Year | 10-Year | ||||||||||||
| Average Annual Total Returns as of 11/30/20 | ||||||||||||||||
| Unadjusted for Sales Charge | 4.50% | 2.52% | 2.45% | 3.40% | ||||||||||||
| Adjusted for the Maximum Sales Charge (max 1.00% CDSC) | 3.50% | 2.52% | 2.45% | 3.40% | ||||||||||||
| Bloomberg Barclays Municipal Bond Index† | 3.29% | 4.89% | 3.93% | 4.36% | ||||||||||||
| Average Annual Total Returns as of 9/30/20 (most recent calendar quarter end) |
| |||||||||||||||
| Unadjusted for Sales Charge | 0.92% | 2.29% | 2.92% | |||||||||||||
| Adjusted for the Maximum Sales Charge (max 1.00% CDSC) | 0.92% | 2.29% | 2.92% | |||||||||||||
| Bloomberg Barclays Municipal Bond Index† | 4.09% | 3.84% | 3.99% | |||||||||||||
| Class S | 6-Month‡ | 1-Year | 5-Year | 10-Year | ||||||||||||
| Average Annual Total Returns as of 11/30/20 | ||||||||||||||||
| No Sales Charges | 5.02% | 3.42% | 3.47% | 4.41% | ||||||||||||
| Bloomberg Barclays Municipal Bond Index† | 3.29% | 4.89% | 3.93% | 4.36% | ||||||||||||
| Average Annual Total Returns as of 9/30/20 (most recent calendar quarter end) |
| |||||||||||||||
| No Sales Charges | 1.91% | 3.30% | 3.94% | |||||||||||||
| Bloomberg Barclays Municipal Bond Index† | 4.09% | 3.84% | 3.99% | |||||||||||||
| Institutional Class | 6-Month‡ | 1-Year | 5-Year | 10-Year | ||||||||||||
| Average Annual Total Returns as of 11/30/20 | ||||||||||||||||
| No Sales Charges | 4.91% | 3.42% | 3.49% | 4.45% | ||||||||||||
| Bloomberg Barclays Municipal Bond Index† | 3.29% | 4.89% | 3.93% | 4.36% | ||||||||||||
| Average Annual Total Returns as of 9/30/20 (most recent calendar quarter end) |
| |||||||||||||||
| No Sales Charges | 1.92% | 3.33% | 3.98% | |||||||||||||
| Bloomberg Barclays Municipal Bond Index† | 4.09% | 3.84% | 3.99% | |||||||||||||
| 4 | | | DWS Managed Municipal Bond Fund |
Performance in the Average Annual Total Returns table(s) above and the Growth of an Assumed $10,000 Investment line graph that follows is historical and does not guarantee future results. Investment return and principal fluctuate, so your shares may be worth more or less when redeemed. Current performance may differ from performance data shown. Please visit dws.com for the Fund’s most recent month-end performance. Fund performance includes reinvestment of all distributions. Unadjusted returns do not reflect sales charges and would have been lower if they had.
The gross expense ratios of the Fund, as stated in the fee table of the prospectus dated October 1, 2020 are 0.76%, 1.55%, 0.62% and 0.55% for Class A, Class C, Class S and Institutional Class shares, respectively, and may differ from the expense ratios disclosed in the Financial Highlights tables in this report.
Index returns do not reflect any fees or expenses and it is not possible to invest directly into an index.
Performance figures do not reflect the deduction of taxes that a shareholder would pay on Fund distributions or the redemption of Fund shares.
A portion of the Fund’s distributions may be subject to federal, state and local taxes and the alternative minimum tax.
Generally accepted accounting principles require adjustments to be made to the net assets of the Fund at period end for financial reporting purposes only, and as such, the total return based on the unadjusted net asset value per share may differ from the total return reported in the financial highlights.
| Growth of an Assumed $10,000 Investment (Adjusted for Maximum Sales Charge) |
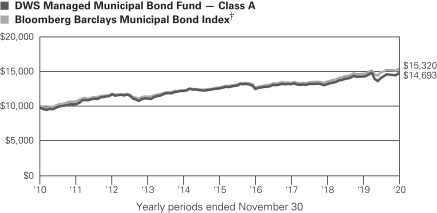
The Fund’s growth of an assumed $10,000 investment is adjusted for the maximum sales charge of 2.75%. This results in a net initial investment of $9,725.
The growth of $10,000 is cumulative.
Performance of other share classes will vary based on the sales charges and the fee structure of those classes.
| † | Bloomberg Barclays Municipal Bond Index covers the USD-denominated long-term tax exempt bond market. The index has four main sectors: state and local general obligation bonds, revenue bonds, insured bonds, and pre-refunded bonds. |
| ‡ | Total returns shown for periods less than one year are not annualized. |
| DWS Managed Municipal Bond Fund | | | 5 |
| Class A | Class C | Class S | Institutional Class | |||||||||||||
| Net Asset Value |
| |||||||||||||||
| 11/30/20 | $ | 9.29 | $ | 9.29 | $ | 9.30 | $ | 9.29 | ||||||||
| 5/31/20 | $ | 8.98 | $ | 8.98 | $ | 8.99 | $ | 8.99 | ||||||||
| Distribution Information as of 11/30/20 |
| |||||||||||||||
| Income Dividends, Six Months | $ | .13 | $ | .09 | $ | .14 | $ | .14 | ||||||||
| November Income Dividend | $ | .0212 | $ | .0150 | $ | .0227 | $ | .0227 | ||||||||
| SEC 30-day Yield‡‡ | 1.18% | 0.44% | 1.40% | 1.42% | ||||||||||||
| Tax Equivalent Yield‡‡ | 1.99% | 0.74% | 2.36% | 2.40% | ||||||||||||
| Current Annualized Distribution Rate‡‡ | 2.78% | 1.96% | 2.97% | 2.97% | ||||||||||||
| ‡‡ | The SEC yield is net investment income per share earned over the month ended November 30, 2020, shown as an annualized percentage of the maximum offering price per share on the last day of the period. The SEC yield is computed in accordance with a standardized method prescribed by the Securities and Exchange Commission. The SEC yield would have been 1.34% for Class S shares, had certain expenses not been reduced. Tax equivalent yield is based on the Fund’s yield and a marginal federal income rate of 40.8%. Current annualized distribution rate is the latest monthly dividend shown as an annualized percentage of net asset value on November 30, 2020. Distribution rate simply measures the level of dividends and is not a complete measure of performance. The current annualized distribution rate would have been 2.91% for Class S, had certain expenses not been reduced. Yields and distribution rates are historical, not guaranteed and will fluctuate. |
| 6 | | | DWS Managed Municipal Bond Fund |
Ashton P. Goodfield, CFA, Managing Director
Portfolio Manager of the Fund. Began managing the Fund in 1998.
| – | Joined DWS in 1986. |
| – | Head of Municipal Bond Department; Portfolio Manager, Municipal Bond Mutual Funds: Boston. |
| – | BA, Duke University. |
Matthew J. Caggiano, CFA, Managing Director
Portfolio Manager of the Fund. Began managing the Fund in 1999.
| – | Joined DWS in 1989. |
| – | BS, Pennsylvania State University; MS, Boston College. |
Chad Farrington, CFA, Managing Director
Portfolio Manager of the Fund. Began managing the Fund in 2018.
| – | Joined DWS in 2018 with 20 years of industry experience; previously, worked as Portfolio Manager, Head of Municipal Research, and Senior Credit Analyst at Columbia Threadneedle. |
| – | BS, Montana State University. |
Michael J. Generazo, Director
Portfolio Manager of the Fund. Began managing the Fund in 2010.
| – | Joined DWS in 1999. |
| – | BS, Bryant College; MBA, Suffolk University. |
| DWS Managed Municipal Bond Fund | | | 7 |
Effective maturity is the weighted average of the maturity date of bonds held by the Fund taking into consideration any available maturity shortening features.
Modified duration is an approximate measure of a fund’s sensitivity to movements in interest rates based on the current interest rate environment.
| Quality (As a % of Investment Portfolio excluding Open-End Investment Companies) | 11/30/20 | 5/31/20 | ||||||
| AAA | 9% | 10% | ||||||
| AA | 38% | 37% | ||||||
| A | 32% | 33% | ||||||
| BBB | 13% | 12% | ||||||
| BB | 2% | 2% | ||||||
| Not Rated | 6% | 6% | ||||||
| 100% | 100% | |||||||
The quality ratings represent the higher of Moody’s Investors Service, Inc. (“Moody’s”), Fitch Ratings, Inc. (“Fitch”) or S&P Global Ratings (“S&P”) credit ratings. The ratings of Moody’s, Fitch and S&P represent their opinions as to the quality of the securities they rate. Credit quality measures a bond issuer’s ability to repay interest and principal in a timely manner. Ratings are relative and subjective and are not absolute standards of quality. Credit quality does not remove market risk and is subject to change.
| Top Five State Allocations (As a % of Investment Portfolio excluding Open-End Investment Companies) | 11/30/20 | 5/31/20 | ||||||
New York | 18% | 16% | ||||||
Texas | 12% | 12% | ||||||
Florida | 9% | 7% | ||||||
California | 9% | 9% | ||||||
Colorado | 6% | 6% | ||||||
Portfolio holdings and characteristics are subject to change.
For more complete details about the Fund’s investment portfolio, see page 9. A quarterly Fact Sheet is available on dws.com or upon request. Please see the Account Management Resources section on page 58 for contact information.
| 8 | | | DWS Managed Municipal Bond Fund |
| Investment Portfolio | as of November 30, 2020 (Unaudited) |
| Principal Amount ($) | Value ($) | |||||||
| Municipal Bonds and Notes 98.8% | ||||||||
| Alaska 0.3% | ||||||||
Alaska, State Industrial Development & Export Authority Revenue, Providence Health Services, Series A, 5.5%, 10/1/2041 | 11,000,000 | 11,328,020 | ||||||
| Arizona 1.0% | ||||||||
Arizona, Salt Verde Financial Corp., Gas Revenue: | ||||||||
5.0%, 12/1/2032, GTY: Citigroup Global Markets | 1,600,000 | 2,141,776 | ||||||
5.0%, 12/1/2037, GTY: Citigroup Global Markets | 8,405,000 | 11,893,663 | ||||||
Arizona, State Industrial Development Authority, 2nd Tier Great Lakes Senior Living Revenue Communities Project, Series B, 5.0%, 1/1/2049 | 1,400,000 | 1,133,510 | ||||||
Arizona, State Industrial Development Authority, Education Facility Revenue, Odyssey Preparatory Academy Project, 144A, 5.0%, 7/1/2049 | 5,490,000 | 5,916,628 | ||||||
Arizona, State Industrial Development Authority, Senior Living Revenue, Great Lakes Senior Living Communities, Series A, 4.5%, 1/1/2049 | 3,750,000 | 3,042,637 | ||||||
Maricopa County, AZ, Industrial Development Authority, Education Revenue, Legacy Traditional Schools Project, Series B, 144A, 5.0%, 7/1/2049 | 4,560,000 | 5,077,378 | ||||||
Phoenix, AZ, Civic Improvement Corp., Rental Car Facility Charge Revenue, Series A, 4.0%, 7/1/2045 | 5,000,000 | 5,251,950 | ||||||
Pima County, AZ, Industrial Development Authority, Education Revenue, American Leadership Academy Project: | ||||||||
144A, 5.0%, 6/15/2049 | 1,445,000 | 1,505,285 | ||||||
144A, 5.0%, 6/15/2052 | 2,995,000 | 3,077,002 | ||||||
|
| |||||||
| 39,039,829 | ||||||||
| California 8.6% | ||||||||
California, Community Housing Agency, Essential Housing Revenue, Verdant at Green Valley Project, Series A, 144A, 5.0%, 8/1/2049 | 9,500,000 | 10,549,180 | ||||||
California, Golden State Tobacco Securitization Corp., Tobacco Settlement Revenue: | ||||||||
Series A, 5.0%, 6/1/2040 | 11,765,000 | 13,696,460 | ||||||
Series A-1, 5.0%, 6/1/2047 | 1,725,000 | 1,780,390 | ||||||
Series A-2, 5.0%, 6/1/2047 | 7,875,000 | 8,127,866 | ||||||
California, M-S-R Energy Authority, Series B, 7.0%, 11/1/2034, GTY: Citigroup Global Markets | 15,315,000 | 24,463,262 | ||||||
California, Morongo Band of Mission Indians Revenue, Series B, 144A, 5.0%, 10/1/2042 | 2,395,000 | 2,644,272 | ||||||
The accompanying notes are an integral part of the financial statements.
| DWS Managed Municipal Bond Fund | | | 9 |
| Principal Amount ($) | Value ($) | |||||||
California, Nuveen Dividend Advantage Municipal Fund, Series 6, 144A, AMT, 0.21%**, 12/7/2020, LIQ: JP Morgan Chase Bank NA | 700,000 | 700,000 | ||||||
California, Public Finance Authority Revenue, Sharp Healthcare Obligated Group, Series B, 0.06%**, 12/1/2020, LOC: Barclays Bank PLC | 100,000 | 100,000 | ||||||
California, River Islands Public Financing Authority, Special Tax, Community Facilities District No. 2019-1, Phase 2 Public Improvements: | ||||||||
3.875%, 9/1/2049 | 1,560,000 | 1,599,936 | ||||||
4.0%, 9/1/2046 | 2,905,000 | 3,050,889 | ||||||
California, State General Obligation: | ||||||||
Series B6, 0.05%**, 12/1/2020, LOC: U.S. Bank NA | 2,750,000 | 2,750,000 | ||||||
Series A-3, 0.06%**, 12/1/2020, LOC: Bank of Montreal | 600,000 | 600,000 | ||||||
5.0%, 2/1/2032 | 25,000,000 | 26,342,500 | ||||||
5.0%, 2/1/2033 | 8,000,000 | 8,427,680 | ||||||
5.25%, 4/1/2035 | 15,340,000 | 16,321,300 | ||||||
California, State General Obligation, Various Purposes: | ||||||||
5.25%, 9/1/2026 | 18,765,000 | 19,473,567 | ||||||
5.25%, 9/1/2030 | 5,000,000 | 5,184,200 | ||||||
5.25%, 10/1/2032 | 25,000,000 | 26,010,750 | ||||||
California, State Health Facilities Financing Authority Revenue, Advent Health Obligated Group, Series B, 0.07%**, 12/1/2020, LOC: U.S. Bank NA | 700,000 | 700,000 | ||||||
California, State Health Facilities Financing Authority Revenue, Sutter Health Obligated Group, Series A, Prerefunded, 5.0%, 8/15/2043 | 10,000,000 | 12,187,900 | ||||||
California, State Municipal Finance Authority Revenue, LINXS Apartment Project, Series A, AMT, 5.0%, 12/31/2047 | 3,200,000 | 3,733,824 | ||||||
California, State University Revenue, Series A, 5.0%, 11/1/2038 | 7,410,000 | 8,875,772 | ||||||
California, Statewide Communities Development Authority Revenue, Kaiser Permanente, Kaiser Foundation, Series A, 5.0%, 4/1/2042 | 5,295,000 | 5,577,700 | ||||||
California, Statewide Communities Development Authority Revenue, Loma Linda University Medical Center: | ||||||||
Series A, 144A, 5.0%, 12/1/2046 | 3,500,000 | 3,840,025 | ||||||
Series A, 5.25%, 12/1/2044 | 7,765,000 | 8,442,108 | ||||||
Series A, 144A, 5.5%, 12/1/2058 | 2,705,000 | 3,116,052 | ||||||
Los Angeles, CA, Department of Airports Revenue: | ||||||||
Series B, AMT, 5.0%, 5/15/2029 | 8,625,000 | 11,001,101 | ||||||
Series B, AMT, 5.0%, 5/15/2030 | 5,715,000 | 7,239,533 | ||||||
Series C, AMT, 5.0%, 5/15/2030 | 3,910,000 | 4,883,043 | ||||||
Series C, AMT, 5.0%, 5/15/2031 | 3,910,000 | 4,863,649 | ||||||
The accompanying notes are an integral part of the financial statements.
| 10 | | | DWS Managed Municipal Bond Fund |
| Principal Amount ($) | Value ($) | |||||||
Los Angeles, CA, Department of Airports Revenue, Los Angeles International Airport, Series D, AMT, 5.0%, 5/15/2048 | 15,000,000 | 18,431,400 | ||||||
Sacramento County, CA, Airport Systems Revenue: | ||||||||
Series C, AMT, 5.0%, 7/1/2029 | 9,455,000 | 11,819,317 | ||||||
Series C, AMT, 5.0%, 7/1/2030 | 13,690,000 | 16,978,749 | ||||||
Series C, AMT, 5.0%, 7/1/2031 | 3,500,000 | 4,316,550 | ||||||
Series C, AMT, 5.0%, 7/1/2032 | 3,000,000 | 3,676,170 | ||||||
San Diego County, CA, Regional Airport Authority Revenue, Series B, AMT, 5.0%, 7/1/2043 | 12,500,000 | 13,515,750 | ||||||
University of California, State Revenues: | ||||||||
Series O, 4.0%, 5/15/2029 | 4,165,000 | 5,142,817 | ||||||
Series O, 4.0%, 5/15/2030 | 5,000,000 | 6,118,300 | ||||||
Series O, 4.0%, 5/15/2031 | 3,335,000 | 4,052,525 | ||||||
|
| |||||||
| 330,334,537 | ||||||||
| Colorado 6.1% | ||||||||
Colorado, Certificates of Participation, Series A, 4.0%, 12/15/2035 | 5,000,000 | 5,965,900 | ||||||
Colorado, North Range Metropolitan District No. 3, 5.25%, 12/1/2050 | 3,333,000 | 3,444,389 | ||||||
Colorado, Public Energy Authority, Natural Gas Purchase Revenue, 6.5%, 11/15/2038, GTY: Merrill Lynch & Co., Inc. | 30,000,000 | 47,497,200 | ||||||
Colorado, State Health Facilities Authority Revenue, CommonSpirit Health, Series A-2, 5.0%, 8/1/2044 | 24,700,000 | 29,761,277 | ||||||
Colorado, State Health Facilities Authority Revenue, School Health Systems, Series A, 5.5%, 1/1/2035 | 16,250,000 | 18,314,237 | ||||||
Colorado, State Health Facilities Authority, Hospital Revenue, CommonSpirit Health Obligation Group, Series A-2, 4.0%, 8/1/2049 | 6,050,000 | 6,702,977 | ||||||
Colorado, State Health Facilities Authority, Hospital Revenue, Covenant Retirement Communities Obligated Group, Series A, 5.0%, 12/1/2043 | 4,890,000 | 5,654,160 | ||||||
Colorado, State Health Facilities Authority, Hospital Revenue, SCL Health System, Series A, 4.0%, 1/1/2037 | 2,615,000 | 3,084,549 | ||||||
Colorado, Trails At Crowfoot Metropolitan District No. 3, Series A, 5.0%, 12/1/2049 | 1,000,000 | 1,026,990 | ||||||
Denver City & County, CO, Airport Revenue: | ||||||||
Series A, AMT, 5.0%, 12/1/2032 | 14,335,000 | 17,868,721 | ||||||
Series A, AMT, 5.5%, 11/15/2028 | 15,000,000 | 16,901,250 | ||||||
Series A, AMT, 5.5%, 11/15/2029 | 14,705,000 | 16,527,685 | ||||||
Series A, AMT, 5.5%, 11/15/2030 | 15,080,000 | 16,911,768 | ||||||
Series A, AMT, 5.5%, 11/15/2031 | 5,000,000 | 5,593,450 | ||||||
Denver, CO, Convention Center Hotel Authority Revenue, 5.0%, 12/1/2040 | 2,770,000 | 3,076,251 | ||||||
The accompanying notes are an integral part of the financial statements.
| DWS Managed Municipal Bond Fund | | | 11 |
| Principal Amount ($) | Value ($) | |||||||
Denver, CO, Urban Renewal Authority, Tax Increment Revenue, 9th Urban Redevelopment Area, Series A, 144A, 5.25%, 12/1/2039 | 6,635,000 | 7,026,147 | ||||||
University of Colorado, Hospital Authority Revenue, Series A, 5.0%, 11/15/2042 | 26,010,000 | 27,805,210 | ||||||
|
| |||||||
| 233,162,161 | ||||||||
| Connecticut 1.7% | ||||||||
Connecticut, Harbor Point Infrastructure Improvement District, Special Obligation Revenue, Harbor Point Project, 144A, 5.0%, 4/1/2039 | 12,000,000 | 13,049,160 | ||||||
Connecticut, State General Obligation, Series C, 5.0%, 6/15/2029 | 14,690,000 | 18,953,185 | ||||||
Connecticut, State Health & Educational Facilities Authority Revenue, Covenant Home, Inc., Series B, 5.0%, 12/1/2040 | 2,610,000 | 3,048,167 | ||||||
Connecticut, State Health & Educational Facilities Authority Revenue, Hartford Healthcare, Series A, Prerefunded, 5.0%, 7/1/2041 | 5,000,000 | 5,136,500 | ||||||
Connecticut, State Health & Educational Facilities Authority Revenue, Sacred Heart University, Series K, 4.0%, 7/1/2045 | 5,595,000 | 6,285,423 | ||||||
Connecticut, State Health & Educational Facilities Authority Revenue, Stamford Hospital, Series J, 5.125%, 7/1/2035 | 18,000,000 | 18,883,800 | ||||||
|
| |||||||
| 65,356,235 | ||||||||
| Delaware 0.2% | ||||||||
Delaware, State Health Facilities Authority Revenue, BEEBE Medical Center, Inc., 5.0%, 6/1/2050 | 5,250,000 | 6,219,045 | ||||||
| District of Columbia 1.5% | ||||||||
District of Columbia, General Obligation, Series A, 5.0%, 6/1/2033 | 10,300,000 | 12,456,247 | ||||||
District of Columbia, International School Revenue: | ||||||||
5.0%, 7/1/2039 | 300,000 | 354,354 | ||||||
5.0%, 7/1/2054 | 2,425,000 | 2,791,490 | ||||||
District of Columbia, Latin American Montessori Bilingual Public Charter School, 5.0%, 6/1/2050 | 4,810,000 | 5,430,201 | ||||||
District of Columbia, Two Rivers Public Charter School, Inc.: | ||||||||
5.0%, 6/1/2050 | 3,175,000 | 3,686,429 | ||||||
5.0%, 6/1/2055 | 2,665,000 | 3,069,600 | ||||||
Metropolitan Washington, DC, Airports Authority System Revenue: | ||||||||
Series A, AMT, 5.0%, 10/1/2031 | 5,355,000 | 6,456,363 | ||||||
Series A, AMT, 5.0%, 10/1/2032 | 5,000,000 | 6,002,200 | ||||||
AMT, 5.0%, 10/1/2042 | 10,805,000 | 12,925,806 | ||||||
The accompanying notes are an integral part of the financial statements.
| 12 | | | DWS Managed Municipal Bond Fund |
| Principal Amount ($) | Value ($) | |||||||
Washington, DC, Convention & Sports Authority, Dedicated Tax Revenue: | ||||||||
Series A, 5.0%, 10/1/2029 | 1,455,000 | 1,732,920 | ||||||
Series A, 5.0%, 10/1/2030 | 1,455,000 | 1,725,659 | ||||||
|
| |||||||
| 56,631,269 | ||||||||
| Florida 8.9% | ||||||||
Broward County, FL, Airport Systems Revenue: | ||||||||
Series A, AMT, 4.0%, 10/1/2044 | 2,140,000 | 2,431,746 | ||||||
Series A, AMT, 4.0%, 10/1/2049 | 3,425,000 | 3,863,571 | ||||||
Series Q-1, Prerefunded, 5.0%, 10/1/2037 | 29,000,000 | 31,547,650 | ||||||
AMT, 5.0%, 10/1/2042 | 10,000,000 | 11,913,500 | ||||||
AMT, 5.0%, 10/1/2047 | 8,950,000 | 10,531,376 | ||||||
Davie, FL, Educational Facilities Revenue, Nova Southeastern University Project, 5.0%, 4/1/2048 | 7,345,000 | 8,628,098 | ||||||
Florida, Capital Project Finance Authority, Student Housing Revenue, Loan Program: | ||||||||
Series A-1, 5.0%, 10/1/2032 | 540,000 | 615,535 | ||||||
Series A-1, 5.0%, 10/1/2033 | 540,000 | 613,111 | ||||||
Series A-1, 5.0%, 10/1/2034 | 545,000 | 616,351 | ||||||
Series A-1, 5.0%, 10/1/2035 | 270,000 | 304,147 | ||||||
Florida, Capital Trust Agency, Senior Living Revenue, American Eagle Portfolio Project, Series A-1, 5.875%, 7/1/2054* (a) | 14,690,000 | 10,283,000 | ||||||
Florida, Development Finance Corp., Educational Facilities Revenue, Mater Academy Projects: | ||||||||
Series A, 5.0%, 6/15/2050 | 2,755,000 | 3,115,437 | ||||||
Series A, 5.0%, 6/15/2055 | 2,415,000 | 2,713,542 | ||||||
Florida, Development Finance Corp., Surface Transportation Facilities Revenue, Virgin Trains USA Passenger Rail Project: | ||||||||
Series A, 144A, AMT, 6.375%***, 1/1/2049 | 3,105,000 | 2,739,324 | ||||||
Series A, 144A, AMT, 6.5%***, 1/1/2049 | 4,040,000 | 3,572,774 | ||||||
Florida, Higher Educational Facilities Financing Authority Revenue, Ringling College Project: | ||||||||
5.0%, 3/1/2029 | 985,000 | 1,099,240 | ||||||
5.0%, 3/1/2032 | 1,105,000 | 1,217,688 | ||||||
5.0%, 3/1/2034 | 1,200,000 | 1,314,912 | ||||||
Florida, Higher Educational Facilities Financing Authority Revenue, Rollins College Project, Series A, 4.0%, 12/1/2050 | 15,000,000 | 16,860,900 | ||||||
Florida, Jacksonville Electric Authority, Electric System Revenue: | ||||||||
Series B, 4.0%, 10/1/2035 | 2,345,000 | 2,734,903 | ||||||
Series B, 4.0%, 10/1/2037 | 1,500,000 | 1,740,390 | ||||||
The accompanying notes are an integral part of the financial statements.
| DWS Managed Municipal Bond Fund | | | 13 |
| Principal Amount ($) | Value ($) | |||||||
Florida, State Higher Educational Facilities Financial Authority Revenue, Florida Institute of Technology, Series A, 4.0%, 10/1/2044 | 1,000,000 | 1,020,870 | ||||||
Florida, State Higher Educational Facilities Financial Authority Revenue, Jacksonville University Project, Series A-1, 144A, 4.75%, 6/1/2038 | 2,150,000 | 2,214,221 | ||||||
Florida, State Housing Finance Corp., Revenue, Series 1, 3.5%, 7/1/2051 | 2,750,000 | 3,069,825 | ||||||
Florida, Village Community Development District No. 12, Special Assessment Revenue: | ||||||||
144A, 4.25%, 5/1/2043 | 8,815,000 | 9,603,590 | ||||||
144A, 4.375%, 5/1/2050 | 7,365,000 | 8,023,284 | ||||||
Jacksonville, FL, Educational Facilities Revenue, Jacksonville University Project, Series B, 144A, 5.0%, 6/1/2053 | 3,250,000 | 3,350,360 | ||||||
Lee County, FL, Airport Revenue, Series A, AMT, 5.375%, 10/1/2032 | 1,750,000 | 1,797,058 | ||||||
Manatee County, FL, Transportation Project, 4.0%, 10/1/2044 | 7,970,000 | 9,513,151 | ||||||
Miami-Dade County, FL, Aviation Revenue: | ||||||||
Series A, AMT, Prerefunded, 5.0%, 10/1/2031 | 3,000,000 | 3,256,050 | ||||||
Series B, 5.0%, 10/1/2035, INS: AGMC | 15,000,000 | 15,176,700 | ||||||
Miami-Dade County, FL, Educational Facilities Authority Revenue, Series A, 5.0%, 4/1/2048 | 8,440,000 | 9,926,790 | ||||||
Miami-Dade County, FL, Transit Sales Surtax Revenue: | ||||||||
Series A, 4.0%, 7/1/2049 | 30,000,000 | 35,468,700 | ||||||
Prerefunded, 5.0%, 7/1/2037 | 16,500,000 | 17,754,660 | ||||||
Miami-Dade County, FL, Water & Sewer System Revenue: | ||||||||
Series A, 4.0%, 10/1/2044 | 6,000,000 | 6,984,660 | ||||||
Series B, 4.0%, 10/1/2049 | 32,500,000 | 38,420,200 | ||||||
Orange County, FL, Health Facilities Authority Revenue, Orlando Regional Healthcare System, Series C, ETM, 6.25%, 10/1/2021, INS: NATL | 1,355,000 | 1,421,354 | ||||||
Orange County, FL, School Board, Certificates of Participation, Series C, 5.0%, 8/1/2033 | 16,610,000 | 20,355,223 | ||||||
Pinellas County, FL, Industrial Development Authority Revenue, 2017 Foundation For Global Understanding, Inc. Project, 5.0%, 7/1/2039 | 1,565,000 | 1,785,462 | ||||||
Tampa, FL, The University of Tampa Project, Series A, 4.0%, 4/1/2050 | 22,170,000 | 24,741,720 | ||||||
Tampa-Hillsborough County, FL, Expressway Authority, Series A, Prerefunded, 5.0%, 7/1/2037 | 10,000,000 | 10,752,100 | ||||||
|
| |||||||
| 343,093,173 | ||||||||
| Georgia 2.6% | ||||||||
Atlanta, GA, Airport Revenue, Series B, 5.0%, 1/1/2037 | 720,000 | 749,750 | ||||||
Atlanta, GA, Water & Wastewater Revenue, Series B, Prerefunded, 5.25%, 11/1/2028 | 5,000,000 | 5,728,500 | ||||||
The accompanying notes are an integral part of the financial statements.
| 14 | | | DWS Managed Municipal Bond Fund |
| Principal Amount ($) | Value ($) | |||||||
Cobb County, GA, Kennestone Hospital Authority, Revenue Anticipation Certificates, Wellstar Health System, Series A, 5.0%, 4/1/2047 | 18,135,000 | 21,566,505 | ||||||
DeKalb County, GA, Water & Sewer Revenue: | ||||||||
Series A, 5.25%, 10/1/2033 | 3,635,000 | 3,765,824 | ||||||
Series A, 5.25%, 10/1/2036 | 11,115,000 | 11,498,912 | ||||||
Series A, 5.25%, 10/1/2041 | 5,000,000 | 5,168,900 | ||||||
Fulton County, GA, Development Authority Hospital Revenue, Revenue Anticipation Certificates, Wellstar Health System, Series A, 5.0%, 4/1/2042 | 3,155,000 | 3,781,204 | ||||||
Georgia, Glynn-Brunswick Memorial Hospital Authority, Anticipation Certificates, Southeast Georgia Health System Project, 5.0%, 8/1/2047 | 2,035,000 | 2,341,837 | ||||||
Georgia, Main Street Natural Gas, Inc., Gas Project Revenue: | ||||||||
Series A, 5.0%, 3/15/2022, GTY: JPMorgan Chase & Co. | 17,340,000 | 18,248,443 | ||||||
Series A, 5.5%, 9/15/2023, GTY: Merrill Lynch & Co. | 5,000,000 | 5,668,500 | ||||||
Series A, 5.5%, 9/15/2027, GTY: Merrill Lynch & Co. | 5,000,000 | 6,398,250 | ||||||
Series A, 5.5%, 9/15/2028, GTY: Merrill Lynch & Co. | 5,000,000 | 6,488,250 | ||||||
Georgia, Municipal Electric Authority Revenue, Project One, Series A, 5.0%, 1/1/2035 | 2,995,000 | 3,418,463 | ||||||
Georgia, State Municipal Electric Authority, Series GG, 5.0%, 1/1/2039 | 5,695,000 | 6,106,008 | ||||||
|
| |||||||
| 100,929,346 | ||||||||
| Guam 0.0% | ||||||||
Guam, Government Waterworks Authority, Water & Wastewater System Revenue, Series A, 5.0%, 1/1/2050 | 1,090,000 | 1,340,951 | ||||||
| Illinois 5.9% |
| |||||||
Chicago, IL, Board of Education: | ||||||||
Series A, 5.0%, 12/1/2034 | 810,000 | 881,361 | ||||||
Series H, 5.0%, 12/1/2046 | 5,580,000 | 5,891,308 | ||||||
Chicago, IL, General Obligation: | ||||||||
Series A, 5.0%, 1/1/2044 | 4,500,000 | 4,792,725 | ||||||
Series A, 5.5%, 1/1/2049 | 2,535,000 | 2,771,465 | ||||||
Series A, 6.0%, 1/1/2038 | 2,290,000 | 2,586,326 | ||||||
Chicago, IL, O’Hare International Airport, Airport Revenue, Third Lien, Series A, 5.75%, 1/1/2039 | 2,190,000 | 2,199,877 | ||||||
Chicago, IL, O’Hare International Airport, Special Facility Revenue, AMT, 5.0%, 7/1/2048 | 2,630,000 | 3,018,451 | ||||||
Chicago, IL, Transit Authority, Sales Tax Receipts Revenue: | ||||||||
Series A, 4.0%, 12/1/2050 | 3,730,000 | 4,101,284 | ||||||
Series A, 4.0%, 12/1/2055 | 3,705,000 | 4,052,158 | ||||||
Series A, 5.0%, 12/1/2045 | 3,700,000 | 4,463,236 | ||||||
Chicago, IL, Waterworks Revenue, 5.0%, 11/1/2023, INS: AGMC | 2,990,000 | 3,000,046 | ||||||
The accompanying notes are an integral part of the financial statements.
| DWS Managed Municipal Bond Fund | | | 15 |
| Principal Amount ($) | Value ($) | |||||||
Cook County, IL, Forest Preservation District, Series C, 5.0%, 12/15/2037 | 3,155,000 | 3,348,622 | ||||||
Illinois, Metropolitan Pier & Exposition Authority Revenue, McCormick Place Expansion Project: | ||||||||
Series B, 5.0%, 6/15/2052 | 11,700,000 | 11,988,054 | ||||||
Series A, 5.0%, 6/15/2057 | 6,000,000 | 6,568,980 | ||||||
Illinois, Metropolitan Pier & Exposition Authority, Dedicated State Tax Revenue, Capital Appreciation-McCormick, Series A, Zero Coupon, 6/15/2038, INS: NATL | 17,305,000 | 9,472,238 | ||||||
Illinois, Regional Transportation Authority: | ||||||||
Series B, 5.75%, 6/1/2033, INS: NATL | 7,000,000 | 9,516,850 | ||||||
Series A, 6.7%, 11/1/2021, INS: NATL | 3,395,000 | 3,580,197 | ||||||
Illinois, Sales & Special Tax Revenue, 6.25%, 12/15/2020, INS: AMBAC | 985,000 | 986,872 | ||||||
Illinois, State Finance Authority Revenue, Ascension Health Credit Group, Series A, Prerefunded, 5.0%, 11/15/2032 | 2,435,000 | 2,545,476 | ||||||
Illinois, State Finance Authority Revenue, Edward Elmhurst Obligated Group: | ||||||||
Series A, 5.0%, 1/1/2036 | 2,970,000 | 3,496,848 | ||||||
Series A, 5.0%, 1/1/2037 | 3,965,000 | 4,656,853 | ||||||
Illinois, State Finance Authority Revenue, Friendship Village of Schaumburg, 5.125%, 2/15/2045 | 9,825,000 | 8,542,346 | ||||||
Illinois, State Finance Authority Revenue, OSF Healthcare Systems, Series A, Prerefunded, 5.0%, 5/15/2041 | 13,155,000 | 14,064,537 | ||||||
Illinois, State Finance Authority Revenue, University of Chicago, Series A, 5.0%, 10/1/2038 | 12,000,000 | 13,645,680 | ||||||
Illinois, State General Obligation: | ||||||||
Series B, 5.0%, 10/1/2032 | 5,000,000 | 5,486,850 | ||||||
5.0%, 11/1/2034 | 3,500,000 | 3,758,930 | ||||||
5.0%, 1/1/2035 | 7,575,000 | 8,061,315 | ||||||
Series A, 5.0%, 5/1/2035 | 9,455,000 | 10,264,159 | ||||||
Series A, 5.0%, 5/1/2036 | 7,480,000 | 8,091,565 | ||||||
5.0%, 5/1/2039 | 4,285,000 | 4,451,344 | ||||||
Series A, 5.0%, 5/1/2040 | 3,000,000 | 3,211,320 | ||||||
Series A, 5.0%, 12/1/2042 | 5,955,000 | 6,311,407 | ||||||
Series A, 5.0%, 5/1/2043 | 7,000,000 | 7,434,770 | ||||||
Series A, 5.25%, 12/1/2030 | 6,500,000 | 7,225,010 | ||||||
5.75%, 5/1/2045 | 4,205,000 | 4,780,370 | ||||||
Illinois, State Toll Highway Authority, Series A, 5.0%, 1/1/2044 | 17,075,000 | 21,545,406 | ||||||
Springfield, IL, Electric Revenue, Senior Lien, 5.0%, 3/1/2040, INS: AGMC | 5,805,000 | 6,701,292 | ||||||
|
| |||||||
| 227,495,528 | ||||||||
The accompanying notes are an integral part of the financial statements.
| 16 | | | DWS Managed Municipal Bond Fund |
| Principal Amount ($) | Value ($) | |||||||
| Indiana 1.6% | ||||||||
Indiana, State Finance Authority Revenue, BHI Senior Living Obligated Group, 5.0%, 11/15/2053 | 20,635,000 | 22,198,101 | ||||||
Indiana, State Finance Authority Revenue, Community Foundation of Northwest Indiana, Prerefunded, 5.0%, 3/1/2041 | 17,395,000 | 18,427,741 | ||||||
Indiana, State Finance Authority Revenue, Stadium Project, Series A, 5.25%, 2/1/2031 | 2,595,000 | 3,105,774 | ||||||
Indiana, State Finance Authority, Exempt Facilities Revenue, Green Bond, RES Plyflow Indiana LLC, Project, 144A, AMT, 7.0%, 3/1/2039 | 2,665,000 | 2,571,672 | ||||||
Indiana, State Finance Authority, Health Facilities Revenue, Baptist Healthcare System, Series A, 5.0%, 8/15/2051 | 5,000,000 | 5,753,200 | ||||||
Indiana, State Finance Authority, Wastewater Utility Revenue, First Lien, Series A, 5.25%, 10/1/2038 | 8,000,000 | 8,311,120 | ||||||
|
| |||||||
| 60,367,608 | ||||||||
| Iowa 0.8% | ||||||||
Iowa, Higher Education Loan Authority Revenue, Loras College, 0.09%**, 12/1/2020, LOC: Bank of America NA | 800,000 | 800,000 | ||||||
Iowa, Higher Education Loan Authority Revenue, Private College Facility, Des Moines University Project: | ||||||||
4.0%, 10/1/2045 | 7,135,000 | 7,906,079 | ||||||
4.0%, 10/1/2050 | 5,770,000 | 6,334,768 | ||||||
Iowa, State Finance Authority Educational Facilities Revenue, Holy Family Catholic Scheme, 0.09%**, 12/1/2020, LOC: U.S. Bank NA | 500,000 | 500,000 | ||||||
Iowa, State Finance Authority Revenue, Lifespace Communities, Inc,.Obligated Group: | ||||||||
Series A, 5.0%, 5/15/2041 | 4,070,000 | 4,360,150 | ||||||
Series A, 5.0%, 5/15/2047 | 1,355,000 | 1,436,436 | ||||||
Series A, 5.0%, 5/15/2048 | 9,775,000 | 10,452,016 | ||||||
|
| |||||||
| 31,789,449 | ||||||||
| Kentucky 0.1% | ||||||||
Kentucky, State Economic Development Finance Authority, Owensboro Health, Inc., Obligated Group: | ||||||||
Series A, 5.0%, 6/1/2045 | 1,275,000 | 1,391,637 | ||||||
Series A, 5.25%, 6/1/2041 | 1,915,000 | 2,162,054 | ||||||
|
| |||||||
| 3,553,691 | ||||||||
| Louisiana 0.3% | ||||||||
Louisiana, New Orleans Aviation Board, General Airport North Terminal, Series B, AMT, 5.0%, 1/1/2048 | 2,830,000 | 3,283,253 | ||||||
Louisiana, State Local Government Environmental Facilities & Community Development Authority Revenue, Westlake Chemical Corp. Project, 3.5%, 11/1/2032 | 9,265,000 | 10,151,846 | ||||||
|
| |||||||
| 13,435,099 | ||||||||
The accompanying notes are an integral part of the financial statements.
| DWS Managed Municipal Bond Fund | | | 17 |
| Principal Amount ($) | Value ($) | |||||||
| Maryland 1.2% | ||||||||
Maryland, State Community Development Administration, Department of Housing & Community Development, Series C, 3.5%, 3/1/2050 | 3,555,000 | 3,912,135 | ||||||
Maryland, State Health & Higher Educational Facilities Authority Revenue, Adventist Healthcare, Obligated Group, Series A, 5.5%, 1/1/2046 | 20,000,000 | 22,790,200 | ||||||
Maryland, State Health & Higher Educational Facilities Authority Revenue, Medstar Health Obligated Group: | ||||||||
Series A, 5.0%, 5/15/2042 | 9,735,000 | 11,601,200 | ||||||
Series A, 5.0%, 5/15/2045 | 5,000,000 | 5,924,850 | ||||||
|
| |||||||
| 44,228,385 | ||||||||
| Massachusetts 0.4% | ||||||||
Massachusetts, State Development Finance Agency Revenue, Lesley University, Series A, 5.0%, 7/1/2049 | 2,750,000 | 3,323,045 | ||||||
Massachusetts, State Development Finance Agency Revenue, NewBridge Charles, Inc.: | ||||||||
144A, 5.0%, 10/1/2047 | 700,000 | 748,790 | ||||||
144A, 5.0%, 10/1/2057 | 1,700,000 | 1,815,311 | ||||||
Massachusetts, State Development Finance Agency Revenue, Partners Healthcare System, Inc.: | ||||||||
Series S-1, 5.0%, 7/1/2028 | 2,700,000 | 3,465,747 | ||||||
Series S-1, 5.0%, 7/1/2033 | 4,000,000 | 4,997,120 | ||||||
Series L, Prerefunded, 5.0%, 7/1/2036 | 70,000 | 71,973 | ||||||
Massachusetts, State Development Finance Agency Revenue, UMass Memorial Healthcare, Series I, 5.0%, 7/1/2036 | 1,000,000 | 1,170,280 | ||||||
|
| |||||||
| 15,592,266 | ||||||||
| Michigan 0.6% | ||||||||
Michigan, State Finance Authority Revenue, Series A, 4.0%, 2/15/2050 | 15,000,000 | 16,937,550 | ||||||
Michigan, State Strategic Fund Ltd., Obligation Revenue Improvement Project, Series I, AMT, 5.0%, 12/31/2043 | 4,800,000 | 5,685,840 | ||||||
|
| |||||||
| 22,623,390 | ||||||||
| Minnesota 1.0% | ||||||||
Duluth, MN, Economic Development Authority, Health Care Facilities Revenue, Essentia Health Obligated Group: | ||||||||
Series A, 5.0%, 2/15/2048 | 5,000,000 | 5,874,700 | ||||||
Series A, 5.0%, 2/15/2053 | 14,060,000 | 16,448,091 | ||||||
Minneapolis, MN, Health Care Systems Revenue, Fairview Health Services, Series A, 5.0%, 11/15/2049 | 4,075,000 | 4,914,694 | ||||||
Minnesota, State Housing Finance Agency, Series E, 3.5%, 7/1/2050 | 3,120,000 | 3,478,145 | ||||||
Minnesota, State Trunk Highway, Series B, 4.0%, 8/1/2032 | 5,000,000 | 6,107,050 | ||||||
|
| |||||||
| 36,822,680 | ||||||||
The accompanying notes are an integral part of the financial statements.
| 18 | | | DWS Managed Municipal Bond Fund |
| Principal Amount ($) | Value ($) | |||||||
| Missouri 0.3% | ||||||||
Missouri, State Development Finance Board Infrastructure Facilities Revenue, State Louise Convention Center Hotel Garage Project, Series C, 0.09%**, 12/1/2020, LOC: U.S. Bank NA | 450,000 | 450,000 | ||||||
Missouri, State Health & Educational Facilities Authority Revenue, Lutheran Senior Services Projects, Series B, 5.0%, 2/1/2046 | 2,460,000 | 2,702,285 | ||||||
Missouri, State Health & Educational Facilities Authority Revenue, Medical Research, Lutheran Senior Services, Series A, 5.0%, 2/1/2046 | 3,285,000 | 3,608,540 | ||||||
Missouri, State Housing Development Commission, Single Family Mortgage Revenue, First Homeownership loan Program, Series B, 4.0%, 5/1/2050 | 4,080,000 | 4,567,356 | ||||||
|
| |||||||
| 11,328,181 | ||||||||
| Nebraska 0.2% | ||||||||
Douglas County, NE, Hospital Authority No.2, Health Facilities, Children’s Hospital Obligated Group, 5.0%, 11/15/2047 | 5,205,000 | 6,235,902 | ||||||
| Nevada 0.0% | ||||||||
Reno, NV, Sales Tax Revenue, Transportation Rail Access, Series C, 144A, Zero Coupon, 7/1/2058 | 8,500,000 | 1,227,145 | ||||||
| New Jersey 2.4% | ||||||||
Hudson County, NJ, Improvement Authority Revenue, Hudson County Courthouse Project, 4.0%, 10/1/2051 | 11,500,000 | 13,596,910 | ||||||
New Jersey, State Covid-19 General Obligation Emergency Bonds: | ||||||||
Series A, 4.0%, 6/1/2030 | 2,590,000 | 3,132,061 | ||||||
Series A, 4.0%, 6/1/2031 | 2,590,000 | 3,160,422 | ||||||
Series A, 4.0%, 6/1/2032 | 1,245,000 | 1,527,179 | ||||||
New Jersey, State Economic Development Authority Revenue: | ||||||||
5.0%, 6/15/2028 | 1,050,000 | 1,073,531 | ||||||
Series BBB, 5.5%, 6/15/2030 | 22,440,000 | 26,829,040 | ||||||
New Jersey, State Economic Development Authority Revenue, Private Activity, The Goethals Bridge Replacement Project, AMT, 5.0%, 1/1/2031, INS: AGMC | 4,000,000 | 4,493,240 | ||||||
New Jersey, State Economic Development Authority, Motor Vehicle Surcharge Revenue, Series A, 5.0%, 7/1/2033 | 1,460,000 | 1,655,041 | ||||||
New Jersey, State Economic Development Authority, State Government Buildings Project: | ||||||||
Series A, 5.0%, 6/15/2042 | 2,885,000 | 3,307,508 | ||||||
Series A, 5.0%, 6/15/2047 | 3,205,000 | 3,644,790 | ||||||
The accompanying notes are an integral part of the financial statements.
| DWS Managed Municipal Bond Fund | | | 19 |
| Principal Amount ($) | Value ($) | |||||||
New Jersey, State Transportation Trust Fund Authority, Transportation Systems: | ||||||||
Series A, 5.0%, 12/15/2034 | 9,280,000 | 11,041,530 | ||||||
Series A, 5.0%, 12/15/2036 | 2,385,000 | 2,808,338 | ||||||
New Jersey, Tobacco Settlement Financing Corp.: | ||||||||
Series A, 5.0%, 6/1/2046 | 5,270,000 | 6,264,712 | ||||||
Series A, 5.25%, 6/1/2046 | 2,630,000 | 3,174,094 | ||||||
South Jersey, NJ, Transportation Authority System Revenue: | ||||||||
Series A, 4.0%, 11/1/2050 | 2,000,000 | 2,233,560 | ||||||
Series A, 5.0%, 11/1/2045 | 3,000,000 | 3,693,180 | ||||||
|
| |||||||
| 91,635,136 | ||||||||
| New Mexico 0.6% | ||||||||
New Mexico, State Finance Authority Revenue, Public Project Revolving Fund: | ||||||||
Series A, 4.0%, 6/1/2029 | 5,765,000 | 7,081,726 | ||||||
Series A, 4.0%, 6/1/2030 | 5,795,000 | 7,031,769 | ||||||
New Mexico, State Mortgage Finance Authority, Series A, 3.5%, 1/1/2051 | 4,180,000 | 4,633,195 | ||||||
New Mexico, State Mortgage Finance Authority, Single Family Mortgage Revenue, “I”, Series D, 3.75%, 1/1/2050 | 4,185,000 | 4,640,663 | ||||||
|
| |||||||
| 23,387,353 | ||||||||
| New York 17.2% | ||||||||
New York, Metropolitan Transportation Authority, Dedicated Tax Fund, Climate Board Certified Green Bond, Series B-2, 5.0%, 11/15/2034 | 10,940,000 | 13,209,941 | ||||||
New York, Metropolitan Transportation Authority Revenue: | ||||||||
Series A-1, 0.09%**, 12/1/2020, LOC: TD Bank NA | 395,000 | 395,000 | ||||||
Series E-1, 0.1%**, 12/1/2020, LOC: U.S. Bank NA | 2,100,000 | 2,100,000 | ||||||
Series A-1, 4.0%, 11/15/2041, INS: AGMC | 12,000,000 | 13,668,360 | ||||||
Series D, 5.0%, 11/15/2027, INS: AGMC | 16,500,000 | 17,737,665 | ||||||
Series D, 5.0%, 11/15/2028 | 9,715,000 | 10,165,485 | ||||||
Series D, 5.0%, 11/15/2038 | 13,635,000 | 14,443,419 | ||||||
Series A-1, 5.0%, 11/15/2047 | 5,000,000 | 5,755,500 | ||||||
Series C-1, 5.0%, 11/15/2050 | 3,470,000 | 3,985,122 | ||||||
Series B, 5.25%, 11/15/2044 | 25,000,000 | 26,917,000 | ||||||
Series C-1, 5.25%, 11/15/2055 | 10,415,000 | 12,228,147 | ||||||
New York, Metropolitan Transportation Authority Revenue, Green Bond: | ||||||||
Series D, 4.0%, 11/15/2048 | 3,500,000 | 3,712,450 | ||||||
Series D, 4.0%, 11/15/2049 | 1,500,000 | 1,589,745 | ||||||
New York, Senior Care Revenue, Dormitory Authority, City University, Series A, 5.25%, 5/15/2021 | 1,025,000 | 1,048,555 | ||||||
The accompanying notes are an integral part of the financial statements.
| 20 | | | DWS Managed Municipal Bond Fund |
| Principal Amount ($) | Value ($) | |||||||
New York, State Dormitory Authority, Personal Income Tax Revenue: | ||||||||
Series A, 4.0%, 3/15/2048 | 20,305,000 | 23,785,480 | ||||||
Series A, Prerefunded, 5.0%, 2/15/2035 | 9,305,000 | 10,288,352 | ||||||
Series B, 5.0%, 2/15/2035 | 29,990,000 | 35,043,615 | ||||||
Series B, Prerefunded, 5.0%, 2/15/2035 | 10,000 | 11,961 | ||||||
Series A, 5.0%, 2/15/2039 | 3,950,000 | 4,795,063 | ||||||
Series C, 5.0%, 3/15/2041 | 10,000,000 | 10,118,800 | ||||||
Series C, 5.0%, 3/15/2042 | 14,750,000 | 16,572,657 | ||||||
New York, State Dormitory Authority, Sales Tax Revenue, Series B, 5.0%, 3/15/2036 | 5,000,000 | 6,291,150 | ||||||
New York, State Housing Finance Agency Revenue, 160 Madison Avenue LLC, Series B, 0.08%**, 12/1/2020, LOC: Landesbank Hessen-Thuringen | 100,000 | 100,000 | ||||||
New York, State Liberty Development Corp., Revenue, World Trade Center Port Authority Construction, 5.25%, 12/15/2043 | 45,000,000 | 46,989,900 | ||||||
New York, State Power Authority Revenue, Series A, 4.0%, 11/15/2050 | 20,000,000 | 23,631,200 | ||||||
New York, State Thruway Authority, Series N, 4.0%, 1/1/2044 | 16,465,000 | 19,087,874 | ||||||
New York, State Thruway Authority General Revenue, Junior Indebtedness Obligation, Series B, 4.0%, 1/1/2040, INS: AGMC | 40,000,000 | 47,190,400 | ||||||
New York, State Transportation Development Corp., Special Facilities Revenue, Delta Air Lines, Inc., LaGuardia Airport C&D Redevelopment: | ||||||||
AMT, 5.0%, 1/1/2033 | 2,045,000 | 2,342,241 | ||||||
AMT, 5.0%, 10/1/2040 | 4,000,000 | 4,658,040 | ||||||
New York, State Transportation Development Corp., Special Facilities Revenue, Laguardia Gateway Partners LLC, Redevelopment Project: | ||||||||
Series A, AMT, 5.0%, 7/1/2041 | 6,660,000 | 7,286,506 | ||||||
Series A, AMT, 5.0%, 7/1/2046 | 14,190,000 | 15,488,811 | ||||||
New York, State Urban Development Corp. Revenue, Series A, 4.0%, 3/15/2049 | 8,000,000 | 9,373,760 | ||||||
New York, State Urban Development Corp. Revenue, State Personal Income Tax, Series A, 5.0%, 3/15/2031 | 4,600,000 | 5,713,200 | ||||||
New York, State Urban Development Corp., Sales Tax Revenue, Series A, 4.0%, 3/15/2045 | 2,200,000 | 2,556,422 | ||||||
New York, Triborough Bridge & Tunnel Authority Revenue: | ||||||||
Series B-4C, 0.1%**, 12/1/2020, LOC: U.S. Bank NA | 2,050,000 | 2,050,000 | ||||||
Series F, 0.1%**, 12/1/2020, LOC: Citibank NA | 100,000 | 100,000 | ||||||
Series A, 4.0%, 11/15/2054 | 5,000,000 | 5,837,700 | ||||||
The accompanying notes are an integral part of the financial statements.
| DWS Managed Municipal Bond Fund | | | 21 |
| Principal Amount ($) | Value ($) | |||||||
New York, Triborough Bridge & Tunnel Authority Revenue, MTA Bridges And Tunnels: | ||||||||
Series A, 5.0%, 11/15/2049 | 4,685,000 | 6,033,015 | ||||||
Series A, 5.0%, 11/15/2054 | 5,155,000 | 6,585,306 | ||||||
New York, TSASC, Inc., Series A, 5.0%, 6/1/2041 | 1,195,000 | 1,363,137 | ||||||
New York, Utility Debt Securitization Authority, Restructuring Revenue: | ||||||||
Series TE, 5.0%, 12/15/2034 | 3,200,000 | 3,632,864 | ||||||
Series TE, 5.0%, 12/15/2035 | 4,000,000 | 4,537,160 | ||||||
New York City, NY, Municipal Water Finance Authority, Water & Sewer System Revenue, Second Generation Resolution, Series GG-1, 4.0%, 6/15/2050 | 19,255,000 | 22,792,914 | ||||||
New York City, NY, Municipal Water Finance Authority, Water & Sewer Systems Revenue: | ||||||||
Series DD, 5.0%, 6/15/2036 | 6,000,000 | 6,863,820 | ||||||
Series BB-1, 5.0%, 6/15/2049 | 10,000,000 | 12,813,000 | ||||||
New York City, NY, Municipal Water Finance Authority, Water & Sewer Systems Revenue, Second Generation Resolution, Series EE, 5.375%, 6/15/2043 | 3,810,000 | 3,817,239 | ||||||
New York City, NY, Transitional Finance Authority Revenue: | ||||||||
Series A-3, 4.0%, 5/1/2043 | 10,000,000 | 11,611,100 | ||||||
Series A-3, 4.0%, 5/1/2044 | 5,000,000 | 5,791,900 | ||||||
New York City, NY, Transitional Finance Authority Revenue, Future Tax Secured: | ||||||||
Series A-1, 4.0%, 5/1/2031 | 5,430,000 | 6,220,119 | ||||||
Series C-1, 4.0%, 5/1/2045 | 9,340,000 | 11,025,683 | ||||||
Series A, 5.0%, 2/1/2031 | 5,000,000 | 6,234,050 | ||||||
Series F-1, 5.0%, 5/1/2031 | 4,900,000 | 6,151,166 | ||||||
Series D-1, 5.0%, 2/1/2038 | 17,655,000 | 19,892,595 | ||||||
New York City, NY, Transitional Finance Authority, Building Aid Revenue, Series S-3, 5.0%, 7/15/2031 | 4,000,000 | 5,117,440 | ||||||
New York City, NY, Transitional Finance Authority, Building Aid Revenue, Fiscal 2018, Series S-1, 5.0%, 7/15/2035 | 2,800,000 | 3,449,852 | ||||||
New York, NY, General Obligation: | ||||||||
Series A-1, 4.0%, 8/1/2034 | 5,750,000 | 6,992,633 | ||||||
Series B-1, 5.0%, 12/1/2031 | 2,000,000 | 2,433,960 | ||||||
Series D-1, 5.0%, 10/1/2033 | 16,585,000 | 17,196,986 | ||||||
Series D-1, Prerefunded, 5.0%, 10/1/2033 | 180,000 | 187,166 | ||||||
Port Authority of New York & New Jersey: | ||||||||
Series 207, AMT, 5.0%, 9/15/2031 | 5,000,000 | 6,234,750 | ||||||
Series 207, AMT, 5.0%, 9/15/2032 | 10,000,000 | 12,404,400 | ||||||
Port Authority of New York & New Jersey, One Hundred Ninety-Third: | ||||||||
AMT, 5.0%, 10/15/2029 | 5,000,000 | 5,943,700 | ||||||
AMT, 5.0%, 10/15/2035 | 2,865,000 | 3,363,997 | ||||||
The accompanying notes are an integral part of the financial statements.
| 22 | | | DWS Managed Municipal Bond Fund |
| Principal Amount ($) | Value ($) | |||||||
Port Authority of New York & New Jersey, Two Hundred Seven: | ||||||||
AMT, 5.0%, 9/15/2029 | 8,000,000 | 10,076,480 | ||||||
AMT, 5.0%, 9/15/2030 | 20,000,000 | 25,060,200 | ||||||
|
| |||||||
| 660,096,153 | ||||||||
| North Carolina 0.5% | ||||||||
Charlotte, NC, Airport Revenue, Series A, 5.5%, 7/1/2034 | 1,500,000 | 1,505,445 | ||||||
Charlotte-Mecklenberg, NC, Hospital Authority, Health Care System Revenue, Series A, 5.0%, 1/15/2039 | 9,540,000 | 10,303,486 | ||||||
North Carolina, State Housing Finance Agency, Series 42, 4.0%, 1/1/2050 | 6,270,000 | 7,001,960 | ||||||
|
| |||||||
| 18,810,891 | ||||||||
| Ohio 3.7% | ||||||||
Allen County, OH, Hospital Facilities Revenue, Catholic Healthcare, Series C, 0.11%**, 12/1/2020, LOC: Bank of Montreal | 2,100,000 | 2,100,000 | ||||||
Buckeye, OH, Tobacco Settlement Financing Authority, Series B-2, Class 2, 5.0%, 6/1/2055 | 17,425,000 | 19,596,503 | ||||||
Chillicothe, OH, Hospital Facilities Revenue, Adena Health System Obligated Group Project, 5.0%, 12/1/2047 | 6,035,000 | 7,111,584 | ||||||
Cleveland, OH, Airport Systems Revenue, Series A, Prerefunded, 5.0%, 1/1/2030 | 1,000,000 | 1,051,450 | ||||||
Columbus, OH, Regional Airport Authority, Capital Funding Revenue, Oasbo Expanded Asset, 0.12%**, 12/1/2036, LOC: U.S. Bank NA | 500,000 | 500,000 | ||||||
Hamilton County, OH, Health Care Revenue, Life Enriching Communities Project: | ||||||||
5.0%, 1/1/2036 | 975,000 | 1,059,045 | ||||||
5.0%, 1/1/2046 | 2,790,000 | 2,985,858 | ||||||
Hancock County, OH, Hospital Revenue, Blanchard Valley Regional Health Center, Prerefunded, 6.5%, 12/1/2030 | 14,425,000 | 14,871,310 | ||||||
Lucas County, OH, Hospital Revenue, Promedica Healthcare, Series A, Prerefunded, 6.5%, 11/15/2037 | 6,000,000 | 6,354,840 | ||||||
Ohio, Akron, Bath & Copley Joint Township Hospital District Revenue, 5.25%, 11/15/2046 | 11,610,000 | 13,649,529 | ||||||
Ohio, Akron, Bath & Copley Joint Township Hospital District Revenue, Children’s Hospital Medical Center of Akron, 5.0%, 11/15/2038 | 15,645,000 | 16,867,813 | ||||||
Ohio, American Municipal Power, Inc. Revenue, Fremont Energy Center Project, Series B, 5.0%, 2/15/2037 | 13,090,000 | 13,730,101 | ||||||
Ohio, State Hospital Revenue, Aultman Health Foundation, 144A, 5.0%, 12/1/2048 | 7,500,000 | 7,993,800 | ||||||
Ohio, State Housing Finance Agency, Residential Mortgage Revenue, Series B, 4.5%, 3/1/2050 | 5,385,000 | 6,102,982 | ||||||
The accompanying notes are an integral part of the financial statements.
| DWS Managed Municipal Bond Fund | | | 23 |
| Principal Amount ($) | Value ($) | |||||||
Ohio, State Housing Finance Agency, Residential Mortgage Revenue, First Time Homebuyer Program, Series A, 3.75%, 9/1/2050 | 3,985,000 | 4,503,209 | ||||||
Ohio, State Turnpike Commission, Infrastructure Projects: | ||||||||
Series A-1, 5.25%, 2/15/2030 | 4,620,000 | 5,054,650 | ||||||
Series A-1, 5.25%, 2/15/2031 | 9,375,000 | 10,239,750 | ||||||
Series A-1, 5.25%, 2/15/2032 | 7,500,000 | 8,176,275 | ||||||
|
| |||||||
| 141,948,699 | ||||||||
| Oklahoma 0.8% | ||||||||
Oklahoma, State Development Finance Authority, Health System Revenue, OU Medicine Project: | ||||||||
Series B, 5.5%, 8/15/2052 | 2,185,000 | 2,590,951 | ||||||
Series B, 5.5%, 8/15/2057 | 9,385,000 | 11,090,911 | ||||||
Oklahoma, State Turnpike Authority Revenue, Series E, 4.0%, 1/1/2031 | 6,375,000 | 7,532,700 | ||||||
Oklahoma, Water & Sewer Revenue, McGee Creek Authority, 6.0%, 1/1/2023, INS: NATL | 5,760,000 | 6,091,776 | ||||||
Tulsa County, OK, Industrial Authority, Senior Living Community Revenue, Montereau, Inc. Project, 5.25%, 11/15/2045 | 1,575,000 | 1,676,777 | ||||||
|
| |||||||
| 28,983,115 | ||||||||
| Pennsylvania 3.4% | ||||||||
Franklin County, PA, Industrial Development Authority Revenue, Menno Haven, Inc. Project: | ||||||||
5.0%, 12/1/2043 | 665,000 | 704,062 | ||||||
5.0%, 12/1/2054 | 1,825,000 | 1,906,906 | ||||||
Lancaster County, PA, Hospital Authority Revenue, University of Pennsylvania Health System Obligated Group, 5.0%, 8/15/2042 | 2,100,000 | 2,500,869 | ||||||
Pennsylvania, Certificate of Participations, Series A, 5.0%, 7/1/2043 | 1,115,000 | 1,352,696 | ||||||
Pennsylvania, Commonwealth Financing Authority Revenue, Series A, 5.0%, 6/1/2033 | 5,000,000 | 5,858,150 | ||||||
Pennsylvania, Commonwealth Financing Authority, Tobacco Master Settlement Payment Revenue Bonds: | ||||||||
5.0%, 6/1/2027 | 1,290,000 | 1,632,082 | ||||||
5.0%, 6/1/2028 | 1,290,000 | 1,667,905 | ||||||
5.0%, 6/1/2029 | 1,290,000 | 1,654,399 | ||||||
5.0%, 6/1/2030 | 855,000 | 1,089,800 | ||||||
5.0%, 6/1/2031 | 865,000 | 1,097,858 | ||||||
Pennsylvania, Geisinger Authority Health System Revenue, Series A-2, 5.0%, 2/15/2034 | 3,000,000 | 3,643,440 | ||||||
Pennsylvania, State General Obligation: | ||||||||
Series 2, 4.0%, 9/15/2032 | 10,000,000 | 11,607,000 | ||||||
Series D, 5.0%, 8/15/2032 | 5,000,000 | 5,958,650 | ||||||
The accompanying notes are an integral part of the financial statements.
| 24 | | | DWS Managed Municipal Bond Fund |
| Principal Amount ($) | Value ($) | |||||||
Pennsylvania, State Housing Finance Agency, Single Family Mortgage Revenue, Series 132A, 3.5%, 4/1/2051 | 2,795,000 | 3,047,920 | ||||||
Pennsylvania, State Turnpike Commission Revenue: | ||||||||
Series B, 5.0%, 6/1/2033 | 12,000,000 | 14,314,200 | ||||||
Series A-1, 5.0%, 12/1/2040 | 15,000,000 | 17,357,400 | ||||||
Series B-1, 5.0%, 6/1/2042 | 6,950,000 | 8,243,534 | ||||||
Series A-1, 5.0%, 12/1/2042 | 5,000,000 | 6,056,350 | ||||||
Series A, 5.0%, 12/1/2044 | 20,335,000 | 25,217,230 | ||||||
Series B, 5.0%, 12/1/2045 | 4,165,000 | 5,312,333 | ||||||
Series A-1, 5.0%, 12/1/2047 | 3,335,000 | 4,006,436 | ||||||
Series B, 5.0%, 12/1/2050 | 4,335,000 | 5,488,413 | ||||||
|
| |||||||
| 129,717,633 | ||||||||
| Puerto Rico 0.9% | ||||||||
Puerto Rico, Sales Tax Financing Corp., Sales Tax Revenue: | ||||||||
Series A-1, Zero Coupon, 7/1/2046 | 68,123,000 | 20,447,800 | ||||||
Series A-1, Zero Coupon, 7/1/2051 | 5,026,000 | 1,090,491 | ||||||
Series A-1, 4.75%, 7/1/2053 | 6,755,000 | 7,338,835 | ||||||
Series A-1, 5.0%, 7/1/2058 | 4,485,000 | 4,946,820 | ||||||
|
| |||||||
| 33,823,946 | ||||||||
| South Carolina 2.7% | ||||||||
Charleston County, SC, Airport District System Revenue, Series A, AMT, 5.75%, 7/1/2030 | 5,880,000 | 6,566,666 | ||||||
Lexington County, SC, Health Services District, Lexington Medical Center: | ||||||||
5.0%, 11/1/2041 | 2,500,000 | 2,908,700 | ||||||
5.0%, 11/1/2046 | 7,490,000 | 8,651,999 | ||||||
South Carolina, State Jobs-Economic Development Authority, Hospital Revenue, Conway Hospitals, Inc., 5.25%, 7/1/2047 | 4,715,000 | 5,472,842 | ||||||
South Carolina, State Public Service Authority Revenue: | ||||||||
Series A, 5.0%, 12/1/2033 | 4,400,000 | 5,293,332 | ||||||
Series A, 5.0%, 12/1/2036 | 4,780,000 | 5,723,715 | ||||||
Series C, 5.0%, 12/1/2046 | 6,850,000 | 7,858,320 | ||||||
South Carolina, State Public Service Authority Revenue, Santee Cooper, Series A, Prerefunded, 5.75%, 12/1/2043 | 35,555,000 | 41,355,798 | ||||||
South Carolina, State Transportation Infrastructure Bank Revenue, 5.0%, 10/1/2038 | 15,130,000 | 18,548,170 | ||||||
|
| |||||||
| 102,379,542 | ||||||||
| South Dakota 1.1% | ||||||||
South Dakota, State Health & Educational Facilities Authority Revenue, Avera Health: | ||||||||
5.0%, 7/1/2044 | 20,475,000 | 22,642,074 | ||||||
5.0%, 7/1/2046 | 16,140,000 | 19,045,200 | ||||||
|
| |||||||
| 41,687,274 | ||||||||
The accompanying notes are an integral part of the financial statements.
| DWS Managed Municipal Bond Fund | | | 25 |
| Principal Amount ($) | Value ($) | |||||||
| Tennessee 0.5% | ||||||||
Metropolitan Government of Nashville & Davidson County, TN, General Obligation, 4.0%, 7/1/2034 | 6,000,000 | 7,224,420 | ||||||
Metropolitan Nashville, TN, Airport Authority Revenue: | ||||||||
Series B, AMT, 4.0%, 7/1/2049 | 4,000,000 | 4,472,560 | ||||||
Series B, AMT, 4.0%, 7/1/2054 | 6,000,000 | 6,676,080 | ||||||
Tennessee, Energy Acquisition Corp., Gas Revenue, Series A, 5.25%, 9/1/2021, GTY: Goldman Sachs Group, Inc. | 2,000,000 | 2,072,280 | ||||||
|
| |||||||
| 20,445,340 | ||||||||
| Texas 11.8% | ||||||||
Central Texas, Regional Mobility Authority Revenue, Senior Lien: | ||||||||
Series E, 4.0%, 1/1/2050 | 8,985,000 | 10,295,552 | ||||||
Series A, 5.0%, 1/1/2040 | 4,730,000 | 5,435,007 | ||||||
Series E, 5.0%, 1/1/2045 | 1,500,000 | 1,876,875 | ||||||
Clifton, TX, Higher Education Finance Corp., Education Revenue, Series D, 6.125%, 8/15/2048 | 11,465,000 | 13,204,241 | ||||||
Houston, TX, Hotel Occupancy Tax & Special Revenue, Convention & Entertainment Facilities Department: | ||||||||
5.0%, 9/1/2029 | 1,000,000 | 1,175,390 | ||||||
5.0%, 9/1/2030 | 1,000,000 | 1,166,600 | ||||||
5.0%, 9/1/2031 | 850,000 | 985,346 | ||||||
Houston, TX, Utility Systems Revenue, First Lien: | ||||||||
Series A, 5.0%, 11/15/2032 | 2,320,000 | 3,189,698 | ||||||
Series A, 5.0%, 11/15/2033 | 2,475,000 | 3,387,335 | ||||||
Series B, 5.0%, 11/15/2034 | 5,000,000 | 6,149,650 | ||||||
Lower Colorado River, TX, Transmission Contract Authority Revenue, LCRA Transmission Services Corp., Project: | ||||||||
5.0%, 5/15/2045 | 1,500,000 | 1,879,260 | ||||||
5.0%, 5/15/2050 | 2,500,000 | 3,114,875 | ||||||
North Texas, Tollway Authority Revenue: | ||||||||
Series B, 5.0%, 1/1/2040 | 8,825,000 | 9,479,462 | ||||||
First Tier, Prerefunded, 6.0%, 1/1/2043 | 25,000,000 | 25,117,750 | ||||||
North Texas, Tollway Authority Revenue, Second Tier: | ||||||||
Series B, 5.0%, 1/1/2043 | 3,075,000 | 3,647,473 | ||||||
Series B, 5.0%, 1/1/2048 | 8,615,000 | 10,123,487 | ||||||
North Texas, Tollway Authority System Revenue, First Tier, Series A, 4.0%, 1/1/2044 | 13,315,000 | 15,317,709 | ||||||
San Antonio, TX, Electric & Gas Systems Revenue, 4.0%, 2/1/2032 | 7,000,000 | 8,175,860 | ||||||
Socorro, TX, Independent School District, 4.0%, 8/15/2045 | 3,920,000 | 4,768,641 | ||||||
Tarrant County, TX, Cultural Education Facilities Finance Corp. Revenue, Christus Health Obligated Group, Series B, 5.0%, 7/1/2048 | 25,000,000 | 30,275,500 | ||||||
The accompanying notes are an integral part of the financial statements.
| 26 | | | DWS Managed Municipal Bond Fund |
| Principal Amount ($) | Value ($) | |||||||
Tarrant County, TX, Cultural Education Facilities Finance Corp., Buckner Retirement Services Revenue, 5.0%, 11/15/2046 | 4,410,000 | 5,022,020 | ||||||
Tarrant County, TX, Cultural Education Facilities Finance Corp., Hospital Revenue, Methodist Hospitals of Dallas Project, Series A, 0.09%**, 12/1/2020, LOC: TD Bank NA | 500,000 | 500,000 | ||||||
Tarrant County, TX, Cultural Education Facilities Finance Corp., Hospital Revenue, Scott & White Healthcare: | ||||||||
5.0%, 8/15/2036 | 7,000,000 | 7,719,670 | ||||||
5.0%, 8/15/2043 | 9,900,000 | 10,848,618 | ||||||
Texas, Grand Parkway Transportation Corp., System Toll Revenue: | ||||||||
First Tier, Series C, 4.0%, 10/1/2049 | 12,250,000 | 14,390,442 | ||||||
Series B, Prerefunded, 5.25%, 10/1/2051 | 20,000,000 | 22,837,000 | ||||||
Texas, Lower Colorado River Authority Revenue, Series A, Prerefunded, 5.0%, 5/15/2036 | 25,000 | 26,691 | ||||||
Texas, New Hope Cultural Education Facilities Finance Corp., Educational Revenue, Cumberland Academy Project, Series A, 144A, 5.0%, 8/15/2050 | 4,250,000 | 4,463,775 | ||||||
Texas, New Hope Cultural Education Facilities Finance Corp., Senior Living Revenue, Bridgemoor Plano Project, Series A, 7.25%, 12/1/2053 | 4,605,000 | 4,059,906 | ||||||
Texas, Private Activity Bond, Surface Transportation Corp. Revenue, Senior Lien Revenue, Infrastructure Group LLC, I-635 Managed Lanes Project: | ||||||||
Series A, 4.0%, 6/30/2038 | 1,145,000 | 1,327,295 | ||||||
Series A, 4.0%, 12/31/2038 | 1,145,000 | 1,324,273 | ||||||
Series A, 4.0%, 6/30/2039 | 875,000 | 1,010,914 | ||||||
Series A, 4.0%, 12/31/2039 | 1,010,000 | 1,165,550 | ||||||
Series A, 4.0%, 6/30/2040 | 815,000 | 938,318 | ||||||
Texas, SA Energy Acquisition Public Facility Corp., Gas Supply Revenue: | ||||||||
5.5%, 8/1/2021, GTY: Goldman Sachs Group, Inc. | 5,575,000 | 5,764,048 | ||||||
5.5%, 8/1/2025, GTY: Goldman Sachs Group, Inc. | 2,750,000 | 3,334,430 | ||||||
Texas, State College Student Loan, AMT, 5.5%, 8/1/2028 | 5,620,000 | 7,195,679 | ||||||
Texas, State Municipal Gas Acquisition & Supply Corp. I, Gas Supply Revenue, Series D, 6.25%, 12/15/2026, GTY: Merrill Lynch & Co. | 15,190,000 | 17,824,857 | ||||||
Texas, State Municipal Gas Acquisition & Supply Corp. III Gas Supply Revenue: | ||||||||
5.0%, 12/15/2030, GTY: Macquarie Group Ltd. | 2,250,000 | 2,410,200 | ||||||
5.0%, 12/15/2031, GTY: Macquarie Group Ltd. | 4,500,000 | 4,812,030 | ||||||
5.0%, 12/15/2032, GTY: Macquarie Group Ltd. | 21,215,000 | 22,639,375 | ||||||
Texas, State Private Activity Bond, Surface Transportation Corp. Revenue, Senior Lien, North Tarrant Express Mobility Partners Segments LLC, AMT, 5.0%, 6/30/2058 | 6,500,000 | 7,692,360 | ||||||
The accompanying notes are an integral part of the financial statements.
| DWS Managed Municipal Bond Fund | | | 27 |
| Principal Amount ($) | Value ($) | |||||||
Texas, State Transportation Commission, Turnpike Systems Revenue: | ||||||||
Series C, 5.0%, 8/15/2034 | 14,410,000 | 16,420,483 | ||||||
Series C, 5.0%, 8/15/2042 | 5,085,000 | 5,732,422 | ||||||
Texas, State Water Development Board Revenue, State Water Implementation Revenue Fund: | ||||||||
4.0%, 10/15/2030 | 8,500,000 | 10,153,080 | ||||||
Series B, 4.0%, 10/15/2033 | 20,000,000 | 24,634,000 | ||||||
Series A, 4.0%, 10/15/2036 | 5,000,000 | 5,999,150 | ||||||
Series B, 4.0%, 10/15/2036 | 23,580,000 | 28,831,973 | ||||||
Series B, 4.0%, 10/15/2037 | 7,000,000 | 8,536,710 | ||||||
Series A, 4.0%, 10/15/2049 | 4,685,000 | 5,631,042 | ||||||
Series A, 5.0%, 10/15/2043 | 6,000,000 | 7,593,780 | ||||||
Texas, State Water Development Board, State Water Implementation Fund, Series B, 5.0%, 4/15/2049 | 10,000,000 | 12,737,400 | ||||||
Texas, University of Texas Revenue, Series B, 5.0%, 8/15/2049 | 12,750,000 | 21,106,987 | ||||||
|
| |||||||
| 453,450,189 | ||||||||
| Utah 0.8% | ||||||||
Salt Lake City, UT, Airport Revenue: | ||||||||
Series A, AMT, 5.0%, 7/1/2032 | 5,000,000 | 6,186,800 | ||||||
Series A, AMT, 5.0%, 7/1/2043 | 3,850,000 | 4,637,017 | ||||||
Series A, AMT, 5.0%, 7/1/2047 | 13,435,000 | 15,958,093 | ||||||
Series A, AMT, 5.0%, 7/1/2048 | 2,310,000 | 2,764,308 | ||||||
|
| |||||||
| 29,546,218 | ||||||||
| Virginia 2.8% | ||||||||
Hampton Roads, VA, Transportation Accountability Commission Revenue, Senior Lien, Series A, 4.0%, 7/1/2050 | 20,000,000 | 23,843,400 | ||||||
Virginia, Small Business Financing Authority, Private Activity Revenue, Transform 66 P3 Project: | ||||||||
AMT, 5.0%, 12/31/2052 | 19,655,000 | 22,451,513 | ||||||
AMT, 5.0%, 12/31/2056 | 5,000,000 | 5,695,200 | ||||||
Virginia, State College Building Authority, Educational Facilities Revenue, 21st Century, Series A, 4.0%, 2/1/2031 | 15,145,000 | 17,469,152 | ||||||
Virginia, State College Building Authority, Educational Facilities Revenue, Public Higher Education: | ||||||||
Series A, 4.0%, 9/1/2030 | 5,590,000 | 6,693,466 | ||||||
Series A, 4.0%, 9/1/2031 | 4,710,000 | 5,500,903 | ||||||
Virginia, State Commonwealth Transportation Board Revenue, Series A, 5.0%, 5/15/2031 | 5,120,000 | 6,564,557 | ||||||
The accompanying notes are an integral part of the financial statements.
| 28 | | | DWS Managed Municipal Bond Fund |
| Principal Amount ($) | Value ($) | |||||||
Virginia, State Public Building Authority, Public Facility Revenue: | ||||||||
Series A, 4.0%, 8/1/2039 | 5,000,000 | 6,116,650 | ||||||
Series B, AMT, 4.0%, 8/1/2039 | 9,700,000 | 11,866,301 | ||||||
|
| |||||||
| 106,201,142 | ||||||||
| Washington 4.9% | ||||||||
King County, WA, School District No. 412 Shoreline: | ||||||||
4.0%, 12/1/2035 | 5,505,000 | 6,610,459 | ||||||
4.0%, 12/1/2037 | 15,000,000 | 17,907,450 | ||||||
5.0%, 12/1/2031 | 14,345,000 | 18,790,659 | ||||||
Port of Seattle, WA, Revenue Bonds: | ||||||||
Series A, AMT, 5.0%, 5/1/2029 | 8,280,000 | 10,051,258 | ||||||
Series A, AMT, 5.0%, 5/1/2030 | 6,200,000 | 7,467,962 | ||||||
Series A, AMT, 5.0%, 5/1/2031 | 9,200,000 | 11,040,736 | ||||||
Seattle, WA, Municipal Light & Power Revenue, Series A, 4.0%, 1/1/2038 | 6,875,000 | 8,101,362 | ||||||
Spokane County, WA, School District No. 81, Series B, 4.0%, 12/1/2030 | 18,800,000 | 22,579,364 | ||||||
Washington, Energy Northwest Electric Revenue, Series C, 5.0%, 7/1/2030 | 14,405,000 | 18,859,314 | ||||||
Washington, Port of Seattle Revenue, AMT, 5.0%, 4/1/2044 | 3,000,000 | 3,624,300 | ||||||
Washington, State Convention Center Public Facilities District: | ||||||||
5.0%, 7/1/2043 | 3,800,000 | 4,278,344 | ||||||
5.0%, 7/1/2048 | 6,125,000 | 6,865,329 | ||||||
Washington, State General Obligation, Series C, 5.0%, 2/1/2031 | 16,000,000 | 20,659,680 | ||||||
Washington, State Health Care Facilities Authority, CommonSpirit Health Obligation, Series A-2, 5.0%, 8/1/2044 | 8,500,000 | 10,241,735 | ||||||
Washington, State Higher Educational Facilities Authority, Seattle University Project: | ||||||||
4.0%, 5/1/2038 | 4,690,000 | 5,135,972 | ||||||
4.0%, 5/1/2050 | 4,350,000 | 4,770,427 | ||||||
Washington, State Housing Finance Commission, Non-Profit Housing Revenue, Rockwood Retirement Communities Project, Series A, 144A, 5.0%, 1/1/2051 | 2,000,000 | 2,014,460 | ||||||
Washington, State Housing Finance Commission, Non-profit Housing Revenue, Rockwood Retirement Communities Project, 144A, 5.0%, 1/1/2055 | 9,010,000 | 8,951,255 | ||||||
|
| |||||||
| 187,950,066 | ||||||||
| West Virginia 0.8% | ||||||||
West Virginia, Marshall University Revenue, Improvement & Refunding Bonds, Series A, 4.0%, 5/1/2050, INS: AGMC | 5,000,000 | 5,759,850 | ||||||
The accompanying notes are an integral part of the financial statements.
| DWS Managed Municipal Bond Fund | | | 29 |
| Principal Amount ($) | Value ($) | |||||||
West Virginia, State Hospital Finance Authority, State University Health System Obligated Group, Series A, 5.0%, 6/1/2047 | 20,120,000 | 23,815,239 | ||||||
|
| |||||||
| 29,575,089 | ||||||||
| Wisconsin 0.6% | ||||||||
Wisconsin, Hospital & Healthcare Revenue, Health & Education Facilities Authority: | ||||||||
Series B, ETM, 6.25%, 1/1/2022, INS: AMBAC | 885,000 | 914,816 | ||||||
Series C, ETM, 6.25%, 1/1/2022, INS: AMBAC | 1,540,000 | 1,591,883 | ||||||
Wisconsin, Public Finance Authority, Senior Living Community First Mortgage Revenue, Cedars Obligated Group: | ||||||||
144A, 5.5%, 5/1/2039 | 235,000 | 234,448 | ||||||
144A, 5.75%, 5/1/2054 | 6,215,000 | 6,150,861 | ||||||
Wisconsin, Public Financing Authority, Retirement Facilities Revenue, Southminster, Inc.: | ||||||||
144A, 5.0%, 10/1/2043 | 1,560,000 | 1,621,339 | ||||||
144A, 5.0%, 10/1/2053 | 12,415,000 | 12,787,077 | ||||||
|
| |||||||
| 23,300,424 | ||||||||
Total Municipal Bonds and Notes (Cost $3,472,783,605) | 3,785,072,100 | |||||||
| Underlying Municipal Bonds of Inverse Floaters (b) 0.3% |
| |||||||
| New York | ||||||||
New York, NY, General Obligation, 5.0%, 4/1/2026 (c) (Cost $12,406,278) | 10,000,000 | 12,348,650 | ||||||
Trust: New York, NY, General Obligation, Series 2020-XM0900, 144A, 17.96%, 4/1/2037, Leverage Factor at purchase date: 4 to 1 | ||||||||
| Open-End Investment Companies 0.0% | ||||||||
BlackRock Liquidity Funds MuniCash Portfolio, Institutional Shares, 0.01%**** (Cost $718,601) | 717,944 | 718,015 | ||||||
| % of Net Assets | Value ($) | |||||||
| Total Investment Portfolio (Cost $3,485,908,484) | 99.1 | 3,798,138,765 | ||||||
| Floating Rate Notes (b) | (0.2 | ) | (7,500,000 | ) | ||||
| Other Assets and Liabilities, Net | 1.1 | 42,900,770 | ||||||
| ||||||||
| Net Assets | 100.0 | 3,833,539,535 | ||||||
The accompanying notes are an integral part of the financial statements.
| 30 | | | DWS Managed Municipal Bond Fund |
| * | Non-income producing security. |
| ** | Variable rate demand notes are securities whose interest rates are reset periodically (usually daily mode or weekly mode) by remarketing agents based on current market levels, and are not directly set as a fixed spread to a reference rate. These securities may be redeemed at par by the holder at any time, and are shown at their current rates as of November 30, 2020. Date shown reflects the earlier of demand date or stated maturity date. |
| *** | Variable or floating rate security. These securities are shown at their current rate as of November 30, 2020. For securities based on a published reference rate and spread, the reference rate and spread are indicated within the description above. Certain variable rate securities are not based on a published reference rate and spread but adjust periodically based on current market conditions, prepayment of underlying positions and/or other variables. |
| **** | Current yield; not a coupon rate. |
| (a) | Defaulted security or security for which income has been deemed uncollectible. |
| (b) | Securities represent the underlying municipal obligations of inverse floating rate obligations held by the Fund. The Floating Rate Notes represents leverage to the Fund and is the amount owed to the floating rate note holders. |
| (c) | Security forms part of the below inverse floater. The Fund accounts for these inverse floaters as a form of secured borrowing, by reflecting the value of the underlying bond in the investments of the Fund and the amount owed to the floating rate note holder as a liability. |
144A: Security exempt from registration under Rule 144A of the Securities Act of 1933. These securities may be resold in transactions exempt from registration, normally to qualified institutional buyers.
AGMC: Assured Guaranty Municipal Corp.
AMBAC: Ambac Financial Group, Inc.
AMT: Subject to alternative minimum tax.
ETM: Bonds bearing the description ETM (escrow to maturity) are collateralized usually by U.S. Treasury securities which are held in escrow and used to pay principal and interest on bonds so designated.
GTY: Guaranty Agreement
INS: Insured
LIQ: Liquidity Facility
LOC: Letter of Credit
NATL: National Public Finance Guarantee Corp.
Prerefunded: Bonds which are prerefunded are collateralized usually by U.S. Treasury securities which are held in escrow and used to pay principal and interest on tax-exempt issues and to retire the bonds in full at the earliest refunding date.
SPA: Standby Bond Purchase Agreement
The accompanying notes are an integral part of the financial statements.
| DWS Managed Municipal Bond Fund | | | 31 |
Fair Value Measurements
Various inputs are used in determining the value of the Fund’s investments. These inputs are summarized in three broad levels. Level 1 includes quoted prices in active markets for identical securities. Level 2 includes other significant observable inputs (including quoted prices for similar securities, interest rates, prepayment speeds and credit risk). Level 3 includes significant unobservable inputs (including the Fund’s own assumptions in determining the fair value of investments). The level assigned to the securities valuations may not be an indication of the risk or liquidity associated with investing in those securities.
The following is a summary of the inputs used as of November 30, 2020 in valuing the Fund’s investments. For information on the Fund’s policy regarding the valuation of investments, please refer to the Security Valuation section of Note A in the accompanying Notes to Financial Statements.
| Assets | Level 1 | Level 2 | Level 3 | Total | ||||||||||||
| Municipal Investments (c) | $ | — | $ | 3,797,420,750 | $ | — | $ | 3,797,420,750 | ||||||||
| Open-End Investment Companies | 718,015 | — | — | 718,015 | ||||||||||||
| Total | $ | 718,015 | $ | 3,797,420,750 | $ | — | $ | 3,798,138,765 | ||||||||
| (c) | See Investment Portfolio for additional detailed categorizations. |
The accompanying notes are an integral part of the financial statements.
| 32 | | | DWS Managed Municipal Bond Fund |
Statement of Assets and Liabilities
| as of November 30, 2020 (Unaudited) | ||||
| Assets | ||||
| Investments in securities, at value (cost $3,485,908,484) | $ | 3,798,138,765 | ||
| Receivable for investments sold | 4,450,083 | |||
| Receivable for investments sold — when-issued security | 1,293,106 | |||
| Receivable for Fund shares sold | 1,613,955 | |||
| Interest receivable | 44,423,660 | |||
| Other assets | 55,963 | |||
| Total assets | 3,849,975,532 | |||
| Liabilities | ||||
| Payable for investments purchased — when-issued security | 1,276,684 | |||
| Payable for Fund shares redeemed | 2,490,595 | |||
| Payable for floating rate notes issued | 7,500,000 | |||
| Distributions payable | 2,123,195 | |||
| Accrued management fee | 924,126 | |||
| Accrued Trustees’ fees | 45,024 | |||
| Other accrued expenses and payables | 2,076,373 | |||
| Total liabilities | 16,435,997 | |||
| Net assets, at value | $ | 3,833,539,535 | ||
| Net Assets Consist of | ||||
| Distributable earnings (loss) | 323,202,215 | |||
| Paid-in capital | 3,510,337,320 | |||
| Net assets, at value | $ | 3,833,539,535 | ||
The accompanying notes are an integral part of the financial statements.
| DWS Managed Municipal Bond Fund | | | 33 |
| Statement of Assets and Liabilities as of November 30, 2020 (Unaudited) (continued) |
| Net Asset Value | ||||
Class A | ||||
| Net Asset Value and redemption price per share ($1,253,214,631 ÷ 134,964,700 outstanding shares of beneficial interest, $.01 par value, unlimited number of shares authorized) | $ | 9.29 | ||
| Maximum offering price per share (100 ÷ 97.25 of $9.29) | $ | 9.55 | ||
Class C | ||||
| Net Asset Value, offering and redemption price (subject to contingent deferred sales charge) per share ($102,888,408 ÷ 11,080,674 outstanding shares of beneficial interest, $.01 par value, unlimited number of shares authorized) | $ | 9.29 | ||
Class S | ||||
| Net Asset Value, offering and redemption price per share ($1,999,669,407 ÷ 215,062,669 outstanding shares of beneficial interest, $.01 par value, unlimited number of shares authorized) | $ | 9.30 | ||
Institutional Class | ||||
| Net Asset Value, offering and redemption price per share ($477,767,089 ÷ 51,430,664 outstanding shares of beneficial interest, $.01 par value, unlimited number of shares authorized) | $ | 9.29 | ||
The accompanying notes are an integral part of the financial statements.
| 34 | | | DWS Managed Municipal Bond Fund |
| for the six months ended November 30, 2020 (Unaudited) | ||||
| Investment Income | ||||
| Income: | ||||
| Interest | $ | 70,349,685 | ||
| Expenses: | ||||
| Management fee | 6,415,369 | |||
| Administration fee | 1,898,331 | |||
| Services to shareholders | 2,435,342 | |||
| Distribution and service fees | 2,058,403 | |||
| Custodian fee | 16,104 | |||
| Professional fees | 68,365 | |||
| Reports to shareholders | 67,161 | |||
| Registration fees | 56,852 | |||
| Trustees’ fees and expenses | 70,943 | |||
| Interest expense and fees on floating rate notes issued | 26,971 | |||
| Other | 91,201 | |||
| Total expenses before expense reductions | 13,205,042 | |||
| Expense reductions | (485,010 | ) | ||
| Total expenses after expense reductions | 12,720,032 | |||
| Net investment income | 57,629,653 | |||
| Realized and Unrealized Gain (Loss) | ||||
| Net realized gain (loss) from: | ||||
| Investments | 25,665,671 | |||
| Payments by affiliates (see Note F) | 37,625 | |||
| 25,703,296 | ||||
| Change in net unrealized appreciation (depreciation) on investments | 102,867,454 | |||
| Net gain (loss) | 128,570,750 | |||
| Net increase (decrease) in net assets resulting from operations | $ | 186,200,403 | ||
The accompanying notes are an integral part of the financial statements.
| DWS Managed Municipal Bond Fund | | | 35 |
Statements of Changes in Net Assets
| Increase (Decrease) in Net Assets | Six Months Ended November 30, 2020 (Unaudited) | Year Ended May 31, 2020 | ||||||
| Operations: | ||||||||
| Net investment income (loss) | $ | 57,629,653 | $ | 127,492,442 | ||||
| Net realized gain (loss) | 25,703,296 | (13,039,906 | ) | |||||
| Change in net unrealized appreciation (depreciation) | 102,867,454 | (82,468,144 | ) | |||||
| Net increase (decrease) in net assets resulting from operations | 186,200,403 | 31,984,392 | ||||||
| Distributions to shareholders: | ||||||||
Class A | (17,667,905 | ) | (40,793,993 | ) | ||||
Class C | (1,139,822 | ) | (3,334,197 | ) | ||||
Class S | (30,839,185 | ) | (74,601,025 | ) | ||||
Institutional Class | (7,533,960 | ) | (15,212,672 | ) | ||||
| Total distributions | (57,180,872 | ) | (133,941,887 | ) | ||||
| Fund share transactions: | ||||||||
| Proceeds from shares sold | 267,620,273 | 831,723,250 | ||||||
| Reinvestment of distributions | 49,974,444 | 116,659,374 | ||||||
| Payments for shares redeemed | (481,047,852 | ) | (1,067,112,666 | ) | ||||
| Net increase (decrease) in net assets from Fund share transactions | (163,453,135 | ) | (118,730,042 | ) | ||||
| Increase (decrease) in net assets | (34,433,604 | ) | (220,687,537 | ) | ||||
| Net assets at beginning of period | 3,867,973,139 | 4,088,660,676 | ||||||
| Net assets at end of period | $ | 3,833,539,535 | $ | 3,867,973,139 | ||||
The accompanying notes are an integral part of the financial statements.
| 36 | | | DWS Managed Municipal Bond Fund |
| DWS Managed Municipal Bond Fund — Class A | ||||||||||||||||||||||||||||
| Six Months Ended 11/30/20 | Years Ended May 31, | |||||||||||||||||||||||||||
| (Unaudited) | 2020 | 2019 | 2018 | 2017 | 2016 | |||||||||||||||||||||||
| Selected Per Share Data | ||||||||||||||||||||||||||||
| Net asset value, beginning of period |
| $8.98 | $9.21 | $8.98 | $9.17 | $9.42 | $9.25 | |||||||||||||||||||||
| Income from investment operations: |
| |||||||||||||||||||||||||||
Net investment income |
| .13 | .28 | .28 | .28 | .31 | .35 | |||||||||||||||||||||
Net realized and unrealized gain (loss) |
| .31 | (.21 | ) | .23 | (.19 | ) | (.25 | ) | .17 | ||||||||||||||||||
Total from investment operations |
| .44 | .07 | .51 | .09 | .06 | .52 | |||||||||||||||||||||
| Less distributions from: |
| |||||||||||||||||||||||||||
Net investment income |
| (.13 | ) | (.28 | ) | (.28 | ) | (.28 | ) | (.31 | ) | (.35 | ) | |||||||||||||||
Net realized gains |
| — | (.02 | ) | (.00 | )*** | (.00 | )*** | (.00 | )*** | (.00 | )*** | ||||||||||||||||
Total distributions |
| (.13 | ) | (.30 | ) | (.28 | ) | (.28 | ) | (.31 | ) | (.35 | ) | |||||||||||||||
| Net asset value, end of period |
| $9.29 | $8.98 | $9.21 | $8.98 | $9.17 | $9.42 | |||||||||||||||||||||
| Total Return (%)a | 4.92 | ** | 0.64 | 5.85 | 1.00 | .71 | 5.70 | |||||||||||||||||||||
| Ratios to Average Net Assets and Supplemental Data |
| |||||||||||||||||||||||||||
| Net assets, end of period ($ millions) |
| 1,253 | 1,220 | 1,315 | 1,507 | 1,693 | 2,031 | |||||||||||||||||||||
| Ratio of expenses (including interest expense) (%)b |
| .76 | * | .76 | .77 | .77 | .79 | .80 | ||||||||||||||||||||
| Ratio of expenses (excluding interest expense) (%) |
| .76 | * | .76 | .77 | .76 | .76 | .76 | ||||||||||||||||||||
| Ratio of net investment income (%) |
| 2.83 | * | 3.02 | 3.18 | 3.08 | 3.40 | 3.73 | ||||||||||||||||||||
| Portfolio turnover rate (%) |
| 20 | ** | 35 | 39 | 42 | 38 | 29 | ||||||||||||||||||||
| a | Total return does not reflect the effect of any sales charges. |
| b | Interest expense represents interest and fees on short-term floating rate notes issued in conjunction with inverse floating rate securities. Interest income from such transactions is included in income from investment operations. |
| * | Annualized |
| ** | Not annualized |
| *** | Amount is less than $.005. |
The accompanying notes are an integral part of the financial statements.
| DWS Managed Municipal Bond Fund | | | 37 |
| DWS Managed Municipal Bond Fund — Class C | ||||||||||||||||||||||||||
| Six Months Ended 11/30/20 | Years Ended May 31, | |||||||||||||||||||||||||
| (Unaudited) | 2020 | 2019 | 2018 | 2017 | 2016 | |||||||||||||||||||||
| Selected Per Share Data |
| |||||||||||||||||||||||||
| Net asset value, beginning of period | $8.98 | $9.21 | $8.98 | $9.17 | $9.42 | $9.25 | ||||||||||||||||||||
| Income from investment operations: | ||||||||||||||||||||||||||
Net investment income | .09 | .20 | .21 | .21 | .24 | .27 | ||||||||||||||||||||
Net realized and unrealized gain (loss) | .31 | (.21 | ) | .23 | (.19 | ) | (.25 | ) | .17 | |||||||||||||||||
Total from investment operations | .40 | (.01 | ) | .44 | .02 | (.01 | ) | .44 | ||||||||||||||||||
| Less distributions from: | ||||||||||||||||||||||||||
Net investment income | (.09 | ) | (.20 | ) | (.21 | ) | (.21 | ) | (.24 | ) | (.27 | ) | ||||||||||||||
Net realized gains | — | (.02 | ) | (.00 | )*** | (.00 | )*** | (.00 | )*** | (.00 | )*** | |||||||||||||||
Total distributions | (.09 | ) | (.22 | ) | (.21 | ) | (.21 | ) | (.24 | ) | (.27 | ) | ||||||||||||||
| Net asset value, end of period | $9.29 | $8.98 | $9.21 | $8.98 | $9.17 | $9.42 | ||||||||||||||||||||
| Total Return (%)a | 4.50 | ** | (.15 | ) | 5.02 | b | .21 | (.08 | ) | 4.88 | b | |||||||||||||||
| Ratios to Average Net Assets and Supplemental Data |
| |||||||||||||||||||||||||
| Net assets, end of period ($ millions) | 103 | 124 | 151 | 208 | 259 | 292 | ||||||||||||||||||||
| Ratio of expenses before expense reductions (including interest expense) (%)c | 1.55 | * | 1.55 | 1.57 | 1.56 | 1.58 | 1.59 | |||||||||||||||||||
| Ratio of expenses after expense reductions (including interest expense) (%)c | 1.55 | * | 1.55 | 1.56 | 1.56 | 1.58 | 1.59 | |||||||||||||||||||
| Ratio of expenses after expense reductions (excluding interest expense) (%) | 1.55 | * | 1.55 | 1.56 | 1.55 | 1.55 | 1.55 | |||||||||||||||||||
| Ratio of net investment income (%) | 2.05 | * | 2.23 | 2.39 | 2.29 | 2.61 | 2.94 | |||||||||||||||||||
| Portfolio turnover rate (%) | 20 | ** | 35 | 39 | 42 | 38 | 29 | |||||||||||||||||||
| a | Total return does not reflect the effect of any sales charges. |
| b | Total return would have been lower had certain expenses not been reduced. |
| c | Interest expense represents interest and fees on short-term floating rate notes issued in conjunction with inverse floating rate securities. Interest income from such transactions is included in income from investment operations. |
| * | Annualized |
| ** | Not annualized |
| *** | Amount is less than $.005. |
The accompanying notes are an integral part of the financial statements.
| 38 | | | DWS Managed Municipal Bond Fund |
| DWS Managed Municipal Bond Fund — Class S | ||||||||||||||||||||||||||
| Six Months Ended 11/30/20 | Years Ended May 31, | |||||||||||||||||||||||||
| (Unaudited) | 2020 | 2019 | 2018 | 2017 | 2016 | |||||||||||||||||||||
| Selected Per Share Data |
| |||||||||||||||||||||||||
| Net asset value, beginning of period | $ | 8.99 | $ | 9.23 | $ | 9.00 | $9.18 | $9.44 | $9.26 | |||||||||||||||||
| Income from investment operations: | ||||||||||||||||||||||||||
Net investment income | .14 | .29 | .30 | .30 | .33 | .37 | ||||||||||||||||||||
Net realized and unrealized gain (loss) | .31 | (.22 | ) | .23 | (.18 | ) | (.26 | ) | .18 | |||||||||||||||||
Total from investment operations | .45 | .07 | .53 | .12 | .07 | .55 | ||||||||||||||||||||
| Less distributions from: | ||||||||||||||||||||||||||
Net investment income | (.14 | ) | (.29 | ) | (.30 | ) | (.30 | ) | (.33 | ) | (.37 | ) | ||||||||||||||
Net realized gains | — | (.02 | ) | (.00 | )*** | (.00 | )*** | (.00 | )*** | (.00 | )*** | |||||||||||||||
Total distributions | (.14 | ) | (.31 | ) | (.30 | ) | (.30 | ) | (.33 | ) | (.37 | ) | ||||||||||||||
| Net asset value, end of period | $ | 9.30 | $ | 8.99 | $ | 9.23 | $9.00 | $9.18 | $9.44 | |||||||||||||||||
| Total Return (%)a | 5.02 | ** | .73 | 6.07 | 1.32 | .81 | 6.03 | |||||||||||||||||||
| Ratios to Average Net Assets and Supplemental Data |
| |||||||||||||||||||||||||
| Net assets, end of period ($ millions) | 2,000 | 2,041 | 2,283 | 2,670 | 2,918 | 2,940 | ||||||||||||||||||||
| Ratio of expenses before expense reductions (including interest expense) (%)b | .61 | * | .62 | .61 | .62 | .63 | .64 | |||||||||||||||||||
| Ratio of expenses after expense reductions (including interest expense) (%)b | .56 | * | .56 | .56 | .58 | .60 | .60 | |||||||||||||||||||
| Ratio of expenses after expense reductions (excluding interest expense) (%) | .56 | * | .56 | .56 | .56 | .57 | .56 | |||||||||||||||||||
| Ratio of net investment income (%) | 3.04 | * | 3.22 | 3.39 | 3.27 | 3.59 | 3.93 | |||||||||||||||||||
| Portfolio turnover rate (%) | 20 | ** | 35 | 39 | 42 | 38 | 29 | |||||||||||||||||||
| a | Total return would have been lower had certain expenses not been reduced. |
| b | Interest expense represents interest and fees on short-term floating rate notes issued in conjunction with inverse floating rate securities. Interest income from such transactions is included in income from investment operations. |
| * | Annualized |
| ** | Not annualized |
| *** | Amount is less than $.005. |
The accompanying notes are an integral part of the financial statements.
| DWS Managed Municipal Bond Fund | | | 39 |
| DWS Managed Municipal Bond Fund — Institutional Class | ||||||||||||||||||||||||||
| Six Months Ended 11/30/20 | Years Ended May 31, | |||||||||||||||||||||||||
| (Unaudited) | 2020 | 2019 | 2018 | 2017 | 2016 | |||||||||||||||||||||
| Selected Per Share Data |
| |||||||||||||||||||||||||
| Net asset value, beginning of period | $8.99 | $9.22 | $8.99 | $9.17 | $9.42 | $9.25 | ||||||||||||||||||||
| Income from investment operations: | ||||||||||||||||||||||||||
Net investment income | .14 | .30 | .30 | .30 | .34 | .37 | ||||||||||||||||||||
Net realized and unrealized gain (loss) | .30 | (.21 | ) | .23 | (.18 | ) | (.26 | ) | .17 | |||||||||||||||||
Total from investment operations | .44 | .09 | .53 | .12 | .08 | .54 | ||||||||||||||||||||
| Less distributions from: | ||||||||||||||||||||||||||
Net investment income | (.14 | ) | (.30 | ) | (.30 | ) | (.30 | ) | (.33 | ) | (.37 | ) | ||||||||||||||
Net realized gains | — | (.02 | ) | (.00 | )*** | (.00 | )*** | (.00 | )*** | (.00 | )*** | |||||||||||||||
Total distributions | (.14 | ) | (.32 | ) | (.30 | ) | (.30 | ) | (.33 | ) | (.37 | ) | ||||||||||||||
| Net asset value, end of period | $9.29 | $8.99 | $9.22 | $8.99 | $9.17 | $9.42 | ||||||||||||||||||||
| Total Return (%) | 4.91 | * | .86 | 6.09 | 1.33 | .94 | a | 5.96 | ||||||||||||||||||
| Ratios to Average Net Assets and Supplemental Data |
| |||||||||||||||||||||||||
| Net assets, end of period ($ millions) | 478 | 484 | 340 | 241 | 177 | 311 | ||||||||||||||||||||
| Ratio of expenses before expense reductions (including interest expense) (%)b | .55 | * | .55 | .55 | .56 | .59 | .56 | |||||||||||||||||||
| Ratio of expenses after expense reductions (including interest expense) (%)b | .55 | * | .55 | .55 | .56 | .56 | .56 | |||||||||||||||||||
| Ratio of expenses after expense reductions (excluding interest expense) (%) | .55 | * | .55 | .55 | .55 | .53 | .52 | |||||||||||||||||||
| Ratio of net investment income (%) | 3.04 | * | 3.22 | 3.41 | 3.29 | 3.63 | 3.93 | |||||||||||||||||||
| Portfolio turnover rate (%) | 20 | ** | 35 | 39 | 42 | 38 | 29 | |||||||||||||||||||
| a | Total return would have been lower had certain expenses not been reduced. |
| b | Interest expense represents interest and fees on short-term floating rate notes issued in conjunction with inverse floating rate securities. Interest income from such transactions is included in income from investment operations. |
| * | Annualized |
| ** | Not annualized |
| *** | Amount is less than $.005. |
The accompanying notes are an integral part of the financial statements.
| 40 | | | DWS Managed Municipal Bond Fund |
| Notes to Financial Statements | (Unaudited) |
A. Organization and Significant Accounting Policies
DWS Managed Municipal Bond Fund (the “Fund”) is a diversified series of Deutsche DWS Municipal Trust (the “Trust”), which is registered under the Investment Company Act of 1940, as amended (the “1940 Act”), as an open-end management investment company organized as a Massachusetts business trust.
The Fund offers multiple classes of shares which provide investors with different purchase options. Class A shares are subject to an initial sales charge. Class C shares are not subject to an initial sales charge but are subject to higher ongoing expenses than Class A shares and a contingent deferred sales charge payable upon certain redemptions within one year of purchase. Class C shares automatically convert to Class A shares in the same fund after 10 years, provided that the fund or the financial intermediary through which the shareholder purchased the Class C shares has records verifying that the Class C shares have been held for at least 10 years. Class S shares are not subject to initial or contingent deferred sales charges and are available through certain intermediary relationships with financial services firms, or can be purchased by establishing an account directly with the Fund’s transfer agent. Institutional Class shares are not subject to initial or contingent deferred sales charges and are generally available only to qualified institutions.
Investment income, realized and unrealized gains and losses and certain fund-level expenses and expense reductions, if any, are borne pro rata on the basis of relative net assets by the holders of all classes of shares, except that each class bears certain expenses unique to that class such as distribution and services fees, services to shareholders and certain other class-specific expenses. Differences in class-level expenses may result in payment of different per share dividends by class. All shares of the Fund have equal rights with respect to voting subject to class-specific arrangements.
The Fund’s financial statements are prepared in accordance with accounting principles generally accepted in the United States of America (“U.S. GAAP”) which require the use of management estimates. Actual results could differ from those estimates. The Fund qualifies as an investment company under Topic 946 of Accounting Standards Codification of U.S. GAAP. The policies described below are followed consistently by the Fund in the preparation of its financial statements.
Security Valuation. Investments are stated at value determined as of the close of regular trading on the New York Stock Exchange on each day the exchange is open for trading.
Various inputs are used in determining the value of the Fund’s investments. These inputs are summarized in three broad levels. Level 1 includes quoted
| DWS Managed Municipal Bond Fund | | | 41 |
prices in active markets for identical securities. Level 2 includes other significant observable inputs (including quoted prices for similar securities, interest rates, prepayment speeds and credit risk). Level 3 includes significant unobservable inputs (including the Fund’s own assumptions in determining the fair value of investments). The level assigned to the securities valuations may not be an indication of the risk or liquidity associated with investing in those securities.
Municipal debt securities are valued at prices supplied by independent pricing services approved by the Fund’s Board whose valuations are intended to reflect the mean between the bid and asked prices. Such services may use various pricing techniques which take into account appropriate factors such as yield, quality, coupon rate, maturity, type of issue, trading characteristics and other data, as well as broker quotes. If the pricing services are unable to provide valuations, the securities are valued at the average of the most recent reliable bid and quotations or evaluated prices, as applicable, obtained from broker-dealers. These securities are generally categorized as Level 2.
Investments in open-end investment companies are valued at their net asset value each business day and are categorized as Level 1.
Securities and other assets for which market quotations are not readily available or for which the above valuation procedures are deemed not to reflect fair value are valued in a manner that is intended to reflect their fair value as determined in accordance with procedures approved by the Board and are generally categorized as Level 3. In accordance with the Fund’s valuation procedures, factors considered in determining value may include, but are not limited to, the type of the security; the size of the holding; the initial cost of the security; the existence of any contractual restrictions on the security’s disposition; the price and extent of public trading in similar securities of the issuer or of comparable companies; quotations or evaluated prices from broker-dealers and/or pricing services; information obtained from the issuer, analysts, and/or the appropriate stock exchange (for exchange-traded securities); an analysis of the company’s or issuer’s financial statements; an evaluation of the forces that influence the issuer and the market(s) in which the security is purchased and sold; and with respect to debt securities, the maturity, coupon, creditworthiness, currency denomination and the movement of the market in which the security is normally traded. The value determined under these procedures may differ from published values for the same securities.
Disclosure about the classification of fair value measurements is included in a table following the Fund’s Investment Portfolio.
Inverse Floaters. The Fund invests in inverse floaters. Inverse floaters are debt instruments with a weekly floating rate of interest that bears an
| 42 | | | DWS Managed Municipal Bond Fund |
inverse relationship to changes in the short-term interest rate market. Inverse floaters are created by depositing a fixed-rate long-term municipal bond into a special purpose Tender Offer Bond trust (the “TOB Trust”). In turn the TOB Trust issues a short-term floating rate note and an inverse floater. The short-term floating rate note is issued in a face amount equal to some fraction of the underlying bond’s par amount and is sold to a third party, usually a tax-exempt money market fund. The Fund receives the proceeds from the sale of the short-term floating rate note and uses the cash proceeds to make additional investments. The short-term floating rate note represents leverage to the Fund. The Fund, as the holder of the inverse floater, has full exposure to any increase or decrease in the value of the underlying bond. The income stream from the underlying bond in the TOB Trust is divided between the floating rate note and the inverse floater. The inverse floater earns all of the interest from the underlying long-term fixed-rate bond less the amount of interest paid on the floating rate note and the expenses of the TOB Trust. The floating rate notes issued by the TOB Trust are valued at cost, which approximates fair value.
By holding the inverse floater, the Fund has the right to collapse the TOB Trust by causing the holders of the floating rate instrument to tender their notes at par and have the broker transfer the underlying bond to the Fund. The floating rate note holder can also elect to tender the note for redemption at par at each reset date. The Fund accounts for these transactions as a form of secured borrowing, by reflecting the value of the underlying bond in the investments of the Fund and the amount owed to the floating rate note holder as a liability under the caption “Payable for floating rate notes issued” in the Statement of Assets and Liabilities. Income earned on the underlying bond is included in interest income, and interest paid on the floaters and the expenses of the TOB Trust are included in “Interest expense and fees on floating rate notes issued” in the Statement of Operations. The weighted average outstanding daily balance of the floating rate notes issued during the six months ended November 30, 2020 approximately $7,582,000, with a weighted average interest rate of 0.71%.
The Fund may enter into shortfall and forbearance agreements by which the Fund agrees to reimburse the TOB Trust, in certain circumstances, for the difference between the liquidation value of the underlying bond held by the TOB Trust and the liquidation value of the floating rate notes plus any shortfalls in interest cash flows. This could potentially expose the Fund to losses in excess of the value of the Fund’s inverse floater investments. In addition, the value of inverse floaters may decrease significantly when interest rates increase. The market for inverse floaters may be more volatile and less liquid than other municipal bonds of comparable maturity. The TOB Trust could be terminated outside of the Fund’s control, resulting in a reduction of leverage and disposal of
| DWS Managed Municipal Bond Fund | | | 43 |
portfolio investments at inopportune times and prices. Investments in inverse floaters generally involve greater risk than in an investment in fixed-rate bonds.
Federal Income Taxes. The Fund’s policy is to comply with the requirements of the Internal Revenue Code, as amended, which are applicable to regulated investment companies, and to distribute all of its taxable and tax-exempt income to its shareholders.
From November 1, 2019 through May 31, 2020, the Fund elects to defer qualified late year losses of approximately $26,118,000 of realized capital losses and treat them as arising in the fiscal year ending May 31, 2021.
At November 30, 2020, the aggregate cost of investments for federal income tax purposes was $3,474,396,142. The net unrealized appreciation for all investments based on tax cost was $316,242,623. This consisted of aggregate gross unrealized appreciation for all investments for which there was an excess of value over tax cost of $325,010,587 and aggregate gross unrealized depreciation for all investments for which there was an excess of tax cost over value of $8,767,964.
The Fund has reviewed the tax positions for the open tax years as of May 31, 2020 and has determined that no provision for income tax and/or uncertain tax positions is required in the Fund’s financial statements. The Fund’s federal tax returns for the prior three fiscal years remain open subject to examination by the Internal Revenue Service.
Distribution of Income and Gains. Net investment income of the Fund is declared as a daily dividend and is distributed to shareholders monthly. Net realized gains from investment transactions, in excess of available capital loss carryforwards, would be taxable to the Fund if not distributed, and, therefore, will be distributed to shareholders at least annually. The Fund may also make additional distributions for tax purposes if necessary.
The timing and characterization of certain income and capital gain distributions are determined annually in accordance with federal tax regulations which may differ from accounting principles generally accepted in the United States of America. These differences primarily relate to investments in inverse floater transactions, certain securities sold at a loss and accretion of market discount on debt securities. As a result, net investment income (loss) and net realized gain (loss) on investment transactions for a reporting period may differ significantly from distributions during such period. Accordingly, the Fund may periodically make reclassifications among certain of its capital accounts without impacting the net asset value of the Fund.
The tax character of current year distributions will be determined at the end of the current fiscal year.
Expenses. Expenses of the Trust arising in connection with a specific fund are allocated to that fund. Other Trust expenses which cannot be directly
| 44 | | | DWS Managed Municipal Bond Fund |
attributed to a fund are apportioned among the funds in the Trust based upon the relative net assets or other appropriate measures.
Contingencies. In the normal course of business, the Fund may enter into contracts with service providers that contain general indemnification clauses. The Fund’s maximum exposure under these arrangements is unknown, as this would involve future claims that may be made against the Fund that have not yet been made. However, based on experience, the Fund expects the risk of loss to be remote.
Other. Investment transactions are accounted for on a trade date plus one basis for daily net asset value calculations. However, for financial reporting purposes, investment transactions are reported on trade date. Interest income is recorded on the accrual basis. Realized gains and losses from investment transactions are recorded on an identified cost basis. All premiums and discounts are amortized/accreted for financial reporting purposes, with the exception of securities in default of principal.
B. Purchases and Sales of Securities
During the six months ended November 30, 2020, purchases and sales of investment securities (excluding short-term investments) aggregated $753,321,612 and $862,549,627, respectively.
C. Related Parties
Management Agreement. Under the Investment Management Agreement with DWS Investment Management Americas, Inc. (“DIMA” or the “Advisor”), an indirect, wholly owned subsidiary of DWS Group GmbH & Co. KGaA (“DWS Group”), the Advisor directs the investments of the Fund in accordance with its investment objectives, policies and restrictions. The Advisor determines the securities, instruments and other contracts relating to investments to be purchased, sold or entered into by the Fund.
Under the Investment Management Agreement with the Advisor, the Fund pays a monthly management fee based on the Fund’s average daily net assets, computed and accrued daily and payable monthly, at the following annual rates:
| First $250 million of the Fund’s average daily net assets | .365% | |||
| Next $750 million of such net assets | .345% | |||
| Next $1.5 billion of such net assets | .325% | |||
| Next $2.5 billion of such net assets | .315% | |||
| Next $2.5 billion of such net assets | .295% | |||
| Next $2.5 billion of such net assets | .275% | |||
| Next $2.5 billion of such net assets | .255% | |||
| Over $12.5 billion of such net assets | .235% |
| DWS Managed Municipal Bond Fund | | | 45 |
Accordingly, for six months ended November 30, 2020, the fee pursuant to the Investment Management Agreement was equivalent to annualized rate (exclusive of any applicable waivers/reimbursements) of 0.33% of the Fund’s average daily net assets.
For the period from June 1, 2020 through September 30, 2020, the Advisor had contractually agreed to waive its fees and/or reimburse certain operating expenses of the Fund to the extent necessary to maintain the total annual operating expenses (excluding certain expenses such as extraordinary expenses, taxes, brokerage and interest) of each class as follows:
| Class A | .81% | |||
| Class C | 1.56% | |||
| Class S | .56% | |||
| Institutional Class | .56% |
Effective October 1, 2020 through September 30, 2021, the Advisor has contractually agreed to waive its fees and/or reimburse certain operating expenses of the Fund to the extent necessary to maintain the total annual operating expenses (excluding certain expenses such as extraordinary expenses, taxes, brokerage and interest) of each class as follows:
| Class A | .80% | |||
| Class C | 1.55% | |||
| Class S | .55% | |||
| Institutional Class | .55% |
For the six months ended November 30 2020, fees waived and/or expenses reimbursed for Class S is $485,010.
Administration Fee. Pursuant to an Administrative Services Agreement, DIMA provides most administrative services to the Fund. For all services provided under the Administrative Services Agreement, the Fund pays the Advisor an annual fee (“Administration Fee”) of 0.097% of the Fund’s average daily net assets, computed and accrued daily and payable monthly. For the six months ended November 30, 2020, the Administration Fee was $1,898,331, of which $304,667 is unpaid.
Service Provider Fees. DWS Service Company (“DSC”), an affiliate of the Advisor, is the transfer agent, dividend-paying agent and shareholder service agent of the Fund. Pursuant to a sub-transfer agency agreement between DSC and DST Systems, Inc. (“DST”), DSC has delegated certain transfer agent, dividend-paying agent and shareholder service agent functions to DST. DSC compensates DST out of the shareholder servicing
| 46 | | | DWS Managed Municipal Bond Fund |
fee it receives from the Fund. For the six months ended November 30, 2020, the amounts charged to the Fund by DSC were as follows:
| Services to Shareholders | Total Aggregated | Unpaid at November 30, 2020 | ||||||
| Class A | $ | 57,462 | $ | 21,104 | ||||
| Class C | 1,277 | 532 | ||||||
| Class S | 120,382 | 40,539 | ||||||
| Institutional Class | 3,782 | 2,676 | ||||||
| $ | 182,903 | $ | 64,851 | |||||
In addition, for the six months ended November 30, 2020, the amounts charged to the Fund for recordkeeping and other administrative services provided by unaffiliated third parties, included in the Statement of Operations under “Services to shareholders,” were as follows:
| Sub-Recordkeeping | Total Aggregated | |||
| Class A | $ | 386,862 | ||
| Class C | 57,164 | |||
| Class S | 1,479,623 | |||
| Institutional Class | 250,344 | |||
| $ | 2,173,993 | |||
Distribution and Service Fees. Under the Fund’s Class C 12b-1 Plan, DWS Distributors, Inc. (“DDI”), an affiliate of the Advisor, receives a fee (“Distribution Fee”) of 0.75% of the average daily net assets of Class C shares. In accordance with the Fund’s Underwriting and Distribution Services Agreement, DDI enters into related selling group agreements with various firms at various rates for sales of Class C shares. For the six months ended November 30, 2020, the Distribution Fee was as follows:
| Distribution Fee | Total Aggregated | Unpaid at November 30, 2020 | ||||||
| Class C | $ | 422,572 | $ | 63,960 | ||||
In addition, DDI provides information and administrative services for a fee (“Service Fee”) to Class A and C shareholders at an annual rate of up to 0.25% of the average daily net assets for each such class. DDI in turn has various agreements with financial services firms that provide these services and pays these fees based upon the assets of shareholder
| DWS Managed Municipal Bond Fund | | | 47 |
accounts the firms service. For the six months ended November 30, 2020, the Service Fee was as follows:
| Service Fee | Total Aggregated | Unpaid at November 30, 2020 | Annualized Rate | |||||||||
| Class A | $ | 1,495,034 | $ | 503,840 | .24 | % | ||||||
| Class C | 140,797 | 42,154 | .25 | % | ||||||||
| $ | 1,635,831 | $ | 545,994 | |||||||||
Underwriting Agreement and Contingent Deferred Sales Charge. DDI is the principal underwriter for the Fund. Underwriting commissions paid to DDI in connection with the distribution of Class A shares for the six months ended November 30, 2020 aggregated $10,132.
In addition, DDI receives any contingent deferred sales charge (“CDSC”) from Class C share redemptions occurring within one year of purchase. There is no such charge upon redemption of any share appreciation or reinvested dividends. The CDSC is 1% of the value of the shares redeemed for Class C. For the six months ended November 30, 2020, the CDSC for Class C shares aggregated $4,399. A deferred sales charge of up to 1.00% is assessed on certain redemptions of Class A shares. For the six months ended November 30, 2020, DDI received $13,762 for Class A shares.
Other Service Fees. Under an agreement with the Fund, DIMA is compensated for providing certain pre-press and regulatory filing services to the Fund. For the six months ended November 30, 2020, the amount charged to the Fund by DIMA included in the Statement of Operations under “Reports to shareholders” aggregated $7,808, of which $7,083 is unpaid.
Trustees’ Fees and Expenses. The Fund paid retainer fees to each Trustee not affiliated with the Advisor, plus specified amounts to the Board Chairperson and to each committee Chairperson.
Transactions with Affiliates. The Fund may purchase securities from, or sell securities to, an affiliated fund provided the affiliation is solely due to having a common investment adviser, common officers, or common trustees. During the six months ended November 30, 2020, the Fund engaged in securities purchases of $134,455,031 and securities sales of $91,070,000 with an affiliated fund in compliance with Rule 17a-7 under the 1940 Act.
D. Line of Credit
The Fund and other affiliated funds (the “Participants”) share in a $350 million revolving credit facility provided by a syndication of banks. The Fund may borrow for temporary or emergency purposes, including the meeting of redemption requests that otherwise might require the untimely
| 48 | | | DWS Managed Municipal Bond Fund |
disposition of securities. The Participants are charged an annual commitment fee, which is allocated based on net assets, among each of the Participants. Interest is calculated at a rate per annum equal to the sum of the Federal Funds Rate plus 1.25 percent plus, if the one-month LIBOR exceeds the Federal Funds Rate, the amount of such excess. The Fund may borrow up to a maximum of 33 percent of its net assets under the agreement. The Fund had no outstanding loans at November 30, 2020.
E. Fund Share Transactions
The following table summarizes share and dollar activity in the Fund:
| Six Months Ended November 30, 2020 | Year Ended May 31, 2020 | |||||||||||||||
| Shares | Dollars | Shares | Dollars | |||||||||||||
| Shares sold | ||||||||||||||||
| Class A | 5,699,861 | $ | 52,279,171 | 9,411,538 | $ | 87,185,439 | ||||||||||
| Class C | 304,739 | 2,798,860 | 1,323,227 | 12,226,246 | ||||||||||||
| Class S | 16,514,336 | 151,647,917 | 44,206,771 | 401,826,257 | ||||||||||||
| Institutional Class | 6,632,975 | 60,894,325 | 35,888,360 | 330,485,308 | ||||||||||||
| $ | 267,620,273 | $ | 831,723,250 | |||||||||||||
| Shares issued to shareholders in reinvestment of distributions |
| |||||||||||||||
| Class A | 1,672,647 | $ | 15,387,812 | 3,886,973 | $ | 35,751,195 | ||||||||||
| Class C | 113,178 | 1,041,031 | 314,090 | 2,890,290 | ||||||||||||
| Class S | 2,907,738 | 26,778,174 | 6,971,265 | 64,227,622 | ||||||||||||
| Institutional Class | 735,472 | 6,767,427 | 1,499,999 | 13,790,267 | ||||||||||||
| $ | 49,974,444 | $ | 116,659,374 | |||||||||||||
| Shares redeemed |
| |||||||||||||||
| Class A | (8,218,005 | ) | $ | (75,486,677 | ) | (20,200,209 | ) | $ | (185,995,111 | ) | ||||||
| Class C | (3,092,932 | ) | (28,442,439 | ) | (4,245,224 | ) | (39,061,897 | ) | ||||||||
| Class S | (31,286,603 | ) | (287,487,981 | ) | (71,779,745 | ) | (656,703,760 | ) | ||||||||
| Institutional Class | (9,751,877 | ) | (89,630,755 | ) | (20,437,413 | ) | (185,351,898 | ) | ||||||||
| $ | (481,047,852 | ) | $ | (1,067,112,666 | ) | |||||||||||
| Net increase (decrease) |
| |||||||||||||||
| Class A | (845,497 | ) | $ | (7,819,694 | ) | (6,901,698 | ) | $ | (63,058,477 | ) | ||||||
| Class C | (2,675,015 | ) | (24,602,548 | ) | (2,607,907 | ) | (23,945,361 | ) | ||||||||
| Class S | (11,864,529 | ) | (109,061,890 | ) | (20,601,709 | ) | (190,649,881 | ) | ||||||||
| Institutional Class | (2,383,430 | ) | (21,969,003 | ) | 16,950,946 | 158,923,677 | ||||||||||
| $ | (163,453,135 | ) | $ | (118,730,042 | ) | |||||||||||
| DWS Managed Municipal Bond Fund | | | 49 |
F. Payments by Affiliates
During the six months ended November 30, 2020, the Advisor agreed to reimburse the Fund $37,625 for losses incurred on trades executed incorrectly. The amount reimbursed was less than 0.01% of the Fund’s average net assets, thus having no impact on the Fund’s total return.
G. Other — COVID-19 Pandemic
A novel coronavirus known as COVID-19, declared a pandemic by the World Health Organization, has caused significant uncertainty, market volatility, decreased economic and other activity and increased government activity. Specifically, COVID-19 has led to significant death and morbidity, and concerns about its further spread have resulted in the closing of schools and non-essential businesses, cancellations, shelter-in place orders, lower consumer spending in certain sectors, social distancing, bans on large social gatherings and travel, quarantines, government economic stimulus measures, reduced productivity, rapid increases in unemployment, increased demand for and strain on government and medical resources, border closings and global trade and supply chain interruptions, among others. The full effects, duration and costs of the COVID-19 pandemic are impossible to predict, and the circumstances surrounding the COVID-19 pandemic will continue to evolve. The pandemic may affect certain countries, industries, economic sectors, companies and investment products more than others, may exacerbate existing economic, political, or social tensions and may increase the probability of an economic recession or depression. The Fund and its investments may be adversely affected by the effects of the COVID-19 pandemic, and a prolonged pandemic may result in the Fund and its service providers experiencing operational difficulties in coordinating a remote workforce and implementing their business continuity plans, among others. Management will continue to monitor the impact COVID-19 has on the Fund and reflect the consequences as appropriate in the Fund’s accounting and financial reporting.
| 50 | | | DWS Managed Municipal Bond Fund |
Information About Your Fund’s Expenses
As an investor of the Fund, you incur two types of costs: ongoing expenses and transaction costs. Ongoing expenses include management fees, distribution and service (12b-1) fees and other Fund expenses. Examples of transaction costs include sales charges (loads) and account maintenance fees, which are not shown in this section. The following tables are intended to help you understand your ongoing expenses (in dollars) of investing in the Fund and to help you compare these expenses with the ongoing expenses of investing in other mutual funds. In the most recent six-month period, Class S shares limited these expenses; had they not done so, expenses would have been higher. The example in the table is based on an investment of $1,000 invested at the beginning of the six-month period and held for the entire period (June 1, 2020 to November 30, 2020).
The tables illustrate your Fund’s expenses in two ways:
| – | Actual Fund Return. This helps you estimate the actual dollar amount of ongoing expenses (but not transaction costs) paid on a $1,000 investment in the Fund using the Fund’s actual return during the period. To estimate the expenses you paid over the period, simply divide your account value by $1,000 (for example, an $8,600 account value divided by $1,000 = 8.6), then multiply the result by the number in the “Expenses Paid per $1,000” line under the share class you hold. |
| – | Hypothetical 5% Fund Return. This helps you to compare your Fund’s ongoing expenses (but not transaction costs) with those of other mutual funds using the Fund’s actual expense ratio and a hypothetical rate of return of 5% per year before expenses. Examples using a 5% hypothetical fund return may be found in the shareholder reports of other mutual funds. The hypothetical account values and expenses may not be used to estimate the actual ending account balance or expenses you paid for the period. |
Please note that the expenses shown in these tables are meant to highlight your ongoing expenses only and do not reflect any transaction costs. The “Expenses Paid per $1,000” line of the tables is useful in comparing ongoing expenses only and will not help you determine the relative total expense of owning different funds. Subject to certain exceptions, an account maintenance fee of $20.00 assessed once per calendar year for Classes A, C and S shares may apply for accounts with balances less than $10,000. This fee is not included in these tables. If it was, the estimate of expenses paid for Classes A, C and S shares during the period would be higher, and account value during the period would be lower, by this amount.
| DWS Managed Municipal Bond Fund | | | 51 |
| Expenses and Value of a $1,000 Investment for the six months ended November 30, 2020 (Unaudited) | ||||||||||||||||
| Actual Fund Return | Class A | Class C | Class S | Institutional Class | ||||||||||||
| Beginning Account Value 6/1/20 | $ | 1,000.00 | $ | 1,000.00 | $ | 1,000.00 | $ | 1,000.00 | ||||||||
| Ending Account Value 11/30/20 | $ | 1,049.20 | $ | 1,045.00 | $ | 1,050.20 | $ | 1,049.10 | ||||||||
| Expenses Paid per $1,000* | $ | 3.90 | $ | 7.95 | $ | 2.88 | $ | 2.83 | ||||||||
| Hypothetical 5% Fund Return | Class A | Class C | Class S | Institutional Class | ||||||||||||
| Beginning Account Value 6/1/20 | $ | 1,000.00 | $ | 1,000.00 | $ | 1,000.00 | $ | 1,000.00 | ||||||||
| Ending Account Value 11/30/20 | $ | 1,021.26 | $ | 1,017.30 | $ | 1,022.26 | $ | 1,022.31 | ||||||||
| Expenses Paid per $1,000* | $ | 3.85 | $ | 7.84 | $ | 2.84 | $ | 2.79 | ||||||||
| * | Expenses are equal to the Fund’s annualized expense ratio for each share class, multiplied by the average account value over the period, multiplied by 183 (the number of days in the most recent six-month period), then divided by 365. |
| Annualized Expense Ratios | Class A | Class C | Class S | Institutional Class | ||||||||||||
| DWS Managed Municipal Bond Fund | .76 | % | 1.55 | % | .56 | % | .55 | % | ||||||||
For more information, please refer to the Fund’s prospectus.
For an analysis of the fees associated with an investment in the Fund or similar funds, please refer to tools.finra.org/fund_analyzer/.
| 52 | | | DWS Managed Municipal Bond Fund |
Advisory Agreement Board Considerations and Fee Evaluation
The Board of Trustees (hereinafter referred to as the “Board” or “Trustees”) approved the renewal of DWS Managed Municipal Bond Fund’s (the “Fund”) investment management agreement (the “Agreement”) with DWS Investment Management Americas, Inc. (“DIMA”) in September 2020.
In terms of the process that the Board followed prior to approving the Agreement, shareholders should know that:
| – | During the entire process, all of the Fund’s Trustees were independent of DIMA and its affiliates (the “Independent Trustees”). |
| – | The Board met frequently during the past year to discuss fund matters and dedicated a substantial amount of time to contract review matters. Over the course of several months, the Board reviewed extensive materials received from DIMA, independent third parties and independent counsel. These materials included an analysis of the Fund’s performance, fees and expenses, and profitability from a fee consultant retained by the Fund’s Independent Trustees (the “Fee Consultant”). |
| – | The Board also received extensive information throughout the year regarding performance of the Fund. |
| – | The Independent Trustees regularly met privately with counsel to discuss contract review and other matters. In addition, the Independent Trustees were advised by the Fee Consultant in the course of their review of the Fund’s contractual arrangements and considered a comprehensive report prepared by the Fee Consultant in connection with their deliberations. |
| – | In connection with reviewing the Agreement, the Board also reviewed the terms of the Fund’s Rule 12b-1 plan, distribution agreement, administrative services agreement, transfer agency agreement and other material service agreements. |
In connection with the contract review process, the Board considered the factors discussed below, among others. The Board also considered that DIMA and its predecessors have managed the Fund since its inception, and the Board believes that a long-term relationship with a capable, conscientious advisor is in the best interests of the Fund. The Board considered, generally, that shareholders chose to invest or remain invested in the Fund knowing that DIMA managed the Fund. DIMA is part of DWS Group GmbH & Co. KGaA (“DWS Group”). DWS Group is a global asset management business that offers a wide range of investing
| DWS Managed Municipal Bond Fund | | | 53 |
expertise and resources, including research capabilities in many countries throughout the world. In 2018, approximately 20% of DWS Group’s shares were sold in an initial public offering, with Deutsche Bank AG owning the remaining shares.
As part of the contract review process, the Board carefully considered the fees and expenses of each DWS fund overseen by the Board in light of the fund’s performance. In many cases, this led to the negotiation and implementation of expense caps.
While shareholders may focus primarily on fund performance and fees, the Fund’s Board considers these and many other factors, including the quality and integrity of DIMA’s personnel and administrative support services provided by DIMA, such as back-office operations, fund valuations, and compliance policies and procedures.
Nature, Quality and Extent of Services. The Board considered the terms of the Agreement, including the scope of advisory services provided under the Agreement. The Board noted that, under the Agreement, DIMA provides portfolio management services to the Fund and that, pursuant to a separate administrative services agreement, DIMA provides administrative services to the Fund. The Board considered the experience and skills of senior management and investment personnel and the resources made available to such personnel. The Board also considered the risks to DIMA in sponsoring or managing the Fund, including financial, operational and reputational risks, the potential economic impact to DIMA from such risks and DIMA’s approach to addressing such risks. The Board reviewed the Fund’s performance over short-term and long-term periods and compared those returns to various agreed-upon performance measures, including market index(es) and a peer universe compiled using information supplied by Morningstar Direct (“Morningstar”), an independent fund data service. The Board also noted that it has put into place a process of identifying “Funds in Review” (e.g., funds performing poorly relative to a peer universe), and receives additional reporting from DIMA regarding such funds and, where appropriate, DIMA’s plans to address underperformance. The Board believes this process is an effective manner of identifying and addressing underperforming funds. Based on the information provided, the Board noted that, for the one-, three- and five-year periods ended December 31, 2019, the Fund’s performance (Class A shares) was in the 3rd quartile of the applicable Morningstar universe (the 1st quartile being the best performers and the 4th quartile being the worst performers). The Board also observed that the Fund has outperformed its benchmark in the one-year period and has underperformed its benchmark in the three- and five-year periods ended December 31, 2019.
Fees and Expenses. The Board considered the Fund’s investment management fee schedule, operating expenses and total expense ratios,
| 54 | | | DWS Managed Municipal Bond Fund |
and comparative information provided by Broadridge Financial Solutions, Inc. (“Broadridge”) and the Fee Consultant regarding investment management fee rates paid to other investment advisors by similar funds (1st quartile being the most favorable and 4th quartile being the least favorable). With respect to management fees paid to other investment advisors by similar funds, the Board noted that the contractual fee rates paid by the Fund, which include a 0.10% fee paid to DIMA under the Fund’s administrative services agreement, were higher than the median (3rd quartile) of the applicable Broadridge peer group (based on Broadridge data provided as of December 31, 2019). The Board noted that, effective March 1, 2020, the fee paid to DIMA under the Fund’s administrative services agreement was reduced to 0.097%. The Board noted that the Fund’s Class A shares total (net) operating expenses (excluding 12b-1 fees) were expected to be lower than the median (2nd quartile) of the applicable Broadridge expense universe (based on Broadridge data provided as of December 31, 2019, and analyzing Broadridge expense universe Class A (net) expenses less any applicable 12b-1 fees) (“Broadridge Universe Expenses”). The Board also reviewed data comparing each other operational share class’s total (net) operating expenses to the applicable Broadridge Universe Expenses. The Board noted that the expense limitations agreed to by DIMA were expected to help the Fund’s total (net) operating expenses remain competitive. The Board considered the Fund’s management fee rate as compared to fees charged by DIMA to comparable DWS U.S. registered funds (“DWS Funds”) and considered differences between the Fund and the comparable DWS Funds. The information requested by the Board as part of its review of fees and expenses also included information about institutional accounts (including any sub-advised funds and accounts) and funds offered primarily to European investors (“DWS Europe Funds”) managed by DWS Group. The Board noted that DIMA indicated that DWS Group does not manage any institutional accounts or DWS Europe Funds comparable to the Fund.
On the basis of the information provided, the Board concluded that management fees were reasonable and appropriate in light of the nature, quality and extent of services provided by DIMA.
Profitability. The Board reviewed detailed information regarding revenues received by DIMA under the Agreement. The Board considered the estimated costs to DIMA, and pre-tax profits realized by DIMA, from advising the DWS Funds, as well as estimates of the pre-tax profits attributable to managing the Fund in particular. The Board also received information regarding the estimated enterprise-wide profitability of DIMA and its affiliates with respect to all fund services in totality and by fund. The Board and the Fee Consultant reviewed DIMA’s methodology in allocating its costs to the management of the Fund. Based on the
| DWS Managed Municipal Bond Fund | | | 55 |
information provided, the Board concluded that the pre-tax profits realized by DIMA in connection with the management of the Fund were not unreasonable. The Board also reviewed certain publicly available information regarding the profitability of certain similar investment management firms. The Board noted that, while information regarding the profitability of such firms is limited (and in some cases is not necessarily prepared on a comparable basis), DIMA and its affiliates’ overall profitability with respect to the DWS Funds (after taking into account distribution and other services provided to the funds by DIMA and its affiliates) was lower than the overall profitability levels of most comparable firms for which such data was available.
Economies of Scale. The Board considered whether there are economies of scale with respect to the management of the Fund and whether the Fund benefits from any economies of scale. The Board noted that the Fund’s investment management fee schedule includes fee breakpoints. The Board concluded that the Fund’s fee schedule represents an appropriate sharing between the Fund and DIMA of such economies of scale as may exist in the management of the Fund at current asset levels.
Other Benefits to DIMA and Its Affiliates. The Board also considered the character and amount of other incidental or “fall-out” benefits received by DIMA and its affiliates, including any fees received by DIMA for administrative services provided to the Fund, any fees received by an affiliate of DIMA for transfer agency services provided to the Fund and any fees received by an affiliate of DIMA for distribution services. The Board also considered benefits to DIMA related to brokerage and soft-dollar allocations, including allocating brokerage to pay for research generated by parties other than the executing broker dealers, which pertain primarily to funds investing in equity securities. In addition, the Board considered the incidental public relations benefits to DIMA related to DWS Funds advertising and cross-selling opportunities among DIMA products and services. The Board considered these benefits in reaching its conclusion that the Fund’s management fees were reasonable.
Compliance. The Board considered the significant attention and resources dedicated by DIMA to its compliance processes in recent years. The Board noted in particular (i) the experience, seniority and time commitment of the individuals serving as DIMA’s and the Fund’s chief compliance officers and (ii) the substantial commitment of resources by DIMA and its affiliates to compliance matters, including the retention of compliance personnel.
The Board also considered that on September 24, 2020, the SEC granted a temporary order permitting DIMA and its affiliates to continue providing investment advisory and underwriting services to the DWS Funds notwithstanding a consent order entered into by Deutsche Bank AG on
| 56 | | | DWS Managed Municipal Bond Fund |
June 17, 2020 (the “Consent Order”). The Board noted that the temporary order was granted effective as of the date of the Consent Order. The Board also noted various representations by DIMA to the Board relating to the Consent Order, including that the conduct giving rise to the Consent Order (unintentional conduct that resulted from a system outage that prevented Deutsche Bank AG from reporting data in accordance with applicable CFTC requirements for five days in April 2016) did not involve any DWS Fund or services DIMA and its affiliates provide to the DWS Funds, that DIMA and its personnel had no involvement in the alleged conduct giving rise to the Consent Order, and that the DWS Funds would not bear any financial impact or costs relating to the Consent Order.
Based on all of the information considered and the conclusions reached, the Board determined that the continuation of the Agreement is in the best interests of the Fund. In making this determination, the Board did not give particular weight to any single factor identified above. The Board considered these factors over the course of numerous meetings, certain of which were in executive session with only the Independent Trustees and counsel present. It is possible that individual Independent Trustees may have weighed these factors differently in reaching their individual decisions to approve the continuation of the Agreement.
| DWS Managed Municipal Bond Fund | | | 57 |
| For More Information | The automated telephone system allows you to access personalized account information and obtain information on other DWS funds using either your voice or your telephone keypad. Certain account types within Classes A, C and S also have the ability to purchase, exchange or redeem shares using this system.
For more information, contact your financial representative. You may also access our automated telephone system or speak with a Shareholder Service representative by calling:
(800) 728-3337 | |
| Web Site | dws.com
View your account transactions and balances, trade shares, monitor your asset allocation, subscribe to fund and account updates by e-mail, and change your address, 24 hours a day.
Obtain prospectuses and applications, news about DWS funds, insight from DWS economists and investment specialists and access to DWS fund account information. | |
| Written Correspondence | DWS
PO Box 219151 Kansas City, MO 64121-9151 | |
| Proxy Voting | The Fund’s policies and procedures for voting proxies for portfolio securities and information about how the Fund voted proxies related to its portfolio securities during the most recent 12-month period ended June 30 are available on our Web site — dws.com/en-us/resources/proxy-voting — or on the SEC’s Web site — sec.gov. To obtain a written copy of the Fund’s policies and procedures without charge, upon request, call us toll free at (800) 728-3337. | |
| Portfolio Holdings | Following the Fund’s fiscal first and third quarter-end, a complete portfolio holdings listing is posted on dws.com, and is available free of charge by contacting your financial intermediary, or if you are a direct investor, calling (800) 728-3337. In addition, the portfolio holdings listing is filed with the SEC on the Fund’s Form N-PORT and will be available on the SEC’s Web site at sec.gov. Additional portfolio holdings for the Fund are also posted on dws.com from time to time.
Please see the Fund’s current prospectus for more information. | |
| Principal Underwriter | If you have questions, comments or complaints, contact:
DWS Distributors, Inc.
222 South Riverside Plaza Chicago, IL 60606-5808 (800) 621-1148 |
| 58 | | | DWS Managed Municipal Bond Fund |
| Investment Management | DWS Investment Management Americas, Inc. (“DIMA” or the “Advisor”), which is part of the DWS Group GmbH & Co. KGaA (“DWS Group”), is the investment advisor for the Fund. DIMA and its predecessors have more than 90 years of experience managing mutual funds and DIMA provides a full range of investment advisory services to both institutional and retail clients. DIMA is an indirect, wholly owned subsidiary of DWS Group.
DWS Group is a global organization that offers a wide range of investing expertise and resources, including hundreds of portfolio managers and analysts and an office network that reaches the world’s major investment centers. This well-resourced global investment platform brings together a wide variety of experience and investment insight across industries, regions, asset classes and investing styles. | |||||||
| Class A | Class C | Class S | Institutional Class | |||||
| Nasdaq Symbol | SMLAX | SMLCX | SCMBX | SMLIX | ||||
| CUSIP Number | 25158T 608 | 25158T 822 | 25158T 848 | 25158T 855 | ||||
| Fund Number | 466 | 766 | 2066 | 544 | ||||
| DWS Managed Municipal Bond Fund | | | 59 |
| FACTS | What Does DWS Do With Your Personal Information? | |
| Why? | Financial companies choose how they share your personal information. Federal law gives consumers the right to limit some but not all sharing. Federal law also requires us to tell you how we collect, share and protect your personal information. Please read this notice carefully to understand what we do. | |
| What? | The types of personal information we collect and share can include:
– Social Security number
– Account balances
– Purchase and transaction history
– Bank account information
– Contact information such as mailing address, e-mail address and telephone number | |
| How? | All financial companies need to share customers’ personal information to run their everyday business. In the section below, we list the reasons financial companies can share their customers’ personal information, the reasons DWS chooses to share and whether you can limit this sharing. | |
| Reasons we can share your personal information | Does DWS share? | Can you limit this sharing? | ||
| For our everyday business purposes — such as to process your transactions, maintain your account(s), respond to court orders or legal investigations | Yes | No | ||
| For our marketing purposes — to offer our products and services to you | Yes | No | ||
| For joint marketing with other financial companies | No | We do not share | ||
| For our affiliates’ everyday business purposes — information about your transactions and experiences | No | We do not share | ||
| For our affiliates’ everyday business purposes — information about your creditworthiness | No | We do not share | ||
| For non-affiliates to market to you | No | We do not share | ||
| Questions? | Call (800) 728-3337 or e-mail us at service@dws.com |
| 60 | | | DWS Managed Municipal Bond Fund |
| ||
| Who we are | ||
| Who is providing this notice? | DWS Distributors, Inc; DWS Investment Management Americas, Inc.; DWS Trust Company; the DWS Funds | |
| What we do | ||
| How does DWS protect my personal information? | To protect your personal information from unauthorized access and use, we use security measures that comply with federal law. These measures include computer safeguards, secured files, and secured buildings. | |
| How does DWS collect my personal information? | We collect your personal information, for example, when you:
– open an account
– give us your contact information
– provide bank account information for ACH or wire transactions
– tell us where to send money
– seek advice about your investments | |
| Why can’t I limit all sharing? | Federal law gives you the right to limit only
– sharing for affiliates’ everyday business purposes
– information about your creditworthiness
– affiliates from using your information to market to you
– sharing for non-affiliates to market to you
State laws and individual companies may give you additional rights to limit sharing. | |
| Definitions | ||
| Affiliates | Companies related by common ownership or control. They can be financial or non-financial companies. Our affiliates include financial companies with the DWS or Deutsche Bank (“DB”) name, such as DB AG Frankfurt. | |
| Non-affiliates | Companies not related by common ownership or control. They can be financial and non-financial companies.
Non-affiliates we share with include account service providers, service quality monitoring services, mailing service providers and verification services to help in the fight against money laundering and fraud. | |
| Joint marketing | A formal agreement between non-affiliated financial companies that together market financial products or services to you. DWS does not jointly market. | |
California residents may go to https://fundsus.dws.com/us/en-us/legal-resources/privacy-policy.html to obtain additional information relating to their rights under California state law.
Rev. 12/2020
| DWS Managed Municipal Bond Fund | | | 61 |
Notes
Notes
DMMBF-3
(R-025437-10 1/21)
| (b) Not applicable | ||
| ITEM 2. | CODE OF ETHICS | |
| Not applicable. | ||
| ITEM 3. | AUDIT COMMITTEE FINANCIAL EXPERT | |
| Not applicable | ||
| ITEM 4. | PRINCIPAL ACCOUNTANT FEES AND SERVICES | |
| Not applicable | ||
| ITEM 5. | AUDIT COMMITTEE OF LISTED REGISTRANTS | |
| Not applicable | ||
| ITEM 6. | SCHEDULE OF INVESTMENTS | |
| Not applicable | ||
| ITEM 7. | DISCLOSURE OF PROXY VOTING POLICIES AND PROCEDURES FOR CLOSED-END MANAGEMENT INVESTMENT COMPANIES | |
| Not applicable | ||
| ITEM 8. | PORTFOLIO MANAGERS OF CLOSED-END MANAGEMENT INVESTMENT COMPANIES | |
| Not applicable | ||
| ITEM 9. | PURCHASES OF EQUITY SECURITIES BY CLOSED-END MANAGEMENT INVESTMENT COMPANY AND AFFILIATED PURCHASERS | |
| Not applicable | ||
| ITEM 10. | SUBMISSION OF MATTERS TO A VOTE OF SECURITY HOLDERS | |
| There were no material changes to the procedures by which shareholders may recommend nominees to the Fund’s Board. The primary function of the Nominating and Governance Committee is to identify and recommend individuals for membership on the Board and oversee the administration of the Board Governance Guidelines. Shareholders may recommend candidates for Board positions by forwarding their correspondence by U.S. mail or courier service to Keith R. Fox, DWS Funds Board Chair, c/o Thomas R. Hiller, Ropes & Gray LLP, Prudential Tower, 800 Boylston Street, Boston, MA 02199-3600. | ||
| ITEM 11. | CONTROLS AND PROCEDURES | |
| (a) | The Chief Executive and Financial Officers concluded that the Registrant’s Disclosure Controls and Procedures are effective based on the evaluation of the Disclosure Controls and Procedures as of a date within 90 days of the filing date of this report. | |
| (b) | There have been no changes in the registrant’s internal control over financial reporting that occurred during the period covered by this report that has materially affected, or is reasonably likely to materially affect, the registrant’s internal controls over financial reporting. | |
| ITEM 12. | Disclosure of Securities Lending Activities for Closed-End Management Investment Companies. | |
| Not applicable | ||
| ITEM 13. | EXHIBITS | |
| (a)(1) | Not applicable | |
| (a)(2) | Certification pursuant to Rule 30a-2(a) under the Investment Company Act of 1940 (17 CFR 270.30a-2(a)) is filed and attached hereto as Exhibit 99.CERT. | |
| (b) | Certification pursuant to Rule 30a-2(b) under the Investment Company Act of 1940 (17 CFR 270.30a-2(b)) is furnished and attached hereto as Exhibit 99.906CERT. | |
SIGNATURES
Pursuant to the requirements of the Securities Exchange Act of 1934 and the Investment Company Act of 1940, the registrant has duly caused this report to be signed on its behalf by the undersigned, thereunto duly authorized.
| Registrant: | DWS Managed Municipal Bond Fund, a series of Deutsche DWS Municipal Trust |
| By: | /s/Hepsen Uzcan Hepsen Uzcan President |
| Date: | 1/29/2021 |
Pursuant to the requirements of the Securities Exchange Act of 1934 and the Investment Company Act of 1940, this report has been signed below by the following persons on behalf of the registrant and in the capacities and on the dates indicated.
| By: | /s/Hepsen Uzcan Hepsen Uzcan President |
| Date: | 1/29/2021 |
| By: | /s/Diane Kenneally Diane Kenneally Chief Financial Officer and Treasurer |
| Date: | 1/29/2021 |