UNITED STATES
SECURITIES AND EXCHANGE COMMISSION
WASHINGTON, D. C. 20549
FORM N-CSRS
Investment Company Act file number: 811-02671
Deutsche DWS Municipal Trust
(Exact Name of Registrant as Specified in Charter)
875 Third Avenue
New York, NY 10022-6225
(Address of Principal Executive Offices) (Zip Code)
Registrant’s Telephone Number, including Area Code: (212) 454-4500
Diane Kenneally
100 Summer Street
Boston, MA 02110
(Name and Address of Agent for Service)
| Date of fiscal year end: | 10/31 |
| Date of reporting period: | 4/30/2021 |
| ITEM 1. | REPORT TO STOCKHOLDERS |
| (a) | |


| 2 | | DWS Short-Term Municipal Bond Fund |


| DWS Short-Term Municipal Bond Fund | | 3 |
| Performance Summary | April 30, 2021 (Unaudited) |
| Class A | 6-Month ‡ | 1-Year | 5-Year | 10-Year |
| Average Annual Total Returns as of 4/30/21 | ||||
| Unadjusted for Sales Charge | 0.94% | 3.66% | 1.47% | 1.32% |
| Adjusted for the Maximum Sales Charge (max 2.25% load) | –1.33% | 1.33% | 1.01% | 1.09% |
| Bloomberg Barclays 1-Year G.O. Index† | 0.56% | 1.88% | 1.40% | 1.10% |
| Bloomberg Barclays 3-Year (2–4) Municipal Bond Index†† | 0.88% | 3.60% | 1.87% | 1.81% |
| Average Annual Total Returns as of 3/31/21 (most recent calendar quarter end) | ||||
| Unadjusted for Sales Charge | 3.28% | 1.46% | 1.35% | |
| Adjusted for the Maximum Sales Charge (max 2.25% load) | 0.96% | 1.00% | 1.12% | |
| Bloomberg Barclays 1-Year G.O. Index† | 1.95% | 1.41% | 1.11% | |
| Bloomberg Barclays 3-Year (2–4) Municipal Bond Index†† | 3.50% | 1.87% | 1.84% | |
| Class C | 6-Month ‡ | 1-Year | 5-Year | 10-Year |
| Average Annual Total Returns as of 4/30/21 | ||||
| Unadjusted for Sales Charge | 0.57% | 2.99% | 0.71% | 0.56% |
| Adjusted for the Maximum Sales Charge (max 1.00% CDSC) | –0.43% | 2.99% | 0.71% | 0.56% |
| Bloomberg Barclays 1-Year G.O. Index† | 0.56% | 1.88% | 1.40% | 1.10% |
| Bloomberg Barclays 3-Year (2–4) Municipal Bond Index†† | 0.88% | 3.60% | 1.87% | 1.81% |
| Average Annual Total Returns as of 3/31/21 (most recent calendar quarter end) | ||||
| Unadjusted for Sales Charge | 2.51% | 0.70% | 0.59% | |
| Adjusted for the Maximum Sales Charge (max 1.00% CDSC) | 2.51% | 0.70% | 0.59% | |
| Bloomberg Barclays 1-Year G.O. Index† | 1.95% | 1.41% | 1.11% | |
| Bloomberg Barclays 3-Year (2–4) Municipal Bond Index†† | 3.50% | 1.87% | 1.84% | |
| 4 | | DWS Short-Term Municipal Bond Fund |
| Class S | 6-Month ‡ | 1-Year | 5-Year | 10-Year |
| Average Annual Total Returns as of 4/30/21 | ||||
| No Sales Charges | 1.12% | 3.92% | 1.62% | 1.47% |
| Bloomberg Barclays 1-Year G.O. Index† | 0.56% | 1.88% | 1.40% | 1.10% |
| Bloomberg Barclays 3-Year (2–4) Municipal Bond Index†† | 0.88% | 3.60% | 1.87% | 1.81% |
| Average Annual Total Returns as of 3/31/21 (most recent calendar quarter end) | ||||
| No Sales Charges | 3.44% | 1.61% | 1.50% | |
| Bloomberg Barclays 1-Year G.O. Index† | 1.95% | 1.41% | 1.11% | |
| Bloomberg Barclays 3-Year (2–4) Municipal Bond Index†† | 3.50% | 1.87% | 1.84% | |
| Institutional Class | 6-Month ‡ | 1-Year | 5-Year | 10-Year |
| Average Annual Total Returns as of 4/30/21 | ||||
| No Sales Charges | 1.17% | 4.02% | 1.75% | 1.58% |
| Bloomberg Barclays 1-Year G.O. Index† | 0.56% | 1.88% | 1.40% | 1.10% |
| Bloomberg Barclays 3-Year (2–4) Municipal Bond Index†† | 0.88% | 3.60% | 1.87% | 1.81% |
| Average Annual Total Returns as of 3/31/21 (most recent calendar quarter end) | ||||
| No Sales Charges | 3.44% | 1.71% | 1.60% | |
| Bloomberg Barclays 1-Year G.O. Index† | 1.95% | 1.41% | 1.11% | |
| Bloomberg Barclays 3-Year (2–4) Municipal Bond Index†† | 3.50% | 1.87% | 1.84% | |
| DWS Short-Term Municipal Bond Fund | | 5 |
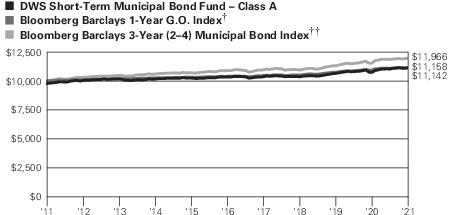
| † | The Bloomberg Barclays 1-Year General Obligation Index is an unmanaged index including bonds with a minimum credit rating of Baa3, issued as part of a deal of at least $50 million, having an amount outstanding of at least $5 million, a maturity of one to two years, backed by the full faith and credit of an issuer with taxing power. |
| †† | The Bloomberg Barclays 3-Year (2–4) Municipal Bond Index is an unmanaged subset of the Bloomberg Barclays Municipal Bond Index. It includes maturities of two to four years. |
| ‡ | Total returns shown for periods less than one year are not annualized. |
| 6 | | DWS Short-Term Municipal Bond Fund |
| Class A | Class C | Class S | Institutional Class | |
| Net Asset Value | ||||
| 4/30/21 | $ 10.21 | $ 10.21 | $ 10.20 | $ 10.22 |
| 10/31/20 | $ 10.21 | $ 10.21 | $ 10.19 | $ 10.21 |
| Distribution Information as of 4/30/21 | ||||
| Income Dividends, Six Months | $ .05 | $ .01 | $ .06 | $ .06 |
| Capital Gain Distributions | $ .0457 | $ .0457 | $ .0457 | $ .0457 |
| April Income Dividend | $ .0076 | $ .0014 | $ .0089 | $ .0097 |
| SEC 30-day Yield‡‡ | –.06% | –.80% | .09% | .19% |
| Tax Equivalent Yield‡‡ | –.06% | –.80% | .15% | .32% |
| Current Annualized Distribution Rate‡‡ | .91% | .17% | 1.06% | 1.15% |
| ‡‡ | The SEC yield is net investment income per share earned over the month ended April 30, 2021, shown as an annualized percentage of the maximum offering price per share on the last day of the period. The SEC yield is computed in accordance with a standardized method prescribed by the Securities and Exchange Commission. The SEC yields would have been –0.09%, –0.86%, 0.07% and 0.14% for Class A, C, S and Institutional Class shares, respectively, had certain expenses not been reduced. Tax equivalent yield is based on the Fund’s yield and a marginal income tax rate of 40.80%. Current annualized distribution rate is the latest monthly dividend shown as an annualized percentage of net asset value on April 30, 2021. Distribution rate simply measures the level of dividends and is not a complete measure of performance. The current annualized distribution rates would have been 0.88%, 0.11%, 1.04% and 1.10% for Class A, C, S and Institutional Class shares, respectively, had certain expenses not been reduced. Yields and distribution rates are historical, not guaranteed and will fluctuate. |
| DWS Short-Term Municipal Bond Fund | | 7 |
| 8 | | DWS Short-Term Municipal Bond Fund |
| Portfolio Summary | (Unaudited) |
| Asset Allocation (As a % of Investment Portfolio excluding Open-End Investment Companies) | 4/30/21 | 10/31/20 |
| Municipal Investments | ||
| Revenue Bonds | 72% | 69% |
| General Obligation Bonds | 20% | 23% |
| Lease Obligations | 6% | 6% |
| Escrow to Maturity/Prerefunded Bonds | 1% | 1% |
| Preferred Shares of Closed-End Investment Companies | 1% | 1% |
| 100% | 100% |
| Interest Rate Sensitivity | 4/30/21 | 10/31/20 |
| Effective Maturity | 2.4 years | 2.6 years |
| Modified Duration | 2.0 years | 2.2 years |
| Quality (As a % of Investment Portfolio excluding Open-End Investment Companies) | 4/30/21 | 10/31/20 |
| AAA | 28% | 23% |
| AA | 38% | 40% |
| A | 18% | 19% |
| BBB | 10% | 13% |
| BB | 1% | 1% |
| B | 0% | — |
| Not Rated | 5% | 4% |
| 100% | 100% |
| Top Five State Allocations (As a % of Investment Portfolio excluding Preferred Shares of Closed-End Investment Companies and Open-End Investment Companies) | 4/30/21 | 10/31/20 |
| California | 19% | 20% |
| New York | 14% | 11% |
| Texas | 10% | 10% |
| Pennsylvania | 5% | 3% |
| Georgia | 4% | 4% |
| DWS Short-Term Municipal Bond Fund | | 9 |
| Investment Portfolio | as of April 30, 2021 (Unaudited) |
| Principal Amount ($) | Value ($) | ||
| Municipal Bonds and Notes 105.0% | |||
| Alabama 1.2% | |||
| Alabama, Black Belt Energy Gas District Prepay Revenue, Series A, 4.0%, Mandatory Put 12/1/2023 @ 100, 12/1/2048, GTY: Goldman Sachs Group, Inc. | 2,200,000 | 2,388,343 | |
| Southeast Alabama, State Gas Supply District Revenue Project, Series A, 4.0%, Mandatory Put 6/1/2024 @ 100, 6/1/2049, GTY: Morgan Stanley | 1,200,000 | 1,321,515 | |
| 3,709,858 | |||
| Arizona 2.2% | |||
| Arizona, Industrial Development Authority, Hospital Revenue Bonds, Phoenix Children Hospital: | |||
| Series A, 5.0%, 2/1/2027 | 200,000 | 247,471 | |
| Series A, 5.0%, 2/1/2028 | 200,000 | 253,328 | |
| Arizona, Salt River Project Agricultural Improvement and Power District, Electric System Revenue: | |||
| Series A, 5.0%, 1/1/2028 (a) | 465,000 | 583,288 | |
| Series A, 5.0%, 1/1/2029 (a) | 645,000 | 825,422 | |
| Arizona, State Certificates of Participation, Series A, 5.0%, 10/1/2026 | 1,500,000 | 1,853,877 | |
| Chandler, AZ, State General Obligation, 4.0%, 7/1/2021 | 1,600,000 | 1,609,927 | |
| Coconino County, AZ, Pollution Control Corp. Revenue, Nevada Power Co., Series A, AMT, 1.875%, Mandatory Put 3/31/2023 @ 100, 9/1/2032 | 1,000,000 | 1,027,046 | |
| Yavapai County, AZ, Industrial Development Authority, Solid Waste Disposal Revenue Bonds, Waste Management, Inc., AMT, 2.8%, Mandatory Put 6/1/2021 @ 100, 6/1/2027 | 500,000 | 500,902 | |
| 6,901,261 | |||
| California 19.6% | |||
| California, Bay Area Toll Authority, Toll Bridge Revenue, San Francisco Bay Area: | |||
| Series B-1, MUNIPSA + 1.1%, 1.16% (b), Mandatory Put 4/1/2024 @ 100, 4/1/2045 | 1,900,000 | 1,933,570 | |
| Series A, MUNIPSA + 1.25%, 1.31% (b), Mandatory Put 4/1/2027 @ 100, 4/1/2036 | 3,940,000 | 4,094,599 | |
| California, Eastern Municipal Water District, Water & Wastewater Revenue, Series B, 70% of 1-month USD-LIBOR + 0.3%, 0.381% (b), Mandatory Put 10/1/2021 @ 100, 7/1/2030 | 1,960,000 | 1,960,394 | |
| 10 | | DWS Short-Term Municipal Bond Fund |
| Principal Amount ($) | Value ($) | ||
| California, Infrastructure & Economic Development Bank Revenue, Brightline West Passenger Rail Project, Series A, AMT, 144A, 0.45%, Mandatory Put 7/1/2021 @ 100, 1/1/2050 | 1,000,000 | 1,000,110 | |
| California, Irvine Ranch Water District Revenue, Series A, 0.03% (c), 5/3/2021, LOC: U.S. Bank NA | 200,000 | 200,000 | |
| California, Municipal Finance Authority Solid Waste Refunding Revenue, 0.15%, Mandatory Put 7/1/2021 @ 100, 9/1/2021 | 500,000 | 500,008 | |
| California, San Diego Association of Governments, Capital Grant Receipts Revenue, Mid-Coast Corridor Transit Project, Series B, 1.8%, 11/15/2027 | 2,500,000 | 2,634,106 | |
| California, State Department of Water Resources, Center Valley Project, Water Systems, Series AT, MUNIPSA + 0.37%, 0.43% (b), Mandatory Put 12/1/2022 @ 100, 12/1/2035 | 4,000,000 | 4,010,228 | |
| California, State General Obligation: | |||
| Series A-2, 0.01% (c), 5/3/2021, LOC: Bank of Montreal | 380,000 | 380,000 | |
| Series E-REMK, MUNIPSA + 0.43%, 0.49% (b), Mandatory Put 12/1/2023 @ 100, 12/1/2029 | 1,250,000 | 1,253,864 | |
| 5.0%, 9/1/2030 (a) | 1,500,000 | 1,983,105 | |
| California, State Health Facilities Financing Authority Revenue, Adventist Health System, Series B, 0.03% (c), 5/3/2021, LOC: U.S. Bank NA | 2,500,000 | 2,500,000 | |
| California, State Infrastructure & Economic Development Bank Revenue, 1.75%, Mandatory Put 8/1/2026 @ 100, 8/1/2055 | 1,100,000 | 1,121,422 | |
| California, State Municipal Finance Authority Revenue, LAX Integrated Express Solutions LLC, APM Project: | |||
| Series A, AMT, 5.0%, 12/31/2025 | 1,000,000 | 1,195,944 | |
| Series A, AMT, 5.0%, 6/30/2026 | 500,000 | 604,349 | |
| California, State Public Works Board, Lease Revenue Refunding Bonds, Various Capital Project: | |||
| Series A, 5.0%, 2/1/2029 (a) | 1,500,000 | 1,898,405 | |
| Series A, 5.0%, 8/1/2029 (a) | 1,905,000 | 2,380,730 | |
| California, State University Revenue, Series A, 5.0%, 11/1/2021 | 3,000,000 | 3,072,843 | |
| California, Statewide Communities Development Authority Revenue, Viamonte Senior Living Project, Series B, 3.0%, 7/1/2025 | 1,500,000 | 1,502,736 | |
| California, Tobacco Securitization Agency, Tobacco Settlement, Series B-1, 1.75%, 6/1/2030 | 500,000 | 502,183 | |
| California, Transbay Joint Powers Authority, Series B, 2.4%, 10/1/2049 | 910,000 | 930,467 | |
| California, University of California Revenue: | |||
| Series S, 5.0%, 5/15/2028 (a) | 2,000,000 | 2,464,466 | |
| Series S, 5.0%, 5/15/2029 (a) | 1,000,000 | 1,256,349 | |
| DWS Short-Term Municipal Bond Fund | | 11 |
| Principal Amount ($) | Value ($) | ||
| Contra Costa, CA, Transportation Authority, Sales Tax Revenue, Series A, 70% of 1-month USD-LIBOR + 0.25%, 0.331% (b), Mandatory Put 9/1/2021 @ 100, 3/1/2034 | 5,165,000 | 5,165,437 | |
| Glendale, CA, Unified School District: | |||
| 5.0%, 9/1/2025 | 500,000 | 599,510 | |
| 5.0%, 9/1/2026 | 500,000 | 618,253 | |
| Irvine, CA, Improvement Bond, Assessment District 03-19, Series A, 0.03% (c), 5/3/2021, LOC: U.S. Bank NA | 500,000 | 500,000 | |
| Long Beach, CA, Harbor Revenue, Private Activity, Series B, AMT, 4.0%, 5/15/2022 | 5,000,000 | 5,189,154 | |
| Port Oakland, CA, Intermediate Lien Revenue Bonds: | |||
| Series H, AMT, 5.0%, 5/1/2028 | 500,000 | 629,943 | |
| Series H, AMT, 5.0%, 11/1/2029 | 250,000 | 323,920 | |
| San Francisco City & County, CA, General Obligation: | |||
| Series R2, 5.0%, 6/15/2027 (a) | 2,065,000 | 2,563,861 | |
| Series R2, 5.0%, 6/15/2028 (a) | 1,935,000 | 2,461,892 | |
| San Francisco City & County, CA, Multi Family Housing Revenue, Eastern Park Apartments, Series K, 1.3%, Mandatory Put 1/1/2023 @ 100, 7/1/2023 | 1,250,000 | 1,265,578 | |
| Stockton, CA, Public Financing Authority, Wastewater Revenue, 1.4%, 6/1/2022 | 1,500,000 | 1,501,178 | |
| Tobacco Securitization Authority of Northern California, Tobacco Settlement Revenue, Sacramento County Tobacco Securitization Corp., Series B-1, 0.45%, 6/1/2030 | 400,000 | 397,989 | |
| Tobacco Securitization Authority of Southern California, Tobacco Settlement Revenue, San Diego, Tobacco Securitization Corp., Class 2, Series B-1, 2.25%, 6/1/2029 | 290,000 | 290,612 | |
| 60,887,205 | |||
| Colorado 3.0% | |||
| Cherry Creek, CO, School District No. 5, Series C, 5.0%, 12/15/2031 | 2,000,000 | 2,514,160 | |
| Denver City & County, CO, Airport System Revenue: | |||
| Series A, AMT, 5.0%, 12/1/2026 | 2,000,000 | 2,445,428 | |
| Series D, 5.0%, Mandatory Put 11/15/2022 @ 100, 11/15/2031 | 2,000,000 | 2,144,073 | |
| Fort Collins, CO, Economic Development Revenue, Oakridge Project, Series A, AMT, 0.1% (c), 5/7/2021, LOC: U.S. Bank NA | 2,245,000 | 2,245,000 | |
| 9,348,661 | |||
| Connecticut 2.3% | |||
| Connecticut, Special Tax Obligation Revenue, Transport Infrastructure Purposes, Series C, 5.0%, 1/1/2029 (a) | 1,000,000 | 1,260,679 | |
| Connecticut, State General Obligation, Series A, 5.0%, 3/15/2029 | 2,000,000 | 2,327,711 | |
| 12 | | DWS Short-Term Municipal Bond Fund |
| Principal Amount ($) | Value ($) | ||
| Connecticut, State Housing Finance Authority, Housing Finance Mortgage Program: | |||
| Series E-E3, 1.625%, Mandatory Put 11/15/2022 @ 100, 11/15/2059 | 930,000 | 930,888 | |
| Series C-1, 4.0%, 11/15/2047 | 1,000,000 | 1,087,536 | |
| Connecticut, State Housing Finance Program Authority Revenue, Series A-1, 4.0%, 11/15/2047 | 760,000 | 827,112 | |
| Connecticut, State Special Tax Obligation Revenue, Series A, 5.0%, 5/1/2024 | 500,000 | 570,931 | |
| 7,004,857 | |||
| Florida 3.2% | |||
| Atlantic Beach, FL, Healthcare Facilities Revenue Fleet Landing Project, Series B-2, 3.0%, 11/15/2023 | 1,250,000 | 1,250,580 | |
| Clay County, FL, Sales Surtax Revenue, 5.0%, 10/1/2022 | 650,000 | 693,664 | |
| Florida, Capital Projects Finance Authority, Student Housing Revenue, Capital Project Loan Program, Series A-1, 5.0%, 10/1/2026 | 500,000 | 587,166 | |
| Florida, Development Finance Corp., Transportation Facility Revenue, Virgin Trains U.S.A. Passanger Rail Project, Series A, AMT, 144A, 6.375%, Mandatory Put 1/1/2026 @ 100, 1/1/2049 | 1,000,000 | 1,002,794 | |
| Hillsborough County, FL, Industrial Development Authority Health System Revenue, Baycare Health System Issue, Series D, 0.03% (c), 5/3/2021, LOC: TD Bank NA | 800,000 | 800,000 | |
| Lee County, FL, Airport Revenue, Series A, AMT, 5.5%, 10/1/2023 | 1,250,000 | 1,267,564 | |
| Miami Beach, FL, Health Facilities Authority, Mount Sinai Medical Center of Florida, Inc., 5.0%, 11/15/2021 | 1,000,000 | 1,022,838 | |
| Pasco County, FL, School Board, Certificates of Participations, Series B, MUNIPSA + 0.75%, 0.81% (b), Mandatory Put 8/2/2023 @ 100, 8/1/2032 | 925,000 | 926,240 | |
| Village, FL, Community Development District No. 13, Special Assessment Revenue, 2.625%, 5/1/2024 | 380,000 | 387,462 | |
| Volusia County, FL, School Board, Certificate of Participations, 5.0%, 8/1/2021 | 2,000,000 | 2,023,473 | |
| 9,961,781 | |||
| Georgia 4.0% | |||
| Burke County, GA, Development Authority, Pollution Control Revenue, Oglethorpe Power Corp., Series E, 3.25%, Mandatory Put 2/3/2025 @ 100, 11/1/2045 | 1,200,000 | 1,308,696 | |
| Cobb County, GA, Kennestone Hospital Authority, Wellstar Health System, Inc. Project: | |||
| Series B, 5.0%, 4/1/2025 | 900,000 | 1,056,129 | |
| Series B, 5.0%, 4/1/2026 | 1,000,000 | 1,210,164 | |
| DWS Short-Term Municipal Bond Fund | | 13 |
| Principal Amount ($) | Value ($) | ||
| Columbia County, GA, Water & Sewerage Revenue, 5.0%, 6/1/2021 | 875,000 | 878,227 | |
| Georgia, Geo L Smith II Congress Center Authority, Convention Center Hotel First Tier Revenue, Series A, 2.375%, 1/1/2031 | 750,000 | 780,371 | |
| Georgia, Main Street Natural Gas, Inc., Gas Supply Revenue: | |||
| Series A, 4.0%, Mandatory Put 9/1/2023 @ 100, 4/1/2048, LIQ: Royal Bank of Canada | 1,865,000 | 2,013,464 | |
| Series C, 4.0%, Mandatory Put 12/1/2023 @ 100, 8/1/2048, LIQ: Royal Bank of Canada | 750,000 | 815,224 | |
| Georgia, State General Obligation, Series C, 5.0%, 7/1/2021 | 4,325,000 | 4,358,889 | |
| 12,421,164 | |||
| Illinois 3.5% | |||
| Granite City, IL, Waste Management, Inc. Project, AMT, 1.25%, Mandatory Put 5/3/2021 @ 100, 5/1/2027, GTY: Waste Management, Inc. | 1,000,000 | 1,000,000 | |
| Illinois, Finance Authority Revenue, University of Chicago, Series A, 5.0%, 10/1/2028 (a) | 1,000,000 | 1,281,993 | |
| Illinois, State General Obligation: | |||
| Series A, 5.0%, 10/1/2021 | 1,000,000 | 1,018,975 | |
| Series B, 5.0%, 10/1/2021 | 1,000,000 | 1,018,975 | |
| 5.0%, 8/1/2023 | 1,000,000 | 1,098,998 | |
| Series A, 5.0%, 3/1/2028 | 750,000 | 923,479 | |
| 5.375%, 5/1/2023 | 1,000,000 | 1,096,072 | |
| Illinois, State Sales Tax Revenue, Junior Obligation, Series A, 5.0%, 6/15/2022 | 1,500,000 | 1,566,061 | |
| Will County, IL, Community Unit School District No. 210, Lincoln-Way, ETM, Zero Coupon, 1/1/2022, INS: AGMC | 1,815,000 | 1,810,707 | |
| 10,815,260 | |||
| Indiana 0.3% | |||
| Indiana, State Finance Authority, Hospital Revenue, Indiana University Health Obligated Group, Series 2015B, Prerefunded 1/1/2022 @ 100, 1.65%, 12/1/2042 | 1,000,000 | 1,009,932 | |
| Iowa 2.0% | |||
| Iowa, Finance Authority, Educational Facility Revenue, Holy Family Catholic School Project, 0.04% (c), 5/3/2021, LOC: U.S. Bank NA | 2,735,000 | 2,735,000 | |
| Iowa, Higher Education Loan Authority Revenue, Loras College, 0.04% (c), 5/3/2021, LOC: Bank of America NA | 600,000 | 600,000 | |
| Iowa, State Finance Authority Revenue, Lifespace Communities, Inc., Series A-2, 2.875%, 5/15/2049 | 1,500,000 | 1,515,926 | |
| 14 | | DWS Short-Term Municipal Bond Fund |
| Principal Amount ($) | Value ($) | ||
| Iowa, State Finance Authority, Midwestern Disaster Area Revenue, Fertilizer Co. Project, 3.125%, 12/1/2022 | 330,000 | 336,653 | |
| Iowa, Tobacco Settlement Authority Settlement Revenue, Series B, 0.375%, 6/1/2030 | 1,000,000 | 1,000,297 | |
| 6,187,876 | |||
| Kansas 0.1% | |||
| Kansas, State Development Finance Authority, Health Facilities, University of Kansas Health System, Series J, 0.04% (c), 5/3/2021, LOC: U.S. Bank NA | 400,000 | 400,000 | |
| Kentucky 2.5% | |||
| Kentucky, Higher Education Student Loan Corp. Revenue, Taxable Asset Back Notes, “A1A” , Series 2021-1, 1.65%, 3/25/2051 | 1,000,000 | 1,011,158 | |
| Kentucky, State Public Energy Authority, Gas Supply Revenue, Series B, 4.0%, Mandatory Put 1/1/2025 @ 100, 1/1/2049, GTY: BP Corp. North America, Inc. | 1,435,000 | 1,600,727 | |
| Louisville & Jefferson County, KY, Metropolitan Government Control Revenue, Louisville Gas & Celectric Co., Series B, AMT, 1.35%, 11/1/2027 (a) | 3,000,000 | 3,005,390 | |
| Louisville & Jefferson County, KY, Metropolitan Government Health System Revenue, Norton Healthcare, Inc., Series B, 0.04% (c), 5/3/2021, LOC: PNC Bank NA | 2,200,000 | 2,200,000 | |
| 7,817,275 | |||
| Louisiana 0.3% | |||
| Louisiana, Stadium & Exposition District, Bond Anticipation Notes, 5.0%, 7/3/2023 | 1,000,000 | 1,074,898 | |
| Maine 0.0% | |||
| Maine, State Housing Authority Mortgage Revenue, Series A-1, AMT, 4.5%, 11/15/2028 | 90,000 | 91,634 | |
| Maryland 1.1% | |||
| Maryland, State Health & Higher Educational Facilities Authority Revenue, University of Maryland Medical System Obligated Group, Series B-2, 5.0%, Mandatory Put 7/1/2027 @ 100, 7/1/2045 | 1,000,000 | 1,219,753 | |
| Montgomery County, MD, Public Improvements Project, Series A, 5.0%, 11/1/2021 | 2,215,000 | 2,268,671 | |
| 3,488,424 | |||
| Massachusetts 2.5% | |||
| Massachusetts, Educational Financing Authority Education Loan Revenue, Series B, AMT, 2.625%, 7/1/2036 | 1,400,000 | 1,424,865 | |
| Massachusetts, State Development Finance Agency Revenue, Boston College, 5.0%, 10/1/2021 | 1,000,000 | 1,019,246 | |
| DWS Short-Term Municipal Bond Fund | | 15 |
| Principal Amount ($) | Value ($) | ||
| Massachusetts, State General Obligation, Series A, 5.0%, 7/1/2021 | 5,000,000 | 5,039,016 | |
| Massachusetts, State Health & Educational Facilities Authority Revenue, Northeastern University Issue, Series T, 5.0%, 10/1/2025 | 245,000 | 260,865 | |
| 7,743,992 | |||
| Michigan 1.9% | |||
| Michigan, State Finance Authority Revenue, Hospital McLaren Health Care Corp.: | |||
| 68% of 1-month USD-LIBOR + 0.4%, 0.475% (b), Mandatory Put 10/15/2021 @ 100, 10/15/2030 | 1,785,000 | 1,782,966 | |
| Series D-2, MUNIPSA + 0.5%, 0.56% (b), Mandatory Put 8/9/2021 @ 100, 10/15/2038 | 925,000 | 925,089 | |
| Series D-2, 1.2%, Mandatory Put 4/13/2028 @ 100, 10/15/2038 (a) | 1,250,000 | 1,255,103 | |
| Michigan, State Finance Authority, Hospital Revenue Bond, Trinity Health Credit Group, MUNIPSA + 0.48%, 0.54% (b), Mandatory Put 2/1/2022 @ 100, 3/1/2051 | 1,335,000 | 1,335,860 | |
| Michigan, State Housing Development Authority, Series A-1, 1.5%, 10/1/2022 | 550,000 | 550,459 | |
| Michigan, University of Michigan General Revenue, Series B, 0.03% (c), 5/3/2021 | 100,000 | 100,000 | |
| 5,949,477 | |||
| Minnesota 2.9% | |||
| Minnesota, State General Obligation: | |||
| Series A, 5.0%, 8/1/2021 | 1,800,000 | 1,821,438 | |
| Series D, 5.0%, 8/1/2021 | 2,060,000 | 2,084,535 | |
| Minnesota, State Housing Finance Agency, Residential Holding Finance, Series H, MUNIPSA + 0.55%, 0.61% (b), Mandatory Put 12/12/2023 @ 100, 7/1/2041 | 5,000,000 | 5,032,042 | |
| 8,938,015 | |||
| Mississippi 0.3% | |||
| Mississippi, Business Finance Corp., Solid Waste Disposal Revenue, Waste Management, Inc. Project, 0.55%, Mandatory Put 9/1/2021 @ 100, 3/1/2029 | 1,000,000 | 1,000,518 | |
| Missouri 1.8% | |||
| Missouri, Higher Education Loan Authority Revenue, Taxable Student Loan Asset Back Notes, Series 2021-1, 1.53%, 1/25/2061 | 2,240,553 | 2,213,928 | |
| 16 | | DWS Short-Term Municipal Bond Fund |
| Principal Amount ($) | Value ($) | ||
| Missouri, State Development Finance Board Infrastructure Facilities Revenue, St. Louis Convention Center Hotel Garage Project, Series C, 0.04% (c), 5/3/2021, LOC: U.S. Bank NA | 330,000 | 330,000 | |
| Missouri, State Health & Educational Facilities Authority Revenue, St Louis University, Series B-1, 0.03% (c), 5/3/2021, LOC: Barclays Bank PLC | 3,000,000 | 3,000,000 | |
| 5,543,928 | |||
| Nebraska 0.4% | |||
| Nebraska, Public Power District General Revenue: | |||
| Series A, 5.0%, 1/1/2025 (a) | 550,000 | 624,709 | |
| Series A, 5.0%, 1/1/2027 (a) | 475,000 | 571,474 | |
| 1,196,183 | |||
| Nevada 1.1% | |||
| Nevada, State Department of Business & Industry Revenue, Brightline West Passenger Rail Project, Series A, AMT, 144A, 0.5%, Mandatory Put 7/1/2021 @ 100, 1/1/2050 | 3,000,000 | 3,000,567 | |
| Sparks, NV, Tourism Improvement District No. 1 Revenue, Sales Tax Revenue, Series A, 144A, 2.5%, 6/15/2024 | 450,000 | 455,260 | |
| 3,455,827 | |||
| New Jersey 3.3% | |||
| New Jersey, State Economic Development Authority, Motor Vehicle Surcharge Revenue, Series A, 3.125%, 7/1/2029 | 195,000 | 197,233 | |
| New Jersey, State Higher Education Assistance Authority, Student Loan Revenue, Series A, 2.375%, 12/1/2029 | 980,000 | 1,014,017 | |
| New Jersey, State Housing & Mortgage Finance Agency, Multi Family Conduit Revenue, Pilgrim Baptist Village I&II Project, Series E, 1.5%, Mandatory Put 9/1/2021 @ 100, 9/1/2022 | 3,000,000 | 3,012,670 | |
| New Jersey, State Transportation Trust Fund Authority, Series A, 5.0%, 12/15/2026 | 2,000,000 | 2,452,870 | |
| New Jersey, State Transportation Trust Fund Authority, Federal Highway Reimbursement Notes, Series A, 5.0%, 6/15/2024 | 1,000,000 | 1,139,071 | |
| New Jersey, Tobacco Settlement Financing Corp., Series A, 5.0%, 6/1/2025 | 1,955,000 | 2,297,476 | |
| 10,113,337 | |||
| New Mexico 0.6% | |||
| New Mexico, Mortgage Finance Authority, Single Family Mortgage, “I” , Series A-1, 4.0%, 1/1/2049 | 720,000 | 796,537 | |
| Santa Fe, NM, Retirement Facility Revenue, El Castillo Retirement Project, Series B-1, 2.625%, 5/15/2025 | 1,000,000 | 1,003,226 | |
| 1,799,763 | |||
| DWS Short-Term Municipal Bond Fund | | 17 |
| Principal Amount ($) | Value ($) | ||
| New York 14.8% | |||
| Chautauqua County, NY, Capital Resource Corp., Exempt Facilities Revenue, NRG Energy, Inc. Project, 1.3%, Mandatory Put 4/3/2023 @ 100, 4/1/2042 | 2,000,000 | 2,020,260 | |
| New York, Metropolitan Transportation Authority, Series F, 5.0%, 11/15/2022 | 5,390,000 | 5,777,711 | |
| New York, Metropolitan Transportation Authority Revenue: | |||
| Series E-1, 0.04% (c), 5/3/2021, LOC: U.S. Bank NA | 200,000 | 200,000 | |
| Series G-1, 0.04% (c), 5/3/2021, LOC: Barclays Bank PLC | 300,000 | 300,000 | |
| New York, Metropolitan Transportation Authority, Dedicated Tax Fund, Series A-1, 0.04% (c), 5/3/2021, LOC: TD Bank NA | 6,800,000 | 6,800,000 | |
| New York, State Dormitory Authority Revenue, Non-Supported Debt, Northwell Healthcare, Inc., Series B-1, 5.0%, Mandatory Put 5/1/2022 @ 100, 5/1/2048 | 2,000,000 | 2,046,348 | |
| New York, State Housing Finance Agency Revenue, Series K, 1.45%, 5/1/2023 | 2,500,000 | 2,520,276 | |
| New York, State Mortgage Agency, Homeowner Mortgage Revenue, Series 195, 4.0%, 10/1/2046 | 1,580,000 | 1,693,475 | |
| New York, State Transportation Development Corp., Special Facility Revenue, Delta Air Lines, Inc., LaGuardia Airport Terminals C&D Redevelopment, AMT, 5.0%, 1/1/2024 | 2,500,000 | 2,777,669 | |
| New York, Triborough Bridge & Tunnel Authority Revenue: | |||
| Series B-1, 0.03% (c), 5/3/2021, LOC: Bank of America NA | 500,000 | 500,000 | |
| Series B-4C, 0.04% (c), 5/3/2021, LOC: U.S. Bank NA | 620,000 | 620,000 | |
| New York & New Jersey, Port Authority: | |||
| Series 226, AMT, 5.0%, 10/15/2027 (a) | 750,000 | 927,566 | |
| Series 226, AMT, 5.0%, 10/15/2028 (a) | 660,000 | 831,125 | |
| New York City, NY, Housing Development Corp., Multi-Family Mortgage Revenue, Series A, 1.125%, Mandatory Put 11/1/2024 @ 100, 5/1/2060 | 1,000,000 | 1,007,070 | |
| New York, NY, General Obligation: | |||
| Series A-3, 0.04% (c), 5/3/2021, LOC: Mizuho Bank Ltd. | 2,000,000 | 2,000,000 | |
| Series I-4, 0.04% (c), 5/3/2021, LOC: TD Bank NA | 6,800,000 | 6,800,000 | |
| Series B-3, 0.21% (c), 5/3/2021 | 2,420,000 | 2,420,000 | |
| Series 2-REM, 0.22% (c), 5/3/2021 | 240,000 | 240,000 | |
| Series 3-REM, 0.22% (c), 5/7/2021 | 635,000 | 635,000 | |
| Series I-A, 5.0%, 4/1/2029 | 2,000,000 | 2,598,001 | |
| Oyster Bay, NY, Public Improvement Refunding Bonds, 4.0%, 11/1/2027, INS: BAM | 315,000 | 378,178 | |
| Troy, NY, Capital Resource Corp. Revenue, Rensselaer Polytechnic Institute: | |||
| Series A, 5.0%, 9/1/2025 | 300,000 | 354,038 | |
| Series A, 5.0%, 9/1/2027 | 500,000 | 621,590 | |
| 18 | | DWS Short-Term Municipal Bond Fund |
| Principal Amount ($) | Value ($) | ||
| 5.0%, 8/1/2028 | 1,000,000 | 1,178,878 | |
| Series A, 5.0%, 9/1/2028 | 500,000 | 634,994 | |
| 45,882,179 | |||
| North Carolina 0.7% | |||
| North Carolina, State Housing Finance Agency, Home Ownership Revenue: | |||
| Series 38-B, 4.0%, 7/1/2047 | 560,000 | 606,957 | |
| Series 41, 4.0%, 1/1/2050 | 1,305,000 | 1,441,081 | |
| 2,048,038 | |||
| North Dakota 0.3% | |||
| North Dakota, State Housing Finance Agency, Home Mortgage Housing Finance Program, Series A, 4.0%, 7/1/2047 | 885,000 | 955,658 | |
| Ohio 2.0% | |||
| Allen Country, OH, Hospital Facilities Revenue: | |||
| Series A, 5.0%, 12/1/2022 | 600,000 | 644,968 | |
| Series A, 5.0%, 12/1/2023 | 1,000,000 | 1,120,353 | |
| Cleveland, OH, Airport System Revenue: | |||
| Series A, 5.0%, 1/1/2023, INS: AGMC | 1,810,000 | 1,947,155 | |
| Series A, AMT, 5.0%, 1/1/2025 | 1,000,000 | 1,155,806 | |
| Ohio, Port of Greater Cincinnati Development Authority Revenue, Convention Center Hotel Acquisition And Demolition Project, Series A, 3.0%, 5/1/2023 | 1,500,000 | 1,502,381 | |
| 6,370,663 | |||
| Oklahoma 0.8% | |||
| Oklahoma, State Development Finance Authority, Gilcrease Expressway West Project, AMT, 1.625%, 7/6/2023 | 2,000,000 | 2,010,834 | |
| Oklahoma, State Municipal Power Authority, SIFMA Index, Series A, MUNIPSA + 0.39%, 0.45% (b), 1/1/2023 | 430,000 | 430,026 | |
| 2,440,860 | |||
| Oregon 1.3% | |||
| Clackamas County, OR, Hospital Facility Authority, Senior Living Revenue, Rose Villa Project, Series B-2, 2.75%, 11/15/2025 | 1,250,000 | 1,258,223 | |
| Oregon, State Housing & Community Services Department, Mortgage Revenue, Series A, 3.5%, 7/1/2036 | 1,230,000 | 1,292,935 | |
| Washington Multnomah & Yamhill Counties, OR, Hillsboro School District No. 1J, 5.0%, 6/15/2031 | 1,180,000 | 1,459,057 | |
| 4,010,215 | |||
| Pennsylvania 4.8% | |||
| Geisinger, PA, Authority Health System Revenue, Series B, 5.0%, Mandatory Put 2/15/2027 @ 100, 4/1/2043 | 1,000,000 | 1,230,177 | |
| DWS Short-Term Municipal Bond Fund | | 19 |
| Principal Amount ($) | Value ($) | ||
| Lancaster County, PA, Hospital Authority Revenue, Masonic Homes Project, Series D, 0.04% (c), 5/3/2021, LOC: JPMorgan Chase Bank NA | 50,000 | 50,000 | |
| Pennsylvania, Commonwealth Financing Authority, Tobacco Master Settlement Payment Revenue Bonds, 5.0%, 6/1/2026 | 2,000,000 | 2,419,927 | |
| Pennsylvania, State Economic Development Financing Authority, Solid Waste Disposal, Republic Services, Inc., Series B-1, AMT, 0.18%, Mandatory Put 7/15/2021 @ 100, 4/1/2049 | 3,000,000 | 2,999,941 | |
| Pennsylvania, State Housing Finance Agency, Single Family Mortgage Revenue: | |||
| Series 119, 3.5%, 10/1/2041 | 780,000 | 819,542 | |
| Series 122, 4.0%, 10/1/2046 | 2,525,000 | 2,728,804 | |
| Pennsylvania, State Turnpike Commission Revenue: | |||
| Series B, MUNIPSA + 0.5%, 0.56% (b), 12/1/2021 | 2,000,000 | 2,000,619 | |
| Series B-1, MUNIPSA + 0.98%, 1.04% (b), 12/1/2021 | 1,000,000 | 1,000,695 | |
| Philadelphia, PA, School District, Series 2020, 5.0%, 9/1/2022 | 1,000,000 | 1,062,929 | |
| Pittsburgh, PA, Water & Sewer Authority Systems Revenue, Series C, MUNIPSA + 0.65%, 0.71% (b), Mandatory Put 12/1/2023 @ 100, 9/1/2040, INS: AGMC | 500,000 | 501,151 | |
| 14,813,785 | |||
| Rhode Island 0.3% | |||
| Rhode Island, State Housing & Mortgage Finance Corp., Revenue, Multi Family Development Sustainability Bonds, Series 1-A, 1.7%, Mandatory Put 10/1/2022 @ 100, 10/1/2049 | 980,000 | 980,593 | |
| South Carolina 0.3% | |||
| Laurens County, SC, Water & Sewer Commission, Waterworks District, Prerefunded 7/1/2021 @ 100, 1.375%, 2/1/2022 | 1,000,000 | 1,001,715 | |
| South Dakota 0.6% | |||
| South Dakota, Housing Development Authority, Homeownership Mortgage: | |||
| Series B, 4.0%, 11/1/2047 | 1,535,000 | 1,670,155 | |
| Series A, AMT, 4.5%, 5/1/2031 | 210,000 | 217,766 | |
| 1,887,921 | |||
| Tennessee 1.2% | |||
| Memphis-Shelby County, TN, Airport Authority Revenue, Series B, AMT, 5.0%, 7/1/2021 | 1,000,000 | 1,007,479 | |
| Tennessee, Housing Development Agency, Residential Financing Program Revenue, Series 1C, 3.0%, 7/1/2038 | 335,000 | 343,129 | |
| 20 | | DWS Short-Term Municipal Bond Fund |
| Principal Amount ($) | Value ($) | ||
| Tennessee, State Energy Acquisition Corp., Gas Revenue, Series A, 4.0%, Mandatory Put 5/1/2023 @ 100, 5/1/2048, GTY: Goldman Sachs Group, Inc. | 2,250,000 | 2,402,249 | |
| Tennessee, State Housing Development Agency, Homeownership Program: | |||
| Series 2C, 4.0%, 7/1/2038 | 45,000 | 45,686 | |
| Series 1A, AMT, 4.5%, 1/1/2038 | 55,000 | 56,062 | |
| 3,854,605 | |||
| Texas 10.2% | |||
| Bexar County, TX, Certificates Obligation, Series B, 5.0%, 6/15/2021 | 4,000,000 | 4,022,405 | |
| Fort Bend, TX, Independent School District Variable Rate, Unlimited Tax Building and Refunding Bonds, Series B, 0.875%, Mandatory Put 8/1/2025 @ 100, 8/1/2050 | 500,000 | 504,717 | |
| Harris County, TX, Cultural Education Facilities Finance Corp. Revenue, Memorial Herman Hospital Health System, Series B-1, 5.0%, Mandatory Put 12/1/2022 @ 100, 7/1/2049 | 1,500,000 | 1,608,656 | |
| Harris County, TX, Flood Control District, Series A, 5.25%, 10/1/2021 | 1,465,000 | 1,495,976 | |
| Houston, TX, Airport Systems Revenue: | |||
| Series A, AMT, 5.0%, 7/1/2025 | 500,000 | 587,063 | |
| Series A, AMT, 5.0%, 7/1/2026 | 1,000,000 | 1,208,808 | |
| Series C, AMT, 5.0%, 7/1/2026 | 2,500,000 | 3,043,187 | |
| Houston, TX, Hotel Occupancy Tax And Special Revenue, Convention and Entertainment Facilities Department, 5.0%, 9/1/2026 | 1,735,000 | 2,025,824 | |
| Houston, TX, Independent School District: | |||
| Series A-2, 2.25%, Mandatory Put 6/1/2022 @ 100, 6/1/2039 | 1,000,000 | 1,022,875 | |
| 4.0%, Mandatory Put 6/1/2023 @ 100, 6/1/2029 | 1,000,000 | 1,078,794 | |
| Houston, TX, Utility System Revenue, Series C, 70% of 1-month USD-LIBOR + 0.36%, 0.437% (b), Mandatory Put 8/1/2021 @ 100, 5/15/2034 | 1,575,000 | 1,575,274 | |
| Katy, TX, Katy Independent School District, Series 2015C, 67% of 1-month USD-LIBOR + 0.28%, 0.357% (b), Mandatory Put 8/16/2021 @ 100, 8/15/2036 | 960,000 | 960,058 | |
| Round Rock, TX, Independent School District, 5.0%, 8/1/2021 | 4,275,000 | 4,326,021 | |
| Texas, Bowie County Industrial Development Corp. Revenue, 0.04% (c), 5/3/2021, LOC: JPMorgan Chase Bank NA | 1,900,000 | 1,900,000 | |
| Texas, Clifton Higher Education Finance Corp. Revenue, Taxable Variable Rate, Idea Public Schools, Series T, 144A, 0.75%, Mandatory Put 2/15/2022 @ 100, 8/15/2050 | 4,000,000 | 3,999,334 | |
| Texas, Grand Parkway Transportation Corp., 5.0%, 2/1/2023 | 1,040,000 | 1,119,912 | |
| DWS Short-Term Municipal Bond Fund | | 21 |
| Principal Amount ($) | Value ($) | ||
| Texas, Love Field Airport Modernization Corp., General Airport Revenue, AMT, 5.0%, 11/1/2021 | 500,000 | 511,487 | |
| Texas, State Municipal Gas Acquisition & Supply Corp., III Gas Supply Revenue, 5.0%, 12/15/2029 | 500,000 | 643,050 | |
| 31,633,441 | |||
| Virginia 1.4% | |||
| Chesapeake Bay, VA, Bridge & Tunnel District Revenue, First Tier General Resolution, 5.0%, 11/1/2023 | 1,250,000 | 1,391,183 | |
| Fairfax County, VA, Economic Development Authority Revenue, Wiehle Avenue Metrorail Station Parking Project, 5.0%, 8/1/2021 | 1,650,000 | 1,669,570 | |
| Peninsula, VA, Ports Authority, Coal Terminal Revenue, Dominion Terminal Associates Project, Series 2003, 1.7%, Mandatory Put 10/1/2022 @ 100, 10/1/2033 | 1,410,000 | 1,437,046 | |
| 4,497,799 | |||
| Washington 3.1% | |||
| Seattle, WA, Municipal Light & Power Revenue, Series C-1, MUNIPSA + 0.49%, 0.55% (b), Mandatory Put 11/1/2023 @ 100, 11/1/2046 | 2,000,000 | 2,006,525 | |
| Washington, Energy Northwest Electric Revenue, Columbia Generating Station, Series A, 5.0%, 7/1/2021 | 4,620,000 | 4,656,125 | |
| Washington, State General Obligation: | |||
| 5.0%, 6/1/2026 | 500,000 | 613,371 | |
| 5.0%, 6/1/2027 | 300,000 | 378,257 | |
| Washington, State Housing Finance Commission, Transforming Age Projects, Series B, 144A, 2.375%, 1/1/2026 | 2,000,000 | 1,999,987 | |
| 9,654,265 | |||
| West Virginia 0.8% | |||
| West Virginia, State Economic Development Authority, Solid Waste Disposal Facilities Revenue, Arch Resources Project, Series A, AMT, 4.125%, Mandatory Put 7/1/2025 @ 100, 7/1/2045 | 250,000 | 256,696 | |
| West Virginia, State Economic Development Authority, Solid Waste Disposal Facilities Revenue, Wheeling Power Co., Mitchell Project, Series A, AMT, 3.0%, Mandatory Put 4/1/2022 @ 100, 6/1/2037 | 2,250,000 | 2,306,948 | |
| 2,563,644 | |||
| Wisconsin 1.6% | |||
| Wisconsin, State Health & Educational Facilities Authority Revenue, Advocate Aurora Health Credit Group, Series C-4, MUNIPSA + 0.65%, 0.71% (b), Mandatory Put 7/31/2024 @ 100, 8/15/2054 | 1,000,000 | 1,009,493 | |
| 22 | | DWS Short-Term Municipal Bond Fund |
| Principal Amount ($) | Value ($) | ||
| Wisconsin, State Health & Educational Facilities Authority Revenue, Marshfield Clinic Health System, Inc., Series A, 0.04% (c), 5/3/2021, LOC: Barclays Bank PLC | 850,000 | 850,000 | |
| Wisconsin, State Housing & Economic Development Authority, Home Ownership Revenue, Series A, AMT, 3.5%, 3/1/2046 | 1,545,000 | 1,631,648 | |
| Wisconsin, Waukesha Note Anticipation Notes, Series A, 2.0%, 7/1/2022 | 1,500,000 | 1,527,543 | |
| 5,018,684 | |||
| Guam 0.5% | |||
| Guam, International Airport Authority Revenue, Series A, AMT, 5.0%, 10/1/2022 | 1,500,000 | 1,565,044 | |
| Other 0.2% | |||
| Federal Home Loan Mortgage Corp., Multi-Family Variable Rate Certificates, “A” , Series M024, AMT, 2.304%, 5/15/2027 | 575,000 | 596,480 | |
| Total Municipal Bonds and Notes (Cost $320,131,116) | 326,636,715 | ||
| Preferred Shares of Closed-End Investment Companies 1.1% | |||
| California | |||
| California, Nuveen AMT-Free Quality Municipal Income Fund, Series D, 0.56%, 3/1/2029 (Cost $3,500,000) | 3,500,000 | 3,500,000 | |
| Shares | Value ($) | ||
| Open-End Investment Companies 0.3% | |||
| BlackRock Liquidity Funds MuniCash Portfolio, Institutional Shares, 0.01% (d) (Cost $816,152) | 815,784 | 815,947 | |
| % of Net Assets | Value ($) | ||
| Total Investment Portfolio (Cost $324,447,268) | 106.4 | 330,952,662 | |
| Other Assets and Liabilities, Net | (6.4) | (19,869,429) | |
| Net Assets | 100.0 | 311,083,233 | |
| (a) | When-issued security. |
| (b) | Variable or floating rate security. These securities are shown at their current rate as of April 30, 2021. For securities based on a published reference rate and spread, the reference rate and spread are indicated within the description above. Certain variable rate securities are not based on a published reference rate and spread but adjust periodically based on current market conditions, prepayment of underlying positions and/or other variables. |
| DWS Short-Term Municipal Bond Fund | | 23 |
| (c) | Variable rate demand notes are securities whose interest rates are reset periodically (usually daily mode or weekly mode) by remarketing agents based on current market levels, and are not directly set as a fixed spread to a reference rate. These securities may be redeemed at par by the holder at any time, and are shown at their current rates as of April 30, 2021. Date shown reflects the earlier of demand date or stated maturity date. |
| (d) | Current yield; not a coupon rate. |
| 144A: Security exempt from registration under Rule 144A of the Securities Act of 1933. These securities may be resold in transactions exempt from registration, normally to qualified institutional buyers. |
| AGMC: Assured Guaranty Municipal Corp. |
| AMT: Subject to alternative minimum tax. |
| BAM: Build America Mutual |
| ETM: Bonds bearing the description ETM (escrow to maturity) are collateralized usually by U.S. Treasury securities which are held in escrow and used to pay principal and interest on bonds so designated. |
| GTY: Guaranty Agreement |
| INS: Insured |
| LIBOR: London Interbank Offered Rate |
| LIQ: Liquidity Facility |
| LOC: Letter of Credit |
| MUNIPSA: SIFMA Municipal Swap Index Yield |
| Prerefunded: Bonds which are prerefunded are collateralized usually by U.S. Treasury securities which are held in escrow and used to pay principal and interest on tax-exempt issues and to retire the bonds in full at the earliest refunding date. |
| SIFMA: Securities Industry and Financial Markets Association |
| Assets | Level 1 | Level 2 | Level 3 | Total |
| Municipal Bonds and Notes (a) | $ — | $326,636,715 | $— | $326,636,715 |
| Preferred Shares of Closed-End Investment Companies | — | 3,500,000 | — | 3,500,000 |
| Open-End Investment Companies | 815,947 | — | — | 815,947 |
| Total | $815,947 | $330,136,715 | $ — | $330,952,662 |
| (a) | See Investment Portfolio for additional detailed categorizations. |
| 24 | | DWS Short-Term Municipal Bond Fund |
| Assets | |
| Investment in securities, at value (cost $324,447,268) | $ 330,952,662 |
| Cash | 2,452 |
| Receivable for investments sold | 3,009,664 |
| Receivable for Fund shares sold | 867,008 |
| Interest receivable | 2,521,770 |
| Other assets | 46,186 |
| Total assets | 337,399,742 |
| Liabilities | |
| Payable for investments purchased — when-issued securities | 25,975,333 |
| Payable for Fund shares redeemed | 36,578 |
| Distributions payable | 34,339 |
| Accrued management fee | 67,620 |
| Accrued Trustees' fees | 3,603 |
| Other accrued expenses and payables | 199,036 |
| Total liabilities | 26,316,509 |
| Net assets, at value | $ 311,083,233 |
| Net Assets Consist of | |
| Distributable earnings (loss) | 6,258,323 |
| Paid-in capital | 304,824,910 |
| Net assets, at value | $ 311,083,233 |
| DWS Short-Term Municipal Bond Fund | | 25 |
| Net Asset Value | |
| Class A | |
| Net Asset Value and redemption price per share ($137,040,420 ÷ 13,416,800 outstanding shares of beneficial interest, $.01 par value, unlimited number of shares authorized) | $ 10.21 |
| Maximum offering price per share (100 ÷ 97.75 of $10.21) | $ 10.45 |
| Class C | |
| Net Asset Value, offering and redemption price (subject to contingent deferred sales charge) per share ($2,716,069 ÷ 265,951 outstanding shares of beneficial interest, $.01 par value, unlimited number of shares authorized) | $ 10.21 |
| Class S | |
| Net Asset Value, offering and redemption price per share ($49,145,623 ÷ 4,817,884 outstanding shares of beneficial interest, $.01 par value, unlimited number of shares authorized) | $ 10.20 |
| Institutional Class | |
| Net Asset Value, offering and redemption price per share ($122,181,121 ÷ 11,959,731 outstanding shares of beneficial interest, $.01 par value, unlimited number of shares authorized) | $ 10.22 |
| 26 | | DWS Short-Term Municipal Bond Fund |
| Investment Income | |
| Income: | |
| Interest | $ 2,531,364 |
| Expenses: | |
| Management fee | 464,016 |
| Administration fee | 150,032 |
| Services to shareholders | 147,003 |
| Distribution and service fees | 179,705 |
| Custodian fee | 1,934 |
| Professional fees | 42,693 |
| Reports to shareholders | 13,579 |
| Registration fees | 33,556 |
| Trustees' fees and expenses | 6,277 |
| Other | 11,641 |
| Total expenses before expense reductions | 1,050,436 |
| Expense reductions | (81,662) |
| Total expenses after expense reductions | 968,774 |
| Net investment income | 1,562,590 |
| Realized and Unrealized Gain (Loss) | |
| Net realized gain (loss) from investments | 266,521 |
| Change in net unrealized appreciation (depreciation) on investments | 1,601,886 |
| Net gain (loss) | 1,868,407 |
| Net increase (decrease) in net assets resulting from operations | $ 3,430,997 |
| DWS Short-Term Municipal Bond Fund | | 27 |
| Six Months Ended April 30, 2021 | Year Ended October 31, | |
| Increase (Decrease) in Net Assets | (Unaudited) | 2020 |
| Operations: | ||
| Net investment income | $ 1,562,590 | $ 3,943,892 |
| Net realized gain (loss) | 266,521 | 1,450,750 |
| Change in net unrealized appreciation (depreciation) | 1,601,886 | 765,052 |
| Net increase (decrease) in net assets resulting from operations | 3,430,997 | 6,159,694 |
| Distributions to shareholders: | ||
| Class A | (1,328,740) | (2,262,008) |
| Class C | (18,644) | (25,033) |
| Class S | (513,319) | (722,026) |
| Institutional Class | (1,289,274) | (1,801,121) |
| Total distributions | (3,149,977) | (4,810,188) |
| Fund share transactions: | ||
| Proceeds from shares sold | 69,730,952 | 197,757,493 |
| Reinvestment of distributions | 2,953,214 | 4,466,589 |
| Payments for shares redeemed | (84,008,615) | (211,370,541) |
| Net increase (decrease) in net assets from Fund share transactions | (11,324,449) | (9,146,459) |
| Increase (decrease) in net assets | (11,043,429) | (7,796,953) |
| Net assets at beginning of period | 322,126,662 | 329,923,615 |
| Net assets at end of period | $311,083,233 | $ 322,126,662 |
| 28 | | DWS Short-Term Municipal Bond Fund |
| DWS Short-Term Municipal Bond Fund — Class A | ||||||
| Six Months Ended 4/30/21 | Years Ended October 31, | |||||
| (Unaudited) | 2020 | 2019 | 2018 | 2017 | 2016 | |
| Selected Per Share Data | ||||||
| Net asset value, beginning of period | $10.21 | $10.15 | $9.93 | $10.10 | $10.16 | $10.21 |
| Income (loss) from investment operations: | ||||||
| Net investment incomea | .05 | .11 | .15 | .17 | .13 | .12 |
| Net realized and unrealized gain (loss) | .05 | .09 | .23 | (.17) | (.06) | (.05) |
| Total from investment operations | .10 | .20 | .38 | — | .07 | .07 |
| Less distributions from: | ||||||
| Net investment income | (.05) | (.12) | (.16) | (.17) | (.13) | (.12) |
| Net realized gains | (.05) | (.02) | — | — | — | — |
| Total distributions | (.10) | (.14) | (.16) | (.17) | (.13) | (.12) |
| Net asset value, end of period | $10.21 | $10.21 | $10.15 | $9.93 | $10.10 | $10.16 |
| Total Return (%)b,c | .94 * | 2.00 | 3.83 | (.02) | .67 | .66 |
| Ratios to Average Net Assets and Supplemental Data | ||||||
| Net assets, end of period ($ millions) | 137 | 145 | 180 | 104 | 121 | 158 |
| Ratio of expenses before expense reductions (%) | .79 ** | .79 | .91 | .94 | .91 | .90 |
| Ratio of expenses after expense reductions (%) | .74 ** | .72 | .72 | .71 | .73 | .73 |
| Ratio of net investment income (%) | .90 ** | 1.13 | 1.54 | 1.67 | 1.26 | 1.15 |
| Portfolio turnover rate (%) | 44 * | 88 | 109 | 117 | 89 | 81 |
| a | Based on average shares outstanding during the period. |
| b | Total return does not reflect the effect of any sales charges. |
| c | Total return would have been lower had certain expenses not been reduced. |
| * | Not annualized |
| ** | Annualized |
| DWS Short-Term Municipal Bond Fund | | 29 |
| DWS Short-Term Municipal Bond Fund — Class C | ||||||
| Six Months Ended 4/30/21 | Years Ended October 31, | |||||
| (Unaudited) | 2020 | 2019 | 2018 | 2017 | 2016 | |
| Selected Per Share Data | ||||||
| Net asset value, beginning of period | $10.21 | $10.15 | $9.93 | $10.10 | $10.16 | $10.20 |
| Income (loss) from investment operations: | ||||||
| Net investment incomea | .01 | .04 | .08 | .09 | .05 | .04 |
| Net realized and unrealized gain (loss) | .05 | .09 | .22 | (.17) | (.06) | (.04) |
| Total from investment operations | .06 | .13 | .30 | (.08) | (.01) | .00 * |
| Less distributions from: | ||||||
| Net investment income | (.01) | (.05) | (.08) | (.09) | (.05) | (.04) |
| Net realized gains | (.05) | (.02) | — | — | — | — |
| Total distributions | (.06) | (.07) | (.08) | (.09) | (.05) | (.04) |
| Net asset value, end of period | $10.21 | $10.21 | $10.15 | $9.93 | $10.10 | $10.16 |
| Total Return (%)b,c | .57 ** | 1.24 | 3.05 | (.77) | (.08) | .01 |
| Ratios to Average Net Assets and Supplemental Data | ||||||
| Net assets, end of period ($ millions) | 3 | 3 | 5 | 8 | 14 | 20 |
| Ratio of expenses before expense reductions (%) | 1.55 *** | 1.55 | 1.70 | 1.70 | 1.68 | 1.67 |
| Ratio of expenses after expense reductions (%) | 1.49 *** | 1.47 | 1.47 | 1.46 | 1.48 | 1.48 |
| Ratio of net investment income (%) | .15 *** | .38 | .85 | .90 | .51 | .40 |
| Portfolio turnover rate (%) | 44 ** | 88 | 109 | 117 | 89 | 81 |
| a | Based on average shares outstanding during the period. |
| b | Total return does not reflect the effect of any sales charges. |
| c | Total return would have been lower had certain expenses not been reduced. |
| * | Amount is less than $.005. |
| ** | Not annualized |
| *** | Annualized |
| 30 | | DWS Short-Term Municipal Bond Fund |
| DWS Short-Term Municipal Bond Fund — Class S | ||||||
| Six Months Ended 4/30/21 | Years Ended October 31, | |||||
| (Unaudited) | 2020 | 2019 | 2018 | 2017 | 2016 | |
| Selected Per Share Data | ||||||
| Net asset value, beginning of period | $10.19 | $10.13 | $9.92 | $10.09 | $10.15 | $10.19 |
| Income (loss) from investment operations: | ||||||
| Net investment incomea | .05 | .13 | .17 | .18 | .14 | .13 |
| Net realized and unrealized gain (loss) | .07 | .09 | .21 | (.17) | (.06) | (.04) |
| Total from investment operations | .12 | .22 | .38 | .01 | .08 | .09 |
| Less distributions from: | ||||||
| Net investment income | (.06) | (.14) | (.17) | (.18) | (.14) | (.13) |
| Net realized gains | (.05) | (.02) | — | — | — | — |
| Total distributions | (.11) | (.16) | (.17) | (.18) | (.14) | (.13) |
| Net asset value, end of period | $10.20 | $10.19 | $10.13 | $9.92 | $10.09 | $10.15 |
| Total Return (%)b | 1.12 * | 2.15 | 3.88 | .12 | .82 | .91 |
| Ratios to Average Net Assets and Supplemental Data | ||||||
| Net assets, end of period ($ millions) | 49 | 49 | 51 | 46 | 113 | 81 |
| Ratio of expenses before expense reductions (%) | .63 ** | .65 | .75 | .81 | .81 | .74 |
| Ratio of expenses after expense reductions (%) | .59 ** | .57 | .57 | .56 | .58 | .58 |
| Ratio of net investment income (%) | 1.05 ** | 1.27 | 1.72 | 1.78 | 1.41 | 1.30 |
| Portfolio turnover rate (%) | 44 * | 88 | 109 | 117 | 89 | 81 |
| a | Based on average shares outstanding during the period. |
| b | Total return would have been lower had certain expenses not been reduced. |
| * | Not annualized |
| ** | Annualized |
| DWS Short-Term Municipal Bond Fund | | 31 |
| DWS Short-Term Municipal Bond Fund — Institutional Class | ||||||
| Six Months Ended 4/30/21 | Years Ended October 31, | |||||
| (Unaudited) | 2020 | 2019 | 2018 | 2017 | 2016 | |
| Selected Per Share Data | ||||||
| Net asset value, beginning of period | $10.21 | $10.15 | $9.93 | $10.10 | $10.16 | $10.20 |
| Income (loss) from investment operations: | ||||||
| Net investment incomea | .06 | .14 | .18 | .19 | .15 | .14 |
| Net realized and unrealized gain (loss) | .06 | .09 | .22 | (.17) | (.06) | (.04) |
| Total from investment operations | .12 | .23 | .40 | .02 | .09 | .10 |
| Less distributions from: | ||||||
| Net investment income | (.06) | (.15) | (.18) | (.19) | (.15) | (.14) |
| Net realized gains | (.05) | (.02) | — | — | — | — |
| Total distributions | (.11) | (.17) | (.18) | (.19) | (.15) | (.14) |
| Net asset value, end of period | $10.22 | $10.21 | $10.15 | $9.93 | $10.10 | $10.16 |
| Total Return (%)b | 1.17 * | 2.26 | 4.09 | .23 | .92 | 1.02 |
| Ratios to Average Net Assets and Supplemental Data | ||||||
| Net assets, end of period ($ millions) | 122 | 125 | 94 | 67 | 45 | 40 |
| Ratio of expenses before expense reductions (%) | .55 ** | .55 | .69 | .72 | .66 | .65 |
| Ratio of expenses after expense reductions (%) | .49 ** | .47 | .48 | .46 | .48 | .48 |
| Ratio of net investment income (%) | 1.15 ** | 1.37 | 1.79 | 1.95 | 1.51 | 1.39 |
| Portfolio turnover rate (%) | 44 * | 88 | 109 | 117 | 89 | 81 |
| a | Based on average shares outstanding during the period. |
| b | Total return would have been lower had certain expenses not been reduced. |
| * | Not annualized |
| ** | Annualized |
| 32 | | DWS Short-Term Municipal Bond Fund |
| Notes to Financial Statements | (Unaudited) |
| A. | Organization and Significant Accounting Policies |
| DWS Short-Term Municipal Bond Fund | | 33 |
| 34 | | DWS Short-Term Municipal Bond Fund |
| DWS Short-Term Municipal Bond Fund | | 35 |
| B. | Purchases and Sales of Securities |
| C. | Related Parties |
| 36 | | DWS Short-Term Municipal Bond Fund |
| First $500 million of the Fund’s average daily net assets | .300% |
| Next $500 million of such net assets | .285% |
| Next $1.0 billion of such net assets | .270% |
| Over $2.0 billion of such net assets | .255% |
| Class A | .72% |
| Class C | 1.47% |
| Class S | .57% |
| Institutional Class | .47% |
| Class A | .76% | |
| Class C | 1.51% | |
| Class S | .61% | |
| Institutional Class | .51% |
| DWS Short-Term Municipal Bond Fund | | 37 |
| Class A | $ 35,633 |
| Class C | 988 |
| Class S | 10,654 |
| Institutional Class | 34,387 |
| $ 81,662 |
| Services to Shareholders | Total Aggregated | Unpaid at April 30, 2021 |
| Class A | $ 1,058 | $ 357 |
| Class C | 195 | 69 |
| Class S | 1,251 | 450 |
| Institutional Class | 239 | 77 |
| $ 2,743 | $ 953 |
| 38 | | DWS Short-Term Municipal Bond Fund |
| Sub-Recordkeeping | Total Aggregated |
| Class A | $ 55,639 |
| Class C | 1,327 |
| Class S | 38,979 |
| Institutional Class | 46,443 |
| $ 142,388 |
| Distribution Fee | Total Aggregated | Unpaid at April 30, 2021 |
| Class C | $ 11,501 | $ 1,711 |
| Service Fee | Total Aggregated | Unpaid at April 30, 2021 | Annualized Rate |
| Class A | $ 164,602 | $ 51,674 | .24% |
| Class C | 3,602 | 1,778 | .23% |
| $ 168,204 | $ 53,452 |
| DWS Short-Term Municipal Bond Fund | | 39 |
| D. | Line of Credit |
| 40 | | DWS Short-Term Municipal Bond Fund |
| E. | Fund Share Transactions |
| Six Months Ended April 30, 2021 | Year Ended October 31, 2020 | |||
| Shares | Dollars | Shares | Dollars | |
| Shares sold | ||||
| Class A | 1,254,944 | $ 12,816,396 | 7,376,750 | $ 74,890,290 |
| Class C | 17,047 | 174,506 | 89,300 | 904,406 |
| Class S | 1,533,384 | 15,648,317 | 2,450,057 | 24,719,648 |
| Institutional Class | 4,021,438 | 41,091,733 | 9,593,317 | 97,243,149 |
| $ 69,730,952 | $ 197,757,493 | |||
| Shares issued to shareholders in reinvestment of distributions | ||||
| Class A | 122,588 | $ 1,253,165 | 210,893 | $ 2,139,312 |
| Class C | 1,771 | 18,085 | 2,118 | 21,468 |
| Class S | 47,484 | 484,690 | 66,030 | 668,976 |
| Institutional Class | 117,107 | 1,197,274 | 161,251 | 1,636,833 |
| $ 2,953,214 | $ 4,466,589 | |||
| Shares redeemed | ||||
| Class A | (2,200,156) | $ (22,493,439) | (11,090,190) | $ (112,076,188) |
| Class C | (83,796) | (855,946) | (233,645) | (2,372,670) |
| Class S | (1,527,567) | (15,599,549) | (2,815,972) | (28,428,212) |
| Institutional Class | (4,406,647) | (45,059,681) | (6,763,093) | (68,493,471) |
| $ (84,008,615) | $ (211,370,541) | |||
| Net increase (decrease) | ||||
| Class A | (822,624) | $ (8,423,878) | (3,502,547) | $ (35,046,586) |
| Class C | (64,978) | (663,355) | (142,227) | (1,446,796) |
| Class S | 53,301 | 533,458 | (299,885) | (3,039,588) |
| Institutional Class | (268,102) | (2,770,674) | 2,991,475 | 30,386,511 |
| $ (11,324,449) | $ (9,146,459) | |||
| F. | Other — COVID-19 Pandemic |
| DWS Short-Term Municipal Bond Fund | | 41 |
| 42 | | DWS Short-Term Municipal Bond Fund |
| — | Actual Fund Return. This helps you estimate the actual dollar amount of ongoing expenses (but not transaction costs) paid on a $1,000 investment in the Fund using the Fund’s actual return during the period. To estimate the expenses you paid over the period, simply divide your account value by $1,000 (for example, an $8,600 account value divided by $1,000 = 8.6), then multiply the result by the number in the “Expenses Paid per $1,000” line under the share class you hold. |
| — | Hypothetical 5% Fund Return. This helps you to compare your Fund’s ongoing expenses (but not transaction costs) with those of other mutual funds using the Fund’s actual expense ratio and a hypothetical rate of return of 5% per year before expenses. Examples using a 5% hypothetical fund return may be found in the shareholder reports of other mutual funds. The hypothetical account values and expenses may not be used to estimate the actual ending account balance or expenses you paid for the period. |
| DWS Short-Term Municipal Bond Fund | | 43 |
| Actual Fund Return | Class A | Class C | Class S | Institutional Class |
| Beginning Account Value 11/1/20 | $1,000.00 | $1,000.00 | $1,000.00 | $1,000.00 |
| Ending Account Value 4/30/21 | $1,009.40 | $1,005.70 | $1,011.20 | $1,011.70 |
| Expenses Paid per $1,000* | $ 3.69 | $ 7.41 | $ 2.94 | $ 2.44 |
| Hypothetical 5% Fund Return | Class A | Class C | Class S | Institutional Class |
| Beginning Account Value 11/1/20 | $1,000.00 | $1,000.00 | $1,000.00 | $1,000.00 |
| Ending Account Value 4/30/21 | $1,021.12 | $1,017.41 | $1,021.87 | $1,022.36 |
| Expenses Paid per $1,000* | $ 3.71 | $ 7.45 | $ 2.96 | $ 2.46 |
| * | Expenses are equal to the Fund’s annualized expense ratio for each share class, multiplied by the average account value over the period, multiplied by 181 (the number of days in the most recent six-month period), then divided by 365. |
| Annualized Expense Ratios | Class A | Class C | Class S | Institutional Class |
| DWS Short-Term Municipal Bond Fund | .74% | 1.49% | .59% | .49% |
| 44 | | DWS Short-Term Municipal Bond Fund |
| DWS Short-Term Municipal Bond Fund | | 45 |
| — | During the entire process, all of the Fund’s Trustees were independent of DIMA and its affiliates (the “Independent Trustees” ). |
| — | The Board met frequently during the past year to discuss fund matters and dedicated a substantial amount of time to contract review matters. Over the course of several months, the Board reviewed extensive materials received from DIMA, independent third parties and independent counsel. These materials included an analysis of the Fund’s performance, fees and expenses, and profitability from a fee consultant retained by the Fund’s Independent Trustees (the “Fee Consultant” ). |
| — | The Board also received extensive information throughout the year regarding performance of the Fund. |
| — | The Independent Trustees regularly met privately with counsel to discuss contract review and other matters. In addition, the Independent Trustees were advised by the Fee Consultant in the course of their review of the Fund’s contractual arrangements and considered a comprehensive report prepared by the Fee Consultant in connection with their deliberations. |
| — | In connection with reviewing the Agreement, the Board also reviewed the terms of the Fund’s Rule 12b-1 plan, distribution agreement, administrative services agreement, transfer agency agreement and other material service agreements. |
| 46 | | DWS Short-Term Municipal Bond Fund |
| DWS Short-Term Municipal Bond Fund | | 47 |
| 48 | | DWS Short-Term Municipal Bond Fund |
| DWS Short-Term Municipal Bond Fund | | 49 |
| 50 | | DWS Short-Term Municipal Bond Fund |
| For More Information | The automated telephone system allows you to access personalized account information and obtain information on other DWS funds using either your voice or your telephone keypad. Certain account types within Classes A, C and S also have the ability to purchase, exchange or redeem shares using this system. |
| For more information, contact your financial representative. You may also access our automated telephone system or speak with a Shareholder Service representative by calling: (800) 728-3337 | |
| Web Site | dws.com View your account transactions and balances, trade shares, monitor your asset allocation, subscribe to fund and account updates by e-mail, and change your address, 24 hours a day. |
| Obtain prospectuses and applications, news about DWS funds, insight from DWS economists and investment specialists and access to DWS fund account information. | |
| Written Correspondence | DWS PO Box 219151 Kansas City, MO 64121-9151 |
| Proxy Voting | The Fund’s policies and procedures for voting proxies for portfolio securities and information about how the Fund voted proxies related to its portfolio securities during the most recent 12-month period ended June 30 are available on our Web site — dws.com/en-us/resources/proxy-voting — or on the SEC’s Web site — sec.gov. To obtain a written copy of the Fund’s policies and procedures without charge, upon request, call us toll free at (800) 728-3337. |
| Portfolio Holdings | Following the Fund’s fiscal first and third quarter-end, a complete portfolio holdings listing is posted on dws.com, and is available free of charge by contacting your financial intermediary, or if you are a direct investor, by calling (800) 728-3337. In addition, the portfolio holdings listing is filed with SEC on the Fund’s Form N-PORT and will be available on the SEC’s Web site at sec.gov. Additional portfolio holdings for the Fund are also posted on dws.com from time to time. Please see the Fund’s current prospectus for more information. |
| Principal Underwriter | If you have questions, comments or complaints, contact:DWS Distributors, Inc. 222 South Riverside Plaza Chicago, IL 60606-5808 (800) 621-1148 |
| DWS Short-Term Municipal Bond Fund | | 51 |
| Investment Management | DWS Investment Management Americas, Inc. (“DIMA” or the “Advisor” ), which is part of the DWS Group GmbH & Co. KGaA (“DWS Group” ), is the investment advisor for the Fund. DIMA and its predecessors have more than 90 years of experience managing mutual funds and DIMA provides a full range of investment advisory services to both institutional and retail clients. DIMA is an indirect, wholly owned subsidiary of DWS Group. |
| DWS Group is a global organization that offers a wide range of investing expertise and resources, including hundreds of portfolio managers and analysts and an office network that reaches the world’s major investment centers. This well-resourced global investment platform brings together a wide variety of experience and investment insight across industries, regions, asset classes and investing styles. |
| Class A | Class C | Class S | Institutional Class | |
| Nasdaq Symbol | SRMAX | SRMCX | SRMSX | MGSMX |
| CUSIP Number | 25158T 863 | 25158T 889 | 25158T 806 | 25158T 830 |
| Fund Number | 436 | 736 | 2336 | 536 |
| 52 | | DWS Short-Term Municipal Bond Fund |
| FACTS | What Does DWS Do With Your Personal Information? |
| Why? | Financial companies choose how they share your personal information. Federal law gives consumers the right to limit some but not all sharing. Federal law also requires us to tell you how we collect, share and protect your personal information. Please read this notice carefully to understand what we do. |
| What? | The types of personal information we collect and share can include: — Social Security number — Account balances — Purchase and transaction history — Bank account information — Contact information such as mailing address, e-mail address and telephone number |
| How? | All financial companies need to share customers’ personal information to run their everyday business. In the section below, we list the reasons financial companies can share their customers’ personal information, the reasons DWS chooses to share and whether you can limit this sharing. |
| Reasons we can share your personal information | Does DWS share? | Can you limit this sharing? |
| For our everyday business purposes —such as to process your transactions, maintain your account(s), respond to court orders or legal investigations | Yes | No |
| For our marketing purposes — to offer our products and services to you | Yes | No |
| For joint marketing with other financial companies | No | We do not share |
| For our affiliates’ everyday business purposes — information about your transactions and experiences | No | We do not share |
| For our affiliates’ everyday business purposes — information about your creditworthiness | No | We do not share |
| For non-affiliates to market to you | No | We do not share |
| Questions? | Call (800) 728-3337 or e-mail us at service@dws.com |
| DWS Short-Term Municipal Bond Fund | | 53 |
| Who we are | |
| Who is providing this notice? | DWS Distributors, Inc; DWS Investment Management Americas, Inc.; DWS Trust Company; the DWS Funds |
| What we do | |
| How does DWS protect my personal information? | To protect your personal information from unauthorized access and use, we use security measures that comply with federal law. These measures include computer safeguards, secured files, and secured buildings. |
| How does DWS collect my personal information? | We collect your personal information, for example, when you: — open an account — give us your contact information — provide bank account information for ACH or wire transactions — tell us where to send money — seek advice about your investments |
| Why can’t I limit all sharing? | Federal law gives you the right to limit only — sharing for affiliates’ everyday business purposes — information about your creditworthiness — affiliates from using your information to market to you — sharing for non-affiliates to market to you State laws and individual companies may give you additional rights to limit sharing. |
| Definitions | |
| Affiliates | Companies related by common ownership or control. They can be financial or non-financial companies. Our affiliates include financial companies with the DWS or Deutsche Bank (“DB” ) name, such as DB AG Frankfurt. |
| Non-affiliates | Companies not related by common ownership or control. They can be financial and non-financial companies. Non-affiliates we share with include account service providers, service quality monitoring services, mailing service providers and verification services to help in the fight against money laundering and fraud. |
| Joint marketing | A formal agreement between non-affiliated financial companies that together market financial products or services to you. DWS does not jointly market. |
| 54 | | DWS Short-Term Municipal Bond Fund |

| (b) Not applicable | ||
| ITEM 2. | CODE OF ETHICS | |
| Not applicable. | ||
| ITEM 3. | AUDIT COMMITTEE FINANCIAL EXPERT | |
| Not applicable | ||
| ITEM 4. | PRINCIPAL ACCOUNTANT FEES AND SERVICES | |
| Not applicable | ||
| ITEM 5. | AUDIT COMMITTEE OF LISTED REGISTRANTS | |
| Not applicable | ||
| ITEM 6. | SCHEDULE OF INVESTMENTS | |
| Not applicable | ||
| ITEM 7. | DISCLOSURE OF PROXY VOTING POLICIES AND PROCEDURES FOR CLOSED-END MANAGEMENT INVESTMENT COMPANIES | |
| Not applicable | ||
| ITEM 8. | PORTFOLIO MANAGERS OF CLOSED-END MANAGEMENT INVESTMENT COMPANIES | |
| Not applicable | ||
| ITEM 9. | PURCHASES OF EQUITY SECURITIES BY CLOSED-END MANAGEMENT INVESTMENT COMPANY AND AFFILIATED PURCHASERS | |
| Not applicable | ||
| ITEM 10. | SUBMISSION OF MATTERS TO A VOTE OF SECURITY HOLDERS | |
| There were no material changes to the procedures by which shareholders may recommend nominees to the Fund’s Board. The primary function of the Nominating and Governance Committee is to identify and recommend individuals for membership on the Board and oversee the administration of the Board Governance Guidelines. Shareholders may recommend candidates for Board positions by forwarding their correspondence by U.S. mail or courier service to Keith R. Fox, DWS Funds Board Chair, c/o Thomas R. Hiller, Ropes & Gray LLP, Prudential Tower, 800 Boylston Street, Boston, MA 02199-3600. | ||
| ITEM 11. | CONTROLS AND PROCEDURES | |
| (a) | The Chief Executive and Financial Officers concluded that the Registrant’s Disclosure Controls and Procedures are effective based on the evaluation of the Disclosure Controls and Procedures as of a date within 90 days of the filing date of this report. | |
| (b) | There have been no changes in the registrant’s internal control over financial reporting that occurred during the period covered by this report that has materially affected, or is reasonably likely to materially affect, the registrant’s internal controls over financial reporting. | |
| ITEM 12. | Disclosure of Securities Lending Activities for Closed-End Management Investment Companies. | |
| Not applicable | ||
| ITEM 13. | EXHIBITS | |
| (a)(1) | Not applicable | |
| (a)(2) | Certification pursuant to Rule 30a-2(a) under the Investment Company Act of 1940 (17 CFR 270.30a-2(a)) is filed and attached hereto as Exhibit 99.CERT. | |
| (b) | Certification pursuant to Rule 30a-2(b) under the Investment Company Act of 1940 (17 CFR 270.30a-2(b)) is furnished and attached hereto as Exhibit 99.906CERT. | |
SIGNATURES
Pursuant to the requirements of the Securities Exchange Act of 1934 and the Investment Company Act of 1940, the registrant has duly caused this report to be signed on its behalf by the undersigned, thereunto duly authorized.
| Registrant: | DWS Short-Term Municipal Bond Fund, a series of Deutsche DWS Municipal Trust |
| By: | /s/Hepsen Uzcan Hepsen Uzcan President |
| Date: | 6/29/2021 |
Pursuant to the requirements of the Securities Exchange Act of 1934 and the Investment Company Act of 1940, this report has been signed below by the following persons on behalf of the registrant and in the capacities and on the dates indicated.
| By: | /s/Hepsen Uzcan Hepsen Uzcan President |
| Date: | 6/29/2021 |
| By: | /s/Diane Kenneally Diane Kenneally Chief Financial Officer and Treasurer |
| Date: | 6/29/2021 |