UNITED STATES
SECURITIES AND EXCHANGE COMMISSION
WASHINGTON, D. C. 20549
FORM N-CSRS
Investment Company Act file number: 811-02671
Deutsche DWS Municipal Trust
(Exact Name of Registrant as Specified in Charter)
875 Third Avenue
New York, NY 10022-6225
(Address of Principal Executive Offices) (Zip Code)
Registrant’s Telephone Number, including Area Code: (212) 454-4500
Diane Kenneally
100 Summer Street
Boston, MA 02110
(Name and Address of Agent for Service)
| Date of fiscal year end: | 5/31 |
| Date of reporting period: | 11/30/2022 |
| ITEM 1. | REPORT TO STOCKHOLDERS |
| (a) | |


Contents
4 | |
5 | |
9 | |
10 | |
11 | |
35 | |
37 | |
38 | |
39 | |
43 | |
54 | |
56 | |
60 |
NOT FDIC/NCUA INSURED NO BANK GUARANTEE MAY LOSE VALUE
NOT A DEPOSIT NOT INSURED BY ANY FEDERAL GOVERNMENT AGENCY
2 | | | DWS Managed Municipal Bond Fund |
DWS Managed Municipal Bond Fund | | | 3 |


4 | | | DWS Managed Municipal Bond Fund |
Class A | 6-Month‡ | 1-Year | 5-Year | 10-Year |
Average Annual Total Returns as of 11/30/22 | ||||
Unadjusted for Sales Charge | –2.68% | –11.55% | 0.44% | 1.38% |
Adjusted for the Maximum Sales Charge (max 2.75% load) | –5.35% | –13.98% | –0.12% | 1.10% |
Bloomberg Municipal Bond Index† | –1.43% | –8.64% | 1.40% | 1.98% |
Average Annual Total Returns as of 9/30/22 (most recent calendar quarter end) | ||||
Unadjusted for Sales Charge | –14.08% | –0.35% | 1.28% | |
Adjusted for the Maximum Sales Charge (max 2.75% load) | –16.44% | –0.90% | 1.00% | |
Bloomberg Municipal Bond Index† | –11.50% | 0.59% | 1.79% | |
Class C | 6-Month‡ | 1-Year | 5-Year | 10-Year |
Average Annual Total Returns as of 11/30/22 | ||||
Unadjusted for Sales Charge | –3.04% | –12.22% | –0.35% | 0.59% |
Adjusted for the Maximum Sales Charge (max 1.00% CDSC) | –4.00% | –12.22% | –0.35% | 0.59% |
Bloomberg Municipal Bond Index† | –1.43% | –8.64% | 1.40% | 1.98% |
Average Annual Total Returns as of 9/30/22 (most recent calendar quarter end) | ||||
Unadjusted for Sales Charge | –14.73% | –1.13% | 0.49% | |
Adjusted for the Maximum Sales Charge (max 1.00% CDSC) | –14.73% | –1.13% | 0.49% | |
Bloomberg Municipal Bond Index† | –11.50% | 0.59% | 1.79% | |
Class S | 6-Month‡ | 1-Year | 5-Year | 10-Year |
Average Annual Total Returns as of 11/30/22 | ||||
No Sales Charges | –2.67% | –11.41% | 0.65% | 1.59% |
Bloomberg Municipal Bond Index† | –1.43% | –8.64% | 1.40% | 1.98% |
Average Annual Total Returns as of 9/30/22 (most recent calendar quarter end) | ||||
No Sales Charges | –13.95% | –0.13% | 1.49% | |
Bloomberg Municipal Bond Index† | –11.50% | 0.59% | 1.79% | |
DWS Managed Municipal Bond Fund | | | 5 |
Institutional Class | 6-Month‡ | 1-Year | 5-Year | 10-Year |
Average Annual Total Returns as of 11/30/22 | ||||
No Sales Charges | –2.67% | –11.43% | 0.66% | 1.61% |
Bloomberg Municipal Bond Index† | –1.43% | –8.64% | 1.40% | 1.98% |
Average Annual Total Returns as of 9/30/22 (most recent calendar quarter end) | ||||
No Sales Charges | –13.96% | –0.13% | 1.51% | |
Bloomberg Municipal Bond Index† | –11.50% | 0.59% | 1.79% | |
6 | | | DWS Managed Municipal Bond Fund |
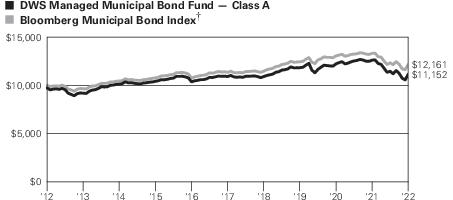 Yearly periods ended November 30
† | Bloomberg Municipal Bond Index covers the USD-denominated long-term tax exempt bond market. The index has four main sectors: state and local general obligation bonds, revenue bonds, insured bonds, and pre-refunded bonds. |
‡ | Total returns shown for periods less than one year are not annualized. |
DWS Managed Municipal Bond Fund | | | 7 |
Class A | Class C | Class S | Institutional Class | |
Net Asset Value | ||||
11/30/22 | $7.94 | $7.94 | $7.95 | $7.94 |
5/31/22 | $8.29 | $8.29 | $8.31 | $8.30 |
Distribution Information as of 11/30/22 | ||||
Income Dividends, Six Months | $.13 | $.10 | $.14 | $.14 |
November Income Dividend | $.0220 | $.0172 | $.0236 | $.0236 |
SEC 30-day Yield‡‡ | 3.56% | 2.93% | 3.91% | 3.91% |
Tax Equivalent Yield‡‡ | 6.01% | 4.95% | 6.60% | 6.60% |
Current Annualized Distribution Rate‡‡ | 3.37% | 2.64% | 3.61% | 3.62% |
‡‡ | The SEC yield is net investment income per share earned over the month ended November 30, 2022, shown as an annualized percentage of the maximum offering price per share on the last day of the period. The SEC yield is computed in accordance with a standardized method prescribed by the Securities and Exchange Commission. The SEC yields would have been 2.90%, 3.82% and 3.86% for Class C, Class S and Institutional shares, respectively, had certain expenses not been reduced. Tax equivalent yield is based on the Fund’s yield and a marginal income tax rate of 40.8%. Current annualized distribution rate is the latest monthly dividend shown as an annualized percentage of net asset value on November 30, 2022. Distribution rate simply measures the level of dividends and is not a complete measure of performance. The current annualized distribution rates would have been 2.61%, 3.52% and 3.57% for Class C, Class S and Institutional shares, respectively, had certain expenses not been reduced. Yields and distribution rates are historical, not guaranteed and will fluctuate. |
8 | | | DWS Managed Municipal Bond Fund |
DWS Managed Municipal Bond Fund | | | 9 |
Asset Allocation (As a % of Investment Portfolio excluding Open-End Investment Companies) | 11/30/22 | 5/31/22 |
Revenue Bonds | 78% | 78% |
Lease Obligations | 8% | 9% |
General Obligation Bonds | 8% | 8% |
Escrow to Maturity/Prerefunded Bonds | 4% | 4% |
Variable Rate Demand Notes | 1% | 1% |
Other | 1% | 0% |
Variable Rate Demand Preferred Shares | 0% | 0% |
100% | 100% |
Interest Rate Sensitivity | 11/30/22 | 5/31/22 |
Effective Maturity | 10.5 years | 7.8 years |
Modified Duration | 7.0 years | 5.8 years |
Quality (As a % of Investment Portfolio excluding Open-End Investment Companies) | 11/30/22 | 5/31/22 |
AAA | 9% | 9% |
AA | 33% | 34% |
A | 31% | 31% |
BBB | 15% | 14% |
BB | 3% | 3% |
B | 0% | 0% |
Not Rated | 9% | 9% |
100% | 100% |
Top Five State Allocations (As a % of Investment Portfolio excluding Open-End Investment Companies) | 11/30/22 | 5/31/22 |
New York | 15% | 15% |
Texas | 10% | 10% |
California | 8% | 7% |
Florida | 7% | 6% |
Illinois | 7% | 6% |
10 | | | DWS Managed Municipal Bond Fund |
Principal Amount ($) | Value ($) | ||
Municipal Investments 97.0% | |||
Alaska 0.1% | |||
Alaska, Northern Tobacco Securitization Corp., Tobacco Settlement Revenue, “1” , Series A, 4.0%, 6/1/2050 | 2,045,000 | 1,743,902 | |
Arizona 1.5% | |||
Arizona, Salt Verde Financial Corp., Gas Revenue: | |||
5.0%, 12/1/2032, GTY: Citigroup Global Markets | 1,600,000 | 1,680,293 | |
5.0%, 12/1/2037, GTY: Citigroup Global Markets | 8,405,000 | 8,699,254 | |
Arizona, State Health Facilities Authority Revenue, Banner Health, Series B, MUNIPSA + 0.25%, 2.15% (a), 1/1/2046 | 3,290,000 | 3,177,043 | |
Arizona, State Industrial Development Authority, Education Facility Revenue, Odyssey Preparatory Academy Project, 144A, 5.0%, 7/1/2049 | 5,490,000 | 4,946,117 | |
Maricopa County, AZ, Industrial Development Authority, Education Revenue, Legacy Traditional Schools Project, Series B, 144A, 5.0%, 7/1/2049 | 4,560,000 | 4,154,485 | |
Phoenix, AZ, Civic Improvement Corp., Rental Car Facility Revenue, Series A, 4.0%, 7/1/2045 | 7,000,000 | 6,271,937 | |
Pima County, AZ, Industrial Development Authority, Education Revenue, American Leadership Academy Project: | |||
Series 2022, 144A, 4.0%, 6/15/2051 | 5,710,000 | 4,122,179 | |
Series 2022, 144A, 4.0%, 6/15/2057 | 715,000 | 494,353 | |
144A, 5.0%, 6/15/2049 | 1,445,000 | 1,282,240 | |
144A, 5.0%, 6/15/2052 | 1,410,000 | 1,238,830 | |
36,066,731 | |||
California 8.2% | |||
California, Community Housing Agency, Essential Housing Revenue, Verdant at Green Valley Project, Series A, 144A, 5.0%, 8/1/2049 | 5,575,000 | 4,897,786 | |
California, CSCDA Community Improvement Authority, Essential Housing Revenue, Series A, 144A, 5.0%, 7/1/2051 | 7,600,000 | 6,863,438 | |
California, Golden State Tobacco Securitization Corp., Tobacco Settlement Revenue, Series A, Prerefunded, 5.0%, 6/1/2040 | 11,765,000 | 12,493,041 | |
California, Housing Finance Agency, Municipal Certificates: | |||
“A", 3.25%, 8/20/2036 | 8,524,677 | 7,367,160 | |
“A", Series 2021-1, 3.5%, 11/20/2035 | 5,448,309 | 4,916,830 | |
“A", Series 2021-2, 3.75%, 3/25/2035 | 19,718,030 | 19,367,745 | |
DWS Managed Municipal Bond Fund | | | 11 |
Principal Amount ($) | Value ($) | ||
California, Mizuho Floater/Residual Trust, Series 2022-MIZ9110, 144A, 2.15% (b), 12/7/2022, LIQ: Mizuho Capital Markets LLC, LOC: Mizuho Capital Markets LLC | 2,465,000 | 2,465,000 | |
California, Morongo Band of Mission Indians Revenue, Series B, 144A, 5.0%, 10/1/2042 | 2,395,000 | 2,402,160 | |
California, M-S-R Energy Authority, Series B, 7.0%, 11/1/2034, GTY: Citigroup Global Markets | 15,315,000 | 18,950,992 | |
California, Nuveen AMT-Free Municipal Credit Income Fund, Series C, 2.35% (b), 12/1/2022 | 3,500,000 | 3,500,000 | |
California, Nuveen AMT-Free Quality Municipal Income Fund, Series D, 2.35% (b), 12/1/2022 | 3,500,000 | 3,500,000 | |
California, River Islands Public Financing Authority, Special Tax, Community Facilities District No. 2019-1, Phase 2 Public Improvements: | |||
3.875%, 9/1/2049 | 1,560,000 | 1,257,250 | |
4.0%, 9/1/2046 | 2,265,000 | 1,978,337 | |
California, State General Obligation, Various Purposes: | |||
Series C-3, 1.35% (b), 12/7/2022, LOC: U.S. Bank NA | 1,900,000 | 1,900,000 | |
4.0%, 9/1/2042 | 4,000,000 | 4,071,935 | |
4.0%, 4/1/2049 | 1,420,000 | 1,427,435 | |
4.0%, 3/1/2050 | 5,365,000 | 5,383,178 | |
California, State Municipal Finance Authority Revenue, LAX Integrated Express Solutions LLC, LINXS Apartment Project, Series A, AMT, 5.0%, 12/31/2043 | 3,110,000 | 3,145,632 | |
California, State Public Finance Authority Revenue, ENSO Village Project: | |||
Series A, 144A, 5.0%, 11/15/2046 | 675,000 | 573,110 | |
Series A, 144A, 5.0%, 11/15/2051 | 1,690,000 | 1,406,882 | |
California, State Public Works Board, Lease Revenue: | |||
Series C, 5.0%, 8/1/2032 | 3,600,000 | 4,241,241 | |
Series A, 5.0%, 8/1/2033 | 6,250,000 | 7,358,139 | |
Series C, 5.0%, 8/1/2033 | 3,765,000 | 4,432,543 | |
California, State University Revenue, Series A, 5.0%, 11/1/2038 | 7,410,000 | 7,771,684 | |
California, Statewide Communities Development Authority Revenue, Loma Linda University Medical Center: | |||
Series A, 144A, 5.25%, 12/1/2056 | 2,905,000 | 2,893,347 | |
Series A, 5.5%, 12/1/2054 | 7,765,000 | 7,807,837 | |
California, Statewide Communities Development Authority, Multi-Family Housing Revenue, Foxwood Apartments Project, Series J, 1.53% (b), 12/7/2022, LOC: Wells Fargo Bank NA | 750,000 | 750,000 | |
Los Angeles, CA, Department of Airports Revenue: | |||
Series B, AMT, 5.0%, 5/15/2029 | 8,625,000 | 9,291,130 | |
12 | | | DWS Managed Municipal Bond Fund |
Principal Amount ($) | Value ($) | ||
Series B, AMT, 5.0%, 5/15/2030 | 5,715,000 | 6,141,192 | |
Series C, AMT, 5.0%, 5/15/2031 | 3,910,000 | 4,161,385 | |
Series C, AMT, 5.0%, 5/15/2044 | 11,250,000 | 11,537,191 | |
Series A, AMT, 5.0%, 5/15/2045 | 3,750,000 | 3,907,769 | |
Nuveen California Quality Municipal Income Fund, 1.99% (b), 12/7/2022 | 100,000 | 100,000 | |
Sacramento County, CA, Airport Systems Revenue, Series C, AMT, 5.0%, 7/1/2030 | 13,690,000 | 14,545,997 | |
San Bernardino County, CA, Flood Control District, 1.6% (b), 12/7/2022, LOC: Bank of America NA | 655,000 | 655,000 | |
193,462,366 | |||
Colorado 6.2% | |||
Colorado, North Range Metropolitan District No. 3, Series A, 5.25%, 12/1/2050 | 3,833,000 | 3,289,895 | |
Colorado, Public Energy Authority, Natural Gas Purchase Revenue, 6.5%, 11/15/2038, GTY: Merrill Lynch & Co. | 30,000,000 | 36,124,746 | |
Colorado, State Health Facilities Authority Revenue, School Health Systems, Series A, Prerefunded, 5.5%, 1/1/2035 | 16,250,000 | 16,741,397 | |
Colorado, State Health Facilities Authority, Hospital Revenue, CommonSpirit Health Obligation Group, Series A-1, 4.0%, 8/1/2044 | 4,000,000 | 3,474,263 | |
Colorado, Trails At Crowfoot Metropolitan District No. 3, Series A, 5.0%, 12/1/2049 | 1,000,000 | 887,805 | |
Denver City & County, CO, Airport Revenue: | |||
Series A, AMT, 5.0%, 12/1/2029 | 7,985,000 | 8,600,307 | |
Series A, AMT, 5.0%, 12/1/2032 | 6,350,000 | 6,743,030 | |
Series A, AMT, 5.5%, 11/15/2028 | 15,000,000 | 15,271,689 | |
Series A, AMT, 5.5%, 11/15/2029 | 14,705,000 | 14,969,484 | |
Series A, AMT, 5.5%, 11/15/2030 | 15,080,000 | 15,341,308 | |
Series A, AMT, 5.5%, 11/15/2031 | 5,000,000 | 5,082,732 | |
Series A, AMT, 5.5%, 11/15/2053 | 4,000,000 | 4,266,534 | |
Series D, AMT, 5.75%, 11/15/2045 | 3,280,000 | 3,633,810 | |
Denver, CO, Convention Center Hotel Authority Revenue, 5.0%, 12/1/2040 | 2,770,000 | 2,753,672 | |
Denver, CO, Urban Renewal Authority, Tax Increment Revenue, 9th Urban Redevelopment Area, Series A, 144A, 5.25%, 12/1/2039 | 4,895,000 | 4,926,513 | |
Douglas County, CO, Rampart Range Metropolitan District No. 5: | |||
4.0%, 12/1/2041 | 940,000 | 706,330 | |
Series 2021, 4.0%, 12/1/2051 | 3,510,000 | 2,369,881 | |
145,183,396 | |||
DWS Managed Municipal Bond Fund | | | 13 |
Principal Amount ($) | Value ($) | ||
Connecticut 1.2% | |||
Connecticut, Harbor Point Infrastructure Improvement District, Special Obligation Revenue, Harbor Point Project, 144A, 5.0%, 4/1/2039 | 12,000,000 | 11,702,383 | |
Connecticut, State General Obligation, Series C, 5.0%, 6/15/2029 | 14,690,000 | 16,316,271 | |
Connecticut, Steel Point Infrastructure Improvement District Special Obligation Revenue, Steelpointe Harbor Project: | |||
144A, 4.0%, 4/1/2041 | 360,000 | 307,037 | |
144A, 4.0%, 4/1/2051 | 1,000,000 | 796,754 | |
29,122,445 | |||
District of Columbia 1.4% | |||
District of Columbia, General Obligation, Series A, 5.0%, 6/1/2033 | 7,500,000 | 7,878,451 | |
District of Columbia, International School Revenue: | |||
5.0%, 7/1/2039 | 300,000 | 302,288 | |
5.0%, 7/1/2054 | 2,425,000 | 2,370,109 | |
District of Columbia, Latin American Montessori Bilingual Public Charter School, 5.0%, 6/1/2050 | 4,810,000 | 4,339,085 | |
District of Columbia, Two Rivers Public Charter School, Inc., 5.0%, 6/1/2055 | 5,330,000 | 5,086,986 | |
Metropolitan Washington, DC, Airports Authority System Revenue: | |||
Series A, AMT, 5.0%, 10/1/2031 | 5,355,000 | 5,621,058 | |
Series A, AMT, 5.0%, 10/1/2032 | 5,000,000 | 5,233,863 | |
Washington, DC, Convention & Sports Authority, Dedicated Tax Revenue: | |||
Series A, 5.0%, 10/1/2029 | 1,455,000 | 1,589,727 | |
Series A, 5.0%, 10/1/2030 | 1,455,000 | 1,588,337 | |
34,009,904 | |||
Florida 6.8% | |||
Broward County, FL, Airport Systems Revenue: | |||
Series A, AMT, 4.0%, 10/1/2044 | 2,140,000 | 1,966,979 | |
Series A, AMT, 4.0%, 10/1/2049 | 3,425,000 | 3,085,349 | |
AMT, 5.0%, 10/1/2042 | 10,000,000 | 10,184,211 | |
Broward County, FL, Port Facilities Revenue: | |||
AMT, 5.25%, 9/1/2047 | 1,010,000 | 1,075,877 | |
AMT, 5.5%, 9/1/2052 | 7,455,000 | 8,046,328 | |
Charlotte County, FL, Industrial Development Authority, Utility System Revenue, Town & Country Utilities Project, Series A, 144A, AMT, 4.0%, 10/1/2051, GTY: Babcock Ranch IRR LLC | 1,560,000 | 1,155,028 | |
14 | | | DWS Managed Municipal Bond Fund |
Principal Amount ($) | Value ($) | ||
Davie, FL, Educational Facilities Revenue, Nova Southeastern University Project, 5.0%, 4/1/2048 | 7,345,000 | 7,535,790 | |
Florida, Capital Project Finance Authority, Student Housing Revenue, Loan Program: | |||
Series A-1, 5.0%, 10/1/2032 | 540,000 | 543,440 | |
Series A-1, 5.0%, 10/1/2033 | 540,000 | 542,394 | |
Series A-1, 5.0%, 10/1/2034 | 545,000 | 545,288 | |
Series A-1, 5.0%, 10/1/2035 | 270,000 | 268,970 | |
Florida, Capital Trust Agency, Educational Growth Fund LLC, Charter School Portfolio Project, Series A-1, 144A, 5.0%, 7/1/2056 | 3,570,000 | 3,178,397 | |
Florida, Development Finance Corp., Educational Facilities Revenue, Mater Academy Projects: | |||
Series A, 5.0%, 6/15/2047 | 6,600,000 | 6,602,971 | |
Series A, 5.0%, 6/15/2050 | 5,170,000 | 5,143,315 | |
Series A, 5.0%, 6/15/2052 | 1,980,000 | 1,960,200 | |
Series A, 5.0%, 6/15/2056 | 3,210,000 | 3,130,678 | |
Florida, Development Finance Corp., Brightline Florida Passenger Rail Expansion Project, Series A, 144A, AMT, 7.25% (a), 7/1/2057 | 2,000,000 | 1,987,626 | |
Florida, Development Finance Corp., Educational Facilities Revenue, River City Science Academy Project: | |||
Series A-1, 5.0%, 7/1/2042 | 280,000 | 280,639 | |
Series B, 5.0%, 7/1/2042 | 295,000 | 288,885 | |
Series A-1, 5.0%, 7/1/2051 | 255,000 | 250,440 | |
Series B, 5.0%, 7/1/2051 | 420,000 | 400,381 | |
Series A-1, 5.0%, 2/1/2057 | 370,000 | 356,748 | |
Series B, 5.0%, 7/1/2057 | 440,000 | 410,892 | |
Florida, Development Finance Corp., Surface Transportation Facilities Revenue, Brightline Passenger Rail Project, Series B, 144A, AMT, 7.375%, 1/1/2049 | 3,000,000 | 2,675,166 | |
Florida, Development Finance Corp., Surface Transportation Facilities Revenue, Virgin Trains USA Passenger Rail Project: | |||
Series A, 144A, AMT, 6.375% (a), 1/1/2049 | 3,105,000 | 2,836,853 | |
Series A, 144A, AMT, 6.5% (a), 1/1/2049 | 3,400,000 | 3,061,064 | |
Florida, Higher Educational Facilities Financing Authority Revenue, Rollins College Project, Series A, 4.0%, 12/1/2050 | 15,000,000 | 13,355,769 | |
Florida, Jacksonville Electric Authority, Electric System Revenue, Series B, 4.0%, 10/1/2037 | 1,500,000 | 1,502,458 | |
Florida, State Development Finance Corp., Senior Living Revenue, The Cabana at Jensen Dunes Project, Series A, 144A, 5.25%, 11/15/2056 | 15,000,000 | 11,502,987 | |
DWS Managed Municipal Bond Fund | | | 15 |
Principal Amount ($) | Value ($) | ||
Florida, State Higher Educational Facilities Financial Authority Revenue, Florida Institute of Technology, Series A, 4.0%, 10/1/2044 | 1,000,000 | 860,838 | |
Florida, State Higher Educational Facilities Financial Authority Revenue, Jacksonville University Project, Series A-1, 144A, 4.75%, 6/1/2038 | 2,150,000 | 1,911,146 | |
Florida, State Housing Finance Corp., Revenue, Series 1, 3.5%, 7/1/2051 | 2,455,000 | 2,421,593 | |
Florida, Village Community Development District No. 12, Special Assessment Revenue: | |||
144A, 4.25%, 5/1/2043 | 8,385,000 | 7,388,032 | |
144A, 4.375%, 5/1/2050 | 7,010,000 | 6,033,205 | |
Florida, Village Community Development District No. 13, Special Assessment Revenue, Series 2021, 3.25%, 5/1/2052 | 2,280,000 | 1,407,505 | |
Florida, Village Community Development District No. 14, 5.5%, 5/1/2053 | 6,670,000 | 6,726,171 | |
Jacksonville, FL, Educational Facilities Revenue, Jacksonville University Project, Series B, 144A, 5.0%, 6/1/2053 | 3,250,000 | 2,765,613 | |
Miami-Dade County, FL, Seaport Revenue, Series B-1, AMT, 4.0%, 10/1/2046 | 6,430,000 | 5,883,874 | |
Orange County, FL, School Board, Certificates of Participation, Series C, 5.0%, 8/1/2033 | 16,610,000 | 17,550,480 | |
Pinellas County, FL, Industrial Development Authority Revenue, Foundation For Global Understanding, Inc. Project, 5.0%, 7/1/2039 | 2,000,000 | 1,944,121 | |
Tampa, FL, The University of Tampa Project, Series A, 4.0%, 4/1/2050 | 13,380,000 | 11,904,341 | |
160,672,042 | |||
Georgia 3.0% | |||
Cobb County, GA, Kennestone Hospital Authority, Revenue Anticipation Certificates, Wellstar Health System, Inc. Project: | |||
Series A, 4.0%, 4/1/2052 | 3,825,000 | 3,472,721 | |
Series A, 5.0%, 4/1/2047 | 18,135,000 | 18,275,325 | |
DeKalb County, GA, Water & Sewer Revenue: | |||
Series A, 5.25%, 10/1/2033 | 3,635,000 | 3,641,250 | |
Series A, 5.25%, 10/1/2036 | 11,115,000 | 11,130,565 | |
Series A, 5.25%, 10/1/2041 | 5,000,000 | 5,006,175 | |
Fulton County, GA, Development Authority Hospital Revenue, Revenue Anticipation Certificates, Wellstar Health System, Series A, 5.0%, 4/1/2042 | 3,155,000 | 3,205,177 | |
George L Smith II, GA, Congress Center Authority, Convention Center Hotel First Tier, Series A, 4.0%, 1/1/2054 | 815,000 | 663,372 | |
16 | | | DWS Managed Municipal Bond Fund |
Principal Amount ($) | Value ($) | ||
George L Smith II, GA, Congress Center Authority, Convention Center Hotel Second Tier, Series B, 144A, 5.0%, 1/1/2054 | 4,255,000 | 3,541,781 | |
Georgia, Glynn-Brunswick Memorial Hospital Authority, Anticipation Certificates, Southeast Georgia Health System Project, 5.0%, 8/1/2047 | 2,035,000 | 2,039,199 | |
Georgia, Main Street Natural Gas, Inc., Gas Project Revenue: | |||
Series A, 5.5%, 9/15/2023, GTY: Merrill Lynch & Co. | 5,000,000 | 5,077,677 | |
Series A, 5.5%, 9/15/2027, GTY: Merrill Lynch & Co. | 5,000,000 | 5,352,609 | |
Series A, 5.5%, 9/15/2028, GTY: Merrill Lynch & Co. | 5,000,000 | 5,398,431 | |
Georgia, Municipal Electric Authority Revenue, Project One, Series A, 5.0%, 1/1/2035 | 2,995,000 | 3,064,921 | |
69,869,203 | |||
Illinois 6.5% | |||
Chicago, IL, Board of Education: | |||
Series A, 4.0%, 12/1/2047 | 2,385,000 | 1,947,521 | |
Series A, 5.0%, 12/1/2034 | 810,000 | 808,576 | |
Series E, 6.038%, 12/1/2029 | 1,500,000 | 1,420,801 | |
Chicago, IL, General Obligation: | |||
Series A, 5.5%, 1/1/2049 | 2,535,000 | 2,571,455 | |
Series A, 6.0%, 1/1/2038 | 2,290,000 | 2,381,162 | |
Chicago, IL, O’Hare International Airport Revenue, Series A, AMT, 5.5%, 1/1/2055 | 6,395,000 | 6,732,879 | |
Chicago, IL, O’Hare International Airport, Special Facility Revenue, AMT, 5.0%, 7/1/2048 | 2,630,000 | 2,634,202 | |
Chicago, IL, Transit Authority, Sales Tax Receipts Revenue: | |||
Series A, 5.0%, 12/1/2045 | 3,700,000 | 3,803,372 | |
Series A, 5.0%, 12/1/2057 | 5,000,000 | 5,118,052 | |
Chicago, IL, Transit Authority, Sales Tax Receipts Revenue, Second Lien: | |||
Series A, 4.0%, 12/1/2050 | 3,730,000 | 3,315,985 | |
Series A, 5.0%, 12/1/2052 | 15,000,000 | 15,343,094 | |
Chicago, IL, Waterworks Revenue, 5.0%, 11/1/2023, INS: AGMC | 2,990,000 | 2,995,660 | |
Illinois, Metropolitan Pier & Exposition Authority, Dedicated State Tax Revenue, Capital Appreciation-McCormick, Series A, Zero Coupon, 6/15/2038, INS: NATL | 17,305,000 | 8,243,870 | |
Illinois, Regional Transportation Authority, Series B, 5.75%, 6/1/2033, INS: NATL | 7,000,000 | 8,151,292 | |
Illinois, State Finance Authority Revenue, Edward Elmhurst Obligated Group: | |||
Series A, Prerefunded, 5.0%, 1/1/2036 | 2,970,000 | 3,201,844 | |
DWS Managed Municipal Bond Fund | | | 17 |
Principal Amount ($) | Value ($) | ||
Series A, Prerefunded, 5.0%, 1/1/2037 | 3,965,000 | 4,290,377 | |
Illinois, State Finance Authority Revenue, Friendship Village of Schaumburg, 5.125%, 2/15/2045* (c) | 9,825,000 | 4,814,250 | |
Illinois, State Finance Authority Revenue, University of Chicago, Series A, 5.0%, 10/1/2038 | 12,000,000 | 12,397,518 | |
Illinois, State General Obligation: | |||
5.0%, 11/1/2034 | 3,500,000 | 3,578,133 | |
5.0%, 1/1/2035 | 7,575,000 | 7,707,150 | |
Series A, 5.0%, 5/1/2040 | 3,000,000 | 3,038,496 | |
Series A, 5.0%, 12/1/2042 | 5,955,000 | 6,002,989 | |
Series A, 5.0%, 5/1/2043 | 2,000,000 | 2,014,039 | |
Series A, 5.0%, 3/1/2046 | 1,995,000 | 2,002,261 | |
Series A, 5.25%, 12/1/2030 | 6,500,000 | 6,847,124 | |
Series C, 5.25%, 10/1/2046 | 6,000,000 | 6,164,307 | |
5.5%, 5/1/2039 | 7,665,000 | 8,091,019 | |
5.75%, 5/1/2045 | 4,205,000 | 4,433,817 | |
Illinois, State Toll Highway Authority, Series A, 5.0%, 1/1/2044 | 7,075,000 | 7,426,315 | |
Springfield, IL, Electric Revenue, Senior Lien, 5.0%, 3/1/2040, INS: AGMC | 5,805,000 | 6,009,787 | |
153,487,347 | |||
Indiana 1.1% | |||
Indiana, State Finance Authority Revenue, BHI Senior Living Obligated Group, 5.0%, 11/15/2053 | 20,635,000 | 18,993,637 | |
Indiana, State Finance Authority Revenue, Stadium Project, Series A, 5.25%, 2/1/2031 | 2,595,000 | 2,742,277 | |
Indiana, State Finance Authority, Health Facilities Revenue, Baptist Healthcare System, Series A, 5.0%, 8/15/2051 | 3,000,000 | 3,031,129 | |
Indiana, State Housing & Community Development Authority, Single Family Mortgage Revenue, Series C-1, 5.0%, 7/1/2053 | 1,800,000 | 1,869,257 | |
26,636,300 | |||
Iowa 0.8% | |||
Iowa, Higher Education Loan Authority, Des Moines University Project, 5.375%, 10/1/2052 | 2,265,000 | 2,342,222 | |
Iowa, State Higher Education Loan Authority Revenue, Private College Facility, Des Moines University Project, 4.0%, 10/1/2045 | 12,905,000 | 11,515,347 | |
Iowa, Tobacco Settlement Authority Revenue: | |||
Series B-2, Zero Coupon, 6/1/2065 | 4,125,000 | 452,241 | |
Series B-1, 4.0%, 6/1/2049 | 4,150,000 | 4,127,157 | |
18,436,967 | |||
18 | | | DWS Managed Municipal Bond Fund |
Principal Amount ($) | Value ($) | ||
Kentucky 0.6% | |||
Kentucky, State Economic Development Finance Authority, Owensboro Health, Inc., Obligated Group: | |||
Series A, 5.0%, 6/1/2045 | 1,275,000 | 1,280,108 | |
Series A, 5.25%, 6/1/2041 | 1,915,000 | 1,950,834 | |
Louisville & Jefferson County, KY, Metro Government Hospital Revenue, UOFL Health Project: | |||
Series A, 5.0%, 5/15/2047 | 2,440,000 | 2,480,705 | |
Series A, 5.0%, 5/15/2052 | 7,835,000 | 7,919,816 | |
13,631,463 | |||
Louisiana 0.1% | |||
Louisiana, New Orleans Aviation Board, General Airport North Terminal, Series B, AMT, 5.0%, 1/1/2048 | 2,830,000 | 2,844,807 | |
Maryland 0.3% | |||
Maryland, State Community Development Administration, Department of Housing & Community Development, Series C, 3.5%, 3/1/2050 | 2,345,000 | 2,315,779 | |
Maryland, State Economic Development Corp., Student Housing Revenue, Morgan State University Project: | |||
5.0%, 7/1/2050 | 1,305,000 | 1,287,639 | |
5.0%, 7/1/2056 | 2,195,000 | 2,145,995 | |
Series A, 5.75%, 7/1/2053 | 1,925,000 | 2,035,255 | |
7,784,668 | |||
Massachusetts 1.1% | |||
Massachusetts, State Development Finance Agency Revenue, Lesley University, Series A, 5.0%, 7/1/2049 | 2,750,000 | 2,751,354 | |
Massachusetts, State Development Finance Agency Revenue, Partners Healthcare System, Inc., Series S-1, 5.0%, 7/1/2028 | 2,700,000 | 2,959,119 | |
Massachusetts, State Development Finance Agency Revenue, Springfield College: | |||
Series B, 4.0%, 6/1/2050 | 3,900,000 | 3,328,524 | |
Series A, 4.0%, 6/1/2056 | 1,105,000 | 912,999 | |
Massachusetts, State Development Finance Agency Revenue, UMass Memorial Healthcare, Series I, 5.0%, 7/1/2036 | 1,000,000 | 1,026,710 | |
Massachusetts, State Development Financing Agency, College of the Holy Cross, Series A, 1.05% (b), 12/1/2022, LOC: Bank of America NA | 1,600,000 | 1,600,000 | |
Massachusetts, State Health & Educational Facilities Authority Revenue, Baystate Medical Center, Series J-2, 1.0% (b), 12/1/2022, LOC: TD Bank NA | 200,000 | 200,000 | |
DWS Managed Municipal Bond Fund | | | 19 |
Principal Amount ($) | Value ($) | ||
Massachusetts, State Housing Finance Agency, Single Family Housing Revenue, Series 222, 3.0%, 6/1/2051 | 13,000,000 | 12,460,999 | |
Massachusetts, State Water Resources Authority, Series A-1, 1.95% (b), 12/7/2022, SPA: JPMorgan Chase Bank NA | 100,000 | 100,000 | |
25,339,705 | |||
Michigan 0.9% | |||
Michigan, State Finance Authority Ltd. Obligation Revenue, Albion College: | |||
4.0%, 12/1/2046 | 1,710,000 | 1,472,994 | |
4.0%, 12/1/2051 | 1,745,000 | 1,460,746 | |
Michigan, State Finance Authority Revenue, Michigan Finance Authority Tobacco Settlement Revenue, “1” , Series A, 4.0%, 6/1/2049 | 10,740,000 | 8,897,489 | |
Michigan, State Strategic Fund Ltd., Obligation Revenue, Graphic International LLC, Coated Recycled Board Machine Project, AMT, 4.0% (a), 10/1/2061 | 2,665,000 | 2,577,492 | |
Michigan, Strategic Fund, 75 Improvement P3 Project, AMT, 5.0%, 6/30/2048 | 5,800,000 | 5,592,191 | |
20,000,912 | |||
Minnesota 1.0% | |||
Duluth, MN, Economic Development Authority, Health Care Facilities Revenue, Essentia Health Obligated Group: | |||
Series A, 5.0%, 2/15/2048 | 5,000,000 | 5,050,704 | |
Series A, 5.0%, 2/15/2053 | 14,060,000 | 14,132,159 | |
Minnesota, State Trunk Highway, Series B, 4.0%, 8/1/2032 | 5,000,000 | 5,255,353 | |
24,438,216 | |||
Missouri 0.4% | |||
Missouri, State Health & Educational Facilities Authority Revenue, Lutheran Senior Services Projects, Series B, 5.0%, 2/1/2046 | 2,460,000 | 2,305,935 | |
Missouri, State Health & Educational Facilities Authority Revenue, Medical Research, Lutheran Senior Services: | |||
4.0%, 2/1/2042 | 2,640,000 | 2,131,248 | |
Series A, 5.0%, 2/1/2046 | 3,285,000 | 3,079,267 | |
Missouri, State Housing Development Commission, Single Family Mortgage Revenue, First Homeownership Loan Program, Series B, 4.0%, 5/1/2050 | 2,960,000 | 2,962,204 | |
10,478,654 | |||
20 | | | DWS Managed Municipal Bond Fund |
Principal Amount ($) | Value ($) | ||
Nebraska 0.2% | |||
Douglas County, NE, Hospital Authority No.2, Health Facilities, Children’s Hospital Obligated Group, 5.0%, 11/15/2047 | 5,205,000 | 5,300,791 | |
Nevada 0.2% | |||
Reno, NV, Sales Tax Revenue, Transportation Rail Access, Series C, 144A, Zero Coupon, 7/1/2058 | 41,500,000 | 4,905,860 | |
New Jersey 3.6% | |||
Hudson County, NJ, Improvement Authority Revenue, Hudson County Courthouse Project, 4.0%, 10/1/2051 | 11,500,000 | 10,827,158 | |
New Jersey, State Covid-19 General Obligation Emergency Bonds, Series A, 4.0%, 6/1/2031 | 1,245,000 | 1,319,570 | |
New Jersey, State Economic Development Authority Revenue, Series BBB, Prerefunded, 5.5%, 6/15/2030 | 16,440,000 | 18,272,725 | |
New Jersey, State Economic Development Authority Revenue, Private Activity, The Goethals Bridge Replacement Project, AMT, 5.0%, 1/1/2031, INS: AGMC | 4,000,000 | 4,016,944 | |
New Jersey, State Economic Development Authority, State Government Buildings Project: | |||
Series A, 5.0%, 6/15/2042 | 2,885,000 | 2,946,799 | |
Series A, 5.0%, 6/15/2047 | 3,205,000 | 3,257,916 | |
New Jersey, State Higher Education Assistance Authority, Student Loan Revenue, Series B, AMT, 2.5%, 12/1/2040 | 2,080,000 | 1,694,142 | |
New Jersey, State Housing & Mortgage Finance Agency, Single Family Housing Revenue, Series I, 5.0%, 10/1/2053 | 2,665,000 | 2,767,643 | |
New Jersey, State Transportation Trust Fund Authority, Transportation Program, Series CC, 5.5%, 6/15/2050 (d) | 4,500,000 | 4,831,624 | |
New Jersey, State Transportation Trust Fund Authority, Transportation Systems: | |||
Series AA, 4.0%, 6/15/2050 | 5,820,000 | 5,250,122 | |
Series A, 5.0%, 12/15/2034 | 9,280,000 | 9,856,310 | |
Series A, 5.0%, 12/15/2036 | 2,385,000 | 2,499,781 | |
New Jersey, Tobacco Settlement Financing Corp., Series A, 5.25%, 6/1/2046 | 7,900,000 | 7,959,937 | |
South Jersey, NJ, Transportation Authority System Revenue: | |||
Series A, 4.0%, 11/1/2050 | 2,000,000 | 1,753,972 | |
Series A, 5.0%, 11/1/2045 | 3,000,000 | 3,092,861 | |
Series A, 5.25%, 11/1/2052 | 3,200,000 | 3,339,229 | |
83,686,733 | |||
DWS Managed Municipal Bond Fund | | | 21 |
Principal Amount ($) | Value ($) | ||
New Mexico 0.8% | |||
New Mexico, State Finance Authority Revenue, Public Project Revolving Fund: | |||
Series A, 4.0%, 6/1/2029 | 5,765,000 | 6,119,750 | |
Series A, 4.0%, 6/1/2030 | 5,795,000 | 6,102,763 | |
New Mexico, State Mortgage Finance Authority, Series A, 3.5%, 1/1/2051 | 3,325,000 | 3,279,212 | |
New Mexico, State Mortgage Finance Authority, Single Family Mortgage Revenue, “I” , Series D, 3.75%, 1/1/2050 | 3,075,000 | 3,056,448 | |
18,558,173 | |||
New York 14.2% | |||
Dutchess County, NY, Local Development Corp., Bard College Project, Series A, 144A, 5.0%, 7/1/2051 | 820,000 | 743,741 | |
New York, Genesee County Funding Corp., Rochester Regional Health Obligation, Series A, 5.25%, 12/1/2052 | 2,000,000 | 2,034,945 | |
New York, Metropolitan Transportation Authority Revenue, Series D, 5.0%, 11/15/2038 | 13,635,000 | 13,670,347 | |
New York, Metropolitan Transportation Authority, Dedicated Tax Fund, Climate Board Certified Green Bond, Series B-2, 5.0%, 11/15/2034 | 10,940,000 | 11,812,740 | |
New York, State Dormitory Authority Revenues, Non-State Supported Debt, The New School: | |||
Series A, 4.0%, 7/1/2047 | 1,000,000 | 869,996 | |
Series A, 4.0%, 7/1/2052 | 1,175,000 | 999,978 | |
New York, State Dormitory Authority, Personal Income Tax Revenue: | |||
Series B, 5.0%, 2/15/2035 | 29,990,000 | 31,157,970 | |
Series B, Prerefunded, 5.0%, 2/15/2035 | 10,000 | 10,501 | |
Series A, 5.0%, 2/15/2039 | 3,945,000 | 4,143,893 | |
Series A, Prerefunded, 5.0%, 2/15/2039 | 5,000 | 5,455 | |
New York, State Dormitory Authority, Sales Tax Revenue, Series A, 5.0%, 3/15/2036 | 5,000,000 | 5,400,850 | |
New York, State Power Authority Revenue: | |||
Series A, 4.0%, 11/15/2045 | 5,825,000 | 5,696,694 | |
Series A, 4.0%, 11/15/2050 | 5,000,000 | 4,808,680 | |
New York, State Thruway Authority: | |||
Series O, Group 1, 4.0%, 1/1/2040 | 10,000,000 | 9,736,281 | |
Series O, Group 1, 4.0%, 1/1/2041 | 15,285,000 | 14,721,355 | |
Series N, Group 2, 4.0%, 1/1/2044 | 5,000,000 | 4,789,852 | |
New York, State Thruway Authority General Revenue, Junior Indebtedness Obligation, Series B, 4.0%, 1/1/2040, INS: AGMC | 12,715,000 | 12,716,540 | |
22 | | | DWS Managed Municipal Bond Fund |
Principal Amount ($) | Value ($) | ||
New York, State Transportation Development Corp., Special Facilities Revenue, Delta Air Lines, Inc., LaGuardia Airport C&D Redevelopment: | |||
AMT, 5.0%, 1/1/2033 | 2,045,000 | 2,071,440 | |
AMT, 5.0%, 10/1/2035 | 3,705,000 | 3,740,604 | |
New York, State Transportation Development Corp., Special Facilities Revenue, John F. Kennedy International Airport Project, AMT, 3.0%, 8/1/2031, GTY: American Airlines Group, Inc. | 1,000,000 | 894,613 | |
New York, State Transportation Development Corp., Special Facilities Revenue, Laguardia Gateway Partners LLC, Redevelopment Project: | |||
Series A, AMT, 5.0%, 7/1/2041 | 6,660,000 | 6,674,495 | |
Series A, AMT, 5.0%, 7/1/2046 | 9,940,000 | 9,874,319 | |
New York, State Transportation Development Corp., Special Facilities Revenue, Terminal 4 John F. Kennedy, International Project, AMT, 5.0%, 12/1/2041 | 3,210,000 | 3,174,083 | |
New York, State Urban Development Corp. Revenue, State Personal Income Tax: | |||
Series A, 5.0%, 3/15/2031 | 4,600,000 | 4,966,407 | |
Series C, 5.0%, 3/15/2047 | 8,300,000 | 8,851,101 | |
New York, Triborough Bridge & Tunnel Authority Revenue, MTA Bridges And Tunnels: | |||
Series A, 4.0%, 11/15/2054 | 5,000,000 | 4,589,875 | |
Series A, 5.0%, 11/15/2049 | 5,155,000 | 5,474,097 | |
Series A, 5.0%, 5/15/2051 | 4,240,000 | 4,523,627 | |
New York, TSASC, Inc., Series A, 5.0%, 6/1/2041 | 1,195,000 | 1,209,283 | |
New York City, NY, Municipal Water Finance Authority, Water & Sewer System Revenue, Second General Resolution, Series DD, 1.96% (b), 12/1/2022 | 3,200,000 | 3,200,000 | |
New York City, NY, Municipal Water Finance Authority, Water & Sewer Systems Revenue: | |||
Series EE-2, 1.05% (b), 12/1/2022, LIQ: State Street B&T Co. | 50,000 | 50,000 | |
Series AA-1, 4.0%, 6/15/2051 | 10,460,000 | 9,914,686 | |
Series DD, 5.0%, 6/15/2036 | 6,000,000 | 6,146,082 | |
Series GG-1, 5.0%, 6/15/2050 | 10,000,000 | 10,635,112 | |
Series AA-1, 5.25%, 6/15/2052 | 7,500,000 | 8,265,014 | |
New York City, NY, Transitional Finance Authority Revenue, Future Tax Secured: | |||
Series D-1, 5.0%, 2/1/2038 | 12,000,000 | 12,199,669 | |
Series D-1, 5.25%, 11/1/2040 | 5,000,000 | 5,602,749 | |
Series D-1, 5.5%, 11/1/2045 | 15,000,000 | 17,090,073 | |
New York City, NY, Transitional Finance Authority, Building Aid Revenue, Series S-3, 5.0%, 7/15/2031 | 4,000,000 | 4,430,563 | |
DWS Managed Municipal Bond Fund | | | 23 |
Principal Amount ($) | Value ($) | ||
New York City, NY, Transitional Finance Authority, Building Aid Revenue, Fiscal 2018, Series S-1, 5.0%, 7/15/2035 | 2,800,000 | 3,021,031 | |
New York, NY, General Obligation: | |||
Series B-3, 1.96% (b), 12/1/2022 | 9,040,000 | 9,040,000 | |
Series 3, 2.1% (b), 12/1/2022 | 500,000 | 500,000 | |
Series B-1, 5.0%, 12/1/2031 | 2,000,000 | 2,150,090 | |
Series B-1, 5.25%, 10/1/2047 | 3,000,000 | 3,320,611 | |
Port Authority of New York & New Jersey: | |||
Series 207, AMT, 5.0%, 9/15/2029 | 8,000,000 | 8,499,152 | |
Series 207, AMT, 5.0%, 9/15/2030 | 20,000,000 | 21,227,722 | |
Series 207, AMT, 5.0%, 9/15/2031 | 6,950,000 | 7,360,425 | |
Triborough, NY, Bridge & Tunnel Authority Sales Tax Revenue: | |||
Series A, 5.25%, 5/15/2052 | 8,000,000 | 8,789,770 | |
Series A, 5.25%, 5/15/2057 | 12,000,000 | 13,184,654 | |
333,991,165 | |||
North Carolina 0.5% | |||
North Carolina, State Housing Finance Agency: | |||
Series 47, 3.0%, 7/1/2051 | 7,965,000 | 7,682,218 | |
Series 42, 4.0%, 1/1/2050 | 4,610,000 | 4,613,849 | |
12,296,067 | |||
Ohio 3.7% | |||
Buckeye, OH, Tobacco Settlement Financing Authority: | |||
“1", Series A, 4.0%, 6/1/2048 | 9,975,000 | 8,691,172 | |
“2", Series B-2, 5.0%, 6/1/2055 | 8,970,000 | 8,231,116 | |
Chillicothe, OH, Hospital Facilities Revenue, Adena Health System Obligated Group Project, 5.0%, 12/1/2047 | 6,035,000 | 6,115,259 | |
Hamilton County, OH, Health Care Revenue, Life Enriching Communities Project: | |||
5.0%, 1/1/2036 | 975,000 | 942,255 | |
5.0%, 1/1/2046 | 2,790,000 | 2,547,550 | |
Ohio, Akron, Bath & Copley Joint Township Hospital District Revenue, 5.25%, 11/15/2046 | 7,380,000 | 7,464,227 | |
Ohio, Akron, Bath & Copley Joint Township Hospital District Revenue, Children’s Hospital Medical Center of Akron, Prerefunded, 5.0%, 11/15/2038 | 5,000,000 | 5,053,963 | |
Ohio, State Hospital Revenue, Aultman Health Foundation: | |||
144A, 5.0%, 12/1/2038 | 7,750,000 | 7,082,738 | |
144A, 5.0%, 12/1/2048 | 7,500,000 | 6,508,777 | |
Ohio, State Housing Finance Agency, Residential Mortgage Revenue, Series B, 4.5%, 3/1/2050 | 4,070,000 | 4,124,013 | |
24 | | | DWS Managed Municipal Bond Fund |
Principal Amount ($) | Value ($) | ||
Ohio, State Housing Finance Agency, Residential Mortgage Revenue, First Time Homebuyer Program, Series A, 3.75%, 9/1/2050 | 3,305,000 | 3,279,972 | |
Ohio, State Turnpike Commission, Infrastructure Projects: | |||
Series A-1, 5.25%, 2/15/2030 | 4,620,000 | 4,646,290 | |
Series A-1, 5.25%, 2/15/2031 | 9,375,000 | 9,428,347 | |
Series A-1, 5.25%, 2/15/2032 | 7,500,000 | 7,542,678 | |
Ohio, State Turnpike Commission, Junior Lien, Infrastructure Projects, Series A, 5.0%, 2/15/2039 | 3,890,000 | 4,393,071 | |
86,051,428 | |||
Oklahoma 0.9% | |||
Oklahoma, State Development Finance Authority, Health System Revenue, OU Medicine Project: | |||
Series B, 5.25%, 8/15/2048 | 5,070,000 | 4,522,938 | |
Series A, 5.5%, 8/15/2041 | 3,020,000 | 2,876,557 | |
Series A, 5.5%, 8/15/2044 | 3,205,000 | 3,022,785 | |
Oklahoma, State Turnpike Authority Revenue, Series E, 4.0%, 1/1/2031 | 6,375,000 | 6,574,931 | |
Oklahoma, Water & Sewer Revenue, McGee Creek Authority, 6.0%, 1/1/2023, INS: NATL | 2,960,000 | 2,966,462 | |
19,963,673 | |||
Pennsylvania 5.1% | |||
Franklin County, PA, Industrial Development Authority Revenue, Menno Haven, Inc. Project: | |||
5.0%, 12/1/2043 | 665,000 | 558,957 | |
5.0%, 12/1/2054 | 1,825,000 | 1,452,109 | |
Lancaster County, PA, Hospital Authority Revenue, University of Pennsylvania Health System Obligated Group, 5.0%, 8/15/2042 | 2,100,000 | 2,175,201 | |
Pennsylvania, Certificate of Participations, Series A, 5.0%, 7/1/2043 | 1,115,000 | 1,175,358 | |
Pennsylvania, Commonwealth Financing Authority Revenue, Series A, 5.0%, 6/1/2033 | 5,000,000 | 5,222,807 | |
Pennsylvania, Commonwealth Financing Authority, Tobacco Master Settlement Payment Revenue Bonds: | |||
5.0%, 6/1/2027 | 1,290,000 | 1,394,521 | |
5.0%, 6/1/2028 | 1,290,000 | 1,415,052 | |
5.0%, 6/1/2029 | 1,290,000 | 1,412,669 | |
5.0%, 6/1/2030 | 855,000 | 935,332 | |
5.0%, 6/1/2031 | 865,000 | 944,117 | |
Pennsylvania, Geisinger Authority Health System Revenue, Series A-2, 5.0%, 2/15/2034 | 3,000,000 | 3,143,434 | |
DWS Managed Municipal Bond Fund | | | 25 |
Principal Amount ($) | Value ($) | ||
Pennsylvania, State General Obligation, Series D, 5.0%, 8/15/2032 | 5,000,000 | 5,262,047 | |
Pennsylvania, State Housing Finance Agency, Single Family Mortgage Revenue: | |||
Series 136, 3.0%, 10/1/2051 | 5,727,810 | 5,574,571 | |
Series 132A, 3.5%, 4/1/2051 | 2,235,000 | 2,214,901 | |
Pennsylvania, State Turnpike Commission Revenue: | |||
Series B, 4.0%, 12/1/2046 | 10,250,000 | 9,780,764 | |
Series B, 5.0%, 6/1/2033 | 12,000,000 | 12,515,406 | |
Series A-1, 5.0%, 12/1/2040 | 5,000,000 | 5,132,033 | |
Series B-1, 5.0%, 6/1/2042 | 6,950,000 | 7,158,690 | |
Series A, 5.0%, 12/1/2044 | 20,335,000 | 21,150,006 | |
Series B, 5.0%, 12/1/2051 | 4,335,000 | 4,546,095 | |
Series B, 5.25%, 12/1/2052 (d) | 4,050,000 | 4,351,292 | |
Southeastern, PA, Transportation Authority Revenue, 5.25%, 6/1/2052 | 20,000,000 | 21,801,680 | |
119,317,042 | |||
South Carolina 2.3% | |||
Lexington County, SC, Health Services District, Lexington Medical Center, 5.0%, 11/1/2041 | 2,500,000 | 2,542,804 | |
South Carolina, State Public Service Authority Revenue: | |||
Series B, 4.0%, 12/1/2047 | 7,270,000 | 6,404,166 | |
Series A, 4.0%, 12/1/2052 | 12,640,000 | 10,844,581 | |
Series A, 5.0%, 12/1/2033 | 4,400,000 | 4,563,365 | |
Series A, 5.0%, 12/1/2036 | 4,780,000 | 4,889,118 | |
South Carolina, State Public Service Authority Revenue, Santee Cooper, Series A, Prerefunded, 5.75%, 12/1/2043 | 8,000,000 | 8,247,512 | |
South Carolina, State Transportation Infrastructure Bank Revenue, 5.0%, 10/1/2038 | 15,130,000 | ���16,143,521 | |
53,635,067 | |||
South Dakota 0.3% | |||
South Dakota, State Health & Educational Facilities Authority Revenue, Avera Health, 5.0%, 7/1/2046 | 6,140,000 | 6,155,198 | |
Tennessee 0.7% | |||
Metropolitan Nashville, TN, Airport Authority Revenue: | |||
Series B, AMT, 4.0%, 7/1/2049 | 4,000,000 | 3,560,507 | |
Series B, AMT, 4.0%, 7/1/2054 | 10,045,000 | 8,707,482 | |
Series B, AMT, 5.5%, 7/1/2052 (d) | 3,250,000 | 3,467,600 | |
15,735,589 | |||
26 | | | DWS Managed Municipal Bond Fund |
Principal Amount ($) | Value ($) | ||
Texas 10.1% | |||
Aubrey, TX, Independent School District, Series 2022, 4.0%, 2/15/2052 | 6,025,000 | 5,801,814 | |
Central Texas, Regional Mobility Authority Revenue, Senior Lien: | |||
Series A, Prerefunded, 5.0%, 1/1/2040 | 4,730,000 | 5,011,098 | |
Series E, 5.0%, 1/1/2045 | 1,500,000 | 1,567,219 | |
Clifton, TX, Higher Education Finance Corp., Education Revenue, Series D, 6.125%, 8/15/2048 | 11,465,000 | 11,664,567 | |
Greater Texas, Cultural Education Facilities Finance Corp. Lease Revenue, Epicenter Multipurpose Facilities Project: | |||
Series A, 4.0%, 3/1/2046 | 2,145,000 | 1,956,997 | |
Series A, 4.0%, 3/1/2050 | 5,055,000 | 4,521,530 | |
Houston, TX, Hotel Occupancy Tax & Special Revenue, Convention & Entertainment Facilities Department: | |||
5.0%, 9/1/2029 | 1,000,000 | 1,088,379 | |
5.0%, 9/1/2030 | 1,000,000 | 1,087,801 | |
5.0%, 9/1/2031 | 850,000 | 922,967 | |
Houston, TX, Utility Systems Revenue, First Lien, Series A, 5.0%, 11/15/2033 | 2,475,000 | 2,803,792 | |
Humble, TX, Independent School District, 5.0%, 2/15/2047 | 9,750,000 | 10,691,985 | |
Lower Colorado River, TX, Transmission Contract Authority Revenue, LCRA Transmission Services Corp., Project: | |||
5.0%, 5/15/2045 | 1,500,000 | 1,560,335 | |
5.0%, 5/15/2050 | 2,500,000 | 2,584,166 | |
Newark, TX, Higher Education Finance Corp., Texas Revenue, Abilene Christian University Project, Series A, 4.0%, 4/1/2057 | 15,000,000 | 12,781,249 | |
North Texas, Tollway Authority Revenue, Series A, 4.125%, 1/1/2040 | 7,500,000 | 7,467,706 | |
San Antonio, TX, Education Facilities Corp. Higher Education Revenue, Hallmark University Project: | |||
Series A, 5.0%, 10/1/2041 | 435,000 | 376,131 | |
Series A, 5.0%, 10/1/2051 | 645,000 | 524,633 | |
San Antonio, TX, Education Facilities Corp. Revenue, University of the Incarnate Word Project: | |||
Series A, 4.0%, 4/1/2046 | 1,525,000 | 1,256,276 | |
Series A, 4.0%, 4/1/2051 | 5,500,000 | 4,375,756 | |
Series A, 4.0%, 4/1/2054 | 785,000 | 610,412 | |
San Antonio, TX, Electric & Gas Systems Revenue, 4.0%, 2/1/2032 | 7,000,000 | 7,213,900 | |
DWS Managed Municipal Bond Fund | | | 27 |
Principal Amount ($) | Value ($) | ||
Tarrant County, TX, Cultural Education Facilities Finance Corp. Revenue, Christus Health Obligated Group, Series B, 5.0%, 7/1/2048 | 25,000,000 | 25,449,920 | |
Tarrant County, TX, Cultural Education Facilities Finance Corp., Hospital Revenue, Baylor Scott & White Healthcare, Series D, 5.5%, 11/15/2047 | 8,550,000 | 9,521,268 | |
Tarrant County, TX, Cultural Education Facilities Finance Corp., Hospital Revenue, Scott & White Healthcare, Prerefunded, 5.0%, 8/15/2043 | 9,900,000 | 10,072,055 | |
Texas, Grand Parkway Transportation Corp., System Toll Revenue, First Tier, Series C, 4.0%, 10/1/2049 | 5,000,000 | 4,561,112 | |
Texas, New Hope Cultural Education Facilities Finance Corp., Educational Revenue, Cumberland Academy Project, Series A, 144A, 5.0%, 8/15/2050 | 4,250,000 | 3,810,567 | |
Texas, New Hope Cultural Education Facilities Finance Corp., Retirement Facilities Revenue, Westminster Project: | |||
4.0%, 11/1/2049 | 1,070,000 | 826,011 | |
4.0%, 11/1/2055 | 1,225,000 | 908,389 | |
Texas, New Hope Cultural Education Facilities Finance Corp., Senior Living Revenue, Bridgemoor Plano Project, Series A, 7.25%, 12/1/2053* (c) | 4,605,000 | 4,144,500 | |
Texas, Private Activity Bond, Surface Transportation Corp. Revenue, Senior Lien Revenue, Infrastructure Group LLC, I-635 Managed Lanes Project: | |||
Series A, 4.0%, 6/30/2038 | 1,145,000 | 1,058,290 | |
Series A, 4.0%, 12/31/2038 | 1,145,000 | 1,056,404 | |
Series A, 4.0%, 6/30/2039 | 875,000 | 801,912 | |
Series A, 4.0%, 12/31/2039 | 1,010,000 | 923,961 | |
Series A, 4.0%, 6/30/2040 | 815,000 | 738,128 | |
Texas, Private Activity Bond, Surface Transportation Corp. Revenue, Senior Lien, North Mobility Partners Segments LLC, AMT, 5.0%, 6/30/2058 | 13,500,000 | 13,410,537 | |
Texas, SA Energy Acquisition Public Facility Corp., Gas Supply Revenue, 5.5%, 8/1/2025, GTY: Goldman Sachs Group, Inc. | 2,750,000 | 2,849,215 | |
Texas, State College Student Loan, AMT, 5.5%, 8/1/2028 | 5,620,000 | 6,076,658 | |
Texas, State Municipal Gas Acquisition & Supply Corp. I, Gas Supply Revenue, Series D, 6.25%, 12/15/2026, GTY: Merrill Lynch & Co. | 11,020,000 | 11,516,501 | |
Texas, State Transportation Commission, Turnpike Systems Revenue, Series C, 5.0%, 8/15/2034 | 14,410,000 | 14,698,304 | |
Texas, State Water Development Board Revenue, State Water Implementation Revenue Fund: | |||
Series B, 4.0%, 10/15/2033 | 20,000,000 | 20,941,088 | |
28 | | | DWS Managed Municipal Bond Fund |
Principal Amount ($) | Value ($) | ||
Series B, 4.0%, 10/15/2036 | 10,000,000 | 10,303,953 | |
Series B, 4.0%, 10/15/2037 | 7,000,000 | 7,171,811 | |
236,709,297 | |||
Utah 1.5% | |||
Salt Lake City, UT, Airport Revenue: | |||
Series A, AMT, 4.0%, 7/1/2051 | 10,200,000 | 9,113,418 | |
Series A, AMT, 5.0%, 7/1/2032 | 5,000,000 | 5,289,067 | |
Series A, AMT, 5.0%, 7/1/2042 | 13,440,000 | 13,687,463 | |
Series A, AMT, 5.0%, 7/1/2043 | 3,850,000 | 3,928,144 | |
Series A, AMT, 5.0%, 7/1/2048 | 2,310,000 | 2,336,123 | |
Utah, State Telecommunication Open Infrastructure Agency Sales Tax and Telecommunications Revenue, 5.5%, 6/1/2040 (d) | 1,400,000 | 1,575,156 | |
35,929,371 | |||
Virginia 3.1% | |||
Stafford County, VA, Economic Development Authority, Hospital Facilities Revenue, Mary Washington Healthcare: | |||
5.0%, 10/1/2042 | 895,000 | 947,010 | |
5.0%, 10/1/2047 | 3,035,000 | 3,176,837 | |
5.0%, 10/1/2052 | 3,900,000 | 4,045,297 | |
Virginia, Small Business Financing Authority Revenue, 95 Express Lanes LLC Project, AMT, 4.0%, 1/1/2048 | 4,010,000 | 3,351,674 | |
Virginia, Small Business Financing Authority, Elizabeth River Crossings OPCO LLC Project, AMT, 4.0%, 1/1/2039 | 4,275,000 | 3,952,356 | |
Virginia, Small Business Financing Authority, I-495 Hot Lanes Project: | |||
AMT, 5.0%, 12/31/2052 | 3,625,000 | 3,724,429 | |
AMT, 5.0%, 12/31/2057 | 1,560,000 | 1,596,482 | |
Virginia, Small Business Financing Authority, Private Activity Revenue, Transform 66 P3 Project, AMT, 5.0%, 12/31/2052 | 13,345,000 | 13,323,816 | |
Virginia, State College Building Authority, Educational Facilities Revenue, 21st Century, Series A, 4.0%, 2/1/2031 | 15,145,000 | 15,603,569 | |
Virginia, State College Building Authority, Educational Facilities Revenue, Public Higher Education, Series A, 4.0%, 9/1/2031 | 4,710,000 | 4,861,265 | |
Virginia, State College Building Authority, Educational Facilities Revenue, Regent University Project, 4.0%, 6/1/2046 | 2,420,000 | 2,017,766 | |
DWS Managed Municipal Bond Fund | | | 29 |
Principal Amount ($) | Value ($) | ||
Virginia, State Commonwealth Transportation Board Revenue, Series A, 5.0%, 5/15/2031 | 5,120,000 | 5,657,000 | |
Virginia, State Public Building Authority, Public Facility Revenue, Series B, AMT, 4.0%, 8/1/2039 | 9,700,000 | 9,828,578 | |
72,086,079 | |||
Washington 4.2% | |||
King County, WA, School District No. 412 Shoreline, 5.0%, 12/1/2031 | 14,345,000 | 16,037,631 | |
Port of Seattle, WA, Revenue Bonds: | |||
Series A, AMT, 5.0%, 5/1/2029 | 8,280,000 | 8,770,693 | |
Series A, AMT, 5.0%, 5/1/2030 | 6,200,000 | 6,551,846 | |
Series A, AMT, 5.0%, 5/1/2031 | 9,200,000 | 9,691,368 | |
AMT, 5.0%, 8/1/2047 | 2,000,000 | 2,061,998 | |
AMT, 5.5%, 8/1/2047 | 1,500,000 | 1,615,399 | |
Spokane County, WA, School District No. 81, Series B, 4.0%, 12/1/2030 | 13,000,000 | 13,721,906 | |
Washington, State Convention Center Public Facilities District: | |||
Series B, 3.0%, 7/1/2043 | 4,665,000 | 3,305,729 | |
Series B, 3.0%, 7/1/2048 | 9,170,000 | 5,989,493 | |
Series B, 3.0%, 7/1/2058 | 4,630,000 | 2,764,336 | |
Washington, State Health Care Facilities Authority, CommonSpirit Health Obligation Group, Series A-2, 5.0%, 8/1/2044 | 17,700,000 | 17,939,095 | |
Washington, State Higher Educational Facilities Authority, Seattle University Project, 4.0%, 5/1/2050 | 4,350,000 | 3,883,409 | |
Washington, State Housing Finance Commission, Non-Profit Housing Revenue, Rockwood Retirement Communities Project, 144A, 5.0%, 1/1/2055 | 9,010,000 | 6,523,747 | |
98,856,650 | |||
West Virginia 1.7% | |||
West Virginia, Marshall University Revenue, Improvement & Refunding Bonds, Series A, 4.0%, 5/1/2050, INS: AGMC | 9,150,000 | 8,699,747 | |
West Virginia, State Economic Development Authority, Solid Waste Disposal Facility, Arch Resources Project, Series A, AMT, 4.125% (a), 7/1/2045 | 3,900,000 | 3,804,409 | |
West Virginia, State Hospital Finance Authority, State University Health System Obligated Group: | |||
Series A, 5.0%, 6/1/2042 | 10,085,000 | 10,251,605 | |
Series A, 5.0%, 6/1/2047 | 10,035,000 | 10,140,249 | |
West Virginia, State Parkways Authority, Senior Lien, Trunpike Toll Revenue, 4.0%, 6/1/2051 | 6,765,000 | 6,398,168 | |
39,294,178 | |||
30 | | | DWS Managed Municipal Bond Fund |
Principal Amount ($) | Value ($) | ||
Wisconsin 1.8% | |||
Wisconsin, Public Finance Authority Educational Facility Revenue, Noorba College of Osteopathic Media Project, Series B, 144A, 6.5%, 6/1/2045 | 10,000,000 | 7,956,652 | |
Wisconsin, Public Finance Authority, Green Bond, Fargo Moorhead, AMT, 4.0%, 3/31/2056 | 7,995,000 | 6,096,673 | |
Wisconsin, Public Finance Authority, Roseman University of Health Sciences Project: | |||
144A, 4.0%, 4/1/2042 | 495,000 | 391,240 | |
144A, 4.0%, 4/1/2052 | 845,000 | 612,102 | |
Wisconsin, Public Finance Authority, Senior Living Community First Mortgage Revenue, Cedars Obligated Group: | |||
144A, 5.5%, 5/1/2039 | 1,235,000 | 1,075,393 | |
144A, 5.75%, 5/1/2054 | 3,950,000 | 3,316,922 | |
Wisconsin, Public Finance Authority, Wisconsin Hotel Revenue, Senior Lien Grand Hyatt San Antonio Hotel: | |||
Series A, 5.0%, 2/1/2062 | 8,750,000 | 7,963,848 | |
Series B, 144A, 6.0%, 2/1/2062 | 5,000,000 | 4,730,209 | |
Wisconsin, Public Financing Authority, Retirement Facilities Revenue, Southminster, Inc.: | |||
144A, 5.0%, 10/1/2043 | 1,560,000 | 1,354,054 | |
144A, 5.0%, 10/1/2048 | 11,840,000 | 9,954,023 | |
43,451,116 | |||
Guam 0.0% | |||
Guam, Government Waterworks Authority, Water & Wastewater System Revenue, Series A, 5.0%, 1/1/2050 | 1,090,000 | 1,095,095 | |
Puerto Rico 0.9% | |||
Puerto Rico, General Obligation: | |||
Series A1, 4.0%, 7/1/2037 | 1,690,325 | 1,412,728 | |
Series A1, 4.0%, 7/1/2041 | 2,613,626 | 2,100,641 | |
Series A1, 4.0%, 7/1/2046 | 1,097,810 | 847,892 | |
Puerto Rico, Sales Tax Financing Corp., Sales Tax Revenue: | |||
Series A-1, Zero Coupon, 7/1/2046 | 44,849,000 | 11,303,074 | |
Series A-1, 5.0%, 7/1/2058 | 7,000,000 | 6,641,675 | |
22,306,010 | |||
Total Municipal Investments (Cost $2,355,157,741) | 2,282,533,610 | ||
DWS Managed Municipal Bond Fund | | | 31 |
Principal Amount ($) | Value ($) | ||
Underlying Municipal Bonds of Inverse Floaters (e) 0.5% | |||
New York | |||
New York, State Thruway Authority, Personal Income Tax Revenue, Series A, 5.0%, 3/15/2048 (f) (Cost $11,160,573) | 10,000,000 | 10,738,928 | |
Trust: New York, NY, State Thruway Authority, Personal Income Tax Revenue, Series 2022-XM1029, 144A, 12.74%, 3/15/2030, Leverage Factor at purchase date: 4 to 1 | |||
Corporate Bonds 0.4% | |||
Consumer Discretionary | |||
Grand Canyon University, 5.125%, 10/1/2028 (Cost $10,835,000) | 10,835,000 | 10,052,713 | |
Shares | Value ($) | ||
Closed-End Investment Companies 0.4% | |||
Nuveen Quality Municipal Income Fund (Cost $10,046,847) | 744,000 | 8,823,840 | |
Open-End Investment Companies 0.8% | |||
BlackRock Liquidity Funds MuniCash Portfolio, Institutional Shares, 1.8% (g) (Cost $19,949,272) | 19,948,260 | 19,950,255 | |
% of Net Assets | Value ($) | ||
Total Investment Portfolio (Cost $2,407,149,433) | 99.1 | 2,332,099,346 | |
Floating Rate Notes | (0.3) | (7,500,000) | |
Other Assets and Liabilities, Net | 1.2 | 28,289,608 | |
Net Assets | 100.0 | 2,352,888,954 | |
* | Non-income producing security. |
(a) | Variable or floating rate security. These securities are shown at their current rate as of November 30, 2022. For securities based on a published reference rate and spread, the reference rate and spread are indicated within the description above. Certain variable rate securities are not based on a published reference rate and spread but adjust periodically based on current market conditions, prepayment of underlying positions and/or other variables. Securities with a floor or ceiling feature are disclosed at the inherent rate, where applicable. |
32 | | | DWS Managed Municipal Bond Fund |
(b) | Variable rate demand notes and variable rate demand preferred shares are securities whose interest rates are reset periodically (usually daily mode or weekly mode) by remarketing agents based on current market levels, and are not directly set as a fixed spread to a reference rate. These securities may be redeemed at par by the holder through a put or tender feature, and are shown at their current rates as of November 30, 2022. Date shown reflects the earlier of demand date or stated maturity date. |
(c) | Defaulted security or security for which income has been deemed uncollectible. |
(d) | When-issued security. |
(e) | Securities represent the underlying municipal obligations of inverse floating rate obligations held by the Fund. The Floating Rate Notes represents leverage to the Fund and is the amount owed to the floating rate note holders. |
(f) | Security forms part of the below inverse floater. The Fund accounts for these inverse floaters as a form of secured borrowing, by reflecting the value of the underlying bond in the investments of the Fund and the amount owed to the floating rate note holder as a liability. |
(g) | Current yield; not a coupon rate. |
144A: Security exempt from registration under Rule 144A of the Securities Act of 1933. These securities may be resold in transactions exempt from registration, normally to qualified institutional buyers. |
AGMC: Assured Guaranty Municipal Corp. |
AMT: Subject to alternative minimum tax. |
GTY: Guaranty Agreement |
INS: Insured |
LIQ: Liquidity Facility |
LOC: Letter of Credit |
MUNIPSA: SIFMA Municipal Swap Index Yield |
NATL: National Public Finance Guarantee Corp. |
Prerefunded: Bonds which are prerefunded are collateralized usually by U.S. Treasury securities which are held in escrow and used to pay principal and interest on tax-exempt issues and to retire the bonds in full at the earliest refunding date. |
SIFMA: Securities Industry and Financial Markets Association |
DWS Managed Municipal Bond Fund | | | 33 |
Assets | Level 1 | Level 2 | Level 3 | Total |
Municipal Investments (a) | $ — | $2,293,272,538 | $— | $2,293,272,538 |
Corporate Bonds | — | 10,052,713 | — | 10,052,713 |
Closed-End Investment Companies | 8,823,840 | — | — | 8,823,840 |
Open-End Investment Companies | 19,950,255 | — | — | 19,950,255 |
Total | $28,774,095 | $2,303,325,251 | $— | $2,332,099,346 |
(a) | See Investment Portfolio for additional detailed categorizations. |
34 | | | DWS Managed Municipal Bond Fund |
Assets | |
Investment in securities, at value (cost $2,407,149,433) | $ 2,332,099,346 |
Receivable for investments sold | 12,924,755 |
Receivable for Fund shares sold | 5,136,322 |
Dividends receivable | 34,596 |
Interest receivable | 31,574,841 |
Other assets | 146,917 |
Total assets | 2,381,916,777 |
Liabilities | |
Payable for investments purchased — when-issued securities | 14,023,848 |
Payable for Fund shares redeemed | 3,958,874 |
Payable for floating rate notes issued | 7,500,000 |
Distributions payable | 1,344,389 |
Accrued management fee | 547,252 |
Accrued Trustees' fees | 33,469 |
Other accrued expenses and payables | 1,619,991 |
Total liabilities | 29,027,823 |
Net assets, at value | $2,352,888,954 |
Net Assets Consist of | |
Distributable earnings (loss) | (166,349,851) |
Paid-in capital | 2,519,238,805 |
Net assets, at value | $2,352,888,954 |
DWS Managed Municipal Bond Fund | | | 35 |
Net Asset Value | |
Class A | |
Net Asset Value and redemption price per share ($897,589,192 ÷ 113,091,908 outstanding shares of beneficial interest, $.01 par value, unlimited number of shares authorized) | $ 7.94 |
Maximum offering price per share (100 ÷ 97.25 of $7.94) | $ 8.16 |
Class C | |
Net Asset Value, offering and redemption price (subject to contingent deferred sales charge) per share ($33,329,173 ÷ 4,199,874 outstanding shares of beneficial interest, $.01 par value, unlimited number of shares authorized) | $ 7.94 |
Class S | |
Net Asset Value, offering and redemption price per share ($1,164,941,642 ÷ 146,580,827 outstanding shares of beneficial interest, $.01 par value, unlimited number of shares authorized) | $ 7.95 |
Institutional Class | |
Net Asset Value, offering and redemption price per share ($257,028,947 ÷ 32,369,111 outstanding shares of beneficial interest, $.01 par value, unlimited number of shares authorized) | $ 7.94 |
36 | | | DWS Managed Municipal Bond Fund |
Investment Income | |
Income: | |
Interest | $ 50,764,226 |
Dividends | 210,189 |
Total income | 50,974,415 |
Expenses: | |
Management fee | 4,277,038 |
Administration fee | 1,240,764 |
Services to shareholders | 1,828,504 |
Distribution and service fees | 1,310,011 |
Custodian fee | 15,615 |
Professional fees | 67,192 |
Reports to shareholders | 58,968 |
Registration fees | 57,091 |
Trustees' fees and expenses | 60,014 |
Interest expense and fees on floating rate notes issued | 77,215 |
Other | 139,468 |
Total expenses before expense reductions | 9,131,880 |
Expense reductions | (844,797) |
Total expenses after expense reductions | 8,287,083 |
Net investment income | 42,687,332 |
Realized and Unrealized Gain (Loss) | |
Net realized gain (loss) from: | |
Investments | (59,167,342) |
Payments by affiliates (see Note F) | 2,733 |
(59,164,609) | |
Change in net unrealized appreciation (depreciation) on investments | (62,678,346) |
Net gain (loss) | (121,842,955) |
Net increase (decrease) in net assets resulting from operations | $ (79,155,623) |
DWS Managed Municipal Bond Fund | | | 37 |
Six Months Ended November 30, 2022 | Year Ended May 31, | |
Increase (Decrease) in Net Assets | (Unaudited) | 2022 |
Operations: | ||
Net investment income | $ 42,687,332 | $ 96,319,259 |
Net realized gain (loss) | (59,164,609) | (20,145,681) |
Change in net unrealized appreciation (depreciation) | (62,678,346) | (359,660,428) |
Net increase (decrease) in net assets resulting from operations | (79,155,623) | (283,486,850) |
Distributions to shareholders: | ||
Class A | (14,917,718) | (41,691,860) |
Class C | (464,083) | (1,523,484) |
Class S | (21,823,466) | (65,291,541) |
Institutional Class | (5,202,885) | (18,945,043) |
Total distributions | (42,408,152) | (127,451,928) |
Fund share transactions: | ||
Proceeds from shares sold | 1,222,557,556 | 1,007,687,942 |
Reinvestment of distributions | 37,291,602 | 113,126,543 |
Payments for shares redeemed | (1,605,136,857) | (1,661,285,146) |
Net increase (decrease) in net assets from Fund share transactions | (345,287,699) | (540,470,661) |
Increase (decrease) in net assets | (466,851,474) | (951,409,439) |
Net assets at beginning of period | 2,819,740,428 | 3,771,149,867 |
Net assets at end of period | $2,352,888,954 | $2,819,740,428 |
38 | | | DWS Managed Municipal Bond Fund |
DWS Managed Municipal Bond Fund — Class A | ||||||
Six Months Ended 11/30/22 | Years Ended May 31, | |||||
(Unaudited) | 2022 | 2021 | 2020 | 2019 | 2018 | |
Selected Per Share Data | ||||||
Net asset value, beginning of period | $8.29 | $9.39 | $8.98 | $9.21 | $8.98 | $9.17 |
Income (loss) from investment operations: | ||||||
Net investment income | .13 | .24 | .25 | .28 | .28 | .28 |
Net realized and unrealized gain (loss) | (.35) | (1.02) | .41 | (.21) | .23 | (.19) |
Total from investment operations | (.22) | (.78) | .66 | .07 | .51 | .09 |
Less distributions from: | ||||||
Net investment income | (.13) | (.24) | (.25) | (.28) | (.28) | (.28) |
Net realized gains | — | (.08) | (.00)* | (.02) | (.00)* | (.00)* |
Total distributions | (.13) | (.32) | (.25) | (.30) | (.28) | (.28) |
Net asset value, end of period | $7.94 | $8.29 | $9.39 | $8.98 | $9.21 | $8.98 |
Total Return (%)a | (2.68)b** | (8.53) | 7.52 | .64 | 5.85 | 1.00 |
Ratios to Average Net Assets and Supplemental Data | ||||||
Net assets, end of period ($ millions) | 898 | 1,008 | 1,251 | 1,220 | 1,315 | 1,507 |
Ratio of expenses before expense reductions (including interest expense) (%)c | .79*** | .76 | .76 | .76 | .77 | .77 |
Ratio of expenses after expense reductions (including interest expense) (%)c | .79*** | .76 | .76 | .76 | .77 | .77 |
Ratio of expenses after expense reductions (excluding interest expense) (%) | .78*** | .76 | .76 | .76 | .77 | .76 |
Ratio of net investment income (%) | 3.20*** | 2.65 | 2.77 | 3.02 | 3.18 | 3.08 |
Portfolio turnover rate (%) | 34** | 39 | 29 | 35 | 39 | 42 |
a | Total return does not reflect the effect of any sales charges. |
b | Total return would have been lower had certain expenses not been reduced. |
c | Interest expense represents interest and fees on short-term floating rate notes issued in conjunction with inverse floating rate securities. Interest income from such transactions is included in income from investment operations. |
* | Amount is less than $.005. |
** | Not annualized |
*** | Annualized |
DWS Managed Municipal Bond Fund | | | 39 |
DWS Managed Municipal Bond Fund — Class C | ||||||
Six Months Ended 11/30/22 | Years Ended May 31, | |||||
(Unaudited) | 2022 | 2021 | 2020 | 2019 | 2018 | |
Selected Per Share Data | ||||||
Net asset value, beginning of period | $8.29 | $9.39 | $8.98 | $9.21 | $8.98 | $9.17 |
Income (loss) from investment operations: | ||||||
Net investment income | .10 | .17 | .18 | .20 | .21 | .21 |
Net realized and unrealized gain (loss) | (.35) | (1.02) | .41 | (.21) | .23 | (.19) |
Total from investment operations | (.25) | (.85) | .59 | (.01) | .44 | .02 |
Less distributions from: | ||||||
Net investment income | (.10) | (.17) | (.18) | (.20) | (.21) | (.21) |
Net realized gains | — | (.08) | (.00)* | (.02) | (.00)* | (.00)* |
Total distributions | (.10) | (.25) | (.18) | (.22) | (.21) | (.21) |
Net asset value, end of period | $7.94 | $8.29 | $9.39 | $8.98 | $9.21 | $8.98 |
Total Return (%)a | (3.04)b** | (9.24)b | 6.67 | (.15) | 5.02b | .21 |
Ratios to Average Net Assets and Supplemental Data | ||||||
Net assets, end of period ($ millions) | 33 | 43 | 65 | 124 | 151 | 208 |
Ratio of expenses before expense reductions (including interest expense) (%)c | 1.61*** | 1.56 | 1.55 | 1.55 | 1.57 | 1.56 |
Ratio of expenses after expense reductions (including interest expense) (%)c | 1.54*** | 1.54 | 1.55 | 1.55 | 1.56 | 1.56 |
Ratio of expenses after expense reductions (excluding interest expense) (%) | 1.53*** | 1.54 | 1.55 | 1.55 | 1.56 | 1.55 |
Ratio of net investment income (%) | 2.44*** | 1.87 | 1.99 | 2.23 | 2.39 | 2.29 |
Portfolio turnover rate (%) | 34** | 39 | 29 | 35 | 39 | 42 |
a | Total return does not reflect the effect of any sales charges. |
b | Total return would have been lower had certain expenses not been reduced. |
c | Interest expense represents interest and fees on short-term floating rate notes issued in conjunction with inverse floating rate securities. Interest income from such transactions is included in income from investment operations. |
* | Amount is less than $.005. |
** | Not annualized |
*** | Annualized |
40 | | | DWS Managed Municipal Bond Fund |
DWS Managed Municipal Bond Fund — Class S | ||||||
Six Months Ended 11/30/22 | Years Ended May 31, | |||||
(Unaudited) | 2022 | 2021 | 2020 | 2019 | 2018 | |
Selected Per Share Data | ||||||
Net asset value, beginning of period | $8.31 | $9.40 | $8.99 | $9.23 | $9.00 | $9.18 |
Income (loss) from investment operations: | ||||||
Net investment income | .14 | .26 | .27 | .29 | .30 | .30 |
Net realized and unrealized gain (loss) | (.36) | (1.01) | .41 | (.22) | .23 | (.18) |
Total from investment operations | (.22) | (.75) | .68 | .07 | .53 | .12 |
Less distributions from: | ||||||
Net investment income | (.14) | (.26) | (.27) | (.29) | (.30) | (.30) |
Net realized gains | — | (.08) | (.00)* | (.02) | (.00)* | (.00)* |
Total distributions | (.14) | (.34) | (.27) | (.31) | (.30) | (.30) |
Net asset value, end of period | $7.95 | $8.31 | $9.40 | $8.99 | $9.23 | $9.00 |
Total Return (%)a | (2.67)** | (8.20) | 7.73 | .73 | 6.07 | 1.32 |
Ratios to Average Net Assets and Supplemental Data | ||||||
Net assets, end of period ($ millions) | 1,165 | 1,393 | 1,898 | 2,041 | 2,283 | 2,670 |
Ratio of expenses before expense reductions (including interest expense) (%)b | .65*** | .61 | .61 | .62 | .61 | .62 |
Ratio of expenses after expense reductions (including interest expense) (%)b | .54*** | .54 | .55 | .56 | .56 | .58 |
Ratio of expenses after expense reductions (excluding interest expense) (%) | .53*** | .54 | .55 | .56 | .56 | .56 |
Ratio of net investment income (%) | 3.44*** | 2.87 | 2.98 | 3.22 | 3.39 | 3.27 |
Portfolio turnover rate (%) | 34** | 39 | 29 | 35 | 39 | 42 |
a | Total return would have been lower had certain expenses not been reduced. |
b | Interest expense represents interest and fees on short-term floating rate notes issued in conjunction with inverse floating rate securities. Interest income from such transactions is included in income from investment operations. |
* | Amount is less than $.005. |
** | Not annualized |
*** | Annualized |
DWS Managed Municipal Bond Fund | | | 41 |
DWS Managed Municipal Bond Fund — Institutional Class | ||||||
Six Months Ended 11/30/22 | Years Ended May 31, | |||||
(Unaudited) | 2022 | 2021 | 2020 | 2019 | 2018 | |
Selected Per Share Data | ||||||
Net asset value, beginning of period | $8.30 | $9.40 | $8.99 | $9.22 | $8.99 | $9.17 |
Income (loss) from investment operations: | ||||||
Net investment income | .14 | .26 | .27 | .30 | .30 | .30 |
Net realized and unrealized gain (loss) | (.36) | (1.02) | .41 | (.21) | .23 | (.18) |
Total from investment operations | (.22) | (.76) | .68 | .09 | .53 | .12 |
Less distributions from: | ||||||
Net investment income | (.14) | (.26) | (.27) | (.30) | (.30) | (.30) |
Net realized gains | — | (.08) | (.00)* | (.02) | (.00)* | (.00)* |
Total distributions | (.14) | (.34) | (.27) | (.32) | (.30) | (.30) |
Net asset value, end of period | $7.94 | $8.30 | $9.40 | $8.99 | $9.22 | $8.99 |
Total Return (%) | (2.67)a** | (8.31)a | 7.75 | .86 | 6.09 | 1.33 |
Ratios to Average Net Assets and Supplemental Data | ||||||
Net assets, end of period ($ millions) | 257 | 375 | 557 | 484 | 340 | 241 |
Ratio of expenses before expense reductions (including interest expense) (%)b | .61*** | .55 | .54 | .55 | .55 | .56 |
Ratio of expenses after expense reductions (including interest expense) (%)b | .54*** | .53 | .54 | .55 | .55 | .56 |
Ratio of expenses after expense reductions (excluding interest expense) (%) | .53*** | .53 | .54 | .55 | .55 | .55 |
Ratio of net investment income (%) | 3.44*** | 2.87 | 2.99 | 3.22 | 3.41 | 3.29 |
Portfolio turnover rate (%) | 34** | 39 | 29 | 35 | 39 | 42 |
a | Total return would have been lower had certain expenses not been reduced. |
b | Interest expense represents interest and fees on short-term floating rate notes issued in conjunction with inverse floating rate securities. Interest income from such transactions is included in income from investment operations. |
* | Amount is less than $.005. |
** | Not annualized |
*** | Annualized |
42 | | | DWS Managed Municipal Bond Fund |
DWS Managed Municipal Bond Fund | | | 43 |
44 | | | DWS Managed Municipal Bond Fund |
DWS Managed Municipal Bond Fund | | | 45 |
46 | | | DWS Managed Municipal Bond Fund |
DWS Managed Municipal Bond Fund | | | 47 |
48 | | | DWS Managed Municipal Bond Fund |
First $250 million of the Fund’s average daily net assets | .365% |
Next $750 million of such net assets | .345% |
Next $1.5 billion of such net assets | .325% |
Next $2.5 billion of such net assets | .315% |
Next $2.5 billion of such net assets | .295% |
Next $2.5 billion of such net assets | .275% |
Next $2.5 billion of such net assets | .255% |
Over $12.5 billion of such net assets | .235% |
Class A | .78% | |
Class C | 1.53% | |
Class S | .53% | |
Institutional Class | .53% |
Class A | $ 14,819 |
Class C | 12,259 |
Class S | 719,396 |
Institutional Class | 98,323 |
$ 844,797 |
DWS Managed Municipal Bond Fund | | | 49 |
Services to Shareholders | Total Aggregated | Unpaid at November 30, 2022 |
Class A | $ 48,768 | $ 17,393 |
Class C | 476 | 174 |
Class S | 108,202 | 37,719 |
Institutional Class | 509 | 149 |
$ 157,955 | $ 55,435 |
Sub-Recordkeeping | Total Aggregated |
Class A | $ 343,158 |
Class C | 25,800 |
Class S | 1,048,239 |
Institutional Class | 202,182 |
$ 1,619,379 |
Distribution Fee | Total Aggregated | Unpaid at November 30, 2022 |
Class C | $ 143,921 | $ 20,420 |
50 | | | DWS Managed Municipal Bond Fund |
Service Fee | Total Aggregated | Unpaid at November 30, 2022 | Annualized Rate |
Class A | $ 1,118,985 | $ 361,888 | .24% |
Class C | 47,105 | 13,301 | .25% |
$ 1,166,090 | $ 375,189 |
DWS Managed Municipal Bond Fund | | | 51 |
Six Months Ended November 30, 2022 | Year Ended May 31, 2022 | |||
Shares | Dollars | Shares | Dollars | |
Shares sold | ||||
Class A | 3,225,683 | $ 25,717,843 | 5,727,227 | $ 51,742,517 |
Class C | 131,619 | 1,052,796 | 341,980 | 3,095,214 |
Class S | 136,835,261 | 1,119,544,667 | 92,438,496 | 806,740,925 |
Institutional Class | 9,540,105 | 76,242,250 | 16,249,439 | 146,109,286 |
$ 1,222,557,556 | $ 1,007,687,942 | |||
Shares issued to shareholders in reinvestment of distributions | ||||
Class A | 1,663,916 | $ 13,167,423 | 4,054,958 | $ 36,802,812 |
Class C | 55,112 | 436,336 | 157,532 | 1,433,228 |
Class S | 2,374,407 | 18,828,287 | 6,324,687 | 57,523,065 |
Institutional Class | 612,964 | 4,859,556 | 1,910,465 | 17,367,438 |
$ 37,291,602 | $ 113,126,543 | |||
Shares redeemed | ||||
Class A | (13,365,565) | $ (106,617,211) | (21,433,489) | $ (190,506,243) |
Class C | (1,218,914) | (9,661,876) | (2,175,324) | (19,694,384) |
Class S | (160,360,520) | (1,305,299,342) | (132,864,925) | (1,164,618,504) |
Institutional Class | (22,980,458) | (183,558,428) | (32,252,168) | (286,466,015) |
$ (1,605,136,857) | $ (1,661,285,146) | |||
52 | | | DWS Managed Municipal Bond Fund |
Six Months Ended November 30, 2022 | Year Ended May 31, 2022 | |||
Shares | Dollars | Shares | Dollars | |
Net increase (decrease) | ||||
Class A | (8,475,966) | $ (67,731,945) | (11,651,304) | $ (101,960,914) |
Class C | (1,032,183) | (8,172,744) | (1,675,812) | (15,165,942) |
Class S | (21,150,852) | (166,926,388) | (34,101,742) | (300,354,514) |
Institutional Class | (12,827,389) | (102,456,622) | (14,092,264) | (122,989,291) |
$ (345,287,699) | $ (540,470,661) | |||
DWS Managed Municipal Bond Fund | | | 53 |
54 | | | DWS Managed Municipal Bond Fund |
Actual Fund Return | Class A | Class C | Class S | Institutional Class |
Beginning Account Value 6/1/22 | $1,000.00 | $1,000.00 | $1,000.00 | $1,000.00 |
Ending Account Value 11/30/22 | $973.20 | $969.60 | $973.30 | $973.30 |
Expenses Paid per $1,000* | $3.91 | $7.60 | $2.67 | $2.67 |
Hypothetical 5% Fund Return | Class A | Class C | Class S | Institutional Class |
Beginning Account Value 6/1/22 | $1,000.00 | $1,000.00 | $1,000.00 | $1,000.00 |
Ending Account Value 11/30/22 | $1,021.11 | $1,017.35 | $1,022.36 | $1,022.36 |
Expenses Paid per $1,000* | $4.00 | $7.79 | $2.74 | $2.74 |
* | Expenses are equal to the Fund’s annualized expense ratio for each share class, multiplied by the average account value over the period, multiplied by 183 (the number of days in the most recent six-month period), then divided by 365. |
Annualized Expense Ratios | Class A | Class C | Class S | Institutional Class |
DWS Managed Municipal Bond Fund† | .79% | 1.54% | .54% | .54% |
† | Includes interest expense and fees on short-term floating rate notes issued in conjunction with inverse floating rate securities of 0.01% for each class. |
DWS Managed Municipal Bond Fund | | | 55 |
56 | | | DWS Managed Municipal Bond Fund |
DWS Managed Municipal Bond Fund | | | 57 |
58 | | | DWS Managed Municipal Bond Fund |
DWS Managed Municipal Bond Fund | | | 59 |
For More Information | The automated telephone system allows you to access personalized account information and obtain information on other DWS funds using either your voice or your telephone keypad. Certain account types within Classes A, C and S also have the ability to purchase, exchange or redeem shares using this system. |
For more information, contact your financial representative. You may also access our automated telephone system or speak with a Shareholder Service representative by calling: (800) 728-3337 | |
Web Site | dws.com View your account transactions and balances, trade shares, monitor your asset allocation, subscribe to fund and account updates by e-mail, and change your address, 24 hours a day. |
Obtain prospectuses and applications, news about DWS funds, insight from DWS economists and investment specialists and access to DWS fund account information. | |
Written Correspondence | DWS PO Box 219151 Kansas City, MO 64121-9151 |
Proxy Voting | The Fund’s policies and procedures for voting proxies for portfolio securities and information about how the Fund voted proxies related to its portfolio securities during the most recent 12-month period ended June 30 are available on our Web site — dws.com/en-us/resources/proxy-voting — or on the SEC’s Web site — sec.gov. To obtain a written copy of the Fund’s policies and procedures without charge, upon request, call us toll free at (800) 728-3337. |
Portfolio Holdings | Following the Fund’s fiscal first and third quarter-end, a complete portfolio holdings listing is posted on dws.com, and is available free of charge by contacting your financial intermediary, or if you are a direct investor, by calling (800) 728-3337. In addition, the portfolio holdings listing is filed with SEC on the Fund’s Form N-PORT and will be available on the SEC’s Web site at sec.gov. Additional portfolio holdings for the Fund are also posted on dws.com from time to time. Please see the Fund’s current prospectus for more information. |
Principal Underwriter | If you have questions, comments or complaints, contact: DWS Distributors, Inc. 222 South Riverside Plaza Chicago, IL 60606-5808 (800) 621-1148 |
60 | | | DWS Managed Municipal Bond Fund |
Investment Management | DWS Investment Management Americas, Inc. (“DIMA” or the “Advisor” ), which is part of the DWS Group GmbH & Co. KGaA (“DWS Group” ), is the investment advisor for the Fund. DIMA and its predecessors have more than 90 years of experience managing mutual funds and DIMA provides a full range of investment advisory services to both institutional and retail clients. DIMA is an indirect, wholly owned subsidiary of DWS Group. |
DWS Group is a global organization that offers a wide range of investing expertise and resources, including hundreds of portfolio managers and analysts and an office network that reaches the world’s major investment centers. This well-resourced global investment platform brings together a wide variety of experience and investment insight across industries, regions, asset classes and investing styles. |
Class A | Class C | Class S | Institutional Class | |
Nasdaq Symbol | SMLAX | SMLCX | SCMBX | SMLIX |
CUSIP Number | 25158T 608 | 25158T 822 | 25158T 848 | 25158T 855 |
Fund Number | 466 | 766 | 2066 | 544 |
DWS Managed Municipal Bond Fund | | | 61 |
(R-025437-12 1/23)
| (b) Not applicable | ||
| ITEM 2. | CODE OF ETHICS | |
| Not applicable. | ||
| ITEM 3. | AUDIT COMMITTEE FINANCIAL EXPERT | |
| Not applicable | ||
| ITEM 4. | PRINCIPAL ACCOUNTANT FEES AND SERVICES | |
| Not applicable | ||
| ITEM 5. | AUDIT COMMITTEE OF LISTED REGISTRANTS | |
| Not applicable | ||
| ITEM 6. | SCHEDULE OF INVESTMENTS | |
| Not applicable | ||
| ITEM 7. | DISCLOSURE OF PROXY VOTING POLICIES AND PROCEDURES FOR CLOSED-END MANAGEMENT INVESTMENT COMPANIES | |
| Not applicable | ||
| ITEM 8. | PORTFOLIO MANAGERS OF CLOSED-END MANAGEMENT INVESTMENT COMPANIES | |
| Not applicable | ||
| ITEM 9. | PURCHASES OF EQUITY SECURITIES BY CLOSED-END MANAGEMENT INVESTMENT COMPANY AND AFFILIATED PURCHASERS | |
| Not applicable | ||
| ITEM 10. | SUBMISSION OF MATTERS TO A VOTE OF SECURITY HOLDERS | |
| There were no material changes to the procedures by which shareholders may recommend nominees to the Fund’s Board. The primary function of the Nominating and Governance Committee is to identify and recommend individuals for membership on the Board and oversee the administration of the Board Governance Guidelines. Shareholders may recommend candidates for Board positions by forwarding their correspondence by U.S. mail or courier service to Keith R. Fox, DWS Funds Board Chair, c/o Thomas R. Hiller, Ropes & Gray LLP, Prudential Tower, 800 Boylston Street, Boston, MA 02199-3600. | ||
| ITEM 11. | CONTROLS AND PROCEDURES | |
| (a) | The Chief Executive and Financial Officers concluded that the Registrant’s Disclosure Controls and Procedures are effective based on the evaluation of the Disclosure Controls and Procedures as of a date within 90 days of the filing date of this report. | |
| (b) | There have been no changes in the registrant’s internal control over financial reporting that occurred during the period covered by this report that has materially affected, or is reasonably likely to materially affect, the registrant’s internal controls over financial reporting. | |
| ITEM 12. | Disclosure of Securities Lending Activities for Closed-End Management Investment Companies. | |
| Not applicable | ||
| ITEM 13. | EXHIBITS | |
| (a)(1) | Not applicable | |
| (a)(2) | Certification pursuant to Rule 30a-2(a) under the Investment Company Act of 1940 (17 CFR 270.30a-2(a)) is filed and attached hereto as Exhibit 99.CERT. | |
| (b) | Certification pursuant to Rule 30a-2(b) under the Investment Company Act of 1940 (17 CFR 270.30a-2(b)) is furnished and attached hereto as Exhibit 99.906CERT. | |
SIGNATURES
Pursuant to the requirements of the Securities Exchange Act of 1934 and the Investment Company Act of 1940, the registrant has duly caused this report to be signed on its behalf by the undersigned, thereunto duly authorized.
| Registrant: | DWS Managed Municipal Bond Fund, a series of Deutsche DWS Municipal Trust |
| By: | /s/Hepsen Uzcan Hepsen Uzcan President |
| Date: | 1/27/2023 |
Pursuant to the requirements of the Securities Exchange Act of 1934 and the Investment Company Act of 1940, this report has been signed below by the following persons on behalf of the registrant and in the capacities and on the dates indicated.
| By: | /s/Hepsen Uzcan Hepsen Uzcan President |
| Date: | 1/27/2023 |
| By: | /s/Diane Kenneally Diane Kenneally Chief Financial Officer and Treasurer |
| Date: | 1/27/2023 |