UNITED STATES
SECURITIES AND EXCHANGE COMMISSION
WASHINGTON, D. C. 20549
FORM N-CSRS
Investment Company Act file number: 811-02671
Deutsche DWS Municipal Trust
(Exact Name of Registrant as Specified in Charter)
875 Third Avenue
New York, NY 10022-6225
(Address of Principal Executive Offices) (Zip Code)
Registrant’s Telephone Number, including Area Code: (212) 454-4500
Diane Kenneally
100 Summer Street
Boston, MA 02110
(Name and Address of Agent for Service)
| Date of fiscal year end: | 5/31 |
| Date of reporting period: | 11/30/2022 |
| ITEM 1. | REPORT TO STOCKHOLDERS |
| (a) | |


Contents
4 | |
5 | |
9 | |
10 | |
12 | |
32 | |
34 | |
35 | |
36 | |
40 | |
53 | |
55 | |
59 |
NOT FDIC/NCUA INSURED NO BANK GUARANTEE MAY LOSE VALUE
NOT A DEPOSIT NOT INSURED BY ANY FEDERAL GOVERNMENT AGENCY
2 | | | DWS Strategic High Yield Tax-Free Fund |
DWS Strategic High Yield Tax-Free Fund | | | 3 |


4 | | | DWS Strategic High Yield Tax-Free Fund |
Class A | 6-Month‡ | 1-Year | 5-Year | 10-Year |
Average Annual Total Returns as of 11/30/22 | ||||
Unadjusted for Sales Charge | –5.46% | –15.69% | 0.11% | 1.30% |
Adjusted for the Maximum Sales Charge (max 2.75% load) | –8.06% | –18.01% | –0.45% | 1.01% |
Bloomberg Municipal Bond Index† | –1.43% | –8.64% | 1.40% | 1.98% |
Average Annual Total Returns as of 9/30/22 (most recent calendar quarter end) | ||||
Unadjusted for Sales Charge | –18.22% | –0.63% | 1.19% | |
Adjusted for the Maximum Sales Charge (max 2.75% load) | –20.46% | –1.18% | 0.91% | |
Bloomberg Municipal Bond Index† | –11.50% | 0.59% | 1.79% | |
Class C | 6-Month‡ | 1-Year | 5-Year | 10-Year |
Average Annual Total Returns as of 11/30/22 | ||||
Unadjusted for Sales Charge | –5.81% | –16.31% | –0.64% | 0.55% |
Adjusted for the Maximum Sales Charge (max 1.00% CDSC) | –6.74% | –16.31% | –0.64% | 0.55% |
Bloomberg Municipal Bond Index† | –1.43% | –8.64% | 1.40% | 1.98% |
Average Annual Total Returns as of 9/30/22 (most recent calendar quarter end) | ||||
Unadjusted for Sales Charge | –18.82% | –1.37% | 0.43% | |
Adjusted for the Maximum Sales Charge (max 1.00% CDSC) | –18.82% | –1.37% | 0.43% | |
Bloomberg Municipal Bond Index† | –11.50% | 0.59% | 1.79% | |
Class S | 6-Month‡ | 1-Year | 5-Year | 10-Year |
Average Annual Total Returns as of 11/30/22 | ||||
No Sales Charges | –5.33% | –15.46% | 0.37% | 1.55% |
Bloomberg Municipal Bond Index† | –1.43% | –8.64% | 1.40% | 1.98% |
Average Annual Total Returns as of 9/30/22 (most recent calendar quarter end) | ||||
No Sales Charges | –17.99% | –0.39% | 1.44% | |
Bloomberg Municipal Bond Index† | –11.50% | 0.59% | 1.79% | |
DWS Strategic High Yield Tax-Free Fund | | | 5 |
Institutional Class | 6-Month‡ | 1-Year | 5-Year | 10-Year |
Average Annual Total Returns as of 11/30/22 | ||||
No Sales Charges | –5.33% | –15.52% | 0.37% | 1.55% |
Bloomberg Municipal Bond Index† | –1.43% | –8.64% | 1.40% | 1.98% |
Average Annual Total Returns as of 9/30/22 (most recent calendar quarter end) | ||||
No Sales Charges | –17.90% | –0.37% | 1.45% | |
Bloomberg Municipal Bond Index† | –11.50% | 0.59% | 1.79% | |
6 | | | DWS Strategic High Yield Tax-Free Fund |
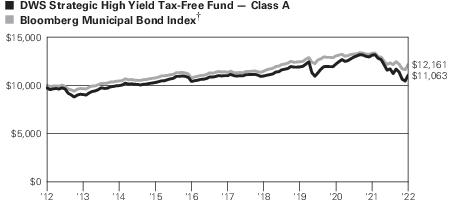 Yearly periods ended November 30
† | Bloomberg Municipal Bond Index covers the USD-denominated long-term tax exempt bond market. The index has four main sectors: state and local general obligation bonds, revenue bonds, insured bonds, and pre-refunded bonds. |
‡ | Total returns shown for periods less than one year are not annualized. |
DWS Strategic High Yield Tax-Free Fund | | | 7 |
Class A | Class C | Class S | Institutional Class | |
Net Asset Value | ||||
11/30/22 | $10.22 | $10.23 | $10.23 | $10.23 |
5/31/22 | $11.02 | $11.03 | $11.03 | $11.03 |
Distribution Information as of 11/30/22 | ||||
Income Dividends, Six Months | $.20 | $.16 | $.21 | $.21 |
November Income Dividend | $.0341 | $.0279 | $.0362 | $.0363 |
SEC 30-day Yield‡‡ | 4.07% | 3.46% | 4.44% | 4.44% |
Tax Equivalent Yield‡‡ | 6.88% | 5.84% | 7.50% | 7.50% |
Current Annualized Distribution Rate‡‡ | 4.06% | 3.32% | 4.31% | 4.32% |
‡‡ | The SEC yield is net investment income per share earned over the month ended November 30, 2022, shown as an annualized percentage of the maximum offering price per share on the last day of the period. The SEC yield is computed in accordance with a standardized method prescribed by the Securities and Exchange Commission. The SEC yields would have been 4.00%, 3.39%, 4.34% and 4.38% for Class A, Class C, Class S and Institutional Class shares, respectively, had certain expenses not been reduced. Tax equivalent yield is based on the Fund’s yield and a marginal income tax rate of 40.8%. Current annualized distribution rate is the latest monthly dividend shown as an annualized percentage of net asset value on November 30, 2022. Distribution rate simply measures the level of dividends and is not a complete measure of performance. The current annualized distribution rates would have been 3.99%, 3.25%, 4.21% and 4.26% for Class A, Class C, Class S and Institutional Class shares, respectively, had certain expenses not been reduced. Yields and distribution rates are historical, not guaranteed and will fluctuate. |
8 | | | DWS Strategic High Yield Tax-Free Fund |
DWS Strategic High Yield Tax-Free Fund | | | 9 |
Asset Allocation (As a % of Investment Portfolio excluding Open-End Investment Companies) | 11/30/22 | 5/31/22 |
Revenue Bonds | 87% | 87% |
General Obligation Bonds | 6% | 6% |
Lease Obligations | 4% | 4% |
Variable Rate Demand Notes | 1% | 2% |
Other | 1% | 0% |
Escrow to Maturity/Prerefunded Bonds | 1% | 1% |
Variable Rate Demand Preferred Shares | 0% | — |
100% | 100% |
Interest Rate Sensitivity | 11/30/22 | 5/31/22 |
Effective Maturity | 15.5 years | 12.1 years |
Modified Duration | 8.7 years | 8.0 years |
Quality (As a % of Investment Portfolio excluding Open-End Investment Companies) | 11/30/22 | 5/31/22 |
AAA | 2% | 1% |
AA | 12% | 11% |
A | 16% | 19% |
BBB | 22% | 23% |
BB | 9% | 10% |
B | 0% | 0% |
D | — | 2% |
Not Rated | 39% | 34% |
100% | 100% |
Top Five State Allocations (As a % of Investment Portfolio excluding Open-End Investment Companies) | 11/30/22 | 5/31/22 |
Florida | 11% | 10% |
Texas | 9% | 9% |
Illinois | 8% | 8% |
New York | 6% | 6% |
Wisconsin | 6% | 5% |
10 | | | DWS Strategic High Yield Tax-Free Fund |
DWS Strategic High Yield Tax-Free Fund | | | 11 |
Principal Amount ($) | Value ($) | ||
Municipal Investments 93.3% | |||
Alabama 0.9% | |||
Jefferson County, AL, Sewer Revenue, Series C, Step-up Coupon, 0% to 10/1/2023, 6.9% to 10/1/2050, INS: AGMC | 5,000,000 | 5,099,004 | |
Arizona 3.7% | |||
Arizona, State Health Facilities Authority Revenue, Banner Health, Series B, MUNIPSA + 0.25%, 2.15% (a), 1/1/2046 | 210,000 | 202,790 | |
Arizona, State Industrial Development Authority, Education Facility Revenue, Odyssey Preparatory Academy Project, 144A, 5.0%, 7/1/2049 | 2,760,000 | 2,486,573 | |
Arizona, State Industrial Development Authority, Education Revenue, BASIS School Projects: | |||
Series G, 144A, 5.0%, 7/1/2047 | 1,000,000 | 922,881 | |
Series D, 144A, 5.0%, 7/1/2051 | 1,035,000 | 942,827 | |
Series G, 144A, 5.0%, 7/1/2051 | 550,000 | 501,019 | |
Series A, 144A, 5.25%, 7/1/2047 | 1,000,000 | 956,975 | |
Maricopa County, AZ, Industrial Development Authority, Education Revenue, Benjamin Franklin Charter School Project, Series A, 144A, 6.0%, 7/1/2052 | 1,000,000 | 1,023,694 | |
Phoenix, AZ, Civic Improvement Corp., Rental Car Facility Revenue, Series A, 4.0%, 7/1/2045 | 6,500,000 | 5,823,941 | |
Phoenix, AZ, Industrial Development Authority, Student Housing Revenue, Downtown Phoenix Student Housing LLC: | |||
Series A, 5.0%, 7/1/2037 | 2,000,000 | 2,017,352 | |
Series A, 5.0%, 7/1/2042 | 2,000,000 | 1,977,768 | |
Pima County, AZ, Industrial Development Authority, Education Revenue, American Leadership Academy Project: | |||
Series 2022, 144A, 4.0%, 6/15/2051 | 1,830,000 | 1,321,119 | |
Series 2022, 144A, 4.0%, 6/15/2057 | 230,000 | 159,023 | |
144A, 5.0%, 6/15/2049 | 1,030,000 | 913,984 | |
144A, 5.0%, 6/15/2052 | 710,000 | 623,808 | |
19,873,754 | |||
California 4.3% | |||
California, Golden State Tobacco Securitization Corp., Tobacco Settlement Revenue: | |||
Series B-2, Zero Coupon, 6/1/2066 | 4,530,000 | 487,711 | |
Series B-1, 3.85%, 6/1/2050 | 3,000,000 | 2,709,742 | |
12 | | | DWS Strategic High Yield Tax-Free Fund |
Principal Amount ($) | Value ($) | ||
California, Morongo Band of Mission Indians Revenue, Series B, 144A, 5.0%, 10/1/2042 | 1,145,000 | 1,148,423 | |
California, M-S-R Energy Authority, Series B, 7.0%, 11/1/2034, GTY: Citigroup Global Markets | 5,750,000 | 7,115,129 | |
California, Nuveen AMT-Free Municipal Credit Income Fund, 2.35% (b), 12/1/2022 | 1,800,000 | 1,800,000 | |
California, River Islands Public Financing Authority, Special Tax, Community Facilities District No. 2019-1, Phase 2 Public Improvements: | |||
3.875%, 9/1/2049 | 2,630,000 | 2,119,595 | |
4.0%, 9/1/2046 | 3,825,000 | 3,340,900 | |
California, State Public Finance Authority Revenue, ENSO Village Project: | |||
Series A, 144A, 5.0%, 11/15/2046 | 270,000 | 229,244 | |
Series A, 144A, 5.0%, 11/15/2051 | 135,000 | 112,384 | |
Long Beach, CA, Bond Finance Authority, Natural Gas Purchase Revenue, Series A, 5.25%, 11/15/2023, GTY: Merrill Lynch & Co. | 620,000 | 629,871 | |
Long Beach, CA, Carnival Cruise Terminal Financing, 144A, 7.282%, 11/1/2030, GTY: Carnival Corp. | 1,450,000 | 1,330,771 | |
Riverside County, CA, General Obligation, Series 2021 B-2, 3.0%, 6/1/2048 | 3,105,000 | 2,311,895 | |
23,335,665 | |||
Colorado 5.0% | |||
Colorado, Aurora Highlands Community Authority Board, Special Tax Revenue, Series A, 5.75%, 12/1/2051 | 5,000,000 | 4,451,118 | |
Colorado, Brighton Crossing Metropolitan District No. 6 Ltd., Series A, 5.0%, 12/1/2050 | 1,000,000 | 840,431 | |
Colorado, Broadway Park North Metropolitan District No. 2: | |||
144A, 5.0%, 12/1/2040 | 1,100,000 | 1,034,038 | |
144A, 5.0%, 12/1/2049 | 1,275,000 | 1,155,339 | |
Colorado, Broadway Station Metropolitan District No. 3, Step-up Coupon, 0% to 12/1/2027, 7.5% to 12/1/2049 | 2,000,000 | 1,232,383 | |
Colorado, General Obligation, Series A, 144A, 5.0%, 12/1/2051 | 1,150,000 | 983,077 | |
Colorado, North Range Metropolitan District No. 3, Series A, 5.25%, 12/1/2050 | 2,167,000 | 1,859,954 | |
Colorado, Public Energy Authority, Natural Gas Purchased Revenue, 6.25%, 11/15/2028, GTY: Merrill Lynch & Co. | 6,365,000 | 6,810,742 | |
Colorado, Trails At Crowfoot Metropolitan District No. 3, Series A, 5.0%, 12/1/2049 | 1,000,000 | 887,805 | |
Denver, CO, Convention Center Hotel Authority Revenue: | |||
5.0%, 12/1/2033 | 500,000 | 507,136 | |
5.0%, 12/1/2034 | 1,000,000 | 1,009,569 | |
DWS Strategic High Yield Tax-Free Fund | | | 13 |
Principal Amount ($) | Value ($) | ||
5.0%, 12/1/2040 | 2,060,000 | 2,047,857 | |
Denver, CO, Health & Hospital Authority, Certificate of Participations, 5.0%, 12/1/2048 | 1,170,000 | 1,173,242 | |
Denver, CO, Urban Renewal Authority, Tax Increment Revenue, 9th Urban Redevelopment Area, Series A, 144A, 5.25%, 12/1/2039 | 1,745,000 | 1,756,234 | |
Douglas County, CO, Rampart Range Metropolitan District No. 5: | |||
4.0%, 12/1/2041 | 560,000 | 420,792 | |
Series 2021, 4.0%, 12/1/2051 | 1,590,000 | 1,073,536 | |
27,243,253 | |||
Connecticut 0.1% | |||
Connecticut, Steel Point Infrastructure Improvement District Special Obligation Revenue, Steelpointe Harbor Project: | |||
144A, 4.0%, 4/1/2041 | 190,000 | 162,047 | |
144A, 4.0%, 4/1/2051 | 505,000 | 402,361 | |
564,408 | |||
District of Columbia 1.1% | |||
District of Columbia, Latin American Montessori Bilingual Public Charter School, 5.0%, 6/1/2050 | 3,370,000 | 3,040,066 | |
District of Columbia, Two Rivers Public Charter School, Inc., 5.0%, 6/1/2055 | 3,065,000 | 2,925,256 | |
5,965,322 | |||
Florida 10.1% | |||
Charlotte County, FL, Industrial Development Authority, Utility System Revenue, Town & Country Utilities Project, Series A, 144A, AMT, 4.0%, 10/1/2051, GTY: Babcock Ranch IRR LLC | 750,000 | 555,302 | |
Collier County, FL, Industrial Development Authority, Continuing Care Community Revenue, Arlington of Naples Project, Series A, 144A, 8.125%, 5/15/2044* (c) | 2,310,000 | 1,478,400 | |
Florida, Capital Project Finance Authority, Student Housing Revenue, Loan Program: | |||
Series A-1, 5.0%, 10/1/2032 | 230,000 | 231,465 | |
Series A-1, 5.0%, 10/1/2033 | 230,000 | 231,020 | |
Series A-1, 5.0%, 10/1/2034 | 230,000 | 230,121 | |
Series A-1, 5.0%, 10/1/2035 | 115,000 | 114,561 | |
Florida, Capital Projects Finance Authority, Student Housing Revenue, Capital Projects Loan Program, Series A-2, 4.0%, 10/1/2024 | 2,245,000 | 2,137,806 | |
Florida, Capital Trust Agency, Educational Facilities Authority, Charter Educational Foundation Project, Series A, 144A, 5.375%, 6/15/2048 | 1,840,000 | 1,675,031 | |
14 | | | DWS Strategic High Yield Tax-Free Fund |
Principal Amount ($) | Value ($) | ||
Florida, Capital Trust Agency, Educational Growth Fund LLC, Charter School Portfolio Project, Series A-1, 144A, 5.0%, 7/1/2056 | 1,190,000 | 1,059,466 | |
Florida, Development Finance Corp., Educational Facilities Revenue, Mater Academy Projects, Series A, 5.0%, 6/15/2050 | 2,065,000 | 2,054,342 | |
Florida, Development Finance Corp., Brightline Florida Passenger Rail Expansion Project, Series A, 144A, AMT, 7.25% (a), 7/1/2057 | 1,000,000 | 993,813 | |
Florida, Development Finance Corp., Educational Facilities Revenue, River City Science Academy Project: | |||
Series A-1, 5.0%, 7/1/2042 | 75,000 | 75,171 | |
Series B, 5.0%, 7/1/2042 | 80,000 | 78,342 | |
Series A-1, 5.0%, 7/1/2051 | 70,000 | 68,748 | |
Series B, 5.0%, 7/1/2051 | 115,000 | 109,628 | |
Series A-1, 5.0%, 2/1/2057 | 100,000 | 96,418 | |
Series B, 5.0%, 7/1/2057 | 120,000 | 112,062 | |
Florida, Development Finance Corp., Surface Transportation Facilities Revenue, Brightline Passenger Rail Project, Series B, 144A, AMT, 7.375%, 1/1/2049 | 4,250,000 | 3,789,819 | |
Florida, Development Finance Corp., Surface Transportation Facilities Revenue, Virgin Trains USA Passenger Rail Project, Series A, 144A, AMT, 6.5% (a), 1/1/2049 | 1,905,000 | 1,715,096 | |
Florida, State Atlantic University Finance Corp., Capital Improvements Revenue, Student Housing Project, Series B, 4.0%, 7/1/2044 | 2,000,000 | 1,877,744 | |
Florida, State Development Finance Corp., Learning Gate Community School Project: | |||
Series A, 5.0%, 2/15/2038 | 500,000 | 504,513 | |
Series A, 5.0%, 2/15/2048 | 1,150,000 | 1,154,303 | |
Florida, State Development Finance Corp., Senior Living Revenue, The Cabana at Jensen Dunes Project: | |||
Series A, 144A, 5.0%, 11/15/2056 | 1,000,000 | 734,849 | |
Series A, 144A, 5.25%, 11/15/2056 | 9,000,000 | 6,901,792 | |
Florida, State Higher Educational Facilities Financial Authority Revenue, Florida Institute of Technology: | |||
Series A, 4.0%, 10/1/2044 | 1,395,000 | 1,200,870 | |
4.0%, 10/1/2049 | 1,905,000 | 1,588,126 | |
Florida, State Higher Educational Facilities Financial Authority Revenue, Jacksonville University Project, Series A-1, 144A, 4.75%, 6/1/2038 | 1,750,000 | 1,555,584 | |
Florida, State Mid-Bay Bridge Authority, Series A, 5.0%, 10/1/2035 | 1,030,000 | 1,040,078 | |
DWS Strategic High Yield Tax-Free Fund | | | 15 |
Principal Amount ($) | Value ($) | ||
Florida, Village Community Development District No. 12, Special Assessment Revenue: | |||
144A, 4.25%, 5/1/2043 | 2,310,000 | 2,035,343 | |
144A, 4.375%, 5/1/2050 | 1,935,000 | 1,665,371 | |
Florida, Village Community Development District No. 13, Special Assessment Revenue, Series 2021, 3.25%, 5/1/2052 | 1,705,000 | 1,052,542 | |
Florida, Village Community Development District No. 14, 5.5%, 5/1/2053 | 2,665,000 | 2,687,443 | |
Greater Orlando, FL, Aviation Authority Airport Facilities Revenue, Series A, AMT, 4.0%, 10/1/2052 | 2,000,000 | 1,801,563 | |
Jacksonville, FL, Educational Facilities Revenue, Jacksonville University Project, Series B, 144A, 5.0%, 6/1/2053 | 3,250,000 | 2,765,613 | |
Lake County, FL, Educational Facilities Revenue, Imagine South Lake Charter School Project: | |||
Series A, 144A, 5.0%, 1/15/2049 | 825,000 | 736,713 | |
Series A, 144A, 5.0%, 1/15/2054 | 850,000 | 746,970 | |
Miami-Dade County, FL, Seaport Revenue, Series B-1, AMT, 4.0%, 10/1/2046 | 2,570,000 | 2,351,719 | |
Osceola County, FL, Transportation Revenue: | |||
Series A-2, Zero Coupon, 10/1/2049 | 3,400,000 | 723,406 | |
Series A-2, Zero Coupon, 10/1/2051 | 4,775,000 | 900,692 | |
Series A-2, Zero Coupon, 10/1/2054 | 4,570,000 | 722,352 | |
Seminole County, FL, Industrial Development Authority, Legacy Pointe At UCF Project: | |||
Series A, 5.25%, 11/15/2039 | 445,000 | 376,197 | |
Series A, 5.5%, 11/15/2049 | 3,635,000 | 2,996,748 | |
54,927,142 | |||
Georgia 1.5% | |||
Americus-Sumter County, GA, Hospital Authority, Magnolia Manor Obligated Group, Series A, Prerefunded, 6.375%, 5/15/2043 | 4,000,000 | 4,068,303 | |
George L Smith II, GA, Congress Center Authority, Convention Center Hotel First Tier, Series A, 4.0%, 1/1/2054 | 1,420,000 | 1,155,813 | |
George L Smith II, GA, Congress Center Authority, Convention Center Hotel Second Tier, Series B, 144A, 5.0%, 1/1/2054 | 3,365,000 | 2,800,962 | |
8,025,078 | |||
Illinois 7.5% | |||
Chicago, IL, Board of Education: | |||
Series B, 4.0%, 12/1/2035 | 2,500,000 | 2,249,501 | |
Series A, 5.0%, 12/1/2033 | 740,000 | 740,758 | |
16 | | | DWS Strategic High Yield Tax-Free Fund |
Principal Amount ($) | Value ($) | ||
Series H, 5.0%, 12/1/2046 | 1,690,000 | 1,595,328 | |
Series E, 6.038%, 12/1/2029 | 1,500,000 | 1,420,801 | |
Chicago, IL, General Obligation: | |||
Series B, 4.0%, 1/1/2036 | 950,000 | 858,124 | |
Series A, 5.5%, 1/1/2049 | 2,425,000 | 2,459,873 | |
Series A, 6.0%, 1/1/2038 | 2,180,000 | 2,266,783 | |
Chicago, IL, O’Hare International Airport, Special Facility Revenue, AMT, 5.0%, 7/1/2048 | 1,185,000 | 1,186,893 | |
Chicago, IL, Transit Authority, Sales Tax Receipts Revenue, Second Lien: | |||
Series A, 4.0%, 12/1/2049 | 5,000,000 | 4,478,993 | |
Series A, 4.0%, 12/1/2050 | 1,400,000 | 1,244,605 | |
Illinois, Housing Development Authority Revenue: | |||
Series B, 3.0%, 4/1/2051 | 3,710,000 | 3,577,414 | |
Series 2022-E, 5.25%, 10/1/2052 | 4,000,000 | 4,196,709 | |
Illinois, Metropolitan Pier & Exposition Authority Revenue, McCormick Place Expansion Project, Series A, Zero Coupon, 12/15/2052, INS: AGMC | 7,000,000 | 1,567,121 | |
Illinois, State Finance Authority Revenue, Friendship Village of Schaumburg, 5.125%, 2/15/2045* (c) | 7,935,000 | 3,888,150 | |
Illinois, State General Obligation: | |||
5.0%, 11/1/2034 | 1,500,000 | 1,533,486 | |
5.0%, 1/1/2035 | 300,000 | 305,234 | |
Series A, 5.0%, 12/1/2042 | 3,610,000 | 3,639,091 | |
Series A, 5.0%, 3/1/2046 | 535,000 | 536,947 | |
5.5%, 5/1/2039 | 1,535,000 | 1,620,315 | |
5.75%, 5/1/2045 | 1,470,000 | 1,549,991 | |
40,916,117 | |||
Indiana 1.6% | |||
Indiana, State Finance Authority Revenue, Educational Facilities, Rock Creek Community Academy Inc., Project: | |||
Series A, 144A, 5.875%, 7/1/2038 | 1,340,000 | 1,339,245 | |
Series A, 144A, 6.125%, 7/1/2048 | 3,660,000 | 3,641,046 | |
Indiana, State Finance Authority, Health Facilities Revenue, Baptist Healthcare System, Series A, 5.0%, 8/15/2051 | 3,000,000 | 3,031,129 | |
Indiana, State Housing & Community Development Authority, Single Family Mortgage Revenue, Series C-1, 5.0%, 7/1/2053 | 720,000 | 747,703 | |
8,759,123 | |||
Iowa 1.8% | |||
Iowa, State Higher Education Loan Authority Revenue, Private College Facility, Des Moines University Project, 4.0%, 10/1/2045 | 5,210,000 | 4,648,970 | |
DWS Strategic High Yield Tax-Free Fund | | | 17 |
Principal Amount ($) | Value ($) | ||
Iowa, State Student Loan Liquidity Corp., Senior Revenue, Series B, AMT, 3.0%, 12/1/2039 | 455,000 | 427,997 | |
Iowa, Tobacco Settlement Authority Revenue: | |||
Series B-2, Zero Coupon, 6/1/2065 | 27,430,000 | 3,007,269 | |
Series B-1, 4.0%, 6/1/2049 | 1,800,000 | 1,790,092 | |
9,874,328 | |||
Kansas 0.2% | |||
Wyandotte County, KS, Unified Government, Legends Apartments Garage & West Lawn Project, 4.5%, 6/1/2040 | 1,325,000 | 1,187,630 | |
Kentucky 1.1% | |||
Columbia, KY, Educational Development Revenue, Lindsey Wilson College Project, 5.0%, 12/1/2033 | 2,560,000 | 2,690,189 | |
Kentucky, State Economic Development Finance Authority, Owensboro Health, Inc., Obligated Group: | |||
Series A, 5.0%, 6/1/2045 | 1,275,000 | 1,280,108 | |
Series A, 5.25%, 6/1/2041 | 1,915,000 | 1,950,834 | |
5,921,131 | |||
Louisiana 0.1% | |||
Louisiana, New Orleans Aviation Board, General Airport North Terminal, Series B, AMT, 5.0%, 1/1/2048 | 710,000 | 713,715 | |
Louisiana, Public Facilities Authority Revenue, Ochsner Clinic Foundation Project, Prerefunded, 5.0%, 5/15/2047 | 10,000 | 10,693 | |
724,408 | |||
Maryland 1.0% | |||
Maryland, State Economic Development Corp., Student Housing Revenue, Morgan State University Project: | |||
5.0%, 7/1/2050 | 645,000 | 636,419 | |
5.0%, 7/1/2056 | 1,100,000 | 1,075,442 | |
Maryland, State Health & Higher Educational Facilities Authority Revenue, Greater Baltimore Medical Center, Series A, 3.0%, 7/1/2046 | 5,040,000 | 3,709,722 | |
5,421,583 | |||
Massachusetts 0.8% | |||
Massachusetts, Development Finance Agency Revenue, 5.0%, 7/1/2047 | 1,250,000 | 1,265,945 | |
Massachusetts, State Development Finance Agency Revenue, Springfield College: | |||
Series B, 4.0%, 6/1/2050 | 1,585,000 | 1,352,746 | |
Series A, 4.0%, 6/1/2056 | 450,000 | 371,810 | |
18 | | | DWS Strategic High Yield Tax-Free Fund |
Principal Amount ($) | Value ($) | ||
Massachusetts, State Educational Financing Authority, Series B, AMT, 3.0%, 7/1/2035 | 300,000 | 299,986 | |
Massachusetts, State Educational Financing Authority, Educational Loan Revenue Bonds, Issue M, Series B, AMT, 2.0%, 7/1/2037 | 1,150,000 | 945,730 | |
4,236,217 | |||
Michigan 1.4% | |||
Kentwood, MI, Economic Development Corp., Holland Home Obligated Group, Series 2022, 4.0%, 11/15/2043 | 1,830,000 | 1,483,138 | |
Michigan, Finance Authority Higher Facilities, Ltd. Obligation Revenue, Kettering University Project: | |||
4.0%, 9/1/2045 | 1,775,000 | 1,607,174 | |
4.0%, 9/1/2050 | 1,660,000 | 1,465,582 | |
Michigan, State Finance Authority Revenue, Detroit Water & Sewer Department, Series C, 5.0%, 7/1/2035 | 910,000 | 937,183 | |
Michigan, State Finance Authority Revenue, Michigan Finance Authority Tobacco Settlement Revenue, “1” , Series A, 4.0%, 6/1/2049 | 1,000,000 | 828,444 | |
Michigan, State Strategic Fund Ltd., Obligation Revenue, Graphic International LLC, Coated Recycled Board Machine Project, AMT, 4.0% (a), 10/1/2061 | 890,000 | 860,776 | |
Michigan, State University Revenues, Series 2000-A, 1.9% (b), 12/7/2022, SPA: Northern Trust Company | 600,000 | 600,000 | |
7,782,297 | |||
Minnesota 1.8% | |||
Duluth, MN, Economic Development Authority, Health Care Facilities Revenue, Essentia Health Obligated Group: | |||
Series A, 5.0%, 2/15/2048 | 1,000,000 | 1,010,141 | |
Series A, 5.0%, 2/15/2053 | 2,815,000 | 2,829,447 | |
Minnesota, State Housing Finance Agency, Series I, 5.0%, 7/1/2053 | 4,000,000 | 4,153,982 | |
Minnesota, State Office of Higher Education Revenue, AMT, 2.65%, 11/1/2038 | 2,100,000 | 1,718,428 | |
9,711,998 | |||
Missouri 1.2% | |||
Kansas City, MO, Land Clearance Redevelopment Authority Project Revenue, Convention Center Hotel Project, Series A, 144A, 6.25%, 4/15/2049 | 3,750,000 | 3,064,868 | |
Missouri, State Health & Educational Facilities Authority Revenue, Medical Research, Lutheran Senior Services: | |||
4.0%, 2/1/2042 | 1,450,000 | 1,170,572 | |
DWS Strategic High Yield Tax-Free Fund | | | 19 |
Principal Amount ($) | Value ($) | ||
Series A, 5.0%, 2/1/2046 | 665,000 | 623,352 | |
St. Louis, MO, Industrial Development Authority Financing Revenue, Ballpark Village Development Project, Series A, 4.75%, 11/15/2047 | 2,275,000 | 1,695,885 | |
6,554,677 | |||
Nevada 0.9% | |||
Nevada, Tahoe Douglas Visitors Authority, Stateline Revenue: | |||
5.0%, 7/1/2040 | 1,000,000 | 1,001,194 | |
5.0%, 7/1/2045 | 1,000,000 | 993,319 | |
5.0%, 7/1/2051 | 1,000,000 | 976,251 | |
Reno, NV, Sales Tax Revenue, Transportation Rail Access, Series C, 144A, Zero Coupon, 7/1/2058 | 18,000,000 | 2,127,843 | |
5,098,607 | |||
New Hampshire 0.1% | |||
New Hampshire, State Health & Educational Facilities Authority Revenue, Hillside Village: | |||
Series A, 144A, 6.125%, 7/1/2037* (c) | 751,308 | 165,288 | |
Series A, 144A, 6.25%, 7/1/2042* (c) | 909,917 | 200,182 | |
365,470 | |||
New Jersey 3.5% | |||
Atlantic County, NJ, Improvement Authority Lease Revenue, Atlantic City Campus Phase II Project, Series A, 4.0%, 7/1/2047, INS: AGMC | 465,000 | 431,322 | |
New Jersey, State Covid-19 General Obligation Emergency Bonds, Series A, 4.0%, 6/1/2031 | 415,000 | 439,857 | |
New Jersey, State Economic Development Authority Revenue, Black Horse EHT Urban Renewal LLC Project, Series A, 144A, 5.0%, 10/1/2039 | 3,795,000 | 2,904,966 | |
New Jersey, State Economic Development Authority Revenue, White Horse HMT Urban Renewal LLC Project, 144A, 5.0%, 1/1/2040 | 1,625,000 | 1,232,111 | |
New Jersey, State Economic Development Authority, Special Facilities Revenue, Continental Airlines, Inc. Project, Series B, AMT, 5.625%, 11/15/2030 | 2,500,000 | 2,515,796 | |
New Jersey, State Health Care Facilities Financing Authority, 5.0%, 10/1/2038 | 4,000,000 | 4,106,897 | |
New Jersey, State Higher Education Assistance Authority, Student Loan Revenue: | |||
Series B, AMT, 2.5%, 12/1/2040 | 1,035,000 | 842,998 | |
Series B, AMT, 3.25%, 12/1/2039 | 1,500,000 | 1,351,835 | |
Series B, AMT, 3.5%, 12/1/2039 | 1,800,000 | 1,743,112 | |
20 | | | DWS Strategic High Yield Tax-Free Fund |
Principal Amount ($) | Value ($) | ||
New Jersey, State Housing & Mortgage Finance Agency, Single Family Housing Revenue, Series I, 5.0%, 10/1/2053 | 1,200,000 | 1,246,218 | |
New Jersey, Transportation Trust Fund Authority, 4.0%, 6/15/2040 | 2,025,000 | 1,913,075 | |
18,728,187 | |||
New Mexico 0.4% | |||
New Mexico, State Mortgage Finance Authority, “I” , Series D, 3.25%, 7/1/2044 | 2,480,000 | 2,103,703 | |
New York 6.2% | |||
Buffalo & Erie County, NY, Industrial Land Development Corp., D’Youville College Project: | |||
Series A, 4.0%, 11/1/2040 | 1,200,000 | 1,125,269 | |
Series A, 4.0%, 11/1/2050 | 2,500,000 | 2,234,844 | |
Dutchess County, NY, Local Development Corp., Bard College Project, Series A, 144A, 5.0%, 7/1/2051 | 380,000 | 344,660 | |
Monroe County, NY, Industrial Development Corp. Revenue, St. Ann’s Community Project, 5.0%, 1/1/2050 | 3,750,000 | 2,973,649 | |
New York, Brooklyn Arena Local Development Corp., Pilot Revenue, Barclays Center Project, Series A, 4.0%, 7/15/2035, INS: AGMC | 455,000 | 461,984 | |
New York, Metropolitan Transportation Authority Revenue, Series C-1, 5.0%, 11/15/2050 | 1,320,000 | 1,295,206 | |
New York, Metropolitan Transportation Authority Revenue, Green Bond, Series D-2, 4.0%, 11/15/2048 | 3,500,000 | 2,936,036 | |
New York, State Dormitory Authority Revenues, Non-State Supported Debt, Orange Regional Medical Center, 144A, 5.0%, 12/1/2045 | 1,000,000 | 966,890 | |
New York, State Dormitory Authority Revenues, Non-State Supported Debt, The New School: | |||
Series A, 4.0%, 7/1/2047 | 500,000 | 434,998 | |
Series A, 4.0%, 7/1/2052 | 590,000 | 502,116 | |
New York, State Transportation Development Corp., Special Facilities Revenue, John F. Kennedy International Airport Project: | |||
AMT, 3.0%, 8/1/2031, GTY: American Airlines Group, Inc. | 500,000 | 447,307 | |
AMT, 4.0%, 12/1/2042 | 1,200,000 | 1,046,746 | |
AMT, 5.375%, 8/1/2036 | 900,000 | 911,485 | |
New York, TSASC, Inc.: | |||
Series A, 5.0%, 6/1/2041 | 595,000 | 602,112 | |
Series B, 5.0%, 6/1/2048 | 2,800,000 | 2,598,424 | |
New York City, NY, Housing Development Corp., Multi-Family Housing Revenue: | |||
Series E-1, 2.8%, 11/1/2034 | 5,000,000 | 4,270,384 | |
DWS Strategic High Yield Tax-Free Fund | | | 21 |
Principal Amount ($) | Value ($) | ||
Series E-1, 3.0%, 11/1/2039 | 3,000,000 | 2,489,115 | |
New York City, NY, Municipal Water Finance Authority, Water & Sewer System Revenue, Second General Resolution, Series DD, 1.96% (b), 12/1/2022 | 200,000 | 200,000 | |
New York Counties, NY, Tobacco Trust IV, Series F, Zero Coupon, 6/1/2060 | 35,000,000 | 1,744,288 | |
New York, NY, General Obligation: | |||
Series 2, 1.96% (b), 12/1/2022 | 400,000 | 400,000 | |
Series B-3, 1.96% (b), 12/1/2022 | 3,575,000 | 3,575,000 | |
Series 3, 2.1% (b), 12/1/2022 | 400,000 | 400,000 | |
Orange County, NY, Senior Care Revenue, Industrial Development Agency, The Glen Arden Project, 5.7%, 1/1/2028 (c) | 2,125,000 | 1,653,675 | |
33,614,188 | |||
North Carolina 0.3% | |||
North Carolina, State Housing Finance Agency, Series 42, 4.0%, 1/1/2050 | 1,530,000 | 1,531,277 | |
Ohio 2.8% | |||
Buckeye, OH, Tobacco Settlement Financing Authority, “2” , Series B-2, 5.0%, 6/1/2055 | 3,190,000 | 2,927,231 | |
Hamilton County, OH, Health Care Revenue, Life Enriching Communities Project: | |||
5.0%, 1/1/2051 | 1,270,000 | 1,139,628 | |
Series A, 5.0%, 1/1/2052 | 1,000,000 | 894,604 | |
Ohio, Akron, Bath & Copley Joint Township Hospital District Revenue, 5.25%, 11/15/2046 | 1,575,000 | 1,592,975 | |
Ohio, State Air Quality Development Authority, Exempt Facilities Revenue, Pratt Paper LLC Project: | |||
144A, AMT, 4.25%, 1/15/2038, GTY: Pratt Industries, Inc. | 725,000 | 675,785 | |
144A, AMT, 4.5%, 1/15/2048, GTY: Pratt Industries, Inc. | 3,115,000 | 2,755,234 | |
Ohio, State Hospital Revenue, Aultman Health Foundation, 144A, 5.0%, 12/1/2048 | 6,000,000 | 5,207,022 | |
15,192,479 | |||
Oklahoma 1.0% | |||
Oklahoma, State Development Finance Authority, Health System Revenue, OU Medicine Project: | |||
Series B, 5.25%, 8/15/2048 | 2,935,000 | 2,618,308 | |
Series A, 5.5%, 8/15/2041 | 1,360,000 | 1,295,403 | |
Series A, 5.5%, 8/15/2044 | 1,445,000 | 1,362,847 | |
5,276,558 | |||
22 | | | DWS Strategic High Yield Tax-Free Fund |
Principal Amount ($) | Value ($) | ||
Pennsylvania 2.3% | |||
Chester County, PA, Industrial Development Authority, Special Obligation Revenue, Woodlands at Graystone Neighborhood Improvement Project, 144A, 5.125%, 3/1/2048 | 436,000 | 410,393 | |
Lancaster County, PA, Hospital Authority, Brethren Village Project: | |||
5.125%, 7/1/2037 | 900,000 | 843,245 | |
5.25%, 7/1/2041 | 900,000 | 840,231 | |
Pennsylvania, Higher Education Assistance Agency Education Loan Revenue, Series A, AMT, 2.45%, 6/1/2041 | 4,240,000 | 3,506,708 | |
Pennsylvania, State Housing Finance Agency, Single Family Mortgage Revenue, Series 132A, 3.5%, 4/1/2051 | 1,360,000 | 1,347,770 | |
Pennsylvania, State Turnpike Commission Revenue: | |||
Series A, 4.0%, 12/1/2044 | 660,000 | 639,330 | |
Series A, 4.0%, 12/1/2046 | 440,000 | 419,857 | |
Series B, 4.0%, 12/1/2046 | 3,500,000 | 3,339,773 | |
Series A-1, 5.0%, 12/1/2041 | 20,000 | 20,462 | |
Philadelphia, PA, Authority For Industrial Development, Charter School Revenue, Philadelphia Electrical and Technology Charter High School Project, Series A, 4.0%, 6/1/2056 | 1,240,000 | 872,838 | |
12,240,607 | |||
South Carolina 0.8% | |||
South Carolina, State Public Service Authority Revenue: | |||
Series B, 4.0%, 12/1/2047 | 1,820,000 | 1,603,244 | |
Series A, 4.0%, 12/1/2052 | 3,160,000 | 2,711,145 | |
4,314,389 | |||
South Dakota 0.3% | |||
Lincon County, SD, Economic Development Revenue, Augustana College Association Project: | |||
Series A, 4.0%, 8/1/2051 | 900,000 | 715,118 | |
Series A, 4.0%, 8/1/2056 | 625,000 | 479,956 | |
Series A, 4.0%, 8/1/2061 | 810,000 | 603,299 | |
1,798,373 | |||
Tennessee 1.1% | |||
Metropolitan Nashville, TN, Airport Authority Revenue: | |||
Series B, AMT, 4.0%, 7/1/2049 | 1,000,000 | 890,127 | |
Series B, AMT, 4.0%, 7/1/2054 | 500,000 | 433,424 | |
DWS Strategic High Yield Tax-Free Fund | | | 23 |
Principal Amount ($) | Value ($) | ||
Nashville & Davidson County, TN, Metropolitan Development & Housing Agency, Tax Increment Revenue, Fifth Broadway Development District, 144A, 5.125%, 6/1/2036 | 900,000 | 908,791 | |
Nashville & Davidson County, TN, Metropolitan Government Health & Education Facilities Board Revenue, Blakeford At Green Hills Corp., Series A, 4.0%, 11/1/2055 | 4,000,000 | 3,032,845 | |
Tennessee, New Memphis Arena Public Building Authority, City of Memphis Project, Step-up Coupon, 0% to 4/1/2026, 4.0% to 4/1/2031 | 750,000 | 659,040 | |
5,924,227 | |||
Texas 8.9% | |||
Central Texas, Regional Mobility Authority Revenue, Capital Appreciation: | |||
Zero Coupon, 1/1/2030 | 5,000,000 | 3,784,543 | |
Zero Coupon, 1/1/2032 | 3,500,000 | 2,425,607 | |
Clifton, TX, Higher Education Finance Corp., Education Revenue, Series D, 6.125%, 8/15/2048 | 4,485,000 | 4,563,069 | |
Greater Texas, Cultural Education Facilities Finance Corp. Lease Revenue, Epicenter Multipurpose Facilities Project: | |||
Series A, 4.0%, 3/1/2046 | 2,505,000 | 2,285,444 | |
Series A, 4.0%, 3/1/2050 | 2,165,000 | 1,936,521 | |
Matagorda County, TX, Navigation District No. 1, Pollution Control Revenue, AEP Texas Central Co. Project, Series A, 4.4%, 5/1/2030, INS: AMBAC | 4,000,000 | 4,095,037 | |
Newark, TX, Higher Education Finance Corp., Texas Revenue, Abilene Christian University Project, Series A, 4.0%, 4/1/2057 | 6,000,000 | 5,112,500 | |
San Antonio, TX, Education Facilities Corp. Higher Education Revenue, Hallmark University Project: | |||
Series A, 5.0%, 10/1/2041 | 350,000 | 302,634 | |
Series A, 5.0%, 10/1/2051 | 520,000 | 422,960 | |
Temple, TX, Tax Increment, Reinvestment Zone No. 1: | |||
Series A, 4.0%, 8/1/2039, INS: BAM | 170,000 | 168,751 | |
Series A, 4.0%, 8/1/2041, INS: BAM | 235,000 | 226,942 | |
Series A, 5.0%, 8/1/2038 | 2,830,000 | 2,874,187 | |
Texas, New Hope Cultural Education Facilities Finance Corp., Educational Revenue, Cumberland Academy Project, Series A, 144A, 5.0%, 8/15/2050 | 3,550,000 | 3,182,944 | |
Texas, New Hope Cultural Education Facilities Finance Corp., Retirement Facilities Revenue, Presbyterian Village North Project: | |||
5.0%, 10/1/2039 | 1,820,000 | 1,552,919 | |
Series A, 5.25%, 10/1/2055 | 3,200,000 | 2,551,436 | |
24 | | | DWS Strategic High Yield Tax-Free Fund |
Principal Amount ($) | Value ($) | ||
Texas, New Hope Cultural Education Facilities Finance Corp., Senior Living Revenue, Bridgemoor Plano Project, Series A, 7.25%, 12/1/2053* (c) | 6,605,000 | 5,944,500 | |
Texas, Private Activity Bond, Surface Transportation Corp. Revenue, Senior Lien Revenue, Infrastructure Group LLC, I-635 Managed Lanes Project: | |||
Series A, 4.0%, 6/30/2038 | 380,000 | 351,223 | |
Series A, 4.0%, 12/31/2038 | 380,000 | 350,597 | |
Series A, 4.0%, 6/30/2039 | 290,000 | 265,777 | |
Series A, 4.0%, 12/31/2039 | 335,000 | 306,462 | |
Series A, 4.0%, 6/30/2040 | 275,000 | 249,061 | |
Texas, State Municipal Gas Acquisition & Supply Corp. I, Gas Supply Revenue, Series D, 6.25%, 12/15/2026, GTY: Merrill Lynch & Co. | 3,020,000 | 3,156,065 | |
Texas, State Private Activity Bond, Surface Transportation Corp. Revenue, Senior Lien, North Tarrant Express Mobility Partners Segments LLC, AMT, 6.75%, 6/30/2043 | 2,220,000 | 2,267,129 | |
48,376,308 | |||
Utah 1.7% | |||
Utah, Infrastructure Agency Telecommunication Revenue: | |||
4.0%, 10/15/2041 | 600,000 | 509,396 | |
Series 2019, 4.0%, 10/15/2042 | 2,350,000 | 1,982,654 | |
Utah, State Charter School Finance Authority, St. George Campus Project, Series A, 144A, 5.0%, 6/15/2052 | 1,130,000 | 975,885 | |
Utah, State Charter School Financing Authority Revenue, Freedom Academy Foundation Project, 144A, 5.375%, 6/15/2048 | 6,490,000 | 5,994,985 | |
9,462,920 | |||
Virginia 3.2% | |||
Prince William County, VA, Industrial Development Authority, Residential Care Facilities, Westminster at Lake Ridge: | |||
5.0%, 1/1/2037 | 1,000,000 | 891,781 | |
5.0%, 1/1/2046 | 1,530,000 | 1,268,618 | |
Roanoke County, VA, Economic Development Authority, RSDL Care Facilities Revenue, Richfield Living: | |||
Series 2020, 5.0%, 9/1/2050* | 1,740,000 | 1,144,799 | |
Series A, 5.375%, 9/1/2054* | 1,500,000 | 1,027,147 | |
Virginia, Marquis Community Development Authority Revenue: | |||
Series C, Zero Coupon, 9/1/2041 | 7,906,000 | 371,629 | |
Series B, 2.823%, 9/1/2041 (c) (d) | 5,332,000 | 2,355,229 | |
144A, 3.75%, 9/1/2045 (c) (d) | 1,640,000 | 730,541 | |
DWS Strategic High Yield Tax-Free Fund | | | 25 |
Principal Amount ($) | Value ($) | ||
Virginia, Peninsula Town Center, Community Development Authority Revenue, Special Obligation: | |||
144A, 5.0%, 9/1/2037 | 1,400,000 | 1,305,784 | |
144A, 5.0%, 9/1/2045 | 4,100,000 | 3,698,677 | |
Virginia, Small Business Financing Authority Revenue, 95 Express Lanes LLC Project, AMT, 4.0%, 1/1/2048 | 1,205,000 | 1,007,174 | |
Virginia, Small Business Financing Authority, Elizabeth River Crossings OPCO LLC Project, AMT, 4.0%, 1/1/2039 | 1,500,000 | 1,386,791 | |
Virginia, Small Business Financing Authority, I-495 Hot Lanes Project: | |||
AMT, 5.0%, 12/31/2052 | 1,500,000 | 1,541,143 | |
AMT, 5.0%, 12/31/2057 | 500,000 | 511,693 | |
17,241,006 | |||
Washington 2.8% | |||
Washington, State Convention Center Public Facilities District: | |||
Series B, 3.0%, 7/1/2043 | 4,710,000 | 3,337,617 | |
Series B, 3.0%, 7/1/2048 | 4,120,000 | 2,691,026 | |
Series B, 3.0%, 7/1/2058 | 2,080,000 | 1,241,862 | |
Washington, State Higher Educational Facilities Authority, Seattle University Project, 4.0%, 5/1/2050 | 1,020,000 | 910,592 | |
Washington, State Housing Finance Commission, Non-Profit Housing Revenue, Rockwood Retirement Communities Project, Series A, 144A, 7.375%, 1/1/2044 | 4,000,000 | 4,013,439 | |
Washington, State Housing Finance Commission, The Hearthstone Project: | |||
Series A, 144A, 5.0%, 7/1/2038 | 775,000 | 639,585 | |
Series A, 144A, 5.0%, 7/1/2048 | 1,735,000 | 1,306,233 | |
Series A, 144A, 5.0%, 7/1/2053 | 1,125,000 | 825,030 | |
14,965,384 | |||
Wisconsin 5.9% | |||
Wisconsin, Health Educational Facilities Authority, Covenant Communities, Inc. Project: | |||
Series A-1, 5.0%, 7/1/2043 | 4,150,000 | 4,097,314 | |
Series B, 5.0%, 7/1/2048 | 1,910,000 | 1,436,162 | |
Series B, 5.0%, 7/1/2053 | 2,125,000 | 1,546,157 | |
Wisconsin, Public Finance Authority Educational Facility Revenue, Noorba College of Osteopathic Media Project, Series B, 144A, 6.5%, 6/1/2045 | 6,000,000 | 4,773,991 | |
Wisconsin, Public Finance Authority, Education Revenue, Mountain Island Charter School Ltd.: | |||
5.0%, 7/1/2047 | 2,000,000 | 1,958,824 | |
5.0%, 7/1/2052 | 910,000 | 879,230 | |
26 | | | DWS Strategic High Yield Tax-Free Fund |
Principal Amount ($) | Value ($) | ||
Wisconsin, Public Finance Authority, Education Revenue, North Carolina Leadership Academy, 144A, 5.0%, 6/15/2049 | 520,000 | 466,581 | |
Wisconsin, Public Finance Authority, Green Bond, Fargo Moorhead, AMT, 4.0%, 3/31/2056 | 3,205,000 | 2,444,007 | |
Wisconsin, Public Finance Authority, Hospital Revenue, Carson Valley Medical Center, Series A, 4.0%, 12/1/2051 | 1,290,000 | 1,019,149 | |
Wisconsin, Public Finance Authority, Pollution Control Revenue, Duke Energy Progress Project, Series A, 3.7% (a), 10/1/2046 | 2,700,000 | 2,703,601 | |
Wisconsin, Public Finance Authority, Roseman University of Health Sciences Project: | |||
144A, 4.0%, 4/1/2042 | 255,000 | 201,548 | |
144A, 4.0%, 4/1/2052 | 455,000 | 329,593 | |
Wisconsin, Public Finance Authority, Senior Living Community First Mortgage Revenue, Cedars Obligated Group: | |||
144A, 5.5%, 5/1/2039 | 635,000 | 552,935 | |
144A, 5.75%, 5/1/2054 | 3,570,000 | 2,997,825 | |
Wisconsin, Public Finance Authority, Wisconsin Hotel Revenue, Senior Lien Grand Hyatt San Antonio Hotel, Series B, 144A, 6.0%, 2/1/2062 | 7,000,000 | 6,622,293 | |
32,029,210 | |||
Guam 0.7% | |||
Guam, Antonio B. Won Pat International Airport Authority: | |||
Series C, AMT, 6.25%, 10/1/2034 | 300,000 | 307,696 | |
Series C, AMT, Prerefunded, 6.25%, 10/1/2034 | 200,000 | 205,131 | |
Guam, Government Waterworks Authority, Water & Wastewater System Revenue: | |||
5.0%, 1/1/2046 | 1,050,000 | 1,055,148 | |
Series A, 5.0%, 1/1/2050 | 655,000 | 658,062 | |
Guam, International Airport Authority Revenue: | |||
Series C, AMT, 6.375%, 10/1/2043 | 775,000 | 795,669 | |
Series C, AMT, Prerefunded, 6.375%, 10/1/2043 | 835,000 | 857,270 | |
3,878,976 | |||
Puerto Rico 4.7% | |||
Puerto Rico, Commonwealth Aqueduct and Sewer Authority, Series A, 144A, 4.0%, 7/1/2042 | 5,000,000 | 4,238,722 | |
Puerto Rico, General Obligation: | |||
Series A, Zero Coupon, 7/1/2024 | 85,592 | 78,654 | |
Series A, Zero Coupon, 7/1/2033 | 329,431 | 180,832 | |
Series A1, 4.0%, 7/1/2033 | 255,987 | 223,052 | |
Series A1, 4.0%, 7/1/2035 | 230,098 | 196,230 | |
DWS Strategic High Yield Tax-Free Fund | | | 27 |
Principal Amount ($) | Value ($) | ||
Series A1, 4.0%, 7/1/2037 | 1,507,160 | 1,259,644 | |
Series A1, 4.0%, 7/1/2041 | 1,098,773 | 883,113 | |
Series A1, 5.25%, 7/1/2023 | 142,945 | 143,571 | |
Series A1, 5.375%, 7/1/2025 | 285,097 | 289,213 | |
Series A1, 5.625%, 7/1/2027 | 282,516 | 289,362 | |
Series A1, 5.625%, 7/1/2029 | 277,932 | 284,897 | |
Series A1, 5.75%, 7/1/2031 | 269,953 | 277,292 | |
Puerto Rico, Sales Tax Financing Corp., Sales Tax Revenue: | |||
Series A-1, Zero Coupon, 7/1/2046 | 12,255,000 | 3,088,568 | |
Series A-1, 4.75%, 7/1/2053 | 6,800,000 | 6,213,190 | |
Series A-1, 5.0%, 7/1/2058 | 5,000,000 | 4,744,053 | |
Puerto Rico, The Childrens Trust Fund, Tobacco Settlement Revenue, Series A, Zero Coupon, 5/15/2057 | 50,000,000 | 3,315,360 | |
25,705,753 | |||
Other 0.5% | |||
Freddie Mac Multi-Family ML Certificates, “A-CA” , Series 2021-ML10, 2.046%, 6/25/2038 | 3,384,242 | 2,549,262 | |
Total Municipal Investments (Cost $565,890,878) | 506,520,019 | ||
Underlying Municipal Bonds of Inverse Floaters (e) 2.9% | |||
Washington | |||
Washington, State General Obligation, Series A-1, 5.0%, 8/1/2037 (f) (Cost $15,934,588) | 15,000,000 | 15,697,217 | |
Trust: State General Obligation, Series XM0127, 144A, 12.32%, 8/1/2023, Leverage Factor at purchase date: 4 to 1 | |||
Corporate Bonds 0.4% | |||
Consumer Discretionary | |||
Grand Canyon University, 5.125%, 10/1/2028 (Cost $2,165,000) | 2,165,000 | 2,008,687 | |
Government & Agency Obligations 0.3% | |||
U.S. Treasury Obligations | |||
U.S. Treasury Bills: | |||
1.933% (g), 4/20/2023 (h) | 500,000 | 491,524 | |
28 | | | DWS Strategic High Yield Tax-Free Fund |
Principal Amount ($) | Value ($) | ||
2.564% (g), 4/20/2023 (h) | 500,000 | 491,524 | |
3.538% (g), 4/20/2023 (h) | 500,000 | 491,524 | |
Total Government & Agency Obligations (Cost $1,484,377) | 1,474,572 | ||
Shares | Value ($) | ||
Closed-End Investment Companies 0.4% | |||
Nuveen Quality Municipal Income Fund (Cost $2,515,604) | 172,000 | 2,039,920 | |
Open-End Investment Companies 2.9% | |||
BlackRock Liquidity Funds MuniCash Portfolio, Institutional Shares, 1.8% (i) (Cost $15,973,919) | 15,972,067 | 15,973,664 | |
% of Net Assets | Value ($) | ||
Total Investment Portfolio (Cost $603,964,366) | 100.2 | 543,714,079 | |
Floating Rate Notes (e) | (2.1) | (11,250,000) | |
Other Assets and Liabilities, Net | 1.9 | 10,153,147 | |
Net Assets | 100.0 | 542,617,226 | |
* | Non-income producing security. |
(a) | Variable or floating rate security. These securities are shown at their current rate as of November 30, 2022. For securities based on a published reference rate and spread, the reference rate and spread are indicated within the description above. Certain variable rate securities are not based on a published reference rate and spread but adjust periodically based on current market conditions, prepayment of underlying positions and/or other variables. Securities with a floor or ceiling feature are disclosed at the inherent rate, where applicable. |
(b) | Variable rate demand notes and variable rate demand preferred shares are securities whose interest rates are reset periodically (usually daily mode or weekly mode) by remarketing agents based on current market levels, and are not directly set as a fixed spread to a reference rate. These securities may be redeemed at par by the holder through a put or tender feature, and are shown at their current rates as of November 30, 2022. Date shown reflects the earlier of demand date or stated maturity date. |
(c) | Defaulted security or security for which income has been deemed uncollectible. |
(d) | Security currently paying partial interest. The rate shown represents 50% of the original coupon rate. |
(e) | Securities represent the underlying municipal obligations of inverse floating rate obligations held by the Fund. The Floating Rate Notes represents leverage to the Fund and is the amount owed to the floating rate note holders. |
(f) | Security forms part of the below inverse floater. The Fund accounts for these inverse floaters as a form of secured borrowing, by reflecting the value of the underlying bond in the investments of the Fund and the amount owed to the floating rate note holder as a liability. |
(g) | Annualized yield at time of purchase; not a coupon rate. |
DWS Strategic High Yield Tax-Free Fund | | | 29 |
(h) | At November 30, 2022, this security has been pledged, in whole or in part, to cover initial margin requirements for open futures contracts. |
(i) | Current yield; not a coupon rate. |
144A: Security exempt from registration under Rule 144A of the Securities Act of 1933. These securities may be resold in transactions exempt from registration, normally to qualified institutional buyers. |
AGMC: Assured Guaranty Municipal Corp. |
AMBAC: Ambac Financial Group, Inc. |
AMT: Subject to alternative minimum tax. |
BAM: Build America Mutual |
GTY: Guaranty Agreement |
INS: Insured |
MUNIPSA: SIFMA Municipal Swap Index Yield |
Prerefunded: Bonds which are prerefunded are collateralized usually by U.S. Treasury securities which are held in escrow and used to pay principal and interest on tax-exempt issues and to retire the bonds in full at the earliest refunding date. |
SIFMA: Securities Industry and Financial Markets Association |
SPA: Standby Bond Purchase Agreement |
Futures | Currency | Expiration Date | Contracts | Notional Amount ($) | Notional Value ($) | Unrealized Appreciation/ (Depreciation) ($) |
U.S. Treasury Note | USD | 3/22/2023 | 150 | 19,153,374 | 19,050,000 | 103,374 |
U.S. Treasury Note | USD | 3/22/2023 | 350 | 39,702,226 | 39,725,000 | (22,774) |
Total net unrealized appreciation | 80,600 | |||||
USD | United States Dollar |
30 | | | DWS Strategic High Yield Tax-Free Fund |
Assets | Level 1 | Level 2 | Level 3 | Total |
Municipal Investments (a) | $ — | $522,217,236 | $— | $522,217,236 |
Corporate Bonds | — | 2,008,687 | — | 2,008,687 |
Government & Agency Obligations | — | 1,474,572 | — | 1,474,572 |
Closed-End Investment Companies | 2,039,920 | — | — | 2,039,920 |
Open-End Investment Companies | 15,973,664 | — | — | 15,973,664 |
Derivatives (b) | ||||
Futures Contracts | 103,374 | — | — | 103,374 |
Total | $18,116,958 | $525,700,495 | $— | $543,817,453 |
Liabilities | Level 1 | Level 2 | Level 3 | Total |
Derivatives (b) | ||||
Futures Contracts | $ (22,774) | $ — | $— | $ (22,774) |
Total | $(22,774) | $— | $— | $(22,774) |
(a) | See Investment Portfolio for additional detailed categorizations. |
(b) | Derivatives include unrealized appreciation (depreciation) on open futures contracts. |
DWS Strategic High Yield Tax-Free Fund | | | 31 |
Assets | |
Investment in securities, at value (cost $603,964,366) | $ 543,714,079 |
Receivable for investments sold | 2,854,406 |
Receivable for Fund shares sold | 1,497,459 |
Dividends receivable | 7,998 |
Interest receivable | 8,002,083 |
Other assets | 57,860 |
Total assets | 556,133,885 |
Liabilities | |
Payable for Fund shares redeemed | 999,141 |
Payable for variation margin on futures contracts | 232,031 |
Payable for floating rate notes issued | 11,250,000 |
Distributions payable | 362,938 |
Accrued management fee | 151,198 |
Accrued Trustees' fees | 17,754 |
Other accrued expenses and payables | 503,597 |
Total liabilities | 13,516,659 |
Net assets, at value | $542,617,226 |
Net Assets Consist of | |
Distributable earnings (loss) | (165,190,546) |
Paid-in capital | 707,807,772 |
Net assets, at value | $542,617,226 |
32 | | | DWS Strategic High Yield Tax-Free Fund |
Net Asset Value | |
Class A | |
Net Asset Value and redemption price per share ($152,084,333 ÷ 14,884,307 outstanding shares of beneficial interest, $.01 par value, unlimited shares authorized) | $ 10.22 |
Maximum offering price per share (100 ÷ 97.25 of $10.22) | $ 10.51 |
Class C | |
Net Asset Value, offering and redemption price (subject to contingent deferred sales charge) per share ($7,560,811 ÷ 739,255 outstanding shares of beneficial interest, $.01 par value, unlimited shares authorized) | $ 10.23 |
Class S | |
Net Asset Value, offering and redemption price per share ($276,404,280 ÷ 27,027,857 outstanding shares of beneficial interest, $.01 par value, unlimited shares authorized) | $ 10.23 |
Institutional Class | |
Net Asset Value, offering and redemption price per share ($106,567,802 ÷ 10,416,817 outstanding shares of beneficial interest, $.01 par value, unlimited shares authorized) | $ 10.23 |
DWS Strategic High Yield Tax-Free Fund | | | 33 |
Investment Income | |
Income: | |
Interest | $ 14,819,807 |
Dividends | 54,095 |
Total income | 14,873,902 |
Expenses: | |
Management fee | 1,329,430 |
Administration fee | 304,160 |
Services to shareholders | 503,047 |
Distribution and service fees | 244,209 |
Custodian fee | 7,101 |
Professional fees | 49,024 |
Reports to shareholders | 26,700 |
Registration fees | 37,876 |
Trustees' fees and expenses | 20,078 |
Interest expense and fees on floating rate notes issued | 160,716 |
Other | 24,273 |
Total expenses before expense reductions | 2,706,614 |
Expense reductions | (415,793) |
Total expenses after expense reductions | 2,290,821 |
Net investment income | 12,583,081 |
Realized and Unrealized Gain (Loss) | |
Net realized gain (loss) from: | |
Investments | (20,840,946) |
Futures | 2,668,856 |
(18,172,090) | |
Change in net unrealized appreciation (depreciation) on: | |
Investments | (34,145,701) |
Futures | (78,914) |
(34,224,615) | |
Net gain (loss) | (52,396,705) |
Net increase (decrease) in net assets resulting from operations | $ (39,813,624) |
34 | | | DWS Strategic High Yield Tax-Free Fund |
Six Months Ended November 30, 2022 | Year Ended May 31, | |
Increase (Decrease) in Net Assets | (Unaudited) | 2022 |
Operations: | ||
Net investment income | $ 12,583,081 | $ 32,854,851 |
Net realized gain (loss) | (18,172,090) | 4,394,507 |
Change in net unrealized appreciation (depreciation) | (34,224,615) | (126,532,794) |
Net increase (decrease) in net assets resulting from operations | (39,813,624) | (89,283,436) |
Distributions to shareholders: | ||
Class A | (3,119,137) | (6,638,421) |
Class C | (123,685) | (306,224) |
Class S | (6,692,968) | (18,128,952) |
Institutional Class | (2,491,921) | (7,462,583) |
Total distributions | (12,427,711) | (32,536,180) |
Fund share transactions: | ||
Proceeds from shares sold | 63,489,009 | 235,451,400 |
Reinvestment of distributions | 10,147,990 | 27,182,504 |
Payments for shares redeemed | (227,560,270) | (432,060,829) |
Net increase (decrease) in net assets from Fund share transactions | (153,923,271) | (169,426,925) |
Increase (decrease) in net assets | (206,164,606) | (291,246,541) |
Net assets at beginning of period | 748,781,832 | 1,040,028,373 |
Net assets at end of period | $542,617,226 | $748,781,832 |
DWS Strategic High Yield Tax-Free Fund | | | 35 |
DWS Strategic High Yield Tax-Free Fund — Class A | ||||||
Six Months Ended 11/30/22 | Years Ended May 31, | |||||
(Unaudited) | 2022 | 2021 | 2020 | 2019 | 2018 | |
Selected Per Share Data | ||||||
Net asset value, beginning of period | $11.02 | $12.59 | $11.37 | $12.13 | $12.08 | $12.27 |
Income (loss) from investment operations: | ||||||
Net investment income | .20 | .39 | .42 | .45 | .46 | .44 |
Net realized and unrealized gain (loss) | (.80) | (1.57) | 1.23 | (.77) | .08 | (.19) |
Total from investment operations | (.60) | (1.18) | 1.65 | (.32) | .54 | .25 |
Less distributions from: | ||||||
Net investment income | (.20) | (.39) | (.42) | (.44) | (.46) | (.43) |
Net realized gains | — | (.00)* | (.01) | (.00)* | (.03) | (.01) |
Total distributions | (.20) | (.39) | (.43) | (.44) | (.49) | (.44) |
Net asset value, end of period | $10.22 | $11.02 | $12.59 | $11.37 | $12.13 | $12.08 |
Total Return (%)a,b | (5.46)** | (9.55) | 14.56 | (2.74) | 4.62 | 2.11 |
Ratios to Average Net Assets and Supplemental Data | ||||||
Net assets, end of period ($ millions) | 152 | 182 | 216 | 181 | 195 | 225 |
Ratio of expenses before expense reductions (including interest expense) (%)c | .97*** | .90 | .90 | .95 | .98 | .95 |
Ratio of expenses after expense reductions (including interest expense) (%)c | .90*** | .87 | .87 | .91 | .91 | .91 |
Ratio of expenses after expense reductions (excluding interest expense) (%) | .85*** | .84 | .84 | .85 | .86 | .87 |
Ratio of net investment income (%) | 3.85*** | 3.21 | 3.51 | 3.72 | 3.87 | 3.61 |
Portfolio turnover rate (%) | 33** | 69 | 59 | 52 | 47 | 34 |
a | Total return does not reflect the effect of any sales charges. |
b | Total return would have been lower had certain expenses not been reduced. |
c | Interest expense represents interest and fees on short-term floating rate notes issued in conjunction with inverse floating rate securities. Interest income from such transactions is included in income from investment operations. |
* | Amount is less than $.005. |
** | Not annualized |
*** | Annualized |
36 | | | DWS Strategic High Yield Tax-Free Fund |
DWS Strategic High Yield Tax-Free Fund — Class C | ||||||
Six Months Ended 11/30/22 | Years Ended May 31, | |||||
(Unaudited) | 2022 | 2021 | 2020 | 2019 | 2018 | |
Selected Per Share Data | ||||||
Net asset value, beginning of period | $11.03 | $12.60 | $11.38 | $12.13 | $12.09 | $12.28 |
Income (loss) from investment operations: | ||||||
Net investment income | .16 | .30 | .33 | .36 | .37 | .35 |
Net realized and unrealized gain (loss) | (.80) | (1.57) | 1.22 | (.76) | .07 | (.19) |
Total from investment operations | (.64) | (1.27) | 1.55 | (.40) | .44 | .16 |
Less distributions from: | ||||||
Net investment income | (.16) | (.30) | (.32) | (.35) | (.37) | (.34) |
Net realized gains | — | (.00)* | (.01) | (.00)* | (.03) | (.01) |
Total distributions | (.16) | (.30) | (.33) | (.35) | (.40) | (.35) |
Net asset value, end of period | $10.23 | $11.03 | $12.60 | $11.38 | $12.13 | $12.09 |
Total Return (%)a,b | (5.81)** | (10.22) | 13.68 | (3.39) | 3.75 | 1.35 |
Ratios to Average Net Assets and Supplemental Data | ||||||
Net assets, end of period ($ millions) | 8 | 9 | 14 | 33 | 52 | 88 |
Ratio of expenses before expense reductions (including interest expense) (%)c | 1.75*** | 1.66 | 1.66 | 1.71 | 1.75 | 1.71 |
Ratio of expenses after expense reductions (including interest expense) (%)c | 1.65*** | 1.62 | 1.62 | 1.66 | 1.66 | 1.66 |
Ratio of expenses after expense reductions (excluding interest expense) (%) | 1.60*** | 1.59 | 1.59 | 1.60 | 1.61 | 1.62 |
Ratio of net investment income (%) | 3.10*** | 2.46 | 2.77 | 2.97 | 3.10 | 2.86 |
Portfolio turnover rate (%) | 33** | 69 | 59 | 52 | 47 | 34 |
a | Total return does not reflect the effect of any sales charges. |
b | Total return would have been lower had certain expenses not been reduced. |
c | Interest expense represents interest and fees on short-term floating rate notes issued in conjunction with inverse floating rate securities. Interest income from such transactions is included in income from investment operations. |
* | Amount is less than $.005. |
** | Not annualized |
*** | Annualized |
DWS Strategic High Yield Tax-Free Fund | | | 37 |
DWS Strategic High Yield Tax-Free Fund — Class S | ||||||
Six Months Ended 11/30/22 | Years Ended May 31, | |||||
(Unaudited) | 2022 | 2021 | 2020 | 2019 | 2018 | |
Selected Per Share Data | ||||||
Net asset value, beginning of period | $11.03 | $12.60 | $11.38 | $12.14 | $12.09 | $12.28 |
Income (loss) from investment operations: | ||||||
Net investment income | .21 | .42 | .45 | .47 | .49 | .47 |
Net realized and unrealized gain (loss) | (.80) | (1.57) | 1.23 | (.76) | .08 | (.18) |
Total from investment operations | (.59) | (1.15) | 1.68 | (.29) | .57 | .29 |
Less distributions from: | ||||||
Net investment income | (.21) | (.42) | (.45) | (.47) | (.49) | (.47) |
Net realized gains | — | (.00)* | (.01) | (.00)* | (.03) | (.01) |
Total distributions | (.21) | (.42) | (.46) | (.47) | (.52) | (.48) |
Net asset value, end of period | $10.23 | $11.03 | $12.60 | $11.38 | $12.14 | $12.09 |
Total Return (%)a | (5.33)** | (9.31) | 14.83 | (2.49) | 4.88 | 2.37 |
Ratios to Average Net Assets and Supplemental Data | ||||||
Net assets, end of period ($ millions) | 276 | 405 | 567 | 576 | 661 | 1,204 |
Ratio of expenses before expense reductions (including interest expense) (%)b | .83*** | .74 | .73 | .80 | .84 | .81 |
Ratio of expenses after expense reductions (including interest expense) (%)b | .65*** | .62 | .62 | .66 | .66 | .66 |
Ratio of expenses after expense reductions (excluding interest expense) (%) | .60*** | .59 | .59 | .60 | .61 | .62 |
Ratio of net investment income (%) | 4.09*** | 3.46 | 3.76 | 3.97 | 4.07 | 3.86 |
Portfolio turnover rate (%) | 33** | 69 | 59 | 52 | 47 | 34 |
a | Total return would have been lower had certain expenses not been reduced. |
b | Interest expense represents interest and fees on short-term floating rate notes issued in conjunction with inverse floating rate securities. Interest income from such transactions is included in income from investment operations. |
* | Amount is less than $.005. |
** | Not annualized |
*** | Annualized |
38 | | | DWS Strategic High Yield Tax-Free Fund |
DWS Strategic High Yield Tax-Free Fund — Institutional Class | ||||||
Six Months Ended 11/30/22 | Years Ended May 31, | |||||
(Unaudited) | 2022 | 2021 | 2020 | 2019 | 2018 | |
Selected Per Share Data | ||||||
Net asset value, beginning of period | $11.03 | $12.60 | $11.39 | $12.14 | $12.10 | $12.29 |
Income (loss) from investment operations: | ||||||
Net investment income | .21 | .43 | .45 | .49 | .49 | .47 |
Net realized and unrealized gain (loss) | (.80) | (1.58) | 1.22 | (.77) | .07 | (.18) |
Total from investment operations | (.59) | (1.15) | 1.67 | (.28) | .56 | .29 |
Less distributions from: | ||||||
Net investment income | (.21) | (.42) | (.45) | (.47) | (.49) | (.47) |
Net realized gains | — | (.00)* | (.01) | (.00)* | (.03) | (.01) |
Total distributions | (.21) | (.42) | (.46) | (.47) | (.52) | (.48) |
Net asset value, end of period | $10.23 | $11.03 | $12.60 | $11.39 | $12.14 | $12.10 |
Total Return (%)a | (5.33)** | (9.38) | 14.82 | (2.41) | 4.80 | 2.37 |
Ratios to Average Net Assets and Supplemental Data | ||||||
Net assets, end of period ($ millions) | 107 | 153 | 242 | 207 | 181 | 159 |
Ratio of expenses before expense reductions (including interest expense) (%)b | .75*** | .68 | .68 | .74 | .70 | .70 |
Ratio of expenses after expense reductions (including interest expense) (%)b | .65*** | .62 | .62 | .66 | .66 | .66 |
Ratio of expenses after expense reductions (excluding interest expense) (%) | .60*** | .59 | .59 | .60 | .61 | .62 |
Ratio of net investment income (%) | 4.09*** | 3.46 | 3.76 | 3.97 | 4.13 | 3.86 |
Portfolio turnover rate (%) | 33** | 69 | 59 | 52 | 47 | 34 |
a | Total return would have been lower had certain expenses not been reduced. |
b | Interest expense represents interest and fees on short-term floating rate notes issued in conjunction with inverse floating rate securities. Interest income from such transactions is included in income from investment operations. |
* | Amount is less than $.005. |
** | Not annualized |
*** | Annualized |
DWS Strategic High Yield Tax-Free Fund | | | 39 |
40 | | | DWS Strategic High Yield Tax-Free Fund |
DWS Strategic High Yield Tax-Free Fund | | | 41 |
42 | | | DWS Strategic High Yield Tax-Free Fund |
DWS Strategic High Yield Tax-Free Fund | | | 43 |
44 | | | DWS Strategic High Yield Tax-Free Fund |
DWS Strategic High Yield Tax-Free Fund | | | 45 |
Assets Derivative | Futures Contracts |
Interest Rate Contracts (a) | $ 103,374 |
The above derivative is located in the following Statement of Assets and Liabilities account: | |
(a) | Includes cumulative appreciation of futures contracts as disclosed in the Investment Portfolio. Unsettled variation margin is disclosed separately within the Statement of Assets and Liabilities. |
Liability Derivative | Futures Contracts |
Interest Rate Contracts (a) | $ (22,774) |
The above derivative is located in the following Statement of Assets and Liabilities account: | |
(a) | Includes cumulative depreciation of futures contracts as disclosed in the Investment Portfolio. Unsettled variation margin is disclosed separately within the Statement of Assets and Liabilities. |
Realized Gain (Loss) | Futures Contracts |
Interest Rate Contracts (a) | $ 2,668,856 |
The above derivative is located in the following Statement of Operations account: | |
(a) | Net realized gain (loss) from futures contracts |
Change in Net Unrealized Appreciation (Depreciation) | Futures Contracts |
Interest Rate Contracts (a) | $ (78,914) |
The above derivative is located in the following Statement of Operations account: | |
(a) | Change in net unrealized appreciation (depreciation) on futures contracts |
46 | | | DWS Strategic High Yield Tax-Free Fund |
First $300 million of the Fund’s average daily net assets | .455% |
Next $200 million of such net assets | .405% |
Next $500 million of such net assets | .380% |
Next $500 million of such net assets | .360% |
Next $500 million of such net assets | .350% |
Over $2 billion of such net assets | .340% |
Class A | .85% |
Class C | 1.60% |
Class S | .60% |
Institutional Class | .60% |
DWS Strategic High Yield Tax-Free Fund | | | 47 |
Class A | $ 55,548 |
Class C | 3,974 |
Class S | 295,463 |
Institutional Class | 60,808 |
$ 415,793 |
Services to Shareholders | Total Aggregated | Unpaid at November 30, 2022 |
Class A | $ 3,589 | $ 1,275 |
Class C | 179 | 64 |
Class S | 29,476 | 10,149 |
Institutional Class | 376 | 112 |
$ 33,620 | $ 11,600 |
48 | | | DWS Strategic High Yield Tax-Free Fund |
Sub-Recordkeeping | Total Aggregated |
Class A | $ 72,737 |
Class C | 4,761 |
Class S | 305,258 |
Institutional Class | 74,957 |
$ 457,713 |
Distribution Fee | Total Aggregated | Unpaid at November 30, 2022 |
Class C | $ 30,436 | $ 4,586 |
Service Fee | Total Aggregated | Unpaid at November 30, 2022 | Annualized Rate |
Class A | $ 203,650 | $ 62,100 | .25% |
Class C | 10,123 | 3,110 | .25% |
$ 213,773 | $ 65,210 |
DWS Strategic High Yield Tax-Free Fund | | | 49 |
50 | | | DWS Strategic High Yield Tax-Free Fund |
Six Months Ended November 30, 2022 | Year Ended May 31, 2022 | |||
Shares | Dollars | Shares | Dollars | |
Shares sold | ||||
Class A | 1,366,302 | $ 14,169,181 | 2,137,131 | $ 25,344,932 |
Class C | 46,867 | 465,096 | 90,268 | 1,124,262 |
Class S | 622,788 | 6,404,960 | 10,633,538 | 126,067,225 |
Institutional Class | 4,149,307 | 42,449,772 | 6,799,561 | 82,914,981 |
$ 63,489,009 | $ 235,451,400 | |||
Shares issued to shareholders in reinvestment of distributions | ||||
Class A | 267,631 | $ 2,749,911 | 481,126 | $ 5,835,839 |
Class C | 11,041 | 113,495 | 22,113 | 269,098 |
Class S | 555,055 | 5,718,182 | 1,315,480 | 16,004,272 |
Institutional Class | 152,098 | 1,566,402 | 414,987 | 5,073,295 |
$ 10,147,990 | $ 27,182,504 | |||
Shares redeemed | ||||
Class A | (3,245,049) | $ (33,419,226) | (3,293,737) | $ (39,069,026) |
Class C | (174,557) | (1,819,612) | (404,688) | (4,860,283) |
Class S | (10,856,242) | (112,138,354) | (20,259,024) | (237,224,768) |
Institutional Class | (7,744,597) | (80,183,078) | (12,588,738) | (150,906,752) |
$ (227,560,270) | $ (432,060,829) | |||
DWS Strategic High Yield Tax-Free Fund | | | 51 |
Six Months Ended November 30, 2022 | Year Ended May 31, 2022 | |||
Shares | Dollars | Shares | Dollars | |
Net increase (decrease) | ||||
Class A | (1,611,116) | $ (16,500,134) | (675,480) | $ (7,888,255) |
Class C | (116,649) | (1,241,021) | (292,307) | (3,466,923) |
Class S | (9,678,399) | (100,015,212) | (8,310,006) | (95,153,271) |
Institutional Class | (3,443,192) | (36,166,904) | (5,374,190) | (62,918,476) |
$ (153,923,271) | $ (169,426,925) | |||
52 | | | DWS Strategic High Yield Tax-Free Fund |
DWS Strategic High Yield Tax-Free Fund | | | 53 |
Actual Fund Return | Class A | Class C | Class S | Institutional Class |
Beginning Account Value 6/1/22 | $1,000.00 | $1,000.00 | $1,000.00 | $1,000.00 |
Ending Account Value 11/30/22 | $945.40 | $941.90 | $946.70 | $946.70 |
Expenses Paid per $1,000* | $4.39 | $8.03 | $3.17 | $3.17 |
Hypothetical 5% Fund Return | Class A | Class C | Class S | Institutional Class |
Beginning Account Value 6/1/22 | $1,000.00 | $1,000.00 | $1,000.00 | $1,000.00 |
Ending Account Value 11/30/22 | $1,020.56 | $1,016.80 | $1,021.81 | $1,021.81 |
Expenses Paid per $1,000* | $4.56 | $8.34 | $3.29 | $3.29 |
* | Expenses are equal to the Fund’s annualized expense ratio for each share class, multiplied by the average account value over the period, multiplied by 183 (the number of days in the most recent six-month period), then divided by 365. |
Annualized Expense Ratios | Class A | Class C | Class S | Institutional Class |
DWS Strategic High Yield Tax-Free Fund† | .90% | 1.65% | .65% | .65% |
† | Includes interest expense and fees on short-term floating rate notes issued in conjunction with inverse floating rate securities of 0.05% for each class. |
54 | | | DWS Strategic High Yield Tax-Free Fund |
DWS Strategic High Yield Tax-Free Fund | | | 55 |
56 | | | DWS Strategic High Yield Tax-Free Fund |
DWS Strategic High Yield Tax-Free Fund | | | 57 |
58 | | | DWS Strategic High Yield Tax-Free Fund |
For More Information | The automated telephone system allows you to access personalized account information and obtain information on other DWS funds using either your voice or your telephone keypad. Certain account types within Classes A, C and S also have the ability to purchase, exchange or redeem shares using this system. |
For more information, contact your financial representative. You may also access our automated telephone system or speak with a Shareholder Service representative by calling: (800) 728-3337 | |
Web Site | dws.com View your account transactions and balances, trade shares, monitor your asset allocation, subscribe to fund and account updates by e-mail, and change your address, 24 hours a day. |
Obtain prospectuses and applications, news about DWS funds, insight from DWS economists and investment specialists and access to DWS fund account information. | |
Written Correspondence | DWS PO Box 219151 Kansas City, MO 64121-9151 |
Proxy Voting | The Fund’s policies and procedures for voting proxies for portfolio securities and information about how the Fund voted proxies related to its portfolio securities during the most recent 12-month period ended June 30 are available on our Web site — dws.com/en-us/resources/proxy-voting — or on the SEC’s Web site — sec.gov. To obtain a written copy of the Fund’s policies and procedures without charge, upon request, call us toll free at (800) 728-3337. |
Portfolio Holdings | Following the Fund’s fiscal first and third quarter-end, a complete portfolio holdings listing is posted on dws.com, and is available free of charge by contacting your financial intermediary, or if you are a direct investor, by calling (800) 728-3337. In addition, the portfolio holdings listing is filed with SEC on the Fund’s Form N-PORT and will be available on the SEC’s Web site at sec.gov. Additional portfolio holdings for the Fund are also posted on dws.com from time to time. Please see the Fund’s current prospectus for more information. |
Principal Underwriter | If you have questions, comments or complaints, contact: DWS Distributors, Inc. 222 South Riverside Plaza Chicago, IL 60606-5808 (800) 621-1148 |
DWS Strategic High Yield Tax-Free Fund | | | 59 |
Investment Management | DWS Investment Management Americas, Inc. (“DIMA” or the “Advisor” ), which is part of the DWS Group GmbH & Co. KGaA (“DWS Group” ), is the investment advisor for the Fund. DIMA and its predecessors have more than 90 years of experience managing mutual funds and DIMA provides a full range of investment advisory services to both institutional and retail clients. DIMA is an indirect, wholly owned subsidiary of DWS Group. |
DWS Group is a global organization that offers a wide range of investing expertise and resources, including hundreds of portfolio managers and analysts and an office network that reaches the world’s major investment centers. This well-resourced global investment platform brings together a wide variety of experience and investment insight across industries, regions, asset classes and investing styles. |
Class A | Class C | Class S | Institutional Class | |
Nasdaq Symbol | NOTAX | NOTCX | SHYTX | NOTIX |
CUSIP Number | 25158T 103 | 25158T 301 | 25158T 400 | 25158T 509 |
Fund Number | 152 | 352 | 2008 | 512 |
60 | | | DWS Strategic High Yield Tax-Free Fund |
(R-025438-12 1/23)
| (b) Not applicable | ||
| ITEM 2. | CODE OF ETHICS | |
| Not applicable. | ||
| ITEM 3. | AUDIT COMMITTEE FINANCIAL EXPERT | |
| Not applicable | ||
| ITEM 4. | PRINCIPAL ACCOUNTANT FEES AND SERVICES | |
| Not applicable | ||
| ITEM 5. | AUDIT COMMITTEE OF LISTED REGISTRANTS | |
| Not applicable | ||
| ITEM 6. | SCHEDULE OF INVESTMENTS | |
| Not applicable | ||
| ITEM 7. | DISCLOSURE OF PROXY VOTING POLICIES AND PROCEDURES FOR CLOSED-END MANAGEMENT INVESTMENT COMPANIES | |
| Not applicable | ||
| ITEM 8. | PORTFOLIO MANAGERS OF CLOSED-END MANAGEMENT INVESTMENT COMPANIES | |
| Not applicable | ||
| ITEM 9. | PURCHASES OF EQUITY SECURITIES BY CLOSED-END MANAGEMENT INVESTMENT COMPANY AND AFFILIATED PURCHASERS | |
| Not applicable | ||
| ITEM 10. | SUBMISSION OF MATTERS TO A VOTE OF SECURITY HOLDERS | |
| There were no material changes to the procedures by which shareholders may recommend nominees to the Fund’s Board. The primary function of the Nominating and Governance Committee is to identify and recommend individuals for membership on the Board and oversee the administration of the Board Governance Guidelines. Shareholders may recommend candidates for Board positions by forwarding their correspondence by U.S. mail or courier service to Keith R. Fox, DWS Funds Board Chair, c/o Thomas R. Hiller, Ropes & Gray LLP, Prudential Tower, 800 Boylston Street, Boston, MA 02199-3600. | ||
| ITEM 11. | CONTROLS AND PROCEDURES | |
| (a) | The Chief Executive and Financial Officers concluded that the Registrant’s Disclosure Controls and Procedures are effective based on the evaluation of the Disclosure Controls and Procedures as of a date within 90 days of the filing date of this report. | |
| (b) | There have been no changes in the registrant’s internal control over financial reporting that occurred during the period covered by this report that has materially affected, or is reasonably likely to materially affect, the registrant’s internal controls over financial reporting. | |
| ITEM 12. | Disclosure of Securities Lending Activities for Closed-End Management Investment Companies. | |
| Not applicable | ||
| ITEM 13. | EXHIBITS | |
| (a)(1) | Not applicable | |
| (a)(2) | Certification pursuant to Rule 30a-2(a) under the Investment Company Act of 1940 (17 CFR 270.30a-2(a)) is filed and attached hereto as Exhibit 99.CERT. | |
| (b) | Certification pursuant to Rule 30a-2(b) under the Investment Company Act of 1940 (17 CFR 270.30a-2(b)) is furnished and attached hereto as Exhibit 99.906CERT. | |
SIGNATURES
Pursuant to the requirements of the Securities Exchange Act of 1934 and the Investment Company Act of 1940, the registrant has duly caused this report to be signed on its behalf by the undersigned, thereunto duly authorized.
| Registrant: | DWS Strategic High Yield Tax-Free Fund, a series of Deutsche DWS Municipal Trust |
| By: | /s/Hepsen Uzcan Hepsen Uzcan President |
| Date: | 1/27/2023 |
Pursuant to the requirements of the Securities Exchange Act of 1934 and the Investment Company Act of 1940, this report has been signed below by the following persons on behalf of the registrant and in the capacities and on the dates indicated.
| By: | /s/Hepsen Uzcan Hepsen Uzcan President |
| Date: | 1/27/2023 |
| By: | /s/Diane Kenneally Diane Kenneally Chief Financial Officer and Treasurer |
| Date: | 1/27/2023 |