Exhibit 96.2
Bulawayo Mining Company Limited
Mazowe Mine
S-K 1300 Technical Report Summary
January 2025


Mazowe Mine
S-K 1300 Technical Report Summary
Bulawayo Mining Company Limited
WSP
Level 3, 51-55 Bolton St
Newcastle NSW 2300
PO Box 1162
Newcastle NSW 2300
Tel: +61 2 4929 8300
Fax: +61 2 4929 8382
wsp.com
| Rev | Date | Details |
| D | 29/01/2025 | Final report |
| | Name | Date | Signature |
| Prepared by: | Aaron Radonich Allan Blair | 29/01/2025 | /s/ Aaron Radonich /s/ Allan Blair |
| Reviewed by: | Jerry DeWolfe | 09/01/2025 | /s/ Jerry DeWolfe |
This document may contain confidential and legally privileged information, neither of which are intended to be waived, and must be used only for its intended purpose. Any unauthorised copying, dissemination or use in any form or by any means other than by the addressee, is strictly prohibited. If you have received this document in error or by any means other than as authorised addressee, please notify us immediately and we will arrange for its return to us.
PS213686-WSP-NTL-MNG-REP-002
RevD (Mazowe Mine) | | January 2025 |
Table of contents
| 1 | Executive summary | 1 |
| | | |
| 1.1 | Property description and ownership | 1 |
| | | |
| 1.2 | Geology and mineralisation | 1 |
| | | |
| 1.3 | Exploration | 2 |
| | | |
| 1.4 | Mineral Resources estimates | 2 |
| | | |
| 1.5 | Mineral Reserves estimates | 3 |
| | | |
| 1.6 | Capital and operating costs | 3 |
| | | |
| 1.7 | Permitting requirements | 3 |
| | | |
| 1.8 | QPs’ conclusions and recommendations | 3 |
| 1.8.1 | Mineral Resources | 3 |
| 1.8.2 | Mineral Reserves | 5 |
| | | |
| 2 | Introduction | 7 |
| | | |
| 2.1 | Registrant information | 7 |
| | | |
| 2.2 | Terms of reference and purpose | 9 |
| | | |
| 2.3 | Sources of information | 12 |
| | | |
| 2.4 | Personal inspection | 12 |
| | | |
| 2.5 | Previously filed Technical Report Summaries | 13 |
| | | |
| 2.6 | WSP declaration | 13 |
| | | |
| 3 | Property description | 14 |
| | | |
| 3.1 | Property location | 14 |
| | | |
| 3.2 | Title and mineral rights | 15 |
| | | |
| 3.3 | Encumbrances | 16 |
| | | |
| 3.4 | Risks to access, title, or right to perform work | 16 |
| | | |
| 3.5 | Agreements and royalties | 17 |
| | | |
| 4 | Accessibility, climate, local resources, infrastructure and physiography | 18 |
| | | |
| 4.1 | Topography, elevation, and vegetation | 18 |
| | | |
| 4.2 | Access | 18 |
| | | |
| 4.3 | Proximity to population centres | 18 |
| | | |
| 4.4 | Climate | 18 |
| | | |
| 4.5 | Local resources and existing infrastructure | 19 |
| 4.5.1 | Power supply | 19 |
| CONTENTS (Continued) | |
| | |
| 4.5.2 | Water supply | 20 |
| 4.5.3 | Personnel | 20 |
| 4.5.4 | Suppliers | 20 |
| | | |
| 5 | History | 21 |
| | | |
| 5.1 | Exploration and ownership history | 21 |
| | | |
| 5.2 | Production history | 21 |
| | | |
| 5.3 | Production reconciliation | 23 |
| | | |
| 5.4 | Aggregate fiscal year production | 23 |
| | | |
| 5.5 | Exploration and development by previous owners or operators | 23 |
| | | |
| 5.6 | Liabilities | 24 |
| | | |
| 6 | Geological setting, mineralisation, and deposit | 25 |
| | | |
| 6.1 | Regional geology | 25 |
| | | |
| 6.2 | Structural setting | 26 |
| | | |
| 6.3 | Local and Property geology | 26 |
| | | |
| 6.4 | Deposit type and geology | 27 |
| | | |
| 6.5 | Mineralisation | 28 |
| | | |
| 7 | Exploration | 29 |
| | | |
| 7.1 | Diamond drilling | 29 |
| 7.1.1 | Underground drilling | 29 |
| 7.1.2 | Surface drilling | 30 |
| 7.3 | QP’s opinion | 34 |
| | | |
| 8 | Sample preparation, analyses, and security | 34 |
| | | |
| 8.1 | Sampling techniques | 34 |
| 8.1.1 | Core sampling | 34 |
| 8.1.2 | Channel sampling | 34 |
| 8.1.3 | Grab samples | 35 |
| 8.1.4 | Sample security | 35 |
| 8.1.5 | Dry bulk density determination | 35 |
| | | |
| 8.2 | Sample preparation, analyses, and procedures | 35 |
| CONTENTS (Continued) | |
| | |
| 8.3 | Quality Assurance Quality Control | 35 |
| 8.3.1 | Channel sampling | 36 |
| 8.3.2 | Core sampling | 36 |
| 8.3.3 | Grab sampling | 36 |
| 8.3.4 | General guidelines | 36 |
| | | |
| 8.4 | QP’s opinion on adequacy | 36 |
| | | |
| 9 | Data verification | 37 |
| | | |
| 9.1 | Mineral Resources verification | 37 |
| 9.1.1 | Data verification conducted by MMC Zimbabwe | 37 |
| 9.1.2 | Data verification conducted by WSP | 37 |
| 9.1.3 | Limitations on Mineral Resources data verification | 38 |
| | | |
| 9.2 | Mining and Mineral Reserves data verification | 38 |
| | | |
| 9.3 | Geotechnical data verification | 38 |
| | | |
| 9.4 | Hydrology and hydrogeology data verification | 39 |
| 9.4.1 | Hydrology | 40 |
| 9.4.2 | Hydrogeology | 41 |
| | | |
| 9.5 | Processing and recovery methods data verification | 41 |
| | | |
| 10 | Mineral processing and metallurgical testing | 42 |
| | | |
| 10.1 | Nature and extent of mineral processing and metallurgical testing | 42 |
| | | |
| 10.2 | Metallurgical sampling representativity | 43 |
| 10.2.1 | Underground ore testwork | 43 |
| 10.2.2 | Sands testwork | 43 |
| | | |
| 10.3 | Details of analytical or testing laboratories | 44 |
| | | |
| 10.4 | Recovery estimates | 45 |
| | | |
| 10.5 | QP’s opinion on adequacy of the data collected | 45 |
| | | |
| 11 | Mineral Resource estimates | 46 |
| | | |
| 11.1 | Key assumptions, parameters, and methods | 46 |
| 11.1.1 | Care and maintenance | 46 |
| 11.1.2 | Resource database | 46 |
| 11.1.3 | Geological interpretation | 46 |
| 11.1.4 | Data preparation | 46 |
| 11.1.5 | Exploratory data analysis | 46 |
| 11.1.6 | Dry bulk density | 49 |
| CONTENTS (Continued) | |
| | |
| 11.1.7 | Block models | 49 |
| 11.1.8 | Grade interpolation parameters | 50 |
| 11.1.9 | Grade estimation | 52 |
| 11.1.10 | Model validation | 53 |
| | | |
| 11.2 | Mineral Resources classification | 53 |
| 11.2.1 | Measured Mineral Resources | 53 |
| 11.2.2 | Indicated Mineral Resources | 54 |
| 11.2.3 | Inferred Mineral Resources | 54 |
| | | |
| 11.3 | Cut-off grade, price, and justification | 54 |
| 11.3.1 | Tonnage-grade factors | 55 |
| | | |
| 11.4 | Mineral Resources statement | 56 |
| | | |
| 11.5 | Uncertainty in the estimates of Inferred, Indicated, and Measured Mineral Resources | 57 |
| | | |
| 11.6 | QP’s opinion on factors likely to influence the prospect of economic extraction | 58 |
| | | |
| 12 | Mineral Reserves estimates | 58 |
| | | |
| 13 | Mining methods | 59 |
| | | |
| 13.1 | Introduction | 59 |
| | | |
| 13.2 | Parameters relevant to the design and schedule | 59 |
| 13.2.1 | Geotechnical | 59 |
| 13.2.2 | Hydrogeological | 60 |
| | | |
| 13.3 | Production parameters | 60 |
| 13.3.1 | Production rates | 60 |
| 13.3.2 | Expected mine life | 60 |
| 13.3.3 | Mining model | 60 |
| 13.3.4 | Mining dilution and recovery factors | 61 |
| | | |
| 13.4 | Mining fleet, machinery, and personnel requirements | 61 |
| | | |
| 13.5 | Scheduling process | 61 |
| | | |
| 13.6 | Scheduling results | 61 |
| | | |
| 13.7 | Mining unit dimensions | 62 |
| | | |
| 13.8 | Mine layout | 62 |
| | | |
| 14 | Processing and recovery methods | 65 |
| | | |
| 14.1 | Processing methodologies and flowsheets | 65 |
| CONTENTS (Continued) | |
| | |
| 14.2 | Processing plant throughput and characteristics | 66 |
| | | |
| 14.3 | Primary and secondary crushing | 66 |
| | | |
| 14.4 | Product sampling | 66 |
| | | |
| 14.5 | Product stockyard | 67 |
| | | |
| 14.6 | Energy and water process materials requirements | 67 |
| 14.6.1 | Mine power plant | 67 |
| 14.6.2 | Mine water management system | 67 |
| | | |
| 14.7 | QP’s opinion | 67 |
| | | |
| 15 | Infrastructure | 68 |
| | | |
| 15.1 | Rail access | 68 |
| | | |
| 15.2 | Port access | 68 |
| | | |
| 15.3 | Roads | 68 |
| | | |
| 15.4 | Camp | 68 |
| | | |
| 15.5 | Tailings | 68 |
| | | |
| 15.6 | Potable water and wastewater | 70 |
| | | |
| 15.7 | Accommodation and offices | 70 |
| | | |
| 15.8 | Non process infrastructure | 70 |
| | | |
| 15.9 | Information and communications technology (ICT) systems | 70 |
| | | |
| 15.10 | Other support facilities and utilities | 70 |
| | | |
| 16 | Market studies | 71 |
| | | |
| 16.1 | Nature and material terms of agency relationships | 71 |
| | | |
| 16.2 | Results of relevant market studies | 71 |
| | | |
| 16.3 | Commodity price projections | 71 |
| | | |
| 16.4 | Mining and processing | 73 |
| | | |
| 16.5 | Product transport and handling | 73 |
| | | |
| 16.6 | Hedging arrangements | 73 |
| | | |
| 16.7 | Forward sales contracts | 73 |
| | | |
| 16.8 | Contracts with affiliated parties | 73 |
| CONTENTS (Continued) | |
| | |
| 17 | Environmental studies, permitting, and plans, negotiations, or agreements with local individuals or groups | 74 |
| | | |
| 17.1 | Introduction | 74 |
| | | |
| 17.2 | Project context | 74 |
| | | |
| 17.3 | Project permitting | 74 |
| | | |
| 17.4 | Environmental and Social Impact Assessment | 74 |
| 17.4.1 | Biodiversity and natural resources | 74 |
| 17.4.2 | Managing impacts on water | 75 |
| 17.4.3 | Acid and metalliferous drainage (AMD) | 75 |
| 17.4.4 | Erosion and protection of soils | 75 |
| 17.4.5 | Noise and vibration | 75 |
| 17.4.6 | Air quality | 75 |
| 17.4.7 | Local climate impacts | 75 |
| 17.4.8 | Greenhouse gas emissions | 75 |
| 17.4.9 | Resources use and non-mineral waste | 75 |
| | | |
| 17.5 | Property standards | 75 |
| | | |
| 17.6 | Stakeholder engagement | 76 |
| 17.6.1 | Stakeholder engagement plan | 76 |
| 17.6.2 | Consultation | 76 |
| | | |
| 17.7 | Cultural, economic, and social conditions | 76 |
| 17.7.1 | Cultural heritage | 76 |
| 17.7.2 | Local landscape | 76 |
| 17.7.3 | Contributing to the national and local economy | 76 |
| 17.7.4 | Establishing a social management framework | 76 |
| 17.7.5 | Impacts on land use and access | 76 |
| 17.7.6 | Protecting community health and safety | 77 |
| 17.7.7 | Protecting the workforce | 77 |
| 17.7.8 | Commitment to local procurement and hiring | 77 |
| | | |
| 17.8 | Mine closure | 77 |
| 17.8.1 | Plan | 77 |
| 17.8.2 | Cost | 78 |
| | | |
| 17.9 | Translating the ESIA into environmental and social management | 78 |
| | | |
| 17.10 | QP’s opinion | 78 |
| | | |
| 18 | Capital and operating costs | 79 |
| | | |
| 19 | Economic analysis | 80 |
| CONTENTS (Continued) | |
| | |
| 20 | Adjacent properties | 81 |
| | | |
| 21 | Other relevant data and information | 82 |
| | | |
| 22 | Interpretation and conclusions | 83 |
| | | |
| 22.1 | Mineral Resources interpretations and conclusions | 83 |
| | | |
| 22.2 | Mineral Reserves interpretations and conclusions | 83 |
| | | |
| 23 | Recommendations | 84 |
| | | |
| 23.1 | Mineral Resources recommendations | 84 |
| | | |
| 23.2 | Mineral Reserves recommendations | 85 |
| | | |
| 24 | References | 87 |
| | | |
| 25 | Reliance on information provided by the Registrant | 88 |
| List of tables | |
| Table 1-1 | MGM underground Measured and Indicated Mineral Resources estimate as at 31 December 2023 | 2 |
| Table 1-2 | MGM underground Inferred Mineral Resources estimate as at 31 December 2023 | 2 |
| Table 1-3 | Summary of proposed 2024 MMC Zimbabwe surface exploration drilling (MMC Zimbabwe 2024) | 5 |
| Table 2-1 | List of acronyms and abbreviations used in this TRS | 9 |
| Table 2-2 | List of QPs | 13 |
| Table 5-1 | Mineral Resource summary comparison end December 2022 to end December 2023 | 23 |
| Table 9-1 | Summary of drill hole database errors | 37 |
| Table 9-2 | Groundwater development potential of formations occurring in the Mazowe Catchment | 41 |
| Table 10-1 | Test conditions and results for flotation | 44 |
| Table 11-1 | Univariate statistics for samples within the economic mineralisation envelope (GFM 2018) | 47 |
| Table 11-2 | Top-cut grades applied by MMC Zimbabwe | 48 |
| List of tables continued | |
| Table 11-3 | Block dimension schemes for 30 June 2018 block models (GFM 2018) | 49 |
| Table 11-4 | Grade interpolation parameters for 30 June 2018 block models (GFM 2018) | 51 |
| Table 11-5 | 31 December 2023 Mineral Resource COG parameters | 54 |
| Table 11-6 | MGM underground Measured and Indicated Mineral Resources estimate as at 31 December 2023 | 56 |
| Table 11-7 | MGM underground Inferred Mineral Resources estimate as at 31 December 2023 | 56 |
| Table 13-1 | MGM shaft list – dimensions, depths and inclination | 64 |
| Table 16-1 | Zimbabwean inflation rate and economic indicators (Trading Economics, 30 May 2024) | 72 |
| Table 17-1 | MGM present closure obligation (Enmin 2024) | 78 |
| Table 23-1 | Summary of proposed 2024 MMC Zimbabwe surface exploration drilling (MMC Zimbabwe 2024) | 85 |
| | | |
| List of figures | |
| Figure 2.1 | BMC Limited corporate structure | 8 |
| Figure 3.1 | Property location map | 15 |
| Figure 3.2 | MMC Zimbabwe claims boundary | 16 |
| Figure 4.1 | Climate statistics for Mazowe, Zimbabwe (Meteoblue 2024) | 19 |
| Figure 5.1 | MGM total gold production 1962–2023 | 22 |
| Figure 6.1 | Regional geology of Zimbabwe showing locations of greenstone belts (Prendergast 2004) | 25 |
| Figure 6.2 | Local geology of the Mazowe area (GFM 2018) | 27 |
| Figure 6.3 | Local stratigraphy of the Mazowe area | 27 |
| Figure 6.4 | Cross-section looking west through the main Property reefs (GFM 2018) | 28 |
| Figure 7.1 | Plan view of channel samples and existing mine development | 29 |
| Figure 7.2 | Plan view of drill hole collars and existing mine development | 29 |
| Figure 9.1 | Section showing all drill holes above the MGM topographic surface | 38 |
| Figure 9.2 | Catchment boundaries of Zimbabwe (BMC Limited) | 39 |
| Figure 9.3 | Mean annual rainfall within the Mazowe catchment (Waterkings 2014) | 40 |
| Figure 10.1 | MGM Sands flotation and CIL plant flowsheet | 42 |
| Figure 11.1 | Nucleus 3 block grade and drill hole comparison | 53 |
| Figure 13.1 | MGM underground mine access shafts and general mine layout (Virimai 2018) | 63 |
| Figure 13.2 | MGM layout – projection looking east | 64 |
| Figure 14.1 | MGM processing flowsheet | 66 |
| Figure 15.1 | MGM site layout showing processing and TSF | 69 |
| Figure 16.1 | Historical (blue) gold spot price and forecast (grey) in US$/oz (Trading Economics 30 May 2024) | 72 |
| Figure 16.2 | Zimbabwean gold currency exchange rate ZiG/USD (Trading Economics, 1 July 2024) | 73 |
List of appendices
Appendix A Limitations statement
| 1.1 | Property description and ownership |
The Mazowe Gold Mine (MGM) [or the Property] is located in Mashonaland Central Province, Zimbabwe, approximately 50 kilometres (km) north of the City of Harare (latitude 17°28’S and longitude 30°55’E). A railway line passes through the Property, linking up with the regional centres of Glendale, Bindura, and Shamva.
Mazowe Mining Company (Private) Limited Zimbabwe (MMC Zimbabwe), a wholly owned subsidiary of Gold Fields of Mazowe (UK) Limited (GFM UK), which is a wholly owned subsidiary of BMC Limited, possesses total ground holdings under Mining Lease (ML) 35 totalling 1,955.5 ha (Figure 3.2) [GFM 2018].
Ore is processed in a single processing plant, consisting of conventional crushing and milling and a Carbon-in-Leach (CIL) facility.
The Property is accessible via the A11 between Harare and Glendale. Access to the mine site and to the ore is authorised by the applicable mining legislation, and MMC Zimbabwe’s title and mining rights. Mining exploration and exploitation works conducted or to be conducted on site are authorised in accordance with the applicable legislation, and MMC Zimbabwe’s title and mining rights.
| 1.2 | Geology and mineralisation |
The MGM is situated within the Harare-Bindura-Shamva greenstone belt of the Zimbabwean (Archaean) Craton, on the margin of the Chinhamhora Batholith. The Harare-Bindura-Shamva greenstone belt comprises major metavolcano-sedimentary sequences, structurally intruded by the Chinhamhora Batholith, linking northwards through the Property area, and then eastwards along the Mazowe Valley, through the Harare-Bindura-Shamva greenstone belt.
The typical lithology at the MGM consists of the Mazowe Granodiorite, which is coarse, crystalline, quartz-rich and porphyritic. Feldspar porphyries occur in the eastern to southern parts of the mine complex. They are typically dark grey or black in colour, with pronounced white phenocrysts of quartz and feldspar. To the east of the Property, feldspar porphyries grade into metabasaltic rocks. These are intercalated with BIF in places. Thin ultramafic units/lithologies are known to occur in the footwall of the Jumbo mineralised shear zone.
The mineralisation at the MGM is collectively hosted by granodiorite stock and feldspar porphyries. These lithologies are host to a multitude of narrow, sub-parallel mineralised shear zones, which form an imbricate thrust shear zone system. To date more than 15 sub-parallel shear zones have been identified. These shear zones strike east-west and dip to the north at approximately 10 to 50 degrees (°). From north to south, mining has exposed the following mineralised shear zones:
| — | Shear zones are generally separated by unsheared zones (lithons) of ± 30 metres (m) in width. |
Project No PS213686
Mazowe Mine
S-K 1300 Technical Report Summary
Bulawayo Mining Company Limited | WSP
January 2025
Page 1 |
Current exploration is conducted using underground diamond drilling and channel samples. Diamond drill core is logged and sampled, with sample length dictated by the width of the mineralised shear zone. One sample each of the barren hanging wall and footwall is also taken and submitted for assay. All underground diamond drill holes are collar and downhole surveyed.
Channel sampling, diamond drilling, and sludge drilling samples were used for the purposes of geological modelling and Mineral Resource estimation.
| 1.4 | Mineral Resources estimates |
This report is prepared as a Technical Report Summary (TRS) for the Property, in accordance with the United States Securities and Exchange Commission’s (SEC) Modernised Property Disclosure Requirements for Mining Registrants as described in Subpart 229.1300 of Regulation S K, Disclosure by Registrants Engaged in Mining Operations (S-K 1300) and Item 601(b)(96).
The disclosure of Mineral Resources under this report is based upon the Qualified Person’s (QP's) initial assessment. The Mineral Resources estimate has been defined, classified, and reported according to the guiding principles and minimum standards set out in SAMREC (2016). WSP’s view is that there are no material differences between SAMREC (206), and S-K 1300 requirements for the reporting of Mineral Resources.
The relevant QPs are satisfied that there has been sufficient orebody knowledge work completed to support Reasonable Prospects for Economic Extraction (RPEE) at the Property from a Mineral Resources perspective. The initial assessment incorporates the QP’s qualitative evaluation of relevant technical and economic factors likely to influence the prospect of economic extraction to establish the economic potential of the mining property or project (Section 11.3).
Evaluation data collection includes diamond drilling, and channel sampling.
Given there has been no mining or exploration conducted since the mine was placed on Care & Maintenance (C&M) due to the mine workings being flooded, in the QP’s opinion the 2018 assumptions regarding definition of the Mineral Resource base remain current.
For the purposes of demonstrating capacity to exploit the Mineral Resource base as required under S-K 1300, the QPs prepared a high-level cashflow model provided by MMC Zimbabwe and are satisfied that the scale of the Mineral Resource and free cashflow after operating costs are sufficient to cover the capital cost of re-establishing access to the underground mine workings, dewatering the underground mine workings, surface infrastructure, and plant refurbishment/replacement. A process recovery of 88% for gold was applied for cashflow modelling consistent with recent historical averages and fixed tail estimates. Further assumptions are provided under Section 11.3 and Table 11-5.
A new COG for 2023 was calculated based on the 3-year trailing average gold price at December 2023 (with a gold price multiplier of 30%), applicable mill recovery, and revised operating and sustaining capital costs. This is described in Section 11.3.
Mineral Resources are reported on an in-situ basis.
Table 1.1 presents the underground Measured and Indicated Mineral Resources (exclusive of Mineral Reserves) reported as at 31 December 2023.
| Table 1-1 | MGM underground Measured and Indicated Mineral Resources estimate as at 31 December 2023 |
| Category | Tonnage (Mt) | Au Grade (g/t) | Au Metal (koz) |
| Underground |
| Measured Resources | 0.26 | 9.01 | 75 |
| Indicated Resources | 0.91 | 7.45 | 217 |
| Grand Total | 1.17 | 7.77 | 291 |
Notes: Mt = million tonnes; Au Grade g/t = gold grams per tonne; koz = thousand ounces.
Table 1.2 presents the underground Inferred Mineral Resources (exclusive of Mineral Reserves) reported as at 31 December 2023.
| Table 1-2 | MGM underground Inferred Mineral Resources estimate as at 31 December 2023 |
| Category | Tonnage (Mt) | Au Grade (g/t) | Au Metal (koz) |
| Underground |
| Inferred Resources | 3.29 | 8.65 | 915 |
| Grand Total | 3.29 | 8.65 | 915 |
Notes: Mt = million tonnes; Au Grade g/t = gold grams per tonne; koz = thousand ounces.
Project No PS213686
Mazowe Mine
S-K 1300 Technical Report Summary
Bulawayo Mining Company Limited | WSP
January 2025
Page 2 |
It should be noted that the Mineral Resources estimate for the Property is reported exclusive of Mineral Reserves. The Property does not have a current Mineral Reserve.
It should be noted that the sands (tailings) Mineral Resources estimate for the Property is not included as part of the in-situ Mineral Resources for the Property, as the ownership of the sands (tailings) material itself, and the accompanying sands (tailings) processing facility is currently under dispute, with legal proceedings ongoing. The sands (tailings) Mineral Resources estimate for the Property is detailed in Section 11.3.
The Mineral Resources presented in this Section are not Mineral Reserves, and do not reflect demonstrated economic viability. The reported Inferred Mineral Resources are considered too speculative geologically to have the economic considerations applied to them that would enable them to be categorised as Mineral Reserves. There is no certainty that all or any part of this Mineral Resource will be converted into Mineral Reserve.
All figures are rounded to reflect the relative accuracy of the estimates and totals may not add correctly.
Based on the geological results presented in this TRS, supported by the assumptions made by BMC Zimbabwe (presented in Section 11.3), it is the QP’s opinion that the Mineral Resources have RPEE.
| 1.5 | Mineral Reserves estimates |
Not applicable since this TRS is an Initial Assessment and no Mineral Reserves have been estimated.
| 1.6 | Capital and operating costs |
Not applicable since this TRS is an Initial Assessment and no Mineral Reserves have been estimated.
Any future estimation of Mineral Reserves and potential recommencement of operations will require the support of an additional drilling and resource definition campaign and at least a pre-feasibility to feasibility level of evaluation.
| 1.7 | Permitting requirements |
The ML is inspected on an annual basis by the Government of Zimbabwe. The area covered by ML 35 was surveyed and declared to be 1,955.5 ha. ML 35 was inspected on 21 May 2024, and the current inspection certificate is valid until the next inspection date of 19 August 2025.
There is also a requirement for renewal of environmental and miscellaneous operating permits as outlined in Section 17.3 before recommencement of active mining operations. The Environmental Impact Assessment Certificate is current and expires 13 September 2025. Miscellaneous operating permits will require renewal.
There has been a significant increase in artisanal gold mining activities within the MGM tenement area during the period of business administration to present day.
| 1.8 | QPs’ conclusions and recommendations |
Based on the information presented in this TRS, the QP’s key conclusions are as follows:
| — | The levels of understanding of the regional geology, local geology, and the nature and controls on mineralisation are high, and provide a solid foundation for geological modelling, Mineral Resource estimation, and mining and exploration geology. |
Project No PS213686
Mazowe Mine
S-K 1300 Technical Report Summary
Bulawayo Mining Company Limited | WSP
January 2025
Page 3 |
| — | The drilling, sampling, assay and Quality Assurance and Quality Control (QAQC) techniques used for both exploration, and resource definition are consistent with standard industry practice, and are considered appropriate for the purposes of geological modelling and Mineral Resource estimation. |
| — | Grade estimates were not constrained to orebody wireframes during grade estimation but were constrained to orebody wireframes during Mineral Resource estimate reporting. |
| — | Estimates utilised all available samples i.e., channel, sludge, diamond drill core etc. |
| — | Dry bulk density (BD) of 2.9 tonnes per cubic metre (t/m3) assigned for all mineralised domains. |
| — | Validation of the Mineral Resource estimates has not been reported. Standard industry practice is to conduct both visual, and statistical validation of estimates and present the findings of this work in the Mineral Resource report to provide the reader an appreciation of the robustness of the estimates. |
| — | Grade estimation within modelled mineralisation domains (constrained estimate) would likely result in an increase in contained metal. |
| — | Mining, processing, and market modifying factors, study assumptions, and parameters are used to establish RPEE for the reporting of Mineral Resources. No significant risks exist that could impact the reliability and/or confidence of Mineral Resources estimates. |
| — | The MRMR technical report developed by MMC Zimbabwe covers a number of areas in sufficient detail; however, some areas require more detail to give the reader a more thorough understanding of the work that has been conducted, the results of the work and any inherent risks to the Mineral Resource estimate. |
Based on the information presented in this TRS, the QP’s key recommendations are as follows:
| — | Data and database management is an area that requires further work. The MGM would benefit from the introduction of a corporate database, with inbuilt validation routines and reporting functionality, to assist with what is a large quantity of geological information. |
| — | The estimated cost of this recommendation is US$1,000,000 across the BMC Limited portfolio of assets. |
| — | Data analysis is conducted; however, it is recommended that for future Mineral Resource estimates, deposit wide Exploratory Data Analysis (EDA) is undertaken prior to estimation, to ensure data is fit for purpose for geological modelling and Mineral Resource estimation. |
| — | It is recommended that a succinct geological modelling and Mineral Resource estimation process flow is developed and followed for future Mineral Resource estimates. |
| — | It is recommended that Mineral Resource estimation is constrained to modelled mineralisation domain wireframes, using an appropriate Au Cut-off Grade (COG). |
| — | Review lithology, structural and mineralisation modelling practices. |
| — | It is recommended that studies to characterise the hydrogeology are included in future exploration programs. |
| — | A comparison between BD values determined from underground grab samples, and drill core should be undertaken to ensure that the mean values used for Mineral Resource estimation are appropriate, and that bias is not being incorporated into the Mineral Resource estimate. |
| — | Validation of the Mineral Resource estimates produced, or at least the documentation of validation work undertaken is an area that requires further work. Standard industry practice is to conduct both visual and statistical validation of estimates and present the findings of this work in the TRS, to give the reader an appreciation of the robustness of the estimates. |
| — | Review Mineral Resource classification methodology and block assignment. |
Project No PS213686
Mazowe Mine
S-K 1300 Technical Report Summary
Bulawayo Mining Company Limited | WSP
January 2025
Page 4 |
| — | Mineral Resource reconciliation practices should be reviewed, and a system implemented that provides a measure of Mineral Resource estimate performance. Planned versus actual resource tonnages and grades should be developed and updated each time a Mineral Resource estimate is completed. It is recommended that mined development and production be reconciled monthly, and stope close-out reports be developed for each completed stope. |
| — | Infill surface drilling and exploration of the eastern continuity of the Mazowe deposits. Drilling proposed by MMC Zimbabwe is presented in Table 1.3. |
| Table 1-3 | Summary of proposed 2024 MMC Zimbabwe surface exploration drilling (MMC Zimbabwe 2024) |
| Mine Area | Nature of Work | Comment |
| Jumbo East | — 600 m of trenching. — Infill diamond drilling (11 drill holes totalling 4,400 m). | — To explore for along strike and down-dip extensions of the Mazowe deposits to the east. — Estimated Cost: US$528,000. — Timing: 2024. — Estimated tonnage and grade: 2 Mt @ 5.50 g/t (353,658 oz). |
| Mazowe South | — 800 m of trenching. — Diamond drilling (10 drill holes totalling 4,000 m). | — To probe the down dip continuity of the Amatola deposit. — Estimated cost: US$480,000. — Timing: 2024. — Estimated tonnage and grade: 580,000 t @ 5.50 g/t (102,561 oz). |
Notes: Mt = million tonnes, g/t = grams per tonne, oz = ounces.
| — | All paper-based estimation techniques should be converted to computer-based (digital) as soon as possible. |
| — | RPEE have been considered, and the parameters used are considered reasonable. |
| — | The MRMR technical report developed by MMC Zimbabwe covers a number of areas in sufficient detail; however, some areas require more detail to give the reader a more thorough understanding of the work that has been conducted, the results of the work and any inherent risks to the Mineral Resource estimate. |
Not applicable since this TRS is an Initial Assessment and no Mineral Reserves have been estimated.
For the historical 2018 Mineral Reserve estimate, the QP provides comment as follows:
| — | When last in operation in 2018 there was a significant gap in head grade delivered of 3.67 g/t compared to the Mineral Reserve grade of 6.37 g/t Au, warranting reconciliation and justification. The June 2018 Mineral Reserves compliance with the 2016 Edition of the SAMREC Code is called into question due to insufficient assurance of technical and economic feasibility. |
| — | The historical estimate is indicative and requires update to reflect resource definition via more modern CAD techniques and to reflect significant changes in cost structures and metal pricing in the intervening 6 years. |
| — | Any future estimation of Mineral Reserves and potential recommencement of operations will require the support of an additional drilling and resource definition campaign and at least a pre-feasibility to feasibility level of evaluation. |
| — | The QP approves of the conventional industry approach to defining Mineral Reserves and applying modifying factors, provided that operating performance measures are regularly updated. |
Project No PS213686
Mazowe Mine
S-K 1300 Technical Report Summary
Bulawayo Mining Company Limited | WSP
January 2025
Page 5 |
| — | The influx of contract artisanal miners in recent years under the supervision of the previous business administrator, now removed by BMC legal action, and associated poor safety statistics, has posed a risk to permitting and future operation. The QP understands that MMC Zimbabwe is now in the process of negotiations and removal of contract artisanal miners. It must be noted that the artisanal miners focused on shallow workings within 30 m of surface in areas outside the MGM resource and reserve base, and with underground workings flooded to the 3 Level (approximately 50 m below surface) there has been no depletion of resources. |
For the historical 2018 Mineral Reserve estimate, the QPs provide recommendations as follows:
| — | MGM is currently on C&M since August 2018 due to external economic environment which had deteriorated by then, though improvement was seen over the years. This affected the sand retreatment project’s performance in terms of throughput, head grade and recovery, and the declining tonnage and head grade from the underground operations over the period from 2016. The performance of the underground during 2017 and 2018 also suffered from a low level of capital investment in exploration and underground development, necessary to define accessible blocks to the required level of confidence and accuracy and to facilitate a well-planned development strategy and potential productivity improvements. More generally, the operation was constrained by a shortage of consumables and critical spares. Processing performance was impacted by the inability to secure reliable supplies of key consumables such cyanide. |
In response, MMC Zimbabwe commissioned a conceptual scoping level study (Virimai, November 2018) to examine options for recommencing operations. The Virimai study appears to provide sufficient confidence to proceed to a more detailed prefeasibility level assessment. WSP’s view is that this work should proceed to provide sufficient confidence for estimation of a SAMREC compliant Mineral Reserve that is suitably supported by a business plan that demonstrates the technical and economic viability. This should include:
| — | Detailed mine prefeasibility assessment of underground options. This should include examination of options for productivity improvements, block access strategies and optimised targeting and sequencing of blocks, dewatering strategy, hoist capacity, and process options. |
| — | Reconciliation of historical mine performance and individual stope reconciliation. |
| — | Once ownership litigation is successfully settled, the tailings retreatment project should be back analysed to confirm reasons for plant underperformance in throughput and head grade. This should include review of the sand tailings in-situ grades, scheduled head grades, and mining strategy. |
The required technical studies should be completed to confirm that re-establishment of commercial production and expansion of production beyond historical benchmarks is both technically feasible and economically viable.
After future Mineral Resource and Mineral Reserve updates, a stope optimisation exercise is recommended. Stope optimisation allows for the rapid development of valid stope shapes according to specified criteria.
More detailed analysis should also be completed in the following areas:
| — | Review actual mining widths compared to applied widths, unplanned dilution levels, adjustment of metal prices, and consideration of exchange rates and revenue constraints. The APF and BRF should be based on actual data and applied by section and stope. Actual mining widths achieved by survey measurement and reconciliation should be compared with average stope widths applied (plus allowance for unplanned dilution). |
| — | Unplanned levels of dilution of 23–25% in combination with the minimum mining width assumptions should be compared with reconciliation statistics from resource, reserve, break, hoist and reconciled mill feed. Planned and achieved stope widths should be compared to properly reconcile and guard against excess dilution. |
| — | Consideration should be given to assessment of the capital development, dewatering, and extraction costs for accessing and exploiting satellite blocks located at increased distance from main haulage horizons and shafts for hoisting of the ore. Increased costs for accessing these blocks needs to be considered to determine if it is economic to mine. The size of the blocks to support this access will also need to be considered as increased capital costs are more easily borne by larger block inventories. |
| — | Gold and silver prices should be updated in line with the 3-year trailing average and monitored against prevailing spot prices and/or long-term forecasts on a regular six-monthly basis. Pay limits and cashflow models should be updated accordingly. |
| — | Allowance for the influence of exchange rates, inflation, and constraints on revenue received from the sale of gold to the Zimbabwean government is required. WSP understands that recent payment has been mandated as a combination of local currency and United States Dollars (USD), the impact of which upon revenue needs to be monitored and quantified in USD terms. |
Project No PS213686
Mazowe Mine
S-K 1300 Technical Report Summary
Bulawayo Mining Company Limited | WSP
January 2025
Page 6 |
| 2.1 | Registrant information |
This Technical Report Summary (TRS) is for the Bulawayo Mining Company Limited (BMC Limited) owned Mazowe Gold Mine (MGM) [or the Property], located in Mashonaland Central Province, approximately 50 km north of the capital Harare, and was prepared by the Qualified Persons (QPs) for BMC Limited.
BMC Limited is a private company incorporated in the United Kingdom (UK) and is a wholly owned subsidiary of Metallon Corporation Limited (UK) [Metallon]. Gold Fields of Mazowe (UK) Limited (GFM UK) is a private company incorporated in the UK and is a wholly owned subsidiary BMC Limited.
Mazowe Mining Company (Private) Limited Zimbabwe (MMC Zimbabwe), Bulawayo Mining Company (Private) Limited Zimbabwe (BMC Zimbabwe), and Redwing Mining Company (Private) Limited Zimbabwe (RMC Zimbabwe) are responsible for the management of mineral assets located in Zimbabwe, the principal activities of which include exploration, development and operation of precious metals mineral assets.
MMC Zimbabwe is directly responsible for the day-to-day management of mining operations and possesses total ground holdings under ML 35 totalling 1,955.5 ha (Figure 3.2) [GFM 2018].
Project No PS213686
Mazowe Mine
S-K 1300 Technical Report Summary
Bulawayo Mining Company Limited | WSP
January 2025
Page 7 |
Figure 2.1 presents the corporate structure of BMC Limited.
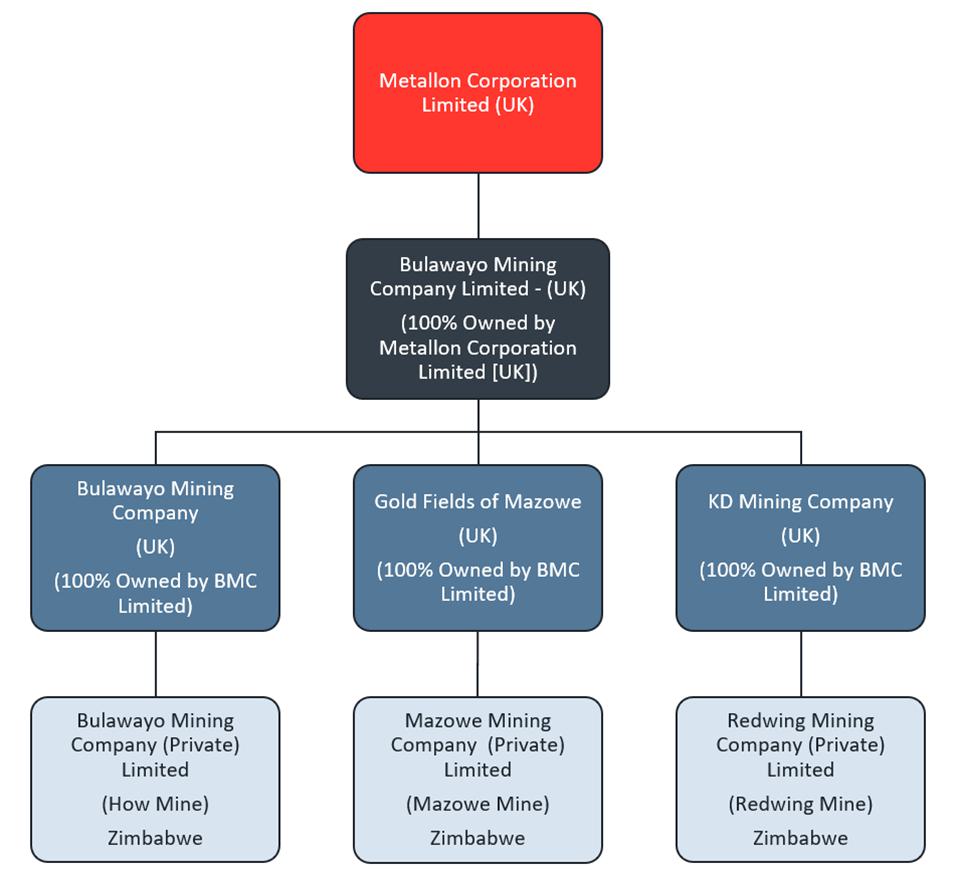
| Figure 2.1 | BMC Limited corporate structure |
In October 2002, Metallon (herein referred to as BMC Limited) acquired a portfolio of mineral assets from a holding subsidiary of Lonmin plc (Lonmin), known as Independence Mining (Private) Limited.
This portfolio of mineral assets located in Zimbabwe consists of three mining properties located within a significant land package consisting of some 66.02 square kilometres (km2) in area. The mining properties comprise three separate underground gold mines, namely: How, Mazowe, and Redwing. Each mining property is serviced by its own dedicated processing facilities and accompanying infrastructure. BMC Limited considers there to be significant exploration potential at each of the mining properties.
From acquisition of the assets in 2002 until 2006, gold production steadily increased with gold production peaking in 2005 at approximately 156,000 ounces (oz) of gold, making BMC Limited Zimbabwe’s largest gold producer.
Due to political unrest and hyperinflation in 2007, BMC Limited’s mining activities in Zimbabwe ceased and all mines were placed on Care & Maintenance (C&M). In 2009, mining activities recommenced, with many of the mines requiring rehabilitation work.
Project No PS213686
Mazowe Mine
S-K 1300 Technical Report Summary
Bulawayo Mining Company Limited | WSP
January 2025
Page 8 |
Operations were suspended at the MGM on 31 December 2018 and Redwing on 30 March 2019 due to general economic challenges. Both mines were placed on a Supreme Court ordered Corporate Rescue, the MGM commencing 20 February 2020 and the Redwing Gold Mine (RGM) commencing 23 July 2020. Both Corporate Rescue proceedings were nullified on 7 October 2021 for the MGM and 5 September 2022 for the RGM.
An application to cancel court orders for the MGM were submitted on 15 February 2024 and is currently being processed. New mining contracts have been finalised in May 2024 and are currently under implementation.
Gold production from the MGM since 2018 is as follows (MMC Zimbabwe Operation Reports):
BMC Limited’s forward strategy is to produce 300,000 oz of gold per annum through expansion across all mines, and through a broader acquisition strategy across Africa.
BMC Limited is pursuing a focused expansion strategy throughout Africa, with the aim of securing prospective green minerals assets in Zimbabwe, and the Democratic Republic of Congo (DRC).
| | | |
| 2.2 | Terms of reference and purpose |
The purpose of this TRS is to report Mineral Resources, and Mineral Reserves for the Property effective as of 31 December 2023. The TRS utilises:
| — | Australian English spelling. |
| — | metric units of measure. |
| — | grades presented in weight percent (wt.%). |
| — | coordinate system presented in metric units using Arc 1950/UTM zone 36S. |
| — | United States Dollars (USD). |
Summary Mineral Resources and Mineral Reserves in Table 1.1 and Table 1.2 are presented based on a BMC Limited equity ownership basis (100%).
Key acronyms and definitions used in this TRS include those items listed in Table 2.1.
| Table 2-1 | List of acronyms and abbreviations used in this TRS |
| Acronym/Abbreviation | Description |
| AAS | Atomic Absorption Spectrometer |
| AISC | All-In-Sustaining-Costs |
| amsl | Above Mean Sea Level |
| APF | Assay plan factor |
| BCF | Block Call Factor |
Project No PS213686
Mazowe Mine
S-K 1300 Technical Report Summary
Bulawayo Mining Company Limited | WSP
January 2025
Page 9 |
| Acronym/Abbreviation | Description |
| BD | Bulk density |
| BIF | Banded Iron Formation |
| BF | Block Factor |
| BMC Limited | Bulawayo Mining Company Limited |
| BMC Zimbabwe | Bulawayo Mining Company (Private) Limited Zimbabwe |
| BRF | Break Factor |
| CIL | Carbon-in-Leach |
| cm | Centimetres |
| C&M | Care and Maintenance |
| COG | Cut-off Grade |
| CPI | Consumer Price Index |
| CRM | Certified Reference Material |
| CV | Coefficient of variation |
| ° | Degrees |
| °C | Degrees Celsius |
| DRC | Democratic Republic of Congo |
| EDA | Exploratory Data Analysis |
| EIA | Environmental Impact Assessment |
| EMS | Environmental Management System |
| EMP | Environmental Management Plan |
| FOS | Factor of Safety |
| FS | Feasibility Study |
| g/cm3 | Grams per cubic centimetre |
| g/t | Grams per tonne |
| GeoPlanet | GeoPlanet Key (Pvt) Ltd |
| GFM | Gold Fields of Mazowe (UK) Limited |
| ha | Hectares |
| HGM | How Gold Mine |
| IGM | Independence Gold Mining Limited |
| JCMC | Jumbo Gold Mining Company |
| kg | Kilograms |
| km | Kilometres |
| km2 | Square kilometres |
| koz | Thousand ounces |
Project No PS213686
Mazowe Mine
S-K 1300 Technical Report Summary
Bulawayo Mining Company Limited | WSP
January 2025
Page 10 |
| Acronym/Abbreviation | Description |
| kt | Thousand tonnes |
| ktpa | Thousand tonnes per annum |
| ktpm | Thousand tonnes per month |
| kVA | Kilovolt-ampere |
| kV | Kilovolt |
| LOM | Life of Mine |
| m | Metres |
| m3 | Cubic metres |
| MAR | Mean annual runoff |
| MCF | Mine Call Factor |
| MGM | Mazowe Gold Mine |
| Ml | Megalitre |
| ML | Mining Lease |
| MMC Zimbabwe | Mazowe Mining Company (Private) Limited |
| mm | Millimetres |
| Moz | Million ounces |
| MRMR | Mineral Resources Mineral Reserves |
| Mt | Million tonnes (metric) |
| MVA | Megavolt-ampere |
| OK | Ordinary Kriging |
| oz | Ounces |
| PFS | Pre-Feasibility Study |
| Q | Rock mass quality |
| QAQC | Quality Assurance Quality Control |
| QP | Qualified Person |
| RC | Reverse Circulation |
| RMC Zimbabwe | Redwing Mining Company (Private) Limited Zimbabwe |
| ROM | Run of Mine |
| RPEE | Reasonable Prospects for Economic Extraction |
| RTGS | Real Time Gross Settlement |
| SAMREC | South African Mineral Resource Committee |
| SD | Standard deviation |
Project No PS213686
Mazowe Mine
S-K 1300 Technical Report Summary
Bulawayo Mining Company Limited | WSP
January 2025
Page 11 |
| Acronym/Abbreviation | Description |
| SML | S. Museka Lab. Consultancy Services (SML) |
| SRK | SRK Consulting (UK) Ltd |
| SRKSA | SRK Consulting (South Africa) (Pty) Ltd |
| t | Tonnes |
| t/m3 | Tonnes per cubic metre |
| tph | Tonnes per hour |
| tpm | Tonnes per month |
| TRS | Technical report summary |
| TSF | Tailings Storage Facility |
| USD | United States Dollar |
| UTM | Universal Transverse Mercator |
| V | Volts |
| WSP | WSP Australia Pty Limited |
| Wt.% | Weight percent |
| ZETDC | Zimbabwe Electricity Transmission and Distribution Company |
| ZESA | Zimbabwe Electricity Supply Authority |
| ZiG | Zimbabwe Gold Currency |
| ZWL | Zimbabwean Dollar |
| | | |
| 2.3 | Sources of information |
This TRS relies upon various reports and other material prepared by BMC Limited, and BMC Limited’s staff and consultants as provided to WSP. This data and information have been supplemented with information in the public domain, and through information gathered during a site inspection by WSP in May 2024 (Section 2.4).
While WSP has reviewed the data and other information contained in the reports and other material provided to it and is not aware of any reason to doubt that such data and information is complete and accurate, excluding Golder (2020), WSP was not responsible for the preparation of those reports and other material.
WSP has taken reasonable care to ensure that the information contained in this TRS is in accordance with the facts and information available to it and is unaware of any omission likely to affect its import. In this regard, the attention of any reader of the TRS is specifically directed to Section 24, and Appendix A.
Information in this TRS has been prepared under the supervision of the following QPs:
| — | Aaron Radonich, Fellow of the Australasian Institute of Mining and Metallurgy (FAusIMM, Member Number 221172), Principal Geologist, WSP. Aaron is responsible for MGM Mineral Resources. The date of the last personal inspection was May 2024. |
| — | Allan Blair, Member of the Australasian Institute of Mining and Metallurgy (FAusIMM, Member Number 102240), Principal Mining Engineer, WSP. Allan is responsible for MGM Mineral Reserves. The date of the last personal inspection was May 2024. |
Project No PS213686
Mazowe Mine
S-K 1300 Technical Report Summary
Bulawayo Mining Company Limited | WSP
January 2025
Page 12 |
Table 2.2 presents a tabulation of the QPs, their personal inspections, and their areas of responsibility.
| QP | Qualifications/Affiliation | Date of Personal Inspection | Areas of Responsibility |
| Aaron Radonich | Fellow AusIMM, PGCert Geostatistics, BSc (Hons.), BSc | May 2024 | Sections 1.1, 1.2, 1.3, 1.4, 1.7, 1.8.1, 2, 3, 4, 5, 6, 7, 8, 9.1, 11, 20, 21, 22,1, 23.1, 24 and 25. |
| Allan Blair | FAusIMM, MBA, BSc, BAppSc Mining Engineering | May 2024 | Sections 1.5, 1.8.2, 2, 3, 4, 5, 9.2, 9.3, 9.4, 9.5, 10, 12, 13, 14, 15, 16, 17, 18, 19, 20, 21, 22.2 and 23.2. |
| | | |
| 2.5 | Previously filed Technical Report Summaries |
This is the first TRS filed for the Property and therefore does not update a previously filed TRS.
The opinions of QPs in the employ of WSP contained herein and effective 31 December 2023, are based on information collected throughout the course of investigations by the QPs. The information in turn reflects various technical and economic conditions at the time of preparing the TRS. Given the nature of the mining business, these conditions can change significantly over relatively short periods of time. Consequently, actual results may be significantly more or less favourable.
This TRS may include technical information that requires subsequent calculations to derive sub-totals, totals, and weighted averages. Such calculations inherently involve a degree of rounding, and consequently introduce a margin of error. Where these occur, the QPs do not consider them to be material.
Neither WSP, nor the QPs responsible for this TRS, are insiders, associates, or affiliates of BMC Limited or any of its subsidiaries. The results of the technical review by the QPs are not dependent on any prior agreements concerning the conclusions to be reached, nor are there any undisclosed understandings concerning any future business dealings.
Project No PS213686
Mazowe Mine
S-K 1300 Technical Report Summary
Bulawayo Mining Company Limited | WSP
January 2025
Page 13 |
The Property is one of the oldest mines in Zimbabwe, with exploration and development dating back to 1890. More than 1.4 million ounces (Moz) of gold has been recovered to date. The Property covers 1,955.5 hectares (ha) of land holding ML 35. Ore is processed in a single processing plant, consisting of conventional crushing and milling and a Carbon-in-Leach (CIL) facility (GFM 2018).
The Property has a Mineral Resource and Mineral Reserve estimated and reported (as at 30 June 2018) in accordance with the 2016 Edition of the SAMREC Code.
The Mineral Resource estimates have not been updated since the MGM was placed on C&M in April 2019. WSP was informed by MMC Zimbabwe that the B.S.V. Mineral Resource is no longer included in the greater MGM Mineral Resource, hence; it was excluded. The Mineral Resource (as at 31 December 2023) contains approximately 1.2 Moz of gold, and the historical reserve contains approximately 120 thousand ounces (koz) of gold (Sections 11.3 and 1.8.2 respectively). There is no current Mineral Reserve stated for the MGM.
Mineralised zones at the Property generally comprise shear zones, which are in-filled with gold-bearing sulphides, and quartz. Mineralised zones are up to 1.0 m in width, range from 25 to 200 m along strike, generally dip between 10 and 60° to the north, and possess mean gold grades of approximately 4 to 5 grams per tonne (g/t) (GFM 2018). Gold mineralisation is associated with pyrite, pyrrhotite, and arsenopyrite. In most cases, gold is strongly associated with sulphide mineralisation, and only to a limited degree with quartz veins. Approximately 70% of the gold present occurs as ‘free gold’. More than 15 mineralised zones have been exploited to date (GFM 2018).
The Property was placed on C&M in August 2018. At that time, installed ore hoisting capacity was 19,000 tonnes per month (tpm), and milling capacity was 10,500 tpm. Total production for 2017 (the last full year of production prior to the operation being placed on C&M) was 8,625 oz of gold (GFM 2018). The mean mined gold grade was 4.20 g/t (GFM 2018). In the five full years prior to 2018 (between 2013 and 2017), gold production averaged 10,500 oz per annum.
Significant exploration potential exists at the Property, and BMC Limited’s conceptual target size for the Property is in the order of 2.5 to 3 Moz of gold to a depth of 1,000 m. The Mazowe deposit mainly comprises several sub-parallel east-striking, shear hosted narrow reefs, and has a defined strike length of approximately 3 kilometres (km). It is open both along strike, and down-dip (GFM 2018).
The Property is located in Mashonaland Central Province, Zimbabwe, approximately 50 km north of the City of Harare (latitude 17°28’S and longitude 30°55’E). A railway line passes through the Property, linking up with the regional centres of Glendale, Bindura, and Shamva (SRK 2012).
Project No PS213686
Mazowe Mine
S-K 1300 Technical Report Summary
Bulawayo Mining Company Limited | WSP
January 2025
Page 14 |
The location of the property and its proximity to major infrastructure is presented in Figure 3.1.
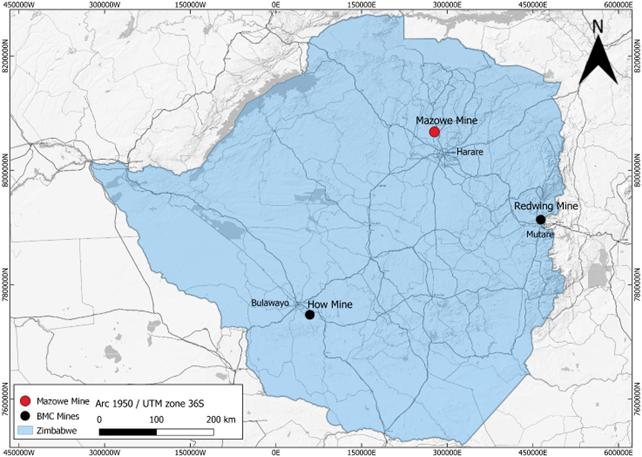
| Figure 3.1 | Property location map |
| | | |
| 3.2 | Title and mineral rights |
MMC Zimbabwe currently possesses total ground holdings under ML 35 totalling 1,955.5 ha (GFM 2018).
Claims were pegged predominantly for precious metals, with 41 claims secured for base metals such as tungsten, iron, zinc, and nickel. These claims can be converted to precious metals claims as and when required (GFM 2018).
Protection is afforded by erecting concrete beacons with claim details engraved on a 200 x 200 mm aluminium plate, mounted on a metal post 600 mm above the beacon. Approximately 20% of the claim area has legally surveyed beacons (GFM 2018).
Theft of metal plates and metal posts has been a long-standing problem. GFM security is in a constant battle with illegal artisanal miners operating within the claim area (GFM 2018).
Project No PS213686
Mazowe Mine
S-K 1300 Technical Report Summary
Bulawayo Mining Company Limited | WSP
January 2025
Page 15 |
Figure 3.2 presents the MMC Zimbabwe claims boundary.

| Figure 3.2 | MMC Zimbabwe claims boundary |
While WSP has referred to tenement holdings in this TRS, such reference is for convenience only and may not be complete or accurate. WSP is not expert in tenement management and the reader should not rely on information in this TRS relating to the current ownership and legal standing of the tenements or any encumbrances impacting on those tenements. This TRS assumes that all tenements and tenement applications are in good standing and free of all encumbrances other than those set out in this TRS.
There are no known significant encumbrances to the Property that would impact the current Mineral Resources or Mineral Reserves.
| | | |
| 3.4 | Risks to access, title, or right to perform work |
Access to the mine site and to the ore is authorised by the applicable mining legislation, and MMC Zimbabwe’s title and mining rights (Section 3.2). Mining exploration and exploitation works conducted or to be conducted on site are authorised in accordance with the applicable legislation, and MMC Zimbabwe’s title and mining rights (Section 3.2). Other required permits and authorisations (e.g., environmental, building, etc.) are applied for by MMC Zimbabwe in accordance with the applicable legislation.
Project No PS213686
Mazowe Mine
S-K 1300 Technical Report Summary
Bulawayo Mining Company Limited | WSP
January 2025
Page 16 |
| 3.5 | Agreements and royalties |
In 2022, the government of Zimbabwe has promulgated new regulations through Statutory Instrument 189 of 2022 to the effect that mineral royalties are to be paid partly in kind and partly in monetary form. The mineral royalties are collected from minerals specified in terms of section 49(1)(c1) of the Reserve Bank of Zimbabwe Act [Chapter 11:15] deemed to be components of the reserves maintained by the Reserve Bank of Zimbabwe. Minerals include but are not limited to gold, diamonds, platinum group metals and lithium. These regulations have also caused timeous amendments to the Finance Act and the Reserve Bank of Zimbabwe Act to ensure the cooperation in application of legislation (BMC 2023).
In 2024, the monetary component was revised. Royalties remitted to the Zimbabwe Revenue Authority in respect of gold and those minerals specified are paid based on 50% in kind and 50% in monetary form. With regards the “in kind component”, miners submit actual minerals they would have extracted. The 50% monetary component would be paid as follows:
| — | 37.5% in the Zimbabwe Gold (ZiG) currency. |
| — | 12.5% in foreign currency (RBZ 2024). |
Prior to the promulgation of these regulations, royalties were paid only in monetary form.
A US$21 per kilogram (/kg) realisation fee is also charged for gold lodged with Fidelity Printers and Refiners (BMC 2023).
Project No PS213686
Mazowe Mine
S-K 1300 Technical Report Summary
Bulawayo Mining Company Limited | WSP
January 2025
Page 17 |
| 4 | Accessibility, climate, local resources, infrastructure and physiography |
| | | |
| 4.1 | Topography, elevation, and vegetation |
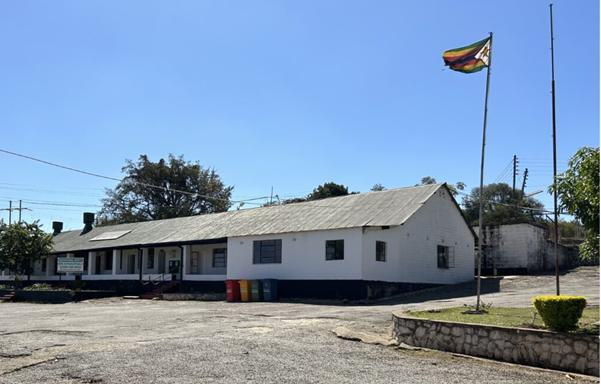
The terrain across the Property is undulating ground, well treed, with frequent granitic and greenstone hills. The elevation is approximately 1,300 m above mean sea level (amsl). A system of seasonal streams, flowing east into the perennial Mazowe River, and west into the Marodzi River, provide good drainage to the area. Depending on rock types, weathering of mafic rocks has resulted in the formation of reddish soils, while felsic rocks have resulted in the formation of slighter coloured sandy loams. The area is endowed with good soils and is intensively cultivated for maize, wheat, cotton, and citrus (GFM 2018).
The Property is accessible via the A11 between Harare, and Glendale. A railway line passes through the Property, linking up with the regional centres of Glendale, Bindura, and Shamva (SRK 2012).
| | | |
| 4.3 | Proximity to population centres |
The MGM is located in Mashonaland Central Province, Zimbabwe, approximately 50 km north of the city of Harare, Zimbabwe (latitude 17°28’S and longitude 30°55’E), which has a population of approximately 1.5 million.
A railway line passes through the Property, linking up with the regional centres of Glendale, Bindura, and Shamva (SRK 2012).
Harare is serviced by Robert Gabriel Mugabe (RGM) International Airport, operated by the Airport Company of Zimbabwe (Private) Limited (ACZ), which has the capacity to handle 2.5 million passengers per annum (ACZ 2024). The National Railways of Zimbabwe (NRZ) provides both freight services (NRZ 2024a), and passenger services (NRZ 2024b).
The MCM operates continuously throughout the year, with no interruptions due to seasonal changes.
Temperatures are cold during winter, although frost is rare. Hot summers are experienced, with temperatures reaching 30 degrees Celsius (°C). Average annual rainfall for the area is approximately 950 millimetres (mm), though extremes of up to 1,560 mm have been recorded. The rainy season stretches from mid-November to mid-March (SRK 2012).
Figure 4.1 presents climate statistics for Mazowe, Zimbabwe.
Project No PS213686
Mazowe Mine
S-K 1300 Technical Report Summary
Bulawayo Mining Company Limited | WSP
January 2025
Page 18 |

| Figure 4.1 | Climate statistics for Mazowe, Zimbabwe (Meteoblue 2024) |
| | | |
| 4.5 | Local resources and existing infrastructure |
MGM has access to two power supply lines, a 33 kilovolt (kV) supply and an 11 kV supply. Power supply is from the power utility company, Zimbabwe Electricity Transmission and Distribution Company (ZETDC), a subsidiary of Zimbabwe Electricity Supply Authority (ZESA) [BMC Limited].
Power is then transformed to the following voltages (BMC Operations Reports):
| — | 11 kV: Distribution voltage for CIL, underground feed, and domestic supply. |
| — | 2.2 kV: Supply voltage for compressors, village transformers supply, and underground feed. |
| — | 550 V: Supply voltage for mine plants, including underground and workshop equipment. |
| — | 380 V: Supply voltage for villages, offices, and domestic water supply. |
The following transformers are utilised by the MGM (BMC Limited Operations Reports):
| — | 2 x 750 kilovolt ampere (kVA) transformers (33kV to 550 V). |
| — | 1 x 750 kVA, which is 33 kV to 2.2 Kv. |
| — | 1 x 2 Megavolt-ampere (MVA), which is 33 kV to 11 kV. |
| — | 1 x 200 kVA 2.2 kV to 550 V located on the 22 level Ogilvy Shaft for underground supply. |
Project No PS213686
Mazowe Mine
S-K 1300 Technical Report Summary
Bulawayo Mining Company Limited | WSP
January 2025
Page 19 |
Process water is pumped from underground (it simultaneously supplies the plant whist dewatering the mine) into water reservoirs with a capacity of more than 350 cubic metres (m3). Process water is accessed by way of gravity flow, and mechanical pumping. It is received at the mill feeds and discharge, cyclone feed sumps, VD9, and trash screen sprays, and for general plat housekeeping. Spilled water is pumped back into the system using a DTV pump. Zero water discharge at the mills is maintained through the use of another DTV pump at the CIL feed section of the plant. Overflow water from the thickener is pumped back to the main mill water tank, with any other water gravitating to the Knelson Concentrator water feed sumps.
The mine has a mine dam as a source of water. The average dam level is 80%. The dam is linked to the much larger Jumbo dam which is an alternative source of water though it has not been used as the mine dam has been sufficient.
The mine is situated in a high rainfall region with a yearly average rainfall of 950 mm though extremes of 1,560 mm have been recorded.
The mine is also flooded, and water can be recycled for processing.
At the time the MGM was placed on C&M, the underground section consisted of 389 workers, against a labour budget of 514. The mine was operating with two production shifts per day (Morning Shift = 0500 hours to 1300 hours, and Night Shift = 2000 hours to 0400 hours), with labour equally distributed as the production target for each shift was the same.
Drilling was conducted on both day and night, with lashing also being conducted on both shifts. Blasting was conducted once per day between 1500 and 1600 hours, with re-entry at 2000 hours as per regulations, so as to give the mine time to adequately ventilate and expel fumes generated by blasting.
Two Mine Captains (reporting to the Underground Manager), and four Overseer Miners (three reporting to the Mine Captain production, and one to the Mine Captain development) were in place.
General labour force is available within the surrounding communities. For specialised skills, advertisements are flighted in the public press and usually they will come from any part of the country (BMC Limited).
Consumables and spares are sourced locally, with a few exceptional cases where they are imported from South Africa (BMC Limited).
Project No PS213686
Mazowe Mine
S-K 1300 Technical Report Summary
Bulawayo Mining Company Limited | WSP
January 2025
Page 20 |
| | | |
| 5.1 | Exploration and ownership history |
The history of the MGM is largely associated with that of the Jumbo Mine. It is estimated that prior to 1980, at least 150,000 oz of gold was extracted. In 1903, the Jumbo Gold Mining Company (JCMC) was floated. This marked the first substantial development of the mine. During the period 1906/1907, a 30-stamp mill was erected, and the JCMC secured the majority of the adjoining claims, including the Jumbo NE extension, and the Ceowara claims on Amatola Farm (GFM 2018).
As the mine increased in depth, mineralised zones became shorter and further apart, hence development was ceased in 1912. Development of the mine decline continued until 1917, when milling also ceased (GFM 2018).
During 1906 to 1917, a total of 293,000 tonnes (t) of ore were treated at a recovered grade of 15.7 g/t Au, yielding approximately 147,898 oz of gold (GFM 2018).
Following closure of the JCMC in 1917, the mine was let out on tribute and was worked until 1931 (GFM 2018).
Between 1932 and 1953, the mine area was a hive of individual self-contained small-scale workings, which included the Carnbrae, Birthday, Connaught, Bojum, Bucks, and Flowing Bowl areas (GFM 2018).
In 1953, all existing tributes were terminated, and holdings were acquired by Lonrho Zimbabwe Ltd (Lonrho), which operated the area as a single entity. This was achieved using a system of cross-cuts, mined to link the various holdings. Today these cross-cuts serve as haulages (GFM 2018).
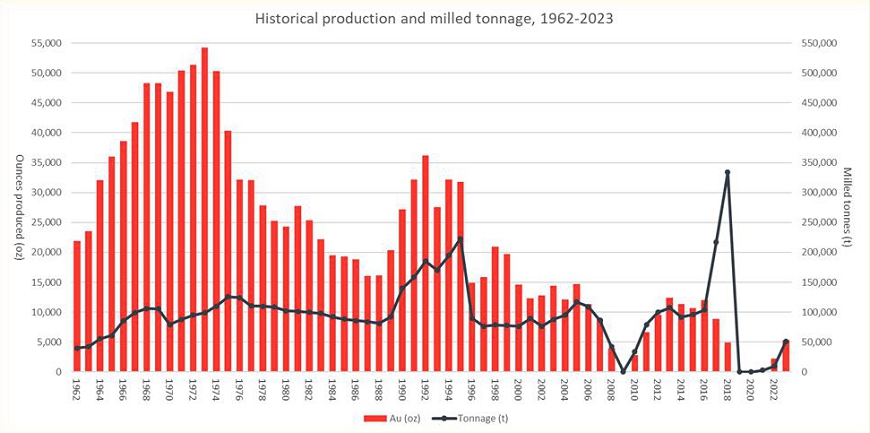
During this period, both Nucleus and Carnbrae continued to operate separately under the Murdoch Eaton brothers but were finally acquired by Lonrho in 1962. From 1962 onwards, production became steady and continuous. Production peaked between 1965 and 1973, when it averaged approximately 3,150 ounces per month (ozpm). After 1973, it declined, reaching its lowest levels in 1991. In the same year, Independence Gold Mining (Pvt) Limited (IGM) took over the mine (GFM 2018).
In 2002, BCM acquired IGM and took over GFM. Since then, post-Independence gold mining production rose from a low of 12,125 oz in 2001, to 15,050 oz in 2005. After 2005, production declined due to poor economic conditions, that prevailed until the introduction of the USD in 2009. Gold production sat at around 10–12 koz for the period 2012-2016, and declined to approximately 6 koz in 2017, and 1 koz in 2018, when the mine was placed on C&M (GFM 2018).
A Supreme Court ordered Corporate Rescue was implemented on 20 February 2020. The Corporate Rescue proceedings were nullified on 7 October 2021. An application to cancel court orders was submitted on 15 February 2024. New mining contracts were finalised in May 2024.
Total gold produced from the MGM between 1962 and 2023 is approximately 1.36 Moz.
Figure 5.1 presents total gold production from the MGM for the period 1962–2023.
Project No PS213686
Mazowe Mine
S-K 1300 Technical Report Summary
Bulawayo Mining Company Limited | WSP
January 2025
Page 21 |
| Figure 5.1 | MGM total gold production 1962–2023 |
Project No PS213686
Mazowe Mine
S-K 1300 Technical Report Summary
Bulawayo Mining Company Limited | WSP
January 2025
Page 22 |
| 5.3 | Production reconciliation |
The Property’s Mineral Resources as of the end of the 2023 and 2022 fiscal years are compared in Table 5.1. While there has been no change in the resource base as the result of mining depletion, there has been minor change associated with adjustment of COG from 2.52 g/t Au in 2022 to 2.58 g/t Au in 2023. There has been no statement of Mineral Reserves for the 2022 and 2023, and therefore no requirement for comparison.
Key variances between 2022 and 2023 Mineral Resources are summarised as follows:
| — | Measured Resources: A 0.08% reduction in ounces arising from the increase in COG. |
| — | Indicated Resources: No change from the increase in COG. |
| — | Measured and Indicated Resources: Tonnage decreased by 0.07% while grade improved by 0.04% leading to a net decrease of 0.02% in contained gold arising from the COG adjustments. |
| — | Inferred Resources: A 0.27% decrease in ounces arising from COG adjustments. |
| Table 5-1 | Mineral Resource summary comparison end December 2022 to end December 2023 |
| Category | 31 December 2022 | 31 December 2023 | Var. (%) |
| Tonnes (kt) | Au Grade (g/t) | Au (koz) | Tonnes (kt) | Au Grade (g/t) | Au (koz) | Au (koz) |
| Mineral Resources |
| Measured Mineral Resources | 260 | 8.99 | 75 | 260 | 9.01 | 75 | -0.08% |
| Indicated Mineral Resources | 910 | 7.42 | 217 | 910 | 7.42 | 217 | 0.00% |
| Total M+I Mineral Resources | 1,170 | 7.75 | 292 | 1,170 | 7.75 | 291 | -0.02% |
| Inferred Mineral Resources | 3,320 | 8.60 | 917 | 3,290 | 8.65 | 915 | -0.27% |
| Total Mineral Resources | 4,490 | 8.37 | 1,209 | 4,460 | 8.41 | 1,206 | -0.21% |
Notes: Numbers are rounded, Mineral Resources exclude Mineral Reserves, and Mineral Reserves are inclusive of dilution and ore loss.
| | | |
| 5.4 | Aggregate fiscal year production |
Since the mine has been on C&M since April 2019, there has been no material production from Mineral Resources over the past 3 years.
| | | |
| 5.5 | Exploration and development by previous owners or operators |
Previous exploration and development is discussed in Section 5.1.
Project No PS213686
Mazowe Mine
S-K 1300 Technical Report Summary
Bulawayo Mining Company Limited | WSP
January 2025
Page 23 |
Inspection of the draft Financial Statements for the year ended 31 December 2023 indicates MMC Zimbabwe carries substantial liabilities that total US$11.928 M comprising:
| — | Non-Current Liability for an “Environmental rehabilitation provision” for US$4.281 M. |
| — | Current Liability for “Trade and other payables” for US$7.647 M. |
Project No PS213686
Mazowe Mine
S-K 1300 Technical Report Summary
Bulawayo Mining Company Limited | WSP
January 2025
Page 24 |
| 6 | Geological setting, mineralisation, and deposit |
The MGM is situated within the Harare-Bindura-Shamva greenstone belt of the Zimbabwean (Archaean) Craton, on the margin of the Chinhamhora Batholith. The Harare-Bindura-Shamva greenstone belt comprises major metavolcano-sedimentary sequences, structurally intruded by the Chinhamhora Batholith, linking northwards through the Property area, and then eastwards along the Mazowe Valley, through the Harare-Bindura-Shamva greenstone belt (GFM 2018).
Figure 6.1 presents a simplified regional geology map of Zimbabwe, and the locations of major greenstone belts. The Harare-Bindura-Shamva greenstone belt can be seen in the top right.

| Figure 6.1 | Regional geology of Zimbabwe showing locations of greenstone belts (Prendergast 2004) |
Project No PS213686
Mazowe Mine
S-K 1300 Technical Report Summary
Bulawayo Mining Company Limited | WSP
January 2025
Page 25 |
The oldest sequence within the Harare-Bindura-Shamva greenstone belt is the Iron Mask Formation, which partially surrounds the later granitoid Chinhamhora Igneous Complex. It is predominantly a succession of metamorphosed felsic volcanics; mainly dacite, with lesser amounts of meta-andesite and meta-rhyolite. It comprises lavas, breccias, and varied volcaniclastics. Included metasediments are cherty sulphide iron formation, subsidiary phyllite, meta-arenite, and quartz schists. Uppermost in the Iron Mask Formation are carbonated meta-dacites and dacitic meta-volcaniclastics with very thin graphitic phyllites (GFM 2018).
The Iron Mask Formation is overlain by tholeiitic metabasalts of the Arcturus Formation. In the east, this formation includes thick sequences of metabasalt, minor meta-andesite/dacite, Banded Iron Formation (BIF), chert bands and ultramafic schists (GFM 2018).
The Mount Hampden Formation overlies the metabasalt sequence in the central region of the greenstone belt and comprises graphitic to tuffaceous meta-argillites or phyllites. These are accompanied by Banded Iron Formation (BIF). Limestone deposits are developed in part of the succession (Passaford and Sternblick regions). The thick phyllite sequences are intimately folded or interdigitated with metabasalts at their base and with metasediments at their top (GFM 2018).
The Passaford Formation is both the uppermost and most complicated sequence within the Harare-Bindura-Shamva greenstone belt. Within the Passaford Formation, the succession is divided into two members, one predominantly comprising felsic metavolcanics, and the other comprising metasediments varying from quartzite to re-worked volcaniclastics, and wackes. The contacts between the metavolcanic and metasedimentary members are gradational, and the lithologies are often interdigitated (GFM 2018).
Metagabbro bodies of the Selby Mafic Igneous event later intruded the entire Harare-Bindura-Shamva greenstone belt sequence described above (GFM 2018).
The Harare-Bindura-Shamva greenstone belt is intruded and circumscribed by various granitoid complexes. To the north and northeast, the Chinhamhora Igneous Complex comprises gneissic tonalite-granodiorite plutons. To the west, the Nyabira Complex includes granitised hornblende granodiorite intrusive that has intruded into the older leucotonalite/trondhjemite gneiss. To the south, the greenstones are bound by the Harare Granite. The earliest lithology in the Harare Complex is the Chinyika Tonalite, which was also intruded by the Harare Granite. In the east lies the Chikwaka Injection Complex, which essentially comprises migmatites. This complex terrain contains numerous greenstone xenoliths, comprising amphibolite, serpentinite, and granitite schist (GFM 2018).
Minor plutons such as the Chishawasha, intrude the interior of the Harare-Bindura-Shamva greenstone belt. The Maryvale porphyritic granite, and the Jumbo Porphyry and Granodiorite (north of Mazowe) are younger sub-volcanic intrusions into the metavolcano-sedimentary sequences of the Harare-Bindura-Shamva greenstone belt (GFM 2018).
Quartz gabbro dykes fill north-northeast striking fractures, which are parallel to the Great Dyke. Later Proterozoic igneous activity led to the intrusion of differentiated ultramafic/mafic bodies of the Manyika Event. The widespread ‘dolerite’ intrusions of the Mashonaland Event followed. These sills and dykes, which generally trend northeast to southwest, comprise tholeiitic dolerite/gabbro (GFM 2018).
| | | |
| 6.3 | Local and Property geology |
The typical lithology of the Mazowe Granodiorite is a coarse, crystalline quartz-rich porphyritic granodiorite. Feldspar porphyries occur in the eastern to southern parts of the mine complex. They are typically dark grey or black in colour, with pronounced white phenocrysts of quartz and feldspar. To the east of the Property, feldspar porphyries grade into metabasaltic rocks. These are intercalated with BIF in places. Thin ultramafic units/lithologies are known to occur in the footwall of the Jumbo mineralised shear zone (GFM 2018).
There are three principal dyke systems at the Mazowe. In the Connaught Section, narrow basic dykes have intruded into the mineralised shear zones, often splitting them in two. Cutting across all the principal mineralised shear zone systems is a northeast-southwest trending quartz porphyry granite dyke. dipping at a shallow angle to the southeast with a width of approximately 5 m. The youngest dyke is a dolerite intrusion, which also cuts across the principal mineralised shear zones. This 7 m thick dyke has a dome-like form and dips flatly to the west in the Connaught to Bucks area, and flatly to the south in the Nucleus to Carnbrae area (GFM 2018).
Project No PS213686
Mazowe Mine
S-K 1300 Technical Report Summary
Bulawayo Mining Company Limited | WSP
January 2025
Page 26 |
Figure 6.2 presents a geological plan of the Mazowe area.
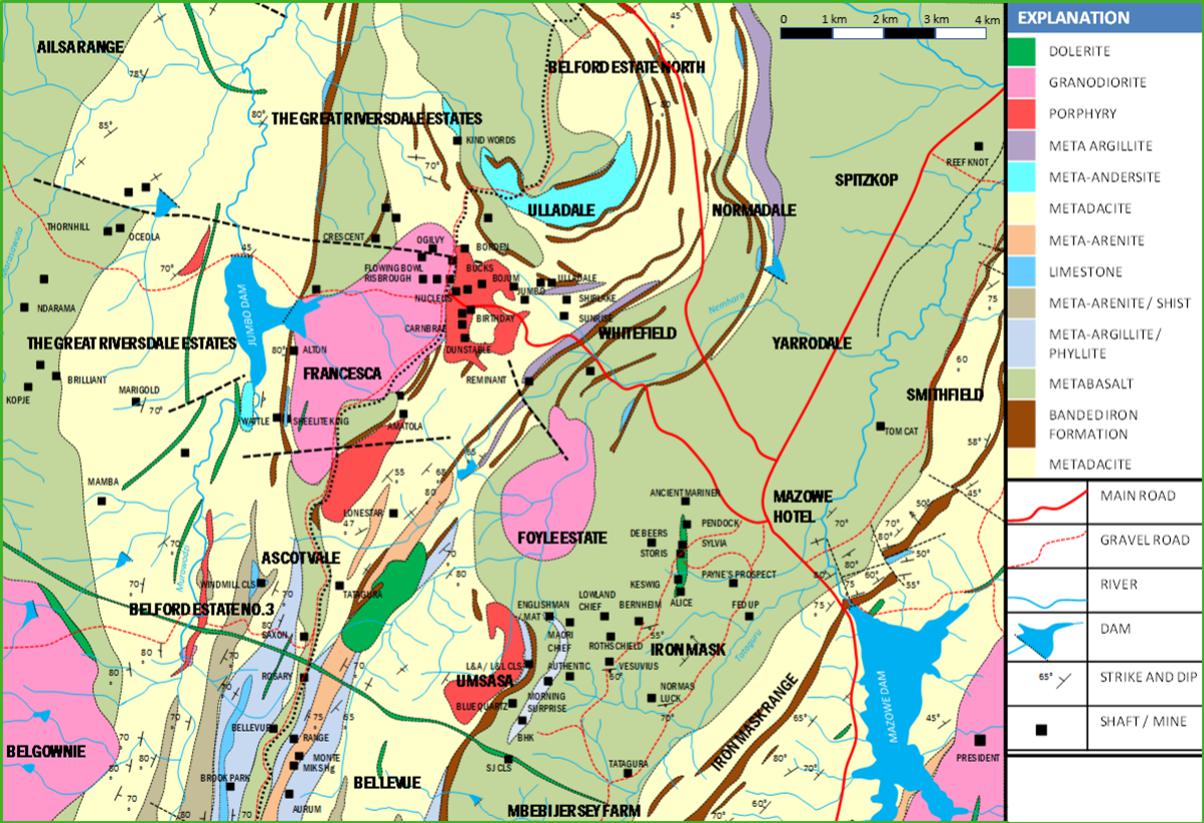
| Figure 6.2 | Local geology of the Mazowe area (GFM 2018) |
Figure 6.3 presents the local stratigraphy of the Mazowe area.
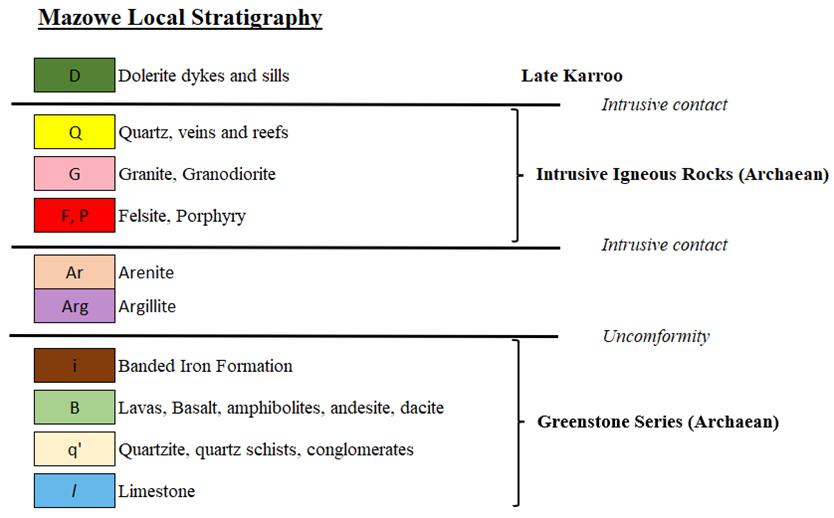
| Figure 6.3 | Local stratigraphy of the Mazowe area |
| 6.4 | Deposit type and geology |
The mineralisation at the MGM is collectively hosted by granodiorite stock and feldspar porphyries. These lithologies are host to a multitude of narrow, sub-parallel mineralised shear zones, which form an imbricate thrust shear zone system (GFM 2018).
Project No PS213686
Mazowe Mine
S-K 1300 Technical Report Summary
Bulawayo Mining Company Limited | WSP
January 2025
Page 27 |
To date more than 15 sub-parallel shear zones have been identified. These shear zones strike east-west and dip to the north at approximately 10 to 50° degrees. Slickenside lineations plunging 50° to the northeast are evident throughout the mine. From north to south, mining has exposed the following mineralised shear zones (GFM 2018):
| — | Shear zones are generally separated by unsheared zones (lithons) of ± 30 m in width. |
These shear zones splay and link in an anastomosing pattern, along strike and down-dip, as demonstrated by the Nucleus Reef on lower levels. The east-west striking mineralised shear zones show dominantly reverse movement, with a component of sinistral oblique slip. Figure 6.4 presents a cross-section looking west through the main Property reefs.
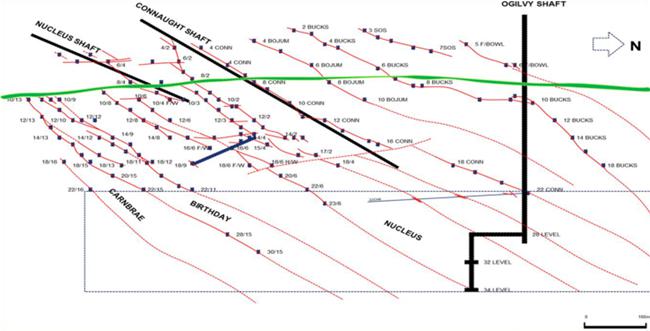
| Figure 6.4 | Cross-section looking west through the main Property reefs (GFM 2018) |
More recently, it has been noted that mineralised shear zones dip to the south at 5 to 25°. The north dipping mineralised shear zones are either displaced, or apparently terminated against the south dipping mineralised shear zones, suggesting that the latter are later features (GFM 2018).
The only major faults that displace the mineralised shear zones are strike-slip faults, one of which terminates the Nucleus and Birthday reefs at their eastern extremities. This fault has a sinistral reverse sense of displacement, indicating a strong likelihood that extensions to the Nucleus, and Birthday reefs may be present east of the fault (GFM 2018).
The mineralisation at the MGM is collectively hosted by granodiorite stock, concentrated around the northeastern tip and extending eastwards into the feldspar porphyries, both with a similar style of mineralisation (GFM 2018).
Mineralisation varies somewhat with the type of country rock through which the mineralised shears zones pass. In most cases, gold is strongly associated with sulphide mineralisation and only to a limited degree with quartz veins. Typical quartz-pyrite mineralisation widths vary from less than 1 centimetre (cm) to approximately 20 cm, in shear zones of widths of ± 1 m (GFM 2018).
In the granodiorite, the principal sulphide is pyrite, which occurs in white to grey quartz. Scheelite, pyrrhotite and arsenopyrite also occur. Two ages of pyrite mineralisation are apparent, the oldest being a coarse crystalline pyrite, which is heavily fractured and intruded by younger quartz and pyrite. The younger pyrite is fine-grained or massive and contains myriads of quartz inclusions. Wall rock alteration of the east-west striking mineralised shear zones in the granodiorite is generally minor. Where shear zone splaying or anastomosing occurs however, the granodiorite is brecciated and saussuritised to a dark grey colour (GFM 2018).
In the porphyries, pyrrhotite becomes more abundant than pyrite and quartz is less common. Where sheared and mineralised, the feldspar porphyry is bleached and altered to a brownish colour (GFM 2018).
It is thought that the ore zones were formed by pulsating hydrothermal solutions, migrating along structurally controlled channels resulting from reverse dextral shearing in an imbricate thrust shear zone system (duplex) [GFM 2018].
Project No PS213686
Mazowe Mine
S-K 1300 Technical Report Summary
Bulawayo Mining Company Limited | WSP
January 2025
Page 28 |
| 7.1.1 | Underground drilling |
Underground diamond core drilling is the primary drilling method employed at the MGM. Diamond drill core is logged and sampled, with sample length dictated by the width of the mineralised shear zone. One sample each of the barren hanging wall and footwall is also taken and submitted for assay (GFM 2018).
Core size drilled at the MGM is AXT (35.51 mm core diameter), with full core being sampled (GFM 2018).
All underground diamond drill holes are collar and downhole surveyed (GFM 2018).
Underground diamond drill holes and channel sample locations are located using offsets from survey pegs with a known location (GFM 2018).
Plan views of channel sample and drill hole collars are provided in Figure 7.1 and Figure 7.2 respectively.
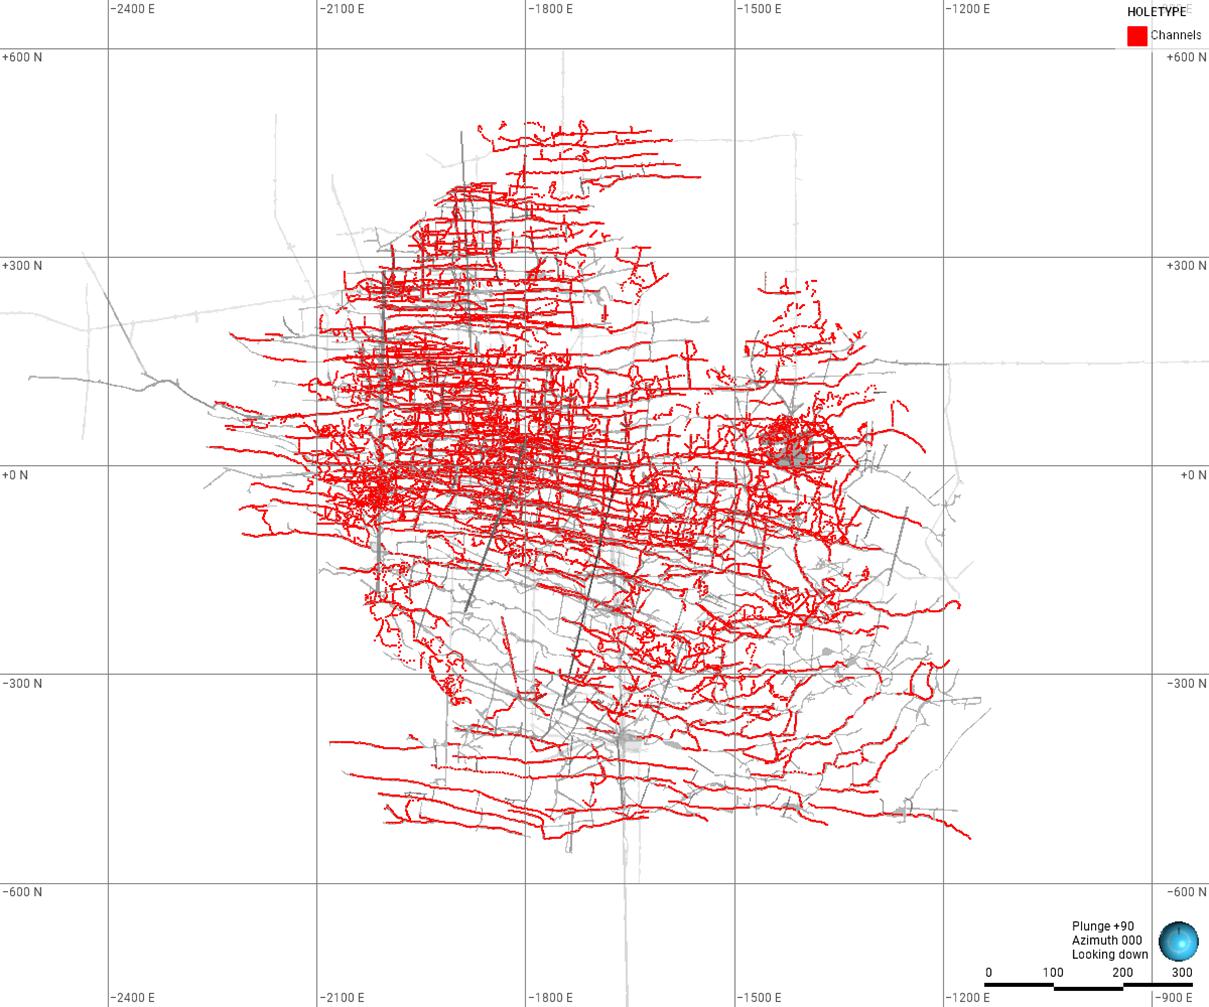
| Figure 7.1 | Plan view of channel samples and existing mine development |
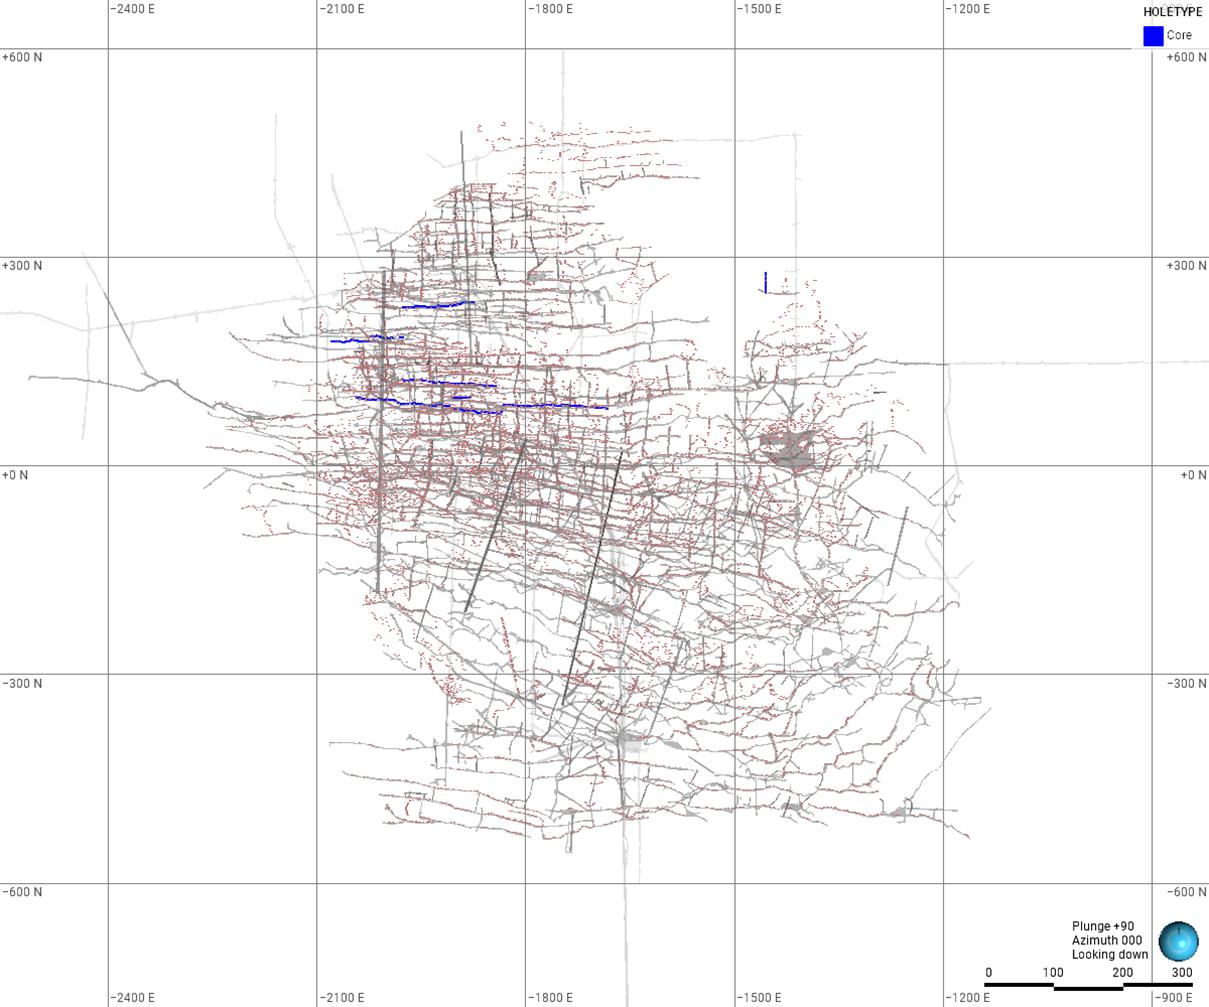
| Figure 7.2 | Plan view of drill hole collars and existing mine development |
Project No PS213686
Mazowe Mine
S-K 1300 Technical Report Summary
Bulawayo Mining Company Limited | WSP
January 2025
Page 29 |
Wide spaced surface diamond drilling to explore near to and above 10 Level expressions of shear zones/reefs in the Jumbo East area was previously conducted. The drill holes completed were spaced at over 100 m.
| 7.2 | Amatola surface exploration |
Surface exploration consisting of a ground magnetic survey and Reverse Circulation (RC) drilling at was conducted on the Amatola Prospect during 2016 aimed at exploring the near surface gold resources with the potential for open pit mining (GFM 2016).
| 7.2.1 | Ground magnetic survey |
A high-resolution ground magnetic survey was conducted on the whole of Mazowe mining lease, starting with the area SW of Mazowe Mine, covering Carnbrae and Amatola old workings. The BIF situated in the central part of the survey area (through Amatola area) is the source of most of the magnetic readings (GFM 2016). Interpretations of the magnetic survey are shown in Figure 7.3 and Figure 7.4.
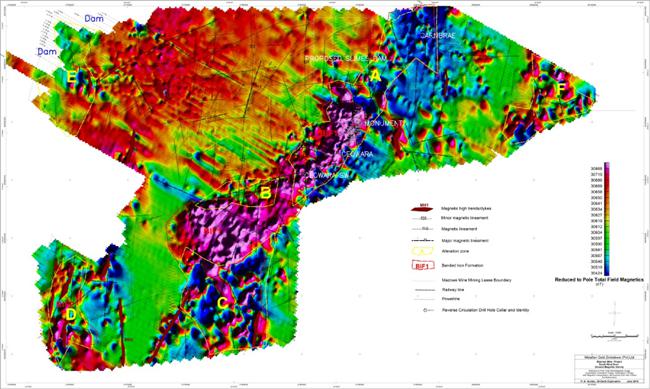
| Figure 7.3 | Mazowe SW reduced to pole total field magnetics with interpretation |
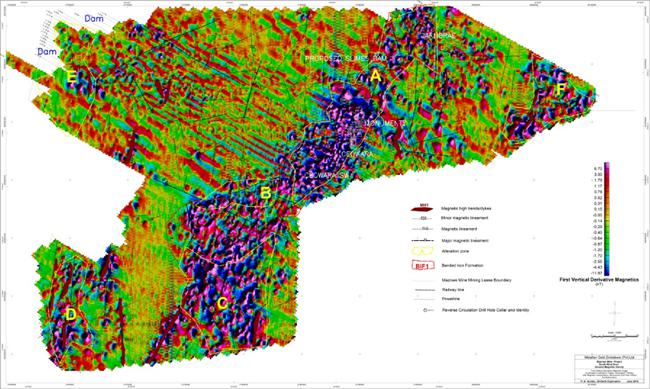
| Figure 7.4 | Mazowe SW first vertical derivative magnetics image with interpretation |
Project No PS213686
Mazowe Mine
S-K 1300 Technical Report Summary
Bulawayo Mining Company Limited | WSP
January 2025
Page 30 |
RC drilling was conducted on a grid design of 25 m on strike spacing by 20 m on dip spacing with infill drilling conducted depending on the style of mineralisation in order to fully evaluate the Prospects (GFM 2016).
| Table 7.1 | Summary of RC drilling |
| Prospect | Number of drill holes | Total meterage (m) |
| Monument | 42 | 1,701 |
| Ceowara | 57 | 2,280 |
| Ceowara SW | 47 | 2,197 |
Assay results from the Monument drilling were not favourable and the Prospect was considered not economically viable. Assay highlights from Ceowara and Ceowara SW are presented in Table 7.2 and Table 7.3.
| Table 7.2 | Assay highlights from Ceowara Prospect |
| DHID | Section | From (m) | To (m) | Intercept | Description |
| CRC01 | CW10 | 10 | 13 | 3 m @ 28.7 g/t | Contact zone between fractured, oxidised banded iron formation and kaolinised felsite. |
| 20 | 22 | 2 m @ 2.5 g/t | Ferruginised felsite showing some strong oxidation. |
| CRC03 | CW08 | 15 | 22 | 7 m @ 1.0 g/t | Contact zone between fractured, oxidised banded iron formation and strongly kaolinised felsite. |
| CRC04 | CW07 | 21 | 23 | 2 m @ 1.3 g/t | Contact zone between altered banded iron formation and ferruginised felsite. |
| CRC11 | CW11 | 20 | 22 | 2 m @ 1.4 g/t | Medium grained silicified felsitic unit with dense sulphide mineralisation plus chloritic alteration. |
| 26 | 30 | 4 m @ 1.7 g/t | Strongly oxidised and fractured limonitic banded iron formation. Slightly chloritic. |
| CRC12 | CW09 | 15 | 20 | 5 m @ 1.5 g/t | Oxidised, fractured and limonitic banded iron formation. |
| 24 | 25 | 1 m @ 3.7 g/t | Strongly kaolinised felsite. |
| CRC18 | CW07 | 21 | 24 | 3 m @ 1.7 g/t | Contact zone between altered banded iron formation and ferruginised felsite. |
| CRC21 | CW06 | 21 | 26 | 5 m @ 1.9 g/t | Contact zone between altered banded iron formation and ferruginised felsite. |
| CRC22 | CW08 | 18 | 23 | 5 m @ 1.6 g/t | Strongly ferruginised felsite. |
| 27 | 28 | 1 m @ 1.2 g/t | Felsite. Silicified and chloritic where fractured. |
| 31 | 33 | 2 m @ 2.0 g/t | Felsite. Silicified and chloritic where fractured. Galena mineralisation. |
| CRC29 | CW04 | 0 | 10 | 10 m @ 1.5 g/t | Strongly oxidised and fractured limonitic banded iron formation. Slightly chloritic. |
| 13 | 20 | 7 m @ 1.0 g/t | Strongly oxidised and fractured limonitic banded iron formation. Slightly chloritic. |
| CRC30 | CW08 | 14 | 16 | 2 m @ 1.4 g/t | Oxidised and moderately fractured banded iron formation. Slightly chloritic. |
| CRC31 | CW07 | 18 | 30 | 12 m @ 1.6 g/t | Moderately to strongly oxidised, fractured and limonitic banded iron formation. |
| CRC28 | CW04 | 12 | 25 | 13 m @ 3.4 g/t | Moderately to strongly oxidised, fractured and limonitic banded iron formation. |
| CRC24 | CW06 | 9 | 14 | 5 m @ 18.0 g/t | Moderately to strongly oxidised, fractured and limonitic banded iron formation. |
| 18 | 26 | 8 m @ 5.6 g/t | Moderately to strongly oxidised, fractured and limonitic banded iron formation. |
| CRC25 | CW06 | 12 | 15 | 3 m @ 1.0 g/t | Moderately to strongly oxidised silicified banded iron formation. |
| 25 | 27 | 2 m @ 2.8 g/t | Contact zone between altered banded iron formation and ferruginised felsite. |
| CRC32 | CW06 | 15 | 19 | 4 m @ 1.2 g/t | Moderately to strongly oxidised, fractured and limonitic banded iron formation. |
| 35 | 42 | 7 m @ 1.4 g/t | Moderately to strongly oxidised, fractured and limonitic banded iron formation. |
| CRC26 | CW05 | 18 | 21 | 3 m @ 2.5 g/t | Strongly ferruginised felsite. |
Project No PS213686
Mazowe Mine
S-K 1300 Technical Report Summary
Bulawayo Mining Company Limited | WSP
January 2025
Page 31 |
| Table 7.3 | Assay highlights from Ceowara SW Prospect |
| DHID | Section | From (m) | To (m) | Intercept | Description |
| CRC27 | CW05 | 14 | 21 | 7 m @ 2.0 g/t | Moderately to strongly oxidised, fractured and limonitic banded iron formation. |
| CRC34 | CW03 | 0 | 9 | 9 m @ 1.2 g/t | Moderately to strongly oxidised, fractured and slightly limonitic banded iron formation. |
| CRC33 | CW07 | 34 | 35 | 1 m @ 1.0 g/t | Sheared and weathered slightly ferruginised felsites. |
| CRC37 | CW10 | 21 | 28 | 7 m @ 1.6 g/t | Moderately to strongly oxidised, fractured and slightly limonitic banded iron formation. |
| CRC41 | CW09 | 20 | 25 | 5 m @ 2.7 g/t | Moderately to strongly oxidized and fractured banded iron formation. |
| 28 | 31 | 3 m @ 1.0 g/t | Moderately to strongly oxidised, fractured and slightly limonitic banded iron formation. |
| CRC40 | CW05 | 15 | 18 | 3 m @ 2.9 g/t | Strongly ferruginised and altered felsite. |
| 35 | 42 | 7 m @ 1.9 g/t | Moderately to strongly oxidized and fractured banded iron formation. |
| CRC45 | CW06 | 0 | 9 | 9 m @ 1.3 g/t | Ferruginised felsite showing some strong oxidation and weakly limonitic. |
| CRC39 | CW04 | 0 | 7 | 7 m @ 2.7 g/t | Moderately to strongly oxidised, fractured and slightly limonitic banded iron formation. |
| 28 | 31 | 3 m @ 1.5 g/t | Silicified and slightly oxidised banded iron formation. |
| 36 | 38 | 2 m @ 1.0 g/t | Contact zone between altered banded iron formation and felsites with sulphide mineralisation. |
| CRC47 | CW08 | 21 | 28 | 7 m @ 6.6 g/t | Banded iron formation. Strongly oxidised, altered, moderately fractured, chloritic and weakly limonitic |
| CRC48 | CW06 | 36 | 42 | 6 m @ 3.3 g/t | Banded iron formation. Strongly silicified and altered. Weakly fractured and chloritic in places. |
| CRC49 | CW05 | 31 | 41 | 10 m @ 1.7 g/t | Strongly altered and oxidised banded iron formation. Moderately limonitic and silicified. |
| CRC50 | CW09 | 24 | 33 | 9 m @ 5.1 g/t | Silicified and altered banded iron formation. Weakly limonitic and in contact with completely weathered and kaolinised felsite. |
| CRC51 | CW10 | 4 | 9 | 5 m @ 1.1 g/t | Felsite. Completely weathered and oxidised. |
| 25 | 34 | 9 m @ 74.1 g/t | Moderately to strongly silicified and oxidised banded iron formation. Fractured and limonitic. |
| CRC53 | CW11 | 35 | 38 | 3 m @ 4.9 g/t | Completely weathered and kaolinised felsite. Chloritic. |
| CRC54 | CW11 | 22 | 23 | 1 m @ 1.3 g/t | Moderately to strongly silicified and oxidised banded iron formation. Fractured and limonitic. |
| CWRC07 | CWSW03 | 2 | 6 | 4m @ 4g/t | Silicified felsite. Weakly to moderately ferruginised and slightly limonitic. |
| 10 | 14 | 4m @ 1.7g/t | Felsite. Strongly oxidised and weakly to moderately kaolinised. |
| 18 | 31 | 13m @ 1.0g/t | Felsite. Sheared in places. Strongly oxidised and moderately limonitic. Slightly kaolinised in places. |
| 51 | 52 | 1m @ 4.4g/t | Strongly silicified felsite. Chloritic plus sulphide mineralisation. |
| CWRC08 | CWSW02 | 5 | 9 | 4m @ 1.0g/t | Contact from ferruginous schist going into moderately to strongly oxidised, fractured and slightly limonitic banded iron formation. |
| 29 | 34 | 5m @ 1.1g/t | Fine to medium grained felsite. Moderately ferruginous and kaolinised in places. |
| 46 | 47 | 1m @ 3.5g/t | Silicified felsite. Sericitised and moderately ferruginous. |
| CWRC04 | CWSW04 | 0 | 6 | 6m @ 6.7g/t | Felsite. Oxidised and slightly fractured. Slightly sheared and chloritic. |
| 55 | 60 | 5m @ 53.5g/t | Silicified felsite. Strongly chloritic plus sulphide mineralisation. White quartz inclusions at 57-58m with suphide mineralisation. |
| CWRC02 | CWSW06 | 8 | 11 | 3m @ 1.5g/t | Medium grained felsite. Sheared, sericitised and chloritic. |
| CWRC09 | CWSW01 | 45 | 53 | 8m @ 3.2g/t | Strongly sheared and oxidised felsite. Chloritic and slightly limonitic in places. |
| CWRC10 | CWSW03 | 25 | 26 | 1m @ 3.3g/t | Felsite. Slightly sheared and weakly kaolinised. |
Project No PS213686
Mazowe Mine
S-K 1300 Technical Report Summary
Bulawayo Mining Company Limited | WSP
January 2025
Page 32 |
| Table 7.3 | Assay highlights from Ceowara SW Prospect |
| DHID | Section | From (m) | To (m) | Intercept | Description |
| CWRC15 | CWSW04 | 20 | 21 | 2m @ 1.1g/t | Moderately to strongly oxidised, fractured and slightly limonitic banded iron formation. |
| 35 | 36 | 1m @ 1.9g/t | Moderately to strongly oxidised, fractured and slightly limonitic banded iron formation. |
| CWRC17 | CWSW06 | 12 | 17 | 5m @ 2.1g/t | Felsite. Sheared and ferruginous in fractured zones. Moderately limonitic. |
| CWRC11 | CWSW02 | 40 | 43 | 3m @ 3.0g/t | Moderately altered and silicified felsite. Slightly chloritic. |
| CWRC13 | CWSW00 | 10 | 11 | 1m @ 1.3g/t | Metabasalt. Strongly chloritic and silicified. |
| 48 | 54 | 6m @ 2.3g/t | Completely weathered and oxidized metabasalt plus quartz veining at 51-82m. |
| 57 | 63 | 6m @ 2.1g/t | Completely weathered plus moderately altered and fractured metabasalt with sulphide mineralisation. |
| CWRC20 | CWSW06 | 13 | 15 | 2m @ 1.3g/t | Strongly oxidised and moderately ferruginised felsite. Weakly limonitic and fractured in places. |
| 20 | 24 | 4m @ 1.2g/t | Strongly silicified felsite. Slightly chloritic. |
| CWRC23 | CWSW01 | 3 | 16 | 13m @ 1.3g/t | Moderately to strongly altered and weathered metabasalt. Chloritic plus quartz veining in places. |
| 27 | 35 | 8m @ 7.5g/t | Strongly sheared and chloritic metabasalt. Strongly altered. |
| CWRC25 | CWSW04 | 0 | 4 | 4m @ 2.9g/t | Strongly oxidised and fractured banded iron formation plus silicified and kaolinised felsite in places. |
| 43 | 50 | 7m @ 11.5g/t | Sheared and silicified banded iron formation. Chloritic and moderately limonitic. |
| CWRC28 | CWSW06 | 42 | 45 | 3m @ 3.0g/t | |
| CWRC31 | CWSW08 | 0 | 10 | 10m @ 2.6g/t | Sheared weakly to moderately ferruginised felsite. Slightly limonitic and fractured in places. |
| 25 | 32 | 7m @ 2.2g/t | Weakly to moderately ferruginised felsite. Slightly limonitic and fractured in places. Oxidised. |
| CWRC32 | CWSW07 | 3 | 11 | 8m @ 3.4g/t | Felsite. Moderately oxidized plus chloritic alteration. Weakly limonitic and ferruginous. |
| 19 | 20 | 1m @ 1.1g/t | Sheared felsite. Moderately chloritic and kaolinised. |
| 23 | 43 | 20m @ 5.6g/t | Weakly to moderately ferruginised felsite. Moderately limonitic and fractured in places. Oxidised. |
| CWRC33 | CWSW08 | 0 | 8 | 8m @ 1.0g/t | Strongly silicified banded iron formation. Altered in places. In contact with sheared and oxidized felsite. |
| CWRC38 | CWSW05 | 12 | 19 | 7m @ 1.1g/t | Completely weathered and kaolinised chloritic felsite. |
| CWRC39 | CWSW01 | 9 | 11 | 2m @ 14.1g/t | Massive metabasalt. Chloritic and epidotised. |
| 28 | 35 | 7m @ 2.8g/t | Ferruginised felsite. Oxidised, sericitised and limonitic. |
| CWRC40 | CWSW07 | 25 | 28 | 3m @ 5.19g/t | Silicified, chloritic and epidotised felsite plus pyrite mineralisation. |
| 48 | 49 | 1m @ 7.78g/t | strongly silicified and moderately chloritic felsite plus minor sulphide mineralisation in places. |
| CWRC41 | CWSW08 | 0 | 9 | 9m @ 1.0g/t | Silicified felsite. Moderately limonitic and chloritic. Weakly ferruginised. |
| 23 | 24 | 1m @ 1.1g/t | Silicified felsite plus strong sulphide mineralisation. Dark greyish. |
| CWRC42 | CWSW06 | 3 | 10 | 7m @ 2.7g/t | Moderately to strongly silicified and oxidised banded iron formation. Fractured and limonitic. |
| CWRC43 | CWSW05 | 9 | 14 | 5m @ 0.1g/t | |
| CWRC46 | CWSW01 | 14 | 16 | 2m @ 3.3g/t | Strongly sheared, oxidised and altered metabasalt. Completely weathered and oxidised in places. |
Project No PS213686
Mazowe Mine
S-K 1300 Technical Report Summary
Bulawayo Mining Company Limited | WSP
January 2025
Page 33 |
The QP considers the data collected including method of collection and storage to be appropriate for the preparation of geological models and Mineral Resources estimates, and that the data has been considered during resource classification. Historical mining areas adopted a combination of limited drilling and resource definition by level, raise and winze development, channel sampling, face sampling and mapping.
| 8 | Sample preparation, analyses, and security |
The following types of samples are used at the MGM for Mineral Resources estimation (GFM 2018)
Gold content data is obtained from AXT drill core (35.51 mm core diameter) samples. Underground exploration drilling is used to confirm the up and down-dip extensions of the mineralised shear zones as well as lateral extensions of parallel mineralised shear zones (GFM 2018).
For underground exploration drill holes intersecting mineralised shear zones, full core is sampled and sent for assay, with sample length dictated by the width of the mineralised shear zone. Sample lengths vary between a minimum length of 6 cm and a maximum length of 60 cm. One sample each of the barren hanging wall and footwall is also taken and submitted for assay (GFM 2018).
In the event of a thin stringer being intersected, a sample is taken to include both hangingwall and footwall contacts. Assay results are documented on the drill hole log sheets where a composite value is calculated for this type of intersection. The information is then transferred onto 1:500 scale survey/geology plans (GFM 2018).
Mineral Resource estimation for the high-nugget gold style mineralisation present at the Property is not based solely on diamond drill hole samples. The Property’s technical staff have found that diamond drill hole samples are widely spaced, small in size (sometimes less than 10 cm), and at times the diamond drill hole may have actually missed the reef it was planned to intersect, due to complexities caused by vein structure and geometry etc. Hence the additional dependency on channel samples, which are generally closely spaced along strike when compared to diamond drill holes (GFM 2018).
The estimated gold content of the mineralised shear zone is ascertained by way of diamond saw samples cut 2 cm x 2 cm over lengths dictated by the width of the mineralised shear zone, with a minimum of 2 cm and a maximum of 60 cm. This technique was initiated to replace older chip sampling techniques with what is considered a more reliable method (GFM 2018).
In drives and sub-levels, channels are cut at a 2 m interval perpendicular to the mineralised shear zone strike, on the southern side wall/footwall of the development. Haulages/cross-cuts are all sampled at a 2 m interval (GFM 2018).
Often 2 cm depth is not achieved, and the channel being cut is uneven. Due to the nature of the mineralisation being characterised by a high nugget effect, a large sample is required for samples to be representative. To this end, a larger sample can be achieved through increasing the channel width to 4 cm (GFM 2018).
The sampling protocol also focusses on quality rather than quantity only of the samples taken. The geological contacts are sharp, hence, sample lengths along the channel are determined according to geology. Additional data is added through sampling where required (GFM 2018).
Gold assays returned from the laboratory are reported to two decimal places, with the lowest reported value being 0.04 g/t Au. Values less than 0.04 g/t Au are reported as half detection limits. Only composite channel values are transferred onto assay plans (GFM 2018).
Project No PS213686
Mazowe Mine
S-K 1300 Technical Report Summary
Bulawayo Mining Company Limited | WSP
January 2025
Page 34 |
Grab samples are taken from box holes, tramming level tips and chutes. Scoops of broken material are collected from the centre and four corners of each cocopan. Samples collected are put into a container and at the end of the shift, each sample is mixed, quartered and submitted for assay as part of a grade monitoring program. These samples are not used for Mineral Resource estimation but for validation purposes (GFM 2018).
Underground channel, diamond drill core, and grab samples from loading chutes and cars are taken to the on-site assay laboratory, which is situated in the security-controlled area of the mine (GFM 2018).
| 8.1.5 | Dry bulk density determination |
MMC Zimbabwe determined dry bulk density (BD) by collecting and analysing stope samples. A total of 103 samples were collected and analysed. Samples were analysed in the MGM on-site assay laboratory using Archimedes’ Principle (GFM 2018). Full results are presented in GFM (2018).
The method used was as follows (GFM 2018):
| — | Samples roasted in a drier to remove moisture. |
| — | Samples weighed, and the mass of the sample determined, using an electronic balance (scale). |
| — | Samples tied to a thin, strong length of string, and lowered gradually into water in a measuring cylinder until entirely submerged. |
| — | Displaced volume of water calculated by subtracting the initial reading from the final reading. |
| — | BD = Weight of Sample/Volume of Water Displaced by the Sample. |
Mean values returned a BD value of 2.90 grams per cubic centimetre (g/cm3) for Mazowe. These values were utilised for Mineral Resource estimation. Since Q2 2003, BD values have also been determined from diamond drill core reef intersections (GFM 2018).
| 8.2 | Sample preparation, analyses, and procedures |
The MGM on-site assay laboratory is capable of assaying 150 samples per day, which translates to 210 fusions. Fusions are treated in batches of 35, known as a “fire”, thus translating to a total of six fires per day. Other assays completed daily include 30 solutions and 10 carbons using Atomic Absorption Spectrometer (AAS) [Varian SpectrAA 50B] (GFM 2018).
The following analyses are completed: carbon assaying, solution samples analysis, and bullion assaying (GFM 2018).
Once sample preparation is complete, dependent on the sample type being assayed, the following procedures are undertaken: crushing, pulverising, fluxing, fusion, cupellation, parting, washing, and annealing (GFM 2018).
| | | |
| 8.3 | Quality Assurance Quality Control |
High-grade internal standards are produced from representative mill feeds, whilst low-grade internal standards are produced from CIL tails and waste rock. These samples were sent to S. Museka Lab. Consultancy Services (SML), Harare, Zimbabwe, where they were thoroughly and homogeneously mixed and split. Representative samples were then sent to different laboratories to determine assay values, which are then averaged. Samples from these standards are regularly sent through the assay stream for the purpose of monitoring the performance of the assay process. In addition, blanks are put into the stream to monitor contamination (GFM 2018).
External standards are procured from ROCKLABS New Zealand and other reputable sources. These standards are also into our systems for the purpose of monitoring the performance of the assay process. Internally, reference materials acquired from various sources are also used (GFM 2018).
Project No PS213686
Mazowe Mine
S-K 1300 Technical Report Summary
Bulawayo Mining Company Limited | WSP
January 2025
Page 35 |
The following Quality Assurance Quality Control Analysis (QAQC) procedures are utilised at the MGM (GFM 2018):
| — | Once CRM sample (either a standard or a blank) is inserted for every bench sampled or one in every twelve samples. |
| — | All CRM samples are tested for compliance to set tolerance ranges, typically ± 2 SD from the designated mean value. |
| — | Assay batches that are rejected are subjected to either re-assay or discarded with appropriate qualifications e.g., contamination, sample ticket mix up and transcription errors etc. |
| — | Channel sampling assay data is routinely subjected to validation by way of scatter and regression plots. |
| — | For every 10 samples of diamond drill core, at least one Certified Reference Material (CRM) sample (either a standard or a blank) is inserted into the sampling stream. |
| — | Core being sampled is halved, with one half of the core taken for assay and the other half being stored in the core library as a duplicate. For cases where the core splitter is not functioning, full core is sampled, and the resultant pulp is stored in the core library as a duplicate. |
| — | If the tenth drill core sample is a blank, then the twentieth sample becomes a standard and the thirtieth becomes a duplicate. This cycle is on occasion rotated to avoid predictability of results. |
| — | All CRM samples are tested for compliance to set tolerance ranges, typically ± 2 standard deviations (SD) from the designated mean value. |
| — | Assay batches that are rejected are subjected to either re-assay or discarded with appropriate qualifications e.g., contamination, sample ticket mix up and transcription errors etc. |
| — | Core drilling assay data is routinely subjected to validation by way of scatter and regression plots. |
| — | At least one CRM sample (either a standard or a blank) is inserted per day for each main tramming level. |
| — | All CRM samples are tested for compliance to set tolerance ranges, typically ± 2 SD from the designated mean value. |
| — | Assay batches that are rejected are subjected to either re-assay or discarded with appropriate qualifications e.g., contamination, sample ticket mix up and transcription errors etc. |
| — | Grab sampling assay data is routinely subjected to validation by way of scatter and regression plots. |
| — | A minimum of fifteen CRM samples (standards and/or blanks) are submitted every month. |
| — | All standards, blanks and duplicates are recorded in the site QAQC book along with the sampling date, mean value, assay value and SD. |
| — | The Section Geologist compiles a QAQC report as part of the site weekly report. |
| — | All assay data is subjected to QAQC iterations i.e., line graphs and regression plots and is analysed for compliance with the set tolerance ranges, typically ± 2 SD from the designated mean value. |
| — | For any other sampling projects carried out on surface or underground, outside of the normal sampling processes, CRM samples are inserted and analysed for compliance with set tolerance ranges, typically ±2 SD from the designated mean value. Anomalous results are handled in the same manner that core drilling, grab sample and channel samples are handled. |
| 8.4 | QP’s opinion on adequacy |
The QP considers the QAQC, and security protocols used at the Property to be appropriate in regard to the data used in the preparation of Mineral Resources estimates, and that the data has been considered during resource classification.
Project No PS213686
Mazowe Mine
S-K 1300 Technical Report Summary
Bulawayo Mining Company Limited | WSP
January 2025
Page 36 |
| 9.1 | Mineral Resources verification |
| 9.1.1 | Data verification conducted by MMC Zimbabwe |
Data validation conducted by MMC Zimbabwe was done so using Microsoft Excel, inbuilt Vulcan™ software validation tools, physical checks, and correction of any erroneous input data to ensure completeness, and integrity of captured data. Transcription errors were checked, identified, and corrected through direct comparison of captured data with data sources such as assay plans, and diamond drill core log sheets. Drill hole collar locations and elevations were inspected, verified and corrected in Vulcan™. MMC Zimbabwe staff also conducted visual validation of the block models developed (GFM 2018).
| 9.1.2 | Data verification conducted by WSP |
The QP has validated the following geological and Mineral Resources estimation data:
| — | Drill hole collar locations. |
| — | Drill hole downhole survey. |
| — | Mineral Resource tonnages and grades. WSP selected a number of wireframes (and accompanying block models) with the highest contained metal content for spot checks. Tonnages and grades were extracted using Vulcan™ tools, and the results were compared with tonnages and grades contained within the MGM block listing Excel workbook provided MMC Zimbabwe. |
Some errors were identified in drill hole locations, survey, validity of the wireframes, and cases of missing blocks within resource wireframes, shown in Table 9.1 and Figure 9.1.
Table 9-1 Summary of drill hole database errors
| Drill hole Errors | Number of Errors |
| No co-ordinates | 825 drill holes |
| Duplicate drill holes | 1,271 drill holes |
| Same survey location | 25 drill holes |
| No downhole survey data | 550 drill holes |
| Samples with no to/from depths | 3,628 samples |
| From depth ≥ to depth | 4 samples |
| Sample depth exceeds collar max-depth | 2 samples |
| Overlapping intervals | 198 samples |
Project No PS213686
Mazowe Mine
S-K 1300 Technical Report Summary
Bulawayo Mining Company Limited | WSP
January 2025
Page 37 |
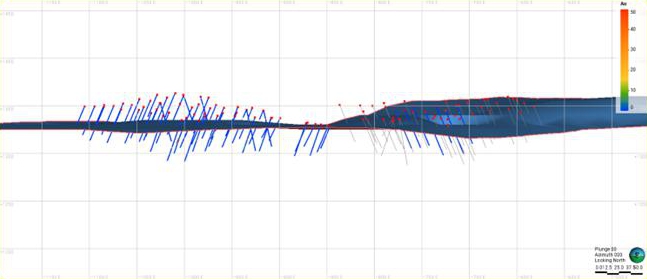
| Figure 9.1 | Section showing all drill holes above the MGM topographic surface |
| 9.1.3 | Limitations on Mineral Resources data verification |
The QP was not directly involved in the exploration drilling, and sampling programs that formed the basis for collecting the data used in the geological modelling and Mineral Resources estimates for the Property, and was unable to observe drilling, sampling, and sample preparation methods at the MGM during the personal inspection (Section 2.4).
The QP is not aware of any other limitations on nor failure to conduct appropriate data verification.
The QP has validated the data presented in Section 9.1, including collar survey, down hole geological data and observations, sampling, analytical, and other test data underlying the information or opinions contained in the written disclosure presented in this TRS. The QP has presented information relating to uncertainty in the estimates of Inferred, Indicated, and Measured Mineral Resources (Section 11.5), and opinions on factors likely to influence the prospect of economic extraction. A comprehensive list of Mineral Resources interpretations and conclusions, and Mineral Resources recommendations have also been presented in Sections 22.1, and 23.1 respectively.
Notwithstanding these matters, the QP considers the data used is acceptable for the purposes of geological modelling and Mineral Resources estimation.
| 9.2 | Mining and Mineral Reserves data verification |
While MGM has been under C&M since 2018, using the data provided by MMC Zimbabwe, the following has been conducted as spot checks on the June 2018 historical reserve estimate:
| — | Six stopes with the highest declared reserves have been selected for spot checks. Tonnage and grade were extracted through interrogation of Reserves Wireframes and Block Model provided using Deswik mining software. Some inconsistencies in reported estimates were noted, judged as not material to the total estimate. |
| — | Dilution was also estimated through the provided Mineral Reserve Excel block listing. |
| — | The QP considers the data suitable for the purposes of preparing the mine design, mine schedule, and Mineral Reserves estimate. |
| 9.3 | Geotechnical data verification |
Based on the documentation supplied to WSP, no geotechnical logging, or sampling has been conducted.
Large rockfalls occurred on 28 October 2014 and 21 January 2015, prompting a rock engineering review conducted by SRK Consulting (South Africa) (Pty) Ltd (SRKSA) in 2015. This review included the calculation of a Q rating using the Barton’s Q-system for rock mass classification. The Q rating for the typical host rock at MGM can be estimated as follows (SRKSA 2015):
| — | Rock Quality Designation (RQD) = 100. |
| — | Number of joint sets (Jn) = 0.5 to 2. |
Project No PS213686
Mazowe Mine
S-K 1300 Technical Report Summary
Bulawayo Mining Company Limited | WSP
January 2025
Page 38 |
| — | Roughness of the most unfavourable joint or discontinuity (Jr) = 2 to 4. |
| — | Degree of alteration or filling along the weakest joint (Ja) = 1. |
| — | Stress condition given as the stress reduction factor (SRF) = 1. |
The Q rating for typical host rock ranges between 100 and 800 (Class A, extremely good to exceptionally good) [SRKSA 2015].
In the opinion of the QP, the geotechnical data used to inform design parameters is of adequate quality for the Property and its material types and for the purposes used in this TRS.
| 9.4 | Hydrology and hydrogeology data verification |
No specific hydrological or hydrogeological studies have been undertaken by MMC Limited for the MGM. The following is a general characterisation of the MGM area.
The MGM is located within the Upper Mazowe Sub-Catchment of the Mazowe Catchment. Figure 9.2 shows the various Zimbabwe catchments, and Figure 9.3 shows the mean annual rainfall within the Mazowe catchment.
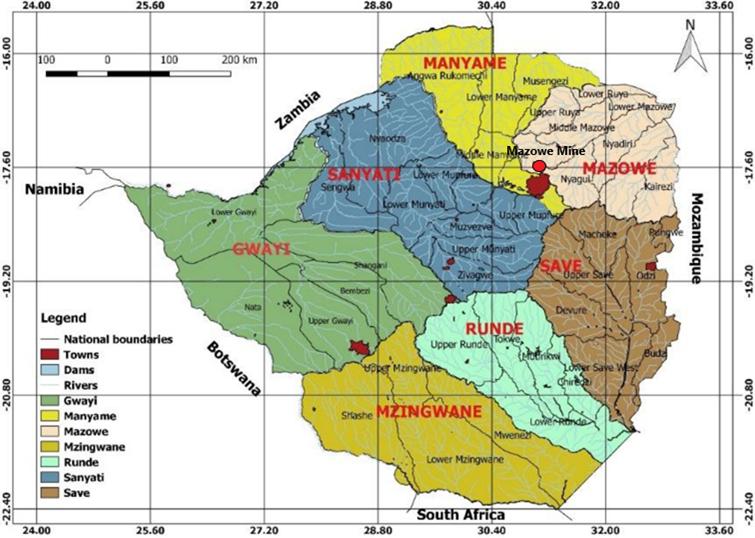
| Figure 9.2 | Catchment boundaries of Zimbabwe (BMC Limited) |
Project No PS213686
Mazowe Mine
S-K 1300 Technical Report Summary
Bulawayo Mining Company Limited | WSP
January 2025
Page 39 |
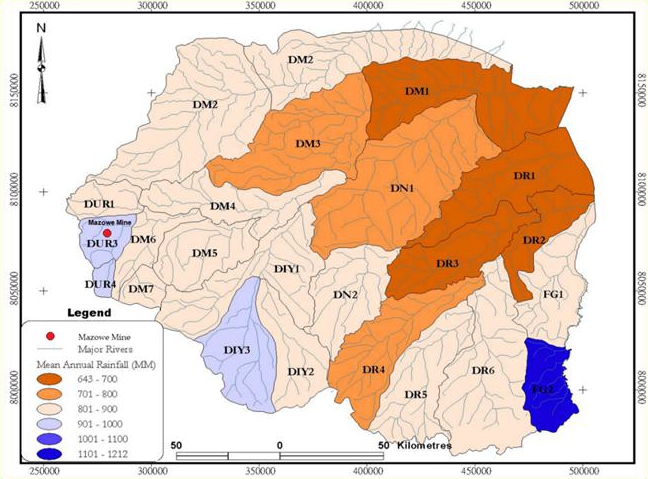
| Figure 9.3 | Mean annual rainfall within the Mazowe catchment (Waterkings 2014) |
The MGM is located within the hydrological sub-zone DUR3 of Upper Mazowe sub-catchment of Mazowe catchment. The area has a Mean Annual Run-off (MAR) of 164 mm and a Coefficient of Variation (CV) of 90%, thus there is a great variation in the run-off that is experienced from year to year. The mine is upstream of the Jumbo dam that has a capacity of 20,941 megalitres (Ml). The Jumbo dam is along the Murowodzi River. Murowodzi River drains into Mazowe River after Glendale. Annual rainfall at Jumbo is around 850 mm and is characterised by mid-season dry spells. Maximum temperatures average 27°C and evaporation is 1,800 mm per annum (Waterkings 2014).
Drainage within the area is characterised by a system of seasonal streams, flowing east into the perennial Mazowe River and west into the Murowodzi River. The Mazowe and Murowodzi drainage systems are separated by a watershed that has a general north to south trend. To the North, the Murowodzi River cuts at right angles across the general north and south trend of the country and flows eastwards to join the Mazowe River, this easterly trend continuing for over 64 km to Shamva. The Murowodzi, together with its main tributaries the Garumapudzi, Marasauta and Watakai rivers, show a rather striking easterly turn in their lower courses. The Murowodzi River flows through a relatively broad valley, the eastern part of which is studded with irregular hills standing 90 to 120 m above the valley level. On the western side the Mashavi hills separate the Murowodzi from the Garumapudzi drainage. Small tributary streams have cut back into the Mashavi hills and subsequent streams have still further helped to dissect the range, creating several longitudinal valleys (Waterkings 2014).
Project No PS213686
Mazowe Mine
S-K 1300 Technical Report Summary
Bulawayo Mining Company Limited | WSP
January 2025
Page 40 |
To the south of the northern boundary of Riversdale Estate, the Watakai River cuts a fairly well-defined gorge through a low gap in the hills and flows eastwards, with the Marasauta River joining from the south, to the Murowodzi River. Both these streams follow a northerly course before reaching the gorge. The Marasauta River is separated from the Murowodzi by rather low hills, but the hills separating the Watakai and Marasauta rivers attain an altitude of over 1,440 m. West of the Mashavi hills the land slopes rather gradually to the Garumapudzi River, in the valley of which the granite contact lies. In the extreme north-west, a spur projects from the Mashavi hills towards the highest point, Nsorodoni, and the Guramapudzi River makes quite a narrow gorge between them. The river then makes its sharp turn to the east and continues in that direction to the Murowodzi River (Waterkings 2014).
The Mazowe River rises 14 km north of Harare at an altitude of approximately 530 amsl. It flows in a northerly direction until its confluence with the Murodzi River 59 km downstream. Thereafter it flows in a general north-easterly direction until it crosses the border with Mozambique at an altitude of approximately 400 amsl. The river has a catchment area of 20,774 km2 and thus occupies the bulk of the area under consideration (Waterkings 2014).
The geology of Mazowe catchment is primarily crystalline basement rocks that typically have a low primary permeability and low porosity. The groundwater occurrence in the catchment is either structurally controlled or confined to weathered overburden. The average regolith thickness is generally less than 20 m (Waterkings 2014). Groundwater in the regolith is under unconfined conditions and the aquifers are frequently laterally discontinuous and highly heterogeneous. The saprolite that is produced by the chemical weathering of granites can have porosities of between 15-30% and is generally not a suitable aquifer due to low permeabilities (Waterkings 2014).
Fracturing, faulting and weathering control the groundwater occurrence. In general, the amount of fracturing decreases with depth (Waterkings 2014). Potential groundwater development of Mazowe Catchment formations are presented in Table 9.2.
| Table 9-2 | Groundwater development potential of formations occurring in the Mazowe Catchment |
| Lithology | Groundwater Development Potential | Water Table Depth
(m) | Borehole Yield
(m3/day) |
| Gneiss and young intrusive granite on the African surface | Low | < 10 | 50–100 |
| Gneiss and young intrusive granite on post African and Pliocene surface | Low | < 10 | 10–50 |
| Mafic metavolcanics (Greenstone) | Moderate | 10-20 | 10–250 |
| Acid metavolcanics (Greenstone) | Low | < 10 | 10–25 |
| Dolerite dykes and sills | Moderate | < 10 | 25–100 |
Source: Interconsult A/S 1984 (Waterkings 2014).
In the opinion of the QP, the data used to inform the groundwater models is of adequate quality.
In the opinion of the QP, this data is adequate for use in the mine design and mine schedules, and for the purposes used in this TRS.
| | | |
| 9.5 | Processing and recovery methods data verification |
The process plant remains on C&M. Process historical data and performance are provided under Section 10.
In the opinion of the QP, the processing and recovery methods data used to inform product predictions are adequate for the purposes used for this TRS.
Project No PS213686
Mazowe Mine
S-K 1300 Technical Report Summary
Bulawayo Mining Company Limited | WSP
January 2025
Page 41 |
| 10 | Mineral processing and metallurgical testing |
Not applicable since this TRS is an Initial Assessment and no Mineral Reserves have been estimated.
Any future estimation of Mineral Reserves and potential recommencement of operations will require the support of an additional drilling and resource definition campaign and at least a pre-feasibility to feasibility level of evaluation.
Recommencement of the underground ore process operations will require as feasibility study prior to significant refurbishment, upgrade and/or replacement of the existing underground ore processing plant.
Disputed ownership of the sand process facility will need to be resolved prior to recommencement of operations. A feasibility study and significant refurbishment and capital upgrades will also be required to address significant underperformance when previously operated in 2017-2018.
| 10.1 | Nature and extent of mineral processing and metallurgical testing |
The MGM underground ore processing plant, which was commissioned in the 1950s (and following various modifications), comprises a single processing facility with two separate sections, these being an underground ore processing section with design capacity of 132 ktpa and a low-grade dump or sands re-processing facility. Extraction is via crushing and milling, leading to gravity concentration, conventional cyanidation and adsorption, prior to elution, electro-winning and smelting (SRK 2012). Refer to the plant flowsheet provided in Figure 14.1.
The low-grade dump or sands re-processing facility (the subject of a legal ownership dispute) is a flotation plant commissioned in 2017 which has a capacity to process 780 ktpa when the plant is operating optimally, however, this rate has not been realized (Virimai 2018). This process adopts flotation of sulphides which are then directed to cyanide leach. Refer to the plant flowsheet provided in Figure 10.1.
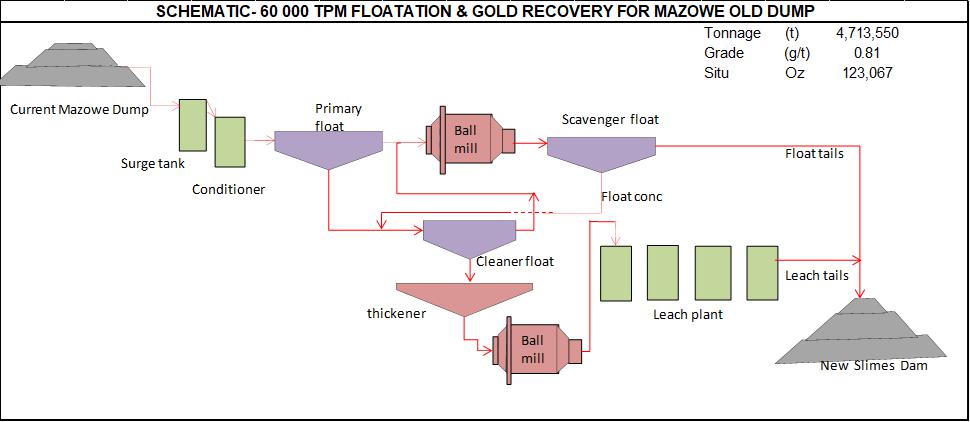
| Figure 10.1 | MGM Sands flotation and CIL plant flowsheet |
Project No PS213686
Mazowe Mine
S-K 1300 Technical Report Summary
Bulawayo Mining Company Limited | WSP
January 2025
Page 42 |
For calendar year 2018 (the MGM was placed on C&M in August 2018), the MGM underground ore processing plant processed approximately 16 kt at a grade of 2.69 g/t Au to produce 706 oz of gold and 545 oz of silver. Gold metallurgical recovery recorded for the period was 100.0% as the result of positive reconciliation due to plant clean up. Historically the underground ore processing plant has averaged 80-85%. The underground ore processing section is old and in poor condition. It will require significant refurbishment prior to any recommencement of operations.
Construction and commissioning of the 780 ktpa gold concentrator and associated facilities was undertaken by Baldmin SA and handed over to MMC in September 2017. In October 2017, Gold Fields of Mazowe contracted Suntech Geomet Laboratories to assist in optimisation of the circuit so as to improve gold recoveries which had dropped to below 50% against a target above 70% (Suntech, 2017). The optimisation program was designed to tackle challenges within the comminution and flotation circuits and identified reasons for poor plant performance due to:
| — | Poor grind of the sands which were sometimes as low as 40% passing 75 μm versus a target of 80% passing 75 μm. |
| — | Poor cyclone efficiencies because of low slurry pressure caused by numerous 90°. |
| — | Inefficient trash removal prior to flotation. |
| — | Poor mechanical agitation. |
| — | Low plant availabilities due to recurring breakdowns and slurry pipe blockages – blockages were a result of poor pipe design as well as misplacement of valves and the pumps. |
| — | Poor slurry rheology creating blockages due to poor discharge pipe design. |
| — | Insufficient flotation stages on secondary rougher cells where only 3 stages are installed but where 4 flotation stages are required. |
The Sands plant poor recoveries of less than 50% at less than half plant design throughput contributed to the decision to place MGM on care on maintenance in August 2018. The plant and associated dump were sold off by the business administrator but are currently the subject of litigation to secure ownership. As a consequence, the Sands plant was not inspected by the QP during the May 2024 site visit, but it is likely that it will require significant refurbishment.
At the time the MGM was placed on C&M, the TSF was near capacity and nearing decommissioning, hence, a new TSF will be required if the MGM is to be taken off C&M and production is resumed (Virimai 2018).
| 10.2 | Metallurgical sampling representativity |
| 10.2.1 | Underground ore testwork |
The QP considers that the historical operation of the underground ore process plant provides a guide to future recovery at the rate of 80-85% that is reasonably representative of ore types processed. This recovery might be improved with construction of a new plant with a finer grind size and modern technology. No recent metallurgical testwork relating to underground ore was available for review.
Testwork was undertaken for the Sands process plant which demonstrated potential recoveries ranging from 81% to 92% at target grind sizes of 80% passing 75 μm.
Project No PS213686
Mazowe Mine
S-K 1300 Technical Report Summary
Bulawayo Mining Company Limited | WSP
January 2025
Page 43 |
Samples for the flotation pilot trials was collected from the dump sites at Mazowe plant and Arcturus mine metallurgical laboratory. These samples were homogenised before sampling for head grade and the rest of the sample was used in the testwork. A total of 21 trials was conducted in different stages:
| — | Concentrate production (laboratory). |
| — | Scouting tests (laboratory). |
| — | Field pilot tests optimisation (at mine). |
Results from the testing are shown in Table 10.1.
| Table 10-1 | Test conditions and results for flotation |
| Item | Unit | Concentrate Production | Scouting | Optimisation Grind |
| Current Arising | Thickener Underflow | New Reagents | 70% | 75% | 80% |
| Date | | 20/09/2013 | 24/09/2013 | 26/09/2013 | 16/09/2013 | 16/09/2013 | 16/09/2013 | 16/09/2013 |
| Milling Time | mins | 41 | 25 | 25 | 41 | 20 | 31 | 41 |
| Condition time | mins | 3 | 3 | 8 | 3 | 3 | 3 | 3 |
| Rougher float 1 | | 8 | 8 | 8 | 8 | 8 | 8 | 8 |
| Rougher float 2 | | 20 | 20 | 20 | 15 | 15 | 15 | 15 |
| Cleaner float | | - | - | - | 25 | - | - | - |
| No. of tests | | 7 | 5 | 3 | 3 | 1 | 1 | 1 |
| Reagents used | | A, B, C* | A, B, C, D | A, B, C | A, B, C, E, F, G, H, I | A, B, C, D | A, B, C, D | A, B, C, D |
| Overall weight | Kg | 56 | 40 | 24 | 96 | 16 | 16 | 16 |
| Ph | | 8.5 | 8.5 | 8.5 | 8.5 | 8.5 | 8.5 | 8.5 |
| Grind < -75µm | % | 80 | 80 | 80 | 80 | 70 | 75 | 80 |
| Head assay | g/t | 0.92 | 0.39 | 2.21 | 1.29 | 1.29 | 1.29 | 1.29 |
| Conc. grade | g/t | 4.38 | 2.06 | 12.32 | 14.70 | 10.81 | 4.07 | 4.50 |
| Residue grade | g/t | 0.19 | 0.09 | 0.17 | 0.10 | 0.55 | 0.15 | 0.13 |
| Conc. Mass pull | % | 16.79 | 15.60 | 14.48 | 2.05 | 10.08 | 18.40 | 19.60 |
| Recovery | % | 82.75 | 81.13 | 92.32 | 92.47 | 68.97 | 86.08 | 89.09 |
Notes: All assays are based on Performance laboratory which is an ISO certified independent laboratory.
* Key: A = SNPX, B = SK 42, C = XP 200, D = FeSO4, E = FLOAT, F = SK 49, G = UNICOL, H = AERO 3418A, I = OREPREP 501, J = OREPREP 515, K = AREO 3302, L = XP 2A, M = CuSO4.
The total of 21 trials conducted have produced excellent results with recoveries as high as 92%. The dump also upgraded well from an average head grade of 1.32 g/t to a concentrate grade of over 10g/t. The grind optimisation process also improved concentrate grades from around 86% at 70% passing -75 µm to nearly 90% at 80% passing -75 µm. Workable mass pulls ranging from 10% to nearly 20% also rendered the results favourable. The new reagents combination which improved overall floatability recovery to between 91-95% was used in the production plant.
| 10.3 | Details of analytical or testing laboratories |
Sample analysis for underground ore mining and processing was completed at the onsite laboratory located at Mazowe (refer to Section 8.2).
The entire testwork programme for Sands re-processing was supervised and coordinated with Suntech Geomet Lab in Johannesburg (South Africa). For laboratory tests, samples collected from the dump were couriered to their laboratory in Johannesburg.
Project No PS213686
Mazowe Mine
S-K 1300 Technical Report Summary
Bulawayo Mining Company Limited | WSP
January 2025
Page 44 |
The QP considers that the old underground ore process plant delivers recoveries that have historically averaged 80–85% as a guide to potential future process recovery. No deleterious elements have been highlighted for underground sourced ore. A finer grind size and circuit operating efficiencies may improve recoveries.
The previous Sands process plant (2017–18) achieved recoveries of less than 50% at only 50% of target throughput. Originally, the process plant targeted 60 thousand tonnes per month (ktpm) at an average 80% recovery over the LOM. The predicted recoveries and throughputs for any restart of Sand processing will need to be reviewed in line with the commissioning report undertaken by Suntech in 2017.
In both cases, a feasibility study followed by significant plant refurbishment and/or replacement will also be necessary.
| 10.5 | QP’s opinion on adequacy of the data collected |
The QP considers that historical operation provides a guide to anticipated recoveries and throughputs; however, the adequacy of projected recoveries and throughput rates will require confirmation prior to any recommencement of process operations, including:
| — | A feasibility study prior to significant refurbishment, upgrade and/or replacement of the existing underground ore processing plant. |
| — | Legal resolution of the disputed ownership of the sand process facility and sands dump. |
| — | Additional metallurgical testwork may be required as part of the feasibility evaluation. |
Project No PS213686
Mazowe Mine
S-K 1300 Technical Report Summary
Bulawayo Mining Company Limited | WSP
January 2025
Page 45 |
| 11 | Mineral Resource estimates |
| 11.1 | Key assumptions, parameters, and methods |
| 11.1.1 | Care and maintenance |
There has been no mining or exploration conducted since the mine was placed on C&M in April 2019. In the interim, the mine has flooded to approximately 50 m below surface. Therefore, in the QP’s opinion the 2018 assumptions regarding definition of the Mineral Resource base remain current.
Data captured in Vulcan™ includes the following (GFM 2018):
| — | Survey data (drives, stopes, raises and pegs). Survey data acquisition is by way of a total station, in the Lo29 grid. |
| — | Orebody outlines digitised from assay plans. |
| — | Assay values, sample lengths, and co-ordinates (channel, drill core and sludge samples). |
| 11.1.3 | Geological interpretation |
Mineralised shear zones at the MGM are clearly distinguishable as zones of quartz-sulphide mineralisation with well-defined, sharp, and discrete contacts. None of these features are present in the country rock (GFM 2018).
| 11.1.3.1 | Geological modelling – Vulcan™ |
Polygons were generated and digitised on screen from level and/or sub-level plans, based on channel and drilling assay information and knowledge of the characteristics of the mineralised shear zones at the time of reporting. The generated polygons were then used to create three-dimensional (3D) shapes (GFM 2018).
A minimum width of 0.87 m for Mazowe (GFM 2018).
Assay data from the geological database was regularised through data compositing in Vulcan™ to provide a consistent sample support. Compositing followed a two-staged approach. Data was initially coded using geological reef interpretation and composited geologically using the interpreted reef zone. The majority of the composited reef samples were less than 0.80 m wide (0.80 m is the historically achievable minimum minable width). The second stage of data compositing involved adjusting the composited samples to at least the minimum minable width (dilution grading 0.0 g/t Au was used in the width adjustments). Data compositing reduced the inherent variability that existed within the population, and also generated sample lengths more appropriate to the scale of the mining method (GFM 2018).
| 11.1.5 | Exploratory data analysis |
To reflect/account for the variation in distribution of assay information, estimates were prepared for each individual reef. Samples within a specific reef were analysed using statistical methods in Microsoft Excel. The major source of data used in the estimates were channel samples. Like many gold deposits, generally, the Mazowe assay data display a near-lognormal distribution with a positive skew, implying that the sample data consists of relatively fewer but significant high-grade assay values. The bulk of samples sit in the medium to lower grade range. COG were determined using statistical methods (GFM 2018).
Project No PS213686
Mazowe Mine
S-K 1300 Technical Report Summary
Bulawayo Mining Company Limited | WSP
January 2025
Page 46 |
| 11.1.5.1 | Univariate statistics |
A summary of the statistical analysis performed on the samples within the economic mineralisation envelope is presented in Table 11.1.
| Table 11-1 | Univariate statistics for samples within the economic mineralisation envelope (GFM 2018) |
| Reef | Mean | Median | SD | Skewness | Min | Max | Count | CV | Threshold |
| 8ConnHW | 28.48 | 13.89 | 49.25 | 6.80 | 0.01 | 579.01 | 261 | 1.73 | 126.99 |
| 4-19L Conn Main | 13.91 | 5.00 | 24.72 | 4.17 | 0.01 | 263.66 | 5,071 | 1.78 | 63.36 |
| 6-3ConnHW3 | 8.81 | 3.90 | 15.06 | 4.03 | 0.03 | 105.63 | 2.94 | 1.71 | 38.92 |
| 4ConnHW1 | 14.48 | 8.03 | 18.29 | 2.45 | 0.20 | 98.80 | 192 | 1.26 | 51.07 |
| 10ConnFW | 9.67 | 4.34 | 14.62 | 3.46 | 0.05 | 96.96 | 145 | 1.51 | 38.91 |
| 4-9LBirthday | 14.28 | 3.65 | 35.19 | 6.01 | 0.01 | 372 | 458 | 2.46 | 84.66 |
| 10-18Birthday13 | 19.68 | 8.05 | 37.50 | 6.30 | 0.01 | 529.20 | 912 | 1.91 | 94.68 |
| 18-30Birthday15 | 19.20 | 7.47 | 40.1 | 7.26 | 0.01 | 651 | 1,416 | 2.09 | 99.41 |
| 18LBirthday15FW | 7.91 | 3.30 | 11.21 | 2.76 | 0.01 | 83.01 | 308 | 1.42 | 30.34 |
| Birthday11 12L_18L | 9.45 | 5.08 | 11.61 | 2.43 | 0.09 | 86.91 | 569 | 1.23 | 32.67 |
| Birthday12 14L-18L | 11.10 | 5.94 | 14.95 | 3.15 | 0.09 | 103.42 | 577 | 1.35 | 41.00 |
| Birthday9-6L-7L | 9.00 | 3.60 | 14.42 | 3.08 | 0.26 | 80.90 | 183 | 1.60 | 37.84 |
| 4-7SOS | 9.66 | 4.51 | 14.97 | 3.66 | 0.01 | 126.97 | 604 | 1.55 | 39.60 |
| 5-14L Nucleus2 | 20.65 | 7.05 | 37.68 | 4.42 | 0.01 | 451.21 | 1,972 | 1.82 | 96.02 |
| 6-13L Nucleus3 | 17.04 | 6.05 | 26.76 | 2.87 | 0.01 | 180.30 | 627 | 1.57 | 70.56 |
| 17L Nucleus2 HW1 | 10.05 | 6.50 | 10.59 | 1.58 | 0.01 | 46.31 | 77 | 1.05 | 31.24 |
| 6-18Nucleus4 | 17.58 | 6.47 | 34.92 | 4.88 | 0.01 | 357.48 | 1,192 | 1.99 | 87.42 |
| Nucleus4 16_18FW1 | 7.47 | 4.30 | 10.13 | 7.07 | 0.50 | 137.47 | 339 | 1.36 | 27.73 |
| Nucleus6 12_23L | 14.26 | 5.15 | 27.57 | 4.84 | 0.01 | 297.19 | 4,647 | 1.93 | 69.41 |
| Nucleus6 14-17FW2 | 16.72 | 6.96 | 24.98 | 2.80 | 0.18 | 155.78 | 493 | 1.49 | 66.67 |
| Nucleus6 14-16FW | 14.47 | 6.40 | 19.93 | 2.70 | 0.19 | 120.00 | 241 | 0.73 | 54.34 |
| Nucleus2 HW | 24.43 | 10.34 | 37.46 | 3.01 | 0.01 | 256.30 | 391 | 1.53 | 99.35 |
| Nucleu2-16L-17L | 6.43 | 3.81 | 6.97 | 1.82 | 0.01 | 37.73 | 140 | 1.08 | 20.37 |
| 4Main Bucks | 15.54 | 5.80 | 18.97 | 1.51 | 0.15 | 79.08 | 70 | 1.22 | 53.49 |
| 5Main Bucks | 28.77 | 8.55 | 37.08 | 1.40 | 0.01 | 168.76 | 146 | 1.29 | 102.93 |
| 4BucksHW | 13.09 | 5.14 | 17.47 | 1.89 | 0.01 | 81.19 | 190 | 1.33 | 48.03 |
| 6L-8L Bucks FW | 1026 | 6.02 | 13.31 | 3.45 | 0.01 | 128.98 | 978 | 1.30 | 36.89 |
| 4-10L Bucks E8 | 22.14 | 7.70 | 41.26 | 5.48 | 0.01 | 612.56 | 1,223 | 1.86 | 104.66 |
| 1-18Old Bucks | 12.27 | 3.80 | 21.05 | 3.60 | 0.01 | 194.69 | 2,986 | 1.72 | 54.37 |
Project No PS213686
Mazowe Mine
S-K 1300 Technical Report Summary
Bulawayo Mining Company Limited | WSP
January 2025
Page 47 |
| Reef | Mean | Median | SD | Skewness | Min | Max | Count | CV | Threshold |
| 4-8L Wimbledon Main | 6.69 | 2.52 | 11.36 | 3.50 | 0.01 | 82.56 | 397 | 1.70 | 29.40 |
| 4_6L Wimbledon FW | 8.52 | 5.11 | 9.25 | 1.88 | 0.01 | 48.74 | 188 | 1.09 | 27.02 |
| 8WimbledonEx-Conn | 5.10 | 2.96 | 6.17 | 2.07 | 0.01 | 26.71 | 54 | 1.21 | 17.44 |
| 3-10L Bojum | 33.01 | 6.48 | 96.39 | 5.72 | 0.01 | 1,009.1 | 1,679 | 2.92 | 225.79 |
| 8Bojum West | 7.12 | 4.92 | 7.36 | 1.83 | 0.01 | 33.06 | 63 | 1.03 | 21.84 |
| 5-6L Bojum HW | 17.43 | 12.82 | 17.04 | 1.59 | 0.09 | 79.97 | 203 | 0.98 | 51.51 |
| Southerly Reef | 13.16 | 6.03 | 20.64 | 3.75 | 0.01 | 168.74 | 190 | 1.57 | 54.44 |
| 7Flowing Bowl HW | 1096 | 4.89 | 16.03 | 2.64 | 0.01 | 93.88 | 362 | 1.46 | 43.02 |
| 4L Commonwealth | 8.68 | 4.80 | 10.96 | 3.51 | 0.01 | 92.65 | 311 | 1.26 | 30.59 |
| Canbrea Reef | 13.36 | 6.89 | 16.65 | 2.5 | 0.01 | 123.78 | 338 | 1.26 | 46.48 |
| 11.1.5.2 | Geostatistical analysis |
Experimental semi-variograms in the three mutually perpendicular directions (strike, dip and plunge) were prepared using individual reef datasets and modelled to derive estimation parameters (BMC Limited).
| 11.1.5.3 | High-grade cutting |
Table 11.2 presents the top-cut thresholds applied to gold grades, which are based on the 95th percentile of the sample population. MMC Zimbabwe established these values by conducting statistical analysis and generating cumulative frequency histograms for all reefs estimated (Golder 2020).
| Table 11-2 | Top-cut grades applied by MMC Zimbabwe |
| Reef | 95% Top-Cut Grade (Au g/t) | Sampling Methodology |
| Nucleus 2 | 400 | Diamond saw sampling |
| Nucleus 3 | 340 | Diamond saw sampling |
| Nucleus 4 | 140 | Chip sampling |
| Nucleus 5 | 65 | Chip sampling |
| Nucleus 6 | 90 | Diamond saw sampling |
| Birthday | 385 | Diamond saw sampling |
| Connaught | 195 | Diamond saw sampling |
| G/Williams | 75 | Diamond saw sampling |
| H/Chief | 35 | Diamond saw sampling |
| Vesuvius | 40 | Diamond saw sampling |
Project No PS213686
Mazowe Mine
S-K 1300 Technical Report Summary
Bulawayo Mining Company Limited | WSP
January 2025
Page 48 |
MMC Zimbabwe determined dry BD by collecting and analysing stope samples. A total of 103 samples were collected and analysed. Samples were analysed in the MGM on-site assay laboratory using Archimedes’ Principle (GFM 2018). Full results are presented in GFM (2018).
The method used was as follows (GFM 2018):
| — | Samples roasted in a drier to remove moisture. |
| — | Samples weighed, and the mass of the sample determined using an electronic balance (scale). |
| — | Samples tied to a thin, strong length of string, and lowered gradually into water in a measuring cylinder until entirely submerged. |
| — | Displaced volume of water calculated by subtracting the initial reading from the final reading. |
| — | BD = Weight of Sample/Volume of Water Displaced by the Sample. |
Mean values returned a BD value of 2.90 grams per cubic centimetre (g/cm3) for Mazowe. These values were utilised for Mineral Resource estimation. Since Q2 2003, BD values have also been determined from diamond drill core reef intersections (GFM 2018).
A total of 40 non-rotated block models were developed. Table 11.3 presents the block dimension schemes for the 30 June 2018 block models.
| Table 11-3 | Block dimension schemes for 30 June 2018 block models (GFM 2018) |
| Reef | Parent block dimensions | Sub-block dimensions |
| X (m) | Y (m) | Z (m) | X (m) | Y (m) | Z (m) |
| 8ConnHW | 4 | 2 | 4 | 2 | 2 | 2 |
| 4-19L Conn Main | 4 | 2 | 4 | 2 | 1 | 2 |
| 6-3ConnHW3 | 4 | 2 | 4 | 2 | 2 | 2 |
| 4ConnHW1 | 4 | 2 | 4 | 2 | 2 | 2 |
| 10ConnFW | 4 | 2 | 4 | 2 | 2 | 2 |
| 4-9LBirthday | 2 | 2 | 2 | 2 | 1 | 1 |
| 10-18Birthday13 | 2 | 2 | 2 | 1 | 1 | 0.5 |
| 18-30Birthday15 | 2 | 2 | 2 | 1 | 1 | 1 |
| 18LBirthday15FW | 4 | 2 | 4 | 1 | 1 | 1 |
| Birthday11 12L_18L | 4 | 2 | 4 | 1 | 1 | 1 |
| Birthday12 14L-18L | 4 | 2 | 4 | 1 | 1 | 1 |
| Birthday9-6L-7L | 2 | 2 | 2 | 1 | 1 | 1 |
| 4-7SOS | 4 | 2 | 4 | 2 | 2 | 2 |
| 5-14L Nucleus2 | 2 | 2 | 2 | 1 | 1 | 0.5 |
| 6-13L Nucleus3 | 4 | 2 | 4 | 1 | 1 | 1 |
Project No PS213686
Mazowe Mine
S-K 1300 Technical Report Summary
Bulawayo Mining Company Limited | WSP
January 2025
Page 49 |
| Reef | Parent block dimensions | Sub-block dimensions |
| X (m) | Y (m) | Z (m) | X (m) | Y (m) | Z (m) |
| 17L Nucleus2 HW1 | 4 | 2 | 4 | 2 | 1 | 2 |
| 6-18Nucleus4 | 2 | 2 | 2 | 1 | 1 | 0.5 |
| Nucleus4 16_18FW1 | 4 | 2 | 4 | 1 | 1 | 1 |
| Nucleus6 12_23L | 4 | 2 | 4 | 2 | 1 | 2 |
| Nucleus6 14-17FW2 | 4 | 2 | 4 | 2 | 1 | 2 |
| Nucleus6 14-16FW | 4 | 2 | 4 | 2 | 1 | 2 |
| Nucleus2 HW | 2 | 2 | 2 | 1 | 1 | 0.5 |
| Nucleu2-16L-17L | 4 | 2 | 4 | 2 | 1 | 2 |
| 4Main Bucks | 4 | 2 | 4 | 1 | 1 | 1 |
| 5Main Bucks | 4 | 2 | 4 | 2 | 2 | 2 |
| 4BucksHW | 4 | 2 | 1 | 2 | 1 | 2 |
| 6L-8L Bucks FW | 4 | 2 | 4 | 1 | 1 | 1 |
| 4-10L Bucks E8 | 4 | 2 | 4 | 1 | 1 | 1 |
| 1-18Old Bucks | 4 | 2 | 4 | 1 | 1 | 1 |
| 4-8L Wimbledon Main | 4 | 2 | 4 | 2 | 2 | 2 |
| 4_6L Wimbledon FW | 2 | 2 | 2 | 1 | 1 | 0.5 |
| 8WimbledonEx-Conn | 4 | 2 | 4 | 2 | 1 | 2 |
| 3-10L Bojum | 2 | 2 | 2 | 1 | 1 | 0.5 |
| 8Bojum West | 2 | 2 | 2 | 1 | 1 | 1 |
| 5-6L Bojum HW | 4 | 2 | 4 | 2 | 1 | 2 |
| Southerly Reef | 4 | 2 | 4 | 1 | 1 | 1 |
| 7Flowing Bowl HW | 2 | 2 | 2 | 1 | 1 | 0.5 |
| 4L Commonwealth | 2 | 2 | 2 | 1 | 1 | 0.5 |
| Carnbrae Reef | 4 | 2 | 4 | 2 | 2 | 2 |
| 8ConnHW | 4 | 2 | 4 | 2 | 2 | 2 |
| 11.1.8 | Grade interpolation parameters |
Ordinary Kriging (OK), using parameters obtained from the modelling of semivariograms was used for grade estimation. Mining blocks, pillars, and remnants tonnages and grades were reported using constraining triangulations (GFM 2018).
Table 11.4 presents a summary of the kriging parameters used for block grade estimation.
Project No PS213686
Mazowe Mine
S-K 1300 Technical Report Summary
Bulawayo Mining Company Limited | WSP
January 2025
Page 50 |
| Table 11-4 | Grade interpolation parameters for 30 June 2018 block models (GFM 2018) |
| Reef | No. of Structures | Type of Structure | Nugget | Sill Differential | Major Radius (m) | Semi-major Radius (m) | Minor Radius (m) | Z’ Rotation (bearing) [º] | Y’ Rotation (plunge) [º] |
| 8ConnHW | 1 | spherical | 11.6 | 22.6 | 14 | 7 | 2 | 271 | 0.8 |
| 4-19L Conn Main | 1 | spherical | 52 | 39.4 | 13 | 10 | 2 | 274 | 1 |
| 6-3ConnHW3 | 1 | spherical | 5.86 | 5.02 | 17 | 14 | 2 | 276 | 1.2 |
| 4ConnHW1 | 2 | spherical | 20.6 | 21.7 | 13 | 15 | 2 | 278 | -0.7 |
| spherical | | 0.122 | 14 | 12 | 2 | 91 | -1.0 |
| 10ConnFW | 1 | spherical | 2.21 | 29.6 | 16 | 8 | 2 | 270 | -2 |
| 4-9LBirthday | 1 | spherical | 4.18 | 3.56 | 17 | 15 | 2 | 267 | 0.3 |
| 10-18Birthday13 | 3 | spherical | 140 | 87 | 25 | 15 | 2 | 267 | -1 |
| | | | 17 | 15 | 2 | 269 | -1 |
| | | | 17 | 15 | 2 | 268 | 0 |
| 18-30Birthday15 | 1 | spherical | 74 | 49.3 | 15 | 12 | 2 | 269 | 0.5 |
| 18LBirthday15FW | 1 | spherical | 46.2 | 83 | 17 | 15 | 2 | 270 | 0.4 |
| Birthday11 12L_18L | 1 | spherical | 42.6 | 30 | 16 | 9 | 2 | 259 | -1.2 |
| Birthday12 14L-18L | 1 | spherical | 124 | 99.6 | 13 | 8 | 2 | 269 | -0.3 |
| Birthday9-6L-7L | 1 | spherical | 2.84 | 39.4 | 17 | 8 | 2 | 271 | 1.5 |
| 4-7SOS | 1 | spherical | 18.7 | 41.8 | 19 | 9 | 2 | 242 | -0.5 |
| 5-14L Nucleus2 | 1 | spherical | 112 | 68.2 | 12 | 11 | 2 | 270 | -0.5 |
| 6-13L Nucleus3 | 2 | spherical | 141 | 170 | 12 | 9 | 2 | 92 | 0 |
| spherical | | 0.1 | 13 | 8 | 2 | 265 | 0 |
| 17L Nucleus2 HW1 | 1 | spherical | 27.8 | 25.7 | 17 | 8 | 2 | 93 | 0 |
| 6-18Nucleus4 | 1 | spherical | 107 | 79 | 17 | 10 | 2 | 96 | 0 |
| Nucleus4 16_18FW1 | 1 | spherical | 10.7 | 16.7 | 15 | 12 | 2 | 280 | -0.1 |
| Nucleus6 12_23L | 2 | spherical | 87.5 | 48.1 | 13 | 15 | 2 | 289 | -1.6 |
| spherical | | 1.1 | 14 | 15 | 2 | 270 | -0.3 |
| Nucleus6 14-17FW2 | 1 | spherical | 108 | 64.6 | 13 | 12 | 2 | 277 | 0 |
| Nucleus6 14-16FW | 1 | spherical | 70.3 | 73.8 | 13 | 11 | 2 | 272 | 0 |
| Nucleus2 HW | 1 | spherical | 250 | 220 | 6 | 10 | 2 | 90 | -1 |
| Nucleu2-16L-17L | 1 | spherical | 8.91 | 4.67 | 16 | 11 | 2 | 100 | -1 |
| 4Main Bucks | 1 | spherical | 22.7 | 46.6 | 17 | 12 | 2 | 270 | -0.3 |
| 5Main Bucks | 1 | spherical | 1.13 | 7.16 | 10 | 10 | 2 | 116 | -2 |
Project No PS213686
Mazowe Mine
S-K 1300 Technical Report Summary
Bulawayo Mining Company Limited | WSP
January 2025
Page 51 |
| Reef | No. of Structures | Type of Structure | Nugget | Sill Differential | Major Radius (m) | Semi-major Radius (m) | Minor Radius (m) | Z’ Rotation (bearing) [º] | Y’ Rotation (plunge) [º] |
| 4BucksHW | 1 | spherical | 8.59 | 29 | 12 | 11 | 2 | 267 | 0 |
| 6L-8L Bucks FW | 1 | spherical | 15.8 | 46.8 | 12 | 9 | 2 | 108 | 1 |
| 4-10L Bucks E8 | 1 | spherical | 29.3 | 126 | 14 | 13 | 2 | 90 | 0.5 |
| 1-18Old Bucks | 1 | spherical | 30.4 | 17.8 | 17 | 14 | 2 | 276 | 0 |
| 4-8L Wimbledon Main | 1 | spherical | 6.87 | 6.23 | 9 | 7 | 2 | 335 | 0.4 |
| 4_6L Wimbledon FW | 2 | spherical | 17.9 | 47.9 | 15 | 30 | 2 | 180 | 0.5 |
| spherical | | 0.3 | 15 | 25 | 2 | 189 | 0.5 |
| 8WimbledonEx-Conn | 1 | spherical | 2.16 | 21.4 | 15 | 11 | 2 | 307 | -3 |
| 3-10L Bojum | 1 | spherical | 117 | 98.6 | 12 | 15 | 2 | 279 | -0.9 |
| 8Bojum West | 1 | spherical | 6.03 | 8.27 | 13 | 10 | 2 | 267 | -0.7 |
| 5-6L Bojum HW | 1 | spherical | 79.4 | 84.8 | 10 | 9 | 2 | 90 | -1.4 |
| Southerly Reef | 1 | spherical | 2.83 | 118 | 20 | 18 | 2 | 73 | 1.5 |
| 7Flowing Bowl HW | 1 | spherical | 15.9 | 11.8 | 15 | 19 | 2 | 278 | -1.5 |
| 4L Commonwealth | 1 | spherical | 19.8 | 19.3 | 12 | 11 | 2 | 112 | -1.2 |
| Canbrea Reef | 1 | spherical | 24 | 96.8 | 9 | 8 | 2 | 260 | -1.1 |
Mineral Resource estimation at the MGM is a combination of manual, and computer based digital estimation (conducted in Vulcan™). Mazowe has successfully been transitioned to computer-based estimation, with only a small number of Inferred Mineral Resources blocks still outstanding. MMC Zimbabwe aimed to ensure full computer-based estimation of the Mineral Resource and Mineral Reserve prior to 30 June 2018.
| 11.1.9.1 | Manual estimation |
Manual estimation of a mining block included development and stope channel samples. The cross-sectional area of a block is measured in vertical projection using a planimeter. Dip long sections are used so there is no need for a dip factor. Individual sample assays are cut to the 95th percentile (defined from historical levels generated for individual reefs, and not currently updated with new data). Channel samples are composited, and a minimum of 20 cm of zero grade dilution is added to bring channel widths up to a minimum mining width of 1.07 m. The grade and thickness of the block is derived using length weighted averaging.
A density of 2.9 tonnes per cubic metre (t/m3) has been used (calculated from rolling sample averages produced using Archimedes’ Principle). No significant difference in densities between granodiorite and porphyry hosted mineralisation has been encountered.
Project No PS213686
Mazowe Mine
S-K 1300 Technical Report Summary
Bulawayo Mining Company Limited | WSP
January 2025
Page 52 |
| 11.1.10.1 | Visual comparisons conducted by MMC Zimbabwe |
A visual comparison between estimated block grades, and original drill hole assay data was conducted in Vulcan™. In addition, sections were cut along and across strike to check the block model fit and general continuity of the estimates within the pre-defined constraining envelopes (the orebody wireframes) [GFM 2018].
| 11.1.10.2 | Visual comparisons conducted by WSP |
No figures of the visual comparisons were presented in GFM 2018. WSP conducted visual comparisons in Vulcan. A section, looking east, comparing the Nucleus 3 block model grades and the drill hole assay results is presented in Figure 11.1.
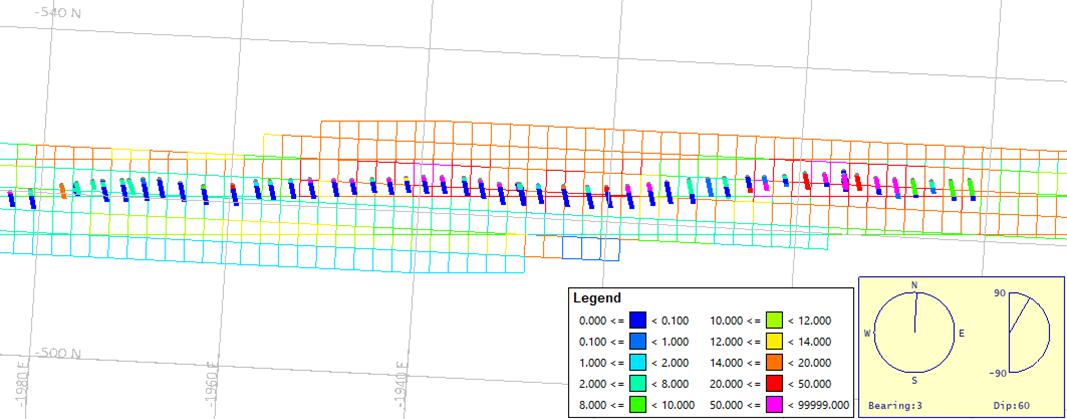
| Figure 11.1 | Nucleus 3 block grade and drill hole comparison |
| 11.2 | Mineral Resources classification |
Mineral Resource classification for Measured, Indicated and Inferred Mineral Resources is conducted as presented in Sections 11.2.1, to 11.2.3.
| 11.2.1 | Measured Mineral Resources |
Measured Mineral Resources are defined where (GFM 2018):
| — | Ore blocks are fully exposed on at least three adequately sampled sides in adjoining drives, raises, winzes or stopes, with a separation not exceeding 30 m and one or two levels/sub-levels are developed at intervals not exceeding 25 m centres. |
| — | Channel sampling in development ends is at no more than 2 m centres. |
| — | Returning assay values are above the lower Mineral Resource COG of 0.80 g/t Au. This COG is based on 80% of the MMC Zimbabwe cost structure of US$550/oz, a tails grade of 0.25 g/t Au, and a Mine Call Factor (MCF) of 100%. |
| — | Mining dilution is included, i.e., the minimum mining width is 0.87 m. |
Project No PS213686
Mazowe Mine
S-K 1300 Technical Report Summary
Bulawayo Mining Company Limited | WSP
January 2025
Page 53 |
| 11.2.2 | Indicated Mineral Resources |
Indicated Mineral Resources are defined where any combination of the following applies (GFM 2018):
| — | Ore blocks are fully exposed on two adequately sampled sides in adjoining drives, raises winzes or stopes, with a separation not exceeding 30 m and one or two levels/sub-levels are developed at intervals not exceeding 25 m centres. |
| — | Ore blocks are fully exposed and sampled on one level and fall within the geological boundaries of an ore shoot confirmed by one or more drill holes. |
| — | Diamond or RC drilling completed at a regular and consistent spacing, intersects mineralisation indicating geological continuity along strike and up-dip, and where a mining model has been applied: |
| — | For Mazowe, such continuity is defined by diamond or RC drilling at a maximum spacing of 30 m along strike, and 25 m up and down-dip. |
| — | Such continuity is defined by diamond or RC drilling at a maximum spacing of 30 m along strike and 25 m up and down-dip. |
| — | Channel sampling in development ends are at no more than 2 m centres. |
| — | Returning assay values are above a lower Mineral Resource COG, calculated without considering Mine Call Factor (MCF). |
| — | Mining dilution is included i.e., the minimum mining width is 0.87 m. |
| 11.2.3 | Inferred Mineral Resources |
Inferred Mineral Resources are defined where (GFM 2018):
| — | Exposure of the mineralised zone on a single level is extrapolated up or down-dip, to a maximum of four levels. |
| — | Extensions of blocks beyond Measured/Indicated Mineral Resources and Proved/Probable Reserves categories. |
| — | Where there is a mineralised zone beyond the boundaries of Measured/Indicated Mineral Resources, Inferred Mineral Resources are defined as exposure of a mineralised zone extrapolated up or down-dip to a maximum of 50% of the exposed strike extent. |
| — | Extensions of blocks beyond Measured/Indicated Mineral Resources along strike to the limits of the advanced exposure. |
| 11.3 | Cut-off grade, price, and justification |
GFM (2018) states that a lower Mineral Resources COG of 0.80 g/t Au was applied to the 2018 Mineral Resources.
A new COG for 2023 was calculated based on the 3-year trailing average gold price at December 2023 (with a gold price multiplier of 30%), applicable mill recovery, and revised operating and sustaining capital costs. Applied COGs are based on a marginal cost analysis assuming direct unit operating costs (C1) only.
Table 11.5 presents the parameters applied for definition of the 31 December 2023 Mineral Resource on an in-situ basis.
| Table 11.5 | 31 December 2023 Mineral Resource COG parameters |
| Parameter | Mineral Resources (ROM) | Comment |
| Au COG (g/t) | 2.58 | Estimated based on Au Price +30% (US$2,340/oz Au), applicable mill recovery, operating and sustaining capital costs. |
| Plant Residual Value (g/t Au) | 0.46 | Fixed tails grade basis, equating to a 94% process recovery considering an average grade of 7.77 g/t for the MI MR. A lower recovery of 88% is assumed for cashflow modelling based on recent historical production 2021-23 at lower grade plant throughput. |
| Direct Operating Cost (C1) [US$/t] | 87.81 | 2023 value terms. |
| Indirect Operating Cost (US$/t) | 7.45 | Long term average at December 2023. |
| Sustaining Capital Cost (US$/t) | 9.92 | Long term average at December 2023. |
| Exchange Rate | N/A | |
| Tonnage for Pay Limit (t) | 45,000 | Estimated throughput for fixed and variable cost components. |
| SG (t/m3) | 2.90 | Average estimation to two decimals recommended. |
| Assay Plan Factor (APF) [%] | 63.94 | 3-year trailing monthly average. |
| Block Factor (BF) [%] | 98.16 | 3-year trailing monthly average. |
| Au Price (USD/oz) | 1,800 | Pricing based on the 3-year trailing average Au price. |
| Au Price +30% (USD/oz) | 2,340 | 30% uplift on the 3-year trailing average Au price. |
Notes: Applied COGs are based on a marginal cost analysis assuming direct operating costs only.
Project No PS213686
Mazowe Mine
S-K 1300 Technical Report Summary
Bulawayo Mining Company Limited | WSP
January 2025
Page 54 |
11.3.1 Tonnage-grade factors
The Mineral Resource conversion parameters presented in Section 11.3 are explained as follows:
11.3.1.1 Assay plan factor
The APF was derived from 3 years of historical data and refers to gold content and is defined as the relationship between gold accounted for versus gold called for by the mine and accounted for. The factor is used in the modification of Mineral Resource block grades to Mineral Reserve (GFM 2018).
The APF is calculated as follows (GFM 2018):
APF = Au Content Accounted (Recovery + Residue) x 100% / Au Content Called for Based on Sampling
11.3.1.2 Block factor
The BF was derived from 3 years of historical data. It is defined as the ratio, expressed as a percentage, of the Au content of the ore broken from a Mineral Reserve block as indicated by sampling results versus the estimated Mineral Reserve block Au content. The BLF is not used in the modification of Mineral Resource blocks to Mineral Reserve blocks (GFM 2018).
The BF is calculated as follows (GFM 2018):
BF = Au Content Based on Sampling x 100% / Estimated Block Au Content
11.3.1.3 Block call factor
A Block Call Factor (BCF) was calculated from the APF and BF. This factor refers to gold content and not grade and is defined as the total specific mineral content of the ore broken from a Mineral Reserve block as indicated by the current sampling results adjusted by the APF versus the estimated Mineral Reserve block content (gold content called for). This factor was applied to the grade only.
BCF = BF x APF x 100% (by block)
11.3.1.4 Mine Call Factor
A Mine Call Factor (MCF) for Mazowe of 62.97% was calculated as an average for all mining blocks based on 3 year trailing monthly average data excluding +10% outliers and non-production months, whereby:
MCF = BF x APF x 100% (all blocks)
11.3.2 Cut-off Grade
The COG is calculated using the following formula:

Project No PS213686
Mazowe Mine
S-K 1300 Technical Report Summary
Bulawayo Mining Company Limited | WSP
January 2025
Page 55 |
| 11.4 | Mineral Resources statement |
The basis of the Property’s Mineral Resources estimate and how it is generated are summarised below. The Mineral Resources estimate for the Property is reported herein in accordance with the requirements detailed in S-K 1300. For estimating the Mineral Resources, the following definition of Mineral Resource as set forth in S-K 1300 is applied:
“Mineral resource is a concentration or occurrence of material of economic interest in or on the Earth’s crust in such form, grade or quality, and quantity that there are reasonable prospects for economic extraction. A mineral resource is a reasonable estimate of mineralisation, taking into account relevant factors such as cut-off grade, likely mining dimensions, location or continuity, that, with the assumed and justifiable technical and economic conditions, is likely to, in whole or in part, become economically extractable. It is not merely an inventory of all mineralisation drilled or sampled.”
The Mineral Resources estimate has been defined, classified and reported according to the guiding principles and minimum standards set out in SAMREC (2016). WSP’s view is that there are no material differences between SAMREC (206), and S-K 1300 requirements for the reporting of Mineral Resources.
For the purposes of demonstrating capacity to exploit the Mineral Resource base as required under S-K 1300, the QPs have reviewed a high-level cashflow model provided by MMC Zimbabwe and are satisfied that the scale of the Mineral Resource and free cashflow after operating costs are sufficient to cover the cost of re-establishing access to the underground mine workings, dewatering the underground mine workings, surface infrastructure, and plant refurbishment/replacement.
A new COG for 2023 was calculated, as detailed in Section 11.3. WSP was informed by MMC Zimbabwe that the B.S.V. Mineral Resource is no longer included in the greater MGM Mineral Resource, hence; it was excluded.
The Mineral Resources estimate (exclusive of Mineral Reserves) for the Property in presented in Table 11.6 and Table 11.7.
The effective date of the Mineral Resources estimates is 31 December 2023.
Mineral Resources are reported on an in-situ basis.
The Mineral Resource comprises:
| — | 1.17 Mt at 7.77 g/t Au, for approximately 291 koz of gold (underground Measured and Indicated Mineral Resources). |
| — | 3.29 Mt at 8.65 g/t Au, for approximately 815 koz of gold (underground Inferred Mineral Resources). |
Table 11.6 presents the underground Measured and Indicated Mineral Resources (exclusive of Mineral Reserves) reported as at 31 December 2023.
| Table 11-6 | MGM underground Measured and Indicated Mineral Resources estimate as at 31 December 2023 |
| Category | Tonnage (Mt) | Au grade (g/t) | Au metal (koz) |
| Measured Resources | 0.26 | 9.01 | 75 |
| Indicated Resources | 0.91 | 7.42 | 217 |
| Grand Total | 1.17 | 7.77 | 291 |
Notes: Mt = Million tonnes; Au Grade g/t = gold grams per tonne; koz = thousand ounces.
Table 11.7 presents the underground Inferred Mineral Resources (exclusive of Mineral Reserves) reported as at 31 December 2023.
| Table 11-7 | MGM underground Inferred Mineral Resources estimate as at 31 December 2023 |
| Category | Tonnage (Mt) | Au grade (g/t) | Au metal (koz) |
| Inferred Resources | 3.29 | 8.65 | 815 |
| Grand Total | 3.29 | 8.65 | 815 |
Notes: Mt = Million tonnes; Au Grade g/t = gold grams per tonne; koz = thousand ounces.
It should be noted that the Mineral Resources estimate for the Property is reported exclusive of Mineral Reserves. The Property does not have a current Mineral Reserve.
It should be noted that the sands (tailings) Mineral Resources estimate for the Property is not included as part of the Mineral Resources for the Property, as the ownership of the sands (tailings) material itself, and the accompanying sands (tailings) processing facility is currently under dispute, with legal proceedings ongoing.
The Mineral Resources presented in this Section are not Mineral Reserves, and do not reflect demonstrated economic viability. The reported Inferred Mineral Resources are considered too speculative geologically to have the economic considerations applied to them that would enable them to be categorised as Mineral Reserves. There is no certainty that all or any part of this Mineral Resource will be converted into Mineral Reserve.
Project No PS213686
Mazowe Mine
S-K 1300 Technical Report Summary
Bulawayo Mining Company Limited | WSP
January 2025
Page 56 |
All figures are rounded to reflect the relative accuracy of the estimates and totals may not add correctly.
Based on the geological results presented in this TRS, supported by the assumptions made by MMC Zimbabwe (presented in Section 11.3), it is the QP’s opinion that the Mineral Resources have RPEE.
Further exploration and technical studies are required to confirm the economic feasibility of the Property, and to allow the estimation and reporting of a Mineral Reserve (Section 5.6).
| | | |
| 11.5 | Uncertainty in the estimates of Inferred, Indicated, and Measured Mineral Resources |
The QP is satisfied that the stated Mineral Resources classification reflects the appropriate level of confidence and considers those factors relevant to the deposit. The application of resource categories appropriately considers the relevant factors used in the classification process.
Some examples of specific factors that can influence the risk and uncertainty of the Mineral Resources estimates that are considered in the resource classification include:
| — | Interpretation of the mineralisation boundary. |
| — | Drill hole spacing and adequacy in defining geology, mineralisation, structure, and grade. |
| — | Quality of samples, assays, and geological information. |
| — | A COG for the Amatola surface resources will be required. |
| — | Pay limits are average block cut-off gold grades used to filter stoping blocks as either economic, or sub-economic. |
| — | The COG applied to the 2018 MRMR for the MGM is 4.82 g/t Au. The basis for these estimates is not adequately explained but is understood to generally correspond with the “upper” COG to achieve breakeven, inclusive of the cost of all mine development, stoping, process, and administration costs. WSP notes that these pay limits (COG) are considerably higher than the average stope production grade of 3.69 g/t Au over the past nine years of operation, and recommends they be reviewed. |
| — | The Mineral Resources estimates have been estimated to two decimal places for gold grade, and to the nearest tonne for tonnage, but have been reported to one decimal place for gold grade, to the neatest ounce for metal content, and to the nearest thousand tonnes for tonnage when reported in summary tables in the MRMR technical report (GFM 2018). |
| — | The Mineral Resource estimation has only been subjected to visual validation by MMC Zimbabwe staff. Standard industry practice is to conduct both visual, and statistical validation. |
The Mineral Resources have addressed RPEE, and have considered mining, metallurgical, and environmental factors.
Mineral Resources confidence is also assessed via independent reviews and internal peer reviews conducted at key stages of the Mineral Resources estimation process.
The Mineral Resources presented are not Mineral Reserves, and do not reflect demonstrated economic viability. The level of geological uncertainty associated with the reported Inferred Mineral Resources is considered too speculative to apply relevant economic, and technical factors to have the economic considerations applied that would enable these to be categorised as Mineral Reserves. There is no certainty that all or any part of the Inferred Mineral Resources will be converted into Mineral Reserves. All figures are rounded to reflect the relative accuracy of the estimates and totals may not sum exactly as a consequence.
Project No PS213686
Mazowe Mine
S-K 1300 Technical Report Summary
Bulawayo Mining Company Limited | WSP
January 2025
Page 57 |
| 11.6 | QP’s opinion on factors likely to influence the prospect of economic extraction |
The main factors likely to influence the prospect of economic extraction include:
| — | Interpretations of fault geometries. |
| — | Geotechnical conditions. |
| — | Dilution considerations. |
The estimate of Mineral Resources may be materially affected by environmental, permitting, legal, title, socio-political, marketing, or other relevant issues including risks set forth in this TRS.
In the QP’s opinion, all of these factors are adequately considered for the Mineral Resources reported. Based on the body of technical studies completed across the Property, it is the QP’s opinion that the Mineral Resources have RPEE.
In the QP’s opinion, all issues relating to all relevant technical and economic factors likely to influence the prospects for economic extraction, can be resolved with the recommendations for further work outlined in Section 23.1.
| 12 | Mineral Reserves estimates |
Not applicable since this TRS is an Initial Assessment and no Mineral Reserves have been estimated.
Any future estimation of Mineral Reserves and potential recommencement of operations will require the support of an additional drilling and resource definition campaign and at least a pre-feasibility to feasibility level of evaluation.
Project No PS213686
Mazowe Mine
S-K 1300 Technical Report Summary
Bulawayo Mining Company Limited | WSP
January 2025
Page 58 |
This section is included to inform an Initial Assessment for the estimation of Mineral Resources.
No current Mineral Reserve estimates exist for the Mazowe mine, only historical estimates dating to June 2018 since the mine has been mothballed on care and maintenance since 2018. WSP consider that in order to comply with S-K 1300 requirements, at least a Pre-Feasibility Study (PFS) level study will be required to estimate current Mineral Reserves.
The mining inventories at the MMC Zimbabwe include material from the Mazowe underground mine, and a sand tailings retreatment project. Operations were suspended in August 2018 due to poor performance and economic conditions. Mazowe experienced low stope grade reconciliation, while the sand tailings processing plant did not meet throughput or gold recovery targets.
Mazowe underground mining operation has historically used traditional narrow vein mining methods with labour-intensive handheld techniques, rail transport, and shaft hoisting. The mine is pneumatic powered with rail haulage via lead acid battery powered locomotives hauling rail cars to a shaft where it is hoisted to surface. Mining is conducted using conventional drilling and blasting techniques using handheld jackhammer machines. Minimal support is used, and explosives are manually initiated. Scrapers and hand lashing are used to move muck into passes and chutes, with fines swept and bagged for transport to the plant.
The mine comprises an aggregation of multiple historical small scale mines targeting predominantly narrow vein reefs (19) that dip at 10° to 58° to the north, utilizing the random room and pillar mining method. There are two main sections Mazowe and Jumbo East, separated by a central fault zone striking approximately 045°. Mineralisation widths average 1.0m while average plan stope widths average 1.2 m and vary between 0.9 and 1.9 m over an extensive 2.75 km of strike, with gold mineralization occurring in sheared granodiorite stock or feldspar porphyry. The minimum stope width is set at 0.9 m while achieved stope widths likely vary between 1.5 and 1.8 m. Some north-south striking steeply dipping orebodies occur on the periphery with larger widths of 15–28 m that may be amenable to larger scale long hole benching methods.
Operations were halted in August 2018, and efforts to resume are underway. Due to this pause, flooding of the mine to approximately 50 m below surface meant that underground workings could not be inspected during the site visit, but details were obtained from inspection of surface facilities, technical studies, plans, and discussions with mine personnel.
| | | |
| 13.2 | Parameters relevant to the design and schedule |
MMC Zimbabwe have very competent ground consist of competent granodiorite with the reef horizon composed of sheared granodiorite which contains the mineralization of pyrite, pyrrhotite and gold with associated silification. This is manifested underground random room and pillar stopes which have been mined for hundreds of metres along strike and up-dip with very little support in the form of in-situ pillars. Exceptions occur where shear zones merge or splays/offshoots take off into the hanging-wall or footwall, or where shear zones occur within proximity. A poor choice of stope width in such a case leads to slabbing of the hanging-wall or footwall contacts of the shear zones. Routine monitoring of ground conditions in operating stopes is carried out by both the mining and geology staff.
Support protocols on the mine employ the use of pillars, matt packs, and cluster props to support areas of weak ground. A second access in between solid pillars to be used as main access is also recommended. Timber props are used where ground conditions are poor in the open stopes. The density of the pillars, matt packs and props is increased whenever ground conditions become unstable and for depths of 500–750 m below surface.
Project No PS213686
Mazowe Mine
S-K 1300 Technical Report Summary
Bulawayo Mining Company Limited | WSP
January 2025
Page 59 |
Historical geotechnical assessments have included:
| — | SRK, 2015, Mazowe Mine, Multi-reef Intersection Mining Presentation – a site visit inspection and recommendations for pillar design and support. |
| — | Kersten R.W.O., April 2014, Mazowe Mine: Rock Mechanics Review – a South African consultant report that reviewed the mining method and provided recommendations. |
The MGM is currently flooded up to the 3 Level approximately 50 m below surface from the 14 Level when operations and mine dewatering were ceased in 2018.
Approximately 33% of the current Mineral Resource base is located below the 14 Level, hence dewatering of the mine is critical to any future ramp-up plans (Virimai 2018).
Dewatering of Mazowe is proposed to be conducted in two stages as follows (BMC Limited Operations Reports):
| — | Stage 1 – Dewatering conducted from the 14 Level to the 22 Level by way of stage pumping using multi-stage KSB pumps. |
| — | Stage 2 – Dewatering conducted from the 22 Level to the 30 Level, by way of stage pumping using multi-stage KSB pumps. |
The total volume of water required to be pumped is 400 Ml. The discharge rates of the KSB pumps used at the MGM are 100 cubic metres per hour (m3/hr) [BMC Limited Operations Reports].
It is estimated that dewatering from the 14 Level to the 22 Level will take approximately three months (Stage 1) and dewatering from the 22 Level to the 30 Level will also take approximately three months (Stage 2) [BMC Limited Operations Reports].
Since no dewatering of the mine is currently undertaken, with water levels 50 m below surface, the dewatering requirements to regain access down to the 22 Level will need to be re-estimated, but it is likely that this will require at least 12 months.
| | | |
| 13.3 | Production parameters |
Production rates for the purpose of an initial assessment have been drawn from a history of previous operation and the QP’s assessment of what is technically achievable. A ramp-up study has been undertaken by Virimai (2018) and estimated an optimal underground mining production rate at 44 ktpm over a mine life of 7.5 years by applying Taylor’s formula.
Using the production rate mentioned above, the initial assessment has considered a potential mine life of 5 years or more.
MMC Zimbabwe applies a standard minimum stope width of 0.87 m at MGM for the purpose of defining stope envelopes for estimating the Mineral Reserve. This is asserted to be based on recent historical experience and decided in consultation with the mining department at MGM. Given recent stope reconciliation discrepancies, WSP recommends a detailed review of actual stope widths estimated from survey and stope reconciliation. It is likely that achieved stope widths are higher than plan leading to increased dilution and lower grades.
Project No PS213686
Mazowe Mine
S-K 1300 Technical Report Summary
Bulawayo Mining Company Limited | WSP
January 2025
Page 60 |
| 13.3.4 | Mining dilution and recovery factors |
A width of 20 cm (at 0 g/t) is applied to the composite value of the channel as dilution, over and above the minimum stoping width which is 87 cm for Mazowe and Bernheim.
| e.g., |  |
This 20 cm dilution represents over break and or slabbing dilution during stoping.
In instances where the width of the shear zone is above the required minimum stoping width, an extra 20 cm (at 0 g/t) is added as dilution to the measured width.
| e.g., |  |
This dilution is calculated for each individual sample channel (section) where applicable.
| | | |
| 13.4 | Mining fleet, machinery, and personnel requirements |
Historical 2018 monthly production targeted 9,000 t of ore and 1,040 t of waste from development. Ten jackhammers are used for stoping, aiming for 300 t per day. The underground section has 389 workers across two shifts, each lasting eight hours. Two Mine Captains and four Overseer Miners manage production and development.
Prior to closure in 2018, BMC Limited was planning a project development and ramp-up for MGM. The plan, based on a financial model from August 2018, included sand mining and retreatment at 60 ktpm in 2019 and underground operations at 65 ktpm starting January 2022. Production forecasts for Mazowe were outlined, with surface mining planned for 2021. The plan extended to 2032; however, WSP views it as preliminary and calls for detailed feasibility evaluation to ensure historical outcomes and future plans align. Tonnage, gold grade, and recovery estimates appear optimistic based on historical performance. Further details on the conceptual planning for restart and ramp-up were provided.
This TRS is an initial assessment for the purpose of estimating Mineral Resources for which mining schedules supported by at least a pre-feasibility or feasibility study have not been prepared.
Project No PS213686
Mazowe Mine
S-K 1300 Technical Report Summary
Bulawayo Mining Company Limited | WSP
January 2025
Page 61 |
| 13.7 | Mining unit dimensions |
MMC Zimbabwe have produced a range of 40 separate resource models with parent block sizes ranging from 4 mE x 2 mN x 4 mRL down to 2 mE x 2 mN x 2 mRL and sub-blocked down to 1 mE x 1 mN x 0.5 mRL, representing sufficient spatial resolution for grade interpolation and estimation of resource and mining inventories. This is regarded as reasonable for reserve estimation provided a partial percentage of block volume approach is adopted for reporting within defined stope wireframes.
For resources and reserves that are still estimated by manual techniques to estimate resource mineralisation and stope block reserves by multiplying average respective widths by plan area to determine volumes and by diluting mineralised widths at zero grade as a function of the increase mining widths. These methods are also appropriate.
A minimum stope width of 0.87 m has been applied for narrow vein stoping while dilution of larger open stopes has been estimated by expanding mineralisation wireframes by 0.2 m. This has resulted in planned stope widths ranging from 0.9 m to 1.9 m for the narrow vein shallow to moderately dipping reefs (10° to 58° dip north) and average 1.2 m.
The mining dimensions are consistent with the mining methods proposed; however, the QP’s experience is that plan average widths of 1.2 m will be difficult to sustain for shallow dipping reef systems and could range upwards of 1.5 m leading to increased dilution and reduction in grades by a further 25%. Active management is required to sustain narrow mining widths within design parameters.
The orebody at the MGM is accessed by a number of shafts, which are a combination of inclined and vertical shafts sunk to various depths. The three most important and active shafts are the Connaught, Ogilvy and Nucleus shafts (Virimai 2018). An isometric plan showing the main shafts and primary underground access level development is provided in Figure 13.1 while a long projection looking west showing the Measured and Indicated blocks, mined out blocks and shafts is provided in Figure 13.2. A list of the main shafts (9 in total) is provided in Table 13-1 together with dimensions, depths and inclination.
The mine currently has access to the 3 Level on the Connaught underlay shaft and has just commenced pumping water from the Ogilvy vertical shaft for use in a small CIP plant adjacent the Ogilvy shaft. The small CIP plant is rated at 10 tonnes per hour (tph) and will be used to retreat tailings.
Project No PS213686
Mazowe Mine
S-K 1300 Technical Report Summary
Bulawayo Mining Company Limited | WSP
January 2025
Page 62 |
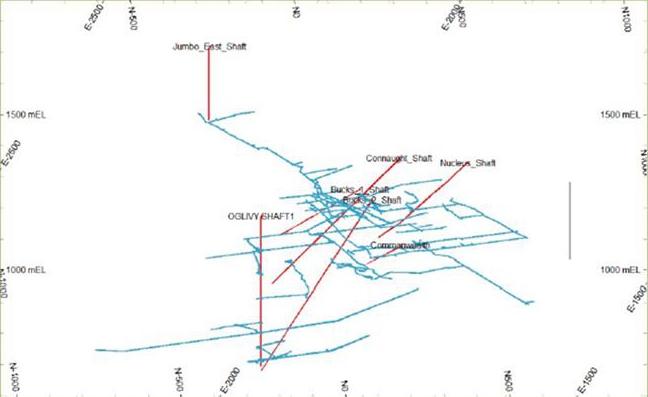
| Figure 13.1 | MGM underground mine access shafts and general mine layout (Virimai 2018) |
Operations are planned to recommence at Connaught Shaft but limited to levels above the Level 3 due to flooding. Future mining plans will require dewatering of lower levels.
Project No PS213686
Mazowe Mine
S-K 1300 Technical Report Summary
Bulawayo Mining Company Limited | WSP
January 2025
Page 63 |
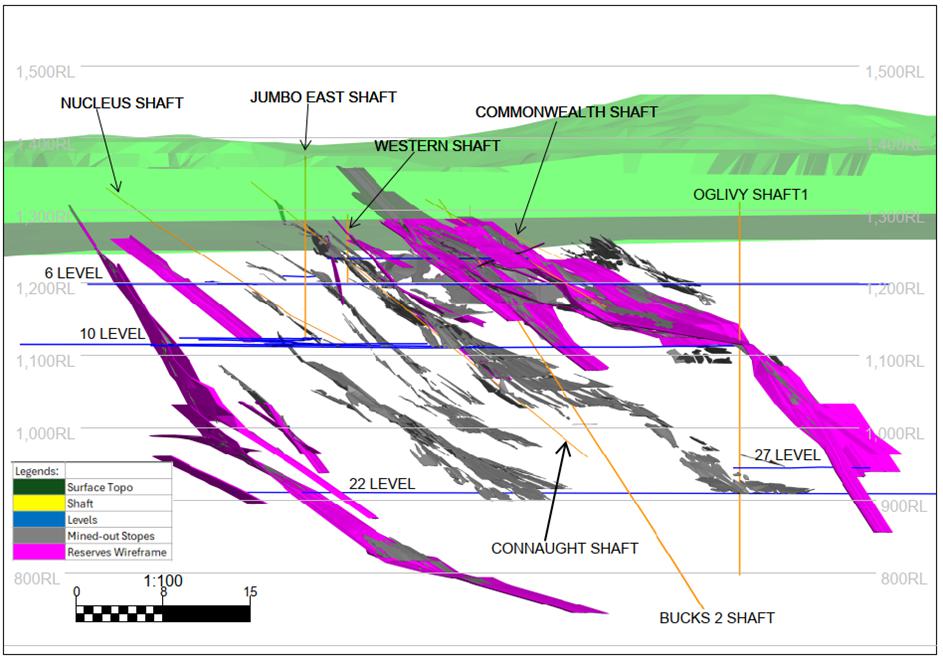
| Figure 13.2 | MGM layout – projection looking east |
| Table 13-1 | MGM shaft list – dimensions, depths and inclination |
| SHAFT NAME | SIZE (m) | INCLINED DISTANCE (m) | DEPTH (m) | REMARKS |
| OGILVY | 5.0 | x | 1.8 | Vertical | 524 | Surface down to 29 LEVEL-VERTICAL |
| CONNAUGHT | 1.5 | x | 2.7 | 594 | 373 | Surface down to 18 LEVEL @ -39ᴼ |
| JUMBO EAST | 1.5 | x | 1.6 | Vertical | 180 | Surface down to 10 LEVEL VERTICAL |
| BATEMAN | 1.4 | x | 1.9 | 161 | 90 | Surface down to 5 LEVEL @ -34ᴼ |
| S.O.S | 1.8 | x | 1.3 | 190 | 79 | Surface down to 6 LEVEL @ -25ᴼ |
| NUCLEUS | 2.0 | x | 1.5 | 398 | 217 | Surface down to 10 LEVEL @ -33ᴼ |
| WESTERN | 1.9 | x | 3.2 | Vertical | 100 | Surface down to 6 LEVEL- VERTICAL |
| COMMONWEALTH | 1.5 | x | 1.6 | 190 | 104 | Surface down to 6 LEVEL -INCLINE |
| VENTILATION | 1.5 | x | 1.6 | Vertical | 109 | Surface down to 6 LEVEL -VERTICAL |
Project No PS213686
Mazowe Mine
S-K 1300 Technical Report Summary
Bulawayo Mining Company Limited | WSP
January 2025
Page 64 |
| 14 | Processing and recovery methods |
| 14.1 | Processing methodologies and flowsheets |
This section is included to inform an Initial Assessment for the estimation of Mineral Resources.
The processing plant at the Property as shown in Figure 14.1, commissioned in the 1950s with subsequent modifications, consists of two sections:
| — | An underground ore process plant located on surface with a design capacity of 132 ktpa. |
| — | A low-grade dump or sands re-processing facility. |
Both circuits involve crushing, milling, gravity concentration, cyanidation, adsorption, elution, electro-winning, and smelting. The low-grade dump or sands re-processing facility is a floatation plant with a nominal capacity of 780 ktpa, although this rate has not yet been achieved. In 2018, the processing plant processed approximately 16 kt of ore, producing 706 oz of gold and 545 oz of silver at a recovery rate of 100.0%. The Tailings Storage Facility (TSF) was nearing capacity at the time of the Property’s placement on care and maintenance, necessitating the construction of a new TSF for potential resumption of production.
Site inspection of the underground ore process plant indicates that it is in a poor condition and will require re-evaluation of the merits of upgrade or replacement prior to restart. The sands re-processing plant and tailings ownership currently resides with another party following auction and disposal by the receiver, now the subject of legal dispute in progress. Consequently, it was not possible to inspect this plant.
Some small-scale processing of artisanal miner ore is still conducted at Mazowe, formerly under the supervision of a business administrator. Part of the existing crushing system has been modified for crushing, roll grinding, and gravity separation. Discharge to a tailings dam adjacent the plant near the Connaught Shaft is planned to be retreated at a small 10 tph CIP plant located at the Ogilvy shaft. Some vat leaching operations adjacent the main plant are also conducted for artisanal miner ore. These operations are not regarded as material to future operations planned but have helped fund care and maintenance operations.
Project No PS213686
Mazowe Mine
S-K 1300 Technical Report Summary
Bulawayo Mining Company Limited | WSP
January 2025
Page 65 |
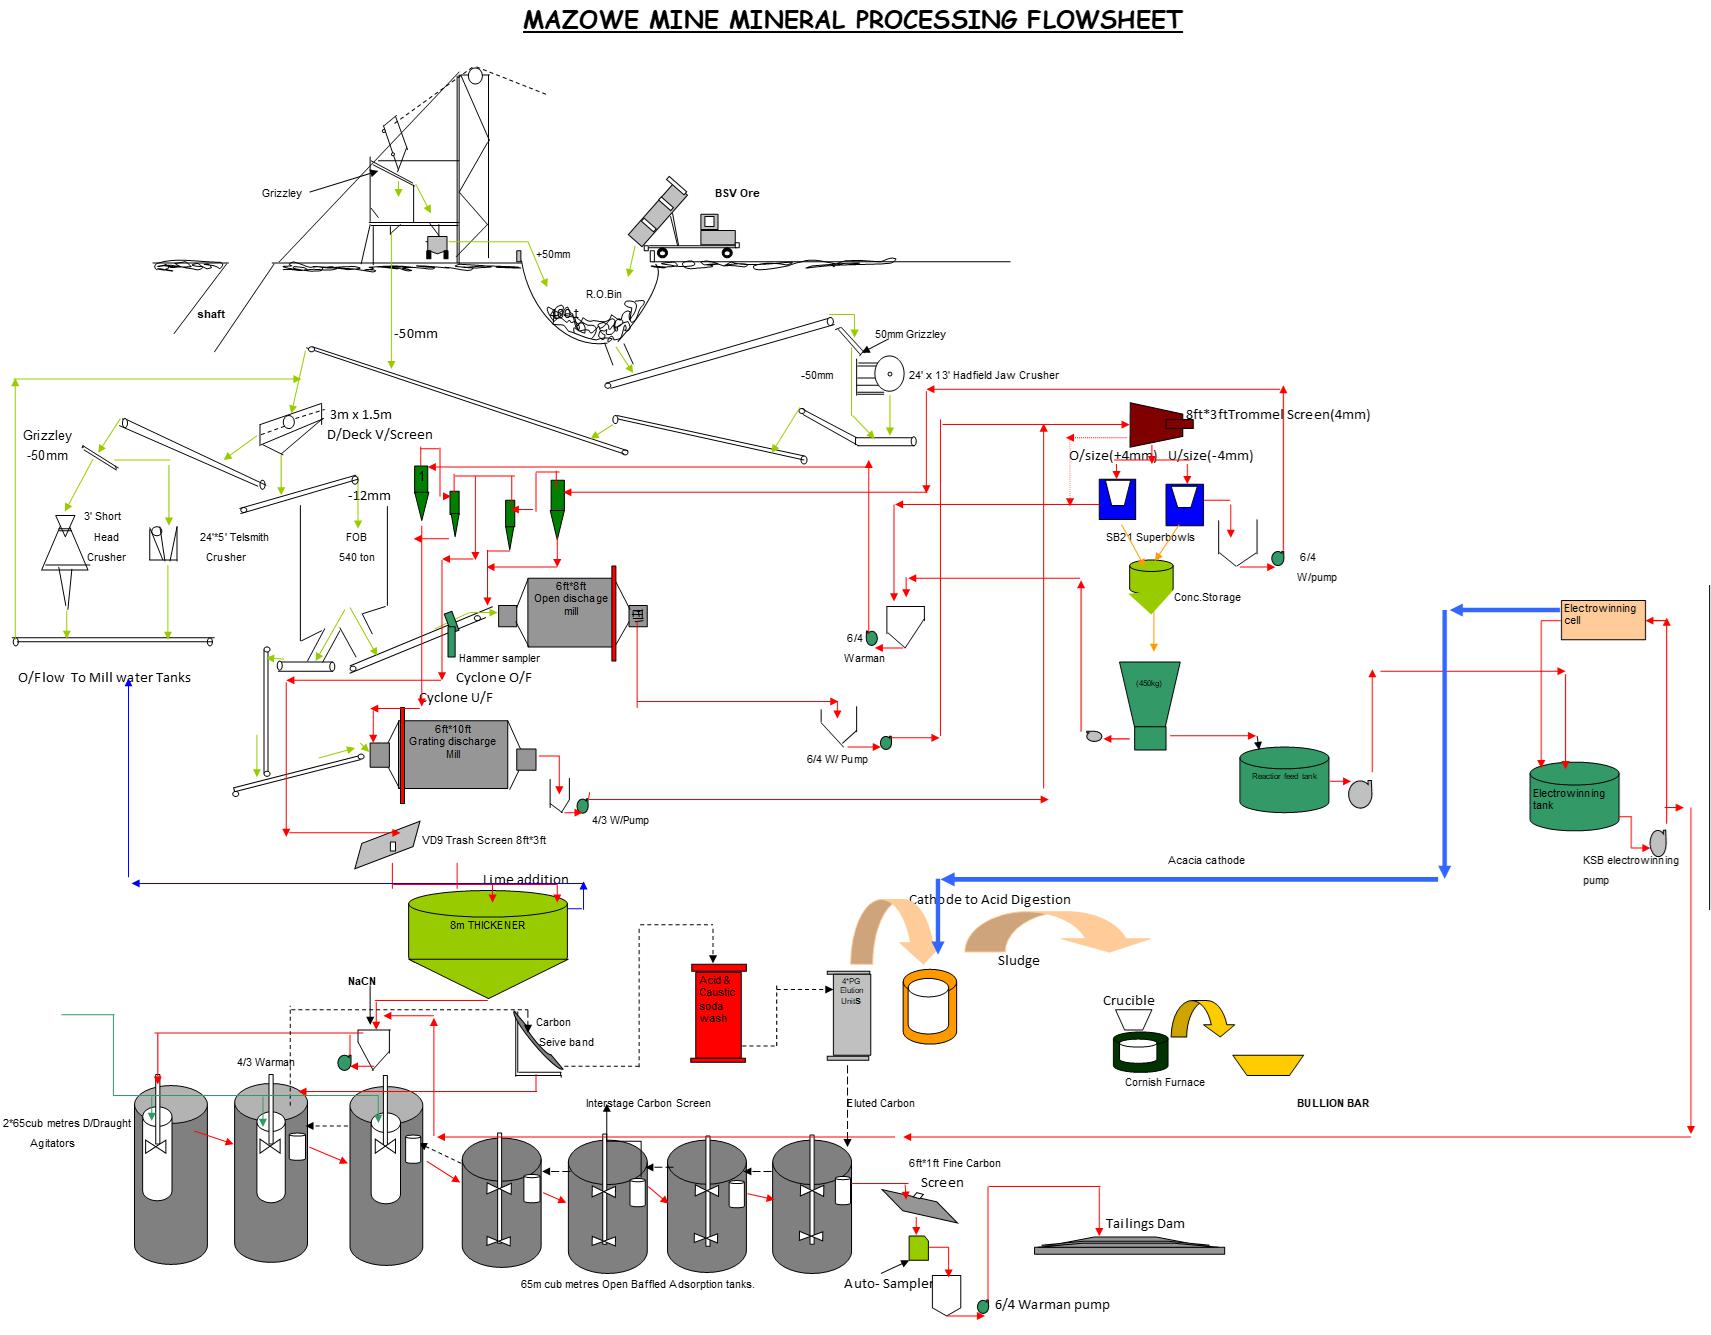
| Figure 14.1 | MGM processing flowsheet |
| 14.2 | Processing plant throughput and characteristics |
Processing plant throughput is rated at 14.5 tph and characteristics mentioned in Section 14.3.
| 14.3 | Primary and secondary crushing |
Minus 200 mm Run of Mine (ROM) ore is extracted from a 400 t Rough Ore Bin and fed onto a conveyor belt to a 14’ x 24’ Telsmith Jaw Crusher via a 50 mm static grizzly. The undersize from the grizzly combines with the crusher product and is conveyed to a Double Deck Vibrating Screen with apertures of 12 mm x 19 mm (bottom deck) and 25 mm x 25 mm (top deck). The oversize from the screen is fed to a 50 mm grizzly, serving as the feed for Secondary crushing in a 5’ x 24’ Telsmith Jaw Crusher, while the undersize is directed to a 3’ Symons Cone Crusher for Tertiary crushing. The Secondary Crushing plant operates in a closed-circuit setup with the Double Deck Screen, and the minus 12 mm ore is conveyed into a 540 t Fine Ore Bin.
ROM ore is drawn at an average of 14.5 t per hour (tph) from the Fine Ore Bin over Weightometer and Automatic Hammer Samplers into a 6’ x 8’ Grate discharge Ball Mill (+/-6 tph) and a 6’x10’ Overflow mill (+/-8.5 tph) operating in parallel.
Project No PS213686
Mazowe Mine
S-K 1300 Technical Report Summary
Bulawayo Mining Company Limited | WSP
January 2025
Page 66 |
MMC Zimbabwe has no product stockyard.
| 14.6 | Energy and water process materials requirements |
Power is provided by ZESA at 33 kilovolts (kV) with a capacity of 4.25 megavolt ampere (MVA). This power is then transformed into various voltages for different purposes:
| — | 11 kV: used for distribution to CIL, underground feed, and domestic supply. |
| — | 2.2 kV: utilised for compressors, village transformers supply, and underground feed. |
| — | 550 V: employed for mine plants, including underground and workshop equipment. |
| — | 380 V: utilised for villages, offices, underground feed, and domestic water supply. |
Different transformers are employed:
| — | 2 x 750 kilovolt ampere (kVA) transformers (33kV to 550 V). |
| — | 1 x 750 kVA transformer (33 kV to 2.2 kV). |
| — | 1 x 2 MVA transformer (33 kV to 11 kV). |
| — | 1 x 200 kVA transformer (2.2 kV to 550 V) located on the 22 level Ogilvy Shaft for underground supply. |
| 14.6.2 | Mine water management system |
Sump and settler systems are used for Mazowe. Pumping of the mine is achieved by a total of five pump stations, four of which are at the Ogilvy Shaft. These stations are cascading, with the 6 Level pump discharging on surface. The other three are located at the Connaught Shaft.
The existing underground ore process plant is in poor condition and will require re-evaluation of the merits of upgrade or replacement prior to restart.
The sands re-processing plant and tailings ownership currently resides with another party following auction and disposal by the receiver, now the subject of legal dispute in progress. It will be necessary to successfully resolve legal proceedings to establish ownership and future potential.
The mine appears to lack a capital equipment inventory for the C&M operation which will require reconciliation as part of valuation and future feasibility assessment.
Project No PS213686
Mazowe Mine
S-K 1300 Technical Report Summary
Bulawayo Mining Company Limited | WSP
January 2025
Page 67 |
This section is included to inform an Initial Assessment for the estimation of Mineral Resources.
A railway line passes through the mine linking up with the regional centres of Glendale, Bindura, and Shamva.
No port access to MGM.
Access to the mine from Harare is by a wide tarred road 42 km to Mazowe Hotel, followed by 8 km of narrow tar, to the west of the Harare-Bindura Road.
Due to the mine being on care and maintenance since 2018, scant information regarding the camp in the mine is available. WSP understands that residential ownership was provided to mine workers as compensation for outstanding salaries on closure.
The Mazowe sand tailings retreatment project, initiated in 2017, faced challenges with throughput rate and gold recovery, leading to its suspension in October 2018.
Despite providing a site layout and TSF view, WSP’s inspection could not inspect the tailings retreatment process plant due to ongoing litigation as to ownership of the plant and tailings dam. Mining operations involved accessing portions of the sands, prompting the need for a new TSF due to capacity concerns. If ownership status is successfully resolved in MMC Zimbabwe’s favour or a deal can be struck, the QP recommends a feasibility study to assess the economic merits of recommencing treatment. This should include a thorough review of metallurgical performance and reconciliation to address issues with throughput, head grade, and gold recovery, along with reassessing resource estimates and optimising mining approaches.
Project No PS213686
Mazowe Mine
S-K 1300 Technical Report Summary
Bulawayo Mining Company Limited | WSP
January 2025
Page 68 |

| Figure 15.1 | MGM site layout showing processing and TSF |
Project No PS213686
Mazowe Mine
S-K 1300 Technical Report Summary
Bulawayo Mining Company Limited | WSP
January 2025
Page 69 |
| 15.6 | Potable water and wastewater |
Portable water requirements are delivered from the water supply system installed at the mine. Wastewater and sewerage systems are installed at the mine.
| 15.7 | Accommodation and offices |
The project site is located within the MGM mining lease area isolated from the surrounding Mazowe farming areas. The mine will make use of accommodation and offices already onsite. No landowners are affected as this is an existing mine.
| 15.8 | Non-process infrastructure |
No Non-process Infrastructure (NPI) is installed on the project site.
| 15.9 | Information and communications technology systems |
The mine currently has telecommunications and IT systems supplying the site offices. These may require upgrade on recommencement of operations.
| 15.10 | Other support facilities and utilities |
An assay laboratory is installed on site that will require refurbishment prior to recommencement of operations. This laboratory is in use for management of artisanal mined ore and retreatment of electrum.
The project area is fenced and manned security provisions are in place.
First aid and ambulance are available on site.
Project No PS213686
Mazowe Mine
S-K 1300 Technical Report Summary
Bulawayo Mining Company Limited | WSP
January 2025
Page 70 |
This section is included to inform an Initial Assessment for the estimation of Mineral Resources.
| 16.1 | Nature and material terms of agency relationships |
MGM is 100% owned by BMC Limited, with no agency relationships applicable.
| 16.2 | Results of relevant market studies |
No recent formal market studies have been completed. Gold and silver are sold according to open market prices as mandated by the Zimbabwean government. Analysis is based on historical pricing using a 3-year trailing average, combined with industry forecasts for exchange rate and inflation.
| 16.3 | Commodity price projections |
Pricing assumptions for gold and silver are based on historical spot pricing in an open market for precious metals, government mandated terms for payment, foreign exchange, and inflation recent history.
Trailing 3-year average daily gold and silver prices have been used as the basis for the gold price assumed for pay limit and revenue assumptions, as provided in Figure 16.1. At end December 2023, this averaged US$1,848/oz for gold and US$21/oz for silver. Silver in doré is not a material contributor to pay limit revenue estimation. As of May 2024, gold was expected to trade at US$2,410/oz. by the end of June 2024, according to Trading Economics global macro models and analysts’ expectations. Looking forward, it is estimated to trade at US$2,484/oz by the end of June 2025.
A gold price assumption of US$1,850/oz is reasonable and supportable for planning purposes, given spot pricing of US$2,330/oz (May 2024) and the 3-year trailing average price of US$1,848/oz (end December 2023, World Gold Council). A silver price assumption of US$21/oz is also reasonable given the spot price for silver is currently US$24.47/oz whilst the 3-year trailing average price is US$23.56/oz, indicating room to increase assumed pricing. Silver represents approximately 10–15% of doré and 0.2% of value and therefore is not material to revenue.
Project No PS213686
Mazowe Mine
S-K 1300 Technical Report Summary
Bulawayo Mining Company Limited | WSP
January 2025
Page 71 |
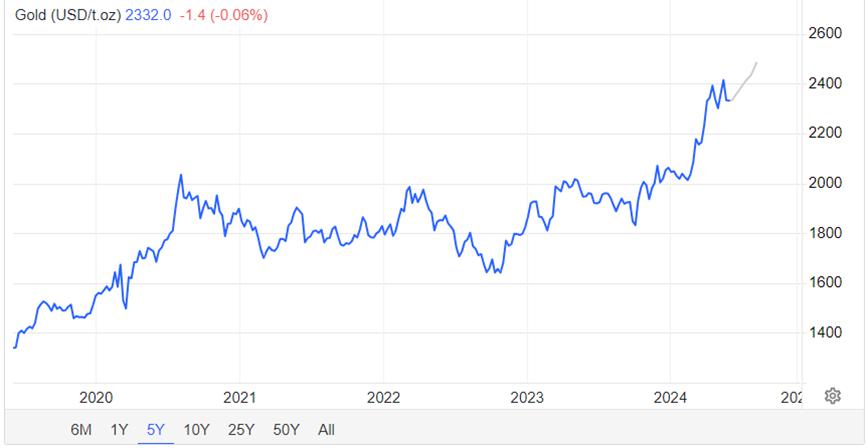
| Figure 16.1 | Historical (blue) gold spot price and forecast (grey) in US$/oz (Trading Economics 30 May 2024) |
Gold proceeds are paid 75% in USD and 25% in local currency with effect from February 2023 (previously 60% USD and 40% in local currency). Sale of gold under these terms has been mandated by the Zimbabwean Government since the start of 2020. The impact of Government controls on gold and silver sales with respect to foreign currency retentions must be considered for the LOM plan. The local ZiG currency was only introduced 5 April 2024, is gold backed and supported by strict monetary policy controls.
The local currency component of revenue has been employed for in country expenses, but this value is subject to high inflation (57.5%, April 2024, Table 16.1) and exchange rate risk (Figure 16.2). Under these circumstances prompt expenditure of local currency is warranted.
| Table 16-1 | Zimbabwean inflation rate and economic indicators (Trading Economics, 30 May 2024) |
| Indicator | Last | Previous | Highest | Lowest | Units | Date |
| Currency | 13.3 | 13.28 | 13.82 | 0 | | May-24 |
| Stock Market | 102 | 100 | 2962052 | 1.13 | Points | May-24 |
| GDP Annual Growth Rate | 4.5 | 6.5 | 22.57 | -17.2 | percent | Dec-23 |
| Unemployment Rate | 9.1 | 9.3 | 10.8 | 4.4 | percent | Dec-23 |
| Inflation Rate | 57.5 | 55.3 | 786 | -7.5 | percent | Apr-24 |
| Interest Rate | 20 | 20 | 200 | 15 | percent | Apr-24 |
| Balance of Trade | -184 | -81.4 | 293 | -3958 | USD Million | Mar-24 |
| Current Account | 305 | 348 | 920 | -2750 | USD Million | Dec-22 |
| Current Account to GDP | 1 | 2.9 | 4.1 | -19.3 | percent of GDP | Dec-22 |
| Government Debt to GDP | 92.6 | 66.9 | 248 | 48.44 | percent of GDP | Dec-22 |
| Government Budget | -0.9 | -1.7 | 1.3 | -11.2 | percent of GDP | Dec-22 |
| Corporate Tax Rate | 24.72 | 24.72 | 30.9 | 24 | % | Dec-23 |
| Personal Income Tax Rate | 41.2 | 41.2 | 51.5 | 36.05 | % | Dec-23 |
Project No PS213686
Mazowe Mine
S-K 1300 Technical Report Summary
Bulawayo Mining Company Limited | WSP
January 2025
Page 72 |
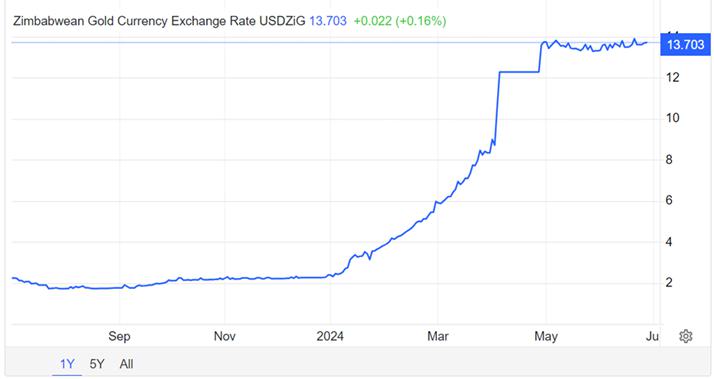
| Figure 16.2 | Zimbabwean gold currency exchange rate ZiG/USD (Trading Economics, 1 July 2024) |
Discounting current gold spot pricing of approximately US$2,350/oz to account for high inflation of 57.5% (April 2024) yields an estimated real value of US$1,936/oz while discounting for exchange rate movements in 2024 (USD:ZiG 2.34 to 13.304) yields an estimated real value of US$1,853/oz. The 12-month forecast price of US$2,484/oz yields discounted values of US$2,061/oz to US$1,971/oz respectively.
This evaluation indicates that the gold pricing assumption of US$1,850/oz for mine planning COG assessment purposes and cashflow modelling is reasonable, provided that inflation and related exchange rate movements for the local currency can be constrained to, or reduced from, current levels and local currency disposed of promptly to cover local costs.
| 16.4 | Mining and processing |
Future mining and processing at MGM are proposed to be conducted on an owner operator basis, consistent with previous practice.
Contract artisanal mining arrangements in place under the previous business administrator have been rescinded and are not material to future plans.
| 16.5 | Product transport and handling |
A gold and silver doré is produced for sale to the Zimbabwean government nominated agent, Fidelity. Gold generally averages 87% by weight. The product is transported by a private professional security company to Fidelity, a government owned refining facility, via the Mutapa Investment Fund (sovereign fund). Gold and silver is valued at spot pricing under the RTGS system on receipt of the doré with Fidelity stipulating allowances for refining charges (US$0.65/oz Au) and government royalty (5%).
No hedging arrangements are currently in place.
| 16.7 | Forward sales contracts |
No forward sales contracts are currently in place.
| 16.8 | Contracts with affiliated parties |
No contracts with affiliated parties are currently in place with respect to gold sales.
Project No PS213686
Mazowe Mine
S-K 1300 Technical Report Summary
Bulawayo Mining Company Limited | WSP
January 2025
Page 73 |
| 17 | Environmental studies, permitting, and plans, negotiations, or agreements with local individuals or groups |
This section is included to inform an Initial Assessment for the estimation of Mineral Resources.
MGM is located 50 km north of the city of Harare, in the Mashonaland Central Province of Zimbabwe. The location is at an altitude of about 1,300 m above sea level, ward 22 of Mazowe district under the jurisdiction of the Mazowe Rural District Council, Mashonaland Central Province. The area is accessible off Mazowe–Harare Road, turning right before Mazowe hotel turnoff then proceeding with the road to MGM commonly known as Jumbo mine.
The mine is owned by MMC Zimbabwe and the proponent was granted mining rights. The proponent is proposing to restart legal mining operations and ensure sustainable mining development.
The following permits/licenses were provided:
| — | Environmental Impact Assessment (EIA) Certificate – Expires 13 September 2025. |
| 17.4 | Environmental and Social Impact Assessment |
Gold Fields of Mazowe obtained ISO 14001:2004 certification for its Environmental Management System in April 2016 and is now aligning it with the ISO 14001:2015 standard. The mine regularly evaluates and manages new environmental risks, implementing appropriate management programs. Every 2 years, Environmental Management Plans (EMP) are submitted to the Environmental Management Agency, and Environmental Impact Assessments are conducted for all new projects to mitigate environmental impacts. The most recent and current EMP for Mazowe Mine was prepared by Metallon Gold Zimbabwe (Pvt) Ltd in 2013-14. Provisions are in place for Mine Closure Liability, ensuring sufficient financial resources are allocated for addressing environmental concerns upon mine closure, adhering to legal requirements and BMC Limited best practice.
| 17.4.1 | Biodiversity and natural resources |
Zimbabwe boasts abundant natural resources, including rich mineral deposits, wildlife, and arable lands. In the working areas of the project, vegetation will be cleared to facilitate shaft sinking and the establishment of milling plants. This vegetation comprises grasses, shrubs, herbaceous plants, and trees. Clearing will be selective, focusing only on necessary areas, and conservative methods will be employed to minimise disturbance. Excavated areas will be backfilled according to decommissioning and rehabilitation plans to allow for vegetative regrowth.
Project No PS213686
Mazowe Mine
S-K 1300 Technical Report Summary
Bulawayo Mining Company Limited | WSP
January 2025
Page 74 |
| 17.4.2 | Managing impacts on water |
The main concern for the MGM would be pollution from effluent and runoff containing suspended solids. All wastewater is to be managed in a closed system thru lining of wastewater facilities.
| 17.4.3 | Acid and metalliferous drainage (AMD) |
The nearby major river system Muroodzi River is approximately 5.5 km south from the project site. There is no direct influence on the river by the project activities since the only possible minimum contribution of surface rainfall will be contained.
| 17.4.4 | Erosion and protection of soils |
Soil erosion at the project site will be prominent during the wet season when the area experiences runoff after heavy rains. Regular movement of equipment and vehicles loosens soil making it susceptible to soil erosion. This is likely to happen before re-profiling and revegetation of the area becomes effective.
| 17.4.5 | Noise and vibration |
The noise survey mainly focused on the project area and potentially affected surroundings. Noise levels shall be kept within acceptable levels of NSSA and ILO (International Labor Organisation) standards.
Mining and milling activities can produce significant dust and release various gases into the environment. This exposes both employees and local communities to air pollution, including dust, gases, and noise, which can negatively impact human health and wellbeing over time. The primary sources of air pollution are dust generated by vehicles transporting ores and dust from the milling process.
| 17.4.7 | Local climate impacts |
The proposed site lies within Natural Ecological Region two (II) which is characterised by warm and temperate climate. When compared with winter, the summers have much more rainfall. The warmest month of the year is December, with an average temperature of 21.0°C. At 13.9°C on average, July is the coldest month of the year. The driest month is August, with 8 mm of rainfall. In January, the precipitation reaches its peak, with an average of 213 mm.
| 17.4.8 | Greenhouse gas emissions |
Not currently addressed as the Property is currently on C&M.
| 17.4.9 | Resources use and non-mineral waste |
No resources use and non-mineral waste provided for review.
No project standards provided for review.
The QP assumes that similar quality assurance standards as adopted by BMC Zimbabwe at the How Gold Mine (HGM) will be implemented for future operations, including:
| — | Quality Management Systems: | ZWS ISO 9001-2015 |
| — | Environmental Management: | ZWS ISO 1401-2015 |
| — | Mining and Quarrying: | IAF Code 2. |
Project No PS213686
Mazowe Mine
S-K 1300 Technical Report Summary
Bulawayo Mining Company Limited | WSP
January 2025
Page 75 |
| 17.6 | Stakeholder engagement |
| 17.6.1 | Stakeholder engagement plan |
Stakeholder consultation employed various methods, including questionnaires, interviews, focus group discussions, and community meetings, utilising a triangulation approach as needed. Stakeholder involvement occurred in four primary ways:
| — | Informing: Providing project details from the proponent and consultant to affected communities and stakeholders, facilitating one-way information flow. |
| — | Consulting: Creating a two-way flow of information between the proponent or consultant and affected communities, allowing the public to express views on the proposal. |
| — | Participating: Engaging in interactive exchanges between the proponent and the community, involving shared analysis, agenda setting, and the development of agreed positions on the proposal and its impacts. |
| — | Negotiating: Facilitating face-to-face discussions between the proponent and key stakeholders to establish consensus and reach mutually acceptable resolutions on issues, such as impact mitigation measures and compensation. |
In line with international good practice as well as the requirements of the EMA Act (20:27), the proponent and GeoPlanet Key (Pvt) Ltd (GeoPlanet) held extensive consultations with the communities affected by the project and authorities at both central and local government levels. Although the public participation process continues throughout the EIA study, it is at its highest intensity during the Scoping exercise and the EIA Report stages.
| 17.7 | Cultural, economic, and social conditions |
The area to be constructed on has no known sites of cultural and historical importance. Resources that will be uncovered during construction activities will be reported to the National Museums and Monuments of Zimbabwe.
Change in landform and geomorphological features within the area will not be very significant given the gradient is gentle and the project area is not very large in terms of spatial coverage. Also, the land is a designated mining area.
| 17.7.3 | Contributing to the national and local economy |
The proponent has also identified the need to provide more employment and process more minerals to serve the nation at large. Zimbabwe defined in a series of short- and medium-term plans, which seeks the restoration and transformation of capacities for sustainable socio-economic growth. The project therefore seeks to better economic transformation of the country. The project will contribute to socio-economic development of both the local and national level through enhancing infrastructural development.
| 17.7.4 | Establishing a social management framework |
No social management framework provided for review.
| 17.7.5 | Impacts on land use and access |
The MGM has minimal impacts on land use and access since it is in C&M since 2018.
Project No PS213686
Mazowe Mine
S-K 1300 Technical Report Summary
Bulawayo Mining Company Limited | WSP
January 2025
Page 76 |
| 17.7.6 | Protecting community health and safety |
MMC Zimbabwe has assessed the impact of the HIV/AIDS epidemic on its operations and implemented ongoing programs to support staff and manage associated risks. The company conducts prevalence studies to monitor HIV trends, predict future patterns, and plan health services accordingly. Efforts are focused on controlling and minimising the identified impacts of HIV/AIDS.
| 17.7.7 | Protecting the workforce |
The Property is going to help the community by providing employment for the local people especially the youths and or school leavers during construction, operation, and decommissioning.
| 17.7.8 | Commitment to local procurement and hiring |
MGM is under care and maintenance since 2018, but when operations will be continued, MMC Zimbabwe aims to give Employment Opportunities to local people where appropriate.
Mine closure plans, including remediation and reclamation plans have recently been updated by Enmin Consulting (Private) Limited (Enmin) in June 2024, including a detailed outline of closure requirements and costs.
The MGM is currently on C&M, with planned recommencement of underground mining and processing operations subject to the outcome of a planned prefeasibility study. Consequently, the mine closure plan and remediation works are on hold.
The mine closure plan envisages that at the conclusion of mining and processing, the land will be rehabilitated. A mine closure plan has been developed that contemplates site closure that will restore the land to its best future use. Closure planning is an iterative process, and ongoing technical studies as well as consultation with local stakeholders will feed into future refinements of the current closure concepts, prepared on a regular basis by MMC Zimbabwe’s selected external consultant. The implementation and success of the plan will be monitored until the site achieves an environmentally and socially acceptable and sustainable state.
The conceptual mine closure plan indicates that closure will be required after completion of mining, although this timeline may vary as a function of conversion of additional Mineral Resources to Mineral Reserves as part of an annual update. Studies are ongoing to determine the potential for further extraction. On exhaustion of reserves, the underground mine will be closed and the ore handling and processing facilities will be decommissioned. This will entail dismantling, demolition and removal of equipment and buildings, reshaping and re contouring of land surfaces and rehabilitation of occupied areas. Dewatering of the underground mine will cease upon completion of mining and allowed to fill with water. As far as practical, the land occupied by the mine and its infrastructure will be returned to its former land use. The mine, plant area and waste emplacements and other works will be made safe for the community including the placement of barriers to discourage people from entering the mined out workings. A public education program on safety issues associated with the mine and any excavated areas will be conducted. A passive water management system will be implemented so that adequate protection for surrounding water resources can be provided without ongoing active management by MMC Zimbabwe.
The closure phase will also require the management of social issues including retrenchment of the workforce and managing the implications of loss of local employment and business. To mitigate the social impacts commonly associated with mine closure, the Mine Closure Plan includes components related to social and community impacts. The plan will be developed in consultation with relevant authorities, the workforce and local communities.
Project No PS213686
Mazowe Mine
S-K 1300 Technical Report Summary
Bulawayo Mining Company Limited | WSP
January 2025
Page 77 |
Mine and social closure costs have recently been updated in the June 2024 mine closure plan prepared by Enmin . The total cost is estimated at US$6.8 M assuming a Planned closure scenario in accordance with the LOM plan, inclusive of a 12.9% contingency (Table 17.1), while this increases to US$7.2 M assuming an Unplanned closure scenario. No Equipment Salvage cost is considered assuming this will be covered by MMC. Social closures costs will only be borne during unplanned closure of the mine. For planned closure, the Mine will have the opportunity to give sufficient notice to its employees on the closure of the mine, thus avoiding this additional cost. The planned closure cost estimate is adopted for cashflow model evaluation.
| Table 17-1 | MGM present closure obligation (Enmin 2024) |
| Item No. | Activity | Cost (US$) |
| Planned Closure | Unplanned Closure |
| 1 | Environmental Liability | 5,682,786 | 5,166,170 |
| 2 | Social Closure | | 882,313 |
| 3 | Equipment Salvage | | |
| Sub-total | 5,682,786 | 6,048,483 |
| Administrative and Supervision costs @6% | 340,967 | 362,909 |
| 12.9% Contingency | 774,925 | 824,793 |
| Total Mine Closure Costs | 6,798,679 | 7,236,185 |
| 17.9 | Translating the ESIA into environmental and social management |
No ESIA and social management provided for review.
Whilst the MGM is currently on C&M, environmental, miscellaneous operational and quality assurance permits and certification should be renewed in preparation for recommencement of operations.
In the QP’s experience, mine closure costs can be a source of significant variability, generally on the downside. Bond liability requirements are generally a guide that reflects the government liability in the event of company default but do not always reflect the full cost of rehabilitation for the company. It is not unusual to find mine closure more than double the cost of legal compliance estimates.
The QP’s view is that whilst the estimates for Mine Closure generally reflect the legal compliance requirements, the actual cost of closure may be higher.
Project No PS213686
Mazowe Mine
S-K 1300 Technical Report Summary
Bulawayo Mining Company Limited | WSP
January 2025
Page 78 |
| 18 | Capital and operating costs |
Not applicable since this TRS is an Initial Assessment and no Mineral Reserves have been estimated.
Any future estimation of Mineral Reserves and potential recommencement of operations will require the support of an additional drilling and resource definition campaign and at least a pre-feasibility to feasibility level of evaluation.
Project No PS213686
Mazowe Mine
S-K 1300 Technical Report Summary
Bulawayo Mining Company Limited | WSP
January 2025
Page 79 |
Not applicable since this TRS is an Initial Assessment and no Mineral Reserves have been estimated.
Any future estimation of Mineral Reserves and potential recommencement of operations will require the support of an additional drilling and resource definition campaign and at least a pre-feasibility to feasibility level of evaluation.
Project No PS213686
Mazowe Mine
S-K 1300 Technical Report Summary
Bulawayo Mining Company Limited | WSP
January 2025
Page 80 |
There are numerous similar historical projects located adjacent to or in the vicinity of the MGM (Figure 6.2).
Little information relating to exploration or production efforts by adjacent property owners is publicly available.
No data or other information from these historical adjacent properties were used in the preparation of this TRS.
Project No PS213686
Mazowe Mine
S-K 1300 Technical Report Summary
Bulawayo Mining Company Limited | WSP
January 2025
Page 81 |
| 21 | Other relevant data and information |
WSP is not aware of any other relevant data or information other than that disclosed in this TRS, that materially affects the information included in this TRS and that all material assumptions and parameters underpinning Mineral Resources and Mineral Reserves estimates continue to apply and have not materially changed.
Project No PS213686
Mazowe Mine
S-K 1300 Technical Report Summary
Bulawayo Mining Company Limited | WSP
January 2025
Page 82 |
| 22 | Interpretation and conclusions |
| 22.1 | Mineral Resources interpretations and conclusions |
Based on the information presented in this TRS, the QP’s key conclusions are as follows:
| — | The levels of understanding of the regional geology, local geology, and the nature and controls on mineralisation are high, and provide a solid foundation for geological modelling, Mineral Resource estimation, and mining and exploration geology. |
| — | The drilling, sampling, assay and QAQC techniques used for both exploration, and resource definition are consistent with standard industry practice, and are considered appropriate for the purposes of geological modelling and Mineral Resource estimation. |
| — | Grade estimates were not constrained to orebody wireframes during grade estimation but were constrained to orebody wireframes during Mineral Resource estimate reporting. |
| — | Estimates utilised all available samples i.e., channel, sludge, diamond drill core etc. |
| — | Dry BD of 2.9 t/m3 assigned for all mineralised domains. |
| — | Validation of the Mineral Resource estimates has not been reported. Standard industry practice is to conduct both visual, and statistical validation of estimates and present the findings of this work in the Mineral Resource report to provide the reader an appreciation of the robustness of the estimates. |
| — | Grade estimation within modelled mineralisation domains (constrained estimate) would likely result in an increase in contained metal. |
| — | Mining, processing, and market modifying factors, study assumptions and parameters are used to establish RPEE for the reporting of Mineral Resources. No significant risks exist that could impact the reliability and/or confidence of Mineral Resources estimates. |
| — | The MRMR technical report developed by BMC Zimbabwe covers a number of areas in sufficient detail; however, some areas require more detail to give the reader a more thorough understanding of the work that has been conducted, the results of the work and any inherent risks to the Mineral Resource estimate. |
| 22.2 | Mineral Reserves interpretations and conclusions |
Not applicable since this TRS is an Initial Assessment and no Mineral Reserves have been estimated.
For the historical 2018 Mineral Reserve estimate, the QP provides comment as follows:
| — | When last in operation in 2018 there was a significant gap in head grade delivered of 3.67 g/t compared to the Mineral Reserve grade of 6.37 g/t Au, warranting reconciliation and justification. This was attributable to a large proportion of ore mined and processed from Mineral Resource category rather than Mineral Reserve. The June 2018 Mineral Reserves compliance with the 2016 Edition of the SAMREC Code is called into question due to insufficient assurance of technical and economic feasibility. |
| — | The historical estimate is indicative and requires update to reflect resource definition via more modern CAD techniques and to reflect significant changes in cost structures and metal pricing in the intervening 6 years. |
| — | Any future estimation of Mineral Reserves and potential recommencement of operations will require the support of an additional drilling and resource definition campaign and at least a pre-feasibility to feasibility level of evaluation. |
| — | The QP approves of the conventional industry approach to defining Mineral Reserves and applying modifying factors, provided that operating performance measures are regularly updated. |
| — | The influx of contract artisanal miners in recent years under the supervision of the previous business administrator, now removed by BMC legal action, and associated poor safety statistics, has posed a risk to permitting and future operation. The QP understands that MMC Zimbabwe is now in the process of negotiations and removal of contract artisanal miners. It must be noted that the artisanal miners focused on shallow workings within 30 m of surface in areas outside the MGM resource and reserve base, and with underground workings flooded to the 3 Level (approximately 50 m below surface) there has been no depletion of resources. |
Project No PS213686
Mazowe Mine
S-K 1300 Technical Report Summary
Bulawayo Mining Company Limited | WSP
January 2025
Page 83 |
Based on the results presented in this TRS, and consistent with BMC Limited’s long standing operating practices, ongoing technical work will be performed on the Property as part of studies to improve confidence, decrease risk, and enable the conversion of Mineral Resources to Mineral Reserves.
The following items are recommended to sustain Mineral Resources and Mineral Reserves:
| 23.1 | Mineral Resources recommendations |
| — | Data and database management is an area that requires further work. The MGM would benefit from the introduction of a corporate database, with inbuilt validation routines and reporting functionality, to assist with what is a large quantity of geological information. |
| — | The estimated cost of this recommendation is US$1,000,000 across the BMC Limited portfolio of assets. |
| — | Data analysis is conducted; however, it is recommended that for future Mineral Resource estimates, deposit wide Exploratory Data Analysis (EDA) is undertaken prior to estimation, to ensure data is fit for purpose for geological modelling and Mineral Resource estimation. |
| — | It is recommended that a succinct geological modelling and Mineral Resource estimation process flow is developed and followed for future Mineral Resource estimates. |
| — | It is recommended that Mineral Resource estimation is constrained to modelled mineralisation domain wireframes, using the Au Cut-off Grade (COG) chosen by the QP at the time of estimation and reporting. |
| — | Review lithology, structural and mineralisation modelling practices. |
| — | It is recommended that studies to characterise the hydrogeology are included in future exploration programs. |
| — | Data analysis is conducted; however, it is recommended that for future Mineral Resource estimates, deposit wide EDA is undertaken prior to estimation, to ensure data is fit for purpose for geological modelling and Mineral Resource estimation. |
| — | It is recommended that Mineral Resource estimation is constrained to modelled mineralisation domain wireframes, using an appropriate Au COG. |
| — | A comparison between BD values determined from underground grab samples, and drill core should be undertaken to ensure that the mean values used for Mineral Resource estimation are appropriate, and that bias is not being incorporated into the Mineral Resource estimate. |
| — | Validation of the Mineral Resource estimates produced, or at least the documentation of validation work undertaken is an area that requires further work. Standard industry practice is to conduct both visual and statistical validation of estimates and present the findings of this work in the TRS, to give the reader an appreciation of the robustness of the estimates. |
| — | Review Mineral Resource classification methodology, and block assignment. |
| — | Mineral Resource reconciliation practices should be reviewed, and a system implemented that provides a measure of Mineral Resource estimate performance. Planned versus actual resource tonnages and grades should be developed and updated each time a Mineral Resource estimate is completed. It is recommended that mined development and production be reconciled monthly, and stope close-out reports be developed for each completed stope. |
| — | Infill surface drilling and exploration of the eastern continuity of the Mazowe deposits. Drilling proposed by MMC Zimbabwe is presented in Table 23.1. |
Project No PS213686
Mazowe Mine
S-K 1300 Technical Report Summary
Bulawayo Mining Company Limited | WSP
January 2025
Page 84 |
| Table 23-1 | Summary of proposed 2024 MMC Zimbabwe surface exploration drilling (MMC Zimbabwe 2024) |
| Mine Area | Nature of Work | Comment |
| Jumbo East | — 600 m of trenching — Infill diamond drilling (11 drill holes totalling 4,400 m) | — To explore for along strike and down-dip extensions of the Mazowe deposits to the east. — Estimated Cost: US$528,000 — Timing: 2024 — Estimated tonnage and grade: 2 Mt @ 5.50 g/t (353,658 oz) |
| Mazowe South | — 800 m of trenching — Diamond drilling (10 drill holes totalling 4,000 m) | — To probe the down dip continuity of the Amatola orebody. — Estimated cost: US$480,000 — Timing: 2024 — Estimated tonnage and grade: 580,000 t @ 5.50 g/t (102,561 oz) |
| — | All paper-based estimation techniques should be converted to computer-based (digital) as soon as possible. |
| — | RPEE have been considered, and the parameters used are considered reasonable. |
| — | The MRMR technical report developed by MMC Zimbabwe covers a number of areas in sufficient detail; however, some areas require more detail to give the reader a more thorough understanding of the work that has been conducted, the results of the work and any inherent risks to the Mineral Resource estimate. |
| 23.2 | Mineral Reserves recommendations |
Not applicable since this TRS is an Initial Assessment and no Mineral Reserves have been estimated.
For the historical 2018 Mineral Reserve estimate, the QP provides recommendations as follows:
MGM is currently on C&M since August 2018 because of the failure of the sand retreatment project to perform in terms of throughput, head grade and recovery, and the declining tonnage and head grade from the underground operations over the period from 2016. The performance of the underground during 2017 and 2018 also suffered from a low level of capital investment in exploration and underground development, necessary to define accessible blocks to the required level of confidence and accuracy and to facilitate a well-planned development strategy and potential productivity improvements. More generally, the operation was constrained by a shortage of consumables and critical spares. Processing performance was impacted by the inability to secure reliable supplies of key consumables such cyanide.
In response, MMC Zimbabwe commissioned a conceptual scoping level study (Virimai, November 2018) to examine options for recommencing operations. The Virimai study appears to provide sufficient confidence to proceed to a more detailed prefeasibility level assessment. WSP’s view is that this work should proceed to provide sufficient confidence for estimation of a SAMREC compliant Mineral Reserve that is suitably supported by a business plan that demonstrates the technical and economic viability. This should include:
| — | Detailed mine prefeasibility assessment of underground options. This should include examination of options for productivity improvements, block access strategies and optimised targeting and sequencing of blocks, dewatering strategy, hoist capacity and process options. |
| — | Reconciliation of historical mine performance and individual stope reconciliation. |
Project No PS213686
Mazowe Mine
S-K 1300 Technical Report Summary
Bulawayo Mining Company Limited | WSP
January 2025
Page 85 |
| — | Once ownership litigation is successfully settled, the tailings retreatment project should be back analysed to confirm reasons for plant underperformance in throughput and head grade. This should include review of the sand tailings in-situ grades, scheduled head grades, and mining strategy. |
The required technical studies should be completed to confirm that re-establishment of commercial production and expansion of production beyond historical benchmarks is both technically feasible and economically viable.
After future Mineral Resource and Mineral Reserve updates, a stope optimisation exercise is recommended. Stope optimisation allows for the rapid development of valid stope shapes according to specified criteria.
More detailed analysis should also be completed in the following areas:
| — | Review actual mining widths compared to applied widths, unplanned dilution levels, adjustment of metal prices, and consideration of exchange rates and revenue constraints. The APF and BRF should be based on actual data and applied by section and stope. Actual mining widths achieved by survey measurement and reconciliation should be compared with average stope widths applied (plus allowance for unplanned dilution). |
| — | Unplanned levels of dilution of 23-25% in combination with the minimum mining width assumptions should be compared with reconciliation statistics from resource, reserve, break, hoist and reconciled mill feed. Planned and achieved stope widths should be compared to properly reconcile and guard against excess dilution. |
| — | Consideration should be given to assessment of the capital development, dewatering and extraction costs for accessing and exploiting satellite blocks located at increased distance from main haulage horizons and shafts for hoisting of the ore. Increased costs for accessing these blocks needs to be considered to determine if it is economic to mine. The size of the blocks to support this access will also need to be considered as increased capital costs are more easily borne by larger block inventories. |
| — | Gold and silver prices should be updated in line with the 3-year trailing average and monitored against prevailing spot prices and/or long-term forecasts on a regular six-monthly basis. Pay limits and cashflow models should be updated accordingly. |
| — | Allowance for the influence of exchange rates, inflation and constraints on revenue received from the sale of gold to the Zimbabwean government is required. WSP understands that recent payment has been mandated as a combination of local currency and United States Dollars (USD), the impact of which upon revenue needs to be monitored and quantified in USD terms. |
Project No PS213686
Mazowe Mine
S-K 1300 Technical Report Summary
Bulawayo Mining Company Limited | WSP
January 2025
Page 86 |
ACZ (Airport Company of Zimbabwe (Private) Limited (2024), Joshua Mqabuko Nkomo International Airport, Available at: https://www.acz.co.zw/Airports/Details/6
BMC (Bulawayo Mining Company (Private) Limited) (2023), How Mine, Mineral Reserves and Mineral Resources (MRMR) Estimates, 31 December 2023, Report on file at Metallon Management (Private) Limited, Harare, Zimbabwe.
GFM (Gold Fields of Mazowe (Private) Limited) (2018), Gold Fields of Mazowe Mineral Reserves and Resources 30th June 2018, Report on file at Metallon Management Services Ltd., Harare, Zimbabwe.
GFM (2016), Amatola Surface Exploration: Reverse Circulation Drilling Summary 2016, Report on file at Gold Fields of Mazowe (UK) Limited, United Kingdom.
Golder Associates Pty Ltd (Golder) (2020), Metallon Corporation Limited (UK) – Competent Person’s Report for the Mazowe Mine, Zimbabwe, Prepared for Metallon Corporation Limited (UK), United Kingdom.
Kersten R.W.O., April 2014, Mazowe Mine: Rock Mechanics Review
MMC Zimbabwe (Mazowe Mining Company (Private) Limited) (2024), MMC: Current Status Report June 2024, 4 pp.
Metallon Gold Zimbabwe (Pvt) Ltd (2013-14), Mazowe Mine, Environmental Management Plan, 182 pp.
Meteoblue 2019, Climate Mazowe, Available at: https://www.meteoblue.com/en/weather/historyclimate/climatemodelled/mazowe_zimbabwe_886384
NRZ (2024a), Freight Services, Available at: https://nrz.co.zw/freight-services/
NRZ (2024b), Passenger Services, Available at: https://nrz.co.zw/passenger-services/
Prendergast, MD (2004), The Bulawayan Supergroup: a late Archaean passive margin-related large igneous province in the Zimbabwe craton, Journal of the Geological Society, vol.161, pp. 431-445.
RBZ (Reserve Bank of Zimbabwe) (2024), The 2024 Monetary Policy Statement at a Glance, 5 April 202413pp.
SAMREC (2016), The South African Code for the Reporting of Exploration Results, Mineral Resources and Mineral Reserves (The SAMREC Code), 2016 Edition.
SRK (SRK Consulting (UK) Ltd) (2012), A Competent Persons’ Report on the Mineral Assets of Metallon Gold Zimbabwe (Private) Limited, Republic of Zimbabwe, Prepared for Metallon Gold Zimbabwe (Private) Limited, Republic of Zimbabwe, Submitted November 2012, 79 pp.
SRK Consulting (South Africa) (Pty) Ltd (SRK), 2015, Mazowe Mine, Multi-reef Intersection Mining Presentation.
SRK Consulting (South Africa) (Pty) Ltd (SRK) (2015), Rock Engineering Review of Metallon Gold Operations, Prepared for Metallon Gold Zimbabwe (Private) Limited, Republic of Zimbabwe, Submitted March 2015, 92 pp.
Suntech Geomet Laboratories (2017), Commissioning Report No. 1: Process Optimisation of the Mazowe Gold Concentrator, Prepare for Goldfields of Mazowe, Submitted 7 October 2017, 11pp.
Virimai Projects (Virimai) (2018), High Level Assessment Mazowe Mine Growth Options, Prepared for Metallon Gold Zimbabwe (Private) Limited, Submitted November 2018.
Waterkings (Waterkings Environment Consultancy) (2014), Mazowe Tailings Dam and Sands Floatation Plant Environmental Impact Assessment (EIA) Report, prepared for Metallon Gold Zimbabwe (Private) Limited, pp. 59 – 66
Project No PS213686
Mazowe Mine
S-K 1300 Technical Report Summary
Bulawayo Mining Company Limited | WSP
January 2025
Page 87 |
| 25 | Reliance on information provided by the Registrant |
Except for the purposes legislated under Canadian/USA securities law, any use of this report by any third party is at that party’s sole risk.
The QPs have wholly relied upon the Registrant for the following:
| — | Macroeconomic trends, data and assumptions, and interest rates (Sections 18 and 19). |
| — | Marketing information and plans within the control of the Registrant (Sections 16, 18, and 19). |
| — | Legal matters outside the expertise of the QPs, such as statutory and regulatory interpretations affecting the mine plan (Sections 3, 13, 15, and 17). |
| — | Environmental matters outside the expertise of the QPs (Section 17). |
| — | Accommodations the Registrant commits or plans to provide to local individuals or groups in connection with its mine plan (Section 17). |
| — | Governmental factors outside the expertise of the QPs (Section 17). |
The QPs consider it reasonable to rely upon the Registrant for the above information, based on the QPs’ past and ongoing interactions with the subject-matter experts in these areas employed or engaged by the Registrant, as well as the Registrant’s considerable experience mining at the Property. Further, the QPs have taken all appropriate steps, in their professional opinion, to ensure that the above information provided by the Registrant is accurate in all material respects and have no reason to believe that any material facts have been withheld or misstated.
Project No PS213686
Mazowe Mine
S-K 1300 Technical Report Summary
Bulawayo Mining Company Limited | WSP
January 2025
Page 88 |

Project No PS213686
Mazowe Mine
S-K 1300 Technical Report Summary
Bulawayo Mining Company Limited | WSP
January 2025
Page 89 |
This Report is provided by WSP Australia Pty Limited (WSP) for Bulawayo Mining Company Ltd (Client) in response to specific instructions from the Client and in accordance with WSP’s proposal dated 29 May 2024 and agreement with the Client dated 30 May 2024 (Agreement).
Permitted purpose
This Report is provided by WSP for the purpose described in the Agreement and no responsibility is accepted by WSP for the use of the Report in whole or in part, for any other purpose (Permitted Purpose).
Qualifications and assumptions
The services undertaken by WSP in preparing this Report were limited to those specifically detailed in the Report and are subject to the scope, qualifications, assumptions and limitations set out in the Report or otherwise communicated to the Client.
Except as otherwise stated in the Report and to the extent that statements, opinions, facts, conclusion and / or recommendations in the Report (Conclusions) are based in whole or in part on information provided by the Client and other parties identified in the report (Information), those Conclusions are based on assumptions by WSP of the reliability, adequacy, accuracy and completeness of the Information and have not been verified. WSP accepts no responsibility for the Information.
WSP has prepared the Report without regard to any special interest of any person other than the Client when undertaking the services described in the Agreement or in preparing the Report.
Use and reliance
This Report should be read in its entirety and must not be copied, distributed or referred to in part only. The Report must not be reproduced without the written approval of WSP. WSP will not be responsible for interpretations or conclusions drawn by the reader. This Report (or sections of the Report) should not be used as part of a specification for a project or for incorporation into any other document without the prior agreement of WSP.
WSP is not (and will not be) obliged to provide an update of this Report to include any event, circumstance, revised Information or any matter coming to WSP’s attention after the date of this Report. Data reported and Conclusions drawn are based solely on information made available to WSP at the time of preparing the Report. The passage of time; unexpected variations in ground conditions; manifestations of latent conditions; or the impact of future events (including (without limitation) changes in policy, legislation, guidelines, scientific knowledge; and changes in interpretation of policy by statutory authorities); may require further investigation or subsequent re-evaluation of the Conclusions.
This Report can only be relied upon for the Permitted Purpose and may not be relied upon for any other purpose. The Report does not purport to recommend or induce a decision to make (or not make) any purchase, disposal, investment, divestment, financial commitment or otherwise. It is the responsibility of the Client to accept (if the Client so chooses) any Conclusions contained within the Report and implement them in an appropriate, suitable and timely manner.
In the absence of express written consent of WSP, no responsibility is accepted by WSP for the use of the Report in whole or in part by any party other than the Client for any purpose whatsoever. Without the express written consent of WSP, any use which a third party makes of this Report or any reliance on (or decisions to be made) based on this Report is at the sole risk of those third parties without recourse to WSP. Third parties should make their own enquiries and obtain independent advice in relation to any matter dealt with or Conclusions expressed in the Report.
Disclaimer
This report contains the expressions of professional opinions of the Authors based on (i) information available at the time of preparation, (ii) data supplied by MMC [and others], and (iii) the assumptions, conditions, and qualifications set forth in this report. The quality of information, conclusions, and estimates contained herein are consistent with the stated levels of accuracy as well as the circumstances and constraints under which the mandate was performed.
Project No PS213686
Mazowe Mine
S-K 1300 Technical Report Summary
Bulawayo Mining Company Limited | WSP
January 2025
Page 90 |