| | | FREE WRITING PROSPECTUS |
| | | FILED PURSUANT TO RULE 433 |
| | | REGISTRATION FILE NO.: 333-280224-03 |
| | | |
| Dated November 26, 2024 | BMO 2024-5C8 |
| Structural and Collateral Term Sheet |
BMO 2024-5C8 Mortgage Trust |
$991,839,388 (Approximate Mortgage Pool Balance) |
| |
$892,209,000 (Approximate Offered Certificates) |
| |
BMO Commercial Mortgage Securities LLC Depositor |
| |
Commercial Mortgage Pass-Through Certificates, Series 2024-5C8 |
| |
| |
Bank of Montreal Goldman Sachs Mortgage Company German American Capital Corporation Starwood Mortgage Capital LLC Citi Real Estate Funding Inc. UBS AG Societe Generale Financial Corporation Greystone Commercial Mortgage Capital LLC Barclays Capital Real Estate Inc. Natixis Real Estate Capital LLC Sponsors and Mortgage Loan Sellers |
BMO Capital
Markets | Deutsche Bank
Securities | Citigroup | Société
Générale | Barclays | UBS
Securities LLC | Goldman Sachs
& Co. LLC |
| Co-Lead Managers and Joint Bookrunners |
| Academy Securities | Bancroft Capital, LLC | | Drexel Hamilton | Natixis |
Co-Managers |
THE INFORMATION IN THIS STRUCTURAL AND COLLATERAL TERM SHEET IS NOT COMPLETE AND MAY BE AMENDED PRIOR TO THE TIME OF SALE. THIS TERM SHEET IS NOT AN OFFER TO SELL THESE SECURITIES AND IT IS NOT A SOLICITATION OF AN OFFER TO BUY THESE SECURITIES IN ANY JURISDICTION WHERE THE OFFER OR SALE IS NOT PERMITTED. |
| | | |
| Dated November 26, 2024 | BMO 2024-5C8 |
This material is for your information, and none of BMO Capital Markets Corp., Goldman Sachs & Co. LLC, Deutsche Bank Securities Inc., Citigroup Global Markets Inc., SG Americas Securities, LLC, Barclays Capital Inc., UBS Securities LLC, Academy Securities, Inc., Bancroft Capital, LLC, Drexel Hamilton, LLC and Natixis Securities Americas LLC (collectively, the “Underwriters”) are soliciting any action based upon it. This material is not to be construed as an offer to sell or the solicitation of any offer to buy any security in any jurisdiction where such an offer or solicitation would be illegal.
The depositor has filed a registration statement (including the prospectus) with the Securities and Exchange Commission (File No. 333-280224) for the offering to which this communication relates. Before you invest, you should read the prospectus in the registration statement and other documents the depositor has filed with the Securities and Exchange Commission for more complete information about the depositor, the issuing entity and this offering. You may get these documents for free by visiting EDGAR on the SEC website at www.sec.gov. Alternatively, the depositor or BMO Capital Markets Corp., any other underwriter, or any dealer participating in this offering will arrange to send you the prospectus if you request it by calling 1-888-200-0266. The Offered Certificates referred to in these materials, and the asset pool backing them, are subject to modification or revision (including the possibility that one or more Classes of Certificates may be split, combined or eliminated at any time prior to issuance or availability of a final prospectus) and are offered on a “when, as and if issued” basis. You understand that, when you are considering the purchase of these Certificates, a contract of sale will come into being no sooner than the date on which the relevant Class has been priced and we have verified the allocation of Certificates to be made to you; any “indications of interest” expressed by you, and any “soft circles” generated by us, will not create binding contractual obligations for you or us.
Neither this document nor anything contained in this document shall form the basis for any contract or commitment whatsoever. The information contained in this document is preliminary as of the date of this document, supersedes any previous such information delivered to you and will be superseded by any such information subsequently delivered prior to the time of sale. These materials are subject to change, completion or amendment from time to time. The information should be reviewed only in conjunction with the entire offering document relating to the Commercial Mortgage Pass-Through Certificates, Series 2024-5C8 (the “Offering Document”). All of the information contained herein is subject to the same limitations and qualifications contained in the Offering Document. The information contained herein does not contain all relevant information relating to the underlying mortgage loans or mortgaged properties. Such information is described elsewhere in the Offering Document. The information contained herein will be more fully described elsewhere in the Offering Document. The information contained herein should not be viewed as projections, forecasts, predictions or opinions with respect to value. Prior to making any investment decision, prospective investors are strongly urged to read the Offering Document its entirety. Neither the Securities and Exchange Commission nor any state securities commission has approved or disapproved of these securities or determined if this free writing prospectus is truthful or complete. Any representation to the contrary is a criminal offense.
This document has been prepared by the Underwriters for information purposes only and does not constitute, in whole or in part, a prospectus for the purposes of Regulation (EU) 2017/1129 (as amended or superseded) and/or Part VI of the Financial Services and Markets Act 2000 (as amended) or other offering document.
The attached information contains certain tables and other statistical analyses (the “Computational Materials”) which have been prepared in reliance upon information furnished by the Mortgage Loan Sellers. Numerous assumptions were used in preparing the Computational Materials, which may or may not be reflected herein. As such, no assurance can be given as to the Computational Materials’ accuracy, appropriateness or completeness in any particular context; or as to whether the Computational Materials and/or the assumptions upon which they are based reflect present market conditions or future market performance. The Computational Materials should not be construed as either projections or predictions or as legal, tax, financial or accounting advice. You should consult your own counsel, accountant and other advisors as to the legal, tax, business, financial and related aspects of a purchase of these Certificates. Any weighted average lives, yields and principal payment periods shown in the Computational Materials are based on prepayment and/or loss assumptions, and changes in such prepayment and/or loss assumptions may dramatically affect such weighted average lives, yields and principal payment periods. In addition, it is possible that prepayments or losses on the underlying assets will occur at rates higher or lower than the rates shown in the attached Computational Materials. The specific characteristics of the Certificates may differ from those shown in the Computational Materials due to differences between the final underlying assets and the preliminary underlying assets used in preparing the Computational Materials. The principal amount and designation of any security described in the Computational Materials are subject to change prior to issuance. None of the Underwriters or any of their respective affiliates make any representation or warranty as to the actual rate or timing of payments or losses on any of the underlying assets or the payments or yield on the Certificates. The information in this presentation is based upon management forecasts and reflects prevailing conditions and management’s views as of this date, all of which are subject to change. In preparing this presentation, we have relied upon and assumed, without independent verification, the accuracy and completeness of all information available from public sources or which was provided to us by or on behalf of the Mortgage Loan Sellers or which was otherwise reviewed by us.
This document contains forward-looking statements. If and when included in this document, the words “expects”, “intends”, “anticipates”, “estimates” and analogous expressions and all statements that are not historical facts, including statements about our beliefs or expectations, are intended to identify forward-looking statements. Any forward-looking statements are made subject to risks and uncertainties which could cause actual results to differ materially from those stated. Those risks and uncertainties include, among other things, declines in general economic and business conditions, increased competition, changes in demographics, changes in political and social conditions, regulatory initiatives and changes in consumer preferences, many of which are beyond our control and the control of any other person or entity related to this offering. The forward-looking statements made in this document are made as of the date hereof. We have no obligation to update or revise any forward-looking statement.
BMO Capital Markets is a trade name used by BMO Financial Group for the wholesale banking businesses of Bank of Montreal, BMO Harris Bank N.A. (member FDIC), Bank of Montreal Europe p.l.c, and Bank of Montreal (China) Co. Ltd, the institutional broker dealer business of BMO Capital Markets Corp. (Member FINRA and SIPC) and the agency broker dealer business of Clearpool Execution Services, LLC (Member FINRA and SIPC) in the U.S., and the institutional broker dealer businesses of BMO Nesbitt Burns Inc. (Member Investment Industry Regulatory Organization of Canada and Member Canadian Investor Protection Fund) in Canada and Asia, Bank of Montreal Europe p.l.c. (authorized and regulated by the Central Bank of Ireland) in Europe and BMO Capital Markets Limited (authorized and regulated by the Financial Conduct Authority) in the UK and Australia.
Securities and investment banking activities in the United States are performed by Deutsche Bank Securities Inc., a member of NYSE, FINRA and SIPC, and its broker-dealer affiliates. Lending and other commercial banking activities in the United States are performed by Deutsche Bank AG and its banking affiliates.
Société Générale is the marketing name for SG Americas Securities, LLC.
THE INFORMATION IN THIS STRUCTURAL AND COLLATERAL TERM SHEET IS NOT COMPLETE AND MAY BE AMENDED PRIOR TO THE TIME OF SALE. THIS TERM SHEET IS NOT AN OFFER TO SELL THESE SECURITIES AND IT IS NOT A SOLICITATION OF AN OFFER TO BUY THESE SECURITIES IN ANY JURISDICTION WHERE THE OFFER OR SALE IS NOT PERMITTED. |
| | 2 | |
| Dated November 26, 2024 | BMO 2024-5C8 |
IMPORTANT NOTICE RELATING TO AUTOMATICALLY-GENERATED EMAIL DISCLAIMERS
Any legends, disclaimers or other notices that may appear at the bottom of any email communication to which this document is attached relating to (1) these materials not constituting an offer (or a solicitation of an offer), (2) no representation that these materials are accurate or complete and may not be updated or (3) these materials possibly being confidential, are not applicable to these materials and should be disregarded. Such legends, disclaimers or other notices have been automatically generated as a result of these materials having been sent via Bloomberg or another system.
THE CERTIFICATES REFERRED TO IN THESE MATERIALS ARE SUBJECT TO MODIFICATION OR REVISION (INCLUDING THE POSSIBILITY THAT ONE OR MORE CLASSES OF CERTIFICATES MAY BE SPLIT, COMBINED OR ELIMINATED AT ANY TIME PRIOR TO ISSUANCE OR AVAILABILITY OF A FINAL PROSPECTUS) AND ARE OFFERED ON A “WHEN, AS AND IF ISSUED” BASIS.
THE UNDERWRITERS MAY FROM TIME TO TIME PERFORM INVESTMENT BANKING SERVICES FOR, OR SOLICIT INVESTMENT BANKING BUSINESS FROM, ANY COMPANY NAMED IN THESE MATERIALS. THE UNDERWRITERS AND/OR THEIR AFFILIATES OR RESPECTIVE EMPLOYEES MAY FROM TIME TO TIME HAVE A LONG OR SHORT POSITION IN ANY CERTIFICATE OR CONTRACT DISCUSSED IN THESE MATERIALS.
THE INFORMATION IN THIS STRUCTURAL AND COLLATERAL TERM SHEET IS NOT COMPLETE AND MAY BE AMENDED PRIOR TO THE TIME OF SALE. THIS TERM SHEET IS NOT AN OFFER TO SELL THESE SECURITIES AND IT IS NOT A SOLICITATION OF AN OFFER TO BUY THESE SECURITIES IN ANY JURISDICTION WHERE THE OFFER OR SALE IS NOT PERMITTED. |
| | 3 | |
| Structural and Collateral Term Sheet | | BMO 2024-5C8 |
| Indicative Capital Structure |
| Offered Certificates | | | | | | |
Classes of Certificates | Expected Ratings (Fitch/KBRA/Moody’s)(1) | Approximate Initial Certificate Balance or Notional Amount(2) | Approximate Initial Credit Support(3) | Initial
Pass-
Through Rate(4) | Pass-Through
Rate Description | Expected Weighted Avg. Life (yrs.)(5) | Expected Principal Window(5) |
| Class A-1 | AAAsf/AAA(sf)/Aaa(sf) | $1,065,000 | | 30.000% | % | (6) | 2.51 | 01/25-09/29 |
| Class A-2 | AAAsf/AAA(sf)/Aaa(sf) | (7) | | 30.000% | % | (6) | (7) | (7) |
| Class A-3 | AAAsf/AAA(sf)/Aaa(sf) | (7) | | 30.000% | % | (6) | (7) | (7) |
| Class X-A | AAAsf/AAA(sf)/Aaa(sf) | $694,287,000 | (8) | N/A | % | Variable IO(9) | N/A | N/A |
| Class X-B(10) | A-sf/AAA(sf)/NR | $197,922,000 | (8) | N/A | % | Variable IO(9) | N/A | N/A |
| Class A-S | AAAsf/AAA(sf)/NR | $112,822,000 | | 18.625% | % | (6) | 4.99 | 12/29-12/29 |
| Class B | AA-sf/AA-(sf)/NR | $48,352,000 | | 13.750% | % | (6) | 4.99 | 12/29-12/29 |
| Class C(10) | A-sf/A-(sf)/NR | $36,748,000 | | 10.045% | % | (6) | 4.99 | 12/29-12/29 |
| Non-Offered Certificates(11) | | | | | |
Classes of Certificates | Expected Ratings (Fitch/KBRA/Moody’s)(1) | Approximate Initial Certificate Balance or Notional Amount(2) | Approximate Initial Credit Support(3) | Initial Pass-
Through Rate(4) | Pass-Through Rate Description | Expected Weighted Avg. Life (yrs.)(5) | Expected Principal Window(5) |
| Class X-D(10) | BBB+sf/BBB+(sf)/NR | $9,928,000 | (8) | N/A | % | Variable IO(9) | N/A | N/A |
| Class D(10) | BBB+sf/BBB+(sf)/NR | $9,928,000 | | 9.044% | % | (6) | 4.99 | 12/29-12/29 |
| Class E-RR(10) | BBB-sf/BBB-(sf)/NR | $20,273,000 | | 7.000% | % | (6) | 4.99 | 12/29-12/29 |
| Class F-RR(10) | BB-sf/BB(sf)/NR | $19,837,000 | | 5.000% | % | (6) | 4.99 | 12/29-12/29 |
| Class G-RR(10) | B-sf/B(sf)/NR | $12,398,000 | | 3.750% | % | (6) | 4.99 | 12/29-12/29 |
| Class J-RR(10) | NR/NR/NR | $37,194,388 | | 0.000% | % | (6) | 4.99 | 12/29-12/29 |
| Class R(12) | N/A | N/A | | N/A | N/A | N/A | N/A | N/A |
| | | | | | | |
| (1) | It is a condition of issuance that the offered certificates and certain classes of non-offered certificates receive the ratings set forth above. The anticipated ratings shown are those of Fitch Ratings, Inc. (“Fitch”), Kroll Bond Rating Agency, LLC (“KBRA”) and Moody’s Investors Service, Inc. (“Moody’s”), as indicated. Subject to the discussion under “Ratings” in the Preliminary Prospectus, the ratings on the certificates address the likelihood of the timely receipt by holders of all payments of interest to which they are entitled on each distribution date and, except in the case of the interest only certificates, the ultimate receipt by holders of all payments of principal to which they are entitled on or before the applicable rated final distribution date. Certain nationally recognized statistical rating organizations, as defined in Section 3(a)(62) of the Securities Exchange Act of 1934, as amended, that were not hired by the depositor may use information they receive pursuant to Rule 17g-5 under the Securities Exchange Act of 1934, as amended, or otherwise to rate the offered certificates. We cannot assure you as to what ratings a non-hired nationally recognized statistical rating organization would assign. See “Risk Factors—Other Risks Relating to the Certificates—Nationally Recognized Statistical Rating Organizations May Assign Different Ratings to the Offered Certificates; Ratings of the Offered Certificates Reflect Only the Views of the Applicable Rating Agencies as of the Dates Such Ratings Were Issued; Ratings May Affect ERISA Eligibility; Ratings May Be Downgraded” in the Preliminary Prospectus. Fitch, KBRA and Moody’s have informed us that the “sf” designation in the ratings represents an identifier of structured finance product ratings. For additional information about this identifier, prospective investors can go to the related rating agency’s website. The depositor and the underwriters have not verified, do not adopt and do not accept responsibility for any statements made by the rating agencies on those websites. Credit ratings referenced throughout this structural and collateral term sheet (this “Term Sheet”) are forward-looking opinions about credit risk and express a rating agency’s opinion about the willingness and ability of an issuer of securities to meet its financial obligations in full and on time. Ratings are not indications of investment merit and are not buy, sell or hold recommendations, a measure of asset value or an indication of the suitability of an investment. |
| (2) | Approximate, subject to a variance of plus or minus 5% and further subject to any additional variances described in the footnotes below. In addition, the notional amounts of the Class X-A, Class X-B and Class X-D certificates (collectively, the “Class X certificates”) may vary depending upon the final pricing of the respective classes of principal balance certificates (as defined in footnote (6) below) whose certificate balances comprise such notional amounts, and, if as a result of such pricing (a) the pass-through rate of any class of Class X certificates would be equal to zero at all times, such class of Class X certificates will not be issued on the closing date of this securitization or (b) the pass-through rate of any class of principal balance certificates whose certificate balance comprises such notional amount is at all times equal to the weighted average of the net interest rates on the mortgage loans (in each case, adjusted, if necessary, to accrue on the basis of a 360-day year consisting of twelve 30-day months) as in effect from time to time, the certificate balance of such class of principal balance certificates may not be part of, and there may be a corresponding reduction in, such notional amount of the related class of Class X certificates. |
| (3) | "Approximate Initial Credit Support" means, with respect to any class of principal balance certificates, the quotient, expressed as a percentage, of (i) the aggregate of the initial certificate balances of all classes of principal balance certificates, if any, junior to the subject class of principal balance certificates, divided by (ii) the aggregate of the initial certificate balances of all classes of principal balance certificates. The approximate initial credit support percentages set forth for the Class A-1, Class A-2 and Class A-3 certificates are represented in the aggregate. |
| (4) | Approximate per annum rate as of the closing date. |
| (5) | Determined assuming no prepayments prior to the maturity date or any anticipated repayment date, as applicable, for any mortgage loan and based on the modeling assumptions described under “Yield, Prepayment and Maturity Considerations” in the Preliminary Prospectus. |
| (6) | For any distribution date, the pass-through rate for each class of the Class A-1, Class A-2, Class A-3, Class A-S, Class B, Class C, Class D, Class E-RR, Class F-RR, Class G-RR and Class J-RR certificates (collectively, the “principal balance certificates”, and collectively with the Class X certificates and the Class R certificates, the “certificates”) will generally be equal to one of (i) a fixed per annum rate, (ii) the weighted average of the net interest rates on the mortgage loans (in each case, adjusted, if necessary, to accrue on the basis of a 360-day year consisting of twelve 30-day months) as in effect from time to time, (iii) a rate equal to the lesser of a specified per annum rate and the weighted average rate described in clause (ii), or (iv) the weighted average rate described in clause (ii) less a specified percentage, but no less than 0.000%. See “Description of the Certificates—Distributions—Pass-Through Rates” in the Preliminary Prospectus. |
| (7) | The exact initial certificate balances of the Class A-2 and Class A-3 certificates are unknown and will be determined based on the final pricing of those classes of certificates. However, the respective initial certificate balances, weighted average lives and principal windows of the Class A-2 and Class A-3 certificates are expected to be within the applicable ranges reflected in the following chart. The aggregate initial certificate balance of the Class A-2 and Class A-3 certificates is expected to be approximately $693,222,000 subject to a variance of plus or minus 5%. |
THE INFORMATION IN THIS STRUCTURAL AND COLLATERAL TERM SHEET IS NOT COMPLETE AND MAY BE AMENDED PRIOR TO THE TIME OF SALE. THIS TERM SHEET IS NOT AN OFFER TO SELL THESE SECURITIES AND IT IS NOT A SOLICITATION OF AN OFFER TO BUY THESE SECURITIES IN ANY JURISDICTION WHERE THE OFFER OR SALE IS NOT PERMITTED. |
| | 4 | |
| Structural and Collateral Term Sheet | | BMO 2024-5C8 |
| Indicative Capital Structure |
Class of Certificates | Expected Range of Initial Certificate Balances | Expected Range of Weighted Avg. Lives (Yrs) | Expected Range of Principal Windows |
| Class A-2 | $0 - $340,000,000 | N/A – 4.87 | N/A – 09/29-11/29 |
| Class A-3 | $353,222,000 - $693,222,000 | 4.92 – 4.97 | 09/29-12/29–11/29-12/29 |
| (8) | The Class X certificates will not have certificate balances and will not be entitled to receive distributions of principal. Interest will accrue on each class of Class X certificates at the related pass-through rate based upon the related notional amount. The notional amount of each class of the Class X certificates will be equal to the certificate balance or the aggregate of the certificate balances, as applicable, from time to time of the class or classes of principal balance certificates identified in the same row as such class of Class X certificates in the chart below (as to such class of Class X certificates, the “corresponding principal balance certificates”): |
| Class of Class X Certificates | Class(es) of Corresponding
Principal Balance Certificates |
| Class X-A | Class A-1, Class A-2 and Class A-3 |
| Class X-B | Class A-S, Class B and Class C |
| Class X-D | Class D |
| (9) | The pass-through rate for each class of Class X certificates will generally be a per annum rate equal to the excess, if any, of (i) the weighted average of the net interest rates on the mortgage loans (in each case, adjusted, if necessary, to accrue on the basis of a 360-day year consisting of twelve 30-day months) as in effect from time to time, over (ii) the pass-through rate (or, if applicable, the weighted average of the pass-through rates) of the class or classes of corresponding principal balance certificates as in effect from time to time, as described in the Preliminary Prospectus. |
| (10) | In satisfaction of Bank of Montreal’s risk retention obligations as retaining sponsor for this securitization transaction, all of the Class E-RR, Class F-RR, Class G-RR and Class J-RR certificates (collectively, the “HRR Certificates”), with an aggregate fair value expected to represent at least 5.0% of the fair value, as of the closing date for this transaction, of all of the “ABS interests” (i.e., all of the certificates (other than the Class R certificates)) issued by the issuing entity, will collectively constitute an “eligible horizontal residual interest” that is to be purchased and retained by 660 RR Holdings LLC, a Delaware limited liability company, or its affiliate in accordance with the credit risk retention rules applicable to this securitization transaction. The certificate balances of the Class C, Class D and Class E-RR certificates may be reallocated between those classes based on the determination of the aggregate fair value, as of the closing date for this transaction, of all of the certificates (other than the Class R certificates), in order to satisfy the foregoing. Any such reallocation would have a corresponding effect on the notional amount of the Class X-B and Class X-D certificates, as applicable. However, the “Approximate Initial Credit Support” for the Class D certificates will have a minimum value of 8.95%, and the “Approximate Initial Credit Support” for the Class C certificates will have a minimum value of 9.95%. “Retaining sponsor,” “ABS interests” and “eligible horizontal residual interest” have the meanings given to such terms in Regulation RR. For more information regarding the methodology and key inputs and assumptions used to determine the sizing of the HRR Certificates, see “Credit Risk Retention” in the Preliminary Prospectus. |
| (11) | The classes of certificates set forth below “Non-Offered Certificates” in the table are not offered hereby. |
| (12) | The Class R certificates will not have a certificate balance, notional amount, pass-through rate, rating or rated final distribution date. The Class R certificates will represent the residual interests in each of two (2) separate REMICs, as further described in the Preliminary Prospectus. The Class R certificates will not be entitled to distributions of principal or interest. |
THE INFORMATION IN THIS STRUCTURAL AND COLLATERAL TERM SHEET IS NOT COMPLETE AND MAY BE AMENDED PRIOR TO THE TIME OF SALE. THIS TERM SHEET IS NOT AN OFFER TO SELL THESE SECURITIES AND IT IS NOT A SOLICITATION OF AN OFFER TO BUY THESE SECURITIES IN ANY JURISDICTION WHERE THE OFFER OR SALE IS NOT PERMITTED. |
| | 5 | |
| Structural and Collateral Term Sheet | | BMO 2024-5C8 |
| Summary of Transaction Terms |
| Publicly Offered Certificates: | $892,209,000 monthly pay, multi-class, commercial mortgage REMIC pass-through Certificates. |
| Co-Lead Managers and Joint Bookrunners: | BMO Capital Markets Corp., Goldman Sachs & Co. LLC, Deutsche Bank Securities Inc., Citigroup Global Markets Inc., SG Americas Securities, LLC, Barclays Capital Inc. and UBS Securities LLC |
| Co-Managers: | Academy Securities, Inc., Bancroft Capital, LLC, Drexel Hamilton, LLC and Natixis Securities Americas LLC |
| Mortgage Loan Sellers: | Bank of Montreal (“BMO”) (25.3%); Goldman Sachs Mortgage Company (“GSMC”) (19.7%); German American Capital Corporation (“GACC”) (17.4%); Starwood Mortgage Capital LLC (“SMC”) (11.9%); Citi Real Estate Funding Inc. (“CREFI”) (9.6%); UBS AG (“UBS”) (5.5%); Societe Generale Financial Corporation (“SGFC”) (5.0%); Greystone Commercial Mortgage Capital LLC (“GCMC”) (2.4%); Barclays Capital Real Estate Inc. (“Barclays”) (2.4%); and Natixis Real Estate Capital LLC (“NREC”) (0.9%). |
| Master Servicer: | Wells Fargo Bank, National Association |
| Special Servicer: | Greystone Servicing Company LLC |
| Directing Holder/Controlling Class Representative: | 400 Capital Management, LLC |
| Trustee: | Computershare Trust Company, National Association |
| Certificate Administrator: | Computershare Trust Company, National Association |
| Operating Advisor: | Pentalpha Surveillance LLC |
| Asset Representations Reviewer: | Pentalpha Surveillance LLC |
| Rating Agencies: | Fitch Ratings, Inc. (“Fitch”), Kroll Bond Rating Agency, LLC (“KBRA”) and Moody’s Investors Service, Inc. (“Moody’s”). |
| U.S. Credit Risk Retention: | For a discussion on the manner in which BMO, as retaining sponsor, intends to satisfy the U.S. credit risk retention requirements, see “Credit Risk Retention” in the Preliminary Prospectus. |
| EU Credit Risk Retention: | The transaction is not structured to satisfy the EU risk retention and due diligence requirements. |
| Closing Date: | On or about December 19, 2024. |
| Cut-off Date: | With respect to each mortgage loan, the related due date in December 2024, or in the case of any mortgage loan that has its first due date after December 2024, the date that would have been its due date in December 2024 under the terms of that mortgage loan if a monthly debt service payment were scheduled to be due in that month. |
| Distribution Date: | The 4th business day after the Determination Date in each month, commencing in January 2025. |
| Determination Date: | 11th day of each month, or if the 11th day is not a business day, the next succeeding business day, commencing in January 2025. |
| Assumed Final Distribution Date: | The Distribution Date in December 2029 which is the latest anticipated repayment date of the Certificates. |
| Rated Final Distribution Date: | The Distribution Date in December 2057. |
| Tax Treatment: | The Publicly Offered Certificates are expected to be treated as REMIC “regular interests” for U.S. federal income tax purposes. |
| Form of Offering: | The Class A-1, Class A-2, Class A-3, Class X-A, Class X-B, Class A-S, Class B and Class C Certificates (the “Publicly Offered Certificates”) will be offered publicly. The Class X-D, Class D, Class E-RR, Class F-RR, Class G-RR, Class J-RR and Class R Certificates (the “Privately Offered Certificates”) will be offered domestically to Qualified Institutional Buyers and to Institutional Accredited Investors (other than the Class R Certificates) and to institutions that are not U.S. Persons pursuant to Regulation S (other than the Class R Certificates). |
| SMMEA Status: | The Certificates will not constitute “mortgage related securities” for purposes of SMMEA. |
| ERISA: | The Publicly Offered Certificates are expected to be ERISA eligible. |
| Optional Termination: | On any Distribution Date on which the aggregate principal balance of the pool of mortgage loans is less than 1% of the aggregate principal balance of the mortgage loans as of the cut-off date, certain entities specified in the Preliminary Prospectus will have the option to purchase all of the remaining mortgage loans (and all property acquired through exercise of remedies in respect of any mortgage loan) at the price specified in the Preliminary Prospectus. Refer to “Pooling and Servicing Agreement—Termination; Retirement of Certificates” and “—Optional Termination; Optional Mortgage Loan Purchase” in the Preliminary Prospectus. |
| Minimum Denominations: | The Publicly Offered Certificates (other than the Class X-A and Class X-B Certificates) will be issued in minimum denominations of $10,000 and integral multiples of $1 in excess of $10,000. The Class X-A and Class X-B Certificates will be issued in minimum denominations of $1,000,000 and in integral multiples of $1 in excess of $1,000,000. |
| Settlement Terms: | DTC, Euroclear and Clearstream Banking. |
| Analytics: | The transaction is expected to be modeled by Bloomberg, L.P., Trepp, LLC, Intex Solutions, Inc., BlackRock Financial Management, Inc., CMBS.com, Inc., Moody’s Analytics, Markit Group Limited, RealINSIGHT, Thompson Reuters Corporation, Intercontinental Exchange | ICE Data Services, KBRA Analytics, LLC, DealView Technologies Ltd., Recursion Co and CRED iQ. |
THE INFORMATION IN THIS STRUCTURAL AND COLLATERAL TERM SHEET IS NOT COMPLETE AND MAY BE AMENDED PRIOR TO THE TIME OF SALE. THIS TERM SHEET IS NOT AN OFFER TO SELL THESE SECURITIES AND IT IS NOT A SOLICITATION OF AN OFFER TO BUY THESE SECURITIES IN ANY JURISDICTION WHERE THE OFFER OR SALE IS NOT PERMITTED. |
| | 6 | |
| Structural and Collateral Term Sheet | | BMO 2024-5C8 |
| Summary of Transaction Terms |
| Risk Factors: | THE CERTIFICATES INVOLVE CERTAIN RISKS AND MAY NOT BE SUITABLE FOR ALL INVESTORS. REFER TO THE “SUMMARY OF RISK FACTORS” AND “RISK FACTORS” SECTIONS OF THE PRELIMINARY PROSPECTUS. |
THE INFORMATION IN THIS STRUCTURAL AND COLLATERAL TERM SHEET IS NOT COMPLETE AND MAY BE AMENDED PRIOR TO THE TIME OF SALE. THIS TERM SHEET IS NOT AN OFFER TO SELL THESE SECURITIES AND IT IS NOT A SOLICITATION OF AN OFFER TO BUY THESE SECURITIES IN ANY JURISDICTION WHERE THE OFFER OR SALE IS NOT PERMITTED. |
| | 7 | |
| Structural and Collateral Term Sheet | | BMO 2024-5C8 |
| Collateral Characteristics |
Mortgage Loan Seller | Number of Mortgage Loans | Number of Mortgaged Properties | Aggregate
Cut-off Date Balance | | Roll-up Aggregate Cut-off Date Balance | Roll-up Aggregate % of Cut-off Date Balance |
| BMO | 6 | 8 | $128,200,000 | 12.9% | $250,749,780 | 25.3% |
| GSMC | 3 | 27 | $136,300,000 | 13.7% | $195,260,651 | 19.7% |
| GACC | 4 | 4 | $70,500,000 | 7.1% | $172,846,957 | 17.4% |
| SMC | 5 | 6 | $74,400,000 | 7.5% | $118,150,000 | 11.9% |
| CREFI | 5 | 7 | $95,490,000 | 9.6% | $95,490,000 | 9.6% |
| UBS AG | 5 | 5 | $54,200,000 | 5.5% | $54,200,000 | 5.5% |
| SGFC | 3 | 3 | $49,200,000 | 5.0% | $49,200,000 | 5.0% |
| GCMC | - | - | - | - | $23,584,000 | 2.4% |
| Barclays | - | - | - | - | $23,583,000 | 2.4% |
| NREC | 1 | 2 | $8,775,000 | 0.9% | $8,775,000 | 0.9% |
| BMO, GACC, GSMC | 2 | 2 | $131,000,000 | 13.2% | - | - |
| BMO, GCMC, Barclays | 1 | 1 | $70,750,000 | 7.1% | - | - |
| SMC, BMO | 2 | 3 | $70,000,000 | 7.1% | - | - |
| GACC, GSMC | 1 | 6 | $64,000,000 | 6.5% | - | - |
| GSMC, BMO | 1 | 23 | $26,389,388 | 2.7% | - | - |
| GACC, BMO | 1 | 1 | $12,635,000 | 1.3% | - | - |
| Total: | 40 | 98 | $991,839,388 | 100.0% | $991,839,388 | 100.0% |
| Loan Pool | |
| | Initial Pool Balance (“IPB”): | $991,839,388 |
| | Number of Mortgage Loans: | 40 |
| | Number of Mortgaged Properties: | 98 |
| | Average Cut-off Date Balance per Mortgage Loan: | $24,795,985 |
| | Weighted Average Current Mortgage Rate: | 6.58110% |
| | 10 Largest Mortgage Loans as % of IPB: | 54.6% |
| | Weighted Average Remaining Term to Maturity: | 59 months |
| | Weighted Average Seasoning: | 1 month |
| | | |
| Credit Statistics | |
| | Weighted Average UW NCF DSCR(1)(2): | 1.68x |
| | Weighted Average UW NOI Debt Yield(1): | 11.6% |
| | Weighted Average Cut-off Date Loan-to-Value Ratio (“LTV”)(1)(3): | 58.1% |
| | Weighted Average Maturity Date/ARD LTV(1)(3): | 58.1% |
| | | |
| Other Statistics | |
| | % of Mortgage Loans with Additional Debt: | 8.0% |
| | % of Mortgage Loans with Single Tenants(4): | 15.6% |
| | % of Mortgage Loans secured by Multiple Properties: | 25.5% |
| | |
| Amortization | |
| | Weighted Average Original Amortization Term(5): | 360 months |
| | Weighted Average Remaining Amortization Term(5): | 360 months |
| | % of Mortgage Loans with Interest-Only: | 97.0% |
| | % of Mortgage Loans with Amortizing Balloon: | 3.0% |
| | | |
| Lockboxes(6) | |
| | % of Mortgage Loans with Hard Lockboxes: | 52.5% |
| | % of Mortgage Loans with Springing Lockboxes: | 25.4% |
| | % of Mortgage Loans with Soft Lockboxes: | 18.2% |
| | % of Mortgage Loans with Soft (Residential); Hard (Commercial)Lockboxes: | 3.8% |
| | | |
| Reserves | |
| | % of Mortgage Loans Requiring Monthly Tax Reserves: | 70.9% |
| | % of Mortgage Loans Requiring Monthly Insurance Reserves: | 36.9% |
| | % of Mortgage Loans Requiring Monthly CapEx Reserves: | 82.9% |
| | % of Mortgage Loans Requiring Monthly TI/LC Reserves(7): | 57.3% |
(See footnotes on following page)
THE INFORMATION IN THIS STRUCTURAL AND COLLATERAL TERM SHEET IS NOT COMPLETE AND MAY BE AMENDED PRIOR TO THE TIME OF SALE. THIS TERM SHEET IS NOT AN OFFER TO SELL THESE SECURITIES AND IT IS NOT A SOLICITATION OF AN OFFER TO BUY THESE SECURITIES IN ANY JURISDICTION WHERE THE OFFER OR SALE IS NOT PERMITTED. |
| | 8 | |
| Structural and Collateral Term Sheet | | BMO 2024-5C8 |
| Collateral Characteristics |
| (1) | In the case of Loan Nos. 1, 3, 4, 5, 7, 8, 11, 14, 16, 18, 23, 28, 30, 33 and 36, the UW NCF DSCR, UW NOI Debt Yield, Cut-off Date LTV and Maturity Date/ARD LTV calculations include the related Pari Passu Companion Loan(s). In the case of Loan Nos. 3 and 23, the UW NCF DSCR, UW NOI Debt Yield, Cut-off Date LTV and Maturity Date/ARD LTV calculations exclude the related subordinate companion loan(s). |
| (2) | For the mortgage loans that are interest-only for the entire term and accrue interest on an Actual/360 basis, the Monthly Debt Service Amount ($) was calculated as 1/12th of the product of (i) the Original Balance ($), (ii) the Interest Rate % and (iii) 365/360. |
| (3) | In the case of Loan Nos. 4, 14 and 23, the Cut-off Date LTV and Maturity/ARD LTV are calculated by using an appraised value based on an “as is portfolio” assumption. In the case of each of Loan No. 16, the Cut-off Date LTV and Maturity/ARD LTV are calculated by using an appraised value based on an “prospective market value upon stabilization” assumption. Refer to the definition of “Appraised Value” under “Description of the Mortgage Pool—Certain Calculations and Definitions” in the Preliminary Prospectus for additional details. |
| (4) | Excludes mortgage loans that are secured by multiple properties leased to separate single tenants. |
| (5) | Excludes 40 mortgage loans that are interest-only for the entire term or until the anticipated repayment date. |
| (6) | For a more detailed description of lockboxes, refer to “Description of the Mortgage Pool—Certain Calculations and Definitions” and “—Certain Terms of the Mortgage Loans—Mortgaged Property Accounts” in the Preliminary Prospectus. |
| (7) | Calculated only with respect to the Cut-off Date Balance of mortgage loans secured or partially secured by office, industrial, retail, multifamily (with commercial tenants) and mixed use properties. |
THE INFORMATION IN THIS STRUCTURAL AND COLLATERAL TERM SHEET IS NOT COMPLETE AND MAY BE AMENDED PRIOR TO THE TIME OF SALE. THIS TERM SHEET IS NOT AN OFFER TO SELL THESE SECURITIES AND IT IS NOT A SOLICITATION OF AN OFFER TO BUY THESE SECURITIES IN ANY JURISDICTION WHERE THE OFFER OR SALE IS NOT PERMITTED. |
| | 9 | |
| Structural and Collateral Term Sheet | | BMO 2024-5C8 |
| Collateral Characteristics |
| | Ten Largest Mortgage Loans |
| |
| No. | Loan Name | City, State | Mortgage Loan Seller | No.
of Prop. | Cut-off Date Balance | % of IPB | Square Feet / Units | Property Type | UW
NCF DSCR(1)(2) | UW NOI Debt Yield(1) | Cut-off Date LTV(1)(3) | Maturity Date/ARD LTV(1)(3) |
| 1 | Queens Center | Elmhurst, NY | BMO, GACC,
GSMC | 1 | $71,000,000 | 7.2% | 412,033 | Retail | 1.84x | 10.2% | 49.5% | 49.5% |
| 2 | 310 Grand Concourse | Bronx, NY | BMO, GCMC,
Barclays | 1 | $70,750,000 | 7.1% | 150 | Multifamily | 1.26x | 8.0% | 69.4% | 69.4% |
| 3 | ICONIQ Multifamily Portfolio | Various, Various | GACC, GSMC | 6 | $64,000,000 | 6.5% | 1,790 | Multifamily | 2.43x | 14.6% | 36.1% | 36.1% |
| 4 | Black Spruce - Briarwood and
Prospect | Various, NY | GSMC | 2 | $64,000,000 | 6.5% | 488 | Multifamily | 1.20x | 8.1% | 70.0% | 70.0% |
| 5 | Colony Square | Atlanta, GA | BMO, GACC,
GSMC | 1 | $60,000,000 | 6.0% | 1,085,612 | Mixed Use | 1.51x | 11.8% | 50.4% | 50.4% |
| 6 | Quest Diagnostics - Chantilly | Chantilly, VA | GSMC | 1 | $57,300,000 | 5.8% | 248,186 | Mixed Use | 1.77x | 10.2% | 70.7% | 70.7% |
| 7 | Woodland Mall | Kentwood, MI | SMC, BMO | 1 | $50,000,000 | 5.0% | 563,041 | Retail | 1.93x | 15.0% | 53.0% | 53.0% |
| 8 | The Outlet Collection Seattle | Auburn, WA | CREFI | 1 | $35,970,000 | 3.6% | 913,033 | Retail | 2.40x | 19.5% | 50.3% | 50.3% |
| 9 | 222 Delaware Avenue | Wilmington, DE | BMO | 1 | $35,500,000 | 3.6% | 294,417 | Office | 1.75x | 14.2% | 64.8% | 64.8% |
| 10 | The Wymore 360 | Altamonte Springs, FL | GACC | 1 | $33,000,000 | 3.3% | 200 | Multifamily | 1.36x | 9.6% | 71.0% | 71.0% |
| | | | | | | | | | | | | |
| | Top 3 Total/Weighted Average | 8 | $205,750,000 | 20.7% | | | 1.82x | 10.8% | 52.2% | 52.2% |
| | Top 5 Total/Weighted Average | 11 | $329,750,000 | 33.2% | | | 1.65x | 10.5% | 55.3% | 55.3% |
| | Top 10 Total/Weighted Average | 16 | $541,520,000 | 54.6% | | | 1.72x | 11.6% | 58.0% | 58.0% |
| | Non-Top 10 Total/Weighted Average | 82 | $450,319,388 | 45.4% | | | 1.62x | 11.6% | 58.3% | 58.2% |
| (1) | In the case of Loan Nos. 1, 3, 4, 5, 7, 8, 11, 14, 16, 18, 23, 28, 30, 33 and 36, the UW NCF DSCR, UW NOI Debt Yield, Cut-off Date LTV and Maturity Date/ARD LTV calculations include the related Pari Passu Companion Loan(s). In the case of Loan Nos. 3 and 23, the UW NCF DSCR, UW NOI Debt Yield, Cut-off Date LTV and Maturity Date/ARD LTV calculations exclude the related subordinate companion loan(s). |
| (2) | For the mortgage loans that are interest-only for the entire term and accrue interest on an Actual/360 basis, the Monthly Debt Service Amount ($) was calculated as 1/12th of the product of (i) the Original Balance ($), (ii) the Interest Rate % and (iii) 365/360. |
| (3) | In the case of Loan Nos. 4, 14 and 23, the Cut-off Date LTV and Maturity/ARD LTV are calculated by using an appraised value based on an “as is portfolio” assumption. In the case of each of Loan No. 16, the Cut-off Date LTV and Maturity/ARD LTV are calculated by using an appraised value based on an “prospective market value upon stabilization” assumption. Refer to the definition of “Appraised Value” under “Description of the Mortgage Pool—Certain Calculations and Definitions” in the Preliminary Prospectus for additional details. |
THE INFORMATION IN THIS STRUCTURAL AND COLLATERAL TERM SHEET IS NOT COMPLETE AND MAY BE AMENDED PRIOR TO THE TIME OF SALE. THIS TERM SHEET IS NOT AN OFFER TO SELL THESE SECURITIES AND IT IS NOT A SOLICITATION OF AN OFFER TO BUY THESE SECURITIES IN ANY JURISDICTION WHERE THE OFFER OR SALE IS NOT PERMITTED. |
| | 10 | |
| Structural and Collateral Term Sheet | | BMO 2024-5C8 |
| Collateral Characteristics |
| Pari Passu Companion Loan Summary |
| |
No. | Loan Name | | Trust Cut-off Date Balance | Aggregate Pari Passu Companion Loan Cut-off Date Balance(1) | Controlling Pooling/Trust & Servicing Agreement | Master Servicer | Special Servicer | Related Pari Passu Loan(s) Securitizations | Related Pari Passu Companion Loan(s) Original Balance(1) |
| 1 | Queens Center | BMO, GACC, GSMC | $71,000,000 | $454,000,000 | Future Securitization(2) | Midland(2) | LNR(2) | WFCM 2024-5C2 BANK5 2024-5YR11 BANK5 2024-5YR12 Future Securitization(s) | $30,000,000 $75,000,000 $85,000,000 $264,000,000 |
| 3 | ICONIQ Multifamily Portfolio | GACC, GSMC | $64,000,000 | $236,000,000 | ICNQ 2024-MF | Wells Fargo | KeyBank | ICNQ 2024-MF WCFM 2024-5C2 Future Securitization(s) | $170,000,000 $26,000,000 $40,000,000 |
| 4 | Black Spruce - Briarwood and Prospect | GSMC | $64,000,000 | $27,230,000 | BMO 2024-5C8 | Wells Fargo | Greystone | Future Securitization(s) | $27,230,000 |
| 5 | Colony Square | BMO, GACC, GSMC | $60,000,000 | $200,000,000 | BMO 2024-5C8 | Wells Fargo | Greystone | BMO 2024-5C7 Benchmark 2024-V11 Future Securitization(s) | $60,000,000 $70,000,000 $70,000,000 |
| 7 | Woodland Mall | SMC, BMO | $50,000,000 | $30,000,000 | BMO 2024-5C8 | Wells Fargo | Greystone | Future Securitization(s) | $30,000,000 |
| 8 | The Outlet Collection Seattle | CREFI | $35,970,000 | $17,297,500 | BMO 2024-5C8 | Wells Fargo | Greystone | Future Securitization(s) | $17,297,500 |
| 11 | Newport on the Levee | BMO | $30,000,000 | $12,000,000 | BMO 2024-5C8 | Wells Fargo | Greystone | Future Securitization(s) | $12,000,000 |
| 14 | Tank Holding Portfolio | GSMC, BMO | $26,389,388 | $60,000,000 | BMO 2024-5C7 | Midland | Greystone | BMO 2024-5C7 | $60,000,000 |
| 16 | Signum at 375 Dean | BMO | $24,000,000 | $60,000,000 | BMO 2024-5C7 | Midland | Greystone | BMO 2024-5C7 | $60,000,000 |
| 18 | Riverwalk West | SMC, BMO | $20,000,000 | $60,000,000 | Future Securitization(3) | Midland(3) | LNR(3) | Future Securitization(s) | $60,000,000 |
| 23 | Atrium Hotel Portfolio 24 Pack | GSMC | $15,000,000 | $449,800,000 | AHPT 2024-ATRM | Wells Fargo | CWC Capital Asset Management LLC | AHPT 2024-ATRM Benchmark 2024-V11 WFCM 2024-5C2 BANK5 2024-5YR11 | $835,000,000 $50,000,000 $35,000,000 $50,000,000 |
| 28 | 125 Summer | GACC, BMO | $12,635,000 | $90,000,000 | BMO 2024-5C7 | Midland | Greystone | BMO 2024-5C7 Future Securitization(s) | $60,000,000 $30,000,000 |
| 30 | GRM South Brunswick | SMC | $12,000,000 | $60,000,000 | BMO 2024-5C7 | Midland | Greystone | BMO 2024-5C7 | $60,000,000 |
| 33 | Linx | SGFC | $10,000,000 | $84,000,000 | BMO 2024-5C6 | Midland | LNR | BMO 2024-5C6 BMO 2024-5C7 Future Securitization(s) | $53,000,000 $6,000,000 $25,000,000 |
| 36 | Northbridge Centre | BMO | $5,000,000 | $91,000,000 | BMO 2024-5C6 | Midland | LNR | BMO 2024-5C6 BMO 2024-5C7 BBCMS 2024-5C29 | $53,000,000 $8,000,000 $30,000,000 |
| (1) | In the case of Loan Nos. 3 and 23, the Aggregate Pari Passu Loan Companion Loan Cut-off Date Balance and Related Pari Passu Loan(s) Original Balance exclude the related subordinate companion loan(s). |
| (2) | In the case of Loan No. 1, the related whole loan will be serviced and administered pursuant to the pooling and servicing agreement of the securitization of the related controlling pari-passu companion loan, which securitization transaction is expected to close on or prior to the closing date for this securitization transaction, at which time the related servicing agreement will be the Controlling Pooling/Trust & Servicing Agreement. |
| (3) | In the case of Loan No. 18, until the securitization of the related controlling pari passu companion loan, the related whole loan will be serviced and administered pursuant to the pooling and servicing agreement for a securitization transaction expected to close on or prior to the closing date for this securitization transaction, at which time the related servicing agreement will be the Controlling Pooling/Trust & Servicing Agreement. Upon the securitization of the related controlling pari-passu companion loan, servicing of the related whole loan will shift to the servicers under the servicing agreement with respect to such future securitization transaction, which servicing agreement will become the Controlling Pooling/Trust & Servicing Agreement. |
THE INFORMATION IN THIS STRUCTURAL AND COLLATERAL TERM SHEET IS NOT COMPLETE AND MAY BE AMENDED PRIOR TO THE TIME OF SALE. THIS TERM SHEET IS NOT AN OFFER TO SELL THESE SECURITIES AND IT IS NOT A SOLICITATION OF AN OFFER TO BUY THESE SECURITIES IN ANY JURISDICTION WHERE THE OFFER OR SALE IS NOT PERMITTED. |
| | 11 | |
| Structural and Collateral Term Sheet | | BMO 2024-5C8 |
| Collateral Characteristics |
No. | Loan Name | Trust
Cut-off Date Balance | Pari Passu Companion Loan(s) Cut-off Date Balance | Subordinate Debt Cut-off Date Balance(1) | Total Debt Cut-off Date Balance | Mortgage Loan UW NCF DSCR(2) | Total Debt UW NCF DSCR | Mortgage Loan
Cut-off Date LTV(2) | Total Debt Cut-off Date LTV | Mortgage Loan UW NOI Debt Yield(2) | Total Debt UW NOI Debt Yield |
| 3 | ICONIQ Multifamily Portfolio | $64,000,000 | $236,000,000 | $225,000,000 | $525,000,000 | 2.43x | 1.34x | 36.1% | 63.1% | 14.6% | 8.3% |
| 23 | Atrium Hotel Portfolio 24 Pack | $15,000,000 | $449,800,000 | $520,200,000 | $985,000,000 | 4.17x | 1.48x | 32.1% | 68.0% | 26.7% | 12.6% |
| (1) | In the case of Loan Nos. 3 and 23, subordinate debt represents one subordinate companion loan secured by the same mortgaged property as the senior pari passu companion loans (including Loan Nos. 3 and 24). |
| (2) | Mortgage Loan UW NCF DSCR, Mortgage Loan Cut-off Date LTV and Mortgage Loan UW NOI Debt Yield calculations include any related Pari Passu Companion Loans (if applicable), but exclude the related subordinate companion loan(s). |
THE INFORMATION IN THIS STRUCTURAL AND COLLATERAL TERM SHEET IS NOT COMPLETE AND MAY BE AMENDED PRIOR TO THE TIME OF SALE. THIS TERM SHEET IS NOT AN OFFER TO SELL THESE SECURITIES AND IT IS NOT A SOLICITATION OF AN OFFER TO BUY THESE SECURITIES IN ANY JURISDICTION WHERE THE OFFER OR SALE IS NOT PERMITTED. |
| | 12 | |
| Structural and Collateral Term Sheet | | BMO 2024-5C8 |
| Collateral Characteristics |
| Mortgaged Properties by Type(1) |
| | | | | | Weighted Average |
| Property Type | Property Subtype | Number of Properties | Cut-off Date Principal Balance | % of IPB | UW
NCF DSCR(2)(3) | UW
NOI Debt Yield(2) | Cut-off Date LTV(2)(4) | Maturity Date/ARD LTV(2)(4) |
| Multifamily | High Rise | 6 | $172,096,667 | 17.4% | 1.63x | 10.1% | 55.2% | 55.2% |
| | Mid Rise | 14 | 137,408,333 | 13.9 | 1.37x | 9.2% | 65.0% | 65.0% |
| | Garden | 7 | 100,636,379 | 10.1 | 1.36x | 9.7% | 66.8% | 66.8% |
| | Townhome | 1 | 10,063,621 | 1.0 | 1.41x | 10.5% | 60.5% | 60.5% |
| | Low Rise | 1 | 2,570,000 | 0.3 | 1.36x | 10.2% | 64.0% | 64.0% |
| | Subtotal / Weighted Average: | 29 | $422,775,000 | 42.6% | 1.48x | 9.7% | 61.3% | 61.3% |
| Retail | Super Regional Mall | 2 | $121,000,000 | 12.2% | 1.88x | 12.2% | 50.9% | 50.9% |
| | Anchored | 3 | 44,000,000 | 4.4 | 1.59x | 12.4% | 56.1% | 56.1% |
| | Outlet Center | 1 | 35,970,000 | 3.6 | 2.40x | 19.5% | 50.3% | 50.3% |
| | Single Tenant | 1 | 3,750,000 | 0.4 | 1.34x | 9.6% | 60.2% | 60.2% |
| | Subtotal / Weighted Average: | 7 | $204,720,000 | 20.6% | 1.90x | 13.5% | 52.1% | 52.1% |
| Mixed Use | Office/Retail | 2 | $73,550,000 | 7.4% | 1.51x | 11.7% | 52.5% | 52.5% |
| | Lab/Office | 2 | 67,300,000 | 6.8 | 1.86x | 10.8% | 65.9% | 65.9% |
| | Retail/Office | 1 | 30,000,000 | 3.0 | 1.68x | 16.6% | 39.9% | 38.3% |
| | Multifamily/Retail | 1 | 11,320,000 | 1.1 | 1.73x | 12.1% | 65.1% | 65.1% |
| | Subtotal / Weighted Average: | 6 | $182,170,000 | 18.4% | 1.68x | 12.2% | 56.1% | 55.9% |
| Office | CBD | 4 | $82,135,000 | 8.3% | 1.75x | 13.1% | 63.6% | 63.6% |
| | Suburban/R&D | 1 | 6,450,000 | 0.7 | 1.50x | 11.1% | 61.6% | 61.6% |
| | Subtotal / Weighted Average: | 5 | $88,585,000 | 8.9% | 1.73x | 13.0% | 63.4% | 63.4% |
| Industrial | Warehouse Distribution/Light Manufacturing | 23 | $26,389,388 | 2.7% | 2.25x | 11.8% | 65.0% | 65.0% |
| | Flex/R&D | 1 | 26,000,000 | 2.6 | 1.27x | 10.5% | 56.8% | 56.8% |
| | Warehouse | 1 | 12,000,000 | 1.2 | 1.37x | 10.0% | 57.1% | 57.1% |
| | Subtotal / Weighted Average: | 25 | $64,389,388 | 6.5% | 1.69x | 10.9% | 60.2% | 60.2% |
| Hospitality | Full Service | 18 | $13,337,315 | 1.3% | 4.17x | 26.7% | 32.1% | 32.1% |
| | Extended Stay | 1 | 10,500,000 | 1.1 | 1.60x | 14.7% | 55.6% | 55.6% |
| | Limited Service/Extended Stay | 3 | 865,477 | 0.1 | 4.17x | 26.7% | 32.1% | 32.1% |
| | Select Service | 3 | 797,208 | 0.1 | 4.17x | 26.7% | 32.1% | 32.1% |
| | Subtotal / Weighted Average: | 25 | $25,500,000 | 2.6% | 3.11x | 21.8% | 41.8% | 41.8% |
| Self Storage | Self Storage | 1 | $3,700,000 | 0.4% | 1.30x | 9.2% | 68.1% | 68.1% |
| Total / Weighted Average: | 98 | $991,839,388 | 100.0% | 1.68x | 11.6% | 58.1% | 58.1% |
| (1) | Because this table presents information relating to the mortgaged properties and not mortgage loans, the information for mortgage loans secured by more than one mortgaged property is based on allocated loan amounts, individual appraised values, net cash flow or net operating income with respect to such individual mortgaged properties, as applicable. |
| (2) | In the case of Loan Nos. 1, 3, 4, 5, 7, 8, 11, 14, 16, 18, 23, 28, 30, 33 and 36, the UW NCF DSCR, UW NOI Debt Yield, Cut-off Date LTV and Maturity Date/ARD LTV calculations include the related Pari Passu Companion Loan(s). In the case of Loan Nos. 3 and 23, the UW NCF DSCR, UW NOI Debt Yield, Cut-off Date LTV and Maturity Date/ARD LTV calculations exclude the related subordinate companion loan(s). |
| (3) | For the mortgage loans that are interest-only for the entire term or until the anticipated repayment date and accrue interest on an Actual/360 basis, the Monthly Debt Service Amount ($) was calculated as 1/12th of the product of (i) the Original Balance ($), (ii) the Interest Rate % and (iii) 365/360. |
| (4) | In the case of Loan Nos. 4, 14 and 23, the Cut-off Date LTV and Maturity/ARD LTV are calculated by using an appraised value based on an “as is portfolio” assumption. In the case of each of Loan No. 16, the Cut-off Date LTV and Maturity/ARD LTV are calculated by using an appraised value based on an “prospective market value upon stabilization” assumption. Refer to the definition of “Appraised Value” under “Description of the Mortgage Pool—Certain Calculations and Definitions” in the Preliminary Prospectus for additional details. |
THE INFORMATION IN THIS STRUCTURAL AND COLLATERAL TERM SHEET IS NOT COMPLETE AND MAY BE AMENDED PRIOR TO THE TIME OF SALE. THIS TERM SHEET IS NOT AN OFFER TO SELL THESE SECURITIES AND IT IS NOT A SOLICITATION OF AN OFFER TO BUY THESE SECURITIES IN ANY JURISDICTION WHERE THE OFFER OR SALE IS NOT PERMITTED. |
| | 13 | |
| Structural and Collateral Term Sheet | | BMO 2024-5C8 |
| Collateral Characteristics |
| Mortgaged Properties by Location(1) |
| | | | | Weighted Average |
State | Number of Properties | Cut-off Date Principal Balance | % of IPB | UW
NCF DSCR(2)(3) | UW
NOI Debt Yield(2) | Cut-off Date LTV(2)(4) | Maturity Date/ARD LTV(2)(4) |
| New York | 19 | $359,701,055 | 36.3% | 1.42x | 9.0% | 62.3% | 62.3% |
| Michigan | 4 | 75,500,000 | 7.6 | 1.75x | 13.5% | 55.4% | 55.4% |
| Georgia | 4 | 74,613,262 | 7.5 | 1.52x | 12.1% | 51.7% | 51.7% |
| Delaware | 2 | 61,500,000 | 6.2 | 1.55x | 12.6% | 61.4% | 61.4% |
| Virginia | 1 | 57,300,000 | 5.8 | 1.77x | 10.2% | 70.7% | 70.7% |
| Washington | 2 | 48,970,000 | 4.9 | 2.30x | 18.1% | 48.6% | 48.6% |
| Florida | 4 | 47,366,028 | 4.8 | 1.59x | 10.7% | 63.9% | 63.9% |
| Massachusetts | 4 | 42,635,000 | 4.3 | 2.02x | 13.9% | 55.9% | 55.9% |
| Texas | 9 | 42,510,922 | 4.3 | 1.66x | 11.0% | 61.2% | 61.2% |
| Kentucky | 2 | 30,428,117 | 3.1 | 1.72x | 16.7% | 39.8% | 38.2% |
| Colorado | 2 | 25,303,917 | 2.6 | 2.49x | 15.0% | 36.0% | 36.0% |
| Indiana | 3 | 18,715,869 | 1.9 | 1.61x | 10.5% | 61.8% | 61.8% |
| Illinois | 4 | 18,688,484 | 1.9 | 2.50x | 14.9% | 38.4% | 38.4% |
| Louisiana | 1 | 17,000,000 | 1.7 | 1.44x | 12.3% | 68.8% | 68.8% |
| California | 3 | 15,747,474 | 1.6 | 1.58x | 11.7% | 51.4% | 51.4% |
| New Jersey | 1 | 12,000,000 | 1.2 | 1.37x | 10.0% | 57.1% | 57.1% |
| Tennessee | 2 | 10,421,670 | 1.1 | 2.54x | 15.4% | 35.8% | 35.8% |
| Missouri | 5 | 6,780,286 | 0.7 | 2.69x | 15.2% | 57.5% | 57.5% |
| Arkansas | 4 | 6,142,046 | 0.6 | 2.37x | 16.4% | 57.7% | 57.7% |
| Iowa | 3 | 3,870,116 | 0.4 | 2.25x | 11.8% | 65.0% | 65.0% |
| Nevada | 1 | 3,700,000 | 0.4 | 1.30x | 9.2% | 68.1% | 68.1% |
| Nebraska | 4 | 2,663,857 | 0.3 | 3.45x | 21.1% | 44.5% | 44.5% |
| North Carolina | 1 | 1,656,065 | 0.2 | 2.25x | 11.8% | 65.0% | 65.0% |
| Ohio | 2 | 1,636,504 | 0.2 | 2.25x | 11.8% | 65.0% | 65.0% |
| Utah | 2 | 1,477,644 | 0.1 | 2.25x | 11.8% | 65.0% | 65.0% |
| Wisconsin | 1 | 1,413,617 | 0.1 | 2.25x | 11.8% | 65.0% | 65.0% |
| Oklahoma | 3 | 1,022,604 | 0.1 | 3.48x | 21.4% | 43.9% | 43.9% |
| New Mexico | 1 | 834,883 | 0.1 | 4.17x | 26.7% | 32.1% | 32.1% |
| Alabama | 1 | 779,013 | 0.1 | 2.25x | 11.8% | 65.0% | 65.0% |
| West Virginia | 1 | 687,640 | 0.1 | 4.17x | 26.7% | 32.1% | 32.1% |
| Arizona | 1 | 443,711 | 0.0 | 4.17x | 26.7% | 32.1% | 32.1% |
| South Carolina | 1 | 329,604 | 0.0 | 4.17x | 26.7% | 32.1% | 32.1% |
| Total / Weighted Average: | 98 | $991,839,388 | 100.0% | 1.68x | 11.6% | 58.1% | 58.1% |
| (1) | Because this table presents information relating to the mortgaged properties and not mortgage loans, the information for mortgage loans secured by more than one mortgaged property is based on allocated loan amounts, individual appraised values, net cash flow or net operating income with respect to such individual mortgaged properties, as applicable. |
| (2) | In the case of Loan Nos. 1, 3, 4, 5, 7, 8, 11, 14, 16, 18, 23, 28, 30, 33 and 36, the UW NCF DSCR, UW NOI Debt Yield, Cut-off Date LTV and Maturity Date/ARD LTV calculations include the related Pari Passu Companion Loan(s). In the case of Loan Nos. 3 and 23, the UW NCF DSCR, UW NOI Debt Yield, Cut-off Date LTV and Maturity Date/ARD LTV calculations exclude the related subordinate companion loan(s). |
| (3) | For the mortgage loans that are interest-only for the entire term or until the anticipated repayment date and accrue interest on an Actual/360 basis, the Monthly Debt Service Amount ($) was calculated as 1/12th of the product of (i) the Original Balance ($), (ii) the Interest Rate % and (iii) 365/360. |
| (4) | In the case of Loan Nos. 4, 14 and 23, the Cut-off Date LTV and Maturity/ARD LTV are calculated by using an appraised value based on an “as is portfolio” assumption. In the case of each of Loan No. 16, the Cut-off Date LTV and Maturity/ARD LTV are calculated by using an appraised value based on an “prospective market value upon stabilization” assumption. Refer to the definition of “Appraised Value” under “Description of the Mortgage Pool—Certain Calculations and Definitions” in the Preliminary Prospectus for additional details. |
THE INFORMATION IN THIS STRUCTURAL AND COLLATERAL TERM SHEET IS NOT COMPLETE AND MAY BE AMENDED PRIOR TO THE TIME OF SALE. THIS TERM SHEET IS NOT AN OFFER TO SELL THESE SECURITIES AND IT IS NOT A SOLICITATION OF AN OFFER TO BUY THESE SECURITIES IN ANY JURISDICTION WHERE THE OFFER OR SALE IS NOT PERMITTED. |
| | 14 | |
| Structural and Collateral Term Sheet | | BMO 2024-5C8 |
| Collateral Characteristics |
| Cut-off Date Principal Balance |
| | | | | Weighted Average |
| Range of Cut-off Date Principal Balances | Number of Loans | Cut-off Date Principal Balance | % of IPB | Mortgage Rate | Remaining Loan Term | UW
NCF DSCR(1)(2) | UW
NOI
Debt Yield(1) | Cut-off
Date LTV(1)(3) | Maturity Date/ARD LTV(1)(3) |
| $3,700,000 | - | $4,999,999 | 4 | | $15,950,000 | 1.6 | % | 7.19505% | 59 | 1.35x | 10.0% | 64.1% | 64.1% |
| $5,000,000 | - | $9,999,999 | 3 | | 20,975,000 | 2.1 | | 6.82246% | 58 | 1.41x | 9.9% | 63.6% | 63.6% |
| $10,000,000 | - | $19,999,999 | 13 | | 170,005,000 | 17.1 | | 6.78124% | 59 | 1.86x | 13.2% | 56.8% | 56.8% |
| $20,000,000 | - | $29,999,999 | 9 | | 213,389,388 | 21.5 | | 6.59108% | 60 | 1.46x | 9.9% | 61.0% | 61.0% |
| $30,000,000 | - | $39,999,999 | 4 | | 134,470,000 | 13.6 | | 7.46254% | 59 | 1.81x | 15.0% | 56.9% | 56.5% |
| $40,000,000 | - | $71,000,000 | 7 | | 437,050,000 | 44.1 | | 6.19319% | 59 | 1.69x | 10.9% | 57.1% | 57.1% |
| Total / Weighted Average: | 40 | | $991,839,388 | 100.0 | % | 6.58110% | 59 | 1.68x | 11.6% | 58.1% | 58.1% |
| | | | | Weighted Average |
Range of
Mortgage Interest Rates | Number of Loans | Cut-off Date Principal Balance | % of IPB | Mortgage Rate | Remaining Loan Term | UW
NCF DSCR(1)(2) | UW
NOI
Debt Yield(1) | Cut-off
Date LTV(1)(3) | Maturity Date/ARD LTV(1)(3) |
| 5.17600% | - | 5.99999% | 6 | $243,689,388 | 24.6 | % | 5.39465% | 59 | 2.19x | 12.7% | 51.1% | 51.1% |
| 6.00000% | - | 6.49999% | 5 | 143,525,000 | 14.5 | | 6.24290% | 60 | 1.37x | 8.9% | 61.5% | 61.5% |
| 6.50000% | - | 6.99999% | 13 | 253,205,000 | 25.5 | | 6.71693% | 60 | 1.39x | 9.7% | 67.1% | 67.1% |
| 7.00000% | - | 7.49999% | 12 | 267,920,000 | 27.0 | | 7.29508% | 59 | 1.71x | 13.3% | 55.7% | 55.7% |
| 7.50000% | - | 8.40500% | 4 | 83,500,000 | 8.4 | | 7.92220% | 60 | 1.49x | 13.6% | 53.0% | 52.4% |
| Total / Weighted Average: | 40 | $991,839,388 | 100.0 | % | 6.58110% | 59 | 1.68x | 11.6% | 58.1% | 58.1% |
| Original Term to Maturity in Months |
| | | | | Weighted Average |
Original Term to
Maturity in Months | Number of Loans | Cut-off Date Principal Balance | % of IPB | Mortgage Rate | Remaining Loan Term | UW
NCF DSCR(1)(2) | UW
NOI
Debt Yield(1) | Cut-off
Date LTV(1)(3) | Maturity Date/ARD LTV(1)(3) |
| 60 | 40 | $991,839,388 | 100.0 | % | 6.58110% | 59 | 1.68x | 11.6% | 58.1% | 58.1% |
| Total / Weighted Average: | 40 | $991,839,388 | 100.0 | % | 6.58110% | 59 | 1.68x | 11.6% | 58.1% | 58.1% |
| Remaining Term to Maturity in Months |
| | | | | Weighted Average |
| Range of Remaining Term to Maturity in Months | Number of Loans | Cut-off Date Principal Balance | % of IPB | Mortgage Rate | Remaining Loan Term | UW
NCF DSCR(1)(2) | UW
NOI
Debt Yield(1) | Cut-off
Date LTV(1)(3) | Maturity Date/ARD LTV(1)(3) |
| 57 | - | 60 | 40 | $991,839,388 | 100.0 | % | 6.58110% | 59 | 1.68x | 11.6% | 58.1% | 58.1% |
| Total / Weighted Average: | 40 | $991,839,388 | 100.0 | % | 6.58110% | 59 | 1.68x | 11.6% | 58.1% | 58.1% |
| (1) | In the case of Loan Nos. 1, 3, 4, 5, 7, 8, 11, 14, 16, 18, 23, 28, 30, 33 and 36, the UW NCF DSCR, UW NOI Debt Yield, Cut-off Date LTV and Maturity Date/ARD LTV calculations include the related Pari Passu Companion Loan(s). In the case of Loan Nos. 3 and 23, the UW NCF DSCR, UW NOI Debt Yield, Cut-off Date LTV and Maturity Date/ARD LTV calculations exclude the related subordinate companion loan(s). |
| (2) | For the mortgage loans that are interest-only for the entire term or until the anticipated repayment date and accrue interest on an Actual/360 basis, the Monthly Debt Service Amount ($) was calculated as 1/12th of the product of (i) the Original Balance ($), (ii) the Interest Rate % and (iii) 365/360. |
| (3) | In the case of Loan Nos. 4, 14 and 23, the Cut-off Date LTV and Maturity/ARD LTV are calculated by using an appraised value based on an “as is portfolio” assumption. In the case of each of Loan No. 16, the Cut-off Date LTV and Maturity/ARD LTV are calculated by using an appraised value based on an “prospective market value upon stabilization” assumption. Refer to the definition of “Appraised Value” under “Description of the Mortgage Pool—Certain Calculations and Definitions” in the Preliminary Prospectus for additional details. |
THE INFORMATION IN THIS STRUCTURAL AND COLLATERAL TERM SHEET IS NOT COMPLETE AND MAY BE AMENDED PRIOR TO THE TIME OF SALE. THIS TERM SHEET IS NOT AN OFFER TO SELL THESE SECURITIES AND IT IS NOT A SOLICITATION OF AN OFFER TO BUY THESE SECURITIES IN ANY JURISDICTION WHERE THE OFFER OR SALE IS NOT PERMITTED. |
| | 15 | |
| Structural and Collateral Term Sheet | | BMO 2024-5C8 |
| Collateral Characteristics |
Original Amortization Term in Months |
| | | | | Weighted Average |
Original
Amortization
Term in Months | Number of Loans | Cut-off Date Principal Balance | % of IPB | Mortgage Rate | Remaining Loan Term | UW
NCF DSCR(1)(2) | UW
NOI
Debt Yield(1) | Cut-off
Date LTV(1)(3) | Maturity Date/ARD LTV(1)(3) |
| Interest Only | 39 | $961,839,388 | 97.0 | % | 6.52421% | 59 | 1.68x | 11.5% | 58.7% | 58.7% |
| 360 | 1 | 30,000,000 | 3.0 | | 8.40500% | 60 | 1.68x | 16.6% | 39.9% | 38.3% |
| Total / Weighted Average: | 40 | $991,839,388 | 100.0 | % | 6.58110% | 59 | 1.68x | 11.6% | 58.1% | 58.1% |
| Remaining Amortization Term in Months |
| | | | | Weighted Average |
| Range of Remaining Amortization Term in Months | Number of Loans | Cut-off Date Principal Balance | % of IPB | Mortgage Rate | Remaining Loan Term | UW
NCF DSCR(1)(2) | UW
NOI
Debt Yield(1) | Cut-off
Date LTV(1)(3) | Maturity Date/ARD LTV(1)(3) |
| Interest Only | 39 | $961,839,388 | 97.0 | % | 6.52421% | 59 | 1.68x | 11.5% | 58.7% | 58.7% |
| 360 | 1 | 30,000,000 | 3.0 | | 8.40500% | 60 | 1.68x | 16.6% | 39.9% | 38.3% |
| Total / Weighted Average: | 40 | $991,839,388 | 100.0 | % | 6.58110% | 59 | 1.68x | 11.6% | 58.1% | 58.1% |
| | | | | Weighted Average |
| Amortization Types | Number of Loans | Cut-off Date Principal Balance | % of IPB | Mortgage Rate | Remaining Loan Term | UW
NCF DSCR(1)(2) | UW
NOI
Debt Yield(1) | Cut-off
Date LTV(1)(3) | Maturity Date/ARD LTV(1)(3) |
| Interest Only | 39 | $961,839,388 | 97.0 | % | 6.52421% | 59 | 1.68x | 11.5% | 58.7% | 58.7% |
| Amortizing Balloon | 1 | $30,000,000 | 3.0 | | 8.40500% | 60 | 1.68x | 16.6% | 39.9% | 38.3% |
| Total / Weighted Average: | 40 | $991,839,388 | 100.0 | % | 6.58110% | 59 | 1.68x | 11.6% | 58.1% | 58.1% |
| Underwritten Net Cash Flow Debt Service Coverage Ratios(1)(2) |
| | | | | Weighted Average |
| Range of Underwritten Net Cash Flow Debt Service Coverage Ratios | Number of Loans | Cut-off Date Principal Balance | % of IPB | Mortgage Rate | Remaining Loan Term | UW
NCF DSCR(1)(2) | UW
NOI
Debt Yield(1) | Cut-off
Date LTV(1)(3) | Maturity Date/ARD LTV(1)(3) |
| 1.20x | - | 1.49x | 22 | $448,225,000 | 45.2 | % | 6.73367% | 60 | 1.31x | 9.2% | 64.7% | 64.7% |
| 1.50x | - | 1.59x | 4 | 101,000,000 | 10.2 | | 7.14084% | 58 | 1.51x | 11.4% | 54.8% | 54.8% |
| 1.60x | - | 1.99x | 7 | 265,620,000 | 26.8 | | 6.58587% | 60 | 1.80x | 12.6% | 56.6% | 56.4% |
| 2.00x | - | 2.99x | 6 | 161,994,388 | 16.3 | | 5.89924% | 59 | 2.37x | 15.4% | 46.7% | 46.7% |
| 3.00x | - | 4.17x | 1 | 15,000,000 | 1.5 | | 5.53252% | 59 | 4.17x | 26.7% | 32.1% | 32.1% |
| Total / Weighted Average: | 40 | $991,839,388 | 100.0 | % | 6.58110% | 59 | 1.68x | 11.6% | 58.1% | 58.1% |
| (1) | In the case of Loan Nos. 1, 3, 4, 5, 7, 8, 11, 14, 16, 18, 23, 28, 30, 33 and 36, the UW NCF DSCR, UW NOI Debt Yield, Cut-off Date LTV and Maturity Date/ARD LTV calculations include the related Pari Passu Companion Loan(s). In the case of Loan Nos. 3 and 23, the UW NCF DSCR, UW NOI Debt Yield, Cut-off Date LTV and Maturity Date/ARD LTV calculations exclude the related subordinate companion loan(s). |
| (2) | For the mortgage loans that are interest-only for the entire term or until the anticipated repayment date and accrue interest on an Actual/360 basis, the Monthly Debt Service Amount ($) was calculated as 1/12th of the product of (i) the Original Balance ($), (ii) the Interest Rate % and (iii) 365/360. |
| (3) | In the case of Loan Nos. 4, 14 and 23, the Cut-off Date LTV and Maturity/ARD LTV are calculated by using an appraised value based on an “as is portfolio” assumption. In the case of each of Loan No. 16, the Cut-off Date LTV and Maturity/ARD LTV are calculated by using an appraised value based on an “prospective market value upon stabilization” assumption. Refer to the definition of “Appraised Value” under “Description of the Mortgage Pool—Certain Calculations and Definitions” in the Preliminary Prospectus for additional details. |
THE INFORMATION IN THIS STRUCTURAL AND COLLATERAL TERM SHEET IS NOT COMPLETE AND MAY BE AMENDED PRIOR TO THE TIME OF SALE. THIS TERM SHEET IS NOT AN OFFER TO SELL THESE SECURITIES AND IT IS NOT A SOLICITATION OF AN OFFER TO BUY THESE SECURITIES IN ANY JURISDICTION WHERE THE OFFER OR SALE IS NOT PERMITTED. |
| | 16 | |
| Structural and Collateral Term Sheet | | BMO 2024-5C8 |
| Collateral Characteristics |
| LTV Ratios as of the Cut-off Date(1)(3) |
| | | | | Weighted Average |
Range of
Cut-off Date LTVs | Number of Loans | Cut-off Date Principal Balance | % of IPB | Mortgage Rate | Remaining Loan Term | UW
NCF DSCR(1)(2) | UW
NOI
Debt Yield(1) | Cut-off
Date LTV(1)(3) | Maturity Date/ARD LTV(1)(3) |
| 32.1% | - | 49.9% | 7 | $230,000,000 | 23.2 | % | 5.92328% | 59 | 2.12x | 13.7% | 41.7% | 41.4% |
| 50.0% | - | 59.9% | 8 | 212,970,000 | 21.5 | | 7.39991% | 59 | 1.71x | 13.6% | 52.7% | 52.7% |
| 60.0% | - | 64.9% | 9 | 150,085,000 | 15.1 | | 7.00735% | 59 | 1.61x | 11.9% | 62.6% | 62.6% |
| 65.0% | - | 71.4% | 16 | 398,784,388 | 40.2 | | 6.36280% | 60 | 1.43x | 9.2% | 68.8% | 68.8% |
| Total / Weighted Average: | 40 | $991,839,388 | 100.0 | % | 6.58110% | 59 | 1.68x | 11.6% | 58.1% | 58.1% |
| LTV Ratios as of the Maturity Date(1)(3) |
| | | | | Weighted Average |
Range of
Maturity Date LTVs | Number of Loans | Cut-off Date Principal Balance | % of IPB | Mortgage Rate | Remaining Loan Term | UW
NCF DSCR(1)(2) | UW
NOI
Debt Yield(1) | Cut-off
Date LTV(1)(3) | Maturity Date/ARD LTV(1)(3) |
| 32.1% | - | 49.9% | 7 | $230,000,000 | 23.2 | % | 5.92328% | 59 | 2.12x | 13.7% | 41.7% | 41.4% |
| 50.0% | - | 59.9% | 8 | 212,970,000 | 21.5 | | 7.39991% | 59 | 1.71x | 13.6% | 52.7% | 52.7% |
| 60.0% | - | 64.9% | 9 | 150,085,000 | 15.1 | | 7.00735% | 59 | 1.61x | 11.9% | 62.6% | 62.6% |
| 65.0% | - | 71.4% | 16 | 398,784,388 | 40.2 | | 6.36280% | 60 | 1.43x | 9.2% | 68.8% | 68.8% |
| Total / Weighted Average: | 40 | $991,839,388 | 100.0 | % | 6.58110% | 59 | 1.68x | 11.6% | 58.1% | 58.1% |
| | | | | Weighted Average |
| Prepayment Protection | Number of Loans | Cut-off Date Principal Balance | % of IPB | Mortgage Rate | Remaining Loan Term | UW
NCF DSCR(1)(2) | UW
NOI
Debt Yield(1) | Cut-off
Date LTV(1)(3) | Maturity Date/ARD LTV(1)(3) |
| Defeasance | 27 | $591,220,000 | 59.6 | % | 6.88208% | 60 | 1.50x | 11.0% | 62.6% | 62.6% |
| Defeasance or Yield Maintenance | 9 | 320,099,388 | 32.3 | | 5.85077% | 59 | 2.04x | 12.6% | 52.3% | 52.3% |
| Yield Maintenance | 4 | 80,520,000 | 8.1 | | 7.27452% | 60 | 1.56x | 12.5% | 48.1% | 47.5% |
| Total / Weighted Average: | 40 | $991,839,388 | 100.0 | % | 6.58110% | 59 | 1.68x | 11.6% | 58.1% | 58.1% |
| | | | | Weighted Average |
| Loan Purpose | Number of Loans | Cut-off Date Principal Balance | % of IPB | Mortgage Rate | Remaining Loan Term | UW
NCF DSCR(1)(2) | UW
NOI
Debt Yield(1) | Cut-off
Date LTV(1)(3) | Maturity Date/ARD LTV(1)(3) |
| Refinance | 35 | $850,860,000 | 85.8 | % | 6.65965% | 59 | 1.61x | 11.3% | 57.5% | 57.5% |
| Recapitalization | 3 | 93,689,388 | 9.4 | | 5.53808% | 59 | 1.97x | 11.1% | 65.6% | 65.6% |
| Acquisition | 2 | 47,290,000 | 4.8 | | 7.23425% | 60 | 2.24x | 17.7% | 53.8% | 53.8% |
| Total / Weighted Average: | 40 | $991,839,388 | 100.0 | % | 6.58110% | 59 | 1.68x | 11.6% | 58.1% | 58.1% |
| (1) | In the case of Loan Nos. 1, 3, 4, 5, 7, 8, 11, 14, 16, 18, 23, 28, 30, 33 and 36, the UW NCF DSCR, UW NOI Debt Yield, Cut-off Date LTV and Maturity Date/ARD LTV calculations include the related Pari Passu Companion Loan(s). In the case of Loan Nos. 3 and 23, the UW NCF DSCR, UW NOI Debt Yield, Cut-off Date LTV and Maturity Date/ARD LTV calculations exclude the related subordinate companion loan(s). |
| (2) | For the mortgage loans that are interest-only for the entire term or until the anticipated repayment date and accrue interest on an Actual/360 basis, the Monthly Debt Service Amount ($) was calculated as 1/12th of the product of (i) the Original Balance ($), (ii) the Interest Rate % and (iii) 365/360. |
| (3) | In the case of Loan Nos. 4, 14 and 23, the Cut-off Date LTV and Maturity/ARD LTV are calculated by using an appraised value based on an “as is portfolio” assumption. In the case of each of Loan No. 16, the Cut-off Date LTV and Maturity/ARD LTV are calculated by using an appraised value based on an “prospective market value upon stabilization” assumption. Refer to the definition of “Appraised Value” under “Description of the Mortgage Pool—Certain Calculations and Definitions” in the Preliminary Prospectus for additional details. |
THE INFORMATION IN THIS STRUCTURAL AND COLLATERAL TERM SHEET IS NOT COMPLETE AND MAY BE AMENDED PRIOR TO THE TIME OF SALE. THIS TERM SHEET IS NOT AN OFFER TO SELL THESE SECURITIES AND IT IS NOT A SOLICITATION OF AN OFFER TO BUY THESE SECURITIES IN ANY JURISDICTION WHERE THE OFFER OR SALE IS NOT PERMITTED. |
| | 17 | |
| Structural and Collateral Term Sheet | | BMO 2024-5C8 |
| Collateral Characteristics |
| Previous Securitization History(1) |
| No. | Mortgage Loan Seller | Loan/Property Name | Location | Property Type | Cut-off Date Principal Balance | % of IPB | Previous Securitization |
| 5 | BMO, GACC, GSMC | Colony Square | Atlanta, GA | Mixed Use | $60,000,000 | 6.0% | BXMT 2020-FL2, BXMT 2020-FL3 and BXMT 2021-FL4 |
| 10 | GACC | The Wymore 360 | Altamonte Springs, FL | Multifamily | $33,000,000 | 3.3% | FHMS Q021, ARBOR 2022-Q021 |
| 18.01 | SMC, BMO | 280 & 290 Merrimack Street | Lawrence, MA | Mixed Use | $13,550,000 | 1.4% | UBSCM 2018-C14, CGCMT 2018-C6 |
| 18.02 | SMC, BMO | 350 Merrimack Street | Lawrence, MA | Office | $6,450,000 | 0.7% | UBSCM 2018-C14, CGCMT 2018-C6 |
| 21 | SMC | Houma Shopping Center | Houma, LA | Retail | $17,000,000 | 1.7% | DBGS 2018-C1 |
| 23.01 | GSMC | Rogers (Bentonville) Embassy Suites | Rogers, AR | Hospitality | $1,473,350 | 0.1% | AHPT 2018-ATRM |
| 23.02 | GSMC | Frisco Embassy Suites | Frisco, TX | Hospitality | $1,128,244 | 0.1% | AHPT 2018-ATRM |
| 23.04 | GSMC | San Marcos Embassy Suites | San Marcos, TX | Hospitality | $925,523 | 0.1% | AHPT 2018-ATRM |
| 23.05 | GSMC | Loveland Embassy Suites | Loveland, CO | Hospitality | $922,964 | 0.1% | AHPT 2018-ATRM |
| 23.06 | GSMC | Albuquerque Embassy Suites | Albuquerque, NM | Hospitality | $834,883 | 0.1% | AHPT 2018-ATRM |
| 23.07 | GSMC | Branson Chateau Hotel | Branson, MO | Hospitality | $758,695 | 0.1% | WFCM 2015-C26 |
| 23.08 | GSMC | Lincoln Embassy Suites | Lincoln, NE | Hospitality | $727,036 | 0.1% | AHPT 2018-ATRM |
| 23.09 | GSMC | Richardson Renaissance | Richardson, TX | Hospitality | $699,594 | 0.1% | AHPT 2018-ATRM |
| 23.10 | GSMC | Charleston Embassy Suites | Charleston, WV | Hospitality | $687,640 | 0.1% | JPMCC 2016-JP3 |
| 23.11 | GSMC | Nashville South Embassy Suites | Franklin, TN | Hospitality | $669,289 | 0.1% | AHPT 2018-ATRM |
| 23.12 | GSMC | La Vista Embassy Suites | La Vista, NE | Hospitality | $658,264 | 0.1% | AHPT 2018-ATRM |
| 23.13 | GSMC | St. Charles Embassy Suites | Saint Charles, MO | Hospitality | $550,355 | 0.1% | AHPT 2018-ATRM |
| 23.14 | GSMC | Hot Springs Embassy Suites | Hot Springs, AR | Hospitality | $497,376 | 0.1% | AHPT 2018-ATRM |
| 23.15 | GSMC | East Peoria Embassy Suites | East Peoria, IL | Hospitality | $459,137 | 0.0% | AHPT 2018-ATRM |
| 23.18 | GSMC | Normal Marriott Hotel | Normal, IL | Hospitality | $412,142 | 0.0% | AHPT 2018-ATRM |
| 23.19 | GSMC | Oklahoma City Courtyard by Marriott | Oklahoma City, OK | Hospitality | $350,102 | 0.0% | AHPT 2018-ATRM |
| 23.20 | GSMC | North Charleston Residence Inn | North Charleston, SC | Hospitality | $329,604 | 0.0% | AHPT 2018-ATRM |
| 23.21 | GSMC | Oklahoma City Residence Inn | Oklahoma City, OK | Hospitality | $306,381 | 0.0% | AHPT 2018-ATRM |
| 23.22 | GSMC | La Vista Courtyard by Marriott | La Vista, NE | Hospitality | $275,787 | 0.0% | AHPT 2018-ATRM |
| (1) | The table above represents the properties for which the previously existing debt was most recently securitized, based on information provided by the related borrower or obtained through searches of a third-party database. |
THE INFORMATION IN THIS STRUCTURAL AND COLLATERAL TERM SHEET IS NOT COMPLETE AND MAY BE AMENDED PRIOR TO THE TIME OF SALE. THIS TERM SHEET IS NOT AN OFFER TO SELL THESE SECURITIES AND IT IS NOT A SOLICITATION OF AN OFFER TO BUY THESE SECURITIES IN ANY JURISDICTION WHERE THE OFFER OR SALE IS NOT PERMITTED. |
| | 18 | |
| Structural and Collateral Term Sheet | | BMO 2024-5C8 |
| Collateral Characteristics |
| Previous Securitization History(1) (Continued) |
| No. | Mortgage Loan Seller | Loan/Property Name | Location | Property Type | Cut-off Date Principal Balance | % of IPB | Previous Securitization |
| 23.23 | GSMC | Springfield Residence Inn | Springfield, MO | Hospitality | $229,492 | 0.0% | AHPT 2018-ATRM |
| 23.24 | GSMC | Fort Smith Courtyard by Marriott | Fort Smith, AR | Hospitality | $171,320 | 0.0% | AHPT 2018-ATRM |
| 24 | GACC | Edgewood Plaza | Palo Alto, CA | Retail | $14,000,000 | 1.4% | COMM 2015-CR22 |
| 36 | BMO | Northbridge Centre | West Palm Beach, FL | Office | $5,000,000 | 0.5% | BXMT 2020-FL3 |
| 39 | SMC | Walgreens Savannah | Savannah, GA | Retail | $3,750,000 | 0.4% | WFRBS 2014-C25 |
| (1) | The table above represents the properties for which the previously existing debt was most recently securitized, based on information provided by the related borrower or obtained through searches of a third-party database. |
THE INFORMATION IN THIS STRUCTURAL AND COLLATERAL TERM SHEET IS NOT COMPLETE AND MAY BE AMENDED PRIOR TO THE TIME OF SALE. THIS TERM SHEET IS NOT AN OFFER TO SELL THESE SECURITIES AND IT IS NOT A SOLICITATION OF AN OFFER TO BUY THESE SECURITIES IN ANY JURISDICTION WHERE THE OFFER OR SALE IS NOT PERMITTED. |
| | 19 | |
| Structural and Collateral Term Sheet | | BMO 2024-5C8 |
| Structural Overview |
| ■ Certificates: | | The “Certificates” will consist of the Class A-1, Class A-2, Class A-3, Class X-A, Class X-B, Class X-D, Class A-S, Class B, Class C, Class D, Class E-RR, Class F-RR, Class G-RR, Class J-RR and Class R certificates. The Certificates other than the Class R Certificates are referred to as the “Regular Certificates”. The Class A-1, Class A-2, Class A-3, Class A-S, Class B, Class C, Class D, Class E-RR, Class F-RR, Class G-RR and Class J-RR certificates are collectively referred to as the “Principal Balance Certificates” The Class X-A, Class X-B and Class X-D certificates are collectively referred to as the “Class X Certificates”. |
| ■ Accrual: | | Each Class of Regular Certificates will accrue interest on a 30/360 basis. The Class R Certificates will not accrue interest. |
| ■ Distributions: | | The aggregate amount available for distribution to holders of the Certificates on each distribution date will be: (i) the gross amount of interest, principal, yield maintenance charges and prepayment premiums collected with respect to the mortgage loans in the applicable one-month collection period, net of specified expenses of the issuing entity, including fees payable therefrom to, and losses, liabilities, advances (with interest thereon), costs and expenses reimbursable or indemnifiable therefrom to, the master servicer, the special servicer, the certificate administrator, the trustee, the operating advisor, the asset representations reviewer and CREFC®. On each Distribution Date, funds available for distribution to holders of the Certificates (exclusive of any portion thereof that represents (i) any yield maintenance charges and prepayment premiums collected on the mortgage loans and/or (ii) any excess interest accrued after the related anticipated repayment date on any mortgage loan with an anticipated repayment date) (“Available Funds”) will be distributed in the following amounts and order of priority (in each case to the extent of remaining available funds): 1. Class A-1, Class A-2, Class A-3, Class X-A, Class X-B and Class X-D certificates: to interest on the Class A-1, Class A-2, Class A-3, Class X-A, Class X-B and Class X-D certificates, up to, and pro rata in accordance with, their respective interest entitlements. 2. Class A-1, Class A-2 and Class A-3 certificates: to the extent of Available Funds allocable to principal received or advanced on the mortgage loans, (i) to principal on the Class A-1 certificates until their certificate balance is reduced to zero, then (ii) to principal on the Class A-2 certificates until their certificate balance is reduced to zero, all funds available for distribution of principal remaining after the distributions to the Class A-1 certificates in clause (i) above, then (iii) to principal on the Class A-3 certificates until their certificate balance is reduced to zero, all funds available for distribution of principal remaining after the distributions to the Class A-2 certificates in clause (ii) above. However, if the certificate balances of each and every class of the Class A-S, Class B, Class C, Class D, Class E-RR, Class F-RR, Class G-RR and Class J-RR certificates have been reduced to zero as a result of the allocation of mortgage loan losses and other unanticipated expenses to those certificates, then Available Funds allocable to principal will be distributed to the Class A-1, Class A-2 and Class A-3 certificates, pro rata, based on their respective certificate balances. 3. Class A-1, Class A-2 and Class A-3 certificates: to reimburse the Class A-1, Class A-2 and Class A-3 certificates, pro rata, for any unreimbursed losses on the mortgage loans that were previously allocated to reduce the certificate balances of those classes, together with interest at their respective pass-through rates. 4. Class A-S certificates: (i) first, to interest on the Class A-S certificates in the amount of their interest entitlement; (ii) next, to the extent of Available Funds allocable to principal remaining after distributions in respect of principal to each class of Principal Balance Certificates with a higher principal payment priority (in this case, the Class A-1, Class A-2 and Class A-3 certificates), to principal on the Class A-S certificates until their certificate balance is reduced to zero; and (iii) next, to reimburse the Class A-S certificates for any unreimbursed losses on the mortgage loans that were previously allocated to reduce the certificate balance of that class, together with interest at its pass-through rate. 5. Class B certificates: (i) first, to interest on the Class B certificates in the amount of their interest entitlement; (ii) next, to the extent of Available Funds allocable to principal remaining after distributions in respect of principal to each class of Principal Balance Certificates with a higher principal payment priority (in this case, the Class A-1, Class A-2, Class A-3 and Class A-S certificates), to principal on the Class B certificates until their certificate balance is reduced to zero; and (iii) next, to reimburse Class B certificates for any unreimbursed losses on the mortgage loans that were previously allocated to reduce the certificate balance of that class, together with interest at its pass-through rate. 6. Class C certificates: (i) first, to interest on the Class C certificates in the amount of their interest entitlement; (ii) next, to the extent of Available Funds allocable to principal remaining after distributions in respect of principal to each class of Principal Balance Certificates with a higher |
THE INFORMATION IN THIS STRUCTURAL AND COLLATERAL TERM SHEET IS NOT COMPLETE AND MAY BE AMENDED PRIOR TO THE TIME OF SALE. THIS TERM SHEET IS NOT AN OFFER TO SELL THESE SECURITIES AND IT IS NOT A SOLICITATION OF AN OFFER TO BUY THESE SECURITIES IN ANY JURISDICTION WHERE THE OFFER OR SALE IS NOT PERMITTED. |
| | 20 | |
| Structural and Collateral Term Sheet | | BMO 2024-5C8 |
| Structural Overview |
| | principal payment priority (in this case, the Class A-1, Class A-2, Class A-3, Class A-S and Class B certificates), to principal on the Class C certificates until their certificate balance is reduced to zero; and (iii) next, to reimburse the Class C certificates for any unreimbursed losses on the mortgage loans that were previously allocated to reduce the certificate balance of that class, together with interest at its pass-through rate. 7. After the Class A-1, Class A-2, Class A-3, Class X-A, Class X-B, Class X-D, Class A-S, Class B and Class C certificates are paid all amounts to which they are entitled on such Distribution Date, the remaining Available Funds will be used to pay interest to the Class D, Class E-RR, Class F-RR, Class G-RR and Class J-RR certificates, and to pay principal to, and to reimburse (with interest) any unreimbursed losses to, the Class D, Class E-RR, Class F-RR, Class G-RR and Class J-RR certificates, sequentially in order, and with respect to each such class of Principal Balance Certificates, in a manner analogous to the Class C certificates pursuant to clause 6 above. |
■ Realized Losses: | | The certificate balances of the Principal Balance Certificates will each be reduced without distribution on any Distribution Date as a write-off to the extent of any loss realized on the mortgage loans allocated to the related class on such Distribution Date. On each Distribution Date, any such losses will be applied to the respective classes of Principal Balance Certificates in the following order, in each case until the related certificate balance is reduced to zero: first to the Class J-RR certificates; second, to the Class G-RR certificates; third, to the Class F-RR certificates; fourth, to the Class E-RR certificates; fifth, to the Class D certificates; sixth, to the Class C certificates; seventh, to the Class B certificates; eighth, to the Class A-S certificates; and, finally pro rata, to the Class A-1, Class A-2 and Class A-3 certificates, based on their then current respective certificate balances. The notional amount of each class of Class X Certificates will be reduced to reflect reductions in the certificate balance(s) of the class (or classes, as applicable) of Corresponding Principal Balance Certificates as a result of allocations of losses realized on the mortgage loans to such class(es) of Principal Balance Certificates. |
| ■ Prepayment Premiums and Yield Maintenance Charges: | | On each Distribution Date, until the notional amounts of the Class X-A, Class X-B and Class X-D certificates and the certificate balances of the Class A-1, Class A-2, Class A-3, Class A-S, Class B, Class C, Class D and Class E-RR certificates have been reduced to zero, each yield maintenance charge collected on the mortgage loans during the related one-month collection period (or, in the case of an outside serviced mortgage loan, that accompanied a principal prepayment included in the aggregate available funds for such Distribution Date) is required to be distributed to holders of the Regular Certificates (excluding holders of the Class F-RR, Class G-RR and Class J-RR certificates) as follows: (a) first such yield maintenance charge will be allocated between (i) the group (the “YM Group A”) comprised of the Class A-1, Class A-2, Class A-3 and Class X-A certificates, (ii) the group (the “YM Group A-S/B/C”) comprised of the Class A-S, Class B, Class C and Class X-B certificates, (iii) the group (the “YM Group D”) comprised of the Class X-D and Class D certificates, and (iv) the group (the “YM Group E”, and the YM Group A, the YM Group A-S/B/C, the YM Group D and the YM Group E, together, the “YM Groups”) comprised of the Class E-RR certificates, pro rata, based upon the aggregate amount of principal distributed to the class or classes of Principal Balance Certificates in each YM Group on such Distribution Date, and (b) then the portion of such yield maintenance charge allocated to each YM Group will be further allocated as among the classes of Regular Certificates in such YM Group, in the following manner: (i) each class of Principal Balance Certificates in such YM Group will entitle the applicable certificateholders to receive on the applicable Distribution Date that portion of such yield maintenance charge equal to the product of (X) a fraction whose numerator is the amount of principal distributed to such class of Principal Balance Certificates on such Distribution Date and whose denominator is the total amount of principal distributed to all of the Principal Balance Certificates in that YM Group on such Distribution Date, (Y) except in the case of any YM Group comprised solely of one or more classes of Principal Balance Certificates, the Base Interest Fraction (as defined in the Preliminary Prospectus) for the related principal prepayment and such class of Principal Balance Certificates, and (Z) the portion of such yield maintenance charge allocated to such YM Group, and (ii) the portion of such yield maintenance charge allocated to such YM Group and remaining after such distributions with respect to the Principal Balance Certificates in such YM Group will be distributed to the class of Class X Certificates (if any) in such YM Group. If there is more than one class of Principal Balance Certificates in any YM Group entitled to distributions of principal on any particular Distribution Date on which yield maintenance charges are distributable to such classes, the aggregate portion of such yield maintenance charges allocated to such YM Group will be allocated among all such classes of Principal Balance Certificates up to, and on a pro rata basis in accordance with, their respective entitlements in those yield maintenance charges in accordance with the prior sentence of this paragraph. If a prepayment premium (calculated as a percentage of the amount prepaid) is imposed in connection with a prepayment rather than a yield maintenance charge, then the prepayment premium so collected will be allocated as described above. For this purpose, the discount rate used to calculate the Base Interest Fraction will be the discount rate used to determine the yield maintenance charge for mortgage loans that require payment at the greater of a yield maintenance charge or a minimum |
THE INFORMATION IN THIS STRUCTURAL AND COLLATERAL TERM SHEET IS NOT COMPLETE AND MAY BE AMENDED PRIOR TO THE TIME OF SALE. THIS TERM SHEET IS NOT AN OFFER TO SELL THESE SECURITIES AND IT IS NOT A SOLICITATION OF AN OFFER TO BUY THESE SECURITIES IN ANY JURISDICTION WHERE THE OFFER OR SALE IS NOT PERMITTED. |
| | 21 | |
| Structural and Collateral Term Sheet | | BMO 2024-5C8 |
| Structural Overview |
| amount equal to a fixed percentage of the principal balance of the mortgage loan or, for mortgage loans that only have a prepayment premium based on a fixed percentage of the principal balance of the mortgage loan, such other discount rate as may be specified in the related loan documents. After the notional amounts of the Class X-A, Class X-B and Class X-D certificates and the certificate balances of the Class A-1, Class A-2, Class A-3, Class A-S, Class B, Class C, Class D and Class E-RR certificates have been reduced to zero, all prepayment premiums and yield maintenance charges with respect to the mortgage loans will be allocated among the holders of the Class F-RR, Class G-RR and Class J-RR certificates as provided in the BMO 2024-5C8 pooling and servicing agreement. No yield maintenance charges or prepayment premiums will be distributed to the holders of the Class R certificates. For a description of prepayment premiums and yield maintenance charges required on the mortgage loans, see Annex A to the Preliminary Prospectus. See also “Certain Legal Aspects of the Mortgage Loans—Default Interest and Limitations on Prepayments” in the Preliminary Prospectus. |
| ■ Advances: | The master servicer and, if it fails to do so, the trustee, will be obligated to make P&I advances with respect to each mortgage loan in the issuing entity and, with respect to all of the mortgage loans serviced under the BMO 2024-5C8 pooling and servicing agreement, servicing advances, including paying delinquent property taxes, condominium assessments, insurance premiums and ground lease rents, but only to the extent that those advances are not deemed non-recoverable from collections on the related mortgage loan and, in the case of servicing advances, any related companion loans as described below. P&I advances are subject to reduction in connection with any appraisal reductions that may occur. The special servicer will have no obligation to make any advances, provided that, in an urgent or emergency situation requiring the making of a property protection advance, the special servicer may, in its sole discretion, make a property protection advance and will be entitled to reimbursement from the master servicer for such advance. The master servicer, the special servicer and the trustee will each be entitled to receive interest on advances they make at the prime rate (and, solely in the case of the master servicer, subject to a floor of 2.0% per annum), compounded annually. |
■ Serviced Mortgage Loans/Outside Serviced Mortgage Loans: | One or more whole loans may each constitute an “outside serviced whole loan”, in which case (as identified under “Collateral Characteristics—Pari Passu Companion Loan Summary” above), the BMO 2024-5C8 pooling and servicing agreement is not the Controlling Pooling/Trust & Servicing Agreement (the “Controlling Servicing Agreement”), and each related mortgage loan constitutes an “outside serviced mortgage loan,” each related companion loan constitutes an “outside serviced companion loan,” and each related Controlling Servicing Agreement constitutes an “outside servicing agreement.” One or more whole loans may be identified in the Preliminary Prospectus as a “servicing shift whole loan”, in which case the related mortgage loan constitutes a “servicing shift mortgage loan” and each related companion loan constitutes a “servicing shift companion loan”. Any servicing shift whole loan will initially be serviced pursuant to the BMO 2024-5C8 pooling and servicing agreement during which time such mortgage loan, such whole loan and each related companion loan will be a serviced mortgage loan, a serviced whole loan and a serviced companion loan (each as defined below), respectively. However, upon the inclusion of the related controlling pari passu companion loan in a future securitization transaction, the servicing of such mortgage loan will shift to the servicing agreement governing such securitization transaction, and such mortgage loan, such whole loan and each related companion loan will be an outside serviced mortgage loan, an outside serviced whole loan and an outside serviced companion loan, respectively. All of the mortgage loans transferred to the issuing entity (other than any outside serviced mortgage loan) are sometimes referred to in this Term Sheet as the “serviced mortgage loans” and, together with any related companion loans, as the “serviced loans” (which signifies that they are being serviced by the master servicer and the special servicer under the BMO 2024-5C8 pooling and servicing agreement); each related whole loan constitutes a “serviced whole loan”; and each related companion loan constitutes a “serviced companion loan.” See “Description of the Mortgage Pool—The Whole Loans” in the Preliminary Prospectus. |
| ■ Appraisal Reduction Amounts: | An Appraisal Reduction Amount generally will be created with respect to a required appraisal loan (which is a serviced loan as to which certain defaults, modifications or insolvency events have occurred (as further described in the Preliminary Prospectus)) in the amount, if any, by which the principal balance of such required appraisal loan, plus other amounts overdue or advanced in connection with such required appraisal loan, exceeds 90% of the appraised value of the related mortgaged property (subject to certain downward adjustments permitted under the BMO 2024-5C8 pooling and servicing agreement) plus certain escrows and reserves (including letters of credit) held with respect to such required appraisal loan; provided that, if so provided in the related co-lender agreement, the holder of a subordinate companion loan may be permitted to post cash or a letter of credit to offset some or all of an Appraisal Reduction Amount. In the case of an outside serviced mortgage loan, any Appraisal Reduction Amounts will be calculated pursuant to, and by a party to, the related outside servicing agreement. In general, any Appraisal Reduction Amount calculated with respect to a whole loan will be allocated first, to any related subordinate companion loan(s) (up to the outstanding principal balance(s) thereof), and then, to the related mortgage loan and any related pari passu companion loan(s) on a pro rata basis in accordance with their respective outstanding principal |
THE INFORMATION IN THIS STRUCTURAL AND COLLATERAL TERM SHEET IS NOT COMPLETE AND MAY BE AMENDED PRIOR TO THE TIME OF SALE. THIS TERM SHEET IS NOT AN OFFER TO SELL THESE SECURITIES AND IT IS NOT A SOLICITATION OF AN OFFER TO BUY THESE SECURITIES IN ANY JURISDICTION WHERE THE OFFER OR SALE IS NOT PERMITTED. |
| | 22 | |
| Structural and Collateral Term Sheet | | BMO 2024-5C8 |
| Structural Overview |
| | balances. As a result of an Appraisal Reduction Amount being calculated for and/or allocated to a given mortgage loan, the interest portion of any P&I advance for such mortgage loan will be reduced, which will have the effect of reducing the amount of interest available to the most subordinate class(es) of Certificates then outstanding (i.e., first, to the Class J-RR certificates, then, to the Class G-RR certificates, then, to the Class F-RR certificates, then, to the Class E-RR certificates, then, to the Class D certificates, then, to the Class C certificates, then, to the Class B certificates, then, to the Class A-S certificates, and then, pro rata based on interest entitlements, to the Class A-1, Class A-2, Class A-3, Class X-A, Class X-B and Class X-D certificates). In general, a serviced loan will cease to be a required appraisal loan, and no longer be subject to an Appraisal Reduction Amount, when the same has ceased to be a specially serviced loan (if applicable), has been brought current for at least three consecutive months and no other circumstances exist that would cause such serviced loan to be a required appraisal loan. For various purposes under the BMO 2024-5C8 pooling and servicing agreement (including, with respect to the Principal Balance Certificates, for purposes of determining the Non-Reduced Certificates and the Controlling Class, as well as the occurrence of a Control Termination Event and an Operating Advisor Consultation Trigger Event), any Appraisal Reduction Amounts in respect of or allocated to the mortgage loans will be allocated to notionally reduce the certificate balances of the Principal Balance Certificates as follows: first, to the Class J-RR, Class G-RR, Class F-RR, Class E-RR, Class D, Class C, Class B and Class A-S certificates, in that order, in each case until the related certificate balance is notionally reduced to zero; and then to the Class A-1, Class A-2 and Class A-3 certificates, pro rata based on certificate balance. |
■ Cumulative Appraisal Reduction Amounts: | | A “Cumulative Appraisal Reduction Amount”, as calculated as of any date of determination by the special servicer with respect to any mortgage loan, is equal to the sum of (i) all Appraisal Reduction Amounts then in effect, and (ii) with respect to any AB Modified Loans, any Collateral Deficiency Amount then in effect. With respect to any class of certificates, references to any Cumulative Appraisal Reduction Amount allocable thereto mean the aggregate portion of any Appraisal Reduction Amounts and/or Collateral Deficiency Amounts comprising such Cumulative Appraisal Reduction Amount that are allocable to such class under the Pooling and Servicing Agreement. “Collateral Deficiency Amount” means, with respect to any AB Modified Loan as of any date of determination, the excess of (i) the stated principal balance of such AB Modified Loan (taking into account the related junior note(s) included therein), over (ii) the sum of (in the case of a whole loan, solely to the extent allocable to the subject mortgage loan) (x) the most recent appraised value for the related mortgaged property or mortgaged properties, plus (y) solely to the extent not reflected or taken into account in such appraised value and to the extent on deposit with, or otherwise under the control of, the lender as of the date of such determination, any capital or additional collateral contributed by the related borrower at the time the mortgage loan became (and as part of the modification related to) such AB Modified Loan for the benefit of the related mortgaged property or mortgaged properties (provided, that in the case of an outside serviced mortgage loan, the amounts set forth in this clause (y) will be taken into account solely to the extent relevant information is received), plus (z) any other escrows or reserves (in addition to any amounts set forth in the immediately preceding clause (y)) held by the lender in respect of such AB Modified Loan as of the date of such determination. For purposes of determining the identity of the Controlling Class and the existence of a Control Termination Event and an Operating Advisor Consultation Trigger Event, Collateral Deficiency Amounts will be allocable to the respective classes of Control Eligible Certificates (as defined below), in reverse alphabetical order of class designation, in a manner similar to the allocation of Appraisal Reduction Amounts to such classes. “AB Modified Loan” means any corrected mortgage loan (1) that became a corrected mortgage loan (which includes for purposes of this definition any outside serviced mortgage loan that became a “corrected” mortgage loan (or any term substantially similar thereto) pursuant to the related outside servicing agreement) due to a modification thereto that resulted in the creation of an A/B note structure (or similar structure) and as to which the new junior note(s) did not previously exist or the principal amount of the new junior note(s) was previously part of either an A note held by the trust or the original unmodified mortgage loan and (2) as to which an Appraisal Reduction Amount is not in effect. |
| ■ Age of Appraisals: | | Appraisals (which can be an update of a prior appraisal) with respect to a serviced loan are required to be no older than 9 months for purposes of determining appraisal reductions (other than the annual re-appraisal), market value, and other calculations as described in the Preliminary Prospectus. |
| ■ Sale of Defaulted Loans: | | There will be no “Fair Market Value Purchase Option”. Instead, defaulted mortgage loans will be sold in a process similar to the sale process for REO property. With respect to an outside serviced whole loan, the party acting as special servicer with respect to such outside serviced whole loan pursuant to the related outside servicing agreement (the “outside special servicer”) may offer to sell to any person (or may offer to purchase) for cash such outside serviced whole loan in accordance with the terms of the related outside servicing agreement during such time as such outside serviced whole loan constitutes a defaulted mortgage loan qualifying for sale thereunder and, in connection with any such sale, the related outside special servicer is required to sell both the applicable outside serviced mortgage loan and the related outside serviced pari passu companion loan(s) and, if so provided in |
THE INFORMATION IN THIS STRUCTURAL AND COLLATERAL TERM SHEET IS NOT COMPLETE AND MAY BE AMENDED PRIOR TO THE TIME OF SALE. THIS TERM SHEET IS NOT AN OFFER TO SELL THESE SECURITIES AND IT IS NOT A SOLICITATION OF AN OFFER TO BUY THESE SECURITIES IN ANY JURISDICTION WHERE THE OFFER OR SALE IS NOT PERMITTED. |
| | 23 | |
| Structural and Collateral Term Sheet | | BMO 2024-5C8 |
| Structural Overview |
| | the related co-lender agreement or the Controlling Servicing Agreement, any related subordinate companion loan(s), together as one defaulted loan. |
| ■ Directing Holder: | | The “Directing Holder” with respect to any mortgage loan or whole loan serviced under the BMO 2024-5C8 pooling and servicing agreement will be: ● except (i) with respect to an excluded mortgage loan, (ii) with respect to a serviced whole loan as to which the Controlling Note is held outside the issuing entity (sometimes referred to in this Term Sheet as a “serviced outside controlled whole loan”), and (iii) during any period that a Control Termination Event has occurred and is continuing, the Controlling Class Representative; and ● with respect to any serviced outside controlled whole loan (which may include a servicing shift whole loan or any other serviced whole loan with a controlling companion loan held outside the issuing entity), if and for so long as such holder is entitled under the related co-lender agreement to exercise consent rights similar to those entitled to be exercised by the Controlling Class Representative, the holder of the related Controlling Note (during any such period, the “outside controlling note holder”). The applicable directing holder (or equivalent party) with respect to any outside serviced mortgage loan will be, in general, (i) in the event the related Controlling Note is included in the subject outside securitization transaction, the controlling class representative (or equivalent entity) under the related outside servicing agreement, and (ii) in all other cases, the third-party holder of the related Controlling Note or its representative (which may be a controlling class representative (or equivalent entity) under a separate securitization transaction to which such note has been transferred (if any)), as provided in the related co-lender agreement. An “excluded mortgage loan” is, if the Controlling Class Representative is the Directing Holder with respect to the subject mortgage loan, a mortgage loan or related whole loan with respect to which the Controlling Class Representative or the holder(s) of more than 50% of the Controlling Class (by certificate balance) is (or are) a Borrower Party (as defined in the Preliminary Prospectus). |
| ■ Controlling Class Representative: | | The “Controlling Class Representative” will be the controlling class certificateholder or other representative designated by at least a majority of the controlling class certificateholders by certificate balance. The “Controlling Class” is, as of any time of determination, the most subordinate class of the Control Eligible Certificates that has an outstanding certificate balance as notionally reduced by any Cumulative Appraisal Reduction Amount allocable to such class, at least equal to 25% of the initial certificate balance of that class of certificates; provided that (except under the circumstances set forth in the next proviso) if no such class meets the preceding requirement, then the Class E-RR certificates will be the controlling class; provided, further, however, that if, at any time, the aggregate outstanding certificate balance of the classes of Principal Balance Certificates senior to the Control Eligible Certificates has been reduced to zero (without regard to the allocation of any Cumulative Appraisal Reduction Amounts), then the “Controlling Class” will be the most subordinate class of Control Eligible Certificates with an outstanding certificate balance greater than zero (without regard to the allocation of any Cumulative Appraisal Reduction Amounts). The “Control Eligible Certificates” consist of the Class E-RR, Class F-RR, Class G-RR and Class J-RR certificates. See “The Pooling and Servicing Agreement—Directing Holder” in the Preliminary Prospectus. No other class of certificates will be eligible to act as the controlling class or appoint a Controlling Class Representative. No person may exercise any of the rights and powers of the Controlling Class Representative with respect to an excluded mortgage loan. On the Closing Date, 660 RR Holdings LLC, is expected to (i) purchase the HRR Certificates, and (ii) to appoint 400 Capital Management, LLC (or an affiliate) as the initial Controlling Class Representative. 660 RR Holdings LLC or an affiliate may acquire additional Certificates |
■ Control Termination Event: | | A “Control Termination Event” will: with respect to any mortgage loan either (a) occur when none of the classes of the Control Eligible Certificates has an outstanding certificate balance (as notionally reduced by any Cumulative Appraisal Reduction Amount then allocable to such class) that is at least equal to 25% of the initial certificate balance of that class of certificates or (b) be deemed to occur as described below; provided, however, that a Control Termination Event will in no event exist at any time that the certificate balance of each class of Principal Balance Certificates senior to the Control Eligible Certificates (without regard to the allocation of Cumulative Appraisal Reduction Amounts) has been reduced to zero. With respect to excluded mortgage loans as to which the Controlling Class Representative would otherwise be the Directing Holder, a Control Termination Event will be deemed to exist. The holders of Certificates representing the majority of the certificate balance of the most senior class of Control Eligible Certificates whose certificate balance is notionally reduced to less than 25% of the initial certificate balance of that class as a result of an allocation of an Appraisal Reduction Amount or a Collateral Deficiency Amount, as applicable, to such class will have the right to challenge the Special Servicer’s Appraisal Reduction Amount determination or a Collateral Deficiency Amount determination, as applicable, and, at their sole expense, obtain a second |
THE INFORMATION IN THIS STRUCTURAL AND COLLATERAL TERM SHEET IS NOT COMPLETE AND MAY BE AMENDED PRIOR TO THE TIME OF SALE. THIS TERM SHEET IS NOT AN OFFER TO SELL THESE SECURITIES AND IT IS NOT A SOLICITATION OF AN OFFER TO BUY THESE SECURITIES IN ANY JURISDICTION WHERE THE OFFER OR SALE IS NOT PERMITTED. |
| | 24 | |
| Structural and Collateral Term Sheet | | BMO 2024-5C8 |
| Structural Overview |
| | appraisal for any serviced loan for which an Appraisal Reduction Event has occurred or as to which there exists a Collateral Deficiency Amount, under the circumstances described in the Preliminary Prospectus. |
■ Consultation Termination Event: | | A “Consultation Termination Event” with respect to any mortgage loan, (a) when none of the classes of Control Eligible Certificates has an outstanding certificate balance, without regard to the allocation of any Cumulative Appraisal Reduction Amount, that is equal to or greater than 25% of the initial certificate balance of that class of certificates or (b) be deemed to occur as described below; provided, however, that a Consultation Termination Event will in no event exist at any time that the certificate balance of each class of Principal Balance Certificates senior to the Control Eligible Certificates (without regard to the allocation of Cumulative Appraisal Reduction Amounts) has been reduced to zero. With respect to excluded mortgage loans as to which the Controlling Class Representative would otherwise be a Consulting Party, a Consultation Termination Event will be deemed to exist. |
■ Control/Consultation Rights: | | With respect to any Serviced Loan, the applicable Directing Holder will be entitled to have consent and/or consultation rights under the BMO 2024-5C8 pooling and servicing agreement with respect to certain major decisions (including with respect to assumptions, waivers, certain loan modifications and workouts) and other matters with respect to each serviced loan. After the occurrence and during the continuance of a Control Termination Event, the consent rights of the Controlling Class Representative will terminate, and the Controlling Class Representative will retain non-binding consultation rights under the BMO 2024-5C8 pooling and servicing agreement with respect to certain major decisions and other matters with respect to the serviced mortgage loans, other than (i) any excluded mortgage loan and (ii) any serviced outside controlled whole loan. After the occurrence and during the continuance of a Consultation Termination Event, all of these rights of the Controlling Class Representative with respect to the applicable serviced loans will terminate. With respect to any serviced outside controlled whole loan (including any servicing shift whole loan for so long as it is serviced under the BMO 2024-5C8 pooling and servicing agreement), the holder of the related Controlling Note or its representative (which holder or representative will not be the Controlling Class Representative) will instead be entitled to exercise the above-described consent and consultation rights, to the extent provided under the related co-lender agreement. With respect to each outside serviced whole loan, the applicable outside controlling class representative or other related controlling noteholder pursuant to, and subject to the limitations set forth in, the related outside servicing agreement and the related co-lender agreement will have consent, consultation, approval and direction rights with respect to certain major decisions (including with respect to assumptions, waivers, loan modifications and workouts) regarding such outside serviced whole loan, as provided for in the related co-lender agreement and in the related outside servicing agreement. To the extent permitted under the related co-lender agreement, the Controlling Class Representative (so long as a Consultation Termination Event does not exist) may have certain consultation rights with respect to each outside serviced whole loan. See “Description of the Mortgage Pool—The Whole Loans” in the Preliminary Prospectus. |
THE INFORMATION IN THIS STRUCTURAL AND COLLATERAL TERM SHEET IS NOT COMPLETE AND MAY BE AMENDED PRIOR TO THE TIME OF SALE. THIS TERM SHEET IS NOT AN OFFER TO SELL THESE SECURITIES AND IT IS NOT A SOLICITATION OF AN OFFER TO BUY THESE SECURITIES IN ANY JURISDICTION WHERE THE OFFER OR SALE IS NOT PERMITTED. |
| | 25 | |
| Structural and Collateral Term Sheet | | BMO 2024-5C8 |
| Structural Overview |
| ■ Termination of Special Servicer: | | At any time, the special servicer (but not any outside special servicer for any outside serviced whole loan) may be removed and replaced by the applicable Directing Holder, if any, with or without cause upon satisfaction of certain conditions specified in the BMO 2024-5C8 pooling and servicing agreement. After the occurrence and during the continuance of a Control Termination Event, the holders of at least 25% of the voting rights of the Regular Certificates (without regard to the application of any Appraisal Reduction Amounts) may request a vote to replace the special servicer (with respect to all of the serviced loans other than any serviced outside controlled whole loan). The subsequent vote may result in the termination and replacement of the special servicer if, within 180 days of the initial request for that vote, the holders of (a) at least 66-2/3% of the voting rights allocable to the Certificates of those holders that voted on the matter (provided that holders representing the applicable Certificateholder Quorum voted on the matter), or (b) more than 50% of the voting rights of each class of Certificates that are Non-Reduced Certificates vote affirmatively to so replace. “Non-Reduced Certificates” means each class of Principal Balance Certificates that has an outstanding certificate balance as may be notionally reduced by any Appraisal Reduction Amounts allocated to that class, equal to or greater than 25% of an amount equal to the initial certificate balance of that class of certificates minus all principal payments made on such class of certificates. Notwithstanding the foregoing, but subject to the discussion in the next paragraph, solely with respect to a serviced outside controlled whole loan (including any servicing shift whole loan, for so long as it is serviced pursuant to the BMO 2024-5C8 pooling and servicing agreement), only the holder of the related Controlling Note or its representative may terminate the special servicer without cause (solely with respect to the related whole loan) and appoint a replacement special servicer for that whole loan. If the operating advisor determines, in its sole discretion exercised in good faith, that (1) the special servicer has failed to comply with the servicing standard and (2) a replacement of the special servicer would be in the best interest of the certificateholders (as a collective whole), the operating advisor will have the right to recommend the replacement of the special servicer with respect to the serviced loans, resulting in a solicitation of a certificateholder vote. The subsequent vote may result in the termination and replacement of the special servicer if, within 180 days of the initial request for that vote, the holders of at least a majority of the aggregate outstanding principal balance of the Certificates of those holders that voted on the matter (provided that holders representing the applicable Certificateholder Quorum vote on the matter) vote affirmatively to so replace. “Certificateholder Quorum” means a quorum that: (a) for purposes of a vote to terminate and replace the special servicer or the asset representations reviewer at the request of the holders of Certificates evidencing not less than 25% of the voting rights (without regard to the application of any Appraisal Reduction Amounts), consists of the holders of Certificates evidencing at least 50% of the voting rights (taking into account the allocation of any Appraisal Reduction Amounts to notionally reduce the certificate balances of the respective classes of Principal Balance Certificates) of all of the Regular Certificates, on an aggregate basis; and (b) for purposes of a vote to terminate and replace the special servicer based on a recommendation of the operating advisor, consists of the holders of Certificates evidencing at least 20% of the aggregate of the outstanding principal balances of all Certificates, with such quorum including at least (3) holders and/or beneficial owners of Certificates that are not “affiliated” (as defined in Regulation RR) with each other. The related outside special servicer under each outside servicing agreement generally may be (or, if the applicable outside servicing agreement has not yet been executed, it is anticipated that such outside special servicer may be) replaced by the related outside controlling class representative (or an equivalent party), or the vote of the requisite holders of certificates issued, under the applicable outside servicing agreement (depending on whether or not the equivalent of a control termination event or a consultation termination event exists under that outside servicing agreement) or by any applicable other controlling noteholder under the related co-lender agreement in a manner generally similar to the manner in which the special servicer may be replaced under the BMO 2024-5C8 pooling and servicing agreement as described above in this “Termination of Special Servicer” section (although there will be differences, in particular as regards certificateholder votes and the timing of when an outside special servicer may be terminated based on the recommendation of an operating advisor). If the special servicer, to its knowledge, becomes a Borrower Party with respect to a mortgage loan, the special servicer will not be permitted to act as special servicer with respect to that mortgage loan. Subject to certain limitations described in the Preliminary Prospectus, any applicable Directing Holder will be entitled to appoint a replacement special servicer for that mortgage loan. If there is no applicable Directing Holder or if the applicable Directing Holder does not take action to appoint a replacement special servicer within the requisite time period, a replacement special servicer will be appointed in the manner specified in the BMO 2024-5C8 pooling and servicing agreement. |
THE INFORMATION IN THIS STRUCTURAL AND COLLATERAL TERM SHEET IS NOT COMPLETE AND MAY BE AMENDED PRIOR TO THE TIME OF SALE. THIS TERM SHEET IS NOT AN OFFER TO SELL THESE SECURITIES AND IT IS NOT A SOLICITATION OF AN OFFER TO BUY THESE SECURITIES IN ANY JURISDICTION WHERE THE OFFER OR SALE IS NOT PERMITTED. |
| | 26 | |
| Structural and Collateral Term Sheet | | BMO 2024-5C8 |
| Structural Overview |
| ■ Voting Rights: | | At all times during the term of the BMO 2024-5C8 pooling and servicing agreement, the voting rights for the Certificates (the “voting rights”) will be allocated among the respective classes of certificateholders in the following percentages: (1) 1% in the aggregate in the case of the respective classes of the Class X Certificates, allocated pro rata based upon their respective notional amounts as of the date of determination (for so long as the notional amount of at least one class of the Class X Certificates is greater than zero), and (2) in the case of any class of Principal Balance Certificates, a percentage equal to the product of 99% (or, if the notional amounts of all classes of the Class X Certificates have been reduced to zero, 100%) and a fraction, the numerator of which is equal to the certificate balance of such class of Principal Balance Certificates as of the date of determination, and the denominator of which is equal to the aggregate of the certificate balances of all classes of the Principal Balance Certificates, in each case, as of the date of determination, provided, that in certain circumstances described under “The Pooling and Servicing Agreement” in the Preliminary Prospectus, voting rights will only be exercisable by holders of Certificates that are Non-Reduced Certificates and/or may otherwise be exercisable or allocated in a manner that takes into account the allocation of Appraisal Reduction Amounts. The voting rights of any class of certificates are required to be allocated among certificateholders of such class in proportion to their respective percentage interests. The Class R certificates will not be entitled to any voting rights. |
| ■ Servicing Compensation: | | Modification Fees: Certain fees resulting from modifications, amendments, waivers or other changes to the terms of the loan documents, as more fully described in the Preliminary Prospectus, will be used to offset expenses on the related serviced mortgage loan (i.e. reimburse the trust for certain expenses, including unreimbursed advances and interest on unreimbursed advances previously incurred (other than special servicing fees, workout fees and liquidation fees) on the related serviced mortgage loan but not yet reimbursed to the trust or servicers or to pay expenses (other than special servicing fees, workout fees and liquidation fees) that are still outstanding in each case unless as part of the written modification the related borrower is required to pay these amounts on a going forward basis or in the future). Any excess modification fees not so applied to offset expenses will be available as compensation to the master servicer and/or special servicer. Within any prior 12-month period, all such excess modification fees earned by the master servicer or by the special servicer (after taking into account the offset described below applied during such 12-month period) with respect to any serviced mortgage loan will be subject to a cap equal to the greater of (i) 1% of the outstanding principal balance of such mortgage loan after giving effect to such transaction and (ii) $25,000. All excess modification fees earned by the special servicer will be required to offset any future workout fees or liquidation fees payable with respect to the related serviced mortgage loan or related REO property; provided, that if the serviced mortgage loan ceases being a corrected loan, and is subject to a subsequent modification, any excess modification fees earned by the special servicer prior to such serviced mortgage loan ceasing to be a corrected loan will no longer be offset against future liquidation fees and workout fees unless such serviced mortgage loan ceased to be a corrected loan within 18 months of it becoming a modified mortgage loan. Penalty Fees: All late fees and default interest will first be used to reimburse certain expenses previously incurred with respect to the related mortgage loan (including special servicing fees, workout fees and liquidation fees) but not yet reimbursed to the trust, the master servicer or the special servicer or to pay certain expenses (including special servicing fees, workout fees and liquidation fees) that are still outstanding on the related mortgage loan, and any excess received with respect to a serviced loan will be paid to the master servicer (for penalty fees accrued while a non-specially serviced loan) and the special servicer (for penalty fees accrued while a specially serviced loan). To the extent any amounts reimbursed out of penalty charges are subsequently recovered on a related serviced loan, they will be paid to the master servicer or special servicer who would have been entitled to the related penalty charges that were previously used to reimburse such expense. Liquidation / Workout Fees: Liquidation fees will be calculated at the lesser of (a) 1.0% or (b) with respect to any serviced mortgage loan (or related serviced whole loan, if applicable) or related REO Property, such lesser rate as would result in a liquidation fee of $1,000,000, for each serviced loan that is a specially serviced loan and any REO property, subject in any case to a minimum liquidation fee of $25,000. For any serviced loan that is a corrected loan, workout fees will be calculated at the lesser of (a) 1.0% and (b) such lower rate as would result in a workout fee of $1,000,000 when applied to each expected payment of principal and interest (other than (i) default interest and (ii) any “excess interest” accrued after the related anticipated repayment date on any mortgage loan with an anticipated repayment date) on the related serviced loan (or related serviced whole loan, if |
THE INFORMATION IN THIS STRUCTURAL AND COLLATERAL TERM SHEET IS NOT COMPLETE AND MAY BE AMENDED PRIOR TO THE TIME OF SALE. THIS TERM SHEET IS NOT AN OFFER TO SELL THESE SECURITIES AND IT IS NOT A SOLICITATION OF AN OFFER TO BUY THESE SECURITIES IN ANY JURISDICTION WHERE THE OFFER OR SALE IS NOT PERMITTED. |
| | 27 | |
| Structural and Collateral Term Sheet | | BMO 2024-5C8 |
| Structural Overview |
| | applicable) from the date such serviced loan becomes a corrected loan through and including the then related maturity date, subject in any case to a minimum workout fee of $25,000. Notwithstanding the foregoing, in connection with a maturity default, no liquidation or workout fee will be payable in connection with a payoff or refinancing of the related serviced loan within 90 days of the maturity default, but the special servicer may collect and retain appropriate fees from the related borrower in connection with the subject liquidation or workout. In the case of an outside serviced whole loan, calculation of the foregoing amounts payable to the related outside servicer or outside special servicer may be different than as described above. For example, the extent to which modification fees and penalty fees are applied to offset expenses may be different and liquidation fees and workout fees may be subject to different caps or no caps. |
| ■ Operating Advisor: | | The operating advisor will, in general and under certain circumstances described in the Preliminary Prospectus, have the following rights and responsibilities with respect to the serviced mortgage loans: ● reviewing the actions of the special servicer with respect to specially serviced loans and with respect to certain major decisions regarding non-specially serviced loans as to which the operating advisor has consultation rights; ● reviewing reports provided by the special servicer to the extent set forth in the BMO 2024-5C8 pooling and servicing agreement; ● reviewing for accuracy certain calculations made by the special servicer; ● issuing an annual report generally setting forth, among other things, its assessment of whether the special servicer is performing its duties in compliance with the servicing standard and the BMO 2024-5C8 pooling and servicing agreement and identifying any material deviations therefrom; ● recommending the replacement of the special servicer if the operating advisor determines, in its sole discretion exercised in good faith, that (1) the special servicer has failed to comply with the servicing standard and (2) a replacement of the special servicer would be in the best interest of the certificateholders (as a collective whole); and ● after the occurrence and during the continuance of an Operating Advisor Consultation Trigger Event, consulting on a non-binding basis with the special servicer with respect to certain major decisions (and such other matters as are set forth in the BMO 2024-5C8 pooling and servicing agreement) in respect of the applicable serviced mortgage loan(s) and/or related companion loan(s). An “Operating Advisor Consultation Trigger Event” will occur when the aggregate outstanding certificate balance of the HRR Certificates (as notionally reduced by any Cumulative Appraisal Reduction Amounts then allocable to the HRR Certificates) is 25% or less of the initial aggregate certificate balance of the HRR Certificates. With respect to excluded mortgage loans, an Operating Advisor Consultation Trigger Event will be deemed to exist. Notwithstanding the foregoing, the operating advisor will generally have no obligations or consultation rights as operating advisor under the BMO 2024-5C8 pooling and servicing agreement with respect to any outside serviced mortgage loan or any related REO property. The operating advisor will be subject to termination and replacement if the holders of at least 15% of the voting rights of Non-Reduced Certificates vote to terminate and replace the operating advisor and such termination and replacement is affirmatively voted for by the holders of more than 50% of the voting rights allocable to the Non-Reduced Certificates of those holders that exercise their right to vote (provided that holders entitled to exercise at least 50% of the voting rights allocable to the Non-Reduced Certificates exercise their right to vote within 180 days of the initial request for a vote). The holders initiating such vote will be responsible for the fees and expenses in connection with the vote and replacement. See “The Pooling and Servicing Agreement—Operating Advisor” in the Preliminary Prospectus. |
| ■ Asset Representations Reviewer: | | The asset representations reviewer will be required to review certain delinquent mortgage loans after a specified delinquency threshold has been exceeded and the required percentage of certificateholders vote to direct a review of such delinquent mortgage loans. An asset review will occur when either (1) mortgage loans with an aggregate outstanding principal balance of 25% or more of the aggregate outstanding principal balance of all of the mortgage loans (including any REO mortgage loans) held by the issuing entity as of the end of the applicable collection period are at least 60 days delinquent in respect of their related monthly payments or balloon payment, if any (for purposes of this paragraph, “delinquent loans”) or (2) at least 15 mortgage loans are delinquent loans as of the end of the applicable collection period and the aggregate outstanding principal |
THE INFORMATION IN THIS STRUCTURAL AND COLLATERAL TERM SHEET IS NOT COMPLETE AND MAY BE AMENDED PRIOR TO THE TIME OF SALE. THIS TERM SHEET IS NOT AN OFFER TO SELL THESE SECURITIES AND IT IS NOT A SOLICITATION OF AN OFFER TO BUY THESE SECURITIES IN ANY JURISDICTION WHERE THE OFFER OR SALE IS NOT PERMITTED. |
| | 28 | |
| Structural and Collateral Term Sheet | | BMO 2024-5C8 |
| Structural Overview |
| | balance of such delinquent loans constitutes at least 20% of the aggregate outstanding principal balance of all of the mortgage loans (including any REO mortgage loans) held by the issuing entity as of the end of the applicable collection period. The asset representations reviewer may be terminated and replaced without cause. Upon (i) the written direction of certificateholders evidencing not less than 25% of the voting rights requesting a vote to terminate and replace the asset representations reviewer with a proposed successor asset representations reviewer that is an eligible asset representations reviewer, and (ii) payment by such holders to the certificate administrator of the reasonable fees and expenses to be incurred by the certificate administrator in connection with administering such vote, the certificate administrator will promptly provide notice of such request to all certificateholders and the asset representations reviewer by posting such notice on its internet website, and by mailing such notice to all certificateholders and the asset representations reviewer. Upon the affirmative vote of certificateholders evidencing at least 75% of the voting rights allocable to those holders that exercise their right to vote (provided that holders representing the applicable Certificateholder Quorum exercise their right to vote within 180 days of the initial request for a vote), the trustee will be required to terminate all of the rights and obligations of the asset representations reviewer under the BMO 2024-5C8 pooling and servicing agreement by written notice to the asset representations reviewer, and the proposed successor asset representations reviewer will be appointed. See “The Pooling and Servicing Agreement—The Asset Representations Reviewer” in the Preliminary Prospectus. |
| ■ Dispute Resolution Provisions: | | The mortgage loan sellers will be subject to the dispute resolution provisions set forth in the BMO 2024-5C8 pooling and servicing agreement to the extent those provisions are triggered with respect to any mortgage loan sold to the depositor by a mortgage loan seller and such mortgage loan seller will be obligated under the related mortgage loan purchase agreement to comply with all applicable provisions and to take part in any mediation or arbitration proceedings that may result. Generally, in the event that a Repurchase Request (as defined in the Preliminary Prospectus) with respect to a mortgage loan is not “Resolved” (as defined below) within 180 days after the related mortgage loan seller receives such Repurchase Request, then the enforcing servicer will be required to send a notice to the “Initial Requesting Certificateholder” (if any) indicating the enforcing servicer’s intended course of action with respect to the Repurchase Request. If (a) the enforcing servicer’s intended course of action with respect to the Repurchase Request does not involve pursuing further action to exercise rights against the applicable mortgage loan seller with respect to the Repurchase Request and the Initial Requesting Certificateholder, if any, or any other certificateholder or certificate owner of Certificates wishes to exercise its right to refer the matter to mediation (including nonbinding arbitration) or arbitration, or (b) the enforcing servicer’s intended course of action is to pursue further action to exercise rights against the related mortgage loan seller with respect to the Repurchase Request but the Initial Requesting Certificateholder, if any, or any other certificateholder or certificate owner of Certificates does not agree with the dispute resolution method selected by the enforcing servicer, then the Initial Requesting Certificateholder, if any, or such other certificateholder or certificate owner may deliver a written notice to the enforcing servicer indicating its intent to exercise its right to refer the matter to either mediation or arbitration. In addition, any other certificateholder or certificate owner of Certificates may deliver, within the time frame provided in the BMO 2024-5C8 pooling and servicing agreement, a written notice requesting the right to participate in any dispute resolution consultation that is conducted by the enforcing servicer following the enforcing servicer’s receipt of the notice described in the preceding sentence. “Resolved” means, with respect to a Repurchase Request, (i) that any material breach of representations and warranties or a material document defect has been cured, (ii) the related mortgage loan has been repurchased in accordance with the related mortgage loan purchase agreement, (iii) a mortgage loan has been substituted for the related mortgage loan in accordance with the related mortgage loan purchase agreement, (iv) the applicable mortgage loan seller has made a “loss of value payment”, (v) a contractually binding agreement has been entered into between the enforcing servicer, on behalf of the issuing entity, and the related mortgage loan seller that settles the related mortgage loan seller’s obligations under the related mortgage loan purchase agreement, or (vi) the related mortgage loan is no longer property of the issuing entity as a result of a sale or other disposition in accordance with the BMO 2024-5C8 pooling and servicing agreement. See “The Pooling and Servicing Agreement—Dispute Resolution Provisions” in the Preliminary Prospectus. |
| ■ Liquidated Loan Waterfall: | | Upon liquidation of any mortgage loan, all net liquidation proceeds related to the mortgage loan (but not any related companion loan) will be applied (after allocation to offset certain advances and expenses) so that amounts allocated as a recovery of accrued and unpaid interest will not, in the first instance, include any delinquent interest that was not advanced as a result of Appraisal Reduction Amounts or interest that accrued on any junior note(s) if such mortgage loan is an AB Modified Loan. After the adjusted interest amount is so allocated, any remaining liquidation proceeds will be allocated to pay principal on the mortgage loan until the unpaid principal amount of the mortgage loan has been reduced to zero. Any remaining liquidation proceeds will then be allocated to pay delinquent interest that was not advanced as a result of Appraisal Reduction Amounts and any interest that accrued on any junior note(s) if such mortgage loan is an AB Modified Loan. |
THE INFORMATION IN THIS STRUCTURAL AND COLLATERAL TERM SHEET IS NOT COMPLETE AND MAY BE AMENDED PRIOR TO THE TIME OF SALE. THIS TERM SHEET IS NOT AN OFFER TO SELL THESE SECURITIES AND IT IS NOT A SOLICITATION OF AN OFFER TO BUY THESE SECURITIES IN ANY JURISDICTION WHERE THE OFFER OR SALE IS NOT PERMITTED. |
| | 29 | |
| Structural and Collateral Term Sheet | | BMO 2024-5C8 |
| Structural Overview |
| ■ Credit Risk Retention: | | This securitization transaction will be subject to the credit risk retention rules of Section 15G of the Securities Exchange Act of 1934, as amended. An economic interest in the credit risk of the mortgage loans in this transaction is expected to be retained pursuant to risk retention regulations (as codified at 12 CFR Part 244) promulgated under Section 15G (“Regulation RR”), as an “eligible horizontal residual interest” in the form of the HRR Certificates. Bank of Montreal will act as retaining sponsor under Regulation RR for this securitization transaction and is expected, on the Closing Date, to satisfy its risk retention obligation through the purchase by a third-party purchaser of the HRR Certificates. For a further discussion of the manner in which the credit risk retention requirements are expected to be satisfied by Bank of Montreal, as retaining sponsor for this securitization transaction, see “Credit Risk Retention” in the Preliminary Prospectus. |
| ■ Investor Communications: | | The certificate administrator is required to include on any Form 10–D any request received from a certificateholder to communicate with other certificateholders related to certificateholders exercising their rights under the terms of the BMO 2024-5C8 pooling and servicing agreement. Any certificateholder wishing to communicate with other certificateholders regarding the exercise of its rights under the terms of the BMO 2024-5C8 pooling and servicing agreement will be able to deliver a written request signed by an authorized representative of the requesting investor to the certificate administrator. |
| ■ Deal Website: | | The certificate administrator will maintain a deal website including, but not limited to: ● all special notices delivered. ● summaries of final asset status reports. ● all appraisals in connection with an appraisal reduction plus any subsequent appraisal updates. ● an “Investor Q&A Forum” and a voluntary investor registry. |
| ■ Cleanup Call: | | On any Distribution Date on which the aggregate unpaid principal balance of the mortgage loans (including mortgage loans as to which the related mortgaged properties have become REO properties) remaining in the issuing entity is less than 1% of the aggregate principal balance of the pool of mortgage loans as of the Cut-off Date (excluding for the purposes of this calculation, the unpaid principal balance of any mortgage loan with an anticipated repayment date, but in such case only if the option described above is exercised after the Distribution Date related to the collection period in which the corresponding anticipated repayment date occurs), certain specified persons will have the option to purchase all of the remaining mortgage loans (and all property acquired through exercise of remedies in respect of any mortgage loan) at the price specified in the Preliminary Prospectus. Exercise of the option will terminate the issuing entity and retire the then outstanding certificates. If the aggregate certificate balances of the Class A-1, Class A-2, Class A-3, Class A-S, Class B, Class C, Class D and Class E-RR certificates and the notional amounts of the Class X-A, Class X-B and Class X-D certificates have been reduced to zero and if the master servicer has received from the remaining certificateholders the payment specified in the BMO 2024-5C8 pooling and servicing agreement, the issuing entity could also be terminated in connection with an exchange of all the then-outstanding certificates (excluding the Class R certificates) for the mortgage loans remaining in the issuing entity, as further described under “The Pooling and Servicing Agreement—Optional Termination; Optional Mortgage Loan Purchase” in the Preliminary Prospectus. |
The Offered Certificates involve certain risks and may not be suitable for all investors. For information regarding certain risks associated with an investment in the Offered Certificates, see “Summary of Risk Factors” and “Risk Factors” in the Preliminary Prospectus. Capitalized terms used but not otherwise defined in this Term Sheet have the respective meanings assigned to those terms in the Preliminary Prospectus.
THE INFORMATION IN THIS STRUCTURAL AND COLLATERAL TERM SHEET IS NOT COMPLETE AND MAY BE AMENDED PRIOR TO THE TIME OF SALE. THIS TERM SHEET IS NOT AN OFFER TO SELL THESE SECURITIES AND IT IS NOT A SOLICITATION OF AN OFFER TO BUY THESE SECURITIES IN ANY JURISDICTION WHERE THE OFFER OR SALE IS NOT PERMITTED. |
| | 30 | |
| Structural and Collateral Term Sheet | | BMO 2024-5C8 |
| No. 1 – Queens Center |
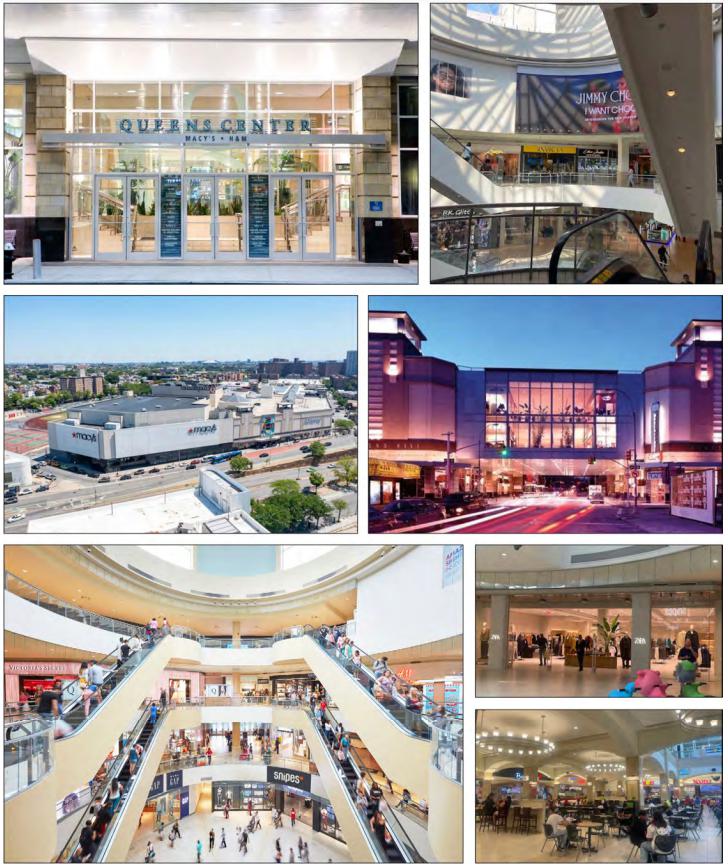
THE INFORMATION IN THIS STRUCTURAL AND COLLATERAL TERM SHEET IS NOT COMPLETE AND MAY BE AMENDED PRIOR TO THE TIME OF SALE. THIS TERM SHEET IS NOT AN OFFER TO SELL THESE SECURITIES AND IT IS NOT A SOLICITATION OF AN OFFER TO BUY THESE SECURITIES IN ANY JURISDICTION WHERE THE OFFER OR SALE IS NOT PERMITTED. |
| | 31 | |
| Structural and Collateral Term Sheet | | BMO 2024-5C8 |
| No. 1 – Queens Center |
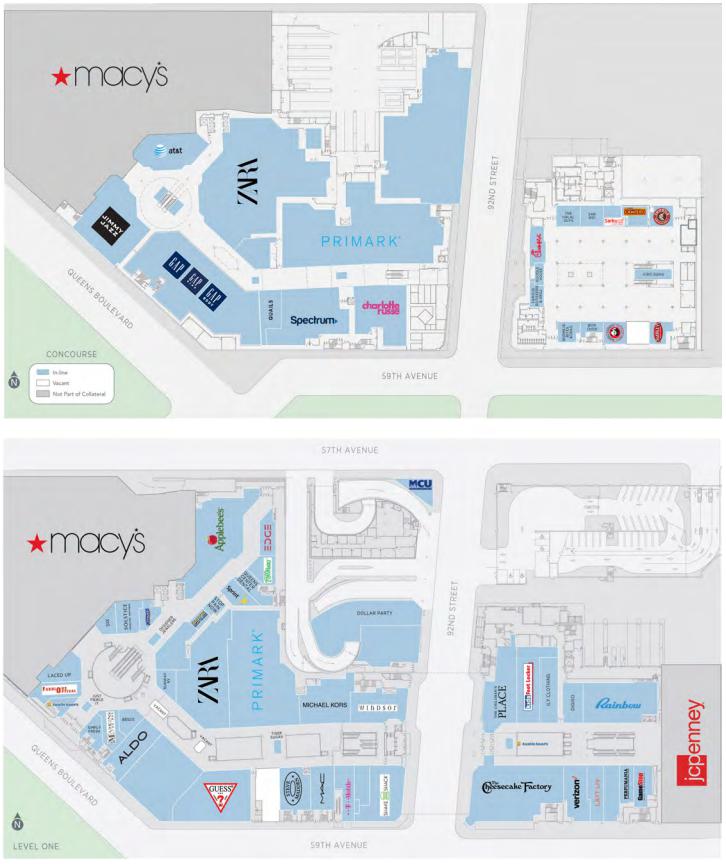
THE INFORMATION IN THIS STRUCTURAL AND COLLATERAL TERM SHEET IS NOT COMPLETE AND MAY BE AMENDED PRIOR TO THE TIME OF SALE. THIS TERM SHEET IS NOT AN OFFER TO SELL THESE SECURITIES AND IT IS NOT A SOLICITATION OF AN OFFER TO BUY THESE SECURITIES IN ANY JURISDICTION WHERE THE OFFER OR SALE IS NOT PERMITTED. |
| | 32 | |
| Structural and Collateral Term Sheet | | BMO 2024-5C8 |
| No. 1 – Queens Center |

THE INFORMATION IN THIS STRUCTURAL AND COLLATERAL TERM SHEET IS NOT COMPLETE AND MAY BE AMENDED PRIOR TO THE TIME OF SALE. THIS TERM SHEET IS NOT AN OFFER TO SELL THESE SECURITIES AND IT IS NOT A SOLICITATION OF AN OFFER TO BUY THESE SECURITIES IN ANY JURISDICTION WHERE THE OFFER OR SALE IS NOT PERMITTED. |
| | 33 | |
| Structural and Collateral Term Sheet | | BMO 2024-5C8 |
| No. 1 – Queens Center |
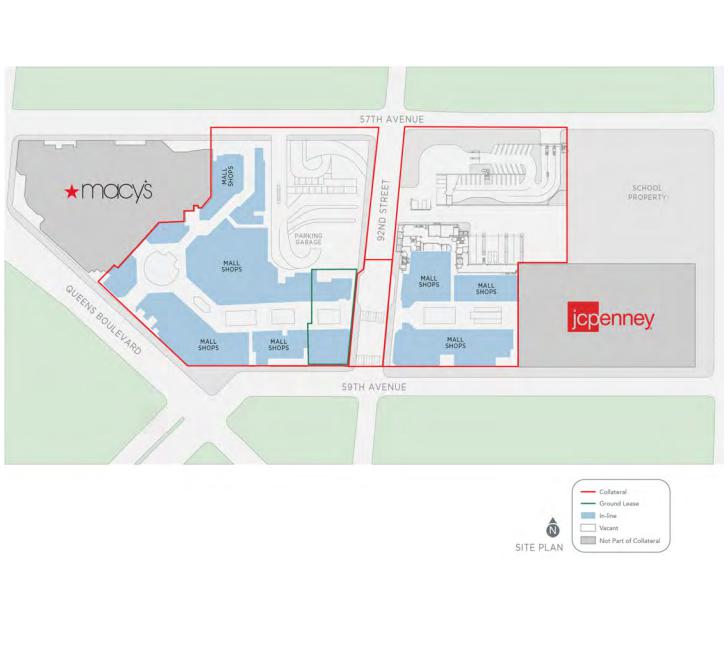
THE INFORMATION IN THIS STRUCTURAL AND COLLATERAL TERM SHEET IS NOT COMPLETE AND MAY BE AMENDED PRIOR TO THE TIME OF SALE. THIS TERM SHEET IS NOT AN OFFER TO SELL THESE SECURITIES AND IT IS NOT A SOLICITATION OF AN OFFER TO BUY THESE SECURITIES IN ANY JURISDICTION WHERE THE OFFER OR SALE IS NOT PERMITTED. |
| | 34 | |
| Structural and Collateral Term Sheet | | BMO 2024-5C8 |
| No. 1 – Queens Center |

THE INFORMATION IN THIS STRUCTURAL AND COLLATERAL TERM SHEET IS NOT COMPLETE AND MAY BE AMENDED PRIOR TO THE TIME OF SALE. THIS TERM SHEET IS NOT AN OFFER TO SELL THESE SECURITIES AND IT IS NOT A SOLICITATION OF AN OFFER TO BUY THESE SECURITIES IN ANY JURISDICTION WHERE THE OFFER OR SALE IS NOT PERMITTED. |
| | 35 | |
| Structural and Collateral Term Sheet | | BMO 2024-5C8 |
| No. 1 – Queens Center |
| Mortgage Loan Information | | Property Information |
| Mortgage Loan Sellers: | GACC, BMO, GSMC | | Single Asset / Portfolio: | Single Asset |
| Original Principal Balance(1): | $71,000,000 | | Title(6): | Fee/Leasehold |
| Cut-off Date Principal Balance(1): | $71,000,000 | | Property Type – Subtype: | Retail – Super Regional Mall |
| % of IPB: | 7.2% | | Net Rentable Area (SF)(7): | 412,033 |
| Loan Purpose: | Refinance | | Location: | Elmhurst, NY |
| Borrower: | Queens Center SPE LLC and Queens Center Pledgor LLC | | Year Built / Renovated: | 1973 / 2004 |
| Borrower Sponsor: | The Macerich Partnership, L.P. | | Occupancy: | 95.4% |
| Interest Rate: | 5.37000% | | Occupancy Date: | 10/7/2024 |
| Note Date: | 10/28/2024 | | 4th Most Recent NOI (As of): | $51,866,594 (12/31/2021) |
| Maturity Date: | 11/6/2029 | | 3rd Most Recent NOI (As of): | $55,476,544 (12/31/2022) |
| Interest-only Period: | 60 months | | 2nd Most Recent NOI (As of): | $52,482,275 (12/31/2023) |
| Original Term: | 60 months | | Most Recent NOI (As of): | $49,730,304 (9/30/2024 TTM) |
| Original Amortization Term: | None | | UW Economic Occupancy: | 95.8% |
| Amortization Type: | Interest Only | | UW Revenues: | $100,774,128 |
| Call Protection(2): | L(25),DorYM1(28),O(7) | | UW Expenses: | $47,153,562 |
| Lockbox / Cash Management: | Hard / Springing | | UW NOI: | $53,620,566 |
| Additional Debt(1): | Yes | | UW NCF: | $52,532,319 |
| Additional Debt Balance(1): | $454,000,000 | | Appraised Value / Per SF: | $1,060,000,000 / $2,573 |
| Additional Debt Type(1)(3): | Pari Passu | | Appraisal Date: | 9/19/2024 |
| | | | | |
| Escrows and Reserves(4) | | Financial Information(1) |
| | Initial | Monthly | Cap | | Cut-off Date Loan / SF: | $1,274 |
| Taxes: | $0 | Springing | N/A | | Maturity Date Loan / SF: | $1.274 |
| Insurance: | $0 | Springing | N/A | | Cut-off Date LTV: | 49.5% |
| Replacement Reserves: | $0 | Springing | $206,017 | | Maturity Date LTV: | 49.5% |
| TI / LC Reserve: | $0 | Springing | $641,476 | | UW NCF DSCR: | 1.84x |
| Other Reserve(5): | $12,211,534 | N/A | N/A | | UW NOI Debt Yield: | 10.2% |
| | | | | | | |
| Sources and Uses |
| Sources | Proceeds | % of Total | | Uses | Proceeds | % of Total |
| Whole Loan Amount(1): | $525,000,000 | 85.2 | % | | Loan Payoff: | $601,802,949 | 97.7 | % |
| Sponsor Equity: | 91,238,851 | 14.8 | | | Reserves | 12,211,534 | 2.0 | |
| | | | | Closing Costs: | 2,224,368 | 0.4 | |
| Total Sources: | $616,238,851 | 100.0 | % | | Total Uses: | $616,238,851 | 100.0 | % |
| (1) | The Queens Center Mortgage Loan (as defined below) is part of a whole loan evidenced by 30 pari passu promissory notes with an aggregate original principal balance of $525,000,000. The financial information presented in the chart above is based on the Queens Center Whole Loan (as defined below). |
| (2) | The lockout period will be at least 25 payment dates beginning with and including the first payment date on December 6, 2024. Defeasance of the Queens Center Whole Loan in full is permitted at any time after the earlier to occur of (i) November 6, 2027 and (ii) the date that is two years from the closing date of the securitization that includes the last pari passu note to be securitized (the ”Lockout Release Date”). In addition, on any business day from and after the Lockout Release Date, voluntary prepayment of the Queens Center Whole Loan is permitted in whole (but not in part), together with, if such voluntary prepayment occurs prior to the monthly payment date that occurs prior to May 6, 2029, a prepayment fee equal to the greater of (x) 1.00% of the principal amount of the Queens Center Whole Loan being prepaid and (y) a yield maintenance premium. The assumed lockout period of 25 payments is based on the anticipated closing date of the BMO 2024-5C8 securitization closing date in December 2024. The actual lockout period may be longer. |
| (3) | See "The Loan" below for further discussion of additional mortgage debt. |
| (4) | Please see “Escrows and Reserves” below for further discussion of reserve information. |
| (5) | Other Reserve is comprised of $11,562,092 for outstanding tenant improvements and leasing commissions and $649,442 for gap rent. |
| (6) | See “Ground Lease” below for further discussion of reserve requirements. |
| (7) | Net Rentable Area (SF) is exclusive of 556,724 square feet associated with Macy’s and JCPenney, both of which are non-collateral anchor tenants. |
The Loan. The largest mortgage loan (the “Queens Center Mortgage Loan”) is part of a whole loan evidenced by 30 pari passu promissory notes with an aggregate outstanding principal balance as of the Cut-off Date of $525,000,000 (the “Queens Center Whole Loan”). The Queens Center Whole Loan is secured by the borrowers’ non-overlapping fee and leasehold interests in a 412,033 SF retail property located in Elmhurst, New York (the “Queens Center Property”) as well as the Pledgor Borrower’s (as defined below) membership interest in the Property Borrower (as defined below). The Queens
THE INFORMATION IN THIS STRUCTURAL AND COLLATERAL TERM SHEET IS NOT COMPLETE AND MAY BE AMENDED PRIOR TO THE TIME OF SALE. THIS TERM SHEET IS NOT AN OFFER TO SELL THESE SECURITIES AND IT IS NOT A SOLICITATION OF AN OFFER TO BUY THESE SECURITIES IN ANY JURISDICTION WHERE THE OFFER OR SALE IS NOT PERMITTED. |
| | 36 | |
| Structural and Collateral Term Sheet | | BMO 2024-5C8 |
| No. 1 – Queens Center |
Center Mortgage Loan is evidenced by the non-controlling notes A-1-4-1, A-1-5, A-2-2-2, A-2-3, A-4-1-2 and A-4-2 with an outstanding principal balance as of the Cut-off Date of $71,000,000. The Queens Center Whole Loan was originated by German American Capital Corporation (“GACC”), Goldman Sachs Bank USA (“GS”), JPMorgan Chase Bank, National Association (“JPMCB”), Bank of Montreal (“BMO”) and Morgan Stanley Bank, N.A. (“MSBNA”) on October 28, 2024. GACC is selling Notes A-1-4-1 and A-1-5 with an outstanding principal balance as of the Cut-off Date of $31,000,000. BMO is selling Notes A-4-1-2 and A-4-2 with an outstanding principal balance as of the Cut-off Date of $20,000,000. GS is selling Notes A-2-2-2 and A-2-3 with an outstanding principal balance as of the Cut-off Date of $20,000,000. The Queens Center Whole Loan will be serviced pursuant to the pooling and servicing agreement for a future securitization trust. See “Description of the Mortgage Pool—The Serviced Pari Passu Whole Loans” and “The Pooling and Servicing Agreement” in the Preliminary Prospectus.
The table below identifies the promissory notes that comprise the Queens Center Whole Loan:
| Whole Loan Summary |
| Note | Original Balance | Cut-off Date Balance | Note Holder | Controlling Piece |
| A-1-1 | $50,000,000 | $50,000,000 | Future Securitization(1) | Yes |
| A-1-2(1) | $25,000,000 | $25,000,000 | DBRI | No |
| A-1-3(1) | $25,000,000 | $25,000,000 | DBRI | No |
| A-1-4-1 | $16,000,000 | $16,000,000 | BMO 2024-5C8 | No |
| A-1-4-2 | $4,000,000 | $4,000,000 | DBRI | No |
| A-1-5 | $15,000,000 | $15,000,000 | BMO 2024-5C8 | No |
| A-1-6(1) | $15,000,000 | $15,000,000 | DBRI | No |
| A-2-1 | $15,000,000 | $15,000,000 | WFCM 2024-5C2 | No |
| A-2-2-1(1) | $10,000,000 | $10,000,000 | GS | No |
| A-2-2-2 | $5,000,000 | $5,000,000 | BMO 2024-5C8 | No |
| A-2-3 | $15,000,000 | $15,000,000 | BMO 2024-5C8 | No |
| A-2-4(1) | $15,000,000 | $15,000,000 | GS | No |
| A-2-5(1) | $15,000,000 | $15,000,000 | GS | No |
| A-2-6(1) | $25,000,000 | $25,000,000 | GS | No |
| A-3-1 | $43,000,000 | $43,000,000 | BANK5 2024-5YR11 | No |
| A-3-2(1) | $20,000,000 | $20,000,000 | JPMCB | No |
| A-3-3 | $15,000,000 | $15,000,000 | WFCM 2024-5C2 | No |
| A-3-4(1) | $15,000,000 | $15,000,000 | JPMCB | No |
| A-3-5(1) | $7,000,000 | $7,000,000 | JPMCB | No |
| A-4-1-1 | $10,000,000 | $10,000,000 | Future Securitization(1) | No |
| A-4-1-2 | $5,000,000 | $5,000,000 | BMO 2024-5C8 | No |
| A-4-2 | $15,000,000 | $15,000,000 | BMO 2024-5C8 | No |
| A-4-3(1) | $15,000,000 | $15,000,000 | BMO | No |
| A-4-4(1) | $15,000,000 | $15,000,000 | BMO | No |
| A-4-5(1) | $15,000,000 | $15,000,000 | BMO | No |
| A-4-6 | $25,000,000 | $25,000,000 | Future Securitization(1) | No |
| A-5-1 | $32,000,000 | $32,000,000 | BANK5 2024-5YR11 | No |
| A-5-2(1) | $20,000,000 | $20,000,000 | MSBNA | No |
| A-5-3(1) | $15,000,000 | $15,000,000 | MSBNA | No |
| A-5-4(1) | $8,000,000 | $8,000,000 | MSBNA | No |
| Total | $525,000,000 | $525,000,000 | | |
| (1) | Expected to be contributed to one or more future securitization transactions. In the case of the notes where the holder is indicated as “Future Securitization”, the related note(s) are expected to be included in a securitization transaction that has not been announced but is expected to close on or prior to the closing date for this securitization transaction. |
The Property. Built in 1973 and renovated in 2004, Queens Center (the “Queens Center Mall”) is a 968,757 square foot (412,033 collateral square feet) super regional mall located in Elmhurst, New York situated on an 11.21-acre parcel with 8.41 acres of owned acreage and 1,903 parking spaces or 4.6 parking spaces per 1,000 square feet. Of the 968,757 total SF, 412,033 SF constitutes the collateral for the Queens Center Whole Loan, with the remaining non-collateral areas of the Queens Center Mall occupied by Macy’s and JCPenney and owned by third parties.
Representing the sole enclosed super-regional shopping center in Queens, the Queens Center Mall attracts 9.4 million visitors annually and has a trade area of 2.4 million people as of 2022. The Queens Center Mall has historically benefited from high tenant demand with occupancy averaging nearly 99% over the last 10 years. Further, the Queens Center Property is currently 95.4% leased and features a mix of 120 national and regional tenants. Since 2022, the borrower sponsor has
THE INFORMATION IN THIS STRUCTURAL AND COLLATERAL TERM SHEET IS NOT COMPLETE AND MAY BE AMENDED PRIOR TO THE TIME OF SALE. THIS TERM SHEET IS NOT AN OFFER TO SELL THESE SECURITIES AND IT IS NOT A SOLICITATION OF AN OFFER TO BUY THESE SECURITIES IN ANY JURISDICTION WHERE THE OFFER OR SALE IS NOT PERMITTED. |
| | 37 | |
| Structural and Collateral Term Sheet | | BMO 2024-5C8 |
| No. 1 – Queens Center |
been able to re-tenant or renew over 60% of the collateral SF. Recently, the borrower sponsor has leased to several new high-performing tenants including Primark (54,832 square feet), ZARA (36,463 square feet) and H&M (19,694 square feet).
The Queens Center Mall was originally acquired by the borrower sponsor in 1995. In 2004, the borrower sponsor invested $275.0 million to fully redevelop and expand the Queens Center Property. The expansion featured the addition of 250,000 in-line square feet and JCPenney’s development of an approximately 204,000 square foot box, which JCPenney subsequently sold to Ashkenazy Acquisition Corporation in January 2022. Since 2019, the Borrowers have invested $65.2 million in leasing capital, common area renovations, and operational upgrades with plans to invest an additional $13.0 million by the end of 2024 (such additional investment is not required or reserved for under the Queens Center Whole Loan documents). Of the $78.2 million spent or budgeted from 2019 through year end 2024, $15.2 million has been allocated toward buildout of ZARA’s new 36,463 square foot store, which combined 10 in-line units across two floors. Furthermore, the borrower sponsor has invested $19.7 million and $6.3 million in tenant allowances and buildout costs for Primark (54,832 SF) and H&M (19,694 SF), respectively.
According to the appraisal, the Queens Center Mall is a top-producing center in New York City, attracting significant foot traffic and generating over $500 million in annual sales. The Queens Center Mall’s sales PSF are significantly higher than the national average, with comparable mall shop sales reported at $1,731 PSF ($1,165 PSF excluding Apple). According to the borrower sponsor, as of TTM July 2024 the non-collateral Macy’s and JCPenney reported annual sales of $132,000,000 and $26,000,000, respectively.
Major Tenants. The four largest tenants by underwritten base rent at Queens Center Property are Primark, American Eagle Outfitters, ZARA and H&M.
Primark (54,832 square feet; 13.3% of NRA; 5.6% of underwritten base rent): Founded in 1969, Primark is an international fashion retailer that offers affordable fashion, home goods and accessories. Primark operates over 450 stores across 17 countries across Europe and the United States. The Queens Center Property hosts Primark’s newest location in the Tri-State area. Primark is not yet in occupancy and is expected to take possession of its space in December 2024. Primark’s lease expires in January 2035, has two, five-year extension options remaining and contains a termination option in the event that gross sales between December 2027 and November 2028 do not exceed $23,000,000, provided it gives notice within 90 days following November 30, 2028.
American Eagle Outfitters (10,268 square feet; 2.5% of NRA; 3.4% of underwritten base rent): Founded in 1977, American Eagle Outfitters is a global specialty retailer that offers various types of apparel, intimates, activewear, accessories, and personal care products. With over 1,000 stores worldwide, American Eagle Outfitters focuses on providing a unique shopping experience for the 15 to 25 year-old consumer demographic. American Eagle Outfitters reported annual sales for the TTM July 2024 period of $10,541,311 ($1,027 PSF). American Eagle Outfitters’ lease at the Queens Center Property expires in September 2032 and has no extension or termination options.
ZARA (36,463 square feet; 8.8% of NRA; 3.2% of underwritten base rent): Founded in 1974, ZARA is an international fashion retailer and part of the Inditex Group. ZARA operates approximately 3,000 stores in 96 countries, offering a wide range of fashion-forward apparel. ZARA’s forecasted reported annual sales for the TTM July 2024 period are $23,559,201 ($646 PSF). ZARA’s lease expires in November 2033, with one, five-year extension option remaining and contains a termination option in the event that ZARA gives notice 270 days prior to either (i) December 31, 2028 or (ii) May 31, 2031 with the payment of a termination fee in an amount equal to the unamortized portion, as of November 30, 2028 or May 31, 2030, of the sum of certain allowance for construction work amortized on a straight-line basis over the period from the rent commencement date through the effective date of termination.
H&M (19,694 SF; 4.8% of NRA; 2.8% of underwritten base rent): Founded in 1947, H&M, part of the H&M Group, is a global fashion retailer offering a broad range of clothing and accessories for men, women, and children. H&M has over 3,800 stores across 77 markets worldwide, H&M is known for its commitment to affordable fashion. H&M’s lease expires in January 2035, has two, 4-year extension options remaining and contains options to terminate its lease if its gross sales (i) between January 2028 and December 2028 do not exceed $16,000,000 or (ii) between January 2031 and December 2031 do not exceed $18,000,000, in each case, provided that it gives notice within 120 days following such period.
THE INFORMATION IN THIS STRUCTURAL AND COLLATERAL TERM SHEET IS NOT COMPLETE AND MAY BE AMENDED PRIOR TO THE TIME OF SALE. THIS TERM SHEET IS NOT AN OFFER TO SELL THESE SECURITIES AND IT IS NOT A SOLICITATION OF AN OFFER TO BUY THESE SECURITIES IN ANY JURISDICTION WHERE THE OFFER OR SALE IS NOT PERMITTED. |
| | 38 | |
| Structural and Collateral Term Sheet | | BMO 2024-5C8 |
| No. 1 – Queens Center |
The following information presents certain information relating to the historical and current occupancy of the Queens Center Property:
| Historical and Current Occupancy(1) |
| 2021 | 2022 | 2023 | Current(2) |
| 97.6% | 98.7% | 98.9% | 95.4% |
| (1) | Historical occupancies are as of December 31 of each respective year. |
| (2) | Current occupancy is based on the underwritten rent roll as of October 7, 2024. |
The following table presents certain information relating to the sales history for the Queens Center Property:
| Comparable Sales History(1) |
| | 2019 | 2021 | 2022 | 2023 | TTM July 2024 |
| Comparable Inline (<10,000 SF) Sales PSF | $1,581 | $1,615 | $1,717 | $1,751 | $1,731 |
| Comparable Inline (<10,000 SF excluding Apple) Sales PSF | $1,145 | $1,122 | $1,189 | $1,147 | $1,165 |
| Comparable Inline (<10,000 SF excluding Apple) Occupancy Cost(2) | 22.5% | 21.7% | 21.1% | 22.8% | 22.1% |
| Non-collateral Anchor Sales(3) | $173,300,000 | $159,700,000 | $164,000,000 | $164,000,000 | $158,000,000 |
| Comparable Total Queens Center Mall Sales | $616,120,375 | $536,343,372 | $561,506,309 | $562,896,033 | $533,839,416 |
| (1) | All sales information presented above is based upon information provided by the borrower sponsor. In certain instances, sales figures represent estimates because the tenants are not required to report, or otherwise may not have reported sales information on a timely basis. Further, because sales are self-reported, such information is not independently verified by the borrower sponsor. 2020 numbers are excluded due to the COVID-19 pandemic. |
| (2) | Occupancy Cost is calculated based on gross sales divided by the sum of (i) contractual rent and (ii) reimbursements, each based on the underwritten rent roll dated October 7, 2024. |
| (3) | Includes sales of Macy’s and JCPenney, both of which are non-collateral anchors, as provided by the borrower sponsor. |
THE INFORMATION IN THIS STRUCTURAL AND COLLATERAL TERM SHEET IS NOT COMPLETE AND MAY BE AMENDED PRIOR TO THE TIME OF SALE. THIS TERM SHEET IS NOT AN OFFER TO SELL THESE SECURITIES AND IT IS NOT A SOLICITATION OF AN OFFER TO BUY THESE SECURITIES IN ANY JURISDICTION WHERE THE OFFER OR SALE IS NOT PERMITTED. |
| | 39 | |
| Structural and Collateral Term Sheet | | BMO 2024-5C8 |
| No. 1 – Queens Center |
The following table presents certain information relating to the major tenants at the Queens Center Property:
| Top Tenant Summary(1) |
| Tenant | Ratings
Moody’s/S&P/Fitch(2) | Net Rentable Area (SF) | % of
Total NRA | UW Base Rent PSF | UW Base Rent | % of Total
UW Base Rent | Lease
Exp. Date |
| Major Tenants | | | | | | | |
| Primark(3) | NR/NR/NR | 54,832 | 13.3 | % | $54.12 | $2,967,306 | 5.6 | % | 1/31/2035 |
| American Eagle Outfitters | NR/NR/NR | 10,268 | 2.5 | | $172.69 | 1,773,181 | 3.4 | | 9/30/2032 |
| ZARA(4) | NR/NR/NR | 36,463 | 8.8 | | $46.62 | 1,700,000 | 3.2 | | 11/30/2033 |
| H&M(5) | NR/NR/NR | 19,694 | 4.8 | | $75.00 | 1,477,050 | 2.8 | | 1/31/2035 |
| Subtotal/Wtd. Avg. | | 121,257 | 29.4 | % | $65.30 | $7,917,537 | 15.0 | % | |
| Select In-Line < 10,000 SF | | | | | | | |
| Finish Line | NR/NR/NR | 8,625 | 2.1 | % | $193.61 | $1,669,923 | 3.2 | % | 8/31/2025 |
| Apple Store | Aaa/AA+/NR | 8,706 | 2.1 | | $178.96 | 1,558,044 | 3.0 | | 7/31/2025 |
| Victoria’s Secret | NR/NR/NR | 7,767 | 1.9 | | $165.55 | 1,285,796 | 2.4 | | 1/31/2033 |
| Adidas(6) | NR/NR/NR | 8,183 | 2.0 | | $135.00 | 1,104,705(7) | 2.1 | | 1/31/2029 |
| Hollister Co. | NR/NR/NR | 8,028 | 1.9 | | $109.50 | 879,028 | 1.7 | | 1/31/2027 |
| The Cheesecake Factory | NR/NR/NR | 8,077 | 2.0 | | $105.00 | 848,085 | 1.6 | | 1/31/2037 |
| Subtotal/Wtd. Average | 49,386 | 12.0 | % | 148.74 | $7,345,580 | 13.9 | % | |
| Other Tenants | | 222,284 | 53.9 | | $168.84 | 37,530,596 | 71.1 | | |
| Occupied Collateral Total | | 392,927 | 95.4 | % | $134.36 | $52,793,713 | 100.0 | % | |
| Vacant Space(8) | | 19,106 | 4.6 | % | | | | |
| Collateral Total | | 412,033 | 100.0 | % | | | | |
| | | | | | | | |
| (1) | Based on the underwritten rent roll dated as of October 7, 2024 and exclusive of 556,724 square feet associated with Macy’s and JCPenney, both of which are non-collateral anchors. |
| (2) | Certain ratings are those of the parent company whether or not the parent guarantees the lease. |
| (3) | Primark has the right to terminate its lease if its gross sales between December 2027 and November 2028 do not exceed $23,000,000, provided it gives notice within 90 days following November 30, 2028, with the payment of a termination fee in an amount equal to the unamortized portion, as of the end of the fifth lease year, of the sum of certain allowances for construction and other interior work amortized on a straight-line basis over the period from the rent commencement date through the effective date of termination. |
| (4) | ZARA has the right to terminate its lease, provided it gives notice 270 days prior to either (i) December 31, 2028 or (ii) May 31, 2031, with the payment of a termination fee in an amount equal to the unamortized portion, as of the end of the fifth lease year, of the sum of certain allowance for construction work amortized on a straight-line basis over the period from the rent commencement date through the effective date of termination. |
| (5) | H&M has the right to terminate its lease if its gross sales (i) between January 2028 and December 2028 do not exceed $16,000,000 or (ii) between January 2031 and December 2031 do not exceed $18,000,000, in each case, provided that it gives notice within 120 days following such period, with the payment of a termination fee in an amount equal to 50% (if terminated based on sales in 2028) or 25% (if terminated based on sales in 2031) of the unamortized portion of the sum of certain allowance for construction and other interior work amortized on a straight-line basis over the period from the rent commencement date through the effective date of termination. |
| (6) | If Adidas' gross sales for calendar year 2024 (the "Test Period") do not exceed $7,000,000, any time during the 60-day period immediately following the Test Period, Adidas will have the one-time right to terminate its lease upon 90 days' prior written notice and the payment of termination fee in an amount equal to five times the monthly fixed minimum rent and monthly amount of the tenant's share of variable costs as set forth in the lease and in effect on the date of tenant's notice to terminate its lease. Adidas' sales for the TTM July 2024 period were $5,438,309. |
| (7) | During the period commencing January 2024 and continuing through December 2024 (“Rent Reduction Period”), in lieu of fixed minimum rent and percentage rent set forth in the lease, Adidas benefits from reduced monthly rent in the amount of (a) $92,058.75 plus (b) the product obtained by multiplying 6% by annual gross sales in excess of $14,452,452.47. |
| (8) | Vacant Space includes 8,351 square feet currently occupied by tenants known to be vacacting that is underwritten as vacant. The Queens Center Property was 97.4% physically occupied inclusive of such tenants as of October 7, 2024. |
THE INFORMATION IN THIS STRUCTURAL AND COLLATERAL TERM SHEET IS NOT COMPLETE AND MAY BE AMENDED PRIOR TO THE TIME OF SALE. THIS TERM SHEET IS NOT AN OFFER TO SELL THESE SECURITIES AND IT IS NOT A SOLICITATION OF AN OFFER TO BUY THESE SECURITIES IN ANY JURISDICTION WHERE THE OFFER OR SALE IS NOT PERMITTED. |
| | 40 | |
| Structural and Collateral Term Sheet | | BMO 2024-5C8 |
| No. 1 – Queens Center |
The following table presents certain information relating to the lease rollover schedule at the Queens Center Property:
| Lease Rollover Schedule(1)(2) |
| Year | Number of Leases Expiring | Net Rentable Area Expiring(3) | % of NRA Expiring(3) | UW Base Rent Expiring | % of UW Base Rent Expiring | Cumulative Net Rentable Area Expiring | Cumulative % of NRA Expiring(3) | Cumulative UW Base Rent Expiring | Cumulative % of UW Base Rent Expiring |
| Vacant | NAP | 19,106 | 4.6 | % | NAP | NA | P | 19,106 | | 4.6% | NAP | NAP | |
| 2024 & MTM | 10 | 21,754 | 5.3 | | $4,334,114 | 8.2 | % | 40,860 | | 9.9% | $4,334,114 | 8.2% | |
| 2025 | 28 | 77,642 | 18.8 | | 9,690,548 | 18.4 | | 118,502 | | 28.8% | $14,024,662 | 26.6% | |
| 2026 | 17 | 37,142 | 9.0 | | 7,896,124 | 15.0 | | 155,644 | | 37.8% | $21,920,786 | 41.5% | |
| 2027 | 13 | 25,249 | 6.1 | | 3,456,921 | 6.5 | | 180,893 | | 43.9% | $25,377,707 | 48.1% | |
| 2028 | 11 | 19,816 | 4.8 | | 3,090,862 | 5.9 | | 200,709 | | 48.7% | $28,468,570 | 53.9% | |
| 2029 | 16 | 32,294 | 7.8 | | 6,424,947 | 12.2 | | 233,003 | | 56.5% | $34,893,516 | 66.1% | |
| 2030 | 5 | 8,572 | 2.1 | | 1,167,451 | 2.2 | | 241,575 | | 58.6% | $36,060,968 | 68.3% | |
| 2031 | 1 | 389 | 0.1 | | 175,873 | 0.3 | | 241,964 | | 58.7% | $36,236,841 | 68.6% | |
| 2032 | 2 | 11,788 | 2.9 | | 1,966,221 | 3.7 | | 253,752 | | 61.6% | $38,203,062 | 72.4% | |
| 2033 | 8 | 52,114 | 12.6 | | 3,599,219 | 6.8 | | 305,866 | | 74.2% | $41,802,281 | 79.2% | |
| 2034 | 10 | 12,981 | 3.2 | | 3,290,888 | 6.2 | | 318,847 | | 77.4% | $45,093,170 | 85.4% | |
| 2035 & Beyond | 8 | 93,186 | 22.6 | | 7,700,543 | 14.6 | | 412,033 | | 100.0% | $52,793,713 | 100.0% | |
| Total | 129 | 412,033 | 100.0 | % | $52,793,713 | 100.0 | % | | | | |
| (1) | Based on the underwritten rent roll as of October 7, 2024. |
| (2) | Certain tenants may have lease termination options that were not taken into account in the Lease Rollover Schedule. |
| (3) | Net Rentable Area Expiring, % of NRA Expiring and Cumulative % of NRA Expiring are exclusive of 556,724 square feet associated with Macy’s and JCPenney, both of which are non-collateral anchor tenants. |
THE INFORMATION IN THIS STRUCTURAL AND COLLATERAL TERM SHEET IS NOT COMPLETE AND MAY BE AMENDED PRIOR TO THE TIME OF SALE. THIS TERM SHEET IS NOT AN OFFER TO SELL THESE SECURITIES AND IT IS NOT A SOLICITATION OF AN OFFER TO BUY THESE SECURITIES IN ANY JURISDICTION WHERE THE OFFER OR SALE IS NOT PERMITTED. |
| | 41 | |
| Structural and Collateral Term Sheet | | BMO 2024-5C8 |
| No. 1 – Queens Center |
The following table presents certain information relating to the historical operating results and underwritten cash flows of the Queens Center Property:
| Operating History and Underwritten Net Cash Flow |
| | 2019 | 2020 | 2021 | 2022 | 2023 | TTM(1) | Underwritten | Per Square Foot | %(2) |
Rents in Place(3) | $67,057,833 | $59,301,650 | $52,916,768 | $51,918,944 | $52,818,458 | $51,520,695 | $52,793,713 | $128.13 | 50.2 | % |
| Rent Steps | 0 | 0 | 0 | 0 | 0 | 0 | 1,247,807 | 3.03 | 1.2 | |
| Vacant Income | 0 | 0 | 0 | 0 | 0 | 0 | 4,370,011 | 10.61 | 4.2 | |
| Gross Potential Income | $67,057,833 | $59,301,650 | $52,916,768 | $51,918,944 | $52,818,458 | $51,520,695 | $58,411,531 | $141.76 | 55.6 | % |
| Reimbursements | 30,790,847 | 29,765,742 | 27,453,264 | 29,305,910 | 29,580,066 | 30,900,451 | 31,470,373 | 76.38 | 29.9 | |
| Percentage Rent | 87,927 | 284,409 | 1,504,768 | 1,176,649 | 211,061 | 4,663 | 0 | 0.00 | 0.0 | |
| Other Income(4) | 18,077,641 | 9,515,462 | 14,790,599 | 20,746,611 | 16,405,772 | 15,580,030 | 15,262,235 | 37.04 | 14.5 | |
| Net Rental Income | $116,014,248 | $98,867,263 | $96,665,399 | $103,148,114 | $99,015,357 | $98,005,839 | $105,144,139 | $255.18 | 100.0 | % |
| (Vacancy/Bad Debt)(5) | (482,316) | (7,429,704) | 3,086,693 | (396,362) | 285,757 | (1,035,603) | (4,370,011) | (10.61) | (4.2 | ) |
| Effective Gross Income | $115,531,932 | $91,437,559 | $99,752,092 | $102,751,752 | $99,301,114 | $96,970,236 | $100,774,128 | $244.58 | 95.8 | % |
| Real Estate Taxes | 28,285,488 | 29,999,255 | 29,577,588 | 27,309,540 | 26,831,221 | 26,587,630 | 26,925,545 | 65.35 | 26.7 | |
| Insurance | 254,934 | 356,236 | 424,981 | 453,227 | 419,257 | 486,435 | 531,957 | 1.29 | 0.5 | |
| Management Fee | 1,106,734 | 952,496 | 923,502 | 1,003,129 | 876,335 | 860,247 | 1,000,000 | 2.43 | 1.0 | |
| Ground Rent Expense | 441,719 | 441,719 | 461,478 | 471,358 | 471,358 | 502,544 | 608,041 | 1.48 | 0.6 | |
| Other Operating Expenses | 17,087,387 | 11,923,051 | 16,497,949 | 18,037,954 | 18,220,668 | 18,803,076 | 18,088,019 | 43.90 | 17.9 | |
| Total Expenses | $47,176,262 | $43,672,757 | $47,885,498 | $47,275,208 | $46,818,839 | $47,239,932 | $47,153,562 | $114.44 | 46.8 | % |
| Net Operating Income | $68,355,670 | $47,764,802 | $51,866,594 | $55,476,544 | $52,482,275 | $49,730,304 | $53,620,566 | $130.14 | 53.2 | % |
| Capital Expenditures | 0 | 0 | 0 | 0 | 0 | 0 | 119,490 | 0.29 | 0.1 | |
| TI/LC | 0 | 0 | 0 | 0 | 0 | 0 | 968,757 | 2.35 | 1.0 | |
| Net Cash Flow(6) | $68,355,670 | $47,764,802 | $51,866,594 | $55,476,544 | $52,482,275 | $49,730,304 | $52,532,319 | $127.50 | 52.1 | % |
| (1) | TTM represents the trailing 12-month period ending September 30, 2024. |
| (2) | % column represents percent of Net Rental Income for all revenue lines and represents percent of Effective Gross Income for the remainder of fields. |
| (3) | Based on the underwritten rent roll as of October 7, 2024. |
| (4) | Other Income is based on the borrower sponsor’s budget and includes income from parking, business development/advertising, specialty leasing, overage rent and other miscellaneous income. |
| (5) | Vacancy/Bad Debt reflects bad debt for historical periods and vacancy for Underwritten. Positive periods reflect recovery of bad debt. |
| (6) | The decrease in Net Cash Flow from 2019 to 2020 and subsequent increase from 2020 to 2021 is primarily attributable to impacts from the COVID-19 pandemic. |
Appraisal. According to the appraisal, the Queens Center Property had an “as-is” appraised value of $1,060,000,000 as of September 19, 2024. The table below shows the appraisal’s “as-is” conclusions:
| Appraisal Valuation Summary(1) |
| Appraisal Approach | Appraised Value | Capitalization Rate(2) |
| Direct Capitalization Approach | $1,060,000,000 | 5.25% |
| (2) | The appraisal used a discounted cash flow approach to arrive at the appraised value. The capitalization rate shown above represents the overall capitalization rate. |
Environmental. According to the Phase I environmental site assessment dated October 18, 2024, there was no evidence of any recognized environmental conditions at the Queens Center Property.
The Market. The Queens Center Property is located in the Elmhurst neighborhood of Queens, New York. Elmhurst is a densely populated area with a mix of residential and commercial developments. The neighborhood is well-connected via public transportation, including the Long Island Rail Road and New York City subway system, providing access to Manhattan and other parts of the city. The area is characterized by a diverse population and a variety of housing types, including multi-tenant rentals and cooperative apartments. In 2023, the average household income in a one-, three- and five-mile radius was $86,791, $92,204 and $98,765, respectively. In 2023, the population within the same radii was 191,469, 907,210, and 2,357,847, respectively.
THE INFORMATION IN THIS STRUCTURAL AND COLLATERAL TERM SHEET IS NOT COMPLETE AND MAY BE AMENDED PRIOR TO THE TIME OF SALE. THIS TERM SHEET IS NOT AN OFFER TO SELL THESE SECURITIES AND IT IS NOT A SOLICITATION OF AN OFFER TO BUY THESE SECURITIES IN ANY JURISDICTION WHERE THE OFFER OR SALE IS NOT PERMITTED. |
| | 42 | |
| Structural and Collateral Term Sheet | | BMO 2024-5C8 |
| No. 1 – Queens Center |
The Queens Center Mall benefits from its location and strong tenant mix, making it a key retail center in the region. Notably, Apple is a significant draw, with TTM July 2024 sales of approximately $130 million. According to the appraisal, the Queens retail market, as of the second quarter of 2024, had a total inventory is approximately 5.7 million square feet with an 11.3% vacancy rate.
As the only enclosed super regional shopping center in Queens County, the Queens Center Property serves a trade area of 2.4 million people and approximately 861,000 households. Queens County spans 108.1 square miles and is home to 2.4 million residents, making Queens the 4th densest county in the United States. The Queens Center Mall’s trade area is characterized by a dynamic and culturally rich population with an average household income approximately of $104,000. The Queens Center Mall has four power centers and four super-regional retail centers in its market; however, the Queens Center Mall offers superior access via car, bus, subway or foot, as it is located adjacent to a highly trafficked subway station and the intersection of Queens Boulevard, Woodhaven Boulevard, and the Long Island Expressway.
The following table presents certain information relating to the appraisal’s market rent conclusions for the Queens Center Property:
| Market Rent Summary(1) |
| | Market Rent (PSF) | Lease Term (Yrs.) | Rent Increase Projections | New Tenant Improvements PSF | Renewal Tenant Improvements PSF |
| 0 – 1,000 SF | $225.00 | 5 | 3% per annum | $100.00 | $25.00 |
| 1,001 – 2,000 SF | $200.00 | 5 | 3% per annum | $100.00 | $25.00 |
| 2,001 – 3,000 SF | $200.00 | 5 | 3% per annum | $100.00 | $25.00 |
| 3,001 – 5,000 SF | $175.00 | 5 | 3% per annum | $100.00 | $25.00 |
| 5,001 – 7,500 SF | $150.00 | 10 | 3% per annum | $100.00 | $25.00 |
| 7,501+ SF | $150.00 | 10 | 3% per annum | $100.00 | $25.00 |
| Jewelry | $400.00 | 10 | 3% per annum | $100.00 | $25.00 |
| Food Court | $410.00 | 10 | 3% per annum | $250.00 | $75.00 |
| Kiosk 0-100 SF | $2,000.00 | 5 | 3% per annum | $0.00 | $0.00 |
| Kiosk 100+ SF | $650.00 | 5 | 3% per annum | $0.00 | $0.00 |
| Major | $75.00 | 10 | 10% in Year 6 | $100.00 | $25.00 |
| Junior Anchor | $50.00 | 10 | 10% in Year 6 | $100.00 | $25.00 |
THE INFORMATION IN THIS STRUCTURAL AND COLLATERAL TERM SHEET IS NOT COMPLETE AND MAY BE AMENDED PRIOR TO THE TIME OF SALE. THIS TERM SHEET IS NOT AN OFFER TO SELL THESE SECURITIES AND IT IS NOT A SOLICITATION OF AN OFFER TO BUY THESE SECURITIES IN ANY JURISDICTION WHERE THE OFFER OR SALE IS NOT PERMITTED. |
| | 43 | |
| Structural and Collateral Term Sheet | | BMO 2024-5C8 |
| No. 1 – Queens Center |
The table below presents certain information relating to retail centers comparable to the Queens Center Property identified by the appraisal:
| Competitive Set(1) |
| Property Name | Year Built/Renovated | Total NRA | Total Occupancy | Anchor / Major Tenants | Distance to Queens Center Property |
| Queens Center | 1973 / 2004 | 412,033(2) | 95.4%(2) | Primark, ZARA(2) | NAP |
| Queens Place Retail Center | 1965 / 1999, 2001 | 445,953 | 96.0% | Target, Macy’s Furniture Store, DSW Shoes, Best Buy, Lidl | One Block North |
| Rego Park Center I | 1996 / 2005 | 342,869 | 75.0% | Burlington, Marshalls | Two Blocks South |
| Rego Park Center II | 2010 / NAP | 616,820 | 100.0% | Costco, At Home, Aldi, Petco, TJ Maxx | Two Blocks South |
| The Shops at Atlas Park | 2006 / NAP | 372,000 | 95.0% | Ashley Furniture, Forever 21, HomeGoods, NYSC, Regal Cinemas, Ulta, TJ Maxx | 1.8 Miles South |
| Kings Plaza(3) | 1969 / 2018 | 1,146,035 | 88.0% | Burlington, Lowe’s, Macy’s, Target, Primark | 10.0 Miles South |
| Green Acres Mall(3) | 1956 / 2016 | 2,075,000 | 93.0% | Macy’s, Kohl’s, Primark | 11.0 Miles Southeast |
| Staten Island Mall(3) | 1972 / 2018 | 1,700,000 | 94.0% | Primark, JC Penney, Macy’s, Lidl, AMC Theatres | 22.0 Miles Southwest |
| Roosevelt Field | 1956 / 2014 | 2,330,000 | 98.0% | Bloomingdale’s, JC Penney, Primark, Macy’s, Nordstrom, Dick’s Sporting Goods, Neiman Marcus | 15.0 Miles East |
| Weighted Average | | | 93.9%(4) | | |
| (1) | Source: Appraisal, unless otherwise specified. |
| (2) | Based on the underwritten rent roll dated as of October 7, 2024 and does not include 556,724 SF of space associated with Macy’s and JCPenney which are non-collateral anchor tenants. |
| (3) | Owned by the borrower sponsor. |
| (4) | Weighted Average excludes the Queens Center Property. |
The Borrowers. The borrowers are Queens Center SPE LLC (the “Property Borrower”) and Queens Center Pledgor LLC (the “Pledgor Borrower”; together with the Property Borrower, the “Borrowers”), each a Delaware limited liability company and single purpose entity with two independent directors. Legal counsel to the Borrowers delivered a non-consolidation opinion in connection with the origination of the Queens Center Whole Loan.
The Borrower Sponsor. The borrower sponsor and non-recourse carveout guarantor is The Macerich Partnership, L.P., which is a subsidiary of The Macerich Company (“Macerich”). Macerich is a fully integrated, self-managed and self-administered real estate investment trust. Developing and managing properties that serve as community cornerstones, Macerich currently owns 44 million square feet of real estate consisting primarily of interests in 41 retail centers.
Property Management. The Queens Center Property is currently managed by Macerich Property Management Company, LLC an affiliate of the Borrowers.
Escrows and Reserves. On the loan origination date, the Borrowers were required to make an upfront deposit of $11,562,092 into a reserve for outstanding tenant improvements and leasing commissions and $649,442 for gap rent.
Real Estate Taxes – During the continuance of an Trigger Period (as defined below), the Borrowers are required to deposit into a real estate tax reserve, on a monthly basis, an amount equal to 1/12th of the real estate taxes that the lender estimates will be payable during the next ensuing 12 months (initially estimated to be approximately $2,243,795 monthly).
Insurance – During the continuance of a Trigger Period, unless the Queens Center Property is insured under an acceptable blanket policy and no event of default for which the lender has commenced an enforcement action is continuing, the Borrowers are required to escrow 1/12th of the annual estimated insurance payments on a monthly basis. A blanket insurance policy was in place at closing.
Replacement Reserve – During the continuance of a Trigger Period, the Borrowers are required to escrow approximately $8,584 on a monthly basis for replacement reserves, subject to a cap of $206,017.
TI/LC Reserve – During the continuance of a Trigger Period, the Borrowers are required to escrow approximately $26,728 on a monthly basis for ongoing rollover reserves, subject to a cap of $641,476.
THE INFORMATION IN THIS STRUCTURAL AND COLLATERAL TERM SHEET IS NOT COMPLETE AND MAY BE AMENDED PRIOR TO THE TIME OF SALE. THIS TERM SHEET IS NOT AN OFFER TO SELL THESE SECURITIES AND IT IS NOT A SOLICITATION OF AN OFFER TO BUY THESE SECURITIES IN ANY JURISDICTION WHERE THE OFFER OR SALE IS NOT PERMITTED. |
| | 44 | |
| Structural and Collateral Term Sheet | | BMO 2024-5C8 |
| No. 1 – Queens Center |
Lockbox / Cash Management. The Queens Center Whole Loan is structured with a hard lockbox and springing cash management. The Borrowers and property manager, as applicable, are required to direct the tenants to pay rent directly into the lockbox account, and to deposit any rents otherwise received in such account within three business days after receipt. So long as no Trigger Period is continuing, the Borrowers will have access to the funds deposited into the lockbox account, and may utilize the lockbox account as its operating account. During the continuance of a Trigger Period, the Borrowers will no longer have any further access to the funds in the lockbox account, and such funds in the lockbox account are required to be swept to a lender-controlled cash management account, and applied and disbursed in accordance with the Queens Center Whole Loan documents, with any excess funds (i) to be deposited into an excess cash flow reserve account held by the lender as cash collateral for the Queens Center Whole Loan during the continuance of such Trigger Period, or (ii) if no Trigger Period is continuing, disbursed to the Borrowers.
A “Trigger Period” means the period commencing upon the occurrence of (i) an event of default or (ii) the debt service coverage ratio is less than 1.40x for two consecutive calendar quarters. A Trigger Period will end (a) with respect to clause (i) above, if the cure of the event of default has been accepted by the lender or (b) with respect to clause (ii) above, (x) the debt service coverage ratio is greater than or equal to 1.40x for two consecutive calendar quarters, or (y) Borrowers will have (1) after the Lockout Release Date, prepaid the Queens Center Whole Loan in an amount that would result in a debt service coverage ratio of 1.40x in accordance with the Queens Center Whole Loan documents or (2) delivered to the lender cash or other securities acceptable to the lender in accordance with the Queens Center Whole Loan documents as additional collateral for the Queens Center Whole Loan in an amount that when added to underwritten net operating income would result in a debt service coverage ratio at least equal to 1.40x.
Subordinate and Mezzanine Debt. None.
Permitted Future Subordinate or Mezzanine Debt. Not permitted.
Partial Release. The Borrowers are permitted to obtain the free release (without prepayment or defeasance) of Out Parcels (as defined below) provided certain conditions are satisfied, including among others, (i) certification by the Borrowers that the release will not materially and adversely affect the use, operations, economic value of, or the revenue produced by (exclusive of the economic value or revenue lost attributable to the Out Parcel being released) the remaining improvements located on the Queens Center Property as a retail shopping center; (ii) the released Out Parcel constitutes a separate tax lot (or the owner of the released Out Parcel is contractually obligated to pay its share of taxes), (iii) compliance with all applicable laws, reciprocal easement and agreement and material leases, and (iv) compliance with REMIC related conditions.
“Out Parcels” means (A) certain real property that is as of the date of any potential release non-income producing and unimproved for tenant occupancy and the release of which does not have a material adverse effect on (i) the business, profits, operations or condition (financial) of the borrowers, (ii) the ability of the borrowers to repay the debt in accordance with the terms of the loan documents, or (iii) the ongoing operations of the remaining Queens Center Property; and (B) certain real property that is as of the date of any potential release non-income producing and improved by structures that (A) were vacant as of the origination date and (B) have been vacant and non-income producing continuously since the origination date and for at least three years prior to the date of any potential release.
Ground Lease. A 17,450 SF portion of the Queens Center Property located on the northeast corner of 92nd Street and 59th Avenue (the “Ground Leased Parcel”) is subject to a ground lease (the “Ground Lease”) between Tiliakos Enterprises LLC, as the ground landlord (the “Ground Landlord”), and the Property Borrower, as the ground tenant (in such capacity, the “Ground Tenant”). The current annual base rent is $595,510, which is required to be adjusted every three years to the greater of (a) $325,000 (which was the initial annual base rent) or (b) the adjusted annual base rent based on the Consumer Price Index. The Ground Lease has a maturity date of May 31, 2048, with no renewal options, but with a purchase option for the Property Borrower, exercisable as follows: Between May 1, 2039 and April 30, 2046, the Ground Landlord must serve notice to the Ground Tenant for the Ground Tenant to purchase the ground-leased parcel (the “Put Right”), with the notice date being deemed to be March 2, 2046, if the Ground Landlord fails to provide such notice by April 30, 2046, and then the Ground Tenant will subsequently have three years to send notice of its acceptance of the Put Right beginning 60 days after Ground Landlord’s notice is sent (the “Call Right”). The Ground Landlord and the Ground Tenant are each required to appoint an appraiser, and to agree to a third, disinterested appraiser, to obtain a fair market value of the Ground Leased Parcel, and the average of the two closest valuations will be treated as the purchase price to be paid by the Ground Tenant for the Ground Leased Parcel.
Shared Tax Lot. A portion of the Queens Center Property to the west of 92nd Street and the Macy’s parcel together constitute a single tax lot (the “Shared Tax Lot”). The real estate taxes on the shared tax lot are allocated between Macy’s
THE INFORMATION IN THIS STRUCTURAL AND COLLATERAL TERM SHEET IS NOT COMPLETE AND MAY BE AMENDED PRIOR TO THE TIME OF SALE. THIS TERM SHEET IS NOT AN OFFER TO SELL THESE SECURITIES AND IT IS NOT A SOLICITATION OF AN OFFER TO BUY THESE SECURITIES IN ANY JURISDICTION WHERE THE OFFER OR SALE IS NOT PERMITTED. |
| | 45 | |
| Structural and Collateral Term Sheet | | BMO 2024-5C8 |
| No. 1 – Queens Center |
and the Property Borrower under a reciprocal easement agreement (the “REA”). Under the REA, Macy’s pays approximately 40% of the total property taxes assessed against the shared tax lot to the Property Borrower, who then makes the required tax payments. There are no other operating covenants in place governing the operation of the Shared Tax Lot.
In the event of default under the Queens Center Whole Loan documents, the lender has the right to require, among other related rights, the Borrowers to exercise the rights of the Property Borrower under the REA to pursue the creation of a separate tax lot for the portion of the Queens Center Property that is part of the Shared Tax Lot, such that no portion of the Queens Center Property shares a tax lot with any real property that is not subject to the lien of the Queens Center Whole Loan.
In September 2005, the City of New York advised that it would no longer accept deeds for recordation which affect only a portion of a tax lot, although the recordation of mortgages or instruments other than deeds is not affected by this advisement. The borrowers have provided a non-recourse carveout for any losses arising from the lender’s inability to foreclose on the portion of the Queens Center Property that is part of the Shared Tax Lot caused by (i) the City of New York’s refusal to accept for recordation a deed in foreclosure with respect to such portion of the Queens Center Property and (ii) the Borrowers’ failure to promptly pursue the creation of a separate tax lot for the portion of the Queens Center Property comprising the Shared Tax Lot.
THE INFORMATION IN THIS STRUCTURAL AND COLLATERAL TERM SHEET IS NOT COMPLETE AND MAY BE AMENDED PRIOR TO THE TIME OF SALE. THIS TERM SHEET IS NOT AN OFFER TO SELL THESE SECURITIES AND IT IS NOT A SOLICITATION OF AN OFFER TO BUY THESE SECURITIES IN ANY JURISDICTION WHERE THE OFFER OR SALE IS NOT PERMITTED. |
| | 46 | |
| Structural and Collateral Term Sheet | | BMO 2024-5C8 |
| No. 2 – 310 Grand Concourse |

THE INFORMATION IN THIS STRUCTURAL AND COLLATERAL TERM SHEET IS NOT COMPLETE AND MAY BE AMENDED PRIOR TO THE TIME OF SALE. THIS TERM SHEET IS NOT AN OFFER TO SELL THESE SECURITIES AND IT IS NOT A SOLICITATION OF AN OFFER TO BUY THESE SECURITIES IN ANY JURISDICTION WHERE THE OFFER OR SALE IS NOT PERMITTED. |
| | 47 | |
| Structural and Collateral Term Sheet | | BMO 2024-5C8 |
| No. 2 – 310 Grand Concourse |
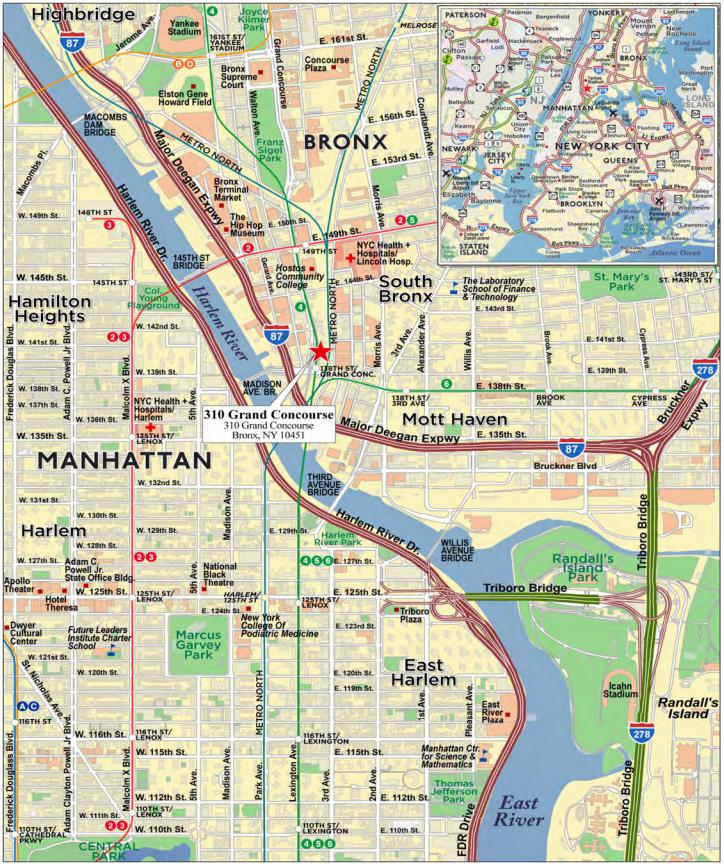
THE INFORMATION IN THIS STRUCTURAL AND COLLATERAL TERM SHEET IS NOT COMPLETE AND MAY BE AMENDED PRIOR TO THE TIME OF SALE. THIS TERM SHEET IS NOT AN OFFER TO SELL THESE SECURITIES AND IT IS NOT A SOLICITATION OF AN OFFER TO BUY THESE SECURITIES IN ANY JURISDICTION WHERE THE OFFER OR SALE IS NOT PERMITTED. |
| | 48 | |
| Structural and Collateral Term Sheet | | BMO 2024-5C8 |
| No. 2 – 310 Grand Concourse |
| Mortgage Loan Information | | Property Information |
| Mortgage Loan Seller: | BMO, GCMC, Barclays | | Single Asset / Portfolio: | Single Asset |
| Original Principal Balance: | $70,750,000 | | Title: | Fee |
| Cut-off Date Principal Balance: | $70,750,000 | | Property Type – Subtype: | Multifamily – High Rise |
| % of IPB: | 7.1% | | Net Rentable Area (Units)(1): | 150 |
| Loan Purpose: | Refinance | | Location: | Bronx, NY |
| Borrower: | 310 Grand Concourse LLC | | Year Built / Renovated: | 2023 / NAP |
| Borrower Sponsors: | Simon Kaufman and Yoel Kaufman | | Occupancy(2): | 96.7% |
| Interest Rate: | 6.21000% | | Occupancy Date: | 11/18/2024 |
| Note Date: | 11/20/2024 | | 4th Most Recent NOI (As of)(3): | NAP |
| Maturity Date: | 12/6/2029 | | 3rd Most Recent NOI (As of)(3): | NAP |
| Interest-only Period: | 60 months | | 2nd Most Recent NOI (As of)(3): | NAP |
| Original Term: | 60 months | | Most Recent NOI (As of): | $5,269,902 (T-3 Ann. 10/31/2024) |
| Original Amortization Term: | None | | UW Economic Occupancy(4): | 96.1% |
| Amortization Type: | Interest Only | | UW Revenues: | $6,294,352 |
| Call Protection: | L(24),D(30),O(6) | | UW Expenses: | $635,092 |
| Lockbox / Cash Management: | Springing / Springing | | UW NOI: | $5,659,260 |
| Additional Debt: | No | | UW NCF: | $5,617,435 |
| Additional Debt Balance: | NAP | | Appraised Value / Per Unit: | $102,000,000 / $680,000 |
| Additional Debt Type: | NAP | | Appraisal Date: | 9/19/2024 |
| | | | | |
| | | | | |
| Escrows and Reserves(5) | | Financial Information |
| | Initial | Monthly | Initial Cap | | Cut-off Date Loan / Unit: | $471,667 |
| Taxes: | $0 | $4,615 | N/A | | Maturity Date Loan / Unit: | $471,667 |
| Insurance: | $91,812 | $12,706 | N/A | | Cut-off Date LTV: | 69.4% |
| Replacement Reserve: | $0 | $3,125 | $75,000 | | Maturity Date LTV: | 69.4% |
| TI/LC: | $0 | $360 | $30,000 | | UW NCF DSCR: | 1.26x |
| | | | | | UW NOI Debt Yield: | 8.0% |
| Sources and Uses |
| Sources | Proceeds | % of Total | | Uses | Proceeds | % of Total | |
| Mortgage Loan | $70,750,000 | 100.0% | | Loan Payoff | $64,717,489 | 91.5 | % |
| | | | | Closing Costs(6) | 3,174,311 | 4.5 | |
| | | | | Upfront Reserves | 91,812 | 0.1 | |
| | | | | Return of Equity | 2,766,388 | 3.9 | |
| Total Sources | $70,750,000 | 100.0% | | Total Uses | $70,750,000 | 100.0 | % |
| (1) | The 310 Grand Concourse Property (as defined below) also contains 4,325 square feet of commercial space. |
| (2) | Occupancy represents residential occupancy only and includes five units master-leased to an affiliate of the borrower sponsors. The commercial space at the 310 Grand Concourse Property is 100.0% leased. |
| (3) | Historical NOI is not available, as the 310 Grand Concourse Property was constructed in 2023. |
| (4) | UW Economic Occupancy is 96.1% for the residential portion of the 310 Grand Concourse Property and 95.0% for the commercial portion. |
| (5) | See “Escrows and Reserves” below for further discussion of reserve information. |
| (6) | Closing Costs include an origination fee / rate buydown of $2,296,100. |
The Loan. The second largest mortgage loan (the “310 Grand Concourse Mortgage Loan”) is secured by the borrower’s fee interest in a 150-unit multifamily property located in the Bronx, New York (the “310 Grand Concourse Property”). The 310 Grand Concourse Mortgage Loan was originated by Greystone Select Company II on November 20, 2024, and Notes A-2 and A-3 were subsequently acquired by Bank of Montreal (“BMO”) and Barclays, respectively. The 310 Grand Concourse Mortgage Loan accrues interest at a rate of 6.21000% per annum on an Actual/360 basis and has an outstanding principal balance as of the Cut-off Date of $70,750,000. The 310 Grand Concourse Mortgage Loan has a five-year term and is interest-only for the full term. The scheduled maturity date of the 310 Grand Concourse Mortgage Loan is December 6, 2029.
The Property. The 310 Grand Concourse Property is a 150-unit high-rise multifamily property built by the borrower sponsors in 2023 for a total cost of approximately $84.4 million. As of November 18, 2024, the residential portion of the 310 Grand Concourse Property was 96.7% leased, inclusive of five units master-leased to an affiliate of and guaranteed by the 310
THE INFORMATION IN THIS STRUCTURAL AND COLLATERAL TERM SHEET IS NOT COMPLETE AND MAY BE AMENDED PRIOR TO THE TIME OF SALE. THIS TERM SHEET IS NOT AN OFFER TO SELL THESE SECURITIES AND IT IS NOT A SOLICITATION OF AN OFFER TO BUY THESE SECURITIES IN ANY JURISDICTION WHERE THE OFFER OR SALE IS NOT PERMITTED. |
| | 49 | |
| Structural and Collateral Term Sheet | | BMO 2024-5C8 |
| No. 2 – 310 Grand Concourse |
Grand Concourse Guarantors (as defined below). The 310 Grand Concourse Property is located on Grand Concourse in the Mott Haven neighborhood of South Bronx, New York. The 310 Grand Concourse Property is located one block from the 138th Street/Grand Concourse subway station, with access to Manhattan via the 4 and 5 subway lines, and proximate to 2 and 6 subway lines and multiple bus routes.
The 310 Grand Concourse Property consists of a 14-story building featuring 150 residential units and 4,325 square feet of commercial space across two units. The 310 Grand Concourse Property also contains a 74-space parking garage that is leased to a third-party operator and shared with the adjacent 322 Grand Concourse building through an easement agreement. The residential units feature studio, 1-bedroom, and 2-bedroom layouts, and of the 150 total units, 45 (30.0% of total units) are designated for affordable housing, while the remaining 105 units (70.0%) are leased as market units. Construction on the 310 Grand Concourse Property was completed in 2023, and leasing began in June 2023.
The 310 Grand Concourse Property adjoins 322 Grand Concourse, which is currently owned by an affiliate of the borrower sponsors, with a shared lobby and amenities, subject to an easement agreement. Amenities include a roof deck, recreation room, yoga room, fitness center, lounge, business center, laundry room, photo studio, party room, bike storage, video game room, pet spa, golf room, outdoor courtyard, and screening room. Units contain stainless steel appliances, custom cabinetry, hardwood flooring and dishwashers, with select units having private balconies.
The commercial space at the 310 Grand Concourse Property is 100% leased to two tenants, which collectively account for 3.6% of underwritten gross potential rent. Commercial tenants include Advanced Bronx Dental PLLC, a dentist office, and Bronx Wine & Spirits Authority Inc., a liquor store.
The 310 Grand Concourse Property benefits from a 35-year 421-a tax abatement from the NYC Department of Housing Preservation & Development and received bonus development rights through the Voluntary Inclusionary Housing Program (“VIH”). The 421-a tax abatement requires the 310 Grand Concourse Property to reserve at least 30% of the units for households earning up to 130% of area median income under affordable housing guidelines. Further, the VIH requires that 24 of the affordable units are reserved for households earning up to 80% of area median income. The 421-a tax abatement phases out in 2057/2058. Of the affordable units, 23 are currently leased to tenants through the Family Homelessness and Eviction Protection Supplement program (“CityFHEPs”).
The following table presents certain information relating to the unit mix at the 310 Grand Concourse Property:
| 310 Grand Concourse Unit Mix |
| Unit Type | No. of Units(1) | % of Total Units(1) | Average Unit Size (SF) (1) | Average Rent Per Unit(1) | Average Rent PSF(1) | Market Rent Per Unit(2) | Market Rent PSF(2) |
| Studio – Market | 10 | 6.7 | % | 569 | $3,142 | $5.52 | $3,510 | $6.17 |
| 1 Bed / 1 Bath – Market | 37 | 24.7 | | 553 | $3,148 | $5.69 | $3,450 | $6.24 |
| 2 Bed / 1 Bath – Market | 47 | 31.3 | | 794 | $4,096 | $5.16 | $4,500 | $5.67 |
| 2 Bed / 1.5 Bath – Market | 11 | 7.3 | | 898 | $4,243 | $4.72 | $4,500 | $5.01 |
| Studio – Affordable | 4 | 2.7 | | 443 | $1,608 | $3.63 | $1,608 | $3.63 |
| 1 Bed / 1 Bath – Affordable | 18 | 12.0 | | 500 | $2,414 | $4.83 | $2,414 | $4.83 |
| 2 Bed / 1 Bath – Affordable | 15 | 10.0 | | 695 | $2,977 | $4.28 | $2,955 | $4.25 |
| 2 Bed / 1.5 Bath – Affordable | 8 | 5.3 | | 870 | $2,078 | $2.39 | $2,078 | $2.39 |
| Collateral Total/Wtd. Avg. | 150 | 100.0 | % | 677 | $3,315 | $4.90 | $3,564 | $5.27 |
| (1) | Based on the underwritten rent roll dated as of November 18, 2024. |
| (2) | Market rent per the appraisal for market rate units and based on the in-place rent for affordable units. |
The Market. According to the appraisal, the 310 Grand Concourse Property is located in the South Bronx multifamily submarket. As of the second quarter of 2024, the South Bronx submarket had an inventory of 65,834 units, Class A monthly market rent of $3,392 per unit, and a vacancy rate of approximately 3.6%.
THE INFORMATION IN THIS STRUCTURAL AND COLLATERAL TERM SHEET IS NOT COMPLETE AND MAY BE AMENDED PRIOR TO THE TIME OF SALE. THIS TERM SHEET IS NOT AN OFFER TO SELL THESE SECURITIES AND IT IS NOT A SOLICITATION OF AN OFFER TO BUY THESE SECURITIES IN ANY JURISDICTION WHERE THE OFFER OR SALE IS NOT PERMITTED. |
| | 50 | |
| Structural and Collateral Term Sheet | | BMO 2024-5C8 |
| No. 2 – 310 Grand Concourse |
The following table presents certain information relating to comparable multifamily rental properties to the 310 Grand Concourse Property:
| Comparable Rental Summary(1) |
| Property | Unit Mix | Average SF per Unit | Average Rent PSF | Average Rent per Unit |
310 Grand Concourse(2) Bronx, NY | Studio – Market 1 Bed / 1 Bath – Market 2 Bed / 1 Bath – Market 2 Bed / 1.5 Bath – Market Studio – Affordable 1 Bed / 1 Bath – Affordable 2 Bed / 1 Bath – Affordable 2 Bed / 1.5 Bath – Affordable | 569 553 794 898 443 500 695 870 | $5.52 $5.69 $5.16 $4.72 $3.63 $4.83 $4.28 $2.39 | $3,142 $3,148 $4,096 $4,243 $1,608 $2,414 $2,977 $2,078 |
445 Gerard Avenue Bronx, NY | Studio 1 Bedroom 2 Bedroom | 622 588 916 | $4.82 $5.78 $4.28 | $2,997 $3,398 $3,921 |
2413 Third Avenue Bronx, NY | Studio 2 Bedroom | 670 812 | $4.76 $5.32 | $3,190 $4,320 |
2455 Third Avenue Bronx, NY | Studio 1 Bedroom 2 Bedroom | 407 531 850 | $7.62 $6.59 $5.76 | $3,100 $3,500 $4,900 |
40 Bruckner Boulevard Bronx, NY | Studio 1 Bedroom 2 Bedroom | 432 578 893 | $7.08 $5.40 $4.54 | $3,060 $3,120 $4,050 |
225 East 138th Street Bronx, NY | 1 Bedroom | 651 | $3.99 | $2,600 |
| (1) | Source: Appraisal, unless otherwise indicated. |
| (2) | Based on the underwritten rent roll dated as of November 18, 2024. |
Environmental. According to the Phase I environmental site assessment dated October 31, 2024, there was no evidence of any recognized environmental conditions or controlled recognized environmental conditions at the 310 Grand Concourse Property.
Appraisal. According to the appraisal valuation dated as of September 19, 2024, the 310 Grand Concourse Property had an “as-is” appraised value of $102,000,000. The table below shows the appraisal’s “as-is” conclusions.
| Appraisal Valuation Summary(1) |
| Appraisal Approach | Appraised Value | Capitalization Rate |
| Direct Capitalization Approach | $102,000,000 | 5.50% |
THE INFORMATION IN THIS STRUCTURAL AND COLLATERAL TERM SHEET IS NOT COMPLETE AND MAY BE AMENDED PRIOR TO THE TIME OF SALE. THIS TERM SHEET IS NOT AN OFFER TO SELL THESE SECURITIES AND IT IS NOT A SOLICITATION OF AN OFFER TO BUY THESE SECURITIES IN ANY JURISDICTION WHERE THE OFFER OR SALE IS NOT PERMITTED. |
| | 51 | |
| Structural and Collateral Term Sheet | | BMO 2024-5C8 |
| No. 2 – 310 Grand Concourse |
The following table presents certain information relating to the operating history and underwritten cash flows at the 310 Grand Concourse Property:
| Operating History and Underwritten Net Cash Flow(1) |
| | T-3 Annualized 10/31/2024 | Underwritten | Per Unit | %(2) | |
| Gross Potential Rent(3) | $6,219,144 | $6,225,800 | $41,505 | 100.0 | % |
| Net Rental Income | $6,219,144 | $6,225,800 | $41,505 | 100.0 | % |
| (Vacancy/Credit Loss)(4) | (720,177) | (244,199) | (1,628) | (3.9 | ) |
| Other Income | 309,943 | 312,751 | 2,085 | 5.0 | |
| Effective Gross Income | $5,808,910 | $6,294,352 | $41,962 | 101.1 | % |
| Total Expenses | $539,008 | $635,091 | $4,234 | 10.1 | % |
| Net Operating Income | $5,269,902 | $5,659,260 | $37,728 | 89.9 | % |
| Total TI/LC, Capex/RR | 0 | 41,825 | 279 | 0.7 | |
| Net Cash Flow | $5,269,902 | $5,617,435 | $37,450 | 89.2 | % |
| (1) | Additional historical financials are not available as the 310 Grand Concourse Property was constructed in 2023. |
| (2) | % column represents percent of Net Rental Income for revenue fields and represents percent of Effective Gross Income for the remainder of fields. |
| (3) | Based on the underwritten rent roll as of November 18, 2024 and includes both residential and commercial Gross Potential Rent. |
| (4) | Underwritten Vacancy is 3.9% for the residential component and 5.0% for the commercial component. |
The Borrower. The borrower is 310 Grand Concourse LLC, a Delaware limited liability company and special purpose entity with two independent directors. Legal counsel to the borrower provided a non-consolidation opinion in connection with the origination of the 310 Grand Concourse Mortgage Loan.
The Borrower Sponsors. The borrower sponsors are Simon Kaufman and Yoel Kaufman, and the guarantors are Simon Kaufman, Yoel Kaufman, and Shmuel Wallerstein (collectively, the “310 Grand Concourse Guarantors”). Simon Kaufman and Yoel Kaufman are the founders of YS Realty NY Inc, YS Builders NY Inc and YNS Management Inc, real estate companies specializing in multifamily development, ownership and management in New York. The borrower sponsors have a combined portfolio of over 28 multifamily and mixed-use properties totaling over 600 units, primarily located in Brooklyn, New York.
Property Management. The 310 Grand Concourse Property is managed by Pointe Management NY LLC, an affiliate of the borrower.
Escrows and Reserves. At origination, the borrower was required to deposit into escrow approximately $91,812 for insurance.
Tax Escrows – On a monthly basis, the borrower is required to escrow 1/12th of the annual estimated tax payments, which currently equates to approximately $4,615.
Insurance Escrows – On a monthly basis, the borrower is required to escrow 1/12th of the annual estimated insurance payments, which currently equates to approximately $12,706.
Replacement Reserves – On a monthly basis, the borrower is required to escrow $3,125 for replacement reserves ($250 per unit annually), subject to a cap of $75,000.
TI/LC Reserves – On a monthly basis, the borrower is required to escrow approximately $360 for tenant improvements and leasing commissions ($1.00 per square foot of commercial space annually), subject to a cap of $30,000.
Lockbox / Cash Management. The 310 Grand Concourse Mortgage Loan is structured with a springing lockbox and springing cash management.
THE INFORMATION IN THIS STRUCTURAL AND COLLATERAL TERM SHEET IS NOT COMPLETE AND MAY BE AMENDED PRIOR TO THE TIME OF SALE. THIS TERM SHEET IS NOT AN OFFER TO SELL THESE SECURITIES AND IT IS NOT A SOLICITATION OF AN OFFER TO BUY THESE SECURITIES IN ANY JURISDICTION WHERE THE OFFER OR SALE IS NOT PERMITTED. |
| | 52 | |
| Structural and Collateral Term Sheet | | BMO 2024-5C8 |
| No. 2 – 310 Grand Concourse |
Upon the occurrence and during the continuance of a 310 Grand Concourse Trigger Event (as defined below), the borrower is required to establish a lender-controlled lockbox account and is thereafter required to (i) deposit, or cause the property manager to immediately deposit, all revenue received by the borrower or the property manager into such lockbox and (ii) cause all rents and revenue from non-residential tenants to be deposited directly into such lockbox. All funds in the lockbox account are required to be swept daily to a cash management account under the control of the lender to be applied and disbursed in accordance with the 310 Grand Concourse Mortgage Loan documents. All excess cash flow remaining in the cash management account after the application of such funds in accordance with the 310 Grand Concourse Mortgage Loan documents is required to be held by the lender in an excess cash flow reserve account as additional collateral for the 310 Grand Concourse Mortgage Loan. To the extent that no 310 Grand Concourse Trigger Event is continuing, all excess cash flow funds are required to be disbursed to the borrower.
A “310 Grand Concourse Trigger Event” will commence upon the earliest of the following: (i) the occurrence of an event of default under the 310 Grand Concourse Mortgage Loan documents or (ii) commencing on or after December 6, 2025, the date on which the debt service coverage ratio is less than 1.10x based on the net cash flow for the trailing 12 months (a “Low DSCR Trigger Event”).
A 310 Grand Concourse Trigger Event will end: (a) with regard to clause (i), upon the cure of such event of default and the lender’s acceptance of such cure in its sole and absolute discretion; or (b) with regard to clause (ii), upon the debt service coverage ratio based on the trailing 12-month period being at least 1.15x for two consecutive calendar quarters.
In order to avoid the commencement of a 310 Grand Concourse Trigger Event Period caused solely by a Low DSCR Trigger Event, the borrower may elect to either (i) deposit cash in an amount that, if such amount had been received by the borrower during the applicable calendar quarter triggering such Low DSCR Trigger Event, would have been sufficient to increase the DSCR to an amount that equals or exceeds 1.15x or (ii) enter into a master lease for the requisite vacant space that shall provide for a monthly base rent in an amount equal to that which would have been sufficient to increase the DSCR to an amount that equals or exceeds 1.15x.
Subordinate and Mezzanine Debt. None.
Permitted Future Subordinate or Mezzanine Debt. Not permitted.
Partial Release. Not permitted.
Ground Lease. None.
THE INFORMATION IN THIS STRUCTURAL AND COLLATERAL TERM SHEET IS NOT COMPLETE AND MAY BE AMENDED PRIOR TO THE TIME OF SALE. THIS TERM SHEET IS NOT AN OFFER TO SELL THESE SECURITIES AND IT IS NOT A SOLICITATION OF AN OFFER TO BUY THESE SECURITIES IN ANY JURISDICTION WHERE THE OFFER OR SALE IS NOT PERMITTED. |
| | 53 | |
| Structural and Collateral Term Sheet | | BMO 2024-5C8 |
| No. 3 – ICONIQ Multifamily Portfolio |
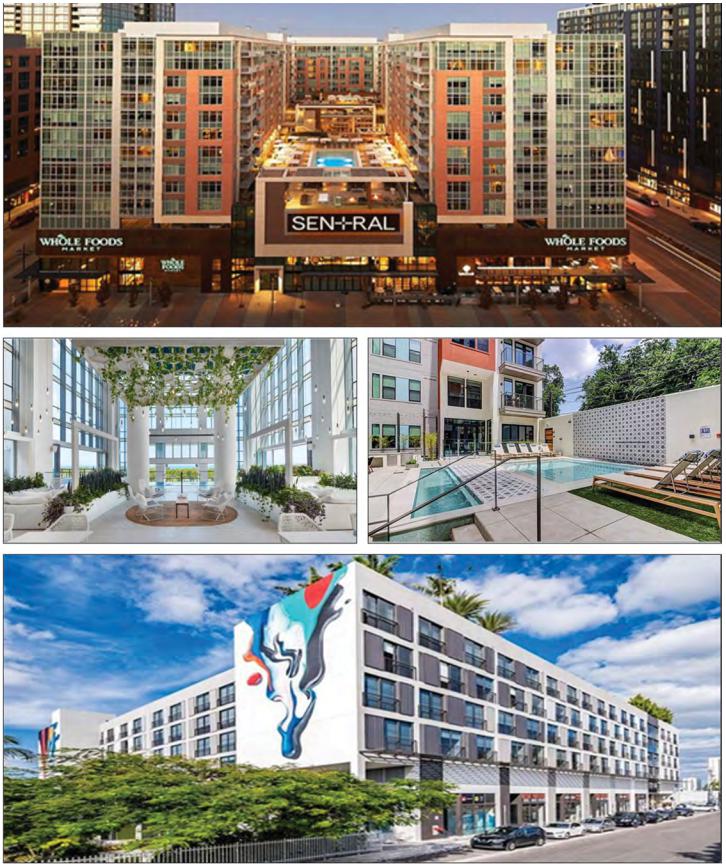
THE INFORMATION IN THIS STRUCTURAL AND COLLATERAL TERM SHEET IS NOT COMPLETE AND MAY BE AMENDED PRIOR TO THE TIME OF SALE. THIS TERM SHEET IS NOT AN OFFER TO SELL THESE SECURITIES AND IT IS NOT A SOLICITATION OF AN OFFER TO BUY THESE SECURITIES IN ANY JURISDICTION WHERE THE OFFER OR SALE IS NOT PERMITTED. |
| | 54 | |
| Structural and Collateral Term Sheet | | BMO 2024-5C8 |
| No. 3 – ICONIQ Multifamily Portfolio |
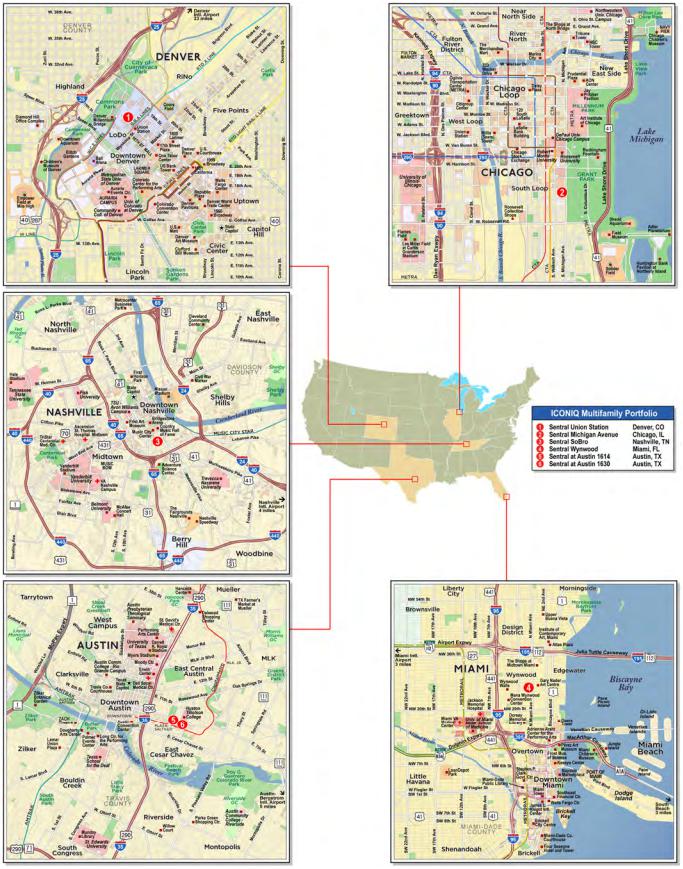
THE INFORMATION IN THIS STRUCTURAL AND COLLATERAL TERM SHEET IS NOT COMPLETE AND MAY BE AMENDED PRIOR TO THE TIME OF SALE. THIS TERM SHEET IS NOT AN OFFER TO SELL THESE SECURITIES AND IT IS NOT A SOLICITATION OF AN OFFER TO BUY THESE SECURITIES IN ANY JURISDICTION WHERE THE OFFER OR SALE IS NOT PERMITTED. |
| | 55 | |
| Structural and Collateral Term Sheet | | BMO 2024-5C8 |
| No. 3 – ICONIQ Multifamily Portfolio |
| Mortgage Loan Information | | Property Information |
| Mortgage Loan Sellers: | GACC, GSMC | | Single Asset / Portfolio: | Portfolio |
| Original Principal Balance(1): | $64,000,000 | | Title: | Various |
| Cut-off Date Principal Balance(1): | $64,000,000 | | Property Type – Subtype: | Multifamily – Various |
| % of IPB: | 6.5% | | Net Rentable Area (Units): | 1,790 |
| Loan Purpose: | Refinance | | Location: | Various, Various |
| Borrower: | Sixth South Partners, LP, IRP Bradley Apartments, LLC, IRP Essex Apartments, LLC, IRP Indie Apartments, LLC, IRP Candela Apartments, LLC and IRP Union Denver Apartments, LLC | | Year Built / Renovated: | Various / NAP |
| Borrower Sponsor: | ICONIQ Residential Partners GP, LP | | Occupancy(5): | 92.2% |
| Interest Rate(2): | 5.179710% | | Occupancy Date: | 9/10/2024 |
| Note Date: | 11/5/2024 | | 4th Most Recent NOI (As of): | NAV |
| Maturity Date: | 11/6/2029 | | 3rd Most Recent NOI (As of): | $34,961,804 (12/31/2022) |
| Interest-only Period: | 60 months | | 2nd Most Recent NOI (As of): | $39,701,158 (12/31/2023) |
| Original Term: | 60 months | | Most Recent NOI (As of): | $40,620,572 (8/31/2024 TTM) |
| Original Amortization Term: | None | | UW Economic Occupancy: | 87.4% |
| Amortization Type: | Interest Only | | UW Revenues: | $81,279,144 |
| Call Protection(3): | YM1(25),DorYM1(28),O(7) | | UW Expenses: | $37,619,484 |
| Lockbox / Cash Management: | Soft / Springing | | UW NOI: | $43,659,660 |
| Additional Debt(1): | Yes | | UW NCF: | $43,287,811 |
| Additional Debt Balance(1): | $236,000,000 / $225,000,000 | | Appraised Value / Per Unit: | $831,600,000 / $464,581 |
| Additional Debt Type(1): | Pari Passu / B Notes | | Appraisal Date: | Various |
| | | | | |
| Escrows and Reserves(4) | | Financial Information(1) |
| | Initial | Monthly | Cap | | | Senior Loan: | Total Debt: |
| Taxes: | $0 | Springing | N/A | | Cut-off Date Loan / Unit: | $167,598 | $293,296 |
| Insurance: | $0 | Springing | N/A | | Maturity Date Loan / Unit: | $167,598 | $293,296 |
| Replacement Reserves: | $0 | $22,375 | N/A | | Cut-off Date LTV: | 36.1% | 63.1% |
| Ground Rent Reserve: | $0 | Springing | N/A | | Maturity Date LTV: | 36.1% | 63.1% |
| Hotel Tax Reserve: | $0 | Springing | N/A | | UW NCF DSCR: | 2.43x | 1.34x |
| | | | | | UW NOI Debt Yield: | 14.6% | 8.3% |
| | | | | | | | |
| Sources and Uses |
| Sources | Proceeds | % of Total | | Uses | Proceeds | % of Total |
| Senior Loan(1): | $300,000,000 | 57.1 | % | | Loan Payoff | $488,485,100 | 93.0 | % |
| Subordinate Companion Loan(1): | 225,000,000 | 42.9 | % | | Closing Costs(6) | 31,399,780 | 6.0 | % |
| | | | | Principal Equity Distribution | 5,115,120 | 1.0 | % |
| Total Sources: | $525,000,000 | 100.0 | % | | Total Uses: | $525,000,000 | 100.0 | % |
| (1) | The ICONIQ Multifamily Portfolio Mortgage Loan (as defined below) is part of a whole loan evidenced by eight senior pari passu promissory notes and two junior promissory notes with an aggregate original principal balance of $525,000,000 (the “ICONIQ Multifamily Portfolio Whole Loan”). The Underwriting and Financial Information presented above is based on the aggregate principal balance of the senior promissory notes. |
| (2) | 5.17971% represents the ICONIQ Multifamily Portfolio Mortgage Loan coupon. The coupon for the ICONIQ Multifamily Portfolio Whole Loan is 6.0715%. The Interest Rate % represents the interest rates associated with Note A-2, Note A-3-3 and Note A-6. Non-Trust Pari Passu Companion Loan Monthly Debt Service ($) is calculated using 6.03352059322034%, which is the weighted average interest rate of Note A-1, Note A 3 1, Note A-3-2, Note A-4 and Note A-5. Underwritten NOI DSCR (x), Underwritten NCF DSCR (x), and Total Trust and Non-Trust Pari Passu Companion Loan Monthly Debt Service ($) are calculated using 5.85137433333333% which is the weighted average interest rate of Note A-1, Note A-2, Note A-3-1, Note A-3-2, Note A-3-3, Note A 4, Note A-5 and Note A-6. |
| (3) | Defeasance of the ICONIQ Multifamily Portfolio Whole Loan, in whole, but not in part, is permitted after the date that is earlier to occur of (i) two years from the closing date of the securitization that includes the last note to be securitized and (ii) November 5, 2027. The assumed defeasance lockout period of 25 payments is based on the closing date of the BMO 2024-5C8 transaction in December 2024. The actual defeasance lockout period may be longer. |
| (4) | Please see “Escrows and Reserves” below for further description of reserve information. |
| (5) | Current Occupancy is based on live units. |
| (6) | Includes $10,500,000 related to a rate buydown |
The Loan. The third largest mortgage loan (the “ICONIQ Multifamily Portfolio Mortgage Loan”) is secured by the borrowers’ cross-collateralized fee simple or leasehold interests in six multifamily properties located across five states (each
THE INFORMATION IN THIS STRUCTURAL AND COLLATERAL TERM SHEET IS NOT COMPLETE AND MAY BE AMENDED PRIOR TO THE TIME OF SALE. THIS TERM SHEET IS NOT AN OFFER TO SELL THESE SECURITIES AND IT IS NOT A SOLICITATION OF AN OFFER TO BUY THESE SECURITIES IN ANY JURISDICTION WHERE THE OFFER OR SALE IS NOT PERMITTED. |
| | 56 | |
| Structural and Collateral Term Sheet | | BMO 2024-5C8 |
| No. 3 – ICONIQ Multifamily Portfolio |
a “ICONIQ Multifamily Portfolio Property”, and collectively the “ICONIQ Multifamily Portfolio Properties” or the “ICONIQ Multifamily Portfolio”).
The ICONIQ Multifamily Portfolio Whole Loan is comprised of eight pari passu componentized senior notes with an aggregate principal balance of $300,000,000 (the “Senior Notes”) and two junior notes with an aggregate principal balance of $225,000,000 (the “Junior Notes”). Two Senior Notes with a principal balance of $170,000,000 and the two Junior Notes were contributed to the ICNQ 2024-MF securitization. The ICONIQ Multifamily Portfolio Mortgage Loan is evidenced by the non-controlling Note A-2, Note A-3-3 and Note A-6 with an aggregate outstanding principal balance as of the Cut-off Date of $64,000,000. The ICONIQ Multifamily Portfolio Whole Loan was co-originated by German American Capital Corporation and Goldman Sachs Bank USA on November 5, 2024. The ICONIQ Multifamily Portfolio Whole Loan accrues interest at a weighted average fixed rate of 6.0715% per annum on an Actual/360 basis. The ICONIQ Multifamily Portfolio Whole Loan has an initial term of 60 months and has a remaining term of 59 months as of the Cut-off Date. The scheduled maturity date of the ICONIQ Multifamily Portfolio Whole Loan is November 6, 2029.
The relationship between the holders of the ICONIQ Multifamily Portfolio Whole Loan is governed by a co-lender agreement as described under “Description of the Mortgage Pool—The Whole Loans—The Non-Serviced AB Whole Loans—The ICONIQ Multifamily Portfolio AB Whole Loan” in the Preliminary Prospectus. The ICONIQ Multifamily Portfolio Whole Loan will be serviced pursuant to the trust and servicing agreement for the ICNQ 2024-MF securitization. See “Pooling and Servicing Agreement—Servicing of the Non-Serviced Whole Loans” in the Preliminary Prospectus.
The table below identifies the promissory notes that comprise the ICONIQ Multifamily Portfolio Whole Loan .
| Whole Loan Summary |
| Note | Original Balance | Cut-off Date Balance | Note Holder | Controlling Piece |
| A-1 | $119,000,000 | $119,000,000 | ICNQ 2024-MF | Yes |
| A-2 | $45,500,000 | $45,500,000 | BMO 2024-5C8 | No |
| A-3-1(1) | $20,000,000 | $20,000,000 | DBRI | No |
| A-3-2(1) | $20,000,000 | $20,000,000 | DBRI | No |
| A-3-3 | $5,500,000 | $5,500,000 | BMO 2024-5C8 | No |
| A-4 | $51,000,000 | $51,000,000 | ICNQ 2024-MF | No |
| A-5 | $26,000,000 | $26,000,000 | WFCM 2024-5C2 | No |
| A-6 | $13,000,000 | $13,000,000 | BMO 2024-5C8 | No |
| Senior Loan | $300,000,000 | $300,000,000 | | |
| B-1 | $157,500,000 | $157,500,000 | ICNQ 2024-MF | No |
| B-2 | $67,500,000 | $67,500,000 | ICNQ 2024-MF | No |
| Subordinate Companion Loan | $225,000,000 | $225,000,000 | | |
| Whole Loan | $525,000,000 | $525,000,000 | | |
| (1) | Expected to be contributed to one or more future securitization transactions. |
The Properties. The ICONIQ Multifamily Portfolio consists of six Class A multifamily properties located in five different states, totaling 1,198 “Live Unfurnished” units, which are traditional multifamily units, 131 “Live Furnished” units and 461 “Stay” units, which are leased for shorter term stays. The ICONIQ Multifamily Portfolio Properties were constructed between 2018 and 2021. As of the September 2024 rent rolls, the Live units (furnished and unfurnished) were 92.2% occupied, with weighted average in-place rent of $2,647/month ($3.40 PSF). The ICONIQ Multifamily Portfolio offers a diverse unit mix with the Live units consisting of 318 Studio units (23.9% of Live units / 490 Avg. SF), 660 One-Bedroom units (49.7% of Live units / 717 Avg. SF), 341 Two-Bedroom units (25.7% of Live units / 1,134 Avg. SF), 6 Three-Bedroom units (0.5% of Live units / 1,408 Avg. SF), and 4 Four-Bedroom units (0.3% of Live units / 2,294 Avg. SF).
The ICONIQ Multifamily Portfolio includes 97,273 SF of commercial tenancy that is 94.9% occupied as of September 10, 2024. See “Commercial Tenancy” below for additional detail.
THE INFORMATION IN THIS STRUCTURAL AND COLLATERAL TERM SHEET IS NOT COMPLETE AND MAY BE AMENDED PRIOR TO THE TIME OF SALE. THIS TERM SHEET IS NOT AN OFFER TO SELL THESE SECURITIES AND IT IS NOT A SOLICITATION OF AN OFFER TO BUY THESE SECURITIES IN ANY JURISDICTION WHERE THE OFFER OR SALE IS NOT PERMITTED. |
| | 57 | |
| Structural and Collateral Term Sheet | | BMO 2024-5C8 |
| No. 3 – ICONIQ Multifamily Portfolio |
The following table sets forth certain information regarding the ICONIQ Multifamily Portfolio Properties:
| Portfolio Summary(1) |
| Property | Market | Live Unfurnished Units | Live Furnished Units | Stay Units | Total Units | Live Occ. | Live In-Place Unit Occupancy | Live In-Place Monthly Rent/Unit | U/W NCF | % of U/W NCF |
| Sentral Union Station | Denver | 489 | 40 | 50 | 579 | 495 | 93.60% | $2,584 | $14,206,940 | 32.8% |
| Sentral Michigan Avenue | Chicago | 362 | 25 | 92 | 479 | 354 | 91.50% | $2,975 | $10,332,467 | 23.9% |
| Sentral SoBro | Nashville | 154 | 0 | 145 | 299 | 146 | 94.80% | $2,825 | $10,325,808 | 23.9% |
| Sentral Wynwood | Miami | 4 | 62 | 109 | 175 | 47 | 71.20% | $3,196 | $4,763,194 | 11.0% |
| Sentral at Austin 1614 | Austin | 87 | 4 | 28 | 119 | 89 | 97.80% | $2,264 | $2,002,210 | 4.6% |
| Sentral at Austin 1630 | Austin | 102 | 0 | 37 | 139 | 94 | 92.20% | $1,546 | $1,657,194 | 3.8% |
| Total / Wtd. Avg.: | | 1,198 | 131 | 461 | 1,790 | 1,225 | 92.20% | $2,647 | $43,287,811 | 100.0% |
| (1) | Source: Appraisal, underwritten cash flow and underwritten rent roll. |
The following table sets forth certain information regarding the ICONIQ Multifamily Portfolio Properties:
| Unit Mix(1) |
| Unit Type(1) | Total Units | Unfurnished Live Units | Furnished Live Units | Stay Units | # of Units | Unit Mix % | Occupied Units | Occ. % | Avg SF/Unit | $/Unit |
| Studio | 430 | 298 | 20 | 112 | 318 | 23.9% | 301 | 94.7% | $490 | 1,873 |
| One-Bedroom | 934 | 570 | 90 | 274 | 660 | 49.7% | 607 | 92.0% | $717 | 2,529 |
| Two-Bedroom | 416 | 320 | 21 | 75 | 341 | 25.7% | 307 | 90.0% | $1,134 | 3,514 |
| Three-Bedroom | 6 | 6 | 0 | 0 | 6 | 0.5% | 6 | 100.0% | $1,408 | 5,082 |
| Four-Bedroom | 4 | 4 | 0 | 0 | 4 | 0.3% | 4 | 100.0% | $2,294 | 8,498 |
| Total / Wtd. Avg.: | 1,790 | 1,198 | 131 | 461 | 1,329 | 100.0% | 1,225 | 92.2% | $778 | 2,647 |
| (1) | Source: Appraisal, underwritten cash flow and underwritten rent roll. |
The following table presents certain information relating to the historical occupancy at the ICONIQ Multifamily Portfolio:
| Historical and Current Occupancy(1) |
| 2022 | 2023 | Current(2)(3) |
| 88.9% | 92.5% | 92.2% |
| (1) | Historical occupancies are as of December 31 of each respective year. |
| (2) | Current Occupancy is as of September 10, 2024. |
| (3) | Current Occupancy is based on live units. |
THE INFORMATION IN THIS STRUCTURAL AND COLLATERAL TERM SHEET IS NOT COMPLETE AND MAY BE AMENDED PRIOR TO THE TIME OF SALE. THIS TERM SHEET IS NOT AN OFFER TO SELL THESE SECURITIES AND IT IS NOT A SOLICITATION OF AN OFFER TO BUY THESE SECURITIES IN ANY JURISDICTION WHERE THE OFFER OR SALE IS NOT PERMITTED. |
| | 58 | |
| Structural and Collateral Term Sheet | | BMO 2024-5C8 |
| No. 3 – ICONIQ Multifamily Portfolio |
The following table presents certain information relating to the major tenants at the ICONIQ Multifamily Portfolio Properties:
| Top Tenant Summary(1) |
| Tenant | Ratings
Moody’s/S&P/Fitch(2) | Net Rentable Area (SF) | % of
Total NRA | UW Base Rent PSF | UW Base Rent | % of Total
UW Base Rent | Lease
Exp. Date |
| Whole Foods Market | A1/AA/AA- | 50,203 | 51.6 | % | $38.52 | $1,933,820 | 47.1% | 11/14/2037 |
| CVS | Baa2/BBB/NR | 8,751 | 9.0 | | $57.24 | 500,907 | 12.2% | 8/31/2043 |
| Ossobuco | NR/NR/NR | 4,207 | 4.3 | | $67.57 | 284,268 | 6.9% | 12/31/2032 |
| The Wall Art Gallery | NR/NR/NR | 4,230 | 4.3 | | $59.57 | 251,976 | 6.1% | 12/16/2027 |
| Zuri | NR/NR/NR | 2,855 | 2.9 | | $81.17 | 231,744 | 5.6% | 3/31/2031 |
| Gyu-Kaku | NR/NR/NR | 3,142 | 3.2 | | $44.04 | 138,374 | 3.4% | 11/30/2028 |
| TABU NASH(3) | NR/NR/NR | 3,222 | 3.3 | | $42.00 | 135,324 | 3.3% | 1/31/2036 |
| House of Mane | NR/NR/NR | 2,115 | 2.2 | | $60.00 | 126,900 | 3.1% | 7/31/2034 |
| The NOW Massage | NR/NR/NR | 2,115 | 2.2 | | $54.83 | 115,968 | 2.8% | 12/21/2033 |
| Maman | NR/NR/NR | 4,202 | 4.3 | | $22.50 | 94,548 | 2.3% | 10/13/2036 |
| Recreation Sports and Social | NR/NR/NR | 2,500 | 2.6 | | $36.57 | 91,428 | 2.2% | 2/29/2028 |
| Form 50 Miami, Inc | NR/NR/NR | 2,115 | 2.2 | | $42.44 | 89,760 | 2.2% | 8/31/2027 |
| Sixt Car Rental(3) | NR/NR/NR | 951 | 1.0 | | $48.00 | 45,648 | 1.1% | 1/31/2030 |
| Wynwood Buggies | NR/NR/NR | 638 | 0.7 | | $48.30 | 30,816 | 0.8% | 10/31/2026 |
| Tipsy Scoop(3) | NR/NR/NR | 1,079 | 1.1 | | $28.00 | 30,212 | 0.7% | 5/31/2035 |
| Total/Wtd. Avg. | 92,325 | 94.9 | % | $44.43 | $4,101,693 | 100.0% | |
| Vacant Space | | 4,948 | 5.1 | | | | | |
| Collateral Total | | 97,273 | 100.0 | % | | | | |
| | | | | | | | |
| (1) | Based on the underwritten rent roll as of September 10, 2024. |
| (2) | In certain instances, ratings provided are those of the parent company of the entity shown, whether or not the parent company guarantees the lease. |
| (3) | Signed but not yet in occupancy. |
THE INFORMATION IN THIS STRUCTURAL AND COLLATERAL TERM SHEET IS NOT COMPLETE AND MAY BE AMENDED PRIOR TO THE TIME OF SALE. THIS TERM SHEET IS NOT AN OFFER TO SELL THESE SECURITIES AND IT IS NOT A SOLICITATION OF AN OFFER TO BUY THESE SECURITIES IN ANY JURISDICTION WHERE THE OFFER OR SALE IS NOT PERMITTED. |
| | 59 | |
| Structural and Collateral Term Sheet | | BMO 2024-5C8 |
| No. 3 – ICONIQ Multifamily Portfolio |
The following table presents certain information relating to the historical operating results and underwritten cash flows of the ICONIQ Multifamily Portfolio Properties:
| Operating History and Underwritten Net Cash Flow(1) |
| | 2022(2) | 2023 | TTM | Underwritten | Per Square Foot | %(3) | |
| Gross Potential Rent | $51,859,233 | $45,005,640 | $43,318,398 | $42,517,436 | $23,753 | 100.0 | % |
| Vacancy | (7,664,052) | (4,336,296) | (3,698,064) | (3,611,845) | (2,018) | (8.5 | ) |
| Non-Revenue Units | (54,951) | (232,353) | (212,680) | (201,763) | (113) | (0.5 | ) |
| Concessions | (1,591,739) | (1,082,373) | (1,309,279) | (1,116,031) | (623) | (2.6 | ) |
| Bad Debt | (306,033) | (670,517) | (929,106) | (425,174) | (238) | (1.0 | ) |
| Gross Potential Income | $42,242,458 | $38,684,102 | $37,169,269 | $37,162,622 | $20,761 | 87.4 | % |
| Other Income(4) | 10,249,650 | 13,832,292 | 16,094,916 | 17,612,303 | 9,839 | 41.4 | |
| Stay Income | 10,913,278 | 21,099,892 | 23,399,121 | 26,504,218 | 14,807 | 62.3 | |
| Effective Gross Income | $63,405,386 | $73,616,286 | $76,663,306 | $81,279,144 | 45,407 | 191.2 | % |
| Real Estate Taxes | 8,612,125 | 8,933,049 | 9,069,650 | 9,844,214 | 5,500 | 12.1 | |
| Insurance | 888,732 | 1,161,948 | 1,413,845 | 1,647,951 | 921 | 2.0 | |
| Ground Rent Expense | 366,762 | 398,175 | 408,393 | 460,094 | 257 | 0.6 | |
| Other Operating Expenses | 18,575,962 | 23,421,956 | 25,150,846 | 25,667,225 | 14,339 | 31.6 | |
| Total Expenses | $28,443,582 | $33,915,128 | $36,042,734 | $37,619,484 | $21,016 | 46.3 | % |
| Net Operating Income | $34,961,804 | $39,701,158 | $40,620,572 | $43,659,660 | $24,391 | 53.7 | % |
| Capital Expenditures | 268,500 | 268,500 | 268,500 | 358,000 | 200 | 0.4 | |
| TI/LC | 0 | 0 | 0 | 13,849 | 8 | 0.0 | |
| Net Cash Flow | $34,693,304 | $39,432,658 | $40,352,072 | $43,287,811 | $24,183 | 53.3 | % |
| (1) | Based on the underwritten cash flow dated September 10, 2024. |
| (2) | 2022 represents February through December 2022 for Sentral SoBro (which was acquired in 2022) and full year end 2022 financials for the remaining ICONIQ Multifamily Portfolio Properties. |
| (3) | % column represents percent of Gross Potential Rent for revenue lines and percent of Effective Gross Income for all remaining fields. |
| (4) | Other Income consists primarily of commercial income, parking income, utility reimbursements resort fee income and homeshare amenity. |
Appraisals. According to the ICONIQ Multifamily Portfolio Properties appraisals dated as of various dates in October 2024, the ICONIQ Multifamily Portfolio Properties had an as-is appraised value of $831,600,000.
| Appraisal Valuation Summary(1) |
| Appraisal Approach | Appraised Value | Capitalization Rate(2) |
| Income Capitalization Approach | $831,600,000 | 5.00% |
| (2) | The appraisals used a discounted cash flow approach to arrive at the appraised value. The capitalization rate shown above represents a weighted average overall capitalization rate of each of the ICONIQ Multifamily Portfolio Properties. |
Environmental. According to the Phase I environmental assessments dated October 14, 2024, there was no evidence of any recognized environmental conditions at the ICONIQ Multifamily Portfolio Properties.
The Market. The ICONIQ Multifamily Portfolio Properties are located in Denver, CO, Chicago, IL, Nashville, TN, Miami, FL and Austin, TX. The following table presents certain information relating to the TTM June 2024 RevPAR Comparison at the ICONIQ Multifamily Portfolio Properties:
THE INFORMATION IN THIS STRUCTURAL AND COLLATERAL TERM SHEET IS NOT COMPLETE AND MAY BE AMENDED PRIOR TO THE TIME OF SALE. THIS TERM SHEET IS NOT AN OFFER TO SELL THESE SECURITIES AND IT IS NOT A SOLICITATION OF AN OFFER TO BUY THESE SECURITIES IN ANY JURISDICTION WHERE THE OFFER OR SALE IS NOT PERMITTED. |
| | 60 | |
| Structural and Collateral Term Sheet | | BMO 2024-5C8 |
| No. 3 – ICONIQ Multifamily Portfolio |
The following table presents certain information relating to comparable units for the ICONIQ Multifamily Portfolio:
| RevPAR Comparison(1) |
| Month | 23-Jan | 23-Feb | 23-Mar | 23-Apr | 23-May | 23-Jun | 23-Jul | 23-Aug | 23-Sep | 23-Oct | 23-Nov | 23-Dec | 24-Jan | 24-Feb | 24-Mar | 24-Apr | 24-May | 24-Jun |
| Live Unfurnished Units | 1,238 | 1,247 | 1,248 | 1,248 | 1,214 | 1,214 | 1,214 | 1,214 | 1,214 | 1,214 | 1,204 | 1,204 | 1,200 | 1,198 | 1,198 | 1,201 | 1,199 | 1,199 |
| ADR | $82 | $82 | $83 | $83 | $83 | $83 | $83 | $84 | $84 | $85 | $85 | $85 | $83 | $83 | $83 | $84 | $86 | $86 |
| Occupancy | 93.6% | 94.0% | 93.1% | 94.9% | 95.9% | 95.3% | 94.2% | 93.6% | 93.4% | 92.0% | 92.2% | 93.3% | 94.8% | 94.8% | 95.7% | 95.9% | 96.4% | 94.9% |
| RevPAR | $77 | $77 | $77 | $79 | $79 | $79 | $78 | $78 | $79 | $78 | $79 | $79 | $79 | $79 | $80 | $80 | $82 | $82 |
| Live Furnished Units | 213 | 204 | 203 | 203 | 172 | 172 | 172 | 172 | 172 | 172 | 172 | 160 | 123 | 118 | 152 | 141 | 134 | 133 |
| ADR | $116 | $118 | $124 | $120 | $124 | $128 | $127 | $124 | $124 | $120 | $116 | $116 | $107 | $114 | $118 | $125 | $137 | $139 |
| Occupancy | 88.4% | 92.3% | 94.5% | 91.1% | 87.3% | 90.1% | 84.6% | 76.9% | 75.9% | 78.7% | 70.4% | 74.8% | 82.2% | 79.3% | 78.1% | 82.4% | 76.5% | 75.1% |
| Rooms Booked | 5,834 | 5,274 | 5,946 | 5,545 | 4,654 | 4,651 | 4,512 | 4,099 | 3,915 | 4,196 | 3,635 | 3,710 | 3,133 | 2,619 | 3,681 | 3,487 | 3,177 | 2,995 |
| RevPAR | $103 | $109 | $117 | $110 | $108 | $116 | $108 | $95 | $94 | $94 | $82 | $87 | $88 | $90 | $92 | $103 | $105 | $105 |
| Stay Units | 339 | 339 | 339 | 339 | 404 | 404 | 404 | 404 | 404 | 405 | 414 | 427 | 436 | 443 | 419 | 448 | 457 | 458 |
| ADR | $157 | $172 | $217 | $212 | $206 | $200 | $189 | $186 | $211 | $239 | $185 | $171 | $174 | $179 | $203 | $202 | $210 | $205 |
| Occupancy | 64.3% | 80.0% | 81.6% | 74.7% | 74.2% | 73.0% | 73.3% | 67.7% | 74.0% | 76.2% | 66.5% | 52.2% | 60.8% | 73.7% | 80.1% | 79.0% | 80.8% | 78.0% |
| Rooms Booked | 6,761 | 7,595 | 8,575 | 7,601 | 9,290 | 8,848 | 9,186 | 8,485 | 8,966 | 9,564 | 8,254 | 6,908 | 8,222 | 9,140 | 10,407 | 10,624 | 11,440 | 10,716 |
| RevPAR | $101 | $138 | $177 | $159 | $153 | $146 | $139 | $126 | $156 | $182 | $123 | $89 | $106 | $132 | $163 | $160 | $170 | $160 |
| RevPAR Premiums | | | | | | | | | | | | | | | | | |
| Live Furnished Premiums | 34.3% | 41.6% | 52.2% | 38.6% | 36.4% | 45.3% | 37.5% | 22.0% | 19.7% | 20.0% | 4.1% | 9.8% | 12.1% | 14.4% | 15.7% | 28.7% | 26.9% | 28.2% |
| Stay Premiums | 32.0% | 78.7% | 130.4% | 100.6% | 93.4% | 83.6% | 76.7% | 61.3% | 98.5% | 131.8% | 56.8% | 12.6% | 34.6% | 66.8% | 103.7% | 99.3% | 105.7% | 95.6% |
The Borrowers. The borrowers are Sixth South Partners, LP, IRP Bradley Apartments, LLC, IRP Essex Apartments, LLC, IRP Indie Apartments, LLC, IRP Candela Apartments, LLC and IRP Union Denver Apartments, LLC, each a Delaware limited liability company or limited partnership structured as a single purpose, bankruptcy-remote entity with two independent directors. Legal counsel to the borrowers delivered a non-consolidation opinion in connection with the origination of the ICONIQ Multifamily Portfolio Whole Loan.
The Borrower Sponsor. The borrower sponsor is ICONIQ Residential Partners GP, LP. The non-recourse carveout guarantors are ICONIQ Residential Partners Fund A, LP, ICONIQ Residential Partners Fund B, LP and ICONIQ Residential Partners Fund C, LP., each a Delaware limited partnership and an affiliate of the borrower sponsor.
Property Management. The ICONIQ Multifamily Portfolio is managed by BHI Residential Corporation, an affiliate of the borrowers.
Escrows and Reserves.
Tax Escrows – During the continuance of a Trigger Period (as defined below), the borrowers are required to deposit into escrow 1/12th of the estimated annual real estate taxes on a monthly basis.
Insurance Escrows – During the continuance of a Trigger Period, the borrowers are required to deposit a monthly amount equal to monthly 1/12th of the annual estimated insurance premiums, unless an acceptable blanket policy is in effect. As of the origination date, an acceptable blanket policy was in place.
Replacement Reserve – On each monthly payment date, the borrowers are required to deposit approximately $22,375 into a capital expenditures account, for the payment and reimbursement of approved capital expenses.
Ground Rent Reserve – During the continuance of a Trigger Period, the borrowers are required to deposit monthly amounts of rent due and payable for the calendar month under the ground lease at the Sentral Michigan Avenue property.
Hotel Tax Reserve – During the continuance of a Trigger Period, the borrowers are required to deposit an amount reasonably budgeted by the borrowers for the payment of sales and occupancy taxes that are anticipated to be payable during such month.
THE INFORMATION IN THIS STRUCTURAL AND COLLATERAL TERM SHEET IS NOT COMPLETE AND MAY BE AMENDED PRIOR TO THE TIME OF SALE. THIS TERM SHEET IS NOT AN OFFER TO SELL THESE SECURITIES AND IT IS NOT A SOLICITATION OF AN OFFER TO BUY THESE SECURITIES IN ANY JURISDICTION WHERE THE OFFER OR SALE IS NOT PERMITTED. |
| | 61 | |
| Structural and Collateral Term Sheet | | BMO 2024-5C8 |
| No. 3 – ICONIQ Multifamily Portfolio |
Lockbox / Cash Management. The ICONIQ Multifamily Portfolio Whole Loan is structured with a soft lockbox with respect to residential rents and springing cash management. The ICONIQ Multifamily Portfolio Whole Loan documents require the borrowers to deliver a notice to all commercial tenants directing them to remit all payments into a lender-controlled clearing account. All gross revenue, including residential rents and any insurance proceeds, received by the borrowers or property manager are required to be deposited into the clearing account within one business day of receipt. Funds in the clearing account will be swept on a daily basis into the borrower’s operating account unless a Trigger Period is continuing, in which event such funds will be swept on a daily basis into a lender-controlled cash management account and disbursed in accordance with the ICONIQ Multifamily Portfolio Whole Loan documents.
A “Trigger Period” will commence upon the following the occurrence of: (i) an event of default under the ICONIQ Multifamily Portfolio Whole Loan documents until cured or waived in writing by the lender or (ii) the debt yield falling below 6.0% for two consecutive calendar quarters (a “Low Debt Yield Period”) until the debt yield is equal to or greater than 6.0% for two consecutive calendar quarters.
The borrowers may prepay the ICONIQ Multifamily Portfolio Whole Loan in an amount such that, if the outstanding principal balance of the ICONIQ Multifamily Portfolio Whole Loan used in the applicable debt yield calculation had been equal to the outstanding principal balance amount of the ICONIQ Multifamily Portfolio Whole Loan after giving effect to such prepayment, the debt yield as of such date would have equaled or exceeded 6.0% (provided that any such prepayment is subject to the payment of any applicable interest shortfall and, if made prior to the open prepayment date is subject to the applicable prepayment fee).
The borrowers may also satisfy the conditions to cure a Trigger Period resulting from a Low Debt Yield Period by delivering cash or a letter of credit as additional collateral for the ICONIQ Multifamily Portfolio Whole Loan in an amount that would be sufficient, if the same were to be deducted from the principal balance of the ICONIQ Multifamily Portfolio Whole Loan, to cause the debt yield to be equal to or greater than 6.0%, at its sole option, to prevent the commencement of a Trigger Period due to the commencement of a Low Debt Yield Period. If the debt yield (without any imputed deduction to the outstanding principal balance of the ICONIQ Multifamily Portfolio Whole Loan) is equal to or greater than 6.0% for two consecutive calendar quarters, the lender will return to the borrowers an amount of the collateral that is not required to satisfy the conditions to cure a Trigger Period resulting from a Low Debt Yield Period.
Subordinate and Mezzanine Debt. The ICONIQ Multifamily Portfolio Whole Loan also includes the ICONIQ Multifamily Portfolio Junior Notes which have an aggregate Cut-off Date principal balance of $225,000,000. The ICONIQ Multifamily Portfolio Junior Notes bear interest at 6.3650% per annum. Payments on the ICONIQ Multifamily Portfolio Junior Notes are generally subordinate to payments on the ICONIQ Multifamily Portfolio Senior Notes, provided that the ICONIQ Multifamily Portfolio Junior Notes receive payments of interest prior to principal payments being made on the ICONIQ Multifamily Portfolio Senior Notes. See “Description of the Mortgage Pool—The Whole Loans—The Non-Serviced AB Whole Loans—The ICONIQ Multifamily Portfolio Whole Loan” in the Preliminary Prospectus.
| Subordinate Note Summary |
| | B-Note Original Principal Balance | B-Note Interest Rate | Original Term (mos.) | Original Amort. Term (mos.) | Original IO Term (mos.) | Whole Loan UW NCF DSCR | Whole Loan UW NOI DY | Whole Loan Cutoff Date LTV |
| ICONIQ Multifamily Portfolio Junior Notes | $225,000,000 | 6.36500% | 60 | 0 | 60 | 1.34x | 8.3% | 63.1% |
Permitted Future Subordinate or Mezzanine Debt. Not Permitted.
Partial Release. The borrowers may at any time, provided no ICONIQ Multifamily Portfolio Whole Loan event of default is continuing (other than as noted below), release one or more ICONIQ Multifamily Portfolio Properties by prepaying the applicable Release Amount (as defined below) of the allocated loan amount of the subject ICONIQ Multifamily Portfolio Properties together with any yield maintenance premium then required (if any), and subject to the following terms and conditions, among others: (i) the debt yield after giving effect to such release (the “Partial Release Required Debt Yield”) is at least equal to the greater of (a) 8.3% or (b) the debt yield immediately prior to the occurrence of such release; (ii) continued compliance with the single purpose entity requirements contained in the ICONIQ Multifamily Portfolio Whole Loan documents; (iii) payment of the lender’s reasonable out-of-pocket costs and expenses; and (iv) satisfaction of any REMIC conditions.
THE INFORMATION IN THIS STRUCTURAL AND COLLATERAL TERM SHEET IS NOT COMPLETE AND MAY BE AMENDED PRIOR TO THE TIME OF SALE. THIS TERM SHEET IS NOT AN OFFER TO SELL THESE SECURITIES AND IT IS NOT A SOLICITATION OF AN OFFER TO BUY THESE SECURITIES IN ANY JURISDICTION WHERE THE OFFER OR SALE IS NOT PERMITTED. |
| | 62 | |
| Structural and Collateral Term Sheet | | BMO 2024-5C8 |
| No. 3 – ICONIQ Multifamily Portfolio |
“Release Amount” with respect to any ICONIQ Multifamily Portfolio Property released, means (x) if the Release Amount paid with respect to the applicable ICONIQ Multifamily Portfolio Property that is subject to a partial release (when aggregated with any prior Release Amounts) is equal to or less than $157,500,000, 105% of the allocated loan amount for such ICONIQ Multifamily Portfolio Property and (y) in all other instances, 110% of the allocated loan amount for such ICONIQ Multifamily Portfolio Property.
In the event that the debt yield following the release does not satisfy the Partial Release Required Debt Yield, the borrower will be permitted to release the subject ICONIQ Multifamily Portfolio Property taking into account any cash or letters of credit previously held or delivered as collateral to cure a Low Debt Yield Period.
Transfers of direct and indirect equity interests in the borrowers will be permitted under certain circumstances so long as the conditions described in “Description of the Mortgage Pool—The Whole Loans—The Non-Serviced AB Whole Loan—The ICONIQ Multifamily Portfolio Whole Loan—Transfer Restrictions” in the Preliminary Prospectus are satisfied.
The borrowers have the right to (x) convey the entire ICONIQ Multifamily Portfolio Whole Loan to a transferee that assumes all of the borrowers’ obligations under the ICONIQ Multifamily Portfolio Whole Loan documents (a “Portfolio Sale”) or (y) to transfer direct or indirect equity interests in the borrowers to a transferee which would not otherwise constitute a permitted transfer under the ICONIQ Multifamily Portfolio Whole Loan documents (an “Equity Sale”), provided, among other things, (i) no event of default under the ICONIQ Multifamily Portfolio Whole Loan documents has occurred and is continuing, (ii) in connection with a Portfolio Sale, the transferee is a special purpose bankruptcy remote entity satisfying the requirements in the ICONIQ Multifamily Portfolio Whole Loan documents and in connection with an Equity Sale, the borrowers continue to be a special purpose bankruptcy remote entities satisfying the requirements in the ICONIQ Multifamily Portfolio Whole Loan documents, (iii) the transferee or the borrowers, as the case may be, is required to be controlled by a person who (a) is a qualified transferee under the ICONIQ Multifamily Portfolio Whole Loan documents, and (b) either satisfies the requirements of an eligible qualified owner under the ICONIQ Multifamily Portfolio Whole Loan documents (or with respect to the experience requirement, engages an unaffiliated qualified property manager that satisfied the experience requirements), (iv) the ICONIQ Multifamily Portfolio Property will be managed by an approved affiliate manager under the ICONIQ Multifamily Portfolio Whole Loan documents, an affiliate of the borrower (in the case of an Equity Sale) or the transferee (in the case of a Portfolio Sale), or another property manager acceptable to the lender, (v) a rating agency confirmation is obtained, (vi) an approved replacement guarantor delivers a replacement, non-recourse carveout guaranty and environmental indemnity, and (vii) the lender receives a transfer fee equal to $500,000.
Ground Lease. The Sentral Michigan Avenue property is subject to a ground lease through December 31, 2114, with no extension options. The current ground rent for the year ending on December 31, 2024, is $410,184.93, payable in equal monthly installments of approximately $34,182. On the first day of January throughout the ground lease term, the base ground rent will be increased by an amount equal to the percentage CPI increase for the immediately preceding year, plus 1%.
THE INFORMATION IN THIS STRUCTURAL AND COLLATERAL TERM SHEET IS NOT COMPLETE AND MAY BE AMENDED PRIOR TO THE TIME OF SALE. THIS TERM SHEET IS NOT AN OFFER TO SELL THESE SECURITIES AND IT IS NOT A SOLICITATION OF AN OFFER TO BUY THESE SECURITIES IN ANY JURISDICTION WHERE THE OFFER OR SALE IS NOT PERMITTED. |
| | 63 | |
| Structural and Collateral Term Sheet | | BMO 2024-5C8 |
| No. 4 – Black Spruce - Briarwood and Prospect |
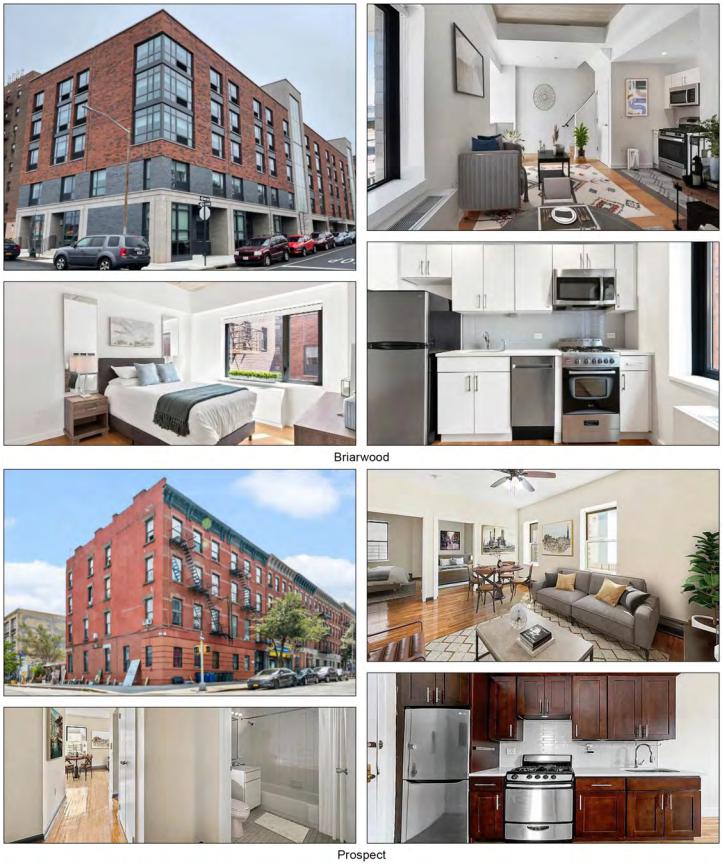
THE INFORMATION IN THIS STRUCTURAL AND COLLATERAL TERM SHEET IS NOT COMPLETE AND MAY BE AMENDED PRIOR TO THE TIME OF SALE. THIS TERM SHEET IS NOT AN OFFER TO SELL THESE SECURITIES AND IT IS NOT A SOLICITATION OF AN OFFER TO BUY THESE SECURITIES IN ANY JURISDICTION WHERE THE OFFER OR SALE IS NOT PERMITTED. |
| | 64 | |
| Structural and Collateral Term Sheet | | BMO 2024-5C8 |
| No. 4 – Black Spruce - Briarwood and Prospect |
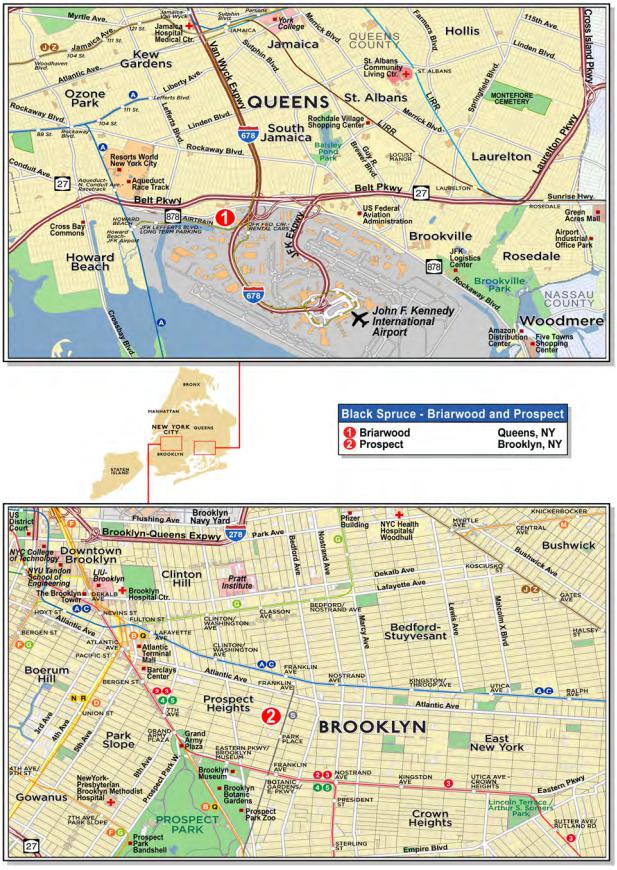
THE INFORMATION IN THIS STRUCTURAL AND COLLATERAL TERM SHEET IS NOT COMPLETE AND MAY BE AMENDED PRIOR TO THE TIME OF SALE. THIS TERM SHEET IS NOT AN OFFER TO SELL THESE SECURITIES AND IT IS NOT A SOLICITATION OF AN OFFER TO BUY THESE SECURITIES IN ANY JURISDICTION WHERE THE OFFER OR SALE IS NOT PERMITTED. |
| | 65 | |
| Structural and Collateral Term Sheet | | BMO 2024-5C8 |
| No. 4 – Black Spruce - Briarwood and Prospect |
| Mortgage Loan Information | | Property Information |
| Mortgage Loan Seller: | GSMC | | Single Asset / Portfolio: | Portfolio |
| Original Principal Balance: | $64,000,000 | | Title: | Fee(3) |
| Cut-off Date Principal Balance: | $64,000,000 | | Property Type – Subtype: | Multifamily – Mid Rise |
| % of IPB: | 6.5% | | Net Rentable Area (Units): | 488 |
| Loan Purpose: | Refinance | | Location: | Various, NY |
| Borrowers: | Briarwood Affordable LLC and Prospect Affordable Package LLC | | Year Built / Renovated: | Various / Various |
| Borrower Sponsor: | Joshua Gotlib | | Occupancy: | 97.3% |
| Interest Rate: | 6.56700% | | Occupancy Date: | 11/5/2024 |
| Note Date: | 11/20/2024 | | 4th Most Recent NOI (As of)(4): | NAV |
| Maturity Date: | 12/6/2029 | | 3rd Most Recent NOI (As of): | $4,770,889 (12/31/2022) |
| Interest-only Period: | 60 months | | 2nd Most Recent NOI (As of): | $6,273,648 (12/31/2023) |
| Original Term: | 60 months | | Most Recent NOI (As of): | $6,347,560 (TTM 8/31/2024) |
| Original Amortization Term: | None | | UW Economic Occupancy: | 97.0% |
| Amortization Type: | Interest Only | | UW Revenues: | $10,968,140 |
| Call Protection: | L(24),D(29),O(7) | | UW Expenses: | $3,539,264 |
| Lockbox / Cash Management: | Soft / Springing | | UW NOI: | $7,428,877 |
| Additional Debt: | Yes | | UW NCF: | $7,289,224 |
| Additional Debt Balance: | $27,230,000 | | Appraised Value / Per Unit(5): | $130,333,000 / $267,076 |
| Additional Debt Type: | Pari Passu | | Appraisal Date(5): | Various |
| | | | | |
| Escrows and Reserves(1) | | Financial Information |
| | Initial | Monthly | Initial Cap | | Cut-off Date Loan / Unit: | $186,947 |
| Taxes(2): | $1,103,826 | $76,800 | N/A | | Maturity Date Loan / Unit: | $186,947 |
| Insurance: | $75,449 | $15,440 | N/A | | Cut-off Date LTV: | 70.0% |
| Replacement Reserves: | $0 | $11,453 | $245,588 | | Maturity Date LTV: | 70.0% |
| TI / LC Reserve: | $0 | $165 | $3,969 | | UW NCF DSCR: | 1.20x |
| Deferred Maintenance Reserve: | $155,584 | $0 | N/A | | UW NOI Debt Yield: | 8.1% |
| | | | | | | |
| Sources and Uses |
| Sources | Proceeds | % of Total | | Uses | Proceeds | % of Total |
| Whole Loan: | $91,230,000 | 97.2 | % | | Loan Payoff: | $87,950,053 | 93.7 | % |
| Equity Contribution: | 2,625,360 | 2.8 | | | Closing Costs(6): | 4,570,448 | 4.9 | |
| | | | | Upfront Reserves: | 1,334,859 | 1.4 | |
| Total Sources | $93,855,360 | 100.0 | % | | Total Uses: | $93,855,360 | 100.0 | % |
| (1) | See “Escrows and Reserves” below for further discussion of reserve information. |
| (2) | The initial taxes reserve consists of $79,991 of a property tax reserve and $1,023,835.28 of a property tax reserve to be used to pay property taxes to the extent the property taxes due with respect to the Briarwood Property (as defined below) for any fiscal year as reasonably determined by the lender exceed the underwritten tax amount in any fiscal year. |
| (3) | By way of a nominee agreement with the City of New York. |
| (4) | 2021 financials are not available due to the Black Spruce - Briarwood and Prospect Portfolio (as defined below) borrower sponsor acquiring the properties in 2021. |
| (5) | Based on the “As Portfolio” appraised value of $130,333,000 which includes an approximately 7.5% portfolio premium. The aggregate as-is appraised value without the portfolio premium is $121,240,000, which results in a Cut-off Date LTV and Maturity Date LTV of 75.2% for the Black Spruce - Briarwood and Prospect Whole Loan (as defined below). All individual appraisal reports are dated between September 19, 2024 and September 23, 2024. |
| (6) | Closing costs include a $1,828,401 rate buydown. |
The Loan. The fourth largest mortgage loan (the “Black Spruce - Briarwood and Prospect Mortgage Loan”) is part of a whole loan (the “Black Spruce - Briarwood and Prospect Whole Loan”) evidenced by two pari passu promissory notes with an aggregate original principal balance of $91,230,000. The Black Spruce - Briarwood and Prospect Mortgage Loan is evidenced by the controlling Note A-1, with an outstanding principal balance as of the Cut-off Date of $64,000,000. The Black Spruce - Briarwood and Prospect Mortgage Loan will be included in the BMO 2024-5C8 securitization trust and represents approximately 6.5% of the Initial Pool Balance. The Black Spruce – Briarwood and Prospect Whole Loan is secured by the fee interests in a 488-unit multifamily portfolio consisting of two individual properties (each a “Black Spruce - Briarwood and Prospect Property” and collectively the “Black Spruce - Briarwood and Prospect Properties”) located in New York City. The fee title to each of the Black Spruce – Briarwood and Prospect Properties is held by HP Briarwood
THE INFORMATION IN THIS STRUCTURAL AND COLLATERAL TERM SHEET IS NOT COMPLETE AND MAY BE AMENDED PRIOR TO THE TIME OF SALE. THIS TERM SHEET IS NOT AN OFFER TO SELL THESE SECURITIES AND IT IS NOT A SOLICITATION OF AN OFFER TO BUY THESE SECURITIES IN ANY JURISDICTION WHERE THE OFFER OR SALE IS NOT PERMITTED. |
| | 66 | |
| Structural and Collateral Term Sheet | | BMO 2024-5C8 |
| No. 4 – Black Spruce - Briarwood and Prospect |
Housing Development Fund Company, Inc. and HP MJM Housing Development Fund Company, Inc., respectively, each a New York City non-profit entity (the “Nominal Owner”) in connection with the affordable housing arrangements at the Black Spruce - Briarwood and Prospect Properties as described under “The Properties,” with all beneficial and equitable ownership interests and control of the Black Spruce - Briarwood and Prospect Properties held by the borrowers pursuant to the related Nominee Agreement. The Nominal Owner has joined the related mortgages and subjected the fee interests in the Black Spruce – Briarwood and Prospect Properties to the lien of the Black Spruce – Briarwood and Prospect Whole Loan for the purposes of availing the properties to mortgage recording tax exemption and Article XI real estate tax abatement. While the record ownership interest is vested in the name of the respective HDFC, the benefits and burdens of ownership are vested in the Borrowers pursuant to the Nominee Agreements. The Black Spruce - Briarwood and Prospect Whole Loan was originated by Goldman Sachs Bank USA on November 20, 2024, has a 5-year interest-only term and accrues interest at a rate of 6.56700% per annum on an Actual/360 basis. The proceeds of the Black Spruce - Briarwood and Prospect Whole Loan were used by the borrowers to refinance the Black Spruce - Briarwood and Prospect Properties and pay origination costs. The scheduled maturity date of the Black Spruce - Briarwood and Prospect Whole Loan is the payment date in December 2029.
The Black Spruce - Briarwood and Prospect Whole Loan will be serviced pursuant to the pooling and servicing agreement for the BMO 2024-5C8 securitization trust. The relationship between the holders of the Black Spruce - Briarwood and Prospect Whole Loan is governed by a co-lender agreement as described under “Description of the Mortgage Pool—The Whole Loans—The Serviced Pari Passu Whole Loans” in the Preliminary Prospectus.
The table below identifies the promissory notes that comprise the Black Spruce – Briarwood and Prospect Whole Loan:
| Whole Loan Summary |
| Note | Original Balance | Cut-off Date Balance | Note Holder | Controlling Piece |
| A-1 | $64,000,000 | $64,000,000 | BMO 2024-5C8 | Yes |
| A-2(1) | $27,230,000 | $27,230,000 | GSBI | No |
| Whole Loan | $91,230,000 | $91,230,000 | | |
| (1) | Expected to be contributed to one or more future securitizations. |
The Properties. The Black Spruce - Briarwood and Prospect Portfolio (the “Black Spruce - Briarwood and Prospect Portfolio” consists of 18 apartment buildings, which comprise the Briarwood property (the “Briarwood Property”) and the Prospect property (the “Prospect Property”). The combined properties are improved with a total of 419,423-square feet of building area and 488 apartments that were completed between 1899 and 2021. The individual buildings in the Black Spruce – Briarwood and Prospect portfolio (the “Black Spruce – Briarwood and Prospect Portfolio”) range in size from 4 to 139 apartments.
The Briarwood Property is located in the Briarwood neighborhood of Queens, New York and is comprised of four properties that benefit from the Article XI tax exemption. As part of the Article XI tax exemption (and due to the age of the buildings), all the Briarwood Property are rent stabilized and leased to tenants that meet certain AMI limits, and in return, the Briarwood Property benefit from a partial tax exemption through December 2062, with a lesser annual payment required in lieu of taxes. The Sponsor acquired the Briarwood Property in December 2021. The Briarwood Property consists of 382 residential units and has an average rent per unit of $1,922. In aggregate, Briarwood is comprised of 44 studios, 200 one-bedrooms, 137 two-bedrooms, and 1 three-bedroom unit.
Under the Briarwood Affordable Housing Regulatory Agreement (the “Regulatory Agreement”), which the related borrower entered into in connection with the Article XI tax exemption, all units at the Briarwood Property are income restricted. The Briarwood Property is not permitted to lease units to households whose income exceeds the limit as of the initial occupancy. However, as the Briarwood Property was occupied prior to the regulatory agreement, the Sponsor was required to allow existing tenants to remain at the property. Vacant units are leased up either through the HPD’s lottery process or through the HPD’s Homeless Placement Services (HPS). There are 77 units set aside as units for homeless people. First priority is given on vacant units (other than the 15 145% AMI units) until the minimum is satisfied. The HPD requires that that the set aside requirements be satisfied by referrals directly from the HPD, so the homeless household may come through a NYC-run shelter or through a housing lottery run by the HPD.
Briarwood qualifies for a 40-year partial tax exemption under the Article XI program, which commenced on December 23, 2022, and continues through December 23, 2062. After the tax exemption expires in 2062, Article XI requires that all units
THE INFORMATION IN THIS STRUCTURAL AND COLLATERAL TERM SHEET IS NOT COMPLETE AND MAY BE AMENDED PRIOR TO THE TIME OF SALE. THIS TERM SHEET IS NOT AN OFFER TO SELL THESE SECURITIES AND IT IS NOT A SOLICITATION OF AN OFFER TO BUY THESE SECURITIES IN ANY JURISDICTION WHERE THE OFFER OR SALE IS NOT PERMITTED. |
| | 67 | |
| Structural and Collateral Term Sheet | | BMO 2024-5C8 |
| No. 4 – Black Spruce - Briarwood and Prospect |
remain rent stabilized. Rent increases are determined by the Regulatory Agreement. Real estate taxes under the Article XI exemption are calculated as 10% of gross potential residential and commercial rental income through December 2027, after which the percentage steps down to 6.25%.
Although the Regulatory Agreement restricts rents based on AMI and rent stabilization, the Sponsor benefits from the Section 610 Program at Briarwood Property, which was implemented to allow affordable housing developments to obtain the full benefit of certain rental assistance programs that are otherwise limited under New York law. The Section 610 program allows the Sponsor to increase rental income above legal rent provided the portfolio undergoes site inspections every two years. Section 610 allows the owner to collect rental subsidies (e.g. Section 8 vouchers, formerly homeless rental subsidy, state rental assistance) in excess of the legal rents. As an example, if a tenant has a Section 8 voucher and the legal rent is capped at $1,000 while subsidy rental standard is $2,000 per month, the borrower will be able to bypass the legal rent and Article XI Regulatory Agreement rent restrictions and collect the full $2,000 per month. The ability to circumvent rent stabilized registered rent cap will apply for existing rent subsidized units as well as future rent subsidized units. Section 610 is granted on a property-by-property basis (for any tenants that receive rental assistance) through a provision that is added to the regulatory agreement.
The following table presents certain information relating to the Unit Mix Summary at the Briarwood Property:
| Unit Mix Summary – Briarwood Property(1) |
| Room Description | Units | Occupied Units | Occupancy | Avg In-Place Rent Per Unit(2) |
| Studio | 44 | 40 | 90.9% | $1,600 |
| 1-Bedroom | 200 | 197 | 98.5% | $1,827 |
| 2-Bedroom | 137 | 133 | 97.1% | $2,161 |
| 3-Bedroom | 1 | 0 | 0.0% | $0 |
| Total / Avg. | 382 | 370 | 96.9% | $1,922 |
| (1) | Source: Borrower rent roll dated November 5, 2024. |
| (2) | Avg In-Place Rent Per Unit excludes vacant units. |
The Prospect Property is located in the Prospect Heights neighborhood of Brooklyn, New York and is comprised of 14 rent stabilized buildings, which were rehabilitated in the late 1990s with public subsidies, including federal low-income housing tax credits (LIHTC), federal HOME funds, low-interest financing from New York City, and local J-51 property tax abatements, in exchange for certain requirements such as income and rent limits. The Prospect Portfolio was acquired in 2021 and consists of 106 units and has an average rent per unit of $1,688. In aggregate, Prospect is comprised of 2 studios, 42 one-bedrooms, 36 two-bedrooms, 25 three-bedrooms, and 1 six-bedroom unit.
The affordability requirements imposed in connection with permanent financing provided by HPD, as well as LIHTC, are set forth in a Regulatory Agreement, which provides for affordability and other restrictions for a period of 30 years. Financing also relied on federal “HOME” funds, which required additional affordability restrictions, set forth in various Home Written Agreements. The restrictions of the Regulatory Agreement and Home Written Agreements expire on January 19, 2029. Prospect Property also benefits from J-51 tax abatements (excluding the units at the 872 Bergen Street property), which is available for the rehabilitation of residential property in exchange for the property becoming subject to rent stabilization. All residential units at Prospect are rent stabilized due to the age of the buildings, under the terms of the Regulatory Agreement, and as the result of the receipt of J-51 tax abatements. The J-51 tax abatements were implemented at each property between 1997-1999. Excluding one property that had a 14-year abatement (which has now expired), all properties possess a 34-year abatement. All other properties’ tax abatements begin to phase out between 2028-2029 and the abatements fully burn off in 2034. As the portfolio is nearing the end of its tax abatement, the Sponsor intends to apply for the 420-c tax incentive program, which is not accounted for in underwriting. 8% of the units at the Prospect Property are receiving Section 8 vouchers and 2% are vacant.
THE INFORMATION IN THIS STRUCTURAL AND COLLATERAL TERM SHEET IS NOT COMPLETE AND MAY BE AMENDED PRIOR TO THE TIME OF SALE. THIS TERM SHEET IS NOT AN OFFER TO SELL THESE SECURITIES AND IT IS NOT A SOLICITATION OF AN OFFER TO BUY THESE SECURITIES IN ANY JURISDICTION WHERE THE OFFER OR SALE IS NOT PERMITTED. |
| | 68 | |
| Structural and Collateral Term Sheet | | BMO 2024-5C8 |
| No. 4 – Black Spruce - Briarwood and Prospect |
The following table presents certain information relating to the Unit Mix Summary for the Prospect Property:
| Unit Mix Summary – Prospect Property(1) |
| Room Description | Units | Occupied Units | Occupancy | Avg In-Place Rent Per Unit(2) |
| Studio | 2 | 2 | 100.0% | $1,588 |
| 1-Bedroom | 42 | 42 | 100.0% | $1,239 |
| 2-Bedroom | 36 | 35 | 97.2% | $1,646 |
| 3-Bedroom | 25 | 25 | 100.0% | $2,433 |
| 6-Bedroom | 1 | 1 | 100.0% | $3,590 |
| Total / Avg. | 106 | 105 | 99.1% | $1,688 |
| | (1) | Source: Borrower rent roll dated November 5, 2024. |
| | (2) | Avg In-Place Rent Per Unit excludes vacant units. |
Appraisals. According to the portfolio appraisal dated October 4, 2024, the Black Spruce - Briarwood and Prospect Properties had an “As Portfolio” appraised value of $130,333,000, which includes a 7.5% portfolio premium. The aggregate as-is appraised value without the premium is $121,240,000.
| Appraisal Valuation Summary(1) |
| Appraisal Approach | Appraised Value | Capitalization Rate |
| Income Capitalization Approach | $130,333,000 | 5.75–6.00% |
Environmental. According to the Phase I environmental reports dated on various dates between October 1, 2024 and October 7, 2024, there are several recognized environmental conditions at the Black Spruce - Briarwood and Prospect Properties. See “Description of the Mortgage Pool—Environmental Considerations” in the Preliminary Prospectus.
THE INFORMATION IN THIS STRUCTURAL AND COLLATERAL TERM SHEET IS NOT COMPLETE AND MAY BE AMENDED PRIOR TO THE TIME OF SALE. THIS TERM SHEET IS NOT AN OFFER TO SELL THESE SECURITIES AND IT IS NOT A SOLICITATION OF AN OFFER TO BUY THESE SECURITIES IN ANY JURISDICTION WHERE THE OFFER OR SALE IS NOT PERMITTED. |
| | 69 | |
| Structural and Collateral Term Sheet | | BMO 2024-5C8 |
| No. 4 – Black Spruce - Briarwood and Prospect |
The following table presents certain information relating to the operating history and underwritten cash flows of the Black Spruce – Briarwood and Prospect Properties
| Underwritten Net Cash Flow |
| | 2022 | 2023 | 8/31/2024 TTM | Underwritten | Per Unit | %(1) |
| Underwritten Residential Potential Rent(2) | $10,103,346 | $10,586,511 | $10,781,643 | $10,975,096 | $22,490 | 100.0 | % |
| Residential Vacancy Loss | (670,540) | (772,240) | (825,743) | (327,058) | (670) | (3.0 | ) |
| Residential Bad Debt Loss | (396,178) | (251,257) | (338,935) | (365,279) | (749) | (3.3 | ) |
| Residential Concessions | (29,130) | (34,009) | (80,034) | 0 | 0 | (0.0 | ) |
| Residential Non-Revenue Unit Loss | 0 | 0 | 0 | (14,886) | (31) | (0.1 | ) |
| Other Miscellaneous Revenue | 397,243 | 530,774 | 546,167 | 546,167 | 1,119 | 5.0 | |
| Net Commercial Revenue | 169,650 | 169,912 | 142,435 | 154,100 | 316 | 1.4 | |
| Effective Gross Revenue | $9,574,391 | $10,229,692 | $10,225,534 | $10,968,140 | $22,476 | 100.0 | % |
| Real Estate Taxes | 2,079,731 | 852,986 | 853,927 | 666,223 | 1,365 | 6.1 | |
| Insurance | 414,482 | 458,228 | 506,911 | 642,313 | 1,316 | 5.9 | |
| Utilities | 837,668 | 926,528 | 909,600 | 909,600 | 1,864 | 8.3 | |
| Repairs & Maintenance | 366,597 | 391,736 | 363,810 | 363,810 | 746 | 3.3 | |
| Management Fee | 524,554 | 585,648 | 454,164 | 219,363 | 450 | 2.0 | |
| Payroll (Office, Security, Maintenance) | 455,162 | 569,781 | 568,739 | 568,739 | 1,165 | 5.2 | |
| General and Administrative | 125,309 | 171,136 | 220,822 | 169,216 | 347 | 1.5 | |
| Total Expenses | $4,803,502 | $3,956,044 | $3,877,974 | $3,539,264 | $7,253 | 32.3 | % |
| Net Operating Income | $4,770,889 | $6,273,648 | $6,347,560 | $7,428,877 | $15,223 | 67.7 | % |
| Replacement Reserves | 0 | 0 | 0 | 136,640 | 280 | 1.2 | |
| TI/LC | 0 | 0 | 0 | 3,012 | 6 | 0.0 | |
| Net Cash Flow | $4,770,889 | $6,273,648 | $6,347,560 | $7,289,224 | $14,937 | 66.5 | % |
| (1) | % column represents percent of Underwritten Residential Potential Rent for revenue lines and percent of Effective Gross Income for all remaining fields. |
| (2) | Based on the underwritten rent roll dated November 5. |
The Market. The Black Spruce - Briarwood and Prospect Properties are predominantly located within the Briarwood and Crown Heights multifamily submarkets. As of Q4 2024, the Briarwood multifamily submarket has a vacancy rate of 2.3% and average rent per unit at $1,883, according to a third-party report. As of Q4 2024, the Crown Heights multifamily submarket has a vacancy rate of 1.5% and average rent per unit at $2,362, according to a third-party report.
The Borrowers. The borrowers are Briarwood Affordable LLC and Prospect Affordable Package LLC, each a New York limited liability company with two independent directors with Delaware limited liability companies as their sole members and managers, which also have two independent directors. Legal counsel to the borrowers provided a non-consolidation opinion in connection with the origination of the Black Spruce - Briarwood and Prospect Whole Loan.
The Borrower Sponsor. The borrower sponsor is Joshua Gotlib and the and non-recourse carveout guarantor is Jeffrey Weinzweig.
Property Management. The Black Spruce - Briarwood and Prospect Properties are managed by Nieuw Amsterdam Property Management, LLC, an affiliate of the borrowers.
Escrows and Reserves. At origination, the borrowers deposited (i) $79,991 into a property tax reserve, (ii) $75,488.51 into an insurance premium reserve, (iii) an additional $1,023,835.28 into the property tax reserve to be returned to the borrower to the extent the property taxes due with respect to the Black Spruce - Briarwood Property for any fiscal year as reasonably determined by the lender do not exceed the underwritten tax amount in any fiscal year, and (iv) $155,584 into a deferred maintenance reserve.
Tax Reserve – On a monthly basis, the borrowers are required to deposit into a property tax reserve an amount equal to 1/12th of the property taxes for the Black Spruce - Briarwood and Prospect Properties that the lender reasonably estimates will be payable during the next ensuing 12 months, initially estimated to be approximately $76,800.
Insurance Reserve – On a monthly basis, the borrowers are required to deposit into an insurance reserve an amount equal to 1/12th of the insurance premiums that the lender reasonably estimates will be payable during the next ensuing 12 months,
THE INFORMATION IN THIS STRUCTURAL AND COLLATERAL TERM SHEET IS NOT COMPLETE AND MAY BE AMENDED PRIOR TO THE TIME OF SALE. THIS TERM SHEET IS NOT AN OFFER TO SELL THESE SECURITIES AND IT IS NOT A SOLICITATION OF AN OFFER TO BUY THESE SECURITIES IN ANY JURISDICTION WHERE THE OFFER OR SALE IS NOT PERMITTED. |
| | 70 | |
| Structural and Collateral Term Sheet | | BMO 2024-5C8 |
| No. 4 – Black Spruce - Briarwood and Prospect |
initially estimated to be $15,439.67; provided, however, the insurance reserve will be conditionally waived for so long as the borrowers provide the lender with evidence that insurance satisfying the requirements of the Black Spruce - Briarwood and Prospect Whole Loan documents has been obtained under one or more blanket insurance policies. As of the origination date, the Briarwood Property is insured under a blanket policy and the Prospect Property is insured under a dedicated policy.
TI/LC Reserve – On a monthly basis, the borrowers are required to deposit into a tenant improvement and leasing commission reserve an amount equal to $165.36, capped at an amount equal to the product of (x) $1.00 times (y) the aggregate number of commercial rentable square feet then contained in the Black Spruce - Briarwood and Prospect Properties (excluding amounts deposited therein in respect of lease termination proceeds).
Capital Expenditure Reserve – On a monthly basis, the borrowers are required to deposit into a capital expenditure reserve an amount equal to approximately $11,452.81, capped at an amount equal to the aggregate of (i) with respect to the residential units at the Black Spruce - Briarwood and Prospect Properties, the product of (x) $500 times (y) the number of residential units at the Black Spruce - Briarwood and Prospect Properties, and (ii) with respect to the commercial units at the Black Spruce - Briarwood and Prospect Properties, the product of (x) $0.40 times (y) the aggregate number of commercial rentable square feet then contained in the commercial units at the Black Spruce - Briarwood and Prospect Properties.
Lockbox / Cash Management. The Black Spruce - Briarwood and Prospect Whole Loan is structured with a soft lockbox and springing cash management. Within 30 business days of origination, the borrowers were required to direct each commercial tenant to remit all rents directly to a lender-controlled lockbox account. In addition, the borrowers are required to cause all cash revenues and all other money received by the borrowers or the property manager (other than tenant security deposits) to be deposited into the lockbox account or a lender-controlled cash management account by the end of the first, or in the case of the deposit of residential rents by the property manager, second, business day following receipt. At the end of each business day during the continuance of a Black Spruce - Briarwood and Prospect Trigger Period (as defined below) or event of default under the Black Spruce - Briarwood and Prospect Whole Loan documents, all amounts in the lockbox are required to be remitted to the cash management account. At the end of each business day (or, at the borrowers’ election, on a less frequent basis) that no Black Spruce - Briarwood and Prospect Trigger Period or an event of default under the Black Spruce - Briarwood and Prospect Whole Loan is continuing, all amounts in the lockbox account are required to be remitted to a borrower-controlled operating account.
On each payment date during the continuance of a Black Spruce - Briarwood and Prospect Trigger Period (or, at the lender’s discretion, during an event of default under the Black Spruce - Briarwood and Prospect Whole Loan documents), all funds on deposit in the cash management account after payment of taxes and insurance premiums, debt service on the Black Spruce - Briarwood and Prospect Whole Loan, necessary expenses and budgeted operating expenses and required reserves are required to be deposited into an excess cash flow reserve account as additional collateral for the Black Spruce - Briarwood and Prospect Whole Loan.
A “Black Spruce - Briarwood and Prospect Trigger Period” means each period that commences when the debt service coverage ratio, determined as of the first day of any fiscal quarter, is less than 1.10x and concludes when (i) the debt service coverage ratio, determined as of the first day of any fiscal quarter thereafter, is equal to or greater than 1.10x or (ii) the borrowers provide the lender a letter of credit in the amount of the shortfall necessary such that, if the amount secured by such letter of credit were applied to the then outstanding principal balance of the Black Spruce - Briarwood and Prospect Whole Loan, the debt service coverage ratio would be in excess of 1.10x (and if the financial reports required under the Black Spruce - Briarwood and Prospect Whole Loan documents are not delivered to the lender as and when required thereunder, a Black Spruce - Briarwood and Prospect Trigger Period will be deemed to have commenced and be ongoing, unless and until such reports are delivered and they indicate that, in fact, no Black Spruce - Briarwood and Prospect Trigger Period is ongoing).
Subordinate and Mezzanine Debt. None.
Permitted Future Subordinate or Mezzanine Debt. Not permitted.
Partial Release. Not permitted.
Ground Lease. None.
THE INFORMATION IN THIS STRUCTURAL AND COLLATERAL TERM SHEET IS NOT COMPLETE AND MAY BE AMENDED PRIOR TO THE TIME OF SALE. THIS TERM SHEET IS NOT AN OFFER TO SELL THESE SECURITIES AND IT IS NOT A SOLICITATION OF AN OFFER TO BUY THESE SECURITIES IN ANY JURISDICTION WHERE THE OFFER OR SALE IS NOT PERMITTED. |
| | 71 | |
| Structural and Collateral Term Sheet | | BMO 2024-5C8 |
| No. 5 – Colony Square |

THE INFORMATION IN THIS STRUCTURAL AND COLLATERAL TERM SHEET IS NOT COMPLETE AND MAY BE AMENDED PRIOR TO THE TIME OF SALE. THIS TERM SHEET IS NOT AN OFFER TO SELL THESE SECURITIES AND IT IS NOT A SOLICITATION OF AN OFFER TO BUY THESE SECURITIES IN ANY JURISDICTION WHERE THE OFFER OR SALE IS NOT PERMITTED. |
| | 72 | |
| Structural and Collateral Term Sheet | | BMO 2024-5C8 |
| No. 5 – Colony Square |

THE INFORMATION IN THIS STRUCTURAL AND COLLATERAL TERM SHEET IS NOT COMPLETE AND MAY BE AMENDED PRIOR TO THE TIME OF SALE. THIS TERM SHEET IS NOT AN OFFER TO SELL THESE SECURITIES AND IT IS NOT A SOLICITATION OF AN OFFER TO BUY THESE SECURITIES IN ANY JURISDICTION WHERE THE OFFER OR SALE IS NOT PERMITTED. |
| | 73 | |
| Structural and Collateral Term Sheet | | BMO 2024-5C8 |
| No. 5 – Colony Square |
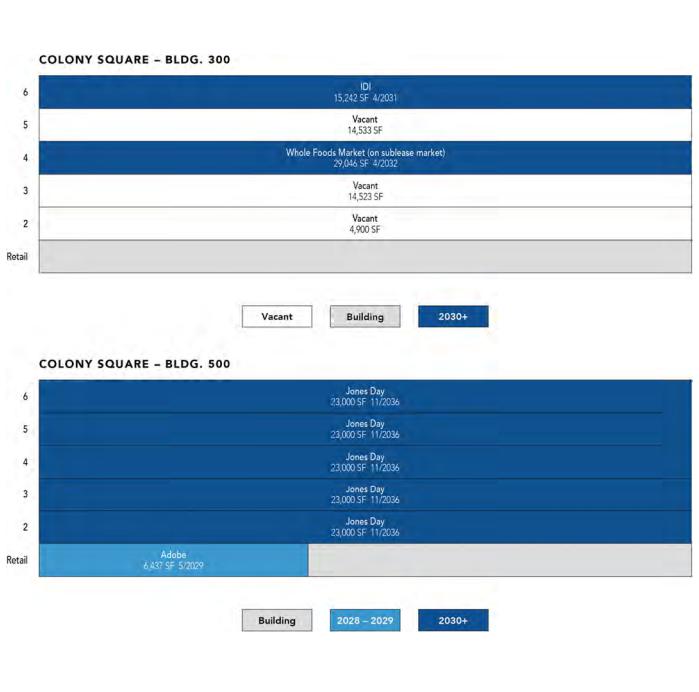
THE INFORMATION IN THIS STRUCTURAL AND COLLATERAL TERM SHEET IS NOT COMPLETE AND MAY BE AMENDED PRIOR TO THE TIME OF SALE. THIS TERM SHEET IS NOT AN OFFER TO SELL THESE SECURITIES AND IT IS NOT A SOLICITATION OF AN OFFER TO BUY THESE SECURITIES IN ANY JURISDICTION WHERE THE OFFER OR SALE IS NOT PERMITTED. |
| | 74 | |
| Structural and Collateral Term Sheet | | BMO 2024-5C8 |
| No. 5 – Colony Square |
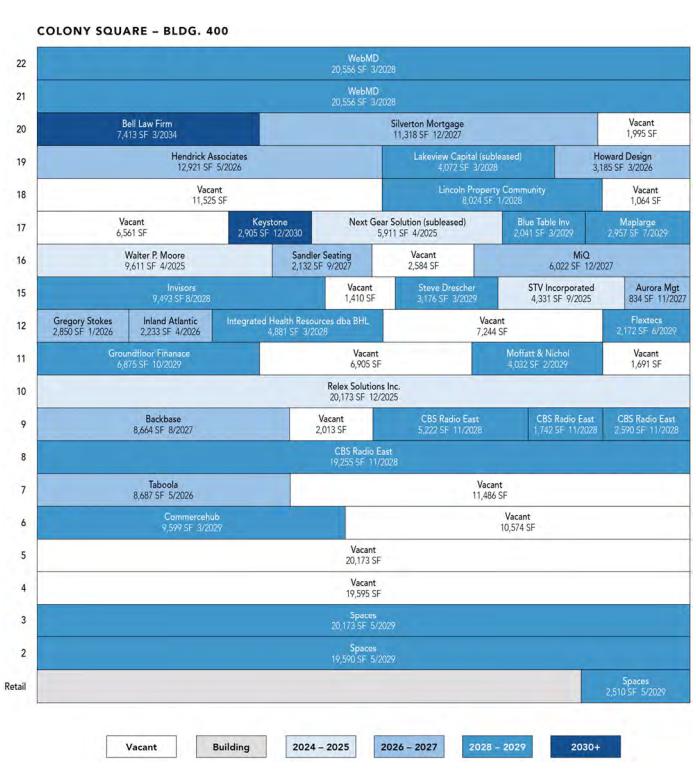
THE INFORMATION IN THIS STRUCTURAL AND COLLATERAL TERM SHEET IS NOT COMPLETE AND MAY BE AMENDED PRIOR TO THE TIME OF SALE. THIS TERM SHEET IS NOT AN OFFER TO SELL THESE SECURITIES AND IT IS NOT A SOLICITATION OF AN OFFER TO BUY THESE SECURITIES IN ANY JURISDICTION WHERE THE OFFER OR SALE IS NOT PERMITTED. |
| | 75 | |
| Structural and Collateral Term Sheet | | BMO 2024-5C8 |
| No. 5 – Colony Square |

THE INFORMATION IN THIS STRUCTURAL AND COLLATERAL TERM SHEET IS NOT COMPLETE AND MAY BE AMENDED PRIOR TO THE TIME OF SALE. THIS TERM SHEET IS NOT AN OFFER TO SELL THESE SECURITIES AND IT IS NOT A SOLICITATION OF AN OFFER TO BUY THESE SECURITIES IN ANY JURISDICTION WHERE THE OFFER OR SALE IS NOT PERMITTED. |
| | 76 | |
| Structural and Collateral Term Sheet | | BMO 2024-5C8 |
| No. 5 – Colony Square |
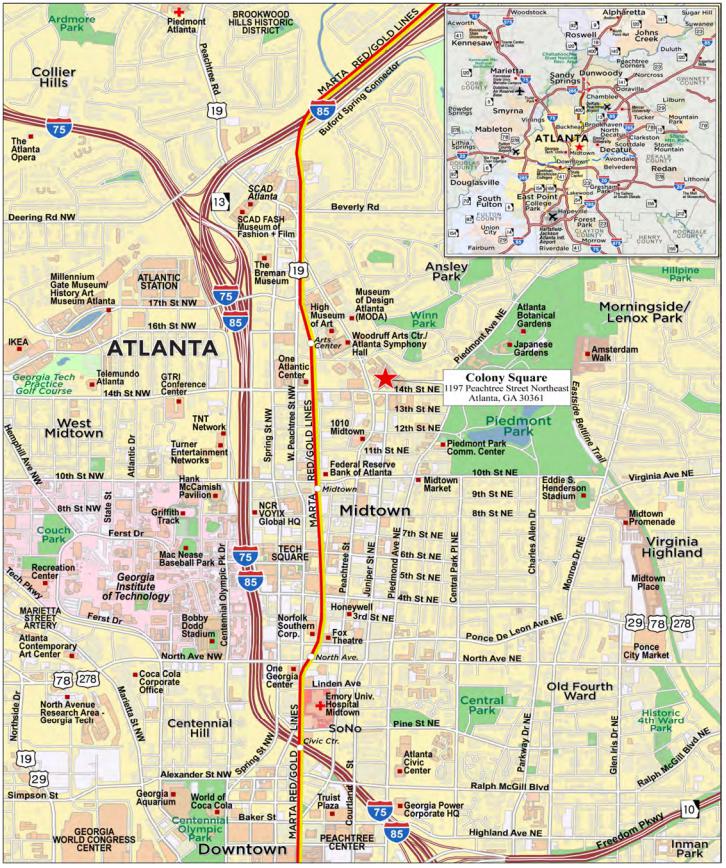
THE INFORMATION IN THIS STRUCTURAL AND COLLATERAL TERM SHEET IS NOT COMPLETE AND MAY BE AMENDED PRIOR TO THE TIME OF SALE. THIS TERM SHEET IS NOT AN OFFER TO SELL THESE SECURITIES AND IT IS NOT A SOLICITATION OF AN OFFER TO BUY THESE SECURITIES IN ANY JURISDICTION WHERE THE OFFER OR SALE IS NOT PERMITTED. |
| | 77 | |
| Structural and Collateral Term Sheet | | BMO 2024-5C8 |
| No. 5 – Colony Square |
| Mortgage Loan Information | | Property Information |
| Mortgage Loan Sellers: | BMO, GSMC, GACC | | Single Asset / Portfolio: | Single Asset |
| Original Principal Balance(1): | $60,000,000 | | Title: | Fee |
| Cut-off Date Principal Balance(1): | $60,000,000 | | Property Type – Subtype: | Mixed Use – Office / Retail |
| % of IPB: | 6.0% | | Net Rentable Area (SF): | 1,085,612 |
| Loan Purpose: | Refinance | | Location: | Atlanta, GA |
| Borrower: | LVA4 Atlanta Colony Square, L.P. | | Year Built / Renovated: | 1972, 1974, 2020, 2021 / 2000 |
Borrower Sponsors: | North American Ventures LLC and Lionstone U.S. Value-Add Four, L.P. | | Occupancy: | 82.5% |
| Interest Rate: | 7.37500% | | Occupancy Date: | 9/9/2024 |
| Note Date: | 10/2/2024 | | 4th Most Recent NOI (As of): | $16,554,450 (12/31/2021) |
| Maturity Date: | 10/6/2029 | | 3rd Most Recent NOI (As of): | $24,041,323 (12/31/2022) |
| Interest-only Period: | 60 months | | 2nd Most Recent NOI (As of): | $29,712,592 (12/31/2023) |
| Original Term: | 60 months | | Most Recent NOI (As of): | $29,188,955 (TTM 7/31/2024) |
| Original Amortization Term: | None | | UW Economic Occupancy: | 83.3% |
| Amortization Type: | Interest Only | | UW Revenues: | $49,913,938 |
| Call Protection(2): | L(26),DorYM1(27),O(7) | | UW Expenses: | $19,331,831 |
| Lockbox / Cash Management: | Hard / Springing | | UW NOI: | $30,582,107 |
| Additional Debt(1): | Yes | | UW NCF: | $29,266,672 |
| Additional Debt Balance(1): | $200,000,000 | | Appraised Value / Per SF(4): | $516,000,000 / $475 |
| Additional Debt Type(1): | Pari Passu | | Appraisal Date: | 5/24/2024 |
| | | | | |
| Escrows and Reserves(3) | | Financial Information(1) |
| | Initial | Monthly | Initial Cap | | | Whole Loan |
| Taxes: | $0 | $375,955 | N/A | | Cut-off Date Loan / SF: | $239 |
| Insurance: | $0 | Springing | N/A | | Maturity Date Loan / SF: | $239 |
| Replacement Reserve: | $0 | $19,152 | N/A | | Cut-off Date LTV(4): | 50.4% |
| Rollover Reserve: | $4,000,000 | $90,468 | N/A | | Maturity Date LTV(4): | 50.4% |
| Free Rent Reserve: | $965,127 | $0 | N/A | | UW NCF DSCR: | 1.51x |
| Outstanding TI/LC: | $3,965,065 | $0 | N/A | | UW NOI Debt Yield: | 11.8% |
| Additional Rollover: | $0 | $425,000 | $5,100,000 | | | |
| | | | | | | |
| Sources and Uses |
| Sources | Proceeds | % of Total | | Uses | Proceeds | % of Total | |
| Whole Loan | $260,000,000 | 87.3 | % | | Loan Payoff | $281,760,456 | 94.6 | % |
| Borrower Sponsor Equity | 37,832,154 | 12.7 | | | Upfront Reserves | 8,930,192 | 3.0 | |
| | | | | Closing Costs | 7,141,506 | 2.4 | |
| | | | | | | |
| Total Sources | $297,832,154 | 100.0 | % | | Total Uses | $297,832,154 | 100.0 | % |
| (1) | The Colony Square Mortgage Loan (as defined below) is part of the Colony Square Whole Loan (as defined below), which is comprised of 24 pari passu promissory notes with an aggregate original balance of $260,000,000. The Colony Square Whole Loan was originated by Bank of Montreal (“BMO”), Goldman Sachs Bank USA (“GSBI”) and German American Capital Corporation (“GACC”). For additional information, see “The Loan” below. The information presented under “Financial Information” above is calculated based on the Colony Square Whole Loan. |
| (2) | The lockout period will be at least 26 payment dates beginning with and including the first payment date on November 6, 2024. Defeasance or voluntary prepayment with yield maintenance of the Colony Square Whole Loan in full (but not in part) is permitted at any time following the earlier to occur of (i) October 2, 2028 or (ii) the date that is two years from the closing date of the securitization that includes the last pari passu note to be securitized. The assumed lockout period of 26 payments is based on the anticipated closing date of the BMO 2024-5C8 securitization trust in December 2024. The actual lockout period may be longer. |
| (3) | For a full description of Escrows and Reserves, see “Escrows and Reserves” below. |
| (4) | Appraised Value reflects the appraised value of the buildings at the Colony Square Property (as defined below) if sold individually. The appraisal determined an “as-is” portfolio value of $465,000,000 if the Colony Square Property were to be sold in its entirety, reflecting an approximately 10% portfolio discount. Such portfolio appraised value would result in a Cut-off Date LTV and Maturity Date LTV of 55.9%. |
The Loan. The fifth largest mortgage loan (the “Colony Square Mortgage Loan”) is part of a whole loan (the “Colony Square Whole Loan”) evidenced by 24 pari passu notes that is secured by the borrower’s fee interest in a 1,085,612 square foot mixed-use property in located in Atlanta, Georgia (the “Colony Square Property”).
THE INFORMATION IN THIS STRUCTURAL AND COLLATERAL TERM SHEET IS NOT COMPLETE AND MAY BE AMENDED PRIOR TO THE TIME OF SALE. THIS TERM SHEET IS NOT AN OFFER TO SELL THESE SECURITIES AND IT IS NOT A SOLICITATION OF AN OFFER TO BUY THESE SECURITIES IN ANY JURISDICTION WHERE THE OFFER OR SALE IS NOT PERMITTED. |
| | 78 | |
| Structural and Collateral Term Sheet | | BMO 2024-5C8 |
| No. 5 – Colony Square |
The Colony Square Mortgage Loan, which is evidenced by the controlling Note A-1-3 and the non-controlling notes A-4-1, A-6-2, A-8, A-9-2, A-11-2, A-13 and A-14-2, has an aggregate outstanding principal balance as of the Cut-off Date of $60,000,000. The Colony Square Whole Loan was co-originated on October 2, 2024 by BMO, GSBI and GACC and has an aggregate outstanding principal balance as of the Cut-off Date of $260,000,000. BMO is selling Notes A-1-3 and A-4-1, with an aggregate Cut-off Date principal balance of $34,468,086, GACC is selling Notes A-11-2, A-13 and A-14-2, with a Cut-off Date principal balance of $12,765,957 and GSMC is selling Notes A-6-2, A-8 and A-9-2, with a Cut-off Date principal balance of $12,765,957. The Colony Square Whole Loan is interest only for the entire term and accrues interest on an Actual/360 basis.
The relationship between the holders of the Colony Square Whole Loan is governed by a co-lender agreement as described under “Description of the Mortgage Pool- The Whole Loans- The Serviced Pari Passu Whole Loans” and “The Outside Serviced Pari Passu Whole Loans” in the Preliminary Prospectus. The Colony Square Whole Loan will be serviced under the pooling and servicing agreement for the BMO 2024-5C8 securitization trust. See “The Pooling and Servicing Agreement-Servicing of the Outside Serviced Mortgage Loans-Servicing Shift Mortgage Loans” in the Preliminary Prospectus.
The table below identifies the promissory notes that comprise the Colony Square Whole Loan:
| Whole Loan Summary |
| Note | | Original Balance | | | Cut-off Date Balance | | | Note Holder | Controlling Piece |
| A-1-1 | | $21,891,892 | | | $21,891,892 | | | Future Securitization(1) | No |
| A-1-2(1) | | $3,959,170 | | | $3,959,170 | | | BMO | No |
| A-1-3 | | $19,148,938 | | | $19,148,938 | | | BMO 2024-5C8 | Yes |
| A-2 | | $30,000,000 | | | $30,000,000 | | | BMO 2024-5C7 | No |
| A-3 | | $25,000,000 | | | $25,000,000 | | | BMARK 2024-V11 | No |
| A-4-1 | | $15,319,148 | | | $15,319,148 | | | BMO 2024-5C8 | No |
| A-4-2 | | $15,212,766 | | | $15,212,766 | | | BMARK 2024-V11 | No |
| A-5 | | $4,468,086 | | | $4,468,086 | | | BMO 2024-5C7 | No |
| A-6-1 | | $14,893,617 | | | $14,893,617 | | | BMARK 2024-V11 | No |
| A-6-2 | | $1,773,383 | | | $1,773,383 | | | BMO 2024-5C8 | No |
| A-7 | | $12,765,957 | | | $12,765,957 | | | BMO 2024-5C7 | No |
| A-8 | | $9,259,000 | | | $9,259,000 | | | BMO 2024-5C8 | No |
| A-9-1(1) | | $4,018,469 | | | $4,018,469 | | | GSBI | No |
| A-9-2 | | $1,733,574 | | | $1,733,574 | | | BMO 2024-5C8 | No |
| A-10(1) | | $5,556,000 | | | $5,556,000 | | | GSBI | No |
| A-11-1 | | $14,893,617 | | | $14,893,617 | | | BMARK 2024-V11 | No |
| A-11-2 | | $1,773,383 | | | $1,773,383 | | | BMO 2024-5C8 | No |
| A-12 | | $12,765,957 | | | $12,765,957 | | | BMO 2024-5C7 | No |
| A-13 | | $9,259,000 | | | $9,259,000 | | | BMO 2024-5C8 | No |
| A-14-1 | | $4,018,469 | | | $4,018,469 | | | Future Securitization(1) | No |
| A-14-2 | | $1,733,574 | | | $1,733,574 | | | BMO 2024-5C8 | No |
| A-15-1 | | $4,089,639 | | | $4,089,639 | | | Future Securitization(1) | No |
| A-15-2(1) | | $1,466,361 | | | $1,466,361 | | | GACC | No |
| A-16(1) | | $25,000,000 | | | $25,000,000 | | | MS | No |
| Whole Loan | | $260,000,000 | | | $260,000,000 | | | | |
| (1) | Expected to be contributed to one or more future securitization trust(s). In the case of the notes where the holder is indicated as “Future Securitization”, the related note(s) are expected to be included in a securitization transaction that has not been announced but is expected to close on or prior to the closing date for this securitization transaction. |
The Property. The Colony Square Property consists of (i) four Class A office buildings (“Building 100”, “Building 300”, “Building 400” and “Building 500”), (ii) a retail component (the “Retail Component”) and (iii) a parking garage. The Colony
THE INFORMATION IN THIS STRUCTURAL AND COLLATERAL TERM SHEET IS NOT COMPLETE AND MAY BE AMENDED PRIOR TO THE TIME OF SALE. THIS TERM SHEET IS NOT AN OFFER TO SELL THESE SECURITIES AND IT IS NOT A SOLICITATION OF AN OFFER TO BUY THESE SECURITIES IN ANY JURISDICTION WHERE THE OFFER OR SALE IS NOT PERMITTED. |
| | 79 | |
| Structural and Collateral Term Sheet | | BMO 2024-5C8 |
| No. 5 – Colony Square |
Square Property totals 1,085,612 square feet across four buildings. Building 100 consists of 329,011 square feet (30.3% of NRA and 31.3% of underwritten base rent) including 310,158 square feet of office space, 11,164 square feet of amenity space and 7,689 square feet of storage space. Building 300 consists of 78,100 square feet (7.2% of NRA and 5.8% of underwritten base rent) including 73,200 square feet of office space and 4,900 square feet of other space. Building 400 consists of 388,411 square feet (35.8% of NRA and 34.1% of underwritten base rent) including 381,034 square feet of office space, 7,236 square feet of storage space and 141 square feet of other space. Building 500 consists of 121,437 square feet of office space (11.2% of NRA and 14.0% of underwritten base rent). The Retail Component consists of 168,653 square feet (15.5% of NRA and 14.9% of underwritten base rent).
The following table presents certain information relating to the space types that comprise the Colony Square Property:
| Property Summary(1) |
| Space Type | Total SF | % Total SF | Occupancy | UW Base Rent(2) | % of UW Base Rent(2) | UW Base Rent
PSF(2)(3) |
| Office | 885,829 | | 81.6 | % | 80.2% | $28,553,290 | 84.8% | $40.17 |
| Retail | 155,215 | | 14.3 | | 98.0% | 4,992,868 | 14.8% | $32.81 |
| Storage | 15,609 | | 1.4 | | 52.2% | 138,439 | 0.4% | $16.99 |
| Amenity/Other | 28,959 | | 2.7 | | 83.1% | 0 | 0.0% | $0.00 |
| Total / Wtd. Avg. | 1,085,612 | | 100.0 | % | 82.5% | $33,684,597 | 100.0% | $37.63 |
| (1) | Based on the underwritten rent roll dated September 9, 2024. |
| (2) | UW Base Rent, UW Base Rent PSF and % of UW Base Rent are inclusive of contractual rent steps through August 2025. |
| (3) | UW Base Rent PSF excludes vacant space and vacant underwritten base rent. |
Major Tenants. The largest tenants by underwritten base rent at the Colony Square Property are Jones Day, WeWork and WebMD.
Jones Day (115,000 square feet; 10.6% of Total NRA; 12.9% of underwritten base rent). Jones Day is a global law firm providing legal services to national and multinational corporations. Jones Day provides legal support in, among others, complex transactions, high stakes litigation, cyber security and capital markets activities. The firm employs over 2,400 lawyers in 40 different offices across the world. Jones Day is ranked ninth in law firms based on size, 12th in a legal industry publication’s ranking of the 200 largest law firms by gross revenue, and 15th in a 2024 survey by a legal industry publication of the 200 largest law firms in the world. The firm reported approximately $2.7 billion in revenue in 2023 and has worked with clients on over 3,000 transactions that hold a collective value of approximately $1.5 trillion over the past five years. Jones Day’s lease at the Colony Square Property commenced in June 2021, expires on November 30, 2036, has two, five-year renewal options remaining and has a contraction option to terminate one floor 120 months (June 2031) after the lease commencement date.
WeWork (44,463 square feet; 4.1% of Total NRA; 5.5% of underwritten base rent). Founded in 2010 and headquartered in New York City, WeWork is a provider of shared office and coworking space in 119 cities and 37 countries. WeWork’s private workspace service allows customers to own a private desk, whole office, or an entire floor of private office space. The company’s other coworking services include day to day office rentals, monthly memberships, and additional meeting and event space rentals. WeWork reported approximately $3.2 billion in revenue and $4.8 billion in expenses in 2022. WeWork emerged from Chapter 11 bankruptcy in May 2024. WeWork’s lease at the Colony Square Property commenced in May 2017 and was amended in November 2017 to expand its leased space at the Colony Square Property and in April 2024 to contract its leased space by one floor. WeWork’s lease expires on April 30, 2032 and has two, five-year renewal options remaining and no termination options.
WebMD (42,112 square feet; 3.9% of Total NRA; 5.2% of underwritten base rent). WebMD is an online health information website that provides information on a number of medical conditions, drugs and supplements, overall wellbeing, symptom checking, and medical practitioner location. Beyond its core services, WebMD also creates content such as news, blogs, and podcasts. WebMD was bought by private equity firm KKR for $2.8 billion in 2017. WebMD’s office lease at the Colony Square Property commenced in August 2010, is scheduled to expire on March 31, 2028 and has one, five-year renewal option remaining and no termination options.
THE INFORMATION IN THIS STRUCTURAL AND COLLATERAL TERM SHEET IS NOT COMPLETE AND MAY BE AMENDED PRIOR TO THE TIME OF SALE. THIS TERM SHEET IS NOT AN OFFER TO SELL THESE SECURITIES AND IT IS NOT A SOLICITATION OF AN OFFER TO BUY THESE SECURITIES IN ANY JURISDICTION WHERE THE OFFER OR SALE IS NOT PERMITTED. |
| | 80 | |
| Structural and Collateral Term Sheet | | BMO 2024-5C8 |
| No. 5 – Colony Square |
The following table presents certain information relating to the historical occupancy of the Colony Square Property:
| Historical and Current Occupancy(1) |
| 2021 | 2022 | 2023 | Current(2) |
| 76.2% | 81.3% | 82.8% | 82.5% |
| (1) | Historical occupancies are as of December 31 of each respective year unless otherwise stated. |
| (2) | Current Occupancy is as of September 9, 2024. |
The following table presents certain information relating to the tenants at the Colony Square Property:
| Tenant Summary(1) |
| Tenant | Tenant Type | Ratings
Moody’s/S&P/Fitch(2) | Net Rentable Area (SF) | % of
Total NRA | UW Base Rent PSF | UW Base Rent | % of Total
UW Base Rent | Lease
Expiration Date | Termination Option (Y/N)(3) | Renewal Option(3) |
| Jones Day | Office | NR/NR/NR | 115,000 | 10.6 | % | $37.73 | $4,338,950 | 12.9 | % | 11/30/2036 | N(4) | 2 x 5 Yr |
| WeWork | Office/Storage | NR/NR/NR | 44,463 | 4.1 | | $41.77 | 1,857,081 | 5.5 | | 4/30/2032 | N | 2 x 5 Yr |
| WebMD | Office/Storage | NR/NR/NR | 42,112 | 3.9 | | $41.92 | 1,765,443 | 5.2 | | 3/31/2028 | N | 1 x 5 Yr |
| SPACES | Office/Retail | NR/NR/NR | 42,273 | 3.9 | | $37.11 | 1,568,751 | 4.7 | | 5/31/2029 | N | 2 x 5 Yr |
| iPic Theater | Retail | NR/NR/NR | 38,011 | 3.5 | | $39.44 | 1,499,154 | 4.5 | | 12/31/2040 | N | 4 x 5 Yr |
| Whole Foods | Office | NR/NR/NR | 29,046 | 2.7 | | $41.41 | 1,202,795 | 3.6 | | 4/30/2032 | N | 2 x 5 Yr |
| CBS Radio East | Office/Storage | Baa2/NR/BBB | 29,688 | 2.7 | | $35.40 | 1,050,846 | 3.1 | | 11/30/2028 | Y(5) | 2 x 5 Yr |
| Diamond Sports | Office/Storage | NR/NR/NR | 36,883 | 3.4 | | $28.49 | 1,050,824 | 3.1 | | 9/30/2026 | N | 2 x 5 Yr |
| Lord, Aeck & Sargent | Office | NR/NR/NR | 30,016 | 2.8 | | $31.56 | 947,305 | 2.8 | | 11/30/2027 | N | 2 x 5 Yr |
| Tosca Services | Office | NR/NR/NR | 23,385 | 2.2 | | $39.42 | 921,741 | 2.7 | | 12/31/2027 | N | 1 x 5 Yr |
| Office/Retail/ Storage Tenants | | | 430,877 | 39.7 | % | $37.60 | $16,202,890 | 48.1 | % | | | |
| Remaining Occupied | | | 464,305 | 42.8 | | 37.65 | 17,481,707 | 51.9 | | | | |
| Total Occupied | | | 895,182 | 82.5 | % | $37.63 | $33,684,597 | 100.0 | % | | | |
| Vacant Space | | | 190,430 | 17.5 | | | | | | | |
| Collateral Total | | | 1,085,612 | 100.0 | % | | | | | | |
| | | | | | | | | | | |
| (1) | Based on the underwritten rent roll dated September 9, 2024, with contractual rent steps through August 2025. |
| (2) | In certain instances, ratings provided are those of the parent company of the entity shown, whether or not the parent company guarantees the lease. |
| (3) | Certain tenants may have termination, contraction or renewal options (which may become exercisable prior to the originally stated expiration date of the tenant lease) with respect to certain tenants’ leased storage space that is not considered in the above Tenant Summary. |
| (4) | Jones Day’s lease at the Colony Square Property commenced in June 2021, expires on November 30, 2036 and has a contraction option to terminate one floor 120 months (June 2031) after the lease commencement date. |
| (5) | CBS Radio East may terminate its office lease at any time with 12 months’ prior notice. |
THE INFORMATION IN THIS STRUCTURAL AND COLLATERAL TERM SHEET IS NOT COMPLETE AND MAY BE AMENDED PRIOR TO THE TIME OF SALE. THIS TERM SHEET IS NOT AN OFFER TO SELL THESE SECURITIES AND IT IS NOT A SOLICITATION OF AN OFFER TO BUY THESE SECURITIES IN ANY JURISDICTION WHERE THE OFFER OR SALE IS NOT PERMITTED. |
| | 81 | |
| Structural and Collateral Term Sheet | | BMO 2024-5C8 |
| No. 5 – Colony Square |
The following table presents certain information relating to the tenant lease expirations at the Colony Square Property:
| Lease Rollover Schedule(1)(2)(3) |
| Year | Number of Leases Expiring | Net Rentable Area Expiring | % of NRA Expiring | UW Base Rent Expiring(4) | % of UW Base Rent Expiring(4) | Cumulative Net Rentable Area Expiring | Cumulative % of NRA Expiring | Cumulative UW Base Rent Expiring(4) | Cumulative % of UW Base Rent Expiring(4) |
| MTM(5) | 10 | 13,704 | 1.3 | % | $22,466 | 0.1 | % | 13,704 | 1.3% | $22,466 | 0.1% |
| 2024 | 4 | 4,224 | 0.4 | | 44,768 | 0.1 | | 17,928 | 1.7% | $67,234 | 0.2% |
| 2025 | 17 | 70,888 | 6.5 | | 2,386,574 | 7.1 | | 88,816 | 8.2% | $2,453,808 | 7.3% |
| 2026 | 18 | 96,572 | 8.9 | | 3,015,645 | 9.0 | | 185,388 | 17.1% | $5,469,453 | 16.2% |
| 2027 | 20 | 107,574 | 9.9 | | 4,262,340 | 12.7 | | 292,962 | 27.0% | $9,731,794 | 28.9% |
| 2028 | 27 | 124,858 | 11.5 | | 5,249,578 | 15.6 | | 417,820 | 38.5% | $14,981,372 | 44.5% |
| 2029 | 21 | 104,577 | 9.6 | | 4,485,385 | 13.3 | | 522,397 | 48.1% | $19,466,757 | 57.8% |
| 2030 | 10 | 32,823 | 3.0 | | 1,528,896 | 4.5 | | 555,220 | 51.1% | $20,995,653 | 62.3% |
| 2031 | 11 | 61,332 | 5.6 | | 1,809,607 | 5.4 | | 616,552 | 56.8% | $22,805,261 | 67.7% |
| 2032 | 8 | 79,551 | 7.3 | | 3,333,631 | 9.9 | | 696,103 | 64.1% | $26,138,891 | 77.6% |
| 2033 | 1 | 2,980 | 0.3 | | 92,082 | 0.3 | | 699,083 | 64.4% | $26,230,973 | 77.9% |
| 2034 | 4 | 12,017 | 1.1 | | 515,289 | 1.5 | | 711,100 | 65.5% | $26,746,262 | 79.4% |
| 2035 & Beyond | 7 | 184,082 | 17.0 | | 6,938,335 | 20.6 | | 895,182 | 82.5% | $33,684,597 | 100.0% |
| Vacant | NAP | 190,430 | 17.5 | | NAP | NAP | | 1,085,612 | 100.0% | NAP | NAP |
| Total / Wtd. Avg. | 158(6) | 1,085,612 | 100.0 | % | $33,684,597 | 100.0 | % | | | | |
| (1) | Based on the underwritten rent roll dated September 9, 2024. |
| (2) | Lease Rollover Schedule is based on the lease expiration dates of all direct leases in place. Certain tenants have more than one lease. |
| (3) | Certain tenants may have termination or contraction options (which may become exercisable prior to the originally stated expiration date of the tenant lease) that are not considered in the above Lease Rollover Schedule. |
| (4) | UW Base Rent Expiring, % of UW Base Rent Expiring, Cumulative UW Base Rent Expiring and Cumulative % of UW Base Rent Expiring are inclusive of contractual rent steps underwritten through August 2025. |
| (5) | MTM includes leases that are considered amenities, management office, and five storage spaces that depend on other tenant leases. |
| (6) | The number of expiring leases includes office, retail, storage and mixed-use tenants. |
THE INFORMATION IN THIS STRUCTURAL AND COLLATERAL TERM SHEET IS NOT COMPLETE AND MAY BE AMENDED PRIOR TO THE TIME OF SALE. THIS TERM SHEET IS NOT AN OFFER TO SELL THESE SECURITIES AND IT IS NOT A SOLICITATION OF AN OFFER TO BUY THESE SECURITIES IN ANY JURISDICTION WHERE THE OFFER OR SALE IS NOT PERMITTED. |
| | 82 | |
| Structural and Collateral Term Sheet | | BMO 2024-5C8 |
| No. 5 – Colony Square |
The following table presents certain information relating to the operating history and underwritten net cash flow of the Colony Square Property:
| Operating History and Underwritten Net Cash Flow(1) |
| | 2019 | 2020(2) | 2021(2) | 2022(2) | 2023 | TTM(3) | Underwritten | Per Square Foot | %(4) |
| Base Rent | $18,260,518 | $19,784,299 | $23,062,339 | $28,545,982 | $31,820,621 | $31,929,941 | $32,794,612 | | $30.21 | 72.4 | % |
| Rent Steps | 0 | 0 | 0 | 0 | 0 | 0 | 889,985 | | 0.82 | 2.0 | |
| Vacancy Lease-Up | 0 | 0 | 0 | 0 | 0 | 0 | 7,564,548 | | 6.97 | 16.7 | |
| Total Base Rent | $18,260,518 | $19,784,299 | $23,062,339 | $28,545,982 | $31,820,621 | $31,929,941 | $41,249,145 | | $38.00 | 91.1 | % |
| Total Reimbursements | 1,003,124 | 654,243 | 1,078,643 | 3,819,783 | 4,002,407 | 4,014,008 | 4,030,272 | | 3.71 | 8.9 | |
| Gross Potential Rent | $19,263,642 | $20,438,542 | $24,140,982 | $32,365,766 | $35,823,028 | $35,943,949 | $45,279,418 | | $41.71 | 100.0 | % |
| Other Income(5) | 5,007,108 | 3,069,143 | 6,423,279 | 9,868,036 | 11,866,796 | 11,751,442 | 12,199,068 | | 11.24 | 26.9 | |
| (Vacancy/Credit Loss/Abatements) | 0 | 0 | 0 | 0 | 0 | 0 | (7,564,548) | | (6.97) | (16.7 | ) |
| Effective Gross Income | $24,270,750 | $23,507,685 | $30,564,261 | $42,233,801 | $47,689,824 | $47,695,391 | $49,913,938 | | $45.98 | 110.2 | % |
| Total Expenses(6) | 13,662,908 | 11,280,709 | 14,009,811 | 18,192,479 | 17,977,232 | 18,506,436 | 19,331,831 | | 17.81 | 38.7 | |
| Net Operating Income | $10,607,842 | $12,226,976 | $16,554,450 | $24,041,323 | $29,712,592 | $29,188,955 | $30,582,107 | | $28.17 | 61.3 | % |
| Capital Expenditures | 0 | 0 | 0 | 0 | 0 | 0 | 229,823 | | 0.21 | 0.5 | |
| TI/LC | 0 | 0 | 0 | 0 | 0 | 0 | 1,085,612 | | 1.00 | 2.2 | |
| Net Cash Flow | $10,607,842 | $12,226,976 | $16,554,450 | $24,041,323 | $29,712,592 | $29,188,955 | $29,266,672 | | $26.96 | 58.6 | % |
| (1) | Based on the underwritten rent roll dated September 9, 2024, with contractual rent steps through August 2025. |
| (2) | The increase in Base Rent and Net Operating Income from 2020 to 2021 and 2022 is largely due to the lease up of newly developed Building 300 and Building 500 as well as an increase in retail occupancy. |
| (3) | TTM represents the trailing 12-month period ending July 31, 2024. |
| (4) | % column represents percent of Gross Potential Rent for revenue lines and percent of Effective Gross Income for all remaining fields. |
| (5) | Other Income is based on the borrower’s 2024 budget and is comprised of percentage rent, parking, direct billing, administrative fees, roof and telecom, late fees and deposit fees bad debt and miscellaneous income. |
| (6) | Total Expenses includes management fees, real estate taxes, insurance, common area maintenance, repairs and maintenance, utilities, payroll, general and administrative, security, elevators and escalators, parking expenses, marketing and direct bill expenses. With respect to real estate taxes, the Colony Square Property benefits from tax abatements applicable to eight of the 12 tax parcels primarily expiring in 2030. Real estate taxes were underwritten based on the estimated 10-year abated real estate tax expense average. |
Environmental. According to the Phase I environmental assessment dated June 5, 2024, there was no evidence of any recognized environmental conditions at the Colony Square Property.
Appraisal. According to the appraisal, the Colony Square Property had an “as-is” appraised value of $516,000,000 as of May 24, 2024. The table below shows the appraisal’s “as-is” conclusions. The appraised value reflects the appraised value of the buildings at the Colony Square Property if sold individually. The appraisal determined an “as-is” portfolio value of $465,000,000 if the Colony Square Property were to be sold in its entirety, reflecting an approximately 10% portfolio discount.
| Appraisal Valuation Summary(1) |
| Appraisal Approach | Appraised Value | Capitalization Rate |
| Direct Capitalization Approach | $516,000,000 | 7.00% |
The Market. The Colony Square Property is located in Atlanta, Georgia. According to the appraisal, the Atlanta metropolitan statistical area (“Atlanta MSA”) had an estimated 2023 population of 6,313,755 which is an average annual 1.2% increase over the 2020 census. Additionally, the current estimated employment in the Atlanta MSA is 3,054,867 jobs which is a 22.0% increase over the past 10 years. Atlanta has the 10th strongest gross domestic product out of all metropolitan area economies in the nation. According to the appraisal, the 2023 total population within a one-, three- and five-mile radius of the Colony Square Property was 34,855, 202,261 and 422,620, respectively, and the 2023 median household income within the same radii was $113,273, $96,372 and $92,474, respectively.
THE INFORMATION IN THIS STRUCTURAL AND COLLATERAL TERM SHEET IS NOT COMPLETE AND MAY BE AMENDED PRIOR TO THE TIME OF SALE. THIS TERM SHEET IS NOT AN OFFER TO SELL THESE SECURITIES AND IT IS NOT A SOLICITATION OF AN OFFER TO BUY THESE SECURITIES IN ANY JURISDICTION WHERE THE OFFER OR SALE IS NOT PERMITTED. |
| | 83 | |
| Structural and Collateral Term Sheet | | BMO 2024-5C8 |
| No. 5 – Colony Square |
According to the appraisal, the Colony Square Property is located in the Midtown/Pershing Point office submarket, which had an inventory of 31.4 million square feet with a 21.4% vacancy rate. The average asking rent is $42.12 per square foot, which is 73.3% greater than the metro area average of $24.30 per square foot.
According to the appraisal, the Colony Square Property is also located in the Midtown/Brookwood retail submarket, which is ranked 27th in inventory in the metro area with 6,904,227 square feet, and has an asking rent of $35.96 per square foot, which is 71.5% greater than the metro area average of $20.97 per square foot. The Midtown/Brookwood retail submarket also holds a vacancy rate of 2.3%.
The following table presents certain information relating to comparable retail leases for the Colony Square Property:
| Comparable Retail Rental Summary(1) |
| Property Name / Location | Year Built / Renovated | Gross Building Area (SF) | Tenant Size (SF) | Tenant Name | Base Rent PSF | Commencement | Lease Term (Months) |
| Colony Square | 1972, 1974, 2020, 2021 / 2000 | 1,085,612(2) | 3,535(2)(3) | Chick-Fil-A | $32.28(2) | May-19(2) | 143(2) |
1197 Peachtree Street Northeast Atlanta, GA |
| 2274 Peachtree Road Northwest | NAV | NAV | 1,553 | Pulse Performance | $35.00 | Apr-24 | 60.0 |
| Atlanta, GA |
| 3050 Peachtree Drive Northeast | NAV | NAV | 2,672 | Ideal Image | $37.00 | Dec-23 | 60.0 |
| Atlanta, GA |
| 4330 Peachtree Road Northeast | NAV | NAV | 2,825 | MHBV Salon | $36.50 | Aug-24 | 120.0 |
| Brookhaven, GA |
| 2860 Cumberland Mall | NAV | NAV | 3,003 | Superior | $45.32 | Oct-23 | 48.0 |
| Atlanta, GA |
| 2955 Cobb Parkway Southeast | NAV | NAV | 4,000 | Mattress Firm | $49.00 | Oct-23 | 120.0 |
| Atlanta, GA |
| 4330 Peachtree Road | NAV | NAV | 2,087 | Tobbany | $33.00 | Sep-24 | 60.0 |
| Atlanta, GA |
| 2300 Peachtree Road Northwest | NAV | NAV | 3,382 | Fete Atlanta | $40.00 | Nov-23 | 60.0 |
| Atlanta, GA |
| | (1) | Information obtained from the appraisal unless otherwise indicated. |
| (2) | Based on the underwritten rent roll dated September 9, 2024. |
| (3) | Excluding 150 square feet of Chick-Fil-A’s storage space. |
THE INFORMATION IN THIS STRUCTURAL AND COLLATERAL TERM SHEET IS NOT COMPLETE AND MAY BE AMENDED PRIOR TO THE TIME OF SALE. THIS TERM SHEET IS NOT AN OFFER TO SELL THESE SECURITIES AND IT IS NOT A SOLICITATION OF AN OFFER TO BUY THESE SECURITIES IN ANY JURISDICTION WHERE THE OFFER OR SALE IS NOT PERMITTED. |
| | 84 | |
| Structural and Collateral Term Sheet | | BMO 2024-5C8 |
| No. 5 – Colony Square |
The following table presents certain information relating to comparable office leases for the Colony Square Property:
| Comparable Office Rental Summary(1) |
| Property Name / Location | Year Built / Renovated | Gross Building Area (SF) | Tenant Size (SF) | Tenant Name | Base Rent PSF | Commencement | Lease Term (Months) |
| Colony Square | 1972, 1974, 2020, 2021 / 2000 | 1,085,612(2) | 115,000(2) | Jones Day | $37.73(2) | Jun-21(2) | 186(2) |
| 1197 Peachtree Street Northeast Atlanta, GA |
| One Atlantic Center | 1987 / NAP | 1,101,022 | 8,000 | Duff & Phelps | $45.00 | Sep-24 | 120 |
1201 West Peachtree Street Northwest Atlanta, GA |
| Atlantic Station | 2007 / NAP | 390,276 | 4,392 | N/A | $45.00 | Dec-23 | 36 |
201 17th Street Northwest Atlanta, GA |
| Atlantic Station | 2007 / NAP | 390,276 | 7,023 | Tractian | $44.00 | Nov-23 | 42 |
201 17th Street Northwest Atlanta, GA |
Ponce City Market 675 Ponce De Leon Avenue Northeast | 2014 / NAP | 685,773 | 196,355 | MailChimp | $55.00 | Oct-23 | 6 |
| Atlanta, GA |
| (1) | Information obtained from the appraisal unless otherwise indicated. |
| (2) | Based on the underwritten rent roll dated September 9, 2024. Base Rent PSF includes contractual rent steps through August 2025. |
The Borrower. The borrower is LVA4 Atlanta Colony Square, L.P., a Delaware limited partnership structured as a single purpose, bankruptcy-remote entity, with its general partner structured as a single purpose, bankruptcy-remote Delaware single member limited liability company with two independent directors. Legal counsel to the borrower delivered a non-consolidation opinion in connection with the origination of the Colony Square Whole Loan.
The Borrower Sponsors. The borrower sponsors and non-recourse carveout guarantors are North American Ventures LLC and Lionstone U.S. Value-Add Four, L.P. North American Properties is a real estate developer, manager and investor, with a portfolio that spans 15 different states throughout the United States with a focus on Ohio, Texas, Florida and Georgia.
Property Management. The Colony Square Property is managed by North American Properties-Atlanta, Ltd., a property management company affiliated with North American Ventures LLC.
Escrows and Reserves. At origination of the Colony Square Whole Loan, the borrower deposited $4,000,000 for a rollover reserve fund, approximately $3,965,065 for outstanding TI/LC and approximately $965,127 for free rent reserves.
Tax Escrows – On a monthly basis, the borrower is required to escrow 1/12th of the estimated annual real estate tax payments (initially estimated to be approximately $375,955).
Insurance Escrows – On a monthly basis, the borrower is required to escrow 1/12th of the annual estimated insurance payments. Such reserve has been conditionally waived so long as the borrower maintains a blanket policy meeting the requirements of the Colony Square Whole Loan documents and the borrower provides evidence of the renewal of any insurance policy prior to the expiration thereof and receipts for the payment of the applicable premiums. As of the origination date, an acceptable blanket policy was in place.
Replacement Reserve – On a monthly basis, the borrower is required to escrow approximately $19,152 for the payment or reimbursement of approved capital expenses.
Rollover Reserve – On a monthly basis, the borrower is required to escrow approximately $90,468 for approved leasing expenses.
Additional Rollover Reserve – On a monthly basis, the borrower is required to escrow $425,000 from excess cash flow, to the extent available, for tenant improvement and leasing commission obligations incurred following the origination date (the “Additional Rollover Reserve”). Such monthly deposits into the Additional Rollover Reserve will not be required during
THE INFORMATION IN THIS STRUCTURAL AND COLLATERAL TERM SHEET IS NOT COMPLETE AND MAY BE AMENDED PRIOR TO THE TIME OF SALE. THIS TERM SHEET IS NOT AN OFFER TO SELL THESE SECURITIES AND IT IS NOT A SOLICITATION OF AN OFFER TO BUY THESE SECURITIES IN ANY JURISDICTION WHERE THE OFFER OR SALE IS NOT PERMITTED. |
| | 85 | |
| Structural and Collateral Term Sheet | | BMO 2024-5C8 |
| No. 5 – Colony Square |
such time that the balance of the Additional Rollover Reserve equals or exceeds $5,100,000 (the “Additional Rollover Reserve Required Amount”).
Lockbox / Cash Management. The Colony Square Whole Loan is structured with a hard lockbox and springing cash management. The borrower was required to deliver tenant direction letters to the existing tenants at the Colony Square Property, directing them to remit their rent directly to the lender-controlled lockbox. The borrower is required to cause revenue received by the borrower or the property manager, as applicable, from the Colony Square Property to be deposited into such lockbox within two business days of receipt. During the continuance of a Trigger Period (as defined below), provided that no event of default is then continuing, all funds in the lockbox account are required to be swept each business day into the lender-controlled cash management account and applied and disbursed in accordance with the Colony Square Whole Loan documents.
A “Trigger Period” means a period commencing upon the earliest to occur of (i) an event of default under the Colony Square Whole Loan, (ii) the debt yield being less than 9.5% (tested on a quarterly basis), (iii) the payment date that is six months prior to the maturity date or (iv) the occurrence of an Additional Replacement Reserve Trigger Event (as defined below), and ending if, with respect to a Trigger Period continuing pursuant to (A) clause (i), the event of default commencing the Trigger Period has been cured or waived and such cure has been accepted by the lender or the lender has waived such event of default in writing, and no other event of default is then continuing, (B) clause (ii), the earlier to occur of the date (x) that the debt yield is equal to or greater than 9.5% for two consecutive calendar quarters or (y) the borrower posts with the lender cash or a letter of credit in an amount that if applied to repay the Colony Square Whole Loan would cause the debt yield test set forth in the preceding clause (x) to be satisfied, (C) clause (iii), payment in full of the Colony Square Whole Loan in accordance with the terms of the Colony Square Whole Loan documents and (D) clause (iv), the occurrence of an Additional Replacement Reserve Cure Event (as defined below).
An “Additional Replacement Reserve Trigger Event” means the failure by the borrower to make deposits into the Additional Rollover Reserve account in the aggregate amount equal to or exceeding the Additional Rollover Reserve Required Amount prior to or on October 6, 2025.
An “Additional Replacement Reserve Cure Event” means the earlier to occur of the date (A) on which the aggregate amount of the Additional Rollover Reserve deposits made equals or exceeds the Additional Rollover Reserve Required Amount or (B) that the borrower otherwise deposits into the Additional Rollover Reserve account additional cash in an amount sufficient to have the aggregate amount of all deposits made into the Additional Rollover Reserve account equal or exceed the Additional Rollover Reserve Required Amount.
Subordinate and Mezzanine Debt. None.
Permitted Future Subordinate or Mezzanine Debt. Not permitted.
Permitted Future Preferred Equity. The borrower is permitted to obtain a one-time preferred equity investment in an amount not to exceed $40,000,000, subject to satisfaction of certain conditions, including the following: (i) the preferred equity investment must be made by a qualified institutional investor, (ii) the loan-to-value ratio (as determined by the lender in its sole but reasonable discretion taking into consideration the contemplated permitted preferred equity) must be equal to or less than 65%, (iii) the debt service coverage ratio (taking into account the permitted preferred equity and based on net cash flow and the current pay interest only preferred return payable) must equal at least 1.20x, (iv) the debt service coverage ratio (taking into account the permitted preferred equity and based on net operating income on the total preferred return (i.e., the sum of the current pay interest only return and the accrued interest only return) must be at least 1.15x, (v) the debt yield (taking into consideration the permitted preferred equity) must be equal to or greater than 10% and (vi) delivery of a rating agency confirmation.
Partial Release. Not permitted.
Ground Lease. The Colony Square Property consists of 12 tax parcels, eight of which are subject to a 10-year tax abatement expiring either in 2030 or 2031 pursuant to a tax abatement transaction with the Atlanta Development Authority d/b/a Invest Atlanta (the “Authority”). Each tax abatement begins with a 50.0% reduction against the gross tax expense and decreases by 5.0% each year. To effectuate tax abatement benefits for the Colony Square Property, the borrower transferred fee ownership the Colony Square Property to the Authority and subsequently leased it back from the Authority
THE INFORMATION IN THIS STRUCTURAL AND COLLATERAL TERM SHEET IS NOT COMPLETE AND MAY BE AMENDED PRIOR TO THE TIME OF SALE. THIS TERM SHEET IS NOT AN OFFER TO SELL THESE SECURITIES AND IT IS NOT A SOLICITATION OF AN OFFER TO BUY THESE SECURITIES IN ANY JURISDICTION WHERE THE OFFER OR SALE IS NOT PERMITTED. |
| | 86 | |
| Structural and Collateral Term Sheet | | BMO 2024-5C8 |
| No. 5 – Colony Square |
pursuant to a ground lease. The ground lease expires on December 31, 2032. The borrower has the right to purchase the fee interest back from the Authority at any time during the tax abatement period for $1.00 in exchange for terminating any future tax abatement benefits. In addition, the Authority agreed to sell, and the borrower agreed to purchase, the fee interest for $1.00 at expiration or sooner termination of the ground lease. In addition to the mortgage on the borrower’s leasehold estate under the ground lease, the Colony Square Whole Loan is also secured by a mortgage on the Authority’s related fee interest.
THE INFORMATION IN THIS STRUCTURAL AND COLLATERAL TERM SHEET IS NOT COMPLETE AND MAY BE AMENDED PRIOR TO THE TIME OF SALE. THIS TERM SHEET IS NOT AN OFFER TO SELL THESE SECURITIES AND IT IS NOT A SOLICITATION OF AN OFFER TO BUY THESE SECURITIES IN ANY JURISDICTION WHERE THE OFFER OR SALE IS NOT PERMITTED. |
| | 87 | |
| Structural and Collateral Term Sheet | | BMO 2024-5C8 |
| No. 6 – Quest Diagnostics – Chantilly |

THE INFORMATION IN THIS STRUCTURAL AND COLLATERAL TERM SHEET IS NOT COMPLETE AND MAY BE AMENDED PRIOR TO THE TIME OF SALE. THIS TERM SHEET IS NOT AN OFFER TO SELL THESE SECURITIES AND IT IS NOT A SOLICITATION OF AN OFFER TO BUY THESE SECURITIES IN ANY JURISDICTION WHERE THE OFFER OR SALE IS NOT PERMITTED. |
| | 88 | |
| Structural and Collateral Term Sheet | | BMO 2024-5C8 |
| No. 6 – Quest Diagnostics – Chantilly |
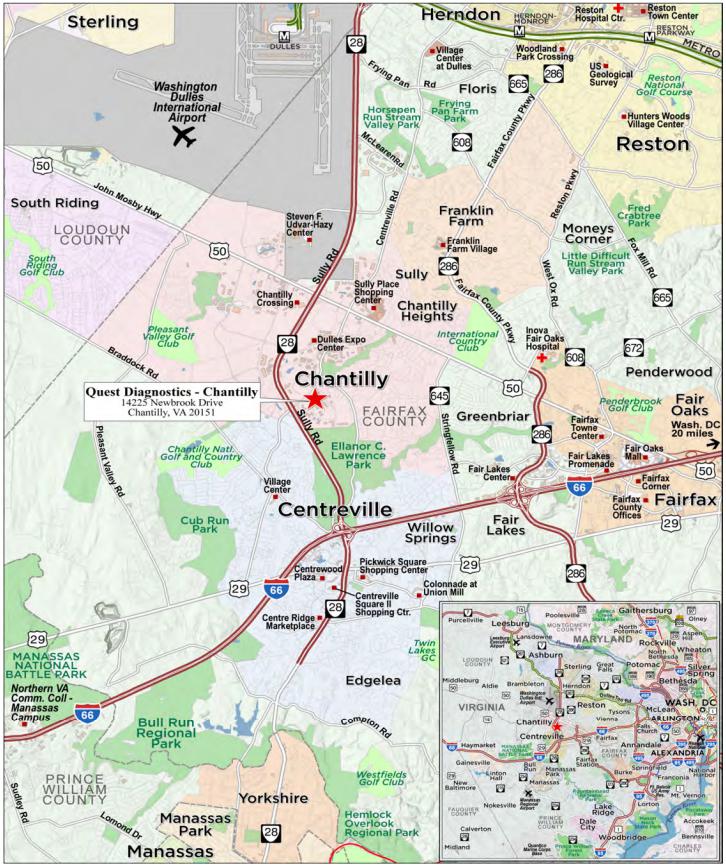
THE INFORMATION IN THIS STRUCTURAL AND COLLATERAL TERM SHEET IS NOT COMPLETE AND MAY BE AMENDED PRIOR TO THE TIME OF SALE. THIS TERM SHEET IS NOT AN OFFER TO SELL THESE SECURITIES AND IT IS NOT A SOLICITATION OF AN OFFER TO BUY THESE SECURITIES IN ANY JURISDICTION WHERE THE OFFER OR SALE IS NOT PERMITTED. |
| | 89 | |
| Structural and Collateral Term Sheet | | BMO 2024-5C8 |
| No. 6 – Quest Diagnostics – Chantilly |
| Mortgage Loan Information | | Property Information |
| Mortgage Loan Seller: | GSMC | | Single Asset / Portfolio: | Single Asset |
| Original Principal Balance: | $57,300,000 | | Title: | Fee |
| Cut-off Date Principal Balance: | $57,300,000 | | Property Type – Subtype: | Mixed Use – Lab/Office |
| % of IPB: | 5.8% | | Net Rentable Area (SF): | 248,186 |
| Loan Purpose: | Recapitalization | | Location: | Chantilly, VA |
| Borrower: | NM QST, L.L.C. | | Year Built / Renovated: | 1991 / 2006 |
| Borrower Sponsor: | New Mountain Net Lease Partners II Corporation | | Occupancy: | 100.0% |
| Interest Rate: | 5.66000% | | Occupancy Date: | 12/6/2024 |
| Note Date: | 11/13/2024 | | 4th Most Recent NOI (As of)(2): | NAV |
| Maturity Date: | 12/6/2029 | | 3rd Most Recent NOI (As of): | $5,516,307 (12/31/2021) |
| Interest-only Period: | 60 months | | 2nd Most Recent NOI (As of): | $5,656,667 (12/31/2022) |
| Original Term: | 60 months | | Most Recent NOI (As of): | $5,781,921 (12/31/2023) |
| Original Amortization Term: | None | | UW Economic Occupancy: | 95.0% |
| Amortization Type: | Interest Only | | UW Revenues: | $6,841,634 |
| Call Protection: | L(23),YM1(1),DorYM(31),O(5) | | UW Expenses: | $973,188 |
| Lockbox / Cash Management: | Hard / Springing | | UW NOI: | $5,868,446 |
| Additional Debt: | No | | UW NCF: | $5,831,218 |
| Additional Debt Balance: | N/A | | Appraised Value / Per SF: | $81,000,000 / $326 |
| Additional Debt Type: | N/A | | Appraisal Date: | 9/16/2024 |
| | | | | |
| Escrows and Reserves(1) | | Financial Information |
| | Initial | Monthly | Initial Cap | | Cut-off Date Loan / SF: | $231 |
| Taxes: | $0 | Springing | N/A | | Maturity Date Loan / SF: | $231 |
| Insurance: | $0 | Springing | N/A | | Cut-off Date LTV: | 70.7% |
| Replacement Reserves: | $0 | Springing | $55,842 | | Maturity Date LTV: | 70.7% |
| TI / LC Reserve: | $0 | Springing | $372,279 | | UW NCF DSCR: | 1.77x |
| Downgrade Reserve: | $0 | Springing | $1,489,116 | | UW NOI Debt Yield: | 10.2% |
Master Lease Trigger Period Avoidance Reserve | $0 | Springing | N/A | | | |
| | | | | | | |
| Sources and Uses |
| Sources | Proceeds | % of Total | | Uses | Proceeds | % of Total |
| Mortgage Loan: | $57,300,000 | 100.0% | | Principal Equity Distribution:(3) | $54,073,047 | 94.4 | % |
| | | | | Closing Costs:(4) | 3,226,953 | 5.6 | |
| Total Sources: | $57,300,000 | 100.0% | | Total Uses: | $57,300,000 | 100.0 | % |
| (1) | See “Escrows and Reserves” below for further discussion of reserve information. |
| (2) | 2020 financials are not available given Quest Diagnostics leases the Quest Diagnostics – Chantilly Property (as defined below) on a triple-net basis. |
| (3) | The borrower sponsor acquired the Quest Diagnostics – Chantilly Property (as defined below) in October 2024 for $80.5 million. |
| (4) | Closing Costs include a rate buydown of $2,865,000. |
The Loan. The sixth largest mortgage loan (the “Quest Diagnostics – Chantilly Mortgage Loan”) is evidenced by a single promissory note with a principal balance as of the Cut-off Date of $57,300,000, secured by a first lien deed of trust on the borrower’s fee interest in a 248,186 square foot office, laboratory and diagnostic testing property (the “Quest Diagnostics – Chantilly Property”) located in Chantilly, Virginia. The Quest Diagnostics – Chantilly Mortgage Loan was originated by Goldman Sachs Bank USA on November 13, 2024, has a 5-year interest-only term and accrues interest at a rate of 5.66000% per annum on an Actual/360 basis. The proceeds of the Quest Diagnostics – Chantilly Mortgage Loan were used by the borrower to recapitalize the Quest Diagnostics – Chantilly Property and pay origination costs. The Quest Diagnostics – Chantilly Mortgage Loan had an original term of 60 months and has a remaining term of 60 months as of the Cut-off Date. The scheduled maturity date of the Quest Diagnostics – Chantilly Mortgage Loan is the payment date in December 2029.
The Property. The Quest Diagnostics – Chantilly Property is a three-story, 248,186 square foot laboratory and diagnostic testing facility located at 14225 Newbrook Drive in Chantilly, Virginia. The Quest Diagnostics – Chantilly Property is 100.0%
THE INFORMATION IN THIS STRUCTURAL AND COLLATERAL TERM SHEET IS NOT COMPLETE AND MAY BE AMENDED PRIOR TO THE TIME OF SALE. THIS TERM SHEET IS NOT AN OFFER TO SELL THESE SECURITIES AND IT IS NOT A SOLICITATION OF AN OFFER TO BUY THESE SECURITIES IN ANY JURISDICTION WHERE THE OFFER OR SALE IS NOT PERMITTED. |
| | 90 | |
| Structural and Collateral Term Sheet | | BMO 2024-5C8 |
| No. 6 – Quest Diagnostics – Chantilly |
leased to Quest Diagnostics (the “Tenant”) on a triple-net basis. Approximately 70% of the Quest Diagnostics – Chantilly Property is dedicated to lab space focused on toxicology, cytogenetics, microbiology and other purposes.
Sole Tenant. The entire Quest Diagnostics – Chantilly Property is leased to Quest Diagnostics on a triple-net basis.
Quest Diagnostics (248,186 SF, 100.0% of NRA, 100.0% of underwritten base rent): Quest Diagnostics (NYSE: DGX) is an American clinical laboratory operator and provider of diagnostics testing. Every year, Quest Diagnostics serves one in three adult Americans and half of the physicians and hospitals in the United States. Quest Diagnostics has nearly 50,000 employees located across 2,000 patient locations. Quest Diagnostics’ lease commenced in January 1997, expires in December 2036, includes two five-year renewal options and has no termination options.
Appraisal. According to the appraisal dated September 16, 2024, the Quest Diagnostics – Chantilly Property had an “as-is” appraised value of $81,000,000. The table below shows the appraisal’s “as-is” conclusions:
| Appraisal Valuation Summary(1) |
| Appraisal Approach | Appraised Value | Capitalization Rate |
| Income Capitalization Approach | $81,000,000 | 7.50% |
Environmental. According to the Phase I environmental assessment for the Quest Diagnostics – Chantilly Property dated July 11, 2024, there was no evidence of any recognized environmental conditions at the Quest Diagnostics – Chantilly Property.
The following table presents certain information relating to the sole tenant at the Quest Diagnostics – Chantilly Property:
| Sole Tenant Summary(1) |
| Tenant Name | Credit Rating (Moody's/ S&P/Fitch) | Net Rentable Area (SF) | % of Total NRA | UW Base Rent PSF | UW Base Rent | % of Total UW Base Rent | Lease Exp. Date |
| Quest Diagnostics | Baa1/BBB+/BBB | 248,186 | 100.0 | % | $24.64 | $6,114,337 | 100.0% | 12/31/2036 |
| Occupied Total Collateral | | 248,186 | 100.0 | % | $24.64 | $6,114,337 | 100.0% | |
| Vacant Space (Owned) | | 0 | 0.0 | | | | | |
| Totals/ Wtd. Avg. All Owned Tenants | | 248,186 | 100.0 | % | | | | |
| (1) | Based on the underwritten rent roll dated December 6, 2024, inclusive of rent steps through November 30, 2025. |
THE INFORMATION IN THIS STRUCTURAL AND COLLATERAL TERM SHEET IS NOT COMPLETE AND MAY BE AMENDED PRIOR TO THE TIME OF SALE. THIS TERM SHEET IS NOT AN OFFER TO SELL THESE SECURITIES AND IT IS NOT A SOLICITATION OF AN OFFER TO BUY THESE SECURITIES IN ANY JURISDICTION WHERE THE OFFER OR SALE IS NOT PERMITTED. |
| | 91 | |
| Structural and Collateral Term Sheet | | BMO 2024-5C8 |
| No. 6 – Quest Diagnostics – Chantilly |
The following table presents certain information relating to the lease rollover schedule at the Quest Diagnostics – Chantilly Property:
| Lease Rollover Schedule(1) |
| Year | Number of Leases Expiring | Net Rentable Area Expiring | % of NRA Expiring | UW Base Rent Expiring | % of UW Base Rent Expiring | Cumulative Net Rentable Area Expiring | Cumulative % of NRA Expiring | Cumulative UW Base Rent Expiring | Cumulative % of UW Base Rent Expiring |
| Vacant | 0 | 0 | 0.0 | % | $0 | 0.0 | % | 0 | 0.0% | $0 | 0.0% |
| 2024 & MTM | 0 | 0 | 0.0 | | 0 | 0.0 | | 0 | 0.0% | 0 | 0.0% |
| 2025 | 0 | 0 | 0.0 | | 0 | 0.0 | | 0 | 0.0% | 0 | 0.0% |
| 2026 | 0 | 0 | 0.0 | | 0 | 0.0 | | 0 | 0.0% | 0 | 0.0% |
| 2027 | 0 | 0 | 0.0 | | 0 | 0.0 | | 0 | 0.0% | 0 | 0.0% |
| 2028 | 0 | 0 | 0.0 | | 0 | 0.0 | | 0 | 0.0% | 0 | 0.0% |
| 2029 | 0 | 0 | 0.0 | | 0 | 0.0 | | 0 | 0.0% | 0 | 0.0% |
| 2030 | 0 | 0 | 0.0 | | 0 | 0.0 | | 0 | 0.0% | 0 | 0.0% |
| 2031 | 0 | 0 | 0.0 | | 0 | 0.0 | | 0 | 0.0% | 0 | 0.0% |
| 2032 | 0 | 0 | 0.0 | | 0 | 0.0 | | 0 | 0.0% | 0 | 0.0% |
| 2033 | 0 | 0 | 0.0 | | 0 | 0.0 | | 0 | 0.0% | 0 | 0.0% |
| 2034 | 0 | 0 | 0.0 | | 0 | 0.0 | | 0 | 0.0% | 0 | 0.0% |
| 2035 & Beyond | 1 | 248,186 | 100.0 | | 6,114,337 | 100.0 | | 248,186 | 100.0% | 6,114,337 | 100.0% |
| Total/Wtd. Avg. | 1 | 248,186 | 100.0 | % | $6,114,337 | 100.0 | % | | | | |
| (1) | Based on the underwritten rent roll dated December 6, 2024, inclusive of rent steps through November 30, 2025. |
The following table presents certain information relating to the underwritten cash flows of the Quest Diagnostics – Chantilly Property:
| Underwritten Net Cash Flow(1) |
| | 2021 | 2022 | 2023 | Underwritten | PSF | %(2) |
| Base Rent | $5,539,287 | $5,677,769 | $5,819,714 | $6,114,337 | $24.64 | 84.9 | % |
| Rent Steps | 0 | 0 | 0 | 115,170 | 0.46 | 1.6 | |
| Reimbursements | 578,090 | 569,010 | 577,161 | 972,213 | 3.92 | 13.5 | |
| Potential Gross Revenue | $6,117,377 | $6,246,779 | $6,396,874 | $7,201,720 | $29.02 | 100.0 | % |
| Vacancy Loss | 0 | 0 | 0 | (360,086) | (1.45) | (5.0% | ) |
| Effective Gross Revenue | $6,117,377 | $6,246,779 | $6,396,874 | $6,841,634 | $27.57 | 95.0 | % |
| Real Estate Taxes | 484,465 | 487,553 | 465,300 | 488,013 | 1.97 | 7.1 | |
| Insurance | 11,966 | 12,167 | 13,969 | 199,518 | 0.80 | 2.9 | |
| Payroll | 32,062 | 33,665 | 35,113 | 56,938 | 0.23 | 0.8 | |
| Other Expenses | 72,578 | 56,727 | 100,571 | 228,719 | 0.92 | 3.3 | |
| Total Expenses | $601,070 | $590,112 | $614,953 | $973,188 | $3.92 | 14.2 | % |
| Net Operating Income | $5,516,307 | $5,656,667 | $5,781,921 | $5,868,446 | $23.65 | 85.8 | % |
| Replacement Reserves | 0 | 0 | 0 | 37,228 | 0.15 | 0.5 | |
| TI/LC | 0 | 0 | 0 | 0 | 0.00 | 0.0 | |
| Net Cash Flow | $5,516,307 | $5,656,667 | $5,781,921 | $5,831,218 | $23.50 | 85.2 | % |
| (1) | Based on the underwritten rent roll dated December 6, 2024, inclusive of rent steps through November 30, 2025. |
| (2) | % column represents percent of Potential Gross Revenue for revenue fields and represents percent of Effective Gross Revenue for the remainder of fields. |
The Market. The Quest Diagnostics – Chantilly Property is located in the Route 28 South Office submarket within the broader Washington, DC metropolitan statistical area. The Quest Diagnostics – Chantilly Property is located in the Westfields Corporate Center, a business park developed in the early 1980s. The area benefits from close proximity to federal agencies and their business partners. Located approximately 10 miles south of Washington Dulles International Airport, the Quest Diagnostics – Chantilly Property is proximate to the Dulles Toll Road, Interstate 66 and U.S. Route 50, amongst other major throughfares.
The Borrower. The borrower is NM QST, L.L.C., a Delaware limited liability company, a special purpose entity with two independent directors in its organizational structure. Legal counsel to the borrower delivered a non-consolidation opinion in connection with the origination of the Quest Diagnostics – Chantilly Mortgage Loan.
THE INFORMATION IN THIS STRUCTURAL AND COLLATERAL TERM SHEET IS NOT COMPLETE AND MAY BE AMENDED PRIOR TO THE TIME OF SALE. THIS TERM SHEET IS NOT AN OFFER TO SELL THESE SECURITIES AND IT IS NOT A SOLICITATION OF AN OFFER TO BUY THESE SECURITIES IN ANY JURISDICTION WHERE THE OFFER OR SALE IS NOT PERMITTED. |
| | 92 | |
| Structural and Collateral Term Sheet | | BMO 2024-5C8 |
| No. 6 – Quest Diagnostics – Chantilly |
The Borrower Sponsor. The borrower sponsor and non-recourse carveout guarantor is New Mountain Net Lease Partners II Corporation.
Property Management. The Quest Diagnostics – Chantilly Property is self-managed.
Escrows and Reserves. At loan origination, the borrower was not required to make any upfront deposits.
Tax Reserve – On each payment date during a Quest Diagnostics – Chantilly Trigger Period (as defined below), the borrower is required to deposit into a real estate tax reserve an amount equal to 1/12 of the amount that the lender reasonably estimates will be necessary to pay real estate taxes over the next 12-month period (such reserve will be conditionally waived so long as no event of default under the Quest Diagnostics – Chantilly Mortgage Loan documents has occurred and is continuing, the Tenant is required to pay such taxes and, upon the request of the lender, the borrower has provided evidence that taxes have been paid in accordance with the requirements of the Quest Diagnostics – Chantilly Mortgage Loan documents).
Insurance Reserve – On each payment date during a Quest Diagnostics – Chantilly Trigger Period, the borrower is required to deposit into an insurance reserve an amount equal to 1/12 of the amount that the lender reasonably estimates will be necessary to cover premiums over the next 12-month period (such reserve will be conditionally waived so long as no event of default under the Quest Diagnostics – Chantilly Mortgage Loan documents has occurred and is continuing, the Tenant is required to pay such insurance premiums and, upon the request of the lender, the borrower has provided evidence that insurance premiums have been paid in accordance with the requirements of the Quest Diagnostics – Chantilly Mortgage Loan documents).
TI/LC Reserve – On each payment date during a Quest Diagnostics – Chantilly Trigger Period, the borrower is required to deposit approximately $20,682 into a tenant improvement and leasing commissions reserve, capped at $372,279 (excluding amounts deposited therein in respect of lease termination proceeds).
Capital Expenditure Reserve – On each payment date during a Quest Diagnostics – Chantilly Trigger Period, the borrower is required to deposit approximately $3,102 into a capital expenditure reserve, capped at $55,842.
Master Lease Reserve – Upon the occurrence of a Quest Diagnostics – Chantilly Master Lease Trigger Event (as defined below), the borrower is required to deposit all excess cash flow into a master lease reserve account as described below under “—Lockbox/Cash Management;” provided, however, any amounts required to be deposited in the master lease reserve account may, at the borrower’s election, be provided instead in the form of one or more letters of credit up to an aggregate amount of 10% of the then outstanding principal balance of the Quest Diagnostics – Chantilly Mortgage Loan.
Downgrade Reserve – On each payment date during a Quest Diagnostics – Chantilly Downgrade Reserve Period (as defined below), if and to the extent the amount contained in the downgrade reserve account is less than $1,489,116, the borrower is required to deposit an amount equal to $41,364 (the “Quest Diagnostics – Chantilly Monthly Downgrade Amount”); provided, however, in lieu of depositing the Quest Diagnostics – Chantilly Monthly Downgrade Amount the borrower may, at the borrower’s election, deliver to the lender a letter of credit satisfying the conditions set forth in the Quest Diagnostics – Chantilly Mortgage Loan documents.
Master Lease Trigger Period Avoidance Reserve– Upon the occurrence of a Quest Diagnostics – Chantilly Master Lease Trigger Event, in order to satisfy the Master Lease Trigger Period Avoidance Condition (as defined below), the borrower may elect to make a cash deposit into a master lease trigger period avoidance reserve account as described below under “—Lockbox/Cash Management.”
DSCR Trigger Period Avoidance Reserve– Upon the occurrence of a Quest Diagnostics – Chantilly DSCR Trigger Event (as defined below), in order to satisfy the DSCR Trigger Period Avoidance Condition (as defined below), the borrower may elect to make a cash deposit with into a DSCR trigger period avoidance reserve account as described below under “— Lockbox/Cash Management.”
A “Quest Diagnostics – Chantilly Downgrade Reserve Period” means the period commencing on the first payment date following the date on which the Tenant or any guarantor of the master lease which is rated by at least two nationally recognized statistical rating organizations (“NRSROs”) is downgraded below “B+” (or the equivalent) by at least two
THE INFORMATION IN THIS STRUCTURAL AND COLLATERAL TERM SHEET IS NOT COMPLETE AND MAY BE AMENDED PRIOR TO THE TIME OF SALE. THIS TERM SHEET IS NOT AN OFFER TO SELL THESE SECURITIES AND IT IS NOT A SOLICITATION OF AN OFFER TO BUY THESE SECURITIES IN ANY JURISDICTION WHERE THE OFFER OR SALE IS NOT PERMITTED. |
| | 93 | |
| Structural and Collateral Term Sheet | | BMO 2024-5C8 |
| No. 6 – Quest Diagnostics – Chantilly |
NRSROs and concluding on the first payment date following the date on which the Tenant (or any guarantor of the master lease) is subsequently rated “B+” or above by at least two NRSROs; provided that if such party is only rated by one NRSRO, the Quest Diagnostics – Chantilly Downgrade Reserve Period means the period commencing on the first payment date following the date on which such party is downgraded below “B+” (or the equivalent) by such NRSRO and concluding on the first payment date following the date on which such party is subsequently rated “B+” or above by such NRSRO.
Lockbox / Cash Management. The Quest Diagnostics – Chantilly Mortgage Loan documents require a hard lockbox and springing cash management. The borrower was required to deliver a tenant direction letter to the Tenant directing the Tenant to remit its rents directly to the lender-controlled lockbox. So long as no Quest Diagnostics – Chantilly Trigger Period or event of default under the Quest Diagnostics – Chantilly Mortgage Loan documents then exists, all funds deposited into the lockbox account are required to be transferred on each business day to a borrower-controlled operating account. Upon the occurrence and during the continuance of a Quest Diagnostics – Chantilly Trigger Period or event of default under the Quest Diagnostics – Chantilly Mortgage Loan documents, all funds in the lockbox account are required to be swept on each business day to a cash management account under the control of the lender.
During the continuance of a Quest Diagnostics – Chantilly Trigger Period or, at the lender’s sole discretion, during an event of default under the Quest Diagnostics – Chantilly Mortgage Loan documents, funds in the cash management account will be applied and disbursed for payment of taxes, insurance premiums, debt service, operating expenses, reserves, and other amounts payable in accordance with the Quest Diagnostics – Chantilly Mortgage Loan documents, and all excess cash flow funds remaining in the cash management account after the application of such funds in accordance with the Quest Diagnostics – Chantilly Mortgage Loan documents are required to be held by the lender (a) during the continuance of a Quest Diagnostics – Chantilly Trigger Period caused by a Quest Diagnostics – Chantilly Master Lease Trigger Event, in the master lease reserve account or (b) during the continuance of a Quest Diagnostics – Chantilly Trigger Period during which a Quest Diagnostics – Chantilly Master Lease Trigger Event is not in effect, (x) to the extent that the balance in the excess cash flow reserve account is less than an amount equal to the monthly base rent under the master lease or any replacement master lease (as of the date of the commencement of the applicable Quest Diagnostics – Chantilly Trigger Period) multiplied by eighteen (the “Quest Diagnostics – Chantilly Excess Cash Flow Threshold Amount”), in an excess cash flow reserve account as additional collateral for the Quest Diagnostics – Chantilly Mortgage Loan and (y) to the extent that the balance in the excess cash flow reserve account equals or exceeds the Quest Diagnostics – Chantilly Excess Cash Flow Threshold Amount, in a borrower-controlled operating account. Upon the occurrence and during the continuance of an event of default under the Quest Diagnostics – Chantilly Mortgage Loan documents or any bankruptcy action of the borrower, the lender may apply funds to the debt in such priority as it may determine.
A “Quest Diagnostics – Chantilly Trigger Period” means each period that commences when (a) the Tenant files for bankruptcy and concludes when (x) (i) the Tenant assumes the master lease in connection with such bankruptcy or (ii) the borrower has relet the Quest Diagnostics – Chantilly Property pursuant to an approved substitute lease resulting in a debt service coverage ratio of at least 1.25x or (y) the borrower has deposited with the lender cash or a letter of credit in such amount as calculated pursuant to the Quest Diagnostics – Chantilly Mortgage Loan documents (a “Master Lease Trigger Period Avoidance Condition”); (b) the Tenant has (i) ceased its business operations in more than 25% (in the aggregate) of the Quest Diagnostics – Chantilly Property or (ii) terminated the master lease (a “Go-Dark Event”) and concludes when (x) (1) a Go-Dark Event is no longer continuing and (2) the Tenant has provided an estoppel certificate confirming its intent to occupy the Quest Diagnostics – Chantilly Property in accordance with the master lease, or (y) the borrower has relet the Quest Diagnostics – Chantilly Property pursuant to an approved substitute lease resulting in a debt service coverage ratio of at least 1.25x or (z) the Master Lease Trigger Period Avoidance Condition is satisfied (any of the events described in clauses (a) and (b), a “Quest Diagnostics – Chantilly Master Lease Trigger Event”); (c) the debt service coverage ratio as of the last day of any two consecutive fiscal quarters, is less than 1.25x (a “Quest Diagnostics – Chantilly DSCR Trigger Event”) and concludes when (x) the debt service coverage ratio, as of the last day of any two consecutive fiscal quarters, is equal to or greater than 1.25x or (y) the borrower has deposited with the lender cash or a letter of credit in such amount as calculated pursuant to the Quest Diagnostics – Chantilly Mortgage Loan documents (a “DSCR Trigger Period Avoidance Condition”) and/or (d) commences when (and if) the financial reports required under the Quest Diagnostics – Chantilly Mortgage Loan documents are not delivered to the lender as and when required and concludes when such reports are delivered and they indicate that, in fact, no Quest Diagnostics – Chantilly Trigger Period based upon clause (c) above is ongoing.
Subordinate and Mezzanine Debt. None.
THE INFORMATION IN THIS STRUCTURAL AND COLLATERAL TERM SHEET IS NOT COMPLETE AND MAY BE AMENDED PRIOR TO THE TIME OF SALE. THIS TERM SHEET IS NOT AN OFFER TO SELL THESE SECURITIES AND IT IS NOT A SOLICITATION OF AN OFFER TO BUY THESE SECURITIES IN ANY JURISDICTION WHERE THE OFFER OR SALE IS NOT PERMITTED. |
| | 94 | |
| Structural and Collateral Term Sheet | | BMO 2024-5C8 |
| No. 6 – Quest Diagnostics – Chantilly |
Permitted Future Subordinate or Mezzanine Debt. Not permitted.
Partial Release. Not Permitted.
Ground Lease. None.
THE INFORMATION IN THIS STRUCTURAL AND COLLATERAL TERM SHEET IS NOT COMPLETE AND MAY BE AMENDED PRIOR TO THE TIME OF SALE. THIS TERM SHEET IS NOT AN OFFER TO SELL THESE SECURITIES AND IT IS NOT A SOLICITATION OF AN OFFER TO BUY THESE SECURITIES IN ANY JURISDICTION WHERE THE OFFER OR SALE IS NOT PERMITTED. |
| | 95 | |
| Structural and Collateral Term Sheet | | BMO 2024-5C8 |
| No. 7 – Woodland Mall |
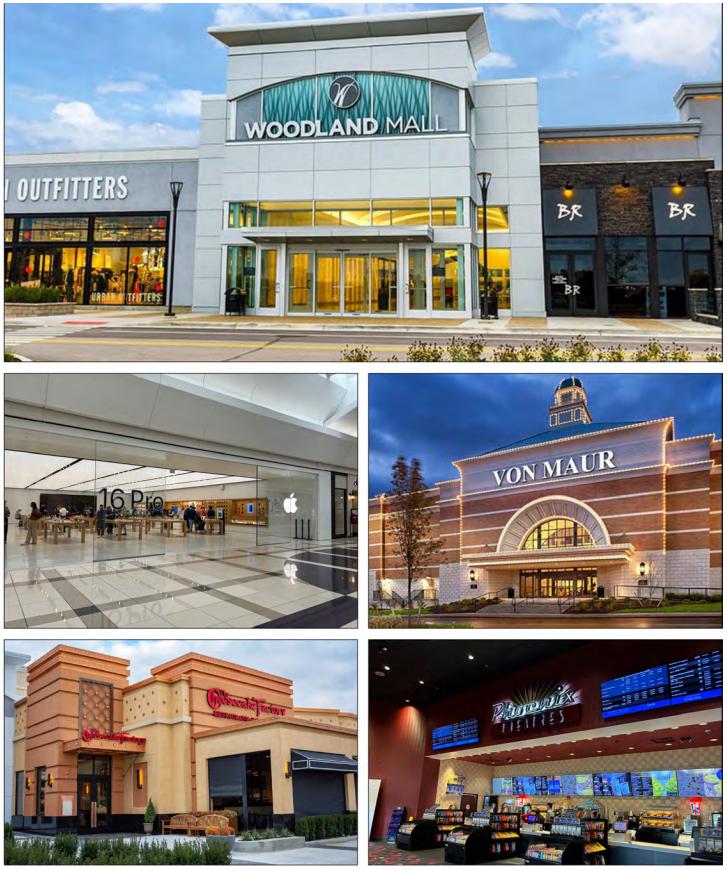
THE INFORMATION IN THIS STRUCTURAL AND COLLATERAL TERM SHEET IS NOT COMPLETE AND MAY BE AMENDED PRIOR TO THE TIME OF SALE. THIS TERM SHEET IS NOT AN OFFER TO SELL THESE SECURITIES AND IT IS NOT A SOLICITATION OF AN OFFER TO BUY THESE SECURITIES IN ANY JURISDICTION WHERE THE OFFER OR SALE IS NOT PERMITTED. |
| | 96 | |
| Structural and Collateral Term Sheet | | BMO 2024-5C8 |
| No. 7 – Woodland Mall |
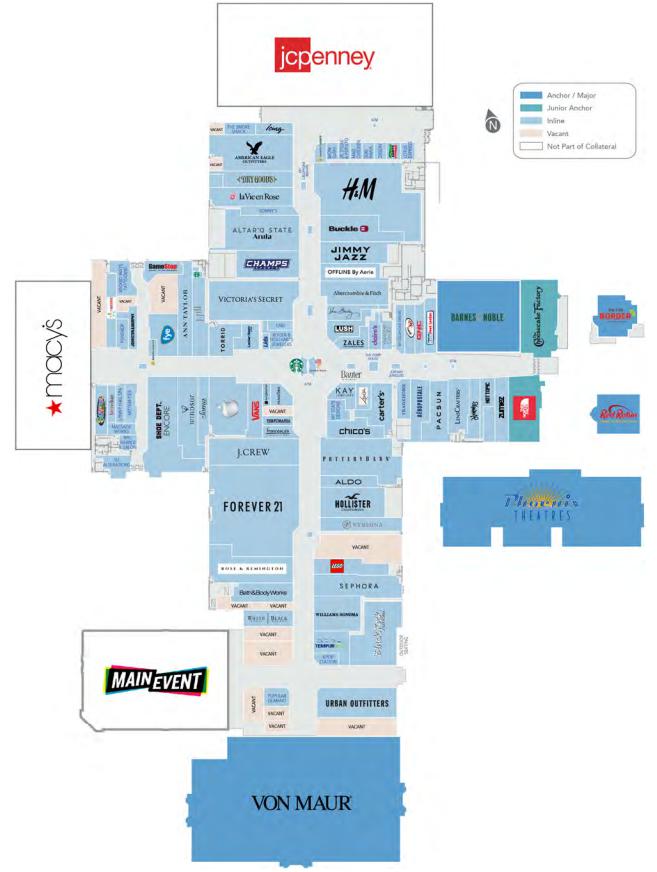
THE INFORMATION IN THIS STRUCTURAL AND COLLATERAL TERM SHEET IS NOT COMPLETE AND MAY BE AMENDED PRIOR TO THE TIME OF SALE. THIS TERM SHEET IS NOT AN OFFER TO SELL THESE SECURITIES AND IT IS NOT A SOLICITATION OF AN OFFER TO BUY THESE SECURITIES IN ANY JURISDICTION WHERE THE OFFER OR SALE IS NOT PERMITTED. |
| | 97 | |
| Structural and Collateral Term Sheet | | BMO 2024-5C8 |
| No. 7 – Woodland Mall |
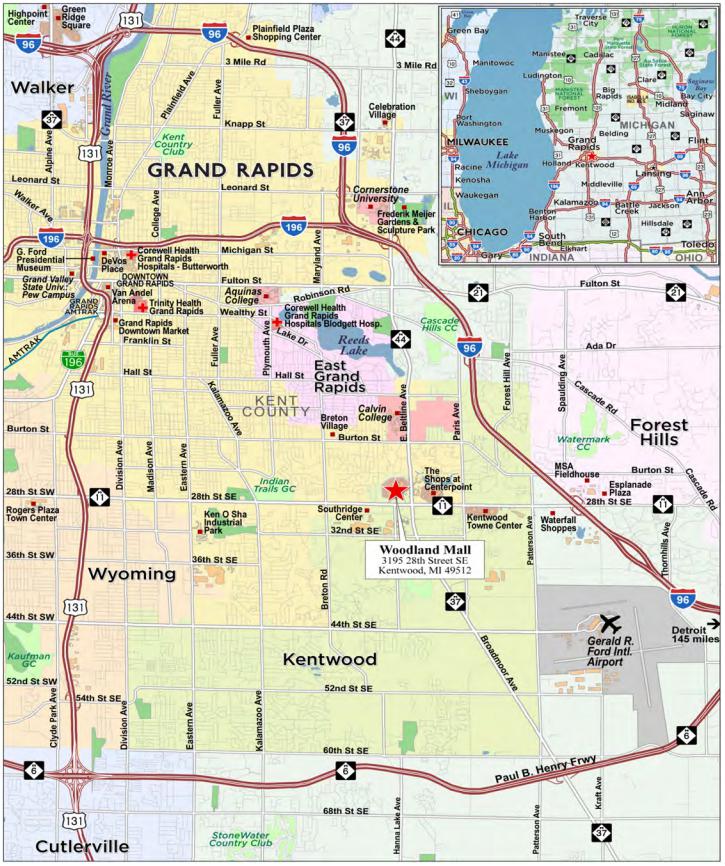
THE INFORMATION IN THIS STRUCTURAL AND COLLATERAL TERM SHEET IS NOT COMPLETE AND MAY BE AMENDED PRIOR TO THE TIME OF SALE. THIS TERM SHEET IS NOT AN OFFER TO SELL THESE SECURITIES AND IT IS NOT A SOLICITATION OF AN OFFER TO BUY THESE SECURITIES IN ANY JURISDICTION WHERE THE OFFER OR SALE IS NOT PERMITTED. |
| | 98 | |
| Structural and Collateral Term Sheet | | BMO 2024-5C8 |
| No. 7 – Woodland Mall |
| Mortgage Loan Information | | Property Information |
| Mortgage Loan Sellers: | SMC, BMO | | Single Asset / Portfolio: | Single Asset |
| Original Principal Balance(1): | $50,000,000 | | Title: | Fee |
| Cut-off Date Principal Balance(1): | $50,000,000 | | Property Type – Subtype: | Retail – Super Regional Mall |
| % of IPB: | 5.0% | | Net Rentable Area (SF)(4): | 563,041 |
| Loan Purpose: | Refinance | | Location: | Kentwood, MI |
| Borrowers: | PR Woodland Limited Partnership and PR Woodland Anchor-S, LLC | | Year Built / Renovated: | 1968 / 1998, 2019 |
| Borrower Sponsor: | PREIT Associates, L.P. | | Occupancy(4): | 95.5% |
| Interest Rate: | 7.35000% | | Occupancy Date(4): | 11/11/2024 |
| Note Date: | 11/19/2024 | | 4th Most Recent NOI (As of): | $11,650,954 (12/31/2021) |
| Maturity Date: | 12/6/2029 | | 3rd Most Recent NOI (As of): | $11,503,714 (12/31/2022) |
| Interest-only Period: | 60 months | | 2nd Most Recent NOI (As of): | $11,494,074 (12/31/2023) |
| Original Term: | 60 months | | Most Recent NOI (As of): | $11,892,540 (TTM 8/31/2024) |
| Original Amortization Term: | None | | UW Economic Occupancy: | 94.9% |
| Amortization Type: | Interest Only | | UW Revenues: | $22,431,491 |
| Call Protection(2): | L(24),D(31),O(5) | | UW Expenses: | $10,411,138 |
| Lockbox / Cash Management: | Hard / Springing | | UW NOI: | $12,020,353 |
| Additional Debt(1): | Yes | | UW NCF: | $11,524,346 |
| Additional Debt Balance(1): | $30,000,000 | | Appraised Value / Per SF: | $151,000,000 / $268 |
| Additional Debt Type(1): | Pari Passu | | Appraisal Date: | 9/17/2024 |
| | | | | |
| Escrows and Reserves(3) | | Financial Information(1) |
| | Initial | Monthly | Initial Cap | | Cut-off Date Loan / SF(4): | $142 |
| Taxes: | $1,197,863 | $399,288 | N/A | | Maturity Date Loan / SF(4): | $142 |
| Insurance: | $0 | Springing | N/A | | Cut-off Date LTV: | 53.0% |
| Replacement Reserves: | $0 | $13,001 | N/A | | Maturity Date LTV: | 53.0% |
| TI / LC Reserve: | $1,500,000 | Springing | $1,500,000 | | UW NCF DSCR: | 1.93x |
| La Vie En Rose Reserve: | $460,074 | $0 | N/A | | UW NOI Debt Yield: | 15.0% |
| | | | | | | |
| Sources and Uses |
| Sources | Proceeds | % of Total | | Uses | Proceeds | % of Total |
| Whole Loan(1) | $80,000,000 | 83.4 | % | | Loan Payoff | $90,784,742 | 94.6 | % |
| Sponsor Equity | 15,928,155 | 16.6 | | | Upfront Reserves | 3,157,937 | 3.3 | |
| | | | | Closing Costs(5) | 1,985,476 | 2.1 | |
| Total Sources | $95,928,155 | 100.0 | % | | Total Uses | $95,928,155 | 100.0 | % |
| (1) | The Woodland Mall Mortgage Loan (as defined below) is part of the Woodland Mall Whole Loan (as defined below), which is evidenced by six pari passu promissory notes with an aggregate principal balance of $80,000,000. The Financial Information presented above is based on the aggregate principal balance of the promissory notes comprising the Woodland Mall Whole Loan. |
| (2) | The lockout period will be at least 24 payments beginning with and including the first payment date of January 6, 2025. Defeasance of the Woodland Mall Whole Loan is permitted after the date that is the earlier to occur of (i) two years from the closing date of the securitization that includes the last note to be securitized and (ii) November 19, 2027. The assumed lockout of 24 payments is based on the expected BMO 2024-5C8 securitization closing date in December 2024. The actual lockout period may be longer. |
| (3) | See “Escrows and Reserves” below for further discussion of reserve information. |
| (4) | The Woodland Mall Property (as defined below) consists of 563,041 square feet of collateral and does not include Non-Collateral Square Footage (as defined below). |
| (5) | Closing Costs include an $800,000 interest rate buydown credit. |
The Loan. The seventh largest mortgage loan (the “Woodland Mall Mortgage Loan”) is part of a whole loan (the “Woodland Mall Whole Loan”) evidenced by six pari passu promissory notes in the aggregate original principal amount of $80,000,000. The Woodland Mall Mortgage Loan is evidenced by the controlling Note A-1 and non-controlling Note A-4, which have an aggregate outstanding principal balance as of the Cut-off Date of $50,000,000. The Woodland Mall Whole Loan was originated on November 19, 2024 by Starwood Mortgage Capital LLC (“SMC”). Bank of Montreal (“BMO”) subsequently purchased Notes A-4, A-5 and A-6. The Woodland Mall Whole Loan is secured by the borrower’s fee simple interest in a 563,041 square foot portion of a 1,031,952 square foot super regional mall located in the Grand Rapids suburb of Kentwood, Michigan (the “Woodland Mall Property”). The Woodland Mall Whole Loan Property does not include any portion of the mall that is occupied by JCPenney, Macy’s, Main Event and Verizon (which are each corporately-owned).
THE INFORMATION IN THIS STRUCTURAL AND COLLATERAL TERM SHEET IS NOT COMPLETE AND MAY BE AMENDED PRIOR TO THE TIME OF SALE. THIS TERM SHEET IS NOT AN OFFER TO SELL THESE SECURITIES AND IT IS NOT A SOLICITATION OF AN OFFER TO BUY THESE SECURITIES IN ANY JURISDICTION WHERE THE OFFER OR SALE IS NOT PERMITTED. |
| | 99 | |
| Structural and Collateral Term Sheet | | BMO 2024-5C8 |
| No. 7 – Woodland Mall |
The Woodland Mall Whole Loan has a five-year interest-only term accruing interest at a rate of 7.35000% per annum on an Actual/360 basis. The scheduled maturity date of the Woodland Mall Whole Loan is December 6, 2029.
The Woodland Mall Whole Loan will be serviced pursuant to the pooling and servicing agreement for the BMO 2024-5C8 trust securitization. The relationship between the holders of notes evidencing the Woodland Mall Whole Loan is governed by a co-lender agreement as described under “Description of the Mortgage Pool—The Whole Loans—The Serviced Pari Passu Whole Loans” and “The Pooling and Servicing Agreement” in the Preliminary Prospectus.
The table below identifies the promissory notes that comprise the Woodland Mall Whole Loan:
| Whole Loan Summary |
| Note | Original Balance | Cut-off Date Balance | Note Holder | Controlling Piece |
| A-1 | $30,000,000 | $30,000,000 | BMO 2024-5C8 | Yes |
| A-2(1) | $12,000,000 | $12,000,000 | Starwood Mortgage Funding VII, LLC | No |
| A-3(1) | $6,000,000 | $6,000,000 | Starwood Mortgage Funding VII, LLC | No |
| A-4 | $20,000,000 | $20,000,000 | BMO 2024-5C8 | No |
| A-5(1) | $8,000,000 | $8,000,000 | BMO | No |
| A-6(1) | $4,000,000 | $4,000,000 | BMO | No |
| Whole Loan | $80,000,000 | $80,000,000 | | |
| (1) | Expected to be contributed to one or more future securitization trusts. |
The Property. The Woodland Mall Property is part of a single-story, super-regional mall located in the Grand Rapids suburb of Kentwood, Michigan. The Woodland Mall Property consists of 563,041 of owned square feet within a super-regional mall of 1,031,952 square feet, which is anchored by an 86,165 square foot Von Maur (ground leased), a 254,905 square foot JCPenney (non-collateral), a 157,316 square foot Macy’s (non-collateral), a 48,690 square foot Main Event (non-collateral) and a 46,922 square foot Phoenix Theatres. Macy’s, JCPenney, Main Event and Verizon (the “Non-Collateral Tenants”) make up the 468,911 square feet not owned by the borrower sponsor (the “Non-Collateral Square Footage”). The Woodland Mall Property is 95.5% leased as of November 11, 2024. The Woodland Mall Property has 5,000 surface parking spaces, resulting in a parking ratio of approximately 4.85 spaces per 1,000 square feet of space including Non-Collateral Tenants.
The Woodland Mall Property is positioned to capture shoppers from households in the communities of Ada, Cascade and East Grand Rapids. The “Medical Mile” in Grand Rapids (approximately 10 minutes away from the Woodland Mall Property) contains more than ten healthcare facilities including two hospitals, five research facilities and one medical school. In addition to key anchor tenants, the Woodland Mall Property features Apple, Pottery Barn, Altar’d State, Williams-Sonoma, Urban Outfitters and Dry Goods. Additional non-collateral parcels feature REI Co-op and Kohl’s. Comparable in-line tenant sales at the Woodland Mall Property were $684 per square foot for the trailing 12 months ending August 2024 equating to an occupancy cost of approximately 8.8%. Comparable in-line sales excluding Apple over the same period were approximately $462 per square foot equating to an occupancy cost of approximately 13.0%.
The borrower sponsor originally purchased the Woodland Mall Property in 2005 for approximately $177.4 million. The borrower sponsor’s total reported cost basis is approximately $305.0 million including the original purchase price, capital expenditures, and various parcel purchases and sales. Since 2016, the borrower sponsor has invested approximately $114.3 million into the Woodland Mall Property including the purchase of a box formerly occupied by Sears in 2016 for approximately $22.7 million. After purchasing the former Sears store in 2016, the borrower sponsor demolished the approximately 313,000 square foot space and commenced a major renovation, investing approximately $91.6 million in capital expenditures into the Woodland Mall Property to add a new wing that is currently anchored by Von Maur and occupied by tenants such as Sephora, Urban Outfitters and Williams-Sonoma. This renovation also added Cheesecake Factory, Red Robin and On The Border Mexican Grill to the open air dining section of the Woodland Mall Property, included a newly renovated theater space for Phoenix Theatres, which executed a 15-year lease in June 2022, and facilitated the replacement of Sears with new anchor tenant Von Maur. Apple, which has been a tenant at the Woodland Mall Property since 2005, also opened a new larger store nearly doubling its footprint as part of the renovation completed by the borrower sponsor. Apple now occupies 7,277 square feet and reported sales of approximately $51.7 million ($7,108 per square foot) for the trailing 12 months ending August 2024.
THE INFORMATION IN THIS STRUCTURAL AND COLLATERAL TERM SHEET IS NOT COMPLETE AND MAY BE AMENDED PRIOR TO THE TIME OF SALE. THIS TERM SHEET IS NOT AN OFFER TO SELL THESE SECURITIES AND IT IS NOT A SOLICITATION OF AN OFFER TO BUY THESE SECURITIES IN ANY JURISDICTION WHERE THE OFFER OR SALE IS NOT PERMITTED. |
| | 100 | |
| Structural and Collateral Term Sheet | | BMO 2024-5C8 |
| No. 7 – Woodland Mall |
Major Tenants. The three largest tenants based on underwritten base rent are Phoenix Theatres, Victoria’s Secret and Apple.
Phoenix Theatres (46,922 square feet, 8.3% of net rentable area (“NRA”), 4.8% of underwritten base rent): Phoenix Theatres is a Michigan-based movie theater chain founded in 2000. Phoenix Theatres has four theaters in Michigan and another four theaters located in Iowa, Massachusetts and Ohio. According to the tenant, Phoenix Theatres spent approximately $4.0 million in building out its 14-screen space. Phoenix Theatres occupies 46,922 square feet on a lease that expires June 30, 2037 with three five-year lease renewal options and no termination options.
Victoria’s Secret (11,506 square feet, 2.0% of NRA, 4.0% of underwritten base rent): Victoria’s Secret (NYSE: VSCO) is an American lingerie, clothing, and beauty retailer. The company was founded in 1977 and is headquartered in Reynoldsburg, Ohio. Victoria’s Secret operates approximately 1,350 stores in 70 countries and employs approximately 30,000 people. Victoria’s Secret occupies an 11,506 square feet space under a lease that commenced on September 21, 2018 and expires January 31, 2029 with no renewal or termination options.
Apple (7,277 square feet, 1.3% of NRA, 3.9% of underwritten base rent) Apple is an American multinational technology company headquartered in Cupertino, California. Apple operates over 500 stores across the world and has over 160,000 employees. Apple has been a tenant at the Woodland Mall Property since March 2017. Apple occupies 7,277 square feet on a lease expiring on March 31, 2027 with no renewal or termination options.
Appraisal. According to the appraisal, the Woodland Mall Property had an “as-is” appraised value of $151,000,000 as of September 17, 2024. The table below shows the appraisal’s “as-is” conclusions.
| Appraisal Valuation Summary(1) |
| Appraisal Approach | Appraised Value | Capitalization Rate |
| Income Capitalization Approach | $151,000,000 | 7.75% |
Environmental. The Phase I environmental assessment of the Woodland Mall Property dated November 8, 2024 (the “ESA”) identified no recognized environmental conditions. The ESA identified a CREC related to prior operations of a gas station on the site of the Woodland Mall Property. See “Descriptions of the Mortgage Pool – Environmental Considerations" in the Preliminary Prospectus.
The following table presents certain information relating to the historical occupancy of the Woodland Mall Property:
| Historical and Current Occupancy(1) |
| 2021 | 2022 | 2023 | Current(2) |
| 93.4% | 98.7% | 98.5% | 95.5% |
| (1) | Historical Occupancies are as of December 31 of each respective year, unless otherwise specified. |
| (2) | Based on the underwritten rent roll dated November 11, 2024. |
The following table presents certain information relating to comparable in-line sales of the Woodland Mall Property:
| Comparable In-Line Sales |
| | 2020 | 2021 | 2022 | 2023 | August 2024 TTM |
| In-Line Sales Under 10,000 SF (PSF) | $410 | $632 | $646 | $613 | $684 |
| Occupancy Cost | NAV | 9.4% | 9.7% | 9.5% | 8.8% |
| In-Line Sales Under 10,000 SF (PSF) (excluding Apple) | $301 | $463 | $454 | $421 | $462 |
| Occupancy Cost (excluding Apple) | NAV | 12.3% | 13.2% | 13.1% | 13.0% |
| |
THE INFORMATION IN THIS STRUCTURAL AND COLLATERAL TERM SHEET IS NOT COMPLETE AND MAY BE AMENDED PRIOR TO THE TIME OF SALE. THIS TERM SHEET IS NOT AN OFFER TO SELL THESE SECURITIES AND IT IS NOT A SOLICITATION OF AN OFFER TO BUY THESE SECURITIES IN ANY JURISDICTION WHERE THE OFFER OR SALE IS NOT PERMITTED. |
| | 101 | |
| Structural and Collateral Term Sheet | | BMO 2024-5C8 |
| No. 7 – Woodland Mall |
The following table presents certain information relating to the top 10 tenants by underwritten base rent (of which, certain tenants have co-tenancy provisions) at the Woodland Mall Property:
| Top Tenant Summary(1) |
| Tenant | Ratings
Moody’s/S&P/Fitch(2) | Total Mall NRA (SF) | % of
Total Collateral NRA(3) | UW Base Rent PSF | UW Base Rent | % of Total
UW Base Rent | TTM August 2024 Sales $(4) | Sales PSF(4) | Occ Cost(4) | Lease
Expiration Date |
| Non-Collateral Anchor Tenants | | | | | | | | | |
| JCPenney | NR/NR/NR | 254,905 | NAP | | $0.00 | $0 | 0.0% | NAV | | NAV | | NAV | | NAV | |
| Macy’s | Ba2/BB+/NR | 157,316 | NAP | | 0.00 | 0 | 0.0 | NAV | | NAV | | NAV | | NAV | |
| Main Event | NR/NR/NR | 48,690 | NAP | | 0.00 | 0 | 0.0 | NAV | | NAV | | NAV | | NAV | |
| Verizon | NR/NR/NR | 8,000 | NAP | | 0.00 | 0 | 0.0 | NAV | | NAV | | NAV | | NAV | |
Non-Collateral Anchor Tenants Subtotal /
Wtd. Avg. | 468,911 | NAP | | $0.00 | $0 | 0.0% | | | | |
| Collateral Anchor Tenants | | | | | | | | | | |
| Von Maur(5) | NR/NR/NR | 86,165 | 15.3 | % | $2.32 | $200,000 | 1.6% | $13,242,314 | | $153.69 | | 1.9% | | 1/31/2119 | |
| Top 10 Tenants | | | | | | | | | | |
| Phoenix Theatres(6) | NR/NR/NR | 46,922 | 8.3 | % | $12.50 | $586,525 | 4.8% | $4,700,511 | | $100.18 | | 12.5% | | 6/30/2037 | |
| Victoria’s Secret | B1/BB-/NR | 11,506 | 2.0 | | $42.00 | 483,252 | 4.0 | $3,936,771 | | $342.15 | | 21.1% | | 1/31/2029 | |
| Apple | Aaa/AA+/NR | 7,277 | 1.3 | | $64.76 | 471,233 | 3.9 | $51,727,511 | | $7,108.36 | | 0.9% | | 3/31/2027 | |
| American Eagle Outfitters | NR/NR/NR | 9,490 | 1.7 | | $49.23 | 467,193 | 3.8 | $5,910,801 | | $622.85 | | 14.7% | | 12/31/2026 | |
| The Cheesecake Factory(7) | NR/NR/NR | 8,387 | 1.5 | | $48.00 | 402,576 | 3.3 | $9,451,178 | | $1,126.88 | | 6.2% | | 1/31/2040 | |
| Barnes & Noble | NR/NR/NR | 37,393 | 6.6 | | $10.70 | 400,000 | 3.3 | NAV | | NAV | | NAV | | 1/31/2030 | |
| Pottery Barn | NR/NR/NR | 10,226 | 1.8 | | $39.02 | 399,018 | 3.3 | $4,607,923 | | $450.61 | | 8.7% | | 1/31/2026 | |
| Kay Jewelers | NR/NR/NR | 1,660 | 0.3 | | $164.38 | 272,871 | 2.2 | $1,433,722 | | $863.69 | | 23.8% | | 12/31/2028 | |
| Altar’d State | NR/NR/NR | 9,197 | 1.6 | | $29.63 | 272,523 | 2.2 | $3,214,938 | | $349.56 | | 9.4% | | 6/30/2029 | |
| Urban Outfitters | NR/NR/NR | 8,000 | 1.4 | | $31.95 | 255,600 | 2.1 | NAV | | NAV | | NAV | | 1/31/2030 | |
| Top 10 Tenants Subtotal / Wtd. Avg. | 150,058 | 26.7 | % | $26.73 | $4,010,791 | 32.8% | | | | |
| Remaining Occupied | | 301,402 | 53.5 | % | $27.20 | $8,199,302 | 67.2% | | | | |
| Occupied Collateral Total | 537,625 | 95.5 | % | $22.71 | $12,210,093 | 100.0% | | | | |
| Vacant | | 25,416 | 4.5 | % | | | | | | | |
| Collateral Total / Wtd. Avg. | 563,041 | 100.0 | % | | | | | | | |
| | | | | | | | | | | |
| | | | | | | | | | | |
| Collateral + Non Collateral Total | 1,031,952 | | | | | | | | |
| | | | | | | | | | | |
| (1) | Based on the underwritten rent roll dated November 11, 2024 inclusive of rent steps totaling $118,067 through July 2025 and average rent through the Woodland Mall Whole Loan term for two investment-grade tenants totaling $20,997. |
| (2) | In certain instances, ratings provided are those of the parent company of the entity shown, whether or not the parent company guarantees the lease. |
| (3) | % of Total Collateral NRA refers only to the Woodland Mall Property and does not include the portion occupied by the Non-Collateral Tenants. |
| (4) | All information regarding sales and occupancy costs presented in this term sheet with respect to the Woodland Mall Property is based upon information provided by the borrower sponsor. In certain instances, sales figures represent estimates because the tenants are not required to report, or otherwise may not have reported, sales information on a timely basis. Further, because sales are self-reported, such information is not independently verified by the borrower sponsor. Sales are as of the 12 months ended August 2024. |
| (5) | Von Maur operates under a ground lease. |
| (6) | Phoenix Theatres has three five-year lease renewal options. |
| (7) | The Cheesecake Factory has two five-year lease renewal options. |
THE INFORMATION IN THIS STRUCTURAL AND COLLATERAL TERM SHEET IS NOT COMPLETE AND MAY BE AMENDED PRIOR TO THE TIME OF SALE. THIS TERM SHEET IS NOT AN OFFER TO SELL THESE SECURITIES AND IT IS NOT A SOLICITATION OF AN OFFER TO BUY THESE SECURITIES IN ANY JURISDICTION WHERE THE OFFER OR SALE IS NOT PERMITTED. |
| | 102 | |
| Structural and Collateral Term Sheet | | BMO 2024-5C8 |
| No. 7 – Woodland Mall |
The following table presents certain information relating to the lease rollover schedule at the Woodland Mall Property:
| Lease Rollover Schedule(1)(2) |
| Year | Number of Leases Expiring | Net Rentable Area Expiring | % of NRA Expiring | UW Base Rent Expiring | % of UW Base Rent Expiring | Cumulative Net Rentable Area Expiring | Cumulative % of NRA Expiring | Cumulative UW Base Rent Expiring | Cumulative % of UW Base Rent Expiring |
| Vacant | NAP | 25,416 | 4.5 | % | NAP | NA | P | 25,416 | 4.5% | NAP | NAP |
| 2024 & MTM | 6 | 14,232 | 2.5 | % | $278,775 | 2.3 | % | 39,648 | 7.0% | $278,775 | 2.3% |
| 2025 | 22 | 42,393 | 7.5 | | 925,120 | 7.6 | | 82,041 | 14.6% | $1,203,896 | 9.9% |
| 2026 | 19 | 85,398 | 15.2 | | 2,174,188 | 17.8 | | 167,439 | 29.7% | $3,378,084 | 27.7% |
| 2027 | 21 | 51,412 | 9.1 | | 1,995,383 | 16.3 | | 218,851 | 38.9% | $5,373,466 | 44.0% |
| 2028 | 10 | 35,387 | 6.3 | | 1,200,161 | 9.8 | | 254,238 | 45.2% | $6,573,627 | 53.8% |
| 2029 | 11 | 46,170 | 8.2 | | 1,636,947 | 13.4 | | 300,408 | 53.4% | $8,210,574 | 67.2% |
| 2030 | 12 | 67,560 | 12.0 | | 1,656,918 | 13.6 | | 367,968 | 65.4% | $9,867,492 | 80.8% |
| 2031 | 6 | 18,128 | 3.2 | | 530,683 | 4.3 | | 386,096 | 68.6% | $10,398,175 | 85.2% |
| 2032 | 0 | 0 | 0.0 | | 0 | 0.0 | | 386,096 | 68.6% | $10,398,175 | 85.2% |
| 2033 | 3 | 24,008 | 4.3 | | 135,000 | 1.1 | | 410,104 | 72.8% | $10,533,175 | 86.3% |
| 2034 | 3 | 9,880 | 1.8 | | 385,217 | 3.2 | | 419,984 | 74.6% | $10,918,392 | 89.4% |
| 2035 & Beyond | 5 | 143,057 | 25.4 | | 1,291,701 | 10.6 | | 563,041 | 100.0% | $12,210,093 | 100.0% |
| Total | 118 | 563,041 | 100.0 | % | $12,210,093 | 100.0 | % | | | | |
| (1) | Information is based on the underwritten rent roll dated November 11, 2024 inclusive of rent steps totaling $118,067 through July 2025 and average rent through the Woodland Mall Whole Loan term for two investment-grade tenants totaling $20,997. |
| (2) | Certain tenants may have lease termination options that are exercisable prior to the stated expiration date of the subject lease or leases which are not considered in the Lease Rollover Schedule. |
The following table presents certain information relating to the operating history and underwritten net cash flow of the Woodland Mall Property:
| Operating History and Underwritten Net Cash Flow |
| | 2021 | 2022 | 2023 | TTM August 2024 | Underwritten | Per Square Foot | %(1) |
| Base Rent(2) | $9,987,657 | $10,605,401 | $11,263,905 | $12,021,681 | $12,071,029 | | $21.44 | | 53.9 | % |
| Rent Steps(3) | 0 | 0 | 0 | 0 | 139,064 | | 0.25 | | 0.6 | |
| Vacant Income | 0 | 0 | 0 | 0 | 936,738 | | 1.66 | | 4.2 | |
| Utility Reimbursements | 1,461,870 | 1,428,460 | 1,366,988 | 1,468,819 | 1,468,819 | | 2.61 | | 6.6 | |
| Expense Recoveries | 5,019,202 | 4,822,809 | 4,736,665 | 4,832,824 | 4,790,089 | | 8.51 | | 21.4 | |
| Gross Potential Income | $16,468,729 | $16,856,670 | $17,367,558 | $18,323,325 | $19,405,739 | | $34.47 | | 86.7 | % |
| Percent in Lieu(4) | 2,083,442 | 2,201,573 | 1,745,089 | 1,198,494 | 1,360,906 | | 2.42 | | 6.1 | |
| Overage Rent | 519,762 | 374,588 | 512,303 | 749,044 | 723,877 | | 1.29 | | 3.2 | |
| Specialty Leasing | 1,001,405 | 1,035,641 | 1,018,101 | 898,218 | 898,218 | | 1.60 | | 4.0 | |
| Gross Potential Rent | $20,073,337 | $20,468,472 | $20,643,050 | $21,169,080 | $22,388,740 | | $39.76 | | 100.0 | % |
| Other Income | 948,062 | 763,681 | 956,578 | 1,040,540 | 1,040,540 | | 1.85 | | 4.6 | |
| (Vacancy/Credit Loss) | 0 | 0 | 0 | 0 | (997,788) | | (1.77) | | (4.5 | ) |
| Effective Gross Income | $21,021,399 | $21,232,152 | $21,599,628 | $22,209,620 | $22,431,491 | | $39.84 | | 100.2 | % |
| Real Estate Taxes | 4,240,550 | 4,330,094 | 4,521,570 | 4,602,251 | 4,641,356 | | 8.24 | | 20.7 | |
| Insurance | 321,466 | 353,763 | 398,949 | 411,622 | 351,424 | | 0.62 | | 1.6 | |
| Other Expenses | 4,808,429 | 5,044,582 | 5,185,035 | 5,303,207 | 5,418,358 | | 9.62 | | 24.2 | |
| Total Expenses | $9,370,445 | $9,728,439 | $10,105,554 | $10,317,080 | $10,411,138 | | $18.49 | | 46.4 | % |
| Net Operating Income | $11,650,954 | $11,503,714 | $11,494,074 | $11,892,540 | $12,020,353 | | $21.35 | | 53.6 | % |
| Total TI/LC, Capex/RR | 0 | 0 | 0 | 0 | 496,007 | | 0.88 | | 2.2 | |
| Net Cash Flow | $11,650,954 | $11,503,714 | $11,494,074 | $11,892,540 | $11,524,346 | | $20.47 | | 51.4 | % |
| (1) | % column represents percent of Gross Potential Rent for all revenue lines and represents percent of Effective Gross Income for the remainder of fields. |
| (2) | Underwritten Base Rent based on the underwritten rent roll dated November 11, 2024. |
| (3) | Includes rent steps totaling $118,067 through July 2025 and average rent through the Woodland Mall Whole Loan term for two investment-grade tenants totaling $20,997. |
| (4) | Nine tenants totaling 68,235 square feet pay Percent in Lieu.
|
THE INFORMATION IN THIS STRUCTURAL AND COLLATERAL TERM SHEET IS NOT COMPLETE AND MAY BE AMENDED PRIOR TO THE TIME OF SALE. THIS TERM SHEET IS NOT AN OFFER TO SELL THESE SECURITIES AND IT IS NOT A SOLICITATION OF AN OFFER TO BUY THESE SECURITIES IN ANY JURISDICTION WHERE THE OFFER OR SALE IS NOT PERMITTED. |
| | 103 | |
| Structural and Collateral Term Sheet | | BMO 2024-5C8 |
| No. 7 – Woodland Mall |
The Market. The Woodland Mall Property is located in Kent County, Michigan, approximately 5.4 miles southeast of the city of Grand Rapids. According to the appraisal, the Woodland Mall Property is located along the region’s primary retail corridor, which is situated along 28th Street, and Beltline Avenue is considered to be the “main and main” of the region. Development along this corridor is dense, with minimal sites available for development, and very few large box vacancies located within this corridor. The Woodland Mall Property, and its neighbor, the Shops at Centerpoint power center, are the anchors to the neighborhood, and offer over 1.7 million square feet of retail in aggregate, excluding the ancillary outparcel retail and restaurants. Other uses in the neighborhood include offices and educational campuses, as well as several dense single and multi-family residential developments to the north. The largest employers in the Grand Rapids area are Spectrum Health Butterworth Hospital, Meijer, Inc. and Seaway Food Town, Inc. The Woodland Mall Property is located approximately 2.1 miles from the Gerald R. Ford International Airport, which is currently undergoing a $135 million expansion project that is expected to add 175,000 square feet to the terminal.
Within a 10-, 15- and 25-mile radius of the Woodland Mall Property, the 2023 average household income was approximately $96,489, $99,970 and $98,886, respectively; and within the same radii, the 2023 estimated population was 512,528, 681,379, and 929,379, respectively.
According to the appraisal, the Woodland Mall Property is situated in the Grand Rapids retail market. As of the second quarter of 2024, the market reported total inventory of approximately 67.0 million square feet with a 3.0% vacancy rate and average rents of $13.28 per square foot.
The following table presents certain information relating to the appraisal’s market rent conclusions for the Woodland Mall Property:
| Market Rent Summary(1) |
| | Market Rent (PSF) | Lease Term (Yrs.) | Rent Increase Projections | New Tenant Improvements |
| 0-1,000 SF Space | $130.00 | 7 | 2.5% annually | $25.00 |
| 1,001-2,500 SF Space | $44.00 | 7 | 2.5% annually | $25.00 |
| 2,501-5,000 SF Space | $30.00 | 7 | 2.5% annually | $25.00 |
| Over 5,001 SF Space | $28.00 | 7 | 2.5% annually | $25.00 |
| Jewelry Space | $145.00 | 7 | 2.5% annually | $25.00 |
| Food Court Space | $115.00 | 7 | 2.5% annually | $25.00 |
| Majors Space | $24.00 | 10 | 10.0% Mid-Term | $15.00 |
| Theater Space | $18.00 | 10 | 10.0% Mid-Term | $15.00 |
| Outparcel Restaurant Space | $25.00 | 10 | 2.5% annually | $25.00 |
| Anchor Space | $8.00 | 10 | 10.0% Mid-Term | $10.00 |
The Borrowers. The borrowers are PR Woodland Limited Partnership and PR Woodland Anchor-S, LLC, each a single purpose entity with two independent directors. Legal counsel to the borrower delivered a non-consolidation opinion in connection with the origination of the Woodland Mall Whole Loan.
The Borrower Sponsor. The borrower sponsor and non-recourse carveout guarantor is PREIT Associates, L.P., a Delaware limited partnership headquartered in Philadelphia, Pennsylvania and a provider of real estate investment services. PREIT Associates, L.P. is a privately-held real estate investment company that acquires, leases, manages, develops and re-develops malls and retail centers.
Property Management. The Woodland Mall Property is managed by PREIT Services, LLC, an affiliate of the borrower sponsor.
Escrows and Reserves. At origination, the borrowers were required to deposit into escrow (i) $1,197,863 for real estate taxes, (ii) $1,500,000 for general tenant improvements and leasing commissions and (iii) $460,074 for free rent and outstanding tenant improvements due to the tenant La Vie En Rose.
Tax Escrows – On a monthly basis, the borrowers are required to escrow 1/12th of the annual estimated tax payments, which currently equates to $399,288.
THE INFORMATION IN THIS STRUCTURAL AND COLLATERAL TERM SHEET IS NOT COMPLETE AND MAY BE AMENDED PRIOR TO THE TIME OF SALE. THIS TERM SHEET IS NOT AN OFFER TO SELL THESE SECURITIES AND IT IS NOT A SOLICITATION OF AN OFFER TO BUY THESE SECURITIES IN ANY JURISDICTION WHERE THE OFFER OR SALE IS NOT PERMITTED. |
| | 104 | |
| Structural and Collateral Term Sheet | | BMO 2024-5C8 |
| No. 7 – Woodland Mall |
Insurance Escrows – On a monthly basis, the borrowers are required to escrow 1/12th of the annual estimated insurance payments; however, the lender will not require the borrower to make monthly deposits for insurance premiums, provided that, among other conditions, no event of default has occurred and the Woodland Mall Property is insured under a blanket policy. The Woodland Mall Property is currently insured under a blanket policy.
Replacement Reserves – On a monthly basis, the borrowers are required to escrow $13,001 for replacement reserves.
Rollover Reserve – On a monthly basis, the borrowers are required to escrow $28,334 for general tenant improvements and leasing commissions subject to a cap of $1,500,000 (the “TI/LC Cap”). Notwithstanding the foregoing, in the event the debt service coverage ratio (“DSCR”) is less than 1.60x based on the trailing 12 months, the monthly deposits into the TI/LC reserve will be increased to approximately $46,667 per month and the TI/LC Cap will be increased to $2,500,000. If an event of default under the Woodland Mall Whole Loan documents then exists, the TI/LC Cap will not apply and ongoing monthly deposits into the TI/LC reserve will be required.
Lockbox / Cash Management. The Woodland Mall Whole Loan is structured with a hard lockbox and springing cash management. The Woodland Mall Whole Loan requires that the borrower deliver tenant direction letters to the tenants directing such tenants to pay all rents into the lockbox account. Upon the occurrence and during the continuance of a Sweep Event Period, all funds in the lockbox account are required to be swept daily to a cash management account under the control of the lender to be applied and disbursed in accordance with the Woodland Mall Whole Loan documents and all excess cash flow funds remaining in the cash management account after the application of such funds in accordance with the Woodland Mall Whole Loan documents are required to be held by the lender in an excess cash flow reserve account as additional collateral for the Woodland Mall Whole Loan . To the extent that no Sweep Event Period is continuing, all excess cash flow funds are required to be disbursed to the borrower.
A “Sweep Event Period” will commence upon the earliest of the following: (i) the occurrence of an event of default under the Woodland Mall Whole Loan documents; (ii) commencing on or after May 19, 2025, the date on which the DSCR is less than 1.40x based on the trailing 12 months (a “DSCR Trigger Event”); or (iii) physical occupancy at the Woodland Mall Property falls below 80% for two consecutive calendar quarters.
A Woodland Mall Sweep Event Period will end with regard to: (a) clause (i), upon the cure of such event of default and the lender’s acceptance of such cure in its sole and absolute discretion; (b) clause (ii), upon the DSCR based on the trailing 12-month period being at least 1.45x for one calendar quarter; or (c) clause (iii), physical occupancy of the Woodland Mall Property is at least 85% for two consecutive calendar quarters.
Notwithstanding the foregoing, solely in the event of Sweep Event Period triggered solely as the result of a DSCR Trigger Event, and so long as no Event of Default or other Sweep Event Period is then continuing, the borrower will have the option of posting with the lender either (i) cash or (ii) an acceptable letter of credit, in an amount equal to the Trigger Event Deposit (as defined below), within ten business days of the occurrence of such DSCR Trigger Event (the “Trigger Suspension Deposit”). Upon the borrower’s depositing with the lender adequate funds to fulfill the Trigger Suspension Deposit, the Sweep Event Period triggered solely as a result of the DSCR Trigger Event will be suspended for a period of 12 months (the “Trigger Suspension Period”). Following the borrower’s timely posting of the Trigger Suspension Deposit, and so long as no event of default under the Woodland Mall Whole Loan or other Sweep Event Period is then continuing, the borrower will have the option of extending the existing Trigger Suspension Period for an additional 12 month period so long as within ten business days of the termination of the existing Trigger Suspension Period, the borrower posts with the lender either (i) cash or (ii) an acceptable letter of credit, in an amount equal to the Trigger Event Deposit.
A “Trigger Event Deposit” means the amount which, when added to the annual debt service due under the Woodland Mall Whole Loan for the trailing 12 calendar months, results in the DCSR at the Woodland Mall Property (based on the trailing 12 calendar months, as calculated by the lender) being at least 1.40x.
Subordinate and Mezzanine Debt. None.
Permitted Future Subordinate or Mezzanine Debt. Not permitted.
Partial Release. The borrower is permitted to release certain parcels identified in the Woodland Mall Whole Loan documents from the collateral for the Woodland Mall Whole Loan (each, a “Release Parcel”). The releases are required to
THE INFORMATION IN THIS STRUCTURAL AND COLLATERAL TERM SHEET IS NOT COMPLETE AND MAY BE AMENDED PRIOR TO THE TIME OF SALE. THIS TERM SHEET IS NOT AN OFFER TO SELL THESE SECURITIES AND IT IS NOT A SOLICITATION OF AN OFFER TO BUY THESE SECURITIES IN ANY JURISDICTION WHERE THE OFFER OR SALE IS NOT PERMITTED. |
| | 105 | |
| Structural and Collateral Term Sheet | | BMO 2024-5C8 |
| No. 7 – Woodland Mall |
be subject to the satisfaction of the lender’s customary release conditions, including, among other things: (i) no default or event of default is ongoing; (ii) the Release Parcel is sold to an unaffiliated third party; and (iii) the borrower is required to partially defease the Woodland Mall Whole Loan in the amount equal to the greatest of (a) 90% of the purchase price for the Release Parcel, (b) the amount that results in the DSCR and debt yield of the remainder of the Woodland Mall Property being no less than 1.90x and 14.4%, respectively, and (c) the amount that results in the unpaid principal balance of the Woodland Mall Whole Loan to the value of the remainder of the Woodland Mall Property being less than 125%, as determined by the lender in its sole discretion.
Ground Lease. None.
THE INFORMATION IN THIS STRUCTURAL AND COLLATERAL TERM SHEET IS NOT COMPLETE AND MAY BE AMENDED PRIOR TO THE TIME OF SALE. THIS TERM SHEET IS NOT AN OFFER TO SELL THESE SECURITIES AND IT IS NOT A SOLICITATION OF AN OFFER TO BUY THESE SECURITIES IN ANY JURISDICTION WHERE THE OFFER OR SALE IS NOT PERMITTED. |
| | 106 | |
| Structural and Collateral Term Sheet | | BMO 2024-5C8 |
| No. 8 – The Outlet Collection Seattle |
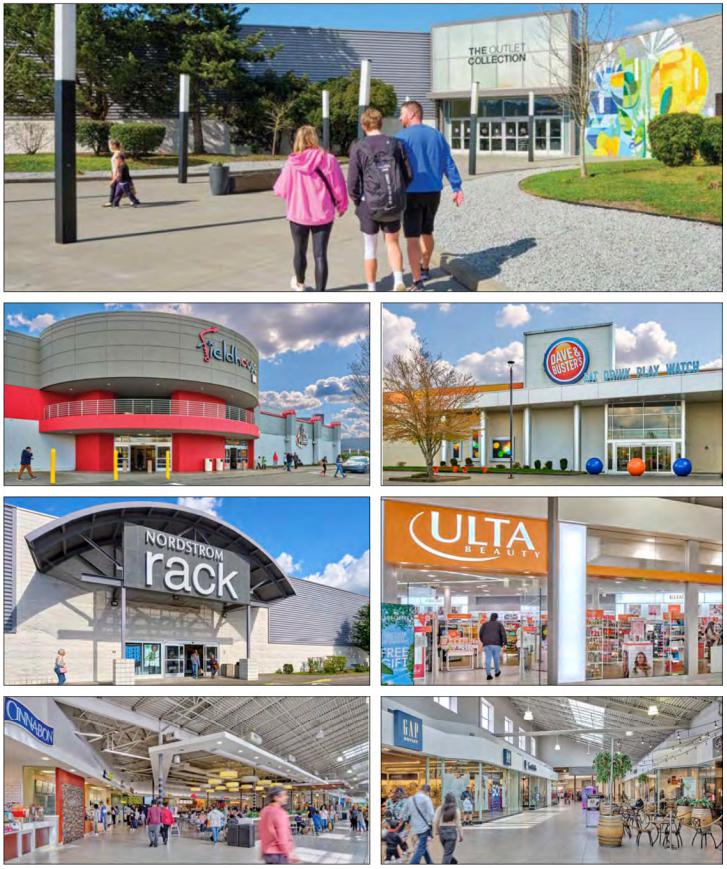
THE INFORMATION IN THIS STRUCTURAL AND COLLATERAL TERM SHEET IS NOT COMPLETE AND MAY BE AMENDED PRIOR TO THE TIME OF SALE. THIS TERM SHEET IS NOT AN OFFER TO SELL THESE SECURITIES AND IT IS NOT A SOLICITATION OF AN OFFER TO BUY THESE SECURITIES IN ANY JURISDICTION WHERE THE OFFER OR SALE IS NOT PERMITTED. |
| | 107 | |
| Structural and Collateral Term Sheet | | BMO 2024-5C8 |
| No. 8 – The Outlet Collection Seattle |
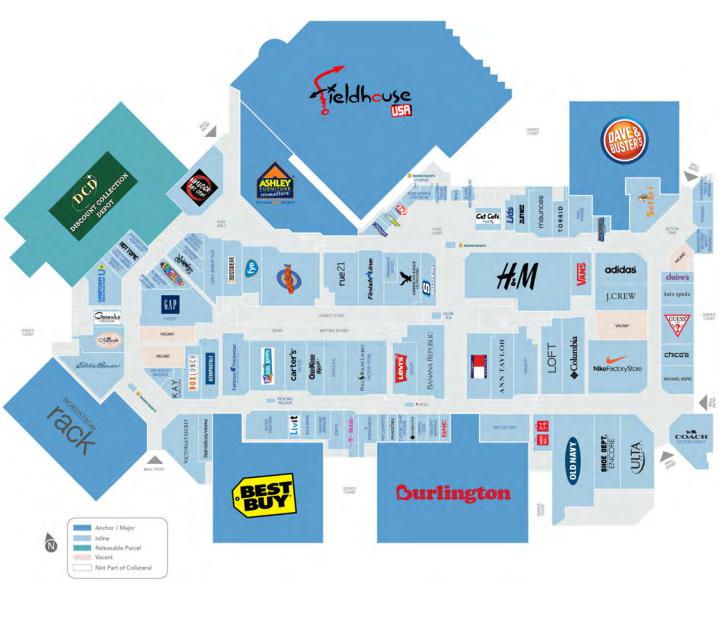
THE INFORMATION IN THIS STRUCTURAL AND COLLATERAL TERM SHEET IS NOT COMPLETE AND MAY BE AMENDED PRIOR TO THE TIME OF SALE. THIS TERM SHEET IS NOT AN OFFER TO SELL THESE SECURITIES AND IT IS NOT A SOLICITATION OF AN OFFER TO BUY THESE SECURITIES IN ANY JURISDICTION WHERE THE OFFER OR SALE IS NOT PERMITTED. |
| | 108 | |
| Structural and Collateral Term Sheet | | BMO 2024-5C8 |
| No. 8 – The Outlet Collection Seattle |
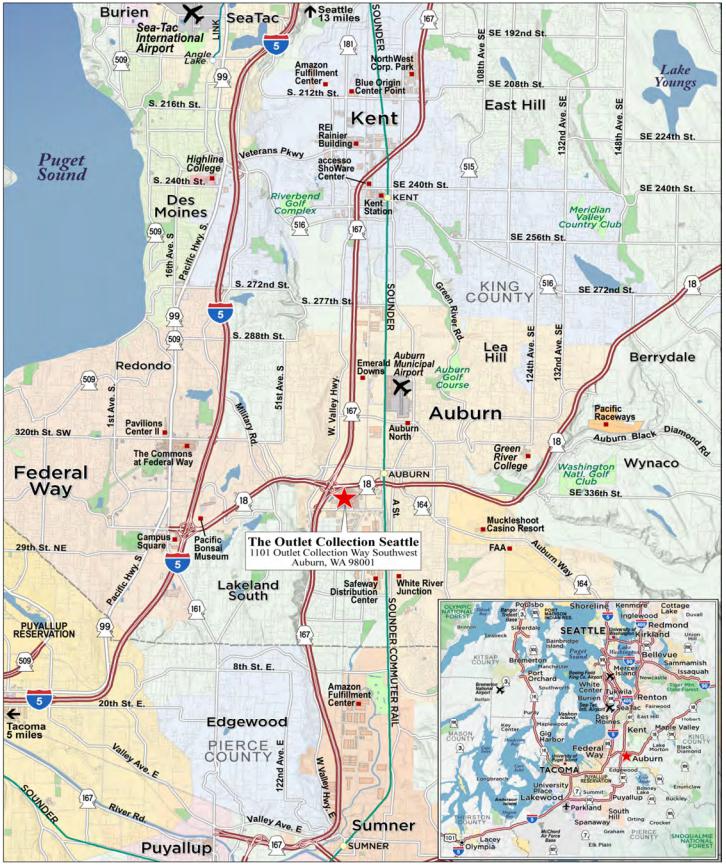
THE INFORMATION IN THIS STRUCTURAL AND COLLATERAL TERM SHEET IS NOT COMPLETE AND MAY BE AMENDED PRIOR TO THE TIME OF SALE. THIS TERM SHEET IS NOT AN OFFER TO SELL THESE SECURITIES AND IT IS NOT A SOLICITATION OF AN OFFER TO BUY THESE SECURITIES IN ANY JURISDICTION WHERE THE OFFER OR SALE IS NOT PERMITTED. |
| | 109 | |
| Structural and Collateral Term Sheet | | BMO 2024-5C8 |
| No. 8 – The Outlet Collection Seattle |
| Mortgage Loan Information | | Property Information |
| Mortgage Loan Seller: | CREFI | | Single Asset / Portfolio: | Single Asset |
| Original Principal Balance(1): | $35,970,000 | | Title: | Fee |
| Cut-off Date Principal Balance(1): | $35,970,000 | | Property Type – Subtype: | Retail – Outlet Center |
| % of IPB: | 3.6% | | Net Rentable Area (SF): | 913,033 |
| Loan Purpose: | Acquisition | | Location: | Auburn, WA |
| Borrower: | Seattle Outlet Associates LLC | | Year Built / Renovated: | 1995 / 2012 |
| Borrower Sponsor: | LSG Enterprises LLC | | Occupancy: | 98.2% |
| Interest Rate: | 7.33000% | | Occupancy Date: | 9/17/2024 |
| Note Date: | 11/18/2024 | | 4th Most Recent NOI (As of): | $9,103,188 (12/31/2021) |
| Maturity Date: | 12/6/2029 | | 3rd Most Recent NOI (As of): | $10,397,804 (12/31/2022) |
| Interest-only Period: | 60 months | | 2nd Most Recent NOI (As of): | $10,490,124 (12/31/2023) |
| Original Term: | 60 months | | Most Recent NOI (As of): | $11,435,572 (TTM 9/30/2024) |
| Original Amortization Term: | None | | UW Economic Occupancy: | 90.0% |
| Amortization Type: | Interest Only | | UW Revenues: | $16,441,883 |
| Call Protection(2): | L(24),D(29),O(7) | | UW Expenses: | $6,073,088 |
| Lockbox / Cash Management: | Hard / Springing | | UW NOI: | $10,368,795 |
| Additional Debt(1): | Yes | | UW NCF: | $9,486,028 |
| Additional Debt Balance(1): | $17,297,500 | | Appraised Value / Per SF: | $106,000,000 / $116 |
| Additional Debt Type(1): | Pari Passu | | Appraisal Date: | 8/30/2024 |
| | | | | |
| Escrows and Reserves(3) | | Financial Information(1) |
| | Initial | Monthly | Initial Cap | | Cut-off Date Loan / SF: | $58 | |
| Taxes: | $348,608 | $116,203 | N/A | | Maturity Date Loan / SF: | $58 | |
| Insurance: | $0 | Springing | N/A | | Cut-off Date LTV: | 50.3% | |
| Replacement Reserves: | $0 | $47,768 | N/A | | Maturity Date LTV: | 50.3% | |
| TI / LC: | $5,000,000 | $95,108 | N/A | | UW NCF DSCR: | 2.40x | |
| Deferred Maintenance | $53,748 | $0 | N/A | | UW NOI Debt Yield: | 19.5% | |
| Unfunded Obligations: | $1,120,046 | $0 | N/A | | | | |
| | | | | | | | |
| Sources and Uses |
| Sources | Proceeds | % of Total | | Uses | Proceeds | % of Total |
| Whole Loan | $53,267,500 | 59.0 | % | | Purchase Price | $81,950,000 | 90.7 | % |
| Sponsor Equity | 34,110,367 | 37.8 | | | Upfront Reserves | 6,522,402 | 7.2 | |
| Other Sources(4) | 2,931,320 | 3.2 | | | Closing Costs | 1,836,785 | 2.0 | |
| Total Sources | $90,309,186 | 100.0 | % | | Total Uses | $90,309,186 | 100.0 | % |
| (1) | The Outlet Collection Seattle Mortgage Loan (as defined below) is part of a whole loan evidenced by two pari passu notes with an aggregate outstanding principal balance as of the Cut-off Date of $53,267,500 (“The Outlet Collection Seattle Whole Loan”). The Financial Information in the chart above reflects The Outlet Collection Seattle Whole Loan. |
| (2) | Defeasance of The Outlet Collection Seattle Whole Loan is permitted at any time after the earlier to occur of (a) the end of the two-year period commencing on the closing date of the securitization of the last promissory note representing a portion of The Outlet Collection Seattle Whole Loan to be securitized and (b) November 18, 2028. The assumed defeasance lockout period of 24 payments is based on the anticipated closing date of the BMO 2024-5C8 securitization trust in December 2024. The actual lockout period may be longer. |
| (3) | See “Escrows and Reserves” below. |
| (4) | Other Sources include prorations and credits in relation to the purchase of The Outlet Collection Seattle Property (as defined below). |
THE INFORMATION IN THIS STRUCTURAL AND COLLATERAL TERM SHEET IS NOT COMPLETE AND MAY BE AMENDED PRIOR TO THE TIME OF SALE. THIS TERM SHEET IS NOT AN OFFER TO SELL THESE SECURITIES AND IT IS NOT A SOLICITATION OF AN OFFER TO BUY THESE SECURITIES IN ANY JURISDICTION WHERE THE OFFER OR SALE IS NOT PERMITTED. |
| | 110 | |
| Structural and Collateral Term Sheet | | BMO 2024-5C8 |
| No. 8 – The Outlet Collection Seattle |
The Loan. The eighth largest mortgage loan (“The Outlet Collection Seattle Mortgage Loan”) is part of The Outlet Collection Seattle Whole Loan and is secured by the borrower’s fee interest in a retail outlet center totaling 913,033 square feet located in Auburn, Washington (“The Outlet Collection Seattle Property”). The Outlet Collection Seattle Whole Loan is comprised of two pari passu notes, with an aggregate outstanding principal balance as of the Cut-off Date of $53,267,500. The Outlet Collection Seattle Whole Loan was originated on November 18, 2024 by Citi Real Estate Funding Inc. (“CREFI”) and accrues interest at a fixed rate of 7.33000% per annum. The Outlet Collection Seattle Whole Loan has an initial term of five years, is interest-only for the full term and accrues interest on an Actual/360 basis. The scheduled maturity date of The Outlet Collection Seattle Whole Loan is December 6, 2029.
The Outlet Collection Seattle Mortgage Loan is evidenced by the controlling Note A-1 with an outstanding principal balance as of the Cut-off Date of $35,970,000. The table below summarizes the promissory notes that comprise The Outlet Collection Seattle Whole Loan. The relationship between the holders of The Outlet Collection Seattle Whole Loan is governed by a co-lender agreement as described under “Description of the Mortgage Pool—The Whole Loans—The Serviced Pari Passu Whole Loans” in the Preliminary Prospectus. The Outlet Collection Seattle Whole Loan will be serviced under the pooling and servicing agreement for the BMO 2024-5C8 securitization trust. See “The Pooling and Servicing Agreement” in the Preliminary Prospectus.
| Whole Loan Summary |
| Note | Original Balance | Cut-off Date Balance | Note Holder | Controlling Piece |
| A-1 | $35,970,000 | $35,970,000 | BMO 2024-5C8 | Yes |
| A-2(1) | $17,297,500 | $17,297,500 | CREFI | No |
| Whole Loan | $53,267,500 | $53,267,500 | | |
| (1) | Expected to be contributed to one or more future securitizations. |
The Property. The Outlet Collection Seattle Property is comprised of a 913,033 square foot retail outlet center located off of the State Route 87 and State Route 18 interchange in Auburn, Washington, approximately 27.2 miles south of Seattle. The Outlet Collection Seattle Property is located on an approximately 93.9-acre site and was built in 1995 and renovated in 2012. The Outlet Collection Seattle Property features 4,634 surface parking spaces resulting in a total parking ratio of approximately 5.1 spaces per 1,000 square feet. As of September 17, 2024, The Outlet Collection Seattle Property was 98.2% leased by 103 tenants at an average rent of $13.99 per square foot. Tenancy at The Outlet Collection Seattle Property features a mix of national and regional outlets and other tenants including Burlington Coat Factory, Fieldhouse USA, Best Buy, Dave and Buster’s, Nordstrom Rack, H&M, and Ashley Furniture. Tenancy also includes 31 temporary tenants which account for 162,314 square feet of net rentable area and $1,533,545 of underwritten rent. According to a third-party market report, The Outlet Collection Seattle Property had approximately 5.3 million visitors between June 1, 2023 and May 31, 2024.
Major Tenants. The three largest tenants based on underwritten base rent are Dave & Buster’s, Burlington Coat Factory and Fieldhouse USA.
Dave & Buster’s (45,218 square feet; 5.0% of NRA; 8.3% of underwritten base rent): Founded in 1982, Dave & Buster’s (NASDAQ: PLAY) is an American restaurant and entertainment business offering a full-service restaurant, full bar, and a video arcade. As of 2023, the company had a total of 156 locations in the United States as well as two in Puerto Rico and two in Canada. Dave & Buster’s has been a tenant at The Outlet Collection Seattle Property since December 2017 and has a current lease term through December 2032 with three, five-year renewal options and no termination options remaining.
Burlington Coat Factory (86,316 square feet; 9.5% of NRA; 6.4% of underwritten base rent): Founded in 1972, Burlington Coat Factory (NYSE: BURL) is an American national off-price department store retailer, and a division of Burlington Coat Factory Warehouse Corporation with 1,000 stores in 40 states and Puerto Rico. Burlington Coat Factory has been a tenant at The Outlet Collection Seattle Property since August 1995 and has a current lease term through January 2026 with no renewal options. Burlington Coat Factory has the right to terminate its lease at any time upon twelve months’ prior written notice, without payment of a termination fee.
Fieldhouse USA (154,336 square feet; 16.9% of NRA; 6.0% of underwritten base rent): Fieldhouse USA is a community based multipurpose indoor facility that offers a variety of sporting activities with facilities specializing in leagues, events and
THE INFORMATION IN THIS STRUCTURAL AND COLLATERAL TERM SHEET IS NOT COMPLETE AND MAY BE AMENDED PRIOR TO THE TIME OF SALE. THIS TERM SHEET IS NOT AN OFFER TO SELL THESE SECURITIES AND IT IS NOT A SOLICITATION OF AN OFFER TO BUY THESE SECURITIES IN ANY JURISDICTION WHERE THE OFFER OR SALE IS NOT PERMITTED. |
| | 111 | |
| Structural and Collateral Term Sheet | | BMO 2024-5C8 |
| No. 8 – The Outlet Collection Seattle |
tournaments. The space offers year-round league play in team sports such as basketball, soccer, volleyball, flag football, and futsal. Fieldhouse also provides programs for individuals such as performance training, all-sports camps, baseball/softball, birthday parties, boot camps, cheerleading, club volleyball, corporate events, dodgeball, skills training, taekwondo, and tumble. A portion of Fieldhouse USA’s space is subleased to Fitness Quest and Big Air Trampoline Park. Fieldhouse USA has been a tenant at The Outlet Collection Seattle Property since November 2020 and has a current lease term through December 2035 with two, five-year renewal options and no termination options remaining.
Appraisal. According to the appraisal, The Outlet Collection Seattle Whole Loan had an “as-is” appraised value of $106,000,000 as of August 30, 2024. The appraisal also concluded to an “as vacant land” value of $89,000,000, resulting in a loan to land value ratio of 59.9%. The table below shows the appraisal’s “as-is” conclusions.
| The Outlet Collection Seattle(1) |
| Property | Value | Capitalization Rate |
| The Outlet Collection Seattle | $106,000,000 | 8.00% |
Environmental. According to the Phase I environmental assessment dated July 9, 2024, there is a recognized environmental condition at The Outlet Collection Seattle Property related to a contaminant plume located beneath The Outlet Collection Seattle Property and a business environmental risk relating to the location of The Outlet Collection Seattle within the Tacoma Smelter Plume Superfund site. See “Description of the Mortgage Pool—Environmental Considerations” in the Preliminary Prospectus.
The following table presents certain information relating to the historical and current occupancy of The Outlet Collection Seattle Property:
| Historical and Current Occupancy(1) |
| 2019 | 2020 | 2021 | 2022 | 2023 | Current (2) |
| 92.3% | 78.2% | 85.5% | 92.1% | 94.3% | 98.2% |
| (1) | Historical Occupancies are the annual average physical occupancy of each respective year. |
| (2) | Based on the underwritten rent roll dated September 17, 2024. |
THE INFORMATION IN THIS STRUCTURAL AND COLLATERAL TERM SHEET IS NOT COMPLETE AND MAY BE AMENDED PRIOR TO THE TIME OF SALE. THIS TERM SHEET IS NOT AN OFFER TO SELL THESE SECURITIES AND IT IS NOT A SOLICITATION OF AN OFFER TO BUY THESE SECURITIES IN ANY JURISDICTION WHERE THE OFFER OR SALE IS NOT PERMITTED. |
| | 112 | |
| Structural and Collateral Term Sheet | | BMO 2024-5C8 |
| No. 8 – The Outlet Collection Seattle |
The following table presents certain information relating to the largest tenants based on underwritten base rent at The Outlet Collection Seattle Property:
| Top Tenant Summary(1) |
| Tenant | Ratings Moody’s/S&P/Fitch(2) | Net Rentable Area (SF) | % of Total NRA | UW Base Rent PSF(3) | UW Base Rent(3) | % of Total UW Base Rent(3) | Lease Expiration Date | Tenant Sales per SF(4) | Occupancy Cost |
| Dave and Buster's | NR/NR/NR | 45,218 | 5.0 | % | $23.15 | $1,046,650 | 8.3 | % | 12/31/2032 | $271 | 8.6% |
| Burlington Coat Factory(5) | Ba1/BB+/NR | 86,316 | 9.5 | | $9.25 | 798,414 | 6.4 | | 1/31/2026 | $234 | 4.0% |
| Fieldhouse USA(6) | NR/NR/NR | 154,336 | 16.9 | | $4.86 | 750,000 | 6.0 | | 12/31/2035 | NAV | NAV |
| Nordstrom Rack | Ba2/BB+/BB | 45,025 | 4.9 | | $9.00 | 405,225 | 3.2 | | 8/31/2025 | $225 | 4.0% |
| Best Buy | A3/BBB+/NR | 50,020 | 5.5 | | $8.00 | 400,160 | 3.2 | | 3/31/2028 | NAV | NAV |
| Ashley Homestore | NR/NR/NR | 30,806 | 3.4 | | $10.00 | 308,060 | 2.5 | | 9/30/2026 | NAV | NAV |
| Finish Line JD (JD Sports) | NR/NR/NR | 5,976 | 0.7 | | $51.20 | 305,971 | 2.4 | | 2/28/2029 | $685 | 7.5% |
| Nike Factory Store | A1/AA-/NR | 13,500 | 1.5 | | $22.00 | 297,000 | 2.4 | | 1/31/2029 | $1,330 | 1.7% |
| American Eagle Outfitters | NR/NR/NR | 6,544 | 0.7 | | $38.00 | 248,672 | 2.0 | | 6/30/2027 | $317 | 12.0% |
| Ulta | NR/NR/NR | 10,015 | 1.1 | | $24.10 | 241,362 | 1.9 | | 5/31/2028 | $596 | 4.0% |
| Total Major Tenants | | 447,756 | 49.0 | % | $10.72 | $4,801,514 | 38.3 | % | | | |
| Non-Major Tenants | 286,516 | 31.4 | | $21.68 | 6,211,024 | 49.5 | | | | |
| Temporary Tenants | 162,314 | 17.8 | | $9.45% | $1,533,545 | 12.2 | % | | | |
| Total Occupied | 896,586 | 98.2 | % | $13.99 | $12,546,082 | 100.0 | % | | | |
| Vacant Space | | 16,447 | 1.8 | % | | | | | | |
| Totals/ Wtd. Avg. | 913,033 | 100.0 | % | | | | | | |
| (1) | Based on the underwritten rent roll dated September 17, 2024. |
| (2) | In certain instances, ratings provided are those of the parent company of the entity shown, whether or not the parent company guarantees the lease. |
| (3) | UW Base Rent PSF, UW Base Rent and % of Total UW Base Rent includes contractual rent steps of $99,314 through September 1, 2025. |
| (4) | Tenant Sales per SF are based on the TTM period ending June 2024 provided by the borrower. |
| (5) | Burlington Coat Factory has the right to terminate its lease at any time upon twelve months’ prior written notice, without payment of a termination fee. |
| (6) | Fieldhouse USA subleases a portion of its space to Fitness Quest and Big Air Trampoline Park. |
THE INFORMATION IN THIS STRUCTURAL AND COLLATERAL TERM SHEET IS NOT COMPLETE AND MAY BE AMENDED PRIOR TO THE TIME OF SALE. THIS TERM SHEET IS NOT AN OFFER TO SELL THESE SECURITIES AND IT IS NOT A SOLICITATION OF AN OFFER TO BUY THESE SECURITIES IN ANY JURISDICTION WHERE THE OFFER OR SALE IS NOT PERMITTED. |
| | 113 | |
| Structural and Collateral Term Sheet | | BMO 2024-5C8 |
| No. 8 – The Outlet Collection Seattle |
The following table presents certain information relating to tenant lease expirations at The Outlet Collection Seattle Property:
| Lease Rollover Schedule(1)(2) |
| Year | Number of Leases Expiring | Net Rentable Area Expiring | % of NRA Expiring | UW Base Rent Expiring(3) | % of UW Base Rent Expiring(3) | Cumulative Net Rentable Area Expiring | Cumulative % of NRA Expiring | Cumulative UW Base Rent Expiring(3) | Cumulative % of UW Base Rent Expiring(3) |
| Vacant | NAP | 16,447 | 1.8 | % | NAP | NA | P | 16,447 | 1.8% | NAP | NAP |
| Other(4) | 31 | 162,314 | 17.8 | | $1,533,545 | 12.2 | % | 178,761 | 19.6% | $1,533,545 | 12.2% |
| 2024 & MTM(5) | 3 | 5,480 | 0.6 | | 246,753 | 2.0 | | 184,241 | 20.2% | $1,780,298 | 14.2% |
| 2025 | 13 | 85,642 | 9.4 | | 1,445,723 | 11.5 | | 269,883 | 29.6% | $3,226,021 | 25.7% |
| 2026 | 19 | 199,595 | 21.9 | | 2,745,713 | 21.9 | | 469,478 | 51.4% | $5,971,734 | 47.6% |
| 2027 | 7 | 38,585 | 4.2 | | 797,477 | 6.4 | | 508,063 | 55.6% | $6,769,211 | 54.0% |
| 2028 | 15 | 89,545 | 9.8 | | 1,826,608 | 14.6 | | 597,608 | 65.5% | $8,595,819 | 68.5% |
| 2029 | 9 | 90,063 | 9.9 | | 1,454,378 | 11.6 | | 687,671 | 75.3% | $10,050,197 | 80.1% |
| 2030 | 1 | 6,864 | 0.8 | | 185,328 | 1.5 | | 694,535 | 76.1% | $10,235,525 | 81.6% |
| 2031 | 1 | 8,356 | 0.9 | | 67,516 | 0.5 | | 702,891 | 77.0% | $10,303,042 | 82.1% |
| 2032 | 3 | 47,498 | 5.2 | | 1,154,710 | 9.2 | | 750,389 | 82.2% | $11,457,752 | 91.3% |
| 2033 | 2 | 8,008 | 0.9 | | 272,811 | 2.2 | | 758,397 | 83.1% | $11,730,562 | 93.5% |
| 2034 | 1 | 300 | 0.0 | | 65,520 | 0.5 | | 758,697 | 83.1% | $11,796,082 | 94.0% |
| 2035 & Beyond | 1 | 154,336 | 16.9 | | 750,000 | 6.0 | | 913,033 | 100.0% | $12,546,082 | 100.0% |
| Total | 106 | 913,033 | 100.0 | % | $12,546,082 | 100.0 | % | | | | |
| (1) | Based on the underwritten rent roll dated September 17, 2024. |
| (2) | Certain tenants have more than one lease. Certain tenants may have lease termination or contraction options that are exercisable prior to the originally stated expiration date of the subject lease and that are not considered in the lease rollover schedule. |
| (3) | UW Base Rent Expiring, % of UW Base Rent Expiring, Cumulative UW Base Rent Expiring and Cumulative % of UW Base Rent Expiring include contractual rent steps of $99,314 through September 1, 2025. |
| (4) | Other represents space for temporary tenants which are on leases expiring from December 2024 to July 2027. |
| (5) | 2024 & MTM includes a lease to Claire’s that expired 7/31/2024 to which 1,206 SF of NRA and $118,008 of UW Base Rent is attributable as well as a lease to Journeys that expired 8/31/2024 to which 2,567 SF of NRA and $68,744 of UW Base Rent is attributable. |
THE INFORMATION IN THIS STRUCTURAL AND COLLATERAL TERM SHEET IS NOT COMPLETE AND MAY BE AMENDED PRIOR TO THE TIME OF SALE. THIS TERM SHEET IS NOT AN OFFER TO SELL THESE SECURITIES AND IT IS NOT A SOLICITATION OF AN OFFER TO BUY THESE SECURITIES IN ANY JURISDICTION WHERE THE OFFER OR SALE IS NOT PERMITTED. |
| | 114 | |
| Structural and Collateral Term Sheet | | BMO 2024-5C8 |
| No. 8 – The Outlet Collection Seattle |
The following table presents certain information relating to operating history and underwritten cash flows at The Outlet Collection Seattle Property:
| Operating History and Underwritten Net Cash Flow |
| | 2019 | 2020 | 2021 | 2022 | 2023 | TTM Sep 2024 | Underwritten | Per Square Foot | %(1) |
| In Place Rent | $9,046,784 | $7,451,763 | $8,162,430 | $8,279,973 | $9,563,651 | $10,665,617 | $10,913,223 | $11.95 | 78.7 | % |
Commercial Rent
Steps(2) | 0 | 0 | 0 | 0 | 0 | 0 | 99,314 | 0.11 | 0.7 | |
Potential Income from
Vacant Space | 0 | 0 | 0 | 0 | 0 | 0 | 443,294 | 0.49 | 3.2 | |
| Gross Potential Rent | $9,046,784 | $7,451,763 | $8,162,430 | $8,279,973 | $9,563,651 | $10,665,617 | $11,455,831 | $12.55 | 82.6 | % |
| Total Reimbursements | 3,884,882 | 3,444,829 | 2,535,466 | 2,805,647 | 2,640,148 | 2,571,143 | 2,410,765 | 2.64 | 17.4 | |
| Total Gross Income | $12,931,666 | $10,896,592 | $10,697,896 | $11,085,620 | $12,203,799 | $13,236,760 | $13,866,596 | $15.19 | 100.0 | % |
| Other Income(3) | 1,576,069 | 1,192,931 | 1,872,694 | 2,509,739 | 2,374,475 | 2,602,029 | 2,602,029 | 2.85 | 15.8 | |
| (Vacancy/Credit Loss) | 0 | 0 | 0 | 0 | 0 | 0 | (1,386,660) | (1.52) | (8.4 | ) |
| Percentage Rent | 1,266,948 | 1,549,477 | 2,434,305 | 2,585,437 | 1,688,317 | 1,613,302 | 1,359,918 | 1.49 | 8.3 | |
Effective Gross
Income | $15,774,683 | $13,639,000 | $15,004,895 | $16,180,797 | $16,266,591 | $17,452,091 | $16,441,883 | $18.01 | 100.0 | % |
| Management Fee | 473,241 | 409,170 | 450,147 | 485,424 | 487,998 | 523,563 | 493,256 | 0.54 | 3.0 | |
| Real Estate Taxes | 1,409,094 | 1,591,417 | 1,604,717 | 1,493,382 | 1,198,885 | 1,359,370 | 1,399,390 | 1.53 | 8.5 | |
| Insurance | 201,174 | 201,414 | 270,759 | 216,115 | 341,475 | 363,986 | 410,842 | 0.45 | 2.5 | |
| Other Expenses(4) | 3,537,325 | 3,100,174 | 3,576,084 | 3,588,072 | 3,748,110 | 3,769,600 | 3,769,600 | 4.13 | 22.9 | |
| Total Expenses | $5,620,834 | $5,302,175 | $5,901,707 | $5,782,993 | $5,776,467 | $6,016,519 | $6,073,088 | $6.65 | 36.9 | % |
| Net Operating Income | $10,153,850 | $8,336,825 | $9,103,188 | $10,397,804 | $10,490,124 | $11,435,572 | $10,368,795 | $11.36 | 63.1 | % |
| Replacement Reserves | 0 | 0 | 0 | 0 | 0 | 0 | 573,214 | 0.63 | 3.5 | |
| TI/LC | 0 | 0 | 0 | 0 | 0 | 0 | 309,554 | 0.34 | 1.9 | |
| Net Cash Flow | $10,153,850 | $8,336,825 | $9,103,188 | $10,397,804 | $10,490,124 | $11,435,572 | $9,486,028 | $10.39 | 57.7 | % |
| (1) | % column represents percent of Total Gross Income for all revenue lines and represents percent of Effective Gross Income for the remainder of fields. |
| (2) | Underwritten Contractual Rent Steps includes contractual rent steps of $99,314 through September 1, 2025. |
| (3) | Other Income includes the base rent of specialty and temporary tenants, other temporary tenant income (storage, shows, events, displays, cart, utilities, kiosk, vending, etc.), non-tenant marketing revenue, and other miscellaneous sources of other income. Revenue attributable to temporary tenants totals $1,533,545. |
| (4) | Other Expenses consist of CAM and repairs and maintenance expenses. |
The Market. The Outlet Collection Seattle Property is located at 1101 Outlet Collection Way Southwest in Auburn, Washington and is part of the Seattle-Tacoma-Bellevue, WA metropolitan statistical area (“Seattle MSA”). The Outlet Collection Seattle Property is located approximately 27.2 miles south of Seattle with primary access provided by State Route 18 and State Route 167, which provide linkage to the surrounding area. The Seattle MSA is located in western Washington and as of the 2020 U.S. census had a population of 4,018,762. The MSA has a diverse economic foundation with a large concentration of technological and service-based industries.
According to the appraisal, The Outlet Collection Seattle Property is located in the Federal Way/Auburn retail submarket of the Seattle MSA. As of December 31, 2023, the Federal Way/Auburn retail submarket had a total inventory of 10,641,711 square feet with 20,200 square feet under construction, a vacancy rate of 3.0% and an average asking rent of $21.30 per square foot.
According to the appraisal, the 2023 total population within a one-, three- and five-mile radius is 2,753, 79,506 and 214,001, respectively. Furthermore, the 2023 average household income within the same radius is $112,787, $105,076 and $113,607, respectively.
THE INFORMATION IN THIS STRUCTURAL AND COLLATERAL TERM SHEET IS NOT COMPLETE AND MAY BE AMENDED PRIOR TO THE TIME OF SALE. THIS TERM SHEET IS NOT AN OFFER TO SELL THESE SECURITIES AND IT IS NOT A SOLICITATION OF AN OFFER TO BUY THESE SECURITIES IN ANY JURISDICTION WHERE THE OFFER OR SALE IS NOT PERMITTED. |
| | 115 | |
| Structural and Collateral Term Sheet | | BMO 2024-5C8 |
| No. 8 – The Outlet Collection Seattle |
The following table presents certain information relating to comparable sales for The Outlet Collection Seattle Property:
| Summary of Comparable Sales(1) |
| Property Name / Address | Sale Date | Sale Price | Square Feet | Price per SF |
The Outlet Collection Seattle 1101 Outlet Collection Way Southwest Auburn, WA 98001 | Jun-24 | $82,000,000 | 914,310 SF | $89.69 |
Bellis Fair Mall 1 Bellis Fair Parkway Bellingham, WA 98226 | Nov-22 | $47,500,000 | 530,376 SF | $89.56 |
Orland Park Place 151st Street & Lagrange Road Orland Park, IL 60462 | Mar-24 | $74,600,000 | 649,668 SF | $114.83 |
Clifton Park Center Mall 22 Clifton Country Road Clifton Park, NY 12065 | Mar-23 | $55,000,000 | 660,000 SF | $83.33 |
Tropicana Centre LV 3055 E. Tropicana Avenue Las Vegas, NV 89121 | Nov-22 | $72,500,000 | 586,087 SF | $123.70 |
Shops at CenterPoint 3665 28th Street Southeast Grand Rapids, MI 49512 | Jul-22 | $63,000,000 | 537,948 SF | $117.11 |
The Borrower. The borrower is Seattle Outlet Associates LLC, a Delaware limited liability company and single purpose entity having at least one independent director in its organizational structure. Legal counsel to the borrower delivered a non-consolidation opinion in connection with the origination of The Outlet Collection Seattle Whole Loan.
The Borrower Sponsor. The borrower sponsor is LSG Enterprises LLC, an affiliate of Lightstone Group (“Lightstone Group”) and the non-recourse carveout guarantors are LSG Enterprises LLC and Converge Holdings LLC. The Lightstone Group is a diversified privately held real estate company headquartered in New York City. The Lightstone Group manages approximately 11.7 million square feet of commercial space and is active in 26 states across the country, developing, managing and investing in all sectors of the real estate market including residential, hospitality, commercial and retail. Converge Holdings LLC is an affiliate of the principal of the Lightstone Group and the owner of the grantor of two trusts, each of which has a life insurance company as beneficiary, and which trusts together indirectly own approximately 32% of the borrower.
Property Management. The Outlet Collection Seattle Property is managed by (i) Lightstone Commercial Management Limited Liability Company, a borrower affiliated management company and (ii) Spinoso Management Group, LLC, a third party manager, as sub-manager.
Escrows and Reserves. At origination of The Outlet Collection Seattle Whole Loan, the borrower deposited approximately (i) $53,748 into an immediate repairs fund, (ii) $348,608 into a real estate tax reserve fund, (iii) $5,000,000 into a leasing reserve account for future approved leasing commissions, tenant improvements and tenant allowances and other leasing expenses (“Approved Leasing Costs”), and (iv) $1,120,046 into an unfunded obligations reserve for tenant improvements, leasing commissions, free rent and gap rent obligations owed to tenants as of the origination date, and prepaid rent.
Tax Escrows – On a monthly basis, the borrower is required to deposit into a real estate tax reserve, 1/12th of the property taxes that the lender estimates will be payable over the next-ensuing 12-month period (initially estimated to be approximately $116,203).
Insurance Escrows – At the option of the lender, if the liability or casualty policy maintained by the borrower is not an approved blanket or umbrella policy, or the lender requires the borrower to maintain a separate policy, on a monthly basis, the borrower is required to deposit into an insurance reserve 1/12th of the amount which will be sufficient to pay the insurance premiums due for the renewal of coverage afforded by such policies.
Replacement Reserves – On a monthly basis, the borrower is required to deposit approximately $47,768 for replacement reserves.
THE INFORMATION IN THIS STRUCTURAL AND COLLATERAL TERM SHEET IS NOT COMPLETE AND MAY BE AMENDED PRIOR TO THE TIME OF SALE. THIS TERM SHEET IS NOT AN OFFER TO SELL THESE SECURITIES AND IT IS NOT A SOLICITATION OF AN OFFER TO BUY THESE SECURITIES IN ANY JURISDICTION WHERE THE OFFER OR SALE IS NOT PERMITTED. |
| | 116 | |
| Structural and Collateral Term Sheet | | BMO 2024-5C8 |
| No. 8 – The Outlet Collection Seattle |
Leasing Reserve – On a monthly basis, the borrower is required to deposit approximately $95,108 into the leasing reserve account.
Holdback Account – In connection with the acquisition of The Outlet Collection Seattle Property, $2,460,000 of the purchase price was held with the related title company to backstop the property seller’s representations, indemnity obligations and other obligations under an escrow and holdback agreement entered into in connection with the related purchase and sale agreement. In the event that the borrower is paid any sum pursuant to the related escrow and holdback agreement (the applicable item related to such payment, a “Holdback Item”), the borrower is required to deposit such sum into a holdback account. Provided no event of default is continuing, the lender is required to disburse sums on deposit in the Holdback Account upon its receipt of evidence that the applicable Holdback Item has been paid in full or otherwise resolved to the lender’s reasonable satisfaction.
Lockbox / Cash Management. The Outlet Collection Seattle Whole Loan is structured with a hard lockbox and springing cash management. The Outlet Collection Seattle Whole Loan documents require the borrower to send a notice to all tenants at The Outlet Collection Seattle Property within ten business days after the origination date, directing them to remit all payments under their respective leases directly to the lender-controlled lockbox account. The borrower is required to cause all revenue received by the borrower or the property manager from The Outlet Collection Seattle Property to be immediately deposited into such lockbox account. All funds deposited into the lockbox account are required to be transferred on each business day to or at the direction of the borrower unless a Trigger Period (as defined below) exists and the lender elects (in its sole discretion) to deliver a restricted account notice, in which case, all funds in the lockbox account are required to be swept on each business day to a cash management account under the control of the lender to be applied and disbursed in accordance with The Outlet Collection Seattle Whole Loan documents. All excess cash flow funds remaining in the cash management account after the application of such funds in accordance with The Outlet Collection Seattle Whole Loan documents are required to be held by the lender in an excess cash flow reserve account as additional collateral for The Outlet Collection Seattle Whole Loan; provided that during a Specified Tenant Trigger Period such funds are required to be disbursed to the borrower to cover Approved Leasing Costs for the applicable Specified Tenant space, in the same manner, and subject to the same requirements, as funds in the leasing reserve (the “Leasing Cost Disbursement Mechanism”), and during any other Trigger Period are required to be disbursed to the borrower to cover Approved Leasing Costs in accordance with the Leasing Cost Disbursement Mechanism. Upon the cure of the applicable Trigger Period, so long as no other Trigger Period exists, the lender is required to return any amounts remaining on deposit in the excess cash flow reserve account to the borrower, except if needed to satisfy the Specified Tenant Excess Cash Flow Condition (as defined below) and/or to satisfy the ST Cap Condition (as defined below); provided that any such retained funds may be released upon satisfaction of certain stabilization conditions. Upon an event of default under The Outlet Collection Seattle Whole Loan documents, the lender may apply funds to the debt in such priority as it may determine.
“Trigger Period” means a period (A) commencing upon the earliest of (i) the occurrence and continuance of an event of default under The Outlet Collection Seattle Whole Loan documents, (ii) the debt yield falling below 13.75%, and (iii) the occurrence of a Specified Tenant Trigger Period and (B) expiring upon (x) with regard to clause (i) above, the cure (if applicable) of such event of default, (y) with regard to clause (ii) above, the date that the debt yield is equal to or greater than 14.25% for one calendar quarter and (z) with regard to clause (iii) above, the Specified Tenant Trigger Period ceasing to exist in accordance with the terms of the loan agreement.
A “Specified Tenant” means, as applicable, (i) any person or entity that (together with its affiliates) (A) leases (in the aggregate) 11.5% or more of the total square footage of The Outlet Collection Seattle Property and/or (B) whose leases (in the aggregate) account for 11.5% or more of the total gross revenue for The Outlet Collection Seattle Property and (ii) any guarantor(s) of the applicable related leases. Notwithstanding the foregoing, in no event will the tenant Auburn Fieldhouse LLC (dba Fieldhouse USA) be deemed a Specified Tenant so long as its rent payable and space leased do not materially increase from those as of the origination date.
A “Specified Tenant Trigger Period” means a period (A) commencing upon the first to occur of (i) Specified Tenant being in monetary default or material non-monetary default under the applicable Specified Tenant lease beyond applicable notice and cure periods, (ii) Specified Tenant failing to be in actual, physical possession of the Specified Tenant space (or applicable portion thereof), (iii) other than in connection with a Permitted Dark Event (as defined below), Specified Tenant failing to be open for business during customary hours and/or “going dark” in the Specified Tenant space (or applicable portion thereof), (iv) Specified Tenant giving notice that it is terminating its lease for all or any portion of the Specified
THE INFORMATION IN THIS STRUCTURAL AND COLLATERAL TERM SHEET IS NOT COMPLETE AND MAY BE AMENDED PRIOR TO THE TIME OF SALE. THIS TERM SHEET IS NOT AN OFFER TO SELL THESE SECURITIES AND IT IS NOT A SOLICITATION OF AN OFFER TO BUY THESE SECURITIES IN ANY JURISDICTION WHERE THE OFFER OR SALE IS NOT PERMITTED. |
| | 117 | |
| Structural and Collateral Term Sheet | | BMO 2024-5C8 |
| No. 8 – The Outlet Collection Seattle |
Tenant space (or applicable portion thereof), (v) any termination or cancellation of any Specified Tenant lease (including, without limitation, rejection in any bankruptcy or similar insolvency proceeding) and/or any Specified Tenant lease failing to otherwise be in full force and effect, (vi) any bankruptcy or similar insolvency of Specified Tenant, and (vii) Specified Tenant failing to renew or extend its lease for at least five years on or prior to the earlier of the renewal notice period under the applicable lease and 12 months prior to expiration, and (B) expiring upon the first to occur of the lender’s receipt of reasonably acceptable evidence of (1) the satisfaction of the applicable Specified Tenant Cure Conditions (as defined below); (2) the borrower leasing all or substantially all of the Specified Tenant space pursuant to one or more leases in accordance with the applicable terms and conditions of The Outlet Collection Seattle Whole Loan documents, the applicable tenant(s) under such lease(s) being in actual, physical occupancy of the space demised, each lease having commenced and a rent commencement date having been established, and, in the lender’s judgment, the applicable Specified Tenant Excess Cash Flow Condition (as defined below) has been satisfied in connection therewith or (3) solely with respect to a Specified Tenant Trigger Period contemplated in clause (A) (iii) of this definition, the ST Cap Condition is satisfied with respect to the applicable Specified Tenant space.
A “Permitted Dark Event” will be deemed to occur with respect to a tenant that has discontinued operations or “gone dark” in all or a portion of its leased premises so long as one or more of the following conditions is satisfied: (i) the discontinuation is effectuated to comply with governmental restrictions on the use or occupancy of The Outlet Collection Seattle Property as a result of or in connection with the COVID-19 pandemic or other pandemic or epidemic and the tenant resumes operations in its leased premises within 90 days after such restrictions are lifted, (ii) the discontinuation is related to ongoing standard and customary upgrades or renovations by the tenant in accordance with its lease, the tenant is pursuing the applicable upgrades or renovations in a good faith diligent manner, and the applicable closure is not anticipated to and does not actually last for more than 90 days, (iii) the discontinuation is in connection with an ongoing restoration of The Outlet Collection Seattle Property in accordance with the loan agreement and the tenant resumes operations in its leased premises within 90 days after the restoration is complete, (iv) the tenant (or any parent entity thereof that has guaranteed all of the tenant’s lease obligations) maintains an investment-grade rating, or (v) portions of the leased premises are not being utilized due to the tenant’s implementation of a “hybrid work” program (whereby tenants are required to work physically in the workplace on most business days but are permitted to otherwise work remotely) so long as (x) a majority of the tenant’s leased premises remain available and functional for the use contemplated by the tenant’s lease if and to the extent on any given day employees elect to utilize such space for work and (y) onsite staff remain in place during normal business hours to implement and provide standard and customary services.
“Specified Tenant Cure Conditions” means each of the following, as applicable: (i) with regard to any Specified Tenant Trigger Period commenced in connection with clause (A)(i) of the definition of “Specified Tenant Trigger Period,” the applicable Specified Tenant has cured all defaults under the applicable Specified Tenant lease and no other default under such lease occurs for a period of three consecutive months following such cure, (ii) with regard to any Specified Tenant Trigger Period commenced in connection with clause (A)(ii) or (A)(iii) of the definition of “Specified Tenant Trigger Period,” the applicable Specified Tenant is in actual, physical possession of the Specified Tenant space (or applicable portion thereof) and, unless a Permitted Dark Event is ongoing with respect to the applicable Specified Tenant, open for business during customary hours and not “dark” in the Specified Tenant space (or applicable portion thereof), (iii) the applicable Specified Tenant has revoked or rescinded all termination or cancellation notices with respect to the applicable Specified Tenant lease and has re-affirmed the applicable Specified Tenant lease as being in full force and effect, (iv) in the event the Specified Tenant Trigger Period is due to the applicable Specified Tenant’s failure to extend or renew the applicable Specified Tenant lease in accordance with clause (A)(vii) of the definition of “Specified Tenant Trigger Period,” the applicable Specified Tenant has renewed or extended the applicable Specified Tenant lease in accordance with the terms thereof and of the loan agreement for at least five years and, in the lender’s reasonable judgment, the applicable Specified Tenant Excess Cash Flow Condition is satisfied in connection therewith, (v) with respect to any applicable bankruptcy or insolvency proceedings involving the applicable Specified Tenant and/or the applicable Specified Tenant lease, the applicable Specified Tenant is no longer insolvent or subject to any bankruptcy or insolvency proceedings and has affirmed the applicable Specified Tenant lease pursuant to final, non-appealable order of a court of competent jurisdiction and (vi) the applicable Specified Tenant is paying full, unabated rent under the applicable Specified Tenant lease.
“Specified Tenant Excess Cash Flow Condition” means (a) with respect to curing any Specified Tenant Trigger Period by re-tenanting the applicable Specified Tenant space (as contemplated by clause (B)(2) of the definition of “Specified Tenant Trigger Period”), sufficient funds have been accumulated in the excess cash flow account (during the continuance of the Specified Tenant Trigger Period) to cover all anticipated leasing commissions, tenant improvement costs, tenant allowances, free rent periods and/or rent abatement periods to be incurred in connection with such re-tenanting, which the
THE INFORMATION IN THIS STRUCTURAL AND COLLATERAL TERM SHEET IS NOT COMPLETE AND MAY BE AMENDED PRIOR TO THE TIME OF SALE. THIS TERM SHEET IS NOT AN OFFER TO SELL THESE SECURITIES AND IT IS NOT A SOLICITATION OF AN OFFER TO BUY THESE SECURITIES IN ANY JURISDICTION WHERE THE OFFER OR SALE IS NOT PERMITTED. |
| | 118 | |
| Structural and Collateral Term Sheet | | BMO 2024-5C8 |
| No. 8 – The Outlet Collection Seattle |
borrower (as opposed to the tenant) is required to pay pursuant to the applicable lease, and (b) with respect to curing any Specified Tenant Trigger Period by renewal/extension of any Specified Tenant lease (as contemplated by clause (iv) of the definition of “Specified Tenant Cure Conditions”), sufficient funds have been accumulated in the excess cash flow account (during the continuance of the Specified Tenant Trigger Period) to cover all anticipated leasing commissions, tenant improvement costs, tenant allowances, free rent periods, and/or rent abatement periods to be incurred in connection with any such renewal/extension, which the borrower (as opposed to the tenant) is required to pay pursuant to the applicable lease.
“ST Cap Condition” means that the amount in the excess cash flow account (without duplication of any amounts then on deposit to satisfy the Specified Tenant Excess Cash Flow Condition with respect to any other Specified Tenant Trigger Period) is equal to or greater than (x) $25.00, multiplied by (y) the number of leasable square feet demised (prior to giving effect to any full or partial termination thereof) pursuant to the applicable Specified Tenant lease with respect to which the applicable Specified Tenant Trigger Period shall have occurred.
Subordinate and Mezzanine Debt. None.
Permitted Future Subordinate or Mezzanine Debt. Not permitted.
Partial Release. At any time after the earlier to occur of (a) the end of the two-year period commencing on the closing date of the securitization of the last promissory note representing a portion of The Outlet Collection Seattle Whole Loan to be securitized and (b) November 18, 2028, the borrower is permitted to obtain the release of a release parcel identified in the loan agreement (and on which the premises leased by Discount Collection Depot as of the origination date are located) (the “Release Parcel”) upon defeasance (or, at the borrower’s option, on or after the open prepayment date, prepayment) of an amount equal to the greater of (a) 120% of the allocated loan amount of the Release Parcel (which allocated loan amount is $3,336,000) and (b) 90% of the net sales proceeds of the Release Parcel, and satisfaction of the following conditions, among others: (i) after giving effect to the partial release, the debt service coverage ratio of the remaining property must be greater than the greater of the debt service coverage ratio immediately prior to the partial release and 2.40x, (ii) after giving effect to the partial release, the debt yield of the remaining property must be greater than the greater of the debt yield immediately prior to the partial release and 17.8%, (iii) after giving effect to the partial release, the loan-to-value ratio of the remaining property must be no greater than the lesser of the loan-to-value ratio immediately prior to the partial release and 65%, (iv) the Release Parcel is conveyed to a person or entity that is not affiliated with the borrower, (v) separate zoning and tax lots and compliance with legal requirements, (vi) restrictive covenants are entered into including, but not limited to, anti-poaching covenants, and (vii) satisfaction of REMIC related conditions.
Ground Lease. None.
THE INFORMATION IN THIS STRUCTURAL AND COLLATERAL TERM SHEET IS NOT COMPLETE AND MAY BE AMENDED PRIOR TO THE TIME OF SALE. THIS TERM SHEET IS NOT AN OFFER TO SELL THESE SECURITIES AND IT IS NOT A SOLICITATION OF AN OFFER TO BUY THESE SECURITIES IN ANY JURISDICTION WHERE THE OFFER OR SALE IS NOT PERMITTED. |
| | 119 | |
| Structural and Collateral Term Sheet | | BMO 2024-5C8 |
| No. 9 – 222 Delaware Avenue |
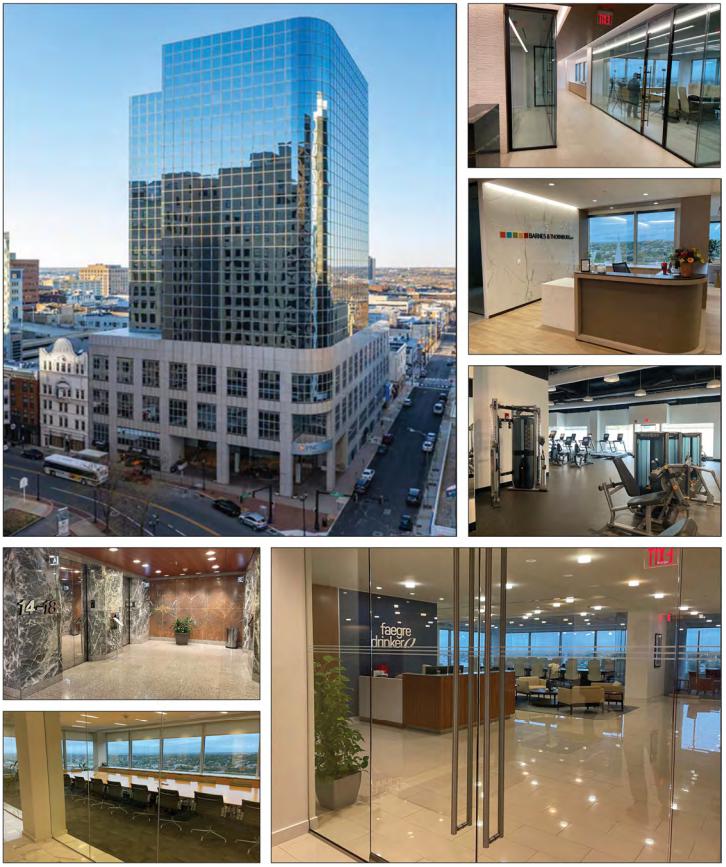
THE INFORMATION IN THIS STRUCTURAL AND COLLATERAL TERM SHEET IS NOT COMPLETE AND MAY BE AMENDED PRIOR TO THE TIME OF SALE. THIS TERM SHEET IS NOT AN OFFER TO SELL THESE SECURITIES AND IT IS NOT A SOLICITATION OF AN OFFER TO BUY THESE SECURITIES IN ANY JURISDICTION WHERE THE OFFER OR SALE IS NOT PERMITTED. |
| | 120 | |
| Structural and Collateral Term Sheet | | BMO 2024-5C8 |
| No. 9 – 222 Delaware Avenue |
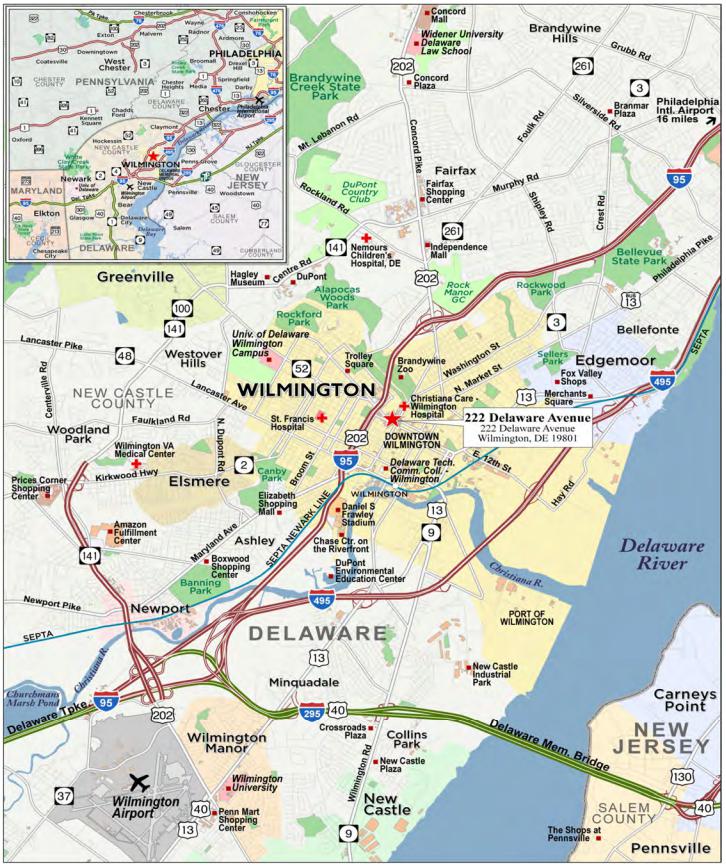
THE INFORMATION IN THIS STRUCTURAL AND COLLATERAL TERM SHEET IS NOT COMPLETE AND MAY BE AMENDED PRIOR TO THE TIME OF SALE. THIS TERM SHEET IS NOT AN OFFER TO SELL THESE SECURITIES AND IT IS NOT A SOLICITATION OF AN OFFER TO BUY THESE SECURITIES IN ANY JURISDICTION WHERE THE OFFER OR SALE IS NOT PERMITTED. |
| | 121 | |
| Structural and Collateral Term Sheet | | BMO 2024-5C8 |
| No. 9 – 222 Delaware Avenue |
| Mortgage Loan Information | | Property Information |
| Mortgage Loan Seller: | BMO | | Single Asset / Portfolio: | Single Asset |
| Original Principal Balance: | $35,500,000 | | Title: | Fee |
| Cut-off Date Principal Balance: | $35,500,000 | | Property Type – Subtype: | Office – CBD |
| % of IPB: | 3.6% | | Net Rentable Area (SF): | 294,417 |
| Loan Purpose: | Refinance | | Location: | Wilmington, DE |
| Borrower: | Jemal’s 222 Delaware L.L.C. | | Year Built / Renovated: | 1987 / 2023 |
| Borrower Sponsor: | Norman Jemal | | Occupancy: | 84.5% |
| Interest Rate: | 7.38000% | | Occupancy Date: | 11/5/2024 |
| Note Date: | 11/5/2024 | | 4th Most Recent NOI (As of): | $1,356,875 (12/31/2021) |
| Maturity Date: | 11/6/2029 | | 3rd Most Recent NOI (As of): | $2,053,961 (12/31/2022) |
| Interest-only Period: | 60 months | | 2nd Most Recent NOI (As of): | $3,005,492 (12/31/2023) |
| Original Term: | 60 months | | Most Recent NOI (As of): | $3,967,471 (TTM 6/30/2024) |
| Original Amortization Term: | None | | UW Economic Occupancy: | 83.7% |
| Amortization Type: | Interest Only | | UW Revenues: | $7,896,600 |
| Call Protection: | L(25),D(28),O(7) | | UW Expenses: | $2,865,359 |
| Lockbox / Cash Management: | Hard / Springing | | UW NOI: | $5,031,241 |
| Additional Debt: | No | | UW NCF: | $4,647,990 |
| Additional Debt Balance: | N/A | | Appraised Value / Per SF: | $54,800,000 / $186 |
| Additional Debt Type: | N/A | | Appraisal Date: | 10/14/2024 |
| | | | | |
| Escrows and Reserves(1) | | Financial Information |
| | Initial | Monthly | Initial Cap | | Cut-off Date Loan / SF: | $121 |
| Taxes: | $178,034 | $59,345 | N/A | | Maturity Date Loan / SF: | $121 |
| Insurance: | $0 | Springing | N/A | | Cut-off Date LTV: | 64.8% |
| Replacement Reserves: | $0 | $4,907 | N/A | | Maturity Date LTV: | 64.8% |
| TI/LC: | $850,000 | $36,802 | N/A | | UW NCF DSCR: | 1.75x |
| Other(1): | $2,853,934 | Springing | N/A | | UW NOI Debt Yield: | 14.2% |
| | | | | | | |
| Sources and Uses |
| Sources | Proceeds | % of Total | | Uses | Proceeds | % of Total |
| Mortgage Loan | $35,500,000 | 90.7 | % | | Loan Payoff | $33,221,113 | 84.9 | % |
| Borrower Sponsor Equity | 3,623,109 | 9.3 | | | Upfront Reserves | 3,881,968 | 9.9 | |
| | | | | Closing Costs | 2,020,029 | 5.2 | |
| Total Sources | $39,123,109 | 100.0 | % | | Total Uses | $39,123,109 | 100.0 | % |
| (1) | See “Escrows and Reserves” below for further discussion of reserve information. |
The Loan. The ninth largest mortgage loan (the “222 Delaware Avenue Mortgage Loan”) is secured by the borrower’s fee interest in an 18-story office building and five-story parking garage located in Wilmington, Delaware featuring 294,417 square feet (the “222 Delaware Avenue Property”). The 222 Delaware Avenue Mortgage Loan has an original and outstanding principal balance as of the Cut-off Date of $35,500,000 and represents approximately 3.6% of the Initial Pool Balance. The 222 Delaware Avenue Mortgage Loan was originated on November 5, 2024 by Bank of Montreal and accrues interest at a fixed rate of 7.38000% per annum on an Actual/360 basis. The 222 Delaware Avenue Mortgage Loan had an original term of 60 months and has a remaining term of 59 months as of the Cut-off Date. The 222 Delaware Avenue Mortgage Loan requires interest-only payments during the full term. The scheduled maturity date of the 222 Delaware Avenue Mortgage Loan is the payment date in November 2029.
THE INFORMATION IN THIS STRUCTURAL AND COLLATERAL TERM SHEET IS NOT COMPLETE AND MAY BE AMENDED PRIOR TO THE TIME OF SALE. THIS TERM SHEET IS NOT AN OFFER TO SELL THESE SECURITIES AND IT IS NOT A SOLICITATION OF AN OFFER TO BUY THESE SECURITIES IN ANY JURISDICTION WHERE THE OFFER OR SALE IS NOT PERMITTED. |
| | 122 | |
| Structural and Collateral Term Sheet | | BMO 2024-5C8 |
| No. 9 – 222 Delaware Avenue |
The Property. The 222 Delaware Avenue Property is a Class A eighteen-story, 294,417 square foot multi-tenant office property including a parking garage that occupies the second through sixth floors. The 222 Delaware Avenue Property is located on the southeast corner of Delaware Avenue and North Tatnall Street with access to other major linkages such as Interstate 95, Route 202, and Chester Pike, in the Wilmington CBD submarket of Philadelphia, Pennsylvania. The 222 Delaware Avenue Property is situated on a 0.82-acre site and was built in 1987 and was most recently renovated in 2023. As of November 5, 2024, the 222 Delaware Avenue Property was 84.5% occupied by 29 office tenants, 3 storage tenants and two retail tenants. The 222 Delaware Avenue Property has 536 total parking spaces, resulting in a ratio of approximately 1.8 spaces per 1,000 square feet of net rentable area.
Major Tenants. The three largest tenants based on underwritten base rent are PNC Bank, Wilson Sonsini Goodrich, and Barnes & Thornburg LLP.
PNC Bank (32,530 square feet; 11.0% of net rentable area; 14.4% of underwritten base rent). PNC Bank (“PNC”) was formed in 1983 in Pittsburgh, Pennsylvania after a merger between Pittsburgh National Corporation and Provident National Corporation. PNC is the 6th largest bank in the United States with over $430 billion in assets and 2,200 branches across 28 states. PNC provides services to individuals, small businesses, corporations, and government entities across its retail banking, asset management, and corporate and institutional banking groups. In 2023, PNC reported revenues of $21.5 billion.
Wilson Sonsini Goodrich (24,180 square feet; 8.2% of net rentable area; 10.1% of underwritten base rent). Wilson Sonsini Goodrich (“Wilson Sonsini”) is an American law firm founded in 1961 in Palo Alto, California. The firm’s practice areas include corporate, intellectual property, litigation, patents and innovations, regulatory, and technology transactions. Wilson Sonsini employs 775 legal professionals across the United States, Europe, and Asia. In the American Lawyer's 2024 Am Law 200 ranking, the firm placed 35th.
Barnes & Thornburg LLP (20,479 square feet; 7.0% of net rentable area; 8.8% of underwritten base rent). Barnes & Thornburg LLP was formed in 1982 in Indiana from a merger between Barnes, Hickam, Pantzer & Boyd and Thornburg, McGill, Deahl, Harman, Carey and Murray. Barnes & Thornburg LLP is a full-service law firm with practice areas including corporate, data security, environmental, insurance, intellectual property, IT, real estate, and tax. Barnes & Thornburg employs over 800 legal professionals in 23 locations across the country. Barnes & Thornburg LLP reported $691,019,000 in revenue in 2023.
Environmental. The Phase I environmental assessment of the 222 Delaware Avenue Property dated May 30, 2024 identified no recognized environmental conditions, controlled environmental conditions or significant data gaps.
The following table presents certain information relating to the historical and current occupancy of the 222 Delaware Avenue Property:
| Historical and Current Occupancy(1) |
| 2021 | 2022 | 2023 | Current(2) |
| 60.0% | 70.0% | 75.0% | 84.5% |
| (1) | Historical occupancies are as of December 31 of each respective year, unless otherwise specified. |
| (2) | Based on the underwritten rent roll dated November 5, 2024. |
THE INFORMATION IN THIS STRUCTURAL AND COLLATERAL TERM SHEET IS NOT COMPLETE AND MAY BE AMENDED PRIOR TO THE TIME OF SALE. THIS TERM SHEET IS NOT AN OFFER TO SELL THESE SECURITIES AND IT IS NOT A SOLICITATION OF AN OFFER TO BUY THESE SECURITIES IN ANY JURISDICTION WHERE THE OFFER OR SALE IS NOT PERMITTED. |
| | 123 | |
| Structural and Collateral Term Sheet | | BMO 2024-5C8 |
| No. 9 – 222 Delaware Avenue |
The following table presents certain information relating to the top 10 tenants by underwritten base rent at the 222 Delaware Avenue Property:
| Top Tenant Summary(1) |
| Tenant | Ratings
Moody’s/S&P/Fitch | Net Rentable Area (SF) | % of
Total NRA | UW
Base Rent PSF |
UW
Base Rent | % of Total
UW Base Rent | Lease
Exp. Date |
| PNC Bank | NR/NR/NR | 32,530 | 11.0 | % | $30.50 | $992,165 | 14.4 | % | 11/30/2030 |
| Wilson Sonsini Goodrich(2) | NR/NR/NR | 24,180 | 8.2 | | $28.68 | 693,482 | 10.1 | | 3/31/2031 |
| Barnes & Thornburg LLP | NR/NR/NR | 20,479 | 7.0 | | $29.67 | 607,612 | 8.8 | | 10/31/2033 |
| Fish and Richardson PC | NR/NR/NR | 19,386 | 6.6 | | $30.35 | 588,365 | 8.6 | | 2/29/2028 |
| Faegre Drinker Biddle & Reath | NR/NR/NR | 18,891 | 6.4 | | $29.50 | 557,285 | 8.1 | | 11/30/2035 |
| Eckert Seamans | NR/NR/NR | 18,461 | 6.3 | | $25.39 | 468,725 | 6.8 | | 3/31/2028 |
| Heyman Enerio | NR/NR/NR | 13,918 | 4.7 | | $31.75 | 441,897 | 6.4 | | 11/30/2037 |
| Greenberg Traurig, LLP | NR/NR/NR | 13,477 | 4.6 | | $28.25 | 380,725 | 5.5 | | 5/31/2037 |
| PoIsinelli PC | NR/NR/NR | 9,921 | 3.4 | | $29.61 | 293,761 | 4.3 | | 3/31/2028 |
| Offit Kurman, P.A, | NR/NR/NR | 7,822 | 2.7 | | $26.02 | 203,528 | 3.0 | | 8/31/2027 |
| Top 10 Tenant Occupied | | 179,065 | 60.8 | % | $29.19 | $5,227,545 | 76.1 | % | |
| Other Occupied | | 69,710 | 23.7 | | $23.54 | 1,641,091 | 23.9 | | |
| Total Occupied | | 248,775 | 84.5 | % | $27.61 | $6,868,636 | 100.0 | % | |
| Vacant Space | | 45,642 | 15.5 | | | | | |
| Totals/ Wtd. Avg. | | 294,417 | 100.0 | % | | | | |
| (1) | Based on the underwritten rent roll dated November 5, 2024, inclusive of rent steps through October 2025. |
| (2) | Wilson Sonsini Goodrich may terminate its lease at any time prior to September 30, 2028 by delivering at least 15 days’ prior written notice. |
The following table presents certain information relating to the lease rollover schedule at the 222 Delaware Avenue Property:
| Lease Rollover Schedule(1)(2) |
| Year | Number of Leases Expiring | Net Rentable Area Expiring | % of NRA Expiring | UW Base Rent Expiring | % of UW Base Rent Expiring | Cumulative Net Rentable Area Expiring | Cumulative % of NRA Expiring | Cumulative UW Base Rent Expiring | Cumulative % of UW Base Rent Expiring |
| Vacant | NAP | 45,642 | 15.5 | % | NAP | NA | P | 45,642 | 15.5% | NAP | NAP |
| 2024 & MTM | 2 | 4,972 | 1.7 | | $136,137 | 2.0 | % | 50,614 | 17.2% | $136,137 | 2.0% |
| 2025 | 3 | 10,178 | 3.5 | | 194,626 | 2.8 | | 60,792 | 20.6% | $330,763 | 4.8% |
| 2026 | 6 | 8,285 | 2.8 | | 169,186 | 2.5 | | 69,077 | 23.5% | $499,950 | 7.3% |
| 2027 | 4 | 20,394 | 6.9 | | 578,441 | 8.4 | | 89,471 | 30.4% | $1,078,390 | 15.7% |
| 2028 | 6 | 54,554 | 18.5 | | 1,556,649 | 22.7 | | 144,025 | 48.9% | $2,635,039 | 38.4% |
| 2029 | 5 | 12,523 | 4.3 | | 316,066 | 4.6 | | 156,548 | 53.2% | $2,951,105 | 43.0% |
| 2030 | 3 | 35,222 | 12.0 | | 1,076,317 | 15.7 | | 191,770 | 65.1% | $4,027,422 | 58.6% |
| 2031 | 2 | 24,180 | 8.2 | | 695,882 | 10.1 | | 215,950 | 73.3% | $4,723,304 | 68.8% |
| 2032 | 1 | 4,519 | 1.5 | | 137,784 | 2.0 | | 220,469 | 74.9% | $4,861,089 | 70.8% |
| 2033 | 1 | 20,479 | 7.0 | | 607,612 | 8.8 | | 240,948 | 81.8% | $5,468,700 | 79.6% |
| 2034 | 1 | 1,987 | 0.7 | | 20,029 | 0.3 | | 242,935 | 82.5% | $5,488,729 | 79.9% |
| 2035 & Beyond | 4 | 51,482 | 17.5 | | 1,379,906 | 20.1 | | 294,417 | 100.0% | $6,868,636 | 100.0% |
| Total | 38 | 294,417 | 100.0 | % | $6,868,636 | 100.0 | % | | | | |
| (1) | Based on the underwritten rent roll dated November 5, 2024, inclusive of rent steps through October 2025. |
| (2) | Certain tenants may have lease termination options that are exercisable prior to the originally stated expiration date of the related lease and are not considered in the rollover schedule.
|
THE INFORMATION IN THIS STRUCTURAL AND COLLATERAL TERM SHEET IS NOT COMPLETE AND MAY BE AMENDED PRIOR TO THE TIME OF SALE. THIS TERM SHEET IS NOT AN OFFER TO SELL THESE SECURITIES AND IT IS NOT A SOLICITATION OF AN OFFER TO BUY THESE SECURITIES IN ANY JURISDICTION WHERE THE OFFER OR SALE IS NOT PERMITTED. |
| | 124 | |
| Structural and Collateral Term Sheet | | BMO 2024-5C8 |
| No. 9 – 222 Delaware Avenue |
The following table presents certain information relating to the operating history and underwritten cash flows of the 222 Delaware Avenue Property:
| Operating History and Underwritten Net Cash Flow |
| | | 2021 | 2022 | 2023 | TTM June 2024 | Underwritten | Per Square Foot | %(1) |
| Rents in Place(2) | | $4,235,022 | $4,614,427 | $5,401,235 | $5,775,911 | $8,169,449 | $27.75 | 112.2 | % |
| Rent Steps | | 0 | 0 | 0 | 0 | 114,088 | 0.39 | 1.6 | |
| Reimbursement Income | | 486,842 | 376,190 | 471,237 | 476,364 | 381,926 | 1.30 | 5.2 | |
| Straight Line Rent | | 0 | 0 | 0 | 0 | 33,346 | 0.11 | 0.5 | |
| Gross Revenue | | $4,721,864 | $4,990,617 | $5,872,472 | $6,252,275 | $8,698,810 | $29.55 | 119.4 | % |
| Concessions | | (498,367) | (457,752) | (693,648) | (116,453) | 0 | 0.00 | 0.0 | |
| Vacancy | | 0 | 0 | 0 | 0 | (1,414,902) | (4.81) | (19.4 | ) |
| Net Rental Income | | $4,223,497 | $4,532,866 | $5,178,824 | $6,135,821 | $7,283,908 | $24.74 | 100.0 | % |
| Other Income | | 163,462 | 365,015 | 585,256 | 612,585 | 612,692 | 2.08 | 8.4 | |
| Effective Gross Income | | $4,386,959 | $4,897,881 | $5,764,080 | $6,748,406 | $7,896,600 | $26.82 | 108.4 | % |
| Management Fee | | 135,759 | 139,905 | 149,555 | 165,092 | 236,898 | 0.80 | 3.0 | |
| Real Estate Taxes | | 950,390 | 675,014 | 709,439 | 712,946 | 722,299 | 2.45 | 9.1 | |
| Insurance | | 79,832 | 111,765 | 142,161 | 149,098 | 152,363 | 0.52 | 1.9 | |
| Other Expenses(3) | | 1,864,103 | 1,917,236 | 1,757,434 | 1,753,799 | 1,753,799 | 5.96 | 22.2 | |
| Total Expenses | | $3,030,084 | $2,843,920 | $2,758,588 | $2,780,935 | $2,865,359 | $9.73 | 36.3 | % |
| Net Operating Income | | $1,356,875 | $2,053,961 | $3,005,492 | $3,967,471 | $5,031,241 | $17.09 | 63.7 | % |
| Total TI/LC, Capex/RR | | 0 | 0 | 0 | 0 | 383,251 | 1.30 | 4.9 | |
| Net Cash Flow | | $1,356,875 | $2,053,961 | $3,005,492 | $3,967,471 | $4,647,990 | $15.79 | 58.9 | % |
| (1) | Revenue-related figures are calculated as a % of Net Rental Income. All other line items are calculated as a % of Effective Gross Income. |
| (2) | Underwritten Rents in Place is based on the underwritten rent roll dated November 5, 2024, inclusive of rent steps through October 2025. |
| (3) | Other Expenses include utilities, janitorial, repairs and maintenance, security, general & administrative, and non-reimbursable expenses. |
The Market. The 222 Delaware Avenue Property is located in Wilmington, Delaware, in the Philadelphia office market and the Wilmington CBD submarket. According to the appraisal, the Philadelphia-Camden-Wilmington, PA-NJ-DE-MD area has a population of approximately 6.3 million people and a median annual household income of $89,278. Total employment in the metro area has been trending upward since 2020 with a 2.2% increase for 2023 and a total of approximately 3.1 million jobs in 2023.
According to the appraisal, over the past 10 years, the Philadelphia office market inventory increased 0.9% with a 39.1% increase in vacancy rate and a change in average asking rent (5.8% increase). As of the second quarter of 2024, the market maintained a vacancy rate of 10.7%, an asking rent of $26.87 per square foot, and had an overall inventory of approximately 334 million square feet with approximately 2.3 million square feet of new supply currently under construction.
The Wilmington CBD submarket has stabilized in recent years. According to the appraisal, submarket inventory has increased 1.6% with a 25.0% decrease in vacancy rate and an increase of 7.3% in average asking rent over the past five years. As of the second quarter of 2024, the Wilmington CBD submarket had approximately 14.5 million square feet in inventory with no square feet under construction, a vacancy rate of 10.3%, and an average asking rent of $26.86 per square foot.
THE INFORMATION IN THIS STRUCTURAL AND COLLATERAL TERM SHEET IS NOT COMPLETE AND MAY BE AMENDED PRIOR TO THE TIME OF SALE. THIS TERM SHEET IS NOT AN OFFER TO SELL THESE SECURITIES AND IT IS NOT A SOLICITATION OF AN OFFER TO BUY THESE SECURITIES IN ANY JURISDICTION WHERE THE OFFER OR SALE IS NOT PERMITTED. |
| | 125 | |
| Structural and Collateral Term Sheet | | BMO 2024-5C8 |
| No. 9 – 222 Delaware Avenue |
The following table presents certain information relating to comparable office leases for the 222 Delaware Avenue Property:
| Comparable Office Leases(1) |
| Property / Location | Year Built / Renovated | Tenant Name | Lease Start Date | Term (yrs.) | Lease Type | Tenant SF | Rent PSF |
222 Delaware Avenue 222 Delaware Avenue Wilmington, DE | 1987 / 2023 | PNC Bank | Sep-19 | 5.0 | Full Service Gross | 32,530(2) | $30.50(2) |
Star Building 123 S Justison St Wilmington, DE | 2010 / NAP | Grant & Eisenhofer | Jun-24 | 15.5 | Full Service Gross | 6,568 | $65.32 |
500 Delaware 500 Delaware Avenue Wilmington, DE | 2006 / 2020 | Quinn Emanuel | Jan-24 | 2.08 | Full Service Gross | 5,389 | $36.00 |
500 Delaware 500 Delaware Avenue Wilmington, DE | 2006 / 2020 | VISA | Oct-23 | 5.0 | Full Service Gross | 8,454 | $32.50 |
300 Delaware 300 Delaware Avenue Wilmington, DE | 1970 / 2005 | TD Bank | Apr-23 | 5.0 | Full Service Gross | 5,799 | $28.45 |
Star Building 123 Justison St Wilmington, DE | 2010 / NAP | Obermayer, Rebmann, Maxwell & Hippel | Mar-23 | 5.0 | Full Service Gross | 1,931 | $31.00 |
1201 N Market 1201 North Market Street Wilmington, DE | 1988 / NAP | Gelfand, Rennert & Feldman | Oct-22 | 5.25 | Full Service Gross | 3,183 | $28.30 |
| (2) | Based on the underwritten rent roll dated November 5, 2024. |
The Borrower. The borrower is Jemal's 222 Delaware L.L.C., a Delaware limited liability company and single purpose entity with two independent directors in its organizational structure. Legal counsel to the borrower delivered a non-consolidation opinion in connection with the origination of the 222 Delaware Avenue Mortgage Loan.
The Borrower Sponsor. The borrower sponsor and non-recourse carveout guarantor is Norman Jemal.
Property Management. The 222 Delaware Avenue Property is managed by CBRE, Inc., a non-affiliated commercial real estate services and investment firm.
Escrows and Reserves. At origination of the 222 Delaware Avenue Mortgage Loan, the borrower deposited approximately $178,034 for real estate taxes, $850,000 for approved leasing expenses, $1,270,734 for a work reserve related to the tenant Heyman Enerio (“Heyman”), $946,465 for outstanding TI/LC, $257,773 for a gap rent reserve related to the tenant Heyman, $220,948 for a free rent reserve related to the tenant Heyman and approximately $158,014 for leasing commissions reserves related to the tenant Heyman.
Tax Escrows – On a monthly basis, the borrower is required to escrow 1/12th of the estimated annual real estate tax payments (initially estimated to be approximately $59,345).
Insurance Escrows – On a monthly basis, the borrower is required to escrow 1/12th of the annual estimated insurance payments. Such reserve has been conditionally waived so long as the borrower maintains a blanket policy meeting the requirements of the 222 Delaware Avenue Mortgage Loan documents and the borrower provides evidence of the renewal of any insurance policy prior to the expiration thereof and receipts for the payment of the applicable premiums. As of the origination date, an acceptable blanket policy was in place.
Replacement Reserve – On a monthly basis, the borrower is required to escrow approximately $4,907 for the payment or reimbursement of approved capital expenses.
TI/LC Reserve – On a monthly basis, the borrower is required to escrow $36,802 for approved leasing expenses.
Rent Replication and Outstanding TI/LC Reserve – On a monthly basis through and including the payment date occurring in March 2025, the borrower is required to escrow $179,384 for the purpose of creating a reserve for (x) the funding of
THE INFORMATION IN THIS STRUCTURAL AND COLLATERAL TERM SHEET IS NOT COMPLETE AND MAY BE AMENDED PRIOR TO THE TIME OF SALE. THIS TERM SHEET IS NOT AN OFFER TO SELL THESE SECURITIES AND IT IS NOT A SOLICITATION OF AN OFFER TO BUY THESE SECURITIES IN ANY JURISDICTION WHERE THE OFFER OR SALE IS NOT PERMITTED. |
| | 126 | |
| Structural and Collateral Term Sheet | | BMO 2024-5C8 |
| No. 9 – 222 Delaware Avenue |
monies to replicate rents for leases that are subject to gap rent, free rent periods, rent abatements or rent reductions, and (y) to pay for outstanding approved leasing expenses.
Lockbox / Cash Management. The 222 Delaware Avenue Mortgage Loan is structured with a hard lockbox and springing cash management. The borrower was required to deliver tenant direction letters to the existing tenants at the 222 Delaware Avenue Property, directing them to remit their rent directly to the lender-controlled lockbox. The borrower is required to cause revenue received by the borrower or the property manager, as applicable, from the 222 Delaware Avenue Property to be deposited into such lockbox within two business days of receipt. During the continuance of a Trigger Period (as defined below), provided that no event of default is then continuing, all funds in the lockbox account are required to be swept each business day into the lender-controlled cash management account and applied and disbursed in accordance with the 222 Delaware Avenue Mortgage Loan documents.
A “Trigger Period” means a period commencing upon the earliest to occur of (i) an event of default under the 222 Delaware Avenue Mortgage Loan, (ii) the debt service coverage ratio being less than 1.25x (tested on a quarterly basis), (iii) if the property manager is an affiliate of the borrower or the guarantor, a bankruptcy action of the property manager or (iv) the occurrence of Lease Sweep Period (as defined below), and ending if, with respect to a Trigger Period continuing pursuant to (A) clause (i), the event of default commencing the Trigger Period has been cured or waived and such cure has been accepted by the lender or the lender has waived such event of default in writing, and no other event of default is then continuing, (B) clause (ii), the debt service coverage ratio is equal to or greater than 1.25x for two consecutive calendar quarters, (C) clause (iii), the property manager is replaced with a lender approved, non-affiliated, replacement property manager and (D) clause (iv), the occurrence of a Lease Sweep Period Cure Event (as defined below).
A “Lease Sweep Period” will commence on the first monthly payment date following the occurrence of any of the following: (a) with respect to each Lease Sweep Lease (as defined below), the earlier to occur of: (i) 12 months prior to the then-current expiration date (including any exercised renewal term(s)) of a Lease Sweep Lease; and (ii) upon the date required under a Lease Sweep Lease by which the tenant thereunder is required to give notice of its exercise of a renewal option thereunder (and such renewal has not been so exercised); (b) the date that a Lease Sweep Lease (or with respect to 50% or more of the applicable Lease Sweep Lease space at the 222 Delaware Avenue Property) is surrendered, cancelled or terminated or the receipt by the borrower or property manager of notice from any tenant under a Lease Sweep Lease of its intent to surrender, cancel or terminate the Lease Sweep Lease (or with respect to 50% or more of the applicable Lease Sweep Lease space at the 222 Delaware Avenue Property); (c) the date that any tenant under a Lease Sweep Lease (i) discontinues its business (i.e., “goes dark”) in 50% or more of its Lease Sweep Lease space at the 222 Delaware Avenue Property for more than 90 days, or (ii) gives notice that it intends to discontinue its business in 50% or more of its Lease Sweep Lease space at the 222 Delaware Avenue Property for more than 90 days; provided, however, that a Lease Sweep Period shall not be triggered pursuant to this clause (c) for so long as the Lease Sweep Business Discontinuance Conditions (as defined below) are met with respect to such Lease Sweep Lease; (d) upon a monetary or material non-monetary default under a Lease Sweep Lease by the tenant thereunder that continues beyond any applicable notice and cure period; or (e) the occurrence of an insolvency proceeding with respect to any Lease Sweep Lease tenant.
A “Lease Sweep Period Cure Event” will commence with respect to the applicable event giving rise to the Lease Sweep Period upon the first to occur of the following with respect to such event: (A) in the case of clauses (i)(a), (i)(b) and (i)(c) above, (i) either (x) the entirety of the Lease Sweep Lease space (or applicable portion thereof) is leased pursuant to one or more qualified leases, or (y) an amount of square footage not less than the amount of rentable square feet demised under the subject Lease Sweep Lease (or applicable portion thereof) (which space may consist of either (1) then-vacant space or (2) a combination of then-vacant space and a portion of the space demised under the subject Lease Sweep Lease), is leased pursuant to one or more accretive leases after the commencement of the subject Lease Sweep Period (it being acknowledged that a renewal of an existing lease at the 222 Delaware Avenue Property does not satisfy this clause (y)), and in either case of clause (x) or (y) above, in the lender’s reasonable judgment, sufficient funds have accumulated in the lease sweep reserve account to cover all reasonably anticipated approved leasing expenses set forth in all such qualified leases and/or accretive leases, as applicable, and any shortfalls in required payments hereunder or operating expenses as a result of any anticipated down time prior to the commencement of payments under such qualified leases and/or accretive leases, as applicable; (B) in the case of clause (i)(a) above, the date on which the subject tenant under the Lease Sweep Lease irrevocably exercises its renewal or extension option with respect to all of its Lease Sweep Lease space, and in Lender’s reasonable judgment, sufficient funds have accumulated in the lease sweep reserve account to cover all reasonably anticipated approved leasing expenses in connection with such renewal or extension; (C) in the case of clause (i)(c) above, the date on which the subject tenant has re-commenced operations at its Lease Sweep Lease space at the
THE INFORMATION IN THIS STRUCTURAL AND COLLATERAL TERM SHEET IS NOT COMPLETE AND MAY BE AMENDED PRIOR TO THE TIME OF SALE. THIS TERM SHEET IS NOT AN OFFER TO SELL THESE SECURITIES AND IT IS NOT A SOLICITATION OF AN OFFER TO BUY THESE SECURITIES IN ANY JURISDICTION WHERE THE OFFER OR SALE IS NOT PERMITTED. |
| | 127 | |
| Structural and Collateral Term Sheet | | BMO 2024-5C8 |
| No. 9 – 222 Delaware Avenue |
222 Delaware Avenue Property during normal business hours, in accordance with the terms of its Lease Sweep Lease, for a period of two consecutive months; (D) in the case of clause (i)(c)(ii) above, the date on which the subject tenant has irrevocably revoked or rescinded any such notice; (E) in the case of clause (i)(d) above, the date on which the subject monetary or material non-monetary default has been cured, and no other monetary or material non-monetary default under such Lease Sweep Lease occurs for a period of two consecutive months following such cure; (F) in the case of clause (i)(e) above, the applicable Lease Sweep Lease tenant insolvency proceeding has terminated and, unless such Lease Sweep Lease tenant insolvency proceeding is involuntary and it shall have terminated by reason of the discharge or dismissal thereof, the applicable Lease Sweep Lease, and each guaranty of the Lease Sweep Lease (if any), has been affirmed or assumed, without modification of such Lease Sweep Lease or any guaranty thereof; and (G) in the case of clauses (i)(a), (i)(b), (i)(c), (i)(d) and (i)(e) above, the date immediately following the occurrence of both (x) the debt service coverage ratio is at least 1.40x as reasonably determined by the lender and (y) the lease sweep reserve funds collected is equal to $55.00 per square foot of the applicable Lease Sweep Lease.
A “Lease Sweep Lease” means (i) the PNC lease, (ii) the Wilson Sonsini lease, or (iii) any replacement lease of either of the foregoing that, either individually, or when taken together with any other Lease with the same tenant or its affiliates, and assuming the exercise of all expansion rights and all preferential rights to lease additional space contained in such lease, which space is specifically identified in such lease (as opposed to a general right to lease additional space that becomes available in the 222 Delaware Avenue Property) covers 24,000 or more rentable square feet.
The “Lease Sweep Business Discontinuance Conditions” means the satisfaction of all of the following: (a) the applicable tenant under the Lease Sweep Lease is discontinuing its business in connection with the restoration of, or alterations to, the improvements (situated on the 222 Delaware Avenue Property) owned or leased by such tenant as a result of a casualty or planned alteration, which such restoration or alteration is anticipated to take in excess of 90 days, (b) such restoration or alterations, as applicable, are performed in accordance with the terms of the Lease Sweep Lease, (c) in the lender’s reasonable judgment, the applicable tenant has commenced and is diligently pursuing completion of such alterations or restoration, as applicable, (d) during the performance of the restoration, such Lease Sweep Lease remains in full force and effect and the tenant thereunder continues to pay full unabated contractual rent in accordance with the terms and provisions of the Lease Sweep Lease (or, to the extent that such tenant is discontinuing its business in connection with the restoration, lender is receiving the full amount of such tenant’s rent through the rental loss and/or business income interruption insurance required under the 222 Delaware Avenue Mortgage Loan documents, and (e) either such Lease Sweep Lease does not contain any termination right in connection with such casualty or the tenant thereunder has failed to timely exercise its termination right or has declined (in writing) to exercise such termination right, such that, in either case, such termination right is of no further force and effect.
Subordinate and Mezzanine Debt. None.
Permitted Future Subordinate or Mezzanine Debt. Not permitted.
Permitted Future Preferred Equity. Not permitted.
Partial Release. Not permitted.
Ground Lease. None.
THE INFORMATION IN THIS STRUCTURAL AND COLLATERAL TERM SHEET IS NOT COMPLETE AND MAY BE AMENDED PRIOR TO THE TIME OF SALE. THIS TERM SHEET IS NOT AN OFFER TO SELL THESE SECURITIES AND IT IS NOT A SOLICITATION OF AN OFFER TO BUY THESE SECURITIES IN ANY JURISDICTION WHERE THE OFFER OR SALE IS NOT PERMITTED. |
| | 128 | |
| Structural and Collateral Term Sheet | | BMO 2024-5C8 |
| No. 10 – The Wymore 360 |
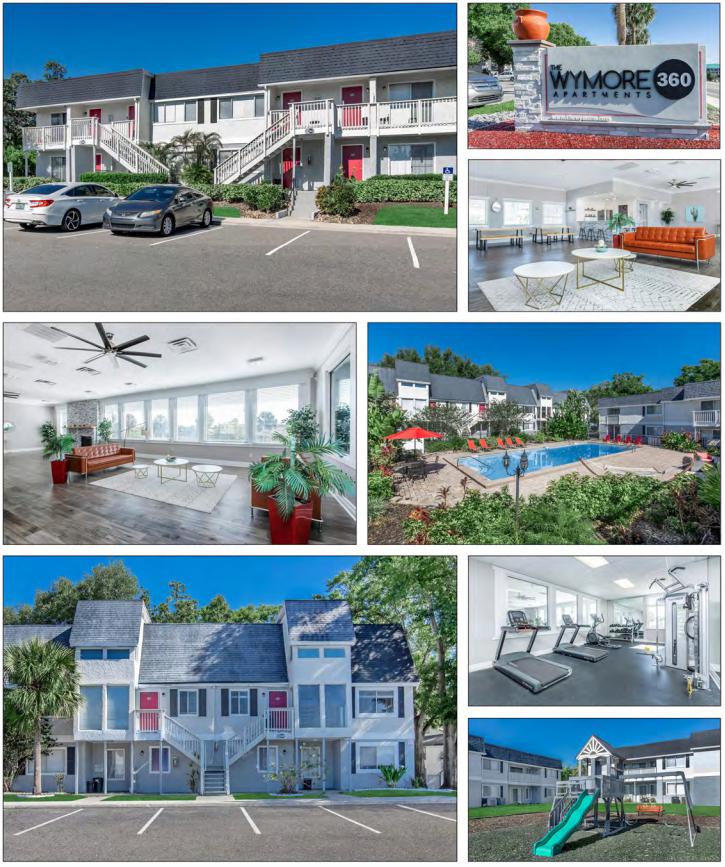
THE INFORMATION IN THIS STRUCTURAL AND COLLATERAL TERM SHEET IS NOT COMPLETE AND MAY BE AMENDED PRIOR TO THE TIME OF SALE. THIS TERM SHEET IS NOT AN OFFER TO SELL THESE SECURITIES AND IT IS NOT A SOLICITATION OF AN OFFER TO BUY THESE SECURITIES IN ANY JURISDICTION WHERE THE OFFER OR SALE IS NOT PERMITTED. |
| | 129 | |
| Structural and Collateral Term Sheet | | BMO 2024-5C8 |
| No. 10 – The Wymore 360 |
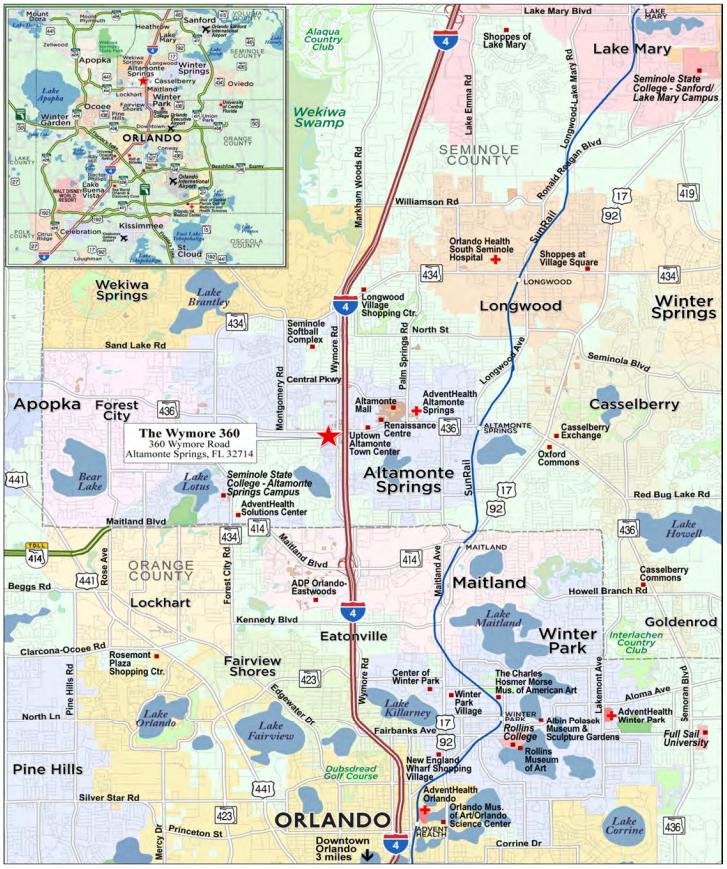
THE INFORMATION IN THIS STRUCTURAL AND COLLATERAL TERM SHEET IS NOT COMPLETE AND MAY BE AMENDED PRIOR TO THE TIME OF SALE. THIS TERM SHEET IS NOT AN OFFER TO SELL THESE SECURITIES AND IT IS NOT A SOLICITATION OF AN OFFER TO BUY THESE SECURITIES IN ANY JURISDICTION WHERE THE OFFER OR SALE IS NOT PERMITTED. |
| | 130 | |
| Structural and Collateral Term Sheet | | BMO 2024-5C8 |
| No. 10 – The Wymore 360 |
| Mortgage Loan Information | | Property Information |
| Mortgage Loan Seller: | GACC | | Single Asset / Portfolio: | Single Asset |
| Original Principal Balance: | $33,000,000 | | Title: | Fee |
| Cut-off Date Principal Balance: | $33,000,000 | | Property Type – Subtype: | Multifamily – Garden |
| % of IPB: | 3.3% | | Net Rentable Area (Units)(1): | 200 |
| Loan Purpose: | Refinance | | Location: | Altamonte Springs, FL |
| Borrower: | Wymore Property Owner, LLC | | Year Built / Renovated: | 1973 / 2024 |
| Borrower Sponsor: | Joseph G. Lubeck | | Occupancy: | 93.0% |
| Interest Rate: | 6.83900% | | Occupancy Date: | 10/1/2024 |
| Note Date: | 10/31/2024 | | 4th Most Recent NOI (As of): | $1,748,792 (12/31/2021) |
| Maturity Date: | 11/6/2029 | | 3rd Most Recent NOI (As of): | $1,672,735 (12/31/2022) |
| Interest-Only Period: | 60 months | | 2nd Most Recent NOI (As of): | $2,586,357 (12/31/2023) |
| Original Term: | 60 months | | Most Recent NOI (As of): | $2,967,454 (TTM 6/30/2024) |
| Original Amortization Term: | None | | UW Economic Occupancy: | 93.1% |
| Amortization Type: | Interest Only | | UW Revenues: | $4,188,207 |
| Call Protection: | L(25),D(30),O(5) | | UW Expenses: | $1,020,695 |
| Lockbox / Cash Management: | Soft / Springing | | UW NOI: | $3,167,511 |
| Additional Debt: | No | | UW NCF: | $3,117,511 |
| Additional Debt Balance: | NAP | | Appraised Value / Per Unit: | $46,500,000 / $232,500 |
| Additional Debt Type: | NAP | | Appraisal Date: | 5/10/2024 |
| Escrows and Reserves(2) | | Financial Information |
| | Initial | Monthly | Initial Cap | | Cut-off Date Loan / Unit: | $165,000 | |
| Taxes: | $280,783 | $23,399 | N/A | | Maturity Date Loan / Unit: | $165,000 | |
| Insurance: | $81,811 | $16,362 | N/A | | Cut-off Date LTV: | 71.0% | |
| Replacement Reserve: | $0 | $4,167 | N/A | | Maturity Date LTV: | 71.0% | |
| Immediate Repairs Reserve: | $196,428 | $0 | N/A | | UW NCF DSCR: | 1.36x | |
| | | | | | UW NOI Debt Yield: | 9.6% | |
| | | | | | | |
| Sources and Uses |
| Sources | Proceeds | % of Total | | Uses | Proceeds | % of Total |
| Mortgage Loan | $33,000,000 | 98.5% | | Loan Payoff | $31,964,879 | 95.5 | % |
| Equity Contribution | 487,155 | 1.5 | | Closing Costs | 963,254 | 2.9 | |
| | | | | Reserves | 559,022 | 1.7 | |
| | | | | | | |
| Total Sources | $33,487,155 | 100.0% | | Total Uses | $33,487,155 | 100.0 | % |
| (1) | The Wymore 360 Property (as defined below) consists of 200 multifamily units totaling 164,348 square feet. |
| (2) | See “Escrows and Reserves” below for further discussion of reserve information. |
The Loan. The tenth largest mortgage loan (“The Wymore 360 Mortgage Loan”) is secured by the borrower’s fee simple interest in a garden-style multifamily property located in Altamonte Springs, Florida (“The Wymore 360 Property”). The Wymore 360 Mortgage Loan was originated on October 31, 2024 by DBR Investments Co. Limited. The Wymore 360 Mortgage Loan has an outstanding principal balance as of the Cut-off Date of $33,000,000, has a five-year term, accrues interest at a rate of 6.83900% per annum on an Actual/360 basis and is interest only for the term of the loan. The scheduled maturity date of The Wymore 360 Mortgage Loan is November 6, 2029.
The Property. The Wymore 360 Property is a recently renovated garden-style multifamily property located in Altamonte Springs, Florida. The Wymore 360 Property consists of 27 buildings and the unit mix includes 8 studio units, 112 one-bedroom units, 41 two-bedroom units, and 39 three-bedroom units. Unit amenities include air-conditioners, dishwashers, garbage disposal, stainless steel appliances, carpet and vinyl flooring, walk-in closets, and patios/balconies. The Wymore 360 Property features a business center, club house, dog park, laundry facility, on-site maintenance, playground, two swimming pools, and guest parking. Parking is provided via 378 surface parking spaces resulting in a parking ratio of approximately 1.89 spaces per unit. As of the October 1, 2024 rent roll, The Wymore 360 Property was 93.0% occupied on a per unit basis.
THE INFORMATION IN THIS STRUCTURAL AND COLLATERAL TERM SHEET IS NOT COMPLETE AND MAY BE AMENDED PRIOR TO THE TIME OF SALE. THIS TERM SHEET IS NOT AN OFFER TO SELL THESE SECURITIES AND IT IS NOT A SOLICITATION OF AN OFFER TO BUY THESE SECURITIES IN ANY JURISDICTION WHERE THE OFFER OR SALE IS NOT PERMITTED. |
| | 131 | |
| Structural and Collateral Term Sheet | | BMO 2024-5C8 |
| No. 10 – The Wymore 360 |
The following table presents certain information with respect to the unit mix of The Wymore 360 Property:
The Wymore 360 Unit Mix(1) |
| Unit Type | No. of Units | % of Total | Occupied Units(2) | % of Units Occupied | Average Unit Size (SF)(1) | Avg. Monthly Rental Rate(2) | Monthly Rental Rate per SF |
| Studio | 8 | 4.0 | % | 8 | 100.0 | % | 495 | $1,339 | $2.71 |
| 1BR/1BA | 112 | 56.0 | | 103 | 92.0 | | 653 | $1,497 | $2.29 |
| 2BR/1BA | 20 | 10.0 | | 18 | 90.0 | | 858 | $1,737 | $2.02 |
| 2BR/2BA | 21 | 10.5 | | 20 | 95.2 | | 1,050 | $1,860 | $1.77 |
| 3BR/2BA | 31 | 15.5 | | 29 | 93.5 | | 1,150 | $2,055 | $1.79 |
| 3BR/1.5BA | 8 | 4.0 | | 8 | 100.0 | | 1,553 | $2,269 | $1.46 |
| Total/Wtd. Avg. | 200 | 100.0 | % | 186 | 93.0 | % | 822 | $1,673 | $2.03 |
| (1) | Based on the rent roll dated October 1, 2024. |
| (2) | Avg. Monthly Rental Rate is calculated using the in-place rent of the Occupied Units. |
Environmental. According to the Phase I environmental assessment dated June 5, 2024, there is no evidence of any recognized environmental conditions at The Wymore 360 Property.
Appraisal. According to the appraisal, The Wymore 360 Property had an “as-is” appraised value of $46,500,000 as of May 10, 2024.
| Appraisal Valuation Summary(1) |
| Appraisal Approach | Appraised Value | Capitalization Rate |
| Direct Capitalization Approach | $46,500,000 | 6.00% |
The following table presents certain information relating to the historical and current occupancy of The Wymore 360 Property:
| Historical and Current Occupancy(1) |
| 2021 | 2022 | 2023 | Current(2) |
| 93.0% | 93.0% | 93.0% | 93.0% |
| (1) | Historical occupancies are as of December 31 of each respective year. |
| (2) | Current Occupancy is as of October 1, 2024. |
The Market. The Wymore 360 Property is located in Altamonte Springs, Florida within Seminole County. The Wymore 360 Property’s neighborhood consists primarily of residential land uses. Primary access to the area is provided by Interstate-4, which is located 0.25 miles from The Wymore 360 Property. The nearest major commercial corridors to the subject are W State Road 436 and Wymore Road, which provide retail and entertainment services. According to the appraisal, development activity in the area has been moderate over the past three years.
According to the appraisal, The Wymore 360 Property is located within the Orlando multifamily market. As of the fourth quarter of 2023, the Orlando Multifamily Market contained 211,770 units, with a occupancy rate of 89.35%. As of the fourth quarter of 2023, the Orlando Multifamily Market reported an effective rent of $1,750 per unit, which is a 3.01% decline year over year. During the last quarter of 2023, there were 3,665 units completed and there was a negative net absorption of 1,470 units within the Orlando Multifamily Market. According to the appraisal, The Wymore 360 Property is located within the North Orlando multifamily submarket, the largest multifamily submarket within Orlando. As of the fourth quarter of 2023, the North Orlando multifamily submarket contained 37,846 units, with a occupancy rate of 89.7%. As of the fourth quarter of 2023, the North Orlando multifamily submarket reported an effective rent of $1,684 per unit. As of the last quarter of 2023, there were 572 units completed with a negative net absorption of 432 units within the North Orlando multifamily submarket.
THE INFORMATION IN THIS STRUCTURAL AND COLLATERAL TERM SHEET IS NOT COMPLETE AND MAY BE AMENDED PRIOR TO THE TIME OF SALE. THIS TERM SHEET IS NOT AN OFFER TO SELL THESE SECURITIES AND IT IS NOT A SOLICITATION OF AN OFFER TO BUY THESE SECURITIES IN ANY JURISDICTION WHERE THE OFFER OR SALE IS NOT PERMITTED. |
| | 132 | |
| Structural and Collateral Term Sheet | | BMO 2024-5C8 |
| No. 10 – The Wymore 360 |
The following table presents certain information relating to comparable multifamily rental properties to The Wymore 360 Property:
| Comparable Rental Summary(1) |
Property Name Location | Year Built / Renovated | Occupancy | # Units | Unit Mix | Rent Range per SF | Rent Range per Unit |
The Wymore 360 360 Wymore Road Altamonte Springs, FL(2) | 1973 / 2024 | 93.0%(2) | 200(2) | Studio, 1BR, 2BR, 3BR | $1.46 - $2.71(2) | $1,339 - $2,269(2) |
Promenade at Uptown 375 Palm Springs Dr Altamonte Springs, FL | 1972 / 2019 | 93.6% | 185 | Studio, 1BR, 2BR, 3BR | $1.50 - $2.64 | $1,261 - $1,898 |
ARIUM Springs Colony 264 Springs Colony Cir Altamonte Springs, FL | 1986 / 2022 | 94.0% | 188 | 1BR, 2BR, 3BR | $1.39 - $2.05 | $1,335 - $1,873 |
Arbors at Maitland Summit 8636 Villa Pt Orlando, FL | 1998 / 2022 | 92.0% | 663 | 1BR, 2BR, 3BR | $1.39 - $2.25 | $1,455 $2,248 |
The Preserve at Spring Lake 895 Wymore Road Altamonte Springs, FL | 1974 / 2022 | 96.9% | 320 | 1BR, 2BR, 3BR, 4BR | $1.32 - $1.67 | $1,200 - $2,450 |
Westmount at Winter Park 1701 Lee Road Winter Park, FL | 1971 / 2019 | 90.5% | 228 | Studio, 1BR, 2BR, 3BR | $1.64 - $3.67 | $1,499 - $1,997 |
| (2) | Based on the underwritten rent roll dated October 1, 2024. |
The following table presents certain information relating to the operating history and underwritten cash flow of The Wymore 360 Property:
| Operating History and Underwritten Net Cash Flow |
| | 2021 | 2022 | 2023 |
TTM(1) | Underwritten | Per Unit | %(2) |
| Gross Potential Rent | $2,612,976 | $3,090,720 | $3,535,906 | $3,734,901 | $4,008,241 | $20,041 | 100.0 | % |
| Vacancy | (102,872) | (372,060) | (412,849) | (181,898) | (274,993) | (1,375) | (6.9 | ) |
| Bad Debt | (43,136) | (184,044) | (23,605) | (19,583) | (20,041) | (100) | (0.5 | ) |
| Concessions | (36,144) | (16,088) | (27,092) | (8,999) | 0 | 0 | 0.0 | |
| Net Rental Income | $2,430,824 | $2,518,527 | $3,072,360 | $3,524,421 | $3,713,207 | $18,566 | 92.6 | % |
| Utility Reimbursement | 196,840 | 225,810 | 248,997 | 250,884 | 265,000 | 1,325 | 6.6 | |
| General Other Income | 210,422 | 105,478 | 206,883 | 179,182 | 210,000 | 1,050 | 5.2 | |
| Effective Gross Income | $2,838,087 | $2,849,815 | $3,528,239 | $3,954,487 | $4,188,207 | $20,941 | 104.5 | % |
| Total Expenses | $1,089,295 | $1,177,081 | $941,882 | $987,033 | $1,020,695 | $5,103 | 24.4 | % |
| Net Operating Income | $1,748,792 | $1,672,735 | $2,586,357 | $2,967,454 | $3,167,511 | $15,838 | 75.6 | % |
| Capital Reserve | 0 | 0 | 0 | 0 | 50,000 | 250 | 1.2 | |
| Net Cash Flow | $1,748,792 | $1,672,735 | $2,586,357 | $2,967,454 | $3,117,511 | $15,588 | 74.4 | % |
| (1) | TTM column represents the trailing 12 months ending June 2024. |
| (2) | % column represents percent of Gross Potential Rent for all revenue lines and represents percent of Effective Gross Income for the remainder of fields. |
THE INFORMATION IN THIS STRUCTURAL AND COLLATERAL TERM SHEET IS NOT COMPLETE AND MAY BE AMENDED PRIOR TO THE TIME OF SALE. THIS TERM SHEET IS NOT AN OFFER TO SELL THESE SECURITIES AND IT IS NOT A SOLICITATION OF AN OFFER TO BUY THESE SECURITIES IN ANY JURISDICTION WHERE THE OFFER OR SALE IS NOT PERMITTED. |
| | 133 | |
| Structural and Collateral Term Sheet | | BMO 2024-5C8 |
| No. 10 – The Wymore 360 |
The Borrower. The borrower is Wymore Property Owner, LLC, a Delaware limited liability company and single purpose entity with two independent directors in its organizational structure. Legal counsel to the borrower delivered a non-consolidation opinion in connection with the origination of The Wymore 360 Mortgage Loan.
The Borrower Sponsor. The borrower sponsor and the non-recourse carveout guarantor is Joseph G. Lubeck. Mr. Lubeck was the original founder of Landmark Apartment Trust, which sold its portfolio in 2015 for $1.9 billion. Mr. Lubeck and his partners returned to the private sector in 2015 to begin a new portfolio build under the American Landmark brand. Mr. Lubeck currently serves as the CEO of American Landmark.
Property Management. The Wymore 360 Mortgage Loan is managed by Vesteco Real Estate Management Services, LLC, a third party management company.
Escrows and Reserves. At origination, the borrower deposited (i) approximately $280,783 for real estate taxes, (ii) approximately $196,428 for immediate repairs and (iii) approximately $81,811 for insurance premiums.
Tax Escrows – On a monthly basis, the borrower is required to deposit 1/12th of an amount that would be sufficient to pay taxes for the next ensuing 12 months (initially, approximately $23,399).
Insurance Escrows – On a monthly basis, the borrower is required to deposit 1/12th of an amount that would be sufficient to pay insurance premiums for the renewal of coverages (initially, approximately $16,362); provided, such monthly deposits will be waived so long as the borrower maintains a blanket insurance policy acceptable to the lender. There was no blanket policy in place at origination.
Replacement Reserve – On a monthly basis, the borrower is required to deposit approximately $4,167 for replacement reserves.
Lockbox / Cash Management. The Wymore 360 Mortgage Loan is structured with a soft lockbox and springing cash management. For so long as no Trigger Period (as defined below) is continuing and has not otherwise been cured, all sums deposited into the clearing account will be transferred into the borrower’s operating account on a daily basis. Following a Trigger Period and so long as such Trigger Period is continuing and has not been cured, any transfers to the borrower’s operating account will cease and such sums on deposit in the clearing account will be transferred on a daily basis to an account controlled by the lender, at a financial institution selected by the lender, to be applied to payment of all monthly amounts due under The Wymore 360 Mortgage Loan documents (including, without limitation, taxes and insurance (unless The Wymore 360 Property is insured under a “blanket” policy acceptable to the lender), debt service and required reserves) and approved property operating expenses (including all approved budgeted property operating expenses) and approved capital expenditures, with any excess funds (the “Excess Funds”) being deposited.
A “Trigger Period” means a period commencing upon the occurrence of (i) an event of default under The Wymore 360 Mortgage Loan documents; (ii) a Low DSCR Period (as defined below) or (iii) if the property manager is an affiliate of the borrower or guarantor and such property manager is bankrupt or insolvent.
A “Low DSCR Period” will (I) commence if, from and after the monthly payment date occurring in December 2025, the debt service coverage ratio is less than 1.15x as of any calculation date, and (II) end if The Wymore 360 Property has achieved a Debt Service Coverage Ratio of at least 1.20x for two consecutive calculation dates, as determined by lender.
Subordinate and Mezzanine Debt. None.
Permitted Future Subordinate or Mezzanine Debt. Not permitted.
Partial Release. Not permitted.
Ground Lease. None.
THE INFORMATION IN THIS STRUCTURAL AND COLLATERAL TERM SHEET IS NOT COMPLETE AND MAY BE AMENDED PRIOR TO THE TIME OF SALE. THIS TERM SHEET IS NOT AN OFFER TO SELL THESE SECURITIES AND IT IS NOT A SOLICITATION OF AN OFFER TO BUY THESE SECURITIES IN ANY JURISDICTION WHERE THE OFFER OR SALE IS NOT PERMITTED. |
| | 134 | |
| Structural and Collateral Term Sheet | | BMO 2024-5C8 |
|
| No. 11 – Newport on the Levee |
| Mortgage Loan Information | | Property Information |
| Mortgage Loan Seller: | BMO | | Single Asset / Portfolio: | Single Asset |
| Original Principal Balance(1): | $30,000,000 | | Title: | Leasehold |
| Cut-off Date Principal Balance(1): | $30,000,000 | | Property Type – Subtype: | Mixed Use – Retail / Office |
| % of IPB: | 3.0% | | Net Rentable Area (SF): | 365,591 |
| Loan Purpose: | Refinance | | Location: | Newport, KY |
| Borrower: | NOTL Property Owner LLC | | Year Built / Renovated: | 2001 / 2021 |
| Borrower Sponsor: | NAP-JT Propco LLC | | Occupancy: | 80.8% |
| Interest Rate: | 8.40500% | | Occupancy Date: | 9/1/2024 |
| Note Date: | 11/21/2024 | | 4th Most Recent NOI (As of): | $1,679,342 (12/31/2021) |
| Maturity Date: | 12/1/2029 | | 3rd Most Recent NOI (As of): | $2,855,870 (12/31/2022) |
| Interest-only Period: | 0 months | | 2nd Most Recent NOI (As of): | $5,232,850 (12/31/2023) |
| Original Term: | 60 months | | Most Recent NOI (As of): | $5,678,250 (TTM 9/30/2024) |
| Original Amortization Term: | 360 months | | UW Economic Occupancy: | 87.6% |
| Amortization Type: | Amortizing Balloon | | UW Revenues: | $15,381,718 |
| Call Protection(2): | L(12),YM1(41),O(7) | | UW Expenses: | $8,394,178 |
| Lockbox / Cash Management: | Hard / In Place | | UW NOI: | $6,987,541 |
| Additional Debt(1)(3): | Yes | | UW NCF: | $6,464,994 |
| Additional Debt Balance(1)(3): | $12,000,000 | | Appraised Value / Per SF: | $105,300,000 / $288 |
| Additional Debt Type(1)(3): | Pari Passu | | Appraisal Date: | 9/10/2024 |
| | | | | |
| Escrows and Reserves | | Financial Information(1) |
| | Initial | Monthly | Initial Cap | | | Whole Loan |
| Taxes: | $0 | $114,288 | N/A | | Cut-off Date Loan / SF: | $115 |
| Insurance: | $0 | Springing | N/A | | Maturity Date Loan / SF: | $110 |
| Replacement Reserve: | $0 | $13,080 | N/A | | Cut-off Date LTV: | 39.9% |
| Rollover Reserve: | $0 | $30,466 | N/A | | Maturity Date LTV: | 38.3% |
| Deferred Maintenance: | $4,000 | $0 | N/A | | UW NCF DSCR: | 1.68x |
| Free Rent Reserve: | $39,943 | $0 | N/A | | UW NOI Debt Yield: | 16.6% |
| Outstanding TI/LC: | $656,704 | $0 | N/A | | | |
| Gap Rent Reserve: | $328,565 | $0 | N/A | | | |
| | | | | | | |
| Sources and Uses |
| Sources | Proceeds | % of Total | | Uses | Proceeds | % of Total |
| Whole Loan | $42,000,000 | 85.0 | % | | Loan Payoff | $45,256,895 | 91.6 | % |
| Borrower Sponsor Equity | 7,429,000 | 15.0 | | | Closing Costs | 3,142,894 | 6.4 | |
| | | | | Upfront Reserves | 1,029,212 | 2.1 | |
| Total Sources | $49,429,000 | 100.0 | % | | Total Uses | $49,429,000 | 100.0 | % |
| (1) | The Newport on the Levee Mortgage Loan (as defined below) is part of the Newport on the Levee Whole Loan (as defined below), which is comprised of two pari passu promissory notes with an aggregate original balance of $42,000,000. The Newport on the Levee Whole Loan was originated by Bank of Montreal (“BMO”). For additional information, see “The Loan” below. The information presented under “Financial Information” above is calculated based on the Newport on the Levee Whole Loan. |
| (2) | The lockout period will be at least 12 payment dates beginning with and including the first payment date on January 1, 2025. Voluntary prepayment with yield maintenance of the Newport on the Levee Whole Loan in full (but not in part) is permitted at any time following the earlier to occur of (i) May 21, 2026 or (ii) the date that is one year from the closing date of the securitization that includes the last pari passu note to be securitized. The assumed lockout period of 12 payments is based on the anticipated closing date of the BMO 2024-5C8 securitization trust closing date in December 2024. The actual lockout period may be longer. |
| (3) | The borrower is permitted to incur a future mezzanine loan subject to the satisfaction of the requirements set forth in the Newport on the Levee Whole Loan documents. See “Description of the Mortgage Pool—Permitted Mezzanine Debt” in the Preliminary Prospectus. |
THE INFORMATION IN THIS STRUCTURAL AND COLLATERAL TERM SHEET IS NOT COMPLETE AND MAY BE AMENDED PRIOR TO THE TIME OF SALE. THIS TERM SHEET IS NOT AN OFFER TO SELL THESE SECURITIES AND IT IS NOT A SOLICITATION OF AN OFFER TO BUY THESE SECURITIES IN ANY JURISDICTION WHERE THE OFFER OR SALE IS NOT PERMITTED. |
| | 135 | |
| Structural and Collateral Term Sheet | | BMO 2024-5C8 |
|
| No. 11 – Newport on the Levee |
The Loan. The eleventh largest mortgage loan (the “Newport on the Levee Mortgage Loan”) is part of a whole loan (the “Newport on the Levee Whole Loan”) evidenced by two pari passu promissory notes that is secured by the borrower’s leasehold interest in a 365,591 square foot mixed-use property located in Newport, Kentucky (the “Newport on the Levee Property”). The Newport on the Levee Mortgage Loan, which is evidenced by the controlling Note A-1, has an outstanding principal balance as of the Cut-off Date of $30,000,000. The Newport on the Levee Whole Loan was originated on November 21, 2024 by Bank of Montreal. The Newport on the Levee Whole Loan accrues interest at a fixed rate of 8.40500% per annum. The Newport on the Levee Whole Loan has a five-year term, and amortizes on a 30-year basis. The scheduled maturity date of the Newport on the Levee Whole Loan is December 1, 2029.
The Newport on the Levee Whole Loan will be serviced pursuant to the pooling and servicing agreement for the BMO 2024-5C8 trust securitization. The relationship between the holders of notes evidencing the Newport on the Levee Whole Loan is governed by a co-lender agreement as described under “Description of the Mortgage Pool—The Whole Loans—The Serviced Pari Passu Whole Loans” and “The Pooling and Servicing Agreement” in the Preliminary Prospectus.
The table below identifies the promissory notes that comprise the Newport on the Levee Whole Loan:
| Whole Loan Summary |
| Note | Original Balance | Cut-off Date Balance | | Note Holder | Controlling Piece |
| A-1 | $30,000,000 | $30,000,000 | | BMO 2024-5C8 | Yes |
| A-2(1) | $12,000,000 | $12,000,000 | | BMO | No |
| Whole Loan | $42,000,000 | $42,000,000 | | | |
| (1) | Expected to be contributed to one or more future securitization trust(s). |
The Property. The Newport on the Levee Property consists of a four-level shopping center and a non-collateral parking garage below. The Newport on the Levee Property totals 365,591 square feet across multiple buildings. There are 2,245 non-collateral parking spaces total leading to approximately 6.1 parking spaces per 1,000 square feet of net rentable area.
The following table presents certain information relating to the space types that comprise the Newport on the Levee Property:
| Property Summary(1) |
| Space Type | Total SF | % Total SF | Occupancy | UW Base Rent(2) | % of UW Base Rent(2) | | UW Base Rent PSF(2)(3) |
| Office | 78,484 | | 21.5 | % | 57.9% | $1,117,869 | 16.3% | | $24.60 |
| Retail | 278,855 | | 76.3 | | 86.6% | 5,701,500 | 83.2% | | $23.60 |
| Storage | 2,784 | | 0.8 | | 100.0% | 0 | 0.0% | | $0.00 |
| Other | 5,468 | | 1.5 | | 100.0% | 31,362 | 0.5% | | $5.74 |
| Total / Wtd. Avg. | 365,591 | | 100.0 | % | 80.8% | $6,850,731 | 100.0% | | $23.20 |
| (1) | Based on the underwritten rent roll dated September 1, 2024. |
| (2) | UW Base Rent, UW Base Rent PSF and % of UW Base Rent are inclusive of contractual rent steps through October 2025. |
| (3) | UW Base Rent PSF excludes vacant space and vacant underwritten base rent. |
Major Tenants. The three largest tenants by underwritten base rent at the Newport on the Levee Property are American Multi-Cinema, Inc. (“AMC Theaters”), Velocity Esports and Uber Freight US LLC.
AMC Theaters (84,479 square feet; 23.1% of Total NRA; 31.6% of underwritten base rent): AMC Theatres is an American movie theatre chain founded in 1920 and headquartered in Leawood, Kansas. The company went international in 2017 and is recognized as the largest theatrical exhibitor across the globe, with approximately 900 theatres and 10,000 screens worldwide. AMC Theatres offers premium cinematic experiences such as IMAX, Dolby Cinema, and Prime at AMC, as well as subscription programs and mobile apps. In 2023 AMC Theatres reported approximately $4.8 billion in revenue, higher than the $3.91 billion reported in 2022, but down from pre pandemic numbers. AMC Theatres’ lease at the Newport on the Levee Property commenced on October 12, 2001, and expires on November 30, 2032, and has three, five-year renewal options and no termination options.
THE INFORMATION IN THIS STRUCTURAL AND COLLATERAL TERM SHEET IS NOT COMPLETE AND MAY BE AMENDED PRIOR TO THE TIME OF SALE. THIS TERM SHEET IS NOT AN OFFER TO SELL THESE SECURITIES AND IT IS NOT A SOLICITATION OF AN OFFER TO BUY THESE SECURITIES IN ANY JURISDICTION WHERE THE OFFER OR SALE IS NOT PERMITTED. |
| | 136 | |
| Structural and Collateral Term Sheet | | BMO 2024-5C8 |
|
| No. 11 – Newport on the Levee |
Velocity Esports (49,805 square feet; 13.6% of Total NRA; 15.5% of underwritten base rent): Velocity Esports is an esports and arcade company founded in 2021 in Chicago, Illinois. Velocity Esports offers a selection of arcade games, esports lounges, bowling, social gaming, and esports tournaments. As of February 2024, Velocity Esports has two locations, with a third in Schaumburg, Illinois on the way. Since its inception Velocity Esports is currently in early-stage seed funding and has raised $9 million. Velocity Esport’s leases two spaces at the Newport on the Levee Property, commencing on April 1, 2022 and January 1, 2023, respectively, and expiring on December 31, 2032 and March 31, 2032, respectively, and has no renewal options remaining and no termination options.
Uber Freight US LLC (19,268 square feet; 5.3% of Total NRA; 8.1% of underwritten base rent): Uber Freight US LLC (“Uber Freight”) is a logistics and supply chain company helping to connect shippers and carriers. Uber Freight was originally launched by Uber in 2017 but was spun off into a separate business unit in 2018. Uber Freight provides advantages for both shipper and carriers though several services such as managed transportation services, logistics applications, carrier network & capacity planning, consulting solutions, and carrier solutions. In 2023, Uber Freight reported $5.24 billion in revenue making about 14% of Uber’s total revenue from Uber Freight. Uber Freight’s lease at the Newport on the Levee Property commenced on January 8, 2024, and is scheduled to expire on July 31, 2032 and has two, five-year renewal options and no termination options.
The following table presents certain information relating to the historical and current occupancy of the Newport on the Levee Property:
| Historical and Current Occupancy(1) |
| 2021 | 2022 | 2023 | Current(2) |
| 65.2% | 70.2% | 68.3% | 80.8% |
| (1) | Historical occupancies are as of December 31 of each respective year unless otherwise stated. |
| (2) | Current Occupancy is as of September 1, 2024. |
The following table presents certain information relating to the tenants at the Newport on the Levee Property:
| Tenant Summary(1) |
| Tenant | Tenant Type | Ratings
Moody’s/S&P/Fitch(2) | Net Rentable Area (SF) | % of
Total NRA | UW Base Rent PSF | UW Base Rent | % of Total
UW Base Rent | Lease
Expiration Date | Termination Option (Y/N)(3) | Renewal Option(3) |
| AMC Theaters | Retail | Caa2/CCC+/NR | 84,479 | 23.1 | % | $25.63 | $2,165,000 | 31.6 | % | 11/30/2032 | N | 3 x 5 Yr |
| Velocity Esports | Retail/Storage | NR/NR/NR | 49,805 | 13.6 | | $21.31 | 1,061,589 | 15.5 | | Various | N | None |
| Uber Freight US LLC | Office | Baa2/BBB-/BBB | 19,268 | 5.3 | | $28.70 | 552,992 | 8.1 | | 7/31/2032 | N | 2 x 5 Yr |
| Par 3 | Retail | NR/NR/NR | 17,188 | 4.7 | | $20.67 | 355,298 | 5.2 | | 12/1/2034 | N | None |
| Cigars International | Retail | NR/NR/NR | 7,891 | 2.2 | | $32.00 | 252,512 | 3.7 | | 3/31/2035 | Y(4) | None |
16 Lots Brewing
Company South LLC | Retail | NR/NR/NR | 7,756 | 2.1 | | $31.83 | 246,873 | 3.6 | | 3/31/2033 | N | None |
| Certified Flooring | Office | NR/NR/NR | 10,717 | 2.9 | | $19.00 | 203,623 | 3.0 | | 5/31/2031 | N | 2 x 3 Yr |
Bravo Brio
Restaurants, LLC | Retail | NR/NR/NR | 8,405 | 2.3 | | $21.46 | 180,371 | 2.6 | | 1/31/2028 | N | None |
| Shiner’s NOTL LLC | Retail | NR/NR/NR | 8,461 | 2.3 | | $20.00 | 169,220 | 2.5 | | 11/30/2032 | N | 1 x 5 Yr |
Immersive Group
Gaming NKY LLC | Retail | NR/NR/NR | 2,956 | 0.8 | | $50.00 | 147,800 | 2.2 | | 8/31/2033 | N | 2 x 5 Yr |
| Top 10 Tenants | | | 216,926 | 59.3 | % | $24.59 | $5,335,278 | 77.9 | % | | | |
| Remaining Occupied | | | 78,346 | 21.4 | % | $19.34 | 1,515,453 | 22.1 | % | | | |
| Total Occupied | | | 295,272 | 80.8 | % | $23.20 | $6,850,731 | 100.0 | % | | | |
| Vacant Space | | | 70,319 | 19.2 | % | | | | | | |
| Collateral Total | | | 365,591 | 100.0 | 0% | | | | | | |
| | | | | | | | | | | |
| (1) | Based on the underwritten rent roll dated September 1, 2024, with contractual rent steps through October 2025. |
| (2) | In certain instances, ratings provided are those of the parent company of the entity shown, whether or not the parent company guarantees the lease. |
| (3) | Certain tenants may have termination, contraction or renewal options (which may become exercisable prior to the originally stated expiration date of the tenant lease) with respect to certain tenants’ leased storage space that is not considered in the above Tenant Summary. |
| (4) | Cigars International has the right to terminate its lease until January 7, 2025; and also has the right to terminate its lease until May 7, 2025 to complete permitting. Rent commences at earlier of six months later or tenant opening for business. |
THE INFORMATION IN THIS STRUCTURAL AND COLLATERAL TERM SHEET IS NOT COMPLETE AND MAY BE AMENDED PRIOR TO THE TIME OF SALE. THIS TERM SHEET IS NOT AN OFFER TO SELL THESE SECURITIES AND IT IS NOT A SOLICITATION OF AN OFFER TO BUY THESE SECURITIES IN ANY JURISDICTION WHERE THE OFFER OR SALE IS NOT PERMITTED. |
| | 137 | |
| Structural and Collateral Term Sheet | | BMO 2024-5C8 |
|
| No. 11 – Newport on the Levee |
The following table presents certain information relating to the tenant lease expirations at the Newport on the Levee Property:
| Lease Rollover Schedule(1)(2)(3) |
| Year | Number of Leases Expiring | Net Rentable Area Expiring | % of NRA Expiring | UW Base Rent Expiring(4) | % of UW Base Rent Expiring(4) | Cumulative Net Rentable Area Expiring | Cumulative % of NRA Expiring | Cumulative UW Base Rent Expiring(4) | Cumulative % of UW Base Rent Expiring(4) |
| MTM(5) | 5 | 2,225 | | 0.6 | % | $0 | 0.0 | % | 2,225 | | 0.6% | | $0 | 0.0% | |
| 2024 | 1 | 2,058 | | 0.6 | | 0 | 0.0 | | 4,283 | | 1.2% | | $0 | 0.0% | |
| 2025 | 7 | 8,675 | | 2.4 | | 89,623 | 1.3 | | 12,958 | | 3.5% | | $89,623 | 1.3% | |
| 2026 | 7 | 10,662 | | 2.9 | | 240,931 | 3.5 | | 23,620 | | 6.5% | | $330,554 | 4.8% | |
| 2027 | 2 | 2,993 | | 0.8 | | 146,920 | 2.1 | | 26,613 | | 7.3% | | $477,474 | 7.0% | |
| 2028 | 4 | 15,510 | | 4.2 | | 387,612 | 5.7 | | 42,123 | | 11.5% | | $865,086 | 12.6% | |
| 2029 | 1 | 6,976 | | 1.9 | | 130,870 | 1.9 | | 49,099 | | 13.4% | | $995,956 | 14.5% | |
| 2030 | 2 | 10,224 | | 2.8 | | 107,150 | 1.6 | | 59,323 | | 16.2% | | $1,103,106 | 16.1% | |
| 2031 | 2 | 13,419 | | 3.7 | | 338,723 | 4.9 | | 72,742 | | 19.9% | | $1,441,829 | 21.0% | |
| 2032 | 7 | 164,992 | | 45.1 | | 4,017,318 | 58.6 | | 237,734 | | 65.0% | | $5,459,147 | 79.7% | |
| 2033 | 4 | 23,201 | | 6.3 | | 510,493 | 7.5 | | 260,935 | | 71.4% | | $5,969,640 | 87.1% | |
| 2034 | 4 | 26,446 | | 7.2 | | 628,579 | 9.2 | | 287,381 | | 78.6% | | $6,598,219 | 96.3% | |
| 2035 & Beyond | 1 | 7,891 | | 2.2 | | 252,512 | 3.7 | | 295,272 | | 80.8% | | $6,850,731 | 100.0% | |
| Vacant | NAP | 70,319 | | 19.2 | | NAP | NAP | | 365,591 | | 100.0% | | NAP | NAP | |
| Total / Wtd. Avg. | 47(6) | 365,591 | | 100.0 | % | $6,850,731 | 100.0 | % | | | | |
| (1) | Based on the underwritten rent roll dated September 1, 2024. |
| (2) | Lease Rollover Schedule is based on the lease expiration dates of all direct leases in place. Certain tenants have more than one lease. |
| (3) | Certain tenants may have termination or contraction options (which may become exercisable prior to the originally stated expiration date of the tenant lease) that are not considered in the above Lease Rollover Schedule. |
| (4) | UW Base Rent Expiring, % of UW Base Rent Expiring, Cumulative UW Base Rent Expiring and Cumulative % of UW Base Rent Expiring are inclusive of contractual rent steps underwritten through October 2025. |
| (5) | MTM includes leases that are considered management offices, and two storage spaces that are dependent on other tenant leases. |
| (6) | The number of expiring leases includes office, retail, storage and mixed-use tenants. |
THE INFORMATION IN THIS STRUCTURAL AND COLLATERAL TERM SHEET IS NOT COMPLETE AND MAY BE AMENDED PRIOR TO THE TIME OF SALE. THIS TERM SHEET IS NOT AN OFFER TO SELL THESE SECURITIES AND IT IS NOT A SOLICITATION OF AN OFFER TO BUY THESE SECURITIES IN ANY JURISDICTION WHERE THE OFFER OR SALE IS NOT PERMITTED. |
| | 138 | |
| Structural and Collateral Term Sheet | | BMO 2024-5C8 |
|
| No. 11 – Newport on the Levee |
The following table presents certain information relating to the operating history and underwritten net cash flow of the Newport on the Levee Property:
| Operating History and Underwritten Net Cash Flow(1) |
| | 2019 | 2020 | 2021 | 2022 | 2023 | TTM(2) | Underwritten | Per Square Foot | %(3) |
| Base Rent | $4,711,466 | $3,765,418 | $3,429,922 | $4,445,905 | $5,688,740 | $5,602,301 | $6,822,946 | $18.66 | 59.3 | % |
| Rent Steps | 0 | 0 | 0 | 0 | 0 | 0 | 27,786 | 0.08 | 0.2 | |
| Vacancy Lease-Up | 0 | 0 | 0 | 0 | 0 | 0 | 1,430,863 | 3.91 | 12.4 | |
| Total Base Rent | $4,711,466 | $3,765,418 | $3,429,922 | $4,445,905 | $5,688,740 | $5,602,301 | $8,281,594 | $22.65 | 71.9 | % |
| Total Reimbursements | 3,254,527 | 2,520,523 | 2,660,676 | 2,972,943 | 3,008,064 | 3,050,187 | 3,232,789 | 8.84 | 28.1 | |
| Gross Potential Rent | $7,965,992 | $6,285,940 | $6,090,597 | $7,418,848 | $8,696,804 | $8,652,488 | $11,514,383 | $31.50 | 100.0 | % |
| Other Income(4) | 3,592,277 | 1,706,478 | 3,341,530 | 3,537,691 | 4,542,046 | 5,317,849 | 5,298,198 | 14.49 | 46.0 | |
| (In-Place Vacancy) | 0 | 0 | 0 | 0 | 0 | 0 | (1,430,863) | (3.91) | (12.4 | ) |
| Effective Gross Income | $11,558,270 | $7,992,418 | $9,432,127 | $10,956,538 | $13,238,850 | $13,970,337 | $15,381,718 | $42.07 | 133.6 | % |
| Total Expenses(5) | 7,780,841 | 6,432,283 | 7,752,786 | 8,100,668 | 8,006,000 | 8,292,086 | 8,394,178 | 22.96 | 54.6 | |
| Net Operating Income | $3,777,428 | $1,560,134 | $1,679,342 | $2,855,870 | $5,232,850 | $5,678,250 | $6,987,541 | $19.11 | 45.4 | % |
| Capital Expenditures | 0 | 0 | 0 | 0 | 0 | 0 | 156,956 | 0.43 | 1.0 | |
| TI/LC | | | | | | | 365,591 | 1.00 | 2.4 | |
| Net Cash Flow | $3,777,428 | $1,560,134 | $1,679,342 | $2,855,870 | $5,232,850 | $5,678,250 | $6,464,994 | $17.68 | 42.0 | % |
| (1) | Based on the underwritten rent roll dated September 1, 2024, with contractual rent steps through October 2025. |
| (2) | TTM represents the trailing 12-month period ending September 30, 2024. |
| (3) | % column represents percent of Gross Potential Rent for revenue lines and percent of Effective Gross Income for all remaining fields. |
| (4) | Other Income is based on the borrower’s 2024 budget and is comprised of percentage rent, parking, ground leases and income from the Kentucky Tourism Development Finance Authority. |
| (5) | Total Expenses includes management fees, real estate taxes, insurance, common area maintenance, repairs and maintenance, utilities, payroll, general and administrative, security, parking expenses and marketing expenses. |
Environmental. According to the Phase I environmental assessment dated September 19, 2024, there was no evidence of any recognized environmental conditions at the Newport on the Levee Property.
Appraisal. According to the appraisal, the Newport on the Levee Property had an “as-is” appraised value of $105,300,000 as of September 10, 2024. The table below shows the appraisal’s “as-is” conclusions.
| Appraisal Valuation Summary(1) |
| Appraisal Approach | Appraised Value | Capitalization Rate |
| Direct Capitalization Approach | $105,300,000 | 9.00% |
The Market. The Newport on the Levee Property is located in Newport, Kentucky. According to the appraisal, the Cincinnati, OH-KY-IN metropolitan statistical area (“Cincinnati MSA”) has an estimated 2024 population of 2,279,612 which is an average annual 0.3% increase over the 2020 census. Additionally, the estimated employment in the Cincinnati MSA as of July 2024 was 1,123,053 jobs. According to the appraisal, the 2024 total population within the market area, a three- and five-mile radius of the Newport on the Levee Property is 9,524, 135,524 and 274,047, respectively, and the 2024 median household income within the same parameters is $47,532, $54,520 and $54,978, respectively.
According to the appraisal, the Newport on the Levee Property is located in the Covington/Newport office submarket. According to the appraisal, as of the second quarter of 2024, the Covington/Newport office submarket had an inventory of approximately 4.4 million square feet with a 5.7% vacancy rate. The average rent is $22.05 per square foot, which is approximately 19.0% greater than the Cincinnati office market average of $18.53 per square foot.
According to the appraisal, the Newport on the Levee Property is also located in the Covington/Newport retail submarket. As of the second quarter of 2024, the Covington/Newport retail submarket had 3,630,538 square feet, and had an asking rent of $19.91 per square foot, which is approximately 53.6% greater than the Cincinnati retail market average of $12.96 per square foot. The Covington/Newport retail submarket also holds a vacancy rate of 2.0%.
THE INFORMATION IN THIS STRUCTURAL AND COLLATERAL TERM SHEET IS NOT COMPLETE AND MAY BE AMENDED PRIOR TO THE TIME OF SALE. THIS TERM SHEET IS NOT AN OFFER TO SELL THESE SECURITIES AND IT IS NOT A SOLICITATION OF AN OFFER TO BUY THESE SECURITIES IN ANY JURISDICTION WHERE THE OFFER OR SALE IS NOT PERMITTED. |
| | 139 | |
| Structural and Collateral Term Sheet | | BMO 2024-5C8 |
|
| No. 11 – Newport on the Levee |
The following table presents certain information relating to comparable retail leases for the Newport on the Levee Property:
| Comparable Retail Rental Summary(1) |
| Property Name / Location | Year Built / Renovated | Gross Building Area (SF) | Tenant Size (SF) | Tenant Name | Base Rent PSF | Commencement | Lease Term (Months) |
| Newport on the Levee | 2001 / 2021 | 365,591(2) | 7,756(2) | 16 Lots Brewing Company LLC | $31.83(2) | Apr-23(2) | 120(2) |
| Newport, KY |
| Crestview Hills Town Center | 2005 / NAP | 500,000 | NAV | Dillard’s | NAV | NAV | NAV |
| Crestview Hills, KY |
| The Banks – Phases I & II | 2011-2017 /
NAP | 98,000 | NAV | Ruth’s Chris | NAV | NAV | NAV |
| Cincinnati, OH |
| Deerfield Towne Center | 2004 / NAP | 475,000 | NAV | Whole Foods | NAV | NAV | NAV |
| Deerfield Township, OH |
| Voice of America Center | 2003 / NAP | 315,000 | NAV | Fresh Market | NAV | NAV | NAV |
| West Chester, OH |
| (1) | Information obtained from the appraisal unless otherwise indicated. |
| (2) | Based on the underwritten rent roll dated September 1, 2024, with contractual rent steps through October 2025. |
The following table presents certain information relating to comparable office leases for the Newport on the Levee Property:
| Comparable Office Rental Summary(1) |
| Property Name / Location | Year Built / Renovated | Gross Building Area (SF) | Tenant Size (SF) | Tenant Name | Base Rent PSF | Commencement | Lease Term (Months) |
| Newport on the Levee | 2001 / 2021 | 365,591(2) | 19,268(2) | Uber Freight US LLC | $28.70(2) | Jan-24(2) | 102(2) |
| Newport, KY |
| Riverfront Place | 1989 / NAP | 181,379 | NAV | NAV | $14.25 | NAV | NAV |
| Newport, KY |
| RiverCenter I & II | 1990 / 1998 | 470,000 | NAV | NAV | $23.00 | NAV | NAV |
| Covington, KY |
| Ovation | 2022 / NAP | 100,000 | NAV | NAV | $22.00 | NAV | NAV |
| Newport, KY |
| Two Rivers | 1939 / 2022 | 58,730 | NAV | NAV | $22.00 | NAV | NAV |
| Covington, KY |
| (1) | Information obtained from the appraisal unless otherwise indicated. |
| (2) | Based on the underwritten rent roll dated September 1, 2024, with contractual rent steps through October 2025. |
THE INFORMATION IN THIS STRUCTURAL AND COLLATERAL TERM SHEET IS NOT COMPLETE AND MAY BE AMENDED PRIOR TO THE TIME OF SALE. THIS TERM SHEET IS NOT AN OFFER TO SELL THESE SECURITIES AND IT IS NOT A SOLICITATION OF AN OFFER TO BUY THESE SECURITIES IN ANY JURISDICTION WHERE THE OFFER OR SALE IS NOT PERMITTED. |
| | 140 | |
| Structural and Collateral Term Sheet | | BMO 2024-5C8 |
| No. 12 – Maimonides Medical Center |
| Mortgage Loan Information | | Property Information |
| Mortgage Loan Seller: | SMC | | Single Asset / Portfolio: | Single Asset |
| Original Principal Balance: | $29,000,000 | | Title: | Fee |
| Cut-off Date Principal Balance: | $29,000,000 | | Property Type - Subtype: | Office – CBD |
| % of Pool by IPB: | 2.9% | | Net Rentable Area (SF): | 54,200 |
| Loan Purpose: | Refinance | | Location: | Brooklyn, NY |
| Borrower: | FT 5402 LLC | | Year Built / Renovated: | 2024 / NAP |
| Borrower Sponsors: | Aaron Katz, Schmiley Schick and Menachem Markovics | | Occupancy(3): | 100.0% |
| Interest Rate: | 6.91500% | | Occupancy Date(3): | 12/6/2024 |
| Note Date: | 11/19/2024 | | 4th Most Recent NOI (As of)(4): | NAV |
| Maturity Date: | 12/6/2029 | | 3rd Most Recent NOI (As of)(4): | NAV |
| Interest-only Period: | 60 months | | 2nd Most Recent NOI (As of)(4): | NAV |
| Original Term: | 60 months | | Most Recent NOI (As of)(4): | NAV |
| Original Amortization: | None | | UW Economic Occupancy: | 97.0% |
| Amortization Type: | Interest Only | | UW Revenues: | $3,000,009 |
| Call Protection: | L(24),D(32),O(4) | | UW Expenses: | $102,668 |
| Lockbox / Cash Management: | Hard / In Place | | UW NOI: | $2,897,340 |
| Additional Debt: | No | | UW NCF: | $2,892,879 |
| Additional Debt Balance: | N/A | | Appraised Value / Per SF: | $45,500,000 / $839 |
| Additional Debt Type: | N/A | | Appraisal Date: | 7/1/2024 |
| | | | | |
| Escrows and Reserves | | Financial Information |
| | Initial | Monthly | Initial Cap | | Cut-off Date Loan / SF: | $535 |
| Taxes(1): | $37,655 | Springing | N/A | | Maturity Date Loan / SF: | $535 |
| Insurance: | $10,667 | $3,556 | N/A | | Cut-off Date LTV: | 63.7% |
| Replacement Reserves: | $0 | $372 | N/A | | Maturity Date LTV: | 63.7% |
| Environmental Reserve: | $17,188 | $0 | N/A | | UW NCF DSCR: | 1.42x |
| Other Reserve(2): | $1,502,996 | $0 | N/A | | UW NOI Debt Yield: | 10.0% |
| | | | | | | |
| Sources and Uses |
| Sources | Proceeds | % of Total | | Uses | Proceeds | % of Total |
| Mortgage Loan | $29,000,000 | 100.0% | | Loan Payoff | $15,554,250 | 53.6 | % |
| | | | | Return of Equity | 10,691,999 | 36.9 | |
| | | | | Upfront Reserves | 1,568,506 | 5.4 | |
| | | | | Closing Costs(5) | 1,185,245 | 4.1 | |
| Total Sources | $29,000,000 | 100.0% | | Total Uses | $29,000,000 | 100.0 | % |
| (1) | The lender will not require the borrower to make monthly deposits for taxes, provided that, among other conditions, (i) no event of default und the Maimonides Medical Center Mortgage Loan (as defined below) then exists and (ii) the sole tenant is paying such taxes. |
| (2) | The Other Reserve includes (i) $1,252,996 for five months of free rent owed to the sole tenant Maimonides Medical Center (“Maimonides”) and (ii) $250,000 which equates to 125% of the remaining landlord work owed under the Maimonides lease. |
| (3) | The Maimonides Medical Center Property (as defined below) is 100% leased to Maimonides. Maimonides entered into a 30-year triple-net lease with the borrower sponsor in May 2024 and accepted its space in October 2024, such date being its lease commencement date. According to the borrower sponsor, Maimonides is expected to move into the Maimonides Medical Center Property in December 2024. |
| (4) | The Maimonides Medical Center Property was built in 2024. Historical NOI is not available. |
| (5) | Closing Costs include an interest rate buy-down credit of $290,000. |
The Loan. The twelfth largest mortgage loan (the “Maimonides Medical Center Mortgage Loan”) has an outstanding principal balance as of the Cut-off Date of $29,000,000 and is secured by a first mortgage lien on the borrower’s fee interest in a single-tenant office property containing 54,200 square feet located in Brooklyn, New York (the “Maimonides Medical Center Property”). The Maimonides Medical Center Mortgage Loan was originated on November 19, 2024 by SMC. The Maimonides Medical Center Mortgage Loan has a five-year interest-only term accruing interest at a rate of 6.91500% per annum on an Actual/360 basis. The scheduled maturity date of the Maimonides Medical Center Mortgage Loan is December 6, 2029.
THE INFORMATION IN THIS STRUCTURAL AND COLLATERAL TERM SHEET IS NOT COMPLETE AND MAY BE AMENDED PRIOR TO THE TIME OF SALE. THIS TERM SHEET IS NOT AN OFFER TO SELL THESE SECURITIES AND IT IS NOT A SOLICITATION OF AN OFFER TO BUY THESE SECURITIES IN ANY JURISDICTION WHERE THE OFFER OR SALE IS NOT PERMITTED. |
| | 141 | |
| Structural and Collateral Term Sheet | | BMO 2024-5C8 |
| No. 12 – Maimonides Medical Center |
The Property. The Maimonides Medical Center Property is located at 5402 Fort Hamilton Parkway in the Borough Park neighborhood of Brooklyn, New York. The Maimonides Medical Center Property was recently completed in 2024 and delivered to the tenant Maimonides. The 54,200 square foot Maimonides Medical Center Property is 100% leased to Maimonides on a triple-net basis. The borrower sponsors acquired the Maimonides Medical Center Property site as a vacant lot in 2021 for approximately $6,500,000. Following the acquisition, the borrower sponsors developed the Maimonides Medical Center Property into a seven-story office building at a further cost of approximately $21,800,000. Inclusive of closing costs incurred in conjunction with the origination of the Maimonides Medical Center Mortgage Loan, the borrower sponsors’ total cost basis is approximately $30,245,000.
The Maimonides Medical Center Property consists of a seven-story office building totaling 54,200 square feet of NRA, plus 9,893 square feet of below grade space, which includes a 24-space parking garage. The Maimonides Medical Center Property is located approximately five blocks from Maimonides’ main hospital complex. The Maimonides Medical Center Property is expected to be utilized to relocate Maimonides executives from various locations in the area to one central location, as well as provide training facilities for hospital staff. The Maimonides Medical Center Property will also include a hospital owned pharmacy (affiliate sublease) and a third-party Starbucks (sublease). The landlord work required under the lease is substantially completed, the lease has commenced and Maimonides is anticipated to move into the Maimonides Medical Center Property by mid-December 2024. Additionally, 125% of outstanding landlord work was reserved for at origination of the Maimonides Medical Center Mortgage Loan.
Sole Tenant.
Maimonides (54,200 square feet; 100.0% of NRA; 100.0% of Underwritten Base Rent): Maimonides is Brooklyn’s largest healthcare system, with approximately 1,800 physicians serving over 320,000 patients each year through the system’s three hospitals and more than 80 community-based practices and outpatient centers. The system is anchored by Maimonides Medical Center Hospital, which is located approximately five blocks north of the Maimonides Medical Center Property. Additional facilities include Maimonides Midwood Community Hospital, a 130-bed acute care hospital in the Midwood and Madison Park section of Brooklyn; Maimonides Children’s Hospital, the only dedicated children’s hospital in Brooklyn, and the Bay Ridge Emergency Department, which serves the Bay Ridge, Dyker Heights and Bensonhurst neighborhoods of Brooklyn. Maimonides recently accepted its space and has a 30-year initial term expiring in October 2054. Maimonides has a triple-net lease with 2% annual rent escalations. Maimonides has rent abatement periods between November 15, 2024 and January 15, 2025, and October 15, 2025 and January 15, 2026. At origination, the borrower deposited $1,252,996 for rent concessions. Maimonides has no renewal or termination options.
The following table presents certain information relating to the sole commercial tenant at the Maimonides Medical Center Property:
| Tenant Summary(1) |
| Tenant | Ratings
Moody’s/S&P/Fitch | Net Rentable Area (SF) | % of
Total NRA | UW Base Rent PSF | UW Base Rent | % of Total
UW Base Rent | Lease
Exp. Date |
| Maimonides(2) | NR / AA+ / NR | 54,200 | 100.0% | $57.06 | $3,092,792 | 100.0% | 10/30/2054 |
| Occupied Collateral Total / Wtd. Avg. | | 54,200 | 100.0% | $57.06 | $3,092,792 | 100.0% | |
| | | | | | | | |
| Vacant Space | | 0 | 0.0% | | | | |
| | | | | | | | |
| Collateral Total | | 54,200 | 100.0% | | | | |
| | | | | | | | |
| (1) | Based on the underwritten rent roll dated December 6, 2024 with straight-lined rent underwritten through the Maimonides Medical Center Mortgage Loan term totaling $121,262. |
| (2) | Maimonides has accepted its space and is required to commence paying rent following a rent abatement period that ends in January 2025. Maimonides has another rent abatement period between October 2025 and January 2026. At origination, the borrower deposited with the lender $1,252,996 in connection with the rent abatement periods. |
THE INFORMATION IN THIS STRUCTURAL AND COLLATERAL TERM SHEET IS NOT COMPLETE AND MAY BE AMENDED PRIOR TO THE TIME OF SALE. THIS TERM SHEET IS NOT AN OFFER TO SELL THESE SECURITIES AND IT IS NOT A SOLICITATION OF AN OFFER TO BUY THESE SECURITIES IN ANY JURISDICTION WHERE THE OFFER OR SALE IS NOT PERMITTED. |
| | 142 | |
| Structural and Collateral Term Sheet | | BMO 2024-5C8 |
| No. 12 – Maimonides Medical Center |
The following table presents certain information relating to the lease rollover schedule at the Maimonides Medical Center Property:
| Lease Rollover Schedule(1) |
| Year | Number of Leases Expiring | Net Rentable Area Expiring | % of NRA Expiring | UW Base Rent Expiring | % of UW Base Rent Expiring | Cumulative Net Rentable Area Expiring | Cumulative % of NRA Expiring | Cumulative UW Base Rent Expiring | Cumulative % of UW Base Rent Expiring |
| Vacant | NAP | 0 | 0.0 | % | NAP | NA | P | 0 | 0.0% | NAP | NAP |
| 2024 & MTM | 0 | 0 | 0.0 | | $0 | 0.0 | % | 0 | 0.0% | $0 | 0.0% |
| 2025 | 0 | 0 | 0.0 | | 0 | 0.0 | | 0 | 0.0% | $0 | 0.0% |
| 2026 | 0 | 0 | 0.0 | | 0 | 0.0 | | 0 | 0.0% | $0 | 0.0% |
| 2027 | 0 | 0 | 0.0 | | 0 | 0.0 | | 0 | 0.0% | $0 | 0.0% |
| 2028 | 0 | 0 | 0.0 | | 0 | 0.0 | | 0 | 0.0% | $0 | 0.0% |
| 2029 | 0 | 0 | 0.0 | | 0 | 0.0 | | 0 | 0.0% | $0 | 0.0% |
| 2030 | 0 | 0 | 0.0 | | 0 | 0.0 | | 0 | 0.0% | $0 | 0.0% |
| 2031 | 0 | 0 | 0.0 | | 0 | 0.0 | | 0 | 0.0% | $0 | 0.0% |
| 2032 | 0 | 0 | 0.0 | | 0 | 0.0 | | 0 | 0.0% | $0 | 0.0% |
| 2033 | 0 | 0 | 0.0 | | 0 | 0.0 | | 0 | 0.0% | $0 | 0.0% |
| 2034 | 0 | 0 | 0.0 | | 0 | 0.0 | | 0 | 0.0% | $0 | 0.0% |
| 2035 & Beyond | 1 | 54,200 | 100.0 | | 3,092,792 | 100.0 | | 54,200 | 100.0% | $3,092,792 | 100.0% |
| Total | 1 | 54,200 | 100.0 | % | $3,092,792 | 100.0 | % | | | | |
| (1) | Based on the underwritten rent roll dated December 6, 2024 with straight-lined rent underwritten through the Maimonides Medical Center Mortgage Loan term totaling $121,262. |
The following table presents certain information with respect to the historical and current occupancy of the Maimonides Medical Center Property:
| Historical and Current Occupancy(1) |
| 2021 | 2022 | 2023 | Current(2) |
| NAV | NAV | NAV | 100.0% |
| (1) | Historical occupancy is not available as the Maimonides Medical Center Property was built in 2024. |
| (2) | Current Occupancy is as of December 6, 2024. Maimonides has accepted its space and is expected to take occupancy of its space in December 2024. |
Environmental. According to a Phase I environmental assessment dated September 13, 2024 (the “ESA”), there was no evidence of any recognized environmental conditions at the Maimonides Medical Center Property. The ESA identified a CREC related to prior operations of a gas station and automotive repair service on the site of the Maimonides Medical Center Property. See “Descriptions of the Mortgage Pool – Environmental Considerations" in the Preliminary Prospectus.
The Market. The Maimonides Medical Center Property is located in Brooklyn, New York. According to the appraisal, the Maimonides Medical Center Property is located within the South Brooklyn medical office submarket. As of the first quarter of 2024, the South Brooklyn medical office submarket had a vacancy rate of 7.4% and market rent of $37.45 per square foot. The appraisal determined a market rent of $55.00 per square foot for the Maimonides Medical Center Property. Within a one-, three- and five-mile radius of the Maimonides Medical Center Property, the estimated 2024 population is 214,694, 947,330 and 2,053,619, respectively. Within the same radii, the estimated 2024 average annual household income is $86,285, $117,470 and $124,618, respectively.
THE INFORMATION IN THIS STRUCTURAL AND COLLATERAL TERM SHEET IS NOT COMPLETE AND MAY BE AMENDED PRIOR TO THE TIME OF SALE. THIS TERM SHEET IS NOT AN OFFER TO SELL THESE SECURITIES AND IT IS NOT A SOLICITATION OF AN OFFER TO BUY THESE SECURITIES IN ANY JURISDICTION WHERE THE OFFER OR SALE IS NOT PERMITTED. |
| | 143 | |
| Structural and Collateral Term Sheet | | BMO 2024-5C8 |
| No. 12 – Maimonides Medical Center |
The following table presents office rental data for comparable office property leases with respect to the Maimonides Medical Center Property as identified in the appraisal:
| Comparable Office Rental Summary(1) |
| Property Name/Location | Year Built / Renovated | Occ. | Size (SF) | Tenant | Suite Size (SF) | Rent PSF | Commencement | Lease Term (Mos.) | Lease Type |
Maimonides Medical Center Brooklyn, NY | 2024 / NAP | 100.0% | 54,200 | Maimonides | 54,200 | $57.06 | Oct-2024 | 360 | NNN |
15 Parkville Avenue Brooklyn, NY | 2025 / NAP | NAV | 74,307 | Premium Health | 20,905 | $50.21 | Jul-2025 | 180 | NNN |
5115 15th Avenue Brooklyn, NY | 2025 / NAP | NAV | 29,165 | Ezra Medical Center | 29,165 | $58.00 | Jan-2025 | 360 | NNN |
1934 Shore Parkway Brooklyn, NY | 2024 / NAP | NAV | 19,252 | Confidential | 5,970 | $45.23 | Oct-2023 | 120 | NNN |
5521 8th Avenue Brooklyn, NY | 2020 / NAP | NAV | 40,386 | Caipa MSO Welbe Health NYC | 13,818 14,814 | $48.75 $49.00 | Oct-2021 Jun-2022 | 60 180 | Net Net |
| (1) | Source: Appraisal, except for the Maimonides Medical Center Property, which information is based on the underwritten rent roll dated December 6, 2024. |
The following table presents certain information with respect to the underwritten cash flow of the Maimonides Medical Center Property:
| Underwritten Net Cash Flow(1) |
| | Underwritten | PSF | %(2) |
| Base Rent | $2,971,530 | $54.83 | 96.1 | % |
| Straight-Line Rent | 121,262 | 2.24 | 3.9 | |
| Net Rental Income | $3,092,792 | $57.06 | 100.0 | % |
| (Vacancy/Credit Loss) | (92,784) | (1.71) | (3.0 | ) |
| Effective Gross Income | $3,000,009 | $55.35 | 97.0 | % |
| | | | |
| Total Expenses | $102,668 | $1.89 | 3.4 | % |
| | | | |
| Net Operating Income | $2,897,340 | $53.46 | 96.6 | % |
| | | | |
| Replacement Reserves | 4,461 | 0.08 | 0.1 | |
| Net Cash Flow | $2,892,879 | $53.37 | 96.4 | % |
| (1) | The Maimonides Medical Center Property was completed in 2024 and historical financial information is not available. |
| (2) | % column represents percentage of Net Rental Income for all revenue lines and represents percentage of Effective Gross Income for the remaining fields. |
THE INFORMATION IN THIS STRUCTURAL AND COLLATERAL TERM SHEET IS NOT COMPLETE AND MAY BE AMENDED PRIOR TO THE TIME OF SALE. THIS TERM SHEET IS NOT AN OFFER TO SELL THESE SECURITIES AND IT IS NOT A SOLICITATION OF AN OFFER TO BUY THESE SECURITIES IN ANY JURISDICTION WHERE THE OFFER OR SALE IS NOT PERMITTED. |
| | 144 | |
| Structural and Collateral Term Sheet | | BMO 2024-5C8 |
| No. 13 – The Meurice |
| Mortgage Loan Information | | Property Information |
| Mortgage Loan Seller: | SGFC | | Single Asset / Portfolio: | Single Asset |
| Original Principal Balance: | $27,000,000 | | Title: | Fee |
| Cut-off Date Principal Balance: | $27,000,000 | | Property Type – Subtype: | Multifamily – High Rise |
| % of IPB: | 2.7% | | Net Rentable Area (Units)(2): | 115 |
| Loan Purpose: | Refinance | | Location: | New York, NY |
| Borrower: | Meurice Equity Partners, LLC | | Year Built / Renovated: | 1928 / 2021-2023 |
| Borrower Sponsor: | Andrew Moses | | Occupancy: | 98.3% |
| Interest Rate: | 6.42700% | | Occupancy Date: | 10/29/2024 |
| Note Date: | 11/19/2024 | | 4th Most Recent NOI (As of): | NAV |
| Maturity Date: | 12/1/2029 | | 3rd Most Recent NOI (As of): | $1,646,905 (12/31/2022) |
| Interest-Only Period: | 60 months | | 2nd Most Recent NOI (As of): | $2,203,465 (12/31/2023) |
| Original Term: | 60 months | | Most Recent NOI (As of)(3): | $2,292,939 (TTM 9/30/2024) |
| Original Amortization Term: | None | | UW Economic Occupancy: | 82.4% |
| Amortization Type: | Interest Only | | UW Revenues: | $5,660,087 |
| Call Protection: | L(13),YM1(40),O(7) | | UW Expenses: | $3,079,528 |
| Lockbox / Cash Management | Springing / Springing | | UW NOI(3): | $2,580,559 |
| Additional Debt: | No | | UW NCF: | $2,550,759 |
| Additional Debt Balance: | NAP | | Appraised Value / Per Unit(4): | $64,800,000 / $563,478 |
| Additional Debt Type: | NAP | | Appraisal Date: | 8/2/2024 |
| Escrows and Reserves | | Financial Information |
| | Initial | Monthly | Initial Cap | | Cut-off Date Loan / Unit: | $234,783 |
| Taxes: | $764,955 | $127,493 | N/A | | Maturity Date Loan / Unit: | $234,783 |
| Insurance(1): | $168,744 | Springing | N/A | | Cut-off Date LTV: | 41.7% |
| Replacement Reserves: | $0 | $2,483 | N/A | | Maturity Date LTV: | 41.7% |
| Deferred Maintenance: | $29,375 | $0 | N/A | | UW NCF DSCR: | 1.45x |
| | | | | | UW NOI Debt Yield: | 9.6% |
| | | | | | | |
| Sources and Uses |
| Sources | Proceeds | % of Total | | Uses | Proceeds | % of Total |
| Mortgage Loan | $27,000,000 | 100.0% | | Loan Payoff | $23,451,338 | 86.9 | % |
| | | | | Return of Equity | 1,948,465 | 7.2 | |
| | | | | Reserves | 963,074 | 3.6 | |
| | | | | Closing Costs(5) | 637,122 | 2.4 | |
| Total Sources | $27,000,000 | 100.0% | | Total Uses | $27,000,000 | 100.0 | % |
| (1) | On a monthly basis, the borrower is required to deposit 1/12th of the insurance premiums that the lender estimates will be payable for the renewal of coverage. The borrower will not be required to make monthly insurance deposits so long as (i) no event of default has occurred and is continuing, (ii) the polices are part of a blanket insurance policy as required pursuant to The Meurice Mortgage Loan (as defined below) documents, (iii) the borrower provides the lender with evidence of renewal of such policies pursuant to The Meurice Mortgage Loan documents and (iv) the borrower provides the lender with paid receipts evidencing payment of the insurance premiums by no later than 10 business days prior to the expiration dates of the policies. |
| (2) | The Meurice Property (as defined below) is improved by 115-unit multifamily units and two commercial units consisting of 7,000 square feet of retail space. The two commercial units are excluded from the unit count above. |
| (3) | The increase in UW NOI from the Most Recent NOI is primarily attributed to an increase in monthly rent at The Meurice Property. |
| (4) | Based on the appraisal’s concluded land value of $41.1 million, the loan to land value is 65.7%. |
| (5) | Closing Costs includes an interest rate buy-down fee of approximately $270,000. |
The Loan. The thirteenth largest mortgage loan (“The Meurice Mortgage Loan”) is secured by the borrower’s fee simple interest in a high-rise multifamily property located in New York, New York (“The Meurice Property”). The Meurice Mortgage Loan was originated on November 19, 2024 by Societe Generale Financial Corporation. The Meurice Mortgage Loan has an outstanding principal balance as of the Cut-off Date of $27,000,000, has a five-year term, accrues interest at a rate of 6.42700% per annum on an Actual/360 basis and is interest only for the term of the loan. The scheduled maturity date of The Meurice Mortgage Loan is December 1, 2029.
The Property. The Meurice Property is high-rise multifamily property located in New York, New York. Built in 1928 and first renovated in 1977, The Meurice Property consists of 100 market rate units, 15 rent stabilized units and 7,000 square feet of commercial space, which is currently vacant. The borrower sponsor has continued to renovate The Meurice Property and over the last six years, The Meurice Property has undergone a complete retrofit and historic restoration including system
THE INFORMATION IN THIS STRUCTURAL AND COLLATERAL TERM SHEET IS NOT COMPLETE AND MAY BE AMENDED PRIOR TO THE TIME OF SALE. THIS TERM SHEET IS NOT AN OFFER TO SELL THESE SECURITIES AND IT IS NOT A SOLICITATION OF AN OFFER TO BUY THESE SECURITIES IN ANY JURISDICTION WHERE THE OFFER OR SALE IS NOT PERMITTED. |
| | 145 | |
| Structural and Collateral Term Sheet | | BMO 2024-5C8 |
| No. 13 – The Meurice |
replacements, public space redesign, elevator replacement and apartment restoration. The units are designed with English oak moldings throughout all wall spaces, crème marfil marble entryway floors with recessed diamond halogen lighting, coffered ceilings, custom marble edgeless windowsills, marble baths with whirlpools, granite countertops, stainless steel appliances and custom white frosted glass cabinetry or solid cherry cabinets, and refinished original white oak floors. Since 2021, the borrower sponsor has completed approximately $3.4 million (inclusive of soft costs) in capital improvements on structural and cosmetic upgrades. Additionally, The Meurice Property features a laundry room, 24/7 doorman concierge service and two passenger elevators. As of the October 29, 2024 rent roll, The Meurice Property was 98.3% occupied on a per unit basis, excluding the two vacant commercial units. Based on the appraisal’s concluded land value of $41.1 million, the loan to land value is 65.7%.
The following table presents detailed information with respect to the unit mix of The Meurice Property:
Multifamily Unit Mix(1) |
| Unit Type | No. of Units | % of Total | Occupied Units | % of Units Occupied | Avg. Monthly Rental Rate Per Unit(2) |
| Studio - Market | 19 | 16.5 | % | 17 | 89.5 | % | $3,657 |
| One Bedroom - Market | 55 | 47.8 | | 55 | 100.0 | | $4,346 |
| One Bedroom - Stabilized | 11 | 9.6 | | 11 | 100.0 | | $1,783 |
| Two Bedroom - Market | 25 | 21.7 | | 25 | 100.0 | | $6,171 |
| Two Bedroom - Stabilized | 4 | 3.5 | | 4 | 100.0 | | $2,040 |
| Three Bedroom - Market | 1 | 0.9 | | 1 | 100.0 | | $4,750 |
| Total/Wtd. Avg. | 115 | 100.0 | % | 113 | 98.3 | % | $4,319 |
| (1) | Based on the underwritten rent roll dated October 29, 2024. |
| (2) | Avg. Monthly Rental Per Unit is calculated using the in-place rent of the Occupied Units. |
Environmental. According to the Phase I environmental assessment dated August 8, 2024, there is no evidence of any recognized environmental conditions at The Meurice Property.
The following table presents certain information relating to the historical and current occupancy of The Meurice Property:
| Historical and Current Occupancy |
| 2022(1) | 2023(1) | Current(2) |
| 97.0% | 97.0% | 98.3% |
| (1) | Historical Occupancies are as of December 31 of each respective year and represent occupancy for the multifamily units. |
| (2) | Current Occupancy is as of October 29, 2024. |
The Market. The Meurice Property is located within the Midtown West neighborhood of New York. The Meurice Property’s neighborhood hosts commuters and residents working in its offices, hotels, and retail establishments, tourists and students. The Meurice Property is located approximately one block south of Central Park and Nordstrom’s flagship store, Columbus Circle and Time Warner Center’s dining and shops. The neighborhood also includes Carnegie Hall, NY Athletic Club and the headquarters of Apple on Fifth Avenue. The Meurice Property sits along 58th Street, also known as Billionaire Row. Billionaire Row is a collection of luxury condominiums with world-class amenities and panoramic views of the city located below Central Park which include One57, 432 Park Avenue, Central Park Tower and 111 West 57th Street.
According to the appraisal, The Meurice Property is located within the New York Metro apartment market. As of the second quarter of 2024, the New York Metro apartment market contained 497,567 units, with a vacancy rate of 3.2% and asking rent of $4,186 per unit. As of the second quarter of 2024, there were 1,013 units completed and there was a positive net absorption of 1,519 units within the New York Metro apartment market. According to the appraisal, The Meurice Property is located within the Midtown West apartment submarket. As of the second quarter of 2024, the Midtown West apartment submarket contained 53,435 units, with a vacancy rate of 4.4% and asking rent of $5,418 per unit. As of the second quarter of 2024, there was positive net absorption of 112 units within the Midtown West apartment submarket.
THE INFORMATION IN THIS STRUCTURAL AND COLLATERAL TERM SHEET IS NOT COMPLETE AND MAY BE AMENDED PRIOR TO THE TIME OF SALE. THIS TERM SHEET IS NOT AN OFFER TO SELL THESE SECURITIES AND IT IS NOT A SOLICITATION OF AN OFFER TO BUY THESE SECURITIES IN ANY JURISDICTION WHERE THE OFFER OR SALE IS NOT PERMITTED. |
| | 146 | |
| Structural and Collateral Term Sheet | | BMO 2024-5C8 |
| No. 13 – The Meurice |
The following table presents certain information relating to comparable multifamily rental properties to The Meurice Property:
| Comparable Rental Summary(1) |
Property Name Location | Year Built / Renovated | # Units | Unit Mix | Average Rent per Unit |
The Meurice 145 West 58th Street New York, NY(2) | 1928 / 2021-2023 | 115(2) | Studio – Market One Bedroom – Market One Bedroom – Stabilized Two Bedroom – Market Two Bedroom – Stabilized Three Bedroom - Market | $3,657(2) $4,346(2) $1,783(2) $6,171(2) $2,040(2) $4,750(2) |
230 West 55th Street 230 West 55th Street New York, NY | 1979 / NAP | 232 | Studio One Bedroom Two Bedroom Three Bedroom | $3,400 $4,495 $5,995 $6,995 |
65 West 55th Street 65 West 55th Street New York, NY | 1963 / NAP | 79 | Studio One Bedroom Three Bedroom | $3,675 $4,500 $6,500 |
1691 Broadway 1691 Broadway New York, NY | 1925 / NAP | 28 | Studio | $3,300 |
888 Eighth Avenue 888 Eighth Avenue New York, NY | 1965 / NAP | 381 | Studio One Bedroom | $3,400 $4,395 |
150 West 58th Street 150 West 58th Street New York, NY | 1925 / NAP | 56 | Studio One Bedroom | $4,000 $4,350 |
123 East 54th Street 123 East 54th Street New York, NY | 1977 / NAP | 64 | One Bedroom Three Bedroom | $4,600 $5,500 |
15 West 55th Street 15 West 55th Street New York, NY | 1915 / NAP | 36 | Two Bedroom Three Bedroom | $6,340 $6,495 |
105 West 55th Street 105 West 55th Street New York, NY | 1917 / NAP | 52 | Two Bedroom | $5,500 |
161 West 54th Street 161 West 54th Street New York, NY | 1923 / NAP | 54 | Two Bedroom Three Bedroom | $5,790 $6,000 |
853 Seventh Avenue 853 Seventh Avenue New York, NY | 1905 / NAP | 79 | Two Bedroom | $5,500 |
| (2) | Based on the underwritten rent roll dated October 29, 2024 for the multifamily units. |
THE INFORMATION IN THIS STRUCTURAL AND COLLATERAL TERM SHEET IS NOT COMPLETE AND MAY BE AMENDED PRIOR TO THE TIME OF SALE. THIS TERM SHEET IS NOT AN OFFER TO SELL THESE SECURITIES AND IT IS NOT A SOLICITATION OF AN OFFER TO BUY THESE SECURITIES IN ANY JURISDICTION WHERE THE OFFER OR SALE IS NOT PERMITTED. |
| | 147 | |
| Structural and Collateral Term Sheet | | BMO 2024-5C8 |
| No. 13 – The Meurice |
The following table presents certain information relating to the operating history and underwritten cash flows of The Meurice Property:
| Operating History and Underwritten Net Cash Flow |
| | 2022 | 2023 |
TTM(1)(2) | Underwritten(2) | Per Unit | %(3) |
| Gross Potential Residential Rents | $4,815,443 | $5,088,675 | $5,402,191 | $5,942,591 | $51,675 | 86.5 | % |
| Gross Potential Commercial Rents | 0 | 0 | 0 | 910,000 | 7,913 | 13.3 | |
| Other Income | 23,996 | 14,786 | 19,868 | 14,626 | 127 | 0.2 | |
| Gross Potential Income | $4,839,439 | $5,103,461 | $5,422,059 | $6,867,217 | $59,715 | 100.0 | % |
| Net Rental Income | $4,839,439 | $5,103,461 | $5,422,059 | $6,867,217 | $59,715 | 100.0 | % |
| (Residential Vacancy/Credit Loss) | (124,992) | (62,771) | (90,334) | (297,130) | (2,584) | (4.3 | ) |
| (Commercial Vacancy) | 0 | 0 | 0 | (910,000) | (7,913) | (13.3 | ) |
| Effective Gross Income | $4,714,447 | $5,040,690 | $5,331,725 | $5,660,087 | $49,218 | 82.4 | % |
| Total Expenses | $3,067,542 | $2,837,225 | $3,038,786 | $3,079,528 | $26,779 | 54.4 | % |
| Net Operating Income | $1,646,905 | $2,203,465 | $2,292,939 | $2,580,559 | $22,440 | 45.6 | % |
| Replacement Reserves | 0 | 0 | 0 | 29,800 | 259 | 0.5 | |
| Net Cash Flow | $1,646,905 | $2,203,465 | $2,292,939 | $2,550,759 | $22,181 | 45.1 | % |
| (1) | TTM column represents the trailing 12 months ending September 2024. |
| (2) | The increase in Underwritten Net Operating Income from the TTM Net Operating Income is primarily attributed to an increase in monthly rent at The Meurice Property. |
| (3) | % column represents percent of Net Rental Income for all revenue lines and represents percent of Effective Gross Income for the remainder of fields. |
THE INFORMATION IN THIS STRUCTURAL AND COLLATERAL TERM SHEET IS NOT COMPLETE AND MAY BE AMENDED PRIOR TO THE TIME OF SALE. THIS TERM SHEET IS NOT AN OFFER TO SELL THESE SECURITIES AND IT IS NOT A SOLICITATION OF AN OFFER TO BUY THESE SECURITIES IN ANY JURISDICTION WHERE THE OFFER OR SALE IS NOT PERMITTED. |
| | 148 | |
| Structural and Collateral Term Sheet | | BMO 2024-5C8 |
| No. 14 – Tank Holding Portfolio |
| Mortgage Loan Information | | Property Information |
| Mortgage Loan Sellers: | GSMC, BMO | | Single Asset / Portfolio: | Portfolio |
| Original Principal Balance(1): | $26,389,388 | | Title: | Fee |
| Cut-off Date Principal Balance(1): | $26,389,388 | | Property Type – Subtype: | Industrial – Warehouse |
| % of IPB: | 2.7% | | | Distribution/Light Manufacturing |
| Loan Purpose: | Recapitalization | | Net Rentable Area (SF): | 1,489,315 |
| Borrower: | NM Tank, L.P. | | Location: | Various, Various |
| Borrower Sponsor: | New Mountain Net Lease Partners II Corporation | | Year Built / Renovated: | Various / Various |
| Interest Rate: | 5.17600% | | Occupancy: | 100.0% |
| Note Date: | 9/27/2024 | | Occupancy Date: | 12/6/2024 |
| Maturity Date: | 10/6/2029 | | 4th Most Recent NOI (As of)(3): | NAV |
| Interest-only Period: | 60 months | | 3rd Most Recent NOI (As of)(3): | NAV |
| Original Term: | 60 months | | 2nd Most Recent NOI (As of)(3): | NAV |
| Original Amortization Term: | None | | Most Recent NOI (As of)(3): | NAV |
| Amortization Type: | Interest Only | | UW Economic Occupancy: | 100.0% |
| Call Protection(2): | L(25),YM1(1),DorYM1(30),O(4) | | UW Revenues: | $10,217,206 |
| Lockbox / Cash Management: | Hard / Springing | | UW Expenses: | $0 |
| Additional Debt(1): | Yes | | UW NOI: | $10,217,206 |
| Additional Debt Balance(1): | $60,000,000 | | UW NCF: | $10,217,206 |
| Additional Debt Type(1): | Pari Passu | | Appraised Value / Per SF(4): | $132,910,000 / $89 |
| | | | Appraisal Date: | Various |
| | | | | |
| Escrows and Reserves | | Financial Information(1) |
| | Initial | Monthly | Initial Cap | | Cut-off Date Loan / SF: | $58 |
| Taxes: | $0 | Springing | N/A | | Maturity Date Loan / SF: | $58 |
| Insurance: | $0 | Springing | N/A | | Cut-off Date LTV: | 65.0% |
| Replacement Reserves: | $0 | Springing | $446,795 | | Maturity Date LTV: | 65.0% |
| TI / LC Reserve: | $0 | Springing | $2,233,973 | | UW NCF DSCR: | 2.25x |
| Free Rent Reserve: | $0 | Springing | N/A | | UW NOI Debt Yield: | 11.8% |
| | | | | | | |
| | | | | | | |
| Sources and Uses |
| Sources | Proceeds | % of Total | | Uses | Proceeds | % of Total |
| Whole Loan(1): | $86,389,388 | 100.0% | | Principal Equity Distribution: | $80,668,035 | 93.4 | % |
| | | | | Closing Costs(5): | 5,721,353 | 6.6 | |
| Total Sources | $86,389,388 | 100.0% | | Total Uses: | $86,389,388 | 100.0 | % |
| (1) | The Tank Holding Portfolio Mortgage Loan (as defined below) is part of the Tank Holding Portfolio Whole Loan (as defined below), which is evidenced by four pari passu promissory notes with an aggregate original principal balance of $86,389,388. The Financial Information presented above is based on the aggregate original principal balance of the promissory notes comprising the Tank Holding Portfolio Whole Loan. |
| (2) | The lockout period will be at least 24 payment dates beginning with and including the first payment date on November 6, 2024. Voluntary prepayment with the greater of a yield maintenance premium or 1% of the principal balance of the Tank Holding Portfolio Whole Loan in full (but not in part) is permitted at any time following the payment date in November 2026. Defeasance of the Tank Holding Portfolio Whole Loan in full (or in part in connection with certain property releases) is permitted at any time following the earlier to occur of (i) November 6, 2027 or (ii) the date that is two years from the closing date of the securitization that includes the last pari passu note to be securitized. The assumed lockout period of 26 payments is based on the expected BMO 2024-5C8 securitization trust closing date in December 2024. The actual lockout period may be longer. |
| (3) | Historical financial information is unavailable given the borrower sponsor purchased the Tank Holding Portfolio Properties (as defined below) in a sale leaseback transaction in June 2024. |
| (4) | Inclusive of a 0.1% portfolio premium. |
| (5) | Closing Costs include a rate buydown of $4,319,470. |
The Loan. The fourteenth largest mortgage loan (the “Tank Holding Portfolio Mortgage Loan”) is part of a whole loan (the “Tank Holding Portfolio Whole Loan”) evidenced by four pari passu notes that is secured by the borrower’s fee interest in a portfolio of 23 industrial properties located in various states (the “Tank Holding Portfolio Properties”).
THE INFORMATION IN THIS STRUCTURAL AND COLLATERAL TERM SHEET IS NOT COMPLETE AND MAY BE AMENDED PRIOR TO THE TIME OF SALE. THIS TERM SHEET IS NOT AN OFFER TO SELL THESE SECURITIES AND IT IS NOT A SOLICITATION OF AN OFFER TO BUY THESE SECURITIES IN ANY JURISDICTION WHERE THE OFFER OR SALE IS NOT PERMITTED. |
| | 149 | |
| Structural and Collateral Term Sheet | | BMO 2024-5C8 |
| No. 14 – Tank Holding Portfolio |
The Tank Holding Portfolio Mortgage Loan, which is evidenced by the non-controlling notes A-3 and A-4, has an outstanding principal balance as of the Cut-off Date of $26,389,388. The Tank Holding Portfolio Whole Loan was co-originated on September 27, 2024 by Goldman Sachs Bank USA (“GSBI”) and Bank of Montreal (“BMO”) and has an aggregate outstanding principal balance as of the Cut-off Date of $86,389,388. Note A-3, with an outstanding principal balance as of the Cut-off Date of $13,194,694, is being sold by Goldman Sachs Mortgage Company and Note A-4, with an outstanding principal balance of $13,194,694 as of the Cut-off Date, is being sold by BMO. The Tank Holding Portfolio Whole Loan has a five-year term, is interest-only for the full term and accrues interest on an Actual/360 basis. The scheduled maturity date of the Tank Holding Portfolio Whole Loan is October 6, 2029.
The Tank Holding Portfolio Whole Loan will be serviced pursuant to the pooling and servicing agreement for the BMO 2024-5C7 securitization trust. The relationship between the holders of the Tank Holding Portfolio Whole Loan is governed by a co-lender agreement. See “Description of the Mortgage Pool—The Whole Loans—The Outside Serviced Pari Passu Whole Loans” and “The Pooling and Servicing Agreement” in the Preliminary Prospectus.
The table below identifies the promissory notes that comprise the Tank Holding Portfolio Whole Loan:
| Whole Loan Summary |
| Note | Original Balance | Cut-off Date Balance | Note Holder | Controlling Piece |
| A-1 | $30,000,000 | $30,000,000 | BMO 2024-5C7 | Yes |
| A-2 | $30,000,000 | $30,000,000 | BMO 2024-5C7 | No |
| A-3 | $13,194,694 | $13,194,694 | BMO 2024-5C8 | No |
| A-4 | $13,194,694 | $13,194,694 | BMO 2024-5C8 | No |
| Whole Loan | $86,389,388 | $86,389,388 | | |
The Properties. The Tank Holding Portfolio Properties consist of 23 warehouse distribution / light manufacturing industrial properties. The Tank Holding Portfolio Properties are master leased to Tank Holding Corp., Semco Tank Holding, LLC and Centro, Incorporated (collectively, “Tank Holding”) on a triple-net basis. No single Tank Holding Portfolio Property comprises more than 16.1% of base rent or 19.8% of aggregate square footage. The Tank Holding Portfolio Properties are located across 23 unique zip codes within 16 unique states.
The borrower sponsor purchased the Tank Holding Portfolio Properties from affiliates of Tank Holding as part of a sale-leaseback transaction in June 2024. The purchase price was $132,906,747, or approximately $89 per square foot.
THE INFORMATION IN THIS STRUCTURAL AND COLLATERAL TERM SHEET IS NOT COMPLETE AND MAY BE AMENDED PRIOR TO THE TIME OF SALE. THIS TERM SHEET IS NOT AN OFFER TO SELL THESE SECURITIES AND IT IS NOT A SOLICITATION OF AN OFFER TO BUY THESE SECURITIES IN ANY JURISDICTION WHERE THE OFFER OR SALE IS NOT PERMITTED. |
| | 150 | |
| Structural and Collateral Term Sheet | | BMO 2024-5C8 |
| No. 14 – Tank Holding Portfolio |
The following table includes certain information about the Tank Holding Portfolio Properties.
| Portfolio Summary(1) |
| Property | City | State | Square Feet | Square Feet (%) | UW Base Rent ($) | UW Base Rent (%) |
| 5301 Old Baumgartner Road | Saint Louis | MO | 294,165 | 19.8 | % | $1,643,680 | 16.1 | % |
| 1 Centro Way | North Liberty | IA | 178,836 | 12.0 | | 1,137,494 | 11.1 | |
| 1745 Cragmont Street | Madison | IN | 145,526 | 9.8 | | 882,174 | 8.6 | |
| 4920 State Road | Ashtabula | OH | 76,231 | 5.1 | | 649,440 | 6.4 | |
| 2725 Kelly Boulevard | Claremont | NC | 102,277 | 6.9 | | 640,625 | 6.3 | |
| 736, 746 Birginal Drive | Bensenville | IL | 63,475 | 4.3 | | 620,435 | 6.1 | |
16160,16180,16200,16210,3308
Hwy 27 | Lake Wales | FL | 70,937 | 4.8 | | 557,902 | 5.5 | |
| 875 Green Valley Road | Beaver Dam | WI | 101,308 | 6.8 | | 546,838 | 5.4 | |
| 2820 FM 1516N | Converse | TX | 41,783 | 2.8 | | 519,049 | 5.1 | |
| 1660 N. Airport Road | Brigham City | UT | 61,654 | 4.1 | | 438,828 | 4.3 | |
6400 N. 60th St, 6401 N.
63rdSt, 6101 McCormick Dr. | Lincoln | NE | 37,618 | 2.5 | | 387,908 | 3.8 | |
| 4724 W. Junction Street | Springfield | MO | 49,159 | 3.3 | | 384,013 | 3.8 | |
| 709 Railroad Avenue | Albertville | AL | 49,159 | 3.3 | | 301,350 | 2.9 | |
| 13241 South 11th Avenue | Hanford | CA | 25,057 | 1.7 | | 227,849 | 2.2 | |
| 1235 Imperial Road | Hampton | IA | 30,070 | 2.0 | | 169,125 | 1.7 | |
| 145 Industrial St. SE | Cascade | IA | 30,000 | 2.0 | | 169,125 | 1.7 | |
| 1952 E. Lucas Street | Rochester | IN | 26,344 | 1.8 | | 168,420 | 1.6 | |
| 100 Bailiff Drive | Fairfield | TX | 21,335 | 1.4 | | 159,900 | 1.6 | |
| 2424 Kenskill Avenue | Washington Court House | OH | 22,072 | 1.5 | | 140,938 | 1.4 | |
| 201 S. Kennedy | Shawnee | OK | 16,967 | 1.1 | | 139,400 | 1.4 | |
| 203 Gate Ridge Road | Griffin | GA | 17,010 | 1.1 | | 121,975 | 1.2 | |
| 90 S. 1200 West | Tooele | UT | 14,258 | 1.0 | | 114,800 | 1.1 | |
| 263 Corporate Drive | Owego | NY | 14,074 | 0.9 | | 95,940 | 0.9 | |
| Total | | | 1,489,315 | 100.0 | % | $10,217,206 | 100.0 | % |
| (1) | Based on the underwritten rent roll dated December 6, 2024, inclusive of rent steps through July 2025. |
Sole Tenant. The Tank Holding Portfolio is leased Tank Holding Corp. on a triple-net basis.
Tank Holding (1,489,315 SF, 100.0% of NRA, 100.0% of underwritten base rent): Tank Holding is a privately-held American manufacturing conglomerate focused on large plastic goods. Tank Holding operates eight manufacturing brands. Tank Holding’s product offering includes liquid storage tanks, plastic containers, pallets and tank accessories. Tank Holding was formed in 2008 upon the merger of Norwesco and Snyder.
Environmental. According to the Phase I environmental assessments for each of the Tank Holding Portfolio Properties, each dated between May 16, 2024 and May 20, 2024, there was no evidence of any recognized environmental conditions at the Tank Holding Portfolio Properties. The environmental assessment for the 875 Green Valley Road property identified a controlled recognized environmental condition (CREC) related to prior on-site industrial uses. See “Description of the Mortgage Pool—Environmental Considerations” in the Preliminary Prospectus.
The following table presents certain information relating to the sole tenant at the Tank Holding Portfolio Properties:
| Sole Tenant Summary(1) |
| Tenant Name | Credit Rating (Moody's/ S&P/Fitch)(2) | Net Rentable Area (SF) | % of Total NRA | UW Base Rent PSF | UW Base Rent | % of Total UW Base Rent | Lease Exp. Date |
| Tank Holding | NR/NR/NR | 1,489,315 | 100.0% | $6.86 | $10,217,206 | 100.0% | 6/30/2044 |
| Occupied Total Collateral | | 1,489,315 | 100.0% | $6.86 | $10,217,206 | 100.0% | |
| Vacant Space (Owned) | | 0 | 0.0 | | | | |
| Totals/ Wtd. Avg. All Owned Tenants(5) | | 1,489,315 | 100.0% | | | | |
| (1) | Based on the underwritten rent roll dated December 6, 2024, inclusive of rent steps through July 2025. |
THE INFORMATION IN THIS STRUCTURAL AND COLLATERAL TERM SHEET IS NOT COMPLETE AND MAY BE AMENDED PRIOR TO THE TIME OF SALE. THIS TERM SHEET IS NOT AN OFFER TO SELL THESE SECURITIES AND IT IS NOT A SOLICITATION OF AN OFFER TO BUY THESE SECURITIES IN ANY JURISDICTION WHERE THE OFFER OR SALE IS NOT PERMITTED. |
| | 151 | |
| Structural and Collateral Term Sheet | | BMO 2024-5C8 |
| No. 14 – Tank Holding Portfolio |
The following table presents certain information relating to the lease rollover schedule at the Tank Holding Portfolio Properties:
| Lease Rollover Schedule(1) |
| Year | Number of Leases Expiring | Net Rentable Area Expiring | % of NRA Expiring | UW Base Rent Expiring | % of UW Base Rent Expiring | Cumulative Net Rentable Area Expiring | Cumulative % of NRA Expiring | Cumulative UW Base Rent Expiring | Cumulative % of UW Base Rent Expiring |
| 2035 & Beyond | 1 | 1,489,315 | 100.0% | $10,217,206 | 100.0% | 1,489,315 | 100.0% | $10,217,206 | 100.0% |
| Total/Wtd. Avg. | 1 | 1,489,315 | 100.0% | $10,217,206 | 100.0% | | | | |
| (1) | Based on the underwritten rent roll dated December 6, 2024, inclusive of rent steps through July 2025. |
The following table presents certain information relating to the underwritten cash flows of the Tank Holding Portfolio Properties:
| Underwritten Net Cash Flow(1) |
| | Underwritten | PSF | %(2) |
| Base Rent(3) | $9,968,006 | $6.69 | 97.6 | % |
| Rent Steps | 249,200 | 0.17 | 2.4 | |
| Total Base Rent | $10,217,206 | $6.86 | 100.0 | % |
| Expense Recoveries | 0 | 0.00 | 0.0 | |
| Total Reimbursements | $0 | $0.00 | 0.0 | % |
| Gross Potential Rent | $10,217,206 | $6.86 | 100.0 | % |
| Total Vacancy | 0 | 0.00 | 0.0 | |
| Effective Gross Income | $10,217,206 | $6.86 | 100.0 | % |
| Management Fees | 0 | 0.00 | 0.0 | |
| Operating Expenses | 0 | 0.00 | 0.0 | |
| Total Expenses | $0 | $0.00 | 0.0 | % |
| Net Operating Income | $10,217,206 | $6.86 | 100.0 | % |
| Total TI/LC | 0 | 0.00 | 0.0 | |
| Capital Expenditures | 0 | 0.00 | 0.0 | |
| Net Cash Flow | $10,217,206 | $6.86 | 100.0 | % |
| (1) | Historical financial information is unavailable given the borrower sponsor purchased the Tank Holding Portfolio Properties in a sale-leaseback transaction in June 2024. |
| (2) | Represents percent of Gross Potential Rent for all revenue fields and percent of Effective Gross Income for all other fields. |
| (3) | Based on the underwritten rent roll dated December 6, 2024, inclusive of rent steps through July 2025. |
The Market. The Tank Holding Portfolio Properties are located across 23 unique zip codes within 16 unique states.
THE INFORMATION IN THIS STRUCTURAL AND COLLATERAL TERM SHEET IS NOT COMPLETE AND MAY BE AMENDED PRIOR TO THE TIME OF SALE. THIS TERM SHEET IS NOT AN OFFER TO SELL THESE SECURITIES AND IT IS NOT A SOLICITATION OF AN OFFER TO BUY THESE SECURITIES IN ANY JURISDICTION WHERE THE OFFER OR SALE IS NOT PERMITTED. |
| | 152 | |
| Structural and Collateral Term Sheet | | BMO 2024-5C8 |
| No. 15 – Chestnut Run Innovation & Science Park (Building 709) |
| Mortgage Loan Information | | Property Information |
| Mortgage Loan Seller: | UBS AG | | Single Asset / Portfolio: | Single Asset |
| Original Principal Balance: | $26,000,000 | | Title: | Fee |
| Cut-off Date Principal Balance: | $26,000,000 | | Property Type - Subtype: | Industrial – Flex/R&D |
| % of IPB: | 2.6% | | Net Rentable Area (SF): | 80,874 |
| Loan Purpose: | Refinance | | Location: | Wilmington, DE |
| Borrower: | CRISP Partners Lot 2A LLC | | Year Built / Renovated: | 1954-1961 / 2023 |
| Borrower Sponsor: | Lawrence J. Stuardi | | Occupancy: | 100.0% |
| Interest Rate: | 7.59000% | | Occupancy Date: | 12/6/2024 |
| Note Date: | 11/18/2024 | | 4th Most Recent NOI (As of)(2): | NAV |
| Maturity Date: | 12/6/2029 | | 3rd Most Recent NOI (As of)(2): | NAV |
| Interest-only Period: | 60 months | | 2nd Most Recent NOI (As of)(2): | NAV |
| Original Term: | 60 months | | Most Recent NOI (As of)(2): | NAV |
| Original Amortization Term: | None | | UW Economic Occupancy: | 95.0% |
| Amortization Type: | Interest Only | | UW Revenues: | $3,784,513 |
| Call Protection: | L(24),D(29),O(7) | | UW Expenses: | $1,047,163 |
| Lockbox / Cash Management: | Hard / In Place | | UW NOI: | $2,737,350 |
| Additional Debt: | No | | UW NCF: | $2,532,376 |
| Additional Debt Balance: | N/A | | Appraised Value / Per SF: | $45,800,000 / $566 |
| Additional Debt Type: | N/A | | Appraisal Date: | 9/17/2024 |
| | | | | |
| Escrows and Reserves | | Financial Information |
| | Initial | Monthly | Initial Cap | | Cut-off Date Loan / SF: | $321 |
| Taxes: | $44,823 | $12,451 | N/A | | Maturity Date Loan / SF: | $321 |
| Insurance(1): | $35,583 | Springing | N/A | | Cut-off Date LTV: | 56.8% |
| Replacement Reserve: | $0 | $1,348 | $32,350 | | Maturity Date LTV: | 56.8% |
| Rent Concession Funds: | $192,579 | $0 | N/A | | UW NCF DSCR: | 1.27x |
| | | | | | UW NOI Debt Yield: | 10.5% |
| | | | | | | |
| Sources and Uses |
| Sources | Proceeds | % of Total | | Uses | Proceeds | % of Total |
| Mortgage Loan | $26,000,000 | 100.0% | | Loan Payoff | $24,000,000 | 92.3 | % |
| | | | | Closing Costs(3) | 1,129,378 | 4.3 | |
| | | | | Return of Equity | 597,637 | 2.3 | |
| | | | | Upfront Reserves | 272,985 | 1.0 | |
| Total Sources | $26,000,000 | 100.0% | | Total Uses | $26,000,000 | 100.0 | % |
| (1) | On a monthly basis, the borrower is required to deposit 1/12th of an amount that would be sufficient to pay insurance premiums for the renewal of coverages; provided, such monthly deposits will be waived so long as the borrower maintains a blanket insurance policy acceptable to the lender. |
| (2) | Historical NOI is not available as the Chestnut Run Innovation & Science Park Property (as defined below) was completely renovated in 2023 when the current tenant took occupancy. |
| (3) | Closing Costs include a $425,000 interest rate buy-down. |
The Loan. The fifteenth largest mortgage loan (the “Chestnut Run Innovation & Science Park Mortgage Loan”) is secured by the borrower’s fee interest in an 80,874 square foot industrial flex and R&D property located in Wilmington, Delaware (the “Chestnut Run Innovation & Science Park Property”). The Chestnut Run Innovation & Science Park Mortgage Loan is evidenced by one promissory note with an outstanding principal balance as of the Cut-off Date of $26,000,000. The Chestnut Run Innovation & Science Park Mortgage Loan was originated on November 18, 2024 by UBS AG. The Chestnut Run Innovation & Science Park Mortgage Loan accrues interest at a fixed rate of 7.59000% per annum. The Chestnut Run Innovation & Science Park Mortgage Loan has a five-year term, is interest-only for the entire term and accrues interest on an Actual/360 basis. The scheduled maturity date of the Chestnut Run Innovation & Science Park Mortgage Loan is December 6, 2029.
THE INFORMATION IN THIS STRUCTURAL AND COLLATERAL TERM SHEET IS NOT COMPLETE AND MAY BE AMENDED PRIOR TO THE TIME OF SALE. THIS TERM SHEET IS NOT AN OFFER TO SELL THESE SECURITIES AND IT IS NOT A SOLICITATION OF AN OFFER TO BUY THESE SECURITIES IN ANY JURISDICTION WHERE THE OFFER OR SALE IS NOT PERMITTED. |
| | 153 | |
| Structural and Collateral Term Sheet | | BMO 2024-5C8 |
| No. 15 – Chestnut Run Innovation & Science Park (Building 709) |
The Property. The Chestnut Run Innovation & Science Park Property is an 80,875 square foot industrial flex and R&D property located in Wilmington, Delaware. The Chestnut Run Innovation & Science Park Property is situated on a 3.5-acre site within the Chestnut Run Innovation and Science Park (“CRISP”), which encompasses approximately 162.4-acres. The Chestnut Run Innovation & Science Park Property is 100.0% occupied by Prelude Therapeutics Inc. (“Prelude”), a biopharmaceutical company specializing in cancer biology and drug development. Prelude has occupied the Chestnut Run Innovation & Science Park Property since it was renovated by the borrower sponsor in 2023 (see “Sole Tenant” below).
The borrower sponsor purchased the Chestnut Run Innovation & Science Park Property in 2021 with the intention of extensively renovating, expanding and repositioning the majority of the existing improvements to attract life science tenants in a phased development program. The borrower sponsor completed an extensive renovation program in 2023 to prepare for occupancy by Prelude for use as office/laboratory space. The borrower sponsor reported total costs (not including land) of approximately $37.4 million, including a tenant improvement allowance of approximately $12.6 million. Prelude spent an additional approximately $15.0 million in tenant improvements for a combined total of approximately $27.6 million spent on tenant improvements at the Chestnut Run Innovation & Science Park Property. Of the approximately $27.6 million, approximately 62.6% was spent on lab space buildout, approximately 22.9% was spent on office buildout and approximately 14.6% was spent on common area buildout.
Sole Tenant.
Prelude (80,874 square feet; 100.0% of NRA; 100.0% of underwritten base rent). Prelude is clinical-stage fully integrated oncology company built on a foundation of drug discovery to deliver precision cancer medicines to underserved patients. By leveraging Prelude’s core competencies in cancer biology and medicinal chemistry, combined with Prelude’s clinical development capabilities, Prelude has built a fully-integrated drug discovery engine and the development expertise necessary to identify compelling biological targets and create new chemical entities, that Prelude advances into clinical trials. Since inception in 2016, Prelude has received clearance from the U.S. Food and Drug Administration, for multiple investigational new drug applications, and successfully advanced several programs into clinical trials. Prelude has utilized the Chestnut Run Innovation & Science Park Property since 2023 with a current underwritten base rental rate of $36.31 per square foot triple net, with 2.5% annual increases. Prelude’s lease expires in May 2037, which is approximately eight years beyond the Chestnut Run Innovation & Science Park Mortgage Loan maturity date. Prelude has three, five-year renewal options and no termination options under its lease. In addition to the borrower sponsor’s contribution of approximately $12.6 million in tenant improvements, Prelude spent approximately $15.0 million in tenant improvements for its buildout or 54.4% of total tenant improvements spent at the Chestnut Run Innovation & Science Park Property.
The following table presents certain information relating to the historical and current occupancy of the Chestnut Run Innovation & Science Park Property:
| Historical and Current Occupancy |
| 2021(1) | 2022(1) | 2023(2) | Current(3) |
| NAV | NAV | 100.0% | 100.0% |
| (1) | Historical occupancies are not available as the Chestnut Run Innovation & Science Park Property was completely renovated in 2023 when the current tenant took occupancy |
| (2) | 2023 occupancy is as of December 31, 2023. Prelude’s lease start date was December 1, 2023. |
| (3) | Current occupancy is based on the underwritten rent roll as of December 6, 2024. |
THE INFORMATION IN THIS STRUCTURAL AND COLLATERAL TERM SHEET IS NOT COMPLETE AND MAY BE AMENDED PRIOR TO THE TIME OF SALE. THIS TERM SHEET IS NOT AN OFFER TO SELL THESE SECURITIES AND IT IS NOT A SOLICITATION OF AN OFFER TO BUY THESE SECURITIES IN ANY JURISDICTION WHERE THE OFFER OR SALE IS NOT PERMITTED. |
| | 154 | |
| Structural and Collateral Term Sheet | | BMO 2024-5C8 |
| No. 15 – Chestnut Run Innovation & Science Park (Building 709) |
The following table presents certain information relating to the sole tenant at the Chestnut Run Innovation & Science Park Property:
| Tenant Summary(1) |
| Tenant | Ratings
Moody’s/S&P/Fitch | Net Rentable Area (SF) | % of
Total NRA | UW Base Rent PSF(2) | UW Base Rent(2) | % of Total
UW Base Rent(2) | Lease
Expiration Date |
| Prelude Therapeutics Inc. | NR/NR/NR | 80,874 | 100.0% | $36.31 | $2,936,535 | 100.0% | 5/31/2037 |
| | | | | | | | |
| Occupied Collateral Total / Wtd. Avg. | 80,874 | 100.0% | $36.31 | $2,936,535 | 100.0% | |
| | | | | | | | |
| Vacant Space | | 0 | 0.0% | | | | |
| | | | | | | | |
| Collateral Total | | 80,874 | 100.0% | | | | |
| | | | | | | | |
| (1) | Based on the underwritten rent roll dated December 6, 2024. |
| (2) | UW Base Rent PSF, UW Base Rent and % of Total UW Base Rent are inclusive of approximately $71,978 of contractual rent steps through December 31, 2025. |
The following table presents certain information relating to the lease rollover schedule at the Chestnut Run Innovation & Science Park Property:
| Lease Rollover Schedule(1) |
| Year | Number of Leases Expiring | Net Rentable Area Expiring | % of NRA Expiring | UW Base Rent Expiring(2) | % of UW Base Rent Expiring(2) | Cumulative Net Rentable Area Expiring | Cumulative % of NRA Expiring | Cumulative UW Base Rent Expiring(2) | Cumulative % of UW Base Rent Expiring(2) |
| Vacant | NAP | 0 | 0.0 | % | NAP | NA | P | 0 | 0.0% | NAP | NAP |
| 2024 & MTM | 0 | 0 | 0.0 | | $0 | 0.0 | % | 0 | 0.0% | $0 | 0.0% |
| 2025 | 0 | 0 | 0.0 | | 0 | 0.0 | | 0 | 0.0% | $0 | 0.0% |
| 2026 | 0 | 0 | 0.0 | | 0 | 0.0 | | 0 | 0.0% | $0 | 0.0% |
| 2027 | 0 | 0 | 0.0 | | 0 | 0.0 | | 0 | 0.0% | $0 | 0.0% |
| 2028 | 0 | 0 | 0.0 | | 0 | 0.0 | | 0 | 0.0% | $0 | 0.0% |
| 2029 | 0 | 0 | 0.0 | | 0 | 0.0 | | 0 | 0.0% | $0 | 0.0% |
| 2030 | 0 | 0 | 0.0 | | 0 | 0.0 | | 0 | 0.0% | $0 | 0.0% |
| 2031 | 0 | 0 | 0.0 | | 0 | 0.0 | | 0 | 0.0% | $0 | 0.0% |
| 2032 | 0 | 0 | 0.0 | | 0 | 0.0 | | 0 | 0.0% | $0 | 0.0% |
| 2033 | 0 | 0 | 0.0 | | 0 | 0.0 | | 0 | 0.0% | $0 | 0.0% |
| 2034 | 0 | 0 | 0.0 | | 0 | 0.0 | | 0 | 0.0% | $0 | 0.0% |
| 2035 & Beyond | 1 | 80,874 | 100.0 | | $2,936,535 | 100.0 | | 80,874 | 100.0% | $2,936,535 | 100.0% |
| Total | 1 | 80,874 | 100.0 | % | $2,936,535 | 100.0 | % | | | | |
| (1) | Based on the underwritten rent roll dated December 6, 2024. |
| (2) | UW Base Rent Expiring, % of UW Base Rent Expiring, Cumulative UW Base Rent Expiring and Cumulative % of UW Base Rent Expiring are inclusive of approximately $71,978 of contractual rent steps through December 31, 2025. |
THE INFORMATION IN THIS STRUCTURAL AND COLLATERAL TERM SHEET IS NOT COMPLETE AND MAY BE AMENDED PRIOR TO THE TIME OF SALE. THIS TERM SHEET IS NOT AN OFFER TO SELL THESE SECURITIES AND IT IS NOT A SOLICITATION OF AN OFFER TO BUY THESE SECURITIES IN ANY JURISDICTION WHERE THE OFFER OR SALE IS NOT PERMITTED. |
| | 155 | |
| Structural and Collateral Term Sheet | | BMO 2024-5C8 |
| No. 15 – Chestnut Run Innovation & Science Park (Building 709) |
The following table presents certain information relating to the underwritten cash flows at the Chestnut Run Innovation & Science Park Property:
| Operating History and Underwritten Net Cash Flow(1) |
| | Underwritten | Per Square Foot | %(2) |
| Rents in Place(3) | $2,936,535 | $36.31 | 73.7 | % |
| Vacant Income | 0 | 0.00 | 0.0 | |
| Gross Potential Rent | $2,936,535 | $36.31 | 73.7 | % |
| Total Reimbursements | 1,047,163 | 12.95 | 26.3 | |
| Net Rental Income | $3,983,698 | $49.26 | 100.0 | % |
| (Vacancy/Credit Loss) | (199,185) | (2.46) | (5.0 | ) |
| Effective Gross Income | $3,784,513 | $46.80 | 95.0 | % |
| | | | |
| Total Expenses | $1,047,163 | $12.95 | 27.7 | % |
| | | | |
| Net Operating Income | $2,737,350 | $33.85 | 72.3 | % |
| | | | |
| Total TI/LC, Capex/RR | 204,974 | 2.53 | 5.4 | |
| | | | |
| Net Cash Flow | $2,532,376 | $31.31 | 66.9 | % |
| (1) | Historical financials are not available as the Chestnut Run Innovation & Science Park Property was completely renovated in 2023 when the current tenant took occupancy. |
| (2) | % column represents percent of Net Rental Income for all revenue lines and represents percent of Effective Gross Income for the remainder of fields. |
| (3) | Based on the underwritten rent roll dated December 6, 2024 with rent steps totaling $71,978 through December 31, 2025. |
Environmental. According to the Phase I environmental assessment dated September 23, 2024, the Chestnut Run Innovation & Science Park Property is part of a 163-acre Brownfields site known as the Chestnut Run Plaza DuPont Site that was formerly used as a research and development facility for Dupont until 2021. The Brownfields site has been separated into six operable units (“OU”). The Chestnut Run Innovation & Science Park Property is part of OU-1, with a focus solely on soil and soil gas around the Chestnut Run Innovation & Science Park Property. An investigation of OU-1 was performed by BrightFields, Inc. in December 2021 on behalf of CRISP Partners LLC, the Brownfield developer. The investigation determined that the soil within OU-1 was acceptable for residential use. Soil gas impacts were detected, and a passive vapor mitigation system (“VMS”) was installed beneath the slab floor of the Chestnut Run Innovation & Science Park Property in late 2022. Post-remedial action confirmatory sampling conducted in October 2023 and February 2024 confirmed that the VMS system is effectively operating. An environmental covenant has been recorded that restricts residential land use, groundwater withdrawal, and requires compliance with a contaminated materials management plan and a long-term stewardship plan that have been developed for OU-1. Based on the current regulatory status and implementation of engineering and institutional controls, conditions associated with OU-1 are considered a controlled recognized environmental condition at the Chestnut Run Innovation & Science Park Property. The Chestnut Run Innovation & Science Park Property is also part of OU-5, with a focus on groundwater. Response actions for this OU are ongoing for the Brownfields site as a whole. With the continued implementation of the existing engineering and institutional controls, no further investigation or action is recommended at the Chestnut Run Innovation & Science Park Property. EBI Consulting recommends continued compliance with the regulatory requirements set forth in the environmental covenant for the Chestnut Run Innovation & Science Park Property.
Appraisal. According to the appraisal, the Chestnut Run Innovation & Science Park Property had an “as-is” appraised value of $45,800,000 as of September 17, 2024. The table below shows the appraisal’s “as-is” conclusions.
| Appraisal Valuation Summary(1) |
| Appraisal Approach | Appraised Value | Capitalization Rate(2) |
| Direct Capitalization Approach | $45,800,000 | 6.00% |
| (2) | The appraisal used a discounted cash flow approach to arrive at the appraised value. The capitalization rates shown above represent the overall capitalization rate. |
THE INFORMATION IN THIS STRUCTURAL AND COLLATERAL TERM SHEET IS NOT COMPLETE AND MAY BE AMENDED PRIOR TO THE TIME OF SALE. THIS TERM SHEET IS NOT AN OFFER TO SELL THESE SECURITIES AND IT IS NOT A SOLICITATION OF AN OFFER TO BUY THESE SECURITIES IN ANY JURISDICTION WHERE THE OFFER OR SALE IS NOT PERMITTED. |
| | 156 | |
| Structural and Collateral Term Sheet | | BMO 2024-5C8 |
| No. 15 – Chestnut Run Innovation & Science Park (Building 709) |
The Market. The Chestnut Run Innovation & Science Park Property is located in Wilmington, New Castle County, Delaware within the Wilmington metropolitan statistical area (the “Wilmington MSA”). Major employers within the Wilmington MSA include Christiana Care Health System, JPMorgan Chase & Co., Bank of America Corp., AstraZeneca, University of Delaware, Amazon and DuPont Co., among others. Access to the area is provided by Delaware Route 141, Interstate 95 and Delaware Route 2. The area is served by the Philadelphia International Airport, located approximately 24.0 miles northeast of the Chestnut Run Innovation & Science Park Property. Public transportation is provided by DART First State, which operates bus transit linking the surrounding area with Wilmington’s CBD. The bus transit system has a stop positioned on the Chestnut Run Plaza campus.
According to a third-party market research report, the Chestnut Run Innovation & Science Park Property is located within the Wilmington industrial submarket. As of the September 2024, the Wilmington industrial submarket contained 16,584,329 square feet, a vacancy rate of approximately 4.7% and asking rent of $10.02 per square foot. The appraisal determined market rent of $36.00 per square foot.
According to a third-party market research report, the estimated 2024 population within a one-, three- and five-mile radius of the Chestnut Run Innovation & Science Park Property was 9,401, 92,105 and 192,958, respectively, and the estimated 2024 average household income within the same radii is $90,951, $92,137 and $97,214, respectively.
The following table presents certain information with respect to comparable leases to the Chestnut Run Innovation & Science Park Property as identified in the appraisal:
| Comparable Industrial Leases(1) |
| Property Name/Location | Year Built / Renovated | Occ. % | Total NRA (SF) | Tenant Name | Lease Date/Term (Yrs.) | Lease Area (SF) | Annual Base Rent PSF | Lease Type |
Chestnut Run Innovation & Science Park 175 Innovation Boulevard Wilmington, DE | 1954-1961 / 2023 | 100.0%(2) | 80,874(2) | Prelude Therapeutics Inc.(2) | Dec-2023 / 13.5(2) | 80,874(2) | $36.31(2) | NNN |
3201 Cuthbert Street Philadelphia, PA | 2024 / NAP | NAV | 508,581 | SmartLabs | Oct-2024 / 21.5 | 114,614 | $81.00 | NNN |
Confidential Wilmington, DE | 1961 / 2023 | 100.0% | 838,463 | Confidential | Dec-2023 / 16.0 | 102,303 | $48.18 | NNN |
2-30 Spring Mill Drive Malvern, PA | 1989 / NAP | NAV | 76,561 | Venatorx Pharmaceuticals, Inc. | Sep-2023 / 5.0 | 24,583 | $31.00 | NNN |
280 Great Valley Parkway Malvern, PA | 1982 / NAP | 100.0% | 32,500 | Janssen Research & Development, LLC | Nov-2022 / 10.0 | 32,500 | $28.50 | NNN |
| (2) | Based on the underwritten rent roll dated December 6, 2024. |
THE INFORMATION IN THIS STRUCTURAL AND COLLATERAL TERM SHEET IS NOT COMPLETE AND MAY BE AMENDED PRIOR TO THE TIME OF SALE. THIS TERM SHEET IS NOT AN OFFER TO SELL THESE SECURITIES AND IT IS NOT A SOLICITATION OF AN OFFER TO BUY THESE SECURITIES IN ANY JURISDICTION WHERE THE OFFER OR SALE IS NOT PERMITTED. |
| | 157 | |
| Structural and Collateral Term Sheet | | BMO 2024-5C8 |
| Contacts |
| BMO Capital Markets CMBS Capital Markets & Banking |
| Contact | E-mail | Phone Number |
| Paul Vanderslice | paul.vanderslice@bmo.com | (917) 996-4514 |
| Managing Director | | |
| | | |
| David Schell | david.schell@bmo.com | (347) 996-0721 |
| Managing Director | | |
| | | |
| Ravish Kamath | ravish.kamath@bmo.com | (347) 668-1507 |
| Director | | |
| | | |
| BMO Capital Markets CMBS Trading & Structuring |
| Contact | E-Mail | Phone Number |
| Andrew Noonan | andrew.noonan@bmo.com | (347) 466-3147 |
| Managing Director | | |
| | | |
| Mary Kunka | mary.kunka@bmo.com | (347) 956-1226 |
| Managing Director | | |
| | | |
| Kiran Manda | kiran.manda@bmo.com | (347) 831-4776 |
| Managing Director | | |
| | | |
| Michael Chen | lei4.chen@bmo.com | (646) 265-0023 |
| Director | | |
| | | |
| BMO Capital Markets Securitized Products Syndicate |
| Contact | E-Mail | Phone Number |
| Alex Smith-Constantine | alex.smithconstantine@bmo.com | (212) 702-1866 |
| Managing Director | | |
| | | |
| Trinian Donohoe | trinian.donohoe@bmo.com | (212) 702-1866 |
| Vice President | | |
| | | |
| Goldman Sachs Real Estate Financing Group - Securitization |
| Contact | E-Mail | Phone Number |
| Scott Epperson | scott.epperson@gs.com | (212) 934-2882 |
| Managing Director | | |
| | | |
| Justin Peterson | justin.peterson@gs.com | (212) 902-4283 |
| Vice President | | |
| | | |
| Raymond Todd | raymond.todd@gs.com | (972) 501-3979 |
| Vice President | | |
| | | |
| Goldman Sachs Real Estate Financing Group - Capital Markets |
| Contact | E-Mail | Phone Number |
| Nitin Jagga | nitin.jagga@gs.com | (212) 855-9035 |
| Vice President | | |
| | | |
| Rebecca Bayard | rebecca.bayard@gs.com | (212) 934-0848 |
| Vice President | | |
| | | |
| Goldman Sachs Syndicate & Structuring |
| Contact | E-Mail | Phone Number |
| Scott Walter | scott.walter@gs.com | (212) 357-8910 |
| Managing Director | | |
| | | |
| Lisa Schexnayder | lisa.schexnayder@gs.com | (212) 902-2330 |
| Vice President | | |
THE INFORMATION IN THIS STRUCTURAL AND COLLATERAL TERM SHEET IS NOT COMPLETE AND MAY BE AMENDED PRIOR TO THE TIME OF SALE. THIS TERM SHEET IS NOT AN OFFER TO SELL THESE SECURITIES AND IT IS NOT A SOLICITATION OF AN OFFER TO BUY THESE SECURITIES IN ANY JURISDICTION WHERE THE OFFER OR SALE IS NOT PERMITTED. |
| | 158 | |
| Structural and Collateral Term Sheet | | BMO 2024-5C8 |
| Contacts |
| Deutsche Bank Securities Banking |
| Contact | Contact | Contact |
| Lainie Kaye | lainie.kaye@db.com | (212) 250-5270 |
| Managing Director | | |
| | | |
| Michael Miller | michael.miller@db.com | (212) 250-0099 |
| Vice President | | |
| | | |
| Sam Lockwood | sam.lockwood@db.com | (212) 250-4569 |
| Vice President | | |
| | | |
| Deutsche Bank Securities Trading & Structuring |
| Contact | Contact | Contact |
| Shaishav Agarwal | shaishav.agarwal@db.com | (212) 250-6290 |
| Managing Director | | |
| | | |
| Daniel Penn | daniel.penn@db.com | (212) 250-5149 |
| Managing Director | | |
| | | |
| Matt Smith | matt-t.smith@db.com | (212) 250-6155 |
| Director | | |
| | | |
| Ryan Horvath | ryan.horvath@db.com | (212) 250-5149 |
| Director | | |
| | | |
| Citigroup CMBS Capital Markets and Securitization |
| Contact | Contact | Contact |
| Rick Simpson | richard.simpson@citi.com | (212) 816-5343 |
| Managing Director | | |
| | | |
| Jason Mercandetti | jason.mercandetti@citi.com | (212) 816-6384 |
| Director | | |
| | | |
| Citigroup Structuring, Trading & Syndicate |
| Contact | E-Mail | Phone Number |
| Raul Orozco | raul.d.orozco@citi.com | (212) 723-1295 |
| Managing Director | | |
| | | |
| Matt Perry | mattison.perry@citi.com | (212) 723-1295 |
| Director | | |
| | | |
| Societe Generale Banking & Capital Markets |
| Contact | E-Mail | Phone Number |
| Jim Barnard | jim.barnard@sgcib.com | (212) 278-6263 |
| Director | | |
| | | |
| Justin Cappuccino | justin.cappuccino@sgcib.com | (212) 278-6393 |
| Director | | |
| | | |
| Societe Generale Syndicate and Trading |
| Contact | E-Mail | Phone Number |
| Mark Lacerenza | mark.lacerenza@sgcib.com | (212) 278-5243 |
| Managing Director | | |
| | | |
| Claire Weiss | claire.weiss@sgcib.com | (212) 278-6570 |
| Director | | |
| | | |
| Philip Yenikomshian | philip.yenikomshian@sgcib.com | (212) 278-5155 |
| Director | | |
| | | |
| | | | | |
THE INFORMATION IN THIS STRUCTURAL AND COLLATERAL TERM SHEET IS NOT COMPLETE AND MAY BE AMENDED PRIOR TO THE TIME OF SALE. THIS TERM SHEET IS NOT AN OFFER TO SELL THESE SECURITIES AND IT IS NOT A SOLICITATION OF AN OFFER TO BUY THESE SECURITIES IN ANY JURISDICTION WHERE THE OFFER OR SALE IS NOT PERMITTED. |
| | 159 | |
| Structural and Collateral Term Sheet | | BMO 2024-5C8 |
| Contacts |
| Barclays CMBS Capital Markets & Banking |
| Contact | E-Mail | Phone Number |
| Daniel Schmidt | daniel.schmidt@barclays.com | (212) 528-7479 |
| Director | | |
| | | |
| Sammy Hamididdin | sammy.hamididdin@barclays.com | (212) 526-4751 |
| Director | | |
| | | |
| Kara Foley | kara.foley@barclays.com | (212) 526-4972 |
| Vice President | | |
| | | |
| Barclays CMBS Trading |
| Contact | E-Mail | Phone Number |
| David Kung | david.kung@barclays.com | (212) 528-7374 |
| Director | | |
| | | |
| Peter Taylor | peter.w.taylor@barclays.com | (212) 526-1528 |
| Director | | |
| | | |
| Barclays Securitized Products Syndicate |
| Contact | E-Mail | Phone Number |
| Brian Wiele | brian.wiele@barclays.com | (212) 412-5780 |
| Managing Director | | |
| | | |
| Sean Foley | sean.foley@barclays.com | (212) 412-5780 |
| Director | | |
| | | |
| UBS CMBS Capital Markets and Banking |
| Contact | E-Mail | Phone Number |
| Nicholas Galeone | nicholas.galeone@ubs.com | (212) 713-8832 |
| Managing Director | | |
| | | |
| Siho Ham | siho.ham@ubs.com | (212) 713-1278 |
| Managing Director | | |
| | | |
| Michael Barbieri | michael.barbieri@ubs.com | (212) 713-1181 |
| Executive Director | | |
| | | |
| UBS CMBS Trading and Syndicate |
| Contact | E-Mail | Phone Number |
| Jared Randall | jared.randall@ubs.com | (212) 713-8568 |
| Executive Director | | |
| | | |
| | | |
| | | |
| | | |
THE INFORMATION IN THIS STRUCTURAL AND COLLATERAL TERM SHEET IS NOT COMPLETE AND MAY BE AMENDED PRIOR TO THE TIME OF SALE. THIS TERM SHEET IS NOT AN OFFER TO SELL THESE SECURITIES AND IT IS NOT A SOLICITATION OF AN OFFER TO BUY THESE SECURITIES IN ANY JURISDICTION WHERE THE OFFER OR SALE IS NOT PERMITTED. |
| | 160 | |