| | | FREE WRITING PROSPECTUS |
| | | FILED PURSUANT TO RULE 433 |
| | | REGISTRATION FILE NO.: 333-280224-05 |
| | | |
| Dated February 5, 2025 | BMO 2025-C11 |
| Structural and Collateral Term Sheet |
BMO 2025-C11 Mortgage Trust |
$906,918,176 (Approximate Mortgage Pool Balance) |
| |
$[] (Approximate Offered Certificates) |
| |
BMO Commercial Mortgage Securities LLC Depositor |
| |
Commercial Mortgage Pass-Through Certificates, Series 2025-C11 |
| |
| |
Bank of Montreal Societe Generale Financial Corporation Starwood Mortgage Capital LLC UBS AG German American Capital Corporation National Cooperative Bank, N.A. Citi Real Estate Funding Inc. Barclays Capital Real Estate Inc. LMF Commercial, LLC LoanCore Capital Markets LLC Goldman Sachs Mortgage Company Greystone Commercial Mortgage Capital LLC Natixis Real Estate Capital LLC Sponsors and Mortgage Loan Sellers |
BMO Capital
Markets | Deutsche
Bank
Securities | Citigroup | Barclays | Goldman
Sachs &
Co. LLC | UBS
Securities
LLC | Société
Générale |
| |
| Co-Lead Managers and Joint Bookrunners |
| | | | | |
| Academy Securities | Bancroft Capital, LLC | Drexel Hamilton | Mischler Financial | Natixis |
| Co-Managers |
| |
| THE INFORMATION IN THIS STRUCTURAL AND COLLATERAL TERM SHEET IS NOT COMPLETE AND MAY BE AMENDED PRIOR TO THE TIME OF SALE. THIS TERM SHEET IS NOT AN OFFER TO SELL THESE SECURITIES AND IT IS NOT A SOLICITATION OF AN OFFER TO BUY THESE SECURITIES IN ANY JURISDICTION WHERE THE OFFER OR SALE IS NOT PERMITTED. |
| | | |
| Dated February 5, 2025 | BMO 2025-C11 |
This material is for your information, and none of BMO Capital Markets Corp., SG Americas Securities, LLC, Deutsche Bank Securities Inc., Citigroup Global Markets Inc., Barclays Capital Inc., Goldman Sachs & Co. LLC, UBS Securities LLC, Academy Securities, Inc., Bancroft Capital, LLC, Drexel Hamilton, LLC, Mischler Financial Group, Inc. and Natixis Securities Americas LLC (collectively, the “Underwriters”) are soliciting any action based upon it. This material is not to be construed as an offer to sell or the solicitation of any offer to buy any security in any jurisdiction where such an offer or solicitation would be illegal.
The depositor has filed a registration statement (including the prospectus) with the Securities and Exchange Commission (File No. 333-280224) for the offering to which this communication relates. Before you invest, you should read the prospectus in the registration statement and other documents the depositor has filed with the Securities and Exchange Commission for more complete information about the depositor, the issuing entity and this offering. You may get these documents for free by visiting EDGAR on the SEC website at www.sec.gov. Alternatively, the depositor or BMO Capital Markets Corp., any other underwriter, or any dealer participating in this offering will arrange to send you the prospectus if you request it by calling 1-888-200-0266. The Offered Certificates referred to in these materials, and the asset pool backing them, are subject to modification or revision (including the possibility that one or more Classes of Certificates may be split, combined or eliminated at any time prior to issuance or availability of a final prospectus) and are offered on a “when, as and if issued” basis. You understand that, when you are considering the purchase of these Certificates, a contract of sale will come into being no sooner than the date on which the relevant Class has been priced and we have verified the allocation of Certificates to be made to you; any “indications of interest” expressed by you, and any “soft circles” generated by us, will not create binding contractual obligations for you or us.
Neither this document nor anything contained in this document shall form the basis for any contract or commitment whatsoever. The information contained in this document is preliminary as of the date of this document, supersedes any previous such information delivered to you and will be superseded by any such information subsequently delivered prior to the time of sale. These materials are subject to change, completion or amendment from time to time. The information should be reviewed only in conjunction with the entire offering document relating to the Commercial Mortgage Pass-Through Certificates, Series 2025-C11 (the “Offering Document”). All of the information contained herein is subject to the same limitations and qualifications contained in the Offering Document. The information contained herein does not contain all relevant information relating to the underlying mortgage loans or mortgaged properties. Such information is described elsewhere in the Offering Document. The information contained herein will be more fully described elsewhere in the Offering Document. The information contained herein should not be viewed as projections, forecasts, predictions or opinions with respect to value. Prior to making any investment decision, prospective investors are strongly urged to read the Offering Document its entirety. Neither the Securities and Exchange Commission nor any state securities commission has approved or disapproved of these securities or determined if this free writing prospectus is truthful or complete. Any representation to the contrary is a criminal offense.
This document has been prepared by the Underwriters for information purposes only and does not constitute, in whole or in part, a prospectus for the purposes of Regulation (EU) 2017/1129 (as amended or superseded) and/or Part VI of the Financial Services and Markets Act 2000 (as amended) or other offering document.
The attached information contains certain tables and other statistical analyses (the “Computational Materials”) which have been prepared in reliance upon information furnished by the Mortgage Loan Sellers. Numerous assumptions were used in preparing the Computational Materials, which may or may not be reflected herein. As such, no assurance can be given as to the Computational Materials’ accuracy, appropriateness or completeness in any particular context; or as to whether the Computational Materials and/or the assumptions upon which they are based reflect present market conditions or future market performance. The Computational Materials should not be construed as either projections or predictions or as legal, tax, financial or accounting advice. You should consult your own counsel, accountant and other advisors as to the legal, tax, business, financial and related aspects of a purchase of these Certificates. Any weighted average lives, yields and principal payment periods shown in the Computational Materials are based on prepayment and/or loss assumptions, and changes in such prepayment and/or loss assumptions may dramatically affect such weighted average lives, yields and principal payment periods. In addition, it is possible that prepayments or losses on the underlying assets will occur at rates higher or lower than the rates shown in the attached Computational Materials. The specific characteristics of the Certificates may differ from those shown in the Computational Materials due to differences between the final underlying assets and the preliminary underlying assets used in preparing the Computational Materials. The principal amount and designation of any security described in the Computational Materials are subject to change prior to issuance. None of the Underwriters or any of their respective affiliates make any representation or warranty as to the actual rate or timing of payments or losses on any of the underlying assets or the payments or yield on the Certificates. The information in this presentation is based upon management forecasts and reflects prevailing conditions and management’s views as of this date, all of which are subject to change. In preparing this presentation, we have relied upon and assumed, without independent verification, the accuracy and completeness of all information available from public sources or which was provided to us by or on behalf of the Mortgage Loan Sellers or which was otherwise reviewed by us.
This document contains forward-looking statements. If and when included in this document, the words “expects”, “intends”, “anticipates”, “estimates” and analogous expressions and all statements that are not historical facts, including statements about our beliefs or expectations, are intended to identify forward-looking statements. Any forward-looking statements are made subject to risks and uncertainties which could cause actual results to differ materially from those stated. Those risks and uncertainties include, among other things, declines in general economic and business conditions, increased competition, changes in demographics, changes in political and social conditions, regulatory initiatives and changes in consumer preferences, many of which are beyond our control and the control of any other person or entity related to this offering. The forward-looking statements made in this document are made as of the date hereof. We have no obligation to update or revise any forward-looking statement.
BMO Capital Markets is a trade name used by BMO Financial Group for the wholesale banking businesses of Bank of Montreal, BMO Harris Bank N.A. (member FDIC), Bank of Montreal Europe p.l.c, and Bank of Montreal (China) Co. Ltd, the institutional broker dealer business of BMO Capital Markets Corp. (Member FINRA and SIPC) and the agency broker dealer business of Clearpool Execution Services, LLC (Member FINRA and SIPC) in the U.S., and the institutional broker dealer businesses of BMO Nesbitt Burns Inc. (Member Investment Industry Regulatory Organization of Canada and Member Canadian Investor Protection Fund) in Canada and Asia, Bank of Montreal Europe p.l.c. (authorized and regulated by the Central Bank of Ireland) in Europe and BMO Capital Markets Limited (authorized and regulated by the Financial Conduct Authority) in the UK and Australia.
Securities and investment banking activities in the United States are performed by Deutsche Bank Securities Inc., a member of NYSE, FINRA and SIPC, and its broker-dealer affiliates. Lending and other commercial banking activities in the United States are performed by Deutsche Bank AG and its banking affiliates.
Société Générale is the marketing name for SG Americas Securities, LLC.
| THE INFORMATION IN THIS STRUCTURAL AND COLLATERAL TERM SHEET IS NOT COMPLETE AND MAY BE AMENDED PRIOR TO THE TIME OF SALE. THIS TERM SHEET IS NOT AN OFFER TO SELL THESE SECURITIES AND IT IS NOT A SOLICITATION OF AN OFFER TO BUY THESE SECURITIES IN ANY JURISDICTION WHERE THE OFFER OR SALE IS NOT PERMITTED. |
| | 2 | |
| Dated February 5, 2025 | BMO 2025-C11 |
IMPORTANT NOTICE RELATING TO AUTOMATICALLY-GENERATED EMAIL DISCLAIMERS
Any legends, disclaimers or other notices that may appear at the bottom of any email communication to which this document is attached relating to (1) these materials not constituting an offer (or a solicitation of an offer), (2) no representation that these materials are accurate or complete and may not be updated or (3) these materials possibly being confidential, are not applicable to these materials and should be disregarded. Such legends, disclaimers or other notices have been automatically generated as a result of these materials having been sent via Bloomberg or another system.
THE CERTIFICATES REFERRED TO IN THESE MATERIALS ARE SUBJECT TO MODIFICATION OR REVISION (INCLUDING THE POSSIBILITY THAT ONE OR MORE CLASSES OF CERTIFICATES MAY BE SPLIT, COMBINED OR ELIMINATED AT ANY TIME PRIOR TO ISSUANCE OR AVAILABILITY OF A FINAL PROSPECTUS) AND ARE OFFERED ON A “WHEN, AS AND IF ISSUED” BASIS.
THE UNDERWRITERS MAY FROM TIME TO TIME PERFORM INVESTMENT BANKING SERVICES FOR, OR SOLICIT INVESTMENT BANKING BUSINESS FROM, ANY COMPANY NAMED IN THESE MATERIALS. THE UNDERWRITERS AND/OR THEIR AFFILIATES OR RESPECTIVE EMPLOYEES MAY FROM TIME TO TIME HAVE A LONG OR SHORT POSITION IN ANY CERTIFICATE OR CONTRACT DISCUSSED IN THESE MATERIALS.
| THE INFORMATION IN THIS STRUCTURAL AND COLLATERAL TERM SHEET IS NOT COMPLETE AND MAY BE AMENDED PRIOR TO THE TIME OF SALE. THIS TERM SHEET IS NOT AN OFFER TO SELL THESE SECURITIES AND IT IS NOT A SOLICITATION OF AN OFFER TO BUY THESE SECURITIES IN ANY JURISDICTION WHERE THE OFFER OR SALE IS NOT PERMITTED. |
| | 3 | |
| Structural and Collateral Term Sheet | | BMO 2025-C11 |
| Collateral Characteristics |
Mortgage Loan Seller | Number of Mortgage Loans | Number of Mortgaged Properties | Aggregate
Cut-off Date Balance | % of IPB | Roll-up Aggregate Cut-off Date Balance | Roll-up Aggregate % of Cut-off Date Balance |
| SGFC | 7 | 8 | $139,408,845 | 15.4% | $164,408,845 | 18.1% |
| BMO | 4 | 10 | $83,025,000 | 9.2% | $132,275,000 | 14.6% |
| SMC | 7 | 9 | $108,150,000 | 11.9% | $108,150,000 | 11.9% |
| UBS AG | 3 | 3 | $107,575,000 | 11.9% | $107,575,000 | 11.9% |
| GACC | 2 | 2 | $50,660,000 | 5.6% | $101,410,000 | 11.2% |
| NCB | 26 | 26 | $75,947,785 | 8.4% | $75,947,785 | 8.4% |
| CREFI | 2 | 2 | $61,000,000 | 6.7% | $61,000,000 | 6.7% |
| Barclays | 1 | 1 | $9,400,000 | 1.0% | $49,400,000 | 5.4% |
| LMF | 2 | 2 | $29,975,000 | 3.3% | $29,975,000 | 3.3% |
| LCM | 1 | 1 | $25,000,000 | 2.8% | $25,000,000 | 2.8% |
| GSMC | 1 | 1 | $19,956,546 | 2.2% | $19,956,546 | 2.2% |
| GCMC | 3 | 4 | $18,570,000 | 2.0% | $18,570,000 | 2.0% |
| Natixis | 1 | 1 | $13,250,000 | 1.5% | $13,250,000 | 1.5% |
| BMO, GACC | 2 | 2 | $100,000,000 | 11.0% | - | - |
| Barclays, SGFC | 1 | 1 | $65,000,000 | 7.2% | - | - |
| Total: | 63 | 73 | $906,918,176 | 100.0% | $906,918,176 | 100.0% |
| Loan Pool | |
| | Initial Pool Balance (“IPB”): | $906,918,176 |
| | Number of Mortgage Loans: | 63 |
| | Number of Mortgaged Properties: | 73 |
| | Average Cut-off Date Balance per Mortgage Loan: | $14,395,527 |
| | Weighted Average Current Mortgage Rate: | 6.73129% |
| | 10 Largest Mortgage Loans as % of IPB: | 50.8% |
| | Weighted Average Remaining Term to Maturity: | 119 months |
| | Weighted Average Seasoning: | 1 month |
| | | |
| Credit Statistics | |
| | Weighted Average UW NCF DSCR: | 2.10x |
| | Weighted Average UW NOI Debt Yield: | 15.8% |
| | Weighted Average Cut-off Date Loan-to-Value Ratio (“LTV”): | 54.9% |
| | Weighted Average Maturity Date/ARD LTV: | 52.6% |
| | | |
| Other Statistics | |
| | % of Mortgage Loans with Additional Debt: | 5.9% |
| | % of Mortgage Loans with Single Tenants(1): | 8.6% |
| | % of Mortgage Loans secured by Multiple Properties: | 12.0% |
| | |
| Amortization | |
| | Weighted Average Original Amortization Term: | 338 months |
| | Weighted Average Remaining Amortization Term: | 337 months |
| | % of Mortgage Loans with Interest-Only: | 65.1% |
| | % of Mortgage Loans with Amortizing Balloon: | 15.4% |
| | % of Mortgage Loans with Partial Interest-Only followed by Amortizing Balloon: | 11.2% |
| | % of Mortgage Loans with Partial Interest-Only followed by Amortizing Balloon and Partial Interest-Only: | 6.5% |
| | % of Mortgage Loans with Fully Amortizing: | 1.8% |
| | | |
| Lockboxes | |
| | % of Mortgage Loans with Hard Lockboxes: | 48.6% |
| | % of Mortgage Loans with Springing Lockboxes: | 32.0% |
| | % of Mortgage Loans with Soft Lockbox: | 11.0% |
| | % of Mortgage Loans with No Lockbox: | 8.4% |
| | | |
| Reserves | |
| | % of Mortgage Loans Requiring Monthly Tax Reserves: | 69.9% |
| | % of Mortgage Loans Requiring Monthly Insurance Reserves: | 40.9% |
| | % of Mortgage Loans Requiring Monthly CapEx Reserves: | 59.8% |
| | % of Mortgage Loans Requiring Monthly TI/LC Reserves(2): | 39.2% |
(1) Excludes mortgage loans that are secured by multiple properties leased to separate single tenants.
(2) Calculated only with respect to the Cut-off Date Balance of mortgage loans secured or partially secured by office, retail, industrial, mixed use, leased fee and multifamily (with commercial tenants) properties.
| THE INFORMATION IN THIS STRUCTURAL AND COLLATERAL TERM SHEET IS NOT COMPLETE AND MAY BE AMENDED PRIOR TO THE TIME OF SALE. THIS TERM SHEET IS NOT AN OFFER TO SELL THESE SECURITIES AND IT IS NOT A SOLICITATION OF AN OFFER TO BUY THESE SECURITIES IN ANY JURISDICTION WHERE THE OFFER OR SALE IS NOT PERMITTED. |
| | 4 | |
| Structural and Collateral Term Sheet | | BMO 2025-C11 |
| Collateral Characteristics |
| Ten Largest Mortgage Loans |
| |
| No. | Loan Name | City, State | Mortgage Loan
Seller | No.
of Prop. | Cut-off Date Balance | % of IPB | Square Feet / Units | Property Type | UW
NCF DSCR | UW NOI Debt Yield | Cut-off Date LTV | Maturity Date/ARD LTV |
| 1 | Shops at Mission Viejo | Mission Viejo, CA | Barclays, SGFC | 1 | $65,000,000 | 7.2% | 1,012,005 | Retail | 1.69x | 13.4% | 52.4% | 49.5% |
| 2 | UOVO QPN | Long Island City, NY | BMO, GACC | 1 | $65,000,000 | 7.2% | 281,494 | Self Storage | 1.47x | 9.7% | 60.9% | 60.9% |
| 3 | 340 Mt Kemble | Morris Township, NJ | SGFC | 1 | $59,000,000 | 6.5% | 413,261 | Office | 1.61x | 14.3% | 61.8% | 54.5% |
| 4 | Ali'i Place | Honolulu, HI | UBS AG | 1 | $46,575,000 | 5.1% | 337,370 | Office | 1.92x | 15.3% | 67.1% | 67.1% |
| 5 | 29-33 Ninth Avenue | New York, NY | UBS AG | 1 | $45,000,000 | 5.0% | 87,537 | Mixed Use | 1.30x | 9.0% | 58.4% | 58.4% |
| 6 | 360 Bowery | New York, NY | GACC | 1 | $40,000,000 | 4.4% | 8,707 | Other | 1.11x | 7.3% | 62.5% | 62.5% |
| 7 | 299 Park Avenue | New York, NY | CREFI | 1 | $36,000,000 | 4.0% | 1,176,837 | Office | 2.35x | 14.4% | 45.6% | 45.6% |
| 8 | FedEx Portfolio | Various, Various | BMO | 4 | $36,000,000 | 4.0% | 438,592 | Industrial | 1.51x | 10.9% | 69.8% | 69.8% |
| 9 | UOVO Orangeburg | Orangetown, NY | BMO, GACC | 1 | $35,000,000 | 3.9% | 102,446 | Self Storage | 1.67x | 11.0% | 59.5% | 59.5% |
| 10 | 2481 Crotona Avenue | Bronx, NY | SMC | 1 | $33,250,000 | 3.7% | 90 | Multifamily | 1.25x | 9.7% | 59.3% | 54.2% |
| | | | | | | | | | | | | |
| | Top 3 Total/Weighted Average | | 3 | $189,000,000 | 20.8% | | | 1.59x | 12.4% | 58.3% | 55.0% |
| | Top 5 Total/Weighted Average | | 5 | $280,575,000 | 30.9% | | | 1.60x | 12.3% | 59.7% | 57.5% |
| | Top 10 Total/Weighted Average | | 13 | $460,825,000 | 50.8% | | | 1.59x | 11.7% | 59.6% | 57.9% |
| | Non-Top 10 Total/Weighted Average | | 60 | $446,093,176 | 49.2% | | | 2.63x | 20.1% | 50.1% | 47.1% |
| THE INFORMATION IN THIS STRUCTURAL AND COLLATERAL TERM SHEET IS NOT COMPLETE AND MAY BE AMENDED PRIOR TO THE TIME OF SALE. THIS TERM SHEET IS NOT AN OFFER TO SELL THESE SECURITIES AND IT IS NOT A SOLICITATION OF AN OFFER TO BUY THESE SECURITIES IN ANY JURISDICTION WHERE THE OFFER OR SALE IS NOT PERMITTED. |
| | 5 | |
| Structural and Collateral Term Sheet | | BMO 2025-C11 |
| Collateral Characteristics |
| Pari Passu Companion Loan Summary |
| |
No. | Loan Name | Mortgage Loan Seller | Trust Cut-off Date Balance | Aggregate Pari Passu Companion Loan Cut-off Date Balance | Controlling Pooling/Trust & Servicing Agreement | Master Servicer | Special Servicer | Related Pari Passu Loan(s) Securitizations | Related Pari Passu Companion Loan(s) Original Balance |
| 1 | Shops at Mission Viejo | Barclays, SGFC | $65,000,000 | $115,000,000 | BBCMS 2025-C32 | Midland | Argentic | BBCMS 2025-C32
Future Securitization(s) | $90,000,000
$25,000,000 |
| 2 | UOVO QPN | BMO, GACC | $65,000,000 | $78,000,000 | WFCM 2025-C64 | Wells Fargo | Rialto | WFCM 2025-C64
Future Securitization(s) | $45,000,000
$33,000,000 |
| 3 | 340 Mt Kemble | SGFC | $59,000,000 | $13,950,000 | BMO 2025-C11 | Midland | KeyBank | Future Securitization(s) | $13,950,000 |
| 5 | 29-33 Ninth Avenue | UBS AG | $45,000,000 | $90,000,000 | BMO 2025-C11(1) | Midland(1) | KeyBank(1) | Future Securitization(s) | $90,000,000 |
| 7 | 299 Park Avenue | CREFI | $36,000,000 | $464,000,000 | NY 2025-299P | Wells Fargo | KeyBank | NY 2025-299P
Future Securitization(s) | $435,000,000
$29,000,000 |
| 17 | Outlet Shoppes of the Bluegrass | GSMC | $19,956,546 | $45,900,055 | WFCM 2025-C64 | Wells Fargo | Rialto | WFCM 2025-C64 | $46,000,000 |
| 23 | Twin Cities Premium Outlets | Natixis | $13,250,000 | $81,750,000 | BBCMS 2024-C30 | Midland | Rialto | BBCMS 2024-C30 WFCM 2025-C64 | $61,750,000 $20,000,000 |
| (1) | In the case of Loan No. 5, until the securitization of the related controlling pari passu companion loan, the related whole loan will be serviced and administered pursuant to the pooling and servicing agreement for the BMO 2025-C11 securitization transaction by the parties thereto. Upon the securitization of the related controlling pari-passu companion loan, servicing of the related whole loan will shift to the servicers under the servicing agreement with respect to such future securitization transaction, which servicing agreement will become the Controlling Pooling/Trust & Servicing Agreement. |
| THE INFORMATION IN THIS STRUCTURAL AND COLLATERAL TERM SHEET IS NOT COMPLETE AND MAY BE AMENDED PRIOR TO THE TIME OF SALE. THIS TERM SHEET IS NOT AN OFFER TO SELL THESE SECURITIES AND IT IS NOT A SOLICITATION OF AN OFFER TO BUY THESE SECURITIES IN ANY JURISDICTION WHERE THE OFFER OR SALE IS NOT PERMITTED. |
| | 6 | |
| Structural and Collateral Term Sheet | | BMO 2025-C11 |
| Collateral Characteristics |
| Mortgaged Properties by Type |
| | | | | | Weighted Average |
| Property Type | Property Subtype | Number of Properties | Cut-off Date Principal Balance | % of IPB | UW
NCF DSCR | UW
NOI DY | Cut-off Date LTV | Maturity Date/ARD LTV |
| Multifamily | Garden | 12 | $107,678,845 | 11.9% | 1.30x | 10.4% | 59.4% | 55.6% |
| | Cooperative | 26 | 75,947,785 | 8.4 | 7.79x | 58.3% | 12.9% | 11.6% |
| | Mid Rise | 2 | 39,700,000 | 4.4 | 1.43x | 9.7% | 65.5% | 65.5% |
| | High Rise | 1 | 33,250,000 | 3.7 | 1.25x | 9.7% | 59.3% | 54.2% |
| | Townhomes | 1 | 3,750,000 | 0.4 | 1.20x | 10.1% | 62.2% | 59.1% |
| | Subtotal: | 42 | $260,326,630 | 28.7% | 3.21x | 24.2% | 46.8% | 44.1% |
| Office | CBD | 2 | $82,575,000 | 9.1% | 2.11x | 14.9% | 57.7% | 57.7% |
| | Suburban | 1 | 59,000,000 | 6.5 | 1.61x | 14.3% | 61.8% | 54.5% |
| | Urban | 1 | 10,000,000 | 1.1 | 1.78x | 12.6% | 47.4% | 47.4% |
| | Subtotal: | 4 | $151,575,000 | 16.7% | 1.89x | 14.5% | 58.6% | 55.8% |
| Retail | Super Regional Mall | 1 | $65,000,000 | 7.2% | 1.69x | 13.4% | 52.4% | 49.5% |
| | Anchored | 3 | 48,535,000 | 5.4 | 1.43x | 10.8% | 62.4% | 62.4% |
| | Outlet Center | 2 | 33,206,546 | 3.7 | 1.84x | 14.2% | 55.1% | 50.3% |
| | Subtotal: | 6 | $146,741,546 | 16.2% | 1.64x | 12.7% | 56.3% | 54.0% |
| Self Storage | Self Storage | 3 | $105,100,000 | 11.6% | 1.61x | 10.6% | 59.1% | 59.1% |
| Industrial | Warehouse/Distribution | 6 | $48,700,000 | 5.4% | 1.51x | 11.1% | 67.1% | 67.1% |
| | Distribution/Manufacturing | 4 | 28,925,000 | 3.2 | 1.91x | 12.9% | 61.5% | 61.5% |
| | Subtotal: | 10 | $77,625,000 | 8.6% | 1.66x | 11.8% | 65.0% | 65.0% |
| Mixed Use | Retail | 1 | $45,000,000 | 5.0% | 1.30x | 9.0% | 58.4% | 58.4% |
| | Retail/Office | 1 | 22,250,000 | 2.5 | 1.42x | 10.2% | 60.0% | 60.0% |
| | Multifamily/Retail | 1 | 6,000,000 | 0.7 | 1.28x | 10.6% | 66.7% | 58.6% |
| | Subtotal: | 3 | $73,250,000 | 8.1% | 1.33x | 9.5% | 59.6% | 58.9% |
| Hospitality | Full Service | 2 | $41,000,000 | 4.5% | 2.06x | 20.4% | 42.7% | 28.0% |
| Other | Leased Fee | 1 | $40,000,000 | 4.4% | 1.11x | 7.3% | 62.5% | 62.5% |
| Manufactured Housing | RV Park | 1 | $6,027,000 | 0.7% | 1.73x | 12.5% | 53.8% | 53.8% |
| | Manufactured Housing/RV Park | 1 | 5,273,000 | 0.6 | 1.73x | 12.5% | 53.8% | 53.8% |
| | Subtotal: | 2 | $11,300,000 | 1.2% | 1.73x | 12.5% | 53.8% | 53.8% |
| Total / Weighted Average: | 73 | $906,918,176 | 100.0% | 2.10x | 15.8% | 54.9% | 52.6% |
| THE INFORMATION IN THIS STRUCTURAL AND COLLATERAL TERM SHEET IS NOT COMPLETE AND MAY BE AMENDED PRIOR TO THE TIME OF SALE. THIS TERM SHEET IS NOT AN OFFER TO SELL THESE SECURITIES AND IT IS NOT A SOLICITATION OF AN OFFER TO BUY THESE SECURITIES IN ANY JURISDICTION WHERE THE OFFER OR SALE IS NOT PERMITTED. |
| | 7 | |
| Structural and Collateral Term Sheet | | BMO 2025-C11 |
| No. 1 – Shops at Mission Viejo |
| THE INFORMATION IN THIS STRUCTURAL AND COLLATERAL TERM SHEET IS NOT COMPLETE AND MAY BE AMENDED PRIOR TO THE TIME OF SALE. THIS TERM SHEET IS NOT AN OFFER TO SELL THESE SECURITIES AND IT IS NOT A SOLICITATION OF AN OFFER TO BUY THESE SECURITIES IN ANY JURISDICTION WHERE THE OFFER OR SALE IS NOT PERMITTED. |
| | 8 | |
| Structural and Collateral Term Sheet | | BMO 2025-C11 |
| No. 1 – Shops at Mission Viejo |
| THE INFORMATION IN THIS STRUCTURAL AND COLLATERAL TERM SHEET IS NOT COMPLETE AND MAY BE AMENDED PRIOR TO THE TIME OF SALE. THIS TERM SHEET IS NOT AN OFFER TO SELL THESE SECURITIES AND IT IS NOT A SOLICITATION OF AN OFFER TO BUY THESE SECURITIES IN ANY JURISDICTION WHERE THE OFFER OR SALE IS NOT PERMITTED. |
| | 9 | |
| Structural and Collateral Term Sheet | | BMO 2025-C11 |
| No. 1 – Shops at Mission Viejo |

| THE INFORMATION IN THIS STRUCTURAL AND COLLATERAL TERM SHEET IS NOT COMPLETE AND MAY BE AMENDED PRIOR TO THE TIME OF SALE. THIS TERM SHEET IS NOT AN OFFER TO SELL THESE SECURITIES AND IT IS NOT A SOLICITATION OF AN OFFER TO BUY THESE SECURITIES IN ANY JURISDICTION WHERE THE OFFER OR SALE IS NOT PERMITTED. |
| | 10 | |
| Structural and Collateral Term Sheet | | BMO 2025-C11 |
| No. 1 – Shops at Mission Viejo |
| Mortgage Loan Information | | Property Information |
| Mortgage Loan Seller: | Barclays, SGFC | | Single Asset / Portfolio: | Single Asset |
| Original Principal Balance(1): | $65,000,000 | | Title: | Fee |
| Cut-off Date Principal Balance(1): | $65,000,000 | | Property Type – Subtype: | Retail – Super Regional Mall |
| % of IPB: | 7.2% | | Net Rentable Area (SF)(3): | 1,012,005 |
| Loan Purpose: | Refinance | | Location: | Mission Viejo, CA |
| Borrower: | Shops at Mission Viejo, LLC | | Year Built / Renovated: | 1979 / 2000, 2021 |
| Borrower Sponsors: | Simon Property Group, L.P. and Institutional Mall Investors LLC | | Occupancy: | 89.8% |
| Interest Rate: | 6.72500% | | Occupancy Date: | 10/23/2024 |
| Note Date: | 12/4/2024 | | 4th Most Recent NOI (As of): | $25,868,237 (12/31/2021) |
| Maturity Date: | 1/1/2035 | | 3rd Most Recent NOI (As of): | $24,750,051 (12/31/2022) |
| Interest-only Period: | 60 months | | 2nd Most Recent NOI (As of)(4): | $25,221,490 (12/31/2023) |
| Original Term: | 120 months | | Most Recent NOI (As of)(4): | $24,142,803 (TTM 9/30/2024) |
| Original Amortization Term: | 360 months | | UW Economic Occupancy: | 85.7% |
| Amortization Type: | Interest Only, Amortizing Balloon | | UW Revenues: | $32,946,299 |
| Call Protection: | L(25),D(88),O(7) | | UW Expenses: | $8,771,579 |
| Lockbox / Cash Management: | Hard / Springing | | UW NOI: | $24,174,721 |
| Additional Debt(1): | Yes | | UW NCF: | $23,570,815 |
| Additional Debt Balance(1): | $115,000,000 | | Appraised Value / Per SF: | $343,600,000 / $340 |
| Additional Debt Type(1): | Pari Passu | | Appraisal Date: | 10/30/2024 |
| | | | | |
| Escrows and Reserves(2) | | Financial Information(1) |
| | Initial | Monthly | Initial Cap | | Cut-off Date Loan / SF: | $178 |
| Taxes: | $0 | Springing | N/A | | Maturity Date Loan / SF: | $168 |
| Insurance: | $0 | Springing | N/A | | Cut-off Date LTV: | 52.4% |
| Replacement Reserves: | $0 | Springing | N/A | | Maturity Date LTV: | 49.5% |
| TI/LC Reserve: | $0 | Springing | N/A | | UW NCF DSCR: | 1.69x |
| Gap Rent Reserve: | $429,705 | $0 | N/A | | UW NOI Debt Yield: | 13.4% |
| Outstanding TI/LC: | $1,981,224 | $0 | N/A | | | |
| Major Tenant Reserve: | $0 | Springing | N/A | | | |
| | | | | | | |
| Sources and Uses |
| Sources | Proceeds | % of Total | | | Uses | Proceeds | % of Total |
| Whole Loan(1) | $180,000,000 | 62.8 | % | | Loan Payoff | $282,626,868 | 98.5 | % |
| Borrower Sponsor Equity | 106,843,216 | 37.2 | | | Upfront Reserves | 2,410,929 | 0.8 | |
| | | | | Closing Costs | 1,805,418 | 0.6 | |
| Total Sources | $286,843,216 | 100.0 | % | | Total Uses | $286,843,216 | 100.0 | % |
| (1) | The Shops at Mission Viejo Mortgage Loan (as defined below) is part of a whole loan evidenced by 10 pari passu promissory notes with an aggregate outstanding principal balance as of the Cut-off Date of $180.0 million (the “Shops at Mission Viejo Whole Loan”). The Financial Information in the chart above reflects the Shops at Mission Viejo Whole Loan. |
| (2) | For a full description of Escrows and Reserves, please refer to “Escrows and Reserves” below. |
| (3) | The Shops at Mission Viejo Property (as defined below) is part of a larger retail development consisting of a total of 1,236,320 square feet (“SF”). Macy’s operates 193,500 SF at the Shops at Mission Viejo Property through a ground lease and has another suite consisting of 224,315 SF that is not part of the collateral. |
| (4) | The decrease from 2nd Most Recent NOI to Most Recent NOI is primarily driven by occupancy (including temporary tenants) decreasing from 98.8% as of the end of 2023 to 96.3% as of October 23, 2024. |
| THE INFORMATION IN THIS STRUCTURAL AND COLLATERAL TERM SHEET IS NOT COMPLETE AND MAY BE AMENDED PRIOR TO THE TIME OF SALE. THIS TERM SHEET IS NOT AN OFFER TO SELL THESE SECURITIES AND IT IS NOT A SOLICITATION OF AN OFFER TO BUY THESE SECURITIES IN ANY JURISDICTION WHERE THE OFFER OR SALE IS NOT PERMITTED. |
| | 11 | |
| Structural and Collateral Term Sheet | | BMO 2025-C11 |
| No. 1 – Shops at Mission Viejo |
The Loan. The largest mortgage loan (the “Shops at Mission Viejo Mortgage Loan”) is part of a fixed rate whole loan secured by the borrower’s fee interest in a super-regional mall located in Mission Viejo, California (the “Shops at Mission Viejo Property”). The Shops at Mission Viejo Whole Loan consists of 10 pari passu promissory notes and accrues interest at a rate of 6.72500% per annum on an Actual/360 basis. The Shops at Mission Viejo Whole Loan has a 10-year term and is interest only for the first 60 months followed by amortization based on a 30 year schedule for the remaining term. The Shops at Mission Viejo Whole Loan was co-originated on December 4,2024 by Barclays, SGFC and Citi Real Estate Funding Inc. The Shops at Mission Viejo Mortgage Loan is evidenced by non-controlling Notes A-1-2 and A-1-3, contributed by Barclays, and non-controlling Notes A-3-2 and A-3-3, contributed by SGFC, with an aggregate original principal balance of $65,000,000. The Shops at Mission Viejo Whole Loan is expected to be serviced pursuant to the pooling and servicing agreement for the BBCMS 2025-C32 trust. See “Description of the Mortgage Pool—The Whole Loans—The Outside Serviced Pari Passu Whole Loans” and “Pooling and Servicing Agreement” in the Preliminary Prospectus.
| Whole Loan Summary |
| Note | Original Balance | Cut-off Date Balance | Note Holder | Controlling Piece |
| A-1-1 | $35,000,000 | $35,000,000 | BBCMS 2025-C32 | Yes |
| A-1-2 | $25,000,000 | $25,000,000 | BMO 2025-C11 | No |
| A-1-3 | $15,000,000 | $15,000,000 | BMO 2025-C11 | No |
| A-1-4 | $10,000,000 | $10,000,000 | BBCMS 2025-C32 | No |
| A-1-5 | $5,000,000 | $5,000,000 | BBCMS 2025-C32 | No |
| A-2-1 | $25,000,000 | $25,000,000 | WFCM 2025-C64 | No |
| A-2-2 | $20,000,000 | $20,000,000 | BBCMS 2025-C32 | No |
| A-3-1 | $20,000,000 | $20,000,000 | BBCMS 2025-C32 | No |
| A-3-2 | $15,000,000 | $15,000,000 | BMO 2025-C11 | No |
| A-3-3 | $10,000,000 | $10,000,000 | BMO 2025-C11 | No |
| Whole Loan | $180,000,000 | $180,000,000 | | |
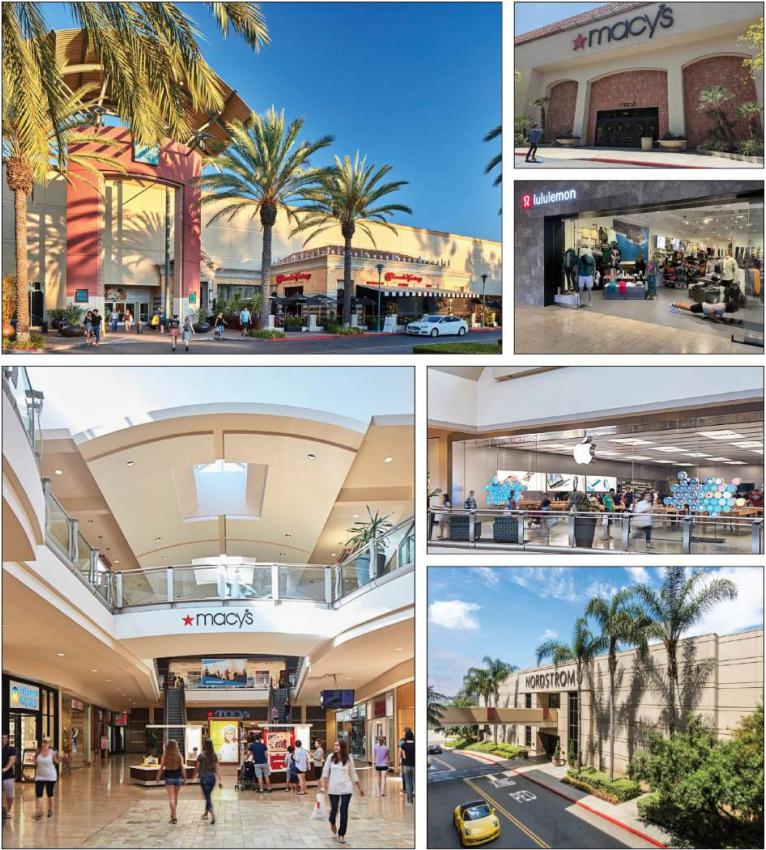
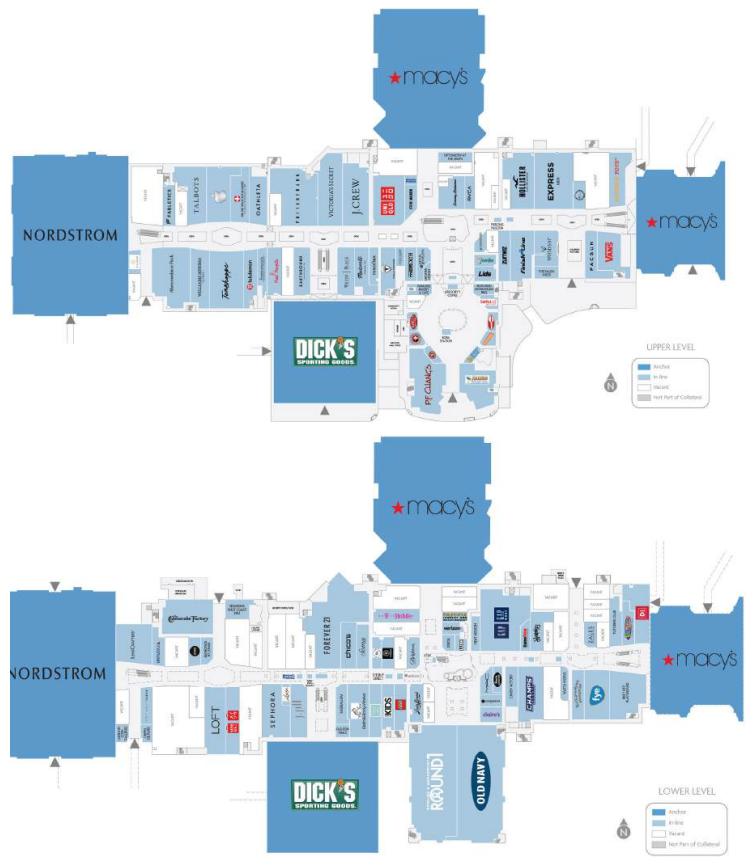
The Property. The Shops at Mission Viejo Property is a Class A, two-story, enclosed super-regional mall on a 66.70-acre site in Mission Viejo in Orange County, California. The Shops at Mission Viejo Property consists of a 1,012,005 square foot portion of a larger retail development consisting of 1,236,320 total SF. The Shops at Mission Viejo Property benefits from three anchor tenants: two Macy’s units (one of which is collateral), Dick’s Sporting Goods (“Dick’s”) and Nordstrom. Notable inline tenants include, among others, Apple, Tesla, Sephora, Lululemon, Steve Madden, Pandora and J. Crew. Food and beverage offerings at the food court include SmashBurger, Chipotle Mexican Grill and Cheesecake Factory. One Macy‘s unit representing 224,315 SF is not part of the collateral. The Shops at Mission Viejo Property was constructed in 1979 and was most recently renovated in 2021 that involved a $17.6 million interior and exterior redevelopment of the Dick’s space to allow for Dick’s to take occupancy on a build-to-suit basis.
As of October 23, 2024, the Shops at Mission Viejo Property was 89.8% leased to 116 unique tenants (excluding temporary tenants), including one medical office tenant (1.0% of underwritten base rent). Other than the three retail anchor tenants and one medical office tenant, no other tenant accounts for greater than 2.1% of net rentable area and 3.9% of underwritten base rent. In the trailing-12 month period ending September 30, 2024, the tenants at the Shops at Mission Viejo Property generated approximately $245.0 million in total sales (excluding Tesla, whose sales have been excluded from all sales data due to historical reporting variances in methodology), with comparable inline sales of $566 per square foot (less than 10,000 SF excluding Apple and Tesla) and $665 per square foot (less than 10,000 SF).
The Shops at Mission Viejo Property has benefitted from positive leasing momentum with 11 unique tenants totaling 43,868 SF (4.3% of collateral SF) and approximately $1.8 million of underwritten rent (9.2% of total underwritten rent) of recently executed leases since the beginning of 2024. Such new leasing includes two major tenants, Round 1 Bowling and Amusement and Uniqlo, collectively representing 32,196 SF.
Major Retail Tenants.
| THE INFORMATION IN THIS STRUCTURAL AND COLLATERAL TERM SHEET IS NOT COMPLETE AND MAY BE AMENDED PRIOR TO THE TIME OF SALE. THIS TERM SHEET IS NOT AN OFFER TO SELL THESE SECURITIES AND IT IS NOT A SOLICITATION OF AN OFFER TO BUY THESE SECURITIES IN ANY JURISDICTION WHERE THE OFFER OR SALE IS NOT PERMITTED. |
| | 12 | |
| Structural and Collateral Term Sheet | | BMO 2025-C11 |
| No. 1 – Shops at Mission Viejo |
Macy’s (193,500 SF; 19.1% of NRA; 0.0% of underwritten base rent): Founded in 1858 and headquartered in New York, New York, Macy’s (Fitch/Moody’s/S&P: BBB-/Ba2/BB+) is a department store chain that operates approximately 735 stores in the United States as well as Guam and Puerto Rico. Macy’s has three banners that include Macy’s, bluemercury and Bloomingdale’s (and accompanying e-commerce sites), which sell men's, women's and children's apparel and accessories, cosmetics and home furnishings, among other merchandise. Macy’s, as ground lessee, occupies the Shops at Mission Viejo Property pursuant to a ground lease from the borrower, as ground lessor, with an expiration date of February 2030 and has five, 10-year renewal options remaining with no termination options. Ground rent will remain $10 during any renewal periods. Simon Property Group, L.P. (“Simon”) estimated Macy’s sales to be $11,100,000, or $57 per square foot, for the 193,500 SF of collateral space and $20,100,000, or $90 per square foot, for the 224,315 SF of non-collateral space from the trailing-12 month period through September 2024. The 224,315 SF non-collateral space is occupied by Macy’s pursuant to a ground lease through 2069. Macy’s has been in occupancy of such space since the Shops at Mission Viejo Property opened in 1977.
Nordstrom (165,000 SF; 16.3% of NRA; 0.0% of underwritten base rent): Nordstrom (Fitch/Moody’s/S&P: BB+/Ba2/BB) was founded in 1901 as a retail shoe business in Seattle, Washington. Nordstrom is a leading fashion designer offering clothing, shoes and accessories for men, women and kids. Nordstrom has more than 350 Nordstrom, Nordstrom Local and Nordstrom Rack locations. Nordstrom was added to the Shops at Mission Viejo Property upon executing a ground lease in January 1999 that was part of a significant renovation and expansion with an original cost of $20 million. The ground lease has an initial expiration date on February 2030. Nordstrom has seven, 10-year extension options remaining. Ground rent will remain $1 during any renewal periods. For the trailing-12 month period through September 2024, Nordstrom reported sales of approximately $49.4 million, which equates to approximately $299 per square foot.
Dick's (80,000 SF; 7.9% of NRA; 7.9% of underwritten base rent): Dick’s (Fitch/Moody's/S&P: NR/Baa2/BBB) was founded in 1948 as a bait-and-tackle shop in Binghamton, New York, and has since grown to become an omnichannel sporting goods retailer, with a primary focus on sports equipment, apparel, footwear and accessories. Headquartered in Coraopolis, Pennsylvania, Dick’s offers a wide range of products through its main and specialty concept stores, including Dick’s Sporting Goods, Public Lands, Moosejaw and Going Going Gone!. Dick’s has been in occupancy at the Shops at Mission Viejo Property since May 2020 and has a lease expiration date of January 2032. Dick’s has three, five-year extension options remaining. For the trailing-12 month period through September 2024, Dick’s reported sales of approximately $19.1 million, which equates to approximately $239 per square foot.
Major Medical Office Tenant.
Welltower Mission Viejo Medical (104,500 SF; 10.3% of NRA; 1.0% of underwritten base rent): Welltower Mission Viejo Medical (“Welltower”) is an outparcel medical office that is being operated as an outpatient center with a focus on cancer care. The medical office also includes an array of health and medical services in partnership with Providence Mission Viejo Hospital that is located adjacent to Welltower. Providence Mission Viejo Hospital is the largest employer in the city of Mission Viejo and is currently undergoing a $712 million expansion. Welltower is a real estate investment trust and S&P 500 company headquartered in Toledo, Ohio. Welltower invests with senior housing operators, post-acute providers and health systems to fund the real estate infrastructure needed for health care operations. Founded in 1970, Welltower currently has a portfolio of over 430 medical properties totaling approximately 26 million square feet with locations across all 50 states. Welltower, as ground lessee, occupies the Shops at Mission Viejo Property pursuant to a ground lease from the borrower, as ground lessor, with an expiration date of January 2074 with two, 10-year renewal options remaining.
| Historical and Current Occupancy(1) |
| | 2019 | 2020 | 2021 | 2022 | 2023 | Current(2) |
| Inc. Temp Tenants | 88.7% | 96.6% | 95.3% | 98.5% | 98.8% | 96.3% |
| Excl. Temp Tenants | 85.2% | 90.6% | 88.4% | 88.2% | 90.8% | 89.8% |
| (1) | Based on December 31 of each respective year. |
| (2) | Based on the underwritten rent roll as of October 23, 2024. Temporary tenants are underwritten as vacant, however, income from such tenants is included in underwritten income. |
| THE INFORMATION IN THIS STRUCTURAL AND COLLATERAL TERM SHEET IS NOT COMPLETE AND MAY BE AMENDED PRIOR TO THE TIME OF SALE. THIS TERM SHEET IS NOT AN OFFER TO SELL THESE SECURITIES AND IT IS NOT A SOLICITATION OF AN OFFER TO BUY THESE SECURITIES IN ANY JURISDICTION WHERE THE OFFER OR SALE IS NOT PERMITTED. |
| | 13 | |
| Structural and Collateral Term Sheet | | BMO 2025-C11 |
| No. 1 – Shops at Mission Viejo |
| Top Tenant Summary(1) |
| Tenant | Ratings
(Fitch/Moody’s/S&P)(2) | Net Rentable Area (SF) | % of
Total NRA | UW Base Rent PSF(1) | UW Base Rent(1) | % of Total
UW Base Rent(1) | Lease
Expiration Date |
| Anchor Tenants | | | | | | | |
| Macy’s(3) | NR/Ba2/BB+ | 193,500 | 19.1% | $0.00 | $10 | 0.0% | 2/2/2030 |
| Nordstrom(3) | BB+/Ba2/BB | 165,000 | 16.3% | $0.00 | $0 | 0.0% | 2/28/2030 |
| Dick’s | NR/Baa2/BBB | 80,000 | 7.9% | $19.50 | $1,560,000 | 7.9% | 1/31/2032 |
| Anchor Tenants Subtotal / Wtd. Avg. | | 438,500 | 43.3% | $3.56 | $1,560,010 | 7.9% | |
| | | | | | | | |
| Medical Office Tenant | | | | | | | |
| Welltower(3) | NR/Baa1/BBB+ | 104,500 | 10.3% | $1.89 | $198,000 | 1.0% | 1/31/2074 |
| | | | | | | | |
| Major Tenants | | | | | | | |
| Old Navy | NR/NR/NR | 21,196 | 2.1% | $22.64 | $479,945 | 2.4% | 1/31/2026 |
| Round 1 Bowling and Amusement | NR/NR/NR | 20,465 | 2.0% | $37.63 | $770,000 | 3.9% | 1/31/2035 |
| Forever 21 | NR/NR/NR | 13,141 | 1.3% | $11.78 | $154,757 | 0.8% | 1/31/2027 |
| Uniqlo(4) | NR/NR/NR | 11,731 | 1.2% | $37.30 | $437,566 | 2.2% | 8/31/2035 |
| The Gap/Gap Body | NR/B1/BB | 10,617 | 1.0% | $59.94 | $636,422 | 3.2% | 1/31/2027 |
| Pottery Barn | NR/NR/NR | 10,048 | 1.0% | $35.64 | $358,138 | 1.8% | 1/31/2025 |
| Express Men | NR/NR/NR | 9,748 | 1.0% | $14.53 | $141,638 | 0.7% | 1/31/2029 |
| Abercrombie & Fitch | NR/NR/BB | 9,350 | 0.9% | $40.88 | $382,222 | 1.9% | 1/31/2026 |
| Tenshoppe | NR/NR/NR | 8,681 | 0.9% | $25.43 | $220,758 | 1.1% | 11/30/2025 |
| Victoria's Secret | NR/B1/BB- | 7,709 | 0.8% | $41.23 | $317,842 | 1.6% | 1/31/2033 |
| Major Tenants Subtotal / Wtd. Avg. | | 122,686 | 12.1% | $31.78 | $3,899,289 | 19.6% | |
| Remaining Occupied | | 243,443 | 24.1% | $58.31 | $14,194,421 | 71.5% | |
| Occupied Collateral Total / Wtd. Avg. | | 909,129 | 89.8% | $21.84 | $19,851,720 | 100.0% | |
| | | | | | | | |
| Vacant Space | | 102,876 | 10.2% | | | | |
| | | | | | | | |
| Collateral Total | | 1,012,005 | 100.0% | | | | |
| | | | | | | | |
| (1) | Based on the underwritten rent roll dated October 23, 2024, inclusive of rent steps through December 2025. |
| (2) | In certain instances, ratings provided are those of the parent company of the entity shown, whether or not the parent company guarantees the lease. |
| (3) | Nordstrom, Macy’s and Welltower are subject to ground leases. |
| (4) | In the event that Uniqlo does not achieve sales of at least $4,271,726 during the 12 month period from September 1, 2027 through August 31, 2028 (the “Sales Measuring Period”), Uniqlo has the right to terminate its lease by providing notice within 90 days of the end of the Sales Measuring Period and the lease termination would be effective one year after providing such notice. |
| THE INFORMATION IN THIS STRUCTURAL AND COLLATERAL TERM SHEET IS NOT COMPLETE AND MAY BE AMENDED PRIOR TO THE TIME OF SALE. THIS TERM SHEET IS NOT AN OFFER TO SELL THESE SECURITIES AND IT IS NOT A SOLICITATION OF AN OFFER TO BUY THESE SECURITIES IN ANY JURISDICTION WHERE THE OFFER OR SALE IS NOT PERMITTED. |
| | 14 | |
| Structural and Collateral Term Sheet | | BMO 2025-C11 |
| No. 1 – Shops at Mission Viejo |
| Tenant Sales(1)(2) |
| | 2019 | 2021 | 2022 | 2023 | TTM(3) |
| Gross Mall Sales | $293,240,349 | $211,527,376 | $241,604,693 | $252,622,256 | $244,989,630 |
| Sales PSF (Inline < 10,000 SF) | $715 | $569 | $653 | $684 | $665 |
| Sales PSF (Inline < 10,000 SF, Ex-Apple / Tesla) | $553 | $501 | $565 | $580 | $566 |
| Occupancy Cost (Inline < 10,000 SF) | 13.5% | 16.4% | 13.8% | 13.4% | 12.8% |
| Occupancy Cost (Inline < 10,000 SF, Ex-Apple / Tesla) | 17.2% | 18.4% | 15.8% | 15.7% | 14.9% |
| (1) | Includes the borrower sponsor’s provided estimates for non-reporting anchor tenants and/or non-collateral tenants. Macy’s does not report sales for its collateral and non-collateral spaces. |
| (2) | 2020 sales are excluded due to the adverse impact of the COVID-19 pandemic. Tesla sales are excluded from all sales data due to historical reporting variances. |
| (3) | Based on the trailing-12 month period as of September 30, 2024. |
| Major Tenant Sales(1)(2) |
| Tenant Name | SF | 2019 | 2021 | 2022 | 2023 | 9/30/2024 TTM | Occupancy Cost | 9/30/2024 TTM
Sales PSF |
| Anchor Tenants | | | | | | | | |
| Macy’s(3) | 193,500 | $13,100,000 | $11,800,000 | $11,700,000 | $11,100,000 | $11,100,000 | 0.6% | $57 |
| Nordstrom | 165,000 | $55,450,000 | $45,699,000 | $62,174,000 | $54,767,955 | $49,364,357 | 0.3% | $299 |
| Dick’s | 80,000 | NAV | NAV | $17,566,000 | $17,398,683 | $19,100,000 | 9.9% | $239 |
| Major Tenants | | | | | | | | |
| Old Navy | 21,196 | $3,813,000 | $3,041,000 | $2,809,000 | $2,855,915 | $2,925,013 | 20.2% | $138 |
| Forever 21 | 13,141 | NAV | $506,000 | $1,651,000 | $1,406,717 | $1,282,319 | 14.0% | $98 |
| The Gap/Gap Body | 10,617 | $2,601,000 | $1,960,000 | $2,010,000 | $2,163,548 | $2,542,138 | 45.0% | $239 |
| Pottery Barn | 10,048 | $6,880,000 | $7,500,000 | $8,801,000 | $7,556,008 | $7,153,671 | 10.2% | $712 |
| Signature Tenants | | | | | | | | |
| Abercrombie & Fitch | 9,350 | $1,731,000 | $1,954,000 | $2,071,000 | $2,557,750 | $3,036,791 | 14.7% | $325 |
| Victoria's Secret | 7,709 | $4,824,000 | $3,789,000 | $3,878,000 | $3,480,655 | $4,553,559 | 12.9% | $591 |
| J. Crew | 7,100 | $1,791,000 | $1,903,000 | $2,144,000 | $2,588,908 | $2,817,790 | 11.1% | $397 |
| Cheesecake Factory | 6,927 | $9,980,000 | $10,015,000 | $10,861,000 | $10,730,469 | $10,516,158 | 6.4% | $1,518 |
| Apple | 6,195 | $50,363,000 | $19,693,000 | $24,418,000 | $28,302,090 | $26,569,865 | 2.4% | $4,289 |
| Sephora | 5,338 | $7,128,000 | $4,576,000 | $6,627,000 | $8,894,692 | $9,298,805 | 7.7% | $1,742 |
| Williams-Sonoma | 4,718 | $2,485,000 | $3,080,000 | $3,168,000 | $3,260,723 | $3,434,306 | 10.9% | $728 |
| Tommy Bahama | 3,387 | $2,395,000 | $2,479,000 | $2,827,000 | $2,533,608 | $2,402,062 | 19.6% | $709 |
| Lululemon | 3,099 | $6,836,000 | $5,010,000 | $6,194,000 | $6,685,376 | $6,742,842 | 5.7% | $2,176 |
| Lego | 2,321 | $1,665,000 | $2,985,000 | $3,319,000 | $3,052,182 | $2,965,632 | 10.3% | $1,278 |
| (1) | All sales information presented herein with respect to the Shops at Mission Viejo Property is based upon information provided by the borrower sponsor. In certain instances, sales figures represent estimates because the tenants are not required to report, or otherwise may not have reported sales information on a timely basis. Further, because sales are self-reported, such information is not independently verified by the borrower sponsor. |
| (2) | 2020 excluded due to the adverse impact of the COVID-19 pandemic on the Shops at Mission Viejo Property. |
| (3) | Based on estimates provided by the borrower sponsor as Macy’s does not report sales. |
| THE INFORMATION IN THIS STRUCTURAL AND COLLATERAL TERM SHEET IS NOT COMPLETE AND MAY BE AMENDED PRIOR TO THE TIME OF SALE. THIS TERM SHEET IS NOT AN OFFER TO SELL THESE SECURITIES AND IT IS NOT A SOLICITATION OF AN OFFER TO BUY THESE SECURITIES IN ANY JURISDICTION WHERE THE OFFER OR SALE IS NOT PERMITTED. |
| | 15 | |
| Structural and Collateral Term Sheet | | BMO 2025-C11 |
| No. 1 – Shops at Mission Viejo |
| Lease Rollover Schedule(1)(2) |
| Year | Number of Leases Expiring | Net Rentable Area Expiring | % of NRA Expiring | UW Base Rent Expiring | % of UW Base Rent Expiring | Cumulative Net Rentable Area Expiring | Cumulative % of NRA Expiring | Cumulative UW Base Rent Expiring | Cumulative % of UW Base Rent Expiring |
| Vacant | NAP | 102,876 | 10.2% | NAP | NAP | 102,876 | 10.2% | NAP | NAP |
| 2025 & MTM | 27 | 75,833 | 7.5% | $2,824,046 | 14.2% | 178,709 | 17.7% | $2,824,046 | 14.2% |
| 2026 | 25 | 94,348 | 9.3% | $4,893,766 | 24.7% | 273,057 | 27.0% | $7,717,812 | 38.9% |
| 2027 | 18 | 51,790 | 5.1% | $2,746,512 | 13.8% | 324,847 | 32.1% | $10,464,324 | 52.7% |
| 2028 | 8 | 12,949 | 1.3% | $1,037,348 | 5.2% | 337,796 | 33.4% | $11,501,673 | 57.9% |
| 2029 | 12 | 30,543 | 3.0% | $1,168,107 | 5.9% | 368,339 | 36.4% | $12,669,780 | 63.8% |
| 2030 | 12 | 387,629 | 38.3% | $2,119,516 | 10.7% | 755,968 | 74.7% | $14,789,296 | 74.5% |
| 2031 | 4 | 8,022 | 0.8% | $540,251 | 2.7% | 763,990 | 75.5% | $15,329,547 | 77.2% |
| 2032 | 4 | 89,093 | 8.8% | $2,100,725 | 10.6% | 853,083 | 84.3% | $17,430,273 | 87.8% |
| 2033 | 3 | 14,333 | 1.4% | $463,498 | 2.3% | 867,416 | 85.7% | $17,893,771 | 90.1% |
| 2034 | 3 | 4,808 | 0.5% | $416,273 | 2.1% | 872,224 | 86.2% | $18,310,044 | 92.2% |
| 2035 | 2 | 32,196 | 3.2% | $1,207,566 | 6.1% | 904,420 | 89.4% | $19,517,610 | 98.3% |
| 2036 & Thereafter | 2 | 107,585 | 10.6% | $334,110 | 1.7% | 1,012,005 | 100.0% | $19,851,720 | 100.0% |
| Total | 120 | 1,012,005 | 100.0% | $19,851,720 | 100.0% | | | | |
| (1) | Based on the underwritten rent roll dated October 23, 2024 inclusive of rent steps through December 2025. |
| (2) | Certain tenants may have lease termination options that are exercisable prior to the originally stated expiration date of the subject lease and that are not considered in the Lease Rollover Schedule. |
Environmental. According to the Phase I environmental site assessment dated November 5, 2024, there was no evidence of any recognized environmental conditions at the Shops at Mission Viejo Property.
| Operating History and Underwritten Net Cash Flow(1) | |
| | 2021) | 2022 | 2023(2) | TTM 9/30/2024(2) | Underwritten | Per SF | %(3) |
| Base Rent | $20,285,085 | $19,884,382 | $19,881,736 | $19,292,499 | $19,487,194 | $19.26 | 52.8% |
| Contractual Rent Steps(4) | 0 | 0 | 0 | 0 | 364,526 | $0.36 | 1.0 |
| Credit Tenant Rent Steps | 0 | 0 | 0 | 0 | 121,892 | $0.12 | 0.3 |
| Temporary Tenant Rent | 1,568,156 | 2,041,575 | 2,193,164 | 2,015,799 | 2,101,000 | $2.08 | 5.7 |
| Percentage in Lieu Rent | 344,873 | 110,773 | 299,278 | 281,009 | 248,573 | $0.25 | 0.7 |
| Overage Rent | 926,893 | 1,599,365 | 1,334,111 | 1,266,529 | 862,043 | $0.85 | 2.3 |
| Other Rental Income | 205,717 | 205,944 | 189,833 | 196,947 | 202,000 | $0.20 | 0.5 |
| Gross-Up Vacant Rent | 0 | 0 | 0 | 0 | 4,465,543 | $4.41 | 12.1 |
| Net Rental Income | $23,330,724 | $23,842,039 | $23,898,122 | $23,052,783 | $27,852,771 | $27.52 | 75.5% |
| Total Recoveries | 8,741,330 | 7,737,820 | 8,631,027 | 8,571,797 | 9,056,105 | $8.95 | 24.5 |
| Gross Potential Income | $32,072,054 | $31,579,859 | $32,529,149 | $31,624,580 | $36,908,876 | $36.47 | 100.0% |
| Vacancy & Bad Debt | 0 | 0 | 0 | 0 | (5,283,576) | (5.22) | (14.3) |
| Miscellaneous Income | 1,028,204 | 1,018,361 | 1,213,703 | 1,146,579 | 1,321,000 | $1.31 | 3.6 |
| Effective Gross Income | $33,100,258 | $32,598,220 | $33,742,852 | $32,771,159 | $32,946,299 | $32.56 | 89.3% |
| Taxes | 1,501,687 | 1,719,161 | 1,748,385 | 1,757,126 | 1,780,005 | $1.76 | 5.4 |
| Insurance | 966,390 | 1,058,211 | 1,195,409 | 1,318,030 | 1,363,648 | $1.35 | 4.1 |
| Management Fee | 993,121 | 1,007,385 | 1,002,899 | 983,193 | 988,329 | $0.98 | 3.0 |
| Other Expenses | 3,770,823 | 4,063,412 | 4,574,669 | 4,570,007 | 4,639,596 | $4.58 | 14.1 |
| Total Expenses | 7,232,021 | 7,848,169 | 8,521,362 | 8,628,356 | 8,771,579 | $8.67 | 26.6% |
| Net Operating Income | $25,868,237 | $24,750,051 | $25,221,490 | $24,142,803 | $24,174,721 | $23.89 | 73.4% |
| Capital Expenditures | 0 | 0 | 0 | 0 | 54,901 | $0.05 | 0.2 |
| TI/LC | 0 | 0 | 0 | 0 | 549,005 | $0.54 | 1.7 |
| Net Cash Flow | $25,868,237 | $24,750,051 | $25,221,490 | $24,142,803 | $23,570,815 | $23.29 | 71.5% |
| (1) | Based on the underwritten rent roll dated October 23, 2024. |
| (2) | The decrease from 2023 NOI to TTM 9/30/2024 NOI is primarily driven by occupancy (including temporary tenants) decreasing from 98.8% as of the end of 2023 to 96.3% as of October 23, 2024. |
| (3) | % column represents percentage of Gross Potential Income for all revenue lines and represents percentage of Effective Gross Income for the remaining fields. |
| (4) | Contractual Rent Steps were taken through December 2025. |
| THE INFORMATION IN THIS STRUCTURAL AND COLLATERAL TERM SHEET IS NOT COMPLETE AND MAY BE AMENDED PRIOR TO THE TIME OF SALE. THIS TERM SHEET IS NOT AN OFFER TO SELL THESE SECURITIES AND IT IS NOT A SOLICITATION OF AN OFFER TO BUY THESE SECURITIES IN ANY JURISDICTION WHERE THE OFFER OR SALE IS NOT PERMITTED. |
| | 16 | |
| Structural and Collateral Term Sheet | | BMO 2025-C11 |
| No. 1 – Shops at Mission Viejo |
The Market. The Shops at Mission Viejo Property is located in the South submarket of the broader Orange County retail market. The Shops at Mission Viejo Property benefits from its accessible location as it is adjacent to Interstate 5, which is a main thoroughfare throughout Orange County and allows for direct access to Los Angeles. Residential development dominates the area surrounding the Shops at Mission Viejo Property. Additionally, the Shops at Mission Viejo Property is the southernmost mall in the competitive set as identified in the appraisal. Providence Mission Hospital and Saddleback College, the two largest employers in Mission Viejo, are both located across the street from the Shops at Mission Viejo Property. Providence Mission Hospital is in the midst of a $712 million expansion and Saddleback College, which consists of approximately 26,000 students, recently completed an expansion project in March of 2024 that added a $60 million facility dedicated to student services.
The South retail submarket consists of approximately 9.7 million SF and is the second largest of the five submarkets within the approximately 41.6 million SF Orange County market. As of the second quarter of 2024, the 6.5% vacancy rate in the submarket is lower than the 6.7% vacancy rate for the Orange County retail market. Additionally, the South submarket asking rent of $39.34 per square foot is greater than the Orange County market asking rent of $34.68 per square foot. Asking rent in the submarket and market have grown each year since 2021.
According to the appraisal, the estimated 2023 population within a five-, seven- and 10-mile radius was 293,855, 469,899 and 651,466, respectively. Additionally, for the same period, the average household income within the same radii was $164,778, $166,335 and $167,972, respectively.
The following table presents certain information relating to the appraiser’s market rent conclusions for the Shops at Mission Viejo– Property:
| Market Rent Summary(1) |
| | Market Rent (PSF) | Lease Term (Yrs.) | Rent Increase Projections | New Tenant Improvements |
| 0 – 1,200 SF | $80.00 | 8 | 3.0% | $40.00 |
| 1,201 – 2,000 SF | $60.00 | 8 | 3.0% | $40.00 |
| 2,001 – 3,500 SF | $45.00 | 8 | 3.0% | $40.00 |
| 3,501 – 5,000 SF | $35.00 | 8 | 3.0% | $40.00 |
| 5,001 – 10,000 SF | $27.00 | 8 | 3.0% | $40.00 |
| 10,000 SF + | $30.00 | 8 | 3.0% | $40.00 |
| Restaurants | $45.00 | 10 | 3.0% | $75.00 |
| Jewelers | $80.00 | 8 | 3.0% | $40.00 |
| Food Court | $100.00 | 8 | 3.0% | $40.00 |
| Kiosk | $400.00 | 5 | 3.0% | $40.00 |
| ATM | $600.00 | 5 | 3.0% | $40.00 |
| (1) | Based on the appraisal. |
| THE INFORMATION IN THIS STRUCTURAL AND COLLATERAL TERM SHEET IS NOT COMPLETE AND MAY BE AMENDED PRIOR TO THE TIME OF SALE. THIS TERM SHEET IS NOT AN OFFER TO SELL THESE SECURITIES AND IT IS NOT A SOLICITATION OF AN OFFER TO BUY THESE SECURITIES IN ANY JURISDICTION WHERE THE OFFER OR SALE IS NOT PERMITTED. |
| | 17 | |
| Structural and Collateral Term Sheet | | BMO 2025-C11 |
| No. 1 – Shops at Mission Viejo |
The following table presents certain information relating to comparable retail centers for the Shops at Mission Viejo Property:
| Competitive Retail Center Summary(1) |
| Property / Location | Year Built / Renovated or Expanded | Total NRA (SF) | Occupancy | Distance to Subject | Sales PSF | Anchor Tenants |
Shops at Mission Viejo Mission Viejo, CA | 1979 / 2000, 2021 | 1,012,005(2)(3) | 89.8%(2)(3) | NAP | $665(4) | Macy’s, Nordstrom, Dick’s |
Irvine Spectrum Center Irvine, CA | 1995 / 2016 | 1,388,737 | 95% | 11 miles | $1,100 - $1,200(5) | Nordstrom, Target, Regal Cinemas, Dave & Busters, Newfound Market |
Fashion Island Newport Beach, CA | 1967 / 2003, 2017 | 1,573,000 | 96% | 15 miles | $1,400 - $1,600(5) | Nordstrom, Macy’s, Bloomingdale’s, Neiman Marcus, Whole Foods, Cinema |
South Coast Plaza Costa Mesa, CA | 1967 / 1999 | 2,740,000 | 95% | 18 miles | $1,300 - $1,500(5) | Bloomingdale’s, Macy’s, Saks Fifth Avenue, Nordstrom |
Marketplace at Laguna Niguel and Plaza De La Paz Laguna Niguel, CA | 1990 & 1994 / 1994 | 811,000 | 94% | 4 miles | NAV | Kohl’s, Costco, The Home Depot, Hobby Lobby, Walmart, Marshall’s, Old Navy |
Outlets at San Clemente San Clemente, CA | 2015 / NAP | 369,500 | 85% | 11 miles | $500 - $550 | Metropolitan Theatres, Nike, H&M |
| (1) | Based on the appraisal. |
| (2) | Based on the underwritten rent roll as of October 23, 2024. |
| (3) | Total NRA (SF) and Occupancy exclude the non-collateral Macy’s space. |
| (4) | Represents sales per square foot as of September 30, 2024 for in-line tenants. All sales information presented herein with respect to the Shops at Mission Viejo Property is based upon information provided by the borrower sponsor. |
| (5) | Includes sales attributed to Apple. |
The Borrower. The borrower for the Shops at Mission Viejo Whole Loan is Shops at Mission Viejo, LLC, a Delaware limited liability company and single purpose entity with two independent directors. Legal counsel to the borrower delivered a non-consolidation opinion in connection with the origination of the Shops at Mission Viejo Whole Loan.
The Borrower Sponsor. The borrower sponsors are Simon (51% interest) and Institutional Mall Investors LLC (“IMI”) (49% interest). Simon is the non-recourse carveout guarantor. So long as the non-recourse carveout guarantor is either Simon, Simon Property Group, Inc., a Delaware corporation, or an IMI Key Principal (as defined below), the liability under the guaranty is limited to 20% ($36,000,000) of the original principal amount of the Shops at Mission Viejo Whole Loan, plus all reasonable out-of-pocket costs and expenses incurred in the enforcement of the guaranty or preservation of the lenders’ rights under the guaranty. There is no separate environmental indemnity for the Shops at Mission Viejo Whole Loan; however, the non-recourse carveout guaranty provides loss recourse for breaches of representations, warranties and indemnification provisions in the Shops at Mission Viejo Whole Loan agreement concerning environmental laws and hazardous materials (subject to the aforementioned 20% cap).
Simon is the operating partnership of Simon Property Group Inc. (NYSE: SPG / S&P: A-), an S&P 100 company and owner of shopping, dining, entertainment and mixed-use destinations. As of March 31, 2024, Simon owned or held an interest in 195 income-producing properties in the United States, including 93 malls, 69 premium outlets, 14 Mills-branded shopping centers, six lifestyle centers and 13 other retail properties. Simon also owns an 84% non-controlling interest in The Taubman Realty Group, LLC, or TRG, which has an interest in 23 regional, super-regional and outlet malls in the United States and Asia. Additionally, Simon has a 22.4% ownership interest in Klépierre SA, a publicly traded, Paris-based real estate company, which owns shopping centers in 14 European countries. As of December 12, 2024, Simon had an equity market capitalization of approximately $57.8 billion.
IMI is a co-investment venture owned by an affiliate of Miller Capital Advisory and California Public Employees’ Retirement System (“CalPERS”), the nation’s largest public pension fund. IMI focuses on high-quality, fashion-oriented retail properties throughout the United States. As of September 2024, IMI’s portfolio included approximately 20.6 million SF of retail space and over approximately 1.2 million SF of prime office space.
| THE INFORMATION IN THIS STRUCTURAL AND COLLATERAL TERM SHEET IS NOT COMPLETE AND MAY BE AMENDED PRIOR TO THE TIME OF SALE. THIS TERM SHEET IS NOT AN OFFER TO SELL THESE SECURITIES AND IT IS NOT A SOLICITATION OF AN OFFER TO BUY THESE SECURITIES IN ANY JURISDICTION WHERE THE OFFER OR SALE IS NOT PERMITTED. |
| | 18 | |
| Structural and Collateral Term Sheet | | BMO 2025-C11 |
| No. 1 – Shops at Mission Viejo |
“IMI Key Principal” means one or more of IMI, CalPERS or any person of which CalPERS owns, directly or indirectly, at least 50% of the capital and profits.
Property Management. The Shops at Mission Viejo Property is managed by Simon Management Associates, LLC, an affiliate of the borrower sponsor.
Escrows and Reserves. At origination, the borrower was required to deposit into escrow (i) $1,981,224 for outstanding tenant improvement allowances and leasing commissions and (ii) $429,705 for outstanding gap rent.
Tax Escrows – On a monthly basis, during the continuance of a Reserve Trigger Period (as defined below) or at any time taxes are not paid by the borrower prior to the assessment of any penalty, the borrower is required to escrow 1/12th of the annual estimated tax payments payable during the next ensuing 12 months.
Insurance Escrows – During the continuance of a Reserve Trigger Period, except if the Shops at Mission Viejo Property is insured under an acceptable blanket policy, the borrower is required to escrow 1/12th of the annual estimated insurance payments on a monthly basis.
Replacement Reserves – During the continuance of a Reserve Trigger Period, the borrower is required to escrow approximately $12,000 on a monthly basis for replacements and repairs to be made at the Shops at Mission Viejo Property.
TI/LC Reserves – During the continuance of a Reserve Trigger Period, the borrower is required to escrow approximately $79,000 on a monthly basis for ongoing leasing reserves.
Major Tenant Reserve – During the continuance of a Major Tenant Trigger Event (as defined below), the borrower is required to escrow an amount equal to 1/12th of the applicable Major Tenant Threshold Amount (as defined below) on a monthly basis until such Major Tenant Threshold Amount is reached.
A “Reserve Trigger Period” commences upon the net operating income debt yield (the “NOI Debt Yield”) falling below 10.50% for two consecutive calendar quarters, and cures upon the NOI Debt Yield reaching 10.50% for two consecutive calendar quarters.
A “Major Tenant Trigger Event” commences upon the earlier to occur of (i) a Major Tenant (as defined below) bankruptcy event, (ii) a Major Tenant vacates its space or goes dark for a period of at least 90 days or (iii) a Major Tenant Renewal Event (as defined below).
Such Major Tenant Trigger Event will be cured with respect to (a) clause (i) above, upon the resolution of the bankruptcy event, the Major Tenant Threshold Amount has been deposited into the Major Tenant reserve account or a permitted guarantor has delivered to the lenders a Major Tenant guaranty with liability limited to the applicable Major Tenant Threshold Amount, (b) clause (ii) above, the Major Tenant reopens for 30 consecutive days or, if applicable, the Major Tenant Threshold Amount has been deposited into the Major Tenant reserve account or (c) clause (iii) above, a Major Tenant Renewal Event Cure (as defined below).
A “Major Tenant” means Macy’s (193,500 SF of collateral space), Nordstrom, Dick’s or any replacement tenant occupying at least 50% of the space occupied by one or more of the foregoing.
A “Major Tenant Renewal Event” means, unless such Major Tenant lease has been renewed or extended, the earlier of (x) the date on which such Major Tenant gives notice that it will not be renewing its lease and (y) the date that is six months prior to the date of such Major Tenant’s lease expiration.
A Major Tenant Renewal event will be cured upon (a) such Major Tenant renews and/or extends the Major Tenant lease, (b) not less than 50% of the space demised by the Major Tenant lease has been leased to one or more new tenants, (c) the applicable notice of intent not to renew has been rescinded, (d) the applicable Major Tenant Threshold Amount has been deposited into the Major Tenant Reserve Account or (e) at the borrower’s election, a permitted guarantor has delivered to the lenders a Major Tenant guaranty with liability limited to the applicable Major Tenant Threshold Amount (collectively, a “Major Tenant Renewal Event Cure”).
| THE INFORMATION IN THIS STRUCTURAL AND COLLATERAL TERM SHEET IS NOT COMPLETE AND MAY BE AMENDED PRIOR TO THE TIME OF SALE. THIS TERM SHEET IS NOT AN OFFER TO SELL THESE SECURITIES AND IT IS NOT A SOLICITATION OF AN OFFER TO BUY THESE SECURITIES IN ANY JURISDICTION WHERE THE OFFER OR SALE IS NOT PERMITTED. |
| | 19 | |
| Structural and Collateral Term Sheet | | BMO 2025-C11 |
| No. 1 – Shops at Mission Viejo |
“Major Tenant Threshold Amount” means the amount, with respect to (i) the Macy’s collateral space, of $9,675,000, (ii) the space occupied by Nordstrom, of $8,250,000 and (iii) the space occupied by Dick’s, of $4,000,000.
Lockbox / Cash Management. The Shops at Mission Viejo Whole Loan is structured with a hard lockbox and springing cash management. The borrower and property manager are required to direct the tenants to pay rent directly into the lockbox account, and to deposit any rents otherwise received into such account within two business days after receipt. During the continuance of a Lockbox Event Period (as defined below), all funds in the lockbox account are required to be swept on a weekly basis to a lender-controlled cash management account. Funds in the cash management account are required to be applied to debt service and the reserves and escrows described above, with any excess funds (i) to be deposited into an excess cash flow reserve account held by the lenders as cash collateral for the Shops at Mission Viejo Whole Loan or (ii) if no Lockbox Event Period is continuing, disbursed to the borrower.
A “Lockbox Event Period” means the period commencing upon the occurrence of (i) an event of default, (ii) a bankruptcy action of the borrower or property manager (if the property manager is an affiliate of the borrower) and the property manager is not replaced within 60 days with a qualified manager or (iii) the NOI Debt Yield being less than 10.50% for two consecutive calendar quarters. A Lockbox Event Period will end with respect to (a) clause (i) above, if the cure of the event of default has been accepted by the lenders, (b) clause (ii) above, if the property manager is replaced within 60 days or the bankruptcy action with respect to the property manager is dismissed within 90 days without adverse consequences to the Shops at Mission Viejo Property or (c) clause (iii) above, if (A) the NOI Debt Yield is greater than or equal to 10.50% for two consecutive calendar quarters, (B) the borrower prepays a portion of the Shops at Mission Viejo Whole Loan in accordance with the Shops at Mission Viejo Whole Loan documents in an amount sufficient such that the debt yield is no less than 10.50%, together with, if prior to the open period, the yield maintenance premium or (C) the borrower delivers to the lenders (1) cash, (2) U.S. obligations, (3) other securities having a rating reasonably acceptable to the lenders and for which a rating agency confirmation has been received or (4) a letter of credit, in each case, in an amount which, if applied to the repayment of the Shops at Mission Viejo Whole Loan would result in a debt yield equal to 10.50%.
Subordinate and Mezzanine Debt. None.
Permitted Future Subordinate or Mezzanine Debt. Not permitted. However, the Shops at Mission Viejo Whole Loan documents permit the borrower to enter into a Property Assessed Clean Energy loan for an amount not to exceed $5,000,000, subject to the consent of the lenders and delivery of a rating agency confirmation.
Partial Release. The Shops at Mission Viejo Whole Loan documents permit the borrower to obtain the release of non-income producing portions of the Shops at Mission Viejo Property in connection with a transfer to third parties or affiliates of the borrower without the payment of a release price provided that, among other conditions, the borrower satisfies customary REMIC requirements.
Additionally, the borrower is permitted to release the proposed space for a planned 50,000 square foot lifestyle development that is expected to break ground in the near future without the payment of a release price provided that, among other conditions, the borrower satisfies the REMIC requirements. The proposed expansion space is expected to be located between Dick’s and Macy’s.
Ground Lease. None.
| THE INFORMATION IN THIS STRUCTURAL AND COLLATERAL TERM SHEET IS NOT COMPLETE AND MAY BE AMENDED PRIOR TO THE TIME OF SALE. THIS TERM SHEET IS NOT AN OFFER TO SELL THESE SECURITIES AND IT IS NOT A SOLICITATION OF AN OFFER TO BUY THESE SECURITIES IN ANY JURISDICTION WHERE THE OFFER OR SALE IS NOT PERMITTED. |
| | 20 | |
| Structural and Collateral Term Sheet | | BMO 2025-C11 |
| No. 2 – UOVO QPN |
| THE INFORMATION IN THIS STRUCTURAL AND COLLATERAL TERM SHEET IS NOT COMPLETE AND MAY BE AMENDED PRIOR TO THE TIME OF SALE. THIS TERM SHEET IS NOT AN OFFER TO SELL THESE SECURITIES AND IT IS NOT A SOLICITATION OF AN OFFER TO BUY THESE SECURITIES IN ANY JURISDICTION WHERE THE OFFER OR SALE IS NOT PERMITTED. |
| | 21 | |
| Structural and Collateral Term Sheet | | BMO 2025-C11 |
| No. 2 – UOVO QPN |
| THE INFORMATION IN THIS STRUCTURAL AND COLLATERAL TERM SHEET IS NOT COMPLETE AND MAY BE AMENDED PRIOR TO THE TIME OF SALE. THIS TERM SHEET IS NOT AN OFFER TO SELL THESE SECURITIES AND IT IS NOT A SOLICITATION OF AN OFFER TO BUY THESE SECURITIES IN ANY JURISDICTION WHERE THE OFFER OR SALE IS NOT PERMITTED. |
| | 22 | |
| Structural and Collateral Term Sheet | | BMO 2025-C11 |
| No. 2 – UOVO QPN |
| Mortgage Loan Information | | Property Information |
| Mortgage Loan Sellers: | BMO, GACC | | Single Asset / Portfolio: | Single Asset |
| Original Principal Balance(1): | $65,000,000 | | Title: | Fee |
| Cut-off Date Principal Balance(1): | $65,000,000 | | Property Type - Subtype: | Self-Storage – Self-Storage |
| % of IPB: | 7.2% | | Net Rentable Area (SF): | 281,494 |
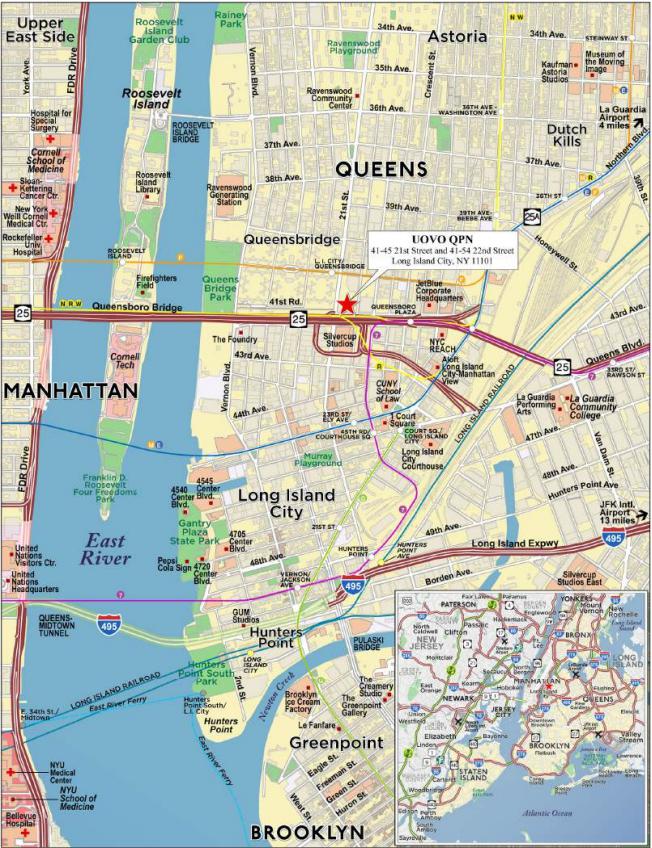
| Loan Purpose: | Refinance | | Location: | Long Island City, NY |
| Borrowers: | QPN 1 DE LLC and QPN 10 DE LLC | | Year Built / Renovated: | 2013 / NAP |
| Borrower Sponsor(2): | Steven J. Guttman | | Occupancy(5): | 87.3% |
| Interest Rate: | 6.48500% | | Occupancy Date: | 11/1/2024 |
| Note Date: | 1/22/2025 | | 4th Most Recent NOI (As of): | $11,871,108 (12/31/2021) |
| Maturity Date: | 2/6/2035 | | 3rd Most Recent NOI (As of): | $12,230,675 (12/31/2022) |
| Interest-only Period: | 120 months | | 2nd Most Recent NOI (As of): | $13,136,852 (12/31/2023) |
| Original Term: | 120 months | | Most Recent NOI (As of): | $12,841,638 (TTM 9/30/2024) |
| Original Amortization Term: | None | | UW Economic Occupancy: | 78.6% |
| Amortization Type: | Interest Only | | UW Revenues: | $17,547,845 |
| Call Protection(3): | L(24),DorYM1(89),O(7) | | UW Expenses: | $3,643,783 |
| Lockbox / Cash Management: | Soft / Springing | | UW NOI: | $13,904,062 |
| Additional Debt(1): | Yes | | UW NCF: | $13,861,838 |
| Additional Debt Balance(1): | $78,000,000 | | Appraised Value / Per SF: | $234,900,000 / $834 |
| Additional Debt Type(1): | Pari Passu | | Appraisal Date: | 12/16/2024 |
| | | | | |
| Escrows and Reserves(4) | | Financial Information(1) |
| | Initial | Monthly | Initial Cap | | Cut-off Date Loan / SF: | $508 | |
| Taxes: | $183,288 | $61,096 | N/A | | Maturity Date Loan / SF: | $508 | |
| Insurance: | $0 | Springing | N/A | | Cut-off Date LTV: | 60.9% | |
| Replacement Reserve: | $0 | Springing | N/A | | Maturity Date LTV: | 60.9% | |
| Immediate Repairs: | $14,300 | $0 | N/A | | UW NCF DSCR: | 1.47x | |
| | | | | | UW NOI Debt Yield: | 9.7% | |
| | | | | | | |
| Sources and Uses |
| Sources | Proceeds | % of Total | | Uses | Proceeds | % of Total |
| Whole Loan | $143,000,000 | 100.0% | | Loan Payoff | $75,832,056 | 53.0 | % |
| | | | | Return of Equity | 63,964,738 | 44.7 | |
| | | | | Closing Costs | 3,005,619 | 2.1 | |
| | | | | Upfront Reserves | 197,588 | 0.1 | |
| Total Sources | $143,000,000 | 100.0% | | Total Uses | $143,000,000 | 100.0 | % |
| (1) | The UOVO QPN Mortgage Loan (as defined below) is part of the UOVO QPN Whole Loan (as defined below) which is comprised of six pari passu promissory notes with an aggregate original principal balance and Cut-off Date balance of $143,000,000. The UOVO QPN Whole Loan was originated by Bank of Montreal (“BMO”) on January 22, 2025. The financial information presented above is based on the UOVO QPN Whole Loan. |
| (2) | The borrower sponsor is also the borrower sponsor of the UOVO Orangeburg Mortgage Loan, which is also being contributed to the BMO 2025-C11 transaction. |
| (3) | The lockout period will be at least 24 payment dates beginning with and including the first payment date on March 6, 2025. Defeasance of the UOVO QPN Whole Loan is permitted after the date that is the earlier of (i) two years from the closing date of the securitization that includes the last note comprising a part of the UOVO QPN Whole Loan to be securitized and (ii) January 22, 2028. The assumed lockout period of 24 payments is based on the expected BMO 2025-C11 securitization closing date in February 2025. The actual lockout period may be longer. |
| (4) | See “Escrows and Reserves” below for further discussion of reserve information. |
| (5) | Occupancy represents the occupancy percentage for the private storage space (measured in square feet). The managed storage space is measured in cubic feet and is 55.4% leased as of November 1, 2024. See “The Property” below for further discussion of the property type. |
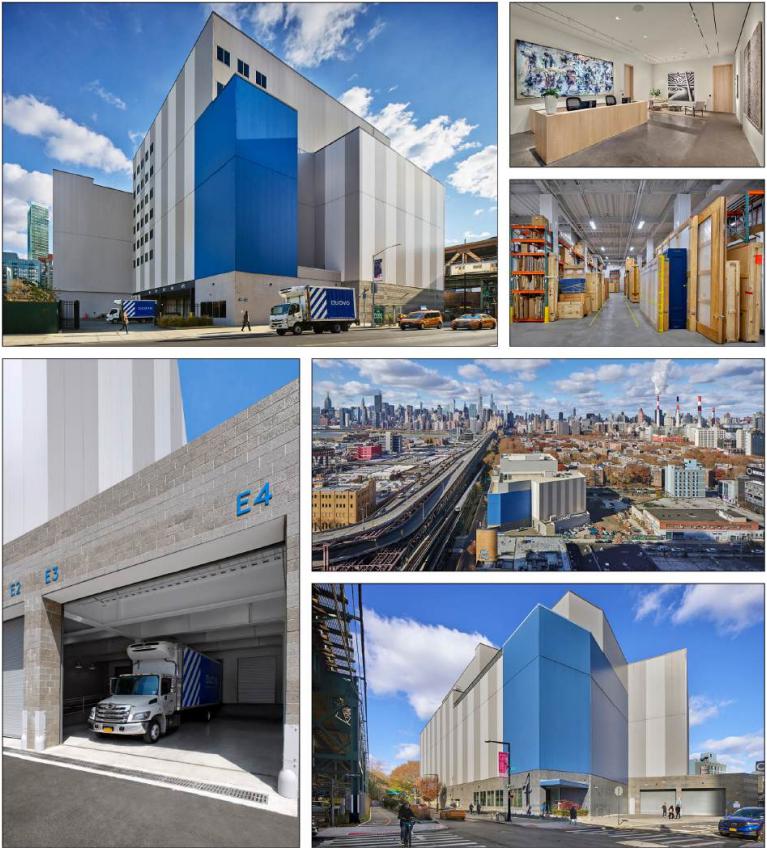
The Loan. The second largest mortgage loan (the “UOVO QPN Mortgage Loan”) is part of a whole loan (the “UOVO QPN Whole Loan”) secured by the borrowers’ fee interest in a 281,494 SF self-storage property located in Long Island City, New York (the “UOVO QPN Property”). The UOVO QPN Whole Loan is evidenced by six pari passu promissory notes with an aggregate outstanding principal balance as of the Cut-off Date of $143,000,000. The UOVO QPN Whole Loan was originated on January 22, 2025 by Bank of Montreal (“BMO”) and accrues interest at a fixed rate of 6.48500% per annum on an Actual/360 basis. On January 22, 2025, BMO transferred Notes A-4, A-5 and A-6, with an aggregate original principal
| THE INFORMATION IN THIS STRUCTURAL AND COLLATERAL TERM SHEET IS NOT COMPLETE AND MAY BE AMENDED PRIOR TO THE TIME OF SALE. THIS TERM SHEET IS NOT AN OFFER TO SELL THESE SECURITIES AND IT IS NOT A SOLICITATION OF AN OFFER TO BUY THESE SECURITIES IN ANY JURISDICTION WHERE THE OFFER OR SALE IS NOT PERMITTED. |
| | 23 | |
| Structural and Collateral Term Sheet | | BMO 2025-C11 |
| No. 2 – UOVO QPN |
balance and Cut-off Date Balance of $50,050,000, to Deutsche Bank AG, New York Branch (“GACC”). The UOVO QPN Whole Loan has a 10-year term and is interest-only for the full term. The scheduled maturity date of the UOVO QPN Whole Loan is the payment date that occurs on February 6, 2035. The UOVO QPN Mortgage Loan is evidenced by the non-controlling Notes A-2 and A-4 with an aggregate outstanding principal balance as of the Cut-off Date of $65,000,000.
The relationship between the holders of the UOVO QPN Whole Loan is governed by a co-lender agreement as described under “Description of the Mortgage Pool— The Whole Loans—The Serviced Pari Passu Whole Loans” and “—The Outside Serviced Pari Passu Whole Loans” in the Preliminary Prospectus. The UOVO QPN Whole Loan will be serviced under the pooling and servicing agreement for the WFCM 2025-C64 securitization trust. See “The Pooling and Servicing Agreement—Servicing of the Outside Serviced Mortgage Loans” in the Preliminary Prospectus.
The table below identifies the promissory notes that comprise the UOVO QPN Whole Loan:
| Whole Loan Summary |
| Note | Original Balance | Cut-off Date Balance | Note Holder | Controlling
Piece |
| A-1 | $45,000,000 | $45,000,000 | WFCM 2025-C64 | Yes |
| A-2 | $26,500,000 | $26,500,000 | BMO 2025-C11 | No |
| A-3(1) | $21,450,000 | $21,450,000 | BMO | No |
| A-4 | $38,500,000 | $38,500,000 | BMO 2025-C11 | No |
| A-5(1) | $5,775,000 | $5,775,000 | GACC | No |
| A-6(1) | $5,775,000 | $5,775,000 | GACC | No |
| Whole Loan | $143,000,000 | $143,000,000 | | |
| (1) | Expected to be contributed to one or more future securitization transactions or may otherwise be transferred at any time. |
The Property. The UOVO QPN Property has 281,494 SF and 669 self-storage units across two interconnected buildings located in Long Island City, New York. The UOVO QPN Property was developed in 2013 and is situated on a 1.27-acre site. The UOVO QPN Property is specially designed for fine art storage and contains two storage components: private storage on floors 3 through 8 (163,150 SF with 282 storage units), and managed/concierge storage on floors 1 through 3 (164,916 cubic feet with 387 storage units). The UOVO QPN Property also serves as UOVO’s headquarters and features 20-foot clear heights, four enclosed loading docks, five covered loading docks, five viewing galleries, private meeting rooms, client café and two freight elevators.
Private Storage. According to the appraisal, the private storage (“Private Storage”) is similar to traditional self-storage and is ideal for clients who prefer direct and frequent access to their works. Private storage includes individual locks, roll-up doors and 8- to 10-foot clear heights. Private storage space can be leased at a minimum of 50 SF and may range to over 20,000 SF. According to the appraisal, private storage is tailored to each specific client’s needs as they partner with an in-house designer to configure a customized plan with racking, lighting, flooring, and climate conditions best suited to their collection.
Managed Storage. According to the appraisal, the managed space (‘Managed Storage”) functions on open-air racks within a fully controlled environment in terms of climate, temperature, humidity and UV filtration lighting. Managed storage is considered a more cost-effective option for clients with fluctuating inventory or temporary storage needs and is exclusively accessed and managed by an expert technical team and tracked using digital inventory. The Managed Storage space is leased by cubic feet on floors 1 through 3 as it consists of an open storage area optimized for large and small pieces of artwork.
| THE INFORMATION IN THIS STRUCTURAL AND COLLATERAL TERM SHEET IS NOT COMPLETE AND MAY BE AMENDED PRIOR TO THE TIME OF SALE. THIS TERM SHEET IS NOT AN OFFER TO SELL THESE SECURITIES AND IT IS NOT A SOLICITATION OF AN OFFER TO BUY THESE SECURITIES IN ANY JURISDICTION WHERE THE OFFER OR SALE IS NOT PERMITTED. |
| | 24 | |
| Structural and Collateral Term Sheet | | BMO 2025-C11 |
| No. 2 – UOVO QPN |
The following table presents certain information relating to the Private Storage at the UOVO QPN Property:
| Unit Mix(1) |
| Unit Type | Net Rentable Area (SF) | % of Net Rentable Area (SF) | Occupied SF | Occupancy % (SF) | # of
Units | % of Total Units | Occupied Units | Avg. Actual Rent Per SF(2) | Market Rent Per SF(3) |
| Private Storage | 163,150 | 82.1% | 142,410 | 87.3% | 282 | 42.2% | 249 | $98.45 | $54.00 - $102.00 |
| (1) | Based on the underwritten rent roll dated November 1, 2024. |
| (2) | Avg. Actual Rent Per SF is calculated using actual rent for occupied square feet and market rent for vacant square feet. |
The following table presents certain information relating to the Managed Storage at the UOVO QPN Property:
| Unit Mix(1) |
| Unit Type | Net Rentable Area (CF) | % of Net Rentable Area (CF) | Occupied CF | Occupancy % (CF) | # of Units | % of Total Units | Occupied Units | Avg. Actual Rent Per CF(2) | Market Rent Per CF(3) |
| Managed Storage | 164,916 | 17.9% | 91,301 | 55.4% | 387 | 57.8% | 386 | $33.58 | $16.20 - $38.40 |
| (1) | Based on the underwritten rent roll dated November 1, 2024. |
| (2) | Avg. Actual Rent Per CF is calculated using actual rent for occupied cubic feet and market rent for vacant cubic feet. |
The following table presents certain information relating to the historical and current occupancy of the UOVO QPN Property:
| Historical and Current Occupancy(1) |
| 2021 | 2022 | 2023 | Current(2) |
| 91.9% | 91.1% | 91.4% | 87.3% |
| (1) | Historical occupancies represent the annual average occupancy of each respective year. |
| (2) | Current occupancy is based on the underwritten rent roll dated November 1, 2024. |
Appraisal. The appraisal concluded to an “as-is” value for the UOVO QPN Property of $234,900,000 as of December 16, 2024.
| Appraisal Valuation Summary(1) |
| Property | As Is Value | Capitalization Rate |
| UOVO QPN | $234,900,000 | 6.25% |
Environmental Matters. According to the Phase I environmental site assessment dated December 31, 2024, there was no evidence of any recognized environmental conditions at the UOVO QPN Property.
| THE INFORMATION IN THIS STRUCTURAL AND COLLATERAL TERM SHEET IS NOT COMPLETE AND MAY BE AMENDED PRIOR TO THE TIME OF SALE. THIS TERM SHEET IS NOT AN OFFER TO SELL THESE SECURITIES AND IT IS NOT A SOLICITATION OF AN OFFER TO BUY THESE SECURITIES IN ANY JURISDICTION WHERE THE OFFER OR SALE IS NOT PERMITTED. |
| | 25 | |
| Structural and Collateral Term Sheet | | BMO 2025-C11 |
| No. 2 – UOVO QPN |
The following table presents certain information relating to the historical operating performance and underwritten net cash flow at the UOVO QPN Property:
| Operating History and Underwritten Net Cash Flow |
| | 2021 | 2022 | 2023 | 9/30/2024 TTM | Underwritten | Underwritten Per SF | %(1) | |
| In-Place Rent (Private) | $12,987,102 | $13,375,690 | $13,627,670 | $13,442,957 | $13,782,417 | $48.96 | 63.0 | % |
| In-Place Rent (Managed) | 2,056,784 | 2,514,142 | 3,075,775 | 2,996,002 | 3,065,534 | 10.89 | 14.0 | |
| Vacancy Lease-Up (Private) | 0 | 0 | 0 | 0 | 2,215,620 | 7.87 | 10.1 | |
| Vacancy Lease-Up (Managed) | 0 | 0 | 0 | 0 | 2,471,707 | 8.78 | 11.3 | |
| Contractual Rent Steps | 0 | 0 | 0 | 0 | 237,174 | 0.84 | 1.1 | |
| Expense Recoveries | 93,476 | 79,734 | 107,350 | $107,189 | 108,407 | 0.39 | 0.5 | |
| Gross Potential Rent(1) | $15,137,362 | $15,969,566 | $16,810,795 | $16,546,148 | $21,880,859 | $77.73 | 100.0 | % |
| | | | | | | | |
| Other Income(2) | ($1,914) | $232,314 | $346,630 | $343,631 | $370,989 | $1.32 | 1.7 | |
| Net Rental Income | $15,135,447 | $16,201,880 | $17,157,425 | $16,889,779 | $22,251,847 | $79.05 | 101.7 | % |
| | | | | | | | |
| Discount Units (Private) | ($5,270) | ($36,025) | ($16,330) | ($16,265) | ($16,676) | ($0.06) | (0.1 | %) |
| Discount Units (Managed) | (13,400) | (13,598) | (3,816) | 0 | 0 | 0.00 | 0.0 | |
| In-Place Vacancy (Private) | 0 | 0 | 0 | 0 | (2,215,620) | (7.87) | (10.1 | ) |
| In-Place Vacancy (Managed) | 0 | 0 | 0 | 0 | (2,471,707) | (8.78) | (11.3 | ) |
| Effective Gross Income | $15,116,777 | $16,152,257 | $17,137,279 | $16,873,514 | $17,547,845 | $62.34 | 80.2 | % |
| | | | | | | | |
| Real Estate Taxes(3) | $428,914 | $511,658 | $563,172 | $623,887 | $751,970 | $2.67 | 4.3 | % |
| Insurance | 161,940 | 254,884 | 266,436 | 258,860 | 225,164 | 0.80 | 1.3 | |
| Other Operating Expenses | 2,654,815 | 3,155,041 | 3,170,819 | 3,149,129 | 2,666,649 | 9.47 | 15.2 | |
| Total Operating Expenses | $3,245,669 | $3,921,582 | $4,000,428 | $4,031,876 | $3,643,783 | $12.94 | 20.8 | % |
| | | | | | | | |
| Net Operating Income | $11,871,108 | $12,230,675 | $13,136,852 | $12,841,638 | $13,904,062 | $49.39 | 79.2 | % |
| Replacement Reserves | 0 | 0 | 0 | 0 | 42,224 | 0.15 | 0.2 | |
| Net Cash Flow | $11,871,108 | $12,230,675 | $13,136,852 | $12,841,638 | $13,861,838 | $49.24 | 79.0 | % |
| (1) | UW Gross Potential Rent is based on the underwritten rent roll dated November 1, 2024. |
| (2) | Other Income includes viewing room rent, private workspace, and fortress payments. |
| (3) | The UOVO QPN Property benefits from an ICAP tax abatement program for 25 years. The UOVO QPN Property receives 100% of the exemption benefit for the first 16 years, which then decreases each year thereafter by 10%. The UOVO QPN Property will be fully taxable in year 26. |
| THE INFORMATION IN THIS STRUCTURAL AND COLLATERAL TERM SHEET IS NOT COMPLETE AND MAY BE AMENDED PRIOR TO THE TIME OF SALE. THIS TERM SHEET IS NOT AN OFFER TO SELL THESE SECURITIES AND IT IS NOT A SOLICITATION OF AN OFFER TO BUY THESE SECURITIES IN ANY JURISDICTION WHERE THE OFFER OR SALE IS NOT PERMITTED. |
| | 26 | |
| Structural and Collateral Term Sheet | | BMO 2025-C11 |
| No. 2 – UOVO QPN |
The Market. The UOVO QPN Property is located in Long Island City, Queens County, New York. Long Island City is a residential and commercial neighborhood in the most western part of Queens, bordering the neighborhood of Astoria to the north, Sunnyside to the east, and Greenpoint to the South. The Long Island City neighborhood has undergone a transformation in recent years due to new high-rise developments, making the neighborhood increasingly residential, as well as new office and retail developments. The neighborhood’s mass transit infrastructure provides easy access to Manhattan, Brooklyn, the Bronx, and surrounding areas. Twelve New York City subway lines travel through Queens, as well as buses and the Long Island Railroad. Both the Long Island Expressway and the Brooklyn Queens Expressway run through the neighborhood. Additionally, two of three major airports serving the New York City metropolitan area (LaGuardia Airport and JFK International Airport) are located in Queens. According to the appraisal, as of 2024, the total population in Queens is 2,356,325, the median household income is $83,331, and the most common job type is health care/social assistance.
According to the appraisal, the national art industry revenue is expected to have grown at a CAGR of 0.9% to $13.1 billion over the last 5 years up through 2024. The national art industry is expected to grow at a CAGR of 2.3% to $15.5 billion by the end of 2029. Additionally, the major concentrations of art dealership establishments in the United States are in California, Florida, and New York with New York being home to 14.1% of establishments in the country.
In New York City, several industrial, office, special-use, and retail buildings have converted to self-storage. In May 2023, 41 East 21st Street completed the conversion of a four story, 50,000 SF parking garage into a self-storage facility to be managed by CubeSmart. The CMX Cinema at 400 East 62nd Street is being converted into a 65,000 SF self-storage facility by Manhattan Mini Storage. The Shell industrial building at 78 Walker has also been proposed for conversion.
The following table presents information regarding certain competitive properties to the UOVO QPN Property:
| Competitive Property Summary(1) |
| Property Name/Location | Year Built / Renovated | Private Occupancy | Square Feet (Private) | Managed Occupancy | Cubic Feet (Managed) | Unit Type | Actual ($/SF) | Actual ($/CF) | Rent Per Annum (SF/CF) |
UOVO QPN(2) Long Island City, NY | 2013 / NAP | 87.3% | 163,150 | 55.4% | 164,916 | Private Storage Managed Storage | $8.20 | $2.80 | $98.45 $33.58 |
105 Evergreen Ave Brooklyn, NY | 1955 / 2019 | 86.0% | 48,145 | 58.0% | 330,000 | Private Storage Managed Storage | $8.22 | $1.60 | $98.64 $19.20 |
4200 Westgate Avenue Westgate, FL | 2023 / NAP (Lease-Up) | 41.0% | 9,765 | 9.0% | 177,000 | Private Storage Managed Storage | $6.77 | $2.25 | $81.24 $27.00 |
346 NW 29th Street Miami, FL | 2008 / NAP | 89.0% | 55,063 | 70.0% | 42,670 | Private Storage Managed Storage | $5.91 | $2.94 | $70.92 $35.28 |
1333 Lowrie Ave South San Francisco, CA | 2022 / NAP | N/A | N/A | 68.0% | 177,222 | Private Storage Managed Storage | N/A | $1.93 | N/A $23.16 |
101 Lake Drive Newark, DE | 1986 / NAP | 53.0% | 7,675 | 24.0% | 238,000 | Private Storage Managed Storage | $4.92 | $1.06 | $59.04 $12.72 |
130 South Myers Street Los Angeles, CA | 2024 / NAP (Lease-Up) | 80.0% | 3,675 | 12.0% | 118,000 | Private Storage Managed Storage | $9.20 | $1.09 | $110.40 $13.08 |
| (1) | Source: Appraisal, unless noted otherwise. |
| (2) | Based on the underwritten rent roll dated November 1, 2024. |
| THE INFORMATION IN THIS STRUCTURAL AND COLLATERAL TERM SHEET IS NOT COMPLETE AND MAY BE AMENDED PRIOR TO THE TIME OF SALE. THIS TERM SHEET IS NOT AN OFFER TO SELL THESE SECURITIES AND IT IS NOT A SOLICITATION OF AN OFFER TO BUY THESE SECURITIES IN ANY JURISDICTION WHERE THE OFFER OR SALE IS NOT PERMITTED. |
| | 27 | |
| Structural and Collateral Term Sheet | | BMO 2025-C11 |
| No. 2 – UOVO QPN |
The Borrowers. The borrowers are QPN 1 DE LLC and QPN 10 DE LLC, each a Delaware limited liability company and single purpose entity with two independent directors. Legal counsel to the borrowers delivered a non-consolidation opinion in connection with the origination of the UOVO QPN Whole Loan.
The Borrower Sponsor. The borrower sponsor and the non-recourse carveout guarantor is Steven J. Guttman. Steven J. Guttman is the founder of Storage Deluxe Management Company, a self-storage developer in the New York City metropolitan area. The company has 84 projects completed and in development, totaling 8 million SF for a total investment in excess of $2.5 billion. Mr. Guttman is also an avid art collector and founded Storage Deluxe affiliate UOVO Fine Art Storage in 2014. Such affiliate was designed for the sole purpose of safe-guarding collections. UOVO’s privately-owned, state-of-the-art facilities are ideal for the long-term preservation and care of art, fashion, wine, archives, cultural artifacts, and rare objects. UOVO has art storage facilities (inclusive of the UOVO QPN Property) in major markets such as Los Angeles, Orange County, San Francisco, Aspen, Denver, Delaware, Miami, West Palm Beach, Brooklyn, Long Island City, Rockland County and Dallas Texas.
Property Management. The UOVO QPN Property is managed by UOVO Management LLC, a borrower-affiliated property management company.
Escrows and Reserves. At origination, the borrowers deposited into escrow (i) approximately $183,288 for real estate taxes and (ii) $14,300 for deferred maintenance.
Tax Escrows. On a monthly basis, the borrowers are required to escrow 1/12th of the annual estimated tax payments, which currently equates to approximately $61,096.
Insurance Escrows. If there is no approved blanket policy in place, the borrowers are required to escrow 1/12th of the annual estimated insurance payments on a monthly basis. The UOVO QPN Property is currently insured under a blanket insurance policy.
Replacement Reserve. On a monthly basis during a Trigger Event (as defined below), the borrowers are required to deposit approximately $3,519 for replacement reserves.
Lockbox / Cash Management. The UOVO QPN Whole Loan is structured with a soft lockbox and springing cash management. The borrowers are required to establish a lockbox account for the benefit of the lender, into which all rents and other revenue from the UOVO QPN Property are required to be deposited by the borrowers. During a Trigger Event, all funds in the lockbox account are required to be transferred to the lender-controlled cash management account on each business day and disbursed in accordance with the UOVO QPN Whole Loan documents. Also, during a Trigger Event, all excess cash is required to be collected by the lender and held as additional security for the UOVO QPN Whole Loan.
A “Trigger Event” will commence upon the earliest of (i) the occurrence of an event of default under the UOVO QPN Whole Loan documents or (ii) the debt yield being less than 9.0%, and will expire upon (a) with respect to clause (i) above, the event of default has been cured or (b) with respect to clause (ii) above, the debt yield being at least 9.0% for two consecutive calendar quarters.
Subordinate and Mezzanine Debt. None.
Permitted Future Subordinate or Mezzanine Debt. Not permitted.
Partial Release. Not permitted.
Ground Lease. None.
| THE INFORMATION IN THIS STRUCTURAL AND COLLATERAL TERM SHEET IS NOT COMPLETE AND MAY BE AMENDED PRIOR TO THE TIME OF SALE. THIS TERM SHEET IS NOT AN OFFER TO SELL THESE SECURITIES AND IT IS NOT A SOLICITATION OF AN OFFER TO BUY THESE SECURITIES IN ANY JURISDICTION WHERE THE OFFER OR SALE IS NOT PERMITTED. |
| | 28 | |
| Structural and Collateral Term Sheet | | BMO 2025-C11 |
| No. 3 – 340 Mt Kemble |
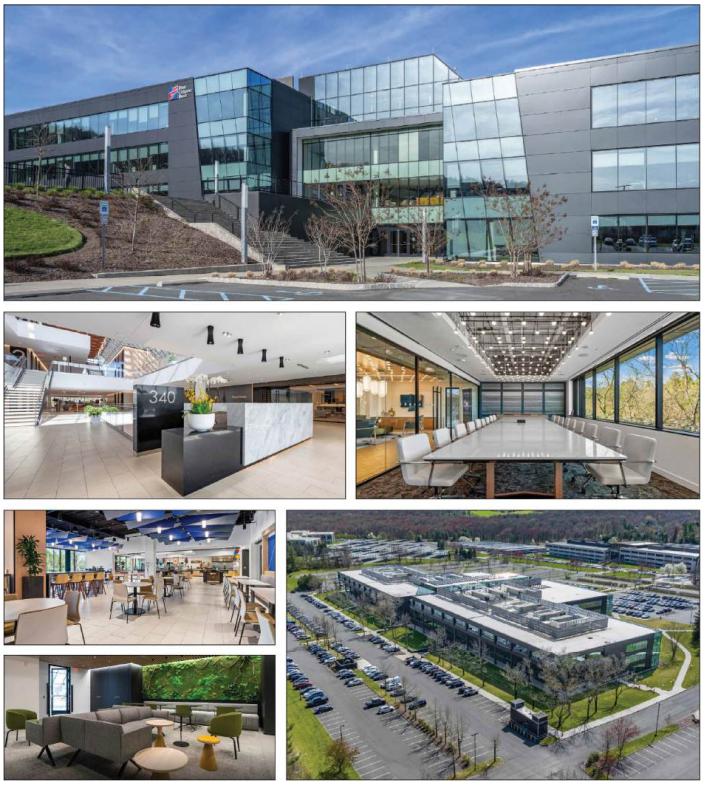
| THE INFORMATION IN THIS STRUCTURAL AND COLLATERAL TERM SHEET IS NOT COMPLETE AND MAY BE AMENDED PRIOR TO THE TIME OF SALE. THIS TERM SHEET IS NOT AN OFFER TO SELL THESE SECURITIES AND IT IS NOT A SOLICITATION OF AN OFFER TO BUY THESE SECURITIES IN ANY JURISDICTION WHERE THE OFFER OR SALE IS NOT PERMITTED. |
| | 29 | |
| Structural and Collateral Term Sheet | | BMO 2025-C11 |
| No. 3 – 340 Mt Kemble |

| THE INFORMATION IN THIS STRUCTURAL AND COLLATERAL TERM SHEET IS NOT COMPLETE AND MAY BE AMENDED PRIOR TO THE TIME OF SALE. THIS TERM SHEET IS NOT AN OFFER TO SELL THESE SECURITIES AND IT IS NOT A SOLICITATION OF AN OFFER TO BUY THESE SECURITIES IN ANY JURISDICTION WHERE THE OFFER OR SALE IS NOT PERMITTED. |
| | 30 | |
| Structural and Collateral Term Sheet | | BMO 2025-C11 |
| No. 3 – 340 Mt Kemble |
| Mortgage Loan Information | | Property Information |
| Mortgage Loan Seller: | SGFC | | Single Asset / Portfolio: | Single Asset |
| Original Principal Balance(1): | $59,000,000 | | Title: | Fee |
| Cut-off Date Principal Balance(1): | $59,000,000 | | Property Type – Subtype: | Office - Suburban |
| % of IPB: | 6.5% | | Net Rentable Area (SF): | 413,261 |
| Loan Purpose: | Acquisition | | Location: | Morris Township, NJ |
| Borrowers: | ICS Junction NJ LLC, SRT Rose Management LLC, 2406 Cottonwood NJ LLC and FM 340 Kemble LLC | | Year Built / Renovated: | 1982 / 2021 |
| Borrower Sponsor: | Richard Chera | | Occupancy: | 94.5% |
| Interest Rate: | 6.94100% | | Occupancy Date: | 9/19/2024 |
| Note Date: | 1/21/2025 | | 4th Most Recent NOI (As of)(5): | NAV |
| Maturity Date: | 2/1/2035 | | 3rd Most Recent NOI (As of)(5): | NAV |
| Interest-only Period(2): | 53 months | | 2nd Most Recent NOI (As of)(5): | NAV |
| Original Term: | 120 months | | Most Recent NOI (As of)(6): | $6,157,251 (TTM 10/31/2024) |
| Original Amortization Term: | 272 months | | UW Economic Occupancy: | 95.1% |
| Amortization Type(2): | Interest Only, Amortizing Balloon, Interest Only | | UW Revenues: | $15,345,687 |
| Call Protection(3): | L(30),YM1(83),O(7) | | UW Expenses: | $4,927,062 |
| Lockbox / Cash Management: | Hard / Springing | | UW NOI(6): | $10,418,625 |
| Additional Debt(1): | Yes | | UW NCF: | $10,315,310 |
| Additional Debt Balance(1): | $13,950,000 | | Appraised Value / Per SF: | $118,100,000 / $286 |
| Additional Debt Type(1): | Pari Passu | | Appraisal Date: | 10/2/2024 |
| | | | | |
| Escrows and Reserves(4) | | Financial Information(1) |
| | Initial | Monthly | Initial Cap | | Cut-off Date Loan / SF: | $177 |
| Taxes: | $109,961 | $109,961 | N/A | | Maturity Date Loan / SF: | $156 |
| Insurance: | $23,610 | $11,805 | N/A | | Cut-off Date LTV: | 61.8% |
| Replacement Reserve: | $0 | $8,610 | $309,946 | | Maturity Date LTV: | 54.5% |
| TI / LC: | $0 | $0 | N/A | | UW NCF DSCR: | 1.61x |
| Deferred Maintenance: | $0 | $0 | N/A | | UW NOI Debt Yield: | 14.3% |
| FCB Free Rent Reserve: | $0 | Springing | $10,798,200 | | | |
| | | | | | | |
| Sources and Uses |
| Sources | Proceeds | % of Total | | Uses | Proceeds | % of Total |
| Whole Loan(1) | $72,950,000 | 61.1 | % | | Purchase Price | $118,500,000 | 99.3 | % |
| Sponsor Equity | 46,434,209 | 38.9 | | | Closing Costs(7) | 750,638 | 0.6 | |
| | | | | Reserves | 133,571 | 0.1 | |
| Total Sources | $119,384,209 | 100.0 | % | | Total Uses | $119,384,209 | 100.0 | % |
| (1) | The 340 Mt Kemble Mortgage Loan (as defined below) is part of a whole loan evidenced by four pari passu notes with an aggregate original principal balance of $72,950,000 (the “340 Mt Kemble Whole Loan”). The information under Financial Information in the chart above is based on the 340 Mt Kemble Whole Loan. |
| (2) | Interest only payments are required for the initial 18 months, followed by 67 months of amortizing payments based on a 272-month amortization schedule, then interest only payments are required for the final 35 months beginning on the payment date occurring in April 2032 through the remaining term of the 340 Mt Kemble Whole Loan. |
| (3) | The lockout period will be at least 30 payment dates beginning with and including the first payment date on March 1, 2025. Voluntary prepayment (with the greater of a yield maintenance premium or 1% of the principal balance of the 340 Mt Kemble Whole Loan) in full (but not in part) is permitted at any time following the payment date in August 2027. |
| (4) | For a full description of Escrows and Reserves, please refer to “Escrows and Reserves” below. |
| (5) | Historical NOI is unavailable as the borrower sponsors acquired the 340 Mt Kemble Property (as defined below) at origination and the sellers did not provide historical cash flow. |
| (6) | The increase in UW NOI from the Most Recent NOI is primarily attributed to (i) approximately $781,702 in underwritten straight-line rent, (ii) approximately $38,906 in rent increases and (iii) the rent abatement periods for Morgan Stanley and Zelis Healthcare, LLC., which ended in April 2024. |
| (7) | Closing Costs include an interest rate buydown of approximately $251,568. |
The Loan. The third largest mortgage loan (the “340 Mt Kemble Mortgage Loan”) is part of a whole loan evidenced by four pari passu promissory notes with an aggregate original principal balance of $72,950,000. The 340 Mt Kemble Whole Loan is
| THE INFORMATION IN THIS STRUCTURAL AND COLLATERAL TERM SHEET IS NOT COMPLETE AND MAY BE AMENDED PRIOR TO THE TIME OF SALE. THIS TERM SHEET IS NOT AN OFFER TO SELL THESE SECURITIES AND IT IS NOT A SOLICITATION OF AN OFFER TO BUY THESE SECURITIES IN ANY JURISDICTION WHERE THE OFFER OR SALE IS NOT PERMITTED. |
| | 31 | |
| Structural and Collateral Term Sheet | | BMO 2025-C11 |
| No. 3 – 340 Mt Kemble |
secured by a first priority fee mortgage encumbering an 413,261 square foot office property located in Morris Township, New Jersey (the “340 Mt Kemble Property”). The 340 Mt Kemble Whole Loan was originated by Societe Generale Financial Corporation (“SGFC”). The 340 Mt Kemble Whole Loan has a 10-year term and accrues interest at an interest rate of 6.94100% per annum on an Actual/360 basis. Interest only payments are required for the initial 18 months, followed by 67 months of amortizing payments based on a 272-month amortization schedule, then interest only payments are required for the final 35 months beginning on the payment date occurring in April 2032 through the remaining term of the 340 Mt Kemble Whole Loan. The 340 Mt Kemble Mortgage Loan is evidenced by the controlling Note A-1 and the non-controlling Note A-2 and Note A-4 with an aggregate original principal balance of $59,000,000. The remaining promissory note is currently held by SGFC and is expected to be contributed to one or more securitization trust(s). The 340 Mt Kemble Whole Loan will be serviced pursuant to the pooling and servicing agreement for the BMO 2025-C11 trust. “See “Description of the Mortgage Pool—The Whole Loans—The Serviced Pari Passu Whole Loans” and “The Pooling and Servicing Agreement” in the Preliminary Prospectus.
The table below identifies the promissory notes that comprise the 340 Mt Kemble Whole Loan:
| Whole Loan Summary |
| Note | Original Balance | Cut-off Date Balance | Note Holder | Controlling Note |
| A-1 | $29,000,000 | $29,000,000 | BMO 2025-C11 | Yes |
| A-2 | $21,000,000 | $21,000,000 | BMO 2025-C11 | No |
| A-3(1) | $13,950,000 | $13,950,000 | SGFC | No |
| A-4 | $9,000,000 | $9,000,000 | BMO 2025-C11 | No |
| Total | $72,950,000 | $72,950,000 | | |
| | (1) | Expected to be contributed to one or more future securitization(s). |
The Property. The 340 Mt Kemble Property is a four-story, Class-A office property totaling 413,261 square feet situated on an approximately 40.00-acre site in Morris Township, New Jersey. The 340 Mt Kemble Property was built in 1982 and renovated in 2021. Capital improvements to the 340 Mt Kemble Property in 2021 were approximately $49.1 million and consisted of a new glass façade with vertical solar glazing, renovations to the lobby, common area and restroom, the addition of a full-service café, coffee bar, employee lounge and game room, conference center and fitness center. Parking is provided via 1,721 surface parking spaces, resulting in a parking ratio of approximately 4.2 parking spaces per 1,000 square feet of net rentable area. As of September 19, 2024, the 340 Mt Kemble Property was 94.5% occupied by three tenants.
Major Tenants. The three tenants at the 340 Mt Kemble Property are CIT/First-Citizens Bank & Trust, Morgan Stanley and Zelis Healthcare, LLC.
CIT/First-Citizens Bank & Trust (“FCB”) (220,628 square feet; 53.4% of NRA; 54.8% of underwritten base rent, Moody’s/S&P/Fitch: Baa1/BBB/BBB+). First Citizens BancShares, Inc. is the financial holding company of FCB. In 2022, FCB acquired CIT, creating a top 20 United States financial institution with more than $200 billion in assets. Headquartered in Raleigh, North Carolina, FCB offers a range of banking services with a network of more than 500 branches and offices in 30 states. FCB has been a tenant to the 340 Mt Kemble Property since 2021 under a lease that expires in April 2036 and has one, ten-year renewal option remaining. FCB has a one-time right to terminate its lease on April 30, 2033, with 12-months’ prior written notice and payment of a termination fee equal to $12,000,000. FCB has a right of first offer during the initial term and renewal terms of its lease upon the first two occasions of the vacating or intended vacating of space then leased to a third party located on the first floor of the south tower of the 340 Mt Kemble Property. FCB currently subleases (i) 72,478 square feet (17.5% of NRA of the 340 Mt Kemble Property) to Marcum LLP for $32.50 per square foot, (ii) 52,500 square feet (12.7% of NRA of the 340 Mt Kemble Property) to Endurance Services Limited, for $32.50 per square feet and (iii) 20,628 square feet (5.0% of NRA of the 340 Mt Kemble Property) to Clyde & Co US LLP for $35.50 per square foot. All subleases are coterminous with FCB’s lease and will terminate if FCB exercises its termination option.
| THE INFORMATION IN THIS STRUCTURAL AND COLLATERAL TERM SHEET IS NOT COMPLETE AND MAY BE AMENDED PRIOR TO THE TIME OF SALE. THIS TERM SHEET IS NOT AN OFFER TO SELL THESE SECURITIES AND IT IS NOT A SOLICITATION OF AN OFFER TO BUY THESE SECURITIES IN ANY JURISDICTION WHERE THE OFFER OR SALE IS NOT PERMITTED. |
| | 32 | |
| Structural and Collateral Term Sheet | | BMO 2025-C11 |
| No. 3 – 340 Mt Kemble |
Morgan Stanley (116,578 square feet; 28.2% of NRA; 31.1% of underwritten base rent; Moody’s/S&P/Fitch: A1/A-/A+). Morgan Stanley is an investment bank and financial services company headquartered in New York. With offices in 42 countries and more than 80,000 employees, Morgan Stanley clients include corporations, governments, institutions, and individuals. Morgan Stanley has been a tenant at the 340 Mt Kemble Property since November 2022 under a lease that expires in April 2038 and has two, five-year extension options remaining.
Morgan Stanley has a one-time right to terminate a portion of its leased space on April 30, 2033, which includes the following leased space: (i) 44,985 square feet of ground floor space (the “Ground Floor Premises”), (ii) 71,593 square feet on the first floor (the “First Floor Premises”), (iii) any of the Right of First Offer Space (as defined below) selected by Morgan Stanley and delivered on or before April 30, 2028, upon receipt of the notice of tenant’s election to lease such space (the “Terminable Right of First Offer Space”) or (iv) the entire premises, provided that, in connection with the termination of any space in clauses (i) through (iv), Morgan Stanley provides 12-months’ prior written notice and pays a termination fee equal to (a) with respect to clause (i), $3,769,080 for the Ground Floor Premises only, (b) with respect to clause (ii), $5,998,438 for the First Floor Premises only, (c) with respect to clause (iii), the sum of (x) three months of minimum rent for the Terminable Right of First Offer Space plus (y) the unamortized transaction costs incurred in leasing the space (collectively, the “Terminable Right of First Offer Space Termination Fee”) or (d) with respect to clause (iv), $9,767,518 for the entire premises plus any Terminable Right of First Offer Space Termination Fee. Morgan Stanley has a right of first offer upon the first occasion of the vacating or intended vacating of the space then leased to a third party located in the south tower of the 340 Mt Kemble Property (the “Right of First Offer Space”).
Zelis Healthcare, LLC (“Zelis”) (53,295 square feet; 12.9% of NRA, 14.0% of underwritten base rent, Moody’s/S&P/Fitch: NR/NR/NR). Zelis provides a platform connecting payers, providers and healthcare consumers in the healthcare industry. Zelis serves more than 750 payers, which includes the top 5 national health plans, BCBS insurers, regional health plans, self-insured employers and millions of healthcare providers and consumers. Zelis has been a tenant at the 340 Mt Kemble Property since April 2023 under a lease that expires in April 2036 and has two, five-year extension options remaining. Zelis has a one-time right to terminate its lease on April 30, 2033 with 12-months’ prior written notice and payment of a termination fee equal to $3,626,681.
Environmental. According to the Phase I environmental assessment dated October 2, 2024, there was no evidence of any recognized environmental conditions at the 340 Mt Kemble Property.
Appraisal. According to the appraisal, the 340 Mt Kemble Property had an “as-is” appraised value of $118,100,000 as of October 2, 2024. The table below shows the appraisal’s “as-is” conclusions.
| Appraisal Valuation Summary(1) |
| Appraisal Approach | Appraised Value | Capitalization Rate(2) |
| Income Capitalization Approach | $118,100,000 | 8.00% |
| (2) | The appraisal placed primary emphasis on the discounted cash flow approach to arrive at the appraised value. The capitalization rate shown above represents the direct capitalization rate. |
The following table presents certain information relating to the historical occupancy of the 340 Mt Kemble Property:
| | Historical and Current Occupancy |
| 2022(1) | 2023(1) | 2024(1) | Current(2) |
| NAV | NAV | NAV | 94.5% |
| (1) | Historical Occupancies are unavailable as the borrower acquired the 340 Mt Kemble Property at origination. |
| (2) | Current Occupancy is as of September 19, 2024. |
| THE INFORMATION IN THIS STRUCTURAL AND COLLATERAL TERM SHEET IS NOT COMPLETE AND MAY BE AMENDED PRIOR TO THE TIME OF SALE. THIS TERM SHEET IS NOT AN OFFER TO SELL THESE SECURITIES AND IT IS NOT A SOLICITATION OF AN OFFER TO BUY THESE SECURITIES IN ANY JURISDICTION WHERE THE OFFER OR SALE IS NOT PERMITTED. |
| | 33 | |
| Structural and Collateral Term Sheet | | BMO 2025-C11 |
| No. 3 – 340 Mt Kemble |
The following table presents certain information relating to the tenants of the 340 Mt Kemble Property:
| Tenant Summary(1) |
| Tenant | Ratings
Moody’s/S&P/ Fitch(2) | Net Rentable Area (SF) | % of
Total NRA | UW Base Rent PSF(3) | UW Base Rent(3) | % of Total
UW Base Rent(3) | Lease
Expiration Date |
| CIT/First-Citizens Bank & Trust(4) | Baa1/BBB/BBB+ | 220,628 | 53.4 | % | $35.39 | $7,807,819 | 54.8% | 4/30/2036 |
| Morgan Stanley(5) | A1/A-/A+ | 116,578 | 28.2 | | $38.03 | 4,433,942 | 31.1 | 4/30/2038 |
| Zelis Healthcare, LLC(6) | NR/NR/NR | 53,295 | 12.9 | | $37.45 | 1,995,898 | 14.0 | 4/30/2036 |
| Occupied Collateral Total / Wtd. Avg. | | 390,501 | 94.5 | % | $36.46 | $14,237,659 | 100.0% | | | |
| Vacant Space | | 22,760 | 5.5 | | | | | | | |
| Collateral Total | | 413,261 | 100.0 | % | | | | | | |
| | | | | | | | | | |
| (1) | Based on the underwritten rent roll dated September 19, 2024. |
| (2) | In certain instances, ratings provided are those of the parent company of the entity shown, whether or not the parent company guarantees the lease. |
| (3) | UW Base Rent PSF, UW Base Rent and % of Total UW Base Rent include (i) straight line rent adjustment for Morgan Stanley and CIT/First-Citizens Bank & Trust totaling $781,702 and (ii) contractual rent steps totaling $38,906 through May 2025. |
| (4) | CIT/First-Citizens Bank & Trust has one, ten-year renewal options remaining. |
| (5) | Morgan Stanley has two, five-year renewal options remaining. |
| (6) | Zelis Healthcare, LLC has two, five-year renewal options remaining. |
The following table presents certain information relating to the tenant lease expirations at the 340 Mt Kemble Property:
| Lease Rollover Schedule(1)(2) |
| Year | Number of Leases Expiring | Net Rentable Area Expiring | % of NRA Expiring | UW Base Rent Expiring(3) | % of UW Base Rent Expiring(3) | Cumulative Net Rentable Area Expiring | Cumulative % of NRA Expiring | Cumulative UW Base Rent Expiring(3) | Cumulative % of UW Base Rent Expiring(3) |
| Vacant | NAP | 22,760 | 5.5% | NAP | NA | P | 22,760 | 5.5% | NAP | NAP |
| 2025 & MTM | 0 | 0 | 0.0 | 0 | 0.0 | % | 22,760 | 5.5% | $0 | 0.0% |
| 2026 | 0 | 0 | 0.0 | 0 | 0.0 | | 22,760 | 5.5% | $0 | 0.0% |
| 2027 | 0 | 0 | 0.0 | 0 | 0.0 | | 22,760 | 5.5% | $0 | 0.0% |
| 2028 | 0 | 0 | 0.0 | 0 | 0.0 | | 22,760 | 5.5% | $0 | 0.0% |
| 2029 | 0 | 0 | 0.0 | 0 | 0.0 | | 22,760 | 5.5% | $0 | 0.0% |
| 2030 | 0 | 0 | 0.0 | 0 | 0.0 | | 22,760 | 5.5% | $0 | 0.0% |
| 2031 | 0 | 0 | 0.0 | 0 | 0.0 | | 22,760 | 5.5% | $0 | 0.0% |
| 2032 | 0 | 0 | 0.0 | 0 | 0.0 | | 22,760 | 5.5% | $0 | 0.0% |
| 2033 | 0 | 0 | 0.0 | 0 | 0.0 | | 22,760 | 5.5% | $0 | 0.0% |
| 2034 | 0 | 0 | 0.0 | 0 | 0.0 | | 22,760 | 5.5% | $0 | 0.0% |
| 2035 & Beyond | 3 | 390,501 | 94.5 | $14,237,659 | 100.0 | | 413,261 | 100.0% | $14,237,659 | 100.0% |
| Total | 3 | 413,261 | 100.0% | $14,237,659 | 100.0 | % | | | | |
| (1) | Based on the underwritten rent roll dated September 19, 2024. |
| (2) | Certain leases may have termination options that are exercisable prior to the originally stated expiration date of the lease and that are not considered in this Lease Rollover Schedule. |
| (3) | UW Base Rent Expiring, % of UW Base Rent Expiring, Cumulative UW Base Rent Expiring and Cumulative % of UW Base Rent Expiring include (i) straight line rent adjustment for Morgan Stanley and CIT/First-Citizens Bank & Trust totaling $781,702 and (ii) contractual rent steps totaling $38,906 through May 2025. |
| THE INFORMATION IN THIS STRUCTURAL AND COLLATERAL TERM SHEET IS NOT COMPLETE AND MAY BE AMENDED PRIOR TO THE TIME OF SALE. THIS TERM SHEET IS NOT AN OFFER TO SELL THESE SECURITIES AND IT IS NOT A SOLICITATION OF AN OFFER TO BUY THESE SECURITIES IN ANY JURISDICTION WHERE THE OFFER OR SALE IS NOT PERMITTED. |
| | 34 | |
| Structural and Collateral Term Sheet | | BMO 2025-C11 |
| No. 3 – 340 Mt Kemble |
The following table presents certain information relating to the underwritten cash flows of the 340 Mt Kemble Property:
| Operating History and Underwriting Net Cash Flow |
| | TTM(1) | Underwritten | Per Square Foot | %(2) |
| Rents in Place(3) | $10,049,475 | $15,034,259 | $36.38 | 93.1 | % |
| Vacant Income | 0 | 0 | 0.00 | 0.0 | |
| Gross Potential Rent | $10,049,475 | $15,034,259 | $36.38 | 93.1 | % |
| Total Reimbursements | 701,920 | 1,022,625 | 2.47 | 6.3 | |
| Other Income 1(4) | 4,800 | 6,000 | 0.01 | 0.0 | |
| Other Income 2(5) | 79,403 | 79,403 | 0.19 | 0.5 | |
| Net Rental Income | $10,835,598 | $16,142,287 | $39.06 | 100.0 | % |
| (Vacancy/Credit Loss)(6) | 0 | (796,600) | (1.93) | (4.9 | ) |
| Effective Gross Income | $10,835,598 | $15,345,687 | $37.13 | 95.1 | % |
| Total Expenses | 4,678,347 | 4,927,062 | 11.92 | 32.1 | |
| Net Operating Income(7) | $6,157,251 | $10,418,625 | $25.21 | 67.9 | % |
| Capital Expenditures | 0 | 103,315 | 0.25 | 0.7 | |
| TI/LC | 0 | 0 | 0.00 | 0.0 | |
| Net Cash Flow | $6,157,251 | $10,315,310 | $24.96 | 67.2 | % |
| (1) | TTM reflects the trailing 12-month period ending October 31, 2024. |
| (2) | % column represents percent of Net Rental Income for all revenue lines and represents percent of Effective Gross Income for the remainder of fields. |
| (3) | Underwritten Rents in Place includes (i) in-place rent totaling $13,417,051, (ii) straight line rent adjustment for Morgan Stanley and CIT/First-Citizens Bank & Trust totaling $781,702, (iii) contractual rent steps totaling $38,906 through May 2025 and (ii) vacancy gross up rents totaling $796,600. |
| (4) | Other Income 1 represents the antenna lease and is based on $500 per month per such lease. |
| (5) | Other Income 2 represents the net work order income, net cleaning routine income and administrative fees. |
| (6) | The underwritten economic vacancy is 4.9%. The 340 Mt Kemble Property was 94.5% physically occupied as of September 19, 2024. |
| (7) | The increase in Underwritten Net Operating Income from the TTM Net Operating Income is primarily attributed to (i) approximately $781,702 in underwritten straight-line rent, (ii) approximately $38,906 in rent increases and (iii) the rent abatement periods which ended in April 2024 for Morgan Stanley and Zelis Healthcare, LLC. |
| THE INFORMATION IN THIS STRUCTURAL AND COLLATERAL TERM SHEET IS NOT COMPLETE AND MAY BE AMENDED PRIOR TO THE TIME OF SALE. THIS TERM SHEET IS NOT AN OFFER TO SELL THESE SECURITIES AND IT IS NOT A SOLICITATION OF AN OFFER TO BUY THESE SECURITIES IN ANY JURISDICTION WHERE THE OFFER OR SALE IS NOT PERMITTED. |
| | 35 | |
| Structural and Collateral Term Sheet | | BMO 2025-C11 |
| No. 3 – 340 Mt Kemble |
The Market. The 340 Mt Kemble Property is located in Morris Township, Morris County, New Jersey. Morris County is located in the central portion of Northern New Jersey, which comprises an area of 479 miles. Morris Township is located approximately 25 miles west of New York City and 60 miles north of Philadelphia. The 340 Mt Kemble Property is located approximately 2.3 miles south of Downtown Morristown. Downtown Morristown is a live, work, pedestrian-centric community featuring 400 businesses, 140 restaurants and local boutiques. Regional access to the 340 Mt Kemble Property is provided via Interstate 287 and Routes 202 and 206 and the New Jersey Turnpike. Additionally, the 340 Mt Kemble Property’s neighborhood is served by the Morris and Essex Line of New Jersey Transit, with direct service to New York’s Penn Station. According to a third party market research report, the 2024 population within a one, three and five-mile radius of the 340 Mt Kemble Property was 3,147, 36,294 and 94,992, respectively. The 2024 average household income within the same radii was $280,669, $206,124 and $223,707, respectively.
According to a third party market research report, the 340 Mt Kemble Property is located within the Morristown Region office submarket. As of November 2024, the Morristown Region office submarket reported year to date inventory of approximately 14.4 million square feet with a vacancy rate of 12.4% and an average rental rate of $34.01 per square foot.
The following table presents certain information relating to comparable office leases for the 340 Mt Kemble Property:
| Comparable Office Leases(1) |
| Property / Location | Year Built / Renovated | Tenant Name | Lease Start Date | Term (yrs.) | Lease Type | Tenant SF | Rent PSF |
340 Mt Kemble 340 Mount Kemble Avenue Morris Township, NJ | 1982 / 2021 | Zelis Healthcare, LLC | Apr-23 | 11.3 | Modified Gross | 53,295(2) | $37.45(2) |
Bridgewater Crossing 200 Crossing Boulevard Bridgewater, NJ | 2002 / NAP | Brother International Corp | Jun-24 | 2.0 | Modified Gross | 103,326 | $32.50 |
Newport Tower 525 Washington Boulevard Jersey City, NJ | 1990 / 2021 | Bank of America | Jan-24 | 17.0 | Modified Gross | 550,000 | $35.00 |
305 Madison Avenue 305 Madison Avenue Morristown, NJ | 1986 / 2018 | Stifel, Nicolaus & Co., Inc. | Feb-24 | 15.6 | Modified Gross | 50,865 | $29.00 |
Park Avenue @ Morris County 200 Campus Drive Florham Park, NJ | 1988 / NAP | Duane Morris LLP | Oct-23 | 7.7 | Modified Gross | 13,313 | $33.50 |
SouthGate Corporate Center 445 South Street Morristown, NJ | 1984 / 2019 | Marsh USA Inc. | Oct-23 | 1.0 | Modified Gross | 54,376 | $29.50 |
Two Gateway Center 2 Gateway Center Newark, NJ | 1972 / 1994 | NJ Transit | Jun-23 | 25.0 | Modified Gross | 407,173 | $39.00 |
The Offices at Metropark 194 Wood Avenue South Iselin, NJ | 2000 / NAP | Wells Fargo | Mar-23 | 12.0 | Modified Gross | 131,010 | $40.00 |
| | (2) | Based on the in place rent roll dated September 19, 2024. |
The Borrowers. The borrowers are ICS Junction NJ LLC, SRT Rose Management LLC, 2406 Cottonwood NJ LLC and FM 340 Kemble LLC, each, a special purpose, bankruptcy remote Delaware limited liability company with one independent director. The borrowers own the 340 Mt Kemble Property under a tenant-in-common structure. Legal counsel to the borrowers delivered a non-consolidation opinion in connection with the origination of the 340 Mt Kemble Whole Loan.
| THE INFORMATION IN THIS STRUCTURAL AND COLLATERAL TERM SHEET IS NOT COMPLETE AND MAY BE AMENDED PRIOR TO THE TIME OF SALE. THIS TERM SHEET IS NOT AN OFFER TO SELL THESE SECURITIES AND IT IS NOT A SOLICITATION OF AN OFFER TO BUY THESE SECURITIES IN ANY JURISDICTION WHERE THE OFFER OR SALE IS NOT PERMITTED. |
| | 36 | |
| Structural and Collateral Term Sheet | | BMO 2025-C11 |
| No. 3 – 340 Mt Kemble |
The Borrower Sponsor. The borrower sponsor and non-recourse carveout guarantor is Richard Chera. Mr. Chera is the co-founder and senior managing director of Crown Acquisitions Inc. (“Crown”), a New York based holding company with holdings in real estate and branding assets. At Crown, Mr. Chera executed several transactions, including the acquisitions of 650 Madison Avenue, Olympic Tower at 641 Fifth Avenue and the adjacent Versace and Cartier mansions. Additionally, Mr. Chera is the co-founder of ReWyre, a technology aggregator and city master planner based in New York City.
Property Management. The 340 Mt Kemble Property is managed by FM Kemble Property Manager LLC, an affiliate of the borrower sponsor.
Escrows and Reserves. At origination, the borrowers were required to deposit into escrow (i) approximately $109,961 for real estate taxes and (ii) $23,610 for insurance premiums.
Tax Escrows – On a monthly basis, the borrowers are required to deposit 1/12th of the real estate taxes that the lender estimates will be payable during the next 12 months, which currently equates to approximately $109,961.
Insurance Escrows – On a monthly basis, the borrowers are required to deposit 1/12th of the insurance premiums that the lender estimates will be payable, which currently equated to approximately $11,805. The borrowers will not be required to make monthly insurance deposits with any insurance coverage carried under a blanket insurance policy pursuant to the 340 Mt Kemble Whole Loan documents so long as (i) no event of default has occurred and is continuing and (ii) the borrowers provide the lender with timely evidence of payment of all such insurance premiums. A blanket insurance policy was not in place at origination.
Replacement Reserve – On a monthly basis, the borrowers are required to deposit approximately $8,610 for replacement reserves, subject to a cap of approximately $309,946.
FCB Free Rent Reserve – Commencing with the payment date that occurs in June 2033 and ending with the payment date occurring in December 2034, the borrowers will be required to deposit with the lender an amount equal to approximately $568,326. The borrowers may suspend their obligation to make such deposits if the borrowers have deposited (and maintain on deposit) with the lender cash and/or a letter of credit in the aggregate amount of $10,798,200.
Special Rollover Reserve – During the continuance of a Lease Sweep Period (as defined below) (provided no other Cash Management Period (as defined below) is then continuing), the borrowers are required to deposit with the lender all available cash (or such portion of available cash allocated by the lender for deposit into the special rollover reserve subaccount). The borrowers will also be required to deposit with the lender for transfer into the special rollover reserve subaccount (i) all fees, penalties, commissions or other payments made to the borrower in connection with or relating to the rejection, buy-out, termination, surrender or cancellation of any Major Lease (as defined below) (including in connection with any Major Tenant (as defined below) insolvency proceedings), (ii) any security deposits or proceeds of letters of credit held by the borrowers in lieu of cash security deposits, which the borrowers are permitted to retain pursuant to the applicable provisions of any Major Lease and (iii) any payments made to any borrower relating to unamortized tenant improvements and leasing commissions under any Major Lease provided, however, if any of the foregoing may be applied to amounts due and owing to such borrower for rent or other charges due and payable under such lease and otherwise accruing through the effective date of any such lease termination, such amounts will not be considered to be major lease termination payments.
Lockbox / Cash Management. The 340 Mt Kemble Whole Loan is structured with a hard lockbox and springing cash management. The borrowers are required at all times to cause all rents to be transmitted by all tenants of the 340 Mt Kemble Property into a lockbox account established and maintained by the borrowers. At origination, the borrowers were required to deliver tenant direction letters to each tenant at the 340 Mt Kemble Property instructing all tenants to remit all payments directly into the lockbox account. If the borrowers or the property manager receive any rent from any tenant at the 340 Mt Kemble Property, the borrowers and the property manager are required to deposit such amounts into the lockbox account within three business days of receipt. Funds deposited into the lockbox account will be swept on a daily basis into the applicable borrower's operating account until a Cash Management Period commenced, in which event such funds will be swept on a daily basis into a lender-controlled lockbox account and applied and disbursed in accordance with the 340 Mt Kemble Whole Loan documents. Available cash on deposit will be applied as follows (a) during the continuance of a Cash Management Period continuing solely as a result of a Lease Sweep Period, to the special rollover reserve subaccount or (b) to the cash collateral subaccount.
| THE INFORMATION IN THIS STRUCTURAL AND COLLATERAL TERM SHEET IS NOT COMPLETE AND MAY BE AMENDED PRIOR TO THE TIME OF SALE. THIS TERM SHEET IS NOT AN OFFER TO SELL THESE SECURITIES AND IT IS NOT A SOLICITATION OF AN OFFER TO BUY THESE SECURITIES IN ANY JURISDICTION WHERE THE OFFER OR SALE IS NOT PERMITTED. |
| | 37 | |
| Structural and Collateral Term Sheet | | BMO 2025-C11 |
| No. 3 – 340 Mt Kemble |
Notwithstanding the above, the lender agrees to not provide notice of a Cash Management Period during a DSCR Cash Management Period (as defined below) (provided no other Cash Management Period is continuing) if and for so long as the following conditions are satisfied: (A) (i) the borrowers have deposited (and maintain on deposit) with the lender cash in the amount of the difference between (x) the annual net operating income that would be required to achieve debt service coverage ratio (“DSCR”) of 1.20x, minus (y) the then existing annual net operating income as reasonably determined by the lender (the “NOI Shortfall”), which cash amount will be transferred to the cash collateral subaccount or (ii) the borrowers have deposited (and maintain on deposit) with the lender a letter of credit in the amount of the NOI Shortfall, (B) the cash deposit or letter of credit remain on deposit with the lender until the termination of the DSCR Cash Management Period as provided within the 340 Mt Kemble Whole Loan documents, at which time the remaining cash deposit or letter or credit will be returned to the borrowers, (C) for the avoidance of doubt, without releasing any such cash previously deposited or such letter of credit previously delivered to the lender, in the event the NOI Shortfall exceeds the amount of cash or the letter of credit on deposit with the lender at the end of any calendar quarter during the continuance of a DSCR Cash Management Period, and the borrowers wish to maintain the suspension of the deposit requirements as set forth in the 340 Mt Kemble Whole Loan documents, the borrowers will promptly make additional deposits of cash or modifications or supplements to the letter of credit, in amounts sufficient to cover the full amount of the then-existing NOI Shortfall and compliance will be tested quarterly and (D) the borrowers grant to the lender a security interest in such cash deposit or letter of credit, as applicable and all proceeds thereof, as additional security for the 340 Mt Kemble Whole Loan.
A “Cash Management Period” will commence upon (i) the maturity date of February 1, 2035, (ii) the occurrence of an event of default, (iii) if, as of any calendar quarter the debt service coverage ratio is less than 1.20x (the “DSCR Cash Management Period”) or (iv) the commencement of a Lease Sweep Period. A Cash Management Period will end with regard to: (1) clause (i), if above the 340 Mt Kemble Whole Loan and all other obligations under the 340 Mt Kemble Whole Loan documents have been repaid in full, (2) clause (ii) above, if the related event of default is no longer continuing and no other event of default has occurred and is continuing, (3) clause (iii) above, upon the debt service coverage ratio based on the trailing 12-month period being at least 1.20x as of the last day of a calendar quarter for two consecutive calendar quarters or (4) clause (iv) above, if the Lease Sweep Period has ended.
A “Lease Sweep Period” will commence on the first payment date following the occurrence of any of the following: (i) the date required under a Major Lease by which the applicable Major Tenant is required to give written notice of its exercise of a renewal option (and such renewal has not been so exercised), (ii) 14 months prior to the effective date of any proposed termination, cancellation or surrender of a Major Lease as set forth in any written notice from a Major Tenant exercising such right to terminate, cancel or surrender its Major Lease, (iii) (a) the date that any Major Lease (or a substantial portion thereof) is actually surrendered, cancelled or terminated prior to its then current expiration date (if such Lease Sweep Period has not already commenced under clause (ii) above) or (b) the receipt by any borrower or property manager of written notice from any Major Tenant of its intent to surrender, cancel or terminate its respective Major Lease (or any substantial portion thereof) prior to then current expiration date of the Major Lease if such surrender, cancellation or termination is intended to take place less than one year from such notice; or actually surrendered, cancelled or terminated prior to its then current expiration date, (iv) any Major Tenant discontinuing its business at the entirety of its premises (i.e., "goes dark") for 60 consecutive days or giving written notice it intends to discontinue its business at the entirety of its premises, (v) the occurrence and continuance of a material monetary default or material nonmonetary default under any Major Lease by the applicable Major Tenant thereunder or (vi) the occurrence of an insolvency proceeding or bankruptcy proceeding of a Major Tenant.
A Lease Sweep Period will end upon the earlier to occur of (x) the reasonable determination by the lender that sufficient funds have been accumulated in the special rollover reserve subaccount to pay for all anticipated expenses in connection with the re-leasing of the space under the applicable Major Lease that gave rise to the subject Lease Sweep Period, including brokerage commissions and tenant improvements and any anticipated shortfalls of payments required under the 340 Mt Kemble Whole Loan documents during any period of time that rents are insufficient as a result of down-time or free rent periods, or (y) the occurrence of any of the following (1) with respect to clauses (i), (ii), (iii) or (iv) above, upon the earlier to occur of (A) the date on which the subject Major Tenant exercises its renewal or extension option (or otherwise enters into an extension agreement with the borrowers and reasonably accepted to the lender) with respect to all of the space demised under its Major Lease and in the lender’s reasonable judgment, sufficient funds have been accumulated in the special rollover reserve subaccount (during the continuance of the subject Lease Sweep Period) to pay for all anticipated approved major lease leasing expenses for such Major Lease and any other reasonably anticipated expenses in connection with such renewal or extension or any borrower has deposited such deficiency or (B) the date on which all of the space
| THE INFORMATION IN THIS STRUCTURAL AND COLLATERAL TERM SHEET IS NOT COMPLETE AND MAY BE AMENDED PRIOR TO THE TIME OF SALE. THIS TERM SHEET IS NOT AN OFFER TO SELL THESE SECURITIES AND IT IS NOT A SOLICITATION OF AN OFFER TO BUY THESE SECURITIES IN ANY JURISDICTION WHERE THE OFFER OR SALE IS NOT PERMITTED. |
| | 38 | |
| Structural and Collateral Term Sheet | | BMO 2025-C11 |
| No. 3 – 340 Mt Kemble |
demised under the subject Major Lease (or any material portion thereof) which gave rise to the subject Lease Sweep Period has been fully leased pursuant to a replacement lease or replacement leases reasonably approved by the lender, and entered into in accordance with the 340 Mt Kemble Whole Loan documents, and all approved major lease leasing expenses (and any other expenses in connection with the re-tenanting of such space) have been paid in full or sufficient funds are on deposit in the special rollover reserve subaccount (which may be satisfied by a borrower deposit), (2) with respect to a Lease Sweep Period caused by a matter described in clause (ii) above, if such termination right is not validly exercised by the subject Major Tenant by the latest date to exercise such termination right specified in such Major Lease or is otherwise validly and waived in writing by such Major Tenant; (3) with respect to a Lease Sweep Period caused by a matter described in clause (v) above, if the subject Major Tenant default has been cured, and no other Major Tenant default has occurred and is continuing beyond the expiration of any notice and cure period; or (4) with respect to a Lease Sweep Period caused by a matter described in clause (vi) above, if the applicable Major Tenant insolvency proceeding has terminated and the applicable Major Lease has been affirmed, assumed or assigned in a manner reasonably satisfactory to the lender.
A ”Major Lease” means (i) the FCB lease, (ii) the Morgan Stanley lease and (ii) any other lease which covers 60,000 or more rentable square feet of the 340 Mt Kemble Property.
A “Major Tenant” means any tenant under either a Major Lease, or under one or more leases (leased by such tenant and/or its affiliates), which in the aggregate 60,000 or more rentable square feet of the 340 Mt Kemble Property.
Subordinate Debt and Mezzanine Debt. None.
Permitted Future Mezzanine Debt. Not permitted.
Partial Release. The 340 Mt Kemble Whole Loan documents permit the borrowers to obtain the release of all or a portion of an approximately 2.745-acre parcel of non-income producing land at the 340 Mt Kemble Property in connection with a transfer to third parties or affiliates of the borrowers without the payment of a release price provided that, among other conditions, the borrowers satisfy customary REMIC requirements.
Ground Lease. None.
| THE INFORMATION IN THIS STRUCTURAL AND COLLATERAL TERM SHEET IS NOT COMPLETE AND MAY BE AMENDED PRIOR TO THE TIME OF SALE. THIS TERM SHEET IS NOT AN OFFER TO SELL THESE SECURITIES AND IT IS NOT A SOLICITATION OF AN OFFER TO BUY THESE SECURITIES IN ANY JURISDICTION WHERE THE OFFER OR SALE IS NOT PERMITTED. |
| | 39 | |
| Structural and Collateral Term Sheet | | BMO 2025-C11 |
| No. 4 – Ali’i Place |
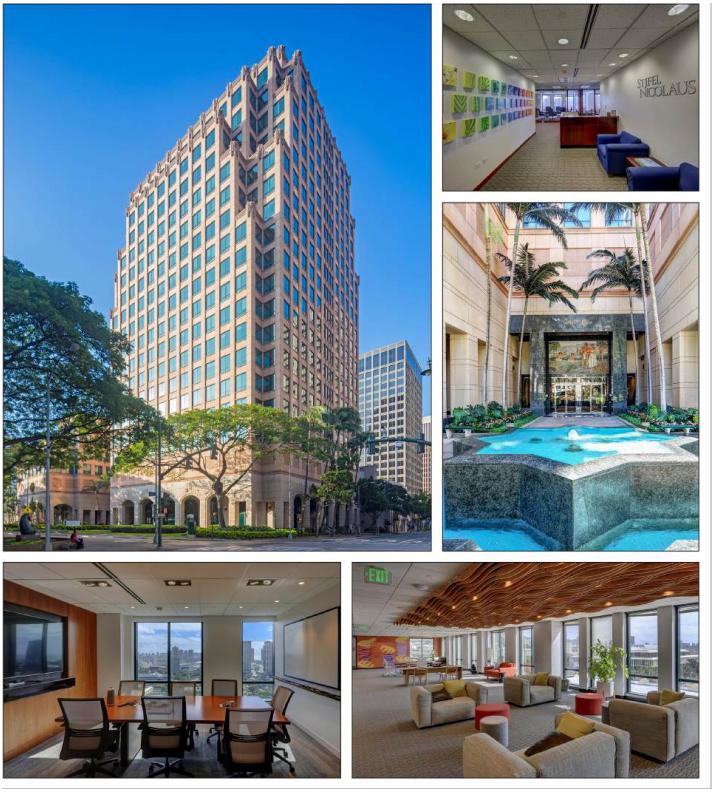
| THE INFORMATION IN THIS STRUCTURAL AND COLLATERAL TERM SHEET IS NOT COMPLETE AND MAY BE AMENDED PRIOR TO THE TIME OF SALE. THIS TERM SHEET IS NOT AN OFFER TO SELL THESE SECURITIES AND IT IS NOT A SOLICITATION OF AN OFFER TO BUY THESE SECURITIES IN ANY JURISDICTION WHERE THE OFFER OR SALE IS NOT PERMITTED. |
| | 40 | |
| Structural and Collateral Term Sheet | | BMO 2025-C11 |
| No. 4 – Ali’i Place |
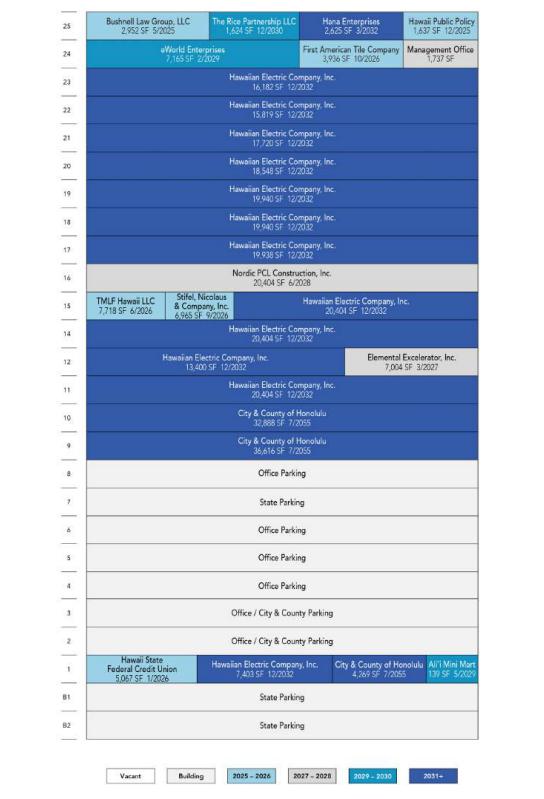
| THE INFORMATION IN THIS STRUCTURAL AND COLLATERAL TERM SHEET IS NOT COMPLETE AND MAY BE AMENDED PRIOR TO THE TIME OF SALE. THIS TERM SHEET IS NOT AN OFFER TO SELL THESE SECURITIES AND IT IS NOT A SOLICITATION OF AN OFFER TO BUY THESE SECURITIES IN ANY JURISDICTION WHERE THE OFFER OR SALE IS NOT PERMITTED. |
| | 41 | |
| Structural and Collateral Term Sheet | | BMO 2025-C11 |
| No. 4 – Ali’i Place |
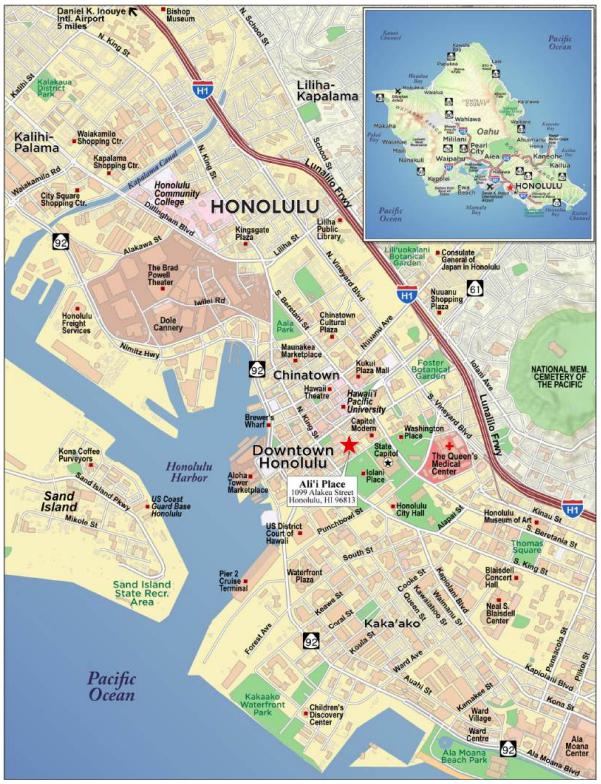
| THE INFORMATION IN THIS STRUCTURAL AND COLLATERAL TERM SHEET IS NOT COMPLETE AND MAY BE AMENDED PRIOR TO THE TIME OF SALE. THIS TERM SHEET IS NOT AN OFFER TO SELL THESE SECURITIES AND IT IS NOT A SOLICITATION OF AN OFFER TO BUY THESE SECURITIES IN ANY JURISDICTION WHERE THE OFFER OR SALE IS NOT PERMITTED. |
| | 42 | |
| Structural and Collateral Term Sheet | | BMO 2025-C11 |
| No. 4 – Ali’i Place |
| Mortgage Loan Information | | Property Information |
| Mortgage Loan Seller: | UBS AG | | Single Asset / Portfolio: | Single Asset |
| Original Principal Balance: | $46,575,000 | | Title: | Leasehold |
| Cut-off Date Principal Balance: | $46,575,000 | | Property Type - Subtype: | Office – CBD |
| % of IPB: | 5.1% | | Net Rentable Area (SF): | 337,370 |
| Loan Purpose: | Acquisition | | Location: | Honolulu, HI |
| Borrower: | HONCRE1 LLC | | Year Built / Renovated: | 1992 / NAP |
| Borrower Sponsor: | AGC Equity Partners Holding Ltd. | | Occupancy: | 100.0% |
| Interest Rate: | 7.02200% | | Occupancy Date: | 10/24/2024 |
| Note Date: | 1/23/2025 | | 4th Most Recent NOI (As of): | $3,952,076 (12/31/2021) |
| Maturity Date: | 2/6/2035 | | 3rd Most Recent NOI (As of): | $5,198,238 (12/31/2022) |
| Interest-only Period: | 120 months | | 2nd Most Recent NOI (As of): | $8,307,942 (12/31/2023) |
| Original Term: | 120 months | | Most Recent NOI (As of): | $8,490,546 (TTM 9/30/2024) |
| Original Amortization Term: | None | | UW Economic Occupancy: | 92.0% |
| Amortization Type: | Interest Only | | UW Revenues: | $14,601,654 |
| Call Protection: | L(12),YM1(101),O(7) | | UW Expenses: | $7,457,474 |
| Lockbox / Cash Management: | Hard / Springing | | UW NOI: | $7,144,180 |
| Additional Debt: | No | | UW NCF: | $6,374,502 |
| Additional Debt Balance: | NAP | | Appraised Value / Per SF: | $69,400,000 / $206 |
| Additional Debt Type: | NAP | | Appraisal Date: | 10/31/2024 |
| | | | | |
| Escrows and Reserves(1) | | Financial Information |
| | Initial | Monthly | Initial Cap | | Cut-off Date Loan / SF: | $138 |
| Taxes: | $119,952 | $59,976 | N/A | | Maturity Date Loan / SF: | $138 |
| Insurance: | $142,019 | $47,340 | N/A | | Cut-off Date LTV: | 67.1% |
| Replacement Reserve: | $0 | $5,623 | $275,000 | | Maturity Date LTV: | 67.1% |
| TI / LC Reserve: | $850,000 | $49,200 | N/A | | UW NCF DSCR: | 1.92x |
| Immediate Repairs: | $40,425 | $0 | N/A | | UW NOI Debt Yield: | 15.3% |
| Other Reserves: | $79,635 | $70,605 | N/A | | | |
| | | | | | | |
| Sources and Uses |
| Sources | Proceeds | % of Total | | Uses | Proceeds | % of Total |
| Mortgage Loan | $46,575,000 | 63.2 | % | | Purchase Price | $69,000,000 | 93.7 | % |
| Borrower Sponsor Equity | 27,093,423 | 36.8 | | | Closing Costs | 3,436,393 | 4.7 | |
| | | | | Upfront Reserves | 1,232,030 | 1.7 | |
| Total Sources | $73,668,423 | 100.0 | % | | Total Uses | $73,668,423 | 100.0 | % |
| (1) | See “Escrows and Reserves” below for further discussion of reserve information. |
The Loan. The fourth largest mortgage loan (the “Ali’i Place Mortgage Loan”) is secured by the borrower’s leasehold interest in a 337,370 square foot Class A, 23-story, office tower located in the central business district (“CBD”) of Honolulu, Hawaii (the “Ali’i Place Property”). The Ali’i Place Mortgage Loan is evidenced by one promissory note with an outstanding principal balance as of the Cut-off Date of $46,575,000. The Ali’i Place Mortgage Loan was originated on January 23, 2025 by UBS AG. The Ali’i Place Mortgage Loan accrues interest at a fixed rate of 7.02200% per annum. The Ali’i Place Mortgage Loan has a 10-year term, is interest-only for the entire term and accrues interest on an Actual/360 basis. The scheduled maturity date of the Ali’i Place Mortgage Loan is February 6, 2035.
The Property. The Ali’i Place Property comprises a 23-story, Class A, LEED Gold certified office building totaling 337,370 square feet of net rentable area and two subterranean levels located in Honolulu, Hawaii. Situated on a 1.58-acre site, the Ali’i Place Property was constructed in 1992. The Ali’i Place Property has 1,057 parking spaces on the two subterranean levels (B1 and B2) and seven above-grade levels, resulting in a parking ratio of approximately 3.1 spaces per 1,000 square feet. According to the borrower sponsor, many of the tenant spaces have been recently improved in the last five years as
| THE INFORMATION IN THIS STRUCTURAL AND COLLATERAL TERM SHEET IS NOT COMPLETE AND MAY BE AMENDED PRIOR TO THE TIME OF SALE. THIS TERM SHEET IS NOT AN OFFER TO SELL THESE SECURITIES AND IT IS NOT A SOLICITATION OF AN OFFER TO BUY THESE SECURITIES IN ANY JURISDICTION WHERE THE OFFER OR SALE IS NOT PERMITTED. |
| | 43 | |
| Structural and Collateral Term Sheet | | BMO 2025-C11 |
| No. 4 – Ali’i Place |
ownership has invested in tenant improvements totaling approximately $11.1 million. In addition, approximately $10.8 million has been spent over the last five years on building improvements including elevator modernization and replacement of chillers and cooling towers. As of October 24, 2024, the Ali’i Place Property was 100.0% leased to 14 tenants.
Major Tenants. The three largest tenants by net rentable area are Hawaiian Electric Company, Inc. (“HECO”), City & County of Honolulu (“CCH”) and Nordic PCL Construction, Inc.
Hawaiian Electric Company, Inc. (194,624 square feet; 57.7% of NRA; 72.9% of underwritten base rent). HECO (Fitch/Moody’s/S&P: B/B1/B-) is a regulated electric public utility incorporated in 1891, operating as a subsidiary of Hawaiian Electric Industries, Inc. (NYSE: HE). HECO is responsible for producing, purchasing, transmitting, distributing, and selling electricity across the islands of Oahu, Hawaii, Maui, Lanai, and Molokai. HECO owns overhead transmission and distribution lines, underground cables, poles, and high-voltage metal towers, serving various suburban communities, resorts, United States Armed Forces installations and agricultural operations. HECO has been at the Ali’i Place Property, which serves as its headquarters, since 2021. HECO has leased 165,405 square feet of initial space since January 2021 and 29,219 square feet of space since January 1, 2022 all with a lease expiration on December 31, 2032. HECO has two, 10-year renewal options, a third renewal option through expiration of the ground lease term in February 2057 (approximately four years), and fourth and fifth renewal options to extend for 7.5 years each if the ground lessee exercises its 15-year extension option. HECO has no termination options but does have a right of first offer to lease any space becoming available at the Ali’i Place Property. Four suites on the 1st, 11th, 17th, and 23rd floors totaling 63,927 square feet have been subleased to the CCH since January 1, 2021. The sublease has the same base rental rate and reimbursement structure as the direct lease with HECO and the expiration date of December 31, 2032 is also co-terminus with HECO's direct lease. The subtenant uses the space for the benefit of The Honolulu Authority For Rapid Transportation, a semi-autonomous municipal agency.
City & County of Honolulu (73,773 square feet; 21.9% of NRA; 0.0% of underwritten base rent). CCH (Fitch/Moody’s/S&P: AA+/Aa2/AA+) is a municipal corporation responsible for overseeing municipal services in urban Honolulu, as well as in other neighborhoods on the island of Oahu and several minor outlying islands. CCH manages a range of affairs, including civil defense, emergency medical services, fire protection, parks and recreation, police, sanitation, transportation, and water services, among others. CCH has been at the Ali’i Place Property since February 1992 and the tenant’s current lease expires July 31, 2055. CCH has a base rental rate of $0 pursuant to the ground lease agreement between CCH and the leasehold owner but is responsible for its pro rata share of operating expenses on a triple-net basis. CCH has one option to extend its term for 15 years if the landlord exercises its 15-year extension option under its ground lease and no termination options. In addition to the 73,773 square feet of space, CCH is currently subleasing an additional 63,927 square feet of space from HECO as detailed above.
Nordic PCL Construction, Inc. (20,404 square feet; 6.0% of NRA; 8.9% of underwritten base rent). Nordic PCL Construction, Inc. is a subsidiary of PCL Constructors Inc., an employee-owned group of construction companies operating in Canada, the United States, Australia, and the Caribbean. The company offers design-build, general contracting, and construction management services across civil infrastructure, heavy industrial, and building markets. Nordic PCL Construction, Inc. is the Hawaiian branch of the business. Nordic PCL Construction, Inc. has expanded several times at the Ali’i Place Property currently occupying 20,404 square feet of space with a lease expiration of June 30, 2028. Nordic PCL Construction, Inc. has no renewal options and no termination options.
The following table presents certain information relating to the historical and current occupancy of the Ali’i Place Property:
| Historical and Current Occupancy |
| 2021(1) | 2022(1) | 2023(2) | Current |
| 93.7% | 99.2% | 98.3% | 100.0% |
| (1) | Historical occupancies are as of December 31 of each respective year. |
| (2) | Current occupancy is based on the underwritten rent roll as of October 24, 2024. |
| THE INFORMATION IN THIS STRUCTURAL AND COLLATERAL TERM SHEET IS NOT COMPLETE AND MAY BE AMENDED PRIOR TO THE TIME OF SALE. THIS TERM SHEET IS NOT AN OFFER TO SELL THESE SECURITIES AND IT IS NOT A SOLICITATION OF AN OFFER TO BUY THESE SECURITIES IN ANY JURISDICTION WHERE THE OFFER OR SALE IS NOT PERMITTED. |
| | 44 | |
| Structural and Collateral Term Sheet | | BMO 2025-C11 |
| No. 4 – Ali’i Place |
The following table presents certain information relating to the tenants at the Ali’i Place Property:
| Tenant Summary(1) |
| Tenant | Ratings
Moody’s/S&P/Fitch | Net Rentable Area (SF) | % of
Total NRA | UW Base Rent PSF(2) | UW Base Rent(2) | % of Total
UW Base Rent(2) | Lease
Expiration Date |
| Hawaiian Electric Company, Inc.(3) | B1/B-/B | 194,624 | 57.7 | % | $21.28 | $4,142,430 | 72.9 | % | 12/31/2032 |
| City & County of Honolulu(4) | Aa2/AA+/AA+ | 73,773 | 21.9 | | $0.00 | 0 | 0.0 | | 7/31/2055 |
| Nordic PCL Construction, Inc. | NR/NR/NR | 20,404 | 6.0 | | $24.85 | 507,065 | 8.9 | | 6/30/2028 |
| Subtotal / Wtd. Avg. | | 288,801 | 85.6 | % | $16.10 | $4,649,495 | 81.8 | % | |
| | | | | | | | |
| Other Tenants | | 48,569 | 14.4 | % | $21.30 | $1,034,363 | 18.2 | % | |
| | | | | | | | |
| Occupied Collateral Total / Wtd. Avg. | 337,370 | 100.0 | % | $16.85 | $5,683,858 | 100.0 | % | |
| | | | | | | | |
| Vacant Space | | 0 | 0.0 | % | | | | |
| | | | | | | | |
| Collateral Total | | 337,370 | 100.0 | % | | | | |
| | | | | | | | |
| (1) | Based on the underwritten rent roll dated October 24, 2024. |
| (2) | UW Base Rent PSF, UW Base Rent and % of Total UW Base Rent are inclusive of approximately $280,679 of contractual rent steps through February 2026. |
| (3) | HECO subleases a portion of its space (63,927 square feet) at the Ali’i Place Property to CCH, the second largest tenant at the Ali’i Place Property. CCH has occupied the subleased space since 2021 at the same base rental rate and reimbursement structure as the direct lease with HECO and an expiration date that is co-terminus with HECO's direct lease. |
| (4) | In addition to the 73,773 square feet of space, CCH is currently subleasing an additional 63,927 square feet of space from HECO as detailed above. CCH has a base rental rate of $0 pursuant to the ground lease agreement between CCH and the leasehold owner but is responsible for its pro rata share of operating expenses on a triple-net basis. |
The following table presents certain information relating to the lease rollover schedule at the Ali’i Place Property:
| Lease Rollover Schedule(1) |
| | Number of Leases Expiring | Net Rentable Area Expiring | % of NRA Expiring | UW Base Rent Expiring(2) | % of UW Base Rent Expiring(2) | Cumulative Net Rentable Area Expiring | Cumulative % of NRA Expiring | Cumulative UW Base Rent Expiring(2) | Cumulative % of UW Base Rent Expiring(2) |
| Vacant | NAP | 0 | 0.0 | % | NAP | NA | P | 0 | 0.0% | NAP | NAP | |
| 2025 & MTM | 3 | 6,326 | 1.9 | | $104,476 | 1.8 | % | 6,326 | 1.9% | $104,476 | 1.8% | |
| 2026 | 4 | 23,686 | 7.0 | | 566,037 | 10.0 | | 30,012 | 8.9% | $670,513 | 11.8% | |
| 2027 | 1 | 7,004 | 2.1 | | 136,158 | 2.4 | | 37,016 | 11.0% | $806,671 | 14.2% | |
| 2028 | 1 | 20,404 | 6.0 | | 507,065 | 8.9 | | 57,420 | 17.0% | $1,313,735 | 23.1% | |
| 2029 | 2 | 7,304 | 2.2 | | 135,936 | 2.4 | | 64,724 | 19.2% | $1,449,671 | 25.5% | |
| 2030 | 1 | 1,624 | 0.5 | | 35,952 | 0.6 | | 66,348 | 19.7% | $1,485,622 | 26.1% | |
| 2031 | 0 | 0 | 0.0 | | 0 | 0.0 | | 66,348 | 19.7% | $1,485,622 | 26.1% | |
| 2032 | 2 | 197,249 | 58.5 | | 4,198,236 | 73.9 | | 263,597 | 78.1% | $5,683,858 | 100.0% | |
| 2033 | 0 | 0 | 0.0 | | 0 | 0.0 | | 263,597 | 78.1% | $5,683,858 | 100.0% | |
| 2034 | 0 | 0 | 0.0 | | 0 | 0.0 | | 263,597 | 78.1% | $5,683,858 | 100.0% | |
| 2035 | 0 | 0 | 0.0 | | 0 | 0.0 | | 263,597 | 78.1% | $5,683,858 | 100.0% | |
| 2036 & Beyond(3) | 1 | 73,773 | 21.9 | | 0 | 0.0 | | 337,370 | 100.0% | $5,683,858 | 100.0% | |
| Total | 15 | 337,370 | 100.0 | % | $5,683,858 | 100.0 | % | | | | |
| (1) | Based on the underwritten rent roll dated October 24, 2024. |
| (2) | UW Base Rent Expiring, % of UW Base Rent Expiring, Cumulative UW Base Rent Expiring and Cumulative % of UW Base Rent Expiring are inclusive of approximately $280,679 of contractual rent steps through February 2026. |
| (3) | 2036 & Beyond incudes CCH, which has a base rental rate of $0 pursuant to the ground lease agreement between CCH and the leasehold owner but is responsible for its pro rata share of operating expenses on a triple-net basis. |
| THE INFORMATION IN THIS STRUCTURAL AND COLLATERAL TERM SHEET IS NOT COMPLETE AND MAY BE AMENDED PRIOR TO THE TIME OF SALE. THIS TERM SHEET IS NOT AN OFFER TO SELL THESE SECURITIES AND IT IS NOT A SOLICITATION OF AN OFFER TO BUY THESE SECURITIES IN ANY JURISDICTION WHERE THE OFFER OR SALE IS NOT PERMITTED. |
| | 45 | |
| Structural and Collateral Term Sheet | | BMO 2025-C11 |
| No. 4 – Ali’i Place |
The following table presents certain information relating to the operating history and underwritten cash flows of the Ali’i Place Property:
| Operating History and Underwritten Net Cash Flow |
| | 2021 | 222 | 2023 | TTM(1) | Underwritten | Per Square Foot | %(2) | |
| Rents in Place(3) | $2,973,705 | $3,999,549 | $5,132,575 | $5,755,576 | $5,683,858 | $16.85 | 36.4 | % |
| Vacant Income | 0 | 0 | 0 | 0 | 0 | 0.00 | 0.0 | |
| Gross Potential Rent | $2,973,705 | $3,999,549 | $5,132,575 | $5,755,576 | $5,683,858 | $16.85 | 36.4 | % |
| Total Reimbursements | 5,798,683 | 6,585,479 | 8,065,485 | 7,624,995 | 7,228,680 | 21.43 | 46.2 | |
| Other Income | 1,707,425 | 2,045,757 | 2,578,275 | 2,722,119 | 2,722,119 | 8.07 | 17.4 | |
| Net Rental Income | $10,479,813 | $12,630,785 | $15,776,334 | $16,102,690 | $15,634,657 | $46.34 | 100.0 | % |
| (Vacancy/Credit Loss) | 0 | 0 | 0 | 0 | (1,033,003) | (3.06) | (6.6 | ) |
| Effective Gross Income | $10,479,813 | $12,630,785 | $15,776,334 | $16,102,690 | $14,601,654 | $43.28 | 93.4 | % |
| | | | | | | | |
| Total Expenses | $6,527,737 | $7,432,547 | $7,468,392 | $7,612,144 | $7,457,474 | $22.10 | 51.1 | % |
| | | | | | | | |
| Net Operating Income | $3,952,076 | $5,198,238 | $8,307,942 | $8,490,546 | $7,144,180 | $21.18 | 48.9 | % |
| | | | | | | | |
| Total TI/LC, Capex/RR | 0 | 0 | 0 | 0 | 769,678 | 2.28 | 5.3 | |
| | | | | | | | |
| Net Cash Flow | $3,952,076 | $5,198,238 | $8,307,942 | $8,490,546 | $6,374,502 | $18.89 | 43.7 | % |
| (1) | TTM represents the trailing 12-month period ending September 30, 2024. |
| (2) | % column represents percent of Net Rental Income for all revenue lines and represents percent of Effective Gross Income for the remainder of fields. |
| (3) | Based on the underwritten rent roll dated October 24, 2024 with rent steps totaling $280,679 through February 2026. |
Environmental. According to the Phase I environmental assessment dated October 7, 2024, there was no evidence of any recognized environmental conditions at the Ali’i Place Property.
Appraisal. According to the appraisal, the Ali’i Place Property had an “as-is” appraised value of $69,400,000 as of October 31, 2024. The table below shows the appraisal’s “as-is” conclusions.
| Appraisal Valuation Summary(1) |
| Appraisal Approach | Appraised Value | Capitalization Rate(2) |
| Direct Capitalization Approach | $69,400,000 | 9.50% |
| (2) | The appraisal used a discounted cash flow approach to arrive at the appraised value. The capitalization rate shown above represents the overall capitalization rate. |
| THE INFORMATION IN THIS STRUCTURAL AND COLLATERAL TERM SHEET IS NOT COMPLETE AND MAY BE AMENDED PRIOR TO THE TIME OF SALE. THIS TERM SHEET IS NOT AN OFFER TO SELL THESE SECURITIES AND IT IS NOT A SOLICITATION OF AN OFFER TO BUY THESE SECURITIES IN ANY JURISDICTION WHERE THE OFFER OR SALE IS NOT PERMITTED. |
| | 46 | |
| Structural and Collateral Term Sheet | | BMO 2025-C11 |
| No. 4 – Ali’i Place |
The Market. The Ali’i Place Property is located in Honolulu, Hawaii in Honolulu's CBD, bounded by Alakea Street, South Hotel Street (northeast), and Richards Street (southeast). The Ali’i Place Property is situated across Richards Street from the Hawaii State Capitol and a less than 10-minute walk from the Supreme Court of Hawaii, Honolulu Hale City Hall, and Washington Place (governor's mansion). TheBus, the City and County of Honolulu's public bus transportation service, is available next to the Ali’i Place Property on Alakea and South Hotel Streets, and three blocks away (eight-minute walk) is the future Kuloloia Station (Downtown) of the Skyline Rail. The CBD is also home to some of Oahu's most historic places including the lolani Palace, the King Kamehameha I statue, and the Kawaiahao Church.
According to a third-party market research report, the estimated 2024 population within a one-, three- and five-mile radius of the Ali’i Place Property was 50,294, 219,568 and 329,509, respectively, and the estimated 2024 average household income within the same radii was $96,025, $104,038 and $111,783, respectively.
According to a third-party market research report, the Ali’i Place Property is located within the Honolulu office market within the CBD office submarket. As of October 2024, the CBD office submarket contained 11,746,592 square feet, a vacancy rate of approximately 6.8% and asking rent of $33.43 per square foot. The appraisal determined market rent of $21.00 per square foot NNN for office space.
The following table presents certain information with respect to comparable leases to the Ali’i Place Property as identified in the appraisal:
| Comparable Office Leases(1) |
| Property Name/Location | Year Built / Renovated | Occ. % | Total NRA (SF) | Tenant Name | Lease Date/Term (Yrs.) | Lease Area (SF) | Annual Base Rent PSF | Lease Type |
Ali’i Place 1099 Alakea Street Honolulu, HI | 1992 / NAP | 100.0%(2) | 337,370(2) | HECO(2) | Jan-2021 / 12.0(2) | 194,624(2) | $21.28(2) | NNN |
City Financial Tower 201 Merchant Street Honolulu, HI | 1989 / NAP | 100.0% | 178,561 | Chicago Partners Investment Group LLC | Mar-2024 / 10.0 | 2,478 | $19.80 | NNN |
Central Pacific Plaza 220 South King Street, Suite 1501 Honolulu, HI | 1983 / NAP | 85.3% | 253,382 | Accumulus | Dec-2023 / 5.0 | 1,689 | $18.00 | NNN |
Waterfront Plaza 500 Ala Moana Boulevard Honolulu, HI | 1986 / 2006 | 87.7% | 547,277 | Ameriprise Financial Services | Nov-2023 / 5.3 | 1,425 | $25.80 | NNN |
Bishop Square 1000 Bishop Street Honolulu, HI | 1972 / 1983 | 87.0% | 519,087 | Wells Fargo Cleaning Services, LLC | Nov-2023 / 1.0 | 17,497 | $16.80 | NNN |
The Block Richards 707 Richards Street Honolulu, HI | 1988 / 2018 | 92.5% | 101,526 | State of Hawaii - DAGS - DHS, Vocational Rehab & Services Division | Oct-2023 / 10.0 | 6,785 | $19.80 | NNN |
| (2) | Based on the underwritten rent roll dated October 24, 2024. |
The Borrower. The borrower is HONCRE1 LLC, a Delaware limited liability company and single purpose entity with one independent director. Legal counsel to the borrower delivered a non-consolidation opinion in connection with the origination of the Ali’i Place Mortgage Loan.
The Borrower Sponsor. The borrower sponsor is AGC Equity Partners Holding Ltd. (“AGC”), a London-based investment company established in 2009, which invests in a wide range of real assets, private equity opportunities and liquid strategies through its investment funds. With approximately $6.5 billion in assets under management, AGC’s global investors include government-related entities, such as sovereign funds and quasi-sovereign entities, as well as public and private pension funds, financial institutions and family offices. The non-recourse carveout guarantor for Ali’i Place Mortgage Loan is HONCRE1 Cayman Holding Limited.
| THE INFORMATION IN THIS STRUCTURAL AND COLLATERAL TERM SHEET IS NOT COMPLETE AND MAY BE AMENDED PRIOR TO THE TIME OF SALE. THIS TERM SHEET IS NOT AN OFFER TO SELL THESE SECURITIES AND IT IS NOT A SOLICITATION OF AN OFFER TO BUY THESE SECURITIES IN ANY JURISDICTION WHERE THE OFFER OR SALE IS NOT PERMITTED. |
| | 47 | |
| Structural and Collateral Term Sheet | | BMO 2025-C11 |
| No. 4 – Ali’i Place |
A portion of the purchase price for the acquisition of the Ali’i Place Property was financed by a $15,150,000 intercompany loan (the “Shareholder Loan”) made by Jermyn Street US Real Estate Fund III LP (“Fund III”) to its subsidiary, HONCRE1 USB LLC (“HONCRE1 USB”), which was contributed by HONCRE1 USB to the borrower. The Shareholder Loan is not secured by any lien, pledge or security agreement and is subordinate to the Ali’i Place Mortgage Loan both by its terms and by a subordination and standstill agreement, pursuant to which Fund III agreed not to enforce the Shareholder Loan documents for so long as the Ali’i Place Mortgage Loan is outstanding and not to receive or be entitled to any payments under the Shareholder Loan during a Cash Management Trigger Event (as defined below) or Cash Sweep Trigger Event (as defined below) under the Ali’I Place Mortgage Loan.
Property Management. The Ali’i Place Property is managed by Avison Young - Southern California, Ltd.
Escrows and Reserves. At origination, the borrower was required to deposit into escrow (i) approximately $119,952 for real estate taxes, (ii) approximately $142,019 for insurance premiums, (iii) $850,000 for tenant improvements and leasing commissions, (iv) $40,425 for immediate repairs, (v) $9,030 for outstanding free rent related to the lease at the Ali’i Place Property with Hana Enterprises and (vi) approximately $70,605 for ground rent.
Tax Escrows – On a monthly basis, the borrower is required to deposit 1/12th of the annual estimated tax payments, which currently equates to approximately $59,976.
Insurance Escrows – On a monthly basis, the borrower is required to deposit 1/12th of the annual estimated insurance premiums, which currently equates to approximately $47,340; provided, such monthly deposits will be waived so long as the borrower maintains a blanket insurance policy acceptable to the lender. There was no blanket policy in place at origination.
Replacement Reserve – On a monthly basis, the borrower is required to deposit approximately $5,623 for replacement reserves subject to a cap of $275,000.
TI / LC Reserve – On a monthly basis, the borrower is required to deposit approximately $49,200 for tenant allowances, tenant improvements and leasing commissions.
Ground Rent Funds – On a monthly basis, the borrower is required to deposit approximately $70,605 for ground rent.
Lockbox / Cash Management. The Ali’i Place Mortgage Loan is structured with a hard lockbox and springing cash management upon the occurrence and continuance of a Cash Management Trigger Event. Rents received from the Ali’i Place Property are required to be deposited directly into the lockbox account or, if received by the borrower or the property manager, as applicable, deposited within three business days of receipt. During the continuance of a Cash Management Trigger Event, all funds in the lockbox account are required to be swept each business day to a lender-controlled cash management account and disbursed in accordance with the Ali’i Place Mortgage Loan documents, and all excess funds on deposit in the cash management account (after payment of required monthly reserve deposits, debt service payment on the Ali’i Place Mortgage Loan, operating expenses and cash management bank fees) will be applied as follows: (a) if a Material Tenant Trigger Event has occurred and is continuing, to a Material Tenant (as defined below) rollover reserve, (b) if a Cash Sweep Trigger Event (as defined below) has occurred and is continuing (but not a Material Tenant Trigger Event), to the lender-controlled excess cash flow account or (c) if no Material Tenant Trigger Event or Cash Sweep Trigger Event has occurred and is continuing, to an account designated by the borrower.
A “Cash Management Trigger Event” means a period commencing upon the occurrence of (i) an event of default under the Ali’i Place Mortgage Loan documents, (ii) any bankruptcy action involving any of the borrower, the guarantor, the sponsor or the property manager, (iii) the trailing 12-month period debt service coverage ratio (“DSCR”) falling below 1.25x for two consecutive calendar quarters, (iv) the indictment for fraud or misappropriation of funds by any of the borrower, the guarantor, the sponsor or an affiliated property manager or any director or officer of the aforementioned parties or third-party property manager (provided that, in the case of the third-party property manager, such fraud or misappropriation is related to the Ali’i Place Property) or (v) a Material Tenant Trigger Event, and expiring upon, with respect to (a) clause (i) above, the cure of such event of default, (b) clause (ii) above, the filing being discharged, stayed or dismissed within 90 days, and the lender’s determination that such filing does not materially affect the borrower’s, the guarantor’s, the sponsor’s or the property manager’s monetary obligations, (c) clause (iii) above, the trailing 12-month DSCR being at least 1.25x for
| THE INFORMATION IN THIS STRUCTURAL AND COLLATERAL TERM SHEET IS NOT COMPLETE AND MAY BE AMENDED PRIOR TO THE TIME OF SALE. THIS TERM SHEET IS NOT AN OFFER TO SELL THESE SECURITIES AND IT IS NOT A SOLICITATION OF AN OFFER TO BUY THESE SECURITIES IN ANY JURISDICTION WHERE THE OFFER OR SALE IS NOT PERMITTED. |
| | 48 | |
| Structural and Collateral Term Sheet | | BMO 2025-C11 |
| No. 4 – Ali’i Place |
two consecutive calendar quarters, (d) clause (iv) above, the dismissal of the applicable indictment with prejudice or acquittal of the applicable person, or the replacement of the property manager with a third-party property manager that constitutes a qualified property manager under the Ali’i Place Mortgage Loan documents or (e) clause (v) above, the cure of such Material Tenant Trigger Event.
A “Cash Sweep Trigger Event” means a period commencing upon the occurrence of (i) an event of default under the Ali’i Place Mortgage Loan documents, (ii) any bankruptcy action involving any of the borrower, the guarantor, the sponsor or the affiliated property manager or (iii) the trailing 12-month period DSCR falling below 1.25x for two consecutive calendar quarters, and expiring upon, with respect to (a) clause (i) above, the cure of such event of default, (b) clause (ii) above, as to an involuntary filing, the filing being discharged, stayed or dismissed within 90 days, and the lender’s determination that such filing does not materially affect the borrower’s, the guarantor’s, the sponsor’s or the property manager’s monetary obligations or (c) clause (iii) above, the trailing 12-month DSCR is at least 1.25x for two consecutive calendar quarters.
A “Material Tenant” means (i) HECO, (ii) CCH or (iii) any tenant at the Ali’i Place Property that, individually or together with its affiliates, either (a) leases no less than 20% of the total rentable square footage of the Ali’i Place Property or (b) accounts for (or would account for) no less than 20% of the total in-place base rent at the Ali’i Place Property.
A “Material Tenant Trigger Event” means a period commencing upon the occurrence of (i) a Material Tenant giving notice of its intention to terminate or not to extend or renew its lease, (ii) if on or prior to the date that is 18 months prior to the then applicable expiration date under its Material Tenant lease, a Material Tenant does not extend such Material Tenant lease, (iii) an event of default under a Material Tenant lease occurring and continuing beyond any applicable notice and/or cure period, (iv) a bankruptcy action of a Material Tenant or a lease guarantor of any Material Tenant lease, (v) a Material Tenant lease being terminated (in whole or with respect to a portion exceeding 20% of the applicable Material Tenant space), (vi) a Material Tenant (other than HECO with respect to the portion of its Material Tenant space subleased to CCH, but only for so long as the CCH sublease remains in full force and effect) “going dark”, vacating, ceasing to occupy or ceasing to conduct business in the ordinary course at all or a portion exceeding 10% of its Material Tenant space, (vii) a Material Tenant announcing or disclosing publicly its intention to relocate from or vacate all or any portion exceeding 50% of its Material Tenant space or (viii) if all or a portion exceeding 50% of a Material Tenant space is marketed in writing for sublease by or on behalf of a Material Tenant (other than HECO with respect to the portion of its Material Tenant space subleased to CCH, but only for so long as the CCH sublease remains in full force and effect), and expiring upon, with respect to (a) clauses (i), (ii), (iii), (v), (vi), (vii) or (viii) above, the date that (1) the applicable Material Tenant lease is extended on terms satisfying the requirements of the Ali’i Place Mortgage Loan documents or (2) all or substantially all of the applicable Material Tenant space is leased to a replacement tenant provided that, in each case, (X) the occupancy conditions have been satisfied as reasonably determined by the lender (or, with respect to an extension of the HECO lease, the HECO lease extension conditions are satisfied) and (Y) the debt yield is at least 11.8%, (b) clause (i) above, the unconditional revocation or rescission by the applicable Material Tenant of all termination or non-extension notices with respect to its Material Tenant lease, (c) clause (iii) above, a cure of the applicable event of default, (d) clause (iv) above, the affirmation of the Material Tenant lease in the applicable bankruptcy proceeding and confirmation that the Material Tenant is actually paying all rents and other amounts under its lease (or, if applicable, the discharge or dismissal of the applicable Material Tenant lease guarantor from the applicable bankruptcy proceeding; provided that such bankruptcy (after dismissal or discharge) does not have an adverse effect on such Material Tenant lease guarantor’s ability to perform its obligations under its lease guaranty), (e) clause (vi) above, the applicable Material Tenant re-commences its operations and the conduct of business in the ordinary course at its Material Tenant space or the applicable portion thereof, as the case may be, such that it is no longer dark, and has not vacated or ceased to conduct business in the ordinary course at property or a portion thereof, (f) clause (vii) above, the unconditional retraction by the applicable Material Tenant of all announcements or disclosures of its intention to relocate from or vacate any portion of its Material Tenant space or (g) clause (viii) above, the unconditional cessation of all marketing efforts by or on behalf of the applicable Material Tenant with respect to its Material Tenant space.
Subordinate and Mezzanine Debt. None.
Permitted Future Mezzanine or Subordinate Debt. Not permitted.
Partial Release. Not permitted.
| THE INFORMATION IN THIS STRUCTURAL AND COLLATERAL TERM SHEET IS NOT COMPLETE AND MAY BE AMENDED PRIOR TO THE TIME OF SALE. THIS TERM SHEET IS NOT AN OFFER TO SELL THESE SECURITIES AND IT IS NOT A SOLICITATION OF AN OFFER TO BUY THESE SECURITIES IN ANY JURISDICTION WHERE THE OFFER OR SALE IS NOT PERMITTED. |
| | 49 | |
| Structural and Collateral Term Sheet | | BMO 2025-C11 |
| No. 4 – Ali’i Place |
Ground Lease. The Ali’i Place Property is subject to a ground lease between the borrower as ground lessee, and CCH, as ground lessor. The ground lease expires on February 5, 2057, with one, 15-year renewal option. Pursuant to the Ali’i Place Mortgage Loan documents, the borrower is required to exercise the renewal option and to extend the ground lease to February 5, 2072, within 90 days of the origination of the Ali’i Place Mortgage Loan. Annual base rent under the ground lease is currently $734,117 through February 6, 2032, subject to increases based on the prevailing fair market return on 70% of the land’s fair market value, with the new rent not less than rent for the preceding period. In addition to annual payments of ground rent, the borrower is obligated to provide office space totaling 73,773 square feet to CCH for the term of the ground lease free of base rent and provide 235 parking spaces to the public. CCH pays its pro rata share of operating expenses and its Hawaii general excise tax.
| THE INFORMATION IN THIS STRUCTURAL AND COLLATERAL TERM SHEET IS NOT COMPLETE AND MAY BE AMENDED PRIOR TO THE TIME OF SALE. THIS TERM SHEET IS NOT AN OFFER TO SELL THESE SECURITIES AND IT IS NOT A SOLICITATION OF AN OFFER TO BUY THESE SECURITIES IN ANY JURISDICTION WHERE THE OFFER OR SALE IS NOT PERMITTED. |
| | 50 | |
| Structural and Collateral Term Sheet | | BMO 2025-C11 |
| No. 6 – 360 Bowery |

| THE INFORMATION IN THIS STRUCTURAL AND COLLATERAL TERM SHEET IS NOT COMPLETE AND MAY BE AMENDED PRIOR TO THE TIME OF SALE. THIS TERM SHEET IS NOT AN OFFER TO SELL THESE SECURITIES AND IT IS NOT A SOLICITATION OF AN OFFER TO BUY THESE SECURITIES IN ANY JURISDICTION WHERE THE OFFER OR SALE IS NOT PERMITTED. |
| | 51 | |
| Structural and Collateral Term Sheet | | BMO 2025-C11 |
| No. 6 – 360 Bowery |
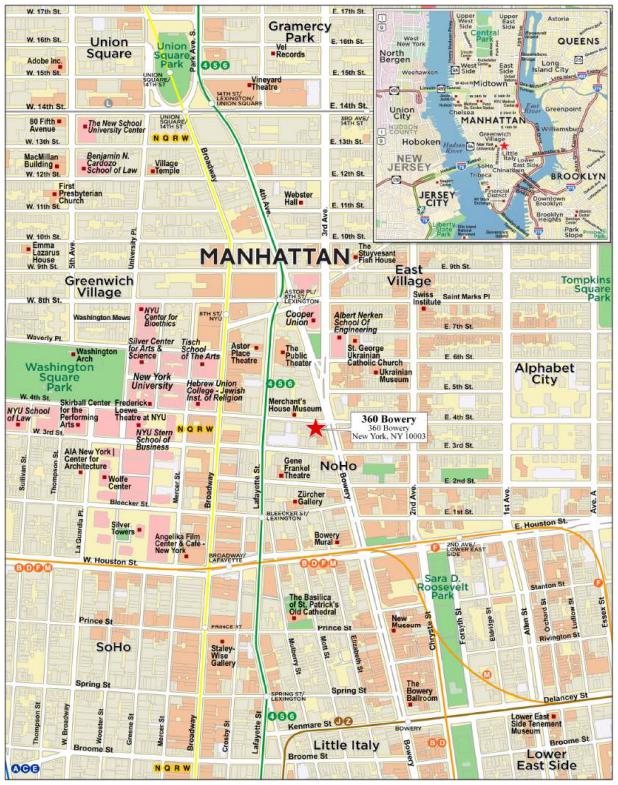
| THE INFORMATION IN THIS STRUCTURAL AND COLLATERAL TERM SHEET IS NOT COMPLETE AND MAY BE AMENDED PRIOR TO THE TIME OF SALE. THIS TERM SHEET IS NOT AN OFFER TO SELL THESE SECURITIES AND IT IS NOT A SOLICITATION OF AN OFFER TO BUY THESE SECURITIES IN ANY JURISDICTION WHERE THE OFFER OR SALE IS NOT PERMITTED. |
| | 52 | |
| Structural and Collateral Term Sheet | | BMO 2025-C11 |
| No. 6 – 360 Bowery |
| Mortgage Loan Information | | Property Information |
| Mortgage Loan Seller: | GACC | | Single Asset / Portfolio: | Single Asset |
| Original Principal Balance: | $40,000,000 | | Title: | Fee |
| Cut-off Date Principal Balance: | $40,000,000 | | Property Type – Subtype(1): | Other – Leased Fee |
| % of IPB: | 4.4% | | Net Rentable Area (SF)(1): | 8,707 |
| Loan Purpose: | Refinance | | Location: | New York, NY |
| Borrower: | Fourth Street Realty Holding LLC | | Year Built / Renovated(1): | NAP / NAP |
| Borrower Sponsor: | Eric Goode | | Occupancy: | NAP |
| Interest Rate: | 6.53700% | | Occupancy Date: | NAP |
| Note Date: | 1/31/2025 | | 4th Most Recent NOI (As of)(2): | NAV |
| Maturity Date: | 2/6/2035 | | 3rd Most Recent NOI (As of) (2): | NAV |
| Interest-only Period: | 120 months | | 2nd Most Recent NOI (As of) (2): | NAV |
| Original Term: | 120 months | | Most Recent NOI (As of) (2): | NAV |
| Original Amortization Term: | None | | UW Economic Occupancy: | 100.0% |
| Amortization Type: | Interest Only | | UW Revenues: | $2,929,850 |
| Call Protection: | L(24),D(92),O(4) | | UW Expenses: | $0 |
| Lockbox / Cash Management: | Springing / Springing | | UW NOI: | $2,929,850 |
| Additional Debt: | No | | UW NCF: | $2,929,850 |
| Additional Debt Balance: | N/A | | Appraised Value / Per SF: | $64,000,000 / $7,350 |
| Additional Debt Type: | N/A | | Appraisal Date: | 12/18/2024 |
| | | | | |
| Escrows and Reserves(3) | | Financial Information |
| | Initial | Monthly | Initial Cap | | Cut-off Date Loan / SF: | $4,594 |
| Taxes: | $0 | Springing | N/A | | Maturity Date Loan / SF: | $4,594 |
| Insurance: | $0 | Springing | N/A | | Cut-off Date LTV: | 62.5% |
| Replacement Reserves: | $0 | Springing | N/A | | Maturity Date LTV: | 62.5% |
| TI/LC: | $0 | Springing | N/A | | UW NCF DSCR: | 1.11x |
| Ground Lease Reserve: | $2,520,833 | $0 | N/A | | UW NOI Debt Yield: | 7.3% |
| | | | | | | |
| Sources and Uses |
| Sources | Proceeds | % of Total | | Uses | Proceeds | % of Total |
| Mortgage Loan | $40,000,000 | 100.0% | | Loan Payoff | $30,112,800 | 75.3 | % |
| | | | | Return of Equity | 6,703,802 | 16.8 | |
| | | | | Upfront Reserves | 2,520,833 | 6.3 | |
| | | | | Closing Costs | 662,565 | 1.7 | |
| Total Sources | $40,000,000 | 100.0% | | Total Uses | $40,000,000 | 100.0 | % |
| (1) | Net Rentable Area (SF) reflects square footage attributable to the parcel of land which serves as collateral for the 360 Bowery Leased Fee Loan (as defined below). The leasehold improvements (which do not serve as collateral) consist of 22-story Class A office building comprised of an above grade gross building area of 120,395 SF. The leasehold improvements were built in 2023. |
| (2) | Historical information is not available because the Non-Collateral Improvements were constructed in 2023. |
| (3) | See “Escrows and Reserves” below for further discussion of reserve information. |
The Loan. The sixth largest mortgage loan (the “360 Bowery Mortgage Loan”) is secured by the borrower’s fee interest in an 8,707 square foot leased fee land parcel in New York, New York (the “360 Bowery Leased Fee Property”). The 360 Bowery Mortgage Loan was originated by the German American Capital Corporation on January 31, 2025. The 360 Bowery Mortgage Loan accrues interest at an interest rate of 6.53700% per annum on an Actual/360 Basis. The 360 Bowery Mortgage Loan has an original term of 120 months and is interest only for the entire term. The scheduled maturity date of the 360 Bowery Mortgage Loan is February 6, 2035.
| THE INFORMATION IN THIS STRUCTURAL AND COLLATERAL TERM SHEET IS NOT COMPLETE AND MAY BE AMENDED PRIOR TO THE TIME OF SALE. THIS TERM SHEET IS NOT AN OFFER TO SELL THESE SECURITIES AND IT IS NOT A SOLICITATION OF AN OFFER TO BUY THESE SECURITIES IN ANY JURISDICTION WHERE THE OFFER OR SALE IS NOT PERMITTED. |
| | 53 | |
| Structural and Collateral Term Sheet | | BMO 2025-C11 |
| No. 6 – 360 Bowery |
The Property. The 360 Bowery Property is an 8,707 square foot leased fee land parcel located on the northwest corner of Bowery and East 4th Street in Manhattan, New York. The leashold improvements (which do not serve as collateral for the 360 Bowery Loan), were constructed in 2023 and consist of a 21-story Class A office building with grade-level retail totaling 120,395 square feet (the “Non-Collateral Improvements). The Non-Collateral Improvements feature 5,278 square feet of retail space and 890 square feet of storage space on the ground floor; as well as 115,116 square feet of office space on floors 2 through 22. As of January 31, 2025 the Non-Collateral Improvements were 100% leased to Chobani Global Holdings, LLC (“Chobani”) by the Ground Lease Tenant (as defined below) under a lease expected to expire December 31, 2045.
The 360 Bowery Leased Fee Property is subject to a ground lease dated as of September 1, 2019 between the borrower as ground lessor and ACEF-CBSKI 360 BOWERY LLC (as successor-in-interest to Bowery Development Partners LLC) (the “Ground Lease Tenant”) with a 99-year term expiring on . The rent under the ground lease is as follows: Year 1 - $1,500,000; Year 2 - $2,000,000; Year 3 - $2,600,000; Years 4 through 10 - $2,750,000. Beginning in year 11, the ground rent will increase by 10% every five years through the remainder of the ground lease term. In lease year 15, and every 15 years thereafter, a cumulative consumer price index (“CPI”) adjustment may be applied if the cumulative CPI adjustment is greater than the prior increases in ground rent for the prior 15-year period. There are no ground rent resets during the term of the 360 Bowery Mortgage Loan. The Ground Lease Tenant has a right of first offer to purchase the ground lessor’s position. The Ground Lease Tenant has mortgaged its ground leasehold interest to secure a $70,000,000 loan on its leasehold interest.
The 360 Bowery Property is located within the predominantly retail and hospitality corridor between Houston Street and Astor Place, and is approximately five blocks and four blocks away from Washington Square Park and Astor Place respectively.
Non-Collateral Improvements Major Tenant.
Chobani (121,284 square feet; 100.0% of net rentable area). Chobani is a yogurt, oat milk, and dairy/non-dairy creamer producer founded by Hamdi Ulukaya, a Turkish immigrant to the United States, in 2005. Chobani manufactures its products in New York, Idaho, and Australia. Chobani products are available throughout North America and distributed in Australia and other select markets.
In September 1, 2024, Chobani signed a 20-year lease which is expected to expire on December 31, 2045. Chobani is expected to take occupancy no earlier than January of 2026, paying $190 per square foot for the ground floor retail space (5,278 square feet) and $130 per square foot for floors 2 through 22 (115,116 square feet). Chobani has a free rent period until the rent commencement date. In addition, Chobani is entitled to a rent credit of approximately $81,318 a month for up to 180 months commencing on the fifth anniversary of the rent commencement date under the Chobani lease.
Chobani has the right to terminate its lease if the commencement date for its lease does not occur by March 1, 2025 (extended on a day to day basis for each day of tenant delay and/or up to 90 days of unavoidable delays). The commencement date will occur when the 360 Bowery Ground Lessee delivers exclusive possession of the building to Chobani (by making keys available for Chobani at the Building) in accordance with the terms of the sublease (including, but not limited to, in compliance with all requirements and free and clear of any hazardous materials) with all required work substantially complete and provides Chobani with a subordination, non-disturbance and attornment agreement executed by the current lessor and a subordination, non-disturbance and attornment agreement executed by the current mortgagee.
Chobani has a one-time contraction option which allows surrender of (i) the 22nd floor, (ii) the 21st and 22nd floors, (iii) the 20th through 22nd floors, or (iv) the 19th through 22nd floors, on the last day of the calendar month in which the 10th anniversary of the rent commencement date occurs, which is expected to be December 31, 2035. Exercise of such contraction option requires 18 months’ prior written notice and payment of a termination fee. Additionally, Chobani has a termination option which is exercisable on the last day of the calendar month in which the 15th anniversary of the rent commencement date, which is expected to be December 31 2038. Exercise of such termination option requires prior written
| THE INFORMATION IN THIS STRUCTURAL AND COLLATERAL TERM SHEET IS NOT COMPLETE AND MAY BE AMENDED PRIOR TO THE TIME OF SALE. THIS TERM SHEET IS NOT AN OFFER TO SELL THESE SECURITIES AND IT IS NOT A SOLICITATION OF AN OFFER TO BUY THESE SECURITIES IN ANY JURISDICTION WHERE THE OFFER OR SALE IS NOT PERMITTED. |
| | 54 | |
| Structural and Collateral Term Sheet | | BMO 2025-C11 |
| No. 6 – 360 Bowery |
notice no later than the last day of the calendar month in which the 13th anniversary of the rent commencement date occurs, and payment of a termination fee.
Environmental. The Phase I environmental assessment of the 360 Bowery Property dated January 6, 2025 identified no recognized environmental conditions, controlled environmental conditions or significant data gaps at the 360 Bowery Leased Fee Property.
The following table presents certain information relating to the historical and current occupancy of the Non-Collateral Improvements:
| Non-Collateral Improvements Historical and Current Occupancy(1) |
| 2021 | 2022 | 2023 | Current(2) |
| N/A | N/A | N/A | 100.0% |
| (1) | Historical occupancies are as of December 31 of each respective year, unless otherwise specified. |
| (2) | Based on the underwritten rent roll for the Non-Collateral Improvements dated January 31, 2025. |
The following table presents certain information relating to the tenant at the 360 Bowery Leased Fee Property:
| Tenant Summary |
| Tenant | Ratings
Moody’s/S&P/Fitch | Net Rentable Area (SF) | % of
Total NRA | UW
Base Rent PSF |
UW
Base Rent(1) | % of Total
UW Base Rent | Lease
Exp. Date |
| ACEF-CBSKI 360 BOWERY LLC | NR/NR/NR | 8,707 | 100.0% | $336.49 | $2,929,850 | 100.0% | 8/31/2118 |
| (1) | Based on the ten year average of ground rent payments. |
The following table presents certain information relating to the tenant at the Non-Collateral Improvements:
| Non-Collateral Improvements Tenant Summary |
| Tenant | Ratings
Moody’s/S&P/Fitch | Net Rentable Area (SF) | % of
Total NRA |
Base Rent PSF(2) |
Base Rent | % of Total
Base Rent | Lease
Exp. Date(1) |
| Chobani Global Holdings, LLC | NR/B/NR | 120,395 | 100.0% | $183.04 | $22,037,600 | 100.0% | 12/31/2045 |
| (1) | Lease expiration date represents the expected lease expiration date, based on a projected rent commencement date of January 1, 2026. Lease expiration date is the last day of the month in which the day immediately preceding the 20th anniversary of the rent commencement date occurs. |
| (2) | Based on 120,395 square feet. |
| THE INFORMATION IN THIS STRUCTURAL AND COLLATERAL TERM SHEET IS NOT COMPLETE AND MAY BE AMENDED PRIOR TO THE TIME OF SALE. THIS TERM SHEET IS NOT AN OFFER TO SELL THESE SECURITIES AND IT IS NOT A SOLICITATION OF AN OFFER TO BUY THESE SECURITIES IN ANY JURISDICTION WHERE THE OFFER OR SALE IS NOT PERMITTED. |
| | 55 | |
| Structural and Collateral Term Sheet | | BMO 2025-C11 |
| No. 6 – 360 Bowery |
The following table presents certain information relating to the lease rollover schedule at the Non-Collateral Improvements:
| Non-Collateral Lease Rollover Schedule(1) |
| Year | Number of Leases Expiring | Net Rentable Area Expiring | % of NRA Expiring | UW Base Rent Expiring | % of UW Base Rent Expiring | Cumulative Net Rentable Area Expiring | Cumulative % of NRA Expiring | Cumulative UW Base Rent Expiring | Cumulative % of UW Base Rent Expiring |
| Vacant | NAP | 0 | 0.0 | % | NAP | NA | P | 0 | 0.0% | NAP | NAP |
| 2024 & MTM | 0 | 0 | 0.0 | | $0 | 0.0 | % | 0 | 0.0% | $0 | 0.0% |
| 2025 | 0 | 0 | 0.0 | | 0 | 0.0 | | 0 | 0.0% | $0 | 0.0% |
| 2026 | 0 | 0 | 0.0 | | 0 | 0.0 | | 0 | 0.0% | $0 | 0.0% |
| 2027 | 0 | 0 | 0.0 | | 0 | 0.0 | | 0 | 0.0% | $0 | 0.0% |
| 2028 | 0 | 0 | 0.0 | | 0 | 0.0 | | 0 | 0.0% | $0 | 0.0% |
| 2029 | 0 | 0 | 0.0 | | 0 | 0.0 | | 0 | 0.0% | $0 | 0.0% |
| 2030 | 0 | 0 | 0.0 | | 0 | 0.0 | | 0 | 0.0% | $0 | 0.0% |
| 2031 | 0 | 0 | 0.0 | | 0 | 0.0 | | 0 | 0.0% | $0 | 0.0% |
| 2032 | 0 | 0 | 0.0 | | 0 | 0.0 | | 0 | 0.0% | $0 | 0.0% |
| 2033 | 0 | 0 | 0.0 | | 0 | 0.0 | | 0 | 0.0% | $0 | 0.0% |
| 2034 | 0 | 0 | 0.0 | | 0 | 0.0 | | 0 | 0.0% | $0 | 0.0% |
| 2035 & Beyond | 1 | 8,707 | 100.0 | | 2,929,850 | 100.0 | | 8,707 | 100.0% | $2,929,850 | 100.0% |
| Total | 1 | 8,707 | 100.0 | % | $2,929,850 | 100.0 | % | | | | |
| (1) | Based on the underwritten rent roll dated January 31, 2025. |
The following table presents certain information relating to the operating history and underwritten cash flows of the 360 Bowery Property:
| Underwritten Net Cash Flow |
| | | Underwritten | Per Square Foot(1) | %(2) |
| Rents in Place(3) | | $2,929,850 | $336.49 | 100.0% |
| Effective Gross Income | | $2,929,850 | $336.49 | 100.0% |
| Net Operating Income | | $2,929,850 | $336.49 | 100.0% |
| Net Cash Flow | | $2,929,850 | $336.49 | 100.0% |
| (1) | Based on 8,707 square feet. |
| (2) | Items are calculated as a % of Effective Gross Income. |
| (3) | Rents in Place are underwritten to a ten year average of ground rent payments. |
| THE INFORMATION IN THIS STRUCTURAL AND COLLATERAL TERM SHEET IS NOT COMPLETE AND MAY BE AMENDED PRIOR TO THE TIME OF SALE. THIS TERM SHEET IS NOT AN OFFER TO SELL THESE SECURITIES AND IT IS NOT A SOLICITATION OF AN OFFER TO BUY THESE SECURITIES IN ANY JURISDICTION WHERE THE OFFER OR SALE IS NOT PERMITTED. |
| | 56 | |
| Structural and Collateral Term Sheet | | BMO 2025-C11 |
| No. 6 – 360 Bowery |
The Market. The 360 Bowery Leased Fee Property is located in New York, New York, in the Midtown South office market and the Greenwich/NoHo office submarket. According to the appraisal, New York City has a population of approximately 8.8 million people and a median annual household income of $108,072. New York City is also home to a multitude of national and international corporations which provide employment opportunities for New York City residents. Notably, Cognizant Technology Solutions Corp., PepsiCo Inc., JPMorgan Chase & Co., and International Business Machines Corp. all employ over 250,000 people each in the city.
According to the appraisal, the Midtown South office market comprises a total of nearly 72.1 million square feet, which makes it the smallest office market in Manhattan. Unlike Midtown which is dominated by glass towers, Midtown South has a distinct lack of Class A properties, instead many buildings are old loft spaces. These buildings have attacted tenants in the fashion, art, advertising, and technology industries by offering large floor plans which allow for a variety of utilizations. Leasing activity in Midtown South totaled 1,208,138 square feet in the 3rd quarter of 2024, which is 66.1% up year over year. Vacancy increased by 390 basis points to 26.3% over the same time period. Class A direct rents in Midtown South increased by $2.51 year over year ending the third quarter of 2024 at $106.96. Over the same time period, there have been 1,172,000 square feet of completions and net absorption was negative, at approximately -1.5 million square feet.
According to the appraisal, the Greenwich/NoHo office submarket contains 5.4 million square feet of office space, of which 33.9% is Class A. Leasing activity in the third quarter of 2024 registered at 177,682 square feet, up by 105.2% from the prior quarter and up 179.7% year over year. Vacancy increased by 47,543 square feet in the third quarter of 2024, ending at 3.5%. Asking rents have for Class A office properties in the submarket have remained constant in the third quarter of 2024, ending at $128.80 per square foot.
The Borrower. The borrower is Fourth Street Realty Holding LLC, a New York limited liability company and single purpose entity.
The Borrower Sponsor. The borrower sponsor and non-recourse carveout guarantor is Eric Goode. Eric Goode is an American entrepreneur, conservationist, and Emmy nominated filmmaker. Eric has founded and created multiple hotels and nightlife venues such as Area, B Bar & Grill (formerly located at 360 Bowery), The Maritime Hotel, The Waverly Inn, Lafayette House, The Bowery Hotel, The Jane Hotel, and the Ludlow Hotel.
Property Management. The 360 Bowery Property is self-managed.
Escrows and Reserves. At origination of the 360 Bowery Mortgage Loan, the borrower deposited approximately $2,520,833 for the purpose of replicating the full, non-discounted payment of rents under the ground lease until such time as the Chobani rent commencement date has occurred (based on an estimated rent commencement date of January 1, 2026).
Tax Escrows – On a monthly basis, the borrower is required to escrow 1/12th of the estimated annual real estate tax payments. Such reserve has been conditionally waived so long as an approved ground lease is in full effect and such ground lease requires the lessee to pay real estate taxes with respect to the 360 Bowery improvements.
Insurance Escrows – On a monthly basis, the borrower is required to escrow 1/12th of the estimated annual insurance payments. Such reserve has been conditionally waived so long as (i) an approved ground lease is in full effect and such ground lease requires the lessee to pay insurance coverage costs with respect to the 360 Bowery improvements or (ii) an acceptable blanket policy is in effect. A blanket policy was in place at origination.
Replacement Reserve – On a monthly basis, the borrower is required to escrow 1/12th of the estimated capital expenditures. Such reserve has been conditionally waived so long as an approved ground lease is in full effect and such ground lease requires the lessee to pay capital expenditures with respect to the Non-Collateral Improvements.
TI/LC Reserve – Should an approved ground lease not be in full effect, the borrower is required to escrow an amount that the lender determines will be needed (in equal monthly deposits) in order to accumulate sufficient funds to pay for all anticipated tenant improvements and leasing commissions that may be incurred with respect to leases at the 360 Bowery Leased Fee Property.
| THE INFORMATION IN THIS STRUCTURAL AND COLLATERAL TERM SHEET IS NOT COMPLETE AND MAY BE AMENDED PRIOR TO THE TIME OF SALE. THIS TERM SHEET IS NOT AN OFFER TO SELL THESE SECURITIES AND IT IS NOT A SOLICITATION OF AN OFFER TO BUY THESE SECURITIES IN ANY JURISDICTION WHERE THE OFFER OR SALE IS NOT PERMITTED. |
| | 57 | |
| Structural and Collateral Term Sheet | | BMO 2025-C11 |
| No. 6 – 360 Bowery |
Lockbox / Cash Management. The 360 Bowery Mortgage Loan is structured with a springing lockbox and springing cash management. Upon the first occurrence of a Trigger Period (as defined below), the borrower is required to establish a lockbox account at an institution reasonably approved by the lender, which is to be maintained by the borrower at all times after the first occurrence of a Trigger Period. Upon the commencement of the first Trigger Period and at all times thereafter, the borrower is required to cause all gross revenue to be transmitted directly by the Ground Lease Tenant into the lockbox account. During the continuation of a Trigger Period, provided that no event of default is then continuing, all funds in the lockbox account are required to be swept each business day into the lender-controlled cash management account and applied and disbursed in accordance with the 360 Bowery Mortgage Loan documents. Upon the continuance of a trigger period, funds deposited will be applied in the following order of priority: (i) to the tax account, (ii) to the insurance account, (iii) to the lender, to pay the monthly interest payment amount, (iv) to the capital expenditure account, (v) to the rollover account, (vi) to the lender, to make any other amounts then due and payable under the 360 Bowery Loan documents, (vii) to the borrower, and lastly (ix) to the cash collateral account to be held or disbursed in accordance with the 360 Bowery Loan documents.
A “Trigger Period” means a period commencing upon the earliest to occur of (i) an event of default under the 360 Bowery Mortgage Loan, (ii) the debt service coverage ratio (based on the 360 Bowery ground lease) being less than 1.10x (tested on a quarterly basis), or (iii) if the property manager is an affiliate of the borrower or the guarantor, and there is a bankruptcy action of the property manager and ending if, with respect to a Trigger Period continuing pursuant to (A) clause (i), the event of default commencing the Trigger Period has been cured or waived and such cure has been accepted by the lender or the lender has waived such event of default in writing, and no other event of default is then continuing, (B) clause (ii), the debt service coverage ratio is equal to or greater than 1.10x for two consecutive calendar quarters, and (C) clause (iii), the property manager is replaced with a lender approved, non-affiliated, replacement property manager.
Subordinate and Mezzanine Debt. None.
Permitted Future Subordinate or Mezzanine Debt. Not permitted.
Partial Release. Not permitted.
Ground Lease. None. The borrower’s interest in the 360 Bowery Property is a fee interest, and the borrower has ground leased the 360 Bowery Property to the Ground Lease Tenant.
| THE INFORMATION IN THIS STRUCTURAL AND COLLATERAL TERM SHEET IS NOT COMPLETE AND MAY BE AMENDED PRIOR TO THE TIME OF SALE. THIS TERM SHEET IS NOT AN OFFER TO SELL THESE SECURITIES AND IT IS NOT A SOLICITATION OF AN OFFER TO BUY THESE SECURITIES IN ANY JURISDICTION WHERE THE OFFER OR SALE IS NOT PERMITTED. |
| | 58 | |
| Structural and Collateral Term Sheet | | BMO 2025-C11 |
| No. 7 – 299 Park Avenue |
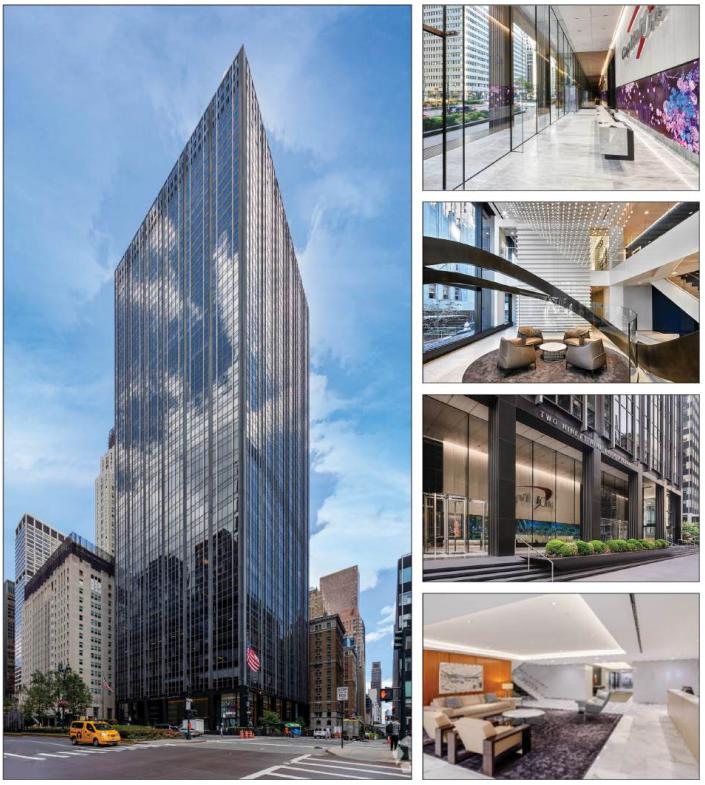
| THE INFORMATION IN THIS STRUCTURAL AND COLLATERAL TERM SHEET IS NOT COMPLETE AND MAY BE AMENDED PRIOR TO THE TIME OF SALE. THIS TERM SHEET IS NOT AN OFFER TO SELL THESE SECURITIES AND IT IS NOT A SOLICITATION OF AN OFFER TO BUY THESE SECURITIES IN ANY JURISDICTION WHERE THE OFFER OR SALE IS NOT PERMITTED. |
| | 59 | |
| Structural and Collateral Term Sheet | | BMO 2025-C11 |
| No. 7 – 299 Park Avenue |
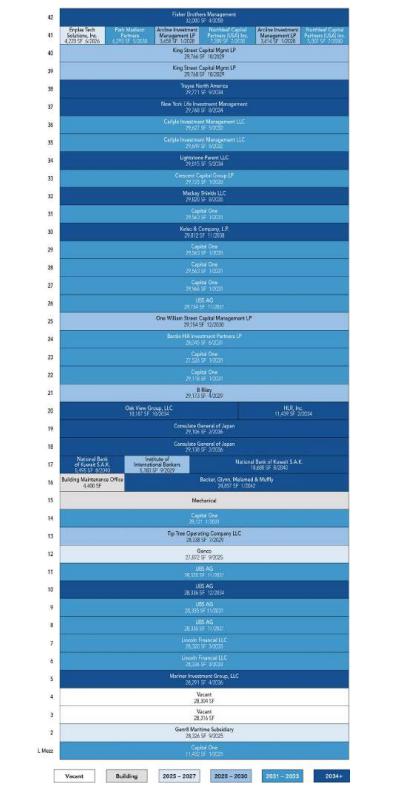
| THE INFORMATION IN THIS STRUCTURAL AND COLLATERAL TERM SHEET IS NOT COMPLETE AND MAY BE AMENDED PRIOR TO THE TIME OF SALE. THIS TERM SHEET IS NOT AN OFFER TO SELL THESE SECURITIES AND IT IS NOT A SOLICITATION OF AN OFFER TO BUY THESE SECURITIES IN ANY JURISDICTION WHERE THE OFFER OR SALE IS NOT PERMITTED. |
| | 60 | |
| Structural and Collateral Term Sheet | | BMO 2025-C11 |
| No. 7 – 299 Park Avenue |
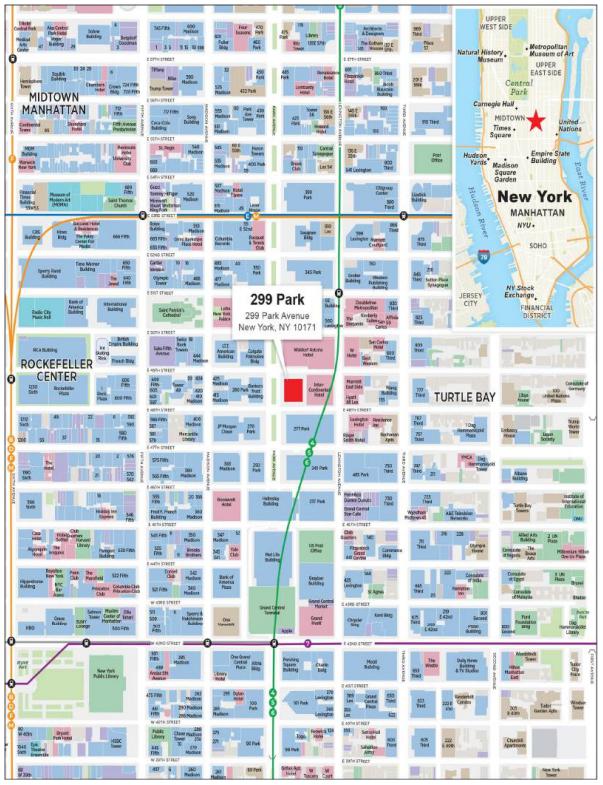
| THE INFORMATION IN THIS STRUCTURAL AND COLLATERAL TERM SHEET IS NOT COMPLETE AND MAY BE AMENDED PRIOR TO THE TIME OF SALE. THIS TERM SHEET IS NOT AN OFFER TO SELL THESE SECURITIES AND IT IS NOT A SOLICITATION OF AN OFFER TO BUY THESE SECURITIES IN ANY JURISDICTION WHERE THE OFFER OR SALE IS NOT PERMITTED. |
| | 61 | |
| Structural and Collateral Term Sheet | | BMO 2025-C11 |
| No. 7 – 299 Park Avenue |
| Mortgage Loan Information | | Property Information |
| Mortgage Loan Seller: | CREFI | | Single Asset / Portfolio: | Single Asset |
| Original Principal Balance(1): | $36,000,000 | | Title: | Fee / Leasehold(4) |
| Cut-off Date Principal Balance(1): | $36,000,000 | | Property Type – Subtype: | Office - CBD |
| % of IPB: | 4.0% | | Net Rentable Area (SF): | 1,176,837 |
| Loan Purpose: | Refinance | | Location: | New York, NY |
| Borrower: | Fisher-Park Lane Owner LLC | | Year Built / Renovated: | 1966 / 2020 |
| Borrower Sponsor: | Fisher Brothers and Alaska Permanent Fund Corporation | | Occupancy: | 95.2% |
| Interest Rate: | 5.95340907% | | Occupancy Date: | 10/31/2024 |
| Note Date: | 2/7/2025 | | 4th Most Recent NOI (As of): | $52,978,482 (12/31/2021) |
| Maturity Date: | 2/6/2035 | | 3rd Most Recent NOI (As of): | $62,232,320 (12/31/2022) |
| Interest-only Period: | 120 months | | 2nd Most Recent NOI (As of): | $60,396,216 (12/31/2023) |
| Original Term: | 120 months | | Most Recent NOI (As of)(5): | $61,324,473 (9/30/2024 TTM) |
| Original Amortization Term: | None | | UW Economic Occupancy: | 96.1% |
| Amortization Type: | Interest Only | | UW Revenues: | $121,577,044 |
| Call Protection: | YM1(24),DorYM1(89),O(7) | | UW Expenses: | $49,384,602 |
| Lockbox / Cash Management: | Hard / Springing | | UW NOI(5): | $72,192,441 |
| Additional Debt(1): | Yes | | UW NCF: | $70,780,237 |
| Additional Debt Balance(1): | $464,000,000 | | Appraised Value / Per SF: | $1,096,000,000 / $931 |
| Additional Debt Type(1): | Pari Passu | | Appraisal Date: | 11/14/2024 |
| | | | | |
| Escrows and Reserves(2) | | Financial Information(1) |
| | Initial | Monthly | Cap | | Cut-off Date Loan / SF: | $425 |
| Taxes: | $0 | Springing | N/A | | Maturity Date Loan / SF: | $425 |
| Insurance: | $0 | Springing | N/A | | Cut-off Date LTV: | 45.6% |
| Replacement Reserves: | $0 | Springing | N/A | | Maturity Date LTV: | 45.6% |
| TI/LC Reserves: | $0 | Springing | N/A | | UW NCF DSCR: | 2.35x |
| Other Reserves: | $11,894,867(3): | $0 | N/A | | UW NOI Debt Yield: | 14.4% |
| | | | | | | |
| Sources and Uses |
| Sources | Proceeds | % of Total | | Uses | Proceeds | % of Total |
| Whole Loan(1) | $500,000,000 | 98.5 | % | | Loan Payoff | $389,667,506 | 76.8 | % |
| Existing Reserve Balance | $7,672,723 | 1.5 | | | Return of Equity | 95,039,909 | 18.7 | |
| | | | | Upfront Reserves | 11,894,867 | 5.8 | |
| | | | | Closing Costs | 11,070,442 | 0.6 | |
| Total Sources | $507,672,723 | 100.0 | % | | Total Uses | $507,672,723 | 100.0 | % |
| (1) | The 299 Park Avenue Mortgage Loan (as defined below) is part of a whole loan evidenced by five pari passu promissory notes with an aggregate outstanding principal balance as of the Cut-off Date of $500.0 million (the “299 Park Avenue Whole Loan”). The Financial Information in the chart above reflects the 299 Park Avenue Whole Loan. |
| (2) | See “Escrows and Reserves” below for further discussion of reserve information. |
| (3) | Other Reserves consist of Unfunded TI Obligations. |
| (4) | In addition to the borrower’s fee simple interest in the 299 Park Avenue Property (as defined below), the borrower holds a leasehold interest in the property located at 111 East 48th Street (the “Air Rights Parcel”), which it subleases back to the owner of the Air Rights Parcel. This arrangement facilitates the borrower’s utilization of additional floor area ratio from the Air Rights Parcel. |
| (5) | The increase from Most Recent NOI to UW NOI is driven by Rent Steps, IG Rent Credit, and two new leases beginning in December 2024 and June 2025, representing 4.9% of NRA and 5.0% of Net Rental Income. |
The Loan. The seventh largest mortgage loan (the “299 Park Avenue Mortgage Loan”) is part of a fixed rate whole loan secured by the borrower’s fee and leasehold interest in a Class A office building containing 1,176,837 square feet, located in New York, New York (the “299 Park Avenue Property”). The 299 Park Avenue Whole Loan is evidenced by five pari passu promissory notes with an aggregate outstanding principal balance as of the Cut-off Date of $500.0 million, has a 10-year interest-only term and accrues interest at a rate of 5.95340907% per annum on an Actual/360 basis. The 299 Park
| THE INFORMATION IN THIS STRUCTURAL AND COLLATERAL TERM SHEET IS NOT COMPLETE AND MAY BE AMENDED PRIOR TO THE TIME OF SALE. THIS TERM SHEET IS NOT AN OFFER TO SELL THESE SECURITIES AND IT IS NOT A SOLICITATION OF AN OFFER TO BUY THESE SECURITIES IN ANY JURISDICTION WHERE THE OFFER OR SALE IS NOT PERMITTED. |
| | 62 | |
| Structural and Collateral Term Sheet | | BMO 2025-C11 |
| No. 7 – 299 Park Avenue |
Avenue Whole loan was co-originated on February 7, 2025 by Citi Real Estate Funding Inc. and JPMorgan Chase Bank, National Association. The 299 Park Avenue Mortgage Loan is evidenced by the non-controlling Note A-2, which has an outstanding principal balance as of the Cut-off Date of $36,000,000. The controlling Note A-1 and non-controlling Note A-4, which have an aggregate outstanding principal balance as of the Cut-off Date of $435,000,000, were securitized in the NY 2025-299P securitization. The non-controlling Notes A-3 and A-, which have an aggregate outstanding principal balance as of the Cut-off Date of $29,000,000, is expected to be contributed to a future securitization
The table below identifies the promissory notes that comprise the 299 Park Avenue Whole Loan. The 299 Park Avenue Whole Loan will be serviced pursuant to the pooling and servicing agreement for the NY 2025-299P trust securitization. The relationship between the holders of the 299 Park Avenue Whole Loan is governed by a co-lender agreement as described under “Description of the Mortgage Pool—The Whole Loans—The Outside Serviced Pari Passu Whole Loans” and “The Pooling and Servicing Agreement” in the Preliminary Prospectus.
| Whole Loan Summary |
| Note | Original
Balance | Cut-off Date
Balance | | Note Holder | Controlling Piece |
| A-1 | $348,000,000 | $348,000,000 | | NY 2025-299P | Yes |
| A-2 | 36,000,000 | 36,000,000 | | BMO 2025-C11 | No |
| A-3 | 16,000,000 | 16,000,000 | | CREFI | No |
| A-4 | 87,000,000 | 87,000,000 | | NY 2025-299P | No |
| A-5 | 13,000,000 | 13,000,000 | | JPMCB | No |
| Whole Loan | $500,000,000 | $500,000,000 | | | |
The Property. The 299 Park Avenue Property is comprised of a 44-story, Class A LEED Silver certified office building containing a total of 1,176,837 square feet, located in New York, New York. The 299 Park Avenue Property occupies the entire block of Park Avenue between East 48th and 49th Streets, across the street from an entrance to Grand Central Terminal. The 299 Park Avenue Property was developed in 1966 and renovated between 2018 and 2020 at a total cost of $20,000,000. The renovation included revitalizing the exterior and interior lobby spaces, various base building improvements, glass panel replacements and façade refinishing. Additionally, the borrower is prebuilding the vacant fourth floor space at a reported cost of approximately $125 per square foot. Such prebuilding is not required or reserved for under the 299 Park Avenue Whole Loan documents. The tenancy at the 299 Park Avenue Property includes a diverse mix of 30 tenants with investment-grade rated tenants comprising 47.5% of NRA and 54.1% of UW Gross Rent. As of October 30, 2024, the 299 Park Avenue Property was 95.2% leased, with a weighted average lease term of 7.9 years. The 299 Park Avenue Property has a seven-year average historical occupancy of 89.9%.
Major Tenants. The three largest tenants based on underwritten base rent are Capital One Financial Corporation (“Capital One”), UBS Group AG (“UBS”), and Carlyle Investment Management LLC (“Carlyle Group”).
Capital One (214,852 square feet; 18.3% of NRA; 21.3% of underwritten rent). Capital One is an American bank holding company specializing in credit cards, auto loans, banking, and savings accounts. Headquartered in McLean, VA, the company had its initial public offering in 1994 and was founded by Richard Fairbank. Capital One offers digital banking services and a variety of financial products to consumers, small businesses, and commercial clients. It is one of the largest banks in the United States by assets. Capital One occupies 214,852 square feet on a lease that expires January 31, 2031. Capital One has been a tenant at the 299 Park Avenue Property since 2014, has one, 10-year renewal option and no termination options.
UBS (143,095 square feet; 12.2% of NRA; 12.5% of underwritten rent). UBS is a Swiss multinational investment bank and financial services company. Headquartered in Zurich, Switzerland, UBS offers a wide range of financial services, including wealth management, asset management, and investment banking services to private, corporate, and institutional clients worldwide. Established in 1862, the bank has grown to become one of the largest financial institutions globally. UBS occupies 143,095 square feet on two leases that expire on November 30, 2031 (114,759 square feet) and December 31, 2034 (28,336 square feet). UBS has been a tenant since 1981 and most recently expanded its space in July 2024. UBS has one 5-year renewal option and no termination options.
| THE INFORMATION IN THIS STRUCTURAL AND COLLATERAL TERM SHEET IS NOT COMPLETE AND MAY BE AMENDED PRIOR TO THE TIME OF SALE. THIS TERM SHEET IS NOT AN OFFER TO SELL THESE SECURITIES AND IT IS NOT A SOLICITATION OF AN OFFER TO BUY THESE SECURITIES IN ANY JURISDICTION WHERE THE OFFER OR SALE IS NOT PERMITTED. |
| | 63 | |
| Structural and Collateral Term Sheet | | BMO 2025-C11 |
| No. 7 – 299 Park Avenue |
Carlyle Group (59,276 square feet; 5.0% of NRA; 6.5% of underwritten rent). Carlyle Group is a private equity firm headquartered in Washington, D.C. Founded in 1987 by William E. Conway Jr., Daniel A. D’Aniello, and David Rubenstein, Carlyle specializes in various investment strategies, including private equity, real assets, global credit, and investment solutions. With a significant presence across the world, Carlyle manages investment portfolios across a wide range of industries such as aerospace, healthcare, technology, media, and energy. Carlyle Group occupies 59,276 square feet on a lease that expires May 31, 2032. The tenant has been located at the 299 Park Avenue Property since 2014, has one 10-year renewal option and no termination options. Carlyle Group subleases 40,364 square feet to Court Square Capital Management LP through May 2032 at a rental rate of $75.00 per square foot and 19,198 square feet to P10 Intermediate Holdings LLC through May 2032 at a rental rate of $70.00 per square foot. P10 Intermediate Holdings LLC further subleases a portion of its space to Braemont Capital Management LLC through May 2025 at a rental rate of $179.90 per square foot.
Appraisal. According to the appraisal dated November 14, 2024, the 299 Park Avenue Property had an “as-is” appraised value of $1,096,000,000. The table below shows the appraisal’s “as-is” conclusions.
| Appraisal Valuation Summary(1) |
| Appraisal Approach | | Appraised Value | Capitalization Rate |
| Income Capitalization Approach | | $1,096,000,000 | 6.50% |
Environmental. According to the Phase I environmental site assessment dated November 18, 2024, there was no evidence of any recognized environmental conditions at the 299 Park Avenue Property.
The following table presents certain information relating to the historical occupancy of the 299 Park Avenue Property:
| Historical and Current Occupancy |
| 2021(1) | 2022(1) | 2023(1) | Current(2) |
| 85.3% | 90.9% | 92.1% | 95.2% |
| (1) | Historical occupancy figures are as of December 31st for each year and were provided by the borrower. |
| (2) | Current occupancy is based on the underwritten rent roll dated as of October 31, 2024. |
| THE INFORMATION IN THIS STRUCTURAL AND COLLATERAL TERM SHEET IS NOT COMPLETE AND MAY BE AMENDED PRIOR TO THE TIME OF SALE. THIS TERM SHEET IS NOT AN OFFER TO SELL THESE SECURITIES AND IT IS NOT A SOLICITATION OF AN OFFER TO BUY THESE SECURITIES IN ANY JURISDICTION WHERE THE OFFER OR SALE IS NOT PERMITTED. |
| | 64 | |
| Structural and Collateral Term Sheet | | BMO 2025-C11 |
| No. 7 – 299 Park Avenue |
The following table presents certain information relating to the major tenants at the 299 Park Avenue Property:
| Top Tenant Summary(1) |
| Tenant | Ratings
Moody’s/S&P/Fitch(2) | Net Rentable Area (SF) | % of
Total NRA | UW Base Rent PSF(3) | UW Base Rent(3) | % of Total
UW Base Rent | Lease
Exp. Date(4) |
| Capital One(5) | A3/BBB+/A | 214,852 | 18.3% | $106.40 | $22,861,059 | 21.3% | 1/31/2031 |
| UBS | Aa2/A+/A+ | 143,095 | 12.2% | $93.50 | $13,378,687 | 12.5% | Various(6) |
| Carlyle Group(7) | NR/NR/A- | 59,276 | 5.0% | $117.00 | $6,935,292 | 6.5% | 5/31/2032 |
| King Street Capital Management | NR/NR/NR | 59,534 | 5.1% | $104.00 | $6,191,536 | 5.8% | 10/31/2029 |
| Major Tenants | 476,757 | 40.5% | $103.55 | $49,366,574 | 46.0% | |
| Other Tenants | | 643,460 | 54.7% | $90.01 | $57,914,813 | 54.0% | |
| Occupied Collateral Total | | 1,120,217 | 95.2% | $95.77 | $107,281,387 | 100.0% | |
| Vacant Space | | 56,620 | 4.8% | | | | |
| Collateral Total | | 1,176,837 | 100.0% | | | | |
| | | | | | | | |
| (1) | Based on the underwritten rent roll dated October 31, 2024. |
| (2) | Certain ratings are those of the parent company whether or not the parent guarantees the lease. |
| (3) | The UW Base Rent and UW Base Rent PSF includes contractual rent steps for non-investment grade tenants through November 2025 of $660,443. |
| (4) | Certain tenants reflected in the chart above and other tenants throughout the 299 Park Avenue Property, although paying rent, may not be in occupancy with respect to all or a portion of their leased space, and/or under certain conditions may have the option to terminate all or a portion of their leased space prior to the lease expiration date. |
| (5) | Capital One occupies two ground-floor retail spaces totaling 11,432 SF (5.3% of total Capital One leased square feet). |
| (6) | UBS leases space under leases with expiration dates of November 30, 2031 (114,759 square feet) and December 31, 2034 (28,336 square feet). |
| (7) | Carlyle Group subleases 40,364 square feet to Court Square Capital Management LP through May 2032 at a rental rate of $75.00 per square foot and 19,198 square feet to P10 Intermediate Holdings LLC through May 2032 at a rental rate of $70.00 per square foot. P10 Intermediate Holdings LLC further subleases a portion of its space to Braemont Capital Management LLC through May 2025 at a rental rate of $179.90 per square foot. |
| THE INFORMATION IN THIS STRUCTURAL AND COLLATERAL TERM SHEET IS NOT COMPLETE AND MAY BE AMENDED PRIOR TO THE TIME OF SALE. THIS TERM SHEET IS NOT AN OFFER TO SELL THESE SECURITIES AND IT IS NOT A SOLICITATION OF AN OFFER TO BUY THESE SECURITIES IN ANY JURISDICTION WHERE THE OFFER OR SALE IS NOT PERMITTED. |
| | 65 | |
| Structural and Collateral Term Sheet | | BMO 2025-C11 |
| No. 7 – 299 Park Avenue |
The following table presents certain information relating to the lease rollover schedule at the 299 Park Avenue Property:
| Lease Rollover Schedule(1)(2) |
| Year | Number of Leases Expiring | Net Rentable Area Expiring | % of NRA Expiring | UW Base Rent Expiring(3) | % of UW Base Rent Expiring (3) | Cumulative Net Rentable Area Expiring | Cumulative % of NRA Expiring | Cumulative UW Base Rent Expiring(3) | Cumulative % of UW Base Rent Expiring(3) |
| 2025 & MTM(4) | 2 | 56,198 | | 4.8% | | $4,633,838 | | 4.3% | 56,198 | 4.8% | $4,633,838 | 4.3% |
| 2026 | 1 | 4,220 | | 0.4% | | $590,800 | | 0.6% | 60,418 | 5.1% | $5,224,638 | 4.9% |
| 2027 | 0 | 0 | | 0.0% | | $0 | | 0.0% | 60,418 | 5.1% | $5,224,638 | 4.9% |
| 2028 | 1 | 7,072 | | 0.6% | | $799,136 | | 0.7% | 67,490 | 5.7% | $6,023,774 | 5.6% |
| 2029 | 4 | 122,228 | | 10.4% | | $11,932,375 | | 11.1% | 189,718 | 16.1% | $17,956,149 | 16.7% |
| 2030 | 3 | 48,263 | | 4.1% | | $4,770,406 | | 4.4% | 237,981 | 20.2% | $22,726,555 | 21.2% |
| 2031 | 3 | 357,656 | | 30.4% | | $36,495,461 | | 34.0% | 595,637 | 50.6% | $59,222,016 | 55.2% |
| 2032 | 1 | 59,276 | | 5.0% | | $6,935,292 | | 6.5% | 654,913 | 55.7% | $66,157,308 | 61.7% |
| 2033 | 2 | 86,381 | | 7.3% | | $7,581,494 | | 7.1% | 741,294 | 63.0% | $73,738,802 | 68.7% |
| 2034 | 6 | 147,316 | | 12.5% | | $14,029,106 | | 13.1% | 888,610 | 75.5% | $87,767,908 | 81.8% |
| 2035 & Beyond | 8 | 231,607 | | 19.7% | | $19,513,479 | | 18.2% | 1,120,217 | 95.2% | $107,281,387 | 100.0% |
| Vacant(5) | 0 | 56,620 | | 4.8% | | $0 | | 0.0% | 1,176,837 | 100.0% | $107,281,387 | 100.0% |
| Total | 31 | 1,176,837 | | 100.0% | | $107,281,387 | | 100.0% | 1,176,837 | 100.0% | $107,281,387 | 100.0% |
| (1) | Based on the underwritten rent roll dated October 31, 2024 and includes contractual rent steps for non-investment grade tenants through November 2025 of $660,443. |
| (2) | Certain tenants may have lease termination options that are exercisable prior to the stated expiration date of the subject lease or leases which are not considered in the Lease Rollover Schedule. |
| (3) | UW Base Rent Expiring, % of UW Base Rent Expiring, Cumulative UW Base Rent Expiring and Cumulative % of UW Base Rent Expiring include two tenants with leases commencing in July 2024 and February 2025 totaling $1,202,668 and contractual rent steps through June 2025 totaling $879,214. |
| (4) | 2025 & MTM includes the entirety of Genco Shipping and Trading Limited’s space (27,892 SF). Genco Shipping and Trading Limited subleases 19,117 SF to Mariner Investment Group LLC through September 2025 at a rental rate of $64.00 per SF. Genco Shipping and Trading Limited utilizes the remaining 9,289 square feet not subleased and recently extended its lease on this space through July 2036 |
| (5) | 2035 & Beyond includes 4,400 square feet representing the Building Management Office for which no rent is attributable. |
| THE INFORMATION IN THIS STRUCTURAL AND COLLATERAL TERM SHEET IS NOT COMPLETE AND MAY BE AMENDED PRIOR TO THE TIME OF SALE. THIS TERM SHEET IS NOT AN OFFER TO SELL THESE SECURITIES AND IT IS NOT A SOLICITATION OF AN OFFER TO BUY THESE SECURITIES IN ANY JURISDICTION WHERE THE OFFER OR SALE IS NOT PERMITTED. |
| | 66 | |
| Structural and Collateral Term Sheet | | BMO 2025-C11 |
| No. 7 – 299 Park Avenue |
The following table presents certain information relating to the operating history and underwritten net cash flow of the 299 Park Avenue Property:
| Operating History and Underwritten Net Cash Flow |
| | 2021 | 2022 | 2023 | TTM(1) | Underwritten | | Per Square Foot | % |
| Gross Potential Rent(2) | $88,668,128 | $94,853,832 | $96,756,975 | $99,675,924 | $106,620,944 | | $90.60 | | 96.5 | % |
| Rent Steps | 0 | 0 | 0 | 0 | 660,443 | | 0.56 | | 0.6 | |
| Income from Vacant Space | 0 | 0 | 0 | 0 | 4,812,700 | | 4.09 | | 4.4 | |
| IG Rent Credit(3) | 0 | 0 | 0 | 0 | 3,178,317 | | 2.70 | | 2.9 | |
| (Vacancy/Credit Loss) | (127,974) | 0 | 0 | 0 | (4,812,700) | | (4.09) | | (4.4 | ) |
| Net Rental Income | $88,540,154 | $94,853,832 | $96,756,975 | $99,675,924 | $110,459,705 | | $93.86 | | 90.9 | % |
| Expense Reimbursement | 2,235,281 | 4,579,949 | 5,722,359 | 5,592,006 | 6,490,122 | | 5.51 | | 5.3 | |
| Other Income (Subject to Vac.)(4) | 2,185,512 | 2,139,064 | 2,628,357 | 2,837,217 | 2,837,217 | | 2.41 | | 2.3 | |
| Other Income(5) | 866,705 | 3,417,876 | 2,007,352 | 1,866,833 | 1,790,000 | | 1.52 | | 1.5 | |
| Effective Gross Income | $93,827,652 | $104,990,721 | $107,115,042 | $109,971,980 | $121,577,044 | | $103.31 | | 100.0 | % |
| Real Estate Taxes | 17,378,535 | 17,964,371 | 20,280,671 | 20,643,014 | 21,751,485(6) | | 18.48 | | 17.9 | |
| Insurance | 940,220 | 978,346 | 1,205,131 | 1,359,959 | 988,582 | | 0.84 | | 0.8 | |
| Other Expenses | 22,530,416 | 23,815,684 | 25,233,024 | 26,644,535 | 26,644,535(7) | | 22.64 | | 21.9 | |
| | | | | | | | |
| Total Expenses | 40,849,170 | 42,758,401 | 46,718,826 | 48,647,507 | 49,384,602 | | $41.96 | | 40.6 | % |
| | | | | | | | |
| Net Operating Income | $52,978,482 | $62,232,320 | $60,396,216 | $61,324,473(8) | $72,192,441(8) | | $61.34 | | 59.4 | % |
| | | | | | | | |
| Capital Expenditures | 0 | 0 | 0 | 0 | 235,367 | | 0.20 | | 0.2 | |
| TI/LC | 0 | 0 | 0 | 0 | 1,176,837 | | 1.00 | | 1.0 | |
| | | | | | | | |
| Net Cash Flow | $52,978,482 | $62,232,320 | $60,396,216 | $61,324,473 | $70,780,237 | | $60.14 | | 58.2 | % |
| (1) | TTM represents the trailing 12-month period ending September 30, 2024. |
| (2) | Based on the underwritten rent roll dated October 31, 2024. |
| (3) | Represents straight line rent for investment grade tenants. |
| (4) | Other Income (subject to Vacancy) consists of submeter electric reimbursement and condenser water charges and is underwritten per the T12 ending 9/30/24. |
| (5) | Other Income consists of antenna license agreement income, other miscellaneous charges, and the recovery from tenants of costs associated with work orders and other specific tenant requests and is underwritten per the budget. |
| (6) | Real Estate Taxes are underwritten to the appraisal’s conclusion. |
| (7) | Includes Management Fee, which is underwritten at a cap of $1,000,000. |
| (8) | The increase in Net Operating Income from TTM to Underwritten is driven by Rent Steps, IG Rent Credit, and two new leases beginning in December 2024 and June 2025, representing 4.9% of NRA and 5.0% of Net Rental Income. |
The Market. The 299 Park Avenue Property is located in the Midtown market of Manhattan. An entrance to Grand Central Station is located at the corner of the building at Park Avenue and East 48th Street, with the main building located approximately 0.5 miles south of the 299 Park Avenue Property, which serves the 4, 5, 6, 7 trains and the Times Square Shuttle. In addition to Grand Central Station, the 299 Park Avenue Property is located within walking distance to Rockefeller Center which houses the B, D, F, and M trains. Park Avenue is considered a prestigious office corridor, with the immediate surrounding area characterized by office buildings with ground floor retail and features a number of corporate headquarters. There is also a significant amount of hotel use in the neighborhood including the Grand Hyatt Hotel, The Intercontinental and The Waldorf Astoria.
The Park Avenue corridor is expected to undergo a revitalization into a more pedestrian-friendly environment by a partnership between New York City and private stakeholders. The project is intended to introduce enhanced green spaces, seating area, concessions and additional street crossings. This initiative is expected to be carried out in coordination with the rehabilitation by the Metropolitan Transit Authority (“MTA”) of the Grand Central Terminal train shed, located beneath Park Avenue. As the MTA completes its work, the city, in collaboration with private stakeholders, plans to develop an expanded median from East 46th Street to East 57th Street. The new design will feature dedicated cycling lanes and pedestrian walkways, encouraging increased foot traffic and promoting a safer, more enjoyable experience for all visitors.
| THE INFORMATION IN THIS STRUCTURAL AND COLLATERAL TERM SHEET IS NOT COMPLETE AND MAY BE AMENDED PRIOR TO THE TIME OF SALE. THIS TERM SHEET IS NOT AN OFFER TO SELL THESE SECURITIES AND IT IS NOT A SOLICITATION OF AN OFFER TO BUY THESE SECURITIES IN ANY JURISDICTION WHERE THE OFFER OR SALE IS NOT PERMITTED. |
| | 67 | |
| Structural and Collateral Term Sheet | | BMO 2025-C11 |
| No. 7 – 299 Park Avenue |
This project was in the RFP stage as of August 2024, and there are no assurances as to whether, or when, the project will be completed or what the final design will be.
According to the appraisal, the 299 Park Avenue Property is located within the Midtown Manhattan office submarket, which has an inventory of 252.6 million SF with a vacancy rate of 13.3% as of the third quarter of 2024. Year to date leasing activity equated to 11.2 million SF, a 41% increase from the prior year. Net absorption, year to date, totals 1.9 million SF and the average asking rent was $83.90 per SF.
The following table presents certain information relating to the appraisal’s market rent conclusions for the 299 Park Avenue Property:
| Market Rent Conclusions (1) |
| | Retail | Floors 2-10 | Floors 11-20 | Floors 21-30 | Floors 31-41 | Floors 42-44 |
| Market Rent (PSF) | $225.00 | $85.00 | $90.00 | $100.00 | $115.00 | $130.00 |
| Lease Term (Years) | 10 | 10 | 10 | 10 | 10 | 10 |
| Lease Type | Tax over BY | MG | MG | MG | MG | MG |
| Escalations (Annual) | 3.0% | 8.0% Yr. 6 | 8.0% Yr. 6 | 8.0% Yr. 6 | 8.0% Yr. 6 | 8.0% Yr. 6 |
| Tenant Improvements (New/Renewal) | $125 / $50 | $150 / $60 | $150 / $60 | $150 / $60 | $150 / $60 | $150 / $60 |
| Leasing Commissions (New/Renewal) | 5.25% / 2.63% | 5.25% / 2.63% | 5.25% / 2.63% | 5.25% / 2.63% | 5.25% / 2.63% | 5.25% / 2.63% |
| Free Rent (Months) (New/Renewal) | 12 / 3 | 15 / 6 | 15 / 6 | 15 / 6 | 15 / 6 | 15 / 6 |
| THE INFORMATION IN THIS STRUCTURAL AND COLLATERAL TERM SHEET IS NOT COMPLETE AND MAY BE AMENDED PRIOR TO THE TIME OF SALE. THIS TERM SHEET IS NOT AN OFFER TO SELL THESE SECURITIES AND IT IS NOT A SOLICITATION OF AN OFFER TO BUY THESE SECURITIES IN ANY JURISDICTION WHERE THE OFFER OR SALE IS NOT PERMITTED. |
| | 68 | |
| Structural and Collateral Term Sheet | | BMO 2025-C11 |
| No. 7 – 299 Park Avenue |
The following table presents recent leasing data at comparable properties to the 299 Park Avenue Property:
| Comparable Lease Summary(1) |
| | Tenant | Lease Date/ Term (yrs.) | Lease Size (SF) | Base Rent PSF | Free Rent (mths.) |
245 Park Avenue New York, NY | Verition Fund Management EQT Partner Angelo Gordon & Company | Oct-24 / 10.0 Jun-23 / 15.7 May-23 / 8.0 | 72,515 76,204 10,636 | $115.00 $127.00 $113.00 | 16.0 20.0 16.0 |
375 Park Avenue New York, NY | Blue Owl Capital Advent International Corporation | Oct-24 / 15.0 Feb-24 / 10.0 | 238,673 33,959 | $220.00 $193.00 | 19.0 16.0 |
430 Park Avenue New York, NY | Z Capital Partners | Oct-24 / 10.0 | 16,849 | $116.00 | 9.0 |
320 Park Avenue New York, NY | Knighthead Capital Management Leonis Partners Flagstar Bank | Sep-24 / 10.0 Mar-24 / 10.9 Jan-24 / 12.3 | 15,361 8,714 54,500 | $133.00 $120.50 $85.00 | 12.0 11.0 15.0 |
499 Park Avenue New York, NY | Empyrean Capital Partners | Jul-24 / 11.0 | 5,553 | $155.00 | 12.0 |
200 Park Avenue New York, NY | Magnitude Capital | Mar-24 / 10.9 | 20,422 | $140.00 | 11.0 |
425 Park Avenue New York, NY | GTCR Golden Rauner | Mar-24 / 15.0 | 55,600 | $225.00 | 16.0 |
55 East 52nd Street New York, NY | Evercore Partners | Jan-24 / 11.0 | 94,397 | $125.00 | 15.0 |
277 Park Avenue New York, NY | Sumitomo Corporation of America ERM, Inc. Arsenal Capital Partners | Dec-23 / 20.0 Jul-23 / 7.0 Apr-23 / 10.0 | 48,591 12,500 46,393 | $94.00 $87.00 $105.00 | 17.0 7.0 15.0 |
65 East 55th Street New York, NY | Eagle Capital Management PineBridge Investments | Dec-23 / 10.0 Apr-23 / 10.0 | 16,442 17,832 | $138.00 $100.00 | 16.0 13.0 |
The Borrower. The borrower is Fisher-Park Lane Owner LLC, a special purpose, bankruptcy-remote entity and a Delaware limited liability company with one independent director. Legal counsel to the borrower delivered a non-consolidation opinion in connection with the origination of the 299 Park Avenue Whole Loan.
The Borrower Sponsors. The borrower sponsors of the 299 Park Avenue Whole Loan are Fisher Brothers and Alaska Permanent Fund Corporation (“APFC”). Fisher Brothers, founded in 1915, is a fully integrated development, construction management, property management and asset management company. The company’s commercial portfolio encompasses over 10.0 million square feet of Class A office space, including Park Avenue Plaza, the 299 Park Avenue Property, 1345 Avenue of the Americas and 605 Third Avenue, as well as Station Place, Washington, DC’s largest private office complex. In addition, the Fisher Brothers portfolio consists of commercial space in Las Vegas, Nevada anchored by AREA15 and Universal Studios.
Alaska Permanent Fund Corporation is a state-owned corporation, based in Juneau, that manages the assets of the Alaska Permanent Fund and other funds designated by law, such as the Alaska Mental Health Trust Fund. APFC’s fund value as of December 31, 2024, totaled approximately $79.6 billion. APFC’s investments are structured into a portfolio of eight asset classes, which include international and domestic public markets, real estate, and alternative investments. In 2019, APFC engaged Heitman to serve as investment manager for APFC’s investment in 299 Park Avenue. Heitman is a global real estate investment management firm with over $49 billion in assets under management (as of September 30, 2024).
Property Management. The 299 Park Avenue Property is managed by Fisher Brothers Management CO. LLC, an affiliate of the borrower.
| THE INFORMATION IN THIS STRUCTURAL AND COLLATERAL TERM SHEET IS NOT COMPLETE AND MAY BE AMENDED PRIOR TO THE TIME OF SALE. THIS TERM SHEET IS NOT AN OFFER TO SELL THESE SECURITIES AND IT IS NOT A SOLICITATION OF AN OFFER TO BUY THESE SECURITIES IN ANY JURISDICTION WHERE THE OFFER OR SALE IS NOT PERMITTED. |
| | 69 | |
| Structural and Collateral Term Sheet | | BMO 2025-C11 |
| No. 7 – 299 Park Avenue |
Escrows and Reserves. At origination, the borrower deposited $11,894,867 into a reserve for unfunded landlord obligations.
Tax Escrows – Upon the occurrence of a Trigger Period (as defined below) the borrower is required to escrow monthly payments equal to 1/12th of the annual estimated tax payments.
Insurance Escrows – Upon the occurrence of a Trigger Period, and if there is no blanket policy in place, the borrower is required to escrow monthly payments equal to 1/12th of the annual estimated insurance payments.
Replacement Reserve – Upon the occurrence of a Trigger Period the borrower is required to deposit monthly replacement reserves equal to approximately $14,710 ($0.15 per square foot annually).
TI/LC Reserves – Upon the occurrence of a Trigger Period the borrower is required to deposit monthly TI/LC reserves equal to approximately $98,070 ($1.00 per square foot annually).
A “Trigger Period” means the period commencing upon the earliest of: (i) the occurrence and continuance of an event of default, (ii) the debt service coverage ratio, inclusive of any future mezzanine debt service payments, falling below 1.35x for one calendar quarter, based upon the trailing 12 month period immediately preceding such date of determination, (iii) any bankruptcy or similar insolvency of any Specified Tenant (as defined below), (iv) any termination or cancellation of any Specified Tenant lease (including, without limitation, rejection in any bankruptcy or similar insolvency proceeding) and/or any Specified Tenant lease failing to otherwise be in full force and effect as further defined in the 299 Park Avenue Whole Loan documents, (v) any Specified Tenant being in monetary default under the applicable Specified Tenant lease beyond applicable notice and cure periods (or at least 30 days if there is no cure period), (vi) any Specified Tenant giving notice that it is terminating its lease for all or any portion of such Specified Tenant’s space (exclusive of any retail space), (vii) any Specified Tenant failing to provide written notice to the borrower of renewal or extension of its lease upon the earlier of (1) the renewal notice deadline required under the applicable lease, or (2) 18 months prior to lease expiration, in each case renewing or extending the applicable Specified Tenant lease for the lesser of (1) five years or (2) the renewal period set forth in the applicable Specified Tenant lease (clauses (iii) – (vii) hereof are collectively referred to as a “Specified Tenant Trigger Period”, and (viii) the occurrence of an event of default relating to any BMR Mezzanine Loan (as defined below).
A Trigger Period will end upon, with respect to clause (i) above, the cure of the applicable event of default, (ii) with respect to clause (ii) above, the debt service coverage ratio remaining at or above 1.35x for one calendar quarter, (iii) with respect to a Specified Tenant Trigger Period, the first to occur of the lender’s receipt of evidence reasonably acceptable to the lender of: (a) the satisfaction of the applicable Specified Tenant Cure Conditions (as defined below), (b) the borrower leasing the entire Specified Tenant space (or applicable portion thereof) pursuant to one or more leases for a minimum of five years in accordance with the applicable terms and conditions of the 299 Park Avenue Whole Loan documents and, the applicable tenant under such lease(s) being in actual, physical occupancy of the space and the replacement tenant is paying full unabated rent (other than with respect to any market free rent period that is discernible in length and for which the borrower has deposited into a reserve account with the lender in an amount equal to the unabated rent that would otherwise be due and payable with respect to such lease during each unexpired free rent period if no rent concession were in place) or (c) the ST Cap Condition (as defined below) is satisfied with respect to the applicable Specified Tenant space, or (iv) with respect to clause (viii) above, the cure of the applicable event of default under the BMR Mezzanine Loan. Notwithstanding the foregoing, a Trigger Period shall not be deemed to cease in the event any other triggering event is then ongoing.
A “Specified Tenant” means Capital One, UBS, any tenant comprising greater than 125,000 SF, or any guarantor of the foregoing leases.
A “Specified Tenant Cure Conditions” means each of the following, as applicable:
| (a) | with respect to clause (v) in the definition of Trigger Period above, the applicable Specified Tenant has cured all applicable monetary defaults under the applicable Specified Tenant lease and no other monetary default under such Specified Tenant lease has occurred; |
| THE INFORMATION IN THIS STRUCTURAL AND COLLATERAL TERM SHEET IS NOT COMPLETE AND MAY BE AMENDED PRIOR TO THE TIME OF SALE. THIS TERM SHEET IS NOT AN OFFER TO SELL THESE SECURITIES AND IT IS NOT A SOLICITATION OF AN OFFER TO BUY THESE SECURITIES IN ANY JURISDICTION WHERE THE OFFER OR SALE IS NOT PERMITTED. |
| | 70 | |
| Structural and Collateral Term Sheet | | BMO 2025-C11 |
| No. 7 – 299 Park Avenue |
| (b) | with respect to clauses (iv) and (vi) in the definition of Trigger Period above, such Specified Tenant has revoked or rescinded all termination or cancellation notices with respect to the applicable Specified Tenant lease and has re-affirmed the applicable Specified Tenant lease as being in full force and effect; |
| (c) | with respect to clause (vii) in the definition of Trigger Period above, the applicable Specified Tenant has renewed or extended the applicable Specified Tenant Lease in accordance with the terms of the 299 Park Avenue Whole Loan documents for the applicable Specified Tenant renewal term; and |
| (d) | with respect to clause (iii) in the definition of Trigger Period above, the applicable Specified Tenant is no longer insolvent or subject to any bankruptcy or insolvency proceedings and has affirmed the applicable Specified Tenant Lease pursuant to final, non-appealable order of a court of competent jurisdiction. |
An “ST Cap Condition” means that the amount in the specified tenant account is equal to or greater than (a) $100, multiplied by (b) the number of leasable square feet demised (prior to giving effect to any full or partial termination thereof) pursuant to the applicable Specified Tenant lease with respect to which the applicable Specified Tenant Trigger Period will have occurred, provided, however, solely in connection with the UBS lease, the foregoing “leasable square feet” will exclude any space on the 10th floor of the 299 Park Avenue Property. Notwithstanding the foregoing, the borrower may deliver to the lender a lump sum cash payment or a letter of credit in an amount equal to the amount which would satisfy the ST Cap Condition in order to satisfy the ST Cap Condition.
Lockbox / Cash Management. The 299 Park Avenue Whole Loan documents require a hard lockbox with springing cash management. All rents from the 299 Park Avenue Property are required to be deposited directly into the lockbox account by tenants and, so long as a Trigger Period is not continuing, funds in the lockbox account will be transferred on each business day to the borrower’s operating account. During a Trigger Period, funds in the lockbox account will be transferred to the lender-controlled cash management account and disbursed according to the 299 Park Avenue Whole Loan documents. During a Trigger Period, all excess cash is required to be held by the lender as additional security for the 299 Park Avenue Whole Loan.
Subordinate and Mezzanine Debt. None.
Permitted Future Subordinate or Mezzanine Debt. Upon at least 30 days and not more than 120 days’ notice to the lender, a constituent party of the borrower (a “BMR Mezzanine Borrower”) has a one-time right to incur mezzanine financing (a “BMR Mezzanine Loan”) subject to the satisfaction of certain requirements set forth in the 299 Park Avenue Whole Loan documents, which include, but are not limited to: (i) there is no event of default continuing, (ii) the interest rate under the BMR Mezzanine Loan is at a fixed rate and the BMR Mezzanine Loan is fully funded on the origination date of the BMR Mezzanine Loan, (iii) after giving effect to the BMR Mezzanine Loan, (x) the combined loan to value ratio is equal to or less than 45.6%, and (y) the combined debt yield is equal to or greater than 12.5%, (iv) the maturity of the BMR Mezzanine Loan is coterminous with, or longer than, the maturity date of the 299 Park Avenue Whole Loan, (v) the lender originating the BMR Mezzanine Loan must be a qualified mezzanine lender approved by the lender under the 299 Park Avenue Whole Loan, (vi) the BMR Mezzanine Borrower must own 100% of the direct or indirect interests in the borrower, and (vii) the lender originating the BMR Mezzanine Loan must enter into an intercreditor agreement with the 299 Park Avenue Whole Loan lender in form and substance acceptable to the rating agencies and reasonably acceptable to the 299 Park Avenue Whole Loan lender.
Partial Release. None.
Ground Lease. None
| THE INFORMATION IN THIS STRUCTURAL AND COLLATERAL TERM SHEET IS NOT COMPLETE AND MAY BE AMENDED PRIOR TO THE TIME OF SALE. THIS TERM SHEET IS NOT AN OFFER TO SELL THESE SECURITIES AND IT IS NOT A SOLICITATION OF AN OFFER TO BUY THESE SECURITIES IN ANY JURISDICTION WHERE THE OFFER OR SALE IS NOT PERMITTED. |
| | 71 | |
| Structural and Collateral Term Sheet | | BMO 2025-C11 |
| No. 8 – FedEx Portfolio |
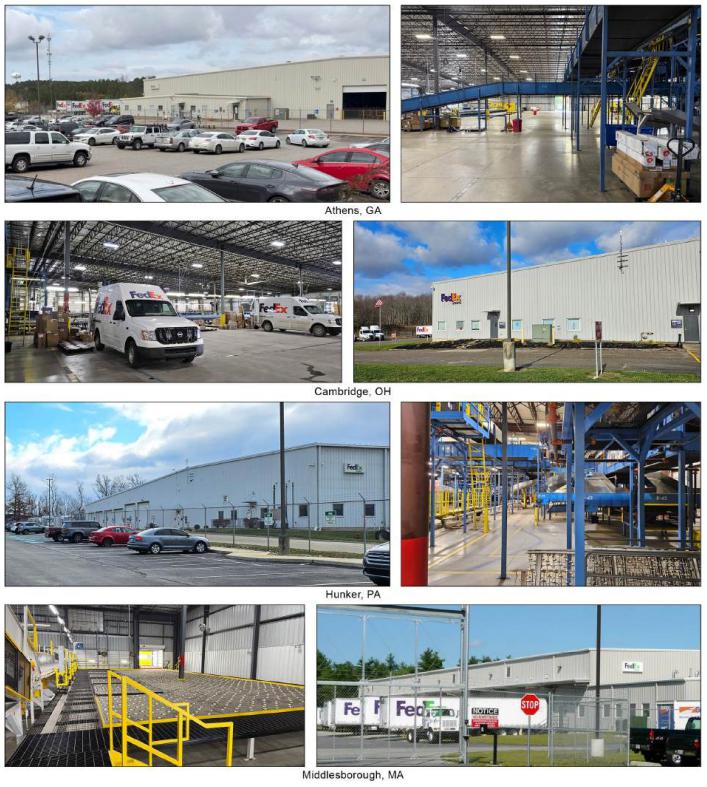
| THE INFORMATION IN THIS STRUCTURAL AND COLLATERAL TERM SHEET IS NOT COMPLETE AND MAY BE AMENDED PRIOR TO THE TIME OF SALE. THIS TERM SHEET IS NOT AN OFFER TO SELL THESE SECURITIES AND IT IS NOT A SOLICITATION OF AN OFFER TO BUY THESE SECURITIES IN ANY JURISDICTION WHERE THE OFFER OR SALE IS NOT PERMITTED. |
| | 72 | |
| Structural and Collateral Term Sheet | | BMO 2025-C11 |
| No. 8 – FedEx Portfolio |
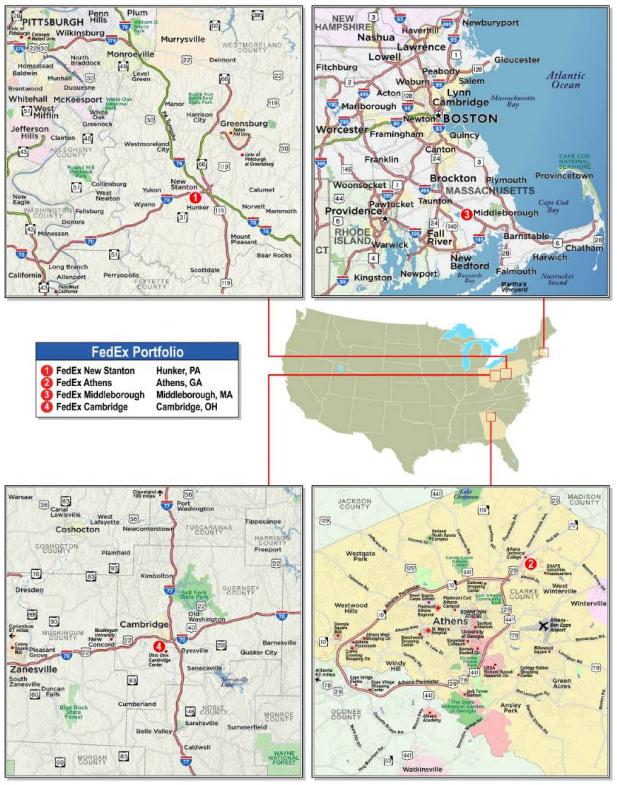
| THE INFORMATION IN THIS STRUCTURAL AND COLLATERAL TERM SHEET IS NOT COMPLETE AND MAY BE AMENDED PRIOR TO THE TIME OF SALE. THIS TERM SHEET IS NOT AN OFFER TO SELL THESE SECURITIES AND IT IS NOT A SOLICITATION OF AN OFFER TO BUY THESE SECURITIES IN ANY JURISDICTION WHERE THE OFFER OR SALE IS NOT PERMITTED. |
| | 73 | |
| Structural and Collateral Term Sheet | | BMO 2025-C11 |
| No. 8 – FedEx Portfolio |
| Mortgage Loan Information | | Property Information |
| Mortgage Loan Seller: | BMO | | Single Asset / Portfolio: | Portfolio |
| Original Principal Balance: | $36,000,000 | | Title: | Fee |
| Cut-off Date Principal Balance: | $36,000,000 | | Property Type – Subtype: | Industrial – Warehouse / Distribution |
| % of IPB: | 4.0% | | Net Rentable Area (SF): | 438,592 |
| Loan Purpose: | Refinance | | Location: | Various |
| Borrowers(1): | Various | | Year Built / Renovated(3): | Various / NAP |
| Borrowers Sponsors: | Jeno Guttmann and Moises J. Mizrahi | | Occupancy: | 100.0% |
| Interest Rate: | 7.01000% | | Occupancy Date: | 2/6/2025 |
| Note Date: | 1/31/2025 | | 4th Most Recent NOI (As of): | $3,121,263 (12/31/2021) |
| Maturity Date: | 2/6/2035 | | 3rd Most Recent NOI (As of): | $3,181,801 (12/31/2022) |
| Interest-only Period: | 120 months | | 2nd Most Recent NOI (As of): | $3,877,697 (12/31/2023) |
| Original Term: | 120 months | | Most Recent NOI (As of): | $3,940,545 (12/31/2024) |
| Original Amortization Term: | None | | UW Economic Occupancy: | 100.0% |
| Amortization Type: | Interest Only | | UW Revenues: | $4,062,417 |
| Call Protection: | L(24),DorYM1(89),O(7) | | UW Expenses: | $121,873 |
| Lockbox / Cash Management: | Hard / Springing | | UW NOI: | $3,940,545 |
| Additional Debt: | No | | UW NCF: | $3,852,826 |
| Additional Debt Balance: | NAP | | Appraised Value / Per SF: | $51,550,000 / $118 |
| Additional Debt Type: | NAP | | Appraisal Date(4): | Various |
| | | | | |
| Escrows and Reserves(2) | | Financial Information |
| | Initial | Monthly | Initial Cap | | Cut-off Date Loan / SF: | $82 |
| Taxes: | $0 | Springing | N/A | | Maturity Date Loan / SF: | $82 |
| Insurance: | $20,442 | $10,221 | N/A | | Cut-off Date LTV: | 69.8% |
| Replacement Reserves: | $0 | $7,310 | N/A | | Maturity Date LTV: | 69.8% |
| Rollover Reserve: | $0 | Springing | N/A | | UW NCF DSCR: | 1.51x |
| Deferred Maintenance: | $8,250 | $0 | N/A | | UW NOI Debt Yield: | 10.9% |
| Earnout Reserve: | $500,000 | $0 | N/A | | | |
| | | | | | | |
| Sources and Uses |
| Sources | Proceeds | % of Total | | Uses | Proceeds | % of Total |
| Mortgage Loan | $36,000,000 | 98.3 | % | | Loan Payoff | 35,350,691 | 96.5 | % |
| Borrower Sponsors’ Equity | 628,859 | 1.7 | | | Closing Costs | 749,476 | 2.0 | |
| | | | | Upfront Reserves | 528,692 | 1.4 | |
| Total Sources | $36,628,859 | 100.0 | % | | Total Uses | $36,628,859 | 100.0 | % |
| (1) | The borrowers are GM Federal Acquisition, L.P., Zanesville Federal Acquisition LLC, Middleborough Federal Acquisition LLC, DG Federal Acquisition, LLC, HR Federal Acquisition, LLC and GM Federal Acquisition, LLC. |
| (2) | For a full description of escrows and reserves, see “Escrows and Reserves” below. |
| (3) | See “Portfolio Summary” table below. |
| (4) | Appraisals are dated between October 22, 2024 and October 29, 2024. See “Appraisal Valuation Summary” table below. |
The Loan. The eighth largest mortgage loan (the “FedEx Portfolio Mortgage Loan”) is secured by the borrowers’ fee interest in four industrial properties (the “FedEx Portfolio Properties”). The FedEx Portfolio Mortgage Loan is evidenced by a single promissory note in the original principal amount of $36,000,000. The FedEx Portfolio Mortgage Loan was originated on January 31, 2025 by Bank of Montreal. The FedEx Portfolio Mortgage Loan has a 10-year interest only term and accrues interest at a rate of 7.01000% per annum on an Actual/360 basis. The scheduled maturity date of the FedEx Portfolio Mortgage Loan is the payment date that occurs on February 6, 2035.
The Properties. The FedEx Portfolio Properties consist of four warehouse/distribution industrial properties, with an aggregate of 438,592 square feet. The FedEx Portfolio Properties are located in Hunker, Pennsylvania (the “FedEx New
| THE INFORMATION IN THIS STRUCTURAL AND COLLATERAL TERM SHEET IS NOT COMPLETE AND MAY BE AMENDED PRIOR TO THE TIME OF SALE. THIS TERM SHEET IS NOT AN OFFER TO SELL THESE SECURITIES AND IT IS NOT A SOLICITATION OF AN OFFER TO BUY THESE SECURITIES IN ANY JURISDICTION WHERE THE OFFER OR SALE IS NOT PERMITTED. |
| | 74 | |
| Structural and Collateral Term Sheet | | BMO 2025-C11 |
| No. 8 – FedEx Portfolio |
Stanton Property”), Athens, Georgia (the “FedEx Athens Property”), Middleborough, Massachusetts (the “FedEx Middleboro Property”) and Cambridge, Ohio (the “FedEx Cambridge Property”). The FedEx Portfolio Properties are 100.0% occupied with a single tenant, Federal Express Corporation (“FedEx”).
The following table presents certain information relating to the FedEx Portfolio Properties:
| Portfolio Summary |
| Property Name | Year Built / Renovated | Net Rentable Area (SF) (1) | Occupancy %(1) | Allocated Loan Amount (“ALA”) | % of ALA | Appraised Value | % of Appraised Value | UW Base Rent | % of UW Base Rent |
| FedEx New Stanton(2) | 2006 / NAP | 140,985 | 100.0% | $13,513,094 | 37.5 | % | $19,350,000 | 37.5 | % | $1,305,604 | 33.1 | % |
| FedEx Athens | 2006 / NAP | 140,218 | 100.0% | 9,846,751 | 27.4 | | $14,100,000 | 27.4 | | 1,467,248 | 37.2 | |
| FedEx Middleborough | 2005 / NAP | 73,137 | 100.0% | 7,821,532 | 21.7 | | 11,200,000 | 21.7 | | 685,416 | 17.4 | |
| FedEx Cambridge | 2006-2014 / NAP | 84,252 | 100.0% | 4,818,623 | 13.4 | | 6,900,000 | 13.4 | | 482,277 | 12.2 | |
| Total / Wtd. Avg. | | 438,592 | 100.0% | $36,000,000 | 100.0 | % | $51,550,000 | 100.0 | % | $3,940,545 | 100.0 | % |
| (1) | Based on the underwritten rent roll dated as of February 6, 2025. |
| (2) | The FedEx New Stanton Property includes a parking lease that accounts for $700,965 of UW Base Rent. |
FedEx New Stanton (32.1% of NRA; 33.1% of underwritten base rent). The FedEx New Stanton Property is a 140,985 square foot industrial property containing a single-story building located at 2000 Labonte Drive in Hunker, Pennsylvania. The building, located on a 33.51-acre site, was built in 2006. The FedEx New Stanton Property has clear heights of 18 – 32 feet.
FedEx Athens (32.0% of NRA; 37.2% of underwritten base rent). The FedEx Athens Property is a 140,218 square foot industrial property containing a single-story building located at 1655 Olympic Drive in Athens, Georgia. The building, located on a 21.54-acre site, was built in 2006. The FedEx Athens Property has clear heights of 22 – 27 feet.
FedEx Middleborough (16.7% of NRA; 17.4% of underwritten base rent). The FedEx Middleborough Property is a 73,137 square foot industrial property containing a single-story building located at 17 Cowan Drive in Middleborough, Massachusetts. The building, located on a 10.63-acre site, was built in 2005. The FedEx Middleborough Property has clear heights of 24 – 28 feet.
FedEx Cambridge (19.2% of NRA; 12.2% of underwritten base rent). The FedEx Cambridge Property is an 84,252 square foot industrial property containing a single-story buildings located at 8705 Commerce Drive in Cambridge, Ohio. The building, located on a 12.17-acre site, was built from 2006 to 2014. The FedEx Cambridge Property has clear heights of 21 – 29 feet.
Sole Tenant.
FedEx (438,592 square feet; 100.0% NRA; 100.0% of underwritten base rent): FedEx provides consumers and businesses worldwide with a broad portfolio of transportation, ecommerce, and business services. FedEx integrates business solutions utilizing its global network, covering more than 220 countries and territories.
Appraisals. According to the appraisals, the FedEx Portfolio Properties have an aggregate “as-is” appraised value of $51,550,000 as of the dates between October 22, 2024 and October 29, 2024. The table below shows the appraisal’s “as-is” conclusions.
| Appraisal Valuation Summary(1) |
| Property Name | Appraisal Approach | Appraised Value | Capitalization Rate(2) |
| FedEx New Stanton | Direct Capitalization Approach | $19,350,000 | 6.75% |
| FedEx Athens | Income Capitalization Approach | $14,100,000 | 7.75% |
| FedEx Middleborough | Direct Capitalization Approach | $11,200,000 | 6.00% |
| FedEx Cambridge | Direct Capitalization Approach | $6,900,000 | 7.00% |
| (2) | The capitalization rates shown above represent the overall capitalization rate. |
| THE INFORMATION IN THIS STRUCTURAL AND COLLATERAL TERM SHEET IS NOT COMPLETE AND MAY BE AMENDED PRIOR TO THE TIME OF SALE. THIS TERM SHEET IS NOT AN OFFER TO SELL THESE SECURITIES AND IT IS NOT A SOLICITATION OF AN OFFER TO BUY THESE SECURITIES IN ANY JURISDICTION WHERE THE OFFER OR SALE IS NOT PERMITTED. |
| | 75 | |
| Structural and Collateral Term Sheet | | BMO 2025-C11 |
| No. 8 – FedEx Portfolio |
Environmental. According to the Phase I environmental assessments dated between October 25, 2024 and October 31, 2024, there was no evidence of any recognized environmental conditions at the FedEx Portfolio Properties.
The following table presents certain information relating to the historical and current occupancy of the FedEx Portfolio Properties:
| Historical and Current Occupancy(1) |
| 2021 | 2022 | 2023 | Current(2) |
| 100.0% | 100.0% | 100.0% | 100.0% |
| (1) | Historical information was obtained from the borrowers. |
| (2) | Current occupancy is based on the underwritten rent roll dated as of February 6, 2025. |
The following table presents certain information relating to the sole tenant at the FedEx Portfolio Properties:
| Sole Tenant Summary(1) |
| Tenant | Ratings
Moody’s/S&P/ Fitch(2) | Net Rentable Area (SF) | % of
Total NRA | UW
Base Rent PSF(2) |
UW
Base Rent | % of Total
UW Base Rent | Lease
Exp. Date |
| FedEx | NR/NR/NR | 438,592 | 100.0% | $8.98 | $3,940,545 | 100.0% | Various(3) |
| Occupied Collateral Total / Wtd. Avg. | | 438,592 | 100.0% | $8.98 | $3,940,545 | 100.0% | |
| Vacant Space | | 0 | 0.0% | | | | |
| Collateral Total | | 438,592 | 100.0% | | | | |
| | | | | | | | |
| | | | | | | | |
| (1) | Based on the underwritten rent roll dated as of February 6, 2025. |
| (2) | Certain ratings are those of the parent company whether or not the parent guarantees the lease. |
| (3) | The various lease expiration dates include August 31, 2026 (FedEx Athens with two, five-year renewal options), May 31, 2028 (FedEx Middleborough with no renewal options), September 14, 2028 (FedEx Cambridge with two, five-year renewal options), August 31, 2032 (FedEx New Stanton with two, five-year renewal options), and November 30, 2032 (FedEx New Stanton Parking with two, five-year renewal options). |
| THE INFORMATION IN THIS STRUCTURAL AND COLLATERAL TERM SHEET IS NOT COMPLETE AND MAY BE AMENDED PRIOR TO THE TIME OF SALE. THIS TERM SHEET IS NOT AN OFFER TO SELL THESE SECURITIES AND IT IS NOT A SOLICITATION OF AN OFFER TO BUY THESE SECURITIES IN ANY JURISDICTION WHERE THE OFFER OR SALE IS NOT PERMITTED. |
| | 76 | |
| Structural and Collateral Term Sheet | | BMO 2025-C11 |
| No. 8 – FedEx Portfolio |
The following table presents certain information relating to the tenant lease expiration at the FedEx Portfolio Properties:
| Lease Rollover Schedule(1) |
| Year | Number of Leases Expiring | Net Rentable Area Expiring | % of NRA Expiring | UW Base Rent Expiring | % of UW Base Rent Expiring | Cumulative Net Rentable Area Expiring | Cumulative % of NRA Expiring | Cumulative UW Base Rent Expiring | Cumulative % of UW Base Rent Expiring |
| Vacant | NAP | 0 | 0.0 | % | NAP | NA | P | 0 | 0.0% | NAP | NAP |
| 2023 & MTM | 0 | 0 | 0.0 | | $0 | 0.0 | % | 0 | 0.0% | $0 | 0.0% |
| 2024 | 0 | 0 | 0.0 | | 0 | 0.0 | | 0 | 0.0% | $0 | 0.0% |
| 2025 | 0 | 0 | 0.0 | | 0 | 0.0 | | 0 | 0.0% | $0 | 0.0% |
| 2026 | 1 | 140,218 | 32.0 | | 1,467,248 | 37.2 | | 140,218 | 32.0% | $1,467,248 | 37.2% |
| 2027 | 0 | 0 | 0.0 | | 0 | 0.0 | | 140,218 | 32.0% | $1,467,248 | 37.2% |
| 2028 | 2 | 157,389 | 35.9 | | 1,167,693 | 29.6 | | 297,607 | 67.9% | $2,634,941 | 66.9% |
| 2029 | 0 | 0 | 0.0 | | 0 | 0.0 | | 297,607 | 67.9% | $2,634,941 | 66.9% |
| 2030 | 0 | 0 | 0.0 | | 0 | 0.0 | | 297,607 | 67.9% | $2,634,941 | 66.9% |
| 2031 | 0 | 0 | 0.0 | | 0 | 0.0 | | 297,607 | 67.9% | $2,634,941 | 66.9% |
| 2032 | 2 | 140,985 | 32.1 | | 1,305,604 | 33.1 | | 438,592 | 100.0% | $3,940,545 | 100.0% |
| 2033 | 0 | 0 | 0.0 | | 0 | 0.0 | | 438,592 | 100.0% | $3,940,545 | 100.0% |
| 2034 & Beyond | 0 | 0 | 0.0 | | 0 | 0.0 | | 438,592 | 100.0% | $3,940,545 | 100.0% |
| Total | 5 | 438,592 | 100.0 | % | $3,940,545 | 100.0 | % | | | | |
| (1) | Based on underwritten rent roll dated as of February 6, 2025. |
The following table presents certain information relating to the underwritten cash flows of the FedEx Portfolio Properties:
| Operating History and Underwritten Net Cash Flow |
| | 2021 | 2022 | 2023 | TTM | Underwritten | Per Square Foot | %(1) |
| Gross Potential Rent | $3,121,263 | $3,181,801 | $3,877,697 | $3,940,545 | $3,940,545 | | $8.98 | | 100.0% | |
| Reimbursement Income | 0 | 0 | 0 | 0 | 121,873 | | 0.28 | | 3.1 | |
| Effective Gross Income | $3,121,263 | $3,181,801 | $3,877,697 | $3,940,545 | $4,062,417 | | $9.26 | | 103.1% | |
| Total Expenses(2) | $0 | $0 | $0 | $0 | $121,873 | | $0.28 | | 3.0% | |
| Net Operating Income | $3,121,263 | $3,181,801 | $3,877,697 | $3,940,545 | $3,940,545 | | $8.98 | | 97.0% | |
| Replacement Reserves | 0 | 0 | 0 | 0 | 87,718 | | 0.20 | | 2.2 | |
| Net Cash Flow | $3,121,263 | $3,181,801 | $3,877,697 | $3,940,545 | $3,852,826 | | $8.78 | | 94.8% | |
| (1) | % column represents percent of Gross Potential Rent for all revenue lines and represents percent of Effective Gross Income for the remainder of fields. |
| (2) | Total Expenses includes a management fee equal to 3.0% of Effective Gross Income. |
The Markets. The following table presents certain market information relating to the FedEx Portfolio Properties:
| Industrial Market Area Summary(1) |
| Property | Market | Submarket | Submarket
Inventory
(SF)(2) | Submarket
Vacancy(2) | Submarket
NNN Rent
PSF(2) |
| FedEx New Stanton | Pittsburgh – PA USA | Westmoreland County | 40,123,198 | 4.3% | $7.41 |
| FedEx Athens | Athens – GA USA | NAV | NAV | NAV | NAV |
| FedEx Middleborough | Greater Boston Metro | Route 495 South | 72,027,351 | 7.0% | $12.70 |
| FedEx Cambridge | Four County Area | NAV | NAV | NAV | NAV |
| (1) | Source: Appraisals, unless otherwise indicated. |
| (2) | Submarket Inventory, Submarket Vacancy, and Submarket NNN Rent PSF are as of the second quarter of 2024. |
| THE INFORMATION IN THIS STRUCTURAL AND COLLATERAL TERM SHEET IS NOT COMPLETE AND MAY BE AMENDED PRIOR TO THE TIME OF SALE. THIS TERM SHEET IS NOT AN OFFER TO SELL THESE SECURITIES AND IT IS NOT A SOLICITATION OF AN OFFER TO BUY THESE SECURITIES IN ANY JURISDICTION WHERE THE OFFER OR SALE IS NOT PERMITTED. |
| | 77 | |
| Structural and Collateral Term Sheet | | BMO 2025-C11 |
| No. 8 – FedEx Portfolio |
The following table presents certain demographic information with respect to the FedEx Portfolio Properties:
| Demographics Overview |
| Property | Net Rentable Area (SF)(1) | ALA | % of ALA | UW Base Rent | % of UW Base Rent | Estimated 2024 Population (5-mile Radius)(2) | Estimated 2024 Average Household Income (5-mile Radius)(2) |
| FedEx New Stanton | 140,985 | $13,513,094 | 37.5 | % | $1,305,604 | 33.1 | % | 20,259 | | $95,028 | |
| FedEx Athens | 140,218 | 9,846,751 | 27.4 | | 1,467,248 | 37.2 | | 78,895 | | $65,053 | |
| FedEx Middleborough | 73,137 | 7,821,532 | 21.7 | | 685,416 | 17.4 | | 16,159 | | $119,687 | |
| FedEx Cambridge | 84,252 | 4,818,623 | 13.4 | | 482,277 | 12.2 | | 19,880 | | $66,206 | |
| Total/Wtd. Avg. | 438,592 | $36,000,000 | 100.0 | % | $3,940,545 | 100.0 | % | | |
| (1) | Based on the underwritten rent rolls dated February 6, 2025. |
| (2) | Information obtained from third-party market research reports. |
The Borrowers. The borrowers are GM Federal Acquisition, L.P., Zanesville Federal Acquisition LLC, Middleborough Federal Acquisition LLC, DG Federal Acquisition, LLC, HR Federal Acquisition, LLC, and GM Federal Acquisition, LLC, as tenants-in-common and each a Delaware limited liability company with one independent director. Legal counsel to the borrowers delivered a non-consolidation opinion in connection with the origination of the FedEx Portfolio Mortgage Loan.
The Borrowers Sponsors. The nonrecourse carve-out guarantors are Jeno Guttmann and Moises J. Mizrahi. Jeno Guttmann is a chairman of Ambo Properties and has four decades of experience in the real estate industry.
Property Management. The FedEx Portfolio Properties are managed by Federal Manager LLC, a borrower-affiliated property management company.
Escrows and Reserves. At origination, the borrowers deposited into escrow (i) $8,250 for deferred maintenance, (ii) approximately $20,442 for insurance reserves and (iii) $500,000 for an earnout reserve, to be disbursed, at the borrowers’ request, upon (a) no event of default has occurred or is continuing, (b) a FedEx Athens Renewal Event (as defined below) has occurred and (c) the borrowers have provided an updated rent roll evidencing each FedEx lease.
Tax Escrows – The borrower will not be required to make any deposits to the tax escrows provided that the FedEx is (i) obligated to pay all real estate taxes pursuant to the terms of the Fed Ex lease, (ii) FedEx pays all real estate taxes when due and payable, and (iii) the borrower provides evidence to the lender of such payment.
Insurance Escrows – If there is no approved blanket policy in place, the borrowers are required to escrow 1/12th of the annual estimated insurance payments on a monthly basis, currently equal to approximately $10,221. There is currently no approved blanket policy in place.
Replacement Reserve – On a monthly basis, the borrowers are required to deposit into a replacement reserve, an amount equal to approximately $7,310.
Rollover Reserve – On each payment date upon the occurrence of Trigger Period (as defined below), the borrowers are required to deposit into a rollover reserve an amount equal to approximately $36,549.
A “FedEx Athens Renewal Event” is a FedEx Lease Renewal Event (as defined below) in connection with the FedEx Athens lease.
A “Lease Sweep Period” will commence upon (i) each date that is (x) one year prior to the expiration of the term under each FedEx lease other than FedEx Middleborough lease and FedEx Cambridge lease, and (y) nine months prior to the expiration of the term under each of FedEx Middleborough lease and FedEx Cambridge lease, including, for the avoidance of doubt, in the case of any FedEx lease, the previous renewal of which cured a previous Lease Sweep Period with respect to such FedEx lease (a “Renewal Failure Event”), or (ii) with respect to any Major Lease (as defined below), such Major Lease is terminated, the tenant under such Major Lease gives notice of its intention to terminate or vacate the leased premises, the tenant under such Major Lease becomes a debtor in a bankruptcy or insolvency proceeding, or 25% or greater of the space demised under such Major Lease “goes dark” or is no longer occupied by the tenant (a “Lease Termination
| THE INFORMATION IN THIS STRUCTURAL AND COLLATERAL TERM SHEET IS NOT COMPLETE AND MAY BE AMENDED PRIOR TO THE TIME OF SALE. THIS TERM SHEET IS NOT AN OFFER TO SELL THESE SECURITIES AND IT IS NOT A SOLICITATION OF AN OFFER TO BUY THESE SECURITIES IN ANY JURISDICTION WHERE THE OFFER OR SALE IS NOT PERMITTED. |
| | 78 | |
| Structural and Collateral Term Sheet | | BMO 2025-C11 |
| No. 8 – FedEx Portfolio |
Event”). Any such Lease Sweep Period will end (1) in the case of a Renewal Failure Event, upon the date on which the tenant under the subject FedEx lease irrevocably exercises its existing renewal or extension option set forth in such FedEx lease (or, if no such option exists, otherwise enters into an extension agreement with the related borrower for an additional term of not less than four years from the date of expiration of the term of such FedEx lease and reasonably acceptable to the lender) in writing with respect to all of the space demised under its FedEx lease, and in all events, for a rental rate not less than the in-place/market rent as approved by the lender in its reasonable judgment, and the lender has received documentary evidence of such renewal/extension together with a new tenant estoppel, in each case reasonably satisfactory to the lender, and provided that no other Lease Sweep Period then exists (a “FedEx Lease Renewal Event”), and (2) in the case of a Lease Termination Event, upon the borrowers leasing to a tenant approved by the lender pursuant to a lease approved by the lender in accordance with the applicable terms and conditions hereof the entire space demised pursuant to the lease affected by the Lease Termination Event, the applicable tenant under such lease will be in actual, physical occupancy of, and open to the public for business in, the entire space demised under its lease and paying the full unabated amount of the rent due under its lease and such tenant has delivered to the lenders an estoppel certificate reasonably acceptable to the lenders.
A ”Major Lease” means, as to each of the individual FedEx Portfolio Properties (i) any lease which together with all other leases to the same tenant and to all affiliates of such tenant, (A) provides for rental income representing 10% or more of the total rental income for the applicable property, (B) covers more than 5,000 square feet at the applicable individual property, in the aggregate, (C) provides for a lease term of more than 10 years including options to renew or (D) is with an affiliate of the borrowers, (ii) each FedEx lease and (iii) any instrument guaranteeing or providing credit support for any lease identified in clause (i) or (ii) above.
Lockbox / Cash Management. The FedEx Portfolio Mortgage Loan is structured with a hard lockbox and springing cash management. The borrowers or property manager are required to immediately deposit all revenues received into the clearing account within two business days of receipt. All sums on deposit in the clearing account are required to be transferred to a cash management account controlled by the lender upon the occurrence and during the continuance of a Trigger Period and are required to be applied and disbursed in accordance with the FedEx Portfolio Mortgage Loan documents. A cash management account was not established prior to closing and the FedEx Portfolio Mortgage Loan is fully recourse until the cash management account is established.
A “Trigger Period” means a period of time (A) commencing upon the earliest of (i) the occurrence of an event of default, (ii) the debt yield being less than 8.0%, or (iii) the commencement of a Lease Sweep Period, and (B) expiring upon (x) with regard to any Trigger Period commenced in connection with clause (i) above, the cure (if applicable) of such event of default (y) with regard to any Trigger Period commenced in connection with clause (ii) above, the date that the debt yield is equal to or greater than 8.0% for two consecutive calendar quarters following the commencement of such Trigger Period, and (z) with respect to the matter described in clause (iii) above, such Lease Sweep Period has ended.
Subordinate and Mezzanine Debt. None.
Permitted Future Mezzanine or Subordinate Debt. Future mezzanine debt is permitted in order to finance expansion work to the extent required under any FedEx lease, upon satisfaction of certain conditions set forth in the FedEx Portfolio Mortgage Loan documents.
Partial Release. Provided no event of default then exists, and provided that the Athens Release Conditions (as defined below) are satisfied, the borrower will have the right at any time after March 6, 2027 to voluntarily prepay a portion of the FedEx Portfolio Mortgage Loan (the “Partial Prepayment Event”) and obtain a release of the FedEx Athens Property (the “Release Property”) upon satisfaction of the following conditions precedent: (i) the borrower provides between 30 and 90 days prior written notice (the “Partial Prepayment Notice”) to the lender specifying the date (the “Partial Prepayment Date”), on a business day that the Partial Prepayment Event will occur and each Release Property that is the subject of a release as a result of the Partial Prepayment Event, provided, however, that the borrower has the right to cancel such notice by providing the lender with notice of cancellation not less than five business days’ prior to the scheduled Partial Prepayment Date, provided that the borrower pays all of lender’s reasonable costs and expenses incurred as a result of such cancellation; (ii) the borrower will pay to lender the monthly debt service payment amount due on the payment date next following the Partial Prepayment Date; (iii) the borrower will pay to the lender all other sums, not including scheduled interest or principal payments, then due under all FedEx Portfolio Mortgage Loan documents; (iv) on the Partial Prepayment Date,
| THE INFORMATION IN THIS STRUCTURAL AND COLLATERAL TERM SHEET IS NOT COMPLETE AND MAY BE AMENDED PRIOR TO THE TIME OF SALE. THIS TERM SHEET IS NOT AN OFFER TO SELL THESE SECURITIES AND IT IS NOT A SOLICITATION OF AN OFFER TO BUY THESE SECURITIES IN ANY JURISDICTION WHERE THE OFFER OR SALE IS NOT PERMITTED. |
| | 79 | |
| Structural and Collateral Term Sheet | | BMO 2025-C11 |
| No. 8 – FedEx Portfolio |
the borrower will pay to the lender a principal reduction payment in an amount equal to 115% of the Release Price (as defined below) for each subject Release Property that is the subject of Partial Prepayment Event (the “Partial Principal Prepayment”); (v) on the Partial Prepayment Date, the borrower will pay, in addition to the Partial Principal Prepayment, (i) an amount equal to all sums due and payable under the FedEx Portfolio Mortgage Loan documents; (vi) the Partial Prepayment Event is permitted under REMIC requirements; (vii) the borrower delivers rating agency confirmation to the lender; (viii) the borrower will deliver an officer’s certificate certifying that the Partial Prepayment Event requirements have been met; (ix) the borrower will deliver such other certificates, documents or instruments as the lender may reasonably request which are necessary to effectuate the Partial Prepayment Event; (x) as of each of the Partial Prepayment Notice date and as of the date of consummation of the Partial Prepayment Event, after giving effect to the release of the Release Property, the debt yield with respect to the remaining FedEx Portfolio Properties is greater than 10.9%; (xi) as of each of the Partial Prepayment Notice date and as of the date of consummation of the Partial Prepayment Event, after giving effect to the Release Property, the LTV with respect to the remaining FedEx Portfolio Properties is no greater than 69.8%; and (xii) the borrower will pay all costs and expenses of the lender incurred in connection with the Partial Prepayment Event.
The “Athens Release Conditions” mean the defeasance of the FedEx Athens Property, provided no event of default then exists, and provided that either (x) a Fed Ex Lease Athens Renewal Event has occurred, or (y) the FedEx Athens Property is to be concurrently released or previously has been released as the subject of a Partial Defeasance Event or Partial Prepayment Event.
The “Release Price” means, with respect to any of the individual FedEx Portfolio Properties, an amount equal to the greater of (a) the allocated loan amount and (b) 90% of the net sales proceeds.
Ground Lease. None.
| THE INFORMATION IN THIS STRUCTURAL AND COLLATERAL TERM SHEET IS NOT COMPLETE AND MAY BE AMENDED PRIOR TO THE TIME OF SALE. THIS TERM SHEET IS NOT AN OFFER TO SELL THESE SECURITIES AND IT IS NOT A SOLICITATION OF AN OFFER TO BUY THESE SECURITIES IN ANY JURISDICTION WHERE THE OFFER OR SALE IS NOT PERMITTED. |
| | 80 | |
| Structural and Collateral Term Sheet | | BMO 2025-C11 |
| No. 9 – UOVO Orangeburg |

| THE INFORMATION IN THIS STRUCTURAL AND COLLATERAL TERM SHEET IS NOT COMPLETE AND MAY BE AMENDED PRIOR TO THE TIME OF SALE. THIS TERM SHEET IS NOT AN OFFER TO SELL THESE SECURITIES AND IT IS NOT A SOLICITATION OF AN OFFER TO BUY THESE SECURITIES IN ANY JURISDICTION WHERE THE OFFER OR SALE IS NOT PERMITTED. |
| | 81 | |
| Structural and Collateral Term Sheet | | BMO 2025-C11 |
| No. 9 – UOVO Orangeburg |
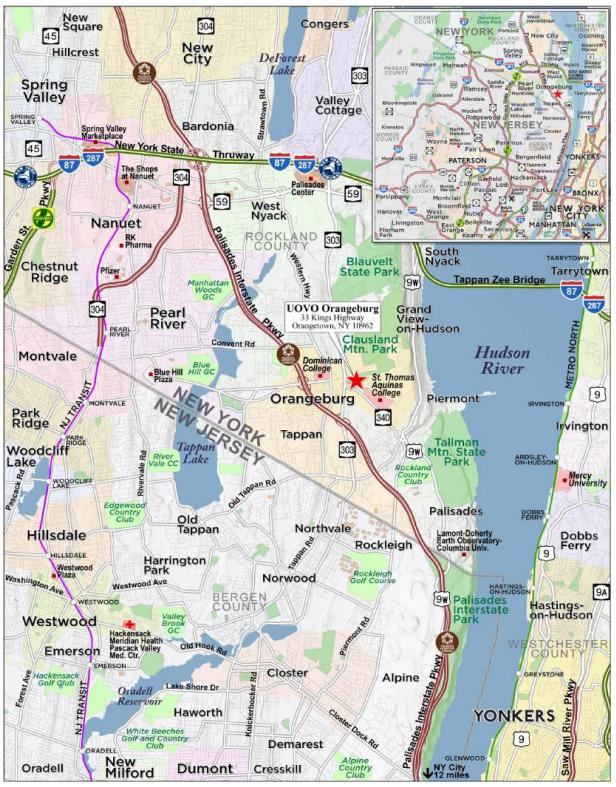
| THE INFORMATION IN THIS STRUCTURAL AND COLLATERAL TERM SHEET IS NOT COMPLETE AND MAY BE AMENDED PRIOR TO THE TIME OF SALE. THIS TERM SHEET IS NOT AN OFFER TO SELL THESE SECURITIES AND IT IS NOT A SOLICITATION OF AN OFFER TO BUY THESE SECURITIES IN ANY JURISDICTION WHERE THE OFFER OR SALE IS NOT PERMITTED. |
| | 82 | |
| Structural and Collateral Term Sheet | | BMO 2025-C11 |
| No. 9 – UOVO Orangeburg |
| Mortgage Loan Information | | Property Information |
| Mortgage Loan Sellers: | BMO, GACC | | Single Asset / Portfolio: | Single Asset |
| Original Principal Balance: | $35,000,000 | | Title: | Fee |
| Cut-off Date Principal Balance: | $35,000,000 | | Property Type - Subtype: | Self-Storage – Self-Storage |
| % of IPB: | 3.9% | | Net Rentable Area (SF): | 102,446 |
| Loan Purpose: | Refinance | | Location: | Orangetown, NY |
| Borrower: | UOVO Kings Hwy LLC | | Year Built / Renovated: | 1972 / 2014 |
| Borrower Sponsor(1): | Steven J. Guttman | | Occupancy(3): | 93.3% |
| Interest Rate: | 6.48500% | | Occupancy Date: | 10/31/2024 |
| Note Date: | 1/22/2025 | | 4th Most Recent NOI (As of): | $2,126,168 (12/31/2021) |
| Maturity Date: | 2/6/2035 | | 3rd Most Recent NOI (As of): | $2,409,769 (12/31/2022) |
| Interest-only Period: | 120 months | | 2nd Most Recent NOI (As of): | $2,402,718 (12/31/2023) |
| Original Term: | 120 months | | Most Recent NOI (As of): | $2,830,388 (TTM 9/30/2024) |
| Original Amortization Term: | None | | UW Economic Occupancy: | 76.8% |
| Amortization Type: | Interest Only | | UW Revenues: | $4,876,598 |
| Call Protection: | L(24),DorYM1(89),O(7) | | UW Expenses: | $1,019,246 |
| Lockbox / Cash Management: | Soft / Springing | | UW NOI(4): | $3,857,352 |
| Additional Debt: | No | | UW NCF: | $3,841,986 |
| Additional Debt Balance: | NAP | | Appraised Value / Per SF: | $58,800,000 / $574 |
| Additional Debt Type: | NAP | | Appraisal Date: | 12/16/2024 |
| | | | | |
| Escrows and Reserves(2) | | Financial Information |
| | Initial | Monthly | Initial Cap | | Cut-off Date Loan / SF: | $342 |
| Taxes: | $84,311 | $28,104 | N/A | | Maturity Date Loan / SF: | $342 |
| Insurance: | $0 | Springing | N/A | | Cut-off Date LTV: | 59.5% |
| Replacement Reserve: | $0 | Springing | N/A | | Maturity Date LTV: | 59.5% |
| Immediate Repairs Reserve: | $7,150 | $0 | N/A | | UW NCF DSCR: | 1.67x |
| | | | | | UW NOI Debt Yield: | 11.0% |
| | | | | | | |
| Sources and Uses |
| Sources | Proceeds | % of Total | | Uses | Proceeds | % of Total |
| Whole Loan | $35,000,000 | 100.0% | | Return of Equity | $20,845,068 | 59.6 | % |
| | | | | Loan Payoff | 13,192,869 | 37.7 | |
| | | | | Closing Costs | 870,601 | 2.5 | |
| | | | | Upfront Reserves | 91,461 | 0.3 | |
| Total Sources | $35,000,000 | 100.0% | | Total Uses | $35,000,000 | 100.0 | % |
| (1) | The borrower sponsor is also the borrower sponsor of the UOVO QPN Whole Loan, which is also being contributed to the BMO 2025-C11 transaction. |
| (2) | See “Escrows and Reserves” below for further discussion of reserve information. |
| (3) | Occupancy represents the occupancy percentage for the private storage space (measured in square feet). The managed storage space is measured in cubic feet and is 70.6% leased as of October 31, 2024. See “The Property” below for further discussion of the property type. |
| (4) | The UW NOI is 37% higher than the Most Recent NOI due to the new 10-year Metropolitan Museum of Art lease for 20,500 square feet of private storage space that commenced in May 2024. |
The Loan. The ninth largest mortgage loan (the “UOVO Orangeburg Mortgage Loan”) is evidenced by two pari passu promissory notes in the original principal amount of $35,000,000 and secured by the borrower’s fee simple interest in a 102,446 square foot self-storage property located in Orangetown, New York (the “UOVO Orangeburg Property”). The UOVO Orangeburg Mortgage Loan has a 10-year term and is interest-only for the entire term accruing interest at a rate of 6.48500% per annum on an Actual/360 basis. The UOVO Orangeburg Mortgage Loan was originated on January 22, 2025, by Bank of Montreal (“BMO”). On January 22, 2025, BMO sold the related Note A-2, with an aggregate original principal balance and Cut-off Date Balance of $12,500,000, to Deutsche Bank AG, New York Branch (“GACC”). The scheduled maturity date of the UOVO Orangeburg Mortgage Loan is the payment date in February 2035.
| THE INFORMATION IN THIS STRUCTURAL AND COLLATERAL TERM SHEET IS NOT COMPLETE AND MAY BE AMENDED PRIOR TO THE TIME OF SALE. THIS TERM SHEET IS NOT AN OFFER TO SELL THESE SECURITIES AND IT IS NOT A SOLICITATION OF AN OFFER TO BUY THESE SECURITIES IN ANY JURISDICTION WHERE THE OFFER OR SALE IS NOT PERMITTED. |
| | 83 | |
| Structural and Collateral Term Sheet | | BMO 2025-C11 |
| No. 9 – UOVO Orangeburg |
The Property. The UOVO Orangeburg Property is a 94,980 square foot one story managed/concierge storage building located in Orangetown, New York. The UOVO Orangeburg Property was developed in 1972, converted to storage in 2014, and is situated on a 12.78-acre site. The UOVO Orangeburg Property is specially renovated for fine art storage and contains two storage components: private storage (23,560 square feet with 8 storage units), and managed/concierge storage (52,394 square feet with 226 units). The UOVO Orangeburg Property features 25-foot clear heights, five enclosed loading docks, and one viewing room.
Private Storage. According to the appraisal, the private storage (“Private Storage”) is similar to traditional self-storage and ideal for clients who prefer direct and frequent access to their works. Private storage includes individual locks, roll-up doors and 8- to 10-foot clear heights. Private storage space can be leased at a minimum of 50 square feet. According to the appraisal, private storage is tailored to each specific client’s needs as they partner with an in-house designer to configure a customized plan with racking, lighting, flooring, and climate conditions best suited to their collection.
Managed Storage. According to the appraisal, the managed space (‘Managed Storage”) functions on open-air racks within a fully controlled environment in terms of climate, temperature, humidity and UV filtration lighting. Managed storage is considered a more cost-effective option for clients with fluctuating inventory or temporary storage needs and is exclusively accessed and managed by an expert technical team and tracked using digital inventory. The Managed Storage space is leased by cubic feet as it consists of an open storage area optimized for large and small pieces of artwork.
The following table presents certain information relating to the Private Storage at the UOVO Orangeburg Property:
| Private Storage Unit Mix(1) |
| Unit Type | Net Rentable Area (SF) | % of Net Rentable Area (SF) | Occupied SF | Occupancy % (SF) | # of Units | % of Total Units | Occupied Units | Avg. Actual Rent Per SF(2) | Market Rent Per SF(3) |
| Private Storage | 23,560 | 28.2% | 21,980 | 93.3% | 8 | 3.4% | 3 | $60.26 | $54.00 - $102.00 |
| (1) | Based on the underwritten rent roll dated October 31, 2024. |
| (2) | Avg. Actual Rent Per SF is calculated using actual rent for occupied square feet and market rent for vacant square feet. |
The following table presents certain information relating to the Managed Storage at the UOVO Orangeburg Property:
| Managed Storage Unit Mix(1) |
| Unit Type | Net Rentable Area (CF) | % of Net Rentable Area (CF) | Occupied CF | Occupancy % (CF) | # of Units | % of Total Units | Occupied Units | Avg. Actual Rent Per CF(2) | Market Rent Per CF(3) |
| Managed Storage | 306,743 | 71.8% | 216,707 | 70.6% | 226 | 96.6% | 225 | $15.57 | $16.20 - $38.40 |
| (1) | Based on the underwritten rent roll dated October 31, 2024. |
| (2) | Avg. Actual Rent Per CF is calculated using actual rent for occupied cubic feet and market rent for vacant cubic feet. |
The following table presents certain information relating to the historical and current occupancy of the UOVO Orangeburg Property:
| Historical and Current Occupancy(1)(2) |
| 2021 | 2022 | 2023 | Current(3) |
| 68.3% | 64.1% | 63.2% | 93.3% |
| (1) | Historical occupancies represent the annual average occupancy of each respective year. |
| (2) | Occupancy represents the occupancy percentage for the private storage space (measured in square feet). The managed storage space is measured in cubic feet and is 70.6% leased as of October 31, 2024. |
| (3) | Based on the underwritten rent roll dated October 31, 2024. |
| THE INFORMATION IN THIS STRUCTURAL AND COLLATERAL TERM SHEET IS NOT COMPLETE AND MAY BE AMENDED PRIOR TO THE TIME OF SALE. THIS TERM SHEET IS NOT AN OFFER TO SELL THESE SECURITIES AND IT IS NOT A SOLICITATION OF AN OFFER TO BUY THESE SECURITIES IN ANY JURISDICTION WHERE THE OFFER OR SALE IS NOT PERMITTED. |
| | 84 | |
| Structural and Collateral Term Sheet | | BMO 2025-C11 |
| No. 9 – UOVO Orangeburg |
Appraisal. According to the appraisal as of December 16, 2024, and the appraisal dated January 9, 2025, the UOVO Orangeburg Property had an “as-is” appraised value of $58,800,000.
| Appraisal Valuation Summary(1) |
| Property | As Is Value | Capitalization Rate |
| UOVO Orangeburg | $58,800,000 | 6.25% |
Environmental Matters. According to the Phase I environmental site assessment dated December 31, 2024, there was no evidence of any recognized environmental conditions at the UOVO Orangeburg Property.
The following table presents certain information relating to the historical operating performance and underwritten net cash flow at the UOVO Orangeburg Property:
| Operating History and Underwritten Net Cash Flow |
| | 2021 | 2022 | 2023 | 9/30/2024 TTM | Underwritten | Underwritten Per SF | %(1) |
| In-Place Rent (Private) | $95,528 | $94,798 | $99,211 | $602,339 | $1,285,992 | $12.55 | 20.3 | % |
| In-Place Rent (Managed) | 2,985,180 | 3,339,217 | 3,386,788 | 3,237,011 | 3,374,245 | 32.94 | 53.2 | |
| Discount Units (Private) | 0 | 0 | 0 | 0 | 0 | 0 | 0.0 | |
| Discount Units (Managed) | (31,755) | (36,284) | (5,554) | 0 | 0 | 0 | 0.0 | |
| Contractual Rent Steps | 0 | 0 | 0 | 0 | 38,436 | 0.38 | 0.6 | |
| Vacancy Lease-Up (Private) | 0 | 0 | 0 | 0 | 71,100 | 0.69 | 1.1 | |
| Vacancy Lease-Up (Managed) | 0 | 0 | 0 | 0 | 1,401,913 | 13.68 | 22.1 | |
| Expense Recoveries | 0 | 0 | 0 | 69,167 | 166,000 | 1.62 | 2.6 | |
| Gross Potential Rent(2) | $3,048,953 | $3,397,731 | $3,480,445 | $3,908,516 | $6,337,686 | $61.86 | 100.0 | % |
| | | | | | | | |
| Viewing Room Rent | $33,250 | $24,083 | $27,740 | $11,925 | $11,925 | $0.12 | 0.2 | |
| Construction Management Fees | 0 | 0 | 0 | 8,750 | 0 | 0 | 0.0 | |
| Fortress Payments | (39,545) | (18,652) | (10,772) | (5,046) | 0 | 0 | 0.0 | |
| Parking Income | 45,005 | 0 | 0 | 0 | 0 | 0 | 0.0 | |
| Total Other Income | $38,710 | $5,431 | $16,968 | $15,629 | $11,925 | $0.12 | 0.2 | % |
| | | | | | | | |
| In-Place Vacancy (Private) | 0 | 0 | 0 | 0 | ($71,100) | ($0.69) | (1.1 | ) |
| In-Place Vacancy (Managed) | 0 | 0 | 0 | 0 | (1,401,913) | (13.68) | (22.1 | ) |
| Effective Gross Income | $3,087,664 | $3,403,162 | $3,497,413 | $3,924,145 | $4,876,598 | $47.60 | 76.9 | % |
| | | | | | | | |
| Real Estate Taxes | $299,038 | $306,108 | $318,647 | $321,641 | $321,186 | $3.14 | 6.6 | |
| Insurance | 48,280 | 66,778 | 63,140 | 68,725 | 76,602 | 0.75 | 1.6 | |
| Other Expenses | 614,178 | 620,506 | 712,908 | 703,391 | 621,457 | 6.07 | 12.7 | |
| Total Expenses | $961,496 | $993,393 | $1,094,695 | $1,093,757 | $1,019,246 | $9.95 | 20. | 9% |
| | | | | | | | |
| Net Operating Income(3) | $2,126,168 | $2,409,769 | $2,402,718 | $2,830,388 | $3,857,352 | $37.65 | 79.1 | % |
| Replacement Reserves | 0 | 0 | 0 | 0 | $15,367 | 0.15 | 0.3 | |
| Net Cash Flow | $2,126,168 | $2,409,769 | $2,402,718 | $2,830,388 | $3,841,986 | $37.50 | 78.8 | % |
| (1) | % column represents percent of Gross Potential Rent for all revenue lines and represents percent of Effective Gross Income for the remainder of fields |
| (2) | UW Gross Potential Rent is based on the underwritten rent roll dated October 31, 2024. |
| (3) | The UW NOI is 37% higher than the Most Recent NOI due to the new 10-year Metropolitan Museum of Art lease for 20,500 square feet of private storage space that commenced in May 2024. |
| THE INFORMATION IN THIS STRUCTURAL AND COLLATERAL TERM SHEET IS NOT COMPLETE AND MAY BE AMENDED PRIOR TO THE TIME OF SALE. THIS TERM SHEET IS NOT AN OFFER TO SELL THESE SECURITIES AND IT IS NOT A SOLICITATION OF AN OFFER TO BUY THESE SECURITIES IN ANY JURISDICTION WHERE THE OFFER OR SALE IS NOT PERMITTED. |
| | 85 | |
| Structural and Collateral Term Sheet | | BMO 2025-C11 |
| No. 9 – UOVO Orangeburg |
The Market. The UOVO Orangeburg Property is located in Orangetown, Rockland County, New York. Orangetown is a 31.4 square mile rural and suburban town located approximately 20 miles northwest of Manhattan via the George Washington Bridge. Orangetown is located in the southeastern part of Rockland County with access to U.S Route 9W, Interstate 287/87, Palisades Parkway, Garden State Parkway, and NYS Route 303. The nearest commuter rail stations to New York City are in Pearl River and Nanuet, which are serviced by New Jersey Transit and provide rail service into Manhattan via the PATH station in Hoboken. Additionally, commuter buses provide access around Rockland County, Westchester County, New Jersey, and New York City. Orangetown has access to the Westchester County Airport as well as the Orange County Airport, and Newark Liberty Airport is an hour and a half away. According to the appraisal, as of 2024, 146,416 people live within 5 miles of the UOVO Orangeburg Property, with a median household income of $144,199. The UOVO Orangeburg Property is located in the New York-Newark-Jersey City, NY-NJ-PA Metropolitan Statistical Area which has a population of 20,181,143 and a median household income of $87,926 as of 2023.
According to the appraisal, the national art industry revenue is expected to have grown at a CAGR of 0.9% to $13.1 billion over the last 5 years up through 2024. The national art industry is expected to grow at a CAGR of 2.3% to $15.5 billion by the end of 2029. Additionally, the major concentrations of art dealership establishments in the U.S are in California, Florida, and New York with New York being home to 14.1% of establishments in the country.
The following table presents information regarding certain competitive properties to the UOVO Orangeburg Property:
| Competitive Properties Summary(1) |
| Property Name/Location | Year Built / Renovated | Private Occupancy(2) | Square Feet (Private) | Managed Occupancy(2) | Cubic Feet (Managed) | Unit Type | Actual ($/SF) | Actual ($/CF) | Rent Per Annum (SF/CF) |
UOVO Orangeburg 33 Kings Highway Orangetown, NY | 1972 / 2014 | 93.3% | 23,560 | 70.6% | 306,743 | Private Storage Managed Storage | $5.02 | $1.30 | $60.26 $15.57 |
105 Evergreen Ave Brooklyn, NY | 1955 / 2019 | 86.0% | 48,145 | 58.0% | 330,000 | Private Storage Managed Storage | $8.22 | $1.60 | $98.64 $19.20 |
4200 Westgate Avenue Westgate, FL | 2023 / NAP (Lease-Up) | 41.0% | 9,765 | 9.0% | 177,000 | Private Storage Managed Storage | $6.77 | $2.25 | $81.24 $27.00 |
346 NW 29th Street Miami, FL | 2008 / NAP | 89.0% | 55,063 | 70.0% | 42,670 | Private Storage Managed Storage | $5.91 | $2.94 | $70.92 $35.28 |
1333 Lowrie Ave South San Francisco, CA | 2022 / NAP | N/A | N/A | 68.0% | 177,222 | Private Storage Managed Storage | N/A | $1.93 | N/A $23.16 |
101 Lake Drive Newark, DE | 1986 / NAP | 53.0% | 7,675 | 24.0% | 238,000 | Private Storage Managed Storage | $4.92 | $1.06 | $59.04 $12.72 |
16358 E 33rd Drive Aurora, CO | 1996 / NAP | 100.0% | 7,915 | 42.0% | 100,000 | Private Storage Managed Storage | $2.82 | $1.82 | $33.84 $21.84 |
401 Aspen Airport Business Ctr Aspen, CO | 1971 / NAP | N/A | N/A | 64.0% | 7,000 | Private Storage Managed Storage | N/A | $3.63 | N/A $43.56 |
| (2) | Based on the underwritten rent roll dated October 31, 2024. |
| THE INFORMATION IN THIS STRUCTURAL AND COLLATERAL TERM SHEET IS NOT COMPLETE AND MAY BE AMENDED PRIOR TO THE TIME OF SALE. THIS TERM SHEET IS NOT AN OFFER TO SELL THESE SECURITIES AND IT IS NOT A SOLICITATION OF AN OFFER TO BUY THESE SECURITIES IN ANY JURISDICTION WHERE THE OFFER OR SALE IS NOT PERMITTED. |
| | 86 | |
| Structural and Collateral Term Sheet | | BMO 2025-C11 |
| No. 9 – UOVO Orangeburg |
The Borrower. The borrower is UOVO Orangeburg Hwy LLC, a Delaware limited liability company and single purpose entity with two independent directors in its organizational structure. Legal counsel to the borrower delivered a non-consolidation opinion in connection with the origination of the UOVO Orangeburg Mortgage Loan.
The Borrower Sponsor. The borrower sponsor and the non-recourse carveout guarantor is Steven J. Guttman. Steven J. Guttman is the founder of Storage Deluxe Management Company, a self-storage developer in the New York City metropolitan area. The company has 84 projects completed and in development, totaling 8 million SF for a total investment in excess of $2.5 billion. Mr. Guttman is also an avid art collector and founded Storage Deluxe affiliate UOVO Fine Art Storage in 2014. Such affiliate was designed for the sole purpose of safe-guarding collections. UOVO’s privately-owned, state-of-the-art facilities are ideal for the long-term preservation and care of art, fashion, wine, archives, cultural artifacts, and rare objects. UOVO has art storage facilities (inclusive of the UOVO Orangeburg Property) in major markets such as Los Angeles, Orange County, San Francisco, Aspen, Denver, Delaware, Miami, West Palm Beach, Brooklyn, Long Island City, Rockland County and Dallas Texas.
Property Management. The UOVO Orangeburg Property is managed by UOVO Management LLC, a borrower affiliated property management company.
Escrows and Reserves. At origination, the borrower deposited into escrow (i) approximately $84,311 for real estate taxes and (ii) $7,150 for deferred maintenance.
Tax Escrows. On a monthly basis, the borrower is required to escrow 1/12th of the annual estimated tax payments, which currently equates to approximately $28,104.
Insurance Escrows. If there is no approved blanket policy in place, the borrower is required to escrow 1/12th of the annual estimated insurance payments on a monthly basis. The UOVO Orangeburg Property is currently insured under a blanket insurance policy.
Replacement Reserve. On a monthly basis during a Trigger Event (as defined below), the borrower is required to deposit approximately $1,281 for replacement reserves.
Lockbox / Cash Management. The UOVO Orangeburg Mortgage Loan is structured with a soft lockbox and springing cash management. The borrower is required to establish a lockbox account for the benefit of the lender, into which all rents and other revenue from the UOVO Orangeburg Property are required to be deposited by the borrower. During a Trigger Event, all funds in the lockbox account are required to be transferred to the lender-controlled cash management account on each business day and disbursed in accordance with the UOVO Orangeburg Whole Loan documents. Also, during a Trigger Event, all excess cash is required to be collected by the lender and held as additional security for the UOVO Orangeburg Mortgage Loan.
A “Trigger Event” will commence upon the earliest of (i) the occurrence of an event of default under the UOVO Orangeburg Mortgage Loan documents or (ii) the debt yield being less than 10.0%, and will expire upon (a) with respect to clause (i) above, the event of default has been cured or (b) with respect to clause (ii) above, the debt yield being at least 10.0% for two consecutive calendar quarters.
Subordinate and Mezzanine Debt. None.
Permitted Future Subordinate or Mezzanine Debt. Not permitted.
Partial Release. Not permitted.
Ground Lease. None.
| THE INFORMATION IN THIS STRUCTURAL AND COLLATERAL TERM SHEET IS NOT COMPLETE AND MAY BE AMENDED PRIOR TO THE TIME OF SALE. THIS TERM SHEET IS NOT AN OFFER TO SELL THESE SECURITIES AND IT IS NOT A SOLICITATION OF AN OFFER TO BUY THESE SECURITIES IN ANY JURISDICTION WHERE THE OFFER OR SALE IS NOT PERMITTED. |
| | 87 | |
| Structural and Collateral Term Sheet | | BMO 2025-C11 |
| No. 10 – 2481 Crotona Avenue |

| THE INFORMATION IN THIS STRUCTURAL AND COLLATERAL TERM SHEET IS NOT COMPLETE AND MAY BE AMENDED PRIOR TO THE TIME OF SALE. THIS TERM SHEET IS NOT AN OFFER TO SELL THESE SECURITIES AND IT IS NOT A SOLICITATION OF AN OFFER TO BUY THESE SECURITIES IN ANY JURISDICTION WHERE THE OFFER OR SALE IS NOT PERMITTED. |
| | 88 | |
| Structural and Collateral Term Sheet | | BMO 2025-C11 |
| No. 10 – 2481 Crotona Avenue |

| THE INFORMATION IN THIS STRUCTURAL AND COLLATERAL TERM SHEET IS NOT COMPLETE AND MAY BE AMENDED PRIOR TO THE TIME OF SALE. THIS TERM SHEET IS NOT AN OFFER TO SELL THESE SECURITIES AND IT IS NOT A SOLICITATION OF AN OFFER TO BUY THESE SECURITIES IN ANY JURISDICTION WHERE THE OFFER OR SALE IS NOT PERMITTED. |
| | 89 | |
| Structural and Collateral Term Sheet | | BMO 2025-C11 |
| No. 10 – 2481 Crotona Avenue |
| Mortgage Loan Information | | Property Information |
| Mortgage Loan Seller: | SMC | | Single Asset / Portfolio: | Single Asset |
| Original Principal Balance: | $33,250,000 | | Title: | Fee |
| Cut-off Date Principal Balance: | $33,250,000 | | Property Type - Subtype: | Multifamily – High-Rise |
| % of IPB: | 3.7% | | Net Rentable Area (Units)(1): | 90 |
| Loan Purpose: | Refinance | | Location: | Bronx, NY |
| Borrower: | RVMIM LLC | | Year Built / Renovated: | 2023 / NAP |
| Borrower Sponsors: | Martin Joseph, Rakesh Kumar and Vijay Gogia | | Occupancy(1): | 98.9% |
| Interest Rate: | 6.64000% | | Occupancy Date: | 1/22/2025 |
| Note Date: | 1/31/2025 | | 4th Most Recent NOI (As of)(2): | NAV |
| Maturity Date: | 2/6/2035 | | 3rd Most Recent NOI (As of)(2): | NAV |
| Interest-only Period: | 36 months | | 2nd Most Recent NOI (As of)(2): | NAV |
| Original Term: | 120 months | | Most Recent NOI (As of)(2): | NAV |
| Original Amortization Term: | 360 months | | UW Economic Occupancy: | 96.7% |
| Amortization Type: | Interest Only, Amortizing Balloon | | UW Revenues: | $3,964,145 |
| Call Protection: | L(24),D(92),O(4) | | UW Expenses: | $726,040 |
| Lockbox / Cash Management: | Springing / Springing | | UW NOI: | $3,238,105 |
| Additional Debt: | No | | UW NCF: | $3,201,952 |
| Additional Debt Balance: | NAP | | Appraised Value / Per Unit: | $56,100,000 / $623,333 |
| Additional Debt Type: | NAP | | Appraisal Date: | 1/15/2025 |
| | | | | |
| Escrows and Reserves(3) | | Financial Information |
| | Initial | Monthly | Initial Cap | | Cut-off Date Loan / Unit: | $369,444 |
| Taxes: | $133,400 | $66,700 | N/A | | Maturity Date Loan / Unit: | $337,851 |
| Insurance: | $166,730 | $13,894 | N/A | | Cut-off Date LTV: | 59.3% |
| Replacement Reserves: | $0 | $2,065 | N/A | | Maturity Date LTV: | 54.2% |
| TI / LC: | $0 | $948 | N/A | | UW NCF DSCR: | 1.25x |
| Deferred Maintenance: | $10,500 | $0 | N/A | | UW NOI Debt Yield: | 9.7% |
| 421-a Reserve: | $400,000 | $0 | N/A | | | |
| Commercial Rent Reserve: | $108,000 | $0 | N/A | | | |
| ICAP Reserve: | $100,000 | $0 | N/A | | | |
| | | | | | | |
| Sources and Uses |
| Sources | Proceeds | % of Total | | Uses | Proceeds | % of Total |
| Mortgage Loan | $33,250,000 | 100.0% | | Payoff Existing Debt | $27,994,447 | 84.2 | % |
| | | | | Return of Equity | 3,423,457 | 10.3 | |
| | | | | Upfront Reserves | 918,630 | 2.8 | |
| | | | | Closing Costs(4) | 913,467 | 2.7 | |
| Total Sources | $33,250,000 | 100.0% | | Total Uses | $33,250,000 | 100.0 | % |
| (1) | The 2481 Crotona Avenue Property (as defined below) is comprised of (i) 90 multifamily units, (ii) 11,377 square feet of ground floor commercial space leased to four separate tenants and (iii) 38 parking spaces leased to a third-party operator. The Occupancy reflected above represents the occupancy of the 90 multifamily units as of January 22, 2025. Little Heroes Childcare Center (2,400 square feet; $108,000 of underwritten base rent) has taken possession of its space and commenced paying rent, but is not yet open for business. At origination, the borrower escrowed $108,000 related to the Little Heroes Childcare Center space until such time that the tenant is in occupancy, open for business and paying rent, and the debt service coverage ratio (“DSCR”) being at least 1.25x. Additionally, Martin Joseph, Rakesh Kumar and Vijay Gogia entered into a master lease for the Little Heroes Childcare Center space (the “Master Lease”). At any time, the Master Lease may be terminated upon (i) the lender’s receipt of a clean estoppel, (ii) evidence that the tenant is fully open for business and (iii) the DSCR being at least 1.25x. |
| (2) | Historical financial information is not available as the 2481 Crotona Avenue Property was built in 2023 and recently completed lease-up. |
| (3) | For a full description of Escrows and Reserves, please refer to “Escrows and Reserves” below. |
| (4) | Closing Costs include an interest rate buy-down credit of $146,250. |
| THE INFORMATION IN THIS STRUCTURAL AND COLLATERAL TERM SHEET IS NOT COMPLETE AND MAY BE AMENDED PRIOR TO THE TIME OF SALE. THIS TERM SHEET IS NOT AN OFFER TO SELL THESE SECURITIES AND IT IS NOT A SOLICITATION OF AN OFFER TO BUY THESE SECURITIES IN ANY JURISDICTION WHERE THE OFFER OR SALE IS NOT PERMITTED. |
| | 90 | |
| Structural and Collateral Term Sheet | | BMO 2025-C11 |
| No. 10 – 2481 Crotona Avenue |
The Loan. The tenth largest mortgage loan (the “2481 Crotona Avenue Mortgage Loan”) is secured by the borrower’s fee interest in a recently developed high-rise multifamily property located in the Bronx, New York (the “2481 Crotona Avenue Property”). The 2481 Crotona Avenue Mortgage Loan was originated on January 31, 2025 by Starwood Mortgage Capital LLC. The 2481 Crotona Avenue Mortgage Loan has an outstanding principal balance as of the Cut-off date of $33,250,000, has a ten-year term and, following a 36-month interest-only period, amortizes on a 30-year schedule and accrues interest at a rate of 6.64000% per annum on an Actual/360 basis. The scheduled maturity date of the 2481 Crotona Avenue Mortgage Loan is February 6, 2035.
The Property. The 2481 Crotona Avenue Property is a 90-unit, nine-story multifamily property, located at 2481 Crotona Avenue in the Belmont neighborhood of the Bronx, New York. The 2481 Crotona Avenue Property was recently developed by the borrower sponsors and features a mix of studios, one- and two-bedroom residential units. All units feature new construction finishes. Shared amenities include bike storage and laundry room. There is 11,377 square feet of commercial space that is currently 100% leased by four commercial tenants. Additionally, the parking garage offers 38 parking spaces and is leased to BK Parking Group Inc. through February 2034. The initial rent under the parking lease is $108,000 per annum. The borrower sponsors cost basis, inclusive of closing costs incurred with the origination of the 2481 Crotona Avenue Mortgage Loan, is equal to approximately $41.4 million.
The 2481 Crotona Avenue Property has a condominium structure with three condominium units, whereby the residential component is one condominium unit and the commercial component is two condominium units. The parking garage is included within the residential condominium unit. The condominium ownership structure allows the 2481 Crotona Avenue Property to receive an ICAP tax abatement in addition to the 421-a tax exemption.
Regarding the residential component of the 2481 Crotona Avenue Property, the borrower has applied for a 35-year 421-a tax abatement under the NYC Department of Housing Preservation & Development’s 421-a tax exemption program. In connection with the 421-a tax exemption, the borrower will be required to reserve at least 98.89% of the units (which is equal to 89 units) at the 2481 Crotona Avenue Mortgaged Property subject to certain rental restrictions (74 units for tenants earning no more than 130% of the area median income and 15 units for tenants earning no more than 80% of the area median income). The 421-a tax exemption provides (i) a 100% tax exemption for the first 25 years and (ii) a 98.89% tax exemption for years 26 through 35 with full taxes commencing at the end of the 35th applicable tax year. The 421-a tax exemption is pending and the exemption period has not yet started.
The 2481 Crotona Avenue Mortgage Loan will be fully recourse to the borrower and the guarantors until such time that the 421-a tax exemption has been approved and is in place at the 2481 Crotona Avenue Property, and the DSCR (based on trailing income for the period from origination until the date the borrower requests release of the 421-a reserve, annualized and underwritten expenses) is greater than or equal to 1.25x. Additionally, if at any time the borrower fails to maintain the 421-a tax exemption, the 2481 Crotona Avenue Mortgage Loan will become fully recourse to the borrower and the guarantors.
Additionally, the borrower has applied for a 15-year ICAP tax exemption under the New York City Department of Finance ICAP tax exemption program. The ICAP tax exemption is pending and the abatement period has not yet started. With regard to both the 421-a tax abatement and the ICAP tax exemption, the estimated full unabated taxes for the 2024/2025 tax year are $812,471 compared to the underwritten abated taxes of $30,886.
The 2481 Crotona Avenue Mortgage Loan will be fully recourse to the borrower and the guarantors until such time that the ICAP tax exemption has been approved and is in place at the 2481 Crotona Avenue Property and the DSCR (based on trailing income for the period from origination until the date the borrower requests release of the ICAP reserve, annualized and underwritten expenses) is greater than or equal to 1.25x. Additionally, if at any time the borrower fails to maintain the ICAP tax exemption, the 2481 Crotona Avenue Mortgage Loan will become fully recourse to the borrower and the guarantors.
| THE INFORMATION IN THIS STRUCTURAL AND COLLATERAL TERM SHEET IS NOT COMPLETE AND MAY BE AMENDED PRIOR TO THE TIME OF SALE. THIS TERM SHEET IS NOT AN OFFER TO SELL THESE SECURITIES AND IT IS NOT A SOLICITATION OF AN OFFER TO BUY THESE SECURITIES IN ANY JURISDICTION WHERE THE OFFER OR SALE IS NOT PERMITTED. |
| | 91 | |
| Structural and Collateral Term Sheet | | BMO 2025-C11 |
| No. 10 – 2481 Crotona Avenue |
The following table presents certain information with respect to the units at the 2481 Crotona Avenue Property:
| 2481 Crotona Avenue Unit Summary |
| Unit Type | No. of Units(1) | % of Total | Occupied Collateral Units(1) | % of Units Occupied | Average Unit Size (SF)(1) | Monthly Market Rental Rate(2) | Monthly Market Rental Rate per SF(2) | Average Monthly Market Rental Rate(1)(3) | Average Monthly Market Rental Rate per SF(1)(3) |
| Studio – 80% AMI | 1 | 1.1 | % | 1 | 100. | % | 403 | $2,624 | $6.51 | $1,869 | $4.64 |
| Studio – 130% AMI | 18 | 20.0 | | 17 | 94.4 | | 345 | $2,624 | $7.61 | $3,105 | $8.97 |
| Studio – FM | 1 | 1.1 | | 1 | 100.0 | | 350 | $2,624 | $7.50 | $3,150 | $9.00 |
| 1 BR / 1BA – 80% AMI | 11 | 12.2 | | 11 | 100.0 | | 579 | $2,696 | $4.66 | $1,993 | $3.44 |
| 1 BR / 1BA – 130% AMI | 45 | 50.0 | | 45 | 100.0 | | 476 | $2,696 | $5.67 | $3,317 | $6.97 |
| 2 BR / 1BA – 80% AMI | 3 | 3.3 | | 3 | 100.0 | | 776 | $3,027 | $3.90 | $2,375 | $3.06 |
| 2 BR / 1BA – 130% AMI | 11 | 12.2 | | 11 | 100.0 | | 692 | $3,027 | $4.37 | $3,963 | $5.72 |
| Total/Wtd. Avg. | 90 | 100.0 | % | 89 | 98.9 | % | 496 | $2,731 | $5.50 | $3,142 | $6.33 |
| (1) | Based on the borrower rent roll dated January 22, 2025. |
The following table presents certain information with respect to the historical and current occupancy of the 2481 Crotona Avenue Property:
| Historical and Current Occupancy(1) |
| 2021 | 2022 | 2023 | Current(2) |
| NAV | NAV | NAV | 98.9% |
| (1) | Historical occupancy is not available as the 2481 Crotona Avenue Property was built in 2023. |
| (2) | Current Occupancy is as of January 22, 2025. |
Environmental. According to a Phase I environmental assessment dated December 11, 2024, there was no evidence of any recognized environmental conditions at the 2481 Crotona Avenue Property. The Phase I environmental assessment identified a CREC related to prior operations as a parking lot with hydraulic vehicle lifts on the site of the 2481 Crotona Avenue Property. See “Descriptions of the Mortgage Pool – Environmental Considerations" in the Preliminary Prospectus.
The Market. The 2481 Crotona Avenue Property is located in the Bronx, New York. According to the appraisal, the 2481 Crotona Avenue Property is located in the Bronx County Apartment submarket. According to the appraisal, the Bronx County Apartment submarket has a vacancy rate of approximately 3.5% and average asking rents of $2,220 per unit as of the third quarter of 2024. Within the zip code of the 2481 Crotona Avenue Property, the estimated 2024 population is 79,439. Within the same zip code, the estimated 2024 average annual household income is $57,624.
| THE INFORMATION IN THIS STRUCTURAL AND COLLATERAL TERM SHEET IS NOT COMPLETE AND MAY BE AMENDED PRIOR TO THE TIME OF SALE. THIS TERM SHEET IS NOT AN OFFER TO SELL THESE SECURITIES AND IT IS NOT A SOLICITATION OF AN OFFER TO BUY THESE SECURITIES IN ANY JURISDICTION WHERE THE OFFER OR SALE IS NOT PERMITTED. |
| | 92 | |
| Structural and Collateral Term Sheet | | BMO 2025-C11 |
| No. 10 – 2481 Crotona Avenue |
The following table presents certain information relating to comparable multifamily rental properties to the 2481 Crotona Avenue Property:
| Comparable Rental Summary(1) |
| Property Address | Year Built / Renovated | Occupancy | # Units | Unit Mix | Average SF per Unit | Average Rent per SF | Average Rent per Unit |
2481 Crotona Avenue(2) Bronx, NY | 2023 / NAP | 98.9% | 90 | Studio – 80% AMI Studio – 130% AMI Studio – FM 1BR / 1BA – 80% AMI 1BR / 1BA – 130% AMI 2BR / 2BA – 80% AMI 2BR / 2BA – 130% AMI | 403 345 350 579 476 776 692 | $4.64 $8.97 $9.00 $3.44 $6.97 $3.06 $5.72 | $1,869 $3,105 $3,150 $1,993 $3,317 $2,375 $3,963 |
1765 Townsend Avenue Bronx, NY | 2007 / NAP | NAV | 99 | Studio | NAV | NAV | $2,530 |
1770 Grand Concourse Bronx, NY | 1960 / 2003 | NAV | 203 | Studio 1BR / 1BA | NAV NAV | NAV NAV | $2,350 $2,599 |
2415 Arthur Avenue Bronx, NY | 2015 / NAP | NAV | 31 | Studio 1BR / 1BA 2BR / 2BA | NAV NAV NAV | NAV NAV NAV | $2,475 $2,765 $4,138 |
299 East 161st Street Bronx, NY | 2023 / NAP | NAV | 155 | Studio | NAV | NAV | $2,475 |
1981 Sedgewick Avenue Bronx, NY | 1952 / NAP | NAV | 225 | 1BR / 1BA | NAV | NAV | $2,599 |
393 Woodycrest Avenue Bronx, NY | 1928 / 2011 | NAV | 167 | 1BR / 1BA | NAV | NAV | $2,599 |
124 West 179th Street Bronx, NY | 1910 / NAP | NAV | 4 | 1BR / 1BA | NAV | NAV | $2,600 |
2321 Belmont Avenue Bronx, NY | 2022 / NAP | NAV | 65 | 2BR / 1BA | NAV | NAV | $2,917 |
2588 Creston Avenue Bronx, NY | 1917 / NAP | NAV | 24 | 2BR / 1BA | NAV | NAV | $2,600 |
930 Grand Concourse Bronx, NY | 1992 / NAP | NAV | 108 | 2BR / 1BA | NAV | NAV | $2,950 |
3050 Corlear Avenue Bronx, NY | 2009 / NAP | NAV | 63 | 2BR / 1BA | NAV | NAV | $2,708 |
| (1) | Source: Appraisal, unless otherwise indicated. Comparables reflect market rate units. |
| (2) | Based on the borrower rent roll dated January 22, 2025 or as otherwise provided by the borrower. |
| THE INFORMATION IN THIS STRUCTURAL AND COLLATERAL TERM SHEET IS NOT COMPLETE AND MAY BE AMENDED PRIOR TO THE TIME OF SALE. THIS TERM SHEET IS NOT AN OFFER TO SELL THESE SECURITIES AND IT IS NOT A SOLICITATION OF AN OFFER TO BUY THESE SECURITIES IN ANY JURISDICTION WHERE THE OFFER OR SALE IS NOT PERMITTED. |
| | 93 | |
| Structural and Collateral Term Sheet | | BMO 2025-C11 |
| No. 10 – 2481 Crotona Avenue |
The following table presents certain information with respect to the underwritten cash flows of the 2481 Crotona Avenue Property:
| Underwritten Net Cash Flow(1) |
| | Underwritten | | Per Unit | | %(2) |
| Gross Potential Rent - Residential | $3,393,780 | | $37,709 | | 83.3 | % |
| Gross Potential Rent - Commercial | 408,000 | | 4,533 | | 10.0 | |
| Gross Potential Rent | $3,801,780 | | $42,242 | | 93.3 | % |
| Utility Reimbursements | 162,864 | | 1,810 | | 4.0 | |
| Parking Income | 108,000 | | 1,200 | | 2.7 | |
| Net Rental Income | $4,072,644 | | $45,252 | | 100.0 | % |
| (Vacancy/Credit Loss) | (132,499) | | (1,472) | | (3.3 | ) |
| Other Income | 24,000 | | 267 | | 0.6 | |
| Effective Gross Income | $3,964,145 | | $44,046 | | 97.3 | % |
| | | | |
| Total Expenses | $726,040 | | $8,067 | | 18.3 | % |
| | | | |
| Net Operating Income | $3,238,105 | | $35,979 | | 81.7 | % |
| | | | |
| Replacement Reserves | 24,775 | | 275 | | 0.6 | |
| TI/LC | 11,377 | | 126 | | 0.3 | |
| Net Cash Flow | $3,201,952 | | $35,577 | | 80.8 | % |
| (1) | The 2481 Crotona Avenue Property was completed in 2023 and historical financial and occupancy information is not available. |
| (2) | % column represents percentage of Net Rental Income for all revenue lines and represents percentage of Effective Gross Income for the remaining fields. |
The Borrower. The borrower is RVMIM LLC, a New York limited liability company and special purpose entity with a Delaware limited liability company with one independent director as its managing member. Legal counsel to the borrower provided a non-consolidation opinion in connection with the origination of the 2481 Crotona Avenue Mortgage Loan.
The Borrower Sponsor. The borrower sponsor and non-recourse carve-out guarantors are Martin Joseph, Rakesh Kumar and Vijah Gogia. Mr. Joseph is a local New York City-based real estate developer and founder of Metropolitan Realty Exemptions Inc., a Brooklyn-based real estate consultancy firm. Metropolitan Realty Exemptions advises developers on ICAP, J51, 421-a and inclusionary housing projects. Metropolitan Realty Exemptions has represented clients throughout Queens, the Bronx and Brooklyn. Additionally, Mr. Joseph has interests in various multifamily developments located throughout Brooklyn and the Bronx.
Property Management. The 2481 Crotona Avenue Property is managed by MRE Property Management LLC, a third-party management company.
Escrows and Reserves. At origination, the borrower deposited into escrow approximately (i) $133,400 for real estate taxes, (ii) $166,730 for insurance premiums, (iii) $10,500 for deferred maintenance, (iv) $400,000 for a 421-a reserve, (v) $108,000 for a commercial rent reserve and (vi) $100,000 for an ICAP reserve.
Tax Escrows – On a monthly basis, the borrower is required to escrow 1/12th of the annual estimated tax payments, which currently equates to $66,700.
Insurance Escrows – On a monthly basis, the borrower is required to escrow 1/12th of the annual estimated insurance payments, which currently equates to approximately $13,894.
Replacement Reserves – On a monthly basis, the borrower is required to escrow $2,065 for replacement reserves.
TI/LC – On a monthly basis, the borrower is required to escrow $948 for tenant improvements and leasing commissions.
| THE INFORMATION IN THIS STRUCTURAL AND COLLATERAL TERM SHEET IS NOT COMPLETE AND MAY BE AMENDED PRIOR TO THE TIME OF SALE. THIS TERM SHEET IS NOT AN OFFER TO SELL THESE SECURITIES AND IT IS NOT A SOLICITATION OF AN OFFER TO BUY THESE SECURITIES IN ANY JURISDICTION WHERE THE OFFER OR SALE IS NOT PERMITTED. |
| | 94 | |
| Structural and Collateral Term Sheet | | BMO 2025-C11 |
| No. 10 – 2481 Crotona Avenue |
421-a Reserve – At origination of the 2481 Crotona Avenue Mortgage Loan, the borrower deposited $400,000 into a 421-a reserve related to the pending 421-a tax exemption. The 421-a reserve may be released upon the satisfaction of certain conditions, including, but not limited to, (i) no event of default under the 2481 Crotona Avenue Mortgage Loan then exists, (ii) the 421-a tax exemption has been approved and is in place at the 2481 Crotona Avenue Property (including, but not limited to, a final certificate of eligibility for the 2481 Crotona Avenue Property and a property tax bill reflecting the 421-a tax exemption and (iii) the DSCR (based on trailing income for the period from origination until the date the borrower requests release of the 421-a reserve, annualized and underwritten expenses) is greater than or equal to 1.25x. The 421-a reserve is held by the lender as additional collateral for the 2481 Crotona Avenue Mortgage Loan. If a 2481 Crotona Avenue Sweep Event Period (as defined below) then exists, the 421-a reserve will be deposited into the cash management account.
Commercial Rent Reserve – At origination of the 2481 Crotona Avenue Mortgage Loan, the borrower deposited $108,000 into a commercial rent reserve related to the tenant Little Heroes Childcare Center. Little Heroes Childcare Center (2,400 square feet; $108,000 of underwritten base rent) has taken possession of its space and commenced paying rent, but is not yet open for business. The commercial rent reserve may be released upon the satisfaction of certain conditions, including but not limited to, (i) no event of default under the 2481 Crotona Avenue Mortgage Loan then exists, (ii) the lender’s receipt of a clean estoppel, (iii) evidence that the tenant is fully open for business and (iv) the DSCR (based on trailing income for the period from origination until the date the borrower requests release of the ICAP reserve, annualized and underwritten expenses) is greater than or equal to 1.25x. If a 2481 Crotona Avenue Sweep Event Period (as defined below) then exists, the commercial rent reserve is deposited into the cash management account.
ICAP Reserve – At origination of the 2481 Crotona Avenue Mortgage Loan, the borrower deposited $100,000 into an ICAP reserve related to the pending ICAP tax exemption. The ICAP reserve may be released upon the satisfaction of certain conditions, including, but not limited to, (i) no event of default or 2481 Crotona Avenue Sweep Event Period under the 2481 Crotona Avenue Mortgage Loan then exists, (ii) the ICAP tax exemption has been approved and is in place at the 2481 Crotona Avenue Property (including, but not limited to, a final certificate of eligibility for the 2481 Crotona Avenue Property and a property tax bill reflecting the ICAP tax exemption and (iii) the DSCR (based on trailing income for the period from origination until the date the borrower requests release of the ICAP reserve, annualized and underwritten expenses) is greater than or equal to 1.25x. The ICAP reserve is held by the lender as additional collateral for the 2481 Crotona Avenue Mortgage Loan. If a 2481 Crotona Avenue Sweep Event Period (as defined below) then exists, the 421-a reserve is deposited into the cash management account.
Lockbox / Cash Management. The 2481 Crotona Avenue Mortgage Loan is structured with a springing lockbox and springing cash management. The 2481 Crotona Avenue Mortgage Loan requires that during the continuance of a 2481 Crotona Avenue Sweep Event Period, the borrower or property manager, as applicable, is required to establish and maintain a lockbox account for the remainder of the 2481 Crotona Avenue Mortgage Loan term. Following a 2481 Crotona Avenue Sweep Event Period, the borrower is required to direct tenants to pay all rents directly into the lockbox account. Upon the occurrence and during the continuance of an 2481 Crotona Avenue Sweep Event Period, all funds in the lockbox account are required to be swept daily to a cash management account under the control of the lender to be applied and disbursed in accordance with the 2481 Crotona Avenue Mortgage Loan documents, and all excess cash flow funds remaining in the cash management account after the application of such funds in accordance with the 2481 Crotona Avenue Mortgage Loan documents are required to be held by the lender in an excess cash flow reserve account as additional collateral for the 2481 Crotona Avenue Mortgage Loan. To the extent that no 2481 Crotona Avenue Sweep Event Period is continuing, all cash flow funds are required to be disbursed to the borrower from the lockbox account.
A “2481 Crotona Avenue Sweep Event Period” will commence upon the earliest to occur of the following: (i) the occurrence of an event of default under the 2481 Crotona Avenue Mortgage Loan documents; (ii) commencing on or after July 31, 2025, the date on which the DSCR is less than 1.15x based on the trailing 12 months; (iii) commencing on or after February 6, 2034, the date on which the debt yield (based on the trailing 12 months) is less than 10.25%; or (iv) if at any time the borrower fails to maintain the 421-a tax exemption.
A 2481 Crotona Avenue Sweep Event Period will end with regard to: (a) clause (i), upon the cure of such event of default and the lender’s acceptance of such cure in its sole and absolute discretion; (b) clause (ii), upon the DSCR based on the trailing 12-month period being at least 1.20x for two consecutive calendar quarters; or (c) clause (iv) upon the borrower re-establishing the 421-a tax exemption. There is no cure for clause (iii) above.
| THE INFORMATION IN THIS STRUCTURAL AND COLLATERAL TERM SHEET IS NOT COMPLETE AND MAY BE AMENDED PRIOR TO THE TIME OF SALE. THIS TERM SHEET IS NOT AN OFFER TO SELL THESE SECURITIES AND IT IS NOT A SOLICITATION OF AN OFFER TO BUY THESE SECURITIES IN ANY JURISDICTION WHERE THE OFFER OR SALE IS NOT PERMITTED. |
| | 95 | |
| Structural and Collateral Term Sheet | | BMO 2025-C11 |
| No. 10 – 2481 Crotona Avenue |
Subordinate and Mezzanine Debt. None.
Permitted Future Subordinate or Mezzanine Debt. Not permitted.
Partial Release. Not permitted.
Ground Lease. None.
| THE INFORMATION IN THIS STRUCTURAL AND COLLATERAL TERM SHEET IS NOT COMPLETE AND MAY BE AMENDED PRIOR TO THE TIME OF SALE. THIS TERM SHEET IS NOT AN OFFER TO SELL THESE SECURITIES AND IT IS NOT A SOLICITATION OF AN OFFER TO BUY THESE SECURITIES IN ANY JURISDICTION WHERE THE OFFER OR SALE IS NOT PERMITTED. |
| | 96 | |