UNITED STATES
SECURITIES AND EXCHANGE COMMISSION
Washington, D.C. 20549
FORM N-CSR
CERTIFIED SHAREHOLDER REPORT OF REGISTERED
MANAGEMENT INVESTMENT COMPANIES
Investment Company Act file number 811-2546
Fidelity Commonwealth Trust
(Exact name of registrant as specified in charter)
82 Devonshire St., Boston, Massachusetts 02109
(Address of principal executive offices) (Zip code)
Scott C. Goebel, Secretary
82 Devonshire St.
Boston, Massachusetts 02109
(Name and address of agent for service)
Registrant's telephone number, including area code: 617-563-7000
Date of fiscal year end: | April 30 |
| |
Date of reporting period: | April 30, 2010 |
Item 1. Reports to Stockholders
Fidelity®
Large Cap Stock
Fund
Annual Report
April 30, 2010
(2_fidelity_logos) (Registered_Trademark)
Contents
Chairman's Message | <Click Here> | The Chairman's message to shareholders. |
Performance | <Click Here> | How the fund has done over time. |
Management's Discussion | <Click Here> | The manager's review of fund performance, strategy and outlook. |
Shareholder Expense Example | <Click Here> | An example of shareholder expenses. |
Investment Changes | <Click Here> | A summary of major shifts in the fund's investments over the past six months. |
Investments | <Click Here> | A complete list of the fund's investments with their market values. |
Financial Statements | <Click Here> | Statements of assets and liabilities, operations, and changes in net assets, as well as financial highlights. |
Notes | <Click Here> | Notes to the financial statements. |
Report of Independent Registered Public Accounting Firm | <Click Here> | |
Trustees and Officers | <Click Here> | |
Distributions | <Click Here> | |
To view a fund's proxy voting guidelines and proxy voting record for the 12-month period ended June 30, visit http://www.fidelity.com/proxyvotingresults or visit the Securities and Exchange Commission's (SEC) web site at http://www.sec.gov. You may also call 1-800-544-8544 to request a free copy of the proxy voting guidelines.
Standard & Poor's, S&P and S&P 500 are registered service marks of The McGraw-Hill Companies, Inc. and have been licensed for use by Fidelity Distributors Corporation.
Other third party marks appearing herein are the property of their respective owners.
All other marks appearing herein are registered or unregistered trademarks or service marks of FMR LLC or an affiliated company.
Annual Report
This report and the financial statements contained herein are submitted for the general information of the shareholders of the fund. This report is not authorized for distribution to prospective investors in the fund unless preceded or accompanied by an effective prospectus.
A fund files its complete schedule of portfolio holdings with the SEC for the first and third quarters of each fiscal year on Form N-Q. Forms N-Q are available on the SEC's web site at http://www.sec.gov. A fund's Forms N-Q may be reviewed and copied at the SEC's Public Reference Room in Washington, DC. Information regarding the operation of the SEC's Public Reference Room may be obtained by calling 1-800-SEC-0330. For a complete list of a fund's portfolio holdings, view the most recent holdings listing, semiannual report, or annual report on Fidelity's web site at http://www.fidelity.com or http://www.advisor.fidelity.com, as applicable.
NOT FDIC INSURED • MAY LOSE VALUE • NO BANK GUARANTEE
Neither the fund nor Fidelity Distributors Corporation is a bank.
Annual Report
(photo_of_Edward_C_Johnson_3d)
Dear Shareholder:
Global capital markets have been predominantly positive thus far in 2010, overcoming some early volatility to continue the upward trend that began in March 2009. Year to date, U.S. stocks have seen the biggest gains, outpacing the performance of foreign equities, which has been hampered by a rebounding dollar. Financial markets are always unpredictable, of course, but there also are several time-tested investment principles that can help put the odds in your favor.
One of the basic tenets is to invest for the long term. Over time, riding out the markets' inevitable ups and downs has proven much more effective than selling into panic or chasing the hottest trend. Even missing only a few of the markets' best days can significantly diminish investor returns. Patience also affords the benefits of compounding - of earning interest on additional income or reinvested dividends and capital gains. There can be tax advantages and cost benefits to consider as well. While staying the course doesn't eliminate risk, it can considerably lessen the effect of short-term declines.
You can further manage your investing risk through diversification. And today, more than ever, geographic diversification should be taken into account. Studies indicate that asset allocation is the single most important determinant of a portfolio's long-term success. The right mix of stocks, bonds and cash - aligned to your particular risk tolerance and investment objective - is very important. Age-appropriate rebalancing is also an essential aspect of asset allocation. For younger investors, an emphasis on equities - which historically have been the best-performing asset class over time - is encouraged. As investors near their specific goal, such as retirement or sending a child to college, consideration may be given to replacing volatile assets (e.g. common stocks) with more-stable fixed investments (bonds or savings plans).
A third principle - investing regularly - can help lower the average cost of your purchases. Investing a certain amount of money each month or quarter helps ensure you won't pay for all your shares at market highs. This strategy - known as dollar cost averaging - also reduces "emotion" from investing, helping shareholders avoid selling weak performers just prior to an upswing, or chasing a hot performer just before a correction.
We invite you to contact us via the Internet, through our Investor Centers or by phone. It is our privilege to provide you the information you need to make the investments that are right for you.
Sincerely,
(The chairman's signature appears here.)
Edward C. Johnson 3d
Annual Report
Average annual total return reflects the change in the value of an investment, assuming reinvestment of the fund's dividend income and capital gains (the profits earned upon the sale of securities that have grown in value, if any) and assuming a constant rate of performance each year. The $10,000 table and the fund's returns do not reflect the deduction of taxes that a shareholder would pay on fund distributions or the redemption of fund shares. During periods of reimbursement by Fidelity, a fund's total return will be greater than it would be had the reimbursement not occurred. How a fund did yesterday is no guarantee of how it will do tomorrow.
Average Annual Total Returns
Periods ended April 30, 2010 | Past 1
year | Past 5
years | Past 10
years |
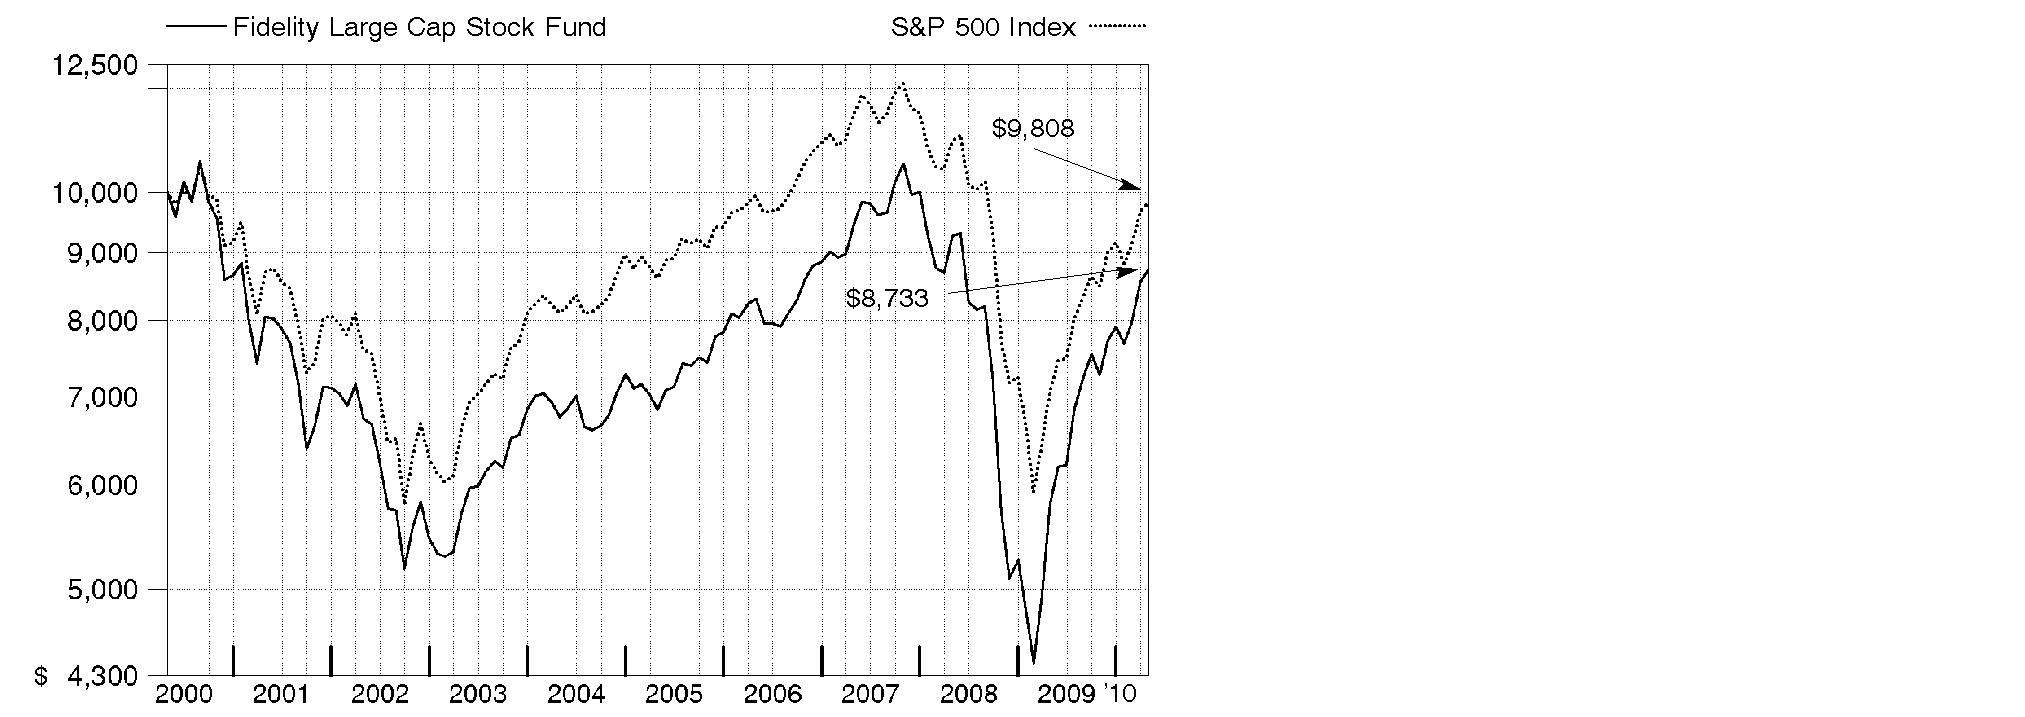
Fidelity® Large Cap Stock Fund | 50.48% | 5.01% | -1.35% |
$10,000 Over 10 Years
Let's say hypothetically that $10,000 was invested in Fidelity® Large Cap Stock Fund on April 30, 2000. The chart shows how the value of your investment would have changed, and also shows how the S&P 500® Index performed over the same period.
Annual Report
Market Recap: Blistering stock market declines sustained during the global economic crisis were largely offset in the 12-month period ending April 30, 2010, as unprecedented government stimulus took hold, significant corporate cost cutting paved the way for encouraging earnings reports, credit conditions improved and consumer fears began to ease. After hitting woeful lows in March 2009, stock markets experienced a steady uptrend that coincided with the near culmination of the Great Recession that began in late 2007. Although a weak labor market still lingered, by mid-April, the blue-chip Dow Jones Industrial AverageSM pushed above the 11,000 mark for the first time in 19 months, closing the period with a 38.69% gain. Impressive returns were widespread, with the S&P 500® Index rising 38.84% and the technology-laden Nasdaq Composite® Index increasing 44.63%. Small-cap stocks continued to outperform their larger counterparts, with the Russell 2000® Index returning 48.95%. Despite widening sovereign debt problems overseas, foreign equities still posted solid gains, with the MSCI® EAFE® (Europe, Australasia, Far East) Index - a measure of developed markets outside the U.S. and Canada - rising 34.56%.
Comments from Matthew Fruhan, Portfolio Manager of Fidelity® Large Cap Stock Fund: The fund returned 50.48% for the year, easily outpacing the S&P 500 Index. The fund was aided by security selection and sector positioning. Stock picking was strongest in financials, materials, consumer discretionary and industrials. The fund held beneficial overweighted stakes in financials, information technology and consumer discretionary. Further aiding performance was the fund's underweighted exposure to telecommunication services, consumer staples and utilities. Seven of the top-10 relative contributors were in financials, including mortgage insurance companies Radian Group and MGIC Investment; banking firms Wells Fargo and PNC Financial Services Group; and diversified financials names Capital One Financial, Bank of America and KKR Financial Holdings. Elsewhere, an out-of-benchmark position in Tenneco, an auto-parts supplier, helped performance. The company's stock rebounded from distressed levels as revenue and earnings prospects moved higher. Conversely, the fund was hurt by positions in two stocks - MEMC Electronic Materials and First Solar - with exposure to the solar industry, which faced declining expectations for demand growth throughout the period. The fund also was hurt by weak security selection in information technology, underweighting industrials and overweighting health care. Several stocks mentioned were not held at period end.
The views expressed above reflect those of the portfolio manager(s) only through the end of the period as stated on the cover of this report and do not necessarily represent the views of Fidelity or any other person in the Fidelity organization. Any such views are subject to change at any time based upon market or other conditions and Fidelity disclaims any responsibility to update such views. These views may not be relied on as investment advice and, because investment decisions for a Fidelity fund are based on numerous factors, may not be relied on as an indication of trading intent on behalf of any Fidelity fund.
Annual Report
Shareholder Expense Example
As a shareholder of the Fund, you incur two types of costs: (1) transaction costs, and (2) ongoing costs, including management fees and other Fund expenses. This Example is intended to help you understand your ongoing costs (in dollars) of investing in the Fund and to compare these costs with the ongoing costs of investing in other mutual funds.
The Example is based on an investment of $1,000 invested at the beginning of the period and held for the entire period (November 1, 2009 to April 30, 2010).
Actual Expenses
The first line of the accompanying table provides information about actual account values and actual expenses. You may use the information in this line, together with the amount you invested, to estimate the expenses that you paid over the period. Simply divide your account value by $1,000.00 (for example, an $8,600 account value divided by $1,000.00 = 8.6), then multiply the result by the number in the first line under the heading entitled "Expenses Paid During Period" to estimate the expenses you paid on your account during this period. A small balance maintenance fee of $12.00 that is charged once a year may apply for certain accounts with a value of less than $2,000. This fee is not included in the table below. If it was, the estimate of expenses you paid during the period would be higher, and your ending account value lower, by this amount. In addition, the Fund, as a shareholder in the underlying Fidelity Central Funds, will indirectly bear its pro-rata share of the fees and expenses incurred by the underlying Fidelity Central Funds. These fees and expenses are not included in the Fund's annualized expense ratio used to calculate the expense estimate in the table below.
Hypothetical Example for Comparison Purposes
The second line of the accompanying table provides information about hypothetical account values and hypothetical expenses based on the Fund's actual expense ratio and an assumed rate of return of 5% per year before expenses, which is not the Fund's actual return. The hypothetical account values and expenses may not be used to estimate the actual ending account balance or expenses you paid for the period. You may use this information to compare the ongoing costs of investing in the Fund and other funds. To do so, compare this 5% hypothetical example with the 5% hypothetical examples that appear in the shareholder reports of the other funds. A small balance maintenance fee of $12.00 that is charged once a year may apply for certain accounts with a value of less than $2,000. This fee is not included in the table below. If it was, the estimate of expenses you paid during the period would be higher, and your ending account value lower, by this amount. In addition, the Fund, as a shareholder in the underlying Fidelity Central Funds, will indirectly bear its pro-rata share of the fees and expenses incurred by the underlying Fidelity Central Funds. These fees and expenses are not included in the Fund's annualized expense ratio used to calculate the expense estimate in the table below.
Please note that the expenses shown in the table are meant to highlight your ongoing costs only and do not reflect any transaction costs. Therefore, the second line of the table is useful in comparing ongoing costs only, and will not help you determine the relative total costs of owning different funds.
Annual Report
Shareholder Expense Example - continued
| Annualized Expense Ratio | Beginning
Account Value
November 1, 2009 | Ending
Account Value
April 30, 2010 | Expenses Paid
During Period*
November 1, 2009
to April 30, 2010 |
Actual | 1.01% | $ 1,000.00 | $ 1,200.40 | $ 5.51 |
Hypothetical (5% return per year before expenses) | | $ 1,000.00 | $ 1,019.79 | $ 5.06 |
* Expenses are equal to the Fund's annualized expense ratio, multiplied by the average account value over the period, multiplied by 181/365 (to reflect the one-half year period).
Annual Report
Investment Changes (Unaudited)
Top Ten Stocks as of April 30, 2010 |
| % of fund's
net assets | % of fund's net assets
6 months ago |
Wells Fargo & Co. | 4.6 | 3.3 |
Bank of America Corp. | 3.5 | 2.9 |
JPMorgan Chase & Co. | 3.4 | 3.7 |
Exxon Mobil Corp. | 3.4 | 3.1 |
Cisco Systems, Inc. | 3.1 | 3.3 |
Chevron Corp. | 2.8 | 1.8 |
Inverness Medical Innovations, Inc. | 2.5 | 2.0 |
Pfizer, Inc. | 2.3 | 2.5 |
Apple, Inc. | 2.2 | 1.9 |
Johnson & Johnson | 1.9 | 1.7 |
| 29.7 | |
Top Five Market Sectors as of April 30, 2010 |
| % of fund's
net assets | % of fund's net assets
6 months ago |
Information Technology | 22.7 | 22.3 |
Financials | 20.5 | 20.5 |
Health Care | 14.3 | 14.2 |
Energy | 12.1 | 9.3 |
Consumer Discretionary | 11.7 | 11.3 |
Asset Allocation (% of fund's net assets) |
As of April 30, 2010 * | As of October 31, 2009 ** |
 | Stocks 99.9% | | | Stocks 100.0% | |
 | Convertible
Securities † 0.0% | | | Convertible
Securities † 0.0% | |
 | Short-Term
Investments and
Net Other Assets 0.1% | | | Short-Term
Investments and
Net Other Assets † 0.0% | |
* Foreign investments | 10.5% | | ** Foreign investments | 9.3% | |

† Amount represents less than 0.1%. |
Annual Report
Investments April 30, 2010
Showing Percentage of Net Assets
Common Stocks - 98.9% |
| Shares | | Value (000s) |
CONSUMER DISCRETIONARY - 10.7% |
Auto Components - 0.0% |
Johnson Controls, Inc. | 2,844 | | $ 96 |
Distributors - 0.1% |
Li & Fung Ltd. | 152,000 | | 733 |
Diversified Consumer Services - 0.2% |
DeVry, Inc. | 22,000 | | 1,373 |
Strayer Education, Inc. (e) | 3,600 | | 875 |
| | 2,248 |
Hotels, Restaurants & Leisure - 0.6% |
International Game Technology | 319,465 | | 6,734 |
Household Durables - 1.7% |
KB Home | 447,420 | | 8,291 |
Lennar Corp. Class A | 214,339 | | 4,265 |
Newell Rubbermaid, Inc. | 321,655 | | 5,491 |
| | 18,047 |
Media - 1.4% |
Comcast Corp. Class A (special) (non-vtg.) | 585,853 | | 11,043 |
McGraw-Hill Companies, Inc. | 30,358 | | 1,024 |
Time Warner, Inc. | 44,110 | | 1,459 |
Viacom, Inc. Class B (non-vtg.) (a) | 60,300 | | 2,130 |
| | 15,656 |
Multiline Retail - 0.9% |
Target Corp. | 169,496 | | 9,639 |
Specialty Retail - 5.1% |
Best Buy Co., Inc. | 206,102 | | 9,398 |
Home Depot, Inc. | 317,655 | | 11,197 |
Lowe's Companies, Inc. | 618,605 | | 16,777 |
Staples, Inc. | 785,505 | | 18,483 |
| | 55,855 |
Textiles, Apparel & Luxury Goods - 0.7% |
Hanesbrands, Inc. (a) | 227,127 | | 6,466 |
Liz Claiborne, Inc. (a) | 123,500 | | 1,079 |
| | 7,545 |
TOTAL CONSUMER DISCRETIONARY | | 116,553 |
CONSUMER STAPLES - 5.2% |
Beverages - 0.5% |
The Coca-Cola Co. | 107,586 | | 5,750 |
Common Stocks - continued |
| Shares | | Value (000s) |
CONSUMER STAPLES - continued |
Food & Staples Retailing - 1.1% |
Metro AG | 16,000 | | $ 957 |
Walgreen Co. | 298,045 | | 10,476 |
| | 11,433 |
Food Products - 0.7% |
Archer Daniels Midland Co. | 38,100 | | 1,065 |
Danone (e) | 109,999 | | 6,482 |
Nestle SA | 10,557 | | 517 |
| | 8,064 |
Household Products - 0.9% |
Kimberly-Clark Corp. | 62,934 | | 3,855 |
Procter & Gamble Co. | 87,707 | | 5,452 |
| | 9,307 |
Personal Products - 0.1% |
Alberto-Culver Co. | 47,056 | | 1,355 |
Tobacco - 1.9% |
Lorillard, Inc. | 54,200 | | 4,248 |
Philip Morris International, Inc. | 328,808 | | 16,138 |
| | 20,386 |
TOTAL CONSUMER STAPLES | | 56,295 |
ENERGY - 12.1% |
Energy Equipment & Services - 2.3% |
Baker Hughes, Inc. | 73,346 | | 3,650 |
Dresser-Rand Group, Inc. (a) | 60,100 | | 2,120 |
Helix Energy Solutions Group, Inc. (a) | 185,135 | | 2,699 |
Smith International, Inc. | 139,500 | | 6,663 |
Weatherford International Ltd. (a) | 544,536 | | 9,862 |
| | 24,994 |
Oil, Gas & Consumable Fuels - 9.8% |
Chevron Corp. | 372,209 | | 30,313 |
EXCO Resources, Inc. | 114,500 | | 2,124 |
Exxon Mobil Corp. | 541,675 | | 36,753 |
Hess Corp. | 34,119 | | 2,168 |
Marathon Oil Corp. | 206,377 | | 6,635 |
Occidental Petroleum Corp. | 137,000 | | 12,146 |
Penn West Energy Trust | 5,400 | | 109 |
Plains Exploration & Production Co. (a) | 57,345 | | 1,681 |
Royal Dutch Shell PLC Class A sponsored ADR | 80,936 | | 5,079 |
Common Stocks - continued |
| Shares | | Value (000s) |
ENERGY - continued |
Oil, Gas & Consumable Fuels - continued |
Southwestern Energy Co. (a) | 51,745 | | $ 2,053 |
Suncor Energy, Inc. | 169,700 | | 5,803 |
Ultra Petroleum Corp. (a) | 32,980 | | 1,575 |
| | 106,439 |
TOTAL ENERGY | | 131,433 |
FINANCIALS - 20.5% |
Capital Markets - 1.5% |
Bank of New York Mellon Corp. | 142,736 | | 4,443 |
Charles Schwab Corp. | 244,299 | | 4,713 |
Morgan Stanley | 237,695 | | 7,183 |
| | 16,339 |
Commercial Banks - 9.2% |
Banco Popular Espanol SA | 153,900 | | 1,090 |
Banco Santander SA | 103,762 | | 1,313 |
BB&T Corp. | 129,905 | | 4,318 |
HSBC Holdings PLC sponsored ADR | 21,300 | | 1,084 |
PNC Financial Services Group, Inc. | 241,596 | | 16,238 |
Regions Financial Corp. | 860,023 | | 7,603 |
SunTrust Banks, Inc. | 149,500 | | 4,425 |
Synovus Financial Corp. | 513,200 | | 1,545 |
U.S. Bancorp, Delaware | 460,429 | | 12,326 |
Wells Fargo & Co. | 1,522,080 | | 50,395 |
| | 100,337 |
Diversified Financial Services - 7.6% |
Bank of America Corp. | 2,167,025 | | 38,638 |
JPMorgan Chase & Co. | 867,506 | | 36,938 |
KKR Financial Holdings LLC | 807,465 | | 7,138 |
| | 82,714 |
Insurance - 0.8% |
ACE Ltd. | 23,371 | | 1,243 |
Aegon NV ADR (a) | 79,970 | | 561 |
Allstate Corp. | 49,850 | | 1,629 |
Genworth Financial, Inc. Class A (a) | 241,947 | | 3,997 |
Lincoln National Corp. | 60,452 | | 1,849 |
| | 9,279 |
Real Estate Management & Development - 0.7% |
CB Richard Ellis Group, Inc. Class A (a) | 414,963 | | 7,187 |
Common Stocks - continued |
| Shares | | Value (000s) |
FINANCIALS - continued |
Thrifts & Mortgage Finance - 0.7% |
Radian Group, Inc. (e) | 511,077 | | $ 7,252 |
TOTAL FINANCIALS | | 223,108 |
HEALTH CARE - 14.3% |
Biotechnology - 1.8% |
Amgen, Inc. (a) | 153,698 | | 8,816 |
Genzyme Corp. (a) | 82,027 | | 4,367 |
Targacept, Inc. (a) | 59,400 | | 1,414 |
Vertex Pharmaceuticals, Inc. (a) | 118,635 | | 4,599 |
| | 19,196 |
Health Care Equipment & Supplies - 3.8% |
Baxter International, Inc. | 49,270 | | 2,327 |
C. R. Bard, Inc. | 55,266 | | 4,782 |
Hill-Rom Holdings, Inc. | 72,300 | | 2,293 |
Inverness Medical Innovations, Inc. (a)(e) | 681,790 | | 27,122 |
Meridian Bioscience, Inc. | 5,500 | | 110 |
SSL International PLC | 147,391 | | 1,931 |
St. Jude Medical, Inc. (a) | 69,400 | | 2,833 |
| | 41,398 |
Health Care Providers & Services - 1.1% |
Clarient, Inc. (a) | 38,600 | | 117 |
Express Scripts, Inc. (a) | 59,700 | | 5,978 |
McKesson Corp. | 10,700 | | 693 |
UnitedHealth Group, Inc. | 160,100 | | 4,853 |
| | 11,641 |
Life Sciences Tools & Services - 0.2% |
Lonza Group AG | 7,695 | | 601 |
QIAGEN NV (a) | 71,600 | | 1,636 |
| | 2,237 |
Pharmaceuticals - 7.4% |
Abbott Laboratories | 236,000 | | 12,074 |
Allergan, Inc. | 19,100 | | 1,216 |
Auxilium Pharmaceuticals, Inc. (a) | 27,700 | | 986 |
Johnson & Johnson | 321,097 | | 20,647 |
Merck & Co., Inc. | 543,063 | | 19,029 |
Common Stocks - continued |
| Shares | | Value (000s) |
HEALTH CARE - continued |
Pharmaceuticals - continued |
Pfizer, Inc. | 1,525,214 | | $ 25,502 |
Roche Holding AG (participation certificate) | 9,140 | | 1,443 |
| | 80,897 |
TOTAL HEALTH CARE | | 155,369 |
INDUSTRIALS - 9.0% |
Aerospace & Defense - 2.3% |
AerCap Holdings NV (a) | 196,380 | | 2,710 |
European Aeronautic Defence and Space Co. EADS NV | 114,700 | | 2,131 |
Honeywell International, Inc. | 387,956 | | 18,416 |
Raytheon Co. | 34,025 | | 1,984 |
| | 25,241 |
Air Freight & Logistics - 1.1% |
C.H. Robinson Worldwide, Inc. | 61,300 | | 3,696 |
United Parcel Service, Inc. Class B | 115,500 | | 7,986 |
| | 11,682 |
Building Products - 0.5% |
Lennox International, Inc. | 82,303 | | 3,725 |
Owens Corning (a) | 53,000 | | 1,843 |
| | 5,568 |
Commercial Services & Supplies - 0.7% |
Avery Dennison Corp. | 103,900 | | 4,055 |
Ritchie Brothers Auctioneers, Inc. (e) | 39,300 | | 920 |
Stericycle, Inc. (a) | 28,192 | | 1,661 |
The Geo Group, Inc. (a) | 50,200 | | 1,063 |
Waste Management, Inc. | 8,500 | | 295 |
| | 7,994 |
Electrical Equipment - 0.6% |
Acuity Brands, Inc. | 23,500 | | 1,062 |
Roper Industries, Inc. | 74,115 | | 4,522 |
Zumtobel AG (a) | 80,633 | | 1,739 |
| | 7,323 |
Industrial Conglomerates - 0.4% |
Siemens AG | 16,897 | | 1,650 |
Textron, Inc. | 108,689 | | 2,482 |
| | 4,132 |
Common Stocks - continued |
| Shares | | Value (000s) |
INDUSTRIALS - continued |
Machinery - 2.4% |
Deere & Co. | 9,300 | | $ 556 |
Ingersoll-Rand Co. Ltd. | 513,328 | | 18,983 |
PACCAR, Inc. | 107,934 | | 5,021 |
SmartHeat, Inc. (a)(e) | 157,766 | | 1,324 |
| | 25,884 |
Professional Services - 0.1% |
Robert Half International, Inc. | 42,400 | | 1,161 |
Road & Rail - 0.6% |
Union Pacific Corp. | 85,226 | | 6,448 |
Trading Companies & Distributors - 0.3% |
WESCO International, Inc. (a) | 77,860 | | 3,163 |
TOTAL INDUSTRIALS | | 98,596 |
INFORMATION TECHNOLOGY - 22.7% |
Communications Equipment - 5.6% |
Cisco Systems, Inc. (a) | 1,244,536 | | 33,503 |
Juniper Networks, Inc. (a) | 333,875 | | 9,485 |
QUALCOMM, Inc. | 449,318 | | 17,407 |
| | 60,395 |
Computers & Peripherals - 4.8% |
3PAR, Inc. (a) | 352,100 | | 3,285 |
Apple, Inc. (a) | 88,910 | | 23,216 |
EMC Corp. (a) | 475,322 | | 9,036 |
Hewlett-Packard Co. | 129,400 | | 6,725 |
International Business Machines Corp. | 76,669 | | 9,890 |
| | 52,152 |
Electronic Equipment & Components - 0.7% |
Corning, Inc. | 393,208 | | 7,569 |
Internet Software & Services - 1.0% |
Google, Inc. Class A (a) | 19,213 | | 10,095 |
LoopNet, Inc. (a) | 57,297 | | 646 |
| | 10,741 |
IT Services - 1.1% |
Accenture PLC Class A | 40,371 | | 1,762 |
Cognizant Technology Solutions Corp. Class A (a) | 10,391 | | 532 |
Echo Global Logistics, Inc. (e) | 20,118 | | 271 |
MasterCard, Inc. Class A | 38,900 | | 9,649 |
| | 12,214 |
Common Stocks - continued |
| Shares | | Value (000s) |
INFORMATION TECHNOLOGY - continued |
Semiconductors & Semiconductor Equipment - 6.6% |
Altera Corp. | 306,500 | | $ 7,773 |
Applied Materials, Inc. | 129,600 | | 1,786 |
ASM International NV (NASDAQ) (a) | 104,037 | | 2,706 |
ASML Holding NV (NY Shares) | 233,700 | | 7,633 |
KLA-Tencor Corp. | 163,700 | | 5,576 |
Lam Research Corp. (a) | 195,102 | | 7,911 |
MEMC Electronic Materials, Inc. (a) | 1,246,120 | | 16,162 |
National Semiconductor Corp. | 433,989 | | 6,414 |
Samsung Electronics Co. Ltd. | 1,654 | | 1,257 |
Siliconware Precision Industries Co. Ltd. sponsored ADR | 160,700 | | 988 |
Taiwan Semiconductor Manufacturing Co. Ltd. | 1,991,453 | | 3,899 |
Taiwan Semiconductor Manufacturing Co. Ltd. sponsored ADR | 600,801 | | 6,362 |
Texas Instruments, Inc. | 139,485 | | 3,628 |
| | 72,095 |
Software - 2.9% |
Adobe Systems, Inc. (a) | 160,905 | | 5,405 |
Autodesk, Inc. (a) | 132,900 | | 4,520 |
Autonomy Corp. PLC (a) | 360,928 | | 9,899 |
Citrix Systems, Inc. (a) | 76,400 | | 3,591 |
Microsoft Corp. | 143,600 | | 4,386 |
Oracle Corp. | 36,929 | | 954 |
Salesforce.com, Inc. (a) | 30,847 | | 2,641 |
| | 31,396 |
TOTAL INFORMATION TECHNOLOGY | | 246,562 |
MATERIALS - 2.9% |
Chemicals - 2.8% |
Air Products & Chemicals, Inc. | 26,000 | | 1,996 |
Albemarle Corp. | 95,636 | | 4,367 |
E.I. du Pont de Nemours & Co. | 217,440 | | 8,663 |
Ecolab, Inc. | 33,980 | | 1,660 |
Lyondell Chemical Co. Class B, (a) | 51,657 | | 1,162 |
LyondellBasell Industries AF SCA Class A | 56,334 | | 1,256 |
Monsanto Co. | 185,132 | | 11,674 |
| | 30,778 |
Metals & Mining - 0.1% |
Gem Diamonds Ltd. (a) | 178,800 | | 791 |
TOTAL MATERIALS | | 31,569 |
Common Stocks - continued |
| Shares | | Value (000s) |
TELECOMMUNICATION SERVICES - 0.8% |
Diversified Telecommunication Services - 0.6% |
Verizon Communications, Inc. | 206,210 | | $ 5,957 |
Wireless Telecommunication Services - 0.2% |
Sprint Nextel Corp. (a) | 587,900 | | 2,499 |
TOTAL TELECOMMUNICATION SERVICES | | 8,456 |
UTILITIES - 0.7% |
Electric Utilities - 0.5% |
FirstEnergy Corp. | 69,849 | | 2,645 |
FPL Group, Inc. | 55,600 | | 2,894 |
| | 5,539 |
Multi-Utilities - 0.2% |
PG&E Corp. | 50,762 | | 2,223 |
TOTAL UTILITIES | | 7,762 |
TOTAL COMMON STOCKS (Cost $999,409) | 1,075,703 |
Nonconvertible Preferred Stocks - 1.0% |
| | | |
CONSUMER DISCRETIONARY - 1.0% |
Automobiles - 1.0% |
Porsche Automobil Holding SE | 72,700 | | 4,208 |
Volkswagen AG | 70,180 | | 6,745 |
| | 10,953 |
TOTAL NONCONVERTIBLE PREFERRED STOCKS (Cost $10,757) | 10,953 |
Convertible Bonds - 0.0% |
| Principal Amount (000s) | | Value (000s) |
UTILITIES - 0.0% |
Independent Power Producers & Energy Traders - 0.0% |
Calpine Corp.: | | | | |
6% 9/30/14 (d)(f) | | $ 1,360 | | $ 170 |
7.75% 6/1/15 (d) | | 2,950 | | 0 |
| | 170 |
TOTAL CONVERTIBLE BONDS (Cost $301) | 170 |
Money Market Funds - 2.1% |
| Shares | | |
Fidelity Cash Central Fund, 0.21% (b) | 3,043,214 | | 3,043 |
Fidelity Securities Lending Cash Central Fund, 0.22% (b)(c) | 19,103,650 | | 19,104 |
TOTAL MONEY MARKET FUNDS (Cost $22,147) | 22,147 |
TOTAL INVESTMENT PORTFOLIO - 102.0% (Cost $1,032,614) | | 1,108,973 |
NET OTHER ASSETS - (2.0)% | | (21,461) |
NET ASSETS - 100% | $ 1,087,512 |
Legend |
(a) Non-income producing |
(b) Affiliated fund that is available only to investment companies and other accounts managed by Fidelity Investments. The rate quoted is the annualized seven-day yield of the fund at period end. A complete unaudited listing of the fund's holdings as of its most recent quarter end is available upon request. |
(c) Investment made with cash collateral received from securities on loan. |
(d) Non-income producing - Issuer is in default. |
(e) Security or a portion of the security is on loan at period end. |
(f) The coupon rate shown on floating or adjustable rate securities represents the rate at period end. |
Affiliated Central Funds |
Information regarding fiscal year to date income earned by the Fund from investments in Fidelity Central Funds is as follows: |
Fund | Income earned
(Amounts in thousands) |
Fidelity Cash Central Fund | $ 9 |
Fidelity Securities Lending Cash Central Fund | 85 |
Total | $ 94 |
Other Information |
The following is a summary of the inputs used, as of April 30, 2010, involving the Fund's assets and liabilities carried at value. The inputs or methodology used for valuing securities may not be an indication of the risk associated with investing in those securities. For more information on valuation inputs, and their aggregation into the levels used in the tables below, please refer to the Security Valuation section in the accompanying Notes to Financial Statements. |
Valuation Inputs at Reporting Date: |
Description
(Amounts in thousands) | Total | Level 1 | Level 2 | Level 3 |
Investments in Securities: | | | | |
Equities: | | | | |
Consumer Discretionary | $ 127,506 | $ 115,820 | $ 11,686 | $ - |
Consumer Staples | 56,295 | 48,339 | 7,956 | - |
Energy | 131,433 | 131,433 | - | - |
Financials | 223,108 | 220,705 | 2,403 | - |
Health Care | 155,369 | 151,394 | 3,975 | - |
Industrials | 98,596 | 93,076 | 5,520 | - |
Information Technology | 246,562 | 231,507 | 15,055 | - |
Materials | 31,569 | 29,616 | 1,953 | - |
Telecommunication Services | 8,456 | 8,456 | - | - |
Utilities | 7,762 | 7,762 | - | - |
Corporate Bonds | 170 | - | - | 170 |
Money Market Funds | 22,147 | 22,147 | - | - |
Total Investments in Securities: | $ 1,108,973 | $ 1,060,255 | $ 48,548 | $ 170 |
The following is a reconciliation of Investments in Securities for which Level 3 inputs were used in determining value: |
(Amounts in thousands) | |
Investments in Securities: | |
Beginning Balance | $ 237 |
Total Realized Gain (Loss) | - |
Total Unrealized Gain (Loss) | (67) |
Cost of Purchases | - |
Proceeds of Sales | - |
Amortization/Accretion | - |
Transfers in to Level 3 | - |
Transfers out of Level 3 | - |
Ending Balance | $ 170 |
The change in unrealized gain (loss) for the period attributable to Level 3 securities held at April 30, 2010 | $ (67) |
The information used in the above reconciliation represents fiscal year to date activity for any Investments in Securities identified as using Level 3 inputs at either the beginning or the end of the current fiscal period. Transfers in or out of Level 3 represents the beginning value of any Security or Instrument where a change in the pricing level occurred from the beginning to the end of the period. The cost of purchases and the proceeds of sales may include securities received or delivered through corporate actions or exchanges. Realized and unrealized gains (losses) disclosed in the reconciliation are included in Net Gain (Loss) on the Fund's Statement of Operations. |
Distribution of investments by country of issue, as a percentage of total net assets, is as follows: (Unaudited) |
United States of America | 89.5% |
Ireland | 1.9% |
United Kingdom | 1.7% |
Netherlands | 1.4% |
Germany | 1.3% |
Switzerland | 1.2% |
Taiwan | 1.1% |
Others (Individually Less Than 1%) | 1.9% |
| 100.0% |
Income Tax Information |
At April 30, 2010, the fund had a capital loss carryforward of approximately $113,276,000 all of which will expire on April 30, 2017. |
See accompanying notes which are an integral part of the financial statements.
Annual Report
Statement of Assets and Liabilities
Amounts in thousands (except per-share amount) | April 30, 2010 |
| | |
Assets | | |
Investment in securities, at value (including securities loaned of $18,288) - See accompanying schedule: Unaffiliated issuers (cost $1,010,467) | $ 1,086,826 | |
Fidelity Central Funds (cost $22,147) | 22,147 | |
Total Investments (cost $1,032,614) | | $ 1,108,973 |
Cash | | 193 |
Receivable for investments sold | | 21,720 |
Receivable for fund shares sold | | 5,570 |
Dividends receivable | | 374 |
Distributions receivable from Fidelity Central Funds | | 12 |
Prepaid expenses | | 1 |
Other receivables | | 36 |
Total assets | | 1,136,879 |
| | |
Liabilities | | |
Payable for investments purchased | $ 28,584 | |
Payable for fund shares redeemed | 747 | |
Accrued management fee | 596 | |
Other affiliated payables | 249 | |
Other payables and accrued expenses | 87 | |
Collateral on securities loaned, at value | 19,104 | |
Total liabilities | | 49,367 |
| | |
Net Assets | | $ 1,087,512 |
Net Assets consist of: | | |
Paid in capital | | $ 1,139,363 |
Undistributed net investment income | | 437 |
Accumulated undistributed net realized gain (loss) on investments and foreign currency transactions | | (128,633) |
Net unrealized appreciation (depreciation) on investments and assets and liabilities in foreign currencies | | 76,345 |
Net Assets, for 65,709 shares outstanding | | $ 1,087,512 |
Net Asset Value, offering price and redemption price per share ($1,087,512 ÷ 65,709 shares) | | $ 16.55 |
See accompanying notes which are an integral part of the financial statements.
Annual Report
Statement of Operations
Amounts in thousands | Year ended April 30, 2010 |
| | |
Investment Income | | |
Dividends | | $ 10,533 |
Interest | | 3 |
Income from Fidelity Central Funds | | 94 |
Total income | | 10,630 |
| | |
Expenses | | |
Management fee
Basic fee | $ 4,422 | |
Performance adjustment | 807 | |
Transfer agent fees | 2,349 | |
Accounting and security lending fees | 297 | |
Custodian fees and expenses | 175 | |
Independent trustees' compensation | 5 | |
Registration fees | 67 | |
Audit | 56 | |
Legal | 4 | |
Interest | 4 | |
Miscellaneous | 13 | |
Total expenses before reductions | 8,199 | |
Expense reductions | (106) | 8,093 |
Net investment income (loss) | | 2,537 |
Realized and Unrealized Gain (Loss) Net realized gain (loss) on: | | |
Investment securities: | | |
Unaffiliated issuers | 204,707 | |
Foreign currency transactions | (39) | |
Total net realized gain (loss) | | 204,668 |
Change in net unrealized appreciation (depreciation) on: Investment securities (net of decrease in deferred foreign taxes of $22) | 101,113 | |
Assets and liabilities in foreign currencies | (6) | |
Total change in net unrealized appreciation (depreciation) | | 101,107 |
Net gain (loss) | | 305,775 |
Net increase (decrease) in net assets resulting from operations | | $ 308,312 |
See accompanying notes which are an integral part of the financial statements.
Annual Report
Financial Statements - continued
Statement of Changes in Net Assets
Amounts in thousands | Year ended
April 30,
2010 | Year ended
April 30,
2009 |
Increase (Decrease) in Net Assets | | |
Operations | | |
Net investment income (loss) | $ 2,537 | $ 8,184 |
Net realized gain (loss) | 204,668 | (293,940) |
Change in net unrealized appreciation (depreciation) | 101,107 | (88,730) |
Net increase (decrease) in net assets resulting
from operations | 308,312 | (374,486) |
Distributions to shareholders from net investment income | (4,133) | (8,011) |
Share transactions
Proceeds from sales of shares | 517,653 | 238,911 |
Reinvestment of distributions | 4,036 | 7,594 |
Cost of shares redeemed | (325,256) | (378,534) |
Net increase (decrease) in net assets resulting from share transactions | 196,433 | (132,029) |
Total increase (decrease) in net assets | 500,612 | (514,526) |
| | |
Net Assets | | |
Beginning of period | 586,900 | 1,101,426 |
End of period (including undistributed net investment income of $437 and undistributed net investment income of $2,038, respectively) | $ 1,087,512 | $ 586,900 |
Other Information Shares | | |
Sold | 35,811 | 20,085 |
Issued in reinvestment of distributions | 304 | 705 |
Redeemed | (23,462) | (29,279) |
Net increase (decrease) | 12,653 | (8,489) |
See accompanying notes which are an integral part of the financial statements.
Annual Report
Financial Highlights
Years ended April 30, | 2010 | 2009 | 2008 | 2007 | 2006 |
Selected Per-Share Data | | | | | |
Net asset value, beginning of period | $ 11.06 | $ 17.90 | $ 18.72 | $ 16.55 | $ 13.72 |
Income from Investment Operations | | | | | |
Net investment income (loss) B | .05 | .15 | .12 | .13 | .10 |
Net realized and unrealized gain (loss) | 5.52 | (6.84) | (.45) | 2.15 | 2.83 |
Total from investment operations | 5.57 | (6.69) | (.33) | 2.28 | 2.93 |
Distributions from net investment income | (.08) | (.15) | (.12) | (.11) | (.10) |
Distributions from net realized gain | - | - | (.37) | - | - |
Total distributions | (.08) | (.15) | (.49) | (.11) | (.10) |
Net asset value, end of period | $ 16.55 | $ 11.06 | $ 17.90 | $ 18.72 | $ 16.55 |
Total Return A | 50.48% | (37.37)% | (1.99)% | 13.84% | 21.43% |
Ratios to Average Net Assets C, E | | | | | |
Expenses before reductions | 1.04% | .84% | .98% | .82% | .78% |
Expenses net of fee waivers,
if any | 1.04% | .84% | .98% | .82% | .78% |
Expenses net of all reductions | 1.02% | .83% | .97% | .81% | .73% |
Net investment income (loss) | .32% | 1.19% | .62% | .75% | .67% |
Supplemental Data | | | | | |
Net assets, end of period
(in millions) | $ 1,088 | $ 587 | $ 1,101 | $ 930 | $ 747 |
Portfolio turnover rate D | 186% | 159% | 120% | 96% | 154% |
A Total returns would have been lower had certain expenses not been reduced during the periods shown.
B Calculated based on average shares outstanding during the period.
C Fees and expenses of the underlying Fidelity Central Funds are not included in the Fund's expense ratio. The Fund indirectly bears its proportionate share of the expenses of any underlying Fidelity Central Funds.
D Amount does not include the portfolio activity of any underlying Fidelity Central Funds.
E Expense ratios reflect operating expenses of the Fund. Expenses before reductions do not reflect amounts reimbursed by the investment adviser or reductions from brokerage service arrangements or reductions from other expense offset arrangements and do not represent the amount paid by the Fund during periods when reimbursements or reductions occur. Expenses net of fee waivers reflect expenses after reimbursement by the investment adviser but prior to reductions from brokerage service arrangements or other expense offset arrangements. Expenses net of all reductions represent the net expenses paid by the Fund.
See accompanying notes which are an integral part of the financial statements.
Annual Report
Notes to Financial Statements
For the period ended April 30, 2010
(Amounts in thousands except ratios)
1. Organization.
Fidelity Large Cap Stock Fund (the Fund) is a fund of Fidelity Commonwealth Trust (the trust) and is authorized to issue an unlimited number of shares. The trust is registered under the Investment Company Act of 1940, as amended (the 1940 Act), as an open-end management investment company organized as a Massachusetts business trust.
2. Investments in Fidelity Central Funds.
The Fund may invest in Fidelity Central Funds, which are open-end investment companies available only to other investment companies and accounts managed by Fidelity Management & Research Company (FMR) and its affiliates. The Fund's Schedule of Investments lists each of the Fidelity Central Funds held as of period end, if any, as an investment of the Fund, but does not include the underlying holdings of each Fidelity Central Fund. As an Investing Fund, the Fund indirectly bears its proportionate share of the expenses of the underlying Fidelity Central Funds.
The Money Market Central Funds seek preservation of capital and current income and are managed by Fidelity Investments Money Management, Inc. (FIMM), an affiliate of FMR.
A complete unaudited list of holdings for each Fidelity Central Fund is available upon request or at the Securities and Exchange Commission (the SEC) web site at www.sec.gov. In addition, the financial statements of the Fidelity Central Funds, which are not covered by the Fund's Report of Independent Registered Public Accounting Firm, are available on the SEC web site or upon request.
3. Significant Accounting Policies.
The financial statements have been prepared in conformity with accounting principles generally accepted in the United States of America, which require management to make certain estimates and assumptions at the date of the financial statements. Actual results could differ from those estimates. The following summarizes the significant accounting policies of the Fund:
Security Valuation. Investments are valued as of 4:00 p.m. Eastern time on the last calendar day of the period. The Fund uses independent pricing services approved by the Board of Trustees to value its investments. When current market prices or quotations are not readily available or reliable, valuations may be determined in good faith in accordance with procedures adopted by the Board of Trustees. Factors used in determining value may include market or security specific events, changes in interest rates and credit quality. The frequency with which these procedures are used cannot be predicted and they may be utilized to a significant extent. The value used for net asset value (NAV) calculation under these procedures may differ from published prices for the same securities.
Annual Report
Notes to Financial Statements - continued
(Amounts in thousands except ratios)
3. Significant Accounting Policies - continued
Security Valuation - continued
The Fund categorizes the inputs to valuation techniques used to value its investments into a disclosure hierarchy consisting of three levels as shown below.
Level 1 - quoted prices in active markets for identical investments
Level 2 - other significant observable inputs (including quoted prices for similar investments, interest rates, prepayment speeds, etc.)
Level 3 - unobservable inputs (including the fund's own assumptions based on the best information available)
Changes in valuation techniques may result in transfers in or out of an assigned level within the disclosure hierarchy. The aggregate value of investments by input level, as of April 30, 2010, as well as a roll forward of Level 3 securities, is included at the end of the Fund's Schedule of Investments. Valuation techniques used to value the Fund's investments by major category are as follows.
Equity securities, including restricted securities, for which market quotations are readily available, are valued at the last reported sale price or official closing price as reported by an independent pricing service on the primary market or exchange on which they are traded and are categorized as Level 1 in the hierarchy. In the event there were no sales during the day or closing prices are not available, securities are valued at the last quoted bid price or may be valued using the last available price and are generally categorized as Level 2 in the hierarchy. For foreign equity securities, when significant market or security specific events arise, comparisons to the valuation of American Depositary Receipts (ADRs), futures contracts, Exchange-traded funds (ETFs) and certain indexes as well as quoted prices for similar securities are used and are categorized as Level 2 in the hierarchy in these circumstances. Utilizing these techniques may result in transfers between Level 1 and Level 2. For restricted equity securities and private placements where observable inputs are limited, assumptions about market activity and risk are used and are categorized as Level 3 in the hierarchy.
Debt securities, including restricted securities, are valued based on evaluated prices received from independent pricing services or from dealers who make markets in such securities. For corporate bonds, pricing services utilize matrix pricing which considers yield or price of bonds of comparable quality, coupon, maturity and type as well as dealer supplied prices and are generally categorized as Level 2 in the hierarchy.
Annual Report
3. Significant Accounting Policies - continued
Security Valuation - continued
Investments in open-end mutual funds, including the Fidelity Central Funds, are valued at their closing net asset value each business day and are categorized as Level 1 in the hierarchy. Short-term securities with remaining maturities of sixty days or less for which quotations are not readily available are valued at amortized cost, which approximates value and are categorized as Level 2 in the hierarchy.
When independent prices are unavailable or unreliable, debt securities may be valued utilizing pricing matrices which consider similar factors that would be used by independent pricing services. These are generally categorized as Level 2 in the hierarchy but may be Level 3 depending on the circumstances.
Foreign Currency. The Fund uses foreign currency contracts to facilitate transactions in foreign-denominated securities. Losses from these transactions may arise from changes in the value of the foreign currency or if the counterparties do not perform under the contracts' terms.
Foreign-denominated assets, including investment securities, and liabilities are translated into U.S. dollars at the exchange rate at period end. Purchases and sales of investment securities, income and dividends received and expenses denominated in foreign currencies are translated into U.S. dollars at the exchange rate in effect on the transaction date.
The effects of exchange rate fluctuations on investments are included with the net realized and unrealized gain (loss) on investment securities. Other foreign currency transactions resulting in realized and unrealized gain (loss) are disclosed separately.
Investment Transactions and Income. For financial reporting purposes, the Fund's investment holdings and NAV include trades executed through the end of the last business day of the period. The NAV per share for processing shareholder transactions is calculated as of the close of business of the New York Stock Exchange (NYSE), normally 4:00 p.m. Eastern time and includes trades executed through the end of the prior business day. Gains and losses on securities sold are determined on the basis of identified cost and may include proceeds received from litigation. Dividend income is recorded on the ex-dividend date, except for certain dividends from foreign securities where the ex-dividend date may have passed, which are recorded as soon as the Fund is informed of the ex-dividend date. Non-cash dividends included in dividend income, if any, are recorded at the fair market value of the securities received. Distributions received on securities that represent a return of capital or capital gain are recorded as a reduction of cost of investments and/or as a realized gain. The Fund estimates the components of
Annual Report
Notes to Financial Statements - continued
(Amounts in thousands except ratios)
3. Significant Accounting Policies - continued
Investment Transactions and Income - continued
distributions received that may be considered return of capital distributions or capital gain distributions. Interest income and distributions from the Fidelity Central Funds are accrued as earned. Interest income includes coupon interest and amortization of premium and accretion of discount on debt securities. Investment income is recorded net of foreign taxes withheld where recovery of such taxes is uncertain. Debt obligations may be placed on non-accrual status and related interest income may be reduced by ceasing current accruals and writing off interest receivables when the collection of all or a portion of interest has become doubtful based on consistently applied procedures. A debt obligation is removed from non-accrual status when the issuer resumes interest payments or when collectability of interest is reasonably assured.
Expenses. Most expenses of the trust can be directly attributed to a fund. Expenses which cannot be directly attributed are apportioned among each Fund in the trust. Expense estimates are accrued in the period to which they relate and adjustments are made when actual amounts are known.
Income Tax Information and Distributions to Shareholders. Each year, the Fund intends to qualify as a regulated investment company by distributing substantially all of its taxable income and realized gains under Subchapter M of the Internal Revenue Code and filing its U.S. federal tax return. As a result, no provision for income taxes is required. As of April 30, 2010, the Fund did not have any unrecognized tax benefits in the accompanying financial statements. A Fund's federal tax return is subject to examination by the Internal Revenue Service (IRS) for a period of three years. Foreign taxes are provided for based on the Fund's understanding of the tax rules and rates that exist in the foreign markets in which it invests.
Distributions are recorded on the ex-dividend date. Income and capital gain distributions are determined in accordance with income tax regulations, which may differ from generally accepted accounting principles.
Capital accounts within the financial statements are adjusted for permanent book-tax differences. These adjustments have no impact on net assets or the results of operations. Temporary book-tax differences will reverse in a subsequent period.
Book-tax differences are primarily due to the short-term gain distributions from the Fidelity Central Funds, foreign currency transactions, market discount, partnerships, deferred trustees compensation, capital loss carryforwards, and losses deferred due to wash sales and excise tax regulations.
Annual Report
3. Significant Accounting Policies - continued
Income Tax Information and Distributions to Shareholders - continued
The federal tax cost of investment securities and unrealized appreciation (depreciation) as of period end were as follows:
Gross unrealized appreciation | $ 99,941 |
Gross unrealized depreciation | (39,228) |
Net unrealized appreciation (depreciation) | $ 60,713 |
| |
Tax Cost | $ 1,048,260 |
The tax-based components of distributable earnings as of period end were as follows:
Undistributed ordinary income | $ 727 |
Capital loss carryforward | $ (113,276) |
Net unrealized appreciation (depreciation) | $ 60,699 |
The tax character of distributions paid was as follows:
| April 30, 2010 | April 30, 2009 |
Ordinary Income | $ 4,133 | $ 8,011 |
4. Purchases and Sales of Investments.
Purchases and sales of securities, other than short-term securities, aggregated $1,643,948 and $1,450,215, respectively.
5. Fees and Other Transactions with Affiliates.
Management Fee. FMR and its affiliates provide the Fund with investment management related services for which the Fund pays a monthly management fee. The management fee is the sum of an individual fund fee rate that is based on an annual rate of .30% of the Fund's average net assets and a group fee rate that averaged .26% during the period. The group fee rate is based upon the average net assets of all the mutual funds advised by FMR. The group fee rate decreases as assets under management increase and increases as assets under management decrease. In addition, the management fee is subject to a performance adjustment (up to a maximum of ± .20% of the Fund's average net assets over a 36 month performance period). The upward or downward adjustment to the management fee is based on the Fund's relative investment performance as compared to an appropriate benchmark index. For the period, the total annual management fee rate, including the performance adjustment, was .66% of the Fund's average net assets.
Annual Report
Notes to Financial Statements - continued
(Amounts in thousands except ratios)
5. Fees and Other Transactions with Affiliates - continued
Transfer Agent Fees. Fidelity Investments Institutional Operations Company, Inc. (FIIOC), an affiliate of FMR, is the Fund's transfer, dividend disbursing and shareholder servicing agent. FIIOC receives account fees and asset-based fees that vary according to account size and type of account. FIIOC pays for typesetting, printing and mailing of shareholder reports, except proxy statements. For the period, the transfer agent fees were equivalent to an annual rate of .30% of average net assets.
Accounting and Security Lending Fees. Fidelity Service Company, Inc. (FSC), an affiliate of FMR, maintains the Fund's accounting records. The accounting fee is based on the level of average net assets for the month. Under a separate contract, FSC administers the security lending program. The security lending fee is based on the number and duration of lending transactions.
Brokerage Commissions. The Fund placed a portion of its portfolio transactions with brokerage firms which are affiliates of the investment adviser. The commissions paid to these affiliated firms were $76 for the period.
Interfund Lending Program. Pursuant to an Exemptive Order issued by the SEC, the Fund, along with other registered investment companies having management contracts with FMR, may participate in an interfund lending program. This program provides an alternative credit facility allowing the funds to borrow from, or lend money to, other participating affiliated funds. At period end, there were no interfund loans outstanding. The Fund's activity in this program during the period for which loans were outstanding was as follows:
Borrower or Lender | Average Daily Loan Balance | Weighted Average Interest Rate | Interest Expense |
Borrower | $ 30,922 | .46% | $ 4 |
6. Committed Line of Credit.
The Fund participates with other funds managed by FMR in a $3.75 billion credit facility (the "line of credit") to be utilized for temporary or emergency purposes to fund shareholder redemptions or for other short-term liquidity purposes. The Fund has agreed to pay commitment fees on its pro-rata portion of the line of credit, which amounted to $3 and is reflected in Miscellaneous Expense on the Statement of Operations. During the period, there were no borrowings on this line of credit.
Annual Report
7. Security Lending.
The Fund lends portfolio securities from time to time in order to earn additional income. On the settlement date of the loan, the Fund receives collateral (in the form of U.S. Treasury obligations, letters of credit and/or cash) against the loaned securities and maintains collateral in an amount not less than 100% of the market value of the loaned securities during the period of the loan. The market value of the loaned securities is determined at the close of business of the Fund and any additional required collateral is delivered to the Fund on the next business day. If the borrower defaults on its obligation to return the securities loaned because of insolvency or other reasons, a fund could experience delays and costs in recovering the securities loaned or in gaining access to the collateral. Any cash collateral received is invested in the Fidelity Securities Lending Cash Central Fund. The value of loaned securities and cash collateral at period end are disclosed on the Fund's Statement of Assets and Liabilities. Security lending income represents the income earned on investing cash collateral, less fees and expenses associated with the loan, plus any premium payments that may be received on the loan of certain types of securities. Security lending income is presented in the Statement of Operations as a component of income from Fidelity Central Funds. Net income from lending portfolio securities during the period amounted to $85.
8. Expense Reductions.
Many of the brokers with whom FMR places trades on behalf of the Fund provided services to the Fund in addition to trade execution. These services included payments of certain expenses on behalf of the Fund totaling $106 for the period.
9. Other.
The Fund's organizational documents provide former and current trustees and officers with a limited indemnification against liabilities arising in connection with the performance of their duties to the Fund. In the normal course of business, the Fund may also enter into contracts that provide general indemnifications. The Fund's maximum exposure under these arrangements is unknown as this would be dependent on future claims that may be made against the Fund. The risk of material loss from such claims is considered remote.
Annual Report
To the Trustees of Fidelity Commonwealth Trust and Shareholders of Fidelity Large Cap Stock Fund:
We have audited the accompanying statement of assets and liabilities of Fidelity Large Cap Stock Fund (the Fund), a fund of Fidelity Commonwealth Trust, including the schedule of investments, as of April 30, 2010, and the related statement of operations for the year then ended, the statement of changes in net assets for each of the two years in the period then ended, and the financial highlights for each of the five years in the period then ended. These financial statements and financial highlights are the responsibility of the Fund's management. Our responsibility is to express an opinion on these financial statements and financial highlights based on our audits.
We conducted our audits in accordance with standards of the Public Company Accounting Oversight Board (United States). Those standards require that we plan and perform the audit to obtain reasonable assurance about whether the financial statements and financial highlights are free of material misstatement. The Fund is not required to have, nor were we engaged to perform, an audit of its internal control over financial reporting. Our audits included consideration of internal control over financial reporting as a basis for designing audit procedures that are appropriate in the circumstances, but not for the purpose of expressing an opinion on the effectiveness of the Fund's internal control over financial reporting. Accordingly, we express no such opinion. An audit also includes examining, on a test basis, evidence supporting the amounts and disclosures in the financial statements, assessing the accounting principles used and significant estimates made by management, as well as evaluating the overall financial statement presentation. Our procedures included confirmation of securities owned as of April 30, 2010, by correspondence with the custodians and brokers; where replies were not received from brokers, we performed other auditing procedures. We believe that our audits provide a reasonable basis for our opinion.
In our opinion, the financial statements and financial highlights referred to above present fairly, in all material respects, the financial position of Fidelity Large Cap Stock Fund as of April 30, 2010, the results of its operations for the year then ended, the changes in its net assets for each of the two years in the period then ended, and the financial highlights for each of the five years in the period then ended, in conformity with accounting principles generally accepted in the United States of America.
/s/ Deloitte & Touche LLP
DELOITTE & TOUCHE LLP
Boston, Massachusetts
June 18, 2010
Annual Report
The Trustees, Member of the Advisory Board, and executive officers of the trust and fund, as applicable, are listed below. The Board of Trustees governs the fund and is responsible for protecting the interests of shareholders. The Trustees are experienced executives who meet periodically throughout the year to oversee the fund's activities, review contractual arrangements with companies that provide services to the fund, oversee management of the risks associated with such activities and contractual arrangements, and review the fund's performance. Except for James C. Curvey, each of the Trustees oversees 222 funds advised by FMR or an affiliate. Mr. Curvey oversees 411 funds advised by FMR or an affiliate.
The Trustees hold office without limit in time except that (a) any Trustee may resign; (b) any Trustee may be removed by written instrument, signed by at least two-thirds of the number of Trustees prior to such removal; (c) any Trustee who requests to be retired or who has become incapacitated by illness or injury may be retired by written instrument signed by a majority of the other Trustees; and (d) any Trustee may be removed at any special meeting of shareholders by a two-thirds vote of the outstanding voting securities of the trust. Each Trustee who is not an interested person (as defined in the 1940 Act) (Independent Trustee), shall retire not later than the last day of the calendar year in which his or her 72nd birthday occurs. The Independent Trustees may waive this mandatory retirement age policy with respect to individual Trustees. The executive officers and Advisory Board Member hold office without limit in time, except that any officer and Advisory Board Member may resign or may be removed by a vote of a majority of the Trustees at any regular meeting or any special meeting of the Trustees. Except as indicated, each individual has held the office shown or other offices in the same company for the past five years.
Experience, Skills, Attributes, and Qualifications of the Fund's Trustees. The Governance and Nominating Committee has adopted a statement of policy that describes the experience, qualifications, attributes, and skills that are necessary and desirable for potential Independent Trustee candidates (Statement of Policy). The Board believes that each Trustee satisfied at the time he or she was initially elected or appointed a Trustee, and continues to satisfy, the standards contemplated by the Statement of Policy. The Governance and Nominating Committee also engages professional search firms to help identify potential Independent Trustee candidates who have the experience, qualifications, attributes, and skills consistent with the Statement of Policy. From time to time, additional criteria based on the composition and skills of the current Independent Trustees, as well as experience or skills that may be appropriate in light of future changes to board composition, business conditions, and regulatory or other developments, have also been considered by the professional search firms and the Governance and Nominating Committee. In addition, the Board takes into account the Trustees' commitment and participation in Board and committee meetings, as well as their leadership of standing and ad hoc committees throughout their tenure.
In determining that a particular Trustee was and continues to be qualified to serve as a Trustee, the Board has considered a variety of criteria, none of which, in isolation, was controlling. The Board believes that, collectively, the Trustees have balanced and diverse experience, qualifications, attributes, and skills, which allow the Board to operate effectively in governing the fund and protecting the interests of shareholders. Information about the specific experience, skills, attributes, and qualifications of each Trustee, which in each case led to the Board's conclusion that the Trustee should serve (or continue to serve) as a trustee of the fund, is provided below.
Annual Report
Board Structure and Oversight Function. Edward C. Johnson 3d is an interested person (as defined in the 1940 Act) and currently serves as Chairman. The Trustees have determined that an interested Chairman is appropriate and benefits shareholders because an interested Chairman has a personal and professional stake in the quality and continuity of services provided to the fund. Independent Trustees exercise their informed business judgment to appoint an individual of their choosing to serve as Chairman, regardless of whether the Trustee happens to be independent or a member of management. The Independent Trustees have determined that they can act independently and effectively without having an Independent Trustee serve as Chairman and that a key structural component for assuring that they are in a position to do so is for the Independent Trustees to constitute a substantial majority for the Board. The Independent Trustees also regularly meet in executive session. Ned C. Lautenbach serves as Chairman of the Independent Trustees and as such (i) acts as a liaison between the Independent Trustees and management with respect to matters important to the Independent Trustees and (ii) with management prepares agendas for Board meetings.
Fidelity funds are overseen by different Boards of Trustees. The fund's Board oversees Fidelity's equity and high income funds and another Board oversees Fidelity's investment-grade bond, money market, and asset allocation funds. The asset allocation funds may invest in Fidelity funds overseen by the fund's Board. The use of separate Boards, each with its own committee structure, allows the Trustees of each group of Fidelity funds to focus on the unique issues of the funds they oversee, including common research, investment, and operational issues. On occasion, the separate Boards establish joint committees to address issues of overlapping consequences for the Fidelity funds overseen by each Board.
The Trustees operate using a system of committees to facilitate the timely and efficient consideration of all matters of importance to the Trustees, the fund, and fund shareholders and to facilitate compliance with legal and regulatory requirements and oversight of the fund's activities and associated risks. The Board, acting through its committees, has charged FMR and its affiliates with (i) identifying events or circumstances the occurrence of which could have demonstrably adverse effects on the fund's business and/or reputation; (ii) implementing processes and controls to lessen the possibility that such events or circumstances occur or to mitigate the effects of such events or circumstances if they do occur; and (iii) creating and maintaining a system designed to evaluate continuously business and market conditions in order to facilitate the identification and implementation processes described in (i) and (ii) above. Because the day-to-day operations and activities of the fund are carried out by or through FMR, its affiliates and other service providers, the fund's exposure to risks is mitigated but not eliminated by the processes overseen by the Trustees. While each of the Board's committees has responsibility for overseeing different aspects of the fund's activities, oversight is exercised primarily through the Operations, Audit, and Compliance Committees. Appropriate personnel, including but not limited to the fund's Chief Compliance Officer (CCO), FMR's internal auditor, the independent accountants, the fund's Treasurer and portfolio management personnel, make periodic reports to the Board's committees, as appropriate. The responsibilities of each committee, including their oversight responsibilities, are described further under "Standing Committees of the Fund's Trustees."
Annual Report
Trustees and Officers - continued
The fund's Statement of Additional Information (SAI) includes more information about the Trustees. To request a free copy, call Fidelity at 1-800-544-8544.
Interested Trustees*:
Correspondence intended for each Trustee who is an interested person may be sent to Fidelity Investments, 82 Devonshire Street, Boston, Massachusetts 02109.
Name, Age; Principal Occupations and Other Relevant Experience+ |
Edward C. Johnson 3d (79) |
| Year of Election or Appointment: 1974 Mr. Johnson is Trustee and Chairman of the Board of Trustees of certain Trusts. Mr. Johnson serves as Chief Executive Officer, Chairman, and a Director of FMR LLC; Chairman and a Director of FMR; Chairman and a Director of Fidelity Research & Analysis Company (FRAC); Chairman and a Director of Fidelity Investments Money Management, Inc.; and Chairman and a Director of FMR Co., Inc. In addition, Mr. Johnson serves as Chairman and Director of FIL Limited. Previously, Mr. Johnson served as President of FMR LLC (2006-2007). |
James C. Curvey (74) |
| Year of Election or Appointment: 2007 Mr. Curvey also serves as Trustee (2007-present) of other investment companies advised by FMR. Mr. Curvey is a Director of FMR and FMR Co., Inc. (2007-present). Mr. Curvey is also Vice Chairman (2006- present) and Director of FMR LLC. In addition, Mr. Curvey serves as an Overseer for the Boston Symphony Orchestra and a member of the Trustees of Villanova University. |
* Trustees have been determined to be "Interested Trustees" by virtue of, among other things, their affiliation with the trust or various entities under common control with FMR.
+ The information above includes each Trustee's principal occupation during the last five years and other information relating to the experience, attributes, and skills relevant to each Trustee's qualifications to serve as a Trustee, which led to the conclusion that each Trustee should serve as a Trustee for the fund.
Annual Report
Independent Trustees:
Correspondence intended for each Independent Trustee (that is, the Trustees other than the Interested Trustees) may be sent to Fidelity Investments, P.O. Box 55235, Boston, Massachusetts 02205-5235.
Name, Age; Principal Occupations and Other Relevant Experience+ |
Dennis J. Dirks (61) |
| Year of Election or Appointment: 2005 Prior to his retirement in May 2003, Mr. Dirks was Chief Operating Officer and a member of the Board of The Depository Trust & Clearing Corporation (DTCC). He also served as President, Chief Operating Officer, and Board member of The Depository Trust Company (DTC) and President and Board member of the National Securities Clearing Corporation (NSCC). In addition, Mr. Dirks served as Chief Executive Officer and Board member of the Government Securities Clearing Corporation, Chief Executive Officer and Board member of the Mortgage-Backed Securities Clearing Corporation, as a Trustee and a member of the Finance Committee of Manhattan College (2005-2008), and as a Trustee and a member of the Finance Committee of AHRC of Nassau County (2006-2008). Currently, Mr. Dirks serves as a member of the Board of Directors for The Brookville Center for Children's Services, Inc. (2009-present). |
Alan J. Lacy (56) |
| Year of Election or Appointment: 2008 Mr. Lacy serves as Senior Adviser (2007-present) of Oak Hill Capital Partners, L.P. (private equity). Mr. Lacy also served as Chief Executive Officer (2000-2005) and Vice Chairman (2005-2006) of Sears Holdings Corporation and Sears, Roebuck and Co. (retail). In addition, Mr. Lacy serves as a member of the Board of Directors of The Western Union Company (global money transfer, 2006-present) and Bristol-Myers Squibb Company (global pharmaceuticals, 2007-present). Mr. Lacy is Chairman (2008-present) and a member (2006-present) of the Board of Trustees of The National Parks Conservation Association. |
Ned C. Lautenbach (66) |
| Year of Election or Appointment: 2000 Mr. Lautenbach is Chairman of the Independent Trustees of the Equity and High Income Funds (2006-present). Mr. Lautenbach is an Advisory Partner of Clayton, Dubilier & Rice, Inc. (private equity investment, 2008-present) and was previously a Partner of Clayton, Dubilier & Rice, Inc. (1998-2008). Previously, Mr. Lautenbach was with the International Business Machines Corporation (IBM) from 1968 until his retirement in 1998. Mr. Lautenbach serves as a Director of Eaton Corporation (diversified industrial) as well as the Philharmonic Center for the Arts in Naples, Florida. Mr. Lautenbach is also a member of the Board of Trustees of Fairfield University (2005-present), as well as a member of the Council on Foreign Relations. Previously, Mr. Lautenbach served as a Director of Sony Corporation (2006-2007). |
Joseph Mauriello (65) |
| Year of Election or Appointment: 2008 Prior to his retirement in January 2006, Mr. Mauriello served in numerous senior management positions including Deputy Chairman and Chief Operating Officer (2004-2005), and Vice Chairman of Financial Services (2002-2004) of KPMG LLP US (professional services, 1965-2005). Mr. Mauriello currently serves as a member of the Board of Directors of XL Capital Ltd. (global insurance and re-insurance, 2006-present) and of Arcadia Resources Inc. (health care services and products, 2007- present). Previously, Mr. Mauriello served as a Director of the Hamilton Funds of the Bank of New York (2006-2007). |
Cornelia M. Small (65) |
| Year of Election or Appointment: 2005 Ms. Small is a member of the Board of Directors of the Teagle Foundation (2009-present). Ms. Small is also a member of the Investment Committee, and Chair (2008-present) and a member of the Board of Trustees of Smith College. In addition, Ms. Small serves on the Investment Committee of the Berkshire Taconic Community Foundation (2008-present). Previously, Ms. Small served as Chairperson of the Investment Committee (2002- 2008) of Smith College. In addition, Ms. Small served as Chief Investment Officer, Director of Global Equity Investments, and a member of the Board of Directors of Scudder, Stevens & Clark and Scudder Kemper Investments. |
William S. Stavropoulos (70) |
| Year of Election or Appointment: 2002 Mr. Stavropoulos is Vice Chairman of the Independent Trustees of the Equity and High Income Funds (2006-present). Mr. Stavropoulos serves as President and Founder of the Michigan Baseball Foundation, the Great Lakes Loons (2007-present). Mr. Stavropoulos is Chairman Emeritus of the Board of Directors of The Dow Chemical Company, where he previously served in numerous senior management positions, including President, CEO (1995-2000; 2002-2004), Chairman of the Executive Committee (2000-2006), and as a member of the Board of Directors (1990-2006). Currently, Mr. Stavropoulos is a Director of Teradata Corporation (data warehousing and technology solutions, 2008-present), Chemical Financial Corporation, Maersk Inc. (industrial conglomerate), Tyco International, Inc. (multinational manufacturing and services, 2007-present), and a member of the Advisory Board for Metalmark Capital (private equity investment, 2005-present). Mr. Stavropoulos is a special advisor to Clayton, Dubilier & Rice, Inc. (private equity investment). In addition, Mr. Stavropoulos is a member of the University of Notre Dame Advisory Council for the College of Science. |
David M. Thomas (60) |
| Year of Election or Appointment: 2008 Previously, Mr. Thomas served as Executive Chairman (2005-2006) and Chairman and Chief Executive Officer (2000-2005) of IMS Health, Inc. (pharmaceutical and healthcare information solutions). In addition, Mr. Thomas serves as a member of the Board of Directors of Fortune Brands, Inc. (consumer products), and Interpublic Group of Companies, Inc. (marketing communication, 2004-present). |
Michael E. Wiley (59) |
| Year of Election or Appointment: 2008 Mr. Wiley also serves as a Director of Asia Pacific Exploration Consolidated (international oil and gas exploration and production, 2008- present), and as a member of the Board of Trustees of the University of Tulsa (2000-2006; 2007-present). Mr. Wiley serves as a Director of Tesoro Corporation (independent oil refiner and marketer, 2005- present), and a Director of Bill Barrett Corporation (exploration and production, 2005-present). In addition, Mr. Wiley also serves as a Director of Post Oak Bank (privately-held bank, 2004-present). Previously, Mr. Wiley served as a Sr. Energy Advisor of Katzenbach Partners, LLC (consulting, 2006-2007), as an Advisory Director of Riverstone Holdings (private investment), Chairman, President, and CEO of Baker Hughes, Inc. (oilfield services, 2000-2004), and as Director of Spinnaker Exploration Company (exploration and production, 2001-2005). |
Annual Report
Trustees and Officers - continued
+ The information above includes each Trustee's principal occupation during the last five years and other information relating to the experience, attributes, and skills relevant to each Trustee's qualifications to serve as a Trustee, which led to the conclusion that each Trustee should serve as a Trustee for the fund.
Advisory Board Member and Executive Officers:
Correspondence intended for each executive officer and Peter S. Lynch may be sent to Fidelity Investments, 82 Devonshire Street, Boston, Massachusetts 02109.
Name, Age; Principal Occupation |
Peter S. Lynch (66) |
| Year of Election or Appointment: 2003 Member of the Advisory Board of Fidelity's Equity and High Income Funds. Mr. Lynch is Vice Chairman and a Director of FMR and FMR Co., Inc. In addition, Mr. Lynch serves as a Trustee of Boston College and as the Chairman of the Inner-City Scholarship Fund. Previously, Mr. Lynch served on the Special Olympics International Board of Directors (1997-2006). |
Kenneth B. Robins (40) |
| Year of Election or Appointment: 2008 President and Treasurer of Fidelity's Equity and High Income Funds. Mr. Robins also serves as President and Treasurer (2010-present) and Assistant Treasurer (2009-present) of other Fidelity funds and is an employee of Fidelity Investments (2004-present). Previously, Mr. Robins served as Deputy Treasurer of the Fidelity funds (2005-2008) and Treasurer and Chief Financial Officer of The North Carolina Capital Management Trust: Cash and Term Portfolios (2006-2008). |
Bruce T. Herring (44) |
| Year of Election or Appointment: 2006 Vice President of certain Equity Funds. Mr. Herring also serves as Group Chief Investments Officer of FMR. Previously, Mr. Herring served as a portfolio manager for Fidelity U.S. Equity Funds. |
Brian B. Hogan (45) |
| Year of Election or Appointment: 2009 Vice President of certain Equity Funds and Vice President of Sector Funds. Mr. Hogan also serves as Senior Vice President, Equity Research of FMR (2006-present) and President of FMR's Equity Division (2009-present). Previously, Mr. Hogan served as a portfolio manager. |
Scott C. Goebel (42) |
| Year of Election or Appointment: 2008 Secretary and Chief Legal Officer (CLO) of the Fidelity funds. Mr. Goebel also serves as General Counsel, Secretary, and Senior Vice President of FMR (2008-present) and FMR Co., Inc. (2008-present); Deputy General Counsel of FMR LLC; Chief Legal Officer of Fidelity Management & Research (Hong Kong) Limited (2008-present) and Assistant Secretary of Fidelity Management & Research (Japan) Inc. (2008-present), Fidelity Investments Money Management, Inc. (2008-present), Fidelity Management & Research (U.K.) Inc. (2008-present), and Fidelity Research and Analysis Company (2008-present). Previously, Mr. Goebel served as Assistant Secretary of the Funds (2007-2008) and as Vice President and Secretary of Fidelity Distributors Corporation (FDC) (2005-2007). |
William C. Coffey (41) |
| Year of Election or Appointment: 2009 Assistant Secretary of Fidelity's Equity and High Income Funds. Mr. Coffey also serves as Senior Vice President and Deputy General Counsel of FMR LLC (2010-present), and is an employee of Fidelity Investments. Previously, Mr. Coffey served as Vice President and Associate General Counsel of FMR LLC (2005-2009). |
Holly C. Laurent (55) |
| Year of Election or Appointment: 2008 Anti-Money Laundering (AML) Officer of the Fidelity funds. Ms. Laurent is an employee of Fidelity Investments. Previously, Ms. Laurent was Senior Vice President and Head of Legal for Fidelity Business Services India Pvt. Ltd. (2006-2008), and Senior Vice President, Deputy General Counsel and Group Head for FMR LLC (2005-2006). |
Christine Reynolds (51) |
| Year of Election or Appointment: 2008 Chief Financial Officer of the Fidelity funds. Ms. Reynolds became President of Fidelity Pricing and Cash Management Services (FPCMS) in August 2008. Ms. Reynolds served as Chief Operating Officer of FPCMS (2007-2008). Previously, Ms. Reynolds served as President, Treasurer, and Anti-Money Laundering officer of the Fidelity funds (2004-2007). |
Kenneth A. Rathgeber (62) |
| Year of Election or Appointment: 2004 Chief Compliance Officer of Fidelity's Equity and High Income Funds. Mr. Rathgeber is Chief Compliance Officer of Fidelity Management & Research (Hong Kong) Limited (2008-present), Fidelity Management & Research (Japan) Inc. (2008-present), FMR (2005-present), FMR Co., Inc. (2005-present), Fidelity Management & Research (U.K.) Inc. (2005-present), Fidelity Research & Analysis Company (2005-present), Fidelity Investments Money Management, Inc. (2005-present), Pyramis Global Advisors, LLC (2005-present), and Strategic Advisers, Inc. (2005-present). |
Jeffrey S. Christian (48) |
| Year of Election or Appointment: 2009 Deputy Treasurer of the Fidelity funds. Mr. Christian is an employee of Fidelity Investments. Previously, Mr. Christian served as Chief Financial Officer (2008-2009) of certain Fidelity funds and Senior Vice President of Fidelity Pricing and Cash Management Services (FPCMS) (2004-2009). |
Bryan A. Mehrmann (49) |
| Year of Election or Appointment: 2005 Deputy Treasurer of the Fidelity funds. Mr. Mehrmann is an employee of Fidelity Investments. |
Adrien E. Deberghes (42) |
| Year of Election or Appointment: 2008 Deputy Treasurer of Fidelity's Equity and High Income Funds. Mr. Deberghes is an employee of Fidelity Investments (2008-present). Previously, Mr. Deberghes served as Senior Vice President of Mutual Fund Administration at State Street Corporation (2007-2008), Senior Director of Mutual Fund Administration at Investors Bank & Trust (2005-2007), and Director of Finance for Dunkin' Brands (2000-2005). |
John R. Hebble (51) |
| Year of Election or Appointment: 2009 Assistant Treasurer of Fidelity's Equity and High Income Funds. Mr. Hebble also serves as Treasurer and Chief Financial Officer of The North Carolina Capital Management Trust: Cash and Term Portfolio (2008-present), President and Treasurer of other Fidelity funds (2008- present) and is an employee of Fidelity Investments. |
Gary W. Ryan (51) |
| Year of Election or Appointment: 2005 Assistant Treasurer of the Fidelity funds. Mr. Ryan is an employee of Fidelity Investments. Previously, Mr. Ryan served as Vice President of Fund Reporting in Fidelity Pricing and Cash Management Services (FPCMS) (1999-2005). |
Annual Report
The Board of Trustees of Fidelity Large Cap Stock Fund voted to pay on June 14, 2010, to shareholders of record at the opening of business on June 11, 2010, a distribution of $.005 per share derived from capital gains realized from sales of portfolio securities and a dividend of $.01 per share from net investment income.
The fund designates 100% of the dividends distributed during the fiscal year as qualifying for the dividends-received deduction for corporate shareholders.
The fund designates 100% of the dividends distributed during the fiscal year as amounts which may be taken into account as a dividend for the purposes of the maximum rate under section 1(h)(11) of the Internal Revenue Code.
The fund will notify shareholders in January 2011 of amounts for use in preparing 2010 income tax returns.
Annual Report
Managing Your Investments
Fidelity offers several ways to conveniently manage your personal investments via your telephone or PC. You can access your account information, conduct trades and research your investments 24 hours a day.
By Phone
Fidelity Automated Service Telephone provides a single toll-free number to access account balances, positions, quotes and trading. It's easy to navigate the service, and on your first call, the system will help you create a personal identification number (PIN) for security.
(phone_graphic)
Fidelity Automated
Service Telephone (FAST®)
1-800-544-5555
Press
 For mutual fund and brokerage trading.
 For quotes.*
 For account balances and holdings.
 To review orders and mutual
fund activity.
 To change your PIN.

 To speak to a Fidelity representative.
By PC
Fidelity's web site on the Internet provides a wide range of information, including daily financial news, fund performance, interactive planning tools and news about Fidelity products and services.
(computer_graphic)
Fidelity's Web Site
www.fidelity.com
* When you call the quotes line, please remember that a fund's yield and return will vary and, except for money market funds, share price will also vary. This means that you may have a gain or loss when you sell your shares. There is no assurance that money market funds will be able to maintain a stable $1 share price; an investment in a money market fund is not insured or guaranteed by the U.S. government. Total returns are historical and include changes in share price, reinvestment of dividends and capital gains, and the effects of any sales charges.
Annual Report
To Write Fidelity
We'll give your correspondence immediate attention and send you written confirmation upon completion of your request.
(letter_graphic)
Making Changes
To Your Account
(such as changing name, address, bank, etc.)
Fidelity Investments
P.O. Box 770001
Cincinnati, OH 45277-0002
(letter_graphic)
For Non-Retirement
Accounts
Buying shares
Fidelity Investments
P.O. Box 770001
Cincinnati, OH 45277-0003
Overnight Express
Fidelity Investments
Attn: Distribution Services
100 Crosby Parkway - KC1H
Covington, KY 41015
Selling shares
Fidelity Investments
P.O. Box 770001
Cincinnati, OH 45277-0035
Overnight Express
Fidelity Investments
Attn: Distribution Services
100 Crosby Parkway - KC1H
Covington, KY 41015
General Correspondence
Fidelity Investments
P.O. Box 500
Merrimack, NH 03054-0500
(letter_graphic)
For Retirement
Accounts
Buying shares
Fidelity Investments
P.O. Box 770001
Cincinnati, OH 45277-0003
Selling shares
Fidelity Investments
P.O. Box 770001
Cincinnati, OH 45277-0035
Overnight Express
Fidelity Investments
Attn: Distribution Services
100 Crosby Parkway - KC1H
Covington, KY 41015
General Correspondence
Fidelity Investments
P.O. Box 500
Merrimack, NH 03054-0500
Annual Report
To Visit Fidelity
For directions and hours,
please call 1-800-544-9797.
Arizona
7001 West Ray Road
Chandler, AZ
15445 N. Scottsdale Road
Scottsdale, AZ
17550 North 75th Avenue
Glendale, AZ
5330 E. Broadway Blvd
Tucson, AZ
California
815 East Birch Street
Brea, CA
1411 Chapin Avenue
Burlingame, CA
851 East Hamilton Avenue
Campbell, CA
601 Larkspur Landing Circle
Larkspur, CA
2000 Avenue of the Stars
Los Angeles, CA
27101 Puerta Real
Mission Viejo, CA
73575 El Paseo
Palm Desert, CA
251 University Avenue
Palo Alto, CA
123 South Lake Avenue
Pasadena, CA
16656 Bernardo Ctr. Drive
Rancho Bernardo, CA
1220 Roseville Parkway
Roseville, CA
1740 Arden Way
Sacramento, CA
7676 Hazard Center Drive
San Diego, CA
11943 El Camino Real
San Diego, CA
8 Montgomery Street
San Francisco, CA
3793 State Street
Santa Barbara, CA
1200 Wilshire Boulevard
Santa Monica, CA
398 West El Camino Real
Sunnyvale, CA
111 South Westlake Blvd
Thousand Oaks, CA
21701 Hawthorne Boulevard
Torrance, CA
2001 North Main Street
Walnut Creek, CA
6326 Canoga Avenue
Woodland Hills, CA
2211 Michelson Drive
Irvine, CA
Colorado
281 East Flatiron Circle
Broomfield, CO
1625 Broadway
Denver, CO
9185 Westview Road
Lone Tree, CO
Connecticut
48 West Putnam Avenue
Greenwich, CT
265 Church Street
New Haven, CT
300 Atlantic Street
Stamford, CT
29 South Main Street
West Hartford, CT
1261 Post Road
Fairfield, CT
Delaware
400 Delaware Avenue
Wilmington, DE
Florida
175 East Altamonte Drive
Altamonte Springs, FL
1400 Glades Road
Boca Raton, FL
121 Alhambra Plaza
Coral Gables, FL
2948 N. Federal Highway
Ft. Lauderdale, FL
4671 Town Center Parkway
Jacksonville, FL
8880 Tamiami Trail, North
Naples, FL
230 Royal Palm Way
Palm Beach, FL
3501 PGA Boulevard
Palm Beach Gardens, FL
3550 Tamiami Trail, South
Sarasota, FL
1502 N. Westshore Blvd.
Tampa, FL
2465 State Road 7
Wellington, FL
Georgia
3242 Peachtree Road
Atlanta, GA
1000 Abernathy Road
Atlanta, GA
Illinois
One North LaSalle Street
Chicago, IL
401 North Michigan Avenue
Chicago, IL
One Skokie Valley Road
Highland Park, IL
1415 West 22nd Street
Oak Brook, IL
15105 S LaGrange Road
Orland Park, IL
1572 East Golf Road
Schaumburg, IL
1823 Freedom Drive
Naperville, IL
Indiana
8480 Keystone Crossing
Indianapolis, IN
Kansas
5400 College Boulevard
Overland Park, KS
Maine
Three Canal Plaza
Portland, ME
Maryland
7315 Wisconsin Avenue
Bethesda, MD
610 York Road
Towson, MD
Massachusetts
801 Boylston Street
Boston, MA
155 Congress Street
Boston, MA
300 Granite Street
Braintree, MA
44 Mall Road
Burlington, MA
238 Main Street
Cambridge, MA
200 Endicott Street
Danvers, MA
Fidelity Brokerage Services, Inc., 100 Summer St., Boston, MA 02110 Member NYSE/SIPC
Annual Report
405 Cochituate Road
Framingham, MA
551 Boston Turnpike
Shrewsbury, MA
Michigan
500 E. Eisenhower Pkwy.
Ann Arbor, MI
280 N. Old Woodward Ave.
Birmingham, MI
30200 Northwestern Hwy.
Farmington Hills, MI
43420 Grand River Avenue
Novi, MI
3480 28th Street
Grand Rapids, MI
2425 S. Linden Road STE E
Flint, MI
Minnesota
7740 France Avenue South
Edina, MN
8342 3rd Street North
Oakdale, MN
Missouri
1524 South Lindbergh Blvd.
St. Louis, MO
Nevada
2225 Village Walk Drive
Henderson, NV
New Jersey
501 Route 73 South
Marlton, NJ
150 Essex Street
Millburn, NJ
35 Morris Street
Morristown, NJ
396 Route 17, North
Paramus, NJ
3518 Route 1 North
Princeton, NJ
530 Broad Street
Shrewsbury, NJ
New Mexico
2261 Q Street NE
Albuquerque, NM
New York
1130 Franklin Avenue
Garden City, NY
37 West Jericho Turnpike
Huntington Station, NY
1271 Avenue of the Americas
New York, NY
980 Madison Avenue
New York, NY
61 Broadway
New York, NY
350 Park Avenue
New York, NY
200 Fifth Avenue
New York, NY
733 Third Avenue
New York, NY
2070 Broadway
New York, NY
1075 Northern Blvd.
Roslyn, NY
799 Central Park Avenue
Scarsdale, NY
3349 Monroe Avenue
Rochester, NY
North Carolina
4611 Sharon Road
Charlotte, NC
7011 Fayetteville Road
Durham, NC
Ohio
3805 Edwards Road
Cincinnati, OH
1324 Polaris Parkway
Columbus, OH
1800 Crocker Road
Westlake, OH
28699 Chagrin Boulevard
Woodmere Village, OH
Oregon
7493 SW Bridgeport Road
Tigard, OR
Pennsylvania
600 West DeKalb Pike
King of Prussia, PA
1735 Market Street
Philadelphia, PA
12001 Perry Highway
Wexford, PA
Rhode Island
10 Memorial Boulevard
Providence, RI
Tennessee
3018 Peoples Street
Johnson City, TN
7628 West Farmington Blvd.
Germantown, TN
2035 Mallory Lane
Franklin, TN
Texas
10000 Research Boulevard
Austin, TX
4001 Northwest Parkway
Dallas, TX
12532 Memorial Drive
Houston, TX
2701 Drexel Drive
Houston, TX
6560 Fannin Street
Houston, TX
1701 Lake Robbins Drive
The Woodlands, TX
6500 N. MacArthur Blvd.
Irving, TX
6005 West Park Boulevard
Plano, TX
1576 East Southlake Blvd.
Southlake, TX
15600 Southwest Freeway
Sugar Land, TX
139 N. Loop 1604 East
San Antonio, TX
Utah
279 West South Temple
Salt Lake City, UT
Virginia
1861 International Drive
McLean, VA
11957 Democracy Drive
Reston, VA
Washington
10500 NE 8th Street
Bellevue, WA
1518 6th Avenue
Seattle, WA
304 Strander Blvd
Tukwila, WA
Washington, DC
1900 K Street, N.W.
Washington, DC
Wisconsin
16020 West Bluemound Road
Brookfield, WI
Annual Report
Investment Adviser
Fidelity Management & Research Company
Boston, MA
Investment Sub-Advisers
FMR Co., Inc.
Fidelity Research & Analysis Company
Fidelity Management & Research
(U.K.) Inc.
FIL Investments (Japan) Limited
FIL Investment Advisors
FIL Investment Advisors (U.K.) Ltd.
Fidelity Management & Research
(Hong Kong) Limited
Fidelity Management & Research
(Japan) Inc.
General Distributor
Fidelity Distributors Corporation
Boston, MA
Transfer and Service Agents
Fidelity Investments Institutional
Operations Company, Inc.
Boston, MA
Fidelity Service Company, Inc.
Boston, MA
Custodian
Brown Brothers Harriman & Co.
Boston, MA
The Fidelity Telephone Connection
Mutual Fund 24-Hour Service
Exchanges/Redemptions
and Account Assistance 1-800-544-6666
Product Information 1-800-544-6666
Retirement Accounts 1-800-544-4774
(8 a.m. - 9 p.m.)
TDD Service 1-800-544-0118
for the deaf and hearing impaired
(9 a.m. - 9 p.m. Eastern time)
Fidelity Automated Service
Telephone (FAST®) 1-800-544-5555
Automated line for quickest service
LCS-UANN-0610
1.784725.107

Fidelity®
Mid-Cap Stock
Fund
Annual Report
April 30, 2010
(2_fidelity_logos) (Registered_Trademark)
Contents
Chairman's Message | <Click Here> | The Chairman's message to shareholders. |
Performance | <Click Here> | How the fund has done over time. |
Management's Discussion | <Click Here> | The manager's review of fund performance, strategy and outlook. |
Shareholder Expense Example | <Click Here> | An example of shareholder expenses. |
Investment Changes | <Click Here> | A summary of major shifts in the fund's investments over the past six months. |
Investments | <Click Here> | A complete list of the fund's investments with their market values. |
Financial Statements | <Click Here> | Statements of assets and liabilities, operations, and changes in net assets, as well as financial highlights. |
Notes | <Click Here> | Notes to the financial statements. |
Report of Independent Registered Public Accounting Firm | <Click Here> | |
Trustees and Officers | <Click Here> | |
Distributions | <Click Here> | |
To view a fund's proxy voting guidelines and proxy voting record for the 12-month period ended June 30, visit http://www.fidelity.com/proxyvotingresults or visit the Securities and Exchange Commission's (SEC) web site at http://www.sec.gov. You may also call 1-800-544-8544 to request a free copy of the proxy voting guidelines.
Standard & Poor's, S&P and S&P 500 are registered service marks of The McGraw-Hill Companies, Inc. and have been licensed for use by Fidelity Distributors Corporation.
Other third party marks appearing herein are the property of their respective owners.
All other marks appearing herein are registered or unregistered trademarks or service marks of FMR LLC or an affiliated company.
This report and the financial statements contained herein are submitted for the general information of the shareholders of the fund. This report is not authorized for distribution to prospective investors in the fund unless preceded or accompanied by an effective prospectus.
A fund files its complete schedule of portfolio holdings with the SEC for the first and third quarters of each fiscal year on Form N-Q. Forms N-Q are available on the SEC's web site at http://www.sec.gov. A fund's Forms N-Q may be reviewed and copied at the SEC's Public Reference Room in Washington, DC. Information regarding the operation of the SEC's Public Reference Room may be obtained by calling 1-800-SEC-0330. For a complete list of a fund's portfolio holdings, view the most recent holdings listing, semiannual report, or annual report on Fidelity's web site at http://www.fidelity.com or http://www.advisor.fidelity.com, as applicable.
NOT FDIC INSURED • MAY LOSE VALUE • NO BANK GUARANTEE
Neither the fund nor Fidelity Distributors Corporation is a bank.
Annual Report
(photo_of_Edward_C_Johnson_3d)
Dear Shareholder:
Global capital markets have been predominantly positive thus far in 2010, overcoming some early volatility to continue the upward trend that began in March 2009. Year to date, U.S. stocks have seen the biggest gains, outpacing the performance of foreign equities, which has been hampered by a rebounding dollar. Financial markets are always unpredictable, of course, but there also are several time-tested investment principles that can help put the odds in your favor.
One of the basic tenets is to invest for the long term. Over time, riding out the markets' inevitable ups and downs has proven much more effective than selling into panic or chasing the hottest trend. Even missing only a few of the markets' best days can significantly diminish investor returns. Patience also affords the benefits of compounding - of earning interest on additional income or reinvested dividends and capital gains. There can be tax advantages and cost benefits to consider as well. While staying the course doesn't eliminate risk, it can considerably lessen the effect of short-term declines.
You can further manage your investing risk through diversification. And today, more than ever, geographic diversification should be taken into account. Studies indicate that asset allocation is the single most important determinant of a portfolio's long-term success. The right mix of stocks, bonds and cash - aligned to your particular risk tolerance and investment objective - is very important. Age-appropriate rebalancing is also an essential aspect of asset allocation. For younger investors, an emphasis on equities - which historically have been the best-performing asset class over time - is encouraged. As investors near their specific goal, such as retirement or sending a child to college, consideration may be given to replacing volatile assets (e.g. common stocks) with more-stable fixed investments (bonds or savings plans).
A third principle - investing regularly - can help lower the average cost of your purchases. Investing a certain amount of money each month or quarter helps ensure you won't pay for all your shares at market highs. This strategy - known as dollar cost averaging - also reduces "emotion" from investing, helping shareholders avoid selling weak performers just prior to an upswing, or chasing a hot performer just before a correction.
We invite you to contact us via the Internet, through our Investor Centers or by phone. It is our privilege to provide you the information you need to make the investments that are right for you.
Sincerely,
(The chairman's signature appears here.)
Edward C. Johnson 3d
Annual Report
Average annual total return reflects the change in the value of an investment, assuming reinvestment of the class' dividend income and capital gains (the profits earned upon the sale of securities that have grown in value, if any) and assuming a constant rate of performance each year. The $10,000 table and the fund's returns do not reflect the deduction of taxes that a shareholder would pay on fund distributions or the redemption of fund shares. During periods of reimbursement by Fidelity, a fund's total return will be greater than it would be had the reimbursement not occurred. How a fund did yesterday is no guarantee of how it will do tomorrow.
Average Annual Total Returns
Periods ended April 30, 2010 | Past 1
year | Past 5
years | Past 10
years |
Fidelity® Mid-Cap Stock Fund | 64.11% | 8.19% | 3.70% |
$10,000 Over 10 Years
Let's say hypothetically that $10,000 was invested in Fidelity Mid-Cap Stock Fund, a class of the fund, on April 30, 2000. The chart shows how the value of your investment would have changed, and also shows how the S&P® MidCap 400 Index performed over the same period.
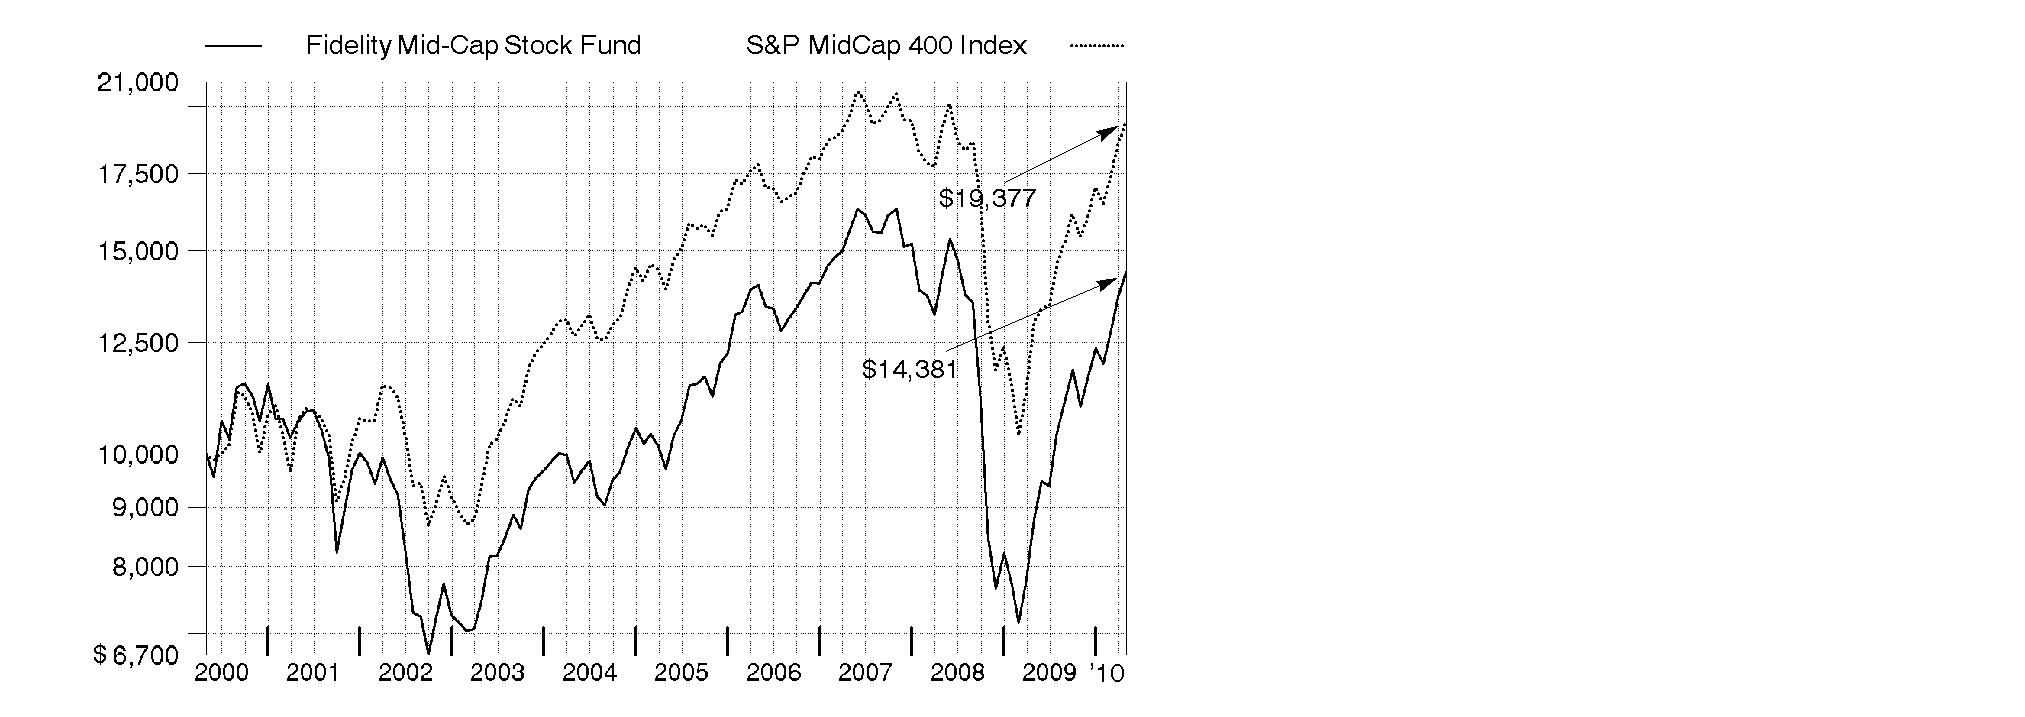
Annual Report
Market Recap: Blistering stock market declines sustained during the global economic crisis were largely offset in the 12-month period ending April 30, 2010, as unprecedented government stimulus took hold, significant corporate cost cutting paved the way for encouraging earnings reports, credit conditions improved and consumer fears began to ease. After hitting woeful lows in March 2009, stock markets experienced a steady uptrend that coincided with the near culmination of the Great Recession that began in late 2007. Although a weak labor market still lingered, by mid-April, the blue-chip Dow Jones Industrial AverageSM pushed above the 11,000 mark for the first time in 19 months, closing the period with a 38.69% gain. Impressive returns were widespread, with the S&P 500® Index rising 38.84% and the technology-laden Nasdaq Composite® Index increasing 44.63%. Small-cap stocks continued to outperform their larger counterparts, with the Russell 2000® Index returning 48.95%. Despite widening sovereign debt problems overseas, foreign equities still posted solid gains, with the MSCI® EAFE® (Europe, Australasia, Far East) Index - a measure of developed markets outside the U.S. and Canada - rising 34.56%.
Comments from Shep Perkins, Portfolio Manager of Fidelity® Mid-Cap Stock Fund: The fund's Retail Class shares returned 64.11%, easily outpacing the S&P® MidCap 400 Index, which gained 48.92%. Security selection was the dominant factor, led by financials, telecommunication services and industrials. Security selection and an overweighting in consumer discretionary also helped a lot. Conversely, the fund was hurt by weak stock picks within health care. Holdings in information technology and energy also detracted - despite favorable sector weightings - as did an overweighting in telecommunication services. In terms of individual securities, several financials names boosted returns. Genworth Financial - a life and mortgage insurer - topped our list of contributors, along with Zions Bancorporation, KKR Financial and Regions Financial. Elsewhere, tw telecom and Flextronics - a maker of electronic equipment - were standouts, rebounding nicely during the period. Conversely, global pharmaceutical company Cephalon and Intrepid Potash were big detractors from the health care and materials sectors, respectively. Within technology, Taiwan Semiconductor, Juniper Networks and QUALCOMM all dragged on performance, as did not owning index component Cree. Since the benchmark index represents only about 20% of my investable universe, most of the portfolio's holdings were out-of-index positions.
The views expressed above reflect those of the portfolio manager(s) only through the end of the period as stated on the cover of this report and do not necessarily represent the views of Fidelity or any other person in the Fidelity organization. Any such views are subject to change at any time based upon market or other conditions and Fidelity disclaims any responsibility to update such views. These views may not be relied on as investment advice and, because investment decisions for a Fidelity fund are based on numerous factors, may not be relied on as an indication of trading intent on behalf of any Fidelity fund.
Annual Report
Shareholder Expense Example
As a shareholder of the Fund, you incur two types of costs: (1) transaction costs, including redemption fees, and (2) ongoing costs, including management fees and other Fund expenses. This Example is intended to help you understand your ongoing costs (in dollars) of investing in the Fund and to compare these costs with the ongoing costs of investing in other mutual funds.
The Example is based on an investment of $1,000 invested at the beginning of the period and held for the entire period (November 1, 2009 to April 30, 2010).
Actual Expenses
The first line of the accompanying table for each class of the Fund provides information about actual account values and actual expenses. You may use the information in this line, together with the amount you invested, to estimate the expenses that you paid over the period. Simply divide your account value by $1,000.00 (for example, an $8,600 account value divided by $1,000.00 = 8.6), then multiply the result by the number in the first line for a class of the Fund under the heading entitled "Expenses Paid During Period" to estimate the expenses you paid on your account during this period. A small balance maintenance fee of $12.00 that is charged once a year may apply for certain accounts with a value of less than $2,000. This fee is not included in the table below. If it was, the estimate of expenses you paid during the period would be higher, and your ending account value lower, by this amount. In addition, the Fund, as a shareholder in the underlying Fidelity Central Funds, will indirectly bear its pro-rata share of the fees and expenses incurred by the underlying Fidelity Central Funds. These fees and expenses are not included in the Fund's annualized expense ratio used to calculate the expense estimate in the table below.
Hypothetical Example for Comparison Purposes
The second line of the accompanying table for each class of the Fund provides information about hypothetical account values and hypothetical expenses based on a Class' actual expense ratio and an assumed rate of return of 5% per year before expenses, which is not the Class' actual return. The hypothetical account values and expenses may not be used to estimate the actual ending account balance or expenses you paid for the period. You may use this information to compare the ongoing costs of investing in the Fund and other funds. To do so, compare this 5% hypothetical example with the 5% hypothetical examples that appear in the shareholder reports of the other funds. A small balance maintenance fee of $12.00 that is charged once a year may apply for certain accounts with a value of less than $2,000. This fee is not included in the table below. If it was, the estimate of expenses you paid during the period would be higher, and your ending account value lower, by this amount. In addition, the Fund, as a shareholder in the underlying Fidelity Central Funds, will indirectly bear its pro-rata share of the fees and expenses incurred by the underlying Fidelity Central Funds. These fees and expenses are not included in the Fund's annualized expense ratio used to calculate the expense estimate in the table below.
Please note that the expenses shown in the table are meant to highlight your ongoing costs only and do not reflect any transaction costs. Therefore, the second line of the table is useful in comparing ongoing costs only, and will not help you determine the relative total costs of owning different funds. In addition, if these transactional costs were included, your costs would have been higher.
Annual Report
| Annualized Expense Ratio | Beginning
Account Value
November 1, 2009 | Ending
Account Value
April 30, 2010 | Expenses Paid
During Period*
November 1, 2009
to April 30, 2010 |
Mid-Cap Stock | .66% | | | |
Actual | | $ 1,000.00 | $ 1,308.00 | $ 3.78 |
HypotheticalA | | $ 1,000.00 | $ 1,021.52 | $ 3.31 |
Class K | .45% | | | |
Actual | | $ 1,000.00 | $ 1,309.30 | $ 2.58 |
HypotheticalA | | $ 1,000.00 | $ 1,022.56 | $ 2.26 |
A 5% return per year before expenses
* Expenses are equal to each Class' annualized expense ratio, multiplied by the average account value over the period, multiplied by 181/365 (to reflect the one-half year period).
Annual Report
Investment Changes (Unaudited)
Top Ten Stocks as of April 30, 2010 |
| % of fund's
net assets | % of fund's net assets
6 months ago |
Genworth Financial, Inc. Class A | 2.7 | 2.3 |
Juniper Networks, Inc. | 2.3 | 2.2 |
tw telecom, inc. | 2.0 | 1.9 |
Hanesbrands, Inc. | 2.0 | 1.8 |
Flextronics International Ltd. | 1.8 | 2.0 |
Zions Bancorporation | 1.7 | 0.9 |
Ingersoll-Rand Co. Ltd. | 1.4 | 1.0 |
Regions Financial Corp. | 1.3 | 0.9 |
St. Jude Medical, Inc. | 1.2 | 1.2 |
Whirlpool Corp. | 1.1 | 1.1 |
| 17.5 | |
Top Five Market Sectors as of April 30, 2010 |
| % of fund's
net assets | % of fund's net assets
6 months ago |
Consumer Discretionary | 22.6 | 19.7 |
Information Technology | 21.4 | 22.0 |
Financials | 18.0 | 18.8 |
Industrials | 13.7 | 12.9 |
Energy | 6.5 | 7.4 |
Asset Allocation (% of fund's net assets) |
As of April 30, 2010* | As of October 31, 2009** |
| Stocks and
Equity Futures 98.9% | | | Stocks and
Equity Futures 99.7% | |
| Convertible
Securities 0.3% | |  | Convertible
Securities 0.0% | |
| Short-Term
Investments and
Net Other Assets 0.8% | | | Short-Term
Investments and
Net Other Assets 0.3% | |
* Foreign investments | 15.9% | | **Foreign investments | 19.1% | |

Annual Report
Investments April 30, 2010
Showing Percentage of Net Assets
Common Stocks - 97.5% |
| Shares | | Value (000s) |
CONSUMER DISCRETIONARY - 22.6% |
Auto Components - 2.6% |
ArvinMeritor, Inc. (a) | 3,000,000 | | $ 45,960 |
BorgWarner, Inc. (a) | 1,000,000 | | 43,340 |
Johnson Controls, Inc. | 2,500,000 | | 83,975 |
Tenneco, Inc. (a) | 1,800,000 | | 46,386 |
| | 219,661 |
Automobiles - 0.8% |
Harley-Davidson, Inc. | 1,495,000 | | 50,576 |
Thor Industries, Inc. | 575,000 | | 20,533 |
| | 71,109 |
Diversified Consumer Services - 0.2% |
Stewart Enterprises, Inc. Class A | 2,171,351 | | 14,722 |
Hotels, Restaurants & Leisure - 6.1% |
Ameristar Casinos, Inc. | 720,901 | | 13,575 |
Bally Technologies, Inc. (a) | 444,907 | | 20,519 |
Boyd Gaming Corp. (a)(d) | 3,000,000 | | 38,100 |
Gaylord Entertainment Co. (a) | 1,486,264 | | 50,161 |
International Game Technology | 1,600,000 | | 33,728 |
Las Vegas Sands Corp. (a) | 1,500,000 | | 37,290 |
MGM Mirage, Inc. (a)(d) | 6,000,000 | | 95,340 |
Morgans Hotel Group Co. (a)(e) | 2,000,000 | | 16,940 |
Penn National Gaming, Inc. (a) | 900,000 | | 27,864 |
Pinnacle Entertainment, Inc. (a) | 1,358,475 | | 18,380 |
Royal Caribbean Cruises Ltd. (a)(d) | 1,750,000 | | 62,720 |
Shuffle Master, Inc. (a) | 1,024,040 | | 9,831 |
Wyndham Worldwide Corp. | 2,000,000 | | 53,620 |
Wynn Resorts Ltd. | 500,000 | | 44,120 |
| | 522,188 |
Household Durables - 4.4% |
Harman International Industries, Inc. (a) | 832,800 | | 32,879 |
Lennar Corp. Class A | 1,500,000 | | 29,850 |
Mohawk Industries, Inc. (a)(d) | 1,250,000 | | 79,675 |
Newell Rubbermaid, Inc. | 3,250,000 | | 55,478 |
Sealy Corp., Inc. (a)(d)(e) | 6,500,000 | | 24,310 |
Stanley Black & Decker, Inc. | 1,000,000 | | 62,150 |
Whirlpool Corp. | 900,000 | | 97,983 |
| | 382,325 |
Internet & Catalog Retail - 0.4% |
Blue Nile, Inc. (a)(d) | 600,000 | | 32,394 |
Common Stocks - continued |
| Shares | | Value (000s) |
CONSUMER DISCRETIONARY - continued |
Leisure Equipment & Products - 0.3% |
Polaris Industries, Inc. (d) | 500,000 | | $ 29,585 |
Media - 0.9% |
Interpublic Group of Companies, Inc. (a) | 3,500,000 | | 31,185 |
National CineMedia, Inc. | 2,000,000 | | 38,080 |
NeuLion, Inc. (a) | 3,500,000 | | 2,204 |
Valassis Communications, Inc. (a) | 310,829 | | 10,161 |
| | 81,630 |
Multiline Retail - 0.2% |
Big Lots, Inc. (a) | 392,704 | | 15,001 |
Specialty Retail - 4.0% |
Abercrombie & Fitch Co. Class A | 500,000 | | 21,865 |
AnnTaylor Stores Corp. (a) | 1,250,000 | | 27,125 |
bebe Stores, Inc. | 562,893 | | 4,638 |
Cabela's, Inc. Class A (a)(d) | 1,200,000 | | 21,792 |
Chico's FAS, Inc. | 1,000,000 | | 14,890 |
Coldwater Creek, Inc. (a)(d) | 2,000,000 | | 14,160 |
Dick's Sporting Goods, Inc. (a) | 1,500,000 | | 43,665 |
Office Depot, Inc. (a) | 3,000,000 | | 20,580 |
Pier 1 Imports, Inc. (a) | 4,000,000 | | 33,120 |
Signet Jewelers Ltd. (United Kingdom) (a) | 677,925 | | 21,837 |
Staples, Inc. | 2,500,000 | | 58,825 |
Talbots, Inc. (a)(d) | 1,250,000 | | 20,563 |
Urban Outfitters, Inc. (a) | 1,100,000 | | 41,261 |
| | 344,321 |
Textiles, Apparel & Luxury Goods - 2.7% |
Hanesbrands, Inc. (a)(e) | 6,000,000 | | 170,820 |
Iconix Brand Group, Inc. (a) | 1,500,000 | | 25,890 |
Warnaco Group, Inc. (a) | 750,000 | | 35,880 |
| | 232,590 |
TOTAL CONSUMER DISCRETIONARY | | 1,945,526 |
CONSUMER STAPLES - 1.0% |
Food & Staples Retailing - 0.6% |
Whole Foods Market, Inc. (a)(d) | 1,250,000 | | 48,775 |
Food Products - 0.4% |
Origin Agritech Ltd. (a)(e) | 1,244,174 | | 10,899 |
Smithfield Foods, Inc. (a) | 1,500,000 | | 28,110 |
| | 39,009 |
Common Stocks - continued |
| Shares | | Value (000s) |
CONSUMER STAPLES - continued |
Personal Products - 0.0% |
L'Occitane Ltd. | 192,000 | | $ 373 |
TOTAL CONSUMER STAPLES | | 88,157 |
ENERGY - 6.5% |
Energy Equipment & Services - 2.0% |
Exterran Holdings, Inc. (a) | 1,000,000 | | 29,150 |
Helmerich & Payne, Inc. | 1,000,000 | | 40,620 |
Noble Corp. | 800,000 | | 31,592 |
North American Energy Partners, Inc. (a)(e) | 2,600,000 | | 29,328 |
Weatherford International Ltd. (a) | 2,500,000 | | 45,275 |
| | 175,965 |
Oil, Gas & Consumable Fuels - 4.5% |
Arch Coal, Inc. | 2,000,000 | | 54,000 |
Continental Resources, Inc. (a)(d) | 500,000 | | 24,580 |
EXCO Resources, Inc. | 2,500,000 | | 46,375 |
OPTI Canada, Inc. (a) | 5,000,000 | | 11,267 |
Plains Exploration & Production Co. (a) | 2,000,000 | | 58,620 |
Range Resources Corp. | 500,000 | | 23,880 |
Southwestern Energy Co. (a) | 900,000 | | 35,712 |
Ultra Petroleum Corp. (a) | 800,000 | | 38,216 |
Whiting Petroleum Corp. (a) | 1,000,000 | | 90,330 |
| | 382,980 |
TOTAL ENERGY | | 558,945 |
FINANCIALS - 17.7% |
Capital Markets - 0.0% |
Calamos Asset Management, Inc. Class A | 69,493 | | 865 |
Commercial Banks - 8.9% |
Associated Banc-Corp. | 1,459,300 | | 21,204 |
Banco Macro SA sponsored ADR (d) | 1,250,000 | | 35,000 |
Boston Private Financial Holdings, Inc. | 1,145,336 | | 9,083 |
Cathay General Bancorp | 2,200,000 | | 27,214 |
Comerica, Inc. | 1,500,000 | | 63,000 |
Fifth Third Bancorp | 2,500,000 | | 37,275 |
First Horizon National Corp. | 1,521,841 | | 21,534 |
FirstMerit Corp. | 1,000,000 | | 23,500 |
Huntington Bancshares, Inc. | 5,500,000 | | 37,235 |
Marshall & Ilsley Corp. | 3,500,000 | | 31,850 |
Common Stocks - continued |
| Shares | | Value (000s) |
FINANCIALS - continued |
Commercial Banks - continued |
North American Financial Holdings, Inc. Class A (a)(f) | 900,000 | | $ 17,550 |
PNC Financial Services Group, Inc. | 1,000,000 | | 67,210 |
Regions Financial Corp. | 12,500,000 | | 110,500 |
Sterling Bancshares, Inc. | 4,000,000 | | 23,520 |
SunTrust Banks, Inc. | 2,000,000 | | 59,200 |
Synovus Financial Corp. (d) | 12,000,000 | | 36,120 |
Zions Bancorporation (d) | 5,000,000 | | 143,650 |
| | 764,645 |
Consumer Finance - 1.3% |
Capital One Financial Corp. | 2,000,000 | | 86,820 |
ORIX Corp. sponsored ADR (d) | 500,000 | | 22,865 |
| | 109,685 |
Diversified Financial Services - 0.6% |
KKR Financial Holdings LLC | 6,000,000 | | 53,040 |
Insurance - 5.2% |
Allstate Corp. | 1,000,000 | | 32,670 |
Genworth Financial, Inc. Class A (a) | 14,000,000 | | 231,275 |
Lincoln National Corp. | 2,400,000 | | 73,416 |
Protective Life Corp. | 1,900,000 | | 45,733 |
XL Capital Ltd. Class A | 3,500,000 | | 62,300 |
| | 445,394 |
Real Estate Investment Trusts - 0.3% |
CBL & Associates Properties, Inc. | 1,762,440 | | 25,732 |
Real Estate Management & Development - 0.5% |
CB Richard Ellis Group, Inc. Class A (a) | 2,350,000 | | 40,702 |
Thrifts & Mortgage Finance - 0.9% |
First Niagara Financial Group, Inc. | 1,000,000 | | 13,900 |
Flagstar Bancorp, Inc. (a) | 25,000,000 | | 15,875 |
MGIC Investment Corp. (a)(d) | 2,150,000 | | 22,425 |
Radian Group, Inc. (d) | 2,000,000 | | 28,380 |
| | 80,580 |
TOTAL FINANCIALS | | 1,520,643 |
HEALTH CARE - 6.3% |
Biotechnology - 0.8% |
Cephalon, Inc. (a)(d) | 1,000,000 | | 64,200 |
Health Care Equipment & Supplies - 4.4% |
CareFusion Corp. (a) | 1,000,000 | | 27,580 |
Common Stocks - continued |
| Shares | | Value (000s) |
HEALTH CARE - continued |
Health Care Equipment & Supplies - continued |
Covidien PLC | 1,150,000 | | $ 55,189 |
Edwards Lifesciences Corp. (a) | 750,000 | | 77,310 |
Inverness Medical Innovations, Inc. (a) | 1,300,000 | | 51,714 |
Masimo Corp. | 1,500,000 | | 35,115 |
St. Jude Medical, Inc. (a) | 2,500,000 | | 102,050 |
Stryker Corp. | 500,000 | | 28,720 |
| | 377,678 |
Health Care Providers & Services - 1.1% |
Emeritus Corp. (a)(d) | 837,849 | | 18,768 |
Express Scripts, Inc. (a) | 600,000 | | 60,078 |
Sunrise Senior Living, Inc. (a)(d)(e) | 3,200,000 | | 17,792 |
| | 96,638 |
TOTAL HEALTH CARE | | 538,516 |
INDUSTRIALS - 13.7% |
Aerospace & Defense - 0.6% |
Precision Castparts Corp. | 400,000 | | 51,336 |
Air Freight & Logistics - 0.5% |
C.H. Robinson Worldwide, Inc. | 750,000 | | 45,225 |
Airlines - 0.3% |
Hawaiian Holdings, Inc. (a)(e) | 4,080,483 | | 28,971 |
Building Products - 2.4% |
Lennox International, Inc. | 2,100,000 | | 95,046 |
Masco Corp. | 2,500,000 | | 40,575 |
Owens Corning (a) | 600,000 | | 20,868 |
Quanex Building Products Corp. | 886,871 | | 16,851 |
USG Corp. (a)(d) | 1,500,000 | | 35,400 |
| | 208,740 |
Commercial Services & Supplies - 0.0% |
Interface, Inc. Class A | 337,642 | | 4,416 |
Construction & Engineering - 0.6% |
Fluor Corp. | 500,000 | | 26,420 |
KBR, Inc. | 1,000,000 | | 22,080 |
| | 48,500 |
Electrical Equipment - 0.6% |
Acuity Brands, Inc. | 475,170 | | 21,482 |
Regal-Beloit Corp. | 500,000 | | 31,635 |
| | 53,117 |
Common Stocks - continued |
| Shares | | Value (000s) |
INDUSTRIALS - continued |
Industrial Conglomerates - 0.7% |
Textron, Inc. | 2,500,000 | | $ 57,100 |
Machinery - 3.2% |
AGCO Corp. (a) | 1,400,000 | | 49,028 |
Cummins, Inc. | 700,000 | | 50,561 |
Ingersoll-Rand Co. Ltd. | 3,188,660 | | 117,917 |
Trinity Industries, Inc. | 2,200,000 | | 54,758 |
| | 272,264 |
Marine - 0.1% |
American Commercial Lines, Inc. (a)(d) | 600,000 | | 12,240 |
Professional Services - 0.4% |
CoStar Group, Inc. (a)(d) | 750,000 | | 32,963 |
Road & Rail - 4.3% |
Arkansas Best Corp. | 1,000,000 | | 30,460 |
Avis Budget Group, Inc. (a) | 1,500,000 | | 22,680 |
Con-way, Inc. | 1,350,000 | | 52,434 |
CSX Corp. | 1,100,000 | | 61,655 |
Hertz Global Holdings, Inc. (a)(d) | 3,000,000 | | 43,380 |
Knight Transportation, Inc. | 1,500,000 | | 31,935 |
Old Dominion Freight Lines, Inc. (a) | 1,500,000 | | 53,820 |
Ryder System, Inc. | 1,500,000 | | 69,780 |
| | 366,144 |
TOTAL INDUSTRIALS | | 1,181,016 |
INFORMATION TECHNOLOGY - 21.4% |
Communications Equipment - 4.3% |
Comverse Technology, Inc. (a) | 9,000,000 | | 82,620 |
Infinera Corp. (a)(d) | 2,900,000 | | 26,535 |
Juniper Networks, Inc. (a) | 7,000,000 | | 198,870 |
QUALCOMM, Inc. | 1,500,000 | | 58,110 |
| | 366,135 |
Computers & Peripherals - 0.3% |
3PAR, Inc. (a)(d) | 2,800,000 | | 26,124 |
Electronic Equipment & Components - 4.7% |
Agilent Technologies, Inc. (a) | 1,000,000 | | 36,260 |
Arrow Electronics, Inc. (a) | 1,250,000 | | 38,125 |
Avnet, Inc. (a) | 1,000,000 | | 31,970 |
Corning, Inc. | 2,500,000 | | 48,125 |
Common Stocks - continued |
| Shares | | Value (000s) |
INFORMATION TECHNOLOGY - continued |
Electronic Equipment & Components - continued |
Flextronics International Ltd. (a) | 20,000,000 | | $ 155,000 |
Tyco Electronics Ltd. | 3,000,000 | | 96,360 |
| | 405,840 |
Internet Software & Services - 0.4% |
Move, Inc. (a)(e) | 15,000,000 | | 33,000 |
IT Services - 0.9% |
Genpact Ltd. (a) | 3,000,000 | | 50,640 |
WNS Holdings Ltd. sponsored ADR (a) | 2,400,000 | | 29,424 |
| | 80,064 |
Semiconductors & Semiconductor Equipment - 8.3% |
Altera Corp. | 1,900,000 | | 48,184 |
Applied Micro Circuits Corp. (a)(e) | 6,500,000 | | 73,320 |
ARM Holdings PLC sponsored ADR (d) | 3,000,000 | | 34,290 |
ASM International NV (NASDAQ) (a) | 1,750,000 | | 45,518 |
ASML Holding NV (NY Shares) | 1,700,000 | | 55,522 |
Broadcom Corp. Class A | 1,200,000 | | 41,388 |
Lam Research Corp. (a) | 900,000 | | 36,495 |
Marvell Technology Group Ltd. (a) | 2,500,000 | | 51,625 |
MEMC Electronic Materials, Inc. (a) | 2,000,000 | | 25,940 |
Micron Technology, Inc. (a) | 3,000,000 | | 28,050 |
National Semiconductor Corp. | 4,000,000 | | 59,120 |
ON Semiconductor Corp. (a) | 9,500,000 | | 75,430 |
PMC-Sierra, Inc. (a) | 4,000,000 | | 35,400 |
Samsung Electronics Co. Ltd. | 50,000 | | 38,012 |
Taiwan Semiconductor Manufacturing Co. Ltd. sponsored ADR | 6,000,000 | | 63,540 |
| | 711,834 |
Software - 2.5% |
Adobe Systems, Inc. (a) | 1,750,000 | | 58,783 |
ANSYS, Inc. (a) | 850,000 | | 38,250 |
Autonomy Corp. PLC (a) | 1,000,000 | | 27,428 |
Nuance Communications, Inc. (a) | 3,000,000 | | 54,810 |
TIBCO Software, Inc. (a) | 3,000,000 | | 34,200 |
| | 213,471 |
TOTAL INFORMATION TECHNOLOGY | | 1,836,468 |
MATERIALS - 2.7% |
Chemicals - 1.0% |
CF Industries Holdings, Inc. | 145,600 | | 12,182 |
Common Stocks - continued |
| Shares | | Value (000s) |
MATERIALS - continued |
Chemicals - continued |
Intrepid Potash, Inc. (a)(d) | 1,500,000 | | $ 39,390 |
K&S AG | 600,000 | | 34,446 |
| | 86,018 |
Metals & Mining - 1.4% |
Newcrest Mining Ltd. | 2,000,000 | | 60,355 |
Silver Wheaton Corp. (a) | 3,000,000 | | 58,925 |
Timminco Ltd. (a)(d) | 7,000,000 | | 5,580 |
| | 124,860 |
Paper & Forest Products - 0.3% |
Louisiana-Pacific Corp. (a) | 2,000,000 | | 23,520 |
TOTAL MATERIALS | | 234,398 |
TELECOMMUNICATION SERVICES - 4.7% |
Diversified Telecommunication Services - 4.0% |
Global Crossing Ltd. (a)(e) | 4,500,000 | | 66,825 |
Level 3 Communications, Inc. (a)(d) | 15,000,000 | | 23,400 |
Qwest Communications International, Inc. | 15,000,000 | | 78,450 |
tw telecom, inc. (a)(e) | 10,000,000 | | 178,000 |
| | 346,675 |
Wireless Telecommunication Services - 0.7% |
SBA Communications Corp. Class A (a) | 1,000,000 | | 35,370 |
Vivo Participacoes SA sponsored ADR | 1,000,000 | | 26,470 |
| | 61,840 |
TOTAL TELECOMMUNICATION SERVICES | | 408,515 |
UTILITIES - 0.9% |
Independent Power Producers & Energy Traders - 0.9% |
AES Corp. | 4,000,000 | | 46,160 |
Calpine Corp. (a) | 2,000,000 | | 27,260 |
| | 73,420 |
TOTAL COMMON STOCKS (Cost $6,982,897) | 8,385,604 |
Convertible Preferred Stocks - 0.3% |
| Shares | | Value (000s) |
FINANCIALS - 0.3% |
Commercial Banks - 0.3% |
Oriental Financial Group, Inc. Series C (a)(h) | 4,597 | | $ 4,606 |
Popular, Inc. Series D (a) | 585,900 | | 19,165 |
| | 23,771 |
TOTAL CONVERTIBLE PREFERRED STOCKS (Cost $19,245) | 23,771 |
U.S. Treasury Obligations - 0.1% |
| Principal Amount (000s) | | |
U.S. Treasury Bills, yield at date of purchase 0.09% to 0.12% 5/13/10 (g)
(Cost $9,600) | | $ 9,600 | | 9,600 |
Money Market Funds - 7.6% |
| Shares | | |
Fidelity Cash Central Fund, 0.21% (b) | 201,266,245 | | 201,266 |
Fidelity Securities Lending Cash Central Fund, 0.22% (b)(c) | 457,396,950 | | 457,397 |
TOTAL MONEY MARKET FUNDS (Cost $658,663) | 658,663 |
TOTAL INVESTMENT PORTFOLIO - 105.5% (Cost $7,670,405) | | 9,077,638 |
NET OTHER ASSETS - (5.5)% | | (475,771) |
NET ASSETS - 100% | $ 8,601,867 |
Futures Contracts |
| Expiration Date | | Underlying Face Amount at Value (000s) | | Unrealized Appreciation/
(Depreciation) (000s) |
Purchased |
Equity Index Contracts |
1,512 CME E-mini S&P MidCap 400 Index Contracts | June 2010 | | $ 124,226 | | $ 3,703 |
|
The face value of futures purchased as a percentage of net assets - 1.4% |
Legend |
(a) Non-income producing |
(b) Affiliated fund that is available only to investment companies and other accounts managed by Fidelity Investments. The rate quoted is the annualized seven-day yield of the fund at period end. A complete unaudited listing of the fund's holdings as of its most recent quarter end is available upon request. |
(c) Investment made with cash collateral received from securities on loan. |
(d) Security or a portion of the security is on loan at period end. |
(e) Affiliated company |
(f) Security exempt from registration under Rule 144A of the Securities Act of 1933. These securities may be resold in transactions exempt from registration, normally to qualified institutional buyers. At the end of the period, the value of these securities amounted to $17,550,000 or 0.2% of net assets. |
(g) Security or a portion of the security was pledged to cover margin requirements for futures contracts. At the period end, the value of securities pledged amounted to $9,600,000. |
(h) Restricted securities - Investment in securities not registered under the Securities Act of 1933 (excluding 144A issues). At the end of the period, the value of restricted securities (excluding 144A issues) amounted to $4,606,000 or 0.1% of net assets. |
Additional information on each holding is as follows: |
Security | Acquisition Date | Acquisition Cost (000s) |
Oriental Financial Group, Inc. Series C | 4/29/10 | $ 4,597 |
Affiliated Central Funds |
Information regarding fiscal year to date income earned by the Fund from investments in Fidelity Central Funds is as follows: |
Fund | Income earned
(Amounts in thousands) |
Fidelity Cash Central Fund | $ 112 |
Fidelity Securities Lending Cash Central Fund | 4,264 |
Total | $ 4,376 |
Other Affiliated Issuers |
An affiliated company is a company in which the fund has ownership of at least 5% of the voting securities. Fiscal year to date transactions with companies which are or were affiliates are as follows: |
Affiliate
(Amounts in thousands) | Value, beginning of period | Purchases | Sales Proceeds | Dividend Income | Value, end of period |
Applied Micro Circuits Corp. | $ 34,880 | $ 693 | $ - | $ - | $ 73,320 |
Comverse Technology, Inc. | 92,950 | - | 31,921 | - | - |
Delcath Systems, Inc. | - | 7,200 | 22,434 | - | - |
Global Crossing Ltd. | 32,670 | 401 | 687 | - | 66,825 |
Hanesbrands, Inc. | 82,300 | 21,828 | 508 | - | 170,820 |
Hawaiian Holdings, Inc. | - | 33,274 | - | - | 28,971 |
Morgans Hotel Group Co. | 2,285 | 6,399 | - | - | 16,940 |
Move, Inc. | 29,923 | 1,092 | 337 | - | 33,000 |
National CineMedia, Inc. | 45,839 | - | 20,148 | 1,781 | - |
North American Energy Partners, Inc. | 9,085 | 2,033 | - | - | 29,328 |
Origin Agritech Ltd. | - | 12,923 | - | - | 10,899 |
Sealy Corp., Inc. | - | 21,786 | - | - | 24,310 |
Sunrise Senior Living, Inc. | - | 13,282 | 754 | - | 17,792 |
Talbots, Inc. | - | 32,078 | 31,071 | - | - |
Telvent GIT SA | 35,794 | - | 65,439 | - | - |
Timminco Ltd. | 5,133 | 4,463 | - | - | - |
tw telecom, inc. | 105,685 | - | 19,929 | - | 178,000 |
Total | $ 476,544 | $ 157,452 | $ 193,228 | $ 1,781 | $ 650,205 |
Other Information |
The following is a summary of the inputs used, as of April 30, 2010, involving the Fund's assets and liabilities carried at value. The inputs or methodology used for valuing securities may not be an indication of the risk associated with investing in those securities. For more information on valuation inputs, and their aggregation into the levels used in the table below, please refer to the Security Valuation section in the accompanying Notes to Financial Statements. |
Valuation Inputs at Reporting Date: |
Description
(Amounts in thousands) | Total | Level 1 | Level 2 | Level 3 |
Investments in Securities: | | | | |
Equities: | | | | |
Consumer Discretionary | $ 1,945,526 | $ 1,923,689 | $ 21,837 | $ - |
Consumer Staples | 88,157 | 87,784 | 373 | - |
Energy | 558,945 | 558,945 | - | - |
Financials | 1,544,414 | 1,522,258 | 22,156 | - |
Health Care | 538,516 | 538,516 | - | - |
Industrials | 1,181,016 | 1,181,016 | - | - |
Information Technology | 1,836,468 | 1,771,028 | 65,440 | - |
Materials | 234,398 | 139,597 | 94,801 | - |
Telecommunication Services | 408,515 | 408,515 | - | - |
Utilities | 73,420 | 73,420 | - | - |
U.S. Government and Government Agency Obligations | 9,600 | - | 9,600 | - |
Money Market Funds | 658,663 | 658,663 | - | - |
Total Investments in Securities: | $ 9,077,638 | $ 8,863,431 | $ 214,207 | $ - |
Derivative Instruments: | | | | |
Assets | | | | |
Futures Contracts | $ 3,703 | $ 3,703 | $ - | $ - |
Value of Derivative Instruments |
The following table is a summary of the Fund's value of derivative instruments by risk exposure as of April 30, 2010. For additional information on derivative instruments, please refer to the Derivative Instruments section in the accompanying Notes to Financial Statements. |
Risk Exposure /
Derivative Type | Value
(Amounts in thousands) |
| Asset | Liability |
Equity Risk | | |
Futures Contracts (a) | $ 3,703 | $ - |
Total Value of Derivatives | $ 3,703 | $ - |
(a) Reflects cumulative appreciation/(depreciation) on futures contracts as disclosed on the Schedule of Investments. Only the period end variation margin is separately disclosed on the Statement of Assets and Liabilities. |
Distribution of investments by country of issue, as a percentage of total net assets, is as follows: (Unaudited) |
United States of America | 84.1% |
Bermuda | 2.2% |
Ireland | 2.1% |
Switzerland | 2.0% |
Singapore | 1.8% |
Canada | 1.6% |
Netherlands | 1.2% |
Others (Individually Less Than 1%) | 5.0% |
| 100.0% |
Income Tax Information |
At April 30, 2010, the fund had a capital loss carryforward of approximately $1,072,367,000 of which $717,619,000 and $354,748,000 will expire on April 30, 2017 and 2018, respectively. |
See accompanying notes which are an integral part of the financial statements.
Annual Report
Statement of Assets and Liabilities
Amounts in thousands (except per-share amounts) | April 30, 2010 |
| | |
Assets | | |
Investment in securities, at value (including securities loaned of $431,597) - See accompanying schedule: Unaffiliated issuers (cost $6,444,892) | $ 7,768,770 | |
Fidelity Central Funds (cost $658,663) | 658,663 | |
Other affiliated issuers (cost $566,850) | 650,205 | |
Total Investments (cost $7,670,405) | | $ 9,077,638 |
Cash | | 403 |
Receivable for investments sold | | 136,151 |
Receivable for fund shares sold | | 17,731 |
Dividends receivable | | 1,974 |
Distributions receivable from Fidelity Central Funds | | 611 |
Prepaid expenses | | 10 |
Other receivables | | 565 |
Total assets | | 9,235,083 |
| | |
Liabilities | | |
Payable for investments purchased | $ 161,652 | |
Payable for fund shares redeemed | 6,818 | |
Accrued management fee | 2,904 | |
Payable for daily variation on futures contracts | 2,631 | |
Other affiliated payables | 1,549 | |
Other payables and accrued expenses | 265 | |
Collateral on securities loaned, at value | 457,397 | |
Total liabilities | | 633,216 |
| | |
Net Assets | | $ 8,601,867 |
Net Assets consist of: | | |
Paid in capital | | $ 8,270,128 |
Undistributed net investment income | | 9,411 |
Accumulated undistributed net realized gain (loss) on investments and foreign currency transactions | | (1,088,619) |
Net unrealized appreciation (depreciation) on investments and assets and liabilities in foreign currencies | | 1,410,947 |
Net Assets | | $ 8,601,867 |
See accompanying notes which are an integral part of the financial statements.
Annual Report
Financial Statements - continued
Statement of Assets and Liabilities - continued
Amounts in thousands (except per-share amounts) | April 30, 2010 |
| | |
Mid-Cap Stock:
Net Asset Value, offering price and redemption price per share ($7,475,116 ÷ 274,180 shares) | | $ 27.26 |
| | |
Class K:
Net Asset Value, offering price and redemption price per share ($1,126,751 ÷ 41,340 shares) | | $ 27.26 |
See accompanying notes which are an integral part of the financial statements.
Annual Report
Statement of Operations
Amounts in thousands | Year ended April 30, 2010 |
| | |
Investment Income | | |
Dividends (including $1,781 earned from other affiliated issuers) | | $ 65,509 |
Interest | | 3 |
Income from Fidelity Central Funds (including $4,264 from security lending) | | 4,376 |
Total income | | 69,888 |
| | |
Expenses | | |
Management fee
Basic fee | $ 38,351 | |
Performance adjustment | (14,898) | |
Transfer agent fees | 17,440 | |
Accounting and security lending fees | 1,360 | |
Custodian fees and expenses | 143 | |
Independent trustees' compensation | 42 | |
Registration fees | 117 | |
Audit | 68 | |
Legal | 50 | |
Interest | 10 | |
Miscellaneous | 140 | |
Total expenses before reductions | 42,823 | |
Expense reductions | (845) | 41,978 |
Net investment income (loss) | | 27,910 |
Realized and Unrealized Gain (Loss) Net realized gain (loss) on: | | |
Investment securities: | | |
Unaffiliated issuers | 665,319 | |
Other affiliated issuers | 28,821 | |
Foreign currency transactions | 71 | |
Futures contracts | 3,760 | |
Capital gain distributions from Fidelity Central Funds | 19 | |
Total net realized gain (loss) | | 697,990 |
Change in net unrealized appreciation (depreciation) on: Investment securities | 2,580,671 | |
Assets and liabilities in foreign currencies | (32) | |
Futures contracts | 3,703 | |
Total change in net unrealized appreciation (depreciation) | | 2,584,342 |
Net gain (loss) | | 3,282,332 |
Net increase (decrease) in net assets resulting from operations | | $ 3,310,242 |
See accompanying notes which are an integral part of the financial statements.
Annual Report
Financial Statements - continued
Statement of Changes in Net Assets
Amounts in thousands | Year ended
April 30,
2010 | Year ended
April 30,
2009 |
Increase (Decrease) in Net Assets | | |
Operations | | |
Net investment income (loss) | $ 27,910 | $ 9,044 |
Net realized gain (loss) | 697,990 | (2,202,748) |
Change in net unrealized appreciation (depreciation) | 2,584,342 | (2,645,558) |
Net increase (decrease) in net assets resulting
from operations | 3,310,242 | (4,839,262) |
Distributions to shareholders from net investment income | (18,117) | (7,694) |
Distributions to shareholders from net realized gain | - | (131,543) |
Total distributions | (18,117) | (139,237) |
Share transactions - net increase (decrease) | 134,634 | (2,821,119) |
Redemption fees | 137 | 167 |
Total increase (decrease) in net assets | 3,426,896 | (7,799,451) |
| | |
Net Assets | | |
Beginning of period | 5,174,971 | 12,974,422 |
End of period (including undistributed net investment income of $9,411 and accumulated net investment loss of $782, respectively) | $ 8,601,867 | $ 5,174,971 |
See accompanying notes which are an integral part of the financial statements.
Annual Report
Financial Highlights - Mid-Cap Stock
Years ended April 30, | 2010 | 2009 | 2008 | 2007 | 2006 |
Selected Per-Share Data | | | | | |
Net asset value, beginning of period | $ 16.65 | $ 27.52 | $ 32.43 | $ 30.43 | $ 21.57 |
Income from Investment Operations | | | | | |
Net investment income (loss) B | .08 | .02 | (.06) | (.04) E | (.01) F |
Net realized and unrealized gain (loss) | 10.59 | (10.58) | (2.44) | 3.38 | 9.51 |
Total from investment operations | 10.67 | (10.56) | (2.50) | 3.34 | 9.50 |
Distributions from net investment income | (.06) | (.02) I | - | - | (.04) |
Distributions from net realized gain | - | (.29) I | (2.41) | (1.34) | (.60) |
Total distributions | (.06) | (.31) | (2.41) | (1.34) | (.64) |
Redemption fees added to paid in capital B, H | - | - | - | - | - |
Net asset value, end of period | $ 27.26 | $ 16.65 | $ 27.52 | $ 32.43 | $ 30.43 |
Total Return A | 64.11% | (38.76)% | (8.49)% | 11.53% | 44.52% |
Ratios to Average Net Assets C, G | | | | | |
Expenses before reductions | .65% | .73% | .95% | .83% | .72% |
Expenses net of fee waivers, if any | .65% | .73% | .95% | .83% | .72% |
Expenses net of all reductions | .64% | .72% | .94% | .82% | .69% |
Net investment income (loss) | .38% | .11% | (.21)% | (.14)% E | (.03)% F |
Supplemental Data | | | | | |
Net assets, end of period (in millions) | $ 7,475 | $ 4,763 | $ 12,974 | $ 15,234 | $ 12,653 |
Portfolio turnover rate D | 85% | 73% | 45% | 52% | 74% |
A Total returns would have been lower had certain expenses not been reduced during the periods shown.
B Calculated based on average shares outstanding during the period.
C Fees and expenses of the underlying Fidelity Central Funds are not included in the Fund's expense ratio. The Fund indirectly bears its proportionate share of the expenses of any underlying Fidelity Central Funds.
D Amount does not include the portfolio activity of any underlying Fidelity Central Funds.
E Investment income per share reflects a special dividend which amounted to $.02 per share. Excluding the special dividend, the ratio of net investment income (loss) to average net assets would have been (.20)%.
F Investment income per share reflects a special dividend which amounted to $.04 per share. Excluding the special dividend, the ratio of net investment income (loss) to average net assets would have been (.20)%.
G Expense ratios reflect operating expenses of the class. Expenses before reductions do not reflect amounts reimbursed by the investment adviser or reductions from brokerage service arrangements or reductions from other expense offset arrangements and do not represent the amount paid by the class during periods when reimbursements or reductions occur. Expenses net of fee waivers reflect expenses after reimbursement by the investment adviser but prior to reductions from brokerage service arrangements or other expense offset arrangements. Expenses net of all reductions represent the net expenses paid by the class.
H Amount represents less than $.01 per share.
I The amount shown reflects certain reclassifications related to book to tax differences.
See accompanying notes which are an integral part of the financial statements.
Annual Report
Financial Highlights - Class K
Years ended April 30, | 2010 | 2009 G |
Selected Per-Share Data | | |
Net asset value, beginning of period | $ 16.63 | $ 28.33 |
Income from Investment Operations | | |
Net investment income (loss) D | .14 | .05 |
Net realized and unrealized gain (loss) | 10.58 | (11.39) |
Total from investment operations | 10.72 | (11.34) |
Distributions from net investment income | (.09) | (.07) J |
Distributions from net realized gain | - | (.29) J |
Total distributions | (.09) | (.36) |
Redemption fees added to paid in capital D, I | - | - |
Net asset value, end of period | $ 27.26 | $ 16.63 |
Total Return B, C | 64.55% | (40.38)% |
Ratios to Average Net Assets E, H | | |
Expenses before reductions | .43% | .52% A |
Expenses net of fee waivers, if any | .43% | .52% A |
Expenses net of all reductions | .41% | .52% A |
Net investment income (loss) | .61% | .31% A |
Supplemental Data | | |
Net assets, end of period (in millions) | $ 1,127 | $ 412 |
Portfolio turnover rate F | 85% | 73% |
A Annualized
B Total returns for periods of less than one year are not annualized.
C Total returns would have been lower had certain expenses not been reduced during the periods shown.
D Calculated based on average shares outstanding during the period.
E Fees and expenses of the underlying Fidelity Central Funds are not included in the Fund's expense ratio. The Fund indirectly bears its proportionate share of the expenses of any underlying Fidelity Central Funds.
F Amount does not include the portfolio activity of any underlying Fidelity Central Funds.
G For the period May 9, 2008 (commencement of sale of shares) to April 30, 2009.
H Expense ratios reflect operating expenses of the class. Expenses before reductions do not reflect amounts reimbursed by the investment adviser or reductions from brokerage service arrangements or reductions from other expense offset arrangements and do not represent the amount paid by the class during periods when reimbursements or reductions occur. Expense ratios before reductions for start-up periods may not be representative of longer-term operating periods. Expenses net of fee waivers reflect expenses after reimbursement by the investment adviser but prior to reductions from brokerage service arrangements or other expense offset arrangements. Expenses net of all reductions represent the net expenses paid by the class.
I Amount represents less than $.01 per share.
J The amount shown reflects certain reclassifications related to book to tax differences.
See accompanying notes which are an integral part of the financial statements.
Annual Report
Notes to Financial Statements
For the period ended April 30, 2010
(Amounts in thousands except ratios)
1. Organization.
Fidelity Mid-Cap Stock Fund (the Fund) is a fund of Fidelity Commonwealth Trust (the trust) and is authorized to issue an unlimited number of shares. The trust is registered under the Investment Company Act of 1940, as amended (the 1940 Act), as an open-end management investment company organized as a Massachusetts business trust. The Fund offers Mid-Cap Stock and Class K shares, each of which has equal rights as to assets and voting privileges. Each class has exclusive voting rights with respect to matters that affect that class. After the commencement of Class K, the Fund began offering conversion privileges between Mid-Cap Stock and Class K to eligible shareholders of Mid-Cap Stock. Investment income, realized and unrealized capital gains and losses, the common expenses of the Fund, and certain fund-level expense reductions, if any, are allocated on a pro-rata basis to each class based on the relative net assets of each class to the total net assets of the Fund. Each class differs with respect to transfer agent fees incurred. Certain expense reductions also differ by class.
2. Investments in Fidelity Central Funds.
The Fund may invest in Fidelity Central Funds, which are open-end investment companies available only to other investment companies and accounts managed by Fidelity Management & Research Company (FMR) and its affiliates. The Fund's Schedule of Investments lists each of the Fidelity Central Funds held as of period end, if any, as an investment of the Fund, but does not include the underlying holdings of each Fidelity Central Fund. As an Investing Fund, the Fund indirectly bears its proportionate share of the expenses of the underlying Fidelity Central Funds.
The Money Market Central Funds seek preservation of capital and current income and are managed by Fidelity Investments Money Management, Inc. (FIMM), an affiliate of FMR.
A complete unaudited list of holdings for each Fidelity Central Fund is available upon request or at the Securities and Exchange Commission (the SEC) web site at www.sec.gov. In addition, the financial statements of the Fidelity Central Funds, which are not covered by the Fund's Report of Independent Registered Public Accounting Firm, are available on the SEC web site or upon request.
3. Significant Accounting Policies.
The financial statements have been prepared in conformity with accounting principles generally accepted in the United States of America, which require management to make certain estimates and assumptions at the date of the financial statements. Actual results could differ from those estimates. The following summarizes the significant accounting policies of the Fund:
Annual Report
Notes to Financial Statements - continued
(Amounts in thousands except ratios)
3. Significant Accounting Policies - continued
Security Valuation. Investments are valued as of 4:00 p.m. Eastern time on the last calendar day of the period. The Fund uses independent pricing services approved by the Board of Trustees to value its investments. When current market prices or quotations are not readily available or reliable, valuations may be determined in good faith in accordance with procedures adopted by the Board of Trustees. Factors used in determining value may include market or security specific events. The frequency with which these procedures are used cannot be predicted and they may be utilized to a significant extent. The value used for net asset value (NAV) calculation under these procedures may differ from published prices for the same securities.
The Fund categorizes the inputs to valuation techniques used to value its investments into a disclosure hierarchy consisting of three levels as shown below.
Level 1 - quoted prices in active markets for identical investments
Level 2 - other significant observable inputs (including quoted prices for similar investments, interest rates, prepayment speeds, etc.)
Level 3 - unobservable inputs (including the fund's own assumptions based on the best information available)
Changes in valuation techniques may result in transfers in or out of an assigned level within the disclosure hierarchy. The aggregate value of investments by input level, as of April 30, 2010, is included at the end of the Fund's Schedule of Investments. Valuation techniques used to value the Fund's investments by major category are as follows.
Equity securities, including restricted securities, for which market quotations are readily available, are valued at the last reported sale price or official closing price as reported by an independent pricing service on the primary market or exchange on which they are traded and are categorized as Level 1 in the hierarchy. In the event there were no sales during the day or closing prices are not available, securities are valued at the last quoted bid price or may be valued using the last available price and are generally categorized as Level 2 in the hierarchy. For foreign equity securities, when significant market or security specific events arise, comparisons to the valuation of American Depositary Receipts (ADRs), futures contracts, Exchange-traded funds (ETFs) and certain indexes as well as quoted prices for similar securities are used and are categorized as Level 2 in the hierarchy in these circumstances. Utilizing these techniques may result in transfers between Level 1 and Level 2. For restricted equity securities and private placements where observable inputs are limited, assumptions about market activity and risk are used and are categorized as Level 3 in the hierarchy.
Annual Report
3. Significant Accounting Policies - continued
Security Valuation - continued
Debt securities, including restricted securities, are valued based on evaluated prices received from independent pricing services or from dealers who make markets in such securities. For U.S. government and government agency obligations, pricing services utilize matrix pricing which considers yield or price of bonds of comparable quality, coupon, maturity and type as well as dealer supplied prices and are generally categorized as Level 2 in the hierarchy.
Futures contracts are valued at the settlement price established each day by the board of trade or exchange on which they are traded and are categorized as Level 1 in the hierarchy. Investments in open-end mutual funds, including the Fidelity Central Funds, are valued at their closing net asset value each business day and are categorized as Level 1 in the hierarchy. Short-term securities with remaining maturities of sixty days or less for which quotations are not readily available are valued at amortized cost, which approximates value and are categorized as Level 2 in the hierarchy.
When independent prices are unavailable or unreliable, debt securities may be valued utilizing pricing matrices which consider similar factors that would be used by independent pricing services. These are generally categorized as Level 2 in the hierarchy but may be Level 3 depending on the circumstances.
Foreign Currency. The Fund uses foreign currency contracts to facilitate transactions in foreign-denominated securities. Losses from these transactions may arise from changes in the value of the foreign currency or if the counterparties do not perform under the contracts' terms.
Foreign-denominated assets, including investment securities, and liabilities are translated into U.S. dollars at the exchange rate at period end. Purchases and sales of investment securities, income and dividends received and expenses denominated in foreign currencies are translated into U.S. dollars at the exchange rate in effect on the transaction date.
The effects of exchange rate fluctuations on investments are included with the net realized and unrealized gain (loss) on investment securities. Other foreign currency transactions resulting in realized and unrealized gain (loss) are disclosed separately.
Investment Transactions and Income. For financial reporting purposes, the Fund's investment holdings and NAV include trades executed through the end of the last business day of the period. The NAV per share for processing shareholder transactions is calculated as of the close of business of the New York Stock Exchange (NYSE), normally 4:00 p.m. Eastern time and includes trades executed through the end of the prior business day. Gains and losses on securities sold are determined on the basis of identified
Annual Report
Notes to Financial Statements - continued
(Amounts in thousands except ratios)
3. Significant Accounting Policies - continued
Investment Transactions and Income - continued
cost and may include proceeds received from litigation. Dividend income is recorded on the ex-dividend date, except for certain dividends from foreign securities where the ex-dividend date may have passed, which are recorded as soon as the Fund is informed of the ex-dividend date. Non-cash dividends included in dividend income, if any, are recorded at the fair market value of the securities received. Distributions received on securities that represent a return of capital or capital gain are recorded as a reduction of cost of investments and/or as a realized gain. The Fund estimates the components of distributions received that may be considered return of capital distributions or capital gain distributions. Interest income and distributions from the Fidelity Central Funds are accrued as earned. Interest income includes coupon interest and amortization of premium and accretion of discount on debt securities. Investment income is recorded net of foreign taxes withheld where recovery of such taxes is uncertain.
Expenses. Most expenses of the trust can be directly attributed to a fund. Expenses which cannot be directly attributed are apportioned among each Fund in the trust. Expense estimates are accrued in the period to which they relate and adjustments are made when actual amounts are known.
Deferred Trustee Compensation. Under a Deferred Compensation Plan (the Plan), independent Trustees may elect to defer receipt of a portion of their annual compensation. Deferred amounts are invested in a cross-section of Fidelity funds, are marked-to-market and remain in the Fund until distributed in accordance with the Plan. The investment of deferred amounts and the offsetting payable to the Trustees are included in the accompanying Statement of Assets and Liabilities.
Income Tax Information and Distributions to Shareholders. Each year, the Fund intends to qualify as a regulated investment company by distributing substantially all of its taxable income and realized gains under Subchapter M of the Internal Revenue Code and filing its U.S. federal tax return. As a result, no provision for income taxes is required. As of April 30, 2010, the Fund did not have any unrecognized tax benefits in the accompanying financial statements. A Fund's federal tax return is subject to examination by the Internal Revenue Service (IRS) for a period of three years. Foreign taxes are provided for based on the Fund's understanding of the tax rules and rates that exist in the foreign markets in which it invests.
Distributions are recorded on the ex-dividend date. Income dividends and capital gain distributions are declared separately for each class. Income and capital gain distributions are determined in accordance with income tax regulations, which may differ from generally accepted accounting principles.
Annual Report
3. Significant Accounting Policies - continued
Income Tax Information and Distributions to Shareholders - continued
Capital accounts within the financial statements are adjusted for permanent book-tax differences. These adjustments have no impact on net assets or the results of operations. Temporary book-tax differences will reverse in a subsequent period.
Book-tax differences are primarily due to the short-term gain distributions from the Fidelity Central Funds, futures transactions, foreign currency transactions, passive foreign investment companies (PFIC), partnerships, deferred trustees compensation, capital loss carryforwards, and losses deferred due to wash sales and excise tax regulations.
The federal tax cost of investment securities and unrealized appreciation (depreciation) as of period end were as follows:
Gross unrealized appreciation | $ 2,050,403 |
Gross unrealized depreciation | (665,669) |
Net unrealized appreciation (depreciation) | $ 1,384,734 |
| |
Tax Cost | $ 7,692,904 |
The tax-based components of distributable earnings as of period end were as follows:
Undistributed ordinary income | $ 19,538 |
Capital loss carryforward | $ (1,072,367) |
Net unrealized appreciation (depreciation) | $ 1,384,745 |
The tax character of distributions paid was as follows:
| April 30, 2010 | April 30, 2009 |
Ordinary Income | $ 18,117 | $ 7,694 |
Long-term Capital Gains | - | 131,543 |
Total | $ 18,117 | $ 139,237 |
Short-Term Trading (Redemption) Fees. Shares held in the Fund less than 30 days are subject to a redemption fee equal to .75% of the proceeds of the redeemed shares. All redemption fees, including any estimated redemption fees paid by FMR, are retained by the Fund and accounted for as an addition to paid in capital.
Annual Report
Notes to Financial Statements - continued
(Amounts in thousands except ratios)
4. Operating Policies.
Restricted Securities. The Fund may invest in securities that are subject to legal or contractual restrictions on resale. These securities generally may be resold in transactions exempt from registration or to the public if the securities are registered. Disposal of these securities may involve time-consuming negotiations and expense, and prompt sale at an acceptable price may be difficult. Information regarding restricted securities is included at the end of the Fund's Schedule of Investments.
5. Investments in Derivative Instruments.
Objectives and Strategies for Investing in Derivative Instruments. The Fund uses derivative instruments ("derivatives"), including futures contracts, in order to meet its investment objectives. The Fund's strategy is to use derivatives as a risk management tool and as an additional way to gain exposure to certain types of assets. The success of any strategy involving derivatives depends on analysis of numerous economic factors, and if the strategies for investment do not work as intended, the Fund may not achieve its objectives.
While utilizing derivatives in pursuit of its investment objectives, the Fund is exposed to certain financial risk relative to those derivatives. This risk is further explained below:
Equity Risk | Equity risk is the risk that the value of financial instruments will fluctuate as a result of changes in market prices (other than those arising from interest rate risk or foreign exchange risk), whether caused by factors specific to an individual investment, its issuer, or all factors affecting all instruments traded in a market or market segment. |
The following notes provide more detailed information about each derivative type held by the Fund:
Futures Contracts. The Fund uses futures contracts to manage its exposure to the stock market. A futures contract is an agreement between two parties to buy or sell a specified underlying instrument for a fixed price at a specified future date. Buying futures tends to increase a fund's exposure to the underlying instrument, while selling futures tends to decrease a fund's exposure to the underlying instrument. Risks of loss may exceed any futures variation margin reflected in the Fund's Statement of Assets and Liabilities and may include equity risk and potential lack of liquidity in the market. Futures have minimal counterparty risk to the Fund since the exchange's clearinghouse, as counterparty to all exchange-traded futures, guarantees the futures against default. The underlying face amount at value of any open futures contracts at period end is shown in the Schedule of Investments under the caption "Futures Contracts." This amount reflects each contract's exposure to the underlying instrument at period end.
Annual Report
5. Investments in Derivative Instruments - continued
Futures Contracts - continued
The purchaser or seller of a futures contract is not required to pay for or deliver the instrument unless the contract is held until the delivery date. Upon entering into a futures contract, a fund is required to deposit with a clearing broker, no later than the following business day, an amount ("initial margin") equal to a certain percentage of the face value of the contract. The initial margin may be in the form of cash or securities and is transferred to a segregated account on settlement date. Securities deposited to meet margin requirements are identified in the Fund's Schedule of Investments. Futures contracts are marked-to-market daily and subsequent payments ("variation margin") are made or received by a fund depending on the daily fluctuations in the value of the futures contract. These amounts are reflected as receivables or payables on the Statement of Assets and Liabilities and changes in value are recognized as unrealized gain (loss). Realized gain (loss) is recorded upon the expiration or closing of the futures contract. The net realized gain (loss) and change in unrealized gain (loss) on futures contracts during the period is included on the Statement of Operations. The total underlying face amount of all open futures contracts at period end is indicative of the volume of this derivative type.
Realized and Change in Unrealized Gain (Loss) on Derivative Instruments. A summary of the Fund's value of derivatives by primary risk exposure as of period end, if any, is included at the end of the Fund's Schedule of Investments. The table below reflects the Fund's realized gain (loss) and change in unrealized gain (loss) for derivatives during the period.
Risk Exposure / Derivative Type | Realized
Gain (Loss) | Change in Unrealized
Gain (Loss) |
Equity Risk | | |
Futures Contracts | $ 3,760 | $ 3,703 |
Total Derivatives Realized and Change in Unrealized Gain (Loss) (a)(b) | $ 3,760 | $ 3,703 |
(a) Total derivatives realized gain (loss) included in the Statement of Operations is comprised of $3,760 for futures contracts.
(b) Total derivatives change in unrealized gain (loss) included in the Statement of Operations is comprised of $3,703 for futures contracts.
6. Purchases and Sales of Investments.
Purchases and sales of securities, other than short-term securities, aggregated $5,707,063 and $5,765,568, respectively.
Annual Report
Notes to Financial Statements - continued
(Amounts in thousands except ratios)
7. Fees and Other Transactions with Affiliates.
Management Fee. FMR and its affiliates provide the Fund with investment management related services for which the Fund pays a monthly management fee. The management fee is the sum of an individual fund fee rate that is based on an annual rate of .30% of the Fund's average net assets and a group fee rate that averaged .26% during the period. The group fee rate is based upon the average net assets of all the mutual funds advised by FMR. The group fee rate decreases as assets under management increase and increases as assets under management decrease. In addition, the management fee is subject to a performance adjustment (up to a maximum of ± .20% of the Fund's average net assets over a 36 month performance period). The upward or downward adjustment to the management fee is based on the relative investment performance of the retail class of the Fund, Mid-Cap Stock, as compared to an appropriate benchmark index. For the period, the total annual management fee rate, including the performance adjustment, was .34% of the Fund's average net assets.
Transfer Agent Fees. Fidelity Investments Institutional Operations Company, Inc. (FIIOC), an affiliate of FMR, is the transfer, dividend disbursing and shareholder servicing agent for each class of the Fund. FIIOC receives account fees and asset-based fees that vary according to the account size and type of account of the shareholders of Mid-Cap Stock. FIIOC receives an asset-based fee of Class K's average net assets. FIIOC pays for typesetting, printing and mailing of shareholder reports, except proxy statements. For the period, the total transfer agent fees paid by each class were as follows:
| Amount | % of
Average
Net Assets |
Mid-Cap Stock | $ 17,040 | .28 |
Class K | 400 | .06 |
| $ 17,440 | |
Accounting and Security Lending Fees. Fidelity Service Company, Inc. (FSC), an affiliate of FMR, maintains the Fund's accounting records. The accounting fee is based on the level of average net assets for the month. Under a separate contract, FSC administers the security lending program. The security lending fee is based on the number and duration of lending transactions.
Brokerage Commissions. The Fund placed a portion of its portfolio transactions with brokerage firms which are affiliates of the investment adviser. The commissions paid to these affiliated firms were $201 for the period.
Annual Report
7. Fees and Other Transactions with Affiliates - continued
Interfund Lending Program. Pursuant to an Exemptive Order issued by the SEC, the Fund, along with other registered investment companies having management contracts with FMR, may participate in an interfund lending program. This program provides an alternative credit facility allowing the funds to borrow from, or lend money to, other participating affiliated funds. The Fund's activity in this program during the period for which loans were outstanding was as follows:
Borrower or Lender | Average Daily
Loan Balance | Weighted Average Interest Rate | Interest Expense |
Borrower | $ 14,698 | .42% | $ 10 |
8. Committed Line of Credit.
The Fund participates with other funds managed by FMR in a $3.75 billion credit facility (the "line of credit") to be utilized for temporary or emergency purposes to fund shareholder redemptions or for other short-term liquidity purposes. The Fund has agreed to pay commitment fees on its pro-rata portion of the line of credit, which amounted to $27 and is reflected in Miscellaneous Expense on the Statement of Operations. During the period, there were no borrowings on this line of credit.
9. Security Lending.
The Fund lends portfolio securities from time to time in order to earn additional income. On the settlement date of the loan, the Fund receives collateral (in the form of U.S. Treasury obligations, letters of credit and/or cash) against the loaned securities and maintains collateral in an amount not less than 100% of the market value of the loaned securities during the period of the loan. The market value of the loaned securities is determined at the close of business of the Fund and any additional required collateral is delivered to the Fund on the next business day. If the borrower defaults on its obligation to return the securities loaned because of insolvency or other reasons, a fund could experience delays and costs in recovering the securities loaned or in gaining access to the collateral. Any cash collateral received is invested in the Fidelity Securities Lending Cash Central Fund. The value of loaned securities and cash collateral at period end are disclosed on the Fund's Statement of Assets and Liabilities. Security lending income represents the income earned on investing cash collateral, less fees and expenses associated with the loan, plus any premium payments that may be received on the loan of certain types of securities. Security lending income is presented in the Statement of Operations as a component of income from Fidelity Central Funds.
Annual Report
Notes to Financial Statements - continued
(Amounts in thousands except ratios)
10. Expense Reductions.
FMR voluntarily agreed to reimburse a portion of Mid-Cap Stock's operating expenses. During the period, this reimbursement reduced the class' expenses by $10.
Many of the brokers with whom FMR places trades on behalf of the Fund provided services to the Fund in addition to trade execution. These services included payments of certain expenses on behalf of the Fund totaling $835 for the period.
11. Distributions to Shareholders.
Distributions to shareholders of each class were as follows:
Years ended April 30, | 2010 | 2009 A |
From net investment income | | |
Mid-Cap Stock | $ 15,250 | $ 6,804 |
Class K | 2,867 | 890 |
Total | $ 18,117 | $ 7,694 |
Years ended April 30, | |
|
From net realized gain | | |
Mid-Cap Stock | $ - | $ 131,185 |
Class K | - | 358 |
Total | $ - | $ 131,543 |
A Distributions for Class K are for the period May 9, 2008 (commencement of sale of shares) to April 30, 2009.
12. Share Transactions.
Transactions for each class of shares were as follows:
| Shares | Dollars |
Years ended April 30, | 2010B | 2009A | 2010B | 2009A |
Mid-Cap Stock | | | | |
Shares sold | 57,640 | 50,358 | $ 1,306,729 | $ 977,540 |
Conversion to Class K | (2,545) | (24,565) | (49,963) | (408,783) |
Reinvestment of distributions | 646 | 5,113 | 14,922 | 135,727 |
Shares redeemed | (67,646) | (216,202) | (1,524,601) | (3,937,402) |
Net increase (decrease) | (11,905) | (185,296) | $ (252,913) | $ (3,232,918) |
Class K | | | | |
Shares sold | 20,395 | 2,326 | $ 479,811 | $ 34,753 |
Conversion from Mid-Cap Stock | 2,546 | 24,570 | 49,963 | 408,783 |
Reinvestment of distributions | 124 | 83 | 2,867 | 1,249 |
Shares redeemed | (6,499) | (2,205) | (145,094) | (32,986) |
Net increase (decrease) | 16,566 | 24,774 | $ 387,547 | $ 411,799 |
A Share transactions for Class K are for the period May 9, 2008 (commencement of sale of shares) to April 30, 2009.
B Conversion transactions for Class K and Mid-Cap Stock are presented for the period May 1, 2009 through August 31, 2009.
Annual Report
13. Other.
The Fund's organizational documents provide former and current trustees and officers with a limited indemnification against liabilities arising in connection with the performance of their duties to the Fund. In the normal course of business, the Fund may also enter into contracts that provide general indemnifications. The Fund's maximum exposure under these arrangements is unknown as this would be dependent on future claims that may be made against the Fund. The risk of material loss from such claims is considered remote.
Annual Report
To the Trustees of Fidelity Commonwealth Trust and Shareholders of Fidelity Mid-Cap Stock Fund:
We have audited the accompanying statement of assets and liabilities of Fidelity Mid-Cap Stock Fund (the Fund), a fund of Fidelity Commonwealth Trust, including the schedule of investments, as of April 30, 2010, and the related statement of operations for the year then ended, the statement of changes in net assets for each of the two years in the period then ended, and the financial highlights for each of the five years in the period then ended. These financial statements and financial highlights are the responsibility of the Fund's management. Our responsibility is to express an opinion on these financial statements and financial highlights based on our audits.
We conducted our audits in accordance with standards of the Public Company Accounting Oversight Board (United States). Those standards require that we plan and perform the audit to obtain reasonable assurance about whether the financial statements and financial highlights are free of material misstatement. The Fund is not required to have, nor were we engaged to perform, an audit of its internal control over financial reporting. Our audits included consideration of internal control over financial reporting as a basis for designing audit procedures that are appropriate in the circumstances, but not for the purpose of expressing an opinion on the effectiveness of the Fund's internal control over financial reporting. Accordingly, we express no such opinion. An audit also includes examining, on a test basis, evidence supporting the amounts and disclosures in the financial statements, assessing the accounting principles used and significant estimates made by management, as well as evaluating the overall financial statement presentation. Our procedures included confirmation of securities owned as of April 30, 2010, by correspondence with the custodians and brokers; where replies were not received from brokers, we performed other auditing procedures. We believe that our audits provide a reasonable basis for our opinion.
In our opinion, the financial statements and financial highlights referred to above present fairly, in all material respects, the financial position of Fidelity Mid-Cap Stock Fund as of April 30, 2010, the results of its operations for the year then ended, the changes in its net assets for each of the two years in the period then ended, and the financial highlights for each of the five years in the period then ended, in conformity with accounting principles generally accepted in the United States of America.
/s/ Deloitte & Touche LLP
DELOITTE & TOUCHE LLP
Boston, Massachusetts
June 17, 2010
Annual Report
The Trustees, Member of the Advisory Board, and executive officers of the trust and fund, as applicable, are listed below. The Board of Trustees governs the fund and is responsible for protecting the interests of shareholders. The Trustees are experienced executives who meet periodically throughout the year to oversee the fund's activities, review contractual arrangements with companies that provide services to the fund, oversee management of the risks associated with such activities and contractual arrangements, and review the fund's performance. Except for James C. Curvey, each of the Trustees oversees 222 funds advised by FMR or an affiliate. Mr. Curvey oversees 411 funds advised by FMR or an affiliate.
The Trustees hold office without limit in time except that (a) any Trustee may resign; (b) any Trustee may be removed by written instrument, signed by at least two-thirds of the number of Trustees prior to such removal; (c) any Trustee who requests to be retired or who has become incapacitated by illness or injury may be retired by written instrument signed by a majority of the other Trustees; and (d) any Trustee may be removed at any special meeting of shareholders by a two-thirds vote of the outstanding voting securities of the trust. Each Trustee who is not an interested person (as defined in the 1940 Act) (Independent Trustee), shall retire not later than the last day of the calendar year in which his or her 72nd birthday occurs. The Independent Trustees may waive this mandatory retirement age policy with respect to individual Trustees. The executive officers and Advisory Board Member hold office without limit in time, except that any officer and Advisory Board Member may resign or may be removed by a vote of a majority of the Trustees at any regular meeting or any special meeting of the Trustees. Except as indicated, each individual has held the office shown or other offices in the same company for the past five years.
Experience, Skills, Attributes, and Qualifications of the Fund's Trustees. The Governance and Nominating Committee has adopted a statement of policy that describes the experience, qualifications, attributes, and skills that are necessary and desirable for potential Independent Trustee candidates (Statement of Policy). The Board believes that each Trustee satisfied at the time he or she was initially elected or appointed a Trustee, and continues to satisfy, the standards contemplated by the Statement of Policy. The Governance and Nominating Committee also engages professional search firms to help identify potential Independent Trustee candidates who have the experience, qualifications, attributes, and skills consistent with the Statement of Policy. From time to time, additional criteria based on the composition and skills of the current Independent Trustees, as well as experience or skills that may be appropriate in light of future changes to board composition, business conditions, and regulatory or other developments, have also been considered by the professional search firms and the Governance and Nominating Committee. In addition, the Board takes into account the Trustees' commitment and participation in Board and committee meetings, as well as their leadership of standing and ad hoc committees throughout their tenure.
In determining that a particular Trustee was and continues to be qualified to serve as a Trustee, the Board has considered a variety of criteria, none of which, in isolation, was controlling. The Board believes that, collectively, the Trustees have balanced and diverse experience, qualifications, attributes, and skills, which allow the Board to operate effectively in governing the fund and protecting the interests of shareholders. Information about the specific experience, skills, attributes, and qualifications of each Trustee, which in each case led to the Board's conclusion that the Trustee should serve (or continue to serve) as a trustee of the fund, is provided below.
Annual Report
Board Structure and Oversight Function. Edward C. Johnson 3d is an interested person (as defined in the 1940 Act) and currently serves as Chairman. The Trustees have determined that an interested Chairman is appropriate and benefits shareholders because an interested Chairman has a personal and professional stake in the quality and continuity of services provided to the fund. Independent Trustees exercise their informed business judgment to appoint an individual of their choosing to serve as Chairman, regardless of whether the Trustee happens to be independent or a member of management. The Independent Trustees have determined that they can act independently and effectively without having an Independent Trustee serve as Chairman and that a key structural component for assuring that they are in a position to do so is for the Independent Trustees to constitute a substantial majority for the Board. The Independent Trustees also regularly meet in executive session. Ned C. Lautenbach serves as Chairman of the Independent Trustees and as such (i) acts as a liaison between the Independent Trustees and management with respect to matters important to the Independent Trustees and (ii) with management prepares agendas for Board meetings.
Fidelity funds are overseen by different Boards of Trustees. The fund's Board oversees Fidelity's equity and high income funds and another Board oversees Fidelity's investment-grade bond, money market, and asset allocation funds. The asset allocation funds may invest in Fidelity funds overseen by the fund's Board. The use of separate Boards, each with its own committee structure, allows the Trustees of each group of Fidelity funds to focus on the unique issues of the funds they oversee, including common research, investment, and operational issues. On occasion, the separate Boards establish joint committees to address issues of overlapping consequences for the Fidelity funds overseen by each Board.
The Trustees operate using a system of committees to facilitate the timely and efficient consideration of all matters of importance to the Trustees, the fund, and fund shareholders and to facilitate compliance with legal and regulatory requirements and oversight of the fund's activities and associated risks. The Board, acting through its committees, has charged FMR and its affiliates with (i) identifying events or circumstances the occurrence of which could have demonstrably adverse effects on the fund's business and/or reputation; (ii) implementing processes and controls to lessen the possibility that such events or circumstances occur or to mitigate the effects of such events or circumstances if they do occur; and (iii) creating and maintaining a system designed to evaluate continuously business and market conditions in order to facilitate the identification and implementation processes described in (i) and (ii) above. Because the day-to-day operations and activities of the fund are carried out by or through FMR, its affiliates and other service providers, the fund's exposure to risks is mitigated but not eliminated by the processes overseen by the Trustees. While each of the Board's committees has responsibility for overseeing different aspects of the fund's activities, oversight is exercised primarily through the Operations, Audit, and Compliance Committees. Appropriate personnel, including but not limited to the fund's Chief Compliance Officer (CCO), FMR's internal auditor, the independent accountants, the fund's Treasurer and portfolio management personnel, make periodic reports to the Board's committees, as appropriate. The responsibilities of each committee, including their oversight responsibilities, are described further under "Standing Committees of the Fund's Trustees."
Annual Report
Trustees and Officers - continued
The fund's Statement of Additional Information (SAI) includes more information about the Trustees. To request a free copy, call Fidelity at 1-800-544-8544.
Interested Trustees*:
Correspondence intended for each Trustee who is an interested person may be sent to Fidelity Investments, 82 Devonshire Street, Boston, Massachusetts 02109.
Name, Age; Principal Occupations and Other Relevant Experience+ |
Edward C. Johnson 3d (79) |
| Year of Election or Appointment: 1974 Mr. Johnson is Trustee and Chairman of the Board of Trustees of certain Trusts. Mr. Johnson serves as Chief Executive Officer, Chairman, and a Director of FMR LLC; Chairman and a Director of FMR; Chairman and a Director of Fidelity Research & Analysis Company (FRAC); Chairman and a Director of Fidelity Investments Money Management, Inc.; and Chairman and a Director of FMR Co., Inc. In addition, Mr. Johnson serves as Chairman and Director of FIL Limited. Previously, Mr. Johnson served as President of FMR LLC (2006-2007). |
James C. Curvey (74) |
| Year of Election or Appointment: 2007 Mr. Curvey also serves as Trustee (2007-present) of other investment companies advised by FMR. Mr. Curvey is a Director of FMR and FMR Co., Inc. (2007-present). Mr. Curvey is also Vice Chairman (2006-
present) and Director of FMR LLC. In addition, Mr. Curvey serves as an Overseer for the Boston Symphony Orchestra and a member of the Trustees of Villanova University. |
* Trustees have been determined to be "Interested Trustees" by virtue of, among other things, their affiliation with the trust or various entities under common control with FMR.
+ The information above includes each Trustee's principal occupation during the last five years and other information relating to the experience, attributes, and skills relevant to each Trustee's qualifications to serve as a Trustee, which led to the conclusion that each Trustee should serve as a Trustee for the fund.
Annual Report
Independent Trustees:
Correspondence intended for each Independent Trustee (that is, the Trustees other than the Interested Trustees) may be sent to Fidelity Investments, P.O. Box 55235, Boston, Massachusetts 02205-5235.
Name, Age; Principal Occupations and Other Relevant Experience+ |
Dennis J. Dirks (61) |
| Year of Election or Appointment: 2005 Prior to his retirement in May 2003, Mr. Dirks was Chief Operating Officer and a member of the Board of The Depository Trust & Clearing Corporation (DTCC). He also served as President, Chief Operating Officer, and Board member of The Depository Trust Company (DTC) and President and Board member of the National Securities Clearing Corporation (NSCC). In addition, Mr. Dirks served as Chief Executive Officer and Board member of the Government Securities Clearing Corporation, Chief Executive Officer and Board member of the Mortgage-Backed Securities Clearing Corporation, as a Trustee and a member of the Finance Committee of Manhattan College (2005-2008), and as a Trustee and a member of the Finance Committee of AHRC of Nassau County (2006-2008). Currently, Mr. Dirks serves as a member of the Board of Directors for The Brookville Center for Children's Services, Inc. (2009-present). |
Alan J. Lacy (56) |
| Year of Election or Appointment: 2008 Mr. Lacy serves as Senior Adviser (2007-present) of Oak Hill Capital Partners, L.P. (private equity). Mr. Lacy also served as Chief Executive Officer (2000-2005) and Vice Chairman (2005-2006) of Sears Holdings Corporation and Sears, Roebuck and Co. (retail). In addition, Mr. Lacy serves as a member of the Board of Directors of The Western Union Company (global money transfer, 2006-present) and Bristol-Myers Squibb Company (global pharmaceuticals, 2007-present). Mr. Lacy is Chairman (2008-present) and a member (2006-present) of the Board of Trustees of The National Parks Conservation Association. |
Ned C. Lautenbach (66) |
| Year of Election or Appointment: 2000 Mr. Lautenbach is Chairman of the Independent Trustees of the Equity and High Income Funds (2006-present). Mr. Lautenbach is an Advisory Partner of Clayton, Dubilier & Rice, Inc. (private equity investment, 2008-present) and was previously a Partner of Clayton, Dubilier & Rice, Inc. (1998-2008). Previously, Mr. Lautenbach was with the International Business Machines Corporation (IBM) from 1968 until his retirement in 1998. Mr. Lautenbach serves as a Director of Eaton Corporation (diversified industrial) as well as the Philharmonic Center for the Arts in Naples, Florida. Mr. Lautenbach is also a member of the Board of Trustees of Fairfield University (2005-present), as well as a member of the Council on Foreign Relations. Previously, Mr. Lautenbach served as a Director of Sony Corporation (2006-2007). |
Joseph Mauriello (65) |
| Year of Election or Appointment: 2008 Prior to his retirement in January 2006, Mr. Mauriello served in numerous senior management positions including Deputy Chairman and Chief Operating Officer (2004-2005), and Vice Chairman of Financial Services (2002-2004) of KPMG LLP US (professional services, 1965-2005). Mr. Mauriello currently serves as a member of the Board of Directors of XL Capital Ltd. (global insurance and re-insurance, 2006-present) and of Arcadia Resources Inc. (health care services and products, 2007-present). Previously, Mr. Mauriello served as a Director of the Hamilton Funds of the Bank of New York (2006-2007). |
Cornelia M. Small (65) |
| Year of Election or Appointment: 2005 Ms. Small is a member of the Board of Directors of the Teagle Foundation (2009-present). Ms. Small is also a member of the Investment Committee, and Chair (2008-present) and a member of the Board of Trustees of Smith College. In addition, Ms. Small serves on the Investment Committee of the Berkshire Taconic Community Foundation (2008-present). Previously, Ms. Small served as Chairperson of the Investment Committee (2002-2008) of Smith College. In addition, Ms. Small served as Chief Investment Officer, Director of Global Equity Investments, and a member of the Board of Directors of Scudder, Stevens & Clark and Scudder Kemper Investments. |
William S. Stavropoulos (70) |
| Year of Election or Appointment: 2002 Mr. Stavropoulos is Vice Chairman of the Independent Trustees of the Equity and High Income Funds (2006-present). Mr. Stavropoulos serves as President and Founder of the Michigan Baseball Foundation, the Great Lakes Loons (2007-present). Mr. Stavropoulos is Chairman Emeritus of the Board of Directors of The Dow Chemical Company, where he previously served in numerous senior management positions, including President, CEO (1995-2000; 2002-2004), Chairman of the Executive Committee (2000-2006), and as a member of the Board of Directors (1990-2006). Currently, Mr. Stavropoulos is a Director of Teradata Corporation (data warehousing and technology solutions, 2008-present), Chemical Financial Corporation, Maersk Inc. (industrial conglomerate), Tyco International, Inc. (multinational manufacturing and services, 2007-present), and a member of the Advisory Board for Metalmark Capital (private equity investment, 2005-present). Mr. Stavropoulos is a special advisor to Clayton, Dubilier & Rice, Inc. (private equity investment). In addition, Mr. Stavropoulos is a member of the University of Notre Dame Advisory Council for the College of Science. |
David M. Thomas (60) |
| Year of Election or Appointment: 2008 Previously, Mr. Thomas served as Executive Chairman (2005-2006) and Chairman and Chief Executive Officer (2000-2005) of IMS Health, Inc. (pharmaceutical and healthcare information solutions). In addition, Mr. Thomas serves as a member of the Board of Directors of Fortune Brands, Inc. (consumer products), and Interpublic Group of Companies, Inc. (marketing communication, 2004-present). |
Michael E. Wiley (59) |
| Year of Election or Appointment: 2008 Mr. Wiley also serves as a Director of Asia Pacific Exploration Consolidated (international oil and gas exploration and production, 2008-
present), and as a member of the Board of Trustees of the University of Tulsa (2000-2006; 2007-present). Mr. Wiley serves as a Director of Tesoro Corporation (independent oil refiner and marketer, 2005-present), and a Director of Bill Barrett Corporation (exploration and production, 2005-present). In addition, Mr. Wiley also serves as a Director of Post Oak Bank (privately-held bank, 2004-present). Previously, Mr. Wiley served as a Sr. Energy Advisor of Katzenbach Partners, LLC (consulting, 2006-2007), as an Advisory Director of Riverstone Holdings (private investment), Chairman, President, and CEO of Baker Hughes, Inc. (oilfield services, 2000-2004), and as Director of Spinnaker Exploration Company (exploration and production, 2001-2005). |
Annual Report
Trustees and Officers - continued
+ The information above includes each Trustee's principal occupation during the last five years and other information relating to the experience, attributes, and skills relevant to each Trustee's qualifications to serve as a Trustee, which led to the conclusion that each Trustee should serve as a Trustee for the fund.
Advisory Board Member and Executive Officers:
Correspondence intended for each executive officer and Peter S. Lynch may be sent to Fidelity Investments, 82 Devonshire Street, Boston, Massachusetts 02109.
Name, Age; Principal Occupation |
Peter S. Lynch (66) |
| Year of Election or Appointment: 2003 Member of the Advisory Board of Fidelity's Equity and High Income Funds. Mr. Lynch is Vice Chairman and a Director of FMR and FMR Co., Inc. In addition, Mr. Lynch serves as a Trustee of Boston College and as the Chairman of the Inner-City Scholarship Fund. Previously, Mr. Lynch served on the Special Olympics International Board of Directors (1997-2006). |
Kenneth B. Robins (40) |
| Year of Election or Appointment: 2008 President and Treasurer of Fidelity's Equity and High Income Funds. Mr. Robins also serves as President and Treasurer (2010-present) and Assistant Treasurer (2009-present) of other Fidelity funds and is an employee of Fidelity Investments (2004-present). Previously, Mr. Robins served as Deputy Treasurer of the Fidelity funds (2005-2008) and Treasurer and Chief Financial Officer of The North Carolina Capital Management Trust: Cash and Term Portfolios (2006-2008). |
Bruce T. Herring (44) |
| Year of Election or Appointment: 2006 Vice President of certain Equity Funds. Mr. Herring also serves as Group Chief Investments Officer of FMR. Previously, Mr. Herring served as a portfolio manager for Fidelity U.S. Equity Funds. |
Brian B. Hogan (45) |
| Year of Election or Appointment: 2009 Vice President of certain Equity Funds and Vice President of Sector Funds. Mr. Hogan also serves as Senior Vice President, Equity Research of FMR (2006-present) and President of FMR's Equity Division (2009-present). Previously, Mr. Hogan served as a portfolio manager. |
Scott C. Goebel (42) |
| Year of Election or Appointment: 2008 Secretary and Chief Legal Officer (CLO) of the Fidelity funds. Mr. Goebel also serves as General Counsel, Secretary, and Senior Vice President of FMR (2008-present) and FMR Co., Inc. (2008-present); Deputy General Counsel of FMR LLC; Chief Legal Officer of Fidelity Management & Research (Hong Kong) Limited (2008-present) and Assistant Secretary of Fidelity Management & Research (Japan) Inc. (2008-present), Fidelity Investments Money Management, Inc. (2008-present), Fidelity Management & Research (U.K.) Inc. (2008-present), and Fidelity Research and Analysis Company (2008-present). Previously, Mr. Goebel served as Assistant Secretary of the Funds (2007-2008) and as Vice President and Secretary of Fidelity Distributors Corporation (FDC) (2005-2007). |
William C. Coffey (41) |
| Year of Election or Appointment: 2009 Assistant Secretary of Fidelity's Equity and High Income Funds. Mr. Coffey also serves as Senior Vice President and Deputy General Counsel of FMR LLC (2010-present), and is an employee of Fidelity Investments. Previously, Mr. Coffey served as Vice President and Associate General Counsel of FMR LLC (2005-2009). |
Holly C. Laurent (55) |
| Year of Election or Appointment: 2008 Anti-Money Laundering (AML) Officer of the Fidelity funds. Ms. Laurent is an employee of Fidelity Investments. Previously, Ms. Laurent was Senior Vice President and Head of Legal for Fidelity Business Services India Pvt. Ltd. (2006-2008), and Senior Vice President, Deputy General Counsel and Group Head for FMR LLC (2005-2006). |
Christine Reynolds (51) |
| Year of Election or Appointment: 2008 Chief Financial Officer of the Fidelity funds. Ms. Reynolds became President of Fidelity Pricing and Cash Management Services (FPCMS) in August 2008. Ms. Reynolds served as Chief Operating Officer of FPCMS (2007-2008). Previously, Ms. Reynolds served as President, Treasurer, and Anti-Money Laundering officer of the Fidelity funds (2004-2007). |
Kenneth A. Rathgeber (62) |
| Year of Election or Appointment: 2004 Chief Compliance Officer of Fidelity's Equity and High Income Funds. Mr. Rathgeber is Chief Compliance Officer of Fidelity Management & Research (Hong Kong) Limited (2008-present), Fidelity Management & Research (Japan) Inc. (2008-present), FMR (2005-present), FMR Co., Inc. (2005-present), Fidelity Management & Research (U.K.) Inc. (2005-present), Fidelity Research & Analysis Company (2005-present), Fidelity Investments Money Management, Inc. (2005-present), Pyramis Global Advisors, LLC (2005-present), and Strategic Advisers, Inc. (2005-present). |
Jeffrey S. Christian (48) |
| Year of Election or Appointment: 2009 Deputy Treasurer of the Fidelity funds. Mr. Christian is an employee of Fidelity Investments. Previously, Mr. Christian served as Chief Financial Officer (2008-2009) of certain Fidelity funds and Senior Vice President of Fidelity Pricing and Cash Management Services (FPCMS) (2004-2009). |
Bryan A. Mehrmann (49) |
| Year of Election or Appointment: 2005 Deputy Treasurer of the Fidelity funds. Mr. Mehrmann is an employee of Fidelity Investments. |
Adrien E. Deberghes (42) |
| Year of Election or Appointment: 2008 Deputy Treasurer of Fidelity's Equity and High Income Funds. Mr. Deberghes is an employee of Fidelity Investments (2008-present). Previously, Mr. Deberghes served as Senior Vice President of Mutual Fund Administration at State Street Corporation (2007-2008), Senior Director of Mutual Fund Administration at Investors Bank & Trust (2005-2007), and Director of Finance for Dunkin' Brands (2000-2005). |
John R. Hebble (51) |
| Year of Election or Appointment: 2009 Assistant Treasurer of Fidelity's Equity and High Income Funds. Mr. Hebble also serves as Treasurer and Chief Financial Officer of The North Carolina Capital Management Trust: Cash and Term Portfolio (2008-present), President and Treasurer of other Fidelity funds (2008-present) and is an employee of Fidelity Investments. |
Gary W. Ryan (51) |
| Year of Election or Appointment: 2005 Assistant Treasurer of the Fidelity funds. Mr. Ryan is an employee of Fidelity Investments. Previously, Mr. Ryan served as Vice President of Fund Reporting in Fidelity Pricing and Cash Management Services (FPCMS) (1999-2005). |
Annual Report
The Board of Trustees of Fidelity Mid-Cap Stock Fund voted to pay shareholders of record at the opening of business on record date, the following distributions per share derived from capital gains realized from sales of portfolio securities, and dividends derived from net investment income:
| Pay Date | Record Date | Dividends | Capital Gains |
Mid-Cap Stock | 06/14/10 | 06/11/10 | $0.028 | $0.035 |
Mid-Cap Stock designates 100% of the dividends distributed during the fiscal year as qualifying for the dividends-received deduction for corporate shareholders.
Mid-Cap Stock designates 100% of the dividends distributed during the fiscal year as amounts which may be taken into account as a dividend for the purposes of the maximum rate under section 1(h)(11) of the Internal Revenue Code.
The fund will notify shareholders in January 2011 of amounts for use in preparing 2010 income tax returns.
Annual Report
Managing Your Investments
Fidelity offers several ways to conveniently manage your personal investments via your telephone or PC. You can access your account information, conduct trades and research your investments 24 hours a day.
By Phone
Fidelity Automated Service Telephone provides a single toll-free number to access account balances, positions, quotes and trading. It's easy to navigate the service, and on your first call, the system will help you create a personal identification number (PIN) for security.
(phone_graphic)
Fidelity Automated
Service Telephone (FAST®)
1-800-544-5555
Press
For mutual fund and brokerage trading.
For quotes.*
For account balances and holdings.
To review orders and mutual
fund activity.
To change your PIN.
To speak to a Fidelity representative.
By PC
Fidelity's web site on the Internet provides a wide range of information, including daily financial news, fund performance, interactive planning tools and news about Fidelity products and services.
(computer_graphic)
Fidelity's Web Site
www.fidelity.com
* When you call the quotes line, please remember that a fund's yield and return will vary and, except for money market funds, share price will also vary. This means that you may have a gain or loss when you sell your shares. There is no assurance that money market funds will be able to maintain a stable $1 share price; an investment in a money market fund is not insured or guaranteed by the U.S. government. Total returns are historical and include changes in share price, reinvestment of dividends and capital gains, and the effects of any sales charges.
Annual Report
To Visit Fidelity
For directions and hours,
please call 1-800-544-9797.
Arizona
7001 West Ray Road
Chandler, AZ
15445 N. Scottsdale Road
Scottsdale, AZ
17550 North 75th Avenue
Glendale, AZ
5330 E. Broadway Blvd
Tucson, AZ
California
815 East Birch Street
Brea, CA
1411 Chapin Avenue
Burlingame, CA
851 East Hamilton Avenue
Campbell, CA
601 Larkspur Landing Circle
Larkspur, CA
2000 Avenue of the Stars
Los Angeles, CA
27101 Puerta Real
Mission Viejo, CA
73575 El Paseo
Palm Desert, CA
251 University Avenue
Palo Alto, CA
123 South Lake Avenue
Pasadena, CA
16656 Bernardo Ctr. Drive
Rancho Bernardo, CA
1220 Roseville Parkway
Roseville, CA
1740 Arden Way
Sacramento, CA
7676 Hazard Center Drive
San Diego, CA
11943 El Camino Real
San Diego, CA
8 Montgomery Street
San Francisco, CA
3793 State Street
Santa Barbara, CA
1200 Wilshire Boulevard
Santa Monica, CA
398 West El Camino Real
Sunnyvale, CA
111 South Westlake Blvd
Thousand Oaks, CA
21701 Hawthorne Boulevard
Torrance, CA
2001 North Main Street
Walnut Creek, CA
6326 Canoga Avenue
Woodland Hills, CA
2211 Michelson Drive
Irvine, CA
Colorado
281 East Flatiron Circle
Broomfield, CO
1625 Broadway
Denver, CO
9185 Westview Road
Lone Tree, CO
Connecticut
48 West Putnam Avenue
Greenwich, CT
265 Church Street
New Haven, CT
300 Atlantic Street
Stamford, CT
29 South Main Street
West Hartford, CT
1261 Post Road
Fairfield, CT
Delaware
400 Delaware Avenue
Wilmington, DE
Florida
175 East Altamonte Drive
Altamonte Springs, FL
1400 Glades Road
Boca Raton, FL
121 Alhambra Plaza
Coral Gables, FL
2948 N. Federal Highway
Ft. Lauderdale, FL
4671 Town Center Parkway
Jacksonville, FL
8880 Tamiami Trail, North
Naples, FL
230 Royal Palm Way
Palm Beach, FL
3501 PGA Boulevard
Palm Beach Gardens, FL
3550 Tamiami Trail, South
Sarasota, FL
1502 N. Westshore Blvd.
Tampa, FL
2465 State Road 7
Wellington, FL
Georgia
3242 Peachtree Road
Atlanta, GA
1000 Abernathy Road
Atlanta, GA
Illinois
One North LaSalle Street
Chicago, IL
401 North Michigan Avenue
Chicago, IL
One Skokie Valley Road
Highland Park, IL
1415 West 22nd Street
Oak Brook, IL
15105 S LaGrange Road
Orland Park, IL
1572 East Golf Road
Schaumburg, IL
1823 Freedom Drive
Naperville, IL
Indiana
8480 Keystone Crossing
Indianapolis, IN
Kansas
5400 College Boulevard
Overland Park, KS
Maine
Three Canal Plaza
Portland, ME
Maryland
7315 Wisconsin Avenue
Bethesda, MD
610 York Road
Towson, MD
Massachusetts
801 Boylston Street
Boston, MA
155 Congress Street
Boston, MA
300 Granite Street
Braintree, MA
44 Mall Road
Burlington, MA
238 Main Street
Cambridge, MA
200 Endicott Street
Danvers, MA
Fidelity Brokerage Services, Inc., 100 Summer St., Boston, MA 02110 Member NYSE/SIPC
Annual Report
405 Cochituate Road
Framingham, MA
551 Boston Turnpike
Shrewsbury, MA
Michigan
500 E. Eisenhower Pkwy.
Ann Arbor, MI
280 N. Old Woodward Ave.
Birmingham, MI
30200 Northwestern Hwy.
Farmington Hills, MI
43420 Grand River Avenue
Novi, MI
3480 28th Street
Grand Rapids, MI
2425 S. Linden Road STE E
Flint, MI
Minnesota
7740 France Avenue South
Edina, MN
8342 3rd Street North
Oakdale, MN
Missouri
1524 South Lindbergh Blvd.
St. Louis, MO
Nevada
2225 Village Walk Drive
Henderson, NV
New Jersey
501 Route 73 South
Marlton, NJ
150 Essex Street
Millburn, NJ
35 Morris Street
Morristown, NJ
396 Route 17, North
Paramus, NJ
3518 Route 1 North
Princeton, NJ
530 Broad Street
Shrewsbury, NJ
New Mexico
2261 Q Street NE
Albuquerque, NM
New York
1130 Franklin Avenue
Garden City, NY
37 West Jericho Turnpike
Huntington Station, NY
1271 Avenue of the Americas
New York, NY
980 Madison Avenue
New York, NY
61 Broadway
New York, NY
350 Park Avenue
New York, NY
200 Fifth Avenue
New York, NY
733 Third Avenue
New York, NY
2070 Broadway
New York, NY
1075 Northern Blvd.
Roslyn, NY
799 Central Park Avenue
Scarsdale, NY
3349 Monroe Avenue
Rochester, NY
North Carolina
4611 Sharon Road
Charlotte, NC
7011 Fayetteville Road
Durham, NC
Ohio
3805 Edwards Road
Cincinnati, OH
1324 Polaris Parkway
Columbus, OH
1800 Crocker Road
Westlake, OH
28699 Chagrin Boulevard
Woodmere Village, OH
Oregon
7493 SW Bridgeport Road
Tigard, OR
Pennsylvania
600 West DeKalb Pike
King of Prussia, PA
1735 Market Street
Philadelphia, PA
12001 Perry Highway
Wexford, PA
Rhode Island
10 Memorial Boulevard
Providence, RI
Tennessee
3018 Peoples Street
Johnson City, TN
7628 West Farmington Blvd.
Germantown, TN
2035 Mallory Lane
Franklin, TN
Texas
10000 Research Boulevard
Austin, TX
4001 Northwest Parkway
Dallas, TX
12532 Memorial Drive
Houston, TX
2701 Drexel Drive
Houston, TX
6560 Fannin Street
Houston, TX
1701 Lake Robbins Drive
The Woodlands, TX
6500 N. MacArthur Blvd.
Irving, TX
6005 West Park Boulevard
Plano, TX
1576 East Southlake Blvd.
Southlake, TX
15600 Southwest Freeway
Sugar Land, TX
139 N. Loop 1604 East
San Antonio, TX
Utah
279 West South Temple
Salt Lake City, UT
Virginia
1861 International Drive
McLean, VA
11957 Democracy Drive
Reston, VA
Washington
10500 NE 8th Street
Bellevue, WA
1518 6th Avenue
Seattle, WA
304 Strander Blvd
Tukwila, WA
Washington, DC
1900 K Street, N.W.
Washington, DC
Wisconsin
16020 West Bluemound Road
Brookfield, WI
Annual Report
To Write Fidelity
We'll give your correspondence immediate attention and send you written confirmation upon completion of your request.
(letter_graphic)
Making Changes
To Your Account
(such as changing name, address, bank, etc.)
Fidelity Investments
P.O. Box 770001
Cincinnati, OH 45277-0002
(letter_graphic)
For Non-Retirement
Accounts
Buying shares
Fidelity Investments
P.O. Box 770001
Cincinnati, OH 45277-0003
Overnight Express
Fidelity Investments
Attn: Distribution Services
100 Crosby Parkway - KC1H
Covington, KY 41015
Selling shares
Fidelity Investments
P.O. Box 770001
Cincinnati, OH 45277-0035
Overnight Express
Fidelity Investments
Attn: Distribution Services
100 Crosby Parkway - KC1H
Covington, KY 41015
General Correspondence
Fidelity Investments
P.O. Box 500
Merrimack, NH 03054-0500
(letter_graphic)
For Retirement
Accounts
Buying shares
Fidelity Investments
P.O. Box 770001
Cincinnati, OH 45277-0003
Selling shares
Fidelity Investments
P.O. Box 770001
Cincinnati, OH 45277-0035
Overnight Express
Fidelity Investments
Attn: Distribution Services
100 Crosby Parkway - KC1H
Covington, KY 41015
General Correspondence
Fidelity Investments
P.O. Box 500
Merrimack, NH 03054-0500
Annual Report
Investment Adviser
Fidelity Management & Research Company
Boston, MA
Investment Sub-Advisers
FMR Co., Inc.
Fidelity Research & Analysis Company
Fidelity Management & Research
(U.K.) Inc.
FIL Investments (Japan) Limited
FIL Investment Advisors
FIL Investment Advisors (U.K.) Ltd.
Fidelity Management & Research
(Japan) Inc.
Fidelity Management & Research
(Hong Kong) Limited
General Distributor
Fidelity Distributors Corporation
Boston, MA
Transfer and Service Agents
Fidelity Investments Institutional
Operations Company, Inc.
Boston, MA
Fidelity Service Company, Inc.
Boston, MA
Custodian
The Northern Trust Company
Chicago, IL
The Fidelity Telephone Connection
Mutual Fund 24-Hour Service
Exchanges/Redemptions
and Account Assistance 1-800-544-6666
Product Information 1-800-544-6666
Retirement Accounts 1-800-544-4774
(8 a.m. - 9 p.m.)
TDD Service 1-800-544-0118
for the deaf and hearing impaired
(9 a.m. - 9 p.m. Eastern time)
Fidelity Automated Service
Telephone (FAST®) 1-800-544-5555
Automated line for quickest service
MCS-UANN-0610
1.784726.107
Fidelity®
Mid-Cap Stock
Fund -
Class K
Annual Report
April 30, 2010
(2_fidelity_logos) (Registered_Trademark)
Contents
Chairman's Message | <Click Here> | The Chairman's message to shareholders. |
Performance | <Click Here> | How the fund has done over time. |
Management's Discussion | <Click Here> | The manager's review of fund performance, strategy and outlook. |
Shareholder Expense Example | <Click Here> | An example of shareholder expenses. |
Investment Changes | <Click Here> | A summary of major shifts in the fund's investments over the past six months. |
Investments | <Click Here> | A complete list of the fund's investments with their market values. |
Financial Statements | <Click Here> | Statements of assets and liabilities, operations, and changes in net assets,
as well as financial highlights. |
Notes | <Click Here> | Notes to the financial statements. |
Report of Independent Registered Public Accounting Firm | <Click Here> | |
Trustees and Officers | <Click Here> | |
Distributions | <Click Here> | |
To view a fund's proxy voting guidelines and proxy voting record for the 12-month period ended June 30, visit http://www.fidelity.com/proxyvotingresults or visit the Securities and Exchange Commission's (SEC) web site at http://www.sec.gov. You may also call 1-800-835-5092 to request a free copy of the proxy voting guidelines.
Standard & Poor's, S&P and S&P 500 are registered service marks of The McGraw-Hill Companies, Inc. and have been licensed for use by Fidelity Distributors Corporation.
Other third party marks appearing herein are the property of their respective owners.
All other marks appearing herein are registered or unregistered trademarks or service marks of FMR LLC or an affiliated company.
This report and the financial statements contained herein are submitted for the general information of the shareholders of the fund. This report is not authorized for distribution to prospective investors in the fund unless preceded or accompanied by an effective prospectus.
A fund files its complete schedule of portfolio holdings with the SEC for the first and third quarters of each fiscal year on Form N-Q. Forms N-Q are available on the SEC's web site at http://www.sec.gov. A fund's Forms N-Q may be reviewed and copied at the SEC's Public Reference Room in Washington, DC. Information regarding the operation of the SEC's Public Reference Room may be obtained by calling 1-800-SEC-0330. For a complete list of a fund's portfolio holdings, view the most recent holdings listing, semiannual report, or annual report on Fidelity's web site at http://www.fidelity.com or http://www.advisor.fidelity.com, as applicable.
NOT FDIC INSURED • MAY LOSE VALUE • NO BANK GUARANTEE
Neither the fund nor Fidelity Distributors Corporation is a bank.
Annual Report
(photo_of_Edward_C_Johnson_3d)
Dear Shareholder:
Global capital markets have been predominantly positive thus far in 2010, overcoming some early volatility to continue the upward trend that began in March 2009. Year to date, U.S. stocks have seen the biggest gains, outpacing the performance of foreign equities, which has been hampered by a rebounding dollar. Financial markets are always unpredictable, of course, but there also are several time-tested investment principles that can help put the odds in your favor.
One of the basic tenets is to invest for the long term. Over time, riding out the markets' inevitable ups and downs has proven much more effective than selling into panic or chasing the hottest trend. Even missing only a few of the markets' best days can significantly diminish investor returns. Patience also affords the benefits of compounding - of earning interest on additional income or reinvested dividends and capital gains. There can be tax advantages and cost benefits to consider as well. While staying the course doesn't eliminate risk, it can considerably lessen the effect of short-term declines.
You can further manage your investing risk through diversification. And today, more than ever, geographic diversification should be taken into account. Studies indicate that asset allocation is the single most important determinant of a portfolio's long-term success. The right mix of stocks, bonds and cash - aligned to your particular risk tolerance and investment objective - is very important. Age-appropriate rebalancing is also an essential aspect of asset allocation. For younger investors, an emphasis on equities - which historically have been the best-performing asset class over time - is encouraged. As investors near their specific goal, such as retirement or sending a child to college, consideration may be given to replacing volatile assets (e.g. common stocks) with more-stable fixed investments (bonds or savings plans).
A third principle - investing regularly - can help lower the average cost of your purchases. Investing a certain amount of money each month or quarter helps ensure you won't pay for all your shares at market highs. This strategy - known as dollar cost averaging - also reduces "emotion" from investing, helping shareholders avoid selling weak performers just prior to an upswing, or chasing a hot performer just before a correction.
We invite you to contact us via the Internet, through our Investor Centers or by phone. It is our privilege to provide you the information you need to make the investments that are right for you.
Sincerely,
(The chairman's signature appears here.)
Edward C. Johnson 3d
Annual Report
Average annual total return reflects the change in the value of an investment, assuming reinvestment of the class' dividend income and capital gains (the profits earned upon the sale of securities that have grown in value, if any) and assuming a constant rate of performance each year. The $10,000 table and the fund's returns do not reflect the deduction of taxes that a shareholder would pay on fund distributions or the redemption of fund shares. During periods of reimbursement by Fidelity, a fund's total return will be greater than it would be had the reimbursement not occurred. How a fund did yesterday is no guarantee of how it will do tomorrow.
Average Annual Total Returns
Periods ended April 30, 2010 | Past 1
year | Past 5
years | Past 10
years |
Class KA | 64.55% | 8.30% | 3.75% |
A The initial offering of Class K shares took place on May 9, 2008. Returns prior to May 9, 2008 are those of Fidelity Mid-Cap Stock Fund, the original class of the fund.
$10,000 Over 10 Years
Let's say hypothetically that $10,000 was invested in Fidelity® Mid-Cap Stock Fund - Class K on April 30, 2000. The chart shows how the value of your investment would have changed, and also shows how the S&P® MidCap 400 Index performed over the same period. The initial offering of Class K took place on May 9, 2008. See above for additional information regarding the performance of Class K.
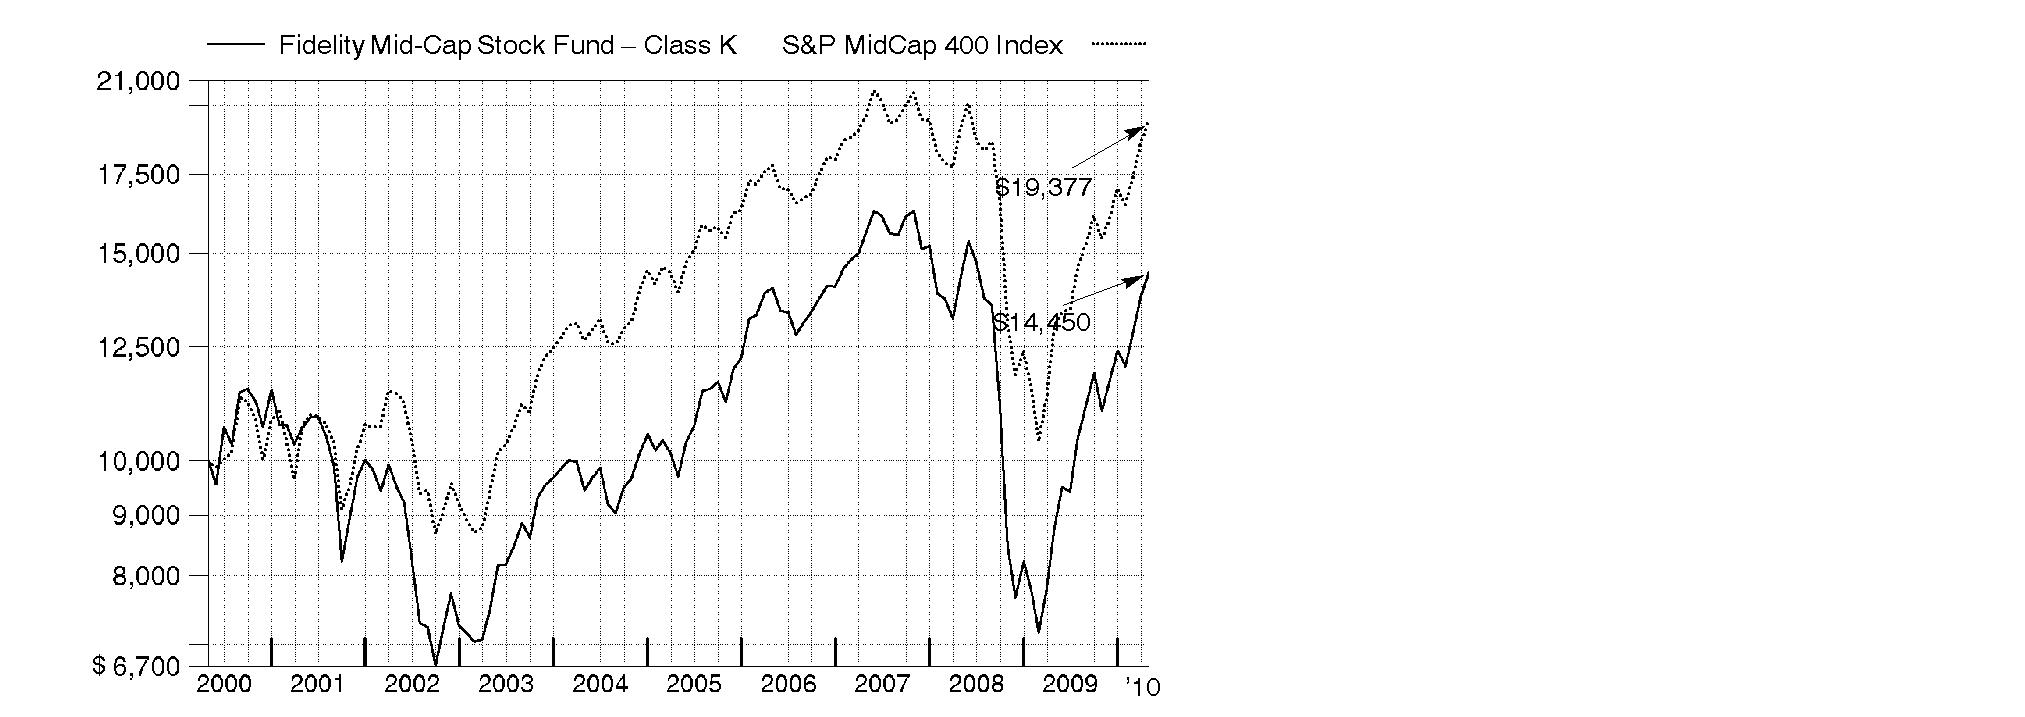
Annual Report
Market Recap: Blistering stock market declines sustained during the global economic crisis were largely offset in the 12-month period ending April 30, 2010, as unprecedented government stimulus took hold, significant corporate cost cutting paved the way for encouraging earnings reports, credit conditions improved and consumer fears began to ease. After hitting woeful lows in March 2009, stock markets experienced a steady uptrend that coincided with the near culmination of the Great Recession that began in late 2007. Although a weak labor market still lingered, by mid-April, the blue-chip Dow Jones Industrial AverageSM pushed above the 11,000 mark for the first time in 19 months, closing the period with a 38.69% gain. Impressive returns were widespread, with the S&P 500® Index rising 38.84% and the technology-laden Nasdaq Composite® Index increasing 44.63%. Small-cap stocks continued to outperform their larger counterparts, with the Russell 2000® Index returning 48.95%. Despite widening sovereign debt problems overseas, foreign equities still posted solid gains, with the MSCI® EAFE® (Europe, Australasia, Far East) Index - a measure of developed markets outside the U.S. and Canada - rising 34.56%.
Comments from Shep Perkins, Portfolio Manager of Fidelity® Mid-Cap Stock Fund: The fund's Class K shares were up 64.55% during the year, easily outpacing the S&P® MidCap 400 Index, which returned 48.92%. Security selection was the dominant factor, led by financials, telecommunication services and industrials. Security selection and an overweighting in consumer discretionary also helped a lot. Conversely, the fund was hurt by weak stock picks within health care. Holdings in information technology and energy also detracted - despite favorable sector weightings - as did an overweighting in telecommunication services. In terms of individual securities, several financials names boosted returns. Genworth Financial - a life and mortgage insurer - topped our list of contributors, along with Zions Bancorporation, KKR Financial and Regions Financial. Elsewhere, tw telecom and Flextronics - a maker of electronic equipment - were standouts, rebounding nicely during the period. Conversely, global pharmaceutical company Cephalon and Intrepid Potash were big detractors from the health care and materials sectors, respectively. Within technology, Taiwan Semiconductor, Juniper Networks and QUALCOMM all dragged on performance, as did not owning index component Cree. Since the benchmark index represents only about 20% of my investable universe, most of the portfolio's holdings were out-of-index positions.
The views expressed above reflect those of the portfolio manager(s) only through the end of the period as stated on the cover of this report and do not necessarily represent the views of Fidelity or any other person in the Fidelity organization. Any such views are subject to change at any time based upon market or other conditions and Fidelity disclaims any responsibility to update such views. These views may not be relied on as investment advice and, because investment decisions for a Fidelity fund are based on numerous factors, may not be relied on as an indication of trading intent on behalf of any Fidelity fund.
Annual Report
Shareholder Expense Example
As a shareholder of the Fund, you incur two types of costs: (1) transaction costs, including redemption fees, and (2) ongoing costs, including management fees and other Fund expenses. This Example is intended to help you understand your ongoing costs (in dollars) of investing in the Fund and to compare these costs with the ongoing costs of investing in other mutual funds.
The Example is based on an investment of $1,000 invested at the beginning of the period and held for the entire period (November 1, 2009 to April 30, 2010).
Actual Expenses
The first line of the accompanying table for each class of the Fund provides information about actual account values and actual expenses. You may use the information in this line, together with the amount you invested, to estimate the expenses that you paid over the period. Simply divide your account value by $1,000.00 (for example, an $8,600 account value divided by $1,000.00 = 8.6), then multiply the result by the number in the first line for a class of the Fund under the heading entitled "Expenses Paid During Period" to estimate the expenses you paid on your account during this period. A small balance maintenance fee of $12.00 that is charged once a year may apply for certain accounts with a value of less than $2,000. This fee is not included in the table below. If it was, the estimate of expenses you paid during the period would be higher, and your ending account value lower, by this amount. In addition, the Fund, as a shareholder in the underlying Fidelity Central Funds, will indirectly bear its pro-rata share of the fees and expenses incurred by the underlying Fidelity Central Funds. These fees and expenses are not included in the Fund's annualized expense ratio used to calculate the expense estimate in the table below.
Hypothetical Example for Comparison Purposes
The second line of the accompanying table for each class of the Fund provides information about hypothetical account values and hypothetical expenses based on a Class' actual expense ratio and an assumed rate of return of 5% per year before expenses, which is not the Class' actual return. The hypothetical account values and expenses may not be used to estimate the actual ending account balance or expenses you paid for the period. You may use this information to compare the ongoing costs of investing in the Fund and other funds. To do so, compare this 5% hypothetical example with the 5% hypothetical examples that appear in the shareholder reports of the other funds. A small balance maintenance fee of $12.00 that is charged once a year may apply for certain accounts with a value of less than $2,000. This fee is not included in the table below. If it was, the estimate of expenses you paid during the period would be higher, and your ending account value lower, by this amount. In addition, the Fund, as a shareholder in the underlying Fidelity Central Funds, will indirectly bear its pro-rata share of the fees and expenses incurred by the underlying Fidelity Central Funds. These fees and expenses are not included in the Fund's annualized expense ratio used to calculate the expense estimate in the table below.
Please note that the expenses shown in the table are meant to highlight your ongoing costs only and do not reflect any transaction costs. Therefore, the second line of the table is useful in comparing ongoing costs only, and will not help you determine the relative total costs of owning different funds. In addition, if these transactional costs were included, your costs would have been higher.
Annual Report
| Annualized Expense Ratio | Beginning
Account Value
November 1, 2009 | Ending
Account Value
April 30, 2010 | Expenses Paid
During Period*
November 1, 2009
to April 30, 2010 |
Mid-Cap Stock | .66% | | | |
Actual | | $ 1,000.00 | $ 1,308.00 | $ 3.78 |
HypotheticalA | | $ 1,000.00 | $ 1,021.52 | $ 3.31 |
Class K | .45% | | | |
Actual | | $ 1,000.00 | $ 1,309.30 | $ 2.58 |
HypotheticalA | | $ 1,000.00 | $ 1,022.56 | $ 2.26 |
A 5% return per year before expenses
* Expenses are equal to each Class' annualized expense ratio, multiplied by the average account value over the period, multiplied by 181/365 (to reflect the one-half year period).
Annual Report
Investment Changes (Unaudited)
Top Ten Stocks as of April 30, 2010 |
| % of fund's
net assets | % of fund's net assets
6 months ago |
Genworth Financial, Inc. Class A | 2.7 | 2.3 |
Juniper Networks, Inc. | 2.3 | 2.2 |
tw telecom, inc. | 2.0 | 1.9 |
Hanesbrands, Inc. | 2.0 | 1.8 |
Flextronics International Ltd. | 1.8 | 2.0 |
Zions Bancorporation | 1.7 | 0.9 |
Ingersoll-Rand Co. Ltd. | 1.4 | 1.0 |
Regions Financial Corp. | 1.3 | 0.9 |
St. Jude Medical, Inc. | 1.2 | 1.2 |
Whirlpool Corp. | 1.1 | 1.1 |
| 17.5 | |
Top Five Market Sectors as of April 30, 2010 |
| % of fund's
net assets | % of fund's net assets
6 months ago |
Consumer Discretionary | 22.6 | 19.7 |
Information Technology | 21.4 | 22.0 |
Financials | 18.0 | 18.8 |
Industrials | 13.7 | 12.9 |
Energy | 6.5 | 7.4 |
Asset Allocation (% of fund's net assets) |
As of April 30, 2010* | As of October 31, 2009** |
| Stocks and
Equity Futures 98.9% | | | Stocks and
Equity Futures 99.7% | |
| Convertible
Securities 0.3% | | | Convertible
Securities 0.0% | |
| Short-Term
Investments and
Net Other Assets 0.8% | | | Short-Term
Investments and
Net Other Assets 0.3% | |
* Foreign investments | 15.9% | | **Foreign investments | 19.1% | |

Annual Report
Investments April 30, 2010
Showing Percentage of Net Assets
Common Stocks - 97.5% |
| Shares | | Value (000s) |
CONSUMER DISCRETIONARY - 22.6% |
Auto Components - 2.6% |
ArvinMeritor, Inc. (a) | 3,000,000 | | $ 45,960 |
BorgWarner, Inc. (a) | 1,000,000 | | 43,340 |
Johnson Controls, Inc. | 2,500,000 | | 83,975 |
Tenneco, Inc. (a) | 1,800,000 | | 46,386 |
| | 219,661 |
Automobiles - 0.8% |
Harley-Davidson, Inc. | 1,495,000 | | 50,576 |
Thor Industries, Inc. | 575,000 | | 20,533 |
| | 71,109 |
Diversified Consumer Services - 0.2% |
Stewart Enterprises, Inc. Class A | 2,171,351 | | 14,722 |
Hotels, Restaurants & Leisure - 6.1% |
Ameristar Casinos, Inc. | 720,901 | | 13,575 |
Bally Technologies, Inc. (a) | 444,907 | | 20,519 |
Boyd Gaming Corp. (a)(d) | 3,000,000 | | 38,100 |
Gaylord Entertainment Co. (a) | 1,486,264 | | 50,161 |
International Game Technology | 1,600,000 | | 33,728 |
Las Vegas Sands Corp. (a) | 1,500,000 | | 37,290 |
MGM Mirage, Inc. (a)(d) | 6,000,000 | | 95,340 |
Morgans Hotel Group Co. (a)(e) | 2,000,000 | | 16,940 |
Penn National Gaming, Inc. (a) | 900,000 | | 27,864 |
Pinnacle Entertainment, Inc. (a) | 1,358,475 | | 18,380 |
Royal Caribbean Cruises Ltd. (a)(d) | 1,750,000 | | 62,720 |
Shuffle Master, Inc. (a) | 1,024,040 | | 9,831 |
Wyndham Worldwide Corp. | 2,000,000 | | 53,620 |
Wynn Resorts Ltd. | 500,000 | | 44,120 |
| | 522,188 |
Household Durables - 4.4% |
Harman International Industries, Inc. (a) | 832,800 | | 32,879 |
Lennar Corp. Class A | 1,500,000 | | 29,850 |
Mohawk Industries, Inc. (a)(d) | 1,250,000 | | 79,675 |
Newell Rubbermaid, Inc. | 3,250,000 | | 55,478 |
Sealy Corp., Inc. (a)(d)(e) | 6,500,000 | | 24,310 |
Stanley Black & Decker, Inc. | 1,000,000 | | 62,150 |
Whirlpool Corp. | 900,000 | | 97,983 |
| | 382,325 |
Internet & Catalog Retail - 0.4% |
Blue Nile, Inc. (a)(d) | 600,000 | | 32,394 |
Common Stocks - continued |
| Shares | | Value (000s) |
CONSUMER DISCRETIONARY - continued |
Leisure Equipment & Products - 0.3% |
Polaris Industries, Inc. (d) | 500,000 | | $ 29,585 |
Media - 0.9% |
Interpublic Group of Companies, Inc. (a) | 3,500,000 | | 31,185 |
National CineMedia, Inc. | 2,000,000 | | 38,080 |
NeuLion, Inc. (a) | 3,500,000 | | 2,204 |
Valassis Communications, Inc. (a) | 310,829 | | 10,161 |
| | 81,630 |
Multiline Retail - 0.2% |
Big Lots, Inc. (a) | 392,704 | | 15,001 |
Specialty Retail - 4.0% |
Abercrombie & Fitch Co. Class A | 500,000 | | 21,865 |
AnnTaylor Stores Corp. (a) | 1,250,000 | | 27,125 |
bebe Stores, Inc. | 562,893 | | 4,638 |
Cabela's, Inc. Class A (a)(d) | 1,200,000 | | 21,792 |
Chico's FAS, Inc. | 1,000,000 | | 14,890 |
Coldwater Creek, Inc. (a)(d) | 2,000,000 | | 14,160 |
Dick's Sporting Goods, Inc. (a) | 1,500,000 | | 43,665 |
Office Depot, Inc. (a) | 3,000,000 | | 20,580 |
Pier 1 Imports, Inc. (a) | 4,000,000 | | 33,120 |
Signet Jewelers Ltd. (United Kingdom) (a) | 677,925 | | 21,837 |
Staples, Inc. | 2,500,000 | | 58,825 |
Talbots, Inc. (a)(d) | 1,250,000 | | 20,563 |
Urban Outfitters, Inc. (a) | 1,100,000 | | 41,261 |
| | 344,321 |
Textiles, Apparel & Luxury Goods - 2.7% |
Hanesbrands, Inc. (a)(e) | 6,000,000 | | 170,820 |
Iconix Brand Group, Inc. (a) | 1,500,000 | | 25,890 |
Warnaco Group, Inc. (a) | 750,000 | | 35,880 |
| | 232,590 |
TOTAL CONSUMER DISCRETIONARY | | 1,945,526 |
CONSUMER STAPLES - 1.0% |
Food & Staples Retailing - 0.6% |
Whole Foods Market, Inc. (a)(d) | 1,250,000 | | 48,775 |
Food Products - 0.4% |
Origin Agritech Ltd. (a)(e) | 1,244,174 | | 10,899 |
Smithfield Foods, Inc. (a) | 1,500,000 | | 28,110 |
| | 39,009 |
Common Stocks - continued |
| Shares | | Value (000s) |
CONSUMER STAPLES - continued |
Personal Products - 0.0% |
L'Occitane Ltd. | 192,000 | | $ 373 |
TOTAL CONSUMER STAPLES | | 88,157 |
ENERGY - 6.5% |
Energy Equipment & Services - 2.0% |
Exterran Holdings, Inc. (a) | 1,000,000 | | 29,150 |
Helmerich & Payne, Inc. | 1,000,000 | | 40,620 |
Noble Corp. | 800,000 | | 31,592 |
North American Energy Partners, Inc. (a)(e) | 2,600,000 | | 29,328 |
Weatherford International Ltd. (a) | 2,500,000 | | 45,275 |
| | 175,965 |
Oil, Gas & Consumable Fuels - 4.5% |
Arch Coal, Inc. | 2,000,000 | | 54,000 |
Continental Resources, Inc. (a)(d) | 500,000 | | 24,580 |
EXCO Resources, Inc. | 2,500,000 | | 46,375 |
OPTI Canada, Inc. (a) | 5,000,000 | | 11,267 |
Plains Exploration & Production Co. (a) | 2,000,000 | | 58,620 |
Range Resources Corp. | 500,000 | | 23,880 |
Southwestern Energy Co. (a) | 900,000 | | 35,712 |
Ultra Petroleum Corp. (a) | 800,000 | | 38,216 |
Whiting Petroleum Corp. (a) | 1,000,000 | | 90,330 |
| | 382,980 |
TOTAL ENERGY | | 558,945 |
FINANCIALS - 17.7% |
Capital Markets - 0.0% |
Calamos Asset Management, Inc. Class A | 69,493 | | 865 |
Commercial Banks - 8.9% |
Associated Banc-Corp. | 1,459,300 | | 21,204 |
Banco Macro SA sponsored ADR (d) | 1,250,000 | | 35,000 |
Boston Private Financial Holdings, Inc. | 1,145,336 | | 9,083 |
Cathay General Bancorp | 2,200,000 | | 27,214 |
Comerica, Inc. | 1,500,000 | | 63,000 |
Fifth Third Bancorp | 2,500,000 | | 37,275 |
First Horizon National Corp. | 1,521,841 | | 21,534 |
FirstMerit Corp. | 1,000,000 | | 23,500 |
Huntington Bancshares, Inc. | 5,500,000 | | 37,235 |
Marshall & Ilsley Corp. | 3,500,000 | | 31,850 |
Common Stocks - continued |
| Shares | | Value (000s) |
FINANCIALS - continued |
Commercial Banks - continued |
North American Financial Holdings, Inc. Class A (a)(f) | 900,000 | | $ 17,550 |
PNC Financial Services Group, Inc. | 1,000,000 | | 67,210 |
Regions Financial Corp. | 12,500,000 | | 110,500 |
Sterling Bancshares, Inc. | 4,000,000 | | 23,520 |
SunTrust Banks, Inc. | 2,000,000 | | 59,200 |
Synovus Financial Corp. (d) | 12,000,000 | | 36,120 |
Zions Bancorporation (d) | 5,000,000 | | 143,650 |
| | 764,645 |
Consumer Finance - 1.3% |
Capital One Financial Corp. | 2,000,000 | | 86,820 |
ORIX Corp. sponsored ADR (d) | 500,000 | | 22,865 |
| | 109,685 |
Diversified Financial Services - 0.6% |
KKR Financial Holdings LLC | 6,000,000 | | 53,040 |
Insurance - 5.2% |
Allstate Corp. | 1,000,000 | | 32,670 |
Genworth Financial, Inc. Class A (a) | 14,000,000 | | 231,275 |
Lincoln National Corp. | 2,400,000 | | 73,416 |
Protective Life Corp. | 1,900,000 | | 45,733 |
XL Capital Ltd. Class A | 3,500,000 | | 62,300 |
| | 445,394 |
Real Estate Investment Trusts - 0.3% |
CBL & Associates Properties, Inc. | 1,762,440 | | 25,732 |
Real Estate Management & Development - 0.5% |
CB Richard Ellis Group, Inc. Class A (a) | 2,350,000 | | 40,702 |
Thrifts & Mortgage Finance - 0.9% |
First Niagara Financial Group, Inc. | 1,000,000 | | 13,900 |
Flagstar Bancorp, Inc. (a) | 25,000,000 | | 15,875 |
MGIC Investment Corp. (a)(d) | 2,150,000 | | 22,425 |
Radian Group, Inc. (d) | 2,000,000 | | 28,380 |
| | 80,580 |
TOTAL FINANCIALS | | 1,520,643 |
HEALTH CARE - 6.3% |
Biotechnology - 0.8% |
Cephalon, Inc. (a)(d) | 1,000,000 | | 64,200 |
Health Care Equipment & Supplies - 4.4% |
CareFusion Corp. (a) | 1,000,000 | | 27,580 |
Common Stocks - continued |
| Shares | | Value (000s) |
HEALTH CARE - continued |
Health Care Equipment & Supplies - continued |
Covidien PLC | 1,150,000 | | $ 55,189 |
Edwards Lifesciences Corp. (a) | 750,000 | | 77,310 |
Inverness Medical Innovations, Inc. (a) | 1,300,000 | | 51,714 |
Masimo Corp. | 1,500,000 | | 35,115 |
St. Jude Medical, Inc. (a) | 2,500,000 | | 102,050 |
Stryker Corp. | 500,000 | | 28,720 |
| | 377,678 |
Health Care Providers & Services - 1.1% |
Emeritus Corp. (a)(d) | 837,849 | | 18,768 |
Express Scripts, Inc. (a) | 600,000 | | 60,078 |
Sunrise Senior Living, Inc. (a)(d)(e) | 3,200,000 | | 17,792 |
| | 96,638 |
TOTAL HEALTH CARE | | 538,516 |
INDUSTRIALS - 13.7% |
Aerospace & Defense - 0.6% |
Precision Castparts Corp. | 400,000 | | 51,336 |
Air Freight & Logistics - 0.5% |
C.H. Robinson Worldwide, Inc. | 750,000 | | 45,225 |
Airlines - 0.3% |
Hawaiian Holdings, Inc. (a)(e) | 4,080,483 | | 28,971 |
Building Products - 2.4% |
Lennox International, Inc. | 2,100,000 | | 95,046 |
Masco Corp. | 2,500,000 | | 40,575 |
Owens Corning (a) | 600,000 | | 20,868 |
Quanex Building Products Corp. | 886,871 | | 16,851 |
USG Corp. (a)(d) | 1,500,000 | | 35,400 |
| | 208,740 |
Commercial Services & Supplies - 0.0% |
Interface, Inc. Class A | 337,642 | | 4,416 |
Construction & Engineering - 0.6% |
Fluor Corp. | 500,000 | | 26,420 |
KBR, Inc. | 1,000,000 | | 22,080 |
| | 48,500 |
Electrical Equipment - 0.6% |
Acuity Brands, Inc. | 475,170 | | 21,482 |
Regal-Beloit Corp. | 500,000 | | 31,635 |
| | 53,117 |
Common Stocks - continued |
| Shares | | Value (000s) |
INDUSTRIALS - continued |
Industrial Conglomerates - 0.7% |
Textron, Inc. | 2,500,000 | | $ 57,100 |
Machinery - 3.2% |
AGCO Corp. (a) | 1,400,000 | | 49,028 |
Cummins, Inc. | 700,000 | | 50,561 |
Ingersoll-Rand Co. Ltd. | 3,188,660 | | 117,917 |
Trinity Industries, Inc. | 2,200,000 | | 54,758 |
| | 272,264 |
Marine - 0.1% |
American Commercial Lines, Inc. (a)(d) | 600,000 | | 12,240 |
Professional Services - 0.4% |
CoStar Group, Inc. (a)(d) | 750,000 | | 32,963 |
Road & Rail - 4.3% |
Arkansas Best Corp. | 1,000,000 | | 30,460 |
Avis Budget Group, Inc. (a) | 1,500,000 | | 22,680 |
Con-way, Inc. | 1,350,000 | | 52,434 |
CSX Corp. | 1,100,000 | | 61,655 |
Hertz Global Holdings, Inc. (a)(d) | 3,000,000 | | 43,380 |
Knight Transportation, Inc. | 1,500,000 | | 31,935 |
Old Dominion Freight Lines, Inc. (a) | 1,500,000 | | 53,820 |
Ryder System, Inc. | 1,500,000 | | 69,780 |
| | 366,144 |
TOTAL INDUSTRIALS | | 1,181,016 |
INFORMATION TECHNOLOGY - 21.4% |
Communications Equipment - 4.3% |
Comverse Technology, Inc. (a) | 9,000,000 | | 82,620 |
Infinera Corp. (a)(d) | 2,900,000 | | 26,535 |
Juniper Networks, Inc. (a) | 7,000,000 | | 198,870 |
QUALCOMM, Inc. | 1,500,000 | | 58,110 |
| | 366,135 |
Computers & Peripherals - 0.3% |
3PAR, Inc. (a)(d) | 2,800,000 | | 26,124 |
Electronic Equipment & Components - 4.7% |
Agilent Technologies, Inc. (a) | 1,000,000 | | 36,260 |
Arrow Electronics, Inc. (a) | 1,250,000 | | 38,125 |
Avnet, Inc. (a) | 1,000,000 | | 31,970 |
Corning, Inc. | 2,500,000 | | 48,125 |
Common Stocks - continued |
| Shares | | Value (000s) |
INFORMATION TECHNOLOGY - continued |
Electronic Equipment & Components - continued |
Flextronics International Ltd. (a) | 20,000,000 | | $ 155,000 |
Tyco Electronics Ltd. | 3,000,000 | | 96,360 |
| | 405,840 |
Internet Software & Services - 0.4% |
Move, Inc. (a)(e) | 15,000,000 | | 33,000 |
IT Services - 0.9% |
Genpact Ltd. (a) | 3,000,000 | | 50,640 |
WNS Holdings Ltd. sponsored ADR (a) | 2,400,000 | | 29,424 |
| | 80,064 |
Semiconductors & Semiconductor Equipment - 8.3% |
Altera Corp. | 1,900,000 | | 48,184 |
Applied Micro Circuits Corp. (a)(e) | 6,500,000 | | 73,320 |
ARM Holdings PLC sponsored ADR (d) | 3,000,000 | | 34,290 |
ASM International NV (NASDAQ) (a) | 1,750,000 | | 45,518 |
ASML Holding NV (NY Shares) | 1,700,000 | | 55,522 |
Broadcom Corp. Class A | 1,200,000 | | 41,388 |
Lam Research Corp. (a) | 900,000 | | 36,495 |
Marvell Technology Group Ltd. (a) | 2,500,000 | | 51,625 |
MEMC Electronic Materials, Inc. (a) | 2,000,000 | | 25,940 |
Micron Technology, Inc. (a) | 3,000,000 | | 28,050 |
National Semiconductor Corp. | 4,000,000 | | 59,120 |
ON Semiconductor Corp. (a) | 9,500,000 | | 75,430 |
PMC-Sierra, Inc. (a) | 4,000,000 | | 35,400 |
Samsung Electronics Co. Ltd. | 50,000 | | 38,012 |
Taiwan Semiconductor Manufacturing Co. Ltd. sponsored ADR | 6,000,000 | | 63,540 |
| | 711,834 |
Software - 2.5% |
Adobe Systems, Inc. (a) | 1,750,000 | | 58,783 |
ANSYS, Inc. (a) | 850,000 | | 38,250 |
Autonomy Corp. PLC (a) | 1,000,000 | | 27,428 |
Nuance Communications, Inc. (a) | 3,000,000 | | 54,810 |
TIBCO Software, Inc. (a) | 3,000,000 | | 34,200 |
| | 213,471 |
TOTAL INFORMATION TECHNOLOGY | | 1,836,468 |
MATERIALS - 2.7% |
Chemicals - 1.0% |
CF Industries Holdings, Inc. | 145,600 | | 12,182 |
Common Stocks - continued |
| Shares | | Value (000s) |
MATERIALS - continued |
Chemicals - continued |
Intrepid Potash, Inc. (a)(d) | 1,500,000 | | $ 39,390 |
K&S AG | 600,000 | | 34,446 |
| | 86,018 |
Metals & Mining - 1.4% |
Newcrest Mining Ltd. | 2,000,000 | | 60,355 |
Silver Wheaton Corp. (a) | 3,000,000 | | 58,925 |
Timminco Ltd. (a)(d) | 7,000,000 | | 5,580 |
| | 124,860 |
Paper & Forest Products - 0.3% |
Louisiana-Pacific Corp. (a) | 2,000,000 | | 23,520 |
TOTAL MATERIALS | | 234,398 |
TELECOMMUNICATION SERVICES - 4.7% |
Diversified Telecommunication Services - 4.0% |
Global Crossing Ltd. (a)(e) | 4,500,000 | | 66,825 |
Level 3 Communications, Inc. (a)(d) | 15,000,000 | | 23,400 |
Qwest Communications International, Inc. | 15,000,000 | | 78,450 |
tw telecom, inc. (a)(e) | 10,000,000 | | 178,000 |
| | 346,675 |
Wireless Telecommunication Services - 0.7% |
SBA Communications Corp. Class A (a) | 1,000,000 | | 35,370 |
Vivo Participacoes SA sponsored ADR | 1,000,000 | | 26,470 |
| | 61,840 |
TOTAL TELECOMMUNICATION SERVICES | | 408,515 |
UTILITIES - 0.9% |
Independent Power Producers & Energy Traders - 0.9% |
AES Corp. | 4,000,000 | | 46,160 |
Calpine Corp. (a) | 2,000,000 | | 27,260 |
| | 73,420 |
TOTAL COMMON STOCKS (Cost $6,982,897) | 8,385,604 |
Convertible Preferred Stocks - 0.3% |
| Shares | | Value (000s) |
FINANCIALS - 0.3% |
Commercial Banks - 0.3% |
Oriental Financial Group, Inc. Series C (a)(h) | 4,597 | | $ 4,606 |
Popular, Inc. Series D (a) | 585,900 | | 19,165 |
| | 23,771 |
TOTAL CONVERTIBLE PREFERRED STOCKS (Cost $19,245) | 23,771 |
U.S. Treasury Obligations - 0.1% |
| Principal Amount (000s) | | |
U.S. Treasury Bills, yield at date of purchase 0.09% to 0.12% 5/13/10 (g)
(Cost $9,600) | | $ 9,600 | | 9,600 |
Money Market Funds - 7.6% |
| Shares | | |
Fidelity Cash Central Fund, 0.21% (b) | 201,266,245 | | 201,266 |
Fidelity Securities Lending Cash Central Fund, 0.22% (b)(c) | 457,396,950 | | 457,397 |
TOTAL MONEY MARKET FUNDS (Cost $658,663) | 658,663 |
TOTAL INVESTMENT PORTFOLIO - 105.5% (Cost $7,670,405) | | 9,077,638 |
NET OTHER ASSETS - (5.5)% | | (475,771) |
NET ASSETS - 100% | $ 8,601,867 |
Futures Contracts |
| Expiration Date | | Underlying Face Amount at Value (000s) | | Unrealized Appreciation/
(Depreciation) (000s) |
Purchased |
Equity Index Contracts |
1,512 CME E-mini S&P MidCap 400 Index Contracts | June 2010 | | $ 124,226 | | $ 3,703 |
|
The face value of futures purchased as a percentage of net assets - 1.4% |
Legend |
(a) Non-income producing |
(b) Affiliated fund that is available only to investment companies and other accounts managed by Fidelity Investments. The rate quoted is the annualized seven-day yield of the fund at period end. A complete unaudited listing of the fund's holdings as of its most recent quarter end is available upon request. |
(c) Investment made with cash collateral received from securities on loan. |
(d) Security or a portion of the security is on loan at period end. |
(e) Affiliated company |
(f) Security exempt from registration under Rule 144A of the Securities Act of 1933. These securities may be resold in transactions exempt from registration, normally to qualified institutional buyers. At the end of the period, the value of these securities amounted to $17,550,000 or 0.2% of net assets. |
(g) Security or a portion of the security was pledged to cover margin requirements for futures contracts. At the period end, the value of securities pledged amounted to $9,600,000. |
(h) Restricted securities - Investment in securities not registered under the Securities Act of 1933 (excluding 144A issues). At the end of the period, the value of restricted securities (excluding 144A issues) amounted to $4,606,000 or 0.1% of net assets. |
Additional information on each holding is as follows: |
Security | Acquisition Date | Acquisition Cost (000s) |
Oriental Financial Group, Inc. Series C | 4/29/10 | $ 4,597 |
Affiliated Central Funds |
Information regarding fiscal year to date income earned by the Fund from investments in Fidelity Central Funds is as follows: |
Fund | Income earned
(Amounts in thousands) |
Fidelity Cash Central Fund | $ 112 |
Fidelity Securities Lending Cash Central Fund | 4,264 |
Total | $ 4,376 |
Other Affiliated Issuers |
An affiliated company is a company in which the fund has ownership of at least 5% of the voting securities. Fiscal year to date transactions with companies which are or were affiliates are as follows: |
Affiliate
(Amounts in thousands) | Value, beginning of period | Purchases | Sales Proceeds | Dividend Income | Value, end of period |
Applied Micro Circuits Corp. | $ 34,880 | $ 693 | $ - | $ - | $ 73,320 |
Comverse Technology, Inc. | 92,950 | - | 31,921 | - | - |
Delcath Systems, Inc. | - | 7,200 | 22,434 | - | - |
Global Crossing Ltd. | 32,670 | 401 | 687 | - | 66,825 |
Hanesbrands, Inc. | 82,300 | 21,828 | 508 | - | 170,820 |
Hawaiian Holdings, Inc. | - | 33,274 | - | - | 28,971 |
Morgans Hotel Group Co. | 2,285 | 6,399 | - | - | 16,940 |
Move, Inc. | 29,923 | 1,092 | 337 | - | 33,000 |
National CineMedia, Inc. | 45,839 | - | 20,148 | 1,781 | - |
North American Energy Partners, Inc. | 9,085 | 2,033 | - | - | 29,328 |
Origin Agritech Ltd. | - | 12,923 | - | - | 10,899 |
Sealy Corp., Inc. | - | 21,786 | - | - | 24,310 |
Sunrise Senior Living, Inc. | - | 13,282 | 754 | - | 17,792 |
Talbots, Inc. | - | 32,078 | 31,071 | - | - |
Telvent GIT SA | 35,794 | - | 65,439 | - | - |
Timminco Ltd. | 5,133 | 4,463 | - | - | - |
tw telecom, inc. | 105,685 | - | 19,929 | - | 178,000 |
Total | $ 476,544 | $ 157,452 | $ 193,228 | $ 1,781 | $ 650,205 |
Other Information |
The following is a summary of the inputs used, as of April 30, 2010, involving the Fund's assets and liabilities carried at value. The inputs or methodology used for valuing securities may not be an indication of the risk associated with investing in those securities. For more information on valuation inputs, and their aggregation into the levels used in the table below, please refer to the Security Valuation section in the accompanying Notes to Financial Statements. |
Valuation Inputs at Reporting Date: |
Description
(Amounts in thousands) | Total | Level 1 | Level 2 | Level 3 |
Investments in Securities: | | | | |
Equities: | | | | |
Consumer Discretionary | $ 1,945,526 | $ 1,923,689 | $ 21,837 | $ - |
Consumer Staples | 88,157 | 87,784 | 373 | - |
Energy | 558,945 | 558,945 | - | - |
Financials | 1,544,414 | 1,522,258 | 22,156 | - |
Health Care | 538,516 | 538,516 | - | - |
Industrials | 1,181,016 | 1,181,016 | - | - |
Information Technology | 1,836,468 | 1,771,028 | 65,440 | - |
Materials | 234,398 | 139,597 | 94,801 | - |
Telecommunication Services | 408,515 | 408,515 | - | - |
Utilities | 73,420 | 73,420 | - | - |
U.S. Government and Government Agency Obligations | 9,600 | - | 9,600 | - |
Money Market Funds | 658,663 | 658,663 | - | - |
Total Investments in Securities: | $ 9,077,638 | $ 8,863,431 | $ 214,207 | $ - |
Derivative Instruments: | | | | |
Assets | | | | |
Futures Contracts | $ 3,703 | $ 3,703 | $ - | $ - |
Value of Derivative Instruments |
The following table is a summary of the Fund's value of derivative instruments by risk exposure as of April 30, 2010. For additional information on derivative instruments, please refer to the Derivative Instruments section in the accompanying Notes to Financial Statements. |
Risk Exposure /
Derivative Type | Value
(Amounts in thousands) |
| Asset | Liability |
Equity Risk | | |
Futures Contracts (a) | $ 3,703 | $ - |
Total Value of Derivatives | $ 3,703 | $ - |
(a) Reflects cumulative appreciation/(depreciation) on futures contracts as disclosed on the Schedule of Investments. Only the period end variation margin is separately disclosed on the Statement of Assets and Liabilities. |
Distribution of investments by country of issue, as a percentage of total net assets, is as follows: (Unaudited) |
United States of America | 84.1% |
Bermuda | 2.2% |
Ireland | 2.1% |
Switzerland | 2.0% |
Singapore | 1.8% |
Canada | 1.6% |
Netherlands | 1.2% |
Others (Individually Less Than 1%) | 5.0% |
| 100.0% |
Income Tax Information |
At April 30, 2010, the fund had a capital loss carryforward of approximately $1,072,367,000 of which $717,619,000 and $354,748,000 will expire on April 30, 2017 and 2018, respectively. |
See accompanying notes which are an integral part of the financial statements.
Annual Report
Statement of Assets and Liabilities
Amounts in thousands (except per-share amounts) | April 30, 2010 |
| | |
Assets | | |
Investment in securities, at value (including securities loaned of $431,597) - See accompanying schedule: Unaffiliated issuers (cost $6,444,892) | $ 7,768,770 | |
Fidelity Central Funds (cost $658,663) | 658,663 | |
Other affiliated issuers (cost $566,850) | 650,205 | |
Total Investments (cost $7,670,405) | | $ 9,077,638 |
Cash | | 403 |
Receivable for investments sold | | 136,151 |
Receivable for fund shares sold | | 17,731 |
Dividends receivable | | 1,974 |
Distributions receivable from Fidelity Central Funds | | 611 |
Prepaid expenses | | 10 |
Other receivables | | 565 |
Total assets | | 9,235,083 |
| | |
Liabilities | | |
Payable for investments purchased | $ 161,652 | |
Payable for fund shares redeemed | 6,818 | |
Accrued management fee | 2,904 | |
Payable for daily variation on futures contracts | 2,631 | |
Other affiliated payables | 1,549 | |
Other payables and accrued expenses | 265 | |
Collateral on securities loaned, at value | 457,397 | |
Total liabilities | | 633,216 |
| | |
Net Assets | | $ 8,601,867 |
Net Assets consist of: | | |
Paid in capital | | $ 8,270,128 |
Undistributed net investment income | | 9,411 |
Accumulated undistributed net realized gain (loss) on investments and foreign currency transactions | | (1,088,619) |
Net unrealized appreciation (depreciation) on investments and assets and liabilities in foreign currencies | | 1,410,947 |
Net Assets | | $ 8,601,867 |
See accompanying notes which are an integral part of the financial statements.
Annual Report
Financial Statements - continued
Statement of Assets and Liabilities - continued
Amounts in thousands (except per-share amounts) | April 30, 2010 |
| | |
Mid-Cap Stock:
Net Asset Value, offering price and redemption price per share ($7,475,116 ÷ 274,180 shares) | | $ 27.26 |
| | |
Class K:
Net Asset Value, offering price and redemption price per share ($1,126,751 ÷ 41,340 shares) | | $ 27.26 |
See accompanying notes which are an integral part of the financial statements.
Annual Report
Statement of Operations
Amounts in thousands | Year ended April 30, 2010 |
| | |
Investment Income | | |
Dividends (including $1,781 earned from other affiliated issuers) | | $ 65,509 |
Interest | | 3 |
Income from Fidelity Central Funds (including $4,264 from security lending) | | 4,376 |
Total income | | 69,888 |
| | |
Expenses | | |
Management fee
Basic fee | $ 38,351 | |
Performance adjustment | (14,898) | |
Transfer agent fees | 17,440 | |
Accounting and security lending fees | 1,360 | |
Custodian fees and expenses | 143 | |
Independent trustees' compensation | 42 | |
Registration fees | 117 | |
Audit | 68 | |
Legal | 50 | |
Interest | 10 | |
Miscellaneous | 140 | |
Total expenses before reductions | 42,823 | |
Expense reductions | (845) | 41,978 |
Net investment income (loss) | | 27,910 |
Realized and Unrealized Gain (Loss) Net realized gain (loss) on: | | |
Investment securities: | | |
Unaffiliated issuers | 665,319 | |
Other affiliated issuers | 28,821 | |
Foreign currency transactions | 71 | |
Futures contracts | 3,760 | |
Capital gain distributions from Fidelity Central Funds | 19 | |
Total net realized gain (loss) | | 697,990 |
Change in net unrealized appreciation (depreciation) on: Investment securities | 2,580,671 | |
Assets and liabilities in foreign currencies | (32) | |
Futures contracts | 3,703 | |
Total change in net unrealized appreciation (depreciation) | | 2,584,342 |
Net gain (loss) | | 3,282,332 |
Net increase (decrease) in net assets resulting from operations | | $ 3,310,242 |
See accompanying notes which are an integral part of the financial statements.
Annual Report
Financial Statements - continued
Statement of Changes in Net Assets
Amounts in thousands | Year ended
April 30,
2010 | Year ended
April 30,
2009 |
Increase (Decrease) in Net Assets | | |
Operations | | |
Net investment income (loss) | $ 27,910 | $ 9,044 |
Net realized gain (loss) | 697,990 | (2,202,748) |
Change in net unrealized appreciation (depreciation) | 2,584,342 | (2,645,558) |
Net increase (decrease) in net assets resulting
from operations | 3,310,242 | (4,839,262) |
Distributions to shareholders from net investment income | (18,117) | (7,694) |
Distributions to shareholders from net realized gain | - | (131,543) |
Total distributions | (18,117) | (139,237) |
Share transactions - net increase (decrease) | 134,634 | (2,821,119) |
Redemption fees | 137 | 167 |
Total increase (decrease) in net assets | 3,426,896 | (7,799,451) |
| | |
Net Assets | | |
Beginning of period | 5,174,971 | 12,974,422 |
End of period (including undistributed net investment income of $9,411 and accumulated net investment loss of $782, respectively) | $ 8,601,867 | $ 5,174,971 |
See accompanying notes which are an integral part of the financial statements.
Annual Report
Financial Highlights - Mid-Cap Stock
Years ended April 30, | 2010 | 2009 | 2008 | 2007 | 2006 |
Selected Per-Share Data | | | | | |
Net asset value, beginning of period | $ 16.65 | $ 27.52 | $ 32.43 | $ 30.43 | $ 21.57 |
Income from Investment Operations | | | | | |
Net investment income (loss) B | .08 | .02 | (.06) | (.04) E | (.01) F |
Net realized and unrealized gain (loss) | 10.59 | (10.58) | (2.44) | 3.38 | 9.51 |
Total from investment operations | 10.67 | (10.56) | (2.50) | 3.34 | 9.50 |
Distributions from net investment income | (.06) | (.02) I | - | - | (.04) |
Distributions from net realized gain | - | (.29) I | (2.41) | (1.34) | (.60) |
Total distributions | (.06) | (.31) | (2.41) | (1.34) | (.64) |
Redemption fees added to paid in capital B, H | - | - | - | - | - |
Net asset value, end of period | $ 27.26 | $ 16.65 | $ 27.52 | $ 32.43 | $ 30.43 |
Total Return A | 64.11% | (38.76)% | (8.49)% | 11.53% | 44.52% |
Ratios to Average Net Assets C, G | | | | | |
Expenses before reductions | .65% | .73% | .95% | .83% | .72% |
Expenses net of fee waivers, if any | .65% | .73% | .95% | .83% | .72% |
Expenses net of all reductions | .64% | .72% | .94% | .82% | .69% |
Net investment income (loss) | .38% | .11% | (.21)% | (.14)% E | (.03)% F |
Supplemental Data | | | | | |
Net assets, end of period (in millions) | $ 7,475 | $ 4,763 | $ 12,974 | $ 15,234 | $ 12,653 |
Portfolio turnover rate D | 85% | 73% | 45% | 52% | 74% |
A Total returns would have been lower had certain expenses not been reduced during the periods shown.
B Calculated based on average shares outstanding during the period.
C Fees and expenses of the underlying Fidelity Central Funds are not included in the Fund's expense ratio. The Fund indirectly bears its proportionate share of the expenses of any underlying Fidelity Central Funds.
D Amount does not include the portfolio activity of any underlying Fidelity Central Funds.
E Investment income per share reflects a special dividend which amounted to $.02 per share. Excluding the special dividend, the ratio of net investment income (loss) to average net assets would have been (.20)%.
F Investment income per share reflects a special dividend which amounted to $.04 per share. Excluding the special dividend, the ratio of net investment income (loss) to average net assets would have been (.20)%.
G Expense ratios reflect operating expenses of the class. Expenses before reductions do not reflect amounts reimbursed by the investment adviser or reductions from brokerage service arrangements or reductions from other expense offset arrangements and do not represent the amount paid by the class during periods when reimbursements or reductions occur. Expenses net of fee waivers reflect expenses after reimbursement by the investment adviser but prior to reductions from brokerage service arrangements or other expense offset arrangements. Expenses net of all reductions represent the net expenses paid by the class.
H Amount represents less than $.01 per share.
I The amount shown reflects certain reclassifications related to book to tax differences.
See accompanying notes which are an integral part of the financial statements.
Annual Report
Financial Highlights - Class K
Years ended April 30, | 2010 | 2009 G |
Selected Per-Share Data | | |
Net asset value, beginning of period | $ 16.63 | $ 28.33 |
Income from Investment Operations | | |
Net investment income (loss) D | .14 | .05 |
Net realized and unrealized gain (loss) | 10.58 | (11.39) |
Total from investment operations | 10.72 | (11.34) |
Distributions from net investment income | (.09) | (.07) J |
Distributions from net realized gain | - | (.29) J |
Total distributions | (.09) | (.36) |
Redemption fees added to paid in capital D, I | - | - |
Net asset value, end of period | $ 27.26 | $ 16.63 |
Total Return B, C | 64.55% | (40.38)% |
Ratios to Average Net Assets E, H | | |
Expenses before reductions | .43% | .52% A |
Expenses net of fee waivers, if any | .43% | .52% A |
Expenses net of all reductions | .41% | .52% A |
Net investment income (loss) | .61% | .31% A |
Supplemental Data | | |
Net assets, end of period (in millions) | $ 1,127 | $ 412 |
Portfolio turnover rate F | 85% | 73% |
A Annualized
B Total returns for periods of less than one year are not annualized.
C Total returns would have been lower had certain expenses not been reduced during the periods shown.
D Calculated based on average shares outstanding during the period.
E Fees and expenses of the underlying Fidelity Central Funds are not included in the Fund's expense ratio. The Fund indirectly bears its proportionate share of the expenses of any underlying Fidelity Central Funds.
F Amount does not include the portfolio activity of any underlying Fidelity Central Funds.
G For the period May 9, 2008 (commencement of sale of shares) to April 30, 2009.
H Expense ratios reflect operating expenses of the class. Expenses before reductions do not reflect amounts reimbursed by the investment adviser or reductions from brokerage service arrangements or reductions from other expense offset arrangements and do not represent the amount paid by the class during periods when reimbursements or reductions occur. Expense ratios before reductions for start-up periods may not be representative of longer-term operating periods. Expenses net of fee waivers reflect expenses after reimbursement by the investment adviser but prior to reductions from brokerage service arrangements or other expense offset arrangements. Expenses net of all reductions represent the net expenses paid by the class.
I Amount represents less than $.01 per share.
J The amount shown reflects certain reclassifications related to book to tax differences.
See accompanying notes which are an integral part of the financial statements.
Annual Report
Notes to Financial Statements
For the period ended April 30, 2010
(Amounts in thousands except ratios)
1. Organization.
Fidelity Mid-Cap Stock Fund (the Fund) is a fund of Fidelity Commonwealth Trust (the trust) and is authorized to issue an unlimited number of shares. The trust is registered under the Investment Company Act of 1940, as amended (the 1940 Act), as an open-end management investment company organized as a Massachusetts business trust. The Fund offers Mid-Cap Stock and Class K shares, each of which has equal rights as to assets and voting privileges. Each class has exclusive voting rights with respect to matters that affect that class. After the commencement of Class K, the Fund began offering conversion privileges between Mid-Cap Stock and Class K to eligible shareholders of Mid-Cap Stock. Investment income, realized and unrealized capital gains and losses, the common expenses of the Fund, and certain fund-level expense reductions, if any, are allocated on a pro-rata basis to each class based on the relative net assets of each class to the total net assets of the Fund. Each class differs with respect to transfer agent fees incurred. Certain expense reductions also differ by class.
2. Investments in Fidelity Central Funds.
The Fund may invest in Fidelity Central Funds, which are open-end investment companies available only to other investment companies and accounts managed by Fidelity Management & Research Company (FMR) and its affiliates. The Fund's Schedule of Investments lists each of the Fidelity Central Funds held as of period end, if any, as an investment of the Fund, but does not include the underlying holdings of each Fidelity Central Fund. As an Investing Fund, the Fund indirectly bears its proportionate share of the expenses of the underlying Fidelity Central Funds.
The Money Market Central Funds seek preservation of capital and current income and are managed by Fidelity Investments Money Management, Inc. (FIMM), an affiliate of FMR.
A complete unaudited list of holdings for each Fidelity Central Fund is available upon request or at the Securities and Exchange Commission (the SEC) web site at www.sec.gov. In addition, the financial statements of the Fidelity Central Funds, which are not covered by the Fund's Report of Independent Registered Public Accounting Firm, are available on the SEC web site or upon request.
3. Significant Accounting Policies.
The financial statements have been prepared in conformity with accounting principles generally accepted in the United States of America, which require management to make certain estimates and assumptions at the date of the financial statements. Actual results could differ from those estimates. The following summarizes the significant accounting policies of the Fund:
Annual Report
Notes to Financial Statements - continued
(Amounts in thousands except ratios)
3. Significant Accounting Policies - continued
Security Valuation. Investments are valued as of 4:00 p.m. Eastern time on the last calendar day of the period. The Fund uses independent pricing services approved by the Board of Trustees to value its investments. When current market prices or quotations are not readily available or reliable, valuations may be determined in good faith in accordance with procedures adopted by the Board of Trustees. Factors used in determining value may include market or security specific events. The frequency with which these procedures are used cannot be predicted and they may be utilized to a significant extent. The value used for net asset value (NAV) calculation under these procedures may differ from published prices for the same securities.
The Fund categorizes the inputs to valuation techniques used to value its investments into a disclosure hierarchy consisting of three levels as shown below.
Level 1 - quoted prices in active markets for identical investments
Level 2 - other significant observable inputs (including quoted prices for similar investments, interest rates, prepayment speeds, etc.)
Level 3 - unobservable inputs (including the fund's own assumptions based on the best information available)
Changes in valuation techniques may result in transfers in or out of an assigned level within the disclosure hierarchy. The aggregate value of investments by input level, as of April 30, 2010, is included at the end of the Fund's Schedule of Investments. Valuation techniques used to value the Fund's investments by major category are as follows.
Equity securities, including restricted securities, for which market quotations are readily available, are valued at the last reported sale price or official closing price as reported by an independent pricing service on the primary market or exchange on which they are traded and are categorized as Level 1 in the hierarchy. In the event there were no sales during the day or closing prices are not available, securities are valued at the last quoted bid price or may be valued using the last available price and are generally categorized as Level 2 in the hierarchy. For foreign equity securities, when significant market or security specific events arise, comparisons to the valuation of American Depositary Receipts (ADRs), futures contracts, Exchange-traded funds (ETFs) and certain indexes as well as quoted prices for similar securities are used and are categorized as Level 2 in the hierarchy in these circumstances. Utilizing these techniques may result in transfers between Level 1 and Level 2. For restricted equity securities and private placements where observable inputs are limited, assumptions about market activity and risk are used and are categorized as Level 3 in the hierarchy.
Annual Report
3. Significant Accounting Policies - continued
Security Valuation - continued
Debt securities, including restricted securities, are valued based on evaluated prices received from independent pricing services or from dealers who make markets in such securities. For U.S. government and government agency obligations, pricing services utilize matrix pricing which considers yield or price of bonds of comparable quality, coupon, maturity and type as well as dealer supplied prices and are generally categorized as Level 2 in the hierarchy.
Futures contracts are valued at the settlement price established each day by the board of trade or exchange on which they are traded and are categorized as Level 1 in the hierarchy. Investments in open-end mutual funds, including the Fidelity Central Funds, are valued at their closing net asset value each business day and are categorized as Level 1 in the hierarchy. Short-term securities with remaining maturities of sixty days or less for which quotations are not readily available are valued at amortized cost, which approximates value and are categorized as Level 2 in the hierarchy.
When independent prices are unavailable or unreliable, debt securities may be valued utilizing pricing matrices which consider similar factors that would be used by independent pricing services. These are generally categorized as Level 2 in the hierarchy but may be Level 3 depending on the circumstances.
Foreign Currency. The Fund uses foreign currency contracts to facilitate transactions in foreign-denominated securities. Losses from these transactions may arise from changes in the value of the foreign currency or if the counterparties do not perform under the contracts' terms.
Foreign-denominated assets, including investment securities, and liabilities are translated into U.S. dollars at the exchange rate at period end. Purchases and sales of investment securities, income and dividends received and expenses denominated in foreign currencies are translated into U.S. dollars at the exchange rate in effect on the transaction date.
The effects of exchange rate fluctuations on investments are included with the net realized and unrealized gain (loss) on investment securities. Other foreign currency transactions resulting in realized and unrealized gain (loss) are disclosed separately.
Investment Transactions and Income. For financial reporting purposes, the Fund's investment holdings and NAV include trades executed through the end of the last business day of the period. The NAV per share for processing shareholder transactions is calculated as of the close of business of the New York Stock Exchange (NYSE), normally 4:00 p.m. Eastern time and includes trades executed through the end of the prior business day. Gains and losses on securities sold are determined on the basis of identified
Annual Report
Notes to Financial Statements - continued
(Amounts in thousands except ratios)
3. Significant Accounting Policies - continued
Investment Transactions and Income - continued
cost and may include proceeds received from litigation. Dividend income is recorded on the ex-dividend date, except for certain dividends from foreign securities where the ex-dividend date may have passed, which are recorded as soon as the Fund is informed of the ex-dividend date. Non-cash dividends included in dividend income, if any, are recorded at the fair market value of the securities received. Distributions received on securities that represent a return of capital or capital gain are recorded as a reduction of cost of investments and/or as a realized gain. The Fund estimates the components of distributions received that may be considered return of capital distributions or capital gain distributions. Interest income and distributions from the Fidelity Central Funds are accrued as earned. Interest income includes coupon interest and amortization of premium and accretion of discount on debt securities. Investment income is recorded net of foreign taxes withheld where recovery of such taxes is uncertain.
Expenses. Most expenses of the trust can be directly attributed to a fund. Expenses which cannot be directly attributed are apportioned among each Fund in the trust. Expense estimates are accrued in the period to which they relate and adjustments are made when actual amounts are known.
Deferred Trustee Compensation. Under a Deferred Compensation Plan (the Plan), independent Trustees may elect to defer receipt of a portion of their annual compensation. Deferred amounts are invested in a cross-section of Fidelity funds, are marked-to-market and remain in the Fund until distributed in accordance with the Plan. The investment of deferred amounts and the offsetting payable to the Trustees are included in the accompanying Statement of Assets and Liabilities.
Income Tax Information and Distributions to Shareholders. Each year, the Fund intends to qualify as a regulated investment company by distributing substantially all of its taxable income and realized gains under Subchapter M of the Internal Revenue Code and filing its U.S. federal tax return. As a result, no provision for income taxes is required. As of April 30, 2010, the Fund did not have any unrecognized tax benefits in the accompanying financial statements. A Fund's federal tax return is subject to examination by the Internal Revenue Service (IRS) for a period of three years. Foreign taxes are provided for based on the Fund's understanding of the tax rules and rates that exist in the foreign markets in which it invests.
Distributions are recorded on the ex-dividend date. Income dividends and capital gain distributions are declared separately for each class. Income and capital gain distributions are determined in accordance with income tax regulations, which may differ from generally accepted accounting principles.
Annual Report
3. Significant Accounting Policies - continued
Income Tax Information and Distributions to Shareholders - continued
Capital accounts within the financial statements are adjusted for permanent book-tax differences. These adjustments have no impact on net assets or the results of operations. Temporary book-tax differences will reverse in a subsequent period.
Book-tax differences are primarily due to the short-term gain distributions from the Fidelity Central Funds, futures transactions, foreign currency transactions, passive foreign investment companies (PFIC), partnerships, deferred trustees compensation, capital loss carryforwards, and losses deferred due to wash sales and excise tax regulations.
The federal tax cost of investment securities and unrealized appreciation (depreciation) as of period end were as follows:
Gross unrealized appreciation | $ 2,050,403 |
Gross unrealized depreciation | (665,669) |
Net unrealized appreciation (depreciation) | $ 1,384,734 |
| |
Tax Cost | $ 7,692,904 |
The tax-based components of distributable earnings as of period end were as follows:
Undistributed ordinary income | $ 19,538 |
Capital loss carryforward | $ (1,072,367) |
Net unrealized appreciation (depreciation) | $ 1,384,745 |
The tax character of distributions paid was as follows:
| April 30, 2010 | April 30, 2009 |
Ordinary Income | $ 18,117 | $ 7,694 |
Long-term Capital Gains | - | 131,543 |
Total | $ 18,117 | $ 139,237 |
Short-Term Trading (Redemption) Fees. Shares held in the Fund less than 30 days are subject to a redemption fee equal to .75% of the proceeds of the redeemed shares. All redemption fees, including any estimated redemption fees paid by FMR, are retained by the Fund and accounted for as an addition to paid in capital.
Annual Report
Notes to Financial Statements - continued
(Amounts in thousands except ratios)
4. Operating Policies.
Restricted Securities. The Fund may invest in securities that are subject to legal or contractual restrictions on resale. These securities generally may be resold in transactions exempt from registration or to the public if the securities are registered. Disposal of these securities may involve time-consuming negotiations and expense, and prompt sale at an acceptable price may be difficult. Information regarding restricted securities is included at the end of the Fund's Schedule of Investments.
5. Investments in Derivative Instruments.
Objectives and Strategies for Investing in Derivative Instruments. The Fund uses derivative instruments ("derivatives"), including futures contracts, in order to meet its investment objectives. The Fund's strategy is to use derivatives as a risk management tool and as an additional way to gain exposure to certain types of assets. The success of any strategy involving derivatives depends on analysis of numerous economic factors, and if the strategies for investment do not work as intended, the Fund may not achieve its objectives.
While utilizing derivatives in pursuit of its investment objectives, the Fund is exposed to certain financial risk relative to those derivatives. This risk is further explained below:
Equity Risk | Equity risk is the risk that the value of financial instruments will fluctuate as a result of changes in market prices (other than those arising from interest rate risk or foreign exchange risk), whether caused by factors specific to an individual investment, its issuer, or all factors affecting all instruments traded in a market or market segment. |
The following notes provide more detailed information about each derivative type held by the Fund:
Futures Contracts. The Fund uses futures contracts to manage its exposure to the stock market. A futures contract is an agreement between two parties to buy or sell a specified underlying instrument for a fixed price at a specified future date. Buying futures tends to increase a fund's exposure to the underlying instrument, while selling futures tends to decrease a fund's exposure to the underlying instrument. Risks of loss may exceed any futures variation margin reflected in the Fund's Statement of Assets and Liabilities and may include equity risk and potential lack of liquidity in the market. Futures have minimal counterparty risk to the Fund since the exchange's clearinghouse, as counterparty to all exchange-traded futures, guarantees the futures against default. The underlying face amount at value of any open futures contracts at period end is shown in the Schedule of Investments under the caption "Futures Contracts." This amount reflects each contract's exposure to the underlying instrument at period end.
Annual Report
5. Investments in Derivative Instruments - continued
Futures Contracts - continued
The purchaser or seller of a futures contract is not required to pay for or deliver the instrument unless the contract is held until the delivery date. Upon entering into a futures contract, a fund is required to deposit with a clearing broker, no later than the following business day, an amount ("initial margin") equal to a certain percentage of the face value of the contract. The initial margin may be in the form of cash or securities and is transferred to a segregated account on settlement date. Securities deposited to meet margin requirements are identified in the Fund's Schedule of Investments. Futures contracts are marked-to-market daily and subsequent payments ("variation margin") are made or received by a fund depending on the daily fluctuations in the value of the futures contract. These amounts are reflected as receivables or payables on the Statement of Assets and Liabilities and changes in value are recognized as unrealized gain (loss). Realized gain (loss) is recorded upon the expiration or closing of the futures contract. The net realized gain (loss) and change in unrealized gain (loss) on futures contracts during the period is included on the Statement of Operations. The total underlying face amount of all open futures contracts at period end is indicative of the volume of this derivative type.
Realized and Change in Unrealized Gain (Loss) on Derivative Instruments. A summary of the Fund's value of derivatives by primary risk exposure as of period end, if any, is included at the end of the Fund's Schedule of Investments. The table below reflects the Fund's realized gain (loss) and change in unrealized gain (loss) for derivatives during the period.
Risk Exposure / Derivative Type | Realized
Gain (Loss) | Change in Unrealized
Gain (Loss) |
Equity Risk | | |
Futures Contracts | $ 3,760 | $ 3,703 |
Total Derivatives Realized and Change in Unrealized Gain (Loss) (a)(b) | $ 3,760 | $ 3,703 |
(a) Total derivatives realized gain (loss) included in the Statement of Operations is comprised of $3,760 for futures contracts.
(b) Total derivatives change in unrealized gain (loss) included in the Statement of Operations is comprised of $3,703 for futures contracts.
6. Purchases and Sales of Investments.
Purchases and sales of securities, other than short-term securities, aggregated $5,707,063 and $5,765,568, respectively.
Annual Report
Notes to Financial Statements - continued
(Amounts in thousands except ratios)
7. Fees and Other Transactions with Affiliates.
Management Fee. FMR and its affiliates provide the Fund with investment management related services for which the Fund pays a monthly management fee. The management fee is the sum of an individual fund fee rate that is based on an annual rate of .30% of the Fund's average net assets and a group fee rate that averaged .26% during the period. The group fee rate is based upon the average net assets of all the mutual funds advised by FMR. The group fee rate decreases as assets under management increase and increases as assets under management decrease. In addition, the management fee is subject to a performance adjustment (up to a maximum of ± .20% of the Fund's average net assets over a 36 month performance period). The upward or downward adjustment to the management fee is based on the relative investment performance of the retail class of the Fund, Mid-Cap Stock, as compared to an appropriate benchmark index. For the period, the total annual management fee rate, including the performance adjustment, was .34% of the Fund's average net assets.
Transfer Agent Fees. Fidelity Investments Institutional Operations Company, Inc. (FIIOC), an affiliate of FMR, is the transfer, dividend disbursing and shareholder servicing agent for each class of the Fund. FIIOC receives account fees and asset-based fees that vary according to the account size and type of account of the shareholders of Mid-Cap Stock. FIIOC receives an asset-based fee of Class K's average net assets. FIIOC pays for typesetting, printing and mailing of shareholder reports, except proxy statements. For the period, the total transfer agent fees paid by each class were as follows:
| Amount | % of
Average
Net Assets |
Mid-Cap Stock | $ 17,040 | .28 |
Class K | 400 | .06 |
| $ 17,440 | |
Accounting and Security Lending Fees. Fidelity Service Company, Inc. (FSC), an affiliate of FMR, maintains the Fund's accounting records. The accounting fee is based on the level of average net assets for the month. Under a separate contract, FSC administers the security lending program. The security lending fee is based on the number and duration of lending transactions.
Brokerage Commissions. The Fund placed a portion of its portfolio transactions with brokerage firms which are affiliates of the investment adviser. The commissions paid to these affiliated firms were $201 for the period.
Annual Report
7. Fees and Other Transactions with Affiliates - continued
Interfund Lending Program. Pursuant to an Exemptive Order issued by the SEC, the Fund, along with other registered investment companies having management contracts with FMR, may participate in an interfund lending program. This program provides an alternative credit facility allowing the funds to borrow from, or lend money to, other participating affiliated funds. The Fund's activity in this program during the period for which loans were outstanding was as follows:
Borrower or Lender | Average Daily
Loan Balance | Weighted Average Interest Rate | Interest Expense |
Borrower | $ 14,698 | .42% | $ 10 |
8. Committed Line of Credit.
The Fund participates with other funds managed by FMR in a $3.75 billion credit facility (the "line of credit") to be utilized for temporary or emergency purposes to fund shareholder redemptions or for other short-term liquidity purposes. The Fund has agreed to pay commitment fees on its pro-rata portion of the line of credit, which amounted to $27 and is reflected in Miscellaneous Expense on the Statement of Operations. During the period, there were no borrowings on this line of credit.
9. Security Lending.
The Fund lends portfolio securities from time to time in order to earn additional income. On the settlement date of the loan, the Fund receives collateral (in the form of U.S. Treasury obligations, letters of credit and/or cash) against the loaned securities and maintains collateral in an amount not less than 100% of the market value of the loaned securities during the period of the loan. The market value of the loaned securities is determined at the close of business of the Fund and any additional required collateral is delivered to the Fund on the next business day. If the borrower defaults on its obligation to return the securities loaned because of insolvency or other reasons, a fund could experience delays and costs in recovering the securities loaned or in gaining access to the collateral. Any cash collateral received is invested in the Fidelity Securities Lending Cash Central Fund. The value of loaned securities and cash collateral at period end are disclosed on the Fund's Statement of Assets and Liabilities. Security lending income represents the income earned on investing cash collateral, less fees and expenses associated with the loan, plus any premium payments that may be received on the loan of certain types of securities. Security lending income is presented in the Statement of Operations as a component of income from Fidelity Central Funds.
Annual Report
Notes to Financial Statements - continued
(Amounts in thousands except ratios)
10. Expense Reductions.
FMR voluntarily agreed to reimburse a portion of Mid-Cap Stock's operating expenses. During the period, this reimbursement reduced the class' expenses by $10.
Many of the brokers with whom FMR places trades on behalf of the Fund provided services to the Fund in addition to trade execution. These services included payments of certain expenses on behalf of the Fund totaling $835 for the period.
11. Distributions to Shareholders.
Distributions to shareholders of each class were as follows:
Years ended April 30, | 2010 | 2009 A |
From net investment income | | |
Mid-Cap Stock | $ 15,250 | $ 6,804 |
Class K | 2,867 | 890 |
Total | $ 18,117 | $ 7,694 |
Years ended April 30, | |
|
From net realized gain | | |
Mid-Cap Stock | $ - | $ 131,185 |
Class K | - | 358 |
Total | $ - | $ 131,543 |
A Distributions for Class K are for the period May 9, 2008 (commencement of sale of shares) to April 30, 2009.
12. Share Transactions.
Transactions for each class of shares were as follows:
| Shares | Dollars |
Years ended April 30, | 2010B | 2009A | 2010B | 2009A |
Mid-Cap Stock | | | | |
Shares sold | 57,640 | 50,358 | $ 1,306,729 | $ 977,540 |
Conversion to Class K | (2,545) | (24,565) | (49,963) | (408,783) |
Reinvestment of distributions | 646 | 5,113 | 14,922 | 135,727 |
Shares redeemed | (67,646) | (216,202) | (1,524,601) | (3,937,402) |
Net increase (decrease) | (11,905) | (185,296) | $ (252,913) | $ (3,232,918) |
Class K | | | | |
Shares sold | 20,395 | 2,326 | $ 479,811 | $ 34,753 |
Conversion from Mid-Cap Stock | 2,546 | 24,570 | 49,963 | 408,783 |
Reinvestment of distributions | 124 | 83 | 2,867 | 1,249 |
Shares redeemed | (6,499) | (2,205) | (145,094) | (32,986) |
Net increase (decrease) | 16,566 | 24,774 | $ 387,547 | $ 411,799 |
A Share transactions for Class K are for the period May 9, 2008 (commencement of sale of shares) to April 30, 2009.
B Conversion transactions for Class K and Mid-Cap Stock are presented for the period May 1, 2009 through August 31, 2009.
Annual Report
13. Other.
The Fund's organizational documents provide former and current trustees and officers with a limited indemnification against liabilities arising in connection with the performance of their duties to the Fund. In the normal course of business, the Fund may also enter into contracts that provide general indemnifications. The Fund's maximum exposure under these arrangements is unknown as this would be dependent on future claims that may be made against the Fund. The risk of material loss from such claims is considered remote.
Annual Report
To the Trustees of Fidelity Commonwealth Trust and Shareholders of Fidelity Mid-Cap Stock Fund:
We have audited the accompanying statement of assets and liabilities of Fidelity Mid-Cap Stock Fund (the Fund), a fund of Fidelity Commonwealth Trust, including the schedule of investments, as of April 30, 2010, and the related statement of operations for the year then ended, the statement of changes in net assets for each of the two years in the period then ended, and the financial highlights for each of the five years in the period then ended. These financial statements and financial highlights are the responsibility of the Fund's management. Our responsibility is to express an opinion on these financial statements and financial highlights based on our audits.
We conducted our audits in accordance with standards of the Public Company Accounting Oversight Board (United States). Those standards require that we plan and perform the audit to obtain reasonable assurance about whether the financial statements and financial highlights are free of material misstatement. The Fund is not required to have, nor were we engaged to perform, an audit of its internal control over financial reporting. Our audits included consideration of internal control over financial reporting as a basis for designing audit procedures that are appropriate in the circumstances, but not for the purpose of expressing an opinion on the effectiveness of the Fund's internal control over financial reporting. Accordingly, we express no such opinion. An audit also includes examining, on a test basis, evidence supporting the amounts and disclosures in the financial statements, assessing the accounting principles used and significant estimates made by management, as well as evaluating the overall financial statement presentation. Our procedures included confirmation of securities owned as of April 30, 2010, by correspondence with the custodians and brokers; where replies were not received from brokers, we performed other auditing procedures. We believe that our audits provide a reasonable basis for our opinion.
In our opinion, the financial statements and financial highlights referred to above present fairly, in all material respects, the financial position of Fidelity Mid-Cap Stock Fund as of April 30, 2010, the results of its operations for the year then ended, the changes in its net assets for each of the two years in the period then ended, and the financial highlights for each of the five years in the period then ended, in conformity with accounting principles generally accepted in the United States of America.
/s/ Deloitte & Touche LLP
DELOITTE & TOUCHE LLP
Boston, Massachusetts
June 17, 2010
Annual Report
The Trustees, Member of the Advisory Board, and executive officers of the trust and fund, as applicable, are listed below. The Board of Trustees governs the fund and is responsible for protecting the interests of shareholders. The Trustees are experienced executives who meet periodically throughout the year to oversee the fund's activities, review contractual arrangements with companies that provide services to the fund, oversee management of the risks associated with such activities and contractual arrangements, and review the fund's performance. Except for James C. Curvey, each of the Trustees oversees 222 funds advised by FMR or an affiliate. Mr. Curvey oversees 411 funds advised by FMR.
The Trustees hold office without limit in time except that (a) any Trustee may resign; (b) any Trustee may be removed by written instrument, signed by at least two-thirds of the number of Trustees prior to such removal; (c) any Trustee who requests to be retired or who has become incapacitated by illness or injury may be retired by written instrument signed by a majority of the other Trustees; and (d) any Trustee may be removed at any special meeting of shareholders by a two-thirds vote of the outstanding voting securities of the trust. Each Trustee who is not an interested person (as defined in the 1940 Act) (Independent Trustee), shall retire not later than the last day of the calendar year in which his or her 72nd birthday occurs. The Independent Trustees may waive this mandatory retirement age policy with respect to individual Trustees. The executive officers and Advisory Board Member hold office without limit in time, except that any officer and Advisory Board Member may resign or may be removed by a vote of a majority of the Trustees at any regular meeting or any special meeting of the Trustees. Except as indicated, each individual has held the office shown or other offices in the same company for the past five years.
Experience, Skills, Attributes, and Qualifications of the Fund's Trustees. The Governance and Nominating Committee has adopted a statement of policy that describes the experience, qualifications, attributes, and skills that are necessary and desirable for potential Independent Trustee candidates (Statement of Policy). The Board believes that each Trustee satisfied at the time he or she was initially elected or appointed a Trustee, and continues to satisfy, the standards contemplated by the Statement of Policy. The Governance and Nominating Committee also engages professional search firms to help identify potential Independent Trustee candidates who have the experience, qualifications, attributes, and skills consistent with the Statement of Policy. From time to time, additional criteria based on the composition and skills of the current Independent Trustees, as well as experience or skills that may be appropriate in light of future changes to board composition, business conditions, and regulatory or other developments, have also been considered by the professional search firms and the Governance and Nominating Committee. In addition, the Board takes into account the Trustees' commitment and participation in Board and committee meetings, as well as their leadership of standing and ad hoc committees throughout their tenure.
In determining that a particular Trustee was and continues to be qualified to serve as a Trustee, the Board has considered a variety of criteria, none of which, in isolation, was controlling. The Board believes that, collectively, the Trustees have balanced and diverse experience, qualifications, attributes, and skills, which allow the Board to operate effectively in governing the fund and protecting the interests of shareholders. Information about the specific experience, skills, attributes, and qualifications of each Trustee, which in each case led to the Board's conclusion that the Trustee should serve (or continue to serve) as a trustee of the fund, is provided below.
Annual Report
Board Structure and Oversight Function. Edward C. Johnson 3d is an interested person (as defined in the 1940 Act) and currently serves as Chairman. The Trustees have determined that an interested Chairman is appropriate and benefits shareholders because an interested Chairman has a personal and professional stake in the quality and continuity of services provided to the fund. Independent Trustees exercise their informed business judgment to appoint an individual of their choosing to serve as Chairman, regardless of whether the Trustee happens to be independent or a member of management. The Independent Trustees have determined that they can act independently and effectively without having an Independent Trustee serve as Chairman and that a key structural component for assuring that they are in a position to do so is for the Independent Trustees to constitute a substantial majority for the Board. The Independent Trustees also regularly meet in executive session. Ned C. Lautenbach serves as Chairman of the Independent Trustees and as such (i) acts as a liaison between the Independent Trustees and management with respect to matters important to the Independent Trustees and (ii) with management prepares agendas for Board meetings.
Fidelity funds are overseen by different Boards of Trustees. The fund's Board oversees Fidelity's equity and high income funds and another Board oversees Fidelity's investment-grade bond, money market, and asset allocation funds. The asset allocation funds may invest in Fidelity funds overseen by the fund's Board. The use of separate Boards, each with its own committee structure, allows the Trustees of each group of Fidelity funds to focus on the unique issues of the funds they oversee, including common research, investment, and operational issues. On occasion, the separate Boards establish joint committees to address issues of overlapping consequences for the Fidelity funds overseen by each Board.
The Trustees operate using a system of committees to facilitate the timely and efficient consideration of all matters of importance to the Trustees, the fund, and fund shareholders and to facilitate compliance with legal and regulatory requirements and oversight of the fund's activities and associated risks. The Board, acting through its committees, has charged FMR and its affiliates with (i) identifying events or circumstances the occurrence of which could have demonstrably adverse effects on the fund's business and/or reputation; (ii) implementing processes and controls to lessen the possibility that such events or circumstances occur or to mitigate the effects of such events or circumstances if they do occur; and (iii) creating and maintaining a system designed to evaluate continuously business and market conditions in order to facilitate the identification and implementation processes described in (i) and (ii) above. Because the day-to-day operations and activities of the fund are carried out by or through FMR, its affiliates and other service providers, the fund's exposure to risks is mitigated but not eliminated by the processes overseen by the Trustees. While each of the Board's committees has responsibility for overseeing different aspects of the fund's activities, oversight is exercised primarily through the Operations, Audit, and Compliance Committees. Appropriate personnel, including but not limited to the fund's Chief Compliance Officer (CCO), FMR's internal auditor, the independent accountants, the fund's Treasurer and portfolio management personnel, make periodic reports to the Board's committees, as appropriate. The responsibilities of each committee, including their oversight responsibilities, are described further under "Standing Committees of the Fund's Trustees."
Annual Report
Trustees and Officers - continued
The fund's Statement of Additional Information (SAI) includes more information about the Trustees. To request a free copy, call Fidelity at 1-800-835-5092.
Interested Trustees*:
Correspondence intended for each Trustee who is an interested person may be sent to Fidelity Investments, 82 Devonshire Street, Boston, Massachusetts 02109.
Name, Age; Principal Occupations and Other Relevant Experience+ |
Edward C. Johnson 3d (79) |
| Year of Election or Appointment: 1974 Mr. Johnson is Trustee and Chairman of the Board of Trustees of certain Trusts. Mr. Johnson serves as Chief Executive Officer, Chairman, and a Director of FMR LLC; Chairman and a Director of FMR; Chairman and a Director of Fidelity Research & Analysis Company (FRAC); Chairman and a Director of Fidelity Investments Money Management, Inc.; and Chairman and a Director of FMR Co., Inc. In addition, Mr. Johnson serves as Chairman and Director of FIL Limited. Previously, Mr. Johnson served as President of FMR LLC (2006-2007). |
James C. Curvey (74) |
| Year of Election or Appointment: 2007 Mr. Curvey also serves as Trustee (2007-present) of other investment companies advised by FMR. Mr. Curvey is a Director of FMR and FMR Co., Inc. (2007-present). Mr. Curvey is also Vice Chairman (2006-
present) and Director of FMR LLC. In addition, Mr. Curvey serves as an Overseer for the Boston Symphony Orchestra and a member of the Trustees of Villanova University. |
* Trustees have been determined to be "Interested Trustees" by virtue of, among other things, their affiliation with the trust or various entities under common control with FMR.
+ The information above includes each Trustee's principal occupation during the last five years and other information relating to the experience, attributes, and skills relevant to each Trustee's qualifications to serve as a Trustee, which led to the conclusion that each Trustee should serve as a Trustee for the fund.
Annual Report
Independent Trustees:
Correspondence intended for each Independent Trustee (that is, the Trustees other than the Interested Trustees) may be sent to Fidelity Investments, P.O. Box 55235, Boston, Massachusetts 02205-5235.
Name, Age; Principal Occupations and Other Relevant Experience+ |
Dennis J. Dirks (61) |
| Year of Election or Appointment: 2005 Prior to his retirement in May 2003, Mr. Dirks was Chief Operating Officer and a member of the Board of The Depository Trust & Clearing Corporation (DTCC). He also served as President, Chief Operating Officer, and Board member of The Depository Trust Company (DTC) and President and Board member of the National Securities Clearing Corporation (NSCC). In addition, Mr. Dirks served as Chief Executive Officer and Board member of the Government Securities Clearing Corporation, Chief Executive Officer and Board member of the Mortgage-Backed Securities Clearing Corporation, as a Trustee and a member of the Finance Committee of Manhattan College (2005-2008), and as a Trustee and a member of the Finance Committee of AHRC of Nassau County (2006-2008). Currently, Mr. Dirks serves as a member of the Board of Directors for The Brookville Center for Children's Services, Inc. (2009-present). |
Alan J. Lacy (56) |
| Year of Election or Appointment: 2008 Mr. Lacy serves as Senior Adviser (2007-present) of Oak Hill Capital Partners, L.P. (private equity). Mr. Lacy also served as Chief Executive Officer (2000-2005) and Vice Chairman (2005-2006) of Sears Holdings Corporation and Sears, Roebuck and Co. (retail). In addition, Mr. Lacy serves as a member of the Board of Directors of The Western Union Company (global money transfer, 2006-present) and Bristol-Myers Squibb Company (global pharmaceuticals, 2007-present). Mr. Lacy is Chairman (2008-present) and a member (2006-present) of the Board of Trustees of The National Parks Conservation Association. |
Ned C. Lautenbach (66) |
| Year of Election or Appointment: 2000 Mr. Lautenbach is Chairman of the Independent Trustees of the Equity and High Income Funds (2006-present). Mr. Lautenbach is an Advisory Partner of Clayton, Dubilier & Rice, Inc. (private equity investment, 2008-present) and was previously a Partner of Clayton, Dubilier & Rice, Inc. (1998-2008). Previously, Mr. Lautenbach was with the International Business Machines Corporation (IBM) from 1968 until his retirement in 1998. Mr. Lautenbach serves as a Director of Eaton Corporation (diversified industrial) as well as the Philharmonic Center for the Arts in Naples, Florida. Mr. Lautenbach is also a member of the Board of Trustees of Fairfield University (2005-present), as well as a member of the Council on Foreign Relations. Previously, Mr. Lautenbach served as a Director of Sony Corporation (2006-2007). |
Joseph Mauriello (65) |
| Year of Election or Appointment: 2008 Prior to his retirement in January 2006, Mr. Mauriello served in numerous senior management positions including Deputy Chairman and Chief Operating Officer (2004-2005), and Vice Chairman of Financial Services (2002-2004) of KPMG LLP US (professional services, 1965-2005). Mr. Mauriello currently serves as a member of the Board of Directors of XL Capital Ltd. (global insurance and re-insurance, 2006-present) and of Arcadia Resources Inc. (health care services and products, 2007-present). Previously, Mr. Mauriello served as a Director of the Hamilton Funds of the Bank of New York (2006-2007). |
Cornelia M. Small (65) |
| Year of Election or Appointment: 2005 Ms. Small is a member of the Board of Directors of the Teagle Foundation (2009-present). Ms. Small is also a member of the Investment Committee, and Chair (2008-present) and a member of the Board of Trustees of Smith College. In addition, Ms. Small serves on the Investment Committee of the Berkshire Taconic Community Foundation (2008-present). Previously, Ms. Small served as Chairperson of the Investment Committee (2002-2008) of Smith College. In addition, Ms. Small served as Chief Investment Officer, Director of Global Equity Investments, and a member of the Board of Directors of Scudder, Stevens & Clark and Scudder Kemper Investments. |
William S. Stavropoulos (70) |
| Year of Election or Appointment: 2002 Mr. Stavropoulos is Vice Chairman of the Independent Trustees of the Equity and High Income Funds (2006-present). Mr. Stavropoulos serves as President and Founder of the Michigan Baseball Foundation, the Great Lakes Loons (2007-present). Mr. Stavropoulos is Chairman Emeritus of the Board of Directors of The Dow Chemical Company, where he previously served in numerous senior management positions, including President, CEO (1995-2000; 2002-2004), Chairman of the Executive Committee (2000-2006), and as a member of the Board of Directors (1990-2006). Currently, Mr. Stavropoulos is a Director of Teradata Corporation (data warehousing and technology solutions, 2008-present), Chemical Financial Corporation, Maersk Inc. (industrial conglomerate), Tyco International, Inc. (multinational manufacturing and services, 2007-present), and a member of the Advisory Board for Metalmark Capital (private equity investment, 2005-present). Mr. Stavropoulos is a special advisor to Clayton, Dubilier & Rice, Inc. (private equity investment). In addition, Mr. Stavropoulos is a member of the University of Notre Dame Advisory Council for the College of Science. |
David M. Thomas (60) |
| Year of Election or Appointment: 2008 Previously, Mr. Thomas served as Executive Chairman (2005-2006) and Chairman and Chief Executive Officer (2000-2005) of IMS Health, Inc. (pharmaceutical and healthcare information solutions). In addition, Mr. Thomas serves as a member of the Board of Directors of Fortune Brands, Inc. (consumer products), and Interpublic Group of Companies, Inc. (marketing communication, 2004-present). |
Michael E. Wiley (59) |
| Year of Election or Appointment: 2008 Mr. Wiley also serves as a Director of Asia Pacific Exploration Consolidated (international oil and gas exploration and production, 2008-
present), and as a member of the Board of Trustees of the University of Tulsa (2000-2006; 2007-present). Mr. Wiley serves as a Director of Tesoro Corporation (independent oil refiner and marketer, 2005-present), and a Director of Bill Barrett Corporation (exploration and production, 2005-present). In addition, Mr. Wiley also serves as a Director of Post Oak Bank (privately-held bank, 2004-present). Previously, Mr. Wiley served as a Sr. Energy Advisor of Katzenbach Partners, LLC (consulting, 2006-2007), as an Advisory Director of Riverstone Holdings (private investment), Chairman, President, and CEO of Baker Hughes, Inc. (oilfield services, 2000-2004), and as Director of Spinnaker Exploration Company (exploration and production, 2001-2005). |
Annual Report
Trustees and Officers - continued
+ The information above includes each Trustee's principal occupation during the last five years and other information relating to the experience, attributes, and skills relevant to each Trustee's qualifications to serve as a Trustee, which led to the conclusion that each Trustee should serve as a Trustee for the fund.
Advisory Board Member and Executive Officers:
Correspondence intended for each executive officer and Peter S. Lynch may be sent to Fidelity Investments, 82 Devonshire Street, Boston, Massachusetts 02109.
Name, Age; Principal Occupation |
Peter S. Lynch (66) |
| Year of Election or Appointment: 2003 Member of the Advisory Board of Fidelity's Equity and High Income Funds. Mr. Lynch is Vice Chairman and a Director of FMR and FMR Co., Inc. In addition, Mr. Lynch serves as a Trustee of Boston College and as the Chairman of the Inner-City Scholarship Fund. Previously, Mr. Lynch served on the Special Olympics International Board of Directors (1997-2006). |
Kenneth B. Robins (40) |
| Year of Election or Appointment: 2008 President and Treasurer of Fidelity's Equity and High Income Funds. Mr. Robins also serves as President and Treasurer (2010-present) and Assistant Treasurer (2009-present) of other Fidelity funds and is an employee of Fidelity Investments (2004-present). Previously, Mr. Robins served as Deputy Treasurer of the Fidelity funds (2005-2008) and Treasurer and Chief Financial Officer of The North Carolina Capital Management Trust: Cash and Term Portfolios (2006-2008). |
Bruce T. Herring (44) |
| Year of Election or Appointment: 2006 Vice President of certain Equity Funds. Mr. Herring also serves as Group Chief Investments Officer of FMR. Previously, Mr. Herring served as a portfolio manager for Fidelity U.S. Equity Funds. |
Brian B. Hogan (45) |
| Year of Election or Appointment: 2009 Vice President of certain Equity Funds and Vice President of Sector Funds. Mr. Hogan also serves as Senior Vice President, Equity Research of FMR (2006-present) and President of FMR's Equity Division (2009-present). Previously, Mr. Hogan served as a portfolio manager. |
Scott C. Goebel (42) |
| Year of Election or Appointment: 2008 Secretary and Chief Legal Officer (CLO) of the Fidelity funds. Mr. Goebel also serves as General Counsel, Secretary, and Senior Vice President of FMR (2008-present) and FMR Co., Inc. (2008-present); Deputy General Counsel of FMR LLC; Chief Legal Officer of Fidelity Management & Research (Hong Kong) Limited (2008-present) and Assistant Secretary of Fidelity Management & Research (Japan) Inc. (2008-present), Fidelity Investments Money Management, Inc. (2008-present), Fidelity Management & Research (U.K.) Inc. (2008-present), and Fidelity Research and Analysis Company (2008-present). Previously, Mr. Goebel served as Assistant Secretary of the Funds (2007-2008) and as Vice President and Secretary of Fidelity Distributors Corporation (FDC) (2005-2007). |
William C. Coffey (41) |
| Year of Election or Appointment: 2009 Assistant Secretary of Fidelity's Equity and High Income Funds. Mr. Coffey also serves as Senior Vice President and Deputy General Counsel of FMR LLC (2010-present), and is an employee of Fidelity Investments. Previously, Mr. Coffey served as Vice President and Associate General Counsel of FMR LLC (2005-2009). |
Holly C. Laurent (55) |
| Year of Election or Appointment: 2008 Anti-Money Laundering (AML) Officer of the Fidelity funds. Ms. Laurent is an employee of Fidelity Investments. Previously, Ms. Laurent was Senior Vice President and Head of Legal for Fidelity Business Services India Pvt. Ltd. (2006-2008), and Senior Vice President, Deputy General Counsel and Group Head for FMR LLC (2005-2006). |
Christine Reynolds (51) |
| Year of Election or Appointment: 2008 Chief Financial Officer of the Fidelity funds. Ms. Reynolds became President of Fidelity Pricing and Cash Management Services (FPCMS) in August 2008. Ms. Reynolds served as Chief Operating Officer of FPCMS (2007-2008). Previously, Ms. Reynolds served as President, Treasurer, and Anti-Money Laundering officer of the Fidelity funds (2004-2007). |
Kenneth A. Rathgeber (62) |
| Year of Election or Appointment: 2004 Chief Compliance Officer of Fidelity's Equity and High Income Funds. Mr. Rathgeber is Chief Compliance Officer of Fidelity Management & Research (Hong Kong) Limited (2008-present), Fidelity Management & Research (Japan) Inc. (2008-present), FMR (2005-present), FMR Co., Inc. (2005-present), Fidelity Management & Research (U.K.) Inc. (2005-present), Fidelity Research & Analysis Company (2005-present), Fidelity Investments Money Management, Inc. (2005-present), Pyramis Global Advisors, LLC (2005-present), and Strategic Advisers, Inc. (2005-present). |
Jeffrey S. Christian (48) |
| Year of Election or Appointment: 2009 Deputy Treasurer of the Fidelity funds. Mr. Christian is an employee of Fidelity Investments. Previously, Mr. Christian served as Chief Financial Officer (2008-2009) of certain Fidelity funds and Senior Vice President of Fidelity Pricing and Cash Management Services (FPCMS) (2004-2009). |
Bryan A. Mehrmann (49) |
| Year of Election or Appointment: 2005 Deputy Treasurer of the Fidelity funds. Mr. Mehrmann is an employee of Fidelity Investments. |
Adrien E. Deberghes (42) |
| Year of Election or Appointment: 2008 Deputy Treasurer of Fidelity's Equity and High Income Funds. Mr. Deberghes is an employee of Fidelity Investments (2008-present). Previously, Mr. Deberghes served as Senior Vice President of Mutual Fund Administration at State Street Corporation (2007-2008), Senior Director of Mutual Fund Administration at Investors Bank & Trust (2005-2007), and Director of Finance for Dunkin' Brands (2000-2005). |
John R. Hebble (51) |
| Year of Election or Appointment: 2009 Assistant Treasurer of Fidelity's Equity and High Income Funds. Mr. Hebble also serves as Treasurer and Chief Financial Officer of The North Carolina Capital Management Trust: Cash and Term Portfolio (2008-present), President and Treasurer of other Fidelity funds (2008-present) and is an employee of Fidelity Investments. |
Gary W. Ryan (51) |
| Year of Election or Appointment: 2005 Assistant Treasurer of the Fidelity funds. Mr. Ryan is an employee of Fidelity Investments. Previously, Mr. Ryan served as Vice President of Fund Reporting in Fidelity Pricing and Cash Management Services (FPCMS) (1999-2005). |
Annual Report
The Board of Trustees of Fidelity Mid-Cap Stock Fund voted to pay shareholders of record at the opening of business on record date, the following distributions per share derived from capital gains realized from sales of portfolio securities, and dividends derived from net investment income:
| Pay Date | Record Date | Dividends | Capital Gains |
Class K | 06/14/10 | 06/11/10 | $0.044 | $0.035 |
Class K designates 100% of the dividends distributed during the fiscal year as qualifying for the dividends-received deduction for corporate shareholders.
Class K designates 100% of the dividends distributed during the fiscal year as amounts which may be taken into account as a dividend for the purposes of the maximum rate under section 1(h)(11) of the Internal Revenue Code.
The fund will notify shareholders in January 2011 of amounts for use in preparing 2010 income tax returns.
Annual Report
Managing Your Investments
Fidelity offers several ways to conveniently manage your workplace benefits (including your workplace savings plan, investments, and additional services) via your telephone or PC. You can access your plan and account information and research your investments 24 hours a day.
By Phone
Fidelity provides a single toll-free number to access plan information, account balances, positions, and quotes*. It's easy to navigate the service, and on your first call, the system will help you create a personal identification number (PIN) for security.
(phone_graphic)
Fidelity Workplace
Investing
1-800-835-5092
By PC
Fidelity's web site on the Internet provides a wide range of information, including plan information, daily financial news, fund performance, interactive planning tools, and news about Fidelity products and services.
(computer_graphic)
Fidelity's Web Site
www.401k.com
* When you call the quotes line, please remember that a fund's yield and return will vary and, except for money market funds, share price will also vary. This means that you may have a gain or loss when you sell your shares. There is no assurance that money market funds will be able to maintain a stable $1 share price; an investment in a money market fund is not insured or guaranteed by the U.S. government. Total returns are historical and include changes in share price, reinvestment of dividends and capital gains, and the effects of any sales charges.
Annual Report
To Write Fidelity
We'll give your correspondence immediate attention and send you written confirmation upon completion of your request.
(letter_graphic)
For Non-Retirement
Accounts
Buying shares
Fidelity Investments
P.O. Box 770001
Cincinnati, OH 45277-0003
Overnight Express
Fidelity Investments
Attn: Distribution Services
100 Crosby Parkway - KC1H
Covington, KY 41015
Selling shares
Fidelity Investments
P.O. Box 770001
Cincinnati, OH 45277-0035
Overnight Express
Fidelity Investments
Attn: Distribution Services
100 Crosby Parkway - KC1H
Covington, KY 41015
General Correspondence
Fidelity Investments
P.O. Box 500
Merrimack, NH 03054-0500
(letter_graphic)
For Retirement
Accounts
Buying shares
Fidelity Investments
P.O. Box 770001
Cincinnati, OH 45277-0003
Selling shares
Fidelity Investments
P.O. Box 770001
Cincinnati, OH 45277-0035
Overnight Express
Fidelity Investments
Attn: Distribution Services
100 Crosby Parkway - KC1H
Covington, KY 41015
General Correspondence
Fidelity Investments
P.O. Box 500
Merrimack, NH 03054-0500
Annual Report
Investment Adviser
Fidelity Management & Research Company
Boston, MA
Investment Sub-Advisers
FMR Co., Inc.
Fidelity Research & Analysis Company
Fidelity Management & Research
(U.K.) Inc.
FIL Investments (Japan) Limited
FIL Investment Advisors
FIL Investment Advisors
(U.K.) Ltd.
Fidelity Management & Research
(Hong Kong) Limited
Fidelity Management & Research
(Japan) Inc.
General Distributor
Fidelity Distributors Corporation
Boston, MA
Transfer and Service Agents
Fidelity Investments Institutional
Operations Company, Inc.
Boston, MA
Fidelity Service Company, Inc.
Boston, MA
Custodian
The Northern Trust Company
Chicago, IL
MCS-K-UANN-0610
1.863346.101
Fidelity®
Small Cap Discovery
Fund
(formerly Fidelity Small Cap Retirement Fund)
Annual Report
April 30, 2010
(2_fidelity_logos) (Registered_Trademark)
Contents
Chairman's Message | <Click Here> | The Chairman's message to shareholders. |
Performance | <Click Here> | How the fund has done over time. |
Management's Discussion | <Click Here> | The manager's review of fund performance, strategy and outlook. |
Shareholder Expense Example | <Click Here> | An example of shareholder expenses. |
Investment Changes | <Click Here> | A summary of major shifts in the fund's investments over the past six months. |
Investments | <Click Here> | A complete list of the fund's investments with their market values. |
Financial Statements | <Click Here> | Statements of assets and liabilities, operations, and changes in net assets, as well as financial highlights. |
Notes | <Click Here> | Notes to the financial statements. |
Report of Independent Registered Public Accounting Firm | <Click Here> | |
Trustees and Officers | <Click Here> | |
Distributions | <Click Here> | |
To view a fund's proxy voting guidelines and proxy voting record for the 12-month period ended June 30, visit http://www.fidelity.com/proxyvotingresults or visit the Securities and Exchange Commission's (SEC) web site at http://www.sec.gov. You may also call 1-800-544-8544 to request a free copy of the proxy voting guidelines.
Standard & Poor's, S&P and S&P 500 are registered service marks of The McGraw-Hill Companies, Inc. and have been licensed for use by Fidelity Distributors Corporation.
Other third party marks appearing herein are the property of their respective owners.
All other marks appearing herein are registered or unregistered trademarks or service marks of FMR LLC or an affiliated company.
Annual Report
This report and the financial statements contained herein are submitted for the general information of the shareholders of the fund. This report is not authorized for distribution to prospective investors in the fund unless preceded or accompanied by an effective prospectus.
A fund files its complete schedule of portfolio holdings with the SEC for the first and third quarters of each fiscal year on Form N-Q. Forms N-Q are available on the SEC's web site at http://www.sec.gov. A fund's Forms N-Q may be reviewed and copied at the SEC's Public Reference Room in Washington, DC. Information regarding the operation of the SEC's Public Reference Room may be obtained by calling 1-800-SEC-0330. For a complete list of a fund's portfolio holdings, view the most recent holdings listing, semiannual report, or annual report on Fidelity's web site at http://www.fidelity.com or http://www.advisor.fidelity.com, as applicable.
NOT FDIC INSURED • MAY LOSE VALUE • NO BANK GUARANTEE
Neither the fund nor Fidelity Distributors Corporation is a bank.
Annual Report
(photo_of_Edward_C_Johnson_3d)
Dear Shareholder:
Global capital markets have been predominantly positive thus far in 2010, overcoming some early volatility to continue the upward trend that began in March 2009. Year to date, U.S. stocks have seen the biggest gains, outpacing the performance of foreign equities, which has been hampered by a rebounding dollar. Financial markets are always unpredictable, of course, but there also are several time-tested investment principles that can help put the odds in your favor.
One of the basic tenets is to invest for the long term. Over time, riding out the markets' inevitable ups and downs has proven much more effective than selling into panic or chasing the hottest trend. Even missing only a few of the markets' best days can significantly diminish investor returns. Patience also affords the benefits of compounding - of earning interest on additional income or reinvested dividends and capital gains. There can be tax advantages and cost benefits to consider as well. While staying the course doesn't eliminate risk, it can considerably lessen the effect of short-term declines.
You can further manage your investing risk through diversification. And today, more than ever, geographic diversification should be taken into account. Studies indicate that asset allocation is the single most important determinant of a portfolio's long-term success. The right mix of stocks, bonds and cash - aligned to your particular risk tolerance and investment objective - is very important. Age-appropriate rebalancing is also an essential aspect of asset allocation. For younger investors, an emphasis on equities - which historically have been the best-performing asset class over time - is encouraged. As investors near their specific goal, such as retirement or sending a child to college, consideration may be given to replacing volatile assets (e.g. common stocks) with more-stable fixed investments (bonds or savings plans).
A third principle - investing regularly - can help lower the average cost of your purchases. Investing a certain amount of money each month or quarter helps ensure you won't pay for all your shares at market highs. This strategy - known as dollar cost averaging - also reduces "emotion" from investing, helping shareholders avoid selling weak performers just prior to an upswing, or chasing a hot performer just before a correction.
We invite you to contact us via the Internet, through our Investor Centers or by phone. It is our privilege to provide you the information you need to make the investments that are right for you.
Sincerely,
(The chairman's signature appears here.)
Edward C. Johnson 3d
Annual Report
Average annual total return reflects the change in the value of an investment, assuming reinvestment of the fund's dividend income and capital gains (the profits earned upon the sale of securities that have grown in value, if any) and assuming a constant rate of performance each year. The $10,000 table and the fund's returns do not reflect the deduction of taxes that a shareholder would pay on fund distributions or the redemption of fund shares. During periods of reimbursement by Fidelity, a fund's total return will be greater than it would be had the reimbursement not occurred. How a fund did yesterday is no guarantee of how it will do tomorrow.
Average Annual Total Returns
Periods ended April 30, 2010 | Past 1
year | Past 5
years | Life of
fund A |
Fidelity® Small Cap Discovery Fund | 64.12% | 10.29% | 9.82% |
A From September 26, 2000.
$10,000 Over Life of Fund
Let's say hypothetically that $10,000 was invested in Fidelity® Small Cap Discovery Fund on September 26, 2000, when the fund started. The chart shows how the value of your investment would have changed, and also shows how the Russell 2000® Index performed over the same period.
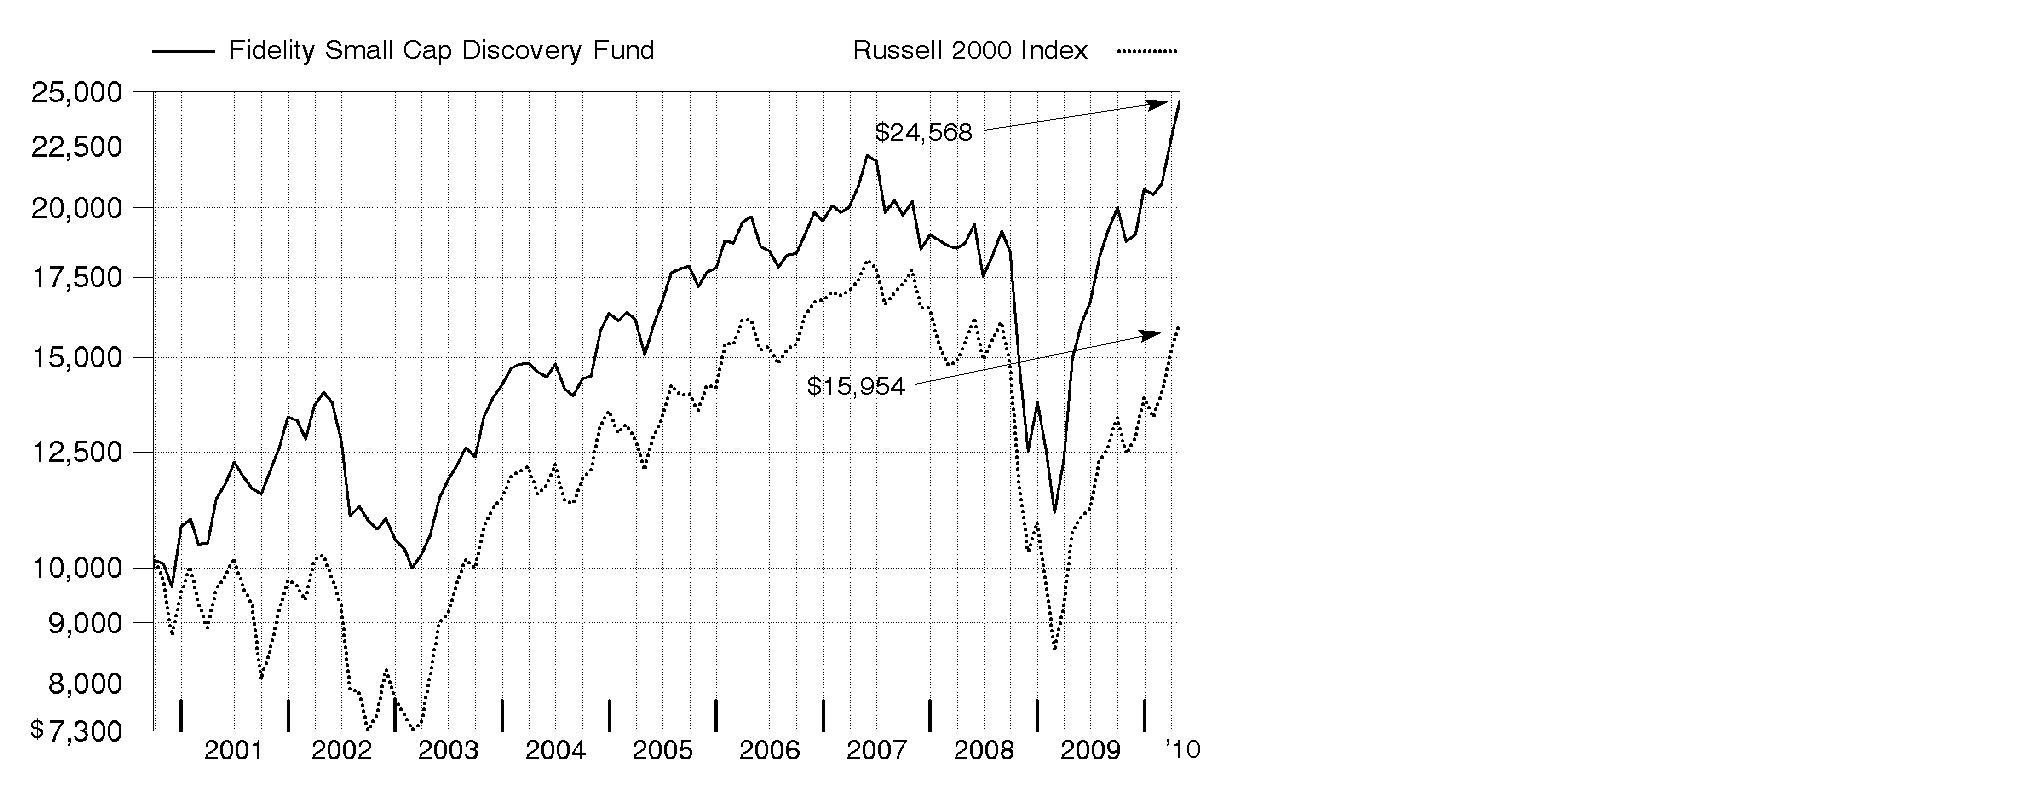
Annual Report
Market Recap: Blistering stock market declines sustained during the global economic crisis were largely offset in the 12-month period ending April 30, 2010, as unprecedented government stimulus took hold, significant corporate cost cutting paved the way for encouraging earnings reports, credit conditions improved and consumer fears began to ease. After hitting woeful lows in March 2009, stock markets experienced a steady uptrend that coincided with the near culmination of the Great Recession that began in late 2007. Although a weak labor market still lingered, by mid-April, the blue-chip Dow Jones Industrial AverageSM pushed above the 11,000 mark for the first time in 19 months, closing the period with a 38.69% gain. Impressive returns were widespread, with the S&P 500® Index rising 38.84% and the technology-laden Nasdaq Composite® Index increasing 44.63%. Small-cap stocks continued to outperform their larger counterparts, with the Russell 2000® Index returning 48.95%. Despite widening sovereign debt problems overseas, foreign equities still posted solid gains, with the MSCI® EAFE® (Europe, Australasia, Far East) Index - a measure of developed markets outside the U.S. and Canada - rising 34.56%.
Comments from Charles Myers, Portfolio Manager of Fidelity® Small Cap Discovery Fund: For the year, the fund gained 64.12%, significantly beating the Russell 2000. Relative performance was strongest in financials, especially among real estate and bank companies. Retail real estate investment trust (REIT) Developers Diversified Realty (DDR), Alexandria Real Estate Equities, which provides laboratory space, and commercial real estate manager Jones Lang LaSalle all were standouts in this sector. DDR was not in the portfolio at period end. Positioning in consumer staples was another positive, and stock selection in materials, consumer staples, information technology and health care made noteworthy contributions as well. In the materials sector, plastic products maker Spartech and specialty metals manufacturer Carpenter Technology were strong relative performers. Stock selection was weak in only one sector - consumer discretionary, where picks in services and durables/apparel companies were disappointing. On an individual basis, Associated Banc-Corp struggled with continuing credit challenges and was hurt by its issuance of additional equity, which diluted the value of the company's stock. VCA Antech, which provides veterinary services and also sells animal-related medical technology products, was hurt by the recession's effects on veterinary-care spending. A small position in bank holding company Western Liberty Bancorp hurt as well. A number of these names were not included in the benchmark.
The views expressed above reflect those of the portfolio manager(s) only through the end of the period as stated on the cover of this report and do not necessarily represent the views of Fidelity or any other person in the Fidelity organization. Any such views are subject to change at any time based upon market or other conditions and Fidelity disclaims any responsibility to update such views. These views may not be relied on as investment advice and, because investment decisions for a Fidelity fund are based on numerous factors, may not be relied on as an indication of trading intent on behalf of any Fidelity fund.
Annual Report
Shareholder Expense Example
As a shareholder of the Fund, you incur two types of costs: (1) transaction costs, including redemption fees, and (2) ongoing costs, including management fees and other Fund expenses. This Example is intended to help you understand your ongoing costs (in dollars) of investing in the Fund and to compare these costs with the ongoing costs of investing in other mutual funds.
The Example is based on an investment of $1,000 invested at the beginning of the period and held for the entire period (November 1, 2009 to April 30, 2010).
Actual Expenses
The first line of the accompanying table provides information about actual account values and actual expenses. You may use the information in this line, together with the amount you invested, to estimate the expenses that you paid over the period. Simply divide your account value by $1,000.00 (for example, an $8,600 account value divided by $1,000.00 = 8.6), then multiply the result by the number in the first line under the heading entitled "Expenses Paid During Period" to estimate the expenses you paid on your account during this period. A small balance maintenance fee of $12.00 that is charged once a year may apply for certain accounts with a value of less than $2,000. This fee is not included in the table below. If it was, the estimate of expenses you paid during the period would be higher, and your ending account value lower, by this amount. In addition, the Fund, as a shareholder in the underlying Fidelity Central Funds, will indirectly bear its pro-rata share of the fees and expenses incurred by the underlying Fidelity Central Funds. These fees and expenses are not included in the Fund's annualized expense ratio used to calculate the expense estimate in the table below.
Hypothetical Example for Comparison Purposes
The second line of the accompanying table provides information about hypothetical account values and hypothetical expenses based on the Fund's actual expense ratio and an assumed rate of return of 5% per year before expenses, which is not the Fund's actual return. The hypothetical account values and expenses may not be used to estimate the actual ending account balance or expenses you paid for the period. You may use this information to compare the ongoing costs of investing in the Fund and other funds. To do so, compare this 5% hypothetical example with the 5% hypothetical examples that appear in the shareholder reports of the other funds. A small balance maintenance fee of $12.00 that is charged once a year may apply for certain accounts with a value of less than $2,000. This fee is not included in the table below. If it was, the estimate of expenses you paid during the period would be higher, and your ending account value lower, by this amount. In addition, the Fund, as a shareholder in the underlying Fidelity Central Funds, will indirectly bear its pro-rata share of the fees and expenses incurred by the underlying Fidelity Central Funds. These fees and expenses are not included in the Fund's annualized expense ratio used to calculate the expense estimate in the table below.
Please note that the expenses shown in the table are meant to highlight your ongoing costs only and do not reflect any transaction costs. Therefore, the second line of the table is useful in comparing ongoing costs only, and will not help you determine the relative total costs of owning different funds. In addition, if these transactional costs were included, your costs would have been higher.
Annual Report
Shareholder Expense Example - continued
| Annualized
Expense Ratio | Beginning
Account Value
November 1, 2009 | Ending
Account Value
April 30, 2010 | Expenses Paid
During Period*
November 1, 2009 to
April 30, 2010 |
Actual | 1.05% | $ 1,000.00 | $ 1,311.60 | $ 6.02 |
Hypothetical (5% return per year before expenses) | | $ 1,000.00 | $ 1,019.59 | $ 5.26 |
* Expenses are equal to the Fund's annualized expense ratio, multiplied by the average account value over the period, multiplied by 181/365 (to reflect the one-half year period).
Annual Report
Investment Changes (Unaudited)
Top Ten Stocks as of April 30, 2010 |
| % of fund's
net assets | % of fund's net assets
6 months ago |
Superior Energy Services, Inc. | 2.9 | 2.8 |
Wright Express Corp. | 2.9 | 2.6 |
MEDNAX, Inc. | 2.8 | 2.2 |
Meritage Homes Corp. | 2.8 | 2.5 |
WESCO International, Inc. | 2.7 | 2.7 |
Platinum Underwriters Holdings Ltd. | 2.7 | 0.0 |
H&E Equipment Services, Inc. | 2.7 | 2.7 |
HNI Corp. | 2.5 | 3.2 |
TCF Financial Corp. | 2.4 | 1.2 |
Columbus McKinnon Corp. (NY Shares) | 2.4 | 0.0 |
| 26.8 | |
Top Five Market Sectors as of April 30, 2010 |
| % of fund's
net assets | % of fund's net assets
6 months ago |
Financials | 20.2 | 21.2 |
Information Technology | 16.5 | 16.5 |
Industrials | 15.4 | 16.2 |
Consumer Discretionary | 14.8 | 12.9 |
Health Care | 13.6 | 13.3 |
Asset Allocation (% of fund's net assets) |
As of April 30, 2010* | As of October 31, 2009** |
| Stocks 97.0% | | | Stocks 98.8% | |
| Convertible
Securities 0.0% | | | Convertible
Securities 1.2% | |
| Short-Term
Investments and
Net Other Assets 3.0% | | | Short-Term
Investments and
Net Other Assets 0.0% | |
* Foreign investments | 9.5% | | ** Foreign investments | 10.0% | |

Annual Report
Investments April 30, 2010
Showing Percentage of Net Assets
Common Stocks - 95.8% |
| Shares | | Value |
CONSUMER DISCRETIONARY - 13.6% |
Diversified Consumer Services - 2.8% |
Matthews International Corp. Class A | 216,200 | | $ 7,567,000 |
Regis Corp. | 459,700 | | 8,789,464 |
| | 16,356,464 |
Household Durables - 8.3% |
Ethan Allen Interiors, Inc. (d) | 385,323 | | 7,783,525 |
KB Home | 581,900 | | 10,782,607 |
Meritage Homes Corp. (a) | 680,000 | | 16,170,400 |
Tempur-Pedic International, Inc. (a) | 382,584 | | 12,893,081 |
| | 47,629,613 |
Specialty Retail - 2.5% |
Asbury Automotive Group, Inc. (a) | 440,707 | | 6,852,994 |
Tsutsumi Jewelry Co. Ltd. | 328,400 | | 7,698,678 |
| | 14,551,672 |
TOTAL CONSUMER DISCRETIONARY | | 78,537,749 |
CONSUMER STAPLES - 3.5% |
Food & Staples Retailing - 3.3% |
BJ's Wholesale Club, Inc. (a) | 292,500 | | 11,196,900 |
Casey's General Stores, Inc. | 152,900 | | 5,906,527 |
Ingles Markets, Inc. Class A | 139,900 | | 2,242,597 |
| | 19,346,024 |
Food Products - 0.2% |
Chiquita Brands International, Inc. (a) | 62,800 | | 944,512 |
TOTAL CONSUMER STAPLES | | 20,290,536 |
ENERGY - 3.0% |
Energy Equipment & Services - 2.9% |
Superior Energy Services, Inc. (a) | 624,400 | | 16,896,262 |
Oil, Gas & Consumable Fuels - 0.1% |
Berry Petroleum Co. Class A | 20,000 | | 647,400 |
TOTAL ENERGY | | 17,543,662 |
Common Stocks - continued |
| Shares | | Value |
FINANCIALS - 20.2% |
Capital Markets - 2.2% |
optionsXpress Holdings, Inc. | 533,598 | | $ 9,471,365 |
Sparx Group Co. Ltd. (a) | 19,500 | | 3,159,693 |
| | 12,631,058 |
Commercial Banks - 7.5% |
Associated Banc-Corp. | 750,412 | | 10,903,486 |
CapitalSource, Inc. | 1,280,300 | | 7,643,391 |
National Penn Bancshares, Inc. | 1,250,000 | | 9,150,000 |
TCF Financial Corp. | 744,100 | | 13,862,583 |
Western Liberty Bancorp (a) | 350,000 | | 1,960,000 |
| | 43,519,460 |
Insurance - 4.7% |
Amerisafe, Inc. (a) | 400,809 | | 6,853,834 |
Endurance Specialty Holdings Ltd. | 130,000 | | 4,790,500 |
Platinum Underwriters Holdings Ltd. | 413,200 | | 15,375,172 |
| | 27,019,506 |
Real Estate Investment Trusts - 1.4% |
Alexandria Real Estate Equities, Inc. (d) | 110,000 | | 7,789,100 |
Real Estate Management & Development - 0.9% |
Jones Lang LaSalle, Inc. | 66,700 | | 5,261,296 |
Thrifts & Mortgage Finance - 3.5% |
Astoria Financial Corp. | 608,120 | | 9,815,057 |
Washington Federal, Inc. | 495,000 | | 10,182,150 |
| | 19,997,207 |
TOTAL FINANCIALS | | 116,217,627 |
HEALTH CARE - 13.6% |
Health Care Providers & Services - 13.6% |
Centene Corp. (a) | 323,700 | | 7,412,730 |
Chemed Corp. | 216,900 | | 11,931,669 |
MEDNAX, Inc. (a) | 298,600 | | 16,405,084 |
Providence Service Corp. (a) | 525,889 | | 8,735,016 |
PSS World Medical, Inc. (a)(d) | 365,000 | | 8,551,950 |
Team Health Holdings, Inc. | 837,453 | | 13,164,761 |
VCA Antech, Inc. (a) | 425,000 | | 12,095,500 |
| | 78,296,710 |
Common Stocks - continued |
| Shares | | Value |
INDUSTRIALS - 15.4% |
Commercial Services & Supplies - 3.9% |
HNI Corp. (d) | 464,000 | | $ 14,402,560 |
United Stationers, Inc. (a) | 135,000 | | 8,264,700 |
| | 22,667,260 |
Machinery - 4.4% |
Blount International, Inc. (a) | 721,000 | | 8,089,620 |
Columbus McKinnon Corp. (NY Shares) (a) | 758,817 | | 13,681,471 |
Nippon Thompson Co. Ltd. | 493,000 | | 3,374,843 |
| | 25,145,934 |
Trading Companies & Distributors - 7.1% |
H&E Equipment Services, Inc. (a) | 1,300,470 | | 15,358,551 |
Interline Brands, Inc. (a) | 478,191 | | 9,951,155 |
WESCO International, Inc. (a) | 385,000 | | 15,638,700 |
| | 40,948,406 |
TOTAL INDUSTRIALS | | 88,761,600 |
INFORMATION TECHNOLOGY - 16.5% |
Communications Equipment - 3.4% |
Polycom, Inc. (a) | 340,000 | | 11,067,000 |
ViaSat, Inc. (a) | 240,000 | | 8,508,000 |
| | 19,575,000 |
Electronic Equipment & Components - 3.9% |
Diploma PLC | 2,050,000 | | 6,974,529 |
Macnica, Inc. | 175,700 | | 4,062,817 |
Ryoyo Electro Corp. | 342,400 | | 3,492,167 |
SYNNEX Corp. (a) | 298,585 | | 8,187,201 |
| | 22,716,714 |
Internet Software & Services - 0.9% |
DealerTrack Holdings, Inc. (a) | 337,009 | | 5,139,387 |
IT Services - 2.9% |
Wright Express Corp. (a) | 485,875 | | 16,505,174 |
Semiconductors & Semiconductor Equipment - 1.0% |
Miraial Co. Ltd. | 183,000 | | 5,788,278 |
Software - 4.4% |
MICROS Systems, Inc. (a) | 210,000 | | 7,803,600 |
Common Stocks - continued |
| Shares | | Value |
INFORMATION TECHNOLOGY - continued |
Software - continued |
Monotype Imaging Holdings, Inc. (a) | 856,788 | | $ 8,944,867 |
Radiant Systems, Inc. (a) | 625,000 | | 8,793,750 |
| | 25,542,217 |
TOTAL INFORMATION TECHNOLOGY | | 95,266,770 |
MATERIALS - 4.8% |
Chemicals - 1.2% |
Spartech Corp. (a) | 464,978 | | 6,621,287 |
Metals & Mining - 3.6% |
Carpenter Technology Corp. | 258,900 | | 10,167,003 |
RTI International Metals, Inc. (a) | 395,000 | | 10,684,750 |
| | 20,851,753 |
TOTAL MATERIALS | | 27,473,040 |
TELECOMMUNICATION SERVICES - 1.7% |
Diversified Telecommunication Services - 1.7% |
Cogent Communications Group, Inc. (a) | 985,300 | | 10,059,913 |
UTILITIES - 3.5% |
Gas Utilities - 3.5% |
Southwest Gas Corp. | 234,012 | | 7,277,773 |
UGI Corp. | 459,900 | | 12,642,651 |
| | 19,920,424 |
TOTAL COMMON STOCKS (Cost $459,190,888) | 552,368,031 |
Nonconvertible Preferred Stocks - 1.2% |
| | | |
CONSUMER DISCRETIONARY - 1.2% |
Household Durables - 1.2% |
M/I Homes, Inc. Series A, 9.75% (a) (Cost $5,011,247) | 375,873 | | 6,765,714 |
Money Market Funds - 2.0% |
| Shares | | Value |
Fidelity Cash Central Fund, 0.21% (b) | 8,643,796 | | $ 8,643,796 |
Fidelity Securities Lending Cash Central Fund, 0.22% (b)(c) | 3,189,225 | | 3,189,225 |
TOTAL MONEY MARKET FUNDS (Cost $11,833,021) | 11,833,021 |
TOTAL INVESTMENT PORTFOLIO - 99.0% (Cost $476,035,156) | | 570,966,766 |
NET OTHER ASSETS - 1.0% | | 5,665,554 |
NET ASSETS - 100% | $ 576,632,320 |
Legend |
(a) Non-income producing |
(b) Affiliated fund that is available only to investment companies and other accounts managed by Fidelity Investments. The rate quoted is the annualized seven-day yield of the fund at period end. A complete unaudited listing of the fund's holdings as of its most recent quarter end is available upon request. |
(c) Investment made with cash collateral received from securities on loan. |
(d) Security or a portion of the security is on loan at period end. |
Affiliated Central Funds |
Information regarding fiscal year to date income earned by the Fund from investments in Fidelity Central Funds is as follows: |
Fund | Income earned |
Fidelity Cash Central Fund | $ 13,594 |
Fidelity Securities Lending Cash Central Fund | 25,669 |
Total | $ 39,263 |
Other Information |
The following is a summary of the inputs used, as of April 30, 2010, involving the Fund's assets and liabilities carried at value. The inputs or methodology used for valuing securities may not be an indication of the risk associated with investing in those securities. For more information on valuation inputs, and their aggregation into the levels used in the table below, please refer to the Security Valuation section in the accompanying Notes to Financial Statements. |
Valuation Inputs at Reporting Date: |
Description | Total | Level 1 | Level 2 | Level 3 |
Investments in Securities: | | | | |
Equities: | | | | |
Consumer Discretionary | $ 85,303,463 | $ 85,303,463 | $ - | $ - |
Consumer Staples | 20,290,536 | 20,290,536 | - | - |
Energy | 17,543,662 | 17,543,662 | - | - |
Financials | 116,217,627 | 114,257,627 | 1,960,000 | - |
Health Care | 78,296,710 | 78,296,710 | - | - |
Industrials | 88,761,600 | 88,761,600 | - | - |
Information Technology | 95,266,770 | 88,292,241 | 6,974,529 | - |
Materials | 27,473,040 | 27,473,040 | - | - |
Telecommunication Services | 10,059,913 | 10,059,913 | - | - |
Utilities | 19,920,424 | 19,920,424 | - | - |
Money Market Funds | 11,833,021 | 11,833,021 | - | - |
Total Investments in Securities: | $ 570,966,766 | $ 562,032,237 | $ 8,934,529 | $ - |
Income Tax Information |
At April 30, 2010, the fund had a capital loss carryforward of approximately $2,188,982 all of which will expire on April 30, 2017. |
See accompanying notes which are an integral part of the financial statements.
Annual Report
Statement of Assets and Liabilities
April 30, 2010 |
Assets | | |
Investment in securities, at value (including securities loaned of $2,998,210) - See accompanying schedule: Unaffiliated issuers (cost $464,202,135) | $ 559,133,745 | |
Fidelity Central Funds (cost $11,833,021) | 11,833,021 | |
Total Investments (cost $476,035,156) | | $ 570,966,766 |
Foreign currency held at value (cost $36,282) | | 36,282 |
Receivable for investments sold | | 13,725,351 |
Receivable for fund shares sold | | 9,980,068 |
Dividends receivable | | 194,498 |
Distributions receivable from Fidelity Central Funds | | 2,980 |
Prepaid expenses | | 332 |
Receivable from investment adviser for expense reductions | | 44,757 |
Other receivables | | 2,779 |
Total assets | | 594,953,813 |
| | |
Liabilities | | |
Payable for investments purchased | $ 14,183,872 | |
Payable for fund shares redeemed | 447,817 | |
Accrued management fee | 335,240 | |
Other affiliated payables | 117,683 | |
Other payables and accrued expenses | 47,656 | |
Collateral on securities loaned, at value | 3,189,225 | |
Total liabilities | | 18,321,493 |
| | |
Net Assets | | $ 576,632,320 |
Net Assets consist of: | | |
Paid in capital | | $ 484,340,814 |
Accumulated undistributed net realized gain (loss) on investments and foreign currency transactions | | (2,638,839) |
Net unrealized appreciation (depreciation) on investments and assets and liabilities in foreign currencies | | 94,930,345 |
Net Assets, for 31,293,967 shares outstanding | | $ 576,632,320 |
Net Asset Value, offering price and redemption price per share ($576,632,320 ÷ 31,293,967 shares) | | $ 18.43 |
See accompanying notes which are an integral part of the financial statements.
Annual Report
Statement of Operations
Year ended April 30, 2010 |
Investment Income | | |
Dividends | | $ 2,599,674 |
Interest | | 511,204 |
Income from Fidelity Central Funds | | 39,263 |
Total income | | 3,150,141 |
| | |
Expenses | | |
Management fee
Basic fee | $ 1,952,195 | |
Performance adjustment | 395,955 | |
Transfer agent fees | 873,905 | |
Accounting and security lending fees | 108,924 | |
Custodian fees and expenses | 14,434 | |
Independent trustees' compensation | 1,455 | |
Registration fees | 53,379 | |
Audit | 52,116 | |
Legal | 1,044 | |
Miscellaneous | 2,482 | |
Total expenses before reductions | 3,455,889 | |
Expense reductions | (584,115) | 2,871,774 |
Net investment income (loss) | | 278,367 |
Realized and Unrealized Gain (Loss) Net realized gain (loss) on: | | |
Investment securities: | | |
Unaffiliated issuers | 22,860,628 | |
Foreign currency transactions | 3,607 | |
Total net realized gain (loss) | | 22,864,235 |
Change in net unrealized appreciation (depreciation) on: Investment securities | 110,793,767 | |
Assets and liabilities in foreign currencies | (1,146) | |
Total change in net unrealized appreciation (depreciation) | | 110,792,621 |
Net gain (loss) | | 133,656,856 |
Net increase (decrease) in net assets resulting from operations | | $ 133,935,223 |
See accompanying notes which are an integral part of the financial statements.
Annual Report
Financial Statements - continued
Statement of Changes in Net Assets
| Year ended
April 30,
2010 | Year ended
April 30,
2009 |
Increase (Decrease) in Net Assets | | |
Operations | | |
Net investment income (loss) | $ 278,367 | $ 1,304,653 |
Net realized gain (loss) | 22,864,235 | (24,844,739) |
Change in net unrealized appreciation (depreciation) | 110,792,621 | (12,268,692) |
Net increase (decrease) in net assets resulting
from operations | 133,935,223 | (35,808,778) |
Distributions to shareholders from net investment income | (810,611) | (1,028,843) |
Share transactions
Proceeds from sales of shares | 379,647,271 | 62,779,497 |
Reinvestment of distributions | 806,710 | 1,028,576 |
Cost of shares redeemed | (79,202,856) | (73,955,839) |
Net increase (decrease) in net assets resulting from share transactions | 301,251,125 | (10,147,766) |
Redemption fees | 159,632 | 87,448 |
Total increase (decrease) in net assets | 434,535,369 | (46,897,939) |
| | |
Net Assets | | |
Beginning of period | 142,096,951 | 188,994,890 |
End of period (including undistributed net investment income of $0 and undistributed net investment income of $287,878, respectively) | $ 576,632,320 | $ 142,096,951 |
Other Information Shares | | |
Sold | 23,941,612 | 5,422,699 |
Issued in reinvestment of distributions | 57,680 | 109,891 |
Redeemed | (5,313,232) | (6,237,844) |
Net increase (decrease) | 18,686,060 | (705,254) |
See accompanying notes which are an integral part of the financial statements.
Annual Report
Financial Highlights
Years ended April 30, | 2010 | 2009 | 2008 | 2007 | 2006 |
Selected Per-Share Data | | | | | |
Net asset value, beginning of period | $ 11.27 | $ 14.20 | $ 17.18 | $ 18.02 | $ 14.65 |
Income from Investment Operations | | | | | |
Net investment income (loss) B | .02 | .11 | .04 | (.02) | (.05) |
Net realized and unrealized gain (loss) | 7.18 | (2.96) | (1.85) | .97 | 4.35 |
Total from investment operations | 7.20 | (2.85) | (1.81) | .95 | 4.30 |
Distributions from net investment income | (.05) | (.09) | (.07) | - | (.04) |
Distributions from net realized gain | - | - | (1.11) | (1.79) | (.90) |
Total distributions | (.05) | (.09) | (1.18) | (1.79) | (.94) |
Redemption fees added to paid in capital B | .01 | .01 | .01 | - F | .01 |
Net asset value, end of period | $ 18.43 | $ 11.27 | $ 14.20 | $ 17.18 | $ 18.02 |
Total Return A | 64.12% | (19.91)% | (10.55)% | 6.36% | 30.51% |
Ratios to Average Net Assets C,E | | | | | |
Expenses before reductions | 1.26% | 1.13% | 1.04% | 1.04% | 1.06% |
Expenses net of fee waivers, if any | 1.05% | 1.05% | 1.04% | 1.04% | 1.05% |
Expenses net of all reductions | 1.04% | 1.05% | 1.03% | 1.02% | .99% |
Net investment income (loss) | .10% | .91% | .25% | (.12)% | (.29)% |
Supplemental Data | | | | | |
Net assets, end of period (000 omitted) | $ 576,632 | $ 142,097 | $ 188,995 | $ 245,564 | $ 247,040 |
Portfolio turnover rate D | 37% | 114% | 140% | 106% | 191% |
A Total returns would have been lower had certain expenses not been reduced during the periods shown.
B Calculated based on average shares outstanding during the period.
C Fees and expenses of the underlying Fidelity Central Funds are not included in the Fund's expense ratio. The Fund indirectly bears its proportionate share of the expenses of any underlying Fidelity Central Funds.
D Amount does not include the portfolio activity of any underlying Fidelity Central Funds.
E Expense ratios reflect operating expenses of the Fund. Expenses before reductions do not reflect amounts reimbursed by the investment adviser or reductions from brokerage service arrangements or reductions from other expense offset arrangements and do not represent the amount paid by the Fund during periods when reimbursements or reductions occur. Expenses net of fee waivers reflect expenses after reimbursement by the investment adviser but prior to reductions from brokerage service arrangements or other expense offset arrangements. Expenses net of all reductions represent the net expenses paid by the Fund.
F Amount represents less than $.01 per share.
See accompanying notes which are an integral part of the financial statements.
Annual Report
Notes to Financial Statements
For the period ended April 30, 2010
1. Organization.
Fidelity Small Cap Discovery Fund (the Fund) (formerly Fidelity Small Cap Retirement Fund) is a fund of Fidelity Commonwealth Trust (the trust) and is authorized to issue an unlimited number of shares. The trust is registered under the Investment Company Act of 1940, as amended (the 1940 Act), as an open-end management investment company organized as a Massachusetts business trust. The Fund's investments in emerging markets can be subject to social, economic, regulatory, and political uncertainties and can be extremely volatile.
2. Investments in Fidelity Central Funds.
The Fund may invest in Fidelity Central Funds, which are open-end investment companies available only to other investment companies and accounts managed by Fidelity Management & Research Company (FMR) and its affiliates. The Fund's Schedule of Investments lists each of the Fidelity Central Funds held as of period end, if any, as an investment of the Fund, but does not include the underlying holdings of each Fidelity Central Fund. As an Investing Fund, the Fund indirectly bears its proportionate share of the expenses of the underlying Fidelity Central Funds.
The Money Market Central Funds seek preservation of capital and current income and are managed by Fidelity Investments Money Management, Inc. (FIMM), an affiliate of FMR.
A complete unaudited list of holdings for each Fidelity Central Fund is available upon request or at the Securities and Exchange Commission (the SEC) web site at www.sec.gov. In addition, the financial statements of the Fidelity Central Funds which are not covered by the Fund's Report of Independent Registered Public Accounting Firm, are available on the SEC web site or upon request.
3. Significant Accounting Policies.
The financial statements have been prepared in conformity with accounting principles generally accepted in the United States of America, which require management to make certain estimates and assumptions at the date of the financial statements. Actual results could differ from those estimates. The following summarizes the significant accounting policies of the Fund:
Security Valuation. Investments are valued as of 4:00 p.m. Eastern time on the last calendar day of the period. The Fund uses independent pricing services approved by the Board of Trustees to value its investments. When current market prices or quotations are not readily available or reliable, valuations may be determined in good faith in accordance with procedures adopted by the Board of Trustees. Factors used in determining value may include market or security specific events. The frequency with which these
Annual Report
3. Significant Accounting Policies - continued
Security Valuation - continued
procedures are used cannot be predicted and they may be utilized to a significant extent. The value used for net asset value (NAV) calculation under these procedures may differ from published prices for the same securities.
The Fund categorizes the inputs to valuation techniques used to value its investments into a disclosure hierarchy consisting of three levels as shown below.
Level 1 - quoted prices in active markets for identical investments
Level 2 - other significant observable inputs (including quoted prices for similar investments, interest rates, prepayment speeds, etc.)
Level 3 - unobservable inputs (including the fund's own assumptions based on the best information available)
Changes in valuation techniques may result in transfers in or out of an assigned level within the disclosure hierarchy. The aggregate value of investments by input level, as of April 30, 2010 is included at the end of the Fund's Schedule of Investments. Valuation techniques used to value the Fund's investments by major category are as follows.
Equity securities, including restricted securities, for which market quotations are readily available, are valued at the last reported sale price or official closing price as reported by an independent pricing service on the primary market or exchange on which they are traded and are categorized as Level 1 in the hierarchy. In the event there were no sales during the day or closing prices are not available, securities are valued at the last quoted bid price or may be valued using the last available price and are generally categorized as Level 2 in the hierarchy. For foreign equity securities, when significant market or security specific events arise, comparisons to the valuation of American Depositary Receipts (ADRs), futures contracts, Exchange-traded funds (ETFs) and certain indexes as well as quoted prices for similar securities are used and are categorized as Level 2 in the hierarchy in these circumstances. Utilizing these techniques may result in transfers between Level 1 and Level 2. For restricted equity securities and private placements where observable inputs are limited, assumptions about market activity and risk are used and are categorized as Level 3 in the hierarchy.
Investments in open-end mutual funds, including the Fidelity Central Funds, are valued at their closing net asset value each business day and are categorized as Level 1 in the hierarchy. Short-term securities with remaining maturities of sixty days or less for which quotations are not readily available are valued at amortized cost, which approximates value and are categorized as Level 2 in the hierarchy.
Annual Report
Notes to Financial Statements - continued
3. Significant Accounting Policies - continued
Foreign Currency. The Fund uses foreign currency contracts to facilitate transactions in foreign-denominated securities. Losses from these transactions may arise from changes in the value of the foreign currency or if the counterparties do not perform under the contracts' terms.
Foreign-denominated assets, including investment securities, and liabilities are translated into U.S. dollars at the exchange rate at period end. Purchases and sales of investment securities, income and dividends received and expenses denominated in foreign currencies are translated into U.S. dollars at the exchange rate in effect on the transaction date.
The effects of exchange rate fluctuations on investments are included with the net realized and unrealized gain (loss) on investment securities. Other foreign currency transactions resulting in realized and unrealized gain (loss) are disclosed separately.
Investment Transactions and Income. For financial reporting purposes, the Fund's investment holdings and NAV include trades executed through the end of the last business day of the period. The NAV per share for processing shareholder transactions is calculated as of the close of business of the New York Stock Exchange (NYSE), normally 4:00 p.m. Eastern time and includes trades executed through the end of the prior business day. Gains and losses on securities sold are determined on the basis of identified cost and may include proceeds received from litigation. Dividend income is recorded on the ex-dividend date, except for certain dividends from foreign securities where the ex-dividend date may have passed, which are recorded as soon as the Fund is informed of the ex-dividend date. Non-cash dividends included in dividend income, if any, are recorded at the fair market value of the securities received. Distributions received on securities that represent a return of capital or capital gain are recorded as a reduction of cost of investments and/or as a realized gain. The Fund estimates the components of distributions received that may be considered return of capital distributions or capital gain distributions. Interest income and distributions from the Fidelity Central Funds are accrued as earned. Interest income includes coupon interest and amortization of premium and accretion of discount on debt securities. Investment income is recorded net of foreign taxes withheld where recovery of such taxes is uncertain.
Expenses. Most expenses of the trust can be directly attributed to a fund. Expenses which cannot be directly attributed are apportioned among each Fund in the trust. Expense estimates are accrued in the period to which they relate and adjustments are made when actual amounts are known.
Income Tax Information and Distributions to Shareholders. Each year, the Fund intends to qualify as a regulated investment company by distributing substantially all of its taxable income and realized gains under Subchapter M of the Internal Revenue Code
Annual Report
3. Significant Accounting Policies - continued
Income Tax Information and Distributions to Shareholders - continued
and filing its U.S. federal tax return. As a result, no provision for income taxes is required. As of April 30, 2010, the Fund did not have any unrecognized tax benefits in the accompanying financial statements. A Fund's federal tax return is subject to examination by the Internal Revenue Service (IRS) for a period of three years. Foreign taxes are provided for based on the Fund's understanding of the tax rules and rates that exist in the foreign markets in which it invests.
Distributions are recorded on the ex-dividend date. Income and capital gain distributions are determined in accordance with income tax regulations, which may differ from generally accepted accounting principles.
Capital accounts within the financial statements are adjusted for permanent book-tax differences. These adjustments have no impact on net assets or the results of operations. Temporary book-tax differences will reverse in a subsequent period.
Book-tax differences are primarily due to the short-term gain distributions from the Underlying Funds, capital loss carryforwards, losses deferred due to wash sales and excise tax regulations.
The federal tax cost of investment securities and unrealized appreciation (depreciation) as of period end were as follows:
Gross unrealized appreciation | $ 105,009,312 |
Gross unrealized depreciation | (10,527,559) |
Net unrealized appreciation (depreciation) | $ 94,481,753 |
Tax Cost | $ 476,485,013 |
The tax-based components of distributable earnings as of period end were as follows:
Capital loss carryforward | $ (2,188,982) |
Net unrealized appreciation (depreciation) | $ 94,480,488 |
The tax character of distributions paid was as follows:
| April 30, 2010 | April 30, 2009 |
Ordinary Income | $ 810,611 | $ 1,028,843 |
Short-Term Trading (Redemption) Fees. Shares held in the Fund less than 90 days are subject to a redemption fee equal to 1.50% of the proceeds of the redeemed shares. All redemption fees, including any estimated redemption fees paid by FMR, are retained by the Fund and accounted for as an addition to paid in capital.
Annual Report
Notes to Financial Statements - continued
4. Purchases and Sales of Investments.
Purchases and sales of securities, other than short-term securities, aggregated $386,318,699 and $101,749,957, respectively.
5. Fees and Other Transactions with Affiliates.
Management Fee. FMR and its affiliates provide the Fund with investment management related services for which the Fund pays a monthly management fee. The management fee is the sum of an individual fund fee rate that is based on an annual rate of .45% of the Fund's average net assets and a group fee rate that averaged .26% during the period. The group fee rate is based upon the average net assets of all the mutual funds advised by FMR. The group fee rate decreases as assets under management increase and increases as assets under management decrease. In addition, the management fee is subject to a performance adjustment (up to a maximum of ± .20% of the Fund's average net assets over a 36 month performance period). The upward or downward adjustment to the management fee is based on the Fund's relative investment performance as compared to an appropriate benchmark index. For the period, the total annual management fee rate, including the performance adjustment, was .85% of the Fund's average net assets.
Transfer Agent Fees. Fidelity Investments Institutional Operations Company, Inc. (FIIOC), an affiliate of FMR, is the Fund's transfer, dividend disbursing and shareholder servicing agent. FIIOC receives account fees and asset-based fees that vary according to account size and type of account. FIIOC pays for typesetting, printing and mailing of shareholder reports, except proxy statements. For the period, the transfer agent fees were equivalent to an annual rate of .32% of average net assets.
Accounting and Security Lending Fees. Fidelity Service Company, Inc. (FSC), an affiliate of FMR, maintains the Fund's accounting records. The accounting fee is based on the level of average net assets for the month. Under a separate contract, FSC administers the security lending program. The security lending fee is based on the number and duration of lending transactions.
Brokerage Commissions. The Fund placed a portion of its portfolio transactions with brokerage firms which are affiliates of the investment adviser. The commissions paid to these affiliated firms were $5,532 for the period.
6. Committed Line of Credit.
The Fund participates with other funds managed by FMR in a $3.75 billion credit facility (the "line of credit") to be utilized for temporary or emergency purposes to fund shareholder redemptions or for other short-term liquidity purposes. The Fund has agreed to pay commitment fees on its pro-rata portion of the line of credit, which amounted to $1,004 and is reflected in Miscellaneous Expense on the Statement of Operations. During the period, there were no borrowings on this line of credit.
Annual Report
7. Security Lending.
The Fund lends portfolio securities from time to time in order to earn additional income. On the settlement date of the loan, the Fund receives collateral (in the form of U.S. Treasury obligations, letters of credit and/or cash) against the loaned securities and maintains collateral in an amount not less than 100% of the market value of the loaned securities during the period of the loan. The market value of the loaned securities is determined at the close of business of the Fund and any additional required collateral is delivered to the Fund on the next business day. If the borrower defaults on its obligation to return the securities loaned because of insolvency or other reasons, a fund could experience delays and costs in recovering the securities loaned or in gaining access to the collateral. Any cash collateral received is invested in the Fidelity Securities Lending Cash Central Fund. The value of loaned securities and cash collateral at period end are disclosed on the Fund's Statement of Assets and Liabilities. Security lending income represents the income earned on investing cash collateral, less fees and expenses associated with the loan, plus any premium payments that may be received on the loan of certain types of securities. Security lending income is presented in the Statement of Operations as a component of income from Fidelity Central Funds. Net income from lending portfolio securities during the period amounted to $25,669.
8. Expense Reductions.
FMR voluntarily agreed to reimburse the Fund to the extent annual operating expenses exceeded 1.05% of average net assets. Some expenses, for example interest expense, including commitment fees, are excluded from this reimbursement. During the period this reimbursement reduced the Fund's expenses by $577,384.
Many of the brokers with whom FMR places trades on behalf of the Fund provided services to the Fund in addition to trade execution. These services included payments of certain expenses on behalf of the Fund totaling $6,731 for the period.
9. Other.
The Fund's organizational documents provide former and current trustees and officers with a limited indemnification against liabilities arising in connection with the performance of their duties to the Fund. In the normal course of business, the Fund may also enter into contracts that provide general indemnifications. The Fund's maximum exposure under these arrangements is unknown as this would be dependent on future claims that may be made against the Fund. The risk of material loss from such claims is considered remote.
Annual Report
To the Trustees of Fidelity Commonwealth Trust and Shareholders of Fidelity Small Cap Discovery Fund:
We have audited the accompanying statement of assets and liabilities of Fidelity Small Cap Discovery Fund (the Fund), a fund of Fidelity Commonwealth Trust, including the schedule of investments, as of April 30, 2010, and the related statement of operations for the year then ended, the statement of changes in net assets for each of the two years in the period then ended, and the financial highlights for each of the five years in the period then ended. These financial statements and financial highlights are the responsibility of the Fund's management. Our responsibility is to express an opinion on these financial statements and financial highlights based on our audits.
We conducted our audits in accordance with standards of the Public Company Accounting Oversight Board (United States). Those standards require that we plan and perform the audit to obtain reasonable assurance about whether the financial statements and financial highlights are free of material misstatement. The Fund is not required to have, nor were we engaged to perform, an audit of its internal control over financial reporting. Our audits included consideration of internal control over financial reporting as a basis for designing audit procedures that are appropriate in the circumstances, but not for the purpose of expressing an opinion on the effectiveness of the Fund's internal control over financial reporting. Accordingly, we express no such opinion. An audit also includes examining, on a test basis, evidence supporting the amounts and disclosures in the financial statements, assessing the accounting principles used and significant estimates made by management, as well as evaluating the overall financial statement presentation. Our procedures included confirmation of securities owned as of April 30, 2010, by correspondence with the custodians and brokers; where replies were not received from brokers, we performed other auditing procedures. We believe that our audits provide a reasonable basis for our opinion.
In our opinion, the financial statements and financial highlights referred to above present fairly, in all material respects, the financial position of Fidelity Small Cap Discovery Fund as of April 30, 2010, the results of its operations for the year then ended, the changes in its net assets for each of the two years in the period then ended, and the financial highlights for each of the five years in the period then ended, in conformity with accounting principles generally accepted in the United States of America.
/s/ Deloitte & Touche LLP
DELOITTE & TOUCHE LLP
Boston, Massachusetts
June 17, 2010
Annual Report
The Trustees, Member of the Advisory Board, and executive officers of the trust and fund, as applicable, are listed below. The Board of Trustees governs the fund and is responsible for protecting the interests of shareholders. The Trustees are experienced executives who meet periodically throughout the year to oversee the fund's activities, review contractual arrangements with companies that provide services to the fund, oversee management of the risks associated with such activities and contractual arrangements, and review the fund's performance. Except for James C. Curvey, each of the Trustees oversees 222 funds advised by FMR or an affiliate. Mr. Curvey oversees 411 funds advised by FMR.
The Trustees hold office without limit in time except that (a) any Trustee may resign; (b) any Trustee may be removed by written instrument, signed by at least two-thirds of the number of Trustees prior to such removal; (c) any Trustee who requests to be retired or who has become incapacitated by illness or injury may be retired by written instrument signed by a majority of the other Trustees; and (d) any Trustee may be removed at any special meeting of shareholders by a two-thirds vote of the outstanding voting securities of the trust. Each Trustee who is not an interested person (as defined in the 1940 Act) (Independent Trustee), shall retire not later than the last day of the calendar year in which his or her 72nd birthday occurs. The Independent Trustees may waive this mandatory retirement age policy with respect to individual Trustees. The executive officers and Advisory Board Member hold office without limit in time, except that any officer and Advisory Board Member may resign or may be removed by a vote of a majority of the Trustees at any regular meeting or any special meeting of the Trustees. Except as indicated, each individual has held the office shown or other offices in the same company for the past five years.
Experience, Skills, Attributes, and Qualifications of the Fund's Trustees. The Governance and Nominating Committee has adopted a statement of policy that describes the experience, qualifications, attributes, and skills that are necessary and desirable for potential Independent Trustee candidates (Statement of Policy). The Board believes that each Trustee satisfied at the time he or she was initially elected or appointed a Trustee, and continues to satisfy, the standards contemplated by the Statement of Policy. The Governance and Nominating Committee also engages professional search firms to help identify potential Independent Trustee candidates who have the experience, qualifications, attributes, and skills consistent with the Statement of Policy. From time to time, additional criteria based on the composition and skills of the current Independent Trustees, as well as experience or skills that may be appropriate in light of future changes to board composition, business conditions, and regulatory or other developments, have also been considered by the professional search firms and the Governance and Nominating Committee. In addition, the Board takes into account the Trustees' commitment and participation in Board and committee meetings, as well as their leadership of standing and ad hoc committees throughout their tenure.
In determining that a particular Trustee was and continues to be qualified to serve as a Trustee, the Board has considered a variety of criteria, none of which, in isolation, was controlling. The Board believes that, collectively, the Trustees have balanced and diverse experience, qualifications, attributes, and skills, which allow the Board to operate effectively in governing the fund and protecting the interests of shareholders. Information about the specific experience, skills, attributes, and qualifications of each Trustee, which in each case led to the Board's conclusion that the Trustee should serve (or continue to serve) as a trustee of the fund, is provided below.
Annual Report
Trustees and Officers - continued
Board Structure and Oversight Function. Edward C. Johnson 3d is an interested person (as defined in the 1940 Act) and currently serves as Chairman. The Trustees have determined that an interested Chairman is appropriate and benefits shareholders because an interested Chairman has a personal and professional stake in the quality and continuity of services provided to the fund. Independent Trustees exercise their informed business judgment to appoint an individual of their choosing to serve as Chairman, regardless of whether the Trustee happens to be independent or a member of management. The Independent Trustees have determined that they can act independently and effectively without having an Independent Trustee serve as Chairman and that a key structural component for assuring that they are in a position to do so is for the Independent Trustees to constitute a substantial majority for the Board. The Independent Trustees also regularly meet in executive session. Ned C. Lautenbach serves as Chairman of the Independent Trustees and as such (i) acts as a liaison between the Independent Trustees and management with respect to matters important to the Independent Trustees and (ii) with management prepares agendas for Board meetings.
Fidelity funds are overseen by different Boards of Trustees. The fund's Board oversees Fidelity's equity and high income funds and another Board oversees Fidelity's investment-grade bond, money market, and asset allocation funds. The asset allocation funds may invest in Fidelity funds overseen by the fund's Board. The use of separate Boards, each with its own committee structure, allows the Trustees of each group of Fidelity funds to focus on the unique issues of the funds they oversee, including common research, investment, and operational issues. On occasion, the separate Boards establish joint committees to address issues of overlapping consequences for the Fidelity funds overseen by each Board.
The Trustees operate using a system of committees to facilitate the timely and efficient consideration of all matters of importance to the Trustees, the fund, and fund shareholders and to facilitate compliance with legal and regulatory requirements and oversight of the fund's activities and associated risks. The Board, acting through its committees, has charged FMR and its affiliates with (i) identifying events or circumstances the occurrence of which could have demonstrably adverse effects on the fund's business and/or reputation; (ii) implementing processes and controls to lessen the possibility that such events or circumstances occur or to mitigate the effects of such events or circumstances if they do occur; and (iii) creating and maintaining a system designed to evaluate continuously business and market conditions in order to facilitate the identification and implementation processes described in (i) and (ii) above. Because the day-to-day operations and activities of the fund are carried out by or through FMR, its affiliates and other service providers, the fund's exposure to risks is mitigated but not eliminated by the processes overseen by the Trustees. While each of the Board's committees has responsibility for overseeing different aspects of the fund's activities, oversight is exercised primarily through the Operations, Audit, and Compliance Committees. Appropriate personnel, including but not limited to the fund's Chief Compliance Officer (CCO), FMR's internal auditor, the independent accountants, the fund's Treasurer and portfolio management personnel, make periodic reports to the Board's committees, as appropriate. The responsibilities of each committee, including their oversight responsibilities, are described further under "Standing Committees of the Fund's Trustees."
Annual Report
The fund's Statement of Additional Information (SAI) includes more information about the Trustees. To request a free copy, call Fidelity at 1-800-544-8544.
Interested Trustees*:
Correspondence intended for each Trustee who is an interested person may be sent to Fidelity Investments, 82 Devonshire Street, Boston, Massachusetts 02109.
Name, Age; Principal Occupations and Other Relevant Experience+ |
Edward C. Johnson 3d (79) |
| Year of Election or Appointment: 1974 Mr. Johnson is Trustee and Chairman of the Board of Trustees of certain Trusts. Mr. Johnson serves as Chief Executive Officer, Chairman, and a Director of FMR LLC; Chairman and a Director of FMR; Chairman and a Director of Fidelity Research & Analysis Company (FRAC); Chairman and a Director of Fidelity Investments Money Management, Inc.; and Chairman and a Director of FMR Co., Inc. In addition, Mr. Johnson serves as Chairman and Director of FIL Limited. Previously, Mr. Johnson served as President of FMR LLC (2006-2007). |
James C. Curvey (74) |
| Year of Election or Appointment: 2007 Mr. Curvey also serves as Trustee (2007-present) of other investment companies advised by FMR. Mr. Curvey is a Director of FMR and FMR Co., Inc. (2007-present). Mr. Curvey is also Vice Chairman (2006-present) and Director of FMR LLC. In addition, Mr. Curvey serves as an Overseer for the Boston Symphony Orchestra and a member of the Trustees of Villanova University. |
* Trustees have been determined to be "Interested Trustees" by virtue of, among other things, their affiliation with the trust or various entities under common control with FMR.
+ The information above includes each Trustee's principal occupation during the last five years and other information relating to the experience, attributes, and skills relevant to each Trustee's qualifications to serve as a Trustee, which led to the conclusion that each Trustee should serve as a Trustee for the fund.
Annual Report
Trustees and Officers - continued
Independent Trustees:
Correspondence intended for each Independent Trustee (that is, the Trustees other than the Interested Trustees) may be sent to Fidelity Investments, P.O. Box 55235, Boston, Massachusetts 02205-5235.
Name, Age; Principal Occupations and Other Relevant Experience+ |
Dennis J. Dirks (61) |
| Year of Election or Appointment: 2005 Prior to his retirement in May 2003, Mr. Dirks was Chief Operating Officer and a member of the Board of The Depository Trust & Clearing Corporation (DTCC). He also served as President, Chief Operating Officer, and Board member of The Depository Trust Company (DTC) and President and Board member of the National Securities Clearing Corporation (NSCC). In addition, Mr. Dirks served as Chief Executive Officer and Board member of the Government Securities Clearing Corporation, Chief Executive Officer and Board member of the Mortgage-Backed Securities Clearing Corporation, as a Trustee and a member of the Finance Committee of Manhattan College (2005-2008), and as a Trustee and a member of the Finance Committee of AHRC of Nassau County (2006-2008). Currently, Mr. Dirks serves as a member of the Board of Directors for The Brookville Center for Children's Services, Inc. (2009-present). |
Alan J. Lacy (56) |
| Year of Election or Appointment: 2008 Mr. Lacy serves as Senior Adviser (2007-present) of Oak Hill Capital Partners, L.P. (private equity). Mr. Lacy also served as Chief Executive Officer (2000-2005) and Vice Chairman (2005-2006) of Sears Holdings Corporation and Sears, Roebuck and Co. (retail). In addition, Mr. Lacy serves as a member of the Board of Directors of The Western Union Company (global money transfer, 2006-present) and Bristol-Myers Squibb Company (global pharmaceuticals, 2007-present). Mr. Lacy is Chairman (2008-present) and a member (2006-present) of the Board of Trustees of The National Parks Conservation Association. |
Ned C. Lautenbach (66) |
| Year of Election or Appointment: 2000 Mr. Lautenbach is Chairman of the Independent Trustees of the Equity and High Income Funds (2006-present). Mr. Lautenbach is an Advisory Partner of Clayton, Dubilier & Rice, Inc. (private equity investment, 2008-present) and was previously a Partner of Clayton, Dubilier & Rice, Inc. (1998-2008). Previously, Mr. Lautenbach was with the International Business Machines Corporation (IBM) from 1968 until his retirement in 1998. Mr. Lautenbach serves as a Director of Eaton Corporation (diversified industrial) as well as the Philharmonic Center for the Arts in Naples, Florida. Mr. Lautenbach is also a member of the Board of Trustees of Fairfield University (2005-present), as well as a member of the Council on Foreign Relations. Previously, Mr. Lautenbach served as a Director of Sony Corporation (2006-2007). |
Joseph Mauriello (65) |
| Year of Election or Appointment: 2008 Prior to his retirement in January 2006, Mr. Mauriello served in numerous senior management positions including Deputy Chairman and Chief Operating Officer (2004-2005), and Vice Chairman of Financial Services (2002-2004) of KPMG LLP US (professional services, 1965-2005). Mr. Mauriello currently serves as a member of the Board of Directors of XL Capital Ltd. (global insurance and re-insurance, 2006-present) and of Arcadia Resources Inc. (health care services and products, 2007-present). Previously, Mr. Mauriello served as a Director of the Hamilton Funds of the Bank of New York (2006-2007). |
Cornelia M. Small (65) |
| Year of Election or Appointment: 2005 Ms. Small is a member of the Board of Directors of the Teagle Foundation (2009-present). Ms. Small is also a member of the Investment Committee, and Chair (2008-present) and a member of the Board of Trustees of Smith College. In addition, Ms. Small serves on the Investment Committee of the Berkshire Taconic Community Foundation (2008-present). Previously, Ms. Small served as Chairperson of the Investment Committee (2002-2008) of Smith College. In addition, Ms. Small served as Chief Investment Officer, Director of Global Equity Investments, and a member of the Board of Directors of Scudder, Stevens & Clark and Scudder Kemper Investments. |
William S. Stavropoulos (70) |
| Year of Election or Appointment: 2002 Mr. Stavropoulos is Vice Chairman of the Independent Trustees of the Equity and High Income Funds (2006-present). Mr. Stavropoulos serves as President and Founder of the Michigan Baseball Foundation, the Great Lakes Loons (2007-present). Mr. Stavropoulos is Chairman Emeritus of the Board of Directors of The Dow Chemical Company, where he previously served in numerous senior management positions, including President, CEO (1995-2000; 2002-2004), Chairman of the Executive Committee (2000-2006), and as a member of the Board of Directors (1990-2006). Currently, Mr. Stavropoulos is a Director of Teradata Corporation (data warehousing and technology solutions, 2008-present), Chemical Financial Corporation, Maersk Inc. (industrial conglomerate), Tyco International, Inc. (multinational manufacturing and services, 2007-present), and a member of the Advisory Board for Metalmark Capital (private equity investment, 2005-present). Mr. Stavropoulos is a special advisor to Clayton, Dubilier & Rice, Inc. (private equity investment). In addition, Mr. Stavropoulos is a member of the University of Notre Dame Advisory Council for the College of Science. |
David M. Thomas (60) |
| Year of Election or Appointment: 2008 Previously, Mr. Thomas served as Executive Chairman (2005-2006) and Chairman and Chief Executive Officer (2000-2005) of IMS Health, Inc. (pharmaceutical and healthcare information solutions). In addition, Mr. Thomas serves as a member of the Board of Directors of Fortune Brands, Inc. (consumer products), and Interpublic Group of Companies, Inc. (marketing communication, 2004-present). |
Michael E. Wiley (59) |
| Year of Election or Appointment: 2008 Mr. Wiley also serves as a Director of Asia Pacific Exploration Consolidated (international oil and gas exploration and production, 2008-present), and as a member of the Board of Trustees of the University of Tulsa (2000-2006; 2007-present). Mr. Wiley serves as a Director of Tesoro Corporation (independent oil refiner and marketer, 2005-present), and a Director of Bill Barrett Corporation (exploration and production, 2005-present). In addition, Mr. Wiley also serves as a Director of Post Oak Bank (privately-held bank, 2004-present). Previously, Mr. Wiley served as a Sr. Energy Advisor of Katzenbach Partners, LLC (consulting, 2006-2007), as an Advisory Director of Riverstone Holdings (private investment), Chairman, President, and CEO of Baker Hughes, Inc. (oilfield services, 2000-2004), and as Director of Spinnaker Exploration Company (exploration and production, 2001-2005). |
+ The information above includes each Trustee's principal occupation during the last five years and other information relating to the experience, attributes, and skills relevant to each Trustee's qualifications to serve as a Trustee, which led to the conclusion that each Trustee should serve as a Trustee for the fund.
Advisory Board Member and Executive Officers:
Correspondence intended for each executive officer and Peter S. Lynch may be sent to Fidelity Investments, 82 Devonshire Street, Boston, Massachusetts 02109.
Name, Age; Principal Occupation |
Peter S. Lynch (66) |
| Year of Election or Appointment: 2003 Member of the Advisory Board of Fidelity's Equity and High Income Funds. Mr. Lynch is Vice Chairman and a Director of FMR and FMR Co., Inc. In addition, Mr. Lynch serves as a Trustee of Boston College and as the Chairman of the Inner-City Scholarship Fund. Previously, Mr. Lynch served on the Special Olympics International Board of Directors (1997-2006). |
Kenneth B. Robins (40) |
| Year of Election or Appointment: 2008 President and Treasurer of Fidelity's Equity and High Income Funds. Mr. Robins also serves as President and Treasurer (2010-present) and Assistant Treasurer (2009-present) of other Fidelity funds and is an employee of Fidelity Investments (2004-present). Previously, Mr. Robins served as Deputy Treasurer of the Fidelity funds (2005-2008) and Treasurer and Chief Financial Officer of The North Carolina Capital Management Trust: Cash and Term Portfolios (2006-2008). |
Brian B. Hogan (45) |
| Year of Election or Appointment: 2009 Vice President of certain Equity Funds and Vice President of Sector Funds. Mr. Hogan also serves as Senior Vice President, Equity Research of FMR (2006-present) and President of FMR's Equity Division (2009-present). Previously, Mr. Hogan served as a portfolio manager. |
Thomas C. Hense (46) |
| Year of Election or Appointment: 2008 Vice President of Fidelity's High Income and Small Cap Funds. Previously, Mr. Hense served as a portfolio manager for Fidelity's Institutional Money Management Group (Pyramis) (2003-2008). |
Scott C. Goebel (42) |
| Year of Election or Appointment: 2008 Secretary and Chief Legal Officer (CLO) of the Fidelity funds. Mr. Goebel also serves as General Counsel, Secretary, and Senior Vice President of FMR (2008-present) and FMR Co., Inc. (2008-present); Deputy General Counsel of FMR LLC; Chief Legal Officer of Fidelity Management & Research (Hong Kong) Limited (2008-present) and Assistant Secretary of Fidelity Management & Research (Japan) Inc. (2008-present), Fidelity Investments Money Management, Inc. (2008-present), Fidelity Management & Research (U.K.) Inc. (2008-present), and Fidelity Research and Analysis Company (2008-present). Previously, Mr. Goebel served as Assistant Secretary of the Funds (2007-2008) and as Vice President and Secretary of Fidelity Distributors Corporation (FDC) (2005-2007). |
William C. Coffey (41) |
| Year of Election or Appointment: 2009 Assistant Secretary of Fidelity's Equity and High Income Funds. Mr. Coffey also serves as Senior Vice President and Deputy General Counsel of FMR LLC (2010-present), and is an employee of Fidelity Investments. Previously, Mr. Coffey served as Vice President and Associate General Counsel of FMR LLC (2005-2009). |
Holly C. Laurent (55) |
| Year of Election or Appointment: 2008 Anti-Money Laundering (AML) Officer of the Fidelity funds. Ms. Laurent is an employee of Fidelity Investments. Previously, Ms. Laurent was Senior Vice President and Head of Legal for Fidelity Business Services India Pvt. Ltd. (2006-2008), and Senior Vice President, Deputy General Counsel and Group Head for FMR LLC (2005-2006). |
Christine Reynolds (51) |
| Year of Election or Appointment: 2008 Chief Financial Officer of the Fidelity funds. Ms. Reynolds became President of Fidelity Pricing and Cash Management Services (FPCMS) in August 2008. Ms. Reynolds served as Chief Operating Officer of FPCMS (2007-2008). Previously, Ms. Reynolds served as President, Treasurer, and Anti-Money Laundering officer of the Fidelity funds (2004-2007). |
Kenneth A. Rathgeber (62) |
| Year of Election or Appointment: 2004 Chief Compliance Officer of Fidelity's Equity and High Income Funds. Mr. Rathgeber is Chief Compliance Officer of Fidelity Management & Research (Hong Kong) Limited (2008-present), Fidelity Management & Research (Japan) Inc. (2008-present), FMR (2005-present), FMR Co., Inc. (2005-present), Fidelity Management & Research (U.K.) Inc. (2005-present), Fidelity Research & Analysis Company (2005-present), Fidelity Investments Money Management, Inc. (2005-present), Pyramis Global Advisors, LLC (2005-present), and Strategic Advisers, Inc. (2005-present). |
Jeffrey S. Christian (48) |
| Year of Election or Appointment: 2009 Deputy Treasurer of the Fidelity funds. Mr. Christian is an employee of Fidelity Investments. Previously, Mr. Christian served as Chief Financial Officer (2008-2009) of certain Fidelity funds and Senior Vice President of Fidelity Pricing and Cash Management Services (FPCMS) (2004-2009). |
Bryan A. Mehrmann (49) |
| Year of Election or Appointment: 2005 Deputy Treasurer of the Fidelity funds. Mr. Mehrmann is an employee of Fidelity Investments. |
Adrien E. Deberghes (42) |
| Year of Election or Appointment: 2008 Deputy Treasurer of Fidelity's Equity and High Income Funds. Mr. Deberghes is an employee of Fidelity Investments (2008-present). Previously, Mr. Deberghes served as Senior Vice President of Mutual Fund Administration at State Street Corporation (2007-2008), Senior Director of Mutual Fund Administration at Investors Bank & Trust (2005-2007), and Director of Finance for Dunkin' Brands (2000-2005). |
John R. Hebble (51) |
| Year of Election or Appointment: 2009 Assistant Treasurer of Fidelity's Equity and High Income Funds. Mr. Hebble also serves as Treasurer and Chief Financial Officer of The North Carolina Capital Management Trust: Cash and Term Portfolio (2008-present), President and Treasurer of other Fidelity funds (2008-present) and is an employee of Fidelity Investments. |
Gary W. Ryan (51) |
| Year of Election or Appointment: 2005 Assistant Treasurer of the Fidelity funds. Mr. Ryan is an employee of Fidelity Investments. Previously, Mr. Ryan served as Vice President of Fund Reporting in Fidelity Pricing and Cash Management Services (FPCMS) (1999-2005). |
Annual Report
The fund designates 100% of the dividends distributed during the fiscal year as qualifying for the dividends-received deduction for corporate shareholders.
The fund designates 100% of the dividends distributed during the fiscal year as amounts which may be taken into account as a dividend for the purposes of the maximum rate under section 1(h)(11) of the Internal Revenue Code.
The fund will notify shareholders in January 2011 of amounts for use in preparing 2010 income tax returns.
Annual Report
Managing Your Investments
Fidelity offers several ways to conveniently manage your personal investments via your telephone or PC. You can access your account information, conduct trades and research your investments 24 hours a day.
By Phone
Fidelity Automated Service Telephone provides a single toll-free number to access account balances, positions, quotes and trading. It's easy to navigate the service, and on your first call, the system will help you create a personal identification number (PIN) for security.
(phone_graphic)
Fidelity Automated
Service Telephone (FAST®)
1-800-544-5555
Press
For mutual fund and brokerage trading.
For quotes.*
For account balances and holdings.
To review orders and mutual
fund activity.
To change your PIN.
To speak to a Fidelity representative.
By PC
Fidelity's web site on the Internet provides a wide range of information, including daily financial news, fund performance, interactive planning tools and news about Fidelity products and services.
(computer_graphic)
Fidelity's Web Site
www.fidelity.com
* When you call the quotes line, please remember that a fund's yield and return will vary and, except for money market funds, share price will also vary. This means that you may have a gain or loss when you sell your shares. There is no assurance that money market funds will be able to maintain a stable $1 share price; an investment in a money market fund is not insured or guaranteed by the U.S. government. Total returns are historical and include changes in share price, reinvestment of dividends and capital gains, and the effects of any sales charges.
Annual Report
To Write Fidelity
We'll give your correspondence immediate attention and send you written confirmation upon completion of your request.
(letter_graphic)
Making Changes
To Your Account
(such as changing name, address, bank, etc.)
Fidelity Investments
P.O. Box 770001
Cincinnati, OH 45277-0002
(letter_graphic)
For Non-Retirement
Accounts
Buying shares
Fidelity Investments
P.O. Box 770001
Cincinnati, OH 45277-0003
Overnight Express
Fidelity Investments
Attn: Distribution Services
100 Crosby Parkway - KC1H
Covington, KY 41015
Selling shares
Fidelity Investments
P.O. Box 770001
Cincinnati, OH 45277-0035
Overnight Express
Fidelity Investments
Attn: Distribution Services
100 Crosby Parkway - KC1H
Covington, KY 41015
General Correspondence
Fidelity Investments
P.O. Box 500
Merrimack, NH 03054-0500
(letter_graphic)
For Retirement
Accounts
Buying shares
Fidelity Investments
P.O. Box 770001
Cincinnati, OH 45277-0003
Selling shares
Fidelity Investments
P.O. Box 770001
Cincinnati, OH 45277-0035
Overnight Express
Fidelity Investments
Attn: Distribution Services
100 Crosby Parkway - KC1H
Covington, KY 41015
General Correspondence
Fidelity Investments
P.O. Box 500
Merrimack, NH 03054-0500
Annual Report
Investment Adviser
Fidelity Management & Research Company
Boston, MA
Investment Sub-Advisers
FMR Co., Inc.
Fidelity Research & Analysis Company
Fidelity Management & Research
(U.K.) Inc.
FIL Investments (Japan) Limited
Fidelity Management & Research
(Japan) Inc.
Fidelity Management & Research
(Hong Kong) Limited
FIL Investment Advisors (U.K.) Ltd.
FIL Investment Advisors
General Distributor
Fidelity Distributors Corporation
Boston, MA
Transfer and Service Agents
Fidelity Investments Institutional
Operations Company, Inc.
Boston, MA
Fidelity Service Company, Inc.
Boston, MA
Custodian
State Street Bank and Trust Company
Quincy, MA
SMR-UANN-0610
1.784729.107
Fidelity®
Small Cap Stock
Fund
Annual Report
April 30, 2010
(2_fidelity_logos) (Registered_Trademark)
Contents
Chairman's Message | <Click Here> | The Chairman's message to shareholders. |
Performance | <Click Here> | How the fund has done over time. |
Management's Discussion | <Click Here> | The manager's review of fund performance, strategy and outlook. |
Shareholder Expense Example | <Click Here> | An example of shareholder expenses. |
Investment Changes | <Click Here> | A summary of major shifts in the fund's investments over the past six months. |
Investments | <Click Here> | A complete list of the fund's investments with their market values. |
Financial Statements | <Click Here> | Statements of assets and liabilities, operations, and changes in net assets, as well as financial highlights. |
Notes | <Click Here> | Notes to the financial statements. |
Report of Independent Registered Public Accounting Firm | <Click Here> | |
Trustees and Officers | <Click Here> | |
To view a fund's proxy voting guidelines and proxy voting record for the 12-month period ended June 30, visit http://www.fidelity.com/proxyvotingresults or visit the Securities and Exchange Commission's (SEC) web site at http://www.sec.gov. You may also call 1-800-544-8544 to request a free copy of the proxy voting guidelines.
Standard & Poor's, S&P and S&P 500 are registered service marks of The McGraw-Hill Companies, Inc. and have been licensed for use by Fidelity Distributors Corporation.
Other third party marks appearing herein are the property of their respective owners.
All other marks appearing herein are registered or unregistered trademarks or service marks of FMR LLC or an affiliated company.
Annual Report
This report and the financial statements contained herein are submitted for the general information of the shareholders of the fund. This report is not authorized for distribution to prospective investors in the fund unless preceded or accompanied by an effective prospectus.
A fund files its complete schedule of portfolio holdings with the SEC for the first and third quarters of each fiscal year on Form N-Q. Forms N-Q are available on the SEC's web site at http://www.sec.gov. A fund's Forms N-Q may be reviewed and copied at the SEC's Public Reference Room in Washington, DC. Information regarding the operation of the SEC's Public Reference Room may be obtained by calling 1-800-SEC-0330. For a complete list of a fund's portfolio holdings, view the most recent holdings listing, semiannual report, or annual report on Fidelity's web site at http://www.fidelity.com or http://www.advisor.fidelity.com, as applicable.
NOT FDIC INSURED • MAY LOSE VALUE • NO BANK GUARANTEE
Neither the fund nor Fidelity Distributors Corporation is a bank.
Annual Report
(photo_of_Edward_C_Johnson_3d)
Dear Shareholder:
Global capital markets have been predominantly positive thus far in 2010, overcoming some early volatility to continue the upward trend that began in March 2009. Year to date, U.S. stocks have seen the biggest gains, outpacing the performance of foreign equities, which has been hampered by a rebounding dollar. Financial markets are always unpredictable, of course, but there also are several time-tested investment principles that can help put the odds in your favor.
One of the basic tenets is to invest for the long term. Over time, riding out the markets' inevitable ups and downs has proven much more effective than selling into panic or chasing the hottest trend. Even missing only a few of the markets' best days can significantly diminish investor returns. Patience also affords the benefits of compounding - of earning interest on additional income or reinvested dividends and capital gains. There can be tax advantages and cost benefits to consider as well. While staying the course doesn't eliminate risk, it can considerably lessen the effect of short-term declines.
You can further manage your investing risk through diversification. And today, more than ever, geographic diversification should be taken into account. Studies indicate that asset allocation is the single most important determinant of a portfolio's long-term success. The right mix of stocks, bonds and cash - aligned to your particular risk tolerance and investment objective - is very important. Age-appropriate rebalancing is also an essential aspect of asset allocation. For younger investors, an emphasis on equities - which historically have been the best-performing asset class over time - is encouraged. As investors near their specific goal, such as retirement or sending a child to college, consideration may be given to replacing volatile assets (e.g. common stocks) with more-stable fixed investments (bonds or savings plans).
A third principle - investing regularly - can help lower the average cost of your purchases. Investing a certain amount of money each month or quarter helps ensure you won't pay for all your shares at market highs. This strategy - known as dollar cost averaging - also reduces "emotion" from investing, helping shareholders avoid selling weak performers just prior to an upswing, or chasing a hot performer just before a correction.
We invite you to contact us via the Internet, through our Investor Centers or by phone. It is our privilege to provide you the information you need to make the investments that are right for you.
Sincerely,
(The chairman's signature appears here.)
Edward C. Johnson 3d
Annual Report
Average annual total return reflects the change in the value of an investment, assuming reinvestment of the fund's dividend income and capital gains (the profits earned upon the sale of securities that have grown in value, if any) and assuming a constant rate of performance each year. The $10,000 table and the fund's returns do not reflect the deduction of taxes that a shareholder would pay on fund distributions or the redemption of fund shares. During periods of reimbursement by Fidelity, a fund's total return will be greater than it would be had the reimbursement not occurred. How a fund did yesterday is no guarantee of how it will do tomorrow.
Average Annual Total Returns
Periods ended April 30, 2010 | Past 1
year | Past 5
years | Past 10
years |
Fidelity® Small Cap Stock Fund | 63.05% | 7.96% | 7.62% |
$10,000 Over 10 Years
Let's say hypothetically that $10,000 was invested in Fidelity® Small Cap Stock Fund on April 30, 2000. The chart shows how the value of your investment would have changed, and also shows how the Russell 2000® Index performed over the same period.
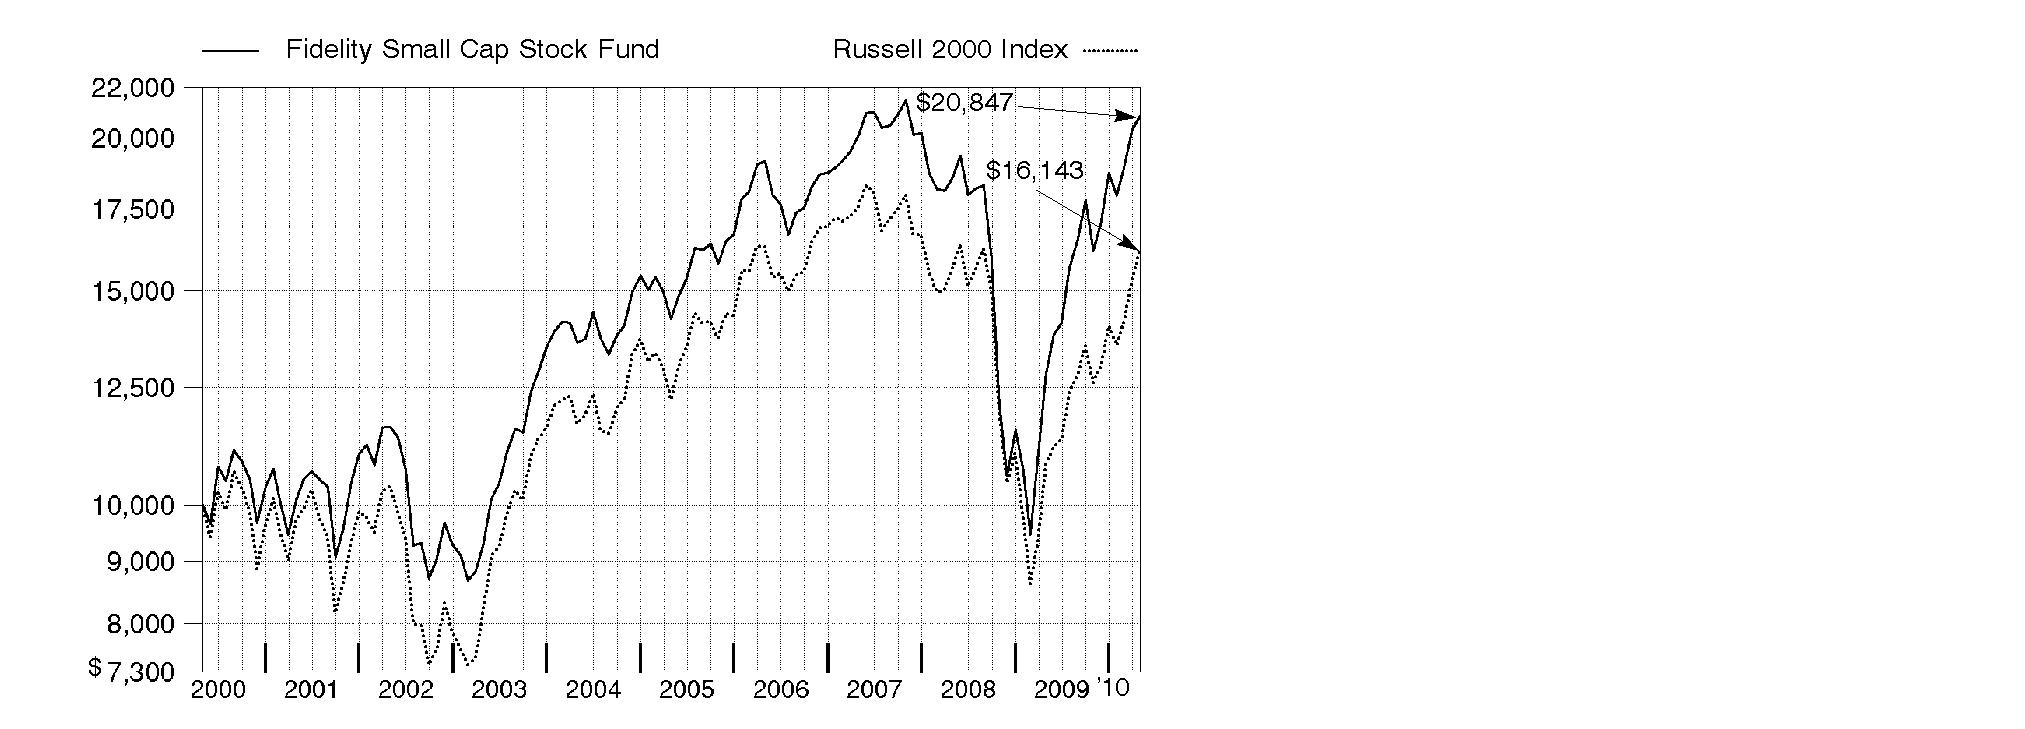
Annual Report
Market Recap: Blistering stock market declines sustained during the global economic crisis were largely offset in the 12-month period ending April 30, 2010, as unprecedented government stimulus took hold, significant corporate cost cutting paved the way for encouraging earnings reports, credit conditions improved and consumer fears began to ease. After hitting woeful lows in March 2009, stock markets experienced a steady uptrend that coincided with the near culmination of the Great Recession that began in late 2007. Although a weak labor market still lingered, by mid-April, the blue-chip Dow Jones Industrial AverageSM pushed above the 11,000 mark for the first time in 19 months, closing the period with a 38.69% gain. Impressive returns were widespread, with the S&P 500® Index rising 38.84% and the technology-laden Nasdaq Composite® Index increasing 44.63%. Small-cap stocks continued to outperform their larger counterparts, with the Russell 2000® Index returning 48.95%. Despite widening sovereign debt problems overseas, foreign equities still posted solid gains, with the MSCI® EAFE® (Europe, Australasia, Far East) Index - a measure of developed markets outside the U.S. and Canada - rising 34.56%.
Comments from Andrew Sassine, Portfolio Manager of Fidelity® Small Cap Stock Fund: The fund gained 63.05% during the year, significantly outpacing the Russell 2000 Index. Stock selection - especially within financials and information technology - was the biggest driver of relative performance. Positions in the insurance, diversified financials and banks groups, as well as in the technology hardware/equipment and software/services segments, were beneficial. Our holdings and an overweighting in industrials, specifically among transportation names, also were favorable. In technology, data-storage maker SanDisk was the fund's top contributor, benefiting from solid financial results. Also helping performance was Assured Guaranty, which provides credit enhancement products in both the U.S. and abroad. Additionally, air carriers UAL - parent company of United Airlines - and Delta Air Lines, benefited from capacity reductions, cost-cutting initiatives and service-fee increases. Our consumer staples holdings in the food/beverage/tobacco area aided results as well. On the downside, stock selection in the pharmaceuticals/biotechnology/life science and semiconductor industries was detrimental, as were my choices in telecommunication services and pockets of consumer discretionary. Individual detractors included Myriad Genetics, a medical diagnostics developer; MEMC Electronic Materials, a silicon wafer manufacturer; and Cbeyond, a communications and technology services company that I sold by period end. Some stocks mentioned were out-of-index holdings.
The views expressed above reflect those of the portfolio manager(s) only through the end of the period as stated on the cover of this report and do not necessarily represent the views of Fidelity or any other person in the Fidelity organization. Any such views are subject to change at any time based upon market or other conditions and Fidelity disclaims any responsibility to update such views. These views may not be relied on as investment advice and, because investment decisions for a Fidelity fund are based on numerous factors, may not be relied on as an indication of trading intent on behalf of any Fidelity fund.
Annual Report
Shareholder Expense Example
As a shareholder of the Fund, you incur two types of costs: (1) transaction costs, including redemption fees, and (2) ongoing costs, including management fees and other Fund expenses. This Example is intended to help you understand your ongoing costs (in dollars) of investing in the Fund and to compare these costs with the ongoing costs of investing in other mutual funds.
The Example is based on an investment of $1,000 invested at the beginning of the period and held for the entire period (November 1, 2009 to April 30, 2010).
Actual Expenses
The first line of the accompanying table provides information about actual account values and actual expenses. You may use the information in this line, together with the amount you invested, to estimate the expenses that you paid over the period. Simply divide your account value by $1,000.00 (for example, an $8,600 account value divided by $1,000.00 = 8.6), then multiply the result by the number in the first line under the heading entitled "Expenses Paid During Period" to estimate the expenses you paid on your account during this period. A small balance maintenance fee of $12.00 that is charged once a year may apply for certain accounts with a value of less than $2,000. This fee is not included in the table below. If it was, the estimate of expenses you paid during the period would be higher, and your ending account value lower, by this amount. In addition, the Fund, as a shareholder in the underlying Fidelity Central Funds, will indirectly bear its pro-rata share of the fees and expenses incurred by the underlying Fidelity Central Funds. These fees and expenses are not included in the Fund's annualized expense ratio used to calculate the expense estimate in the table below.
Hypothetical Example for Comparison Purposes
The second line of the accompanying table provides information about hypothetical account values and hypothetical expenses based on the Fund's actual expense ratio and an assumed rate of return of 5% per year before expenses, which is not the Fund's actual return. The hypothetical account values and expenses may not be used to estimate the actual ending account balance or expenses you paid for the period. You may use this information to compare the ongoing costs of investing in the Fund and other funds. To do so, compare this 5% hypothetical example with the 5% hypothetical examples that appear in the shareholder reports of the other funds. A small balance maintenance fee of $12.00 that is charged once a year may apply for certain accounts with a value of less than $2,000. This fee is not included in the table below. If it was, the estimate of expenses you paid during the period would be higher, and your ending account value lower, by this amount. In addition, the Fund, as a shareholder in the underlying Fidelity Central Funds, will indirectly bear its pro-rata share of the fees and expenses incurred by the underlying Fidelity Central Funds. These fees and expenses are not included in the Fund's annualized expense ratio used to calculate the expense estimate in the table below.
Please note that the expenses shown in the table are meant to highlight your ongoing costs only and do not reflect any transaction costs. Therefore, the second line of the table is useful in comparing ongoing costs only, and will not help you determine the relative total costs of owning different funds. In addition, if these transactional costs were included, your costs would have been higher.
Annual Report
Shareholder Expense Example - continued
| Annualized
Expense Ratio | Beginning
Account Value
November 1, 2009 | Ending
Account Value
April 30, 2010 | Expenses Paid
During Period*
November 1, 2009
to April 30, 2010 |
Actual | 1.20% | $ 1,000.00 | $ 1,290.20 | $ 6.81 |
Hypothetical (5% return per year before expenses) | | $ 1,000.00 | $ 1,018.84 | $ 6.01 |
* Expenses are equal to the Fund's annualized expense ratio, multiplied by the average account value over the period, multiplied by 181/365 (to reflect the one-half year period).
Annual Report
Investment Changes (Unaudited)
Top Ten Stocks as of April 30, 2010 |
| % of fund's
net assets | % of fund's net assets
6 months ago |
Alliance Data Systems Corp. | 3.4 | 4.2 |
Assured Guaranty Ltd. | 2.8 | 2.7 |
Micron Technology, Inc. | 2.6 | 2.5 |
Virgin Media, Inc. | 2.4 | 2.5 |
XL Capital Ltd. Class A | 2.3 | 3.1 |
UAL Corp. | 2.0 | 0.8 |
Delta Air Lines, Inc. | 1.8 | 1.4 |
SanDisk Corp. | 1.6 | 2.3 |
KeyCorp | 1.5 | 1.3 |
AMR Corp. | 1.5 | 1.4 |
| 21.9 | |
Top Five Market Sectors as of April 30, 2010 |
| % of fund's
net assets | % of fund's net assets
6 months ago |
Information Technology | 23.7 | 26.2 |
Industrials | 20.2 | 15.6 |
Financials | 16.3 | 20.7 |
Health Care | 11.8 | 9.3 |
Consumer Discretionary | 9.5 | 7.7 |
Asset Allocation (% of fund's net assets) |
As of April 30, 2010* | As of October 31, 2009** |
| Stocks and
Investment
Companies 94.6% | | | Stocks, Investment Companies and
Equity Futures 93.9% | |
| Short-Term
Investments and
Net Other Assets 5.4% | | | Short-Term
Investments and
Net Other Assets 6.1% | |
* Foreign investments | 13.6% | | ** Foreign investments | 15.0% | |

Annual Report
Investments April 30, 2010
Showing Percentage of Net Assets
Common Stocks - 94.2% |
| Shares | | Value (000s) |
CONSUMER DISCRETIONARY - 9.5% |
Auto Components - 2.0% |
ArvinMeritor, Inc. (a) | 600,000 | | $ 9,192 |
Lear Corp. (a) | 357,615 | | 29,031 |
Modine Manufacturing Co. (a) | 555,900 | | 7,788 |
The Goodyear Tire & Rubber Co. (a) | 941,186 | | 12,640 |
TRW Automotive Holdings Corp. (a) | 755,100 | | 24,322 |
| | 82,973 |
Hotels, Restaurants & Leisure - 1.6% |
Burger King Holdings, Inc. | 2,856,000 | | 60,262 |
Denny's Corp. (a) | 623,968 | | 2,078 |
Wyndham Worldwide Corp. | 142,200 | | 3,812 |
| | 66,152 |
Household Durables - 1.9% |
Ethan Allen Interiors, Inc. (d) | 360,300 | | 7,278 |
KB Home | 836,669 | | 15,503 |
Lennar Corp. Class A | 1,172,722 | | 23,337 |
M.D.C. Holdings, Inc. | 100,000 | | 3,830 |
Pulte Group, Inc. (a) | 1,839,260 | | 24,076 |
Ryland Group, Inc. | 200,000 | | 4,556 |
Techtronic Industries Co. Ltd. | 2,000,000 | | 2,078 |
| | 80,658 |
Media - 2.7% |
DreamWorks Animation SKG, Inc. Class A (a) | 10,300 | | 409 |
Focus Media Holding Ltd. ADR (a)(d) | 800,200 | | 13,427 |
Virgin Media, Inc. | 5,610,250 | | 98,684 |
| | 112,520 |
Multiline Retail - 0.2% |
Dollarama, Inc. | 200,000 | | 4,916 |
Dollarama, Inc. (f) | 141,000 | | 3,466 |
| | 8,382 |
Specialty Retail - 0.4% |
Big 5 Sporting Goods Corp. | 200,000 | | 3,390 |
Shoe Carnival, Inc. (a) | 297,670 | | 8,234 |
The Buckle, Inc. | 100,000 | | 3,618 |
| | 15,242 |
Textiles, Apparel & Luxury Goods - 0.7% |
Deckers Outdoor Corp. (a) | 40,000 | | 5,623 |
Fossil, Inc. (a) | 150,000 | | 5,835 |
Common Stocks - continued |
| Shares | | Value (000s) |
CONSUMER DISCRETIONARY - continued |
Textiles, Apparel & Luxury Goods - continued |
Iconix Brand Group, Inc. (a) | 300,000 | | $ 5,178 |
Phillips-Van Heusen Corp. | 238,200 | | 15,009 |
| | 31,645 |
TOTAL CONSUMER DISCRETIONARY | | 397,572 |
CONSUMER STAPLES - 4.5% |
Beverages - 0.4% |
Constellation Brands, Inc. Class A (sub. vtg.) (a) | 889,575 | | 16,253 |
Food & Staples Retailing - 0.4% |
Winn-Dixie Stores, Inc. (a) | 1,314,144 | | 16,571 |
Food Products - 3.7% |
Chiquita Brands International, Inc. (a)(d)(e) | 2,880,070 | | 43,316 |
Corn Products International, Inc. | 800,000 | | 28,800 |
Diamond Foods, Inc. | 42,600 | | 1,819 |
Dole Food Co., Inc. (d) | 1,339,154 | | 15,159 |
Fresh Del Monte Produce, Inc. (a) | 200,000 | | 4,174 |
Global Bio-Chem Technology Group Co. Ltd. | 58,189,000 | | 13,334 |
Ralcorp Holdings, Inc. (a) | 300,000 | | 19,965 |
Smithfield Foods, Inc. (a) | 1,705,200 | | 31,955 |
| | 158,522 |
TOTAL CONSUMER STAPLES | | 191,346 |
ENERGY - 5.0% |
Energy Equipment & Services - 1.4% |
Atwood Oceanics, Inc. (a) | 700,000 | | 25,487 |
Baker Hughes, Inc. | 200,173 | | 9,961 |
Hornbeck Offshore Services, Inc. (a) | 499,501 | | 12,223 |
TETRA Technologies, Inc. (a) | 1,000,800 | | 12,300 |
| | 59,971 |
Oil, Gas & Consumable Fuels - 3.6% |
Arch Coal, Inc. | 959,167 | | 25,898 |
Denbury Resources, Inc. (a) | 1,500,000 | | 28,725 |
EXCO Resources, Inc. | 500,000 | | 9,275 |
Massey Energy Co. | 671,600 | | 24,601 |
OPTI Canada, Inc. (a) | 1,700,000 | | 3,831 |
Petrobank Energy & Resources Ltd. (a) | 400,000 | | 20,165 |
Petroleum Development Corp. (a) | 200,000 | | 4,682 |
Common Stocks - continued |
| Shares | | Value (000s) |
ENERGY - continued |
Oil, Gas & Consumable Fuels - continued |
Plains Exploration & Production Co. (a) | 628,668 | | $ 18,426 |
Quicksilver Gas Services LP | 600,000 | | 12,666 |
| | 148,269 |
TOTAL ENERGY | | 208,240 |
FINANCIALS - 16.3% |
Capital Markets - 4.0% |
AllianceBernstein Holding LP | 500,000 | | 15,695 |
E*TRADE Financial Corp. (a) | 14,653,326 | | 24,618 |
Fifth Street Finance Corp. | 700,000 | | 8,925 |
GLG Partners, Inc. (a) | 2,000,000 | | 6,480 |
Janus Capital Group, Inc. | 2,840,300 | | 39,991 |
Morgan Stanley | 600,000 | | 18,132 |
optionsXpress Holdings, Inc. | 500,000 | | 8,875 |
State Street Corp. | 1,046,550 | | 45,525 |
| | 168,241 |
Commercial Banks - 3.2% |
Comerica, Inc. | 500,000 | | 21,000 |
Huntington Bancshares, Inc. | 3,000,000 | | 20,310 |
KeyCorp | 7,000,000 | | 63,140 |
Webster Financial Corp. | 300,000 | | 6,216 |
Zions Bancorp (d) | 798,600 | | 22,944 |
| | 133,610 |
Diversified Financial Services - 0.8% |
Bank of America Corp. | 1,911,400 | | 34,080 |
Insurance - 8.3% |
Allied World Assurance Co. Holdings Ltd. | 284,200 | | 12,383 |
Assured Guaranty Ltd. | 5,373,033 | | 115,789 |
Endurance Specialty Holdings Ltd. | 821,000 | | 30,254 |
Genworth Financial, Inc. Class A (a) | 3,200,000 | | 52,864 |
Max Capital Group Ltd. | 517,800 | | 11,547 |
Validus Holdings Ltd. | 1,000,022 | | 25,571 |
XL Capital Ltd. Class A | 5,500,000 | | 97,900 |
| | 346,308 |
Real Estate Investment Trusts - 0.0% |
Sunstone Hotel Investors, Inc. (a) | 103,500 | | 1,318 |
TOTAL FINANCIALS | | 683,557 |
Common Stocks - continued |
| Shares | | Value (000s) |
HEALTH CARE - 11.8% |
Biotechnology - 3.1% |
Alkermes, Inc. (a) | 2,000,000 | | $ 26,200 |
Allos Therapeutics, Inc. (a) | 772,600 | | 6,104 |
Amylin Pharmaceuticals, Inc. (a) | 1,195,879 | | 24,683 |
BB BIOTECH AG | 134,610 | | 8,411 |
Exelixis, Inc. (a) | 1,574,626 | | 9,101 |
Human Genome Sciences, Inc. (a) | 37,443 | | 1,037 |
ImmunoGen, Inc. (a)(d) | 1,119,900 | | 11,098 |
Myriad Genetics, Inc. (a) | 1,122,150 | | 26,943 |
Renovo Group PLC (a)(e) | 10,410,310 | | 3,976 |
United Therapeutics Corp. (a) | 220,000 | | 12,516 |
| | 130,069 |
Health Care Equipment & Supplies - 2.0% |
CareFusion Corp. (a) | 155,900 | | 4,300 |
Cooper Companies, Inc. | 100,000 | | 3,889 |
ev3, Inc. (a) | 950,000 | | 18,174 |
Integra LifeSciences Holdings Corp. (a) | 178,264 | | 8,099 |
Kinetic Concepts, Inc. (a) | 550,000 | | 23,815 |
Mako Surgical Corp. (a) | 500,000 | | 7,015 |
Thoratec Corp. (a) | 100,000 | | 4,459 |
Wright Medical Group, Inc. (a) | 689,650 | | 12,952 |
| | 82,703 |
Health Care Providers & Services - 1.3% |
Brookdale Senior Living, Inc. (a) | 615,000 | | 13,223 |
Catalyst Health Solutions, Inc. (a) | 200,000 | | 8,462 |
Community Health Systems, Inc. (a) | 400,000 | | 16,344 |
Coventry Health Care, Inc. (a) | 139,000 | | 3,300 |
Emeritus Corp. (a) | 184,400 | | 4,131 |
MEDNAX, Inc. (a) | 100,000 | | 5,494 |
Owens & Minor, Inc. | 150,000 | | 4,718 |
| | 55,672 |
Health Care Technology - 0.1% |
SXC Health Solutions Corp. (a) | 100,800 | | 7,006 |
Life Sciences Tools & Services - 4.0% |
Bruker BioSciences Corp. (a) | 146,700 | | 2,243 |
Charles River Laboratories International, Inc. (a) | 500,000 | | 16,740 |
Covance, Inc. (a) | 320,000 | | 18,285 |
ICON PLC sponsored ADR (a) | 600,000 | | 17,502 |
Illumina, Inc. (a) | 428,996 | | 17,962 |
Life Technologies Corp. (a) | 200,000 | | 10,942 |
PAREXEL International Corp. (a) | 700,000 | | 16,506 |
Common Stocks - continued |
| Shares | | Value (000s) |
HEALTH CARE - continued |
Life Sciences Tools & Services - continued |
Pharmaceutical Product Development, Inc. | 600,000 | | $ 16,500 |
QIAGEN NV (a) | 1,731,520 | | 39,565 |
Wuxi Pharmatech Cayman, Inc. sponsored ADR (a) | 550,091 | | 10,562 |
| | 166,807 |
Pharmaceuticals - 1.3% |
Cadence Pharmaceuticals, Inc. (a) | 525,400 | | 5,149 |
Elan Corp. PLC sponsored ADR (a) | 5,176,240 | | 34,784 |
Pronova BioPharma ASA (a) | 2,800,003 | | 8,947 |
ViroPharma, Inc. (a) | 400,000 | | 5,088 |
| | 53,968 |
TOTAL HEALTH CARE | | 496,225 |
INDUSTRIALS - 20.2% |
Aerospace & Defense - 0.8% |
Alliant Techsystems, Inc. (a) | 100,000 | | 8,091 |
GeoEye, Inc. (a) | 871,760 | | 24,845 |
| | 32,936 |
Air Freight & Logistics - 0.7% |
Forward Air Corp. | 1,132,232 | | 31,725 |
Airlines - 9.3% |
AirTran Holdings, Inc. (a)(d) | 3,460,000 | | 18,269 |
Alaska Air Group, Inc. (a) | 700,728 | | 29,017 |
AMR Corp. (a) | 8,224,850 | | 60,699 |
Continental Airlines, Inc. Class B (a) | 1,894,500 | | 42,342 |
Delta Air Lines, Inc. (a) | 6,236,800 | | 75,341 |
Hawaiian Holdings, Inc. (a) | 1,273,410 | | 9,041 |
JetBlue Airways Corp. (a)(d) | 4,819,246 | | 26,940 |
UAL Corp. (a)(d) | 3,872,700 | | 83,573 |
US Airways Group, Inc. (a)(d) | 6,707,791 | | 47,424 |
| | 392,646 |
Commercial Services & Supplies - 1.7% |
Avery Dennison Corp. | 400,000 | | 15,612 |
Clean Harbors, Inc. (a) | 249,695 | | 15,838 |
Corrections Corp. of America (a) | 700,043 | | 14,505 |
The Geo Group, Inc. (a) | 852,408 | | 18,054 |
Waste Connections, Inc. (a) | 180,000 | | 6,442 |
| | 70,451 |
Common Stocks - continued |
| Shares | | Value (000s) |
INDUSTRIALS - continued |
Construction & Engineering - 1.7% |
Foster Wheeler AG (a) | 700,000 | | $ 20,986 |
KBR, Inc. | 700,000 | | 15,456 |
MasTec, Inc. (a) | 2,003,115 | | 25,059 |
Orion Marine Group, Inc. (a) | 450,000 | | 8,532 |
| | 70,033 |
Electrical Equipment - 0.6% |
Fushi Copperweld, Inc. (a) | 425,000 | | 4,701 |
SunPower Corp.: | | | |
Class A (a)(d) | 857,300 | | 14,188 |
Class B (a) | 300,000 | | 4,512 |
| | 23,401 |
Machinery - 1.2% |
Actuant Corp. Class A | 500,026 | | 11,466 |
AGCO Corp. (a) | 650,000 | | 22,763 |
Terex Corp. (a) | 690,000 | | 18,299 |
| | 52,528 |
Professional Services - 0.7% |
FTI Consulting, Inc. (a) | 705,914 | | 29,034 |
Road & Rail - 3.4% |
Avis Budget Group, Inc. (a) | 2,051,800 | | 31,023 |
Celadon Group, Inc. (a) | 316,825 | | 4,730 |
Con-way, Inc. | 1,090,000 | | 42,336 |
Frozen Food Express Industries, Inc. (e) | 982,041 | | 4,419 |
Hertz Global Holdings, Inc. (a)(d) | 586,600 | | 8,482 |
Knight Transportation, Inc. (d) | 2,200,059 | | 46,839 |
Landstar System, Inc. | 90,000 | | 3,980 |
| | 141,809 |
Trading Companies & Distributors - 0.1% |
Kaman Corp. | 140,000 | | 3,837 |
TOTAL INDUSTRIALS | | 848,400 |
INFORMATION TECHNOLOGY - 23.7% |
Communications Equipment - 0.6% |
Riverbed Technology, Inc. (a) | 827,753 | | 25,652 |
Computers & Peripherals - 2.0% |
SanDisk Corp. (a) | 1,750,000 | | 69,808 |
Seagate Technology (a) | 890,470 | | 16,358 |
| | 86,166 |
Common Stocks - continued |
| Shares | | Value (000s) |
INFORMATION TECHNOLOGY - continued |
Electronic Equipment & Components - 1.6% |
HannStar Display Corp. (a) | 48,000,355 | | $ 9,884 |
IPG Photonics Corp. (a) | 343,300 | | 6,011 |
Itron, Inc. (a) | 619,900 | | 49,350 |
| | 65,245 |
Internet Software & Services - 1.0% |
Art Technology Group, Inc. (a)(e) | 9,195,524 | | 39,357 |
Rackspace Hosting, Inc. (a) | 200,000 | | 3,590 |
| | 42,947 |
IT Services - 4.5% |
Alliance Data Systems Corp. (a)(d) | 1,915,000 | | 143,737 |
CACI International, Inc. Class A (a) | 235,048 | | 11,148 |
CyberSource Corp. (a) | 800,063 | | 20,546 |
Devoteam SA (d) | 149,997 | | 4,105 |
ExlService Holdings, Inc. (a) | 500,000 | | 7,960 |
| | 187,496 |
Semiconductors & Semiconductor Equipment - 13.7% |
ARM Holdings PLC sponsored ADR (d) | 3,700,000 | | 42,291 |
ASML Holding NV (NY Shares) | 200,003 | | 6,532 |
Cymer, Inc. (a) | 632,780 | | 21,609 |
Cypress Semiconductor Corp. (a) | 2,069,178 | | 26,672 |
FormFactor, Inc. (a) | 900,065 | | 13,510 |
Himax Technologies, Inc. sponsored ADR (d) | 19,090,974 | | 59,755 |
KLA-Tencor Corp. | 250,000 | | 8,515 |
Kulicke & Soffa Industries, Inc. (a) | 2,013,856 | | 16,514 |
LTX-Credence Corp. (a) | 6,255,210 | | 21,205 |
MEMC Electronic Materials, Inc. (a) | 2,061,200 | | 26,734 |
Micron Technology, Inc. (a) | 11,730,466 | | 109,680 |
Novellus Systems, Inc. (a) | 925,000 | | 24,235 |
NVIDIA Corp. (a) | 3,734,833 | | 58,712 |
Omnivision Technologies, Inc. (a) | 500,000 | | 8,780 |
ON Semiconductor Corp. (a) | 1,555,071 | | 12,347 |
PDF Solutions, Inc. (a)(e) | 1,830,000 | | 9,059 |
Photronics, Inc. (a) | 1,200,028 | | 6,540 |
PMC-Sierra, Inc. (a) | 3,878,400 | | 34,324 |
Power Integrations, Inc. | 430,000 | | 16,546 |
Rudolph Technologies, Inc. (a) | 922,814 | | 8,794 |
Teradyne, Inc. (a) | 3,100,000 | | 37,913 |
Verigy Ltd. (a) | 576,800 | | 6,887 |
| | 577,154 |
Common Stocks - continued |
| Shares | | Value (000s) |
INFORMATION TECHNOLOGY - continued |
Software - 0.3% |
Solera Holdings, Inc. | 100,000 | | $ 3,887 |
Synopsys, Inc. (a) | 350,000 | | 7,949 |
| | 11,836 |
TOTAL INFORMATION TECHNOLOGY | | 996,496 |
MATERIALS - 3.1% |
Chemicals - 1.0% |
Ashland, Inc. | 300,000 | | 17,868 |
Calgon Carbon Corp. (a)(d) | 488,245 | | 7,568 |
DC Chemical Co. Ltd. | 64,441 | | 12,218 |
Sensient Technologies Corp. | 100,000 | | 3,153 |
| | 40,807 |
Containers & Packaging - 1.0% |
Boise, Inc. (a) | 1,000,000 | | 6,890 |
Silgan Holdings, Inc. | 570,000 | | 34,388 |
| | 41,278 |
Paper & Forest Products - 1.1% |
Schweitzer-Mauduit International, Inc. | 850,000 | | 48,382 |
TOTAL MATERIALS | | 130,467 |
TELECOMMUNICATION SERVICES - 0.1% |
Wireless Telecommunication Services - 0.1% |
NII Holdings, Inc. (a) | 150,200 | | 6,371 |
TOTAL COMMON STOCKS (Cost $3,000,152) | 3,958,674 |
Preferred Stocks - 0.0% |
| | | |
Convertible Preferred Stocks - 0.0% |
HEALTH CARE - 0.0% |
Health Care Providers & Services - 0.0% |
LifeMasters Supported SelfCare, Inc.: | | | |
Series F (a)(g) | 461,818 | | 0* |
Series H (a)(g) | 46,051 | | 0 |
TOTAL HEALTH CARE | | 0 |
Preferred Stocks - continued |
| Shares | | Value (000s) |
Nonconvertible Preferred Stocks - 0.0% |
HEALTH CARE - 0.0% |
Health Care Technology - 0.0% |
Lifeoutcomes, Inc. Series A (a)(g) | 39,076 | | $ 0 |
TOTAL PREFERRED STOCKS (Cost $11,433) | 0 |
Investment Companies - 0.4% |
| | | |
KBW Regional Banking ETF (d)
(Cost $13,867) | 636,000 | | 17,763 |
Money Market Funds - 11.8% |
| | | |
Fidelity Cash Central Fund, 0.21% (b) | 218,319,372 | | 218,319 |
Fidelity Securities Lending Cash Central Fund, 0.22% (b)(c) | 278,245,864 | | 278,246 |
TOTAL MONEY MARKET FUNDS (Cost $496,565) | 496,565 |
TOTAL INVESTMENT PORTFOLIO - 106.4% (Cost $3,522,017) | | 4,473,002 |
NET OTHER ASSETS - (6.4)% | | (268,615) |
NET ASSETS - 100% | $ 4,204,387 |
Security Type Abbreviations |
ETF - Exchange Traded Funds |
Legend |
(a) Non-income producing |
(b) Affiliated fund that is available only to investment companies and other accounts managed by Fidelity Investments. The rate quoted is the annualized seven-day yield of the fund at period end. A complete unaudited listing of the fund's holdings as of its most recent quarter end is available upon request. |
(c) Investment made with cash collateral received from securities on loan. |
(d) Security or a portion of the security is on loan at period end. |
(e) Affiliated company |
(f) Security exempt from registration under Rule 144A of the Securities Act of 1933. These securities may be resold in transactions exempt from registration, normally to qualified institutional buyers. At the end of the period, the value of these securities amounted to $3,466,000 or 0.1% of net assets. |
(g) Restricted securities - Investment in securities not registered under the Securities Act of 1933 (excluding 144A issues). At the end of the period, the value of restricted securities (excluding 144A issues) amounted to $0 or 0.0% of net assets. |
Additional information on each holding is as follows: |
Security | Acquisition Date | Acquisition Cost (000s) |
LifeMasters Supported SelfCare, Inc.:
Series F | 6/24/02 | $ 5,100 |
Series H | 12/17/07 | $ 368 |
Lifeoutcomes, Inc.
Series A | 5/31/06 | $ 5,965 |
* Amount represents less than $1,000 |
Affiliated Central Funds |
Information regarding fiscal year to date income earned by the Fund from investments in Fidelity Central Funds is as follows: |
Fund | Income earned
(Amounts in thousands) |
Fidelity Cash Central Fund | $ 281 |
Fidelity Securities Lending Cash Central Fund | 3,107 |
Total | $ 3,388 |
Other Affiliated Issuers |
An affiliated company is a company in which the fund has ownership of at least 5% of the voting securities. Fiscal year to date transactions with companies which are or were affiliates are as follows: |
Affiliate
(Amounts in thousands) | Value,
beginning
of period | Purchases | Sales Proceeds | Dividend Income | Value,
end
of period |
Art Technology Group, Inc. | $ 17,145 | $ 13,073 | $ - | $ - | $ 39,357 |
Assured Guaranty Ltd. | 47,430 | 12,235 | 8,493 | 930 | - |
Celadon Group, Inc. | 10,742 | - | 15,222 | - | - |
Chiquita Brands International, Inc. | 25,826 | - | 8,586 | - | 43,316 |
DDi Corp. | 5,156 | - | 7,222 | - | - |
Devoteam SA | 10,007 | - | 12,029 | 249 | - |
ExlService Holdings, Inc. | 8,684 | 10,944 | 24,031 | - | - |
Frozen Food Express Industries, Inc. | 7,540 | - | 2,454 | - | 4,419 |
Groupe Open SA | 6,974 | - | 7,932 | 387 | - |
Medtox Scientific, Inc. | 6,490 | - | 7,306 | - | - |
MIPS Technologies, Inc. | 14,011 | - | 16,898 | - | - |
Oplink Communications, Inc. | 16,689 | - | 17,496 | - | - |
P.A.M. Transportation Services, Inc. | 2,760 | - | 2,594 | - | - |
PDF Solutions, Inc. | 5,040 | - | 3,865 | - | 9,059 |
Plambeck Neue Energien AG | 11,760 | - | 12,433 | - | - |
Quality Distribution, Inc. | 2,234 | - | 2,222 | - | - |
Quicksilver Gas Services LP | 8,526 | - | 519 | - | - |
Renovo Group PLC | 4,551 | - | 201 | - | 3,976 |
Rudolph Technologies, Inc. | 10,424 | - | 9,604 | - | - |
Shoe Carnival, Inc. | 10,817 | - | 12,395 | - | - |
The Great Atlantic & Pacific Tea Co. | 28,791 | - | 25,251 | - | - |
Total | $ 261,597 | $ 36,252 | $ 196,753 | $ 1,566 | $ 100,127 |
Other Information |
The following is a summary of the inputs used, as of April 30, 2010, involving the Fund's assets and liabilities carried at value. The inputs or methodology used for valuing securities may not be an indication of the risk associated with investing in those securities. For more information on valuation inputs, and their aggregation into the levels used in the tables below, please refer to the Security Valuation section in the accompanying Notes to Financial Statements. |
Valuation Inputs at Reporting Date: |
Description
(Amounts in thousands) | Total | Level 1 | Level 2 | Level 3 |
Investments in Securities: | | | | |
Equities: | | | | |
Consumer Discretionary | $ 397,572 | $ 395,494 | $ 2,078 | $ - |
Consumer Staples | 191,346 | 178,012 | 13,334 | - |
Energy | 208,240 | 208,240 | - | - |
Financials | 683,557 | 683,557 | - | - |
Health Care | 496,225 | 474,891 | 21,334 | - |
Industrials | 848,400 | 848,400 | - | - |
Information Technology | 996,496 | 982,507 | 13,989 | - |
Materials | 130,467 | 118,249 | 12,218 | - |
Telecommunication Services | 6,371 | 6,371 | - | - |
Investment Companies | 17,763 | 17,763 | - | - |
Money Market Funds | 496,565 | 496,565 | - | - |
Total Investments in Securities: | $ 4,473,002 | $ 4,410,049 | $ 62,953 | $ - |
The following is a reconciliation of Investments in Securities for which Level 3 inputs were used in determining value: |
(Amounts in thousands) | |
Investments in Securities: | |
Beginning Balance | $ 528 |
Total Realized Gain (Loss) | - |
Total Unrealized Gain (Loss) | (528) |
Cost of Purchases | - |
Proceeds of Sales | - |
Amortization/Accretion | - |
Transfers in to Level 3 | - |
Transfers out of Level 3 | - |
Ending Balance | $ - |
The change in unrealized gain (loss) for the period attributable to Level 3 securities held at April 30, 2010 | $ (528) |
The information used in the above reconciliation represents fiscal year to date activity for any Investments in Securities identified as using Level 3 inputs at either the beginning or the end of the current fiscal period. Transfers in or out of Level 3 represents the beginning value of any Security or Instrument where a change in the pricing level occurred from the beginning to the end of the period. The cost of purchases and the proceeds of sales may include securities received or delivered through corporate actions or exchanges. Realized and unrealized gains (losses) disclosed in the reconciliation are included in Net Gain (Loss) on the Fund's Statement of Operations. |
Distribution of investments by country of issue, as a percentage of total net assets, is as follows: (Unaudited) |
United States of America | 86.4% |
Bermuda | 4.7% |
Cayman Islands | 2.2% |
Ireland | 1.3% |
United Kingdom | 1.1% |
Netherlands | 1.1% |
Others (Individually Less Than 1%) | 3.2% |
| 100.0% |
Income Tax Information |
At April 30, 2010, the fund had a capital loss carryforward of approximately $706,581,000 of which $432,252,000 and $274,329,000 will expire on April 30, 2017 and 2018, respectively. |
See accompanying notes which are an integral part of the financial statements.
Annual Report
Statement of Assets and Liabilities
Amounts in thousands (except per-share amount) | April 30, 2010 |
Assets | | |
Investment in securities, at value (including securities loaned of $266,616) - See accompanying schedule: Unaffiliated issuers (cost $2,916,626) | $ 3,876,310 | |
Fidelity Central Funds (cost $496,565) | 496,565 | |
Other affiliated issuers (cost $108,826) | 100,127 | |
Total Investments (cost $3,522,017) | | $ 4,473,002 |
Cash | | 1,345 |
Receivable for investments sold | | 39,305 |
Receivable for fund shares sold | | 8,304 |
Dividends receivable | | 718 |
Distributions receivable from Fidelity Central Funds | | 92 |
Prepaid expenses | | 5 |
Other receivables | | 103 |
Total assets | | 4,522,874 |
| | |
Liabilities | | |
Payable for investments purchased | $ 32,690 | |
Payable for fund shares redeemed | 3,483 | |
Accrued management fee | 3,095 | |
Other affiliated payables | 899 | |
Other payables and accrued expenses | 74 | |
Collateral on securities loaned, at value | 278,246 | |
Total liabilities | | 318,487 |
| | |
Net Assets | | $ 4,204,387 |
Net Assets consist of: | | |
Paid in capital | | $ 3,970,294 |
Accumulated net investment loss | | (787) |
Accumulated undistributed net realized gain (loss) on investments and foreign currency transactions | | (716,106) |
Net unrealized appreciation (depreciation) on investments and assets and liabilities in foreign currencies | | 950,986 |
Net Assets, for 236,982 shares outstanding | | $ 4,204,387 |
Net Asset Value, offering price and redemption price per share ($4,204,387 ÷ 236,982 shares) | | $ 17.74 |
See accompanying notes which are an integral part of the financial statements.
Annual Report
Statement of Operations
Amounts in thousands | Year ended April 30, 2010 |
Investment Income | | |
Dividends (including $1,566 earned from other affiliated issuers) | | $ 21,557 |
Interest | | 3 |
Income from Fidelity Central Funds (including $3,107 from security lending) | | 3,388 |
Total income | | 24,948 |
| | |
Expenses | | |
Management fee
Basic fee | $ 23,802 | |
Performance adjustment | 7,043 | |
Transfer agent fees | 9,429 | |
Accounting and security lending fees | 1,040 | |
Custodian fees and expenses | 157 | |
Independent trustees' compensation | 20 | |
Registration fees | 108 | |
Audit | 60 | |
Legal | 16 | |
Interest | 1 | |
Miscellaneous | 59 | |
Total expenses before reductions | 41,735 | |
Expense reductions | (324) | 41,411 |
Net investment income (loss) | | (16,463) |
Realized and Unrealized Gain (Loss) Net realized gain (loss) on: | | |
Investment securities: | | |
Unaffiliated issuers | 236,683 | |
Other affiliated issuers | (100,564) | |
Capital gain distribution from Fidelity Central Funds | 11 | |
Foreign currency transactions | 82 | |
Futures contracts | 7,047 | |
Total net realized gain (loss) | | 143,259 |
Change in net unrealized appreciation (depreciation) on: Investment securities | | 1,422,346 |
Net gain (loss) | | 1,565,605 |
Net increase (decrease) in net assets resulting from operations | | $ 1,549,142 |
See accompanying notes which are an integral part of the financial statements.
Annual Report
Financial Statements - continued
Statement of Changes in Net Assets
Amounts in thousands | Year ended
April 30,
2010 | Year ended
April 30,
2009 |
Increase (Decrease) in Net Assets | | |
Operations | | |
Net investment income (loss) | $ (16,463) | $ 1,131 |
Net realized gain (loss) | 143,259 | (834,945) |
Change in net unrealized appreciation (depreciation) | 1,422,346 | (407,656) |
Net increase (decrease) in net assets resulting from operations | 1,549,142 | (1,241,470) |
Distributions to shareholders from net investment income | - | (71) |
Distributions to shareholders from net realized gain | - | (58,885) |
Total distributions | - | (58,956) |
Share transactions
Proceeds from sales of shares | 1,131,288 | 527,584 |
Reinvestment of distributions | - | 57,615 |
Cost of shares redeemed | (877,438) | (838,556) |
Net increase (decrease) in net assets resulting from share transactions | 253,850 | (253,357) |
Redemption fees | 895 | 572 |
Total increase (decrease) in net assets | 1,803,887 | (1,553,211) |
| | |
Net Assets | | |
Beginning of period | 2,400,500 | 3,953,711 |
End of period (including accumulated net investment loss of $787 and $0, respectively) | $ 4,204,387 | $ 2,400,500 |
Other Information Shares | | |
Sold | 75,855 | 44,161 |
Issued in reinvestment of distributions | - | 3,675 |
Redeemed | (59,609) | (73,615) |
Net increase (decrease) | 16,246 | (25,779) |
See accompanying notes which are an integral part of the financial statements.
Annual Report
Financial Highlights
Years ended April 30, | 2010 | 2009 | 2008 | 2007 | 2006 |
Selected Per-Share Data | | | | | |
Net asset value, beginning of period | $ 10.88 | $ 16.04 | $ 20.40 | $ 21.02 | $ 16.74 |
Income from Investment Operations | | | | | |
Net investment income (loss) B | (.07) | - F | (.03) | (.06) | (.04) |
Net realized and unrealized gain (loss) | 6.93 | (4.92) | (1.19) | .96 | 5.58 |
Total from investment operations | 6.86 | (4.92) | (1.22) | .90 | 5.54 |
Distributions from net investment income | - | - F,G | - | - | - |
Distributions from net realized gain | - | (.24) G | (3.14) | (1.52) | (1.26) |
Total distributions | - | (.24) | (3.14) | (1.52) | (1.26) |
Redemption fees added to paid in capital B,F | - | - | - | - | - |
Net asset value, end of period | $ 17.74 | $ 10.88 | $ 16.04 | $ 20.40 | $ 21.02 |
Total Return A | 63.05% | (31.13)% | (7.64)% | 4.98% | 34.68% |
Ratios to Average Net Assets C,E | | | | | |
Expenses before reductions | 1.24% | .96% | 1.08% | .96% | .98% |
Expenses net of fee waivers, if any | 1.24% | .96% | 1.08% | .96% | .98% |
Expenses net of all reductions | 1.23% | .95% | 1.07% | .94% | .93% |
Net investment income (loss) | (.49)% | .04% | (.18)% | (.32)% | (.23)% |
Supplemental Data | | | | | |
Net assets, end of period (in millions) | $ 4,204 | $ 2,401 | $ 3,954 | $ 4,985 | $ 5,159 |
Portfolio turnover rate D | 60% | 92% | 115% | 115% | 107% |
A Total returns would have been lower had certain expenses not been reduced during the periods shown.
B Calculated based on average shares outstanding during the period.
C Fees and expenses of the underlying Fidelity Central Funds are not included in the Fund's expense ratio. The Fund indirectly bears its proportionate share of the expenses of any underlying Fidelity Central Funds.
D Amount does not include the portfolio activity of any underlying Fidelity Central Funds.
E Expense ratios reflect operating expenses of the Fund. Expenses before reductions do not reflect amounts reimbursed by the investment adviser or reductions from brokerage service arrangements or reductions from other expense offset arrangements and do not represent the amount paid by the Fund during periods when reimbursements or reductions occur. Expenses net of fee waivers reflect expenses after reimbursement by the investment adviser but prior to reductions from brokerage service arrangements or other expense offset arrangements. Expenses net of all reductions represent the net expenses paid by the Fund.
F Amount represents less than $.01 per share.
G The amount shown reflects certain reclassifications related to book to tax differences.
See accompanying notes which are an integral part of the financial statements.
Annual Report
Notes to Financial Statements
For the period ended April 30, 2010
(Amounts in thousands except ratios)
1. Organization.
Fidelity Small Cap Stock Fund (the Fund) is a fund of Fidelity Commonwealth Trust (the trust) and is authorized to issue an unlimited number of shares. The trust is registered under the Investment Company Act of 1940, as amended (the 1940 Act), as an open-end management investment company organized as a Massachusetts business trust.
2. Investments in Fidelity Central Funds.
The Fund may invest in Fidelity Central Funds, which are open-end investment companies available only to other investment companies and accounts managed by Fidelity Management & Research Company (FMR) and its affiliates. The Fund's Schedule of Investments lists each of the Fidelity Central Funds held as of period end, if any, as an investment of the Fund, but does not include the underlying holdings of each Fidelity Central Fund. As an Investing Fund, the Fund indirectly bears its proportionate share of the expenses of the underlying Fidelity Central Funds.
The Money Market Central Funds seek preservation of capital and current income and are managed by Fidelity Investments Money Management, Inc. (FIMM), an affiliate of FMR.
A complete unaudited list of holdings for each Fidelity Central Fund is available upon request or at the Securities and Exchange Commission (the SEC) web site at www.sec.gov. In addition, the financial statements of the Fidelity Central Funds which are not covered by the Fund's Report of Independent Registered Public Accounting Firm, are available on the SEC web site or upon request.
3. Significant Accounting Policies.
The financial statements have been prepared in conformity with accounting principles generally accepted in the United States of America, which require management to make certain estimates and assumptions at the date of the financial statements. Actual results could differ from those estimates. The following summarizes the significant accounting policies of the Fund:
Security Valuation. Investments are valued as of 4:00 p.m. Eastern time on the last calendar day of the period. The Fund uses independent pricing services approved by the Board of Trustees to value its investments. When current market prices or quotations are not readily available or reliable, valuations may be determined in good faith in accordance with procedures adopted by the Board of Trustees. Factors used in determining value may include market or security specific events, changes in interest rates and credit quality. The frequency with which these procedures are used cannot be predicted and they may be utilized to a significant extent. The value used for net asset value (NAV) calculation under these procedures may differ from published prices for the same securities.
Annual Report
Notes to Financial Statements - continued
(Amounts in thousands except ratios)
3. Significant Accounting Policies - continued
Security Valuation - continued
The Fund categorizes the inputs to valuation techniques used to value its investments into a disclosure hierarchy consisting of three levels as shown below.
Level 1 - quoted prices in active markets for identical investments
Level 2 - other significant observable inputs (including quoted prices for similar investments, interest rates, prepayment speeds, etc.)
Level 3 - unobservable inputs (including the fund's own assumptions based on the best information available)
Changes in valuation techniques may result in transfers in or out of an assigned level within the disclosure hierarchy. The aggregate value of investments by input level, as of April 30, 2010, as well as a roll forward of Level 3 securities, is included at the end of the Fund's Schedule of Investments. Valuation techniques used to value the Fund's investments by major category are as follows.
Equity securities, including restricted securities, for which market quotations are readily available, are valued at the last reported sale price or official closing price as reported by an independent pricing service on the primary market or exchange on which they are traded and are categorized as Level 1 in the hierarchy. In the event there were no sales during the day or closing prices are not available, securities are valued at the last quoted bid price or may be valued using the last available price and are generally categorized as Level 2 in the hierarchy. For foreign equity securities, when significant market or security specific events arise, comparisons to the valuation of American Depository Receipts (ADR), futures contracts, Exchange Traded Funds (ETF), and certain indexes as well as quoted prices for similar securities are used and are categorized as Level 2 in the hierarchy in these circumstances. Utilizing these techniques may result in transfers between Level 1 and Level 2. For restricted equity securities and private placements where observable inputs are limited, assumptions about market activity and risk are used and are categorized as Level 3 in the hierarchy.
Investments in open-end mutual funds, including the Fidelity Central Funds, are valued at their closing net asset value each business day and are categorized as Level 1 in the hierarchy. Short-term securities with remaining maturities of sixty days or less for which quotations are not readily available are valued at amortized cost, which approximates value and are categorized as Level 2 in the hierarchy.
Foreign Currency. The Fund uses foreign currency contracts to facilitate transactions in foreign-denominated securities. Losses from these transactions may arise from changes in the value of the foreign currency or if the counterparties do not perform under the contracts' terms.
Annual Report
3. Significant Accounting Policies - continued
Foreign Currency - continued
Foreign-denominated assets, including investment securities, and liabilities are translated into U.S. dollars at the exchange rate at period end. Purchases and sales of investment securities, income and dividends received and expenses denominated in foreign currencies are translated into U.S. dollars at the exchange rate in effect on the transaction date.
The effects of exchange rate fluctuations on investments are included with the net realized and unrealized gain (loss) on investment securities. Other foreign currency transactions resulting in realized and unrealized gain (loss) are disclosed separately.
Investment Transactions and Income. For financial reporting purposes, the Fund's investment holdings and NAV include trades executed through the end of the last business day of the period. The NAV per share for processing shareholder transactions is calculated as of the close of business of the New York Stock Exchange (NYSE), normally 4:00 p.m. Eastern time and includes trades executed through the end of the prior business day. Gains and losses on securities sold are determined on the basis of identified cost and may include proceeds received from litigation. Dividend income is recorded on the ex-dividend date, except for certain dividends from foreign securities where the ex-dividend date may have passed, which are recorded as soon as the Fund is informed of the ex-dividend date. Non-cash dividends included in dividend income, if any, are recorded at the fair market value of the securities received. Distributions received on securities that represent a return of capital or capital gain are recorded as a reduction of cost of investments and/or as a realized gain. The Fund estimates the components of distributions received that may be considered return of capital distributions or capital gain distributions. Interest income and distributions from the Fidelity Central Funds are accrued as earned. Interest income includes coupon interest and amortization of premium and accretion of discount on debt securities. Investment income is recorded net of foreign taxes withheld where recovery of such taxes is uncertain.
Expenses. Most expenses of the trust can be directly attributed to a fund. Expenses which cannot be directly attributed are apportioned among each Fund in the trust. Expense estimates are accrued in the period to which they relate and adjustments are made when actual amounts are known.
Income Tax Information and Distributions to Shareholders. Each year, the Fund intends to qualify as a regulated investment company by distributing substantially all of its taxable income and realized gains under Subchapter M of the Internal Revenue Code and filing its U.S. federal tax return. As a result, no provision for income taxes is required. As of April 30, 2010, the Fund did not have any unrecognized tax benefits in the accompanying financial statements. A Fund's federal tax return is subject to examination by the
Annual Report
Notes to Financial Statements - continued
(Amounts in thousands except ratios)
3. Significant Accounting Policies - continued
Income Tax Information and Distributions to Shareholders - continued
Internal Revenue Service (IRS) for a period of three years. Foreign taxes are provided for based on the Fund's understanding of the tax rules and rates that exist in the foreign markets in which it invests.
Distributions are recorded on the ex-dividend date. Income and capital gain distributions are determined in accordance with income tax regulations, which may differ from generally accepted accounting principles.
Capital accounts within the financial statements are adjusted for permanent book-tax differences. These adjustments have no impact on net assets or the results of operations. Temporary book-tax differences will reverse in a subsequent period.
Book-tax differences are primarily due to the short-term gain distributions from the Fidelity Central Funds, futures transactions, foreign currency transactions, passive foreign investment companies (PFIC), partnerships, net operating losses, capital loss carryforwards, losses deferred due to wash sales and excise tax regulations.
The federal tax cost of investment securities and unrealized appreciation (depreciation) as of period end were as follows:
Gross unrealized appreciation | $ 1,133,442 |
Gross unrealized depreciation | (191,958) |
Net unrealized appreciation (depreciation) | $ 941,484 |
| |
Tax Cost | $ 3,531,518 |
The tax-based components of distributable earnings as of period end were as follows:
Undistributed ordinary income | $ - |
Capital loss carryforward | $ (706,581) |
Net unrealized appreciation (depreciation) | $ 941,484 |
The tax character of distributions paid was as follows:
| April 30, 2010 | April 30, 2009 |
Ordinary Income | $ - | $ 2,269 |
Long-term Capital Gains | - | 56,687 |
Total | $ - | $ 58,956 |
Annual Report
3. Significant Accounting Policies - continued
Short-Term Trading (Redemption) Fees. Shares held in the Fund less than 90 days are subject to a redemption fee equal to 2.00% of the proceeds of the redeemed shares. All redemption fees, including any estimated redemption fees paid by FMR, are retained by the Fund and accounted for as an addition to paid in capital.
4. Operating Policies.
Restricted Securities. The Fund may invest in securities that are subject to legal or contractual restrictions on resale. These securities generally may be resold in transactions exempt from registration or to the public if the securities are registered. Disposal of these securities may involve time-consuming negotiations and expense, and prompt sale at an acceptable price may be difficult. Information regarding restricted securities is included at the end of the Fund's Schedule of Investments.
5. Investments in Derivative Instruments.
Objectives and Strategies for Investing in Derivative Instruments. The Fund uses derivative instruments ("derivatives"), including futures contracts, in order to meet its investment objectives. The Fund's strategy is to use derivatives as a risk management tool and as an additional way to gain exposure to certain types of assets. The success of any strategy involving derivatives depends on analysis of numerous economic factors, and if the strategies for investment do not work as intended, the Fund may not achieve its objectives.
While utilizing derivatives in pursuit of its investment objectives, the Fund is exposed to certain financial risk relative to those derivatives. This risk is further explained below:
Equity Risk | Equity risk is the risk that the value of financial instruments will fluctuate as a result of changes in market prices (other than those arising from interest rate risk or foreign exchange risk), whether caused by factors specific to an individual investment, its issuer, or all factors affecting all instruments traded in a market or market segment. |
The following notes provide more detailed information about each derivative type held by the Fund:
Futures Contracts. The Fund uses futures contracts to manage its exposure to the stock market. A futures contract is an agreement between two parties to buy or sell a specified underlying instrument for a fixed price at a specified future date. Buying futures tends to increase a fund's exposure to the underlying instrument, while selling futures tends to decrease a fund's exposure to the underlying instrument. Risks of loss may include equity risk, and potential lack of liquidity in the market. Futures have
Annual Report
Notes to Financial Statements - continued
(Amounts in thousands except ratios)
5. Investments in Derivative Instruments - continued
Futures Contracts - continued
minimal counterparty risk to the Fund since the exchange's clearinghouse, as counterparty to all exchange-traded futures, guarantees the futures against default.
The purchaser or seller of a futures contract is not required to pay for or deliver the instrument unless the contract is held until the delivery date. Upon entering into a futures contract, a fund is required to deposit with a clearing broker, no later than the following business day, an amount ("initial margin") equal to a certain percentage of the face value of the contract. The initial margin may be in the form of cash or securities and is transferred to a segregated account on settlement date. Securities deposited to meet margin requirements are identified in the Fund's Schedule of Investments. Futures contracts are marked-to-market daily and subsequent payments ("variation margin") are made or received by a fund depending on the daily fluctuations in the value of the futures contract. These amounts are reflected as receivables or payables on the Statement of Assets and Liabilities and changes in value are recognized as unrealized gain (loss). Realized gain (loss) is recorded upon the expiration or closing of the futures contract. The net realized gain (loss) and change in unrealized gain (loss) on futures contracts during the period is included on the Statement of Operations.
At the end of the period, the Fund had no open futures contracts.
Realized and Change in Unrealized Gain (Loss) on Derivative Instruments. A summary of the Fund's value of derivatives by primary risk exposure as of period end, if any, is included at the end of the Fund's Schedule of Investments. The table below reflects the Fund's realized gain (loss) and change in unrealized gain (loss) for derivatives during the period.
Risk Exposure / Derivative Type | Realized Gain (Loss) | Change in
Unrealized Gain (Loss) |
Equity Risk | | |
Futures Contracts | $ 7,047 | $ - |
| | |
Total Derivatives Realized and Change in Unrealized Gain (Loss) (a) | $ 7,047 | $ - |
(a) Total derivatives realized gain (loss) included in the Statement of Operations is comprised of $7,047 for futures contracts
6. Purchases and Sales of Investments.
Purchases and sales of securities other than short-term securities, aggregated $1,986,423 and $1,929,057, respectively.
Annual Report
7. Fees and Other Transactions with Affiliates.
Management Fee. FMR and its affiliates provide the Fund with investment management related services for which the Fund pays a monthly management fee. The management fee is the sum of an individual fund fee rate that is based on an annual rate of .45% of the Fund's average net assets and a group fee rate that averaged .26% during the period. The group fee rate is based upon the average net assets of all the mutual funds advised by FMR. The group fee rate decreases as assets under management increase and increases as assets under management decrease. In addition, the management fee is subject to a performance adjustment (up to a maximum of ±.20% of the Fund's average net assets over a 36 month performance period). The upward or downward adjustment to the management fee is based on the Fund's relative investment performance as compared to an appropriate benchmark index. For the period, the total annual management fee rate, including the performance adjustment, was .92% of the Fund's average net assets.
Transfer Agent Fees. Fidelity Investments Institutional Operations Company, Inc. (FIIOC), an affiliate of FMR, is the Fund's transfer, dividend disbursing and shareholder servicing agent. FIIOC receives account fees and asset-based fees that vary according to account size and type of account. FIIOC pays for typesetting, printing and mailing of shareholder reports, except proxy statements. For the period, the transfer agent fees were equivalent to an annual rate of .28% of average net assets.
Accounting and Security Lending Fees. FSC maintains the Fund's accounting records. The accounting fee is based on the level of average net assets for the month. Under a separate contract, FSC administers the security lending program. The security lending fee is based on the number and duration of lending transactions.
Brokerage Commissions. The Fund placed a portion of its portfolio transactions with brokerage firms which are affiliates of the investment adviser. The commissions paid to these affiliated firms were $127 for the period.
Interfund Lending Program. Pursuant to an Exemptive Order issued by the SEC, the Fund, along with other registered investment companies having management contracts with FMR, may participate in an interfund lending program. This program provides an alternative credit facility allowing the funds to borrow from, or lend money to, other participating affiliated funds. At period end, there were no interfund loans outstanding. The Fund's activity in this program during the period for which loans were outstanding was as follows:
Borrower or Lender | Average Daily
Loan Balance | Weighted Average Interest Rate | Interest Expense |
Borrower | $ 12,107 | .46% | $ 1 |
Annual Report
Notes to Financial Statements - continued
(Amounts in thousands except ratios)
8. Committed Line of Credit.
The Fund participates with other funds managed by FMR in a $3.75 billion credit facility (the "line of credit") to be utilized for temporary or emergency purposes to fund shareholder redemptions or for other short-term liquidity purposes. The Fund has agreed to pay commitment fees on its pro-rata portion of the line of credit, which amounted to $13 and is reflected in Miscellaneous Expense on the Statement of Operations. During the period, there were no borrowings on this line of credit.
9. Security Lending.
The Fund lends portfolio securities from time to time in order to earn additional income. On the settlement date of the loan, the Fund receives collateral (in the form of U.S. Treasury obligations, letters of credit and/or cash) against the loaned securities and maintains collateral in an amount not less than 100% of the market value of the loaned securities during the period of the loan. The market value of the loaned securities is determined at the close of business of the Fund and any additional required collateral is delivered to the Fund on the next business day. If the borrower defaults on its obligation to return the securities loaned because of insolvency or other reasons, a fund could experience delays and costs in recovering the securities loaned or in gaining access to the collateral. Any cash collateral received is invested in the Fidelity Securities Lending Cash Central Fund. The value of loaned securities and cash collateral at period end are disclosed on the Fund's Statement of Assets and Liabilities. Security lending income represents the income earned on investing cash collateral, less fees and expenses associated with the loan, plus any premium payments that may be received on the loan of certain types of securities. Security lending income is presented in the Statement of Operations as a component of income from Fidelity Central Funds.
10. Bank Borrowings.
The Fund is permitted to have bank borrowings for temporary or emergency purposes to fund shareholder redemptions. The Fund has established borrowing arrangements with certain banks. The interest rate on the borrowings is the bank's base rate, as revised from time to time. The average daily loan balance during the period for which loans were outstanding amounted to $5,992. The weighted average interest rate was .62%. The interest expense amounted to one hundred three dollars under the bank borrowing program.
11. Expense Reductions.
Many of the brokers with whom FMR places trades on behalf of the Fund provided services to the Fund in addition to trade execution. These services included payments of certain expenses on behalf of the Fund totaling $324 for the period.
Annual Report
12. Other.
The Fund's organizational documents provide former and current trustees and officers with a limited indemnification against liabilities arising in connection with the performance of their duties to the Fund. In the normal course of business, the Fund may also enter into contracts that provide general indemnifications. The Fund's maximum exposure under these arrangements is unknown as this would be dependent on future claims that may be made against the Fund. The risk of material loss from such claims is considered remote.
Annual Report
To the Trustees of Fidelity Commonwealth Trust and Shareholders of Fidelity Small Cap Stock Fund:
We have audited the accompanying statement of assets and liabilities of Fidelity Small Cap Stock Fund (the Fund), a fund of Fidelity Commonwealth Trust, including the schedule of investments, as of April 30, 2010, and the related statement of operations for the year then ended, the statement of changes in net assets for each of the two years in the period then ended, and the financial highlights for each of the five years in the period then ended. These financial statements and financial highlights are the responsibility of the Fund's management. Our responsibility is to express an opinion on these financial statements and financial highlights based on our audits.
We conducted our audits in accordance with standards of the Public Company Accounting Oversight Board (United States). Those standards require that we plan and perform the audit to obtain reasonable assurance about whether the financial statements and financial highlights are free of material misstatement. The Fund is not required to have, nor were we engaged to perform, an audit of its internal control over financial reporting. Our audits included consideration of internal control over financial reporting as a basis for designing audit procedures that are appropriate in the circumstances, but not for the purpose of expressing an opinion on the effectiveness of the Fund's internal control over financial reporting. Accordingly, we express no such opinion. An audit also includes examining, on a test basis, evidence supporting the amounts and disclosures in the financial statements, assessing the accounting principles used and significant estimates made by management, as well as evaluating the overall financial statement presentation. Our procedures included confirmation of securities owned as of April 30, 2010, by correspondence with the custodians and brokers; where replies were not received from brokers, we performed other auditing procedures. We believe that our audits provide a reasonable basis for our opinion.
In our opinion, the financial statements and financial highlights referred to above present fairly, in all material respects, the financial position of Fidelity Small Cap Stock Fund as of April 30, 2010, the results of its operations for the year then ended, the changes in its net assets for each of the two years in the period then ended, and the financial highlights for each of the five years in the period then ended, in conformity with accounting principles generally accepted in the United States of America.
/s/ Deloitte & Touche LLP
DELOITTE & TOUCHE LLP
Boston, Massachusetts
June 17, 2010
Annual Report
The Trustees, Member of the Advisory Board, and executive officers of the trust and fund, as applicable, are listed below. The Board of Trustees governs the fund and is responsible for protecting the interests of shareholders. The Trustees are experienced executives who meet periodically throughout the year to oversee the fund's activities, review contractual arrangements with companies that provide services to the fund, oversee management of the risks associated with such activities and contractual arrangements, and review the fund's performance. Except for James C. Curvey, each of the Trustees oversees 222 funds advised by FMR or an affiliate. Mr. Curvey oversees 411 funds advised by FMR or an affiliate.
The Trustees hold office without limit in time except that (a) any Trustee may resign; (b) any Trustee may be removed by written instrument, signed by at least two-thirds of the number of Trustees prior to such removal; (c) any Trustee who requests to be retired or who has become incapacitated by illness or injury may be retired by written instrument signed by a majority of the other Trustees; and (d) any Trustee may be removed at any special meeting of shareholders by a two-thirds vote of the outstanding voting securities of the trust. Each Trustee who is not an interested person (as defined in the 1940 Act) (Independent Trustee), shall retire not later than the last day of the calendar year in which his or her 72nd birthday occurs. The Independent Trustees may waive this mandatory retirement age policy with respect to individual Trustees. The executive officers and Advisory Board Member hold office without limit in time, except that any officer and Advisory Board Member may resign or may be removed by a vote of a majority of the Trustees at any regular meeting or any special meeting of the Trustees. Except as indicated, each individual has held the office shown or other offices in the same company for the past five years.
Experience, Skills, Attributes, and Qualifications of the Fund's Trustees. The Governance and Nominating Committee has adopted a statement of policy that describes the experience, qualifications, attributes, and skills that are necessary and desirable for potential Independent Trustee candidates (Statement of Policy). The Board believes that each Trustee satisfied at the time he or she was initially elected or appointed a Trustee, and continues to satisfy, the standards contemplated by the Statement of Policy. The Governance and Nominating Committee also engages professional search firms to help identify potential Independent Trustee candidates who have the experience, qualifications, attributes, and skills consistent with the Statement of Policy. From time to time, additional criteria based on the composition and skills of the current Independent Trustees, as well as experience or skills that may be appropriate in light of future changes to board composition, business conditions, and regulatory or other developments, have also been considered by the professional search firms and the Governance and Nominating Committee. In addition, the Board takes into account the Trustees' commitment and participation in Board and committee meetings, as well as their leadership of standing and ad hoc committees throughout their tenure.
In determining that a particular Trustee was and continues to be qualified to serve as a Trustee, the Board has considered a variety of criteria, none of which, in isolation, was controlling. The Board believes that, collectively, the Trustees have balanced and diverse experience, qualifications, attributes, and skills, which allow the Board to operate effectively in governing the fund and protecting the interests of shareholders. Information about the specific experience, skills, attributes, and qualifications of each Trustee, which in each case led to the Board's conclusion that the Trustee should serve (or continue to serve) as a trustee of the fund, is provided below.
Annual Report
Trustees and Officers - continued
Board Structure and Oversight Function. Edward C. Johnson 3d is an interested person (as defined in the 1940 Act) and currently serves as Chairman. The Trustees have determined that an interested Chairman is appropriate and benefits shareholders because an interested Chairman has a personal and professional stake in the quality and continuity of services provided to the fund. Independent Trustees exercise their informed business judgment to appoint an individual of their choosing to serve as Chairman, regardless of whether the Trustee happens to be independent or a member of management. The Independent Trustees have determined that they can act independently and effectively without having an Independent Trustee serve as Chairman and that a key structural component for assuring that they are in a position to do so is for the Independent Trustees to constitute a substantial majority for the Board. The Independent Trustees also regularly meet in executive session. Ned C. Lautenbach serves as Chairman of the Independent Trustees and as such (i) acts as a liaison between the Independent Trustees and management with respect to matters important to the Independent Trustees and (ii) with management prepares agendas for Board meetings.
Fidelity funds are overseen by different Boards of Trustees. The fund's Board oversees Fidelity's equity and high income funds and another Board oversees Fidelity's investment-grade bond, money market, and asset allocation funds. The asset allocation funds may invest in Fidelity funds overseen by the fund's Board. The use of separate Boards, each with its own committee structure, allows the Trustees of each group of Fidelity funds to focus on the unique issues of the funds they oversee, including common research, investment, and operational issues. On occasion, the separate Boards establish joint committees to address issues of overlapping consequences for the Fidelity funds overseen by each Board.
The Trustees operate using a system of committees to facilitate the timely and efficient consideration of all matters of importance to the Trustees, the fund, and fund shareholders and to facilitate compliance with legal and regulatory requirements and oversight of the fund's activities and associated risks. The Board, acting through its committees, has charged FMR and its affiliates with (i) identifying events or circumstances the occurrence of which could have demonstrably adverse effects on the fund's business and/or reputation; (ii) implementing processes and controls to lessen the possibility that such events or circumstances occur or to mitigate the effects of such events or circumstances if they do occur; and (iii) creating and maintaining a system designed to evaluate continuously business and market conditions in order to facilitate the identification and implementation processes described in (i) and (ii) above. Because the day-to-day operations and activities of the fund are carried out by or through FMR, its affiliates and other service providers, the fund's exposure to risks is mitigated but not eliminated by the processes overseen by the Trustees. While each of the Board's committees has responsibility for overseeing different aspects of the fund's activities, oversight is exercised primarily through the Operations, Audit, and Compliance Committees. Appropriate personnel, including but not limited to the fund's Chief Compliance Officer (CCO), FMR's internal auditor, the independent accountants, the fund's Treasurer and portfolio management personnel, make periodic reports to the Board's committees, as appropriate. The responsibilities of each committee, including their oversight responsibilities, are described further under "Standing Committees of the Fund's Trustees."
Annual Report
The fund's Statement of Additional Information (SAI) includes more information about the Trustees. To request a free copy, call Fidelity at 1-800-544-8544.
Interested Trustees*:
Correspondence intended for each Trustee who is an interested person may be sent to Fidelity Investments, 82 Devonshire Street, Boston, Massachusetts 02109.
Name, Age; Principal Occupations and Other Relevant Experience+ |
Edward C. Johnson 3d (79) |
| Year of Election or Appointment: 1974 Mr. Johnson is Trustee and Chairman of the Board of Trustees of certain Trusts. Mr. Johnson serves as Chief Executive Officer, Chairman, and a Director of FMR LLC; Chairman and a Director of FMR; Chairman and a Director of Fidelity Research & Analysis Company (FRAC); Chairman and a Director of Fidelity Investments Money Management, Inc.; and Chairman and a Director of FMR Co., Inc. In addition, Mr. Johnson serves as Chairman and Director of FIL Limited. Previously, Mr. Johnson served as President of FMR LLC (2006-2007). |
James C. Curvey (74) |
| Year of Election or Appointment: 2007 Mr. Curvey also serves as Trustee (2007-present) of other investment companies advised by FMR. Mr. Curvey is a Director of FMR and FMR Co., Inc. (2007-present). Mr. Curvey is also Vice Chairman (2006-present) and Director of FMR LLC. In addition, Mr. Curvey serves as an Overseer for the Boston Symphony Orchestra and a member of the Trustees of Villanova University. |
* Trustees have been determined to be "Interested Trustees" by virtue of, among other things, their affiliation with the trust or various entities under common control with FMR.
+ The information above includes each Trustee's principal occupation during the last five years and other information relating to the experience, attributes, and skills relevant to each Trustee's qualifications to serve as a Trustee, which led to the conclusion that each Trustee should serve as a Trustee for the fund.
Annual Report
Trustees and Officers - continued
Independent Trustees:
Correspondence intended for each Independent Trustee (that is, the Trustees other than the Interested Trustees) may be sent to Fidelity Investments, P.O. Box 55235, Boston, Massachusetts 02205-5235.
Name, Age; Principal Occupations and Other Relevant Experience+ |
Dennis J. Dirks (61) |
| Year of Election or Appointment: 2005 Prior to his retirement in May 2003, Mr. Dirks was Chief Operating Officer and a member of the Board of The Depository Trust & Clearing Corporation (DTCC). He also served as President, Chief Operating Officer, and Board member of The Depository Trust Company (DTC) and President and Board member of the National Securities Clearing Corporation (NSCC). In addition, Mr. Dirks served as Chief Executive Officer and Board member of the Government Securities Clearing Corporation, Chief Executive Officer and Board member of the Mortgage-Backed Securities Clearing Corporation, as a Trustee and a member of the Finance Committee of Manhattan College (2005-2008), and as a Trustee and a member of the Finance Committee of AHRC of Nassau County (2006-2008). Currently, Mr. Dirks serves as a member of the Board of Directors for The Brookville Center for Children's Services, Inc. (2009-present). |
Alan J. Lacy (56) |
| Year of Election or Appointment: 2008 Mr. Lacy serves as Senior Adviser (2007-present) of Oak Hill Capital Partners, L.P. (private equity). Mr. Lacy also served as Chief Executive Officer (2000-2005) and Vice Chairman (2005-2006) of Sears Holdings Corporation and Sears, Roebuck and Co. (retail). In addition, Mr. Lacy serves as a member of the Board of Directors of The Western Union Company (global money transfer, 2006-present) and Bristol-Myers Squibb Company (global pharmaceuticals, 2007-present). Mr. Lacy is Chairman (2008-present) and a member (2006-present) of the Board of Trustees of The National Parks Conservation Association. |
Ned C. Lautenbach (66) |
| Year of Election or Appointment: 2000 Mr. Lautenbach is Chairman of the Independent Trustees of the Equity and High Income Funds (2006-present). Mr. Lautenbach is an Advisory Partner of Clayton, Dubilier & Rice, Inc. (private equity investment, 2008-present) and was previously a Partner of Clayton, Dubilier & Rice, Inc. (1998-2008). Previously, Mr. Lautenbach was with the International Business Machines Corporation (IBM) from 1968 until his retirement in 1998. Mr. Lautenbach serves as a Director of Eaton Corporation (diversified industrial) as well as the Philharmonic Center for the Arts in Naples, Florida. Mr. Lautenbach is also a member of the Board of Trustees of Fairfield University (2005-present), as well as a member of the Council on Foreign Relations. Previously, Mr. Lautenbach served as a Director of Sony Corporation (2006-2007). |
Joseph Mauriello (65) |
| Year of Election or Appointment: 2008 Prior to his retirement in January 2006, Mr. Mauriello served in numerous senior management positions including Deputy Chairman and Chief Operating Officer (2004-2005), and Vice Chairman of Financial Services (2002-2004) of KPMG LLP US (professional services, 1965-2005). Mr. Mauriello currently serves as a member of the Board of Directors of XL Capital Ltd. (global insurance and re-insurance, 2006-present) and of Arcadia Resources Inc. (health care services and products, 2007-present). Previously, Mr. Mauriello served as a Director of the Hamilton Funds of the Bank of New York (2006-2007). |
Cornelia M. Small (65) |
| Year of Election or Appointment: 2005 Ms. Small is a member of the Board of Directors of the Teagle Foundation (2009-present). Ms. Small is also a member of the Investment Committee, and Chair (2008-present) and a member of the Board of Trustees of Smith College. In addition, Ms. Small serves on the Investment Committee of the Berkshire Taconic Community Foundation (2008-present). Previously, Ms. Small served as Chairperson of the Investment Committee (2002-2008) of Smith College. In addition, Ms. Small served as Chief Investment Officer, Director of Global Equity Investments, and a member of the Board of Directors of Scudder, Stevens & Clark and Scudder Kemper Investments. |
William S. Stavropoulos (70) |
| Year of Election or Appointment: 2002 Mr. Stavropoulos is Vice Chairman of the Independent Trustees of the Equity and High Income Funds (2006-present). Mr. Stavropoulos serves as President and Founder of the Michigan Baseball Foundation, the Great Lakes Loons (2007-present). Mr. Stavropoulos is Chairman Emeritus of the Board of Directors of The Dow Chemical Company, where he previously served in numerous senior management positions, including President, CEO (1995-2000; 2002-2004), Chairman of the Executive Committee (2000-2006), and as a member of the Board of Directors (1990-2006). Currently, Mr. Stavropoulos is a Director of Teradata Corporation (data warehousing and technology solutions, 2008-present), Chemical Financial Corporation, Maersk Inc. (industrial conglomerate), Tyco International, Inc. (multinational manufacturing and services, 2007-present), and a member of the Advisory Board for Metalmark Capital (private equity investment, 2005-present). Mr. Stavropoulos is a special advisor to Clayton, Dubilier & Rice, Inc. (private equity investment). In addition, Mr. Stavropoulos is a member of the University of Notre Dame Advisory Council for the College of Science. |
David M. Thomas (60) |
| Year of Election or Appointment: 2008 Previously, Mr. Thomas served as Executive Chairman (2005-2006) and Chairman and Chief Executive Officer (2000-2005) of IMS Health, Inc. (pharmaceutical and healthcare information solutions). In addition, Mr. Thomas serves as a member of the Board of Directors of Fortune Brands, Inc. (consumer products), and Interpublic Group of Companies, Inc. (marketing communication, 2004-present). |
Michael E. Wiley (59) |
| Year of Election or Appointment: 2008 Mr. Wiley also serves as a Director of Asia Pacific Exploration Consolidated (international oil and gas exploration and production, 2008-present), and as a member of the Board of Trustees of the University of Tulsa (2000-2006; 2007-present). Mr. Wiley serves as a Director of Tesoro Corporation (independent oil refiner and marketer, 2005-present), and a Director of Bill Barrett Corporation (exploration and production, 2005-present). In addition, Mr. Wiley also serves as a Director of Post Oak Bank (privately-held bank, 2004-present). Previously, Mr. Wiley served as a Sr. Energy Advisor of Katzenbach Partners, LLC (consulting, 2006-2007), as an Advisory Director of Riverstone Holdings (private investment), Chairman, President, and CEO of Baker Hughes, Inc. (oilfield services, 2000-2004), and as Director of Spinnaker Exploration Company (exploration and production, 2001-2005). |
+ The information above includes each Trustee's principal occupation during the last five years and other information relating to the experience, attributes, and skills relevant to each Trustee's qualifications to serve as a Trustee, which led to the conclusion that each Trustee should serve as a Trustee for the fund.
Advisory Board Member and Executive Officers:
Correspondence intended for each executive officer and Peter S. Lynch may be sent to Fidelity Investments, 82 Devonshire Street, Boston, Massachusetts 02109.
Name, Age; Principal Occupation |
Peter S. Lynch (66) |
| Year of Election or Appointment: 2003 Member of the Advisory Board of Fidelity's Equity and High Income Funds. Mr. Lynch is Vice Chairman and a Director of FMR and FMR Co., Inc. In addition, Mr. Lynch serves as a Trustee of Boston College and as the Chairman of the Inner-City Scholarship Fund. Previously, Mr. Lynch served on the Special Olympics International Board of Directors (1997-2006). |
Kenneth B. Robins (40) |
| Year of Election or Appointment: 2008 President and Treasurer of Fidelity's Equity and High Income Funds. Mr. Robins also serves as President and Treasurer (2010-present) and Assistant Treasurer (2009-present) of other Fidelity funds and is an employee of Fidelity Investments (2004-present). Previously, Mr. Robins served as Deputy Treasurer of the Fidelity funds (2005-2008) and Treasurer and Chief Financial Officer of The North Carolina Capital Management Trust: Cash and Term Portfolios (2006-2008). |
Brian B. Hogan (45) |
| Year of Election or Appointment: 2009 Vice President of certain Equity Funds and Vice President of Sector Funds. Mr. Hogan also serves as Senior Vice President, Equity Research of FMR (2006-present) and President of FMR's Equity Division (2009-present). Previously, Mr. Hogan served as a portfolio manager. |
Thomas C. Hense (46) |
| Year of Election or Appointment: 2008 Vice President of Fidelity's High Income and Small Cap Funds. Previously, Mr. Hense served as a portfolio manager for Fidelity's Institutional Money Management Group (Pyramis) (2003-2008). |
Scott C. Goebel (42) |
| Year of Election or Appointment: 2008 Secretary and Chief Legal Officer (CLO) of the Fidelity funds. Mr. Goebel also serves as General Counsel, Secretary, and Senior Vice President of FMR (2008-present) and FMR Co., Inc. (2008-present); Deputy General Counsel of FMR LLC; Chief Legal Officer of Fidelity Management & Research (Hong Kong) Limited (2008-present) and Assistant Secretary of Fidelity Management & Research (Japan) Inc. (2008-present), Fidelity Investments Money Management, Inc. (2008-present), Fidelity Management & Research (U.K.) Inc. (2008-present), and Fidelity Research and Analysis Company (2008-present). Previously, Mr. Goebel served as Assistant Secretary of the Funds (2007-2008) and as Vice President and Secretary of Fidelity Distributors Corporation (FDC) (2005-2007). |
William C. Coffey (41) |
| Year of Election or Appointment: 2009 Assistant Secretary of Fidelity's Equity and High Income Funds. Mr. Coffey also serves as Senior Vice President and Deputy General Counsel of FMR LLC (2010-present), and is an employee of Fidelity Investments. Previously, Mr. Coffey served as Vice President and Associate General Counsel of FMR LLC (2005-2009). |
Holly C. Laurent (55) |
| Year of Election or Appointment: 2008 Anti-Money Laundering (AML) Officer of the Fidelity funds. Ms. Laurent is an employee of Fidelity Investments. Previously, Ms. Laurent was Senior Vice President and Head of Legal for Fidelity Business Services India Pvt. Ltd. (2006-2008), and Senior Vice President, Deputy General Counsel and Group Head for FMR LLC (2005-2006). |
Christine Reynolds (51) |
| Year of Election or Appointment: 2008 Chief Financial Officer of the Fidelity funds. Ms. Reynolds became President of Fidelity Pricing and Cash Management Services (FPCMS) in August 2008. Ms. Reynolds served as Chief Operating Officer of FPCMS (2007-2008). Previously, Ms. Reynolds served as President, Treasurer, and Anti-Money Laundering officer of the Fidelity funds (2004-2007). |
Kenneth A. Rathgeber (62) |
| Year of Election or Appointment: 2004 Chief Compliance Officer of Fidelity's Equity and High Income Funds. Mr. Rathgeber is Chief Compliance Officer of Fidelity Management & Research (Hong Kong) Limited (2008-present), Fidelity Management & Research (Japan) Inc. (2008-present), FMR (2005-present), FMR Co., Inc. (2005-present), Fidelity Management & Research (U.K.) Inc. (2005-present), Fidelity Research & Analysis Company (2005-present), Fidelity Investments Money Management, Inc. (2005-present), Pyramis Global Advisors, LLC (2005-present), and Strategic Advisers, Inc. (2005-present). |
Jeffrey S. Christian (48) |
| Year of Election or Appointment: 2009 Deputy Treasurer of the Fidelity funds. Mr. Christian is an employee of Fidelity Investments. Previously, Mr. Christian served as Chief Financial Officer (2008-2009) of certain Fidelity funds and Senior Vice President of Fidelity Pricing and Cash Management Services (FPCMS) (2004-2009). |
Bryan A. Mehrmann (49) |
| Year of Election or Appointment: 2005 Deputy Treasurer of the Fidelity funds. Mr. Mehrmann is an employee of Fidelity Investments. |
Adrien E. Deberghes (42) |
| Year of Election or Appointment: 2008 Deputy Treasurer of Fidelity's Equity and High Income Funds. Mr. Deberghes is an employee of Fidelity Investments (2008-present). Previously, Mr. Deberghes served as Senior Vice President of Mutual Fund Administration at State Street Corporation (2007-2008), Senior Director of Mutual Fund Administration at Investors Bank & Trust (2005-2007), and Director of Finance for Dunkin' Brands (2000-2005). |
John R. Hebble (51) |
| Year of Election or Appointment: 2009 Assistant Treasurer of Fidelity's Equity and High Income Funds. Mr. Hebble also serves as Treasurer and Chief Financial Officer of The North Carolina Capital Management Trust: Cash and Term Portfolio (2008-present), President and Treasurer of other Fidelity funds (2008-present) and is an employee of Fidelity Investments. |
Gary W. Ryan (51) |
| Year of Election or Appointment: 2005 Assistant Treasurer of the Fidelity funds. Mr. Ryan is an employee of Fidelity Investments. Previously, Mr. Ryan served as Vice President of Fund Reporting in Fidelity Pricing and Cash Management Services (FPCMS) (1999-2005). |
Annual Report
Managing Your Investments
Fidelity offers several ways to conveniently manage your personal investments via your telephone or PC. You can access your account information, conduct trades and research your investments 24 hours a day.
By Phone
Fidelity Automated Service Telephone provides a single toll-free number to access account balances, positions, quotes and trading. It's easy to navigate the service, and on your first call, the system will help you create a personal identification number (PIN) for security.
(phone_graphic)
Fidelity Automated
Service Telephone (FAST®)
1-800-544-5555
Press
For mutual fund and brokerage trading.
For quotes.*
For account balances and holdings.
To review orders and mutual
fund activity.
To change your PIN.
To speak to a Fidelity representative.
By PC
Fidelity's web site on the Internet provides a wide range of information, including daily financial news, fund performance, interactive planning tools and news about Fidelity products and services.
(computer_graphic)
Fidelity's Web Site
www.fidelity.com
* When you call the quotes line, please remember that a fund's yield and return will vary and, except for money market funds, share price will also vary. This means that you may have a gain or loss when you sell your shares. There is no assurance that money market funds will be able to maintain a stable $1 share price; an investment in a money market fund is not insured or guaranteed by the U.S. government. Total returns are historical and include changes in share price, reinvestment of dividends and capital gains, and the effects of any sales charges.
Annual Report
Investment Adviser
Fidelity Management & Research Company
Boston, MA
Investment Sub-Advisers
FMR Co., Inc.
Fidelity Research & Analysis Company
Fidelity Management & Research
(U.K.) Inc.
FIL Investments (Japan) Limited
FIL Investment Advisors
FIL Investment Advisors (U.K.) Ltd.
Fidelity Management & Research
(Hong Kong) Limited
Fidelity Management & Research
(Japan) Inc.
General Distributor
Fidelity Distributors Corporation
Boston, MA
Transfer and Service Agents
Fidelity Investments Institutional
Operations Company, Inc.
Boston, MA
Fidelity Service Company, Inc.
Boston, MA
Custodian
Brown Brothers Harriman & Co.
Boston, MA
The Fidelity Telephone Connection
Mutual Fund 24-Hour Service
Exchanges/Redemptions
and Account Assistance 1-800-544-6666
Product Information 1-800-544-6666
Retirement Accounts 1-800-544-4774
(8 a.m. - 9 p.m.)
TDD Service 1-800-544-0118
for the deaf and hearing impaired
(9 a.m. - 9 p.m. Eastern time)
Fidelity Automated Service
Telephone (FAST®) 1-800-544-5555
Automated line for quickest service
SLCX-UANN-0610
1.784727.107
Item 2. Code of Ethics
As of the end of the period, April 30, 2010, Fidelity Commonwealth Trust (the trust) has adopted a code of ethics, as defined in Item 2 of Form N-CSR, that applies to its President and Treasurer and its Chief Financial Officer. A copy of the code of ethics is filed as an exhibit to this Form N-CSR.
Item 3. Audit Committee Financial Expert
The Board of Trustees of the trust has determined that Joseph Mauriello is an audit committee financial expert, as defined in Item 3 of Form N-CSR. Mr. Mauriello is independent for purposes of Item 3 of Form N-CSR.
Item 4. Principal Accountant Fees and Services
Fees and Services
The following table presents fees billed by Deloitte & Touche LLP, the member firms of Deloitte Touche Tohmatsu, and their respective affiliates (collectively, "Deloitte Entities") in each of the last two fiscal years for services rendered to Fidelity Large Cap Stock Fund, Fidelity Mid-Cap Stock Fund, Fidelity Small Cap Discovery Fund, Fidelity and Small Cap Stock Fund (the "Funds"):
Services Billed by Deloitte Entities
April 30, 2010 FeesA
| Audit Fees | Audit-Related Fees | Tax Fees | All Other Fees |
Fidelity Large Cap Stock Fund | $36,000 | $- | $4,500 | $- |
Fidelity Mid-Cap Stock Fund | $36,000 | $- | $4,500 | $- |
Fidelity Small Cap Discovery Fund | $42,000 | $- | $4,500 | $- |
Fidelity Small Cap Stock Fund | $42,000 | $- | $4,500 | $- |
April 30, 2009 FeesA
| Audit Fees | Audit-Related Fees | Tax Fees | All Other Fees |
Fidelity Large Cap Stock Fund | $39,000 | $- | $4,500 | $- |
Fidelity Mid-Cap Stock Fund | $38,000 | $- | $4,500 | $- |
Fidelity Small Cap Discovery Fund | $42,000 | $- | $4,500 | $- |
Fidelity Small Cap Stock Fund | $43,000 | $- | $4,500 | $- |
A Amounts may reflect rounding.
The following table presents fees billed by Deloitte Entities that were required to be approved by the Audit Committee for services that relate directly to the operations and financial reporting of the Funds and that are rendered on behalf of Fidelity Management & Research Company ("FMR") and entities controlling, controlled by, or under common control with FMR (not including any sub-adviser whose role is primarily portfolio management and is subcontracted with or overseen by another investment adviser) that provide ongoing services to the Funds ("Fund Service Providers"):
Services Billed by Deloitte Entities
| April 30, 2010A | April 30, 2009A |
Audit-Related Fees | $725,000 | $815,000 |
Tax Fees | $- | $2,000 |
All Other Fees | $450,000 | $445,000 |
A Amounts may reflect rounding.
"Audit-Related Fees" represent fees billed for assurance and related services that are reasonably related to the performance of the fund audit or the review of the fund's financial statements and that are not reported under Audit Fees.
"Tax Fees" represent fees billed for tax compliance, tax advice or tax planning that relate directly to the operations and financial reporting of the fund.
"All Other Fees" represent fees billed for assurance services provided to the fund or Fund Service Provider that relate directly to the operations and financial reporting of the fund, excluding those services that are reported under Audit Fees, Audit-Related Fees or Tax Fees.
Assurance services must be performed by an independent public accountant.
* * *
The aggregate non-audit fees billed by Deloitte Entities for services rendered to the Funds, FMR (not including any sub-adviser whose role is primarily portfolio management and is subcontracted with or overseen by another investment adviser), and any Fund Service Provider for each of the last two fiscal years of the Funds are as follows:
Billed By | April 30, 2010 A | April 30, 2009 A |
Deloitte Entities | $1,220,000 | $1,490,000 |
A Amounts may reflect rounding.
The trust's Audit Committee has considered non-audit services that were not pre-approved that were provided by Deloitte Entities to Fund Service Providers to be compatible with maintaining the independence of Deloitte Entities in its audit of the Funds, taking into account representations from Deloitte Entities, in accordance with Public Company Accounting Oversight Board rules, regarding its independence from the Funds and their related entities and FMR's review of the appropriateness and permissibility under applicable law of such non-audit services prior to their provision to the Fund Service Providers.
Audit Committee Pre-Approval Policies and Procedures
The trust's Audit Committee must pre-approve all audit and non-audit services provided by a fund's independent registered public accounting firm relating to the operations or financial reporting of the fund. Prior to the commencement of any audit or non-audit services to a fund, the Audit Committee reviews the services to determine whether they are appropriate and permissible under applicable law.
The Audit Committee has adopted policies and procedures to, among other purposes, provide a framework for the Committee's consideration of non-audit services by the audit firms that audit the Fidelity funds. The policies and procedures require that any non-audit service provided by a fund audit firm to a Fidelity fund and any non-audit service provided by a fund auditor to a Fund Service Provider that relates directly to the operations and financial reporting of a Fidelity fund ("Covered Service") are subject to approval by the Audit Committee before such service is provided.
All Covered Services must be approved in advance of provision of the service either: (i) by formal resolution of the Audit Committee, or (ii) by oral or written approval of the service by the Chair of the Audit Committee (or if the Chair is unavailable, such other member of the Audit Committee as may be designated by the Chair to act in the Chair's absence). The approval contemplated by (ii) above is permitted where the Treasurer determines that action on such an engagement is necessary before the next meeting of the Audit Committee.
Non-audit services provided by a fund audit firm to a Fund Service Provider that do not relate directly to the operations and financial reporting of a Fidelity fund are reported to the Audit Committee on a periodic basis.
Non-Audit Services Approved Pursuant to Rule 2-01(c)(7)(i)(C) and (ii) of Regulation S-X ("De Minimis Exception")
There were no non-audit services approved or required to be approved by the Audit Committee pursuant to the De Minimis Exception during the Funds' last two fiscal years relating to services provided to (i) the Funds or (ii) any Fund Service Provider that relate directly to the operations and financial reporting of the Funds.
Item 5. Audit Committee of Listed Registrants
Not applicable.
Item 6. Investments
(a) Not applicable.
(b) Not applicable
Item 7. Disclosure of Proxy Voting Policies and Procedures for Closed-End Management Investment Companies
Not applicable.
Item 8. Portfolio Managers of Closed-End Management Investment Companies
Not applicable.
Item 9. Purchase of Equity Securities by Closed-End Management Investment Company and Affiliated Purchasers
Not applicable.
Item 10. Submission of Matters to a Vote of Security Holders
There were no material changes to the procedures by which shareholders may recommend nominees to the trust's Board of Trustees.
Item 11. Controls and Procedures
(a)(i) The President and Treasurer and the Chief Financial Officer have concluded that the trust's disclosure controls and procedures (as defined in Rule 30a-3(c) under the Investment Company Act) provide reasonable assurances that material information relating to the trust is made known to them by the appropriate persons, based on their evaluation of these controls and procedures as of a date within 90 days of the filing date of this report.
(a)(ii) There was no change in the trust's internal control over financial reporting (as defined in Rule 30a-3(d) under the Investment Company Act) that occurred during the second fiscal quarter of the period covered by this report that has materially affected, or is reasonably likely to materially affect, the trust's internal control over financial reporting.
Item 12. Exhibits
(a) | (1) | Code of Ethics pursuant to Item 2 of Form N-CSR is filed and attached hereto as EX-99.CODE ETH. |
(a) | (2) | Certification pursuant to Rule 30a-2(a) under the Investment Company Act of 1940 (17 CFR 270.30a-2(a)) is filed and attached hereto as Exhibit 99.CERT. |
(a) | (3) | Not applicable. |
(b) | | Certification pursuant to Rule 30a-2(b) under the Investment Company Act of 1940 (17 CFR 270.30a-2(b)) is furnished and attached hereto as Exhibit 99.906CERT. |
SIGNATURES
Pursuant to the requirements of the Securities Exchange Act of 1934 and the Investment Company Act of 1940, the registrant has duly caused this report to be signed on its behalf by the undersigned, thereunto duly authorized.
Fidelity Commonwealth Trust
By: | /s/Kenneth B. Robins |
| Kenneth B. Robins |
| President and Treasurer |
| |
Date: | June 28, 2010 |
Pursuant to the requirements of the Securities Exchange Act of 1934 and the Investment Company Act of 1940, this report has been signed below by the following persons on behalf of the registrant and in the capacities and on the dates indicated.
By: | /s/Kenneth B. Robins |
| Kenneth B. Robins |
| President and Treasurer |
| |
Date: | June 28, 2010 |
By: | /s/Christine Reynolds |
| Christine Reynolds |
| Chief Financial Officer |
| |
Date: | June 28, 2010 |