UNITED STATES
SECURITIES AND EXCHANGE COMMISSION
Washington, D.C. 20549
FORM N-CSR
CERTIFIED SHAREHOLDER REPORT OF REGISTERED
MANAGEMENT INVESTMENT COMPANIES
Investment Company Act file number 811-2546
Fidelity Commonwealth Trust
(Exact name of registrant as specified in charter)
82 Devonshire St., Boston, Massachusetts 02109
(Address of principal executive offices) (Zip code)
Scott C. Goebel, Secretary
82 Devonshire St.
Boston, Massachusetts 02109
(Name and address of agent for service)
Registrant's telephone number, including area code: 617-563-7000
Date of fiscal year end: | November 30 |
| |
Date of reporting period: | November 30, 2010 |
Item 1. Reports to Stockholders
Fidelity®
Nasdaq Composite® Index
Fund
Annual Report
November 30, 2010
(2_fidelity_logos) (Registered_Trademark)
Contents
Chairman's Message | <Click Here> | The Chairman's message to shareholders. |
Performance | <Click Here> | How the fund has done over time. |
Management's Discussion of Fund Performance | <Click Here> | The Portfolio Manager's review of fund performance and strategy. |
Shareholder Expense Example | <Click Here> | An example of shareholder expenses. |
Investment Changes | <Click Here> | A summary of major shifts in the fund's investments over the past six months. |
Investments | <Click Here> | A complete list of the fund's investments with their market values. |
Financial Statements | <Click Here> | Statements of assets and liabilities, operations, and changes in net assets, as well as financial highlights. |
Notes | <Click Here> | Notes to the financial statements. |
Report of Independent Registered Public Accounting Firm | <Click Here> | |
Trustees and Officers | <Click Here> | |
Distributions | <Click Here> | |
Board Approval of Investment Advisory Contracts and Management Fees | <Click Here> | |
To view a fund's proxy voting guidelines and proxy voting record for the 12-month period ended June 30, visit http://www.fidelity.com/proxyvotingresults or visit the Securities and Exchange Commission's (SEC) web site at http://www.sec.gov. You may also call 1-800-544-8544 to request a free copy of the proxy voting guidelines.
Nasdaq®, OMX®, NASDAQ OMX®, Nasdaq Composite®, and The Nasdaq Stock Market®, Inc. are registered trademarks of The NASDAQ OMX Group, Inc. (which with its Affiliates are the Corporations) and are licensed for use by Fidelity. The product has not been passed on by the Corporations as to its legality or suitability. The product is not issued, endorsed or sold by the Corporations. The Corporations make no warranties and bear no liability with respect to shares of the product.
Standard & Poor's, S&P and S&P 500 are registered service marks of The McGraw-Hill Companies, Inc. and have been licensed for use by Fidelity Distributors Corporation.
Other third party marks appearing herein are the property of their respective owners.
All other marks appearing herein are registered or unregistered trademarks or service marks of FMR LLC or an affiliated company.
Annual Report
This report and the financial statements contained herein are submitted for the general information of the shareholders of the fund. This report is not authorized for distribution to prospective investors in the fund unless preceded or accompanied by an effective prospectus.
A fund files its complete schedule of portfolio holdings with the SEC for the first and third quarters of each fiscal year on Form N-Q. Forms N-Q are available on the SEC's web site at http://www.sec.gov. A fund's Forms N-Q may be reviewed and copied at the SEC's Public Reference Room in Washington, DC. Information regarding the operation of the SEC's Public Reference Room may be obtained by calling 1-800-SEC-0330. For a complete list of a fund's portfolio holdings, view the most recent holdings listing, semiannual report, or annual report on Fidelity's web site at http://www.fidelity.com, http://www.advisor.fidelity.com, or http://www.401k.com, as applicable.
NOT FDIC INSURED • MAY LOSE VALUE • NO BANK GUARANTEE
Neither the fund nor Fidelity Distributors Corporation is a bank.
Annual Report
(photo_of_James_C_Curvey)
Dear Shareholder:
Equities have staged a rally in the second half of 2010, shaking off concerns about the European debt crisis and the possibility of a double-dip recession in the U.S. Although the short-term surge pushed major equity indexes back into positive territory for the year, several questions remain about the longer-term outlook, including lackluster economic growth and persistently high unemployment. Financial markets are always unpredictable, of course, but there also are several time-tested investment principles that can help put the odds in your favor.
One of the basic tenets is to invest for the long term. Over time, riding out the markets' inevitable ups and downs has proven much more effective than selling into panic or chasing the hottest trend. Even missing only a few of the markets' best days can significantly diminish investor returns. Patience also affords the benefits of compounding - of earning interest on additional income or reinvested dividends and capital gains. There can be tax advantages and cost benefits to consider as well. While staying the course doesn't eliminate risk, it can considerably lessen the effect of short-term declines.
You can further manage your investing risk through diversification. And today, more than ever, geographic diversification should be taken into account. Studies indicate that asset allocation is the single most important determinant of a portfolio's long-term success. The right mix of stocks, bonds and cash - aligned to your particular risk tolerance and investment objective - is very important. Age-appropriate rebalancing is also an essential aspect of asset allocation. For younger investors, an emphasis on equities - which historically have been the best-performing asset class over time - is encouraged. As investors near their specific goal, such as retirement or sending a child to college, consideration may be given to replacing volatile assets (e.g. common stocks) with more-stable fixed investments (bonds or savings plans).
A third principle - investing regularly - can help lower the average cost of your purchases. Investing a certain amount of money each month or quarter helps ensure you won't pay for all your shares at market highs. This strategy - known as dollar cost averaging - also reduces "emotion" from investing, helping shareholders avoid selling weak performers just prior to an upswing, or chasing a hot performer just before a correction.
We invite you to contact us via the Internet, through our Investor Centers or by phone. It is our privilege to provide you the information you need to make the investments that are right for you.
Sincerely,
(The acting chairman's signature appears here.)
James C. Curvey
Acting Chairman
Annual Report
Average annual total return reflects the change in the value of an investment, assuming reinvestment of the fund's distributions from dividend income and capital gains (the profits earned upon the sale of securities that have grown in value, if any) and assuming a constant rate of performance each year. The $10,000 table and the fund's returns do not reflect the deduction of taxes that a shareholder would pay on fund distributions or the redemption of fund shares. During periods of reimbursement by Fidelity, a fund's total return will be greater than it would be had the reimbursement not occurred. How a fund did yesterday is no guarantee of how it will do tomorrow.
Average Annual Total Returns
Periods ended November 30, 2010 | Past 1
year | Past 5
years | Life of fund A |
Fidelity® Nasdaq Composite® Index Fund | 17.45% | 2.97% | 5.09% |
A From September 25, 2003.
$10,000 Over Life of Fund
Let's say hypothetically that $10,000 was invested in Fidelity® Nasdaq Composite® Index Fund on September 25, 2003, when the fund started. The chart shows how the value of your investment would have changed, and also shows how the Nasdaq Composite Index performed over the same period.
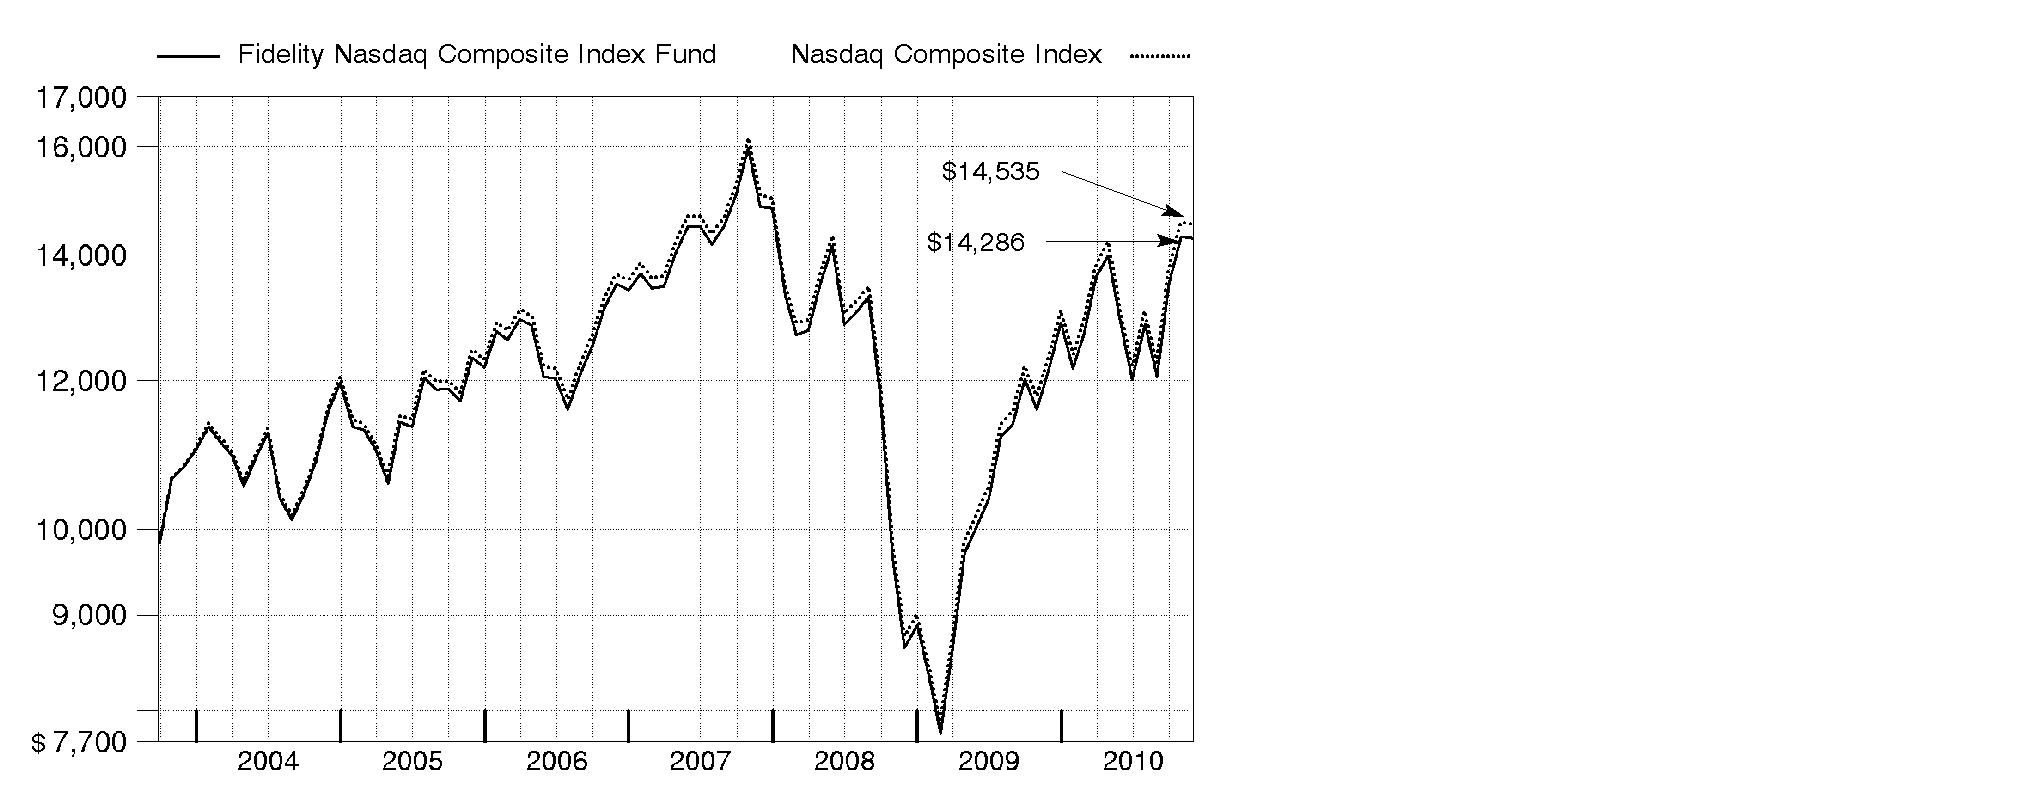
See accompanying notes which are an integral part of the financial statements.
Annual Report
Market Recap: Despite bouts of volatility and concern over European debt woes, major U.S. stock markets recorded solid gains for the year ending November 30, 2010, lifted by economic optimism, encouraging earnings reports and a wave of corporate mergers. Stocks extended their 2009 upswing in the first five months of the period on signs the Great Recession was over. However, high unemployment in the U.S. and sovereign debt problems in Europe sent equities falling during the spring. Markets vacillated for much of the summer before regaining momentum in the fall, with the large-cap S&P 500® Index posting its best September/October performance since 1998. By November, however, Ireland's debt took center stage, along with slower growth in China and additional quantitative easing in the U.S., unnerving investors and cooling down markets. For the full 12 months, the S&P 500® rose 9.94%, while the blue-chip-laden Dow Jones Industrial AverageSM added 9.33%. Both were bested by the technology-heavy Nasdaq Composite® Index, which advanced 17.58%. Overall, it was a broad-based rally, with economically sensitive sectors among the biggest gainers. Stocks of mid- and small-sized companies fared better than their larger-cap counterparts, advancing 24.04% and 26.98%, respectively, as measured by the Russell Midcap® and Russell 2000® indexes.
Comments from Jeffrey Adams, who oversees Fidelity® Nasdaq Composite® Index Fund's investment management team as Head of Indexing for Geode Capital Management, LLC: For the year, the fund returned 17.45%, in line with the Nasdaq index. Personal computer and consumer-electronics maker Apple was the top contributor and largest position in the index as of period end, with its stock gaining more than 55% on strong sales. Oracle, a database-software manufacturer, benefited from good sales and profit growth, while Baidu.com, the leading Internet search company in China, and leading semiconductor maker Intel also contributed. Apart from technology, several television-service providers made notable contributions, including Comcast and DIRECTV. Much-better-than-expected earnings lifted shares of "name your own price" travel agency Priceline.com. In contrast, the biggest detractors were software giant Microsoft, the second-largest position in the index as of November 30, and networking equipment maker Cisco Systems. Internet search company Google lost modest ground, while digital publishing software company Adobe Systems experienced a sharp share-price drop in September. Elsewhere, biotechnology stocks Gilead Sciences and Amgen lost ground. For-profit education provider Apollo Group, operator of the University of Phoenix, saw its shares fall on concerns about government regulation of the for-profit education industry. Semiconductor device manufacturer Micron Technology also struggled.
The views expressed above reflect those of the portfolio manager(s) only through the end of the period as stated on the cover of this report and do not necessarily represent the views of Fidelity or any other person in the Fidelity organization. Any such views are subject to change at any time based upon market or other conditions and Fidelity disclaims any responsibility to update such views. These views may not be relied on as investment advice and, because investment decisions for a Fidelity fund are based on numerous factors, may not be relied on as an indication of trading intent on behalf of any Fidelity fund.
Annual Report
Shareholder Expense Example
As a shareholder of the Fund, you incur two types of costs: (1) transaction costs, including redemption fees, and (2) ongoing costs, including management fees, distribution and/or service (12b-1) fees and other Fund expenses. This Example is intended to help you understand your ongoing costs (in dollars) of investing in the Fund and to compare these costs with the ongoing costs of investing in other mutual funds.
The Example is based on an investment of $1,000 invested at the beginning of the period and held for the entire period (June 1, 2010 to November 30, 2010).
Actual Expenses
The first line of the accompanying table provides information about actual account values and actual expenses. You may use the information in this line, together with the amount you invested, to estimate the expenses that you paid over the period. Simply divide your account value by $1,000.00 (for example, an $8,600 account value divided by $1,000.00 = 8.6), then multiply the result by the number in the first line under the heading entitled "Expenses Paid During Period" to estimate the expenses you paid on your account during this period. An annual index fund fee of $10 that is charged once a year may apply for certain accounts with a value of less than $10,000. This fee is not included in the table below. If it was, the estimate of expenses you paid during the period would be higher, and your ending account value lower, by this amount. In addition, the Fund, as a shareholder in the underlying Fidelity Central Funds, will indirectly bear its pro-rata share of the fees and expenses incurred by the underlying Fidelity Central Funds. These fees and expenses are not included in the Fund's annualized expense ratio used to calculate the expense estimate in the table below.
Hypothetical Example for Comparison Purposes
The second line of the accompanying table provides information about hypothetical account values and hypothetical expenses based on the Fund's actual expense ratio and an assumed rate of return of 5% per year before expenses, which is not the Fund's actual return. The hypothetical account values and expenses may not be used to estimate the actual ending account balance or expenses you paid for the period. You may use this information to compare the ongoing costs of investing in the Fund and other funds. To do so, compare this 5% hypothetical example with the 5% hypothetical examples that appear in the shareholder reports of the other funds. An annual index fund fee of $10 that is charged once a year may apply for certain accounts with a value of less than $10,000. This fee is not included in the table below. If it was, the estimate of expenses you paid during the period would be higher, and your ending account value lower, by this amount. In addition, the Fund, as a shareholder in the underlying Fidelity Central Funds, will indirectly bear its pro-rata share of the fees and expenses incurred by the underlying Fidelity Central Funds. These fees and expenses are not included in the Fund's annualized expense ratio used to calculate the expense estimate in the table below.
Please note that the expenses shown in the table are meant to highlight your ongoing costs only and do not reflect any transaction costs. Therefore, the second line of the table is useful in comparing ongoing costs only, and will not help you determine the relative total costs of owning different funds. In addition, if these transactional costs were included, your costs would have been higher.
Annual Report
| Annualized
Expense Ratio | Beginning
Account Value
June 1, 2010 | Ending
Account Value
November 30, 2010 | Expenses Paid
During Period*
June 1, 2010 to November 30, 2010 |
Actual | .35% | $ 1,000.00 | $ 1,112.00 | $ 1.85 |
Hypothetical (5% return per year before expenses) | | $ 1,000.00 | $ 1,023.31 | $ 1.78 |
* Expenses are equal to the Fund's annualized expense ratio, multiplied by the average account value over the period, multiplied by 183/365 (to reflect the one-half year period).
Annual Report
Investment Changes (Unaudited)
Top Ten Stocks as of November 30, 2010 |
| % of fund's
net assets | % of fund's net assets
6 months ago |
Apple, Inc. | 7.3 | 6.7 |
Microsoft Corp. | 5.6 | 6.5 |
Google, Inc. Class A | 3.5 | 3.4 |
Oracle Corp. | 3.5 | 3.2 |
Intel Corp. | 3.0 | 3.4 |
Cisco Systems, Inc. | 2.8 | 3.8 |
Amazon.com, Inc. | 2.0 | 1.6 |
QUALCOMM, Inc. | 1.9 | 1.7 |
Amgen, Inc. | 1.3 | 1.4 |
Comcast Corp. Class A | 1.1 | 1.1 |
| 32.0 | |
Market Sectors as of November 30, 2010 |
| % of fund's
net assets | % of fund's net assets
6 months ago |
Information Technology | 51.1 | 50.6 |
Consumer Discretionary | 14.9 | 14.3 |
Health Care | 12.6 | 13.9 |
Financials | 6.9 | 7.6 |
Industrials | 5.2 | 5.4 |
Consumer Staples | 2.0 | 1.9 |
Telecommunication Services | 1.6 | 1.6 |
Energy | 1.6 | 1.3 |
Materials | 1.2 | 1.1 |
Utilities | 0.1 | 0.1 |
Asset Allocation (% of fund's net assets) |
To match the Nasdaq Composite Index, Fidelity Nasdaq Composite Index Fund seeks 100% investment exposure to stocks at all times.
Annual Report
Investments November 30, 2010
Showing Percentage of Net Assets
Common Stocks - 97.2% |
| Shares | | Value |
CONSUMER DISCRETIONARY - 14.9% |
Auto Components - 0.2% |
Amerigon, Inc. (a) | 1,196 | | $ 12,558 |
Ballard Power Systems, Inc. (a)(d) | 6,442 | | 8,409 |
China Automotive Systems, Inc. (a)(d) | 2,230 | | 33,339 |
China XD Plastics Co. Ltd. (a) | 4,588 | | 25,005 |
Dorman Products, Inc. (a) | 1,496 | | 59,107 |
Exide Technologies (a) | 5,824 | | 47,640 |
Federal-Mogul Corp. Class A (a) | 7,311 | | 136,716 |
Fuel Systems Solutions, Inc. (a) | 1,416 | | 48,937 |
Gentex Corp. | 9,673 | | 203,036 |
Quantum Fuel Systems Technologies Worldwide, Inc. (a) | 19,263 | | 9,990 |
Shiloh Industries, Inc. (a) | 1,044 | | 11,620 |
SORL Auto Parts, Inc. (a) | 1,464 | | 13,542 |
Spartan Motors, Inc. | 2,787 | | 14,743 |
Strattec Security Corp. | 130 | | 4,446 |
Wonder Auto Technology, Inc. (a)(d) | 2,915 | | 24,282 |
| | 653,370 |
Automobiles - 0.1% |
Kandi Technologies Corp. (a) | 3,592 | | 20,582 |
Tesla Motors, Inc. (a)(d) | 6,737 | | 238,018 |
| | 258,600 |
Distributors - 0.1% |
Audiovox Corp. Class A (a) | 1,524 | | 10,439 |
Core-Mark Holding Co., Inc. (a) | 1,192 | | 43,150 |
LKQ Corp. (a) | 10,023 | | 216,246 |
Weyco Group, Inc. | 1,363 | | 32,998 |
| | 302,833 |
Diversified Consumer Services - 0.5% |
American Public Education, Inc. (a) | 1,271 | | 43,430 |
Apollo Group, Inc. Class A (non-vtg.) (a) | 10,596 | | 360,264 |
Cambium Learning Group, Inc. (a) | 3,505 | | 10,445 |
Capella Education Co. (a) | 1,115 | | 61,091 |
Career Education Corp. (a) | 6,010 | | 106,918 |
ChinaCast Education Corp. (a) | 2,890 | | 22,426 |
Coinstar, Inc. (a) | 2,282 | | 147,052 |
Collectors Universe, Inc. | 712 | | 10,680 |
Corinthian Colleges, Inc. (a)(d) | 6,096 | | 25,176 |
Education Management Corp. (a)(d) | 10,029 | | 141,609 |
Global Education & Technology Group Ltd. ADR (a) | 620 | | 5,673 |
Grand Canyon Education, Inc. (a) | 3,280 | | 62,451 |
Learning Tree International, Inc. | 1,097 | | 10,882 |
Common Stocks - continued |
| Shares | | Value |
CONSUMER DISCRETIONARY - continued |
Diversified Consumer Services - continued |
Lincoln Educational Services Corp. | 1,850 | | $ 27,121 |
Matthews International Corp. Class A | 2,184 | | 70,936 |
National American University Holdings, Inc. | 1,000 | | 6,860 |
Nobel Learning Communities, Inc. (a) | 750 | | 5,228 |
Princeton Review, Inc. (a) | 2,376 | | 2,257 |
Steiner Leisure Ltd. (a) | 938 | | 37,726 |
Stewart Enterprises, Inc. Class A | 6,460 | | 36,628 |
StoneMor Partners LP | 1,100 | | 31,955 |
Strayer Education, Inc. | 1,084 | | 147,283 |
| | 1,374,091 |
Hotels, Restaurants & Leisure - 1.8% |
AFC Enterprises, Inc. (a) | 2,444 | | 32,456 |
Ambassadors Group, Inc. | 1,175 | | 12,937 |
Ambassadors International, Inc. (a) | 976 | | 1,649 |
Ameristar Casinos, Inc. | 4,267 | | 76,209 |
Benihana, Inc. (a) | 188 | | 1,429 |
Benihana, Inc. Class A (sub. vtg.) (a) | 376 | | 2,910 |
BJ's Restaurants, Inc. (a)(d) | 1,953 | | 71,577 |
Bob Evans Farms, Inc. | 2,352 | | 73,241 |
Bravo Brio Restaurant Group, Inc. | 950 | | 16,682 |
Buffalo Wild Wings, Inc. (a) | 1,324 | | 64,201 |
California Pizza Kitchen, Inc. (a) | 1,973 | | 33,363 |
Caribou Coffee Co., Inc. (a)(d) | 2,780 | | 30,413 |
Carrols Restaurant Group, Inc. (a) | 1,153 | | 8,175 |
Century Casinos, Inc. (a) | 1,085 | | 2,474 |
China Lodging Group Ltd. ADR | 615 | | 14,631 |
Churchill Downs, Inc. | 1,407 | | 55,703 |
Cosi, Inc. (a) | 1,996 | | 2,295 |
Cracker Barrel Old Country Store, Inc. | 1,713 | | 90,207 |
Ctrip.com International Ltd. sponsored ADR (a)(d) | 10,596 | | 464,317 |
Denny's Corp. (a) | 9,181 | | 33,602 |
Einstein Noah Restaurant Group, Inc. (a) | 1,406 | | 17,969 |
eLong, Inc. sponsored ADR (a) | 893 | | 17,092 |
Empire Resorts, Inc. (a)(d) | 4,691 | | 4,832 |
Famous Dave's of America, Inc. (a) | 1,672 | | 16,553 |
Gaming Partners International Corp. | 597 | | 3,457 |
Great Wolf Resorts, Inc. (a) | 2,070 | | 4,823 |
Home Inns & Hotels Management, Inc. sponsored ADR (a)(d) | 1,920 | | 91,411 |
International Speedway Corp. Class A | 1,932 | | 45,769 |
Interval Leisure Group, Inc. (a) | 4,080 | | 67,606 |
Common Stocks - continued |
| Shares | | Value |
CONSUMER DISCRETIONARY - continued |
Hotels, Restaurants & Leisure - continued |
Isle of Capri Casinos, Inc. (a) | 2,440 | | $ 21,448 |
Jack in the Box, Inc. (a) | 3,980 | | 80,058 |
Jamba, Inc. (a) | 4,136 | | 8,355 |
Lakes Entertainment, Inc. (a) | 1,385 | | 2,978 |
McCormick & Schmick's Seafood Restaurants (a) | 992 | | 8,670 |
Melco PBL Entertainment (Macau) Ltd. sponsored ADR (a)(d) | 12,861 | | 76,780 |
Monarch Casino & Resort, Inc. (a) | 2,000 | | 24,020 |
Morgans Hotel Group Co. (a) | 2,134 | | 16,304 |
MTR Gaming Group, Inc. (a) | 1,922 | | 3,844 |
Multimedia Games, Inc. (a) | 3,590 | | 15,509 |
O'Charleys, Inc. (a) | 1,573 | | 10,885 |
P.F. Chang's China Bistro, Inc. | 1,531 | | 77,377 |
Panera Bread Co. Class A (a) | 2,003 | | 200,781 |
Papa John's International, Inc. (a) | 2,041 | | 52,270 |
Peet's Coffee & Tea, Inc. (a) | 1,065 | | 40,608 |
Penn National Gaming, Inc. (a) | 5,859 | | 205,709 |
PokerTek, Inc. (a)(d) | 568 | | 386 |
Premier Exhibitions, Inc. (a) | 1,302 | | 2,500 |
Red Robin Gourmet Burgers, Inc. (a) | 1,445 | | 26,776 |
Rick's Cabaret International, Inc. (a) | 524 | | 3,642 |
Ruth's Hospitality Group, Inc. (a) | 3,483 | | 17,206 |
Scientific Games Corp. Class A (a) | 6,896 | | 55,513 |
Shuffle Master, Inc. (a) | 4,163 | | 44,669 |
Sonic Corp. (a) | 4,347 | | 40,688 |
Starbucks Corp. | 53,071 | | 1,623,973 |
Texas Roadhouse, Inc. Class A (a) | 5,066 | | 86,578 |
The Cheesecake Factory, Inc. (a) | 3,611 | | 115,083 |
Town Sports International Holdings, Inc. (a) | 1,521 | | 5,095 |
Wynn Resorts Ltd. | 8,897 | | 899,487 |
| | 5,125,175 |
Household Durables - 0.2% |
Bassett Furniture Industries, Inc. (a) | 931 | | 3,836 |
Cavco Industries, Inc. (a) | 956 | | 34,856 |
CTI Industries Corp. | 672 | | 3,575 |
Deer Consumer Products, Inc. (a)(d) | 2,580 | | 28,819 |
Dixie Group, Inc. (a) | 767 | | 2,508 |
Flexsteel Industries, Inc. | 620 | | 10,807 |
Garmin Ltd. (d) | 13,987 | | 405,064 |
Helen of Troy Ltd. (a) | 1,916 | | 45,256 |
Hooker Furniture Corp. | 696 | | 7,914 |
Common Stocks - continued |
| Shares | | Value |
CONSUMER DISCRETIONARY - continued |
Household Durables - continued |
iRobot Corp. (a) | 2,106 | | $ 42,752 |
Lifetime Brands, Inc. (a) | 634 | | 9,345 |
Palm Harbor Homes, Inc. (a) | 1,659 | | 224 |
SodaStream International Ltd. (d) | 800 | | 26,400 |
Stanley Furniture Co., Inc. (a) | 624 | | 2,040 |
Stanley Furniture Co., Inc. rights 12/8/10 (a) | 624 | | 41 |
Universal Electronics, Inc. (a) | 1,462 | | 40,176 |
| | 663,613 |
Internet & Catalog Retail - 3.4% |
1-800-FLOWERS.com, Inc. Class A (a) | 1,747 | | 3,477 |
Amazon.com, Inc. (a) | 32,190 | | 5,646,126 |
Bidz.com, Inc. (a) | 6,158 | | 8,005 |
Blue Nile, Inc. (a)(d) | 1,069 | | 52,862 |
dELiA*s, Inc. (a) | 2,226 | | 3,851 |
drugstore.com, Inc. (a) | 9,138 | | 15,717 |
Expedia, Inc. | 18,760 | | 493,951 |
Gaiam, Inc. Class A | 839 | | 6,309 |
Geeknet, Inc. (a) | 449 | | 9,366 |
Hollywood Media Corp. (a) | 1,921 | | 2,920 |
HSN, Inc. (a) | 4,190 | | 118,787 |
Liberty Media Corp. Interactive Series A (a) | 42,042 | | 649,969 |
MakeMyTrip Ltd. (d) | 2,600 | | 73,892 |
Mecox Lane Ltd. ADR | 800 | | 6,560 |
Netflix, Inc. (a) | 3,727 | | 767,389 |
NutriSystem, Inc. | 2,035 | | 42,063 |
Overstock.com, Inc. (a) | 2,066 | | 31,858 |
PetMed Express, Inc. | 1,606 | | 28,474 |
Priceline.com, Inc. (a) | 3,425 | | 1,349,621 |
Shutterfly, Inc. (a) | 2,004 | | 66,132 |
US Auto Parts Network, Inc. (a) | 2,459 | | 19,647 |
ValueVision Media, Inc. Class A (a) | 2,128 | | 7,427 |
Vitacost.com, Inc. (a) | 2,000 | | 12,400 |
| | 9,416,803 |
Leisure Equipment & Products - 0.3% |
Arctic Cat, Inc. (a) | 607 | | 9,050 |
Clarus Corp. (a) | 630 | | 4,372 |
Escalade, Inc. | 749 | | 3,895 |
Gametech International, Inc. (a) | 660 | | 290 |
JAKKS Pacific, Inc. (a) | 2,354 | | 45,315 |
Common Stocks - continued |
| Shares | | Value |
CONSUMER DISCRETIONARY - continued |
Leisure Equipment & Products - continued |
Johnson Outdoors, Inc. Class A (a) | 771 | | $ 9,984 |
Mattel, Inc. | 25,954 | | 670,651 |
Pool Corp. | 3,471 | | 73,550 |
RC2 Corp. (a) | 1,393 | | 30,855 |
Smith & Wesson Holding Corp. (a) | 5,026 | | 19,300 |
Summer Infant, Inc. (a) | 548 | | 3,951 |
| | 871,213 |
Media - 5.3% |
AirMedia Group, Inc. ADR (a) | 3,030 | | 20,937 |
Ascent Media Corp. (a) | 1,358 | | 41,976 |
Beasley Broadcast Group, Inc. Class A (a) | 689 | | 2,784 |
Carmike Cinemas, Inc. (a) | 861 | | 7,224 |
Central European Media Enterprises Ltd. Class A (a)(d) | 4,193 | | 80,338 |
Charter Communications, Inc. Class A (a) | 8,100 | | 271,512 |
China MediaExpress Holdings, Inc. (a)(d) | 2,750 | | 46,393 |
China Yida Holding Co. (a)(d) | 1,936 | | 18,431 |
ChinaNet Online Holdings, Inc. (a) | 1,300 | | 5,122 |
CKX, Inc. (a) | 7,153 | | 29,542 |
Comcast Corp.: | | | |
Class A | 149,741 | | 2,994,820 |
Class A (special) (non-vtg.) | 53,216 | | 1,009,508 |
Crown Media Holdings, Inc. Class A (a)(d) | 22,356 | | 58,796 |
CTC Media, Inc. | 11,186 | | 251,797 |
Cumulus Media, Inc. Class A (a) | 3,181 | | 11,293 |
Daily Journal Corp. (a) | 100 | | 7,217 |
DIRECTV (a) | 62,485 | | 2,595,002 |
Discovery Communications, Inc. (a) | 9,858 | | 402,009 |
Discovery Communications, Inc. Class C (a) | 10,486 | | 372,358 |
DISH Network Corp. Class A | 15,673 | | 288,226 |
DreamWorks Animation SKG, Inc. Class A (a) | 5,496 | | 170,321 |
Emmis Communications Corp. Class A (a) | 2,486 | | 1,492 |
Fisher Communications, Inc. (a) | 612 | | 12,271 |
Focus Media Holding Ltd. ADR (a) | 9,688 | | 226,021 |
Global Sources Ltd. (a) | 1,698 | | 15,367 |
Global Traffic Network, Inc. (a) | 1,198 | | 10,830 |
Harris Interactive, Inc. (a) | 4,199 | | 3,611 |
IMAX Corp. (a) | 4,777 | | 129,982 |
Insignia Systems, Inc. (a) | 738 | | 5,196 |
interCLICK, Inc. (a) | 1,301 | | 7,754 |
Knology, Inc. (a) | 2,562 | | 39,429 |
Common Stocks - continued |
| Shares | | Value |
CONSUMER DISCRETIONARY - continued |
Media - continued |
Lamar Advertising Co. Class A (a) | 5,427 | | $ 199,442 |
Liberty Global, Inc.: | | | |
Class A (a)(d) | 9,347 | | 329,575 |
Class B (a) | 234 | | 8,443 |
Class C (a) | 8,587 | | 288,867 |
Liberty Media Corp.: | | | |
Capital Series A (a) | 6,770 | | 389,817 |
Starz Series A (a) | 3,586 | | 225,362 |
LodgeNet Entertainment Corp. (a) | 2,000 | | 6,200 |
Madison Square Garden, Inc. Class A (a) | 4,450 | | 97,633 |
MDC Partners, Inc. Class A (sub. vtg.) | 1,884 | | 26,866 |
Mediacom Communications Corp. Class A (a) | 3,349 | | 28,299 |
Morningstar, Inc. | 3,650 | | 183,997 |
National CineMedia, Inc. | 3,385 | | 63,164 |
Navarre Corp. (a) | 871 | | 1,986 |
New Frontier Media, Inc. (a) | 1,084 | | 2,081 |
News Corp.: | | | |
Class A | 130,095 | | 1,774,496 |
Class B (d) | 58,741 | | 894,625 |
Nexstar Broadcasting Group, Inc. Class A (a) | 1,166 | | 6,296 |
Outdoor Channel Holdings, Inc. (a) | 1,940 | | 12,610 |
Private Media Group, Inc. (a) | 788 | | 922 |
Radio One, Inc. Class D (non-vtg.) (a) | 3,233 | | 3,492 |
ReachLocal, Inc. (d) | 1,900 | | 32,756 |
Reading International, Inc. Class A (a) | 1,500 | | 7,620 |
Rentrak Corp. (a) | 700 | | 18,480 |
RRSat Global Communications Network Ltd. | 1,101 | | 7,696 |
Salem Communications Corp. Class A | 1,009 | | 3,370 |
Scholastic Corp. | 2,550 | | 71,655 |
Sinclair Broadcast Group, Inc. Class A | 2,661 | | 20,623 |
Sirius XM Radio, Inc. (a) | 286,428 | | 392,406 |
Spanish Broadcasting System, Inc. Class A (a) | 3,114 | | 2,273 |
SuperMedia, Inc. (a) | 1,700 | | 7,684 |
Value Line, Inc. | 658 | | 9,475 |
Virgin Media, Inc. | 24,291 | | 618,935 |
VisionChina Media, Inc. ADR (a)(d) | 5,356 | | 19,710 |
Westwood One, Inc. (a)(d) | 1,202 | | 11,335 |
WPP PLC sponsored ADR | 1,012 | | 56,217 |
Xinhua Sports & Entertainment sponsored ADR (a) | 1,611 | | 402 |
| | 14,962,369 |
Common Stocks - continued |
| Shares | | Value |
CONSUMER DISCRETIONARY - continued |
Multiline Retail - 0.4% |
Dollar Tree, Inc. (a) | 9,008 | | $ 494,990 |
Fred's, Inc. Class A | 3,106 | | 39,726 |
Gordmans Stores, Inc. | 1,550 | | 19,778 |
Sears Holdings Corp. (a)(d) | 7,970 | | 522,035 |
The Bon-Ton Stores, Inc. (a) | 1,410 | | 18,922 |
Tuesday Morning Corp. (a) | 4,055 | | 21,086 |
| | 1,116,537 |
Specialty Retail - 2.0% |
A.C. Moore Arts & Crafts, Inc. (a) | 3,230 | | 7,494 |
America's Car Mart, Inc. (a) | 1,346 | | 34,148 |
AutoChina International Ltd. (a)(d) | 1,339 | | 33,448 |
bebe Stores, Inc. | 6,318 | | 40,688 |
Bed Bath & Beyond, Inc. (a) | 18,863 | | 825,068 |
Big 5 Sporting Goods Corp. | 1,981 | | 27,338 |
Body Central Corp. | 1,200 | | 14,652 |
Books-A-Million, Inc. | 1,634 | | 10,409 |
Cache, Inc. (a) | 659 | | 2,801 |
Casual Male Retail Group, Inc. (a) | 2,971 | | 14,261 |
Charming Shoppes, Inc. (a) | 9,910 | | 37,708 |
Citi Trends, Inc. (a) | 1,148 | | 27,196 |
Coldwater Creek, Inc. (a) | 6,864 | | 23,200 |
Conn's, Inc. (a)(d) | 1,681 | | 5,379 |
Cost Plus, Inc. (a) | 2,312 | | 17,826 |
Destination Maternity Corp. (a) | 366 | | 14,010 |
Dress Barn, Inc. (a) | 5,684 | | 140,395 |
Finish Line, Inc. Class A | 3,833 | | 68,419 |
Golfsmith International Holdings, Inc. (a) | 629 | | 1,849 |
Hastings Entertainment, Inc. (a) | 1,374 | | 9,137 |
Hibbett Sports, Inc. (a) | 2,043 | | 69,973 |
Hot Topic, Inc. | 3,405 | | 20,873 |
Jos. A. Bank Clothiers, Inc. (a) | 1,846 | | 83,144 |
Kirkland's, Inc. (a) | 1,743 | | 20,829 |
Monro Muffler Brake, Inc. | 1,480 | | 73,171 |
O'Reilly Automotive, Inc. (a) | 9,509 | | 572,252 |
Pacific Sunwear of California, Inc. (a) | 4,706 | | 29,601 |
PetSmart, Inc. | 8,571 | | 324,498 |
Rent-A-Center, Inc. | 4,584 | | 127,619 |
Ross Stores, Inc. | 8,761 | | 568,414 |
rue21, Inc. | 1,773 | | 53,208 |
Select Comfort Corp. (a) | 4,300 | | 37,797 |
Common Stocks - continued |
| Shares | | Value |
CONSUMER DISCRETIONARY - continued |
Specialty Retail - continued |
Shoe Carnival, Inc. (a) | 605 | | $ 16,783 |
Staples, Inc. | 52,229 | | 1,149,560 |
Stein Mart, Inc. | 2,833 | | 28,047 |
Syms Corp. (a) | 598 | | 4,216 |
Tandy Leather Factory, Inc. | 800 | | 3,512 |
The Children's Place Retail Stores, Inc. (a) | 1,954 | | 101,432 |
Tractor Supply Co. | 5,092 | | 216,257 |
Trans World Entertainment Corp. (a) | 1,445 | | 2,485 |
Ulta Salon, Cosmetics & Fragrance, Inc. (a) | 4,220 | | 147,489 |
Urban Outfitters, Inc. (a) | 12,054 | | 455,521 |
West Marine, Inc. (a) | 1,329 | | 12,719 |
Wet Seal, Inc. Class A (a) | 8,704 | | 28,462 |
Winmark Corp. | 446 | | 14,339 |
Zumiez, Inc. (a) | 2,370 | | 75,390 |
| | 5,593,017 |
Textiles, Apparel & Luxury Goods - 0.6% |
Cherokee, Inc. | 881 | | 17,356 |
Columbia Sportswear Co. | 2,430 | | 135,205 |
Crocs, Inc. (a) | 6,561 | | 115,113 |
Deckers Outdoor Corp. (a) | 2,760 | | 212,244 |
Exceed Co. Ltd. (a) | 1,935 | | 16,157 |
Fossil, Inc. (a) | 4,752 | | 321,473 |
Fuqi International, Inc. (a)(d) | 3,049 | | 18,690 |
G-III Apparel Group Ltd. (a) | 1,179 | | 32,269 |
Heelys, Inc. (a) | 1,200 | | 3,948 |
Iconix Brand Group, Inc. (a) | 4,807 | | 89,795 |
Joe's Jeans, Inc. (a)(d) | 4,434 | | 7,050 |
K-Swiss, Inc. Class A (a) | 2,810 | | 35,181 |
Kingold Jewelry, Inc. (a)(d) | 1,500 | | 13,650 |
Lacrosse Footwear, Inc. | 197 | | 3,038 |
LJ International, Inc. (a) | 4,357 | | 15,554 |
lululemon athletica, Inc. (a) | 3,761 | | 201,665 |
Perry Ellis International, Inc. (a) | 1,086 | | 29,550 |
R.G. Barry Corp. | 474 | | 5,451 |
Rocky Brands, Inc. (a) | 112 | | 1,036 |
Steven Madden Ltd. (a) | 1,845 | | 83,486 |
Tandy Brands Accessories, Inc. (a) | 905 | | 2,570 |
True Religion Apparel, Inc. (a) | 1,926 | | 43,200 |
Vera Bradley, Inc. | 2,500 | | 81,850 |
Common Stocks - continued |
| Shares | | Value |
CONSUMER DISCRETIONARY - continued |
Textiles, Apparel & Luxury Goods - continued |
Volcom, Inc. | 1,724 | | $ 31,032 |
Wacoal Holdings Corp. sponsored ADR | 219 | | 14,877 |
| | 1,531,440 |
TOTAL CONSUMER DISCRETIONARY | | 41,869,061 |
CONSUMER STAPLES - 2.0% |
Beverages - 0.2% |
Central European Distribution Corp. (a) | 5,135 | | 123,394 |
Coca-Cola Bottling Co. Consolidated | 560 | | 32,760 |
Craft Brewers Alliance, Inc. (a) | 972 | | 6,405 |
Hansen Natural Corp. (a) | 6,453 | | 343,429 |
Jones Soda Co. (a) | 1,719 | | 1,908 |
MGP Ingredients, Inc. | 1,799 | | 16,389 |
National Beverage Corp. | 3,200 | | 41,888 |
Primo Water Corp. | 1,600 | | 19,312 |
| | 585,485 |
Food & Staples Retailing - 1.2% |
Andersons, Inc. | 1,237 | | 39,980 |
Arden Group, Inc. Class A | 298 | | 24,138 |
Casey's General Stores, Inc. | 2,446 | | 97,216 |
China Jo-Jo Drugstores, Inc. (a) | 1,100 | | 4,950 |
Costco Wholesale Corp. | 31,375 | | 2,121,264 |
Fresh Market, Inc. | 4,000 | | 145,000 |
Ingles Markets, Inc. Class A | 1,509 | | 28,143 |
Nash-Finch Co. | 1,029 | | 38,022 |
PriceSmart, Inc. | 2,391 | | 80,266 |
QKL Stores, Inc. (a) | 3,276 | | 11,532 |
Spartan Stores, Inc. | 1,954 | | 31,967 |
Susser Holdings Corp. (a) | 1,119 | | 15,039 |
The Pantry, Inc. (a) | 1,730 | | 35,534 |
United Natural Foods, Inc. (a) | 3,008 | | 112,620 |
Village Super Market, Inc. Class A | 428 | | 13,491 |
Whole Foods Market, Inc. (a) | 11,918 | | 562,768 |
Winn-Dixie Stores, Inc. (a) | 4,206 | | 25,572 |
| | 3,387,502 |
Food Products - 0.5% |
AgFeed Industries, Inc. (a)(d) | 2,483 | | 5,959 |
Alico, Inc. | 753 | | 17,432 |
Bridgford Foods Corp. | 433 | | 5,499 |
Common Stocks - continued |
| Shares | | Value |
CONSUMER STAPLES - continued |
Food Products - continued |
Cal-Maine Foods, Inc. | 1,475 | | $ 45,224 |
Calavo Growers, Inc. | 1,103 | | 25,468 |
Cresud S.A.C.I.F. y A. sponsored ADR | 3,595 | | 67,622 |
Diamond Foods, Inc. | 1,457 | | 67,809 |
Farmer Brothers Co. | 1,034 | | 18,012 |
Green Mountain Coffee Roasters, Inc. (a) | 9,621 | | 356,747 |
Griffin Land & Nurseries, Inc. | 729 | | 21,243 |
Hain Celestial Group, Inc. (a) | 3,381 | | 89,630 |
Imperial Sugar Co. | 1,553 | | 21,369 |
J&J Snack Foods Corp. | 1,258 | | 57,554 |
John B. Sanfilippo & Son, Inc. (a) | 308 | | 3,668 |
Lancaster Colony Corp. | 1,957 | | 101,901 |
Lance, Inc. | 2,342 | | 54,826 |
Le Gaga Holdings Ltd. ADR | 950 | | 8,199 |
Lifeway Foods, Inc. (a) | 1,041 | | 9,910 |
Limoneira Co. (d) | 700 | | 15,267 |
Origin Agritech Ltd. (a) | 2,765 | | 24,470 |
Sanderson Farms, Inc. | 1,625 | | 71,923 |
Seneca Foods Corp. Class A (a) | 877 | | 20,864 |
SkyPeople Fruit Juice, Inc. (a) | 1,700 | | 8,296 |
Smart Balance, Inc. (a) | 5,777 | | 21,144 |
SunOpta, Inc. (a) | 4,632 | | 32,100 |
Synutra International, Inc. (a)(d) | 3,971 | | 50,710 |
Yuhe International, Inc. (a)(d) | 1,958 | | 17,622 |
Zhongpin, Inc. (a)(d) | 2,426 | | 46,361 |
| | 1,286,829 |
Household Products - 0.0% |
Central Garden & Pet Co. (a) | 2,553 | | 23,641 |
Central Garden & Pet Co. Class A (non-vtg.) (a) | 1,297 | | 12,114 |
WD-40 Co. | 1,339 | | 52,342 |
| | 88,097 |
Personal Products - 0.1% |
China Sky One Medical, Inc. (a)(d) | 1,836 | | 13,458 |
China-Biotics, Inc. (a)(d) | 1,652 | | 19,081 |
Elizabeth Arden, Inc. (a) | 2,172 | | 46,285 |
GLG Life Tech Corp. (a) | 1,584 | | 11,804 |
Inter Parfums, Inc. | 2,587 | | 47,239 |
Mannatech, Inc. (a) | 1,708 | | 3,279 |
Nutraceutical International Corp. (a) | 889 | | 13,219 |
Parlux Fragrances, Inc. (a) | 684 | | 1,867 |
Common Stocks - continued |
| Shares | | Value |
CONSUMER STAPLES - continued |
Personal Products - continued |
Physicians Formula Holdings, Inc. (a) | 1,230 | | $ 4,293 |
Reliv International, Inc. | 923 | | 1,708 |
The Female Health Co. | 2,003 | | 11,437 |
USANA Health Sciences, Inc. (a) | 1,178 | | 49,617 |
| | 223,287 |
Tobacco - 0.0% |
Star Scientific, Inc. (a)(d) | 6,277 | | 11,675 |
TOTAL CONSUMER STAPLES | | 5,582,875 |
ENERGY - 1.6% |
Energy Equipment & Services - 0.3% |
Acergy SA sponsored ADR | 2,091 | | 41,966 |
Bronco Drilling Co., Inc. (a) | 1,816 | | 8,517 |
Dawson Geophysical Co. (a) | 534 | | 14,963 |
ENGlobal Corp. (a) | 1,250 | | 3,725 |
Exterran Partners LP | 1,705 | | 41,125 |
Global Industries Ltd. (a) | 8,313 | | 51,790 |
Gulf Island Fabrication, Inc. | 1,159 | | 31,015 |
Hercules Offshore, Inc. (a) | 8,686 | | 22,193 |
Lufkin Industries, Inc. | 2,022 | | 102,374 |
Matrix Service Co. (a) | 2,410 | | 23,931 |
Mitcham Industries, Inc. (a) | 452 | | 4,294 |
OYO Geospace Corp. (a) | 502 | | 38,082 |
Patterson-UTI Energy, Inc. | 10,662 | | 210,468 |
PHI, Inc. (non-vtg.) (a) | 1,466 | | 24,775 |
Recon Technology Ltd. (a) | 1,253 | | 7,142 |
Seahawk Drilling, Inc. (a) | 1,067 | | 8,675 |
SinoTech Energy Ltd. ADR | 1,590 | | 8,761 |
T-3 Energy Services, Inc. (a) | 1,599 | | 56,844 |
Tesco Corp. (a) | 2,917 | | 38,534 |
TGC Industries, Inc. | 1,256 | | 4,032 |
Union Drilling, Inc. (a) | 1,261 | | 7,957 |
| | 751,163 |
Oil, Gas & Consumable Fuels - 1.3% |
Abraxas Petroleum Corp. (a) | 4,833 | | 20,589 |
Alliance Holdings GP, LP | 4,083 | | 186,185 |
Alliance Resource Partners LP | 2,526 | | 156,612 |
Amyris, Inc. | 3,400 | | 69,972 |
APCO Oil and Gas International, Inc. | 2,112 | | 79,728 |
Common Stocks - continued |
| Shares | | Value |
ENERGY - continued |
Oil, Gas & Consumable Fuels - continued |
Approach Resources, Inc. (a) | 1,835 | | $ 33,525 |
Atlas Energy, Inc. (a) | 5,496 | | 236,053 |
ATP Oil & Gas Corp. (a)(d) | 3,994 | | 58,792 |
BioFuel Energy Corp. (a)(d) | 3,636 | | 6,036 |
BreitBurn Energy Partners LP | 3,924 | | 77,224 |
Brigham Exploration Co. (a) | 8,230 | | 206,985 |
Calumet Specialty Products Partners LP | 1,943 | | 42,280 |
Capital Product Partners LP | 3,440 | | 28,930 |
Carrizo Oil & Gas, Inc. (a) | 2,388 | | 69,300 |
China Integrated Energy, Inc. (a)(d) | 2,613 | | 19,650 |
Clayton Williams Energy, Inc. (a) | 1,072 | | 80,572 |
Clean Energy Fuels Corp. (a)(d) | 4,495 | | 60,143 |
Copano Energy LLC | 5,288 | | 158,270 |
CREDO Petroleum Corp. (a) | 469 | | 3,747 |
Crimson Exploration, Inc. (a) | 2,641 | | 9,825 |
Crosstex Energy LP | 4,020 | | 55,999 |
Crosstex Energy, Inc. | 4,501 | | 41,634 |
Delta Petroleum Corp. (a)(d) | 16,416 | | 12,496 |
Dorchester Minerals LP | 3,005 | | 81,706 |
Double Eagle Petroleum Co. (a) | 564 | | 2,927 |
Eagle Rock Energy Partners LP | 5,065 | | 40,571 |
Energy XXI (Bermuda) Ltd. (a) | 3,441 | | 84,821 |
EV Energy Partners LP | 1,853 | | 70,729 |
FX Energy, Inc. (a) | 3,870 | | 22,872 |
GeoMet, Inc. (a) | 2,493 | | 2,069 |
Georesources, Inc. (a) | 1,031 | | 20,538 |
Golar LNG Ltd. (NASDAQ) | 4,752 | | 66,100 |
Green Plains Renewable Energy, Inc. (a)(d) | 2,120 | | 23,278 |
Gulfport Energy Corp. (a) | 2,670 | | 49,769 |
Hallador Energy Co. (d) | 1,426 | | 16,399 |
Isramco, Inc. (a) | 150 | | 8,598 |
Ivanhoe Energy, Inc. (a)(d) | 22,215 | | 46,741 |
James River Coal Co. (a) | 2,008 | | 39,959 |
Knightsbridge Tankers Ltd. | 1,852 | | 42,114 |
L&L Energy, Inc. (a)(d) | 2,643 | | 27,937 |
Legacy Reserves LP | 2,665 | | 69,583 |
LINN Energy LLC | 10,984 | | 398,719 |
Magellan Petroleum Corp. (a) | 4,557 | | 8,658 |
Marine Petroleum Trust | 475 | | 11,158 |
Martin Midstream Partners LP | 1,264 | | 46,427 |
Miller Petroleum, Inc. (a) | 2,549 | | 13,255 |
Common Stocks - continued |
| Shares | | Value |
ENERGY - continued |
Oil, Gas & Consumable Fuels - continued |
New Generation Biofuels Holdings, Inc. (a) | 10,914 | | $ 841 |
NGAS Resources, Inc. (a) | 1,100 | | 583 |
Omega Navigation Enterprises, Inc. Class A (a) | 768 | | 983 |
Pacific Ethanol, Inc. (a)(d) | 5,548 | | 3,884 |
Petroleum Development Corp. (a) | 1,182 | | 42,103 |
PostRock Energy Corp. (a) | 945 | | 3,449 |
PrimeEnergy Corp. (a) | 168 | | 3,478 |
Ram Energy Resources, Inc. (a) | 7,581 | | 13,191 |
Regency Energy Partners LP | 9,960 | | 255,972 |
Rex Energy Corp. (a) | 3,122 | | 36,996 |
Rosetta Resources, Inc. (a) | 2,983 | | 106,851 |
Sino Clean Energy, Inc. (a) | 623 | | 4,211 |
StealthGas, Inc. (a) | 1,288 | | 6,543 |
Syntroleum Corp. (a) | 7,054 | | 13,050 |
TC Pipelines LP | 3,094 | | 143,840 |
TEL Offshore Trust (a) | 435 | | 918 |
Top Ships, Inc. (a) | 1,897 | | 1,537 |
Toreador Resources Corp. (a) | 1,924 | | 29,341 |
TORM AS ADR (a) | 347 | | 2,471 |
TransGlobe Energy Corp. (a) | 4,888 | | 80,705 |
Uranium Resources, Inc. (a) | 2,300 | | 8,510 |
Verenium Corp. (a) | 1,612 | | 5,239 |
Warren Resources, Inc. (a) | 3,124 | | 13,839 |
Zion Oil & Gas, Inc. (a)(d) | 2,179 | | 10,546 |
Zion Oil & Gas, Inc. rights (a)(d) | 392 | | 522 |
| | 3,699,078 |
TOTAL ENERGY | | 4,450,241 |
FINANCIALS - 6.9% |
Capital Markets - 1.5% |
American Capital Ltd. (a) | 25,350 | | 182,267 |
BGC Partners, Inc. Class A | 5,310 | | 40,622 |
Calamos Asset Management, Inc. Class A | 1,792 | | 21,379 |
Capital Southwest Corp. | 282 | | 28,273 |
Cowen Group, Inc. Class A (a) | 4,369 | | 17,826 |
Deerfield Capital Corp. (a) | 1,024 | | 5,990 |
Diamond Hill Investment Group, Inc. | 178 | | 12,325 |
E*TRADE Financial Corp. (a) | 16,129 | | 237,903 |
Epoch Holding Corp. | 1,309 | | 20,983 |
FBR Capital Markets Corp. (a) | 3,107 | | 11,247 |
Common Stocks - continued |
| Shares | | Value |
FINANCIALS - continued |
Capital Markets - continued |
Financial Engines, Inc. (a) | 2,992 | | $ 50,625 |
FirstCity Financial Corp. (a) | 1,173 | | 8,903 |
Gleacher & Co., Inc. (a) | 12,422 | | 31,179 |
Harris & Harris Group, Inc. (a) | 3,415 | | 14,958 |
Horizon Technology Finance Corp. | 560 | | 8,322 |
International Assets Holding Corp. (a) | 1,167 | | 26,643 |
LPL Investment Holdings, Inc. | 9,000 | | 305,100 |
Northern Trust Corp. | 17,356 | | 873,007 |
optionsXpress Holdings, Inc. | 3,928 | | 67,915 |
Penson Worldwide, Inc. (a)(d) | 2,074 | | 10,100 |
Prospect Capital Corp. | 6,371 | | 62,308 |
Rodman & Renshaw Capital Group, Inc. (a) | 2,182 | | 5,193 |
Sanders Morris Harris Group, Inc. | 2,380 | | 16,184 |
SEI Investments Co. | 13,807 | | 311,762 |
Siebert Financial Corp. (a) | 2,067 | | 3,927 |
T. Rowe Price Group, Inc. | 18,486 | | 1,078,288 |
TD Ameritrade Holding Corp. | 41,490 | | 694,543 |
TradeStation Group, Inc. (a) | 3,142 | | 19,983 |
U.S. Global Investments, Inc. Class A | 870 | | 7,091 |
Virtus Investment Partners, Inc. (a) | 174 | | 7,795 |
| | 4,182,641 |
Commercial Banks - 2.6% |
1st Source Corp. | 1,711 | | 31,944 |
1st United Bancorp, Inc. (a) | 1,509 | | 8,782 |
Alliance Financial Corp. | 376 | | 11,103 |
American National Bankshares, Inc. | 549 | | 12,259 |
American River Bankshares (a) | 684 | | 3,796 |
Ameris Bancorp | 1,504 | | 14,499 |
AmeriServ Financial, Inc. (a) | 1,045 | | 1,609 |
Ames National Corp. | 710 | | 13,873 |
Arrow Financial Corp. | 875 | | 24,448 |
Associated Banc-Corp. | 12,274 | | 157,046 |
BancFirst Corp. | 1,402 | | 56,893 |
Bancorp Rhode Island, Inc. | 498 | | 14,850 |
Bancorp, Inc., Delaware (a) | 2,028 | | 17,441 |
BancTrust Financial Group, Inc. (a) | 1,124 | | 2,821 |
Bank of Granite Corp. (a) | 972 | | 603 |
Bank of Kentucky Financial Corp. | 406 | | 7,125 |
Bank of Marin Bancorp | 428 | | 14,295 |
Bank of the Ozarks, Inc. | 1,395 | | 52,857 |
Common Stocks - continued |
| Shares | | Value |
FINANCIALS - continued |
Commercial Banks - continued |
Banner Corp. | 1,305 | | $ 2,075 |
BCB Bancorp, Inc. | 666 | | 6,127 |
BNC Bancorp | 475 | | 4,266 |
BOK Financial Corp. | 5,147 | | 240,365 |
Boston Private Financial Holdings, Inc. | 6,522 | | 35,023 |
Bridge Bancorp, Inc. | 424 | | 10,333 |
Bridge Capital Holdings (a) | 707 | | 6,010 |
Bryn Mawr Bank Corp. | 785 | | 13,180 |
Cadence Financial Corp. (a) | 596 | | 1,466 |
Camden National Corp. | 695 | | 24,951 |
Cape Bancorp, Inc. (a) | 687 | | 5,716 |
Capital Bank Corp. | 729 | | 2,107 |
Capital City Bank Group, Inc. (d) | 991 | | 12,536 |
Cardinal Financial Corp. | 1,972 | | 20,430 |
Cascade Bancorp (a)(d) | 241 | | 1,856 |
Cascade Financial Corp. (a)(d) | 1,011 | | 455 |
Cathay General Bancorp | 6,123 | | 82,722 |
Center Bancorp, Inc. | 648 | | 5,087 |
Center Financial Corp. (a) | 2,368 | | 14,824 |
Centerstate Banks of Florida, Inc. | 2,198 | | 15,540 |
Central Jersey Bancorp NA (a) | 554 | | 4,149 |
Century Bancorp, Inc. Class A (non-vtg.) | 318 | | 7,667 |
Chemical Financial Corp. | 2,040 | | 42,677 |
Citizens & Northern Corp. | 811 | | 12,092 |
Citizens Banking Corp., Michigan (a) | 41,950 | | 24,331 |
City Holding Co. | 1,436 | | 46,053 |
CNB Financial Corp., Pennsylvania | 587 | | 8,412 |
CoBiz, Inc. | 2,255 | | 11,072 |
Colony Bankcorp, Inc. (a) | 217 | | 914 |
Columbia Banking Systems, Inc. | 2,880 | | 50,227 |
Commerce Bancshares, Inc. | 6,010 | | 225,676 |
Commonwealth Bankshares, Inc. (a) | 311 | | 383 |
Community Trust Bancorp, Inc. | 1,536 | | 42,255 |
CVB Financial Corp. | 7,632 | | 60,064 |
Danvers Bancorp, Inc. | 2,696 | | 41,114 |
Dearborn Bancorp, Inc. (a)(d) | 465 | | 711 |
Eagle Bancorp, Inc., Maryland (a) | 2,319 | | 29,382 |
East West Bancorp, Inc. | 10,842 | | 188,000 |
Eastern Virgina Bankshares, Inc. | 469 | | 1,745 |
Encore Bancshares, Inc. (a) | 491 | | 4,650 |
Enterprise Bancorp, Inc. | 370 | | 4,233 |
Common Stocks - continued |
| Shares | | Value |
FINANCIALS - continued |
Commercial Banks - continued |
Enterprise Financial Services Corp. | 830 | | $ 8,275 |
Farmers Capital Bank Corp. | 175 | | 863 |
Fidelity Southern Corp. | 460 | | 3,142 |
Fifth Third Bancorp | 56,994 | | 681,078 |
Financial Institutions, Inc. | 990 | | 18,068 |
First Bancorp, North Carolina | 1,220 | | 17,678 |
First Busey Corp. | 5,408 | | 23,525 |
First California Financial Group, Inc. (a) | 4,861 | | 11,666 |
First Citizen Bancshares, Inc. | 600 | | 104,334 |
First Community Bancshares, Inc. | 1,036 | | 14,369 |
First Financial Bancorp, Ohio | 4,010 | | 66,245 |
First Financial Bankshares, Inc. | 1,823 | | 88,179 |
First Financial Corp., Indiana | 1,190 | | 35,867 |
First Interstate Bancsystem, Inc. | 700 | | 9,534 |
First M&F Corp. | 312 | | 1,173 |
First Mariner Bancorp, Inc. (a) | 782 | | 376 |
First Merchants Corp. | 3,562 | | 29,529 |
First Midwest Bancorp, Inc., Delaware | 5,064 | | 47,450 |
First of Long Island Corp. | 572 | | 14,735 |
First Security Group, Inc. | 566 | | 351 |
First South Bancorp, Inc., Virginia | 619 | | 4,599 |
First United Corp. | 493 | | 1,908 |
Firstbank Corp., Michigan | 489 | | 2,416 |
FirstMerit Corp. | 7,897 | | 137,605 |
FNB Corp., North Carolina (a) | 602 | | 181 |
Fulton Financial Corp. | 14,543 | | 125,797 |
German American Bancorp, Inc. | 686 | | 11,923 |
Glacier Bancorp, Inc. | 5,079 | | 67,703 |
Great Southern Bancorp, Inc. (d) | 844 | | 18,872 |
Green Bankshares, Inc. (a) | 802 | | 2,133 |
Grupo Financiero Galicia SA sponsored ADR (a) | 2,672 | | 41,069 |
Guaranty Bancorp (a) | 2,883 | | 3,690 |
Hampton Roads Bankshares, Inc. (a)(d) | 1,999 | | 973 |
Hampton Roads Bankshares, Inc. rights 12/10/10 (a) | 1,999 | | 76 |
Hancock Holding Co. | 2,589 | | 81,554 |
Hanmi Financial Corp. (a) | 8,074 | | 7,413 |
Hawthorn Bancshares, Inc. | 310 | | 2,802 |
Heartland Financial USA, Inc. | 1,634 | | 26,258 |
Heritage Commerce Corp. (a) | 500 | | 1,850 |
Heritage Financial Corp., Washington (a) | 1,562 | | 21,431 |
Home Bancshares, Inc. | 1,826 | | 37,798 |
Common Stocks - continued |
| Shares | | Value |
FINANCIALS - continued |
Commercial Banks - continued |
Hudson Valley Holding Corp. | 1,278 | | $ 25,304 |
Huntington Bancshares, Inc. | 52,782 | | 307,983 |
IBERIABANK Corp. | 1,887 | | 95,124 |
Independent Bank Corp. | 135 | | 162 |
Independent Bank Corp., Massachusetts | 1,594 | | 38,718 |
Integra Bank Corp. (a)(d) | 932 | | 513 |
International Bancshares Corp. | 4,762 | | 81,906 |
Intervest Bancshares Corp. Class A (a) | 539 | | 1,180 |
Investors Bancorp, Inc. (a) | 8,399 | | 102,888 |
Lakeland Bancorp, Inc. | 1,703 | | 17,796 |
Lakeland Financial Corp. | 2,272 | | 47,508 |
LNB Bancorp, Inc. | 836 | | 3,929 |
Macatawa Bank Corp. (a)(d) | 639 | | 1,591 |
MainSource Financial Group, Inc. | 1,798 | | 16,470 |
MB Financial, Inc. | 3,689 | | 52,494 |
MBT Financial Corp. (a) | 578 | | 907 |
Mercantile Bank Corp. | 476 | | 3,256 |
Merchants Bancshares, Inc. | 610 | | 16,610 |
Metro Bancorp, Inc. (a) | 1,268 | | 12,743 |
Metrocorp Bancshares, Inc. (a) | 399 | | 998 |
Middleburg Financial Corp. | 329 | | 4,606 |
MidWestOne Financial Group, Inc. | 465 | | 6,719 |
Nara Bancorp, Inc. (a) | 2,750 | | 22,440 |
National Bankshares, Inc. | 287 | | 7,583 |
National Penn Bancshares, Inc. | 8,614 | | 57,800 |
NBT Bancorp, Inc. | 2,341 | | 51,970 |
NewBridge Bancorp (a) | 1,464 | | 6,061 |
North Valley Bancorp (a) | 582 | | 757 |
Northern States Financial Corp. (a) | 462 | | 633 |
Northfield Bancorp, Inc. | 3,924 | | 49,874 |
Northrim Bancorp, Inc. | 360 | | 6,800 |
Old Point Financial Corp. | 453 | | 4,960 |
Old Second Bancorp, Inc. | 929 | | 1,802 |
OmniAmerican Bancorp, Inc. (a) | 412 | | 5,084 |
Orrstown Financial Services, Inc. | 470 | | 12,314 |
PAB Bankshares, Inc. (a)(d) | 579 | | 367 |
Pacific Capital Bancorp (a)(d) | 226,843 | | 49,905 |
Pacific Continental Corp. | 1,605 | | 13,867 |
Pacific Mercantile Bancorp (a) | 562 | | 2,220 |
PacWest Bancorp | 2,457 | | 41,769 |
Park Sterling Bank (a) | 2,400 | | 12,624 |
Common Stocks - continued |
| Shares | | Value |
FINANCIALS - continued |
Commercial Banks - continued |
Patriot National Bancorp, Inc. (a) | 549 | | $ 1,180 |
Peapack-Gladstone Financial Corp. (d) | 546 | | 6,552 |
Penns Woods Bancorp, Inc. (d) | 361 | | 13,462 |
Peoples Bancorp, Inc. | 991 | | 12,873 |
Pinnacle Financial Partners, Inc. (a)(d) | 2,472 | | 24,300 |
Popular, Inc. (a) | 75,903 | | 218,601 |
Porter Bancorp, Inc. | 496 | | 5,307 |
Preferred Bank, Los Angeles California (a) | 632 | | 1,011 |
PremierWest Bancorp (a) | 6,618 | | 2,780 |
PrivateBancorp, Inc. | 5,144 | | 62,551 |
Prosperity Bancshares, Inc. | 3,382 | | 110,050 |
Renasant Corp. | 1,973 | | 34,172 |
Republic Bancorp, Inc., Kentucky Class A | 1,724 | | 35,359 |
Republic First Bancorp, Inc. (a) | 530 | | 1,108 |
Royal Bancshares of Pennsylvania, Inc. Class A (a) | 504 | | 706 |
Rurban Financial Corp. | 723 | | 2,784 |
S&T Bancorp, Inc. | 2,197 | | 43,105 |
S.Y. Bancorp, Inc. | 1,971 | | 47,146 |
Sandy Spring Bancorp, Inc. | 2,008 | | 34,076 |
SCBT Financial Corp. | 1,465 | | 45,283 |
Seacoast Banking Corp., Florida (a) | 4,680 | | 5,616 |
Shore Bancshares, Inc. | 765 | | 7,474 |
Sierra Bancorp | 727 | | 7,524 |
Signature Bank, New York (a) | 3,305 | | 145,255 |
Silver State Bancorp (a) | 100 | | 1 |
Simmons First National Corp. Class A | 1,418 | | 41,193 |
Southcoast Financial Corp. (a) | 534 | | 1,602 |
Southern Community Financial Corp. (a) | 910 | | 1,174 |
Southside Bancshares, Inc. | 1,606 | | 33,598 |
Southwest Bancorp, Inc., Oklahoma | 1,648 | | 17,337 |
State Bancorp, Inc., New York | 2,462 | | 22,453 |
StellarOne Corp. | 1,819 | | 23,829 |
Sterling Bancshares, Inc. | 7,003 | | 41,563 |
Sterling Financial Corp., Washington (a)(d) | 4,343 | | 69,488 |
Suffolk Bancorp | 1,427 | | 36,645 |
Summit Financial Group, Inc. (a) | 583 | | 2,647 |
Sun Bancorp, Inc., New Jersey (a) | 2,559 | | 10,594 |
Superior Bancorp (a) | 529 | | 217 |
Susquehanna Bancshares, Inc., Pennsylvania | 9,144 | | 73,609 |
SVB Financial Group (a) | 3,066 | | 137,755 |
Common Stocks - continued |
| Shares | | Value |
FINANCIALS - continued |
Commercial Banks - continued |
Taylor Capital Group, Inc. (a)(d) | 2,054 | | $ 25,531 |
Tennessee Commerce Bancorp, Inc. (a) | 494 | | 1,946 |
Texas Capital Bancshares, Inc. (a) | 2,519 | | 47,559 |
The First Bancorp, Inc. | 846 | | 11,836 |
TIB Financial Corp. (a)(d) | 818 | | 205 |
TIB Financial Corp. rights 1/10/11 (a) | 8,180 | | 818 |
Tower Bancorp, Inc. | 358 | | 8,255 |
TowneBank (d) | 2,286 | | 35,296 |
Trico Bancshares | 1,843 | | 26,594 |
Trustmark Corp. | 4,301 | | 91,783 |
UMB Financial Corp. | 3,258 | | 121,523 |
Umpqua Holdings Corp. | 8,372 | | 88,659 |
Union/First Market Bankshares Corp. | 1,847 | | 25,304 |
United Bankshares, Inc., West Virginia | 3,191 | | 83,636 |
United Community Banks, Inc., Georgia (a) | 6,325 | | 9,677 |
United Security Bancshares, Inc. | 450 | | 4,325 |
United Security Bancshares, California (d) | 968 | | 3,775 |
Univest Corp. of Pennsylvania | 1,063 | | 19,782 |
Virginia Commerce Bancorp, Inc. (a) | 1,689 | | 9,577 |
VIST Financial Corp. | 512 | | 3,558 |
Washington Banking Co., Oak Harbor | 1,761 | | 22,523 |
Washington Trust Bancorp, Inc. | 1,556 | | 32,660 |
WesBanco, Inc. | 2,143 | | 37,352 |
West Bancorp., Inc. | 1,654 | | 12,025 |
West Coast Bancorp (a) | 6,425 | | 16,962 |
Westamerica Bancorp. | 2,079 | | 101,622 |
Western Liberty Bancorp (a) | 1,400 | | 7,434 |
Whitney Holding Corp. | 8,095 | | 76,012 |
Wilshire Bancorp, Inc. | 1,594 | | 11,286 |
Wintrust Financial Corp. | 2,217 | | 63,517 |
Yadkin Valley Financial Corp. (a) | 667 | | 1,087 |
Zions Bancorporation | 11,968 | | 232,778 |
| | 7,336,720 |
Consumer Finance - 0.2% |
Cardtronics, Inc. (a) | 3,427 | | 57,916 |
CompuCredit Holdings Corp. | 4,390 | | 26,340 |
Consumer Portfolio Services, Inc. (a) | 1,184 | | 1,042 |
Credit Acceptance Corp. (a) | 1,968 | | 122,154 |
Dollar Financial Corp. (a) | 1,671 | | 43,747 |
EZCORP, Inc. (non-vtg.) Class A (a) | 3,381 | | 85,066 |
Common Stocks - continued |
| Shares | | Value |
FINANCIALS - continued |
Consumer Finance - continued |
First Cash Financial Services, Inc. (a) | 2,190 | | $ 63,050 |
Netspend Holdings, Inc. | 5,972 | | 80,025 |
Nicholas Financial, Inc. | 590 | | 5,894 |
QC Holdings, Inc. | 1,007 | | 4,028 |
Rewards Network, Inc. (a) | 439 | | 6,036 |
World Acceptance Corp. (a) | 1,195 | | 52,652 |
| | 547,950 |
Diversified Financial Services - 0.7% |
Asset Acceptance Capital Corp. (a) | 2,070 | | 12,172 |
Asta Funding, Inc. | 1,124 | | 8,037 |
California First National Bancorp | 58 | | 805 |
CBOE Holdings, Inc. (d) | 1,119 | | 26,621 |
CME Group, Inc. | 4,800 | | 1,382,688 |
Encore Capital Group, Inc. (a) | 1,489 | | 27,681 |
Interactive Brokers Group, Inc. | 2,770 | | 50,802 |
Life Partners Holdings, Inc. (d) | 1,243 | | 26,588 |
MarketAxess Holdings, Inc. | 2,718 | | 49,440 |
Marlin Business Services Corp. (a) | 759 | | 8,045 |
Medallion Financial Corp. | 1,715 | | 14,543 |
NewStar Financial, Inc. (a) | 3,429 | | 28,941 |
PICO Holdings, Inc. (a) | 1,642 | | 46,879 |
Portfolio Recovery Associates, Inc. (a) | 1,231 | | 78,008 |
Resource America, Inc. Class A | 1,085 | | 6,532 |
The NASDAQ Stock Market, Inc. (a) | 14,986 | | 321,600 |
| | 2,089,382 |
Insurance - 0.9% |
21st Century Holding Co. | 425 | | 1,377 |
Alterra Capital Holdings Ltd. | 7,901 | | 160,706 |
American National Insurance Co. | 2,080 | | 165,402 |
American Physicians Service Group, Inc. | 672 | | 21,820 |
Amerisafe, Inc. (a) | 1,658 | | 30,656 |
Amtrust Financial Services, Inc. | 4,509 | | 72,189 |
Arch Capital Group Ltd. (a) | 3,361 | | 303,498 |
Argo Group International Holdings, Ltd. | 1,966 | | 72,506 |
Baldwin & Lyons, Inc. Class B | 1,187 | | 27,455 |
Cincinnati Financial Corp. | 11,287 | | 340,247 |
CNinsure, Inc. ADR (d) | 1,576 | | 34,294 |
CRM Holdings Ltd. (a) | 73 | | 313 |
Donegal Group, Inc. Class A | 1,525 | | 22,677 |
Eastern Insurance Holdings, Inc. | 468 | | 5,195 |
Common Stocks - continued |
| Shares | | Value |
FINANCIALS - continued |
Insurance - continued |
eHealth, Inc. (a) | 1,971 | | $ 29,664 |
EMC Insurance Group | 882 | | 19,651 |
Enstar Group Ltd. (a) | 922 | | 76,526 |
Erie Indemnity Co. Class A | 3,269 | | 205,816 |
FPIC Insurance Group, Inc. (a) | 1,154 | | 42,675 |
Global Indemnity PLC (a) | 1,815 | | 34,812 |
Greenlight Capital Re, Ltd. (a) | 2,430 | | 67,991 |
Hallmark Financial Services, Inc. (a) | 1,598 | | 14,030 |
Harleysville Group, Inc. | 1,985 | | 70,646 |
Infinity Property & Casualty Corp. | 1,165 | | 67,255 |
Investors Title Co. | 370 | | 11,292 |
Kansas City Life Insurance Co. | 814 | | 25,503 |
Maiden Holdings Ltd. | 5,868 | | 44,186 |
Mercer Insurance Group, Inc. | 963 | | 18,076 |
National Interstate Corp. | 1,208 | | 24,945 |
National Western Life Insurance Co. Class A | 280 | | 46,684 |
Navigators Group, Inc. (a) | 1,115 | | 55,181 |
Presidential Life Corp. | 3,187 | | 29,543 |
Safety Insurance Group, Inc. | 1,308 | | 61,227 |
Selective Insurance Group, Inc. | 3,494 | | 57,651 |
State Auto Financial Corp. | 2,892 | | 45,520 |
Tower Group, Inc. | 2,796 | | 71,913 |
United Fire & Casualty Co. | 1,973 | | 40,920 |
| | 2,420,042 |
Real Estate Investment Trusts - 0.1% |
American Capital Agency Corp. | 3,245 | | 95,143 |
Gladstone Commercial Corp. | 882 | | 16,317 |
Investors Real Estate Trust | 6,140 | | 54,339 |
Mission West Properties, Inc. | 1,926 | | 12,577 |
Retail Opportunity Investments Corp. | 3,350 | | 32,931 |
| | 211,307 |
Real Estate Management & Development - 0.1% |
Altisource Portfolio Solutions SA (a) | 2,135 | | 58,029 |
Avatar Holdings, Inc. (a) | 1,147 | | 22,493 |
China HGS Real Estate, Inc. (a)(d) | 4,000 | | 14,200 |
China Housing & Land Development, Inc. (a)(d) | 4,266 | | 10,196 |
China Real Estate Information Corp. ADR (a)(d) | 954 | | 8,729 |
Elbit Imaging Ltd. (a) | 1,492 | | 18,053 |
FirstService Corp. (sub. vtg.) (a) | 2,137 | | 55,954 |
Stratus Properties, Inc. (a) | 335 | | 2,971 |
Common Stocks - continued |
| Shares | | Value |
FINANCIALS - continued |
Real Estate Management & Development - continued |
Thomas Properties Group, Inc. (a) | 2,004 | | $ 8,597 |
ZipRealty, Inc. (a) | 624 | | 1,548 |
| | 200,770 |
Thrifts & Mortgage Finance - 0.8% |
Abington Bancorp, Inc. | 2,376 | | 28,512 |
America First Tax Exempt Investors LP | 1,675 | | 8,794 |
Anchor BanCorp Wisconsin, Inc. (a)(d) | 2,266 | | 1,994 |
Atlantic Coast Federal Corp. (a) | 668 | | 1,309 |
Bank Mutual Corp. | 4,433 | | 20,303 |
BankFinancial Corp. | 1,864 | | 17,391 |
Beneficial Mutual Bancorp, Inc. (a) | 6,328 | | 49,169 |
Berkshire Bancorp, Inc. (a) | 927 | | 4,172 |
Berkshire Hills Bancorp, Inc. | 1,600 | | 32,112 |
BofI Holding, Inc. (a) | 1,645 | | 22,175 |
Brookline Bancorp, Inc., Delaware | 4,768 | | 46,869 |
Brooklyn Federal Bancorp, Inc. | 773 | | 1,322 |
Camco Financial Corp. (a) | 727 | | 916 |
Capitol Federal Financial | 5,683 | | 132,698 |
CFS Bancorp, Inc. | 485 | | 2,546 |
Charter Financial Corp., Georgia | 1,600 | | 13,184 |
Chicopee Bancorp, Inc. (a) | 716 | | 8,900 |
Citizens South Banking Corp., Delaware | 668 | | 3,026 |
Clifton Savings Bancorp, Inc. | 1,915 | | 18,116 |
Dime Community Bancshares, Inc. | 3,457 | | 47,188 |
Eagle Bancorp Montana, Inc. | 1,100 | | 11,000 |
ESB Financial Corp. | 1,247 | | 17,583 |
ESSA Bancorp, Inc. | 1,551 | | 20,396 |
First Advantage Bancorp | 249 | | 2,926 |
First Defiance Financial Corp. (a) | 1,088 | | 12,871 |
First Federal Bancshares of Arkansas, Inc. (a)(d) | 569 | | 649 |
First Financial Holdings, Inc. | 1,653 | | 18,166 |
First Financial Northwest, Inc. (d) | 2,916 | | 9,477 |
First Financial Service Corp. (a) | 413 | | 1,747 |
First Niagara Financial Group, Inc. | 13,965 | | 172,957 |
First PacTrust Bancorp, Inc. (d) | 595 | | 7,140 |
First Place Financial Corp. (a) | 740 | | 1,584 |
Flushing Financial Corp. | 2,335 | | 31,289 |
Fox Chase Bancorp, Inc. (a) | 1,170 | | 12,297 |
Heritage Financial Group, Inc. | 681 | | 6,980 |
HMN Financial, Inc. (a) | 448 | | 1,299 |
Common Stocks - continued |
| Shares | | Value |
FINANCIALS - continued |
Thrifts & Mortgage Finance - continued |
Home Federal Bancorp, Inc. | 1,430 | | $ 16,488 |
Hudson City Bancorp, Inc. | 38,000 | | 431,300 |
Kaiser Federal Financial Group, Inc. | 527 | | 5,091 |
Kearny Financial Corp. | 4,321 | | 37,117 |
Legacy Bancorp, Inc. | 898 | | 7,094 |
Louisiana Bancorp, Inc. (a) | 97 | | 1,377 |
LSB Corp. | 631 | | 13,219 |
LSB Financial Corp. | 136 | | 1,598 |
Meridian Interstate Bancorp, Inc. (a) | 1,350 | | 14,783 |
MutualFirst Financial, Inc. | 550 | | 4,703 |
NASB Financial, Inc. | 486 | | 6,250 |
Northeast Community Bancorp, Inc. | 544 | | 3,237 |
Northwest Bancshares, Inc. | 7,812 | | 80,151 |
OceanFirst Financial Corp. | 1,038 | | 12,529 |
Oritani Financial Corp. | 3,825 | | 42,955 |
Parkvale Financial Corp. | 256 | | 1,994 |
People's United Financial, Inc. | 25,337 | | 313,925 |
Provident Financial Holdings, Inc. | 315 | | 2,111 |
Provident New York Bancorp | 3,587 | | 33,610 |
Prudential Bancorp, Inc. of Pennsylvania | 1,172 | | 7,255 |
Pulaski Financial Corp. | 484 | | 3,693 |
PVF Capital Corp. (a) | 1,421 | | 2,629 |
Riverview Bancorp, Inc. (a) | 1,020 | | 2,407 |
Rockville Financial, Inc. | 1,512 | | 16,632 |
Roma Financial Corp. | 2,638 | | 25,430 |
Rome Bancorp, Inc. | 1,067 | | 12,057 |
Severn Bancorp, Inc. (a) | 677 | | 1,950 |
SI Financial Group, Inc. | 1,167 | | 7,165 |
Territorial Bancorp, Inc. | 477 | | 8,786 |
TFS Financial Corp. | 22,317 | | 182,553 |
Timberland Bancorp, Inc. | 250 | | 923 |
Tree.com, Inc. (a) | 969 | | 7,355 |
Trustco Bank Corp., New York | 5,917 | | 33,194 |
United Community Financial Corp., Ohio (a) | 1,934 | | 2,379 |
United Financial Bancorp, Inc. | 2,852 | | 42,295 |
United Western Bancorp, Inc. (a) | 3,337 | | 938 |
ViewPoint Financial Group | 2,273 | | 23,844 |
Washington Federal, Inc. | 8,151 | | 120,309 |
Waterstone Financial, Inc. (a) | 2,022 | | 7,380 |
Common Stocks - continued |
| Shares | | Value |
FINANCIALS - continued |
Thrifts & Mortgage Finance - continued |
Westfield Financial, Inc. | 4,429 | | $ 36,406 |
WSFS Financial Corp. | 627 | | 27,275 |
| | 2,391,444 |
TOTAL FINANCIALS | | 19,380,256 |
HEALTH CARE - 12.6% |
Biotechnology - 5.9% |
3SBio, Inc. sponsored ADR (a) | 1,110 | | 17,039 |
Aastrom Biosciences, Inc. (a) | 464 | | 1,118 |
Acadia Pharmaceuticals, Inc. (a) | 2,336 | | 1,565 |
Achillion Pharmaceuticals, Inc. (a) | 2,091 | | 5,980 |
Acorda Therapeutics, Inc. (a) | 2,796 | | 73,675 |
AEterna Zentaris, Inc. (sub. vtg.) (a) | 3,891 | | 5,572 |
Affymax, Inc. (a) | 1,762 | | 11,911 |
Alexion Pharmaceuticals, Inc. (a) | 6,531 | | 499,295 |
Alkermes, Inc. (a) | 6,265 | | 65,657 |
Allos Therapeutics, Inc. (a) | 7,271 | | 29,520 |
Alnylam Pharmaceuticals, Inc. (a) | 3,693 | | 33,791 |
AMAG Pharmaceuticals, Inc. (a) | 1,445 | | 22,672 |
Amarin Corp. PLC ADR (a) | 1,491 | | 8,693 |
Amgen, Inc. (a) | 68,544 | | 3,611,583 |
Amicus Therapeutics, Inc. (a) | 2,472 | | 10,259 |
Amylin Pharmaceuticals, Inc. (a) | 10,613 | | 136,006 |
Anadys Pharmaceuticals, Inc. (a) | 2,079 | | 2,225 |
Anthera Pharmaceuticals, Inc. | 1,300 | | 7,111 |
Antigenics, Inc. (a) | 9,659 | | 8,597 |
Arena Pharmaceuticals, Inc. (a)(d) | 7,480 | | 10,846 |
ARIAD Pharmaceuticals, Inc. (a) | 9,358 | | 37,713 |
ArQule, Inc. (a) | 4,918 | | 26,705 |
Array Biopharma, Inc. (a) | 3,726 | | 11,960 |
AspenBio Pharma, Inc. (a)(d) | 1,506 | | 919 |
Athersys, Inc. (a) | 2,708 | | 6,851 |
AVEO Pharmaceuticals, Inc. | 1,900 | | 28,082 |
AVI BioPharma, Inc. (a) | 10,138 | | 18,654 |
Avigen, Inc. rights (a) | 1,684 | | 0 |
BioCryst Pharmaceuticals, Inc. (a) | 3,295 | | 16,277 |
Biogen Idec, Inc. (a) | 17,254 | | 1,103,738 |
BioMarin Pharmaceutical, Inc. (a) | 7,352 | | 199,092 |
Bionovo, Inc. (a) | 640 | | 870 |
Biosante Pharmaceuticals, Inc. (a) | 3,609 | | 5,305 |
Common Stocks - continued |
| Shares | | Value |
HEALTH CARE - continued |
Biotechnology - continued |
Biospecifics Technologies Corp. (a)(d) | 342 | | $ 7,757 |
Capstone Therapeutics Corp. (a) | 1,251 | | 1,163 |
Celera Corp. (a) | 7,372 | | 41,799 |
Celgene Corp. (a) | 33,012 | | 1,960,253 |
Cell Therapeutics, Inc. (a) | 53,221 | | 20,756 |
Celldex Therapeutics, Inc. (a)(d) | 1,996 | | 8,283 |
Cephalon, Inc. (a) | 5,292 | | 335,989 |
Cepheid, Inc. (a) | 4,096 | | 80,650 |
Chelsea Therapeutics International Ltd. (a) | 3,392 | | 18,419 |
China Biologic Products, Inc. (a)(d) | 1,711 | | 19,916 |
Cleveland Biolabs, Inc. (a)(d) | 3,204 | | 21,563 |
Clinical Data, Inc. (a)(d) | 1,824 | | 33,343 |
Codexis, Inc. (a) | 2,784 | | 26,225 |
Crucell NV sponsored ADR (a) | 1,054 | | 33,001 |
Cubist Pharmaceuticals, Inc. (a) | 3,760 | | 81,630 |
Curis, Inc. (a) | 7,955 | | 13,364 |
Cyclacel Pharmaceuticals, Inc. (a) | 732 | | 1,340 |
Cytokinetics, Inc. (a) | 4,127 | | 9,121 |
Cytori Therapeutics, Inc. (a) | 4,179 | | 18,764 |
CytRx Corp. (a) | 5,744 | | 5,974 |
Dendreon Corp. (a) | 9,773 | | 349,287 |
Discovery Laboratories, Inc. (a) | 9,282 | | 1,856 |
DUSA Pharmaceuticals, Inc. (a) | 923 | | 2,280 |
Dyax Corp. (a) | 6,344 | | 14,337 |
Dynavax Technologies Corp. (a) | 5,399 | | 10,798 |
Emergent BioSolutions, Inc. rights 10/29/13 (a) | 854 | | 0 |
EntreMed, Inc. (a) | 424 | | 3,066 |
Enzon Pharmaceuticals, Inc. (a) | 4,117 | | 45,781 |
EpiCept Corp. (a) | 6,238 | | 2,059 |
Exact Sciences Corp. (a) | 2,959 | | 17,576 |
Exelixis, Inc. (a) | 8,847 | | 51,224 |
Genomic Health, Inc. (a) | 2,164 | | 39,926 |
Gentium SpA sponsored ADR (a) | 138 | | 780 |
GenVec, Inc. (a) | 7,648 | | 3,671 |
Genzyme Corp. (a) | 18,199 | | 1,296,133 |
Geron Corp. (a)(d) | 8,872 | | 50,837 |
Gilead Sciences, Inc. (a) | 60,112 | | 2,194,088 |
GTx, Inc. (a) | 3,012 | | 8,735 |
Halozyme Therapeutics, Inc. (a) | 7,473 | | 51,713 |
Human Genome Sciences, Inc. (a)(d) | 13,760 | | 337,533 |
Idenix Pharmaceuticals, Inc. (a) | 7,108 | | 27,081 |
Common Stocks - continued |
| Shares | | Value |
HEALTH CARE - continued |
Biotechnology - continued |
Idera Pharmaceuticals, Inc. (a) | 1,411 | | $ 3,499 |
ImmunoGen, Inc. (a)(d) | 4,889 | | 40,676 |
Immunomedics, Inc. (a)(d) | 4,527 | | 14,260 |
Incyte Corp. (a) | 8,834 | | 128,181 |
Infinity Pharmaceuticals, Inc. (a) | 1,638 | | 10,303 |
Inhibitex, Inc. (a) | 4,447 | | 13,030 |
Insmed, Inc. (a) | 9,133 | | 6,576 |
InterMune, Inc. (a)(d) | 3,978 | | 49,964 |
Ironwood Pharmaceuticals, Inc. Class A | 1,050 | | 11,225 |
Isis Pharmaceuticals, Inc. (a) | 7,153 | | 67,489 |
Keryx Biopharmaceuticals, Inc. (a) | 5,121 | | 27,961 |
Lexicon Pharmaceuticals, Inc. (a) | 23,805 | | 32,375 |
Ligand Pharmaceuticals, Inc.: | | | |
rights 12/31/11 (a) | 1,933 | | 0 |
rights 12/31/11 (a) | 1,639 | | 0 |
rights 12/31/11 (a) | 1,639 | | 0 |
Class B (a) | 1,966 | | 16,593 |
rights (a) | 1,518 | | 42 |
rights (a) | 1,518 | | 68 |
rights (a) | 1,518 | | 40 |
rights (a) | 1,518 | | 39 |
MannKind Corp. (a)(d) | 8,534 | | 53,594 |
Marina Biotech, Inc. (a)(d) | 284 | | 503 |
Marshall Edwards, Inc. (a)(d) | 544 | | 481 |
Martek Biosciences (a) | 2,219 | | 48,818 |
Maxygen, Inc. | 3,874 | | 25,065 |
Medivation, Inc. (a) | 2,582 | | 29,254 |
Metabolix, Inc. (a) | 2,402 | | 24,596 |
Micromet, Inc. (a) | 5,634 | | 40,903 |
Molecular Insight Pharmaceuticals, Inc. (a)(d) | 1,312 | | 1,050 |
Momenta Pharmaceuticals, Inc. (a)(d) | 3,141 | | 47,900 |
Myrexis, Inc. (a) | 4,067 | | 15,170 |
Myriad Genetics, Inc. (a) | 6,957 | | 149,784 |
Nabi Biopharmaceuticals (a) | 3,990 | | 20,748 |
Nanosphere, Inc. (a) | 2,685 | | 14,043 |
Neurocrine Biosciences, Inc. (a) | 3,383 | | 24,628 |
NeurogesX, Inc. (a)(d) | 1,369 | | 7,338 |
Nile Therapeutics, Inc. (a) | 5,215 | | 2,608 |
Novavax, Inc. (a) | 7,440 | | 16,591 |
NPS Pharmaceuticals, Inc. (a) | 4,747 | | 29,479 |
Nymox Pharmaceutical Corp. (a) | 1,810 | | 7,403 |
Common Stocks - continued |
| Shares | | Value |
HEALTH CARE - continued |
Biotechnology - continued |
Omeros Corp. (a)(d) | 2,026 | | $ 16,431 |
OncoGenex Pharmaceuticals, Inc. (a) | 515 | | 8,271 |
Oncolytics Biotech, Inc. (a) | 4,198 | | 19,628 |
Oncothyreon, Inc. (a) | 2,510 | | 8,358 |
ONYX Pharmaceuticals, Inc. (a) | 4,548 | | 133,939 |
Orchid Cellmark, Inc. (a) | 2,602 | | 4,215 |
OREXIGEN Therapeutics, Inc. (a)(d) | 3,466 | | 18,058 |
Osiris Therapeutics, Inc. (a) | 3,298 | | 21,635 |
OXiGENE, Inc. (a) | 1,607 | | 329 |
Oxygen Biotherapeutics, Inc. (a) | 1,500 | | 3,225 |
PDL BioPharma, Inc. | 8,372 | | 48,390 |
Peregrine Pharmaceuticals, Inc. (a)(d) | 3,244 | | 4,996 |
Pharmacyclics, Inc. (a) | 3,400 | | 18,428 |
Pharmasset, Inc. (a) | 2,429 | | 105,224 |
Pluristem Therapeutics, Inc. (a)(d) | 7,166 | | 9,674 |
Poniard Pharmaceuticals, Inc. (a) | 8,376 | | 3,040 |
Progenics Pharmaceuticals, Inc. (a) | 3,648 | | 17,328 |
QLT, Inc. (a) | 4,361 | | 26,384 |
Raptor Pharmaceutical Corp. (a) | 1,198 | | 4,516 |
Regeneron Pharmaceuticals, Inc. (a) | 5,791 | | 166,897 |
Repligen Corp. (a) | 1,624 | | 6,041 |
Rigel Pharmaceuticals, Inc. (a) | 4,009 | | 31,992 |
RXi Pharmaceuticals Corp. (a) | 745 | | 2,637 |
Sangamo Biosciences, Inc. (a) | 5,191 | | 24,190 |
Savient Pharmaceuticals, Inc. (a) | 5,462 | | 64,506 |
SciClone Pharmaceuticals, Inc. (a) | 4,363 | | 16,318 |
Seattle Genetics, Inc. (a) | 7,126 | | 107,603 |
SIGA Technologies, Inc. (a) | 3,606 | | 45,436 |
Sinovac Biotech Ltd. (a) | 4,346 | | 21,078 |
Spectrum Pharmaceuticals, Inc. (a) | 3,410 | | 15,175 |
StemCells, Inc. (a)(d) | 19,124 | | 20,271 |
Sunesis Pharmaceuticals, Inc. (a) | 1,761 | | 694 |
Synta Pharmaceuticals Corp. (a) | 2,072 | | 8,889 |
Talecris Biotherapeutics Holdings Corp. (a) | 8,899 | | 193,108 |
Targacept, Inc. (a) | 2,128 | | 45,114 |
Telik, Inc. (a) | 2,715 | | 1,955 |
Theravance, Inc. (a) | 4,611 | | 115,183 |
Transcept Pharmaceuticals, Inc. (a) | 1,571 | | 10,117 |
Trimeris, Inc. (a) | 671 | | 1,698 |
Trius Therapeutics, Inc. | 1,800 | | 6,228 |
United Therapeutics Corp. (a) | 4,169 | | 262,355 |
Common Stocks - continued |
| Shares | | Value |
HEALTH CARE - continued |
Biotechnology - continued |
Vanda Pharmaceuticals, Inc. (a) | 1,679 | | $ 13,533 |
Vertex Pharmaceuticals, Inc. (a) | 14,761 | | 489,032 |
Vical, Inc. (a) | 5,241 | | 10,272 |
XOMA Ltd. (a) | 1,862 | | 4,432 |
Zalicus, Inc. (a) | 9,513 | | 11,225 |
ZIOPHARM Oncology, Inc. (a) | 3,283 | | 13,493 |
| | 16,431,170 |
Health Care Equipment & Supplies - 1.6% |
Abaxis, Inc. (a) | 1,567 | | 42,309 |
Abiomed, Inc. (a)(d) | 3,647 | | 41,868 |
Accuray, Inc. (a) | 4,719 | | 28,220 |
Align Technology, Inc. (a) | 5,337 | | 93,344 |
Alimera Sciences, Inc. (a)(d) | 2,500 | | 28,600 |
Alphatec Holdings, Inc. (a) | 5,917 | | 13,313 |
American Medical Systems Holdings, Inc. (a) | 5,446 | | 97,647 |
Analogic Corp. | 1,208 | | 56,136 |
Angiodynamics, Inc. (a) | 2,452 | | 34,254 |
Anika Therapeutics, Inc. (a) | 1,002 | | 6,122 |
ArthroCare Corp. (a) | 1,840 | | 55,715 |
Atricure, Inc. (a) | 695 | | 6,241 |
Atrion Corp. | 234 | | 38,409 |
BioLase Technology, Inc. (a) | 592 | | 906 |
Cardiac Science Corp. (a) | 1,500 | | 3,465 |
Cardica, Inc. (a) | 1,278 | | 3,438 |
Cardiovascular Systems, Inc. (a) | 980 | | 8,781 |
Cerus Corp. (a) | 1,646 | | 3,967 |
China Medical Technologies, Inc. sponsored ADR (a) | 1,646 | | 18,814 |
Conceptus, Inc. (a) | 2,216 | | 29,140 |
CONMED Corp. (a) | 2,415 | | 51,947 |
Cutera, Inc. (a) | 521 | | 3,652 |
Cyberonics, Inc. (a) | 2,180 | | 58,577 |
Cynosure, Inc. Class A (a) | 700 | | 6,636 |
Delcath Systems, Inc. (a)(d) | 3,168 | | 31,870 |
DENTSPLY International, Inc. | 10,180 | | 314,766 |
DexCom, Inc. (a) | 4,859 | | 54,785 |
DynaVox, Inc. Class A (a) | 830 | | 3,270 |
Endologix, Inc. (a) | 4,661 | | 26,474 |
Exactech, Inc. (a) | 1,360 | | 24,235 |
Gen-Probe, Inc. (a) | 3,402 | | 176,428 |
Given Imaging Ltd. (a) | 1,925 | | 29,068 |
Common Stocks - continued |
| Shares | | Value |
HEALTH CARE - continued |
Health Care Equipment & Supplies - continued |
Hansen Medical, Inc. (a) | 2,938 | | $ 4,231 |
HeartWare International, Inc. (a) | 992 | | 91,224 |
Hologic, Inc. (a) | 18,040 | | 295,856 |
ICU Medical, Inc. (a) | 1,041 | | 38,153 |
IDEXX Laboratories, Inc. (a)(d) | 4,088 | | 262,490 |
Immucor, Inc. (a) | 5,142 | | 94,459 |
Insulet Corp. (a) | 2,951 | | 40,045 |
Integra LifeSciences Holdings Corp. (a) | 2,187 | | 94,850 |
Intuitive Surgical, Inc. (a) | 2,793 | | 726,990 |
IRIS International, Inc. (a) | 2,486 | | 23,344 |
Kensey Nash Corp. (a) | 1,045 | | 28,361 |
LeMaitre Vascular, Inc. (a) | 426 | | 2,846 |
Mako Surgical Corp. (a) | 3,360 | | 38,539 |
Masimo Corp. | 4,523 | | 139,580 |
Medical Action Industries, Inc. (a) | 1,561 | | 12,426 |
MELA Sciences, Inc. (a)(d) | 1,612 | | 5,739 |
Meridian Bioscience, Inc. | 2,843 | | 63,171 |
Merit Medical Systems, Inc. (a) | 2,018 | | 30,754 |
Natus Medical, Inc. (a) | 2,216 | | 28,498 |
Neogen Corp. (a) | 1,962 | | 72,888 |
NeuroMetrix, Inc. (a) | 497 | | 258 |
NMT Medical, Inc. (a) | 513 | | 108 |
NuVasive, Inc. (a)(d) | 2,787 | | 65,104 |
NxStage Medical, Inc. (a) | 3,958 | | 85,651 |
OraSure Technologies, Inc. (a) | 2,902 | | 15,236 |
Orthofix International NV (a) | 1,423 | | 38,691 |
Orthovita, Inc. (a) | 5,865 | | 11,671 |
OTIX Global, Inc. (a) | 284 | | 3,127 |
Palomar Medical Technologies, Inc. (a) | 1,877 | | 23,369 |
Quidel Corp. (a) | 2,368 | | 31,281 |
Rochester Medical Corp. (a) | 1,184 | | 13,095 |
Rockwell Medical Technologies, Inc. (a) | 2,032 | | 15,829 |
RTI Biologics, Inc. (a) | 3,187 | | 8,637 |
Shamir Optical Industry Ltd. | 707 | | 9,608 |
Sirona Dental Systems, Inc. (a) | 4,001 | | 151,198 |
Solta Medical, Inc. (a) | 4,423 | | 8,979 |
SonoSite, Inc. (a) | 1,349 | | 40,983 |
Staar Surgical Co. (a) | 2,835 | | 15,167 |
Stereotaxis, Inc. (a)(d) | 3,232 | | 11,150 |
SurModics, Inc. (a)(d) | 1,470 | | 13,598 |
Synergetics USA, Inc. (a) | 1,175 | | 4,042 |
Common Stocks - continued |
| Shares | | Value |
HEALTH CARE - continued |
Health Care Equipment & Supplies - continued |
Syneron Medical Ltd. (a) | 2,826 | | $ 27,271 |
Synovis Life Technologies, Inc. (a) | 2,035 | | 32,865 |
The Spectranetics Corp. (a) | 1,742 | | 8,518 |
ThermoGenesis Corp. (a) | 1,101 | | 3,050 |
Thoratec Corp. (a) | 4,037 | | 102,762 |
TomoTherapy, Inc. (a) | 4,758 | | 16,653 |
TranS1, Inc. (a) | 612 | | 1,169 |
Trinity Biotech PLC sponsored ADR (a) | 674 | | 5,419 |
Unilife Corp. (a)(d) | 3,500 | | 19,005 |
Utah Medical Products, Inc. | 500 | | 13,615 |
Vascular Solutions, Inc. (a) | 1,180 | | 12,484 |
Volcano Corp. (a) | 3,479 | | 92,367 |
Winner Medical Group, Inc. (a)(d) | 1,800 | | 10,224 |
Wright Medical Group, Inc. (a) | 2,669 | | 35,204 |
Young Innovations, Inc. | 390 | | 11,786 |
Zoll Medical Corp. (a) | 1,648 | | 55,076 |
| | 4,501,091 |
Health Care Providers & Services - 1.6% |
Air Methods Corp. (a) | 1,038 | | 51,101 |
Allied Healthcare International, Inc. (a) | 7,104 | | 20,602 |
Almost Family, Inc. (a) | 863 | | 30,585 |
Amedisys, Inc. (a) | 2,018 | | 57,271 |
America Service Group, Inc. | 530 | | 7,780 |
American CareSource Holdings, Inc. (a) | 1,100 | | 1,507 |
American Dental Partners, Inc. (a) | 1,575 | | 19,451 |
AmSurg Corp. (a) | 1,125 | | 20,678 |
Animal Health International, Inc. (a) | 1,331 | | 3,328 |
Bio-Reference Laboratories, Inc. (a) | 2,262 | | 47,434 |
BioScrip, Inc. (a) | 3,251 | | 13,069 |
CardioNet, Inc. (a) | 1,581 | | 6,387 |
Catalyst Health Solutions, Inc. (a) | 3,439 | | 147,602 |
Chindex International, Inc. (a) | 849 | | 12,930 |
Clarient, Inc. (a) | 6,261 | | 31,305 |
Corvel Corp. (a) | 957 | | 43,725 |
Cross Country Healthcare, Inc. (a) | 3,098 | | 23,793 |
Express Scripts, Inc. (a) | 38,961 | | 2,029,478 |
Genoptix, Inc. (a) | 1,274 | | 21,747 |
Gentiva Health Services, Inc. (a) | 2,116 | | 48,626 |
Healthways, Inc. (a) | 2,712 | | 26,171 |
Henry Schein, Inc. (a) | 6,487 | | 372,548 |
Common Stocks - continued |
| Shares | | Value |
HEALTH CARE - continued |
Health Care Providers & Services - continued |
HMS Holdings Corp. (a) | 1,903 | | $ 119,908 |
IPC The Hospitalist Co., Inc. (a) | 1,313 | | 42,567 |
LCA-Vision, Inc. (a) | 1,176 | | 6,092 |
LHC Group, Inc. (a) | 1,191 | | 31,502 |
LifePoint Hospitals, Inc. (a) | 3,977 | | 144,047 |
Lincare Holdings, Inc. | 7,024 | | 180,868 |
Magellan Health Services, Inc. (a) | 2,419 | | 117,805 |
Medcath Corp. (a) | 1,605 | | 20,255 |
MWI Veterinary Supply, Inc. (a) | 943 | | 57,617 |
National Research Corp. | 370 | | 10,475 |
NightHawk Radiology Holdings, Inc. (a) | 1,452 | | 9,423 |
NovaMed Eyecare, Inc. (a)(d) | 392 | | 4,555 |
Patterson Companies, Inc. | 8,619 | | 256,243 |
PDI, Inc. (a) | 594 | | 5,619 |
Prospect Medical Holdings, Inc. (a) | 1,450 | | 12,238 |
Providence Service Corp. (a) | 853 | | 14,339 |
PSS World Medical, Inc. (a) | 3,884 | | 80,010 |
RadNet, Inc. (a) | 2,333 | | 5,996 |
ResCare, Inc. (a) | 2,120 | | 28,048 |
Rural/Metro Corp. (a) | 2,478 | | 28,076 |
Sharps Compliance Corp. (a) | 740 | | 3,360 |
Sun Healthcare Group, Inc. (a) | 1,068 | | 10,466 |
The Ensign Group, Inc. | 1,319 | | 28,372 |
U.S. Physical Therapy, Inc. (a) | 1,196 | | 22,951 |
VCA Antech, Inc. (a) | 6,127 | | 133,844 |
| | 4,411,794 |
Health Care Technology - 0.5% |
Allscripts-Misys Healthcare Solutions, Inc. (a) | 10,235 | | 179,624 |
athenahealth, Inc. (a) | 2,444 | | 100,228 |
Cerner Corp. (a) | 5,904 | | 518,725 |
Computer Programs & Systems, Inc. | 840 | | 39,220 |
iCAD, Inc. (a) | 2,501 | | 3,752 |
MedAssets, Inc. (a) | 4,099 | | 76,016 |
Medidata Solutions, Inc. (a) | 1,700 | | 33,830 |
MedQuist, Inc. | 2,000 | | 17,840 |
Merge Healthcare, Inc. (a) | 5,742 | | 22,164 |
Omnicell, Inc. (a) | 2,544 | | 34,090 |
Quality Systems, Inc. | 2,125 | | 137,041 |
SXC Health Solutions Corp. (a) | 4,372 | | 167,155 |
Common Stocks - continued |
| Shares | | Value |
HEALTH CARE - continued |
Health Care Technology - continued |
Transcend Services, Inc. (a) | 710 | | $ 11,360 |
Vital Images, Inc. (a) | 1,217 | | 16,332 |
| | 1,357,377 |
Life Sciences Tools & Services - 0.9% |
Accelrys, Inc. (a) | 4,219 | | 35,524 |
Affymetrix, Inc. (a) | 5,223 | | 21,728 |
Albany Molecular Research, Inc. (a) | 3,021 | | 15,256 |
Arrowhead Research Corp. (a) | 1,920 | | 1,824 |
Bruker BioSciences Corp. (a) | 11,774 | | 181,555 |
Caliper Life Sciences, Inc. (a) | 7,618 | | 44,718 |
Combimatrix Corp. (a) | 142 | | 280 |
Complete Genomics, Inc. | 2,200 | | 17,050 |
Compugen Ltd. (a) | 1,757 | | 6,659 |
Dionex Corp. (a) | 1,284 | | 117,062 |
eResearchTechnology, Inc. (a) | 4,964 | | 27,848 |
Furiex Pharmaceuticals, Inc. (a) | 710 | | 8,747 |
Harvard Bioscience, Inc. (a) | 3,295 | | 12,916 |
ICON PLC sponsored ADR (a) | 4,511 | | 90,806 |
Illumina, Inc. (a) | 9,031 | | 542,944 |
Kendle International, Inc. (a) | 727 | | 6,550 |
Life Technologies Corp. (a) | 13,111 | | 652,993 |
Luminex Corp. (a) | 3,105 | | 52,412 |
Medtox Scientific, Inc. | 357 | | 4,141 |
Pacific Biosciences of California, Inc. | 4,500 | | 56,700 |
PAREXEL International Corp. (a) | 4,187 | | 73,524 |
Pharmaceutical Product Development, Inc. | 8,671 | | 216,081 |
Pure Bioscience (a) | 1,890 | | 4,064 |
QIAGEN NV (a) | 16,673 | | 305,116 |
Sequenom, Inc. (a)(d) | 4,998 | | 34,336 |
SeraCare Life Sciences, Inc. (a) | 764 | | 3,171 |
Techne Corp. | 2,429 | | 145,910 |
| | 2,679,915 |
Pharmaceuticals - 2.1% |
Acura Pharmaceuticals, Inc. (a)(d) | 2,462 | | 6,500 |
Adolor Corp. (a) | 5,544 | | 6,930 |
Akorn, Inc. (a) | 6,018 | | 31,956 |
Alexza Pharmaceuticals, Inc. (a) | 4,285 | | 3,872 |
Angiotech Pharmaceuticals, Inc. (a) | 4,579 | | 1,048 |
Ardea Biosciences, Inc. (a) | 1,685 | | 37,458 |
Auxilium Pharmaceuticals, Inc. (a) | 3,409 | | 64,532 |
Common Stocks - continued |
| Shares | | Value |
HEALTH CARE - continued |
Pharmaceuticals - continued |
AVANIR Pharmaceuticals Class A (a)(d) | 6,500 | | $ 27,820 |
Biodel, Inc. (a)(d) | 1,400 | | 2,380 |
BioMimetic Therapeutics, Inc. (a) | 1,931 | | 21,550 |
BMP Sunstone Corp. (a) | 3,220 | | 31,814 |
Cadence Pharmaceuticals, Inc. (a)(d) | 4,147 | | 29,734 |
Cardiome Pharma Corp. (a) | 5,488 | | 26,729 |
Columbia Laboratories, Inc. (a) | 1,899 | | 2,545 |
Corcept Therapeutics, Inc. (a) | 7,129 | | 27,803 |
Cornerstone Therapeutics, Inc. (a) | 1,844 | | 11,009 |
CPEX Pharmaceuticals, Inc. (a) | 136 | | 3,359 |
Cumberland Pharmaceuticals, Inc. (a) | 1,718 | | 11,785 |
Cypress Bioscience, Inc. (a) | 3,928 | | 15,633 |
DepoMed, Inc. (a) | 3,719 | | 20,306 |
Durect Corp. (a) | 10,798 | | 32,178 |
Endo Pharmaceuticals Holdings, Inc. (a) | 8,345 | | 300,503 |
Eurand NV (a) | 4,134 | | 45,350 |
Flamel Technologies SA sponsored ADR (a)(d) | 1,311 | | 9,295 |
Hi-Tech Pharmacal Co., Inc. (a) | 1,240 | | 29,487 |
Impax Laboratories, Inc. (a) | 4,486 | | 80,299 |
Inspire Pharmaceuticals, Inc. (a) | 6,727 | | 46,954 |
Ista Pharmaceuticals, Inc. (a) | 1,726 | | 7,681 |
Jazz Pharmaceuticals, Inc. (a) | 2,544 | | 42,358 |
Jiangbo Pharmaceuticals, Inc. (a) | 950 | | 5,776 |
Labopharm, Inc. (a) | 3,695 | | 3,563 |
MAP Pharmaceuticals, Inc. (a) | 1,862 | | 26,757 |
Matrixx Initiatives, Inc. (a) | 2,605 | | 13,494 |
Mylan, Inc. (a) | 31,253 | | 611,465 |
Nektar Therapeutics (a) | 7,166 | | 90,793 |
Novogen Ltd. sponsored ADR (a) | 97 | | 49 |
NuPathe, Inc. | 1,000 | | 5,970 |
Obagi Medical Products, Inc. (a) | 1,285 | | 14,032 |
Optimer Pharmaceuticals, Inc. (a) | 2,863 | | 27,113 |
Pain Therapeutics, Inc. | 4,907 | | 39,109 |
Perrigo Co. | 6,562 | | 395,295 |
Pozen, Inc. (a) | 3,117 | | 19,949 |
ProPhase Labs, Inc. (a) | 1,566 | | 2,004 |
Questcor Pharmaceuticals, Inc. (a) | 5,132 | | 73,080 |
Repros Therapeutics, Inc. (a) | 372 | | 551 |
Salix Pharmaceuticals Ltd. (a) | 4,077 | | 182,038 |
Santarus, Inc. (a) | 3,045 | | 8,404 |
Shire PLC sponsored ADR | 3,791 | | 266,659 |
Common Stocks - continued |
| Shares | | Value |
HEALTH CARE - continued |
Pharmaceuticals - continued |
Skystar Bio-Pharmaceutical Co. Ltd. (a) | 1,359 | | $ 11,225 |
Somaxon Pharmaceuticals, Inc. (a)(d) | 2,940 | | 7,909 |
Sucampo Pharmaceuticals, Inc. Class A (a) | 1,103 | | 3,805 |
SuperGen, Inc. (a) | 3,481 | | 9,225 |
Teva Pharmaceutical Industries Ltd. sponsored ADR | 51,247 | | 2,564,400 |
The Medicines Company (a) | 3,621 | | 47,725 |
ViroPharma, Inc. (a) | 5,338 | | 82,472 |
Vivus, Inc. (a)(d) | 5,699 | | 37,044 |
Warner Chilcott PLC | 18,132 | | 344,689 |
XenoPort, Inc. (a) | 2,186 | | 16,942 |
| | 5,890,405 |
TOTAL HEALTH CARE | | 35,271,752 |
INDUSTRIALS - 5.2% |
Aerospace & Defense - 0.3% |
AeroVironment, Inc. (a) | 1,516 | | 37,445 |
American Science & Engineering, Inc. | 592 | | 47,727 |
Applied Energetics, Inc. (a) | 7,472 | | 5,978 |
Applied Signal Technology, Inc. | 1,222 | | 40,155 |
Ascent Solar Technologies, Inc. (a)(d) | 1,977 | | 6,307 |
Astronics Corp. (a) | 339 | | 6,973 |
BE Aerospace, Inc. (a) | 7,358 | | 261,209 |
Ceradyne, Inc. (a) | 2,097 | | 55,403 |
Elbit Systems Ltd. | 2,996 | | 140,213 |
GeoEye, Inc. (a) | 1,394 | | 55,565 |
Global Defense Technology & Systems, Inc. | 921 | | 12,562 |
Herley Industries, Inc. (a) | 746 | | 12,130 |
Innovative Solutions & Support, Inc. (a) | 1,067 | | 5,901 |
KEYW Holding Corp. | 1,900 | | 23,750 |
Kratos Defense & Security Solutions, Inc. (a) | 2,082 | | 22,007 |
Ladish Co., Inc. (a) | 1,186 | | 55,671 |
LMI Aerospace, Inc. (a) | 964 | | 15,684 |
Sypris Solutions, Inc. (a) | 676 | | 2,305 |
Taser International, Inc. (a) | 4,353 | | 17,543 |
TAT Technologies Ltd. | 863 | | 4,483 |
| | 829,011 |
Air Freight & Logistics - 0.7% |
Air Transport Services Group, Inc. (a) | 3,839 | | 28,332 |
Atlas Air Worldwide Holdings, Inc. (a) | 1,792 | | 97,772 |
Common Stocks - continued |
| Shares | | Value |
INDUSTRIALS - continued |
Air Freight & Logistics - continued |
C.H. Robinson Worldwide, Inc. | 11,916 | | $ 878,328 |
Dynamex, Inc. (a) | 981 | | 23,691 |
Expeditors International of Washington, Inc. | 14,842 | | 785,142 |
Forward Air Corp. | 2,142 | | 58,948 |
Hub Group, Inc. Class A (a) | 2,631 | | 85,850 |
Pacer International, Inc. (a) | 2,247 | | 12,561 |
Park-Ohio Holdings Corp. (a) | 771 | | 14,919 |
UTI Worldwide, Inc. | 7,164 | | 137,907 |
| | 2,123,450 |
Airlines - 0.2% |
Allegiant Travel Co. | 1,372 | | 68,504 |
Hawaiian Holdings, Inc. (a) | 4,459 | | 35,226 |
JetBlue Airways Corp. (a) | 21,289 | | 144,552 |
Pinnacle Airlines Corp. (a) | 2,738 | | 22,260 |
Republic Airways Holdings, Inc. (a) | 2,375 | | 18,430 |
Ryanair Holdings PLC sponsored ADR | 7,810 | | 238,439 |
SkyWest, Inc. | 3,793 | | 61,409 |
| | 588,820 |
Building Products - 0.1% |
AAON, Inc. | 1,218 | | 31,242 |
American Woodmark Corp. | 1,276 | | 26,554 |
Apogee Enterprises, Inc. | 2,050 | | 23,063 |
Builders FirstSource, Inc. (a)(d) | 6,715 | | 10,610 |
China Architectural Engineering, Inc. (a) | 2,400 | | 1,419 |
China Ceramics Co. Ltd. (a)(d) | 1,500 | | 11,025 |
Gibraltar Industries, Inc. (a) | 2,751 | | 27,978 |
Insteel Industries, Inc. | 926 | | 9,603 |
PGT, Inc. (a) | 4,454 | | 9,799 |
Universal Forest Products, Inc. | 1,250 | | 40,850 |
US Home Systems, Inc. (a) | 272 | | 1,020 |
| | 193,163 |
Commercial Services & Supplies - 0.8% |
APAC Customer Services, Inc. (a) | 4,492 | | 26,593 |
Casella Waste Systems, Inc. Class A (a) | 1,581 | | 7,209 |
CECO Environmental Corp. (a) | 977 | | 5,354 |
Cintas Corp. | 10,991 | | 293,954 |
Copart, Inc. (a) | 6,167 | | 218,805 |
Courier Corp. | 1,323 | | 18,800 |
EnerNOC, Inc. (a)(d) | 1,893 | | 46,435 |
Fuel Tech, Inc. (a) | 2,055 | | 15,022 |
Common Stocks - continued |
| Shares | | Value |
INDUSTRIALS - continued |
Commercial Services & Supplies - continued |
G&K Services, Inc. Class A | 1,298 | | $ 36,007 |
Guanwei Recycling Corp. (a) | 1,400 | | 5,124 |
Healthcare Services Group, Inc. | 4,728 | | 75,317 |
Heritage-Crystal Clean, Inc. (a) | 639 | | 6,186 |
Herman Miller, Inc. | 3,951 | | 85,105 |
InnerWorkings, Inc. (a) | 4,327 | | 26,698 |
Interface, Inc. Class A | 4,270 | | 61,659 |
Intersections, Inc. | 1,601 | | 16,650 |
Kimball International, Inc. Class B | 3,264 | | 19,127 |
McGrath RentCorp. | 1,837 | | 51,289 |
Mobile Mini, Inc. (a) | 2,314 | | 41,814 |
Multi-Color Corp. | 745 | | 14,565 |
Perma-Fix Environmental Services, Inc. (a) | 2,601 | | 3,928 |
R.R. Donnelley & Sons Co. | 15,112 | | 238,165 |
RINO International Corp. (a)(d) | 2,476 | | 15,054 |
Standard Parking Corp. (a) | 1,686 | | 29,943 |
Stericycle, Inc. (a) | 5,914 | | 437,045 |
Sykes Enterprises, Inc. (a) | 3,184 | | 58,586 |
Team, Inc. (a) | 1,757 | | 35,773 |
Tetra Tech, Inc. (a) | 4,262 | | 98,495 |
United Stationers, Inc. (a) | 1,562 | | 99,140 |
US Ecology, Inc. | 1,521 | | 23,895 |
Virco Manufacturing Co. | 1,086 | | 2,834 |
WCA Waste Corp. (a) | 2,105 | | 12,146 |
| | 2,126,717 |
Construction & Engineering - 0.2% |
Foster Wheeler Ag (a) | 9,304 | | 260,512 |
Great Lakes Dredge & Dock Corp. | 3,806 | | 29,230 |
Insituform Technologies, Inc. Class A (a) | 2,578 | | 57,077 |
Integrated Electrical Services, Inc. (a) | 652 | | 2,054 |
Layne Christensen Co. (a) | 1,467 | | 48,367 |
MYR Group, Inc. (a) | 1,479 | | 23,324 |
Northwest Pipe Co. (a) | 758 | | 16,820 |
Primoris Services Corp. | 2,215 | | 19,581 |
Sterling Construction Co., Inc. (a) | 1,382 | | 18,643 |
UniTek Global Services, Inc. (a) | 2,400 | | 10,848 |
| | 486,456 |
Electrical Equipment - 0.4% |
A-Power Energy Generation Systems, Ltd. (a)(d) | 3,139 | | 19,964 |
A123 Systems, Inc. (a)(d) | 7,793 | | 59,928 |
Common Stocks - continued |
| Shares | | Value |
INDUSTRIALS - continued |
Electrical Equipment - continued |
Active Power, Inc. (a) | 12,711 | | $ 26,439 |
Advanced Battery Technologies, Inc. (a)(d) | 4,982 | | 18,832 |
American Superconductor Corp. (a)(d) | 3,216 | | 107,028 |
Broadwind Energy, Inc. (a) | 8,190 | | 15,643 |
Capstone Turbine Corp. (a) | 16,385 | | 12,813 |
China BAK Battery, Inc. (a)(d) | 3,906 | | 7,343 |
China Electric Motor, Inc. | 1,700 | | 8,279 |
China Recycling Energy Corp. (a)(d) | 2,900 | | 8,555 |
China Ritar Power Corp. (a)(d) | 3,274 | | 9,691 |
Coleman Cable, Inc. (a) | 1,065 | | 6,124 |
Deswell Industries, Inc. | 609 | | 1,979 |
Ecotality, Inc. (a) | 654 | | 2,256 |
Encore Wire Corp. | 1,450 | | 33,031 |
Ener1, Inc. (a)(d) | 8,808 | | 38,315 |
Franklin Electric Co., Inc. | 1,509 | | 58,715 |
FuelCell Energy, Inc. (a)(d) | 8,624 | | 9,745 |
Fushi Copperweld, Inc. (a) | 2,570 | | 23,079 |
Global Power Equipment Group, Inc. (a) | 1,100 | | 21,912 |
Harbin Electric, Inc. (a) | 2,087 | | 33,976 |
Highpower International, Inc. (a) | 815 | | 2,755 |
Hoku Corp. (a)(d) | 4,244 | | 10,780 |
Hydrogenics Corp. (a) | 131 | | 498 |
II-VI, Inc. (a) | 2,500 | | 102,075 |
Jinpan International Ltd. | 1,698 | | 17,371 |
Lihua International, Inc. (a)(d) | 1,829 | | 21,911 |
Lime Energy Co. (a) | 1,937 | | 7,942 |
LSI Industries, Inc. | 2,044 | | 18,049 |
Nexxus Lighting, Inc. (a) | 956 | | 2,065 |
Ocean Power Technologies, Inc. (a) | 1,435 | | 8,165 |
Plug Power, Inc. (a) | 6,316 | | 2,558 |
Powell Industries, Inc. (a) | 807 | | 28,390 |
PowerSecure International, Inc. (a) | 871 | | 7,508 |
Preformed Line Products Co. | 259 | | 12,044 |
Satcon Technology Corp. (a) | 5,298 | | 18,702 |
Ultralife Corp. (a) | 1,473 | | 9,221 |
Valence Technology, Inc. (a)(d) | 16,044 | | 21,339 |
Vicor Corp. | 2,800 | | 46,984 |
Woodward Governor Co. | 4,914 | | 165,848 |
| | 1,027,852 |
Common Stocks - continued |
| Shares | | Value |
INDUSTRIALS - continued |
Industrial Conglomerates - 0.0% |
Raven Industries, Inc. | 1,294 | | $ 57,454 |
Machinery - 1.4% |
3D Systems Corp. (a) | 2,450 | | 68,943 |
Altra Holdings, Inc. (a) | 2,183 | | 36,631 |
American Railcar Industries, Inc. (a) | 2,226 | | 33,412 |
Astec Industries, Inc. (a) | 1,883 | | 56,396 |
Bucyrus International, Inc. Class A | 5,743 | | 512,046 |
Chart Industries, Inc. (a) | 2,340 | | 74,014 |
China Fire & Security Group, Inc. (a) | 2,036 | | 14,700 |
China Valves Technology, Inc. (a)(d) | 2,643 | | 26,721 |
China Wind Systems, Inc. (a) | 1,970 | | 7,269 |
Columbus McKinnon Corp. (NY Shares) (a) | 1,868 | | 30,654 |
Commercial Vehicle Group, Inc. (a) | 2,120 | | 30,040 |
Dynamic Materials Corp. | 806 | | 12,969 |
Energy Recovery, Inc. (a)(d) | 3,989 | | 13,283 |
Flow International Corp. (a) | 3,549 | | 11,747 |
Force Protection, Inc. (a) | 5,486 | | 28,143 |
FreightCar America, Inc. | 980 | | 24,343 |
Gencor Industries, Inc. (a) | 519 | | 3,669 |
Hardinge, Inc. | 1,062 | | 8,777 |
Hurco Companies, Inc. (a) | 280 | | 5,393 |
Joy Global, Inc. | 7,112 | | 542,788 |
Key Technology, Inc. (a) | 313 | | 5,221 |
L.B. Foster Co. Class A (a) | 891 | | 30,909 |
Lincoln Electric Holdings, Inc. | 3,029 | | 186,768 |
Makita Corp. sponsored ADR | 115 | | 4,143 |
MFRI, Inc. (a) | 146 | | 1,168 |
Middleby Corp. (a) | 1,285 | | 103,404 |
NN, Inc. (a) | 807 | | 8,070 |
Nordson Corp. | 2,471 | | 196,272 |
Omega Flex, Inc. | 414 | | 7,026 |
PACCAR, Inc. | 26,088 | | 1,405,100 |
PMFG, Inc. (a) | 953 | | 14,200 |
Portec Rail Products, Inc. | 692 | | 8,027 |
RBC Bearings, Inc. (a) | 1,554 | | 57,327 |
Shengkai Innovations, Inc. (a)(d) | 500 | | 3,250 |
SmartHeat, Inc. (a) | 2,200 | | 10,450 |
Sun Hydraulics Corp. | 1,419 | | 44,216 |
Tecumseh Products Co.: | | | |
Class A (non-vtg.) (a) | 1,265 | | 16,862 |
Class B (a) | 262 | | 3,558 |
Common Stocks - continued |
| Shares | | Value |
INDUSTRIALS - continued |
Machinery - continued |
Thermadyne Holdings Corp. (a) | 668 | | $ 9,993 |
TriMas Corp. (a) | 3,224 | | 64,319 |
Twin Disc, Inc. | 1,506 | | 36,746 |
Westport Innovations, Inc. | 2,762 | | 49,934 |
Wuhan General Group China Ltd. (a) | 1,750 | | 2,223 |
| | 3,811,124 |
Marine - 0.1% |
American Commercial Lines, Inc. (a) | 1,241 | | 40,953 |
DryShips, Inc. (a) | 20,442 | | 105,685 |
Eagle Bulk Shipping, Inc. (a) | 4,473 | | 22,365 |
Euroseas Ltd. | 2,727 | | 10,553 |
FreeSeas, Inc. (a) | 343 | | 1,348 |
Newlead Holdings Ltd. (a) | 85 | | 227 |
OceanFreight, Inc. (a) | 3,560 | | 3,418 |
Seanergy Martime Holdings Corp. (a) | 3,125 | | 3,125 |
Star Bulk Carriers Corp. (d) | 6,130 | | 17,593 |
TBS International Ltd. Class A (a) | 2,262 | | 8,596 |
Ultrapetrol (Bahamas) Ltd. (a) | 1,325 | | 9,156 |
| | 223,019 |
Professional Services - 0.3% |
51job, Inc. sponsored ADR (a) | 868 | | 44,042 |
Acacia Research Corp. - Acacia Technologies (a) | 2,802 | | 76,355 |
Advisory Board Co. (a) | 1,397 | | 66,302 |
Barrett Business Services, Inc. | 849 | | 12,591 |
CoStar Group, Inc. (a)(d) | 1,672 | | 88,181 |
CRA International, Inc. (a) | 945 | | 20,885 |
Exponent, Inc. (a) | 1,070 | | 37,364 |
Heidrick & Struggles International, Inc. | 1,475 | | 30,636 |
Hudson Highland Group, Inc. (a) | 1,554 | | 6,340 |
Huron Consulting Group, Inc. (a) | 1,413 | | 32,089 |
ICF International, Inc. (a) | 1,258 | | 30,117 |
Kelly Services, Inc. Class A (non-vtg.) (a) | 2,586 | | 46,225 |
Kforce, Inc. (a) | 2,704 | | 40,857 |
LECG Corp. (a) | 2,460 | | 2,318 |
Lightbridge Corp. (a)(d) | 2,205 | | 11,378 |
Odyssey Marine Exploration, Inc. (a) | 6,577 | | 13,022 |
On Assignment, Inc. (a) | 2,000 | | 13,740 |
RCM Technologies, Inc. (a) | 426 | | 2,049 |
Resources Connection, Inc. | 4,204 | | 70,333 |
School Specialty, Inc. (a) | 1,586 | | 20,031 |
Common Stocks - continued |
| Shares | | Value |
INDUSTRIALS - continued |
Professional Services - continued |
Verisk Analytics, Inc. (a) | 10,439 | | $ 315,989 |
VSE Corp. | 427 | | 12,968 |
| | 993,812 |
Road & Rail - 0.4% |
AMERCO (a) | 1,394 | | 135,134 |
Arkansas Best Corp. | 1,921 | | 47,324 |
Covenant Transport Group, Inc. Class A (a) | 611 | | 5,194 |
Frozen Food Express Industries, Inc. (a) | 1,931 | | 6,816 |
Heartland Express, Inc. | 6,302 | | 97,366 |
J.B. Hunt Transport Services, Inc. | 8,506 | | 310,469 |
Landstar System, Inc. | 3,580 | | 128,701 |
Marten Transport Ltd. | 2,024 | | 43,516 |
Old Dominion Freight Lines, Inc. (a) | 3,846 | | 111,072 |
P.A.M. Transportation Services, Inc. (a) | 668 | | 7,234 |
Patriot Transportation Holding, Inc. (a) | 214 | | 15,926 |
Quality Distribution, Inc. (a) | 1,569 | | 10,889 |
Saia, Inc. (a) | 1,454 | | 21,912 |
Trailer Bridge, Inc. (a) | 724 | | 2,063 |
Universal Truckload Services, Inc. (a) | 990 | | 14,850 |
USA Truck, Inc. (a) | 1,050 | | 13,913 |
Vitran Corp., Inc. (a) | 938 | | 10,881 |
Werner Enterprises, Inc. | 4,976 | | 107,382 |
YRC Worldwide, Inc. (a)(d) | 3,141 | | 10,962 |
| | 1,101,604 |
Trading Companies & Distributors - 0.3% |
Aceto Corp. | 3,840 | | 28,762 |
Beacon Roofing Supply, Inc. (a) | 3,114 | | 53,530 |
DXP Enterprises, Inc. (a) | 963 | | 20,724 |
Fastenal Co. (d) | 10,589 | | 566,723 |
H&E Equipment Services, Inc. (a) | 2,677 | | 26,636 |
Houston Wire & Cable Co. | 2,312 | | 24,623 |
Kaman Corp. | 1,741 | | 49,044 |
Lawson Products, Inc. | 645 | | 12,971 |
Mitsui & Co. Ltd. sponsored ADR | 45 | | 14,070 |
Rush Enterprises, Inc.: | | | |
Class A (a) | 2,392 | | 42,027 |
Class B (a) | 1,009 | | 17,678 |
Titan Machinery, Inc. (a) | 1,583 | | 33,188 |
| | 889,976 |
Common Stocks - continued |
| Shares | | Value |
INDUSTRIALS - continued |
Transportation Infrastructure - 0.0% |
China Infrastructure Investment Corp. (a) | 4,625 | | $ 2,840 |
Grupo Aeroportuario Norte SAB de CV ADR (a)(d) | 550 | | 8,338 |
| | 11,178 |
TOTAL INDUSTRIALS | | 14,463,636 |
INFORMATION TECHNOLOGY - 51.1% |
Communications Equipment - 7.3% |
Acme Packet, Inc. (a) | 4,540 | | 222,369 |
ADC Telecommunications, Inc. (a) | 6,573 | | 83,609 |
Adtran, Inc. | 4,442 | | 138,324 |
Alvarion Ltd. (a) | 5,431 | | 14,229 |
Anaren, Inc. (a) | 1,716 | | 31,248 |
Arris Group, Inc. (a) | 8,843 | | 88,518 |
Aruba Networks, Inc. (a) | 6,629 | | 140,535 |
AudioCodes Ltd. (a) | 1,741 | | 7,887 |
Aviat Networks, Inc. (a) | 3,862 | | 15,989 |
Bel Fuse, Inc.: | | | |
Class A | 177 | | 4,076 |
Class B (non-vtg.) | 558 | | 12,527 |
BigBand Networks, Inc. (a) | 5,734 | | 17,087 |
Black Box Corp. | 1,579 | | 56,576 |
Blue Coat Systems, Inc. (a) | 3,096 | | 82,354 |
Brocade Communications Systems, Inc. (a) | 32,892 | | 163,802 |
Ceragon Networks Ltd. (a) | 2,384 | | 25,413 |
China GrenTech Corp. Ltd. ADR (a)(d) | 1,452 | | 4,109 |
China TechFaith Wireless Communication Technology Ltd. sponsored ADR (a) | 5,387 | | 21,171 |
Ciena Corp. (a)(d) | 6,750 | | 102,263 |
Cisco Systems, Inc. (a) | 410,263 | | 7,860,639 |
Cogo Group, Inc. (a) | 4,165 | | 31,154 |
Comtech Telecommunications Corp. | 1,949 | | 57,807 |
DG FastChannel, Inc. (a) | 2,008 | | 50,662 |
Dialogic, Inc. (a) | 360 | | 1,854 |
Digi International, Inc. (a) | 3,056 | | 29,338 |
Ditech Networks, Inc. (a) | 1,208 | | 1,740 |
DragonWave, Inc. (a) | 2,480 | | 18,674 |
EchoStar Holding Corp. Class A (a) | 3,192 | | 64,383 |
EMCORE Corp. (a)(d) | 3,730 | | 4,774 |
EMS Technologies, Inc. (a) | 1,352 | | 25,134 |
Endwave Corp. (a) | 412 | | 1,112 |
Common Stocks - continued |
| Shares | | Value |
INFORMATION TECHNOLOGY - continued |
Communications Equipment - continued |
EXFO, Inc. (sub. vtg.) (a) | 2,252 | | $ 14,127 |
Extreme Networks, Inc. (a) | 7,442 | | 21,805 |
F5 Networks, Inc. (a) | 5,759 | | 759,497 |
Finisar Corp. (a) | 5,634 | | 107,722 |
Gilat Satellite Networks Ltd. (a) | 2,826 | | 13,650 |
Globecomm Systems, Inc. (a) | 1,123 | | 9,489 |
Harmonic, Inc. (a) | 6,840 | | 46,238 |
Hughes Communications, Inc. (a) | 1,719 | | 68,072 |
Infinera Corp. (a) | 8,141 | | 66,431 |
InterDigital, Inc. (a) | 3,092 | | 102,252 |
Ituran Location & Control Ltd. | 1,591 | | 24,470 |
Ixia (a) | 5,463 | | 86,643 |
JDS Uniphase Corp. (a) | 16,035 | | 190,335 |
KVH Industries, Inc. (a) | 1,563 | | 20,710 |
Loral Space & Communications Ltd. (a) | 1,577 | | 115,247 |
Meru Networks, Inc. (a) | 1,000 | | 13,870 |
Mitel Networks, Inc. (a) | 3,745 | | 24,492 |
NETGEAR, Inc. (a) | 2,308 | | 73,348 |
Network Engines, Inc. (a) | 2,771 | | 4,267 |
Network Equipment Technologies, Inc. (a) | 1,783 | | 7,239 |
NumereX Corp. Class A (a) | 847 | | 6,912 |
Occam Networks, Inc. (a) | 2,320 | | 17,261 |
Oclaro, Inc. (a) | 3,681 | | 35,706 |
Oplink Communications, Inc. (a) | 1,737 | | 30,033 |
Opnext, Inc. (a) | 6,299 | | 8,630 |
ORBCOMM, Inc. (a) | 2,897 | | 7,648 |
Orckit Communications Ltd. (a)(d) | 1,533 | | 4,108 |
Parkervision, Inc. (a)(d) | 2,588 | | 1,100 |
PC-Tel, Inc. (a) | 1,155 | | 7,253 |
Performance Technologies, Inc. (a) | 470 | | 841 |
Polycom, Inc. (a) | 5,975 | | 221,105 |
Powerwave Technologies, Inc. (a)(d) | 6,700 | | 14,137 |
QUALCOMM, Inc. | 115,217 | | 5,385,243 |
RADWARE Ltd. (a) | 1,428 | | 44,311 |
Research In Motion Ltd. (a) | 37,835 | | 2,340,095 |
Riverbed Technology, Inc. (a) | 10,434 | | 353,817 |
SeaChange International, Inc. (a) | 3,784 | | 30,423 |
ShoreTel, Inc. (a) | 3,356 | | 23,828 |
Sierra Wireless, Inc. (a) | 2,705 | | 29,827 |
Silicom Ltd. (a) | 400 | | 6,484 |
Sonus Networks, Inc. (a) | 19,406 | | 52,008 |
Common Stocks - continued |
| Shares | | Value |
INFORMATION TECHNOLOGY - continued |
Communications Equipment - continued |
Sycamore Networks, Inc. | 2,247 | | $ 67,455 |
Symmetricom, Inc. (a) | 5,203 | | 34,600 |
Tekelec (a) | 4,857 | | 59,984 |
Telefonaktiebolaget LM Ericsson (B Shares) sponsored ADR | 18,411 | | 190,002 |
Telestone Technologies Corp. (a) | 578 | | 6,306 |
Tellabs, Inc. | 27,280 | | 172,137 |
Telular Corp. | 871 | | 4,634 |
Tollgrade Communications, Inc. (a) | 443 | | 3,792 |
UTStarcom, Inc. (a) | 8,980 | | 19,217 |
ViaSat, Inc. (a) | 2,704 | | 111,837 |
Westell Technologies, Inc. Class A (a) | 3,694 | | 10,971 |
ZST Digital Networks, Inc. (a) | 576 | | 4,038 |
| | 20,455,004 |
Computers & Peripherals - 9.2% |
ActivIdentity Corp. (a) | 5,068 | | 16,471 |
Apple, Inc. (a) | 65,614 | | 20,415,750 |
Avid Technology, Inc. (a) | 2,752 | | 42,876 |
Concurrent Computer Corp. (a) | 225 | | 1,076 |
Cray, Inc. (a) | 3,431 | | 24,497 |
Dell, Inc. (a) | 139,761 | | 1,847,640 |
Dot Hill Systems Corp. (a) | 4,517 | | 8,040 |
Electronics for Imaging, Inc. (a) | 4,088 | | 53,512 |
Hutchinson Technology, Inc. (a) | 1,552 | | 4,811 |
iGO, Inc. (a) | 1,162 | | 3,684 |
Immersion Corp. (a) | 1,492 | | 8,370 |
Intevac, Inc. (a) | 2,427 | | 32,279 |
Isilon Systems, Inc. (a) | 4,795 | | 161,831 |
LaserCard Corp. (a) | 492 | | 2,086 |
Logitech International SA (a)(d) | 12,447 | | 240,476 |
NetApp, Inc. (a) | 25,683 | | 1,308,035 |
Novatel Wireless, Inc. (a) | 2,420 | | 23,740 |
Overland Storage, Inc. (a) | 304 | | 389 |
Presstek, Inc. (a) | 2,467 | | 4,564 |
QLogic Corp. (a) | 7,884 | | 141,045 |
Rimage Corp. (a) | 799 | | 12,225 |
SanDisk Corp. (a) | 16,661 | | 743,081 |
Seagate Technology (a) | 34,059 | | 456,731 |
Silicon Graphics International Corp. (a) | 2,701 | | 20,771 |
Smart Technologies, Inc. Class A (a) | 2,900 | | 28,842 |
STEC, Inc. (a)(d) | 3,803 | | 64,632 |
Common Stocks - continued |
| Shares | | Value |
INFORMATION TECHNOLOGY - continued |
Computers & Peripherals - continued |
Stratasys, Inc. (a) | 1,858 | | $ 62,838 |
Super Micro Computer, Inc. (a) | 2,842 | | 29,273 |
Synaptics, Inc. (a) | 2,366 | | 67,431 |
Xyratex Ltd. (a) | 2,115 | | 32,317 |
| | 25,859,313 |
Electronic Equipment & Components - 1.3% |
Agilysys, Inc. (a) | 2,256 | | 11,573 |
Brightpoint, Inc. (a) | 6,256 | | 51,299 |
CalAmp Corp. (a) | 4,043 | | 10,188 |
Cogent, Inc. (a) | 6,548 | | 68,689 |
Cognex Corp. | 2,704 | | 75,604 |
Coherent, Inc. (a) | 1,959 | | 80,926 |
Comverge, Inc. (a)(d) | 2,385 | | 15,908 |
CPI International, Inc. (a) | 1,519 | | 29,393 |
Daktronics, Inc. | 3,527 | | 47,544 |
DDi Corp. | 1,501 | | 15,745 |
Digital Ally, Inc. (a) | 1,439 | | 2,245 |
DTS, Inc. (a) | 1,270 | | 59,614 |
Echelon Corp. (a) | 3,399 | | 32,392 |
Electro Rent Corp. | 1,443 | | 21,385 |
Electro Scientific Industries, Inc. (a) | 2,429 | | 36,289 |
FARO Technologies, Inc. (a) | 1,390 | | 36,098 |
Flextronics International Ltd. (a) | 56,990 | | 413,178 |
FLIR Systems, Inc. (a) | 11,154 | | 298,983 |
Frequency Electronics, Inc. (a) | 801 | | 4,950 |
Funtalk China Holdings Ltd. (a) | 3,228 | | 19,594 |
GTSI Corp. (a) | 429 | | 2,059 |
HLS Systems International Ltd. (a)(d) | 3,677 | | 50,044 |
I. D. Systems Inc. (a) | 623 | | 1,657 |
Identive Group, Inc. (a) | 1,068 | | 2,520 |
Insight Enterprises, Inc. (a) | 3,642 | | 45,926 |
IPG Photonics Corp. (a) | 3,185 | | 91,282 |
Itron, Inc. (a) | 2,989 | | 169,686 |
LeCroy Corp. (a) | 1,187 | | 11,027 |
Littelfuse, Inc. | 1,594 | | 73,754 |
LoJack Corp. (a) | 1,208 | | 5,955 |
Magal Security Systems Ltd. (a)(d) | 1,252 | | 3,869 |
Maxwell Technologies, Inc. (a) | 1,992 | | 32,211 |
Measurement Specialties, Inc. (a) | 1,117 | | 28,573 |
Mercury Computer Systems, Inc. (a) | 1,684 | | 29,992 |
Common Stocks - continued |
| Shares | | Value |
INFORMATION TECHNOLOGY - continued |
Electronic Equipment & Components - continued |
Microvision, Inc. (a)(d) | 9,861 | | $ 13,904 |
Molex, Inc. (d) | 6,896 | | 143,437 |
Molex, Inc. Class A (non-vtg.) | 5,800 | | 101,036 |
MTS Systems Corp. | 1,440 | | 55,181 |
Multi-Fineline Electronix, Inc. (a) | 2,064 | | 48,091 |
National Instruments Corp. | 5,822 | | 198,647 |
NetList, Inc. (a) | 1,689 | | 3,902 |
Newport Corp. (a) | 3,672 | | 53,354 |
NU Horizons Electronics Corp. (a) | 1,635 | | 11,380 |
Orbotech Ltd. (a) | 3,303 | | 36,399 |
OSI Systems, Inc. (a) | 1,358 | | 47,353 |
PC Connection, Inc. (a) | 2,121 | | 19,131 |
PC Mall, Inc. (a) | 1,949 | | 13,701 |
Perceptron, Inc. (a) | 784 | | 4,030 |
Planar Systems, Inc. (a) | 480 | | 1,032 |
Plexus Corp. (a) | 2,819 | | 76,494 |
Power-One, Inc. (a)(d) | 6,230 | | 58,874 |
RadiSys Corp. (a) | 1,638 | | 14,791 |
Research Frontiers, Inc. (a)(d) | 596 | | 3,028 |
Richardson Electronics Ltd. | 989 | | 10,592 |
Rofin-Sinar Technologies, Inc. (a) | 2,056 | | 59,028 |
Sanmina-SCI Corp. (a) | 5,470 | | 57,162 |
ScanSource, Inc. (a) | 1,823 | | 53,177 |
SMART Modular Technologies (WWH), Inc. (a) | 4,840 | | 27,104 |
Spectrum Control, Inc. (a) | 541 | | 8,261 |
Tech Data Corp. (a) | 3,590 | | 158,211 |
Tessco Technologies, Inc. | 550 | | 8,366 |
Trimble Navigation Ltd. (a) | 8,634 | | 321,530 |
TTM Technologies, Inc. (a) | 5,550 | | 73,565 |
Universal Display Corp. (a) | 2,578 | | 63,831 |
Viasystems Group, Inc. (a) | 1,193 | | 20,699 |
X-Rite, Inc. (a)(d) | 7,258 | | 30,556 |
Zygo Corp. (a) | 1,222 | | 14,004 |
| | 3,690,003 |
Internet Software & Services - 7.6% |
Akamai Technologies, Inc. (a) | 13,000 | | 678,470 |
Ancestry.com, Inc. | 2,818 | | 80,538 |
Archipelago Learning, Inc. | 1,789 | | 15,439 |
Art Technology Group, Inc. (a) | 10,871 | | 64,900 |
Autobytel, Inc. (a) | 3,159 | | 2,369 |
Common Stocks - continued |
| Shares | | Value |
INFORMATION TECHNOLOGY - continued |
Internet Software & Services - continued |
Baidu.com, Inc. sponsored ADR (a) | 19,107 | | $ 2,009,865 |
China Finance Online Co. Ltd. ADR (a) | 2,033 | | 15,329 |
ChinaCache International Holdings Ltd. sponsored ADR | 450 | | 12,465 |
comScore, Inc. (a) | 2,205 | | 48,510 |
Constant Contact, Inc. (a)(d) | 2,338 | | 59,829 |
CryptoLogic Ltd. | 2,831 | | 3,397 |
DealerTrack Holdings, Inc. (a) | 2,806 | | 53,595 |
Digital River, Inc. (a) | 2,765 | | 101,807 |
EarthLink, Inc. | 4,974 | | 44,592 |
EasyLink Services International Corp. (a) | 4,384 | | 19,114 |
eBay, Inc. (a) | 94,272 | | 2,746,143 |
Enternet Gold Golden Lines Ltd. (a) | 1,727 | | 47,579 |
Equinix, Inc. (a) | 3,363 | | 260,969 |
GigaMedia Ltd. (a) | 5,039 | | 7,055 |
Google, Inc. Class A (a) | 17,707 | | 9,839,957 |
GSI Commerce, Inc. (a) | 4,454 | | 106,228 |
HSW International, Inc. (a) | 212 | | 856 |
IAC/InterActiveCorp (a) | 6,745 | | 189,939 |
InfoSpace, Inc. (a) | 3,092 | | 23,870 |
Internap Network Services Corp. (a) | 4,621 | | 24,168 |
Internet Brands, Inc. Class A (a) | 3,000 | | 39,990 |
Internet Capital Group, Inc. (a) | 3,962 | | 49,089 |
Internet Initiative Japan, Inc. sponsored ADR | 728 | | 4,164 |
iPass, Inc. | 2,745 | | 3,267 |
j2 Global Communications, Inc. (a) | 3,673 | | 98,363 |
Keynote Systems, Inc. | 1,025 | | 12,546 |
KIT Digital, Inc. (a) | 1,597 | | 21,991 |
Ku6 Media Co. Ltd. sponsored ADR (a) | 2,051 | | 11,260 |
Limelight Networks, Inc. (a) | 5,569 | | 39,540 |
Liquidity Services, Inc. (a) | 2,232 | | 34,529 |
LivePerson, Inc. (a) | 4,012 | | 38,756 |
Local.com Corp. (a) | 545 | | 2,076 |
LogMeIn, Inc. (a) | 1,658 | | 72,604 |
LoopNet, Inc. (a) | 2,688 | | 28,654 |
Marchex, Inc. Class B | 1,598 | | 11,538 |
Market Leader, Inc. (a) | 3,144 | | 5,942 |
MediaMind Technologies, Inc. (a) | 1,350 | | 17,712 |
Mercadolibre, Inc. (a) | 3,226 | | 205,238 |
ModusLink Global Solutions, Inc. (a) | 3,600 | | 24,120 |
Move, Inc. (a) | 10,906 | | 27,592 |
NaviSite, Inc. (a) | 3,222 | | 11,406 |
Common Stocks - continued |
| Shares | | Value |
INFORMATION TECHNOLOGY - continued |
Internet Software & Services - continued |
NetEase.com, Inc. sponsored ADR (a) | 5,266 | | $ 201,056 |
NIC, Inc. | 5,174 | | 43,203 |
Open Text Corp. (a) | 3,982 | | 168,729 |
OpenTable, Inc. (a) | 1,680 | | 121,867 |
Openwave Systems, Inc. (a) | 4,488 | | 10,726 |
Perficient, Inc. (a) | 2,900 | | 32,712 |
QuinStreet, Inc. (d) | 3,085 | | 61,700 |
RADVision Ltd. (a) | 1,551 | | 12,113 |
RealNetworks, Inc. (a) | 10,884 | | 37,223 |
Rediff.com India Ltd. sponsored ADR (a) | 371 | | 1,135 |
RightNow Technologies, Inc. (a) | 2,428 | | 61,501 |
Saba Software, Inc. (a) | 1,898 | | 11,445 |
SAVVIS, Inc. (a) | 3,819 | | 95,971 |
SciQuest, Inc. | 1,500 | | 20,115 |
Selectica, Inc. (a) | 245 | | 1,220 |
Sify Technologies Ltd. sponsored ADR (a)(d) | 7,477 | | 13,384 |
Sina Corp. (a) | 4,341 | | 277,911 |
Sohu.com, Inc. (a) | 2,711 | | 188,225 |
SPS Commerce, Inc. (a) | 1,000 | | 11,860 |
Stamps.com, Inc. | 989 | | 13,015 |
Subaye, Inc. (a) | 400 | | 2,852 |
Support.com, Inc. (a) | 2,282 | | 14,765 |
TechTarget, Inc. (a) | 3,566 | | 21,218 |
Terremark Worldwide, Inc. (a) | 4,592 | | 54,943 |
The Knot, Inc. (a) | 2,918 | | 27,283 |
TheStreet.com, Inc. | 1,783 | | 4,778 |
Travelzoo, Inc. (a) | 1,418 | | 60,960 |
United Online, Inc. | 6,293 | | 40,055 |
ValueClick, Inc. (a) | 5,743 | | 89,246 |
VeriSign, Inc. (a) | 12,609 | | 432,615 |
VistaPrint Ltd. (a)(d) | 3,115 | | 125,597 |
Vocus, Inc. (a) | 1,536 | | 37,601 |
Web.com, Inc. (a) | 1,607 | | 13,001 |
WebMD Health Corp. (a) | 4,223 | | 216,809 |
WebMediaBrands, Inc. (a) | 1,459 | | 1,196 |
Yahoo!, Inc. (a) | 96,982 | | 1,529,406 |
Zix Corp. (a) | 3,758 | | 14,431 |
| | 21,289,227 |
IT Services - 2.1% |
Acorn Energy, Inc. (a) | 1,217 | | 4,856 |
Common Stocks - continued |
| Shares | | Value |
INFORMATION TECHNOLOGY - continued |
IT Services - continued |
Acxiom Corp. (a) | 5,551 | | $ 94,423 |
Automatic Data Processing, Inc. | 35,314 | | 1,573,945 |
Cass Information Systems, Inc. | 612 | | 21,640 |
China Information Technology, Inc. (a)(d) | 3,300 | | 17,424 |
Cognizant Technology Solutions Corp. Class A (a) | 21,283 | | 1,382,969 |
Computer Task Group, Inc. (a) | 1,224 | | 12,056 |
CSG Systems International, Inc. (a) | 2,408 | | 45,319 |
Dynamics Research Corp. (a) | 900 | | 12,231 |
Echo Global Logistics, Inc. (a) | 1,450 | | 16,603 |
Edgewater Technology, Inc. (a) | 1,090 | | 3,139 |
eLoyalty Corp. (a) | 438 | | 2,790 |
Euronet Worldwide, Inc. (a) | 3,381 | | 55,313 |
ExlService Holdings, Inc. (a) | 2,333 | | 48,223 |
Fiserv, Inc. (a) | 10,775 | | 595,858 |
Forrester Research, Inc. | 2,033 | | 70,443 |
Hackett Group, Inc. (a) | 1,964 | | 6,913 |
iGate Corp. | 4,208 | | 84,160 |
Information Services Group, Inc. (a) | 2,794 | | 6,175 |
Infosys Technologies Ltd. sponsored ADR | 7,656 | | 506,444 |
Innodata Isogen, Inc. (a) | 1,720 | | 5,057 |
Integral Systems, Inc. (a) | 2,535 | | 23,119 |
Lionbridge Technologies, Inc. (a) | 3,727 | | 12,150 |
ManTech International Corp. Class A (a) | 1,595 | | 63,672 |
NCI, Inc. Class A (a) | 1,074 | | 23,596 |
Ness Technologies, Inc. (a) | 2,946 | | 13,286 |
Newtek Business Services, Inc. | 1,293 | | 1,771 |
Online Resources Corp. (a) | 2,603 | | 11,271 |
Paychex, Inc. | 25,973 | | 741,269 |
PFSweb, Inc. (a) | 257 | | 1,005 |
PRG-Schultz International, Inc. (a) | 1,378 | | 8,006 |
Rainmaker Systems, Inc. (a) | 1,909 | | 2,501 |
Sapient Corp. | 9,219 | | 109,983 |
Syntel, Inc. | 2,849 | | 136,011 |
TechTeam Global, Inc. (a) | 575 | | 4,790 |
Teletech Holdings, Inc. (a) | 4,340 | | 82,286 |
Telvent GIT SA (a) | 2,411 | | 57,526 |
Tier Technologies, Inc. Class B (a) | 3,261 | | 15,979 |
Virtusa Corp. (a) | 2,940 | | 40,102 |
Yucheng Technologies Ltd. (a) | 1,788 | | 5,811 |
| | 5,920,115 |
Common Stocks - continued |
| Shares | | Value |
INFORMATION TECHNOLOGY - continued |
Office Electronics - 0.1% |
Zebra Technologies Corp. Class A (a) | 3,654 | | $ 133,152 |
Semiconductors & Semiconductor Equipment - 9.0% |
Actions Semiconductor Co. Ltd. ADR (a) | 8,012 | | 17,066 |
Advanced Analogic Technologies, Inc. (a) | 6,334 | | 23,182 |
Advanced Energy Industries, Inc. (a) | 3,107 | | 36,290 |
Aixtron AG sponsored ADR (d) | 769 | | 23,578 |
Alpha & Omega Semiconductor Ltd. (a) | 1,448 | | 17,028 |
Altera Corp. | 21,193 | | 743,662 |
Amkor Technology, Inc. (a)(d) | 13,060 | | 90,898 |
Amtech Systems, Inc. (a) | 413 | | 8,549 |
ANADIGICS, Inc. (a) | 5,180 | | 33,256 |
Applied Materials, Inc. | 96,656 | | 1,201,434 |
Applied Micro Circuits Corp. (a) | 5,170 | | 47,978 |
ARM Holdings PLC sponsored ADR | 5,585 | | 104,719 |
ASM International NV unit (a) | 681 | | 16,868 |
ASML Holding NV | 7,815 | | 255,003 |
Atheros Communications, Inc. (a) | 5,012 | | 163,191 |
Atmel Corp. (a) | 33,897 | | 352,190 |
ATMI, Inc. (a) | 2,419 | | 43,421 |
AuthenTec, Inc. (a) | 1,524 | | 3,277 |
Avago Technologies Ltd. | 17,018 | | 444,340 |
Axcelis Technologies, Inc. (a) | 5,873 | | 14,565 |
AXT, Inc. (a) | 3,766 | | 31,070 |
Broadcom Corp. Class A | 32,176 | | 1,431,510 |
Brooks Automation, Inc. (a) | 5,277 | | 38,258 |
BTU International, Inc. (a) | 402 | | 2,714 |
Cabot Microelectronics Corp. (a) | 1,573 | | 62,086 |
Camtek Ltd. (a) | 1,772 | | 4,465 |
Canadian Solar, Inc. (a) | 3,257 | | 42,406 |
Cascade Microtech, Inc. (a) | 599 | | 2,528 |
Cavium Networks, Inc. (a) | 3,193 | | 117,486 |
Ceva, Inc. (a) | 2,018 | | 46,818 |
China Sunergy Co. Ltd. ADR (a)(d) | 1,739 | | 7,582 |
ChipMOS TECHNOLOGIES (Bermuda) Ltd. (a) | 2,935 | | 4,138 |
Cirrus Logic, Inc. (a)(d) | 5,016 | | 76,594 |
Cohu, Inc. | 2,855 | | 41,340 |
Conexant Systems, Inc. (a) | 5,664 | | 7,703 |
Cree, Inc. (a) | 7,666 | | 499,670 |
Cymer, Inc. (a) | 1,837 | | 69,935 |
Cypress Semiconductor Corp. (a) | 11,788 | | 184,718 |
Diodes, Inc. (a) | 3,379 | | 83,461 |
Common Stocks - continued |
| Shares | | Value |
INFORMATION TECHNOLOGY - continued |
Semiconductors & Semiconductor Equipment - continued |
DSP Group, Inc. (a) | 2,504 | | $ 19,156 |
Energy Conversion Devices, Inc. (a) | 2,972 | | 13,344 |
Entegris, Inc. (a) | 10,671 | | 69,362 |
Entropic Communications, Inc. (a) | 5,377 | | 48,070 |
Evergreen Solar, Inc. (a)(d) | 15,459 | | 12,027 |
Exar Corp. (a) | 4,400 | | 29,480 |
Ezchip Semiconductor Ltd. (a) | 2,049 | | 49,893 |
FEI Co. (a) | 2,571 | | 61,190 |
First Solar, Inc. (a)(d) | 6,145 | | 754,913 |
FormFactor, Inc. (a) | 3,771 | | 34,995 |
FSI International, Inc. (a) | 4,179 | | 14,752 |
GSI Technology, Inc. (a) | 2,209 | | 16,347 |
GT Solar International, Inc. (a) | 10,441 | | 69,850 |
Himax Technologies, Inc. sponsored ADR | 6,926 | | 14,406 |
Hittite Microwave Corp. (a) | 2,011 | | 115,110 |
Ikanos Communications, Inc. (a) | 2,406 | | 2,647 |
Integrated Device Technology, Inc. (a) | 11,149 | | 71,688 |
Integrated Silicon Solution, Inc. (a) | 2,319 | | 18,529 |
Intel Corp. | 399,950 | | 8,446,944 |
Intersil Corp. Class A | 9,498 | | 121,100 |
IXYS Corp. (a) | 3,057 | | 34,208 |
JA Solar Holdings Co. Ltd. ADR (a) | 9,508 | | 65,890 |
KLA-Tencor Corp. | 12,099 | | 443,670 |
Kopin Corp. (a) | 6,157 | | 24,751 |
Kulicke & Soffa Industries, Inc. (a) | 4,659 | | 30,889 |
Lam Research Corp. (a) | 8,787 | | 398,315 |
Lattice Semiconductor Corp. (a) | 9,567 | | 42,573 |
Linear Technology Corp. | 15,429 | | 502,985 |
LTX-Credence Corp. (a) | 3,814 | | 30,054 |
Marvell Technology Group Ltd. (a) | 45,546 | | 878,582 |
Mattson Technology, Inc. (a) | 3,129 | | 8,667 |
Maxim Integrated Products, Inc. | 20,904 | | 486,018 |
Mellanox Technologies Ltd. (a) | 2,648 | | 63,102 |
MEMSIC, Inc. (a) | 1,025 | | 3,106 |
Micrel, Inc. | 5,407 | | 66,939 |
Microchip Technology, Inc. | 12,501 | | 420,159 |
Micron Technology, Inc. (a) | 68,811 | | 499,568 |
Microsemi Corp. (a) | 5,831 | | 129,098 |
Microtune, Inc. (a) | 3,311 | | 9,668 |
Mindspeed Technologies, Inc. (a) | 2,073 | | 12,915 |
MIPS Technologies, Inc. (a) | 3,591 | | 48,802 |
Common Stocks - continued |
| Shares | | Value |
INFORMATION TECHNOLOGY - continued |
Semiconductors & Semiconductor Equipment - continued |
MKS Instruments, Inc. (a) | 3,418 | | $ 69,625 |
Monolithic Power Systems, Inc. (a) | 2,525 | | 40,728 |
MoSys, Inc. (a) | 2,523 | | 10,294 |
Nanometrics, Inc. (a) | 1,596 | | 18,913 |
Netlogic Microsystems, Inc. (a) | 4,834 | | 150,821 |
Nova Measuring Instruments Ltd. (a) | 2,306 | | 15,335 |
Novellus Systems, Inc. (a) | 6,378 | | 192,297 |
NVE Corp. (a) | 362 | | 18,458 |
NVIDIA Corp. (a) | 41,231 | | 560,742 |
NXP Semiconductors NV (d) | 18,400 | | 231,472 |
O2Micro International Ltd. sponsored ADR (a) | 3,450 | | 21,390 |
Omnivision Technologies, Inc. (a) | 3,679 | | 104,079 |
ON Semiconductor Corp. (a) | 30,325 | | 247,300 |
PDF Solutions, Inc. (a) | 3,905 | | 15,581 |
Pericom Semiconductor Corp. (a) | 3,349 | | 33,457 |
Photronics, Inc. (a) | 4,964 | | 31,720 |
Pixelworks, Inc. (a) | 616 | | 2,174 |
PLX Technology, Inc. (a) | 3,185 | | 10,702 |
PMC-Sierra, Inc. (a) | 16,808 | | 121,858 |
Power Integrations, Inc. | 1,872 | | 75,423 |
QuickLogic Corp. (a) | 4,310 | | 25,774 |
Rambus, Inc. (a) | 8,310 | | 166,283 |
Ramtron International Corp. (a) | 3,073 | | 11,186 |
RDA Microelectronics, Inc. sponsored ADR (d) | 650 | | 10,413 |
RF Micro Devices, Inc. (a) | 19,464 | | 136,443 |
Rubicon Technology, Inc. (a)(d) | 1,899 | | 41,664 |
Rudolph Technologies, Inc. (a) | 1,643 | | 12,257 |
Semtech Corp. (a) | 3,850 | | 90,052 |
Sigma Designs, Inc. (a) | 2,077 | | 24,924 |
Silicon Image, Inc. (a) | 7,238 | | 55,515 |
Silicon Laboratories, Inc. (a) | 3,117 | | 132,410 |
Silicon Motion Technology Corp. sponsored ADR (a) | 1,507 | | 6,058 |
Siliconware Precision Industries Co. Ltd. sponsored ADR | 10,286 | | 52,870 |
Skyworks Solutions, Inc. (a) | 12,694 | | 323,062 |
Solarfun Power Holdings Co. Ltd. ADR (a) | 2,999 | | 24,922 |
Spreadtrum Communications, Inc. ADR (a)(d) | 2,695 | | 44,063 |
Standard Microsystems Corp. (a) | 1,492 | | 40,657 |
SunPower Corp.: | | | |
Class A (a) | 4,237 | | 49,403 |
Class B (a) | 3,505 | | 40,220 |
Supertex, Inc. (a) | 1,164 | | 29,112 |
Common Stocks - continued |
| Shares | | Value |
INFORMATION TECHNOLOGY - continued |
Semiconductors & Semiconductor Equipment - continued |
Tessera Technologies, Inc. (a) | 3,447 | | $ 68,630 |
Tower Semiconductor Ltd. (a)(d) | 15,694 | | 21,815 |
TranSwitch Corp. (a) | 492 | | 1,004 |
Trident Microsystems, Inc. (a) | 11,118 | | 20,568 |
TriQuint Semiconductor, Inc. (a) | 10,881 | | 129,593 |
Ultra Clean Holdings, Inc. (a) | 2,382 | | 18,675 |
Ultratech, Inc. (a) | 1,790 | | 32,882 |
Varian Semiconductor Equipment Associates, Inc. (a) | 5,318 | | 167,677 |
Veeco Instruments, Inc. (a) | 2,926 | | 128,685 |
Verigy Ltd. (a) | 4,358 | | 37,304 |
Vimicro International Corp. sponsored ADR (a) | 1,066 | | 3,379 |
Volterra Semiconductor Corp. (a) | 2,419 | | 54,476 |
Xilinx, Inc. | 18,201 | | 493,611 |
Zoran Corp. (a) | 3,961 | | 27,252 |
| | 25,073,947 |
Software - 14.5% |
ACI Worldwide, Inc. (a) | 2,700 | | 68,553 |
Activision Blizzard, Inc. | 87,864 | | 1,031,523 |
Actuate Corp. (a) | 3,000 | | 16,920 |
Adobe Systems, Inc. (a) | 37,712 | | 1,045,754 |
Advent Software, Inc. (a) | 1,976 | | 101,922 |
Allot Communications Ltd. (a) | 1,427 | | 11,973 |
American Software, Inc. Class A | 2,162 | | 14,507 |
ANSYS, Inc. (a) | 6,659 | | 322,962 |
Ariba, Inc. (a) | 6,667 | | 134,907 |
AsiaInfo Holdings, Inc. (a) | 5,436 | | 90,509 |
Aspen Technology, Inc. (a) | 6,749 | | 84,363 |
Authentidate Holding Corp. (a) | 9,462 | | 5,961 |
Autodesk, Inc. (a) | 16,311 | | 575,615 |
Blackbaud, Inc. | 3,062 | | 77,499 |
Blackboard, Inc. (a)(d) | 2,331 | | 96,853 |
BluePhoenix Solutions Ltd. (a) | 1,138 | | 2,083 |
BMC Software, Inc. (a) | 12,501 | | 555,044 |
Bottomline Technologies, Inc. (a) | 2,171 | | 41,097 |
BroadSoft, Inc. (a) | 2,000 | | 45,460 |
CA, Inc. | 37,015 | | 847,273 |
Cadence Design Systems, Inc. (a) | 19,909 | | 156,485 |
Callidus Software, Inc. (a) | 2,708 | | 13,053 |
CDC Corp. Class A (a) | 2,515 | | 9,733 |
Changyou.com Ltd. (A Shares) ADR (a) | 656 | | 19,293 |
Common Stocks - continued |
| Shares | | Value |
INFORMATION TECHNOLOGY - continued |
Software - continued |
Check Point Software Technologies Ltd. (a) | 14,805 | | $ 634,690 |
China TransInfo Technlgy Corp. (a) | 1,285 | | 6,785 |
Cinedigm Digital Cinema Corp. (a) | 987 | | 1,382 |
Citrix Systems, Inc. (a) | 13,392 | | 889,497 |
ClickSoftware Technologies Ltd. (a) | 3,155 | | 20,508 |
CommVault Systems, Inc. (a) | 3,103 | | 90,390 |
Compuware Corp. (a) | 15,623 | | 160,917 |
Concur Technologies, Inc. (a) | 3,557 | | 182,154 |
Convio, Inc. (a) | 1,400 | | 10,234 |
Deltek, Inc. (a) | 5,101 | | 36,421 |
DemandTec, Inc. (a) | 3,464 | | 35,852 |
Descartes Systems Group, Inc. (a) | 2,850 | | 19,433 |
Digimarc Corp. (a) | 456 | | 12,814 |
ebix.com, Inc. (a) | 2,379 | | 49,364 |
Electronic Arts, Inc. (a) | 22,632 | | 337,443 |
Epicor Software Corp. (a) | 4,405 | | 41,231 |
EPIQ Systems, Inc. | 2,750 | | 35,035 |
ePlus, Inc. (a) | 213 | | 4,942 |
Evolving Systems, Inc. | 2,956 | | 23,352 |
FalconStor Software, Inc. (a) | 4,107 | | 10,925 |
Fortinet, Inc. | 4,851 | | 154,601 |
Fundtech Ltd. (a) | 1,244 | | 19,568 |
Glu Mobile, Inc. (a) | 2,413 | | 5,333 |
Gravity Co. Ltd. sponsored ADR (a) | 917 | | 1,550 |
Guidance Software, Inc. (a) | 905 | | 5,548 |
Informatica Corp. (a) | 6,657 | | 274,801 |
Interactive Intelligence, Inc. (a) | 1,472 | | 39,803 |
Intuit, Inc. (a) | 22,517 | | 1,010,788 |
Jack Henry & Associates, Inc. | 5,180 | | 141,621 |
JDA Software Group, Inc. (a) | 2,777 | | 73,327 |
Kenexa Corp. (a) | 1,647 | | 30,157 |
KongZhong Corp. sponsored ADR (a) | 1,876 | | 13,639 |
Lawson Software, Inc. (a) | 11,584 | | 99,507 |
Magic Software Enterprises Ltd. | 1,246 | | 8,087 |
Magma Design Automation, Inc. (a) | 4,785 | | 19,810 |
Majesco Entertainment Co. (a) | 700 | | 509 |
Manhattan Associates, Inc. (a) | 1,878 | | 58,387 |
Mentor Graphics Corp. (a) | 7,511 | | 84,461 |
MICROS Systems, Inc. (a) | 5,767 | | 252,133 |
Microsoft Corp. | 621,490 | | 15,667,763 |
MicroStrategy, Inc. Class A (a) | 603 | | 52,190 |
Common Stocks - continued |
| Shares | | Value |
INFORMATION TECHNOLOGY - continued |
Software - continued |
Monotype Imaging Holdings, Inc. (a) | 2,633 | | $ 29,490 |
Motricity, Inc. (a)(d) | 3,200 | | 95,168 |
Net 1 UEPS Technologies, Inc. (a) | 3,713 | | 45,113 |
NetScout Systems, Inc. (a) | 3,540 | | 78,199 |
Nice Systems Ltd. sponsored ADR (a)(d) | 2,383 | | 73,015 |
Novell, Inc. (a) | 25,131 | | 149,781 |
Nuance Communications, Inc. (a) | 21,390 | | 378,068 |
Opnet Technologies, Inc. | 1,706 | | 41,490 |
Oracle Corp. | 361,111 | | 9,764,441 |
Parametric Technology Corp. (a) | 8,097 | | 173,438 |
Pegasystems, Inc. | 2,704 | | 83,689 |
Perfect World Co. Ltd. sponsored ADR Class B (a) | 3,032 | | 71,858 |
Pervasive Software, Inc. (a) | 1,282 | | 6,731 |
Progress Software Corp. (a) | 3,239 | | 124,928 |
QAD, Inc. | 4,728 | | 22,269 |
QLIK Technologies, Inc. | 5,556 | | 130,955 |
Quest Software, Inc. (a) | 6,496 | | 164,349 |
Radiant Systems, Inc. (a) | 2,762 | | 49,854 |
RealPage, Inc. | 5,100 | | 139,740 |
Renaissance Learning, Inc. | 1,806 | | 21,257 |
Retalix Ltd. (a) | 909 | | 11,817 |
Rovi Corp. (a) | 7,480 | | 412,672 |
S1 Corp. (a) | 3,933 | | 24,935 |
Shanda Games Ltd. sponsored ADR (a) | 5,533 | | 30,985 |
Shanda Interactive Entertainment Ltd. sponsored ADR (a)(d) | 2,181 | | 86,215 |
Smith Micro Software, Inc. (a) | 2,943 | | 43,968 |
Sonic Foundry, Inc. (a) | 478 | | 6,812 |
Sonic Solutions, Inc. (a) | 2,595 | | 25,898 |
Sourcefire, Inc. (a) | 2,245 | | 60,907 |
SRS Labs, Inc. (a) | 2,684 | | 22,868 |
SS&C Technologies Holdings, Inc. (a) | 5,118 | | 99,340 |
SuccessFactors, Inc. (a) | 5,280 | | 159,298 |
Symantec Corp. (a) | 56,799 | | 954,223 |
Synchronoss Technologies, Inc. (a) | 2,767 | | 71,914 |
Synopsys, Inc. (a) | 10,384 | | 266,765 |
Take-Two Interactive Software, Inc. (a)(d) | 6,232 | | 68,957 |
Taleo Corp. Class A (a) | 2,864 | | 87,925 |
TeleCommunication Systems, Inc. Class A (a) | 2,954 | | 13,766 |
TeleNav, Inc. | 3,300 | | 21,516 |
The9 Ltd. sponsored ADR (a)(d) | 1,168 | | 7,475 |
THQ, Inc. (a) | 5,677 | | 28,953 |
Common Stocks - continued |
| Shares | | Value |
INFORMATION TECHNOLOGY - continued |
Software - continued |
TIBCO Software, Inc. (a) | 12,051 | | $ 236,682 |
TigerLogic Corp. (a)(d) | 1,200 | | 5,532 |
TiVo, Inc. (a) | 6,973 | | 57,318 |
Trintech Group PLC sponsored ADR (a) | 659 | | 4,277 |
Ultimate Software Group, Inc. (a) | 1,725 | | 75,676 |
Vasco Data Security International, Inc. (a) | 3,544 | | 30,620 |
Verint Systems, Inc. (a) | 2,200 | | 72,380 |
Versant Corp. (a) | 349 | | 4,139 |
Voltaire Ltd. (a) | 1,910 | | 16,522 |
Wave Systems Corp. Class A (a) | 5,662 | | 14,948 |
Websense, Inc. (a) | 3,100 | | 64,263 |
| | 40,719,693 |
TOTAL INFORMATION TECHNOLOGY | | 143,140,454 |
MATERIALS - 1.2% |
Chemicals - 0.4% |
A. Schulman, Inc. | 2,108 | | 42,687 |
ADA-ES, Inc. (a) | 172 | | 820 |
Altair Nanotechnologies, Inc. (a)(d) | 3,677 | | 8,567 |
American Pacific Corp. (a) | 617 | | 3,782 |
Ampal-American Israel Corp. Class A (a) | 2,681 | | 5,282 |
Balchem Corp. | 1,821 | | 56,378 |
Cereplast, Inc. (a) | 820 | | 2,870 |
China Agritech, Inc. (a)(d) | 1,300 | | 14,950 |
Fuwei Films Holdings Co. Ltd. (a) | 926 | | 2,306 |
Hawkins, Inc. | 1,094 | | 47,622 |
Innophos Holdings, Inc. | 1,494 | | 50,886 |
Innospec, Inc. (a) | 2,262 | | 48,520 |
KMG Chemicals, Inc. | 572 | | 8,180 |
Landec Corp. (a) | 4,366 | | 27,331 |
Material Sciences Corp. (a) | 1,000 | | 4,930 |
Methanex Corp. | 6,543 | | 191,714 |
Nanophase Technologies Corp. (a) | 626 | | 670 |
Penford Corp. (a) | 697 | | 4,161 |
Senomyx, Inc. (a) | 1,884 | | 10,626 |
ShengdaTech, Inc. (a)(d) | 5,173 | | 30,986 |
Sigma Aldrich Corp. | 8,601 | | 543,755 |
TPC Group, Inc. (a) | 1,300 | | 36,296 |
Common Stocks - continued |
| Shares | | Value |
MATERIALS - continued |
Chemicals - continued |
Yongye International, Inc. (a)(d) | 3,018 | | $ 23,601 |
Zoltek Companies, Inc. (a) | 3,335 | | 30,315 |
| | 1,197,235 |
Construction Materials - 0.0% |
China Advanced Construction Materials Group, Inc. (a) | 3,904 | | 15,382 |
United States Lime & Minerals, Inc. (a) | 477 | | 19,557 |
| | 34,939 |
Containers & Packaging - 0.1% |
AEP Industries, Inc. (a) | 553 | | 13,300 |
Silgan Holdings, Inc. | 5,395 | | 184,725 |
| | 198,025 |
Metals & Mining - 0.7% |
Century Aluminum Co. (a) | 6,799 | | 94,132 |
China Gerui Adv Mat Group Ltd. (a)(d) | 2,700 | | 15,093 |
China Natural Resources, Inc. (a)(d) | 1,155 | | 18,145 |
China Precision Steel, Inc. (a)(d) | 3,260 | | 4,955 |
DRDGOLD Ltd. sponsored ADR (d) | 3,237 | | 15,343 |
Globe Specialty Metals, Inc. | 5,451 | | 88,361 |
Gulf Resources, Inc. (a)(d) | 3,255 | | 33,168 |
Haynes International, Inc. | 1,001 | | 38,709 |
Horsehead Holding Corp. (a) | 2,890 | | 33,611 |
Kaiser Aluminum Corp. | 1,568 | | 73,539 |
Olympic Steel, Inc. | 1,095 | | 23,039 |
Pan American Silver Corp. | 7,773 | | 291,099 |
Qiao Xing Universal Telephone, Inc. (a)(d) | 4,546 | | 8,046 |
Randgold Resources Ltd. sponsored ADR (d) | 4,367 | | 410,760 |
Royal Gold, Inc. | 3,734 | | 192,376 |
Schnitzer Steel Industries, Inc. Class A | 1,521 | | 86,834 |
Silver Standard Resources, Inc. (a) | 5,767 | | 150,288 |
SinoCoking Coal and Coke Chemical Industries, Inc. (a)(d) | 1,300 | | 10,738 |
Steel Dynamics, Inc. | 15,636 | | 249,238 |
Sutor Technology Group Ltd. (a) | 5,943 | | 10,757 |
Universal Stainless & Alloy Products, Inc. (a) | 691 | | 21,608 |
US Energy Corp. (a) | 3,179 | | 15,641 |
| | 1,885,480 |
Common Stocks - continued |
| Shares | | Value |
MATERIALS - continued |
Paper & Forest Products - 0.0% |
Mercer International, Inc. (SBI) (a) | 2,806 | | $ 19,361 |
Pope Resources, Inc. LP | 213 | | 7,242 |
| | 26,603 |
TOTAL MATERIALS | | 3,342,282 |
TELECOMMUNICATION SERVICES - 1.6% |
Diversified Telecommunication Services - 0.5% |
012 Smile.Communications Ltd. | 2,149 | | 65,029 |
8x8, Inc. (a) | 8,794 | | 23,216 |
Alaska Communication Systems Group, Inc. | 5,059 | | 53,322 |
Arbinet-thexchange, Inc. (a) | 200 | | 1,360 |
Atlantic Tele-Network, Inc. | 1,084 | | 37,170 |
Cbeyond, Inc. (a) | 2,266 | | 29,866 |
City Telecom (HK) Ltd. sponsored ADR | 459 | | 6,848 |
Cogent Communications Group, Inc. (a) | 3,394 | | 41,000 |
Consolidated Communications Holdings, Inc. | 2,550 | | 46,971 |
General Communications, Inc. Class A (a) | 3,767 | | 42,454 |
Global Crossing Ltd. (a) | 4,081 | | 54,563 |
Globalstar, Inc. (a) | 22,812 | | 35,130 |
HickoryTech Corp. | 972 | | 8,806 |
Iridium Communications, Inc. (a) | 5,293 | | 49,437 |
Level 3 Communications, Inc. (a)(d) | 120,999 | | 120,999 |
Neutral Tandem, Inc. (a) | 2,278 | | 32,735 |
PAETEC Holding Corp. (a) | 10,485 | | 38,795 |
SureWest Communications (a) | 1,410 | | 12,479 |
Telefonos de Mexico SA de CV Series A sponsored ADR | 257 | | 4,073 |
tw telecom, inc. (a) | 10,610 | | 174,853 |
VocalTec Communications Ltd. (a) | 850 | | 23,902 |
Warwick Valley Telephone Co. | 420 | | 6,153 |
Windstream Corp. | 32,759 | | 427,177 |
| | 1,336,338 |
Wireless Telecommunication Services - 1.1% |
America Movil SAB de CV Series A sponsored ADR | 375 | | 20,246 |
Clearwire Corp. Class A (a)(d) | 16,505 | | 115,865 |
FiberTower Corp. (a) | 5,318 | | 23,186 |
ICO Global Communications Holdings Ltd. Class A (a) | 16,937 | | 25,575 |
Leap Wireless International, Inc. (a) | 5,795 | | 63,079 |
Linktone Ltd. sponsored ADR (a) | 452 | | 642 |
Millicom International Cellular SA | 7,825 | | 679,054 |
Common Stocks - continued |
| Shares | | Value |
TELECOMMUNICATION SERVICES - continued |
Wireless Telecommunication Services - continued |
NII Holdings, Inc. (a) | 12,267 | | $ 475,469 |
NTELOS Holdings Corp. | 2,836 | | 48,155 |
Partner Communications Co. Ltd. ADR | 591 | | 12,240 |
SBA Communications Corp. Class A (a) | 7,883 | | 308,619 |
Shenandoah Telecommunications Co. | 2,363 | | 41,329 |
USA Mobility, Inc. | 2,100 | | 35,742 |
Vodafone Group PLC sponsored ADR | 56,500 | | 1,415,890 |
| | 3,265,091 |
TOTAL TELECOMMUNICATION SERVICES | | 4,601,429 |
UTILITIES - 0.1% |
Electric Utilities - 0.0% |
MGE Energy, Inc. | 1,440 | | 59,458 |
Otter Tail Corp. | 2,439 | | 50,146 |
| | 109,604 |
Gas Utilities - 0.0% |
China Natural Gas, Inc. (a)(d) | 1,300 | | 6,565 |
Delta Natural Gas Co., Inc. | 344 | | 10,667 |
| | 17,232 |
Independent Power Producers & Energy Traders - 0.0% |
Synthesis Energy Systems, Inc. (a) | 3,632 | | 3,523 |
Water Utilities - 0.1% |
Artesian Resources Corp. Class A | 433 | | 8,127 |
Cadiz, Inc. (a) | 828 | | 9,340 |
Connecticut Water Service, Inc. | 1,238 | | 31,532 |
Consolidated Water Co., Inc. | 1,157 | | 10,216 |
Middlesex Water Co. | 1,342 | | 23,431 |
Pure Cycle Corp. (a) | 764 | | 2,666 |
Tri-Tech Holding, Inc. (a) | 664 | | 7,118 |
York Water Co. | 1,531 | | 24,236 |
| | 116,666 |
TOTAL UTILITIES | | 247,025 |
TOTAL COMMON STOCKS (Cost $216,361,024) | 272,349,011 |
U.S. Treasury Obligations - 0.2% |
| Principal Amount | | Value |
U.S. Treasury Bills, yield at date of purchase 0.19% to 0.21% 7/28/11 (e)
(Cost $599,231) | | $ 600,000 | | $ 599,156 |
Money Market Funds - 5.7% |
| Shares | | |
Fidelity Cash Central Fund, 0.24% (b) | 6,794,622 | | 6,794,622 |
Fidelity Securities Lending Cash Central Fund, 0.25% (b)(c) | 9,206,472 | | 9,206,472 |
TOTAL MONEY MARKET FUNDS (Cost $16,001,094) | 16,001,094 |
TOTAL INVESTMENT PORTFOLIO - 103.1% (Cost $232,961,349) | | 288,949,261 |
NET OTHER ASSETS (LIABILITIES) - (3.1)% | | (8,798,934) |
NET ASSETS - 100% | 280,150,327 |
Futures Contracts |
| Expiration
Date | | Underlying
Face Amount
at Value | | Unrealized
Appreciation/
(Depreciation) |
Purchased |
Equity Index Contracts |
182 CME E-mini NASDAQ 100 Index Contracts | Dec. 2010 | | $ 7,705,880 | | $ (78,358) |
|
The face value of futures purchased as a percentage of net assets is 2.8% |
Legend |
(a) Non-income producing |
(b) Affiliated fund that is available only to investment companies and other accounts managed by Fidelity Investments. The rate quoted is the annualized seven-day yield of the fund at period end. A complete unaudited listing of the fund's holdings as of its most recent quarter end is available upon request. In addition, each Fidelity Central Fund's financial statements, which are not covered by the Fund's Report of Independent Registered Public Accounting Firm, are available on the SEC's website or upon request. |
(c) Investment made with cash collateral received from securities on loan. |
(d) Security or a portion of the security is on loan at period end. |
(e) Security or a portion of the security was pledged to cover margin requirements for futures contracts. At the period end, the value of securities pledged amounted to $539,240. |
Affiliated Central Funds |
Information regarding fiscal year to date income earned by the Fund from investments in Fidelity Central Funds is as follows: |
Fund | Income earned |
Fidelity Cash Central Fund | $ 6,007 |
Fidelity Securities Lending Cash Central Fund | 299,882 |
Total | $ 305,889 |
Other Information |
The following is a summary of the inputs used, as of November 30, 2010, involving the Fund's assets and liabilities carried at fair value. The inputs or methodology used for valuing securities may not be an indication of the risk associated with investing in those securities. For more information on valuation inputs, and their aggregation into the levels used in the tables below, please refer to the Security Valuation section in the accompanying Notes to Financial Statements. |
Valuation Inputs at Reporting Date: |
Description | Total | Level 1 | Level 2 | Level 3 |
Investments in Securities: | | | | |
Equities: | | | | |
Consumer Discretionary | $ 41,869,061 | $ 41,869,061 | $ - | $ - |
Consumer Staples | 5,582,875 | 5,582,875 | - | - |
Energy | 4,450,241 | 4,449,719 | 522 | - |
Financials | 19,380,256 | 19,379,362 | 76 | 818 |
Health Care | 35,271,752 | 35,271,752 | - | - |
Industrials | 14,463,636 | 14,448,582 | - | 15,054 |
Information Technology | 143,140,454 | 143,140,454 | - | - |
Materials | 3,342,282 | 3,342,282 | - | - |
Telecommunication Services | 4,601,429 | 4,601,429 | - | - |
Utilities | 247,025 | 247,025 | - | - |
U.S. Government and Government Agency Obligations | 599,156 | - | 599,156 | - |
Money Market Funds | 16,001,094 | 16,001,094 | - | - |
Total Investments in Securities: | $ 288,949,261 | $ 288,333,635 | $ 599,754 | $ 15,872 |
Derivative Instruments: | | | | |
Liabilities | | | | |
Futures Contracts | $ (78,358) | $ (78,358) | $ - | $ - |
The following is a reconciliation of Investments in Securities for which Level 3 inputs were used in determining value: |
Investments in Securities: | |
Beginning Balance | $ - |
Total Realized Gain (Loss) | - |
Total Unrealized Gain (Loss) | (57,471) |
Cost of Purchases | 11,693 |
Proceeds of Sales | - |
Amortization/Accretion | - |
Transfers in to Level 3 | 61,650 |
Transfers out of Level 3 | - |
Ending Balance | $ 15,872 |
The change in unrealized gain (loss) for the period attributable to Level 3 securities held at November 30, 2010 | $ (57,471) |
The information used in the above reconciliation represents fiscal year to date activity for any Investments in Securities identified as using Level 3 inputs at either the beginning or the end of the current fiscal period. Transfers in or out of Level 3 represent the beginning value of any Security or Instrument where a change in the pricing level occurred from the beginning to the end of the period. The cost of purchases and the proceeds of sales may include securities received or delivered through corporate actions or exchanges. Realized and unrealized gains (losses) disclosed in the reconciliation are included in Net Gain (Loss) on the Fund's Statement of Operations. |
Value of Derivative Instruments |
The following table is a summary of the Fund's value of derivative instruments by risk exposure as of November 30, 2010. For additional information on derivative instruments, please refer to the Derivative Instruments section in the accompanying Notes to Financial Statements. |
Risk Exposure /
Derivative Type | Value |
| Asset | Liability |
Equity Risk | | |
Futures Contracts (a) | $ - | $ (78,358) |
Total Value of Derivatives | $ - | $ (78,358) |
(a) Reflects cumulative appreciation/(depreciation) on futures contracts as disclosed on the Schedule of Investments. Only the period end variation margin is separately disclosed on the Statement of Assets and Liabilities. |
Income Tax Information |
At November 30, 2010, the Fund had a capital loss carryforward of approximately $7,703,215 of which $5,238,336, $260,007 and $2,204,872 will expire in fiscal 2016, 2017 and 2018, respectively. Capital loss carryforwards are only available to offset future capital gains of the Fund to the extent provided by regulations and may be limited. |
See accompanying notes which are an integral part of the financial statements.
Annual Report
Statement of Assets and Liabilities
| November 30, 2010 |
| | |
Assets | | |
Investment in securities, at value (including securities loaned of $8,694,928) - See accompanying schedule: Unaffiliated issuers (cost $216,960,255) | $ 272,948,167 | |
Fidelity Central Funds (cost $16,001,094) | 16,001,094 | |
Total Investments (cost $232,961,349) | | $ 288,949,261 |
Cash | | 47,149 |
Receivable for investments sold | | 148,558 |
Receivable for fund shares sold | | 409,368 |
Dividends receivable | | 404,524 |
Distributions receivable from Fidelity Central Funds | | 38,736 |
Prepaid expenses | | 930 |
Receivable from investment adviser for expense reductions | | 50,473 |
Other receivables | | 9 |
Total assets | | 290,049,008 |
| | |
Liabilities | | |
Payable for investments purchased | $ 82,158 | |
Payable for fund shares redeemed | 291,157 | |
Accrued management fee | 56,295 | |
Distribution and service plan fees payable | 40,479 | |
Payable for daily variation on futures contracts | 102,445 | |
Other affiliated payables | 42,059 | |
Other payables and accrued expenses | 77,616 | |
Collateral on securities loaned, at value | 9,206,472 | |
Total liabilities | | 9,898,681 |
| | |
Net Assets | | $ 280,150,327 |
Net Assets consist of: | | |
Paid in capital | | $ 230,829,506 |
Undistributed net investment income | | 1,608,695 |
Accumulated undistributed net realized gain (loss) on investments and foreign currency transactions | | (8,197,427) |
Net unrealized appreciation (depreciation) on investments and assets and liabilities in foreign currencies | | 55,909,553 |
Net Assets, for 8,399,830 shares outstanding | | $ 280,150,327 |
Net Asset Value, offering price and redemption price per share ($280,150,327 ÷ 8,399,830 shares) | | $ 33.35 |
See accompanying notes which are an integral part of the financial statements.
Annual Report
Financial Statements - continued
Statement of Operations
| Year ended November 30, 2010 |
| | |
Investment Income | | |
Dividends | | $ 2,439,412 |
Interest | | 2,764 |
Income from Fidelity Central Funds (including $299,882 from security lending) | | 305,889 |
Total income | | 2,748,065 |
| | |
Expenses | | |
Management fee | $ 612,163 | |
Transfer agent fees | 357,710 | |
Distribution and service plan fees | 153,099 | |
Licensing fees | 153,099 | |
Accounting and security lending fees | 100,333 | |
Custodian fees and expenses | 14,506 | |
Independent trustees' compensation | 1,402 | |
Registration fees | 33,180 | |
Audit | 52,301 | |
Legal | 1,088 | |
Miscellaneous | 2,864 | |
Total expenses before reductions | 1,481,745 | |
Expense reductions | (587,962) | 893,783 |
Net investment income (loss) | | 1,854,282 |
Realized and Unrealized Gain (Loss) Net realized gain (loss) on: | | |
Investment securities: | | |
Unaffiliated issuers | (2,470,543) | |
Foreign currency transactions | 1,285 | |
Futures contracts | 331,487 | |
Capital gain distributions from Fidelity Central Funds | 635 | |
Total net realized gain (loss) | | (2,137,136) |
Change in net unrealized appreciation (depreciation) on: Investment securities | 38,983,232 | |
Assets and liabilities in foreign currencies | (1) | |
Futures contracts | (115,264) | |
Total change in net unrealized appreciation (depreciation) | | 38,867,967 |
Net gain (loss) | | 36,730,831 |
Net increase (decrease) in net assets resulting from operations | | $ 38,585,113 |
See accompanying notes which are an integral part of the financial statements.
Annual Report
Statement of Changes in Net Assets
| Year ended
November 30,
2010 | Year ended
November 30,
2009 |
Increase (Decrease) in Net Assets | | |
Operations | | |
Net investment income (loss) | $ 1,854,282 | $ 1,231,534 |
Net realized gain (loss) | (2,137,136) | 318,530 |
Change in net unrealized appreciation (depreciation) | 38,867,967 | 56,722,497 |
Net increase (decrease) in net assets resulting from operations | 38,585,113 | 58,272,561 |
Distributions to shareholders from net investment income | (1,165,841) | (1,155,385) |
Share transactions
Proceeds from sales of shares | 107,954,188 | 102,813,332 |
Reinvestment of distributions | 1,117,280 | 1,098,205 |
Cost of shares redeemed | (87,310,674) | (58,869,179) |
Net increase (decrease) in net assets resulting from share transactions | 21,760,794 | 45,042,358 |
Redemption fees | 68,572 | 87,347 |
Total increase (decrease) in net assets | 59,248,638 | 102,246,881 |
| | |
Net Assets | | |
Beginning of period | 220,901,689 | 118,654,808 |
End of period (including undistributed net investment income of $1,608,695 and undistributed net investment income of $952,669, respectively) | $ 280,150,327 | $ 220,901,689 |
Other Information Shares | | |
Sold | 3,473,521 | 4,345,451 |
Issued in reinvestment of distributions | 38,132 | 53,105 |
Redeemed | (2,852,299) | (2,451,844) |
Net increase (decrease) | 659,354 | 1,946,712 |
See accompanying notes which are an integral part of the financial statements.
Annual Report
Financial Highlights
Years ended November 30, | 2010 | 2009 | 2008 | 2007 | 2006 |
Selected Per-Share Data | | | | | |
Net asset value, beginning of period | $ 28.54 | $ 20.48 | $ 35.88 | $ 32.95 | $ 30.32 |
Income from Investment Operations | | | | | |
Net investment income (loss) B | .22 | .18 | .22 | .18 | .14 |
Net realized and unrealized gain (loss) | 4.73 | 8.07 | (14.96) | 3.07 | 2.69 |
Total from investment operations | 4.95 | 8.25 | (14.74) | 3.25 | 2.83 |
Distributions from net investment income | (.15) | (.20) | (.18) | (.10) | (.08) |
Distributions from net realized gain | - | - | (.50) | (.25) | (.13) |
Total distributions | (.15) | (.20) | (.68) | (.35) | (.21) |
Redemption fees added to paid in capital B | .01 | .01 | .02 | .03 | .01 |
Net asset value, end of period | $ 33.35 | $ 28.54 | $ 20.48 | $ 35.88 | $ 32.95 |
Total Return A | 17.45% | 40.70% | (41.83)% | 10.05% | 9.42% |
Ratios to Average Net Assets C,E | | | | | |
Expenses before reductions | .58% | .62% | .61% | .60% | .58% |
Expenses net of fee waivers, if any | .35% | .35% | .35% | .35% | .42% |
Expenses net of all reductions | .35% | .35% | .35% | .35% | .42% |
Net investment income (loss) | .73% | .75% | .72% | .52% | .47% |
Supplemental Data | | | | | |
Net assets, end of period (000 omitted) | $ 280,150 | $ 220,902 | $ 118,655 | $ 190,571 | $ 179,412 |
Portfolio turnover rate D | 8% | 3% | 13% | 18% | 7% |
A Total returns would have been lower had certain expenses not been reduced during the periods shown.
B Calculated based on average shares outstanding during the period.
C Fees and expenses of the underlying Fidelity Central Funds are not included in the Fund's expense ratio. The Fund indirectly bears its proportionate share of the expenses of any underlying Fidelity Central Funds.
D Amount does not include the portfolio activity of any underlying Fidelity Central Funds.
E Expense ratios reflect operating expenses of the Fund. Expenses before reductions do not reflect amounts reimbursed by the investment adviser or reductions from expense offset arrangements and do not represent the amount paid by the Fund during periods when reimbursements or reductions occur. Expenses net of fee waivers reflect expenses after reimbursement by the investment adviser but prior to reductions from expense offset arrangements. Expenses net of all reductions represent the net expenses paid by the Fund.
See accompanying notes which are an integral part of the financial statements.
Annual Report
Notes to Financial Statements
For the period ended November 30, 2010
1. Organization.
Fidelity Nasdaq Composite Index Fund (the Fund) is a fund of Fidelity Commonwealth Trust (the Trust) and is authorized to issue an unlimited number of shares. The Trust is registered under the Investment Company Act of 1940, as amended (the 1940 Act), as an open-end management investment company organized as a Massachusetts business trust.
2. Investments in Fidelity Central Funds.
The Fund may invest in Fidelity Central Funds, which are open-end investment companies available only to other investment companies and accounts managed by Fidelity Management & Research Company (FMR) and its affiliates. The Fund's Schedule of Investments lists each of the Fidelity Central Funds held as of period end, if any, as an investment of the Fund, but does not include the underlying holdings of each Fidelity Central Fund. As an Investing Fund, the Fund indirectly bears its proportionate share of the expenses of the underlying Fidelity Central Funds.
The Money Market Central Funds seek preservation of capital and current income and are managed by Fidelity Investments Money Management, Inc. (FIMM), an affiliate of FMR.
A complete unaudited list of holdings for each Fidelity Central Fund is available upon request or at the Securities and Exchange Commission (the SEC) web site at www.sec.gov. In addition, the financial statements of the Fidelity Central Funds, which are not covered by the Fund's Report of Independent Registered Public Accounting Firm, are available on the SEC web site or upon request.
3. Significant Accounting Policies.
The financial statements have been prepared in conformity with accounting principles generally accepted in the United States of America (GAAP), which require management to make certain estimates and assumptions at the date of the financial statements. Actual results could differ from those estimates. The following summarizes the significant accounting policies of the Fund:
Security Valuation. Investments are valued as of 4:00 p.m. Eastern time on the last calendar day of the period. The Fund uses independent pricing services approved by the Board of Trustees to value its investments. When current market prices or quotations are not readily available or reliable, valuations may be determined in good faith in accordance with procedures adopted by the Board of Trustees. Factors used in determining value may include market or security specific events, changes in interest rates and credit quality. The frequency with which these procedures are used cannot be predicted and they may be utilized to a significant extent. The value used for net asset value (NAV) calculation under these procedures may differ from published prices for the same securities.
Annual Report
3. Significant Accounting Policies - continued
Security Valuation - continued
The Fund categorizes the inputs to valuation techniques used to value its investments into a disclosure hierarchy consisting of three levels as shown below.
Level 1 - quoted prices in active markets for identical investments
Level 2 - other significant observable inputs (including quoted prices for similar investments, interest rates, prepayment speeds, etc.)
Level 3 - unobservable inputs (including the Fund's own assumptions based on the best information available)
Changes in valuation techniques may result in transfers in or out of an assigned level within the disclosure hierarchy. The aggregate value of investments by input level, as of November 30, 2010, as well as a roll forward of Level 3 securities, is included at the end of the Fund's Schedule of Investments. Valuation techniques used to value the Fund's investments by major category are as follows.
Equity securities, including restricted securities, for which market quotations are readily available, are valued at the last reported sale price or official closing price as reported by an independent pricing service on the primary market or exchange on which they are traded and are categorized as Level 1 in the hierarchy. In the event there were no sales during the day or closing prices are not available, securities are valued at the last quoted bid price or may be valued using the last available price and are generally categorized as Level 2 in the hierarchy. For foreign equity securities, when significant market or security specific events arise, comparisons to the valuation of American Depositary Receipts (ADRs), futures contracts, Exchange-traded funds (ETFs) and certain indexes as well as quoted prices for similar securities are used and are categorized as Level 2 in the hierarchy in these circumstances. Utilizing these techniques may result in transfers between Level 1 and Level 2. For restricted equity securities and private placements where observable inputs are limited, assumptions about market activity and risk are used and are categorized as Level 3 in the hierarchy.
Debt securities, including restricted securities, are valued based on evaluated prices received from independent pricing services or from dealers who make markets in such securities. For U.S. government and government agency obligations, pricing services utilize matrix pricing which considers yield or price of bonds of comparable quality, coupon, maturity and type as well as dealer supplied prices and are generally categorized as Level 2 in the hierarchy.
Annual Report
Notes to Financial Statements - continued
3. Significant Accounting Policies - continued
Security Valuation - continued
Futures contracts are valued at the settlement price established each day by the board of trade or exchange on which they are traded and are categorized as Level 1 in the hierarchy. Investments in open-end mutual funds, including the Fidelity Central Funds, are valued at their closing net asset value each business day and are categorized as Level 1 in the hierarchy.
When independent prices are unavailable or unreliable, debt securities may be valued utilizing pricing matrices which consider similar factors that would be used by independent pricing services. These are generally categorized as Level 2 in the hierarchy but may be Level 3 depending on the circumstances.
Foreign Currency. The Fund uses foreign currency contracts to facilitate transactions in foreign-denominated securities. Gains and losses from these transactions may arise from changes in the value of the foreign currency or if the counterparties do not perform under the contracts' terms.
Foreign-denominated assets, including investment securities, and liabilities are translated into U.S. dollars at the exchange rate at period end. Purchases and sales of investment securities, income and dividends received and expenses denominated in foreign currencies are translated into U.S. dollars at the exchange rate in effect on the transaction date.
The effects of exchange rate fluctuations on investments are included with the net realized and unrealized gain (loss) on investment securities. Other foreign currency transactions resulting in realized and unrealized gain (loss) are disclosed separately.
Investment Transactions and Income. For financial reporting purposes, the Fund's investment holdings and NAV include trades executed through the end of the last business day of the period. The NAV per share for processing shareholder transactions is calculated as of the close of business of the New York Stock Exchange (NYSE), normally 4:00 p.m. Eastern time and includes trades executed through the end of the prior business day. Gains and losses on securities sold are determined on the basis of identified cost and may include proceeds received from litigation. Dividend income is recorded on the ex-dividend date, except for certain dividends from foreign securities where the ex-dividend date may have passed, which are recorded as soon as the Fund is informed of the ex-dividend date. Non-cash dividends included in dividend income, if any, are recorded at the fair market value of the securities received. Distributions received on securities that represent a return of capital or capital gain are recorded as a reduction of cost of investments and/or as a realized gain. The Fund estimates the components of
Annual Report
3. Significant Accounting Policies - continued
Investment Transactions and Income - continued
distributions received that may be considered return of capital distributions or capital gain distributions. Interest income and distributions from the Fidelity Central Funds are accrued as earned. Interest income includes coupon interest and amortization of premium and accretion of discount on debt securities. Investment income is recorded net of foreign taxes withheld where recovery of such taxes is uncertain.
Expenses. Most expenses of the Trust can be directly attributed to a fund. Expenses which cannot be directly attributed are apportioned amongst each fund in the Trust. Expense estimates are accrued in the period to which they relate and adjustments are made when actual amounts are known.
Income Tax Information and Distributions to Shareholders. Each year the Fund intends to qualify as a regulated investment company, including distributing substantially all of its taxable income and realized gains under Subchapter M of the Internal Revenue Code and filing its U.S. federal tax return. As a result, no provision for income taxes is required. As of November 30, 2010, the Fund did not have any unrecognized tax benefits in the accompanying financial statements. A fund's federal tax return is subject to examination by the Internal Revenue Service (IRS) for a period of three years. Foreign taxes are provided for based on the Fund's understanding of the tax rules and rates that exist in the foreign markets in which it invests.
Distributions are declared and recorded on the ex-dividend date. Income and capital gain distributions are determined in accordance with income tax regulations, which may differ from GAAP.
Capital accounts within the financial statements are adjusted for permanent book-tax differences. These adjustments have no impact on net assets or the results of operations. Temporary book-tax differences will reverse in a subsequent period.
Book-tax differences are primarily due to short-term gain distributions from the Fidelity Central Funds, futures transactions, foreign currency transactions, market discount, partnerships, capital loss carryforwards and losses deferred due to wash sales.
The federal tax cost of investment securities and unrealized appreciation (depreciation) as of period end were as follows:
Gross unrealized appreciation | $ 86,378,774 |
Gross unrealized depreciation | (30,963,434) |
Net unrealized appreciation (depreciation) | $ 55,415,340 |
| |
Tax Cost | $ 233,533,921 |
Annual Report
Notes to Financial Statements - continued
3. Significant Accounting Policies - continued
Income Tax Information and Distributions to Shareholders - continued
The tax-based components of distributable earnings as of period end were as follows:
Undistributed ordinary income | $ 1,633,619 |
Capital loss carryforward | $ (7,703,215) |
Net unrealized appreciation (depreciation) | $ (55,391,049) |
The tax character of distributions paid was as follows:
| November 30, 2010 | November 31, 2009 |
Ordinary Income | $ 1,165,841 | $ 1,155,385 |
Short-Term Trading (Redemption) Fees. Shares held by investors in the Fund less than 90 days are subject to a redemption fee equal to .75% of the net asset value of shares redeemed. All redemption fees, which reduce the proceeds of the shareholder redemption, are retained by the Fund and accounted for as an addition to paid in capital.
4. Derivative Instruments.
Risk Exposures and the Use of Derivative Instruments. The Fund uses derivative instruments (derivatives), including futures contracts in order to meet its investment objectives. The strategy is to use derivatives to increase returns and to manage exposure to certain risks as defined below. The success of any strategy involving derivatives depends on analysis of numerous economic factors, and if the strategies for investment do not work as intended, the Fund may not achieve its objectives.
The Fund's use of derivatives may increase or decrease its exposure to the following risk:
Equity Risk | Equity risk relates to the fluctuations in the value of financial instruments as a result of changes in market prices (other than those arising from interest rate risk or foreign exchange risk), whether caused by factors specific to an individual investment, its issuer, or all factors affecting all instruments traded in a market or market segment. |
The Fund is also exposed to additional risks from investing in derivatives, such as liquidity risk and counterparty credit risk. Liquidity risk is the risk that the Fund will be unable to sell the derivative in the open market in a timely manner. Counterparty credit risk is the risk that the counterparty will not be able to fulfill its obligation to the Fund. The Fund's maximum risk of loss from counterparty credit risk is generally the aggregate
Annual Report
4. Derivative Instruments - continued
Risk Exposures and the Use of Derivative Instruments - continued
unrealized appreciation and unpaid counterparty fees in excess of any collateral pledged by the counterparty to the Fund. Counterparty risk related to exchange-traded futures contracts is minimal because of the protection provided by the exchange on which they trade. Risk of loss may exceed the amounts recognized in the Statement of Assets and Liabilities.
Futures Contracts. A futures contract is an agreement between two parties to buy or sell a specified underlying instrument for a fixed price at a specified future date. The Fund uses futures contracts to manage its exposure to the stock market.
Upon entering into a futures contract, a fund is required to deposit either cash or securities (initial margin) with a clearing broker in an amount equal to a certain percentage of the face value of the contract. Futures contracts are marked-to-market daily and subsequent payments (variation margin) are made or received by a fund depending on the daily fluctuations in the value of the futures contracts and are recorded as unrealized appreciation or (depreciation). Realized gain or (loss) is recorded upon the expiration or closing of a futures contract.
The underlying face amount at value of open futures contracts at period end is shown in the Schedule of Investments under the caption "Futures Contracts." This amount reflects each contract's exposure to the underlying instrument at period end and is representative of activity for the period. Securities deposited to meet initial margin requirements are identified in the Schedule of Investments. The receivable and/or payable for the variation margin are reflected in the Statement of Assets and Liabilities.
Certain risks may arise upon entering into futures contracts, including the risk that an illiquid market may limit the ability to close out a futures contract prior to settlement date.
During the period the Fund recognized net realized gain (loss) of $331,487 and a change in net unrealized appreciation (depreciation) of ($115,264) related to its investment in futures contracts. These amounts are included in the Statement of Operations.
5. Purchases and Sales of Investments.
Purchases and sales of securities, other than short-term securities, aggregated $35,657,657 and $19,381,087, respectively.
Annual Report
Notes to Financial Statements - continued
6. Fees and Other Transactions with Affiliates.
Management Fee. FMR and its affiliates provide the Fund with investment management related services for which the Fund pays a monthly management fee that is based on an annual rate of .24% of the Fund's average net assets.
Sub-Adviser. Geode Capital Management, LLC (Geode), serves as sub-adviser for the Fund. Geode provides discretionary investment advisory services to the Fund and is paid by FMR for providing these services.
Distribution and Service Plan Fees. In accordance with Rule 12b-1 of the 1940 Act, the Fund has adopted a Distribution and Service Plan. The Fund pays Fidelity Distributors Corporation (FDC), an affiliate of FMR, a distribution fee based on an annual percentage of the Fund's average net assets of up to .25%. In addition, FDC pays NASDAQ for marketing services provided to the Fund. For the period, the distribution fees were equivalent to an annual rate of .06% of average net assets. The total fees and amounts retained by FDC were $153,099 and $0, respectively.
Transfer Agent Fees. Fidelity Investments Institutional Operations Company, Inc. (FIIOC), an affiliate of FMR, is the Fund's transfer, dividend disbursing and shareholder servicing agent. FIIOC receives account fees and asset-based fees that vary according to account size and type of account. FIIOC pays for typesetting, printing and mailing of shareholder reports, except proxy statements. For the period, the transfer agent fees were equivalent to an annual rate of .14% of average net assets.
Accounting and Security Lending Fees. Fidelity Service Company, Inc. (FSC), an affiliate of FMR, maintains the Fund's accounting records. The accounting fee is based on the level of average net assets for the month. Under a separate contract, FSC administers the security lending program. The security lending fee is based on the number and duration of lending transactions.
Licensing Fees. Under the terms of a license agreement, FMR pays NASDAQ an annual licensing fee for the use of the NASDAQ Composite Index. FMR has entered into a sub-license agreement with the Fund whereby the Fund pays FMR the amount of the license fee at the rate of up to .06% of the Fund's average net assets.
7. Committed Line of Credit.
The Fund participates with other funds managed by FMR or an affiliate in a $3.75 billion credit facility (the "line of credit") to be utilized for temporary or emergency purposes to fund shareholder redemptions or for other short-term liquidity purposes. The Fund has agreed to pay commitment fees on its pro-rata portion of the line of credit, which amounted to $966 and is reflected in Miscellaneous expenses on the Statement of Operations. During the period, there were no borrowings on this line of credit.
Annual Report
8. Security Lending.
The Fund lends portfolio securities through a lending agent from time to time in order to earn additional income. On the settlement date of the loan, the Fund receives collateral (in the form of U.S. Treasury obligations, letters of credit and/or cash) against the loaned securities and maintains collateral in an amount not less than 100% of the market value of the loaned securities during the period of the loan. The market value of the loaned securities is determined at the close of business of the Fund and any additional required collateral is delivered to the Fund on the next business day. If the borrower defaults on its obligation to return the securities loaned because of insolvency or other reasons, a fund could experience delays and costs in recovering the securities loaned or in gaining access to the collateral. Any cash collateral received is invested in the Fidelity Securities Lending Cash Central Fund. The value of loaned securities and cash collateral at period end are disclosed on the Fund's Statement of Assets and Liabilities. Security lending income represents the income earned on investing cash collateral, less rebates paid to borrowers and lending agent fees associated with the loan, plus any premium payments received for lending certain types of securities. Security lending income is presented in the Statement of Operations as a component of income from Fidelity Central Funds.
9. Expense Reductions.
FMR contractually agreed to waive expenses of the Fund to the extent annual operating expenses exceeded .35% of average net assets. This waiver will remain in place through January 31, 2012. Some expenses, for example interest expense, including commitment fees, are excluded from this waiver. During the period this waiver reduced the Fund's expenses by $587,950.
In addition, through arrangements with the Fund's custodian, credits realized as a result of uninvested cash balances were used to reduce the Fund's expenses. During the period, these credits reduced the Fund's custody expenses by $12.
10. Other.
The Fund's organizational documents provide former and current trustees and officers with a limited indemnification against liabilities arising in connection with the performance of their duties to the Fund. In the normal course of business, the Fund may also enter into contracts that provide general indemnifications. The Fund's maximum exposure under these arrangements is unknown as this would be dependent on future claims that may be made against the Fund. The risk of material loss from such claims is considered remote.
Annual Report
To the Trustees of Fidelity Commonwealth Trust and Shareholders of Fidelity Nasdaq Composite Index Fund:
We have audited the accompanying statement of assets and liabilities of Fidelity Nasdaq Composite Index Fund (the Fund), a fund of Fidelity Commonwealth Trust, including the schedule of investments, as of November 30, 2010, and the related statement of operations for the year then ended, the statement of changes in net assets for each of the two years in the period then ended, and the financial highlights for each of the five years in the period then ended. These financial statements and financial highlights are the responsibility of the Fund's management. Our responsibility is to express an opinion on these financial statements and financial highlights based on our audits.
We conducted our audits in accordance with standards of the Public Company Accounting Oversight Board (United States). Those standards require that we plan and perform the audit to obtain reasonable assurance about whether the financial statements and financial highlights are free of material misstatement. The Fund is not required to have, nor were we engaged to perform, an audit of its internal control over financial reporting. Our audits included consideration of internal control over financial reporting as a basis for designing audit procedures that are appropriate in the circumstances, but not for the purpose of expressing an opinion on the effectiveness of the Fund's internal control over financial reporting. Accordingly, we express no such opinion. An audit also includes examining, on a test basis, evidence supporting the amounts and disclosures in the financial statements, assessing the accounting principles used and significant estimates made by management, as well as evaluating the overall financial statement presentation. Our procedures included confirmation of securities owned as of November 30, 2010, by correspondence with the custodians and brokers; where replies were not received from brokers, we performed other auditing procedures. We believe that our audits provide a reasonable basis for our opinion.
In our opinion, the financial statements and financial highlights referred to above present fairly, in all material respects, the financial position of Fidelity Nasdaq Composite Index Fund as of November 30, 2010, the results of its operations for the year then ended, the changes in its net assets for the each of the two years in the period then ended, and the financial highlights for each of the five years in the period then ended in conformity with accounting principles generally accepted in the United States of America.
/s/ Deloitte & Touche LLP
DELOITTE & TOUCHE LLP
Boston, Massachusetts
January 19, 2011
Annual Report
The Trustees, Members of the Advisory Board, and executive officers of the trust and fund, as applicable, are listed below. The Board of Trustees governs the fund and is responsible for protecting the interests of shareholders. The Trustees are experienced executives who meet periodically throughout the year to oversee the fund's activities, review contractual arrangements with companies that provide services to the fund, oversee management of the risks associated with such activities and contractual arrangements, and review the fund's performance. Except for James C. Curvey, each of the Trustees oversees 219 funds advised by FMR or an affiliate. Mr. Curvey oversees 408 funds advised by FMR or an affiliate.
The Trustees hold office without limit in time except that (a) any Trustee may resign; (b) any Trustee may be removed by written instrument, signed by at least two-thirds of the number of Trustees prior to such removal; (c) any Trustee who requests to be retired or who has become incapacitated by illness or injury may be retired by written instrument signed by a majority of the other Trustees; and (d) any Trustee may be removed at any special meeting of shareholders by a two-thirds vote of the outstanding voting securities of the trust. Each Trustee who is not an interested person (as defined in the 1940 Act) (Independent Trustee), shall retire not later than the last day of the calendar year in which his or her 72nd birthday occurs. The Independent Trustees may waive this mandatory retirement age policy with respect to individual Trustees. The executive officers and Advisory Board Members hold office without limit in time, except that any officer and Advisory Board Member may resign or may be removed by a vote of a majority of the Trustees at any regular meeting or any special meeting of the Trustees. Except as indicated, each individual has held the office shown or other offices in the same company for the past five years.
Experience, Skills, Attributes, and Qualifications of the Fund's Trustees. The Governance and Nominating Committee has adopted a statement of policy that describes the experience, qualifications, attributes, and skills that are necessary and desirable for potential Independent Trustee candidates (Statement of Policy). The Board believes that each Trustee satisfied at the time he or she was initially elected or appointed a Trustee, and continues to satisfy, the standards contemplated by the Statement of Policy. The Governance and Nominating Committee also engages professional search firms to help identify potential Independent Trustee candidates who have the experience, qualifications, attributes, and skills consistent with the Statement of Policy. From time to time, additional criteria based on the composition and skills of the current Independent Trustees, as well as experience or skills that may be appropriate in light of future changes to board composition, business conditions, and regulatory or other developments, have also been considered by the professional search firms and the Governance and Nominating Committee. In addition, the Board takes into account the Trustees' commitment and participation in Board and committee meetings, as well as their leadership of standing and ad hoc committees throughout their tenure.
In determining that a particular Trustee was and continues to be qualified to serve as a Trustee, the Board has considered a variety of criteria, none of which, in isolation, was controlling. The Board believes that, collectively, the Trustees have balanced and diverse experience, qualifications, attributes, and skills, which allow the Board to operate effectively in governing the fund and protecting the interests of shareholders. Information about the specific experience, skills, attributes, and qualifications of each Trustee, which in each case led to the Board's conclusion that the Trustee should serve (or continue to serve) as a trustee of the fund, is provided below.
Annual Report
Board Structure and Oversight Function. James C. Curvey is an interested person (as defined in the 1940 Act) and currently serves as Acting Chairman. The Trustees have determined that an interested Chairman is appropriate and benefits shareholders because an interested Chairman has a personal and professional stake in the quality and continuity of services provided to the fund. Independent Trustees exercise their informed business judgment to appoint an individual of their choosing to serve as Chairman, regardless of whether the Trustee happens to be independent or a member of management. The Independent Trustees have determined that they can act independently and effectively without having an Independent Trustee serve as Chairman and that a key structural component for assuring that they are in a position to do so is for the Independent Trustees to constitute a substantial majority for the Board. The Independent Trustees also regularly meet in executive session. Ned C. Lautenbach serves as Chairman of the Independent Trustees and as such (i) acts as a liaison between the Independent Trustees and management with respect to matters important to the Independent Trustees and (ii) with management prepares agendas for Board meetings.
Fidelity funds are overseen by different Boards of Trustees. The fund's Board oversees Fidelity's equity and high income funds and another Board oversees Fidelity's investment-grade bond, money market, and asset allocation funds. The asset allocation funds may invest in Fidelity funds overseen by the fund's Board. The use of separate Boards, each with its own committee structure, allows the Trustees of each group of Fidelity funds to focus on the unique issues of the funds they oversee, including common research, investment, and operational issues. On occasion, the separate Boards establish joint committees to address issues of overlapping consequences for the Fidelity funds overseen by each Board.
The Trustees operate using a system of committees to facilitate the timely and efficient consideration of all matters of importance to the Trustees, the fund, and fund shareholders and to facilitate compliance with legal and regulatory requirements and oversight of the fund's activities and associated risks. The Board, acting through its committees, has charged FMR and its affiliates with (i) identifying events or circumstances the occurrence of which could have demonstrably adverse effects on the fund's business and/or reputation; (ii) implementing processes and controls to lessen the possibility that such events or circumstances occur or to mitigate the effects of such events or circumstances if they do occur; and (iii) creating and maintaining a system designed to evaluate continuously business and market conditions in order to facilitate the identification and implementation processes described in (i) and (ii) above. Because the day-to-day operations and activities of the fund are carried out by or through FMR, its affiliates and other service providers, the fund's exposure to risks is mitigated but not eliminated by the processes overseen by the Trustees. While each of the Board's committees has responsibility for overseeing different aspects of the fund's activities, oversight is exercised primarily through the Operations, Audit, and Compliance Committees. Appropriate personnel, including but not limited to the fund's Chief Compliance Officer (CCO), FMR's internal auditor, the independent accountants, the fund's Treasurer and portfolio management personnel, make periodic reports to the Board's committees, as appropriate. The responsibilities of each committee, including their oversight responsibilities, are described further under "Standing Committees of the Fund's Trustees."
Annual Report
Trustees and Officers - continued
The fund's Statement of Additional Information (SAI) includes more information about the Trustees. To request a free copy, call Fidelity at 1-800-544-8544.
Interested Trustees*:
Correspondence intended for each Trustee who is an interested person may be sent to Fidelity Investments, 82 Devonshire Street, Boston, Massachusetts 02109.
Name, Age; Principal Occupations and Other Relevant Experience+ |
James C. Curvey (75) |
| Year of Election or Appointment: 2007 Mr. Curvey is Trustee and Acting Chairman of the Board of Trustees of certain Trusts. Mr. Curvey also serves as Trustee (2007-present) of other investment companies advised by FMR. Mr. Curvey is a Director of Fidelity Investments Money Management, Inc. (2009-present), Director of Fidelity Research & Analysis Co. (2009-present) and Director of FMR and FMR Co., Inc. (2007-present). Mr. Curvey is also Vice Chairman (2007-present) and Director of FMR LLC. In addition, Mr. Curvey serves as an Overseer for the Boston Symphony Orchestra and a member of the Trustees of Villanova University. Previously, Mr. Curvey was the Vice Chairman (2006-2007) and Director (2000-2007) of FMR Corp. |
Ronald P. O'Hanley (54) |
| Year of Election or Appointment: 2011 Ronald P. O'Hanley is President, Asset Management and Corporate Services, for Fidelity Investments and a member of Fidelity's Executive Committee (2010-present). Previously, Mr. O'Hanley served as President and Chief Executive Officer of BNY Mellon Asset Management (2007-2010). Mr. O'Hanley also served as Vice Chairman of Bank New York Mellon Corp. and a member of that firm's Executive Committee. Prior to the 2007 merger of The Bank of New York and Mellon Financial Corporation, he was Vice Chairman of Mellon Financial Corporation and President and Chief Executive Officer of Mellon Asset Management. He joined Mellon in February 1997. Mr. O'Hanley currently serves as Chairman of the Boston Public Library Foundation Board of Directors and sits on the Board of Directors of Beth Israel Deaconess Medical Center, the Board of Trustees of the Marine Biological Laboratory and the Advisory Board of the Maxwell School of Citizenship and Public Administration at Syracuse University. Mr. O'Hanley also chairs the Council on Asset Management for the Financial Services Roundtable and is a member of the Board of Directors of Institutional Investor's U.S. Institute. |
* Trustees have been determined to be "Interested Trustees" by virtue of, among other things, their affiliation with the trust or various entities under common control with FMR.
+ The information above includes each Trustee's principal occupation during the last five years and other information relating to the experience, attributes, and skills relevant to each Trustee's qualifications to serve as a Trustee, which led to the conclusion that each Trustee should serve as a Trustee for the fund.
Annual Report
Trustees and Officers - continued
Independent Trustees:
Correspondence intended for each Independent Trustee (that is, the Trustees other than the Interested Trustees) may be sent to Fidelity Investments, P.O. Box 55235, Boston, Massachusetts 02205-5235.
Name, Age; Principal Occupations and Other Relevant Experience+ |
Dennis J. Dirks (62) |
| Year of Election or Appointment: 2005 Prior to his retirement in May 2003, Mr. Dirks was Chief Operating Officer and a member of the Board of The Depository Trust & Clearing Corporation (DTCC). He also served as President, Chief Operating Officer, and Board member of The Depository Trust Company (DTC) and President and Board member of the National Securities Clearing Corporation (NSCC). In addition, Mr. Dirks served as Chief Executive Officer and Board member of the Government Securities Clearing Corporation, Chief Executive Officer and Board member of the Mortgage-Backed Securities Clearing Corporation, as a Trustee and a member of the Finance Committee of Manhattan College (2005-2008), and as a Trustee and a member of the Finance Committee of AHRC of Nassau County (2006-2008). Mr. Dirks is a member of the Independent Directors Council (IDC) Governing Council (2010-Present) and Board of Directors for The Brookville Center for Children's Services, Inc. (2009-present). |
Alan J. Lacy (57) |
| Year of Election or Appointment: 2008 Mr. Lacy serves as Senior Adviser (2007-present) of Oak Hill Capital Partners, L.P. (private equity). Mr. Lacy also served as Chief Executive Officer (2000-2005) and Vice Chairman (2005-2006) of Sears Holdings Corporation and Sears, Roebuck and Co. (retail). In addition, Mr. Lacy serves as a member of the Board of Directors of The Western Union Company (global money transfer, 2006-present) and Bristol-Myers Squibb Company (global pharmaceuticals, 2007-present). Mr. Lacy is Chairman (2008-present) and a member (2006-present) of the Board of Trustees of The National Parks Conservation Association. |
Ned C. Lautenbach (66) |
| Year of Election or Appointment: 2000 Mr. Lautenbach is Chairman of the Independent Trustees of the Equity and High Income Funds (2006-present). Mr. Lautenbach currently serves as the Lead Director of the Eaton Corporation Board of Directors (diversified industrial, 1997-present). Mr. Lautenbach is also a member of the Board of Directors of the Philharmonic Center for the Arts in Naples, Florida (1999-present); a member of the Board of Trustees of Fairfield University (2005-present); and a member of the Council on Foreign Relations (1994-present). Previously, Mr. Lautenbach was a Partner/Advisory Partner at Clayton, Dubilier & Rice, Inc. (private equity investment, 1998-2010), as well as a Director of Sony Corporation (2006-2007). |
Joseph Mauriello (66) |
| Year of Election or Appointment: 2008 Prior to his retirement in January 2006, Mr. Mauriello served in numerous senior management positions including Deputy Chairman and Chief Operating Officer (2004-2005), and Vice Chairman of Financial Services (2002-2004) of KPMG LLP US (professional services, 1965-2005). Mr. Mauriello currently serves as a member of the Board of Directors of XL Group plc. (global insurance and re-insurance, 2006-present) and of Arcadia Resources Inc. (health care services and products, 2007-present). Previously, Mr. Mauriello served as a Director of the Hamilton Funds of the Bank of New York (2006-2007). |
Cornelia M. Small (66) |
| Year of Election or Appointment: 2005 Ms. Small is a member of the Board of Directors of the Teagle Foundation (2009-present). Ms. Small is also a member of the Investment Committee, and Chair (2008-present) and a member of the Board of Trustees of Smith College. In addition, Ms. Small serves on the Investment Committee of the Berkshire Taconic Community Foundation (2008-present). Previously, Ms. Small served as Chairperson of the Investment Committee (2002-2008) of Smith College. In addition, Ms. Small served as Chief Investment Officer, Director of Global Equity Investments, and a member of the Board of Directors of Scudder, Stevens & Clark and Scudder Kemper Investments. |
William S. Stavropoulos (71) |
| Year of Election or Appointment: 2002 Mr. Stavropoulos is Vice Chairman of the Independent Trustees of the Equity and High Income Funds (2006-present). Mr. Stavropoulos serves as President and Founder of the Michigan Baseball Foundation, the Great Lakes Loons (2007-present). Mr. Stavropoulos is Chairman Emeritus of the Board of Directors of The Dow Chemical Company, where he previously served in numerous senior management positions, including President, CEO (1995-2000; 2002-2004), Chairman of the Executive Committee (2000-2006), and as a member of the Board of Directors (1990-2006). Currently, Mr. Stavropoulos is Chairman of Univar (global distributor of commodity and specialty chemicals, 2010-present), a Director of Teradata Corporation (data warehousing and technology solutions, 2008-present), Chemical Financial Corporation, Maersk Inc. (industrial conglomerate), Tyco International, Inc. (multinational manufacturing and services, 2007-present), and a member of the Advisory Board for Metalmark Capital (private equity investment, 2005-present). Mr. Stavropoulos is a special advisor to Clayton, Dubilier & Rice, LLC (private equity investment). In addition, Mr. Stavropoulos is a member of the University of Notre Dame Advisory Council for the College of Science. |
David M. Thomas (61) |
| Year of Election or Appointment: 2008 Previously, Mr. Thomas served as Executive Chairman (2005-2006) and Chairman and Chief Executive Officer (2000-2005) of IMS Health, Inc. (pharmaceutical and healthcare information solutions). In addition, Mr. Thomas serves as a member of the Board of Directors of Fortune Brands, Inc. (consumer products), and Interpublic Group of Companies, Inc. (marketing communication, 2004-present). |
Michael E. Wiley (60) |
| Year of Election or Appointment: 2008 Mr. Wiley also serves as a Director of Asia Pacific Exploration Consolidated (international oil and gas exploration and production, 2008-present). Mr. Wiley serves as a Director of Tesoro Corporation (independent oil refiner and marketer, 2005-present), and a Director of Bill Barrett Corporation (exploration and production, 2005-present). In addition, Mr. Wiley also serves as a Director of Post Oak Bank (privately-held bank, 2004-present). Previously, Mr. Wiley served as a member of the Board of Trustees of the University of Tulsa (2000-2006; 2007-2010), as a Senior Energy Advisor of Katzenbach Partners, LLC (consulting, 2006-2007), as an Advisory Director of Riverstone Holdings (private investment), Chairman, President, and CEO of Baker Hughes, Inc. (oilfield services, 2000-2004), and as Director of Spinnaker Exploration Company (exploration and production, 2001-2005). |
+ The information above includes each Trustee's principal occupation during the last five years and other information relating to the experience, attributes, and skills relevant to each Trustee's qualifications to serve as a Trustee, which led to the conclusion that each Trustee should serve as a Trustee for the fund.
Advisory Board Members and Executive Officers:
Correspondence intended for each executive officer, Edward C. Johnson 3d, and Peter S. Lynch may be sent to Fidelity Investments, 82 Devonshire Street, Boston, Massachusetts 02109.
Name, Age; Principal Occupation |
Edward C. Johnson 3d (80) |
| Year of Election or Appointment: 2011 Member of the Advisory Board of Fidelity's Equity and High Income Funds. Formerly Trustee and Chairman of the Board of Trustees of certain Trusts, Mr. Johnson serves as Chief Executive Officer, Chairman, and a Director of FMR LLC; Chairman and a Director of FMR; and Chairman and a Director of FMR Co., Inc. In addition, Mr. Johnson serves as Chairman and Director of FIL Limited. Previously, Mr. Johnson served as President of FMR LLC (2006-2007). |
Peter S. Lynch (66) |
| Year of Election or Appointment: 2003 Member of the Advisory Board of Fidelity's Equity and High Income Funds. Mr. Lynch is Vice Chairman and a Director of FMR and FMR Co., Inc. In addition, Mr. Lynch serves as a Trustee of Boston College and as the Chairman of the Inner-City Scholarship Fund. Previously, Mr. Lynch served on the Special Olympics International Board of Directors (1997-2006). |
Kenneth B. Robins (41) |
| Year of Election or Appointment: 2008 President and Treasurer of Fidelity's Equity and High Income Funds. Mr. Robins also serves as President and Treasurer (2010-present) and Assistant Treasurer (2009-present) of other Fidelity funds and is an employee of Fidelity Investments (2004-present). Previously, Mr. Robins served as Deputy Treasurer of the Fidelity funds (2005-2008) and Treasurer and Chief Financial Officer of The North Carolina Capital Management Trust: Cash and Term Portfolios (2006-2008). |
Bruce T. Herring (45) |
| Year of Election or Appointment: 2006 Vice President of certain Equity Funds. Mr. Herring also serves as Chief Investment Officer and Director of Fidelity Management & Research (U.K.) Inc. (2010-present) and Group Chief Investments Officer of FMR. Previously, Mr. Herring served as Vice President (2005-2006) and Senior Vice President (2006-2007) of Fidelity Management & Research Company, Vice President of FMR Co., Inc. (2001-2007) and as a portfolio manager for Fidelity U.S. Equity Funds. |
Brian B. Hogan (46) |
| Year of Election or Appointment: 2009 Vice President of certain Equity Funds and Vice President of Sector Funds. Mr. Hogan also serves as President of FMR's Equity Division (2009-present). Previously, Mr. Hogan served as Senior Vice President, Equity Research of FMR (2006-2009) and as a portfolio manager. |
Scott C. Goebel (42) |
| Year of Election or Appointment: 2008 Secretary and Chief Legal Officer (CLO) of the Fidelity funds. Mr. Goebel also serves as Secretary and CLO of The North Carolina Capital Management Trust: Cash and Term Portfolio (2008-present); General Counsel, Secretary, and Senior Vice President of FMR (2008-present) and FMR Co., Inc. (2008-present); Deputy General Counsel of FMR LLC; Chief Legal Officer of Fidelity Management & Research (Hong Kong) Limited (2008-present) and Assistant Secretary of Fidelity Management & Research (Japan) Inc. (2008-present), Fidelity Investments Money Management, Inc. (2008-present), Fidelity Management & Research (U.K.) Inc. (2008-present), and Fidelity Research and Analysis Company (2008-present). Previously, Mr. Goebel served as Assistant Secretary of the Funds (2007-2008) and as Vice President and Secretary of Fidelity Distributors Corporation (FDC) (2005-2007). |
William C. Coffey (41) |
| Year of Election or Appointment: 2009 Assistant Secretary of Fidelity's Equity and High Income Funds. Mr. Coffey also serves as Senior Vice President and Deputy General Counsel of FMR LLC (2010-present), and is an employee of Fidelity Investments. Previously, Mr. Coffey served as Vice President and Associate General Counsel of FMR LLC (2005-2009). |
Holly C. Laurent (56) |
| Year of Election or Appointment: 2008 Anti-Money Laundering (AML) Officer of the Fidelity funds. Ms. Laurent also serves as AML Officer of The North Carolina Capital Management Trust: Cash and Term Portfolio (2008-present) and is an employee of Fidelity Investments. Previously, Ms. Laurent was Senior Vice President and Head of Legal for Fidelity Business Services India Pvt. Ltd. (2006-2008), and Senior Vice President, Deputy General Counsel and Group Head for FMR LLC (2005-2006). |
Christine Reynolds (52) |
| Year of Election or Appointment: 2008 Chief Financial Officer of the Fidelity funds. Ms. Reynolds became President of Fidelity Pricing and Cash Management Services (FPCMS) in August 2008. Ms. Reynolds served as Chief Operating Officer of FPCMS (2007-2008). Previously, Ms. Reynolds served as President, Treasurer, and Anti-Money Laundering officer of the Fidelity funds (2004-2007). |
Kenneth A. Rathgeber (63) |
| Year of Election or Appointment: 2004 Chief Compliance Officer of Fidelity's Equity and High Income Funds. Mr. Rathgeber is Chief Compliance Officer of Fidelity Management & Research (Hong Kong) Limited (2008-present), Fidelity Management & Research (Japan) Inc. (2008-present), FMR (2005-present), FMR Co., Inc. (2005-present), Fidelity Management & Research (U.K.) Inc. (2005-present), Fidelity Research & Analysis Company (2005-present), Fidelity Investments Money Management, Inc. (2005-present), Pyramis Global Advisors, LLC (2005-present), and Strategic Advisers, Inc. (2005-present). |
Jeffrey S. Christian (49) |
| Year of Election or Appointment: 2009 Deputy Treasurer of the Fidelity funds. Mr. Christian is an employee of Fidelity Investments. Previously, Mr. Christian served as Chief Financial Officer (2008-2009) of certain Fidelity funds and Senior Vice President of Fidelity Pricing and Cash Management Services (FPCMS) (2004-2009). |
Bryan A. Mehrmann (49) |
| Year of Election or Appointment: 2005 Deputy Treasurer of the Fidelity funds. Mr. Mehrmann is an employee of Fidelity Investments. |
Adrien E. Deberghes (43) |
| Year of Election or Appointment: 2008 Deputy Treasurer of Fidelity's Equity and High Income Funds. Mr. Deberghes also serves as Assistant Treasurer of other Fidelity funds (2010-present) and is an employee of Fidelity Investments (2008-present). Previously, Mr. Deberghes served as Senior Vice President of Mutual Fund Administration at State Street Corporation (2007-2008), Senior Director of Mutual Fund Administration at Investors Bank & Trust (2005-2007), and Director of Finance for Dunkin' Brands (2000-2005). |
Stephanie J. Dorsey (41) |
| Year of Election or Appointment: 2010 Assistant Treasurer of Fidelity's Equity and High Income Funds. Ms. Dorsey also serves as Deputy Treasurer of other Fidelity funds (2008-present) and is an employee of Fidelity Investments (2008-present). Previously, Ms. Dorsey served as Treasurer (2004-2008) of the JPMorgan Mutual Funds and Vice President (2004-2008) of JPMorgan Chase Bank. |
John R. Hebble (52) |
| Year of Election or Appointment: 2009 Assistant Treasurer of Fidelity's Equity and High Income Funds. Mr. Hebble also serves as Treasurer and Chief Financial Officer of The North Carolina Capital Management Trust: Cash and Term Portfolio (2008-present), President and Treasurer of other Fidelity funds (2008-present) and is an employee of Fidelity Investments. |
Gary W. Ryan (52) |
| Year of Election or Appointment: 2005 Assistant Treasurer of the Fidelity funds. Mr. Ryan is an employee of Fidelity Investments. Previously, Mr. Ryan served as Vice President of Fund Reporting in Fidelity Pricing and Cash Management Services (FPCMS) (1999-2005). |
Jonathan Davis (42) |
| Year of Election or Appointment: 2010 Assistant Treasurer of the Fidelity funds. Mr. Davis is an employee of Fidelity Investments. Previously, Mr. Davis served as Vice President and Associate General Counsel of FMR LLC (2003-2010). |
Annual Report
The fund designates 93% of the dividend distributed during the fiscal year as qualifying for the dividends-received deduction for corporate shareholders.
The fund designates 94% of the dividend distributed during the fiscal year as amounts which may be taken into account as a dividend for the purposes of the maximum rate under section 1(h)(11) of the Internal Revenue Code.
The fund will notify shareholders in January 2011 of amounts for use in preparing 2010 income tax returns.
Annual Report
Board Approval of Investment Advisory Contracts and Management Fees
Fidelity Nasdaq Composite Index Fund
Each year, the Board of Trustees, including the Independent Trustees (together, the Board), votes on the renewal of the management contract and sub-advisory agreements (together, the Advisory Contracts) for the fund. The Board, assisted by the advice of fund counsel and Independent Trustees' counsel, requests and considers a broad range of information relevant to the renewal of the Advisory Contracts throughout the year.
The Board meets regularly and considers at each of its meetings factors that are relevant to its annual consideration of the renewal of the fund's Advisory Contracts, including the services and support provided to the fund and its shareholders. The Board has established various standing committees, each composed of Independent Trustees with varying backgrounds, to which the Board has assigned specific subject matter responsibilities in order to enhance effective decision-making by the Board. The Board, acting directly and through its Committees, requests and receives information concerning the annual consideration of the renewal of the fund's Advisory Contracts. The Board also meets as needed to consider matters specifically related to the Board's annual consideration of the renewal of Advisory Contracts. Members of the Board may also meet with trustees of other Fidelity funds through ad hoc joint committees to discuss certain matters relevant to the Fidelity funds.
At its July 2010 meeting, the Board of Trustees, including the Independent Trustees, unanimously determined to renew the fund's Advisory Contracts. In reaching its determination, the Board considered all factors it believed relevant, including (i) the nature, extent, and quality of the services to be provided to the fund and its shareholders (including the investment performance of the fund); (ii) the competitiveness of the fund's management fee and total expenses; (iii) the total costs of the services to be provided by and the profits to be realized by Fidelity from its relationship with the fund; (iv) the extent to which economies of scale would be realized as the fund grows; and (v) whether fee levels reflect these economies of scale, if any, for the benefit of fund shareholders.
In considering whether to renew the Advisory Contracts for the fund, the Board reached a determination, with the assistance of fund counsel and Independent Trustees' counsel and through the exercise of its business judgment, that the renewal of the Advisory Contracts is in the best interests of fund shareholders and that the compensation to be received by Fidelity under the management contract is fair and reasonable. The Board's decision to renew the Advisory Contracts was not based on any single factor noted above, but rather was based on a comprehensive consideration of all the information provided to the Board at its meetings throughout the year. The Board, in reaching its determination to renew the Advisory Contracts, is aware that shareholders in the fund have a broad range of investment choices available to them, including a wide choice among mutual funds offered by Fidelity's competitors, and that the fund's shareholders, with the opportunity to review and weigh the disclosure provided by the fund in its prospectus and other public disclosures, have chosen to invest in this fund, managed by Fidelity.
Annual Report
Board Approval of Investment Advisory Contracts and
Management Fees - continued
Nature, Extent, and Quality of Services Provided. The Board considered the staffing within the investment adviser, FMR, and the sub-advisers (together, the Investment Advisers), including the backgrounds of the fund's investment personnel and the fund's investment objective and discipline. The Independent Trustees also had discussions with senior management of Fidelity's investment operations and investment groups. The Board considered the structure of the portfolio manager compensation program and whether this structure provides appropriate incentives to act in the best interest of the fund.
Resources Dedicated to Investment Management and Support Services. The Board and the equity research subcommittee of the Board's Fund Oversight Committee reviewed the size, education, and experience of the Investment Advisers' investment staff, their use of technology, and the Investment Advisers' approach to recruiting, training, and retaining portfolio managers and other research, advisory, and management personnel. The Board noted FMR's continued focus on strengthening the organization and discipline of equity portfolio management and research.
Shareholder and Administrative Services. The Board considered (i) the nature, extent, quality, and cost of advisory, administrative, and shareholder services performed by the Investment Advisers and their affiliates under the Advisory Contracts and under separate agreements covering transfer agency, pricing and bookkeeping, and securities lending services for the fund; (ii) the nature and extent of the investment adviser's supervision of third party service providers, principally custodians and subcustodians; and (iii) the resources devoted to, and the record of compliance with, the fund's compliance policies and procedures. The Board also reviewed the allocation of fund brokerage, including allocations to brokers affiliated with the Investment Advisers.
The Board noted that the growth of fund assets over time across the complex allows Fidelity to reinvest in the development of services designed to enhance the value or convenience of the Fidelity funds as investment vehicles. These services include 24-hour access to account information and market information through phone representatives and over the Internet, and investor education materials and asset allocation tools.
Investment in a Large Fund Family. The Board considered the benefits to shareholders of investing in a Fidelity fund, including the benefits of investing in a fund that is part of a large family of funds offering a variety of investment disciplines and providing a large variety of mutual fund investor services. The Board noted that Fidelity had taken, or had made recommendations that resulted in the Fidelity funds taking, a number of actions over the previous year that benefited particular funds, including (i) dedicating additional resources to investment research and restructuring and broadening the focus of the investment research teams; (ii) bolstering the senior management team that oversees asset management; (iii) launching Class F of certain funds as a lower-fee class available to Freedom K and Freedom Index Funds; (iv) lowering the initial investment minimums and ongoing balance requirements for Real Estate High Income Fund; (v) eliminating subsequent purchase minimums for all funds and adding a waiver of the investment minimum requirement for new accounts opened with the proceeds of a systematic withdrawal plan; (vi) eliminating the withdrawal minimum and maximum limits for systematic withdrawals from Advisor funds; (vii) expanding sales load waivers on Class A shares for Destiny Planholders and expanding Institutional Class eligibility for Class O Destiny Planholders; and (viii) changing certain Class A and Class T sales charge structures to further align them with industry practices.
Annual Report
Investment Performance. The Board considered whether the fund has operated in accordance with its investment objective, as well as its record of compliance with its investment restrictions. It also reviewed the fund's absolute investment performance, as well as the fund's relative investment performance measured over multiple periods against a broad-based securities market index. The Board noted that FMR does not believe that a meaningful peer group exists against which to compare the fund's performance. The following charts considered by the Board show, over the one-, three-, and five-year periods ended December 31, 2009, the fund's cumulative total returns and the cumulative total returns of a broad-based securities market index ("benchmark").
Fidelity Nasdaq Composite Index Fund
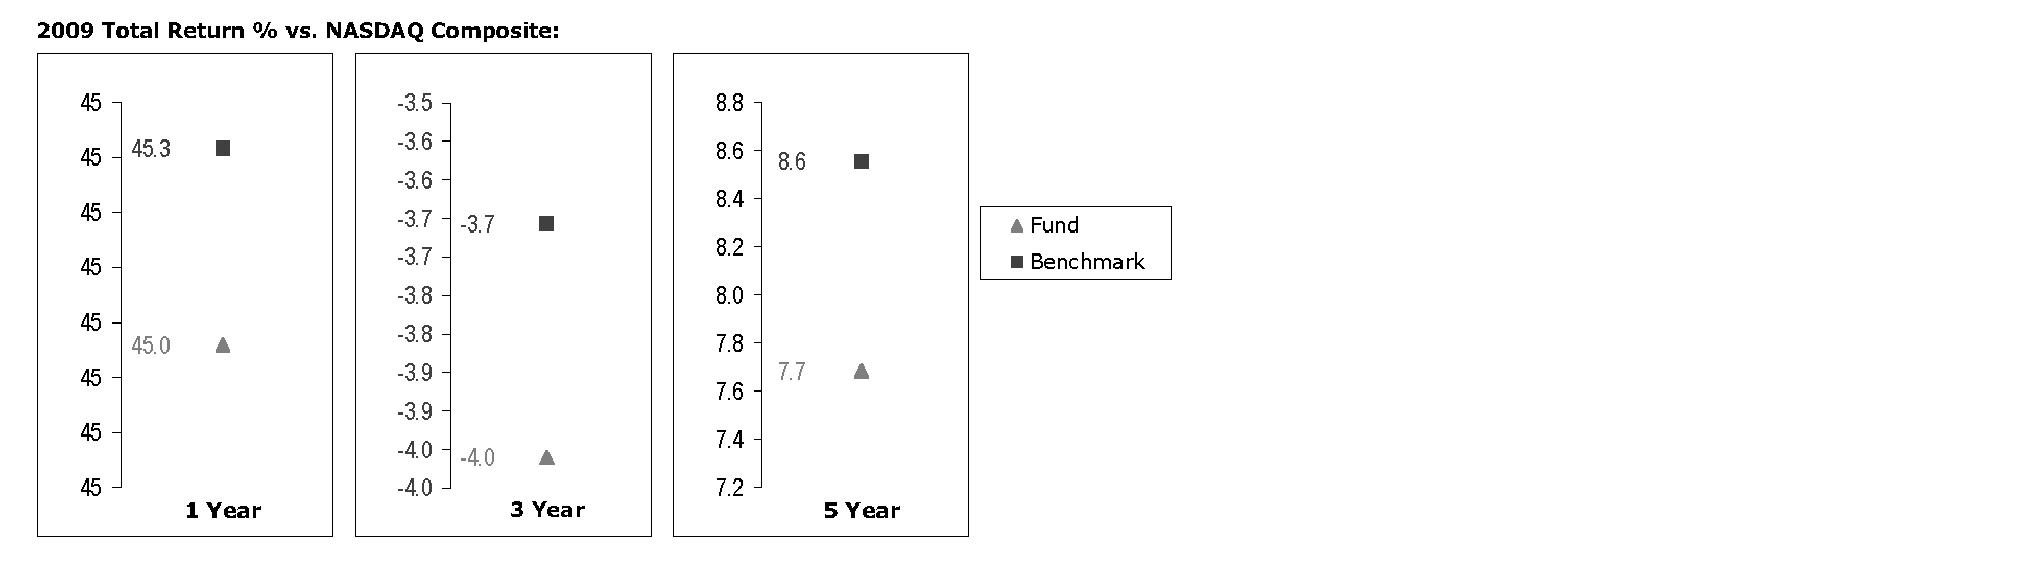
The Board noted that the investment performance of the fund was lower than its benchmark for all the periods shown, but considered that the performance of the fund and benchmark may vary due to valuation differences or due to fees and transaction costs, which apply to the fund but not to the benchmark. The Board also reviewed the fund's performance since inception as well as performance in the current year.
Annual Report
Board Approval of Investment Advisory Contracts and
Management Fees - continued
Based on its review, and giving particular weight to the nature and quality of the resources dedicated by the Investment Advisers to maintain and improve relative performance and factoring in the unprecedented market events in recent years, the Board concluded that the nature, extent, and quality of investment management and support services and of shareholder and administrative services provided to the fund will benefit the fund's shareholders, particularly in light of the Board's view that the fund's shareholders benefit from investing in a fund that is part of a large family of funds offering a variety of investment disciplines and services.
Competitiveness of Management Fee and Total Fund Expenses. The Board considered the fund's management fee and total expenses compared to "mapped groups" of competitive funds and classes. Fidelity creates "mapped groups" by combining similar Lipper investment objective categories that have comparable management fee characteristics. Combining Lipper investment objective categories aids the Board's management fee and total expense comparisons by broadening the competitive group used for comparison and by reducing the number of universes to which various Fidelity funds are compared.
Management Fee. The Board considered two proprietary management fee comparisons for the 12-month periods shown in the chart below. The group of Lipper funds used by the Board for management fee comparisons is referred to below as the "Total Mapped Group." The Total Mapped Group comparison focuses on a fund's standing relative to the total universe of comparable funds available to investors, in terms of gross management fees before expense reimbursements or caps. "TMG %" represents the percentage of funds in the Total Mapped Group that had management fees that were lower than the fund's. For example, a TMG % of 39% means that 61% of the funds in the Total Mapped Group had higher management fees than the fund. The "Asset-Size Peer Group" (ASPG) comparison focuses on a fund's standing relative to non-Fidelity funds similar in size to the fund within the Total Mapped Group. The ASPG represents at least 15% of the funds in the Total Mapped Group with comparable asset size and management fee characteristics, subject to a minimum of 50 funds (or all funds in the Total Mapped Group if fewer than 50). Additional information, such as the ASPG quartile in which the fund's management fee ranked, is also included in the chart and considered by the Board.
Annual Report
Fidelity Nasdaq Composite Index Fund
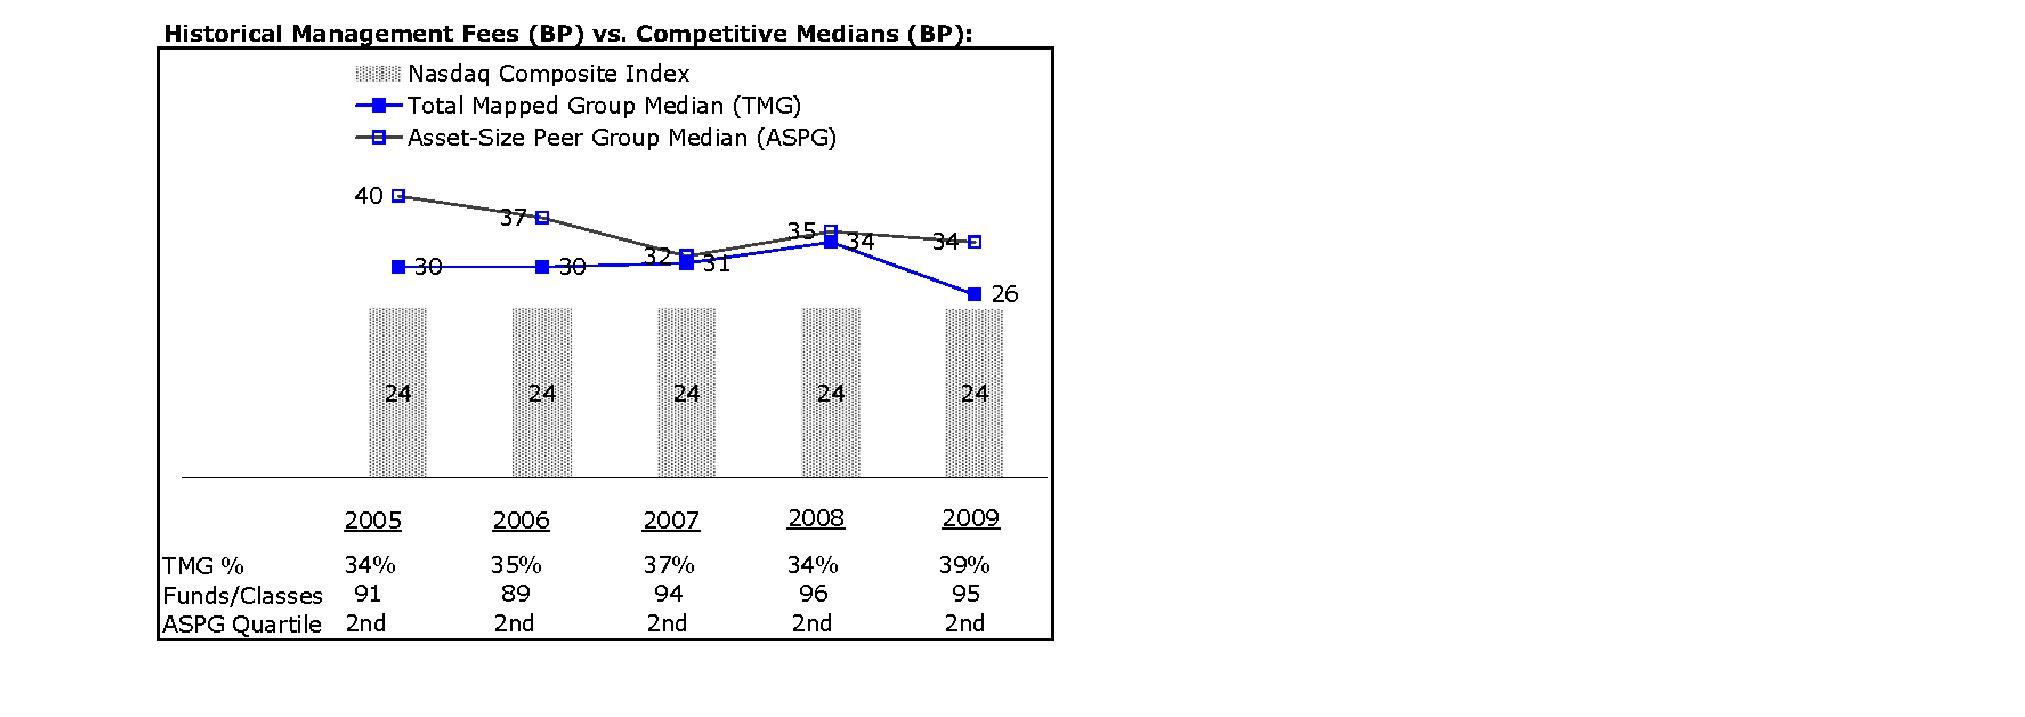
The Board noted that the fund's management fee ranked below the median of its Total Mapped Group and below the median of its ASPG for 2009.
Based on its review, the Board concluded that the fund's management fee is fair and reasonable in light of the services that the fund receives and the other factors considered.
Total Expenses. In its review of the fund's total expenses, the Board considered the fund's management fee as well as other fund expenses, such as transfer agent fees, pricing and bookkeeping fees, fund-paid 12b-1 fees, and custodial, legal, and audit fees. The Board also noted the effects of any waivers and reimbursements on fees and expenses. As part of its review, the Board also considered current and historical total expenses of the fund compared to competitive fund median expenses. The fund is compared to those funds and classes in the Total Mapped Group (used by the Board for management fee comparisons) that have a similar sales load structure.
The Board noted that the fund's total expenses ranked above its competitive median for 2009. The Board also considered that, following discussions with the Board, FMR contractually agreed to waive a portion of its management fee until January 31, 2011, to the extent necessary to maintain the fund's total operating expenses (excluding interest, taxes, certain securities lending costs, brokerage commissions, and extraordinary expenses) at 35 basis points.
Fees Charged to Other Fidelity Clients. The Board also considered Fidelity fee structures and other information with respect to clients of FMR and its affiliates, such as other mutual funds advised or subadvised by FMR or its affiliates, pension plan clients, and other institutional clients. In March 2010, the Board created an ad hoc joint committee with the board of other Fidelity funds (the Committee) to review and compare Fidelity's institutional investment advisory business with its business of providing services to the Fidelity funds, including the differences in services provided, fees charged, and costs incurred, as well as competition in their respective marketplaces.
Annual Report
Board Approval of Investment Advisory Contracts and
Management Fees - continued
Based on its review of total expenses and fees charged to other Fidelity clients, the Board concluded that the fund's total expenses were reasonable, although above the median of the universe presented for comparison, in light of the services that the fund and its shareholders receive and the other factors considered, including the findings of the Committee.
Costs of the Services and Profitability. The Board considered the revenues earned and the expenses incurred by Fidelity in conducting the business of developing, marketing, distributing, managing, administering and servicing the fund and its shareholders. The Board also considered the level of Fidelity's profits in respect of all the Fidelity funds.
On an annual basis, FMR presents to the Board Fidelity's profitability for the fund. Fidelity calculates the profitability for each fund, as well as aggregate profitability for groups of Fidelity funds and all Fidelity funds, using a series of detailed revenue and cost allocation methodologies which originate with the audited books and records of Fidelity. The Audit Committee of the Board reviews any significant changes from the prior year's methodologies.
PricewaterhouseCoopers LLP (PwC), independent registered public accounting firm and auditor to Fidelity and certain Fidelity funds, has been engaged annually by the Board as part of the Board's assessment of Fidelity's profitability analysis. PwC's engagement includes the review and assessment of Fidelity's methodologies used in determining the revenues and expenses attributable to Fidelity's mutual fund business, and completion of agreed-upon procedures surrounding the mathematical accuracy of fund profitability and its conformity to allocation methodologies. After considering PwC's reports issued under the engagement and information provided by Fidelity, the Board believes that while other allocation methods may also be reasonable, Fidelity's profitability methodologies are reasonable in all material respects.
The Board has also reviewed Fidelity's non-fund businesses and fall-out benefits related to the mutual fund business as well as cases where Fidelity's affiliates may benefit from or be related to the fund's business.
The Board considered the costs of the services provided by and the profits realized by Fidelity in connection with the operation of the fund and were satisfied that the profitability was not excessive in the circumstances.
Annual Report
Economies of Scale. The Board considered whether there have been economies of scale in respect of the management of the Fidelity funds, whether the Fidelity funds (including the fund) have appropriately benefited from any such economies of scale, and whether there is potential for realization of any further economies of scale. The Board considered the extent to which the fund will benefit from economies of scale through increased services to the fund, through waivers or reimbursements, or through fee or expense reductions.
In February 2009, the Board and the board of other Fidelity funds created an ad hoc committee (the Economies of Scale Committee) to analyze whether FMR attains economies of scale in respect of the management and servicing of the Fidelity funds, whether the Fidelity funds have appropriately benefited from such economies of scale, and whether there is potential for realization of any further economies of scale.
The Board concluded, considering the findings of the Economies of Scale Committee, that any potential economies of scale are being appropriately shared between fund shareholders and Fidelity.
Additional Information Requested by the Board. In order to develop fully the factual basis for consideration of the Fidelity funds' Advisory Contracts, the Board requested and received additional information on certain topics, including (i) fund performance trends, actions to be taken by FMR to improve certain funds' overall performance, and Fidelity's long-term strategies for certain funds; (ii) portfolio manager changes that have occurred during the past year and length of portfolio manager tenure for different categories of funds over time; (iii) Fidelity's compensation structure for portfolio managers, research analysts, and other key personnel, the rationale for the compensation structure, and how the compensation structure provides appropriate performance incentives; (iv) the amount of the investment that each portfolio manager has made in the Fidelity fund(s) that he or she manages; (v) management and other fees paid by FMR to affiliated sub-advisers on behalf of the Fidelity funds; (vi) Fidelity's fee structures and rationale for recommending different fees among different categories of funds; (vii) Fidelity's rationale for recommending which funds should have a performance adjustment component as part of their management fees; (viii) the rationale for any differences between fund fee structures and fee structures in place for other Fidelity clients; and (ix) explanations regarding the relative total expenses borne by certain funds and classes, total expense competitive trends, and actions that might be taken by FMR to reduce total expenses for certain funds and classes.
Based on its evaluation of all of the conclusions noted above, and after considering all factors it believed relevant, the Board ultimately concluded that the advisory fee structures are fair and reasonable, and that the fund's Advisory Contracts should be renewed.
Annual Report
Managing Your Investments
Fidelity offers several ways to conveniently manage your personal investments via your telephone or PC. You can access your account information, conduct trades and research your investments 24 hours a day.
By Phone
Fidelity Automated Service Telephone provides a single toll-free number to access account balances, positions, quotes and trading. It's easy to navigate the service, and on your first call, the system will help you create a personal identification number (PIN) for security.
(phone_graphic)
Fidelity Automated
Service Telephone (FAST®)
1-800-544-5555
Press
 For mutual fund and brokerage trading.
 For quotes.*
 For account balances and holdings.
 To review orders and mutual
fund activity.
 To change your PIN.

 To speak to a Fidelity representative.
By PC
Fidelity's web site on the Internet provides a wide range of information, including daily financial news, fund performance, interactive planning tools and news about Fidelity products and services.
(computer_graphic)
Fidelity's Web Site
www.fidelity.com
* When you call the quotes line, please remember that a fund's yield and return will vary and, except for money market funds, share price will also vary. This means that you may have a gain or loss when you sell your shares. There is no assurance that money market funds will be able to maintain a stable $1 share price; an investment in a money market fund is not insured or guaranteed by the U.S. government. Total returns are historical and include changes in share price, reinvestment of dividends and capital gains distributions, and the effects of any sales charges.
Annual Report
To Visit Fidelity
For directions and hours,
please call 1-800-544-9797.
Arizona
7001 West Ray Road
Chandler, AZ
15445 N. Scottsdale Road
Scottsdale, AZ
17550 North 75th Avenue
Glendale, AZ
5330 E. Broadway Blvd
Tucson, AZ
California
815 East Birch Street
Brea, CA
1411 Chapin Avenue
Burlingame, CA
851 East Hamilton Avenue
Campbell, CA
601 Larkspur Landing Circle
Larkspur, CA
2000 Avenue of the Stars
Los Angeles, CA
27101 Puerta Real
Mission Viejo, CA
73575 El Paseo
Palm Desert, CA
251 University Avenue
Palo Alto, CA
123 South Lake Avenue
Pasadena, CA
16656 Bernardo Ctr. Drive
Rancho Bernardo, CA
1220 Roseville Parkway
Roseville, CA
1740 Arden Way
Sacramento, CA
7676 Hazard Center Drive
San Diego, CA
11943 El Camino Real
San Diego, CA
8 Montgomery Street
San Francisco, CA
3793 State Street
Santa Barbara, CA
1200 Wilshire Boulevard
Santa Monica, CA
398 West El Camino Real
Sunnyvale, CA
111 South Westlake Blvd
Thousand Oaks, CA
21701 Hawthorne Boulevard
Torrance, CA
2001 North Main Street
Walnut Creek, CA
6326 Canoga Avenue
Woodland Hills, CA
2211 Michelson Drive
Irvine, CA
Colorado
281 East Flatiron Circle
Broomfield, CO
1625 Broadway
Denver, CO
9185 Westview Road
Lone Tree, CO
Connecticut
48 West Putnam Avenue
Greenwich, CT
265 Church Street
New Haven, CT
300 Atlantic Street
Stamford, CT
29 South Main Street
West Hartford, CT
1261 Post Road
Fairfield, CT
Delaware
400 Delaware Avenue
Wilmington, DE
Florida
175 East Altamonte Drive
Altamonte Springs, FL
1400 Glades Road
Boca Raton, FL
121 Alhambra Plaza
Coral Gables, FL
2948 N. Federal Highway
Ft. Lauderdale, FL
4671 Town Center Parkway
Jacksonville, FL
8880 Tamiami Trail, North
Naples, FL
230 Royal Palm Way
Palm Beach, FL
3501 PGA Boulevard
Palm Beach Gardens, FL
3550 Tamiami Trail, South
Sarasota, FL
1502 N. Westshore Blvd.
Tampa, FL
2465 State Road 7
Wellington, FL
Georgia
3242 Peachtree Road
Atlanta, GA
1000 Abernathy Road
Atlanta, GA
Illinois
One North LaSalle Street
Chicago, IL
401 North Michigan Avenue
Chicago, IL
One Skokie Valley Road
Highland Park, IL
1415 West 22nd Street
Oak Brook, IL
15105 S LaGrange Road
Orland Park, IL
1572 East Golf Road
Schaumburg, IL
1823 Freedom Drive
Naperville, IL
Indiana
8480 Keystone Crossing
Indianapolis, IN
Kansas
5400 College Boulevard
Overland Park, KS
Maine
Three Canal Plaza
Portland, ME
Maryland
7315 Wisconsin Avenue
Bethesda, MD
610 York Road
Towson, MD
Massachusetts
801 Boylston Street
Boston, MA
155 Congress Street
Boston, MA
300 Granite Street
Braintree, MA
44 Mall Road
Burlington, MA
238 Main Street
Cambridge, MA
200 Endicott Street
Danvers, MA
Fidelity Brokerage Services, Inc., 100 Summer St., Boston, MA 02110 Member NYSE/SIPC
Annual Report
405 Cochituate Road
Framingham, MA
551 Boston Turnpike
Shrewsbury, MA
Michigan
500 E. Eisenhower Pkwy.
Ann Arbor, MI
280 N. Old Woodward Ave.
Birmingham, MI
30200 Northwestern Hwy.
Farmington Hills, MI
43420 Grand River Avenue
Novi, MI
3480 28th Street
Grand Rapids, MI
2425 S. Linden Road STE E
Flint, MI
Minnesota
7740 France Avenue South
Edina, MN
8342 3rd Street North
Oakdale, MN
Missouri
1524 South Lindbergh Blvd.
St. Louis, MO
Nevada
2225 Village Walk Drive
Henderson, NV
New Jersey
501 Route 73 South
Marlton, NJ
150 Essex Street
Millburn, NJ
35 Morris Street
Morristown, NJ
396 Route 17, North
Paramus, NJ
3518 Route 1 North
Princeton, NJ
530 Broad Street
Shrewsbury, NJ
New Mexico
2261 Q Street NE
Albuquerque, NM
New York
1130 Franklin Avenue
Garden City, NY
37 West Jericho Turnpike
Huntington Station, NY
1271 Avenue of the Americas
New York, NY
980 Madison Avenue
New York, NY
61 Broadway
New York, NY
350 Park Avenue
New York, NY
200 Fifth Avenue
New York, NY
733 Third Avenue
New York, NY
2070 Broadway
New York, NY
1075 Northern Blvd.
Roslyn, NY
799 Central Park Avenue
Scarsdale, NY
3349 Monroe Avenue
Rochester, NY
North Carolina
4611 Sharon Road
Charlotte, NC
7011 Fayetteville Road
Durham, NC
Ohio
3805 Edwards Road
Cincinnati, OH
1324 Polaris Parkway
Columbus, OH
1800 Crocker Road
Westlake, OH
28699 Chagrin Boulevard
Woodmere Village, OH
Oregon
7493 SW Bridgeport Road
Tigard, OR
Pennsylvania
600 West DeKalb Pike
King of Prussia, PA
1735 Market Street
Philadelphia, PA
12001 Perry Highway
Wexford, PA
Rhode Island
10 Memorial Boulevard
Providence, RI
Tennessee
3018 Peoples Street
Johnson City, TN
7628 West Farmington Blvd.
Germantown, TN
2035 Mallory Lane
Franklin, TN
Texas
10000 Research Boulevard
Austin, TX
4001 Northwest Parkway
Dallas, TX
12532 Memorial Drive
Houston, TX
2701 Drexel Drive
Houston, TX
6560 Fannin Street
Houston, TX
1701 Lake Robbins Drive
The Woodlands, TX
6500 N. MacArthur Blvd.
Irving, TX
6005 West Park Boulevard
Plano, TX
1576 East Southlake Blvd.
Southlake, TX
15600 Southwest Freeway
Sugar Land, TX
139 N. Loop 1604 East
San Antonio, TX
Utah
279 West South Temple
Salt Lake City, UT
Virginia
1861 International Drive
McLean, VA
11957 Democracy Drive
Reston, VA
Washington
10500 NE 8th Street
Bellevue, WA
1518 6th Avenue
Seattle, WA
304 Strander Blvd
Tukwila, WA
Washington, DC
1900 K Street, N.W.
Washington, DC
Wisconsin
16020 West Bluemound Road
Brookfield, WI
Annual Report
To Write Fidelity
We'll give your correspondence immediate attention and send you written confirmation upon completion of your request.
(letter_graphic)
Making Changes
To Your Account
(such as changing name, address, bank, etc.)
Fidelity Investments
P.O. Box 770001
Cincinnati, OH 45277-0002
(letter_graphic)
For Non-Retirement
Accounts
Buying shares
Fidelity Investments
P.O. Box 770001
Cincinnati, OH 45277-0003
Overnight Express
Fidelity Investments
Attn: Distribution Services
100 Crosby Parkway - KC1H
Covington, KY 41015
Selling shares
Fidelity Investments
P.O. Box 770001
Cincinnati, OH 45277-0035
Overnight Express
Fidelity Investments
Attn: Distribution Services
100 Crosby Parkway - KC1H
Covington, KY 41015
General Correspondence
Fidelity Investments
P.O. Box 500
Merrimack, NH 03054-0500
(letter_graphic)
For Retirement
Accounts
Buying shares
Fidelity Investments
P.O. Box 770001
Cincinnati, OH 45277-0003
Selling shares
Fidelity Investments
P.O. Box 770001
Cincinnati, OH 45277-0035
Overnight Express
Fidelity Investments
Attn: Distribution Services
100 Crosby Parkway - KC1H
Covington, KY 41015
General Correspondence
Fidelity Investments
P.O. Box 500
Merrimack, NH 03054-0500
Annual Report
Investment Adviser
Fidelity Management & Research Company
Boston, MA
Investment Sub-Advisers
FMR Co., Inc.
Geode Capital Management, LLC
General Distributor
Fidelity Distributors Corporation
Boston, MA
Transfer and Service Agents
Fidelity Investments Institutional Operations Company, Inc.
Boston, MA
Fidelity Service Company, Inc.
Boston, MA
Custodian
JPMorgan Chase Bank
New York, NY
The Fidelity Telephone Connection
Mutual Fund 24-Hour Service
Exchanges/Redemptions
and Account Assistance 1-800-544-6666
Product Information 1-800-544-6666
Retirement Accounts 1-800-544-4774
(8 a.m. - 9 p.m.)
TDD Service 1-800-544-0118
for the deaf and hearing impaired
(9 a.m. - 9 p.m. Eastern time)
Fidelity Automated Service
Telephone (FAST®)
1-800-544-5555
Automated line for quickest service
EIF-UANN-0111
1.795563.107

Fidelity®
Nasdaq Composite® Index Tracking Stock
Annual Report
November 30, 2010
(2_fidelity_logos) (Registered_Trademark)
Contents
Chairman's Message | <Click Here> | The Chairman's message to shareholders. |
Performance | <Click Here> | How the fund has done over time. |
Management's Discussion of Fund Performance | <Click Here> | The Portfolio Manager's review of fund performance and strategy. |
Premium/Discount Analysis | <Click Here> | Information regarding the fund's NAV and market price. |
Shareholder Expense Example | <Click Here> | An example of shareholder expenses. |
Investment Changes | <Click Here> | A summary of major shifts in the fund's investments over the past six months. |
Investments | <Click Here> | A complete list of the fund's investments with their market values. |
Financial Statements | <Click Here> | Statements of assets and liabilities, operations, and changes in net assets, as well as financial highlights. |
Notes | <Click Here> | Notes to the financial statements. |
Report of Independent Registered Public Accounting Firm | <Click Here> | |
Trustees and Officers | <Click Here> | |
Distributions | <Click Here> | |
Board Approval of Investment Advisory Contracts and Management Fees | <Click Here> | |
To view a fund's proxy voting guidelines and proxy voting record for the 12-month period ended June 30, visit http://www.fidelity.com/proxyvotingresults or visit the Securities and Exchange Commission's (SEC) web site at http://www.sec.gov. You may also call 1-800-FIDELITY to request a free copy of the proxy voting guidelines.
Nasdaq®, OMX®, NASDAQ OMX®, Nasdaq Composite® and The Nasdaq Stock Market®, Inc. are registered trademarks of The NASDAQ OMX Group, Inc. (which with its Affiliates are the Corporations) and are licensed for use by Fidelity. The product has not been passed on by the Corporations as to its legality or suitability. The product is not issued, endorsed or sold by the Corporations. The Corporations make no warranties and bear no liability with respect to shares of the product.
Standard & Poor's, S&P and S&P 500 are registered service marks of The McGraw-Hill Companies, Inc. and have been licensed for use by Fidelity Distributors Corporation.
Other third party marks appearing herein are the property of their respective owners.
Annual Report
All other marks appearing herein are registered or unregistered trademarks or service marks of FMR LLC or an affiliated company.
This report and the financial statements contained herein are submitted for the general information of the shareholders of the fund. This report is not authorized for distribution to prospective investors in the fund unless preceded or accompanied by an effective prospectus.
A fund files its complete schedule of portfolio holdings with the SEC for the first and third quarters of each fiscal year on Form N-Q. Forms N-Q are available on the SEC's web site at http://www.sec.gov. A fund's Forms N-Q may be reviewed and copied at the SEC's Public Reference Room in Washington, DC. Information regarding the operation of the SEC's Public Reference Room may be obtained by calling 1-800-SEC-0330. For a complete list of a fund's portfolio holdings, view the most recent holdings listing, semiannual report, or annual report on Fidelity's web site at http://www.fidelity.com, http://www.advisor.fidelity.com, or http://www.401k.com, as applicable.
NOT FDIC INSURED • MAY LOSE VALUE • NO BANK GUARANTEE
Neither the fund nor Fidelity Distributors Corporation is a bank.
Annual Report
(photo_of_James_C_Curvey)
Dear Shareholder:
Equities have staged a rally in the second half of 2010, shaking off concerns about the European debt crisis and the possibility of a double-dip recession in the U.S. Although the short-term surge pushed major equity indexes back into positive territory for the year, several questions remain about the longer-term outlook, including lackluster economic growth and persistently high unemployment. Financial markets are always unpredictable, of course, but there also are several time-tested investment principles that can help put the odds in your favor.
One of the basic tenets is to invest for the long term. Over time, riding out the markets' inevitable ups and downs has proven much more effective than selling into panic or chasing the hottest trend. Even missing only a few of the markets' best days can significantly diminish investor returns. Patience also affords the benefits of compounding - of earning interest on additional income or reinvested dividends and capital gains. There can be tax advantages and cost benefits to consider as well. While staying the course doesn't eliminate risk, it can considerably lessen the effect of short-term declines.
You can further manage your investing risk through diversification. And today, more than ever, geographic diversification should be taken into account. Studies indicate that asset allocation is the single most important determinant of a portfolio's long-term success. The right mix of stocks, bonds and cash - aligned to your particular risk tolerance and investment objective - is very important. Age-appropriate rebalancing is also an essential aspect of asset allocation. For younger investors, an emphasis on equities - which historically have been the best-performing asset class over time - is encouraged. As investors near their specific goal, such as retirement or sending a child to college, consideration may be given to replacing volatile assets (e.g. common stocks) with more-stable fixed investments (bonds or savings plans).
A third principle - investing regularly - can help lower the average cost of your purchases. Investing a certain amount of money each month or quarter helps ensure you won't pay for all your shares at market highs. This strategy - known as dollar cost averaging - also reduces "emotion" from investing, helping shareholders avoid selling weak performers just prior to an upswing, or chasing a hot performer just before a correction.
We invite you to contact us via the Internet, through our Investor Centers or by phone. It is our privilege to provide you the information you need to make the investments that are right for you.
Sincerely,
(The acting chairman's signature appears here.)
James C. Curvey
Acting Chairman
Annual Report
The fund's net asset value per share (NAV) performance is based on the NAV calculated each business day. It is calculated in accordance with the standard formula for valuing mutual fund shares as of the close of regular trading hours on The Nasdaq Stock Market, normally 4:00 p.m. Eastern time (or NYSE if NASDAQ is closed). The fund's market price performance is based on the daily closing price of the shares of the fund on The Nasdaq Stock Market.
Cumulative total returns reflect performance over the period shown generally by adding one year's return - positive or negative - to the next year's return. NAV and closing market price average annual returns reflect the change in the value of an investment, assuming reinvestment of the fund's distributions from dividend income and capital gains (the profits earned upon the sale of securities that have grown in value, if any), at NAV and Market Price, respectively, and assumes a constant rate of performance each year. The $10,000 table and the fund's returns do not reflect the deduction of taxes that a shareholder would pay on fund distributions or the redemption or selling of fund shares. How a fund did yesterday is no guarantee of how it will do tomorrow.
Cumulative Total Returns
Periods ended November 30, 2010 | Past 1
year | Past 5
years | Life of
fund A |
Fidelity® Nasdaq Composite® Index Tracking Stock -
NAV | 17.35% | 15.73% | 42.86% |
Fidelity Nasdaq Composite Index Tracking Stock -
Market Price | 17.73% | 15.79% | 42.77% |
Nasdaq Composite® Index | 17.58% | 16.62% | 45.35% |
Average Annual Total Returns
Periods ended November 30, 2010 | Past 1
year | Past 5
years | Life of
fund A |
Fidelity Nasdaq Composite Index Tracking Stock -
NAV | 17.35% | 2.97% | 5.09% |
Fidelity Nasdaq Composite Index Tracking Stock -
Market Price | 17.73% | 2.98% | 5.08% |
A From September 25, 2003.
Annual Report
$10,000 Over Life of Fund
Let's say hypothetically that $10,000 was invested in Fidelity® Nasdaq Composite® Index Tracking Stock - NAV on September 25, 2003, when the fund started. The chart shows how the value of your investment would have changed, and also shows how the Nasdaq Composite® Index performed over the same period.
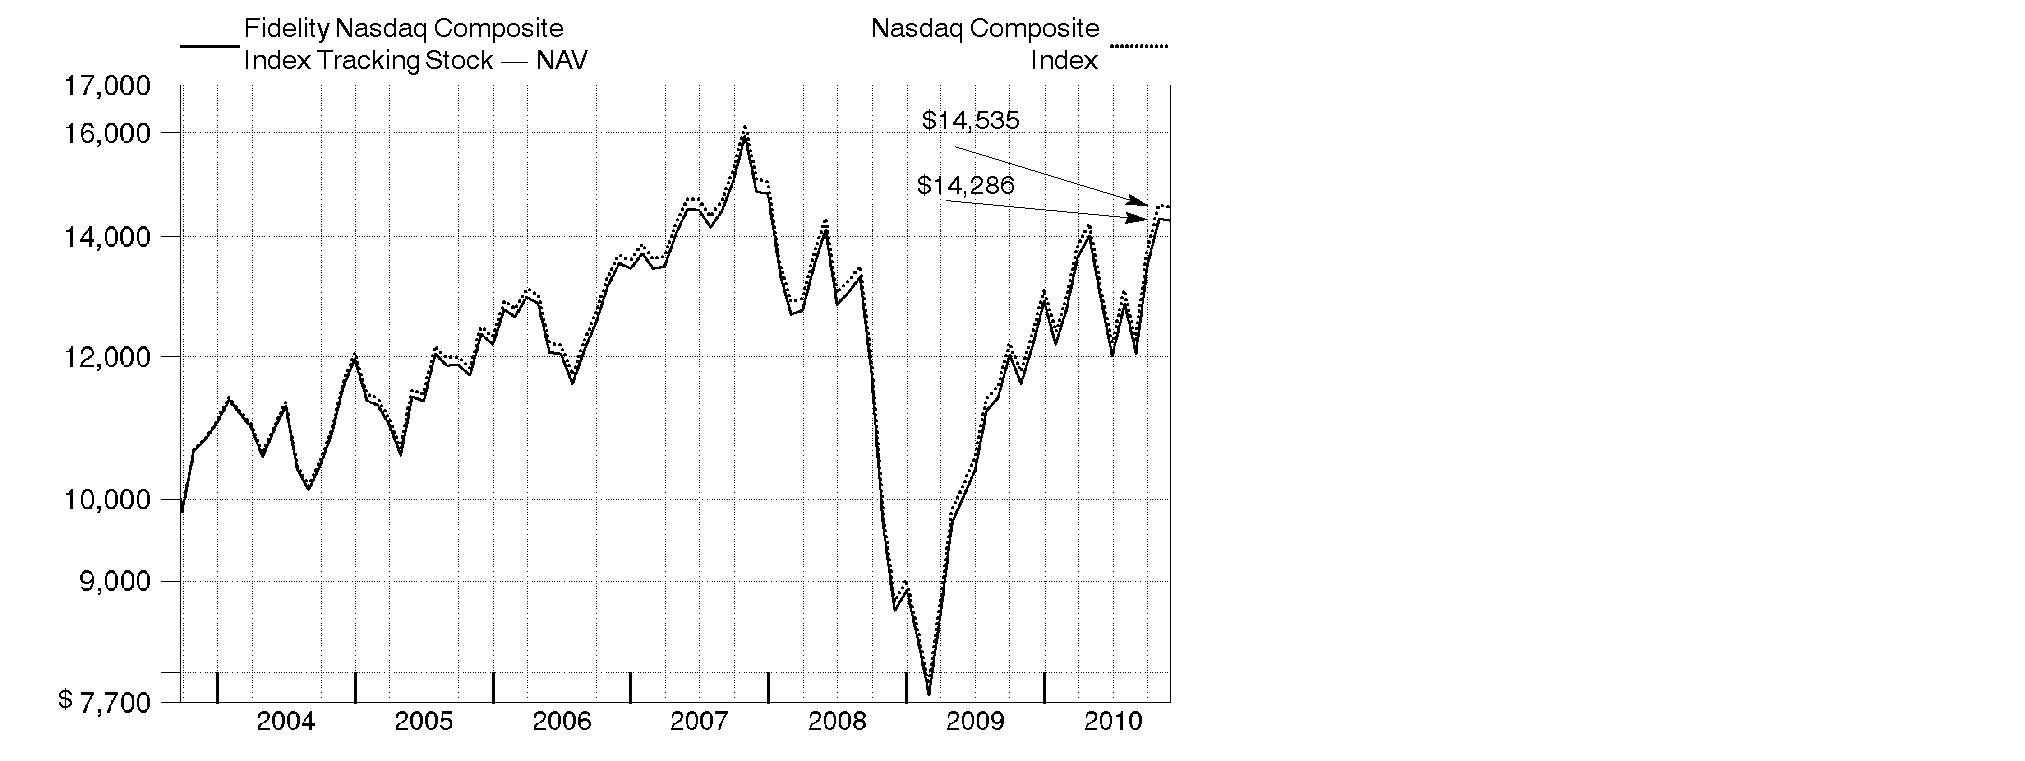
Annual Report
Market Recap: Despite bouts of volatility and concern over European debt woes, major U.S. stock markets recorded solid gains for the year ending November 30, 2010, lifted by economic optimism, encouraging earnings reports and a wave of corporate mergers. Stocks extended their 2009 upswing in the first five months of the period on signs the Great Recession was over. However, high unemployment in the U.S. and sovereign debt problems in Europe sent equities falling during the spring. Markets vacillated for much of the summer before regaining momentum in the fall, with the large-cap S&P 500® Index posting its best September/October performance since 1998. By November, however, Ireland's debt took center stage, along with slower growth in China and additional quantitative easing in the U.S., unnerving investors and cooling down markets. For the full 12 months, the S&P 500® rose 9.94%, while the blue-chip-laden Dow Jones Industrial AverageSM added 9.33%. Both were bested by the technology-heavy Nasdaq Composite® Index, which advanced 17.58%. Overall, it was a broad-based rally, with economically sensitive sectors among the biggest gainers. Stocks of mid- and small-sized companies fared better than their larger-cap counterparts, advancing 24.04% and 26.98%, respectively, as measured by the Russell Midcap® and Russell 2000® indexes.
Comments from Jeffrey Adams, who oversees Fidelity® Nasdaq Composite® Index Tracking Stock's investment management team as Head of Indexing for Geode Capital Management, LLC: For the year, the fund returned 17.35%, in line with the Nasdaq Composite Index. The fund's market price returned 17.73%. Personal computer and consumer-electronics maker Apple was the top contributor, as its stock gained more than 55% on strong sales. Oracle, a database-software manufacturer, benefited from good sales and profit growth, while Baidu.com, the leading Internet search company in China, and leading semiconductor maker Intel also contributed. Apart from technology, several television-service providers made notable contributions, including Comcast and DIRECTV. Much-better-than-expected earnings lifted shares of "name your own price" travel agency Priceline.com. In contrast, the biggest detractors were software giant Microsoft and networking equipment maker Cisco Systems. Internet search company Google lost modest ground, while digital publishing software company Adobe Systems experienced a sharp share-price drop in September. Elsewhere, biotechnology stocks Gilead Sciences and Amgen declined. For-profit education provider Apollo Group, operator of the online University of Phoenix, saw its shares fall on concerns about government regulation of the for-profit education industry. Semiconductor device manufacturer Micron Technology also struggled.
The views expressed above reflect those of the portfolio manager(s) only through the end of the period as stated on the cover of this report and do not necessarily represent the views of Fidelity or any other person in the Fidelity organization. Any such views are subject to change at any time based upon market or other conditions and Fidelity disclaims any responsibility to update such views. These views may not be relied on as investment advice and, because investment decisions for a Fidelity fund are based on numerous factors, may not be relied on as an indication of trading intent on behalf of any Fidelity fund.
Annual Report
Shares of Fidelity® Nasdaq Composite® Index Tracking Stock (the fund) are listed on The Nasdaq Stock Market® and can be bought and sold on the secondary market at market prices. Although the market price is expected to approximate the fund's NAV, it is possible that the market price and NAV will vary significantly. The closing market price is the daily closing price as reported on The Nasdaq Stock Market.
Premiums or discounts are the differences (expressed as a basis point differential with 1 basis point equaling 1/100 of 1%) between the fund's NAV and closing market price. A premium indicates that the closing market price is trading above the NAV. A discount indicates that the closing market price is trading below the NAV. A discrepancy may exist with respect to the timing of when the NAV is calculated and the determination of the closing market price.
The chart below presents information about the differences between the fund's daily closing market price and the fund's NAV.
Period Ended November 30, 2010
From December 1, 2005 | | | |
to November 30, 2010 | Closing Price
Below NAV | Closing Price Above
or Equal to NAV |
| Basis Point Differential | Number of
Days | % of Total
Days | Number of
Days | % of Total
Days |
| 0 - <25 | 572 | 45.47% | 431 | 34.26% |
| 25 - <50 | 95 | 7.55% | 55 | 4.37% |
| 50 - <75 | 26 | 2.07% | 26 | 2.07% |
| 75 - <100 | 10 | 0.79% | 9 | 0.72% |
| 100 or above | 16 | 1.27% | 18 | 1.43% |
| Total | 719 | 57.15% | 539 | 42.85% |
Annual Report
Shareholder Expense Example
As a shareholder of the Fund, you incur two types of costs: (1) transaction costs, and (2) ongoing costs, including management fees, distribution and/or service (12b-1) fees and other Fund expenses. This Example is intended to help you understand your ongoing costs (in dollars) of investing in the Fund and to compare these costs with the ongoing costs of investing in other mutual funds.
The Example is based on an investment of $1,000 invested at the beginning of the period and held for the entire period (June 1, 2010 to November 30, 2010).
Actual Expenses
The first line of the accompanying table provides information about actual account values and actual expenses. You may use the information in this line, together with the amount you invested, to estimate the expenses that you paid over the period. Simply divide your account value by $1,000.00 (for example, an $8,600 account value divided by $1,000.00 = 8.6), then multiply the result by the number in the first line under the heading entitled "Expenses Paid During Period" to estimate the expenses you paid on your account during this period. In addition, the Fund, as a shareholder in the underlying Fidelity Central Funds, will indirectly bear its pro-rata share of the fees and expenses incurred by the underlying Fidelity Central Funds. These fees and expenses are not included in the Fund's annualized expense ratio used to calculate the expense estimate in the table below.
Hypothetical Example for Comparison Purposes
The second line of the accompanying table provides information about hypothetical account values and hypothetical expenses based on the Fund's actual expense ratio and an assumed rate of return of 5% per year before expenses, which is not the Fund's actual return. The hypothetical account values and expenses may not be used to estimate the actual ending account balance or expenses you paid for the period. You may use this information to compare the ongoing costs of investing in the Fund and other funds. To do so, compare this 5% hypothetical example with the 5% hypothetical examples that appear in the shareholder reports of the other funds. In addition, the Fund, as a shareholder in the underlying Fidelity Central Funds, will indirectly bear its pro-rata share of the fees and expenses incurred by the underlying Fidelity Central Funds. These fees and expenses are not included in the Fund's annualized expense ratio used to calculate the expense estimate in the table below.
Please note that the expenses shown in the table are meant to highlight your ongoing costs only and do not reflect any transaction costs. Therefore, the second line of the table is useful in comparing ongoing costs only, and will not help you determine the relative total costs of owning different funds.
Annual Report
Shareholder Expense Example - continued
| Annualized
Expense Ratio | Beginning
Account Value
June 1, 2010 | Ending
Account Value
November 30, 2010 | Expenses Paid
During Period*
June 1, 2010
to November 30, 2010 |
Actual | .30% | $ 1,000.00 | $ 1,111.40 | $ 1.59 |
Hypothetical (5% return per year before expenses) | | $ 1,000.00 | $ 1,023.56 | $ 1.52 |
* Expenses are equal to the Fund's annualized expense ratio, multiplied by the average account value over the period, multiplied by 183/365 (to reflect the one-half year period).
Annual Report
Investment Changes (Unaudited)
Top Ten Stocks as of November 30, 2010 |
| % of fund's
net assets | % of fund's net assets
6 months ago |
Apple, Inc. | 7.5 | 6.8 |
Microsoft Corp. | 5.8 | 6.6 |
Google, Inc. Class A | 3.6 | 3.5 |
Oracle Corp. | 3.6 | 3.3 |
Intel Corp. | 3.1 | 3.5 |
Cisco Systems, Inc. | 2.9 | 3.9 |
Amazon.com, Inc. | 2.1 | 1.7 |
QUALCOMM, Inc. | 2.0 | 1.8 |
Amgen, Inc. | 1.4 | 1.5 |
Comcast Corp. Class A | 1.1 | 1.1 |
| 33.1 | |
Market Sectors as of November 30, 2010 |
| % of fund's
net assets | % of fund's net assets
6 months ago |
Information Technology | 52.5 | 51.7 |
Consumer Discretionary | 15.4 | 14.6 |
Health Care | 12.9 | 14.2 |
Financials | 7.1 | 7.7 |
Industrials | 5.3 | 5.6 |
Consumer Staples | 2.1 | 1.9 |
Telecommunication Services | 1.7 | 1.6 |
Energy | 1.6 | 1.3 |
Materials | 1.2 | 1.1 |
Utilities | 0.1 | 0.1 |
Asset Allocation (% of fund's net assets) |
To match the Nasdaq Composite Index, Fidelity Nasdaq Composite Index Tracking Stock seeks 100% investment exposure to stocks at all times. |
Annual Report
Investments November 30, 2010
Showing Percentage of Net Assets
Common Stocks - 99.9% |
| Shares | | Value |
CONSUMER DISCRETIONARY - 15.4% |
Auto Components - 0.2% |
Amerigon, Inc. (a) | 1,126 | | $ 11,823 |
Ballard Power Systems, Inc. (a)(d) | 4,911 | | 6,410 |
China Automotive Systems, Inc. (a)(d) | 976 | | 14,591 |
China XD Plastics Co. Ltd. (a) | 1,500 | | 8,175 |
Dorman Products, Inc. (a) | 813 | | 32,122 |
Exide Technologies (a) | 2,941 | | 24,057 |
Federal-Mogul Corp. Class A (a) | 3,831 | | 71,640 |
Fuel Systems Solutions, Inc. (a) | 788 | | 27,233 |
Gentex Corp. | 5,425 | | 113,871 |
Quantum Fuel Systems Technologies Worldwide, Inc. (a) | 7,301 | | 3,786 |
Shiloh Industries, Inc. (a) | 795 | | 8,848 |
SORL Auto Parts, Inc. (a) | 706 | | 6,531 |
Spartan Motors, Inc. | 1,617 | | 8,554 |
Wonder Auto Technology, Inc. (a)(d) | 1,170 | | 9,746 |
| | 347,387 |
Automobiles - 0.1% |
Kandi Technologies Corp. (a) | 1,230 | | 7,048 |
Tesla Motors, Inc. (a)(d) | 3,525 | | 124,538 |
| | 131,586 |
Distributors - 0.1% |
Audiovox Corp. Class A (a) | 1,512 | | 10,357 |
Core-Mark Holding Co., Inc. (a) | 470 | | 17,014 |
LKQ Corp. (a) | 5,616 | | 121,165 |
Weyco Group, Inc. | 600 | | 14,526 |
| | 163,062 |
Diversified Consumer Services - 0.5% |
American Public Education, Inc. (a) | 786 | | 26,858 |
Apollo Group, Inc. Class A (non-vtg.) (a) | 5,838 | | 198,492 |
Cambium Learning Group, Inc. (a) | 1,422 | | 4,238 |
Capella Education Co. (a) | 696 | | 38,134 |
Career Education Corp. (a) | 3,323 | | 59,116 |
ChinaCast Education Corp. (a) | 1,400 | | 10,864 |
Coinstar, Inc. (a) | 1,281 | | 82,548 |
Corinthian Colleges, Inc. (a)(d) | 3,336 | | 13,778 |
Education Management Corp. (a)(d) | 5,400 | | 76,248 |
Global Education & Technology Group Ltd. ADR (a) | 330 | | 3,020 |
Grand Canyon Education, Inc. (a) | 1,755 | | 33,415 |
Learning Tree International, Inc. | 981 | | 9,732 |
Lincoln Educational Services Corp. | 1,060 | | 15,540 |
Matthews International Corp. Class A | 1,320 | | 42,874 |
Common Stocks - continued |
| Shares | | Value |
CONSUMER DISCRETIONARY - continued |
Diversified Consumer Services - continued |
National American University Holdings, Inc. | 744 | | $ 5,104 |
Princeton Review, Inc. (a) | 1,131 | | 1,074 |
Steiner Leisure Ltd. (a) | 630 | | 25,339 |
Stewart Enterprises, Inc. Class A | 4,161 | | 23,593 |
StoneMor Partners LP | 522 | | 15,164 |
Strayer Education, Inc. | 538 | | 73,098 |
| | 758,229 |
Hotels, Restaurants & Leisure - 1.9% |
AFC Enterprises, Inc. (a) | 1,036 | | 13,758 |
Ambassadors Group, Inc. | 986 | | 10,856 |
Ambassadors International, Inc. (a) | 69 | | 117 |
Ameristar Casinos, Inc. | 2,331 | | 41,632 |
Benihana, Inc. (a) | 136 | | 1,034 |
Benihana, Inc. Class A (sub. vtg.) (a) | 256 | | 1,981 |
BJ's Restaurants, Inc. (a)(d) | 1,200 | | 43,980 |
Bob Evans Farms, Inc. | 1,335 | | 41,572 |
Bravo Brio Restaurant Group, Inc. | 500 | | 8,780 |
Buffalo Wild Wings, Inc. (a) | 636 | | 30,840 |
California Pizza Kitchen, Inc. (a) | 1,056 | | 17,857 |
Caribou Coffee Co., Inc. (a) | 636 | | 6,958 |
Carrols Restaurant Group, Inc. (a) | 690 | | 4,892 |
Century Casinos, Inc. (a) | 1,051 | | 2,396 |
China Lodging Group Ltd. ADR | 341 | | 8,112 |
Churchill Downs, Inc. | 808 | | 31,989 |
Cosi, Inc. (a) | 2,856 | | 3,284 |
Cracker Barrel Old Country Store, Inc. | 891 | | 46,920 |
Ctrip.com International Ltd. sponsored ADR (a) | 5,723 | | 250,782 |
Denny's Corp. (a) | 5,491 | | 20,097 |
Einstein Noah Restaurant Group, Inc. (a) | 801 | | 10,237 |
Empire Resorts, Inc. (a) | 1,786 | | 1,840 |
Gaming Partners International Corp. | 405 | | 2,345 |
Great Wolf Resorts, Inc. (a) | 1,656 | | 3,858 |
Home Inns & Hotels Management, Inc. sponsored ADR (a) | 1,000 | | 47,610 |
International Speedway Corp. Class A | 1,079 | | 25,562 |
Interval Leisure Group, Inc. (a) | 1,956 | | 32,411 |
Isle of Capri Casinos, Inc. (a) | 1,311 | | 11,524 |
Jack in the Box, Inc. (a) | 1,994 | | 40,109 |
Jamba, Inc. (a) | 2,631 | | 5,315 |
Lakes Entertainment, Inc. (a) | 1,276 | | 2,743 |
McCormick & Schmick's Seafood Restaurants (a) | 786 | | 6,870 |
Common Stocks - continued |
| Shares | | Value |
CONSUMER DISCRETIONARY - continued |
Hotels, Restaurants & Leisure - continued |
Melco PBL Entertainment (Macau) Ltd. sponsored ADR (a) | 6,671 | | $ 39,826 |
Monarch Casino & Resort, Inc. (a) | 976 | | 11,722 |
Morgans Hotel Group Co. (a) | 1,296 | | 9,901 |
MTR Gaming Group, Inc. (a) | 1,590 | | 3,180 |
Multimedia Games, Inc. (a) | 1,111 | | 4,800 |
O'Charleys, Inc. (a) | 1,021 | | 7,065 |
P.F. Chang's China Bistro, Inc. | 911 | | 46,042 |
Panera Bread Co. Class A (a) | 1,154 | | 115,677 |
Papa John's International, Inc. (a) | 1,026 | | 26,276 |
Peet's Coffee & Tea, Inc. (a) | 509 | | 19,408 |
Penn National Gaming, Inc. (a) | 3,230 | | 113,405 |
Premier Exhibitions, Inc. (a) | 1,531 | | 2,940 |
Red Robin Gourmet Burgers, Inc. (a) | 795 | | 14,731 |
Rick's Cabaret International, Inc. (a) | 546 | | 3,795 |
Ruth's Hospitality Group, Inc. (a) | 1,954 | | 9,653 |
Scientific Games Corp. Class A (a) | 3,891 | | 31,323 |
Shuffle Master, Inc. (a) | 2,856 | | 30,645 |
Sonic Corp. (a) | 2,295 | | 21,481 |
Starbucks Corp. | 29,000 | | 887,400 |
Texas Roadhouse, Inc. Class A (a) | 2,651 | | 45,306 |
The Cheesecake Factory, Inc. (a) | 2,676 | | 85,284 |
Town Sports International Holdings, Inc. (a) | 1,156 | | 3,873 |
Wynn Resorts Ltd. | 4,775 | | 482,753 |
| | 2,794,747 |
Household Durables - 0.2% |
Bassett Furniture Industries, Inc. (a) | 831 | | 3,424 |
Cavco Industries, Inc. (a) | 221 | | 8,058 |
Deer Consumer Products, Inc. (a)(d) | 1,000 | | 11,170 |
Dixie Group, Inc. (a) | 511 | | 1,671 |
Flexsteel Industries, Inc. | 324 | | 5,647 |
Garmin Ltd. (d) | 7,663 | | 221,920 |
Helen of Troy Ltd. (a) | 1,061 | | 25,061 |
Hooker Furniture Corp. | 791 | | 8,994 |
iRobot Corp. (a) | 926 | | 18,798 |
Lifetime Brands, Inc. (a) | 540 | | 7,960 |
Palm Harbor Homes, Inc. (a) | 1,816 | | 245 |
SodaStream International Ltd. | 400 | | 13,200 |
Stanley Furniture Co., Inc. (a) | 901 | | 2,946 |
Common Stocks - continued |
| Shares | | Value |
CONSUMER DISCRETIONARY - continued |
Household Durables - continued |
Stanley Furniture Co., Inc. rights 12/8/10 (a) | 901 | | $ 59 |
Universal Electronics, Inc. (a) | 671 | | 18,439 |
| | 347,592 |
Internet & Catalog Retail - 3.5% |
1-800-FLOWERS.com, Inc. Class A (a) | 1,800 | | 3,582 |
Amazon.com, Inc. (a) | 17,450 | | 3,060,730 |
Bidz.com, Inc. (a) | 966 | | 1,256 |
Blue Nile, Inc. (a)(d) | 666 | | 32,934 |
dELiA*s, Inc. (a) | 1,231 | | 2,130 |
drugstore.com, Inc. (a) | 3,246 | | 5,583 |
Expedia, Inc. | 10,075 | | 265,275 |
Gaiam, Inc. Class A | 826 | | 6,212 |
Geeknet, Inc. (a) | 322 | | 6,717 |
HSN, Inc. (a) | 2,103 | | 59,620 |
Liberty Media Corp. Interactive Series A (a) | 23,133 | | 357,636 |
MakeMyTrip Ltd. (d) | 1,383 | | 39,305 |
Mecox Lane Ltd. ADR | 420 | | 3,444 |
Netflix, Inc. (a) | 2,055 | | 423,125 |
NutriSystem, Inc. | 1,365 | | 28,215 |
Overstock.com, Inc. (a) | 971 | | 14,973 |
PetMed Express, Inc. | 1,226 | | 21,737 |
Priceline.com, Inc. (a) | 1,875 | | 738,844 |
Shutterfly, Inc. (a) | 1,000 | | 33,000 |
US Auto Parts Network, Inc. (a) | 1,216 | | 9,716 |
ValueVision Media, Inc. Class A (a) | 1,606 | | 5,605 |
Vitacost.com, Inc. (a) | 1,100 | | 6,820 |
| | 5,126,459 |
Leisure Equipment & Products - 0.3% |
Arctic Cat, Inc. (a) | 780 | | 11,630 |
Clarus Corp. (a) | 810 | | 5,621 |
JAKKS Pacific, Inc. (a) | 1,086 | | 20,906 |
Mattel, Inc. | 14,010 | | 362,018 |
Pool Corp. | 1,926 | | 40,812 |
RC2 Corp. (a) | 870 | | 19,271 |
Smith & Wesson Holding Corp. (a) | 2,189 | | 8,406 |
Summer Infant, Inc. (a) | 940 | | 6,777 |
| | 475,441 |
Media - 5.5% |
AirMedia Group, Inc. ADR (a) | 2,088 | | 14,428 |
Ascent Media Corp. (a) | 730 | | 22,564 |
Common Stocks - continued |
| Shares | | Value |
CONSUMER DISCRETIONARY - continued |
Media - continued |
Beasley Broadcast Group, Inc. Class A (a) | 961 | | $ 3,882 |
Carmike Cinemas, Inc. (a) | 600 | | 5,034 |
Central European Media Enterprises Ltd. Class A (a)(d) | 2,189 | | 41,941 |
Charter Communications, Inc. Class A (a) | 4,300 | | 144,136 |
China MediaExpress Holdings, Inc. (a)(d) | 1,463 | | 24,681 |
China Yida Holding Co. (a) | 803 | | 7,645 |
ChinaNet Online Holdings, Inc. (a) | 700 | | 2,758 |
CKX, Inc. (a) | 4,476 | | 18,486 |
Comcast Corp.: | | | |
Class A | 80,700 | | 1,614,000 |
Class A (special) (non-vtg.) | 28,955 | | 549,276 |
Crown Media Holdings, Inc. Class A (a)(d) | 13,065 | | 34,361 |
CTC Media, Inc. | 6,015 | | 135,398 |
Cumulus Media, Inc. Class A (a) | 2,040 | | 7,242 |
Daily Journal Corp. (a) | 40 | | 2,887 |
DIRECTV (a) | 34,000 | | 1,412,020 |
Discovery Communications, Inc. (a) | 5,517 | | 224,983 |
Discovery Communications, Inc. Class C (a) | 5,438 | | 193,103 |
DISH Network Corp. Class A | 8,361 | | 153,759 |
DreamWorks Animation SKG, Inc. Class A (a) | 2,951 | | 91,451 |
Emmis Communications Corp. Class A (a) | 1,171 | | 703 |
Fisher Communications, Inc. (a) | 375 | | 7,519 |
Focus Media Holding Ltd. ADR (a) | 5,085 | | 118,633 |
Global Sources Ltd. (a) | 1,719 | | 15,557 |
Global Traffic Network, Inc. (a) | 576 | | 5,207 |
Harris Interactive, Inc. (a) | 2,721 | | 2,340 |
IMAX Corp. (a) | 2,611 | | 71,045 |
Insignia Systems, Inc. (a) | 1,214 | | 8,547 |
interCLICK, Inc. (a) | 645 | | 3,844 |
Knology, Inc. (a) | 1,497 | | 23,039 |
Lamar Advertising Co. Class A (a) | 3,066 | | 112,676 |
Liberty Global, Inc.: | | | |
Class A (a)(d) | 5,000 | | 176,300 |
Class B (a) | 206 | | 7,432 |
Class C (a) | 4,833 | | 162,582 |
Liberty Media Corp.: | | | |
Capital Series A (a) | 3,531 | | 203,315 |
Starz Series A (a) | 1,986 | | 124,810 |
LodgeNet Entertainment Corp. (a) | 1,156 | | 3,584 |
Madison Square Garden, Inc. Class A (a) | 2,409 | | 52,853 |
MDC Partners, Inc. Class A (sub. vtg.) | 1,636 | | 23,329 |
Common Stocks - continued |
| Shares | | Value |
CONSUMER DISCRETIONARY - continued |
Media - continued |
Mediacom Communications Corp. Class A (a) | 1,660 | | $ 14,027 |
Morningstar, Inc. | 1,903 | | 95,930 |
National CineMedia, Inc. | 2,100 | | 39,186 |
Navarre Corp. (a) | 1,456 | | 3,320 |
New Frontier Media, Inc. (a) | 1,456 | | 2,796 |
News Corp.: | | | |
Class A | 70,969 | | 968,017 |
Class B | 31,125 | | 474,034 |
Nexstar Broadcasting Group, Inc. Class A (a) | 1,349 | | 7,285 |
Outdoor Channel Holdings, Inc. (a) | 1,002 | | 6,513 |
Private Media Group, Inc. (a) | 786 | | 920 |
Radio One, Inc. Class D (non-vtg.) (a) | 2,013 | | 2,174 |
ReachLocal, Inc. | 1,032 | | 17,792 |
Rentrak Corp. (a) | 486 | | 12,830 |
RRSat Global Communications Network Ltd. | 906 | | 6,333 |
Salem Communications Corp. Class A | 702 | | 2,345 |
Scholastic Corp. | 1,400 | | 39,340 |
Sinclair Broadcast Group, Inc. Class A | 1,914 | | 14,834 |
Sirius XM Radio, Inc. (a)(d) | 155,000 | | 212,350 |
Spanish Broadcasting System, Inc. Class A (a) | 1,618 | | 1,181 |
SuperMedia, Inc. (a) | 550 | | 2,486 |
Value Line, Inc. | 450 | | 6,480 |
Virgin Media, Inc. | 13,086 | | 333,431 |
VisionChina Media, Inc. ADR (a)(d) | 3,138 | | 11,548 |
Westwood One, Inc. (a)(d) | 795 | | 7,497 |
WPP PLC sponsored ADR | 510 | | 28,331 |
Xinhua Sports & Entertainment sponsored ADR (a) | 5,007 | | 1,251 |
| | 8,139,581 |
Multiline Retail - 0.4% |
Dollar Tree, Inc. (a) | 4,893 | | 268,870 |
Fred's, Inc. Class A | 1,836 | | 23,482 |
Gordmans Stores, Inc. | 821 | | 10,476 |
Sears Holdings Corp. (a)(d) | 4,461 | | 292,196 |
The Bon-Ton Stores, Inc. (a) | 511 | | 6,858 |
Tuesday Morning Corp. (a) | 1,641 | | 8,533 |
| | 610,415 |
Specialty Retail - 2.1% |
A.C. Moore Arts & Crafts, Inc. (a) | 871 | | 2,021 |
America's Car Mart, Inc. (a) | 495 | | 12,558 |
AutoChina International Ltd. (a)(d) | 677 | | 16,911 |
Common Stocks - continued |
| Shares | | Value |
CONSUMER DISCRETIONARY - continued |
Specialty Retail - continued |
bebe Stores, Inc. | 3,505 | | $ 22,572 |
Bed Bath & Beyond, Inc. (a) | 10,250 | | 448,335 |
Big 5 Sporting Goods Corp. | 1,041 | | 14,366 |
Body Central Corp. | 650 | | 7,937 |
Books-A-Million, Inc. | 771 | | 4,911 |
Cache, Inc. (a) | 691 | | 2,937 |
Casual Male Retail Group, Inc. (a) | 2,259 | | 10,843 |
Charming Shoppes, Inc. (a) | 5,121 | | 19,485 |
Citi Trends, Inc. (a) | 615 | | 14,569 |
Coldwater Creek, Inc. (a) | 3,396 | | 11,478 |
Conn's, Inc. (a)(d) | 1,091 | | 3,491 |
Cost Plus, Inc. (a) | 841 | | 6,484 |
Destination Maternity Corp. (a) | 479 | | 18,336 |
Dress Barn, Inc. (a) | 3,090 | | 76,323 |
Finish Line, Inc. Class A | 1,876 | | 33,487 |
Golfsmith International Holdings, Inc. (a) | 570 | | 1,676 |
Hibbett Sports, Inc. (a) | 1,161 | | 39,764 |
Hot Topic, Inc. | 1,891 | | 11,592 |
Jos. A. Bank Clothiers, Inc. (a) | 960 | | 43,238 |
Kirkland's, Inc. (a) | 931 | | 11,125 |
Monro Muffler Brake, Inc. | 785 | | 38,810 |
O'Reilly Automotive, Inc. (a) | 5,233 | | 314,922 |
Pacific Sunwear of California, Inc. (a) | 2,790 | | 17,549 |
PetSmart, Inc. | 4,688 | | 177,488 |
Rent-A-Center, Inc. | 2,661 | | 74,082 |
Ross Stores, Inc. | 4,742 | | 307,661 |
rue21, Inc. | 1,041 | | 31,240 |
Select Comfort Corp. (a) | 2,041 | | 17,940 |
Shoe Carnival, Inc. (a) | 477 | | 13,232 |
Staples, Inc. | 28,200 | | 620,682 |
Stein Mart, Inc. | 1,770 | | 17,523 |
Tandy Leather Factory, Inc. | 422 | | 1,853 |
The Children's Place Retail Stores, Inc. (a) | 873 | | 45,317 |
Tractor Supply Co. | 2,820 | | 119,765 |
Trans World Entertainment Corp. (a) | 2,931 | | 5,041 |
Ulta Salon, Cosmetics & Fragrance, Inc. (a) | 2,339 | | 81,748 |
Urban Outfitters, Inc. (a) | 6,403 | | 241,969 |
West Marine, Inc. (a) | 916 | | 8,766 |
Wet Seal, Inc. Class A (a) | 4,042 | | 13,217 |
Common Stocks - continued |
| Shares | | Value |
CONSUMER DISCRETIONARY - continued |
Specialty Retail - continued |
Winmark Corp. | 300 | | $ 9,645 |
Zumiez, Inc. (a) | 1,176 | | 37,409 |
| | 3,030,298 |
Textiles, Apparel & Luxury Goods - 0.6% |
Cherokee, Inc. | 405 | | 7,979 |
Columbia Sportswear Co. | 1,371 | | 76,282 |
Crocs, Inc. (a) | 3,216 | | 56,425 |
Deckers Outdoor Corp. (a) | 1,592 | | 122,425 |
Exceed Co. Ltd. (a) | 1,148 | | 9,586 |
Fossil, Inc. (a) | 2,490 | | 168,449 |
Fuqi International, Inc. (a) | 1,042 | | 6,387 |
G-III Apparel Group Ltd. (a) | 750 | | 20,528 |
Heelys, Inc. (a) | 960 | | 3,158 |
Iconix Brand Group, Inc. (a) | 2,850 | | 53,238 |
Joe's Jeans, Inc. (a)(d) | 2,547 | | 4,050 |
K-Swiss, Inc. Class A (a) | 1,411 | | 17,666 |
Kingold Jewelry, Inc. (a)(d) | 1,981 | | 18,027 |
LJ International, Inc. (a) | 981 | | 3,502 |
lululemon athletica, Inc. (a) | 2,003 | | 107,401 |
Perry Ellis International, Inc. (a) | 736 | | 20,027 |
Steven Madden Ltd. (a) | 1,020 | | 46,155 |
Tandy Brands Accessories, Inc. (a) | 1,011 | | 2,871 |
True Religion Apparel, Inc. (a) | 956 | | 21,443 |
Vera Bradley, Inc. | 1,600 | | 52,384 |
Volcom, Inc. | 882 | | 15,876 |
Wacoal Holdings Corp. sponsored ADR | 98 | | 6,657 |
| | 840,516 |
TOTAL CONSUMER DISCRETIONARY | | 22,765,313 |
CONSUMER STAPLES - 2.1% |
Beverages - 0.2% |
Central European Distribution Corp. (a) | 2,876 | | 69,110 |
Coca-Cola Bottling Co. Consolidated | 315 | | 18,428 |
Craft Brewers Alliance, Inc. (a) | 627 | | 4,132 |
Hansen Natural Corp. (a) | 3,576 | | 190,315 |
Jones Soda Co. (a) | 1,516 | | 1,683 |
MGP Ingredients, Inc. | 716 | | 6,523 |
Common Stocks - continued |
| Shares | | Value |
CONSUMER STAPLES - continued |
Beverages - continued |
National Beverage Corp. | 2,000 | | $ 26,180 |
Primo Water Corp. | 875 | | 10,561 |
| | 326,932 |
Food & Staples Retailing - 1.3% |
Andersons, Inc. | 716 | | 23,141 |
Arden Group, Inc. Class A | 150 | | 12,150 |
Casey's General Stores, Inc. | 1,506 | | 59,856 |
China Jo-Jo Drugstores, Inc. (a) | 574 | | 2,583 |
Costco Wholesale Corp. | 16,955 | | 1,146,328 |
Fresh Market, Inc. | 2,100 | | 76,125 |
Ingles Markets, Inc. Class A | 861 | | 16,058 |
Nash-Finch Co. | 538 | | 19,879 |
PriceSmart, Inc. | 1,215 | | 40,788 |
QKL Stores, Inc. (a) | 2,086 | | 7,343 |
Spartan Stores, Inc. | 873 | | 14,282 |
Susser Holdings Corp. (a) | 641 | | 8,615 |
The Pantry, Inc. (a) | 881 | | 18,096 |
United Natural Foods, Inc. (a) | 1,731 | | 64,809 |
Village Super Market, Inc. Class A | 275 | | 8,668 |
Whole Foods Market, Inc. (a) | 6,599 | | 311,605 |
Winn-Dixie Stores, Inc. (a) | 2,121 | | 12,896 |
| | 1,843,222 |
Food Products - 0.5% |
AgFeed Industries, Inc. (a)(d) | 1,833 | | 4,399 |
Alico, Inc. | 240 | | 5,556 |
Bridgford Foods Corp. | 391 | | 4,966 |
Cal-Maine Foods, Inc. | 888 | | 27,226 |
Calavo Growers, Inc. | 741 | | 17,110 |
Cresud S.A.C.I.F. y A. sponsored ADR | 1,928 | | 36,266 |
Diamond Foods, Inc. | 756 | | 35,184 |
Farmer Brothers Co. | 750 | | 13,065 |
Green Mountain Coffee Roasters, Inc. (a) | 5,139 | | 190,554 |
Hain Celestial Group, Inc. (a) | 1,455 | | 38,572 |
Imperial Sugar Co. | 496 | | 6,825 |
J&J Snack Foods Corp. | 855 | | 39,116 |
John B. Sanfilippo & Son, Inc. (a) | 362 | | 4,311 |
Lancaster Colony Corp. | 978 | | 50,924 |
Lance, Inc. | 1,196 | | 27,998 |
Le Gaga Holdings Ltd. ADR | 500 | | 4,315 |
Lifeway Foods, Inc. (a) | 786 | | 7,483 |
Common Stocks - continued |
| Shares | | Value |
CONSUMER STAPLES - continued |
Food Products - continued |
Limoneira Co. | 375 | | $ 8,179 |
Origin Agritech Ltd. (a) | 1,000 | | 8,850 |
Sanderson Farms, Inc. | 848 | | 37,532 |
Seneca Foods Corp. Class A (a) | 481 | | 11,443 |
SkyPeople Fruit Juice, Inc. (a) | 904 | | 4,412 |
Smart Balance, Inc. (a) | 2,551 | | 9,337 |
SunOpta, Inc. (a) | 2,641 | | 18,302 |
Synutra International, Inc. (a) | 2,181 | | 27,851 |
Yuhe International, Inc. (a) | 671 | | 6,039 |
Zhongpin, Inc. (a)(d) | 1,276 | | 24,384 |
| | 670,199 |
Household Products - 0.0% |
Central Garden & Pet Co. (a) | 1,321 | | 12,232 |
Central Garden & Pet Co. Class A (non-vtg.) (a) | 1,186 | | 11,077 |
WD-40 Co. | 700 | | 27,363 |
| | 50,672 |
Personal Products - 0.1% |
China Sky One Medical, Inc. (a) | 576 | | 4,222 |
China-Biotics, Inc. (a)(d) | 854 | | 9,864 |
Elizabeth Arden, Inc. (a) | 1,380 | | 29,408 |
GLG Life Tech Corp. (a) | 1,704 | | 12,698 |
Inter Parfums, Inc. | 1,381 | | 25,217 |
Mannatech, Inc. (a) | 1,156 | | 2,220 |
Nutraceutical International Corp. (a) | 550 | | 8,179 |
Parlux Fragrances, Inc. (a) | 1,126 | | 3,074 |
Physicians Formula Holdings, Inc. (a) | 856 | | 2,987 |
Reliv International, Inc. | 601 | | 1,112 |
The Female Health Co. | 899 | | 5,133 |
USANA Health Sciences, Inc. (a) | 681 | | 28,684 |
| | 132,798 |
Tobacco - 0.0% |
Star Scientific, Inc. (a)(d) | 3,231 | | 6,010 |
TOTAL CONSUMER STAPLES | | 3,029,833 |
ENERGY - 1.6% |
Energy Equipment & Services - 0.2% |
Acergy SA sponsored ADR | 1,506 | | 30,225 |
Bronco Drilling Co., Inc. (a) | 1,819 | | 8,531 |
Dawson Geophysical Co. (a) | 450 | | 12,609 |
Common Stocks - continued |
| Shares | | Value |
ENERGY - continued |
Energy Equipment & Services - continued |
ENGlobal Corp. (a) | 1,050 | | $ 3,129 |
Exterran Partners LP | 671 | | 16,185 |
Global Industries Ltd. (a) | 4,221 | | 26,297 |
Gulf Island Fabrication, Inc. | 651 | | 17,421 |
Hercules Offshore, Inc. (a) | 5,500 | | 14,052 |
Lufkin Industries, Inc. | 1,200 | | 60,756 |
Matrix Service Co. (a) | 1,041 | | 10,337 |
Mitcham Industries, Inc. (a) | 336 | | 3,192 |
OYO Geospace Corp. (a) | 206 | | 15,627 |
Patterson-UTI Energy, Inc. | 6,111 | | 120,631 |
PHI, Inc. (non-vtg.) (a) | 476 | | 8,044 |
Seahawk Drilling, Inc. (a) | 647 | | 5,260 |
SinoTech Energy Ltd. ADR | 860 | | 4,739 |
T-3 Energy Services, Inc. (a) | 480 | | 17,064 |
Tesco Corp. (a) | 1,470 | | 19,419 |
Union Drilling, Inc. (a) | 1,161 | | 7,326 |
| | 400,844 |
Oil, Gas & Consumable Fuels - 1.4% |
Abraxas Petroleum Corp. (a) | 2,778 | | 11,834 |
Alliance Holdings GP, LP | 2,376 | | 108,346 |
Alliance Resource Partners LP | 1,450 | | 89,900 |
Amyris, Inc. | 1,800 | | 37,044 |
APCO Oil and Gas International, Inc. | 1,041 | | 39,298 |
Approach Resources, Inc. (a) | 1,050 | | 19,184 |
Atlas Energy, Inc. (a) | 3,055 | | 131,212 |
ATP Oil & Gas Corp. (a)(d) | 1,838 | | 27,055 |
BioFuel Energy Corp. (a)(d) | 1,983 | | 3,292 |
BreitBurn Energy Partners LP | 2,100 | | 41,328 |
Brigham Exploration Co. (a) | 4,455 | | 112,043 |
Calumet Specialty Products Partners LP | 843 | | 18,344 |
Capital Product Partners LP | 1,309 | | 11,009 |
Carrizo Oil & Gas, Inc. (a) | 1,191 | | 34,563 |
China Integrated Energy, Inc. (a)(d) | 1,437 | | 10,806 |
Clayton Williams Energy, Inc. (a) | 465 | | 34,949 |
Clean Energy Fuels Corp. (a) | 2,500 | | 33,450 |
Copano Energy LLC | 2,727 | | 81,619 |
CREDO Petroleum Corp. (a) | 1,004 | | 8,022 |
Crimson Exploration, Inc. (a) | 2,124 | | 7,901 |
Crosstex Energy LP | 1,976 | | 27,526 |
Crosstex Energy, Inc. | 2,006 | | 18,556 |
Common Stocks - continued |
| Shares | | Value |
ENERGY - continued |
Oil, Gas & Consumable Fuels - continued |
Delta Petroleum Corp. (a)(d) | 10,810 | | $ 8,229 |
Dorchester Minerals LP | 1,144 | | 31,105 |
Double Eagle Petroleum Co. (a) | 405 | | 2,102 |
Eagle Rock Energy Partners LP | 2,514 | | 20,137 |
Energy XXI (Bermuda) Ltd. (a) | 2,095 | | 51,642 |
EV Energy Partners LP | 1,265 | | 48,285 |
FX Energy, Inc. (a) | 1,740 | | 10,283 |
GeoMet, Inc. (a) | 2,416 | | 2,005 |
Georesources, Inc. (a) | 798 | | 15,896 |
Golar LNG Ltd. (NASDAQ) | 2,796 | | 38,892 |
Green Plains Renewable Energy, Inc. (a) | 1,400 | | 15,372 |
Gulfport Energy Corp. (a) | 1,521 | | 28,351 |
Hallador Energy Co. | 1,071 | | 12,317 |
Isramco, Inc. (a) | 100 | | 5,732 |
Ivanhoe Energy, Inc. (a)(d) | 11,028 | | 23,203 |
James River Coal Co. (a) | 1,160 | | 23,084 |
Knightsbridge Tankers Ltd. (d) | 941 | | 21,398 |
L&L Energy, Inc. (a) | 1,400 | | 14,798 |
Legacy Reserves LP | 1,410 | | 36,815 |
LINN Energy LLC | 5,680 | | 206,184 |
Martin Midstream Partners LP | 608 | | 22,332 |
Miller Petroleum, Inc. (a) | 3,040 | | 15,808 |
NGAS Resources, Inc. (a) | 1,291 | | 684 |
Pacific Ethanol, Inc. (a)(d) | 1,426 | | 998 |
Petroleum Development Corp. (a) | 600 | | 21,372 |
PostRock Energy Corp. (a) | 615 | | 2,245 |
PrimeEnergy Corp. (a) | 165 | | 3,416 |
Ram Energy Resources, Inc. (a) | 6,236 | | 10,851 |
Regency Energy Partners LP | 5,322 | | 136,775 |
Rex Energy Corp. (a) | 1,615 | | 19,138 |
Rosetta Resources, Inc. (a) | 2,181 | | 78,123 |
Sino Clean Energy, Inc. (a) | 1,155 | | 7,808 |
StealthGas, Inc. (a) | 1,116 | | 5,669 |
Syntroleum Corp. (a) | 2,661 | | 4,923 |
TC Pipelines LP | 1,725 | | 80,195 |
TEL Offshore Trust (a) | 300 | | 633 |
Top Ships, Inc. (a) | 2,745 | | 2,223 |
Toreador Resources Corp. (a) | 1,260 | | 19,215 |
TransGlobe Energy Corp. (a) | 2,602 | | 42,961 |
Uranium Resources, Inc. (a) | 3,910 | | 14,467 |
Verenium Corp. (a)(d) | 997 | | 3,240 |
Common Stocks - continued |
| Shares | | Value |
ENERGY - continued |
Oil, Gas & Consumable Fuels - continued |
Warren Resources, Inc. (a) | 2,571 | | $ 11,390 |
Zion Oil & Gas, Inc. (a)(d) | 1,119 | | 5,416 |
Zion Oil & Gas, Inc. rights (a)(d) | 201 | | 268 |
| | 2,033,261 |
TOTAL ENERGY | | 2,434,105 |
FINANCIALS - 7.1% |
Capital Markets - 1.5% |
American Capital Ltd. (a) | 13,199 | | 94,901 |
BGC Partners, Inc. Class A | 2,515 | | 19,240 |
Calamos Asset Management, Inc. Class A | 941 | | 11,226 |
Capital Southwest Corp. | 195 | | 19,551 |
Cowen Group, Inc. Class A (a) | 2,711 | | 11,061 |
Diamond Hill Investment Group, Inc. | 180 | | 12,463 |
E*TRADE Financial Corp. (a) | 8,565 | | 126,334 |
Epoch Holding Corp. | 1,101 | | 17,649 |
FBR Capital Markets Corp. (a) | 2,895 | | 10,480 |
Financial Engines, Inc. (a) | 1,640 | | 27,749 |
FirstCity Financial Corp. (a) | 871 | | 6,611 |
Gleacher & Co., Inc. (a) | 4,606 | | 11,561 |
Harris & Harris Group, Inc. (a) | 1,245 | | 5,453 |
Horizon Technology Finance Corp. | 300 | | 4,458 |
International Assets Holding Corp. (a) | 764 | | 17,442 |
LPL Investment Holdings, Inc. | 4,900 | | 166,110 |
Northern Trust Corp. | 9,529 | | 479,309 |
optionsXpress Holdings, Inc. | 2,355 | | 40,718 |
Penson Worldwide, Inc. (a) | 891 | | 4,339 |
Prospect Capital Corp. | 2,651 | | 25,927 |
Rodman & Renshaw Capital Group, Inc. (a) | 2,384 | | 5,674 |
Sanders Morris Harris Group, Inc. | 975 | | 6,630 |
SEI Investments Co. | 7,535 | | 170,140 |
T. Rowe Price Group, Inc. | 10,080 | | 587,966 |
TD Ameritrade Holding Corp. | 23,188 | | 388,167 |
TradeStation Group, Inc. (a) | 1,791 | | 11,391 |
U.S. Global Investments, Inc. Class A | 1,078 | | 8,786 |
Virtus Investment Partners, Inc. (a) | 285 | | 12,768 |
| | 2,304,104 |
Commercial Banks - 2.6% |
1st Source Corp. | 1,106 | | 20,649 |
Common Stocks - continued |
| Shares | | Value |
FINANCIALS - continued |
Commercial Banks - continued |
1st United Bancorp, Inc. (a) | 886 | | $ 5,157 |
Alliance Financial Corp. | 360 | | 10,631 |
American National Bankshares, Inc. | 525 | | 11,723 |
American River Bankshares (a) | 496 | | 2,753 |
Ameris Bancorp | 723 | | 6,970 |
Ames National Corp. | 341 | | 6,663 |
Arrow Financial Corp. | 679 | | 18,971 |
Associated Banc-Corp. | 6,486 | | 82,988 |
BancFirst Corp. | 600 | | 24,348 |
Bancorp Rhode Island, Inc. | 200 | | 5,964 |
Bancorp, Inc., Delaware (a) | 615 | | 5,289 |
BancTrust Financial Group, Inc. (a) | 1,251 | | 3,140 |
Bank of Granite Corp. (a) | 1,035 | | 642 |
Bank of Marin Bancorp | 371 | | 12,391 |
Bank of the Ozarks, Inc. | 720 | | 27,281 |
Banner Corp. | 4,500 | | 7,155 |
BCB Bancorp, Inc. | 666 | | 6,127 |
BNC Bancorp | 360 | | 3,233 |
BOK Financial Corp. | 2,767 | | 129,219 |
Boston Private Financial Holdings, Inc. | 2,700 | | 14,499 |
Bridge Capital Holdings (a) | 516 | | 4,386 |
Bryn Mawr Bank Corp. | 570 | | 9,570 |
Camden National Corp. | 434 | | 15,581 |
Capital Bank Corp. | 330 | | 954 |
Capital City Bank Group, Inc. | 876 | | 11,081 |
Cardinal Financial Corp. | 1,266 | | 13,116 |
Cascade Bancorp (a)(d) | 123 | | 947 |
Cascade Financial Corp. (a)(d) | 871 | | 392 |
Cathay General Bancorp | 3,100 | | 41,881 |
Center Bancorp, Inc. | 1,211 | | 9,506 |
Center Financial Corp. (a) | 1,521 | | 9,521 |
Centerstate Banks of Florida, Inc. | 1,407 | | 9,947 |
Century Bancorp, Inc. Class A (non-vtg.) | 164 | | 3,954 |
Chemical Financial Corp. | 926 | | 19,372 |
Citizens & Northern Corp. | 330 | | 4,920 |
Citizens Banking Corp., Michigan (a) | 16,171 | | 9,379 |
City Holding Co. | 726 | | 23,283 |
CNB Financial Corp., Pennsylvania | 681 | | 9,759 |
CoBiz, Inc. | 1,196 | | 5,872 |
Colony Bankcorp, Inc. (a)(d) | 420 | | 1,768 |
Columbia Banking Systems, Inc. | 1,530 | | 26,683 |
Common Stocks - continued |
| Shares | | Value |
FINANCIALS - continued |
Commercial Banks - continued |
Commerce Bancshares, Inc. | 3,239 | | $ 121,624 |
Community Trust Bancorp, Inc. | 735 | | 20,220 |
CVB Financial Corp. | 3,778 | | 29,733 |
Danvers Bancorp, Inc. | 1,485 | | 22,646 |
Eagle Bancorp, Inc., Maryland (a) | 1,700 | | 21,539 |
East West Bancorp, Inc. | 5,712 | | 99,046 |
Eastern Virgina Bankshares, Inc. | 270 | | 1,004 |
Enterprise Financial Services Corp. | 840 | | 8,375 |
Fidelity Southern Corp. | 753 | | 5,143 |
Fifth Third Bancorp | 31,475 | | 376,126 |
Financial Institutions, Inc. | 296 | | 5,402 |
First Bancorp, North Carolina | 720 | | 10,433 |
First Busey Corp. | 2,713 | | 11,802 |
First Chester County Corp. | 1,580 | | 9,859 |
First Citizen Bancshares, Inc. | 341 | | 59,296 |
First Community Bancshares, Inc. | 993 | | 13,773 |
First Financial Bancorp, Ohio | 2,091 | | 34,543 |
First Financial Bankshares, Inc. | 900 | | 43,533 |
First Financial Corp., Indiana | 540 | | 16,276 |
First Interstate Bancsystem, Inc. | 398 | | 5,421 |
First M&F Corp. | 540 | | 2,030 |
First Mariner Bancorp, Inc. (a) | 885 | | 425 |
First Merchants Corp. | 1,598 | | 13,247 |
First Midwest Bancorp, Inc., Delaware | 2,856 | | 26,761 |
First of Long Island Corp. | 521 | | 13,421 |
First South Bancorp, Inc., Virginia | 450 | | 3,344 |
First United Corp. | 555 | | 2,148 |
Firstbank Corp., Michigan | 331 | | 1,635 |
FirstMerit Corp. | 4,194 | | 73,080 |
FNB Corp., North Carolina (a) | 411 | | 123 |
Fulton Financial Corp. | 7,724 | | 66,813 |
German American Bancorp, Inc. | 616 | | 10,706 |
Glacier Bancorp, Inc. | 2,842 | | 37,884 |
Great Southern Bancorp, Inc. | 784 | | 17,530 |
Green Bankshares, Inc. (a) | 498 | | 1,325 |
Grupo Financiero Galicia SA sponsored ADR (a) | 1,271 | | 19,535 |
Guaranty Bancorp (a) | 2,355 | | 3,014 |
Hampton Roads Bankshares, Inc. (a)(d) | 2,407 | | 1,171 |
Hampton Roads Bankshares, Inc. rights 12/10/10 (a) | 2,407 | | 92 |
Hancock Holding Co. | 1,308 | | 41,202 |
Hanmi Financial Corp. (a) | 4,350 | | 3,994 |
Common Stocks - continued |
| Shares | | Value |
FINANCIALS - continued |
Commercial Banks - continued |
Heartland Financial USA, Inc. | 720 | | $ 11,570 |
Heritage Commerce Corp. (a) | 592 | | 2,190 |
Heritage Financial Corp., Washington (a) | 525 | | 7,203 |
Home Bancshares, Inc. | 977 | | 20,224 |
Hudson Valley Holding Corp. | 605 | | 11,979 |
Huntington Bancshares, Inc. | 27,900 | | 162,797 |
IBERIABANK Corp. | 1,044 | | 52,628 |
Independent Bank Corp. | 73 | | 88 |
Independent Bank Corp., Massachusetts | 850 | | 20,647 |
Integra Bank Corp. (a)(d) | 825 | | 454 |
International Bancshares Corp. | 2,535 | | 43,602 |
Intervest Bancshares Corp. Class A (a) | 330 | | 723 |
Investors Bancorp, Inc. (a) | 4,476 | | 54,831 |
Lakeland Bancorp, Inc. | 1,200 | | 12,540 |
Lakeland Financial Corp. | 816 | | 17,063 |
LNB Bancorp, Inc. | 891 | | 4,188 |
Macatawa Bank Corp. (a) | 541 | | 1,347 |
MainSource Financial Group, Inc. | 1,136 | | 10,406 |
MB Financial, Inc. | 2,000 | | 28,460 |
MBT Financial Corp. (a)(d) | 1,035 | | 1,625 |
Mercantile Bank Corp. | 255 | | 1,744 |
Merchants Bancshares, Inc. | 565 | | 15,385 |
Metro Bancorp, Inc. (a) | 390 | | 3,920 |
Metrocorp Bancshares, Inc. (a) | 81 | | 203 |
Nara Bancorp, Inc. (a) | 1,446 | | 11,799 |
National Bankshares, Inc. | 338 | | 8,930 |
National Penn Bancshares, Inc. | 5,109 | | 34,281 |
NBT Bancorp, Inc. | 1,400 | | 31,080 |
NewBridge Bancorp (a) | 1,366 | | 5,655 |
North Valley Bancorp (a) | 570 | | 741 |
Northern States Financial Corp. (a) | 381 | | 522 |
Northfield Bancorp, Inc. | 2,196 | | 27,911 |
Northrim Bancorp, Inc. | 386 | | 7,292 |
Old Point Financial Corp. | 461 | | 5,048 |
Old Second Bancorp, Inc. | 900 | | 1,746 |
OmniAmerican Bancorp, Inc. (a) | 426 | | 5,257 |
Orrstown Financial Services, Inc. | 250 | | 6,550 |
Pacific Capital Bancorp (a)(d) | 111,038 | | 24,428 |
Pacific Continental Corp. | 450 | | 3,888 |
Pacific Mercantile Bancorp (a) | 556 | | 2,196 |
PacWest Bancorp | 1,500 | | 25,500 |
Common Stocks - continued |
| Shares | | Value |
FINANCIALS - continued |
Commercial Banks - continued |
Park Sterling Bank (a) | 1,257 | | $ 6,612 |
Peapack-Gladstone Financial Corp. | 302 | | 3,624 |
Penns Woods Bancorp, Inc. | 457 | | 17,042 |
Peoples Bancorp, Inc. | 495 | | 6,430 |
Pinnacle Financial Partners, Inc. (a) | 1,161 | | 11,413 |
Popular, Inc. (a) | 39,756 | | 114,497 |
Preferred Bank, Los Angeles California (a) | 511 | | 818 |
PremierWest Bancorp (a) | 740 | | 311 |
PrivateBancorp, Inc. | 2,900 | | 35,264 |
Prosperity Bancshares, Inc. | 1,866 | | 60,720 |
Renasant Corp. | 771 | | 13,354 |
Republic Bancorp, Inc., Kentucky Class A | 866 | | 17,762 |
Republic First Bancorp, Inc. (a) | 765 | | 1,599 |
Royal Bancshares of Pennsylvania, Inc. Class A (a) | 735 | | 1,029 |
S&T Bancorp, Inc. | 1,115 | | 21,876 |
S.Y. Bancorp, Inc. | 708 | | 16,935 |
Sandy Spring Bancorp, Inc. | 696 | | 11,811 |
SCBT Financial Corp. | 476 | | 14,713 |
Seacoast Banking Corp., Florida (a) | 856 | | 1,027 |
Shore Bancshares, Inc. | 300 | | 2,931 |
Sierra Bancorp | 480 | | 4,968 |
Signature Bank, New York (a) | 1,515 | | 66,584 |
Simmons First National Corp. Class A | 696 | | 20,219 |
Southern Community Financial Corp. (a) | 631 | | 814 |
Southside Bancshares, Inc. | 841 | | 17,594 |
Southwest Bancorp, Inc., Oklahoma | 971 | | 10,215 |
State Bancorp, Inc., New York | 566 | | 5,162 |
StellarOne Corp. | 1,176 | | 15,406 |
Sterling Bancshares, Inc. | 3,972 | | 23,574 |
Sterling Financial Corp., Washington (a)(d) | 2,326 | | 37,216 |
Suffolk Bancorp | 562 | | 14,432 |
Summit Financial Group, Inc. (a) | 405 | | 1,839 |
Sun Bancorp, Inc., New Jersey (a) | 803 | | 3,324 |
Superior Bancorp (a) | 360 | | 148 |
Susquehanna Bancshares, Inc., Pennsylvania | 5,056 | | 40,701 |
SVB Financial Group (a) | 1,585 | | 71,214 |
Taylor Capital Group, Inc. (a) | 566 | | 7,035 |
Texas Capital Bancshares, Inc. (a) | 1,320 | | 24,922 |
The First Bancorp, Inc. | 621 | | 8,688 |
TIB Financial Corp. (a)(d) | 902 | | 226 |
TIB Financial Corp. rights 1/10/11 (a) | 9,620 | | 962 |
Common Stocks - continued |
| Shares | | Value |
FINANCIALS - continued |
Commercial Banks - continued |
Tower Bancorp, Inc. | 230 | | $ 5,304 |
TowneBank (d) | 921 | | 14,220 |
Trico Bancshares | 786 | | 11,342 |
Trustmark Corp. | 2,475 | | 52,817 |
UMB Financial Corp. | 1,613 | | 60,165 |
Umpqua Holdings Corp. | 4,455 | | 47,178 |
Union/First Market Bankshares Corp. | 696 | | 9,535 |
United Bankshares, Inc., West Virginia | 1,716 | | 44,976 |
United Community Banks, Inc., Georgia (a) | 3,639 | | 5,568 |
United Security Bancshares, Inc. | 465 | | 4,469 |
United Security Bancshares, California | 947 | | 3,693 |
Univest Corp. of Pennsylvania | 711 | | 13,232 |
Virginia Commerce Bancorp, Inc. (a) | 1,605 | | 9,100 |
VIST Financial Corp. | 450 | | 3,128 |
Washington Banking Co., Oak Harbor | 345 | | 4,413 |
Washington Trust Bancorp, Inc. | 796 | | 16,708 |
WesBanco, Inc. | 1,311 | | 22,851 |
West Bancorp., Inc. | 675 | | 4,907 |
West Coast Bancorp (a) | 3,530 | | 9,319 |
Westamerica Bancorp. | 1,163 | | 56,847 |
Western Liberty Bancorp (a) | 750 | | 3,983 |
Whitney Holding Corp. | 4,005 | | 37,607 |
Wilshire Bancorp, Inc. | 1,011 | | 7,158 |
Wintrust Financial Corp. | 1,093 | | 31,314 |
Yadkin Valley Financial Corp. (a) | 851 | | 1,387 |
Zions Bancorporation | 6,800 | | 132,260 |
| | 3,930,072 |
Consumer Finance - 0.2% |
Cardtronics, Inc. (a) | 1,926 | | 32,549 |
CompuCredit Holdings Corp. | 2,042 | | 12,252 |
Consumer Portfolio Services, Inc. (a) | 1,005 | | 884 |
Credit Acceptance Corp. (a) | 1,101 | | 68,339 |
Dollar Financial Corp. (a) | 891 | | 23,326 |
EZCORP, Inc. (non-vtg.) Class A (a) | 1,656 | | 41,665 |
First Cash Financial Services, Inc. (a) | 1,086 | | 31,266 |
Netspend Holdings, Inc. | 3,600 | | 48,240 |
QC Holdings, Inc. | 826 | | 3,304 |
Rewards Network, Inc. (a) | 448 | | 6,160 |
World Acceptance Corp. (a) | 566 | | 24,938 |
| | 292,923 |
Common Stocks - continued |
| Shares | | Value |
FINANCIALS - continued |
Diversified Financial Services - 0.8% |
Asset Acceptance Capital Corp. (a) | 1,440 | | $ 8,467 |
Asta Funding, Inc. | 516 | | 3,689 |
CBOE Holdings, Inc. | 601 | | 14,298 |
CME Group, Inc. | 2,620 | | 754,717 |
Encore Capital Group, Inc. (a) | 921 | | 17,121 |
Interactive Brokers Group, Inc. | 1,566 | | 28,720 |
Life Partners Holdings, Inc. | 543 | | 11,615 |
MarketAxess Holdings, Inc. | 1,170 | | 21,282 |
Marlin Business Services Corp. (a) | 586 | | 6,212 |
Medallion Financial Corp. | 1,071 | | 9,082 |
NewStar Financial, Inc. (a) | 2,046 | | 17,268 |
PICO Holdings, Inc. (a) | 911 | | 26,009 |
Portfolio Recovery Associates, Inc. (a) | 610 | | 38,656 |
Resource America, Inc. Class A | 675 | | 4,064 |
The NASDAQ Stock Market, Inc. (a) | 7,965 | | 170,929 |
| | 1,132,129 |
Insurance - 0.9% |
21st Century Holding Co. | 720 | | 2,333 |
Alterra Capital Holdings Ltd. | 4,651 | | 94,601 |
American National Insurance Co. | 1,007 | | 80,077 |
Amerisafe, Inc. (a) | 696 | | 12,869 |
Amtrust Financial Services, Inc. | 2,661 | | 42,603 |
Arch Capital Group Ltd. (a) | 1,949 | | 175,995 |
Argo Group International Holdings, Ltd. | 1,241 | | 45,768 |
Baldwin & Lyons, Inc. Class B | 566 | | 13,092 |
Cincinnati Financial Corp. | 6,211 | | 187,231 |
CNinsure, Inc. ADR | 992 | | 21,586 |
Donegal Group, Inc. Class A | 1,061 | | 15,777 |
Eastern Insurance Holdings, Inc. | 261 | | 2,897 |
eHealth, Inc. (a) | 1,071 | | 16,119 |
EMC Insurance Group | 761 | | 16,955 |
Enstar Group Ltd. (a) | 522 | | 43,326 |
Erie Indemnity Co. Class A | 1,894 | | 119,246 |
FPIC Insurance Group, Inc. (a) | 329 | | 12,166 |
Global Indemnity PLC (a) | 791 | | 15,171 |
Greenlight Capital Re, Ltd. (a) | 1,101 | | 30,806 |
Hallmark Financial Services, Inc. (a) | 797 | | 6,998 |
Harleysville Group, Inc. | 874 | | 31,106 |
Infinity Property & Casualty Corp. | 621 | | 35,850 |
Kansas City Life Insurance Co. | 510 | | 15,978 |
Common Stocks - continued |
| Shares | | Value |
FINANCIALS - continued |
Insurance - continued |
Maiden Holdings Ltd. | 3,225 | | $ 24,284 |
National Interstate Corp. | 731 | | 15,095 |
National Western Life Insurance Co. Class A | 165 | | 27,510 |
Navigators Group, Inc. (a) | 671 | | 33,208 |
Penn Millers Holding Corp. (a) | 524 | | 7,016 |
Presidential Life Corp. | 1,016 | | 9,418 |
Safety Insurance Group, Inc. | 623 | | 29,163 |
Selective Insurance Group, Inc. | 2,151 | | 35,492 |
State Auto Financial Corp. | 1,581 | | 24,885 |
Tower Group, Inc. | 1,653 | | 42,515 |
United Fire & Casualty Co. | 1,226 | | 25,427 |
| | 1,312,563 |
Real Estate Investment Trusts - 0.1% |
American Capital Agency Corp. | 2,029 | | 59,490 |
Gladstone Commercial Corp. | 546 | | 10,101 |
Investors Real Estate Trust | 2,820 | | 24,957 |
Mission West Properties, Inc. | 676 | | 4,414 |
Retail Opportunity Investments Corp. | 1,933 | | 19,001 |
| | 117,963 |
Real Estate Management & Development - 0.1% |
Altisource Portfolio Solutions SA (a) | 950 | | 25,821 |
Avatar Holdings, Inc. (a) | 266 | | 5,216 |
China HGS Real Estate, Inc. (a) | 2,100 | | 7,455 |
China Housing & Land Development, Inc. (a)(d) | 1,732 | | 4,139 |
China Real Estate Information Corp. ADR (a)(d) | 473 | | 4,328 |
Elbit Imaging Ltd. (a) | 1,350 | | 16,335 |
FirstService Corp. (sub. vtg.) (a) | 1,371 | | 35,898 |
Stratus Properties, Inc. (a) | 266 | | 2,359 |
Thomas Properties Group, Inc. (a) | 1,876 | | 8,048 |
ZipRealty, Inc. (a) | 1,230 | | 3,050 |
| | 112,649 |
Thrifts & Mortgage Finance - 0.9% |
Abington Bancorp, Inc. | 1,176 | | 14,112 |
America First Tax Exempt Investors LP | 1,272 | | 6,678 |
Anchor BanCorp Wisconsin, Inc. (a)(d) | 936 | | 824 |
Atlantic Coast Federal Corp. (a) | 691 | | 1,354 |
Bank Mutual Corp. | 2,106 | | 9,645 |
BankFinancial Corp. | 1,191 | | 11,112 |
Beneficial Mutual Bancorp, Inc. (a) | 3,991 | | 31,010 |
Berkshire Bancorp, Inc. (a) | 960 | | 4,320 |
Common Stocks - continued |
| Shares | | Value |
FINANCIALS - continued |
Thrifts & Mortgage Finance - continued |
Berkshire Hills Bancorp, Inc. | 735 | | $ 14,751 |
BofI Holding, Inc. (a) | 519 | | 6,996 |
Brookline Bancorp, Inc., Delaware | 2,400 | | 23,592 |
Camco Financial Corp. (a) | 511 | | 644 |
Capitol Federal Financial | 2,907 | | 67,878 |
CFS Bancorp, Inc. | 375 | | 1,969 |
Charter Financial Corp., Georgia | 850 | | 7,004 |
Citizens South Banking Corp., Delaware | 504 | | 2,283 |
Clifton Savings Bancorp, Inc. | 990 | | 9,365 |
Dime Community Bancshares, Inc. | 1,213 | | 16,557 |
Eagle Bancorp Montana, Inc. | 618 | | 6,180 |
ESB Financial Corp. | 600 | | 8,460 |
ESSA Bancorp, Inc. | 623 | | 8,192 |
First Defiance Financial Corp. (a) | 331 | | 3,916 |
First Federal Bancshares of Arkansas, Inc. (a) | 435 | | 496 |
First Financial Holdings, Inc. | 816 | | 8,968 |
First Financial Northwest, Inc. | 805 | | 2,616 |
First Niagara Financial Group, Inc. | 8,177 | | 101,272 |
First PacTrust Bancorp, Inc. | 480 | | 5,760 |
First Place Financial Corp. (a) | 871 | | 1,864 |
Flushing Financial Corp. | 1,290 | | 17,286 |
Fox Chase Bancorp, Inc. (a) | 851 | | 8,944 |
HMN Financial, Inc. (a) | 216 | | 626 |
Home Federal Bancorp, Inc. | 750 | | 8,648 |
Hudson City Bancorp, Inc. | 20,538 | | 233,106 |
Kaiser Federal Financial Group, Inc. | 608 | | 5,873 |
Kearny Financial Corp. | 3,436 | | 29,515 |
LSB Corp. | 171 | | 3,582 |
Meridian Interstate Bancorp, Inc. (a) | 1,256 | | 13,753 |
MutualFirst Financial, Inc. | 346 | | 2,958 |
NASB Financial, Inc. | 406 | | 5,221 |
Northwest Bancshares, Inc. | 4,320 | | 44,323 |
OceanFirst Financial Corp. | 600 | | 7,242 |
Oritani Financial Corp. | 2,326 | | 26,121 |
Parkvale Financial Corp. | 300 | | 2,337 |
People's United Financial, Inc. | 14,277 | | 176,892 |
Provident Financial Holdings, Inc. | 226 | | 1,514 |
Provident New York Bancorp | 2,176 | | 20,389 |
Pulaski Financial Corp. | 181 | | 1,381 |
PVF Capital Corp. (a) | 791 | | 1,463 |
Riverview Bancorp, Inc. (a) | 1,320 | | 3,115 |
Common Stocks - continued |
| Shares | | Value |
FINANCIALS - continued |
Thrifts & Mortgage Finance - continued |
Rockville Financial, Inc. | 1,350 | | $ 14,850 |
Roma Financial Corp. | 1,596 | | 15,385 |
Severn Bancorp, Inc. (a) | 801 | | 2,307 |
Territorial Bancorp, Inc. | 600 | | 11,052 |
TFS Financial Corp. | 11,756 | | 96,164 |
Tree.com, Inc. (a) | 805 | | 6,110 |
Trustco Bank Corp., New York | 3,054 | | 17,133 |
United Community Financial Corp., Ohio (a) | 1,403 | | 1,726 |
United Financial Bancorp, Inc. | 1,070 | | 15,868 |
United Western Bancorp, Inc. (a) | 270 | | 76 |
ViewPoint Financial Group | 2,052 | | 21,525 |
Washington Federal, Inc. | 4,376 | | 64,590 |
Waterstone Financial, Inc. (a) | 1,776 | | 6,482 |
Westfield Financial, Inc. | 1,872 | | 15,388 |
WSFS Financial Corp. | 266 | | 11,571 |
| | 1,292,334 |
TOTAL FINANCIALS | | 10,494,737 |
HEALTH CARE - 12.9% |
Biotechnology - 6.0% |
3SBio, Inc. sponsored ADR (a) | 809 | | 12,418 |
Aastrom Biosciences, Inc. (a) | 608 | | 1,465 |
Acadia Pharmaceuticals, Inc. (a) | 2,295 | | 1,538 |
Achillion Pharmaceuticals, Inc. (a) | 3,313 | | 9,475 |
Acorda Therapeutics, Inc. (a) | 1,485 | | 39,130 |
AEterna Zentaris, Inc. (sub. vtg.) (a) | 6,110 | | 8,749 |
Affymax, Inc. (a) | 806 | | 5,449 |
Alexion Pharmaceuticals, Inc. (a) | 3,524 | | 269,410 |
Alkermes, Inc. (a) | 3,831 | | 40,149 |
Allos Therapeutics, Inc. (a) | 4,965 | | 20,158 |
Alnylam Pharmaceuticals, Inc. (a) | 1,641 | | 15,015 |
AMAG Pharmaceuticals, Inc. (a) | 815 | | 12,787 |
Amgen, Inc. (a) | 37,400 | | 1,970,606 |
Amicus Therapeutics, Inc. (a) | 1,041 | | 4,320 |
Amylin Pharmaceuticals, Inc. (a) | 5,565 | | 71,315 |
Anadys Pharmaceuticals, Inc. (a) | 1,441 | | 1,542 |
Anthera Pharmaceuticals, Inc. | 750 | | 4,103 |
Antigenics, Inc. (a) | 2,010 | | 1,789 |
Arena Pharmaceuticals, Inc. (a)(d) | 4,364 | | 6,328 |
ARIAD Pharmaceuticals, Inc. (a) | 4,441 | | 17,897 |
Common Stocks - continued |
| Shares | | Value |
HEALTH CARE - continued |
Biotechnology - continued |
ArQule, Inc. (a) | 1,941 | | $ 10,540 |
Array Biopharma, Inc. (a) | 1,680 | | 5,393 |
AspenBio Pharma, Inc. (a) | 1,226 | | 748 |
AVEO Pharmaceuticals, Inc. | 1,060 | | 15,667 |
AVI BioPharma, Inc. (a) | 4,555 | | 8,381 |
BioCryst Pharmaceuticals, Inc. (a) | 2,280 | | 11,263 |
Biogen Idec, Inc. (a) | 9,500 | | 607,715 |
BioMarin Pharmaceutical, Inc. (a) | 4,041 | | 109,430 |
Bionovo, Inc. (a) | 2,269 | | 3,086 |
Biosante Pharmaceuticals, Inc. (a) | 1,663 | | 2,445 |
Biospecifics Technologies Corp. (a) | 250 | | 5,670 |
Capstone Therapeutics Corp. (a) | 2,601 | | 2,419 |
Celera Corp. (a) | 3,111 | | 17,639 |
Celgene Corp. (a) | 17,872 | | 1,061,239 |
Cell Therapeutics, Inc. (a) | 23,803 | | 9,283 |
Celldex Therapeutics, Inc. (a) | 811 | | 3,366 |
Cephalon, Inc. (a) | 2,935 | | 186,343 |
Cepheid, Inc. (a) | 2,423 | | 47,709 |
Chelsea Therapeutics International Ltd. (a) | 1,898 | | 10,306 |
China Biologic Products, Inc. (a)(d) | 1,000 | | 11,640 |
Cleveland Biolabs, Inc. (a) | 624 | | 4,200 |
Clinical Data, Inc. (a) | 951 | | 17,384 |
Codexis, Inc. (a) | 1,476 | | 13,904 |
Crucell NV sponsored ADR (a) | 480 | | 15,029 |
Cubist Pharmaceuticals, Inc. (a) | 2,306 | | 50,063 |
Curis, Inc. (a) | 2,541 | | 4,269 |
Cyclacel Pharmaceuticals, Inc. (a) | 2,291 | | 4,193 |
Cytokinetics, Inc. (a) | 1,875 | | 4,144 |
Cytori Therapeutics, Inc. (a) | 1,800 | | 8,082 |
CytRx Corp. (a) | 6,000 | | 6,240 |
Dendreon Corp. (a) | 5,600 | | 200,144 |
Discovery Laboratories, Inc. (a) | 3,696 | | 739 |
Dyax Corp. (a) | 2,856 | | 6,455 |
Dynavax Technologies Corp. (a) | 2,585 | | 5,170 |
Emergent BioSolutions, Inc. rights 10/29/13 (a) | 1,192 | | 0 |
EntreMed, Inc. (a) | 452 | | 3,268 |
Enzon Pharmaceuticals, Inc. (a) | 2,322 | | 25,821 |
EpiCept Corp. (a) | 3,639 | | 1,201 |
Exact Sciences Corp. (a) | 1,524 | | 9,053 |
Exelixis, Inc. (a) | 3,960 | | 22,928 |
Genomic Health, Inc. (a) | 1,155 | | 21,310 |
Common Stocks - continued |
| Shares | | Value |
HEALTH CARE - continued |
Biotechnology - continued |
Gentium SpA sponsored ADR (a) | 778 | | $ 4,396 |
GenVec, Inc. (a) | 3,931 | | 1,887 |
Genzyme Corp. (a) | 10,000 | | 712,200 |
Geron Corp. (a)(d) | 3,411 | | 19,545 |
Gilead Sciences, Inc. (a) | 33,000 | | 1,204,500 |
GTx, Inc. (a) | 1,470 | | 4,263 |
Halozyme Therapeutics, Inc. (a) | 3,666 | | 25,369 |
Human Genome Sciences, Inc. (a) | 7,378 | | 180,982 |
Idenix Pharmaceuticals, Inc. (a) | 3,004 | | 11,445 |
Idera Pharmaceuticals, Inc. (a) | 1,200 | | 2,976 |
ImmunoGen, Inc. (a) | 2,475 | | 20,592 |
Immunomedics, Inc. (a)(d) | 3,726 | | 11,737 |
Incyte Corp. (a) | 4,716 | | 68,429 |
Infinity Pharmaceuticals, Inc. (a) | 1,690 | | 10,630 |
Inhibitex, Inc. (a) | 3,363 | | 9,854 |
Insmed, Inc. (a) | 6,038 | | 4,347 |
InterMune, Inc. (a) | 2,197 | | 27,594 |
Ironwood Pharmaceuticals, Inc. Class A | 1,700 | | 18,173 |
Isis Pharmaceuticals, Inc. (a) | 3,906 | | 36,853 |
Keryx Biopharmaceuticals, Inc. (a) | 2,384 | | 13,017 |
Lexicon Pharmaceuticals, Inc. (a) | 13,164 | | 17,903 |
Ligand Pharmaceuticals, Inc.: | | | |
rights 12/31/11 (a) | 1,431 | | 0 |
Class B (a) | 1,050 | | 8,862 |
rights (a) | 1,530 | | 42 |
rights (a) | 1,530 | | 69 |
rights (a) | 1,530 | | 40 |
rights (a) | 1,530 | | 40 |
MannKind Corp. (a)(d) | 4,984 | | 31,300 |
Marina Biotech, Inc. (a)(d) | 990 | | 1,752 |
Marshall Edwards, Inc. (a) | 225 | | 199 |
Martek Biosciences (a) | 1,455 | | 32,010 |
Maxygen, Inc. | 1,686 | | 10,908 |
Medivation, Inc. (a) | 1,338 | | 15,160 |
Metabolix, Inc. (a) | 1,021 | | 10,455 |
Micromet, Inc. (a) | 2,640 | | 19,166 |
Molecular Insight Pharmaceuticals, Inc. (a)(d) | 1,425 | | 1,140 |
Momenta Pharmaceuticals, Inc. (a) | 1,656 | | 25,254 |
Myrexis, Inc. (a) | 866 | | 3,230 |
Myriad Genetics, Inc. (a) | 3,714 | | 79,962 |
Nabi Biopharmaceuticals (a) | 2,145 | | 11,154 |
Common Stocks - continued |
| Shares | | Value |
HEALTH CARE - continued |
Biotechnology - continued |
Nanosphere, Inc. (a) | 1,581 | | $ 8,269 |
Neurocrine Biosciences, Inc. (a) | 2,112 | | 15,375 |
NeurogesX, Inc. (a) | 1,294 | | 6,936 |
Novavax, Inc. (a) | 3,696 | | 8,242 |
NPS Pharmaceuticals, Inc. (a) | 2,371 | | 14,724 |
Nymox Pharmaceutical Corp. (a) | 1,170 | | 4,785 |
Omeros Corp. (a) | 1,209 | | 9,805 |
OncoGenex Pharmaceuticals, Inc. (a) | 285 | | 4,577 |
Oncolytics Biotech, Inc. (a) | 2,080 | | 9,725 |
Oncothyreon, Inc. (a) | 1,186 | | 3,949 |
ONYX Pharmaceuticals, Inc. (a) | 2,314 | | 68,147 |
Orchid Cellmark, Inc. (a) | 2,526 | | 4,092 |
OREXIGEN Therapeutics, Inc. (a)(d) | 1,671 | | 8,706 |
Osiris Therapeutics, Inc. (a) | 1,320 | | 8,659 |
OXiGENE, Inc. (a) | 4,911 | | 1,007 |
Oxygen Biotherapeutics, Inc. (a) | 1,711 | | 3,679 |
PDL BioPharma, Inc. | 4,561 | | 26,363 |
Peregrine Pharmaceuticals, Inc. (a) | 1,371 | | 2,111 |
Pharmacyclics, Inc. (a) | 2,850 | | 15,447 |
Pharmasset, Inc. (a) | 1,330 | | 57,616 |
Poniard Pharmaceuticals, Inc. (a) | 1,860 | | 675 |
Progenics Pharmaceuticals, Inc. (a) | 1,275 | | 6,056 |
QLT, Inc. (a) | 2,343 | | 14,175 |
Regeneron Pharmaceuticals, Inc. (a) | 3,114 | | 89,745 |
Repligen Corp. (a) | 1,396 | | 5,193 |
Rigel Pharmaceuticals, Inc. (a) | 2,038 | | 16,263 |
RXi Pharmaceuticals Corp. (a) | 1,015 | | 3,593 |
Sangamo Biosciences, Inc. (a) | 1,786 | | 8,323 |
Savient Pharmaceuticals, Inc. (a) | 2,500 | | 29,525 |
SciClone Pharmaceuticals, Inc. (a) | 1,906 | | 7,128 |
Seattle Genetics, Inc. (a) | 3,631 | | 54,828 |
SIGA Technologies, Inc. (a) | 1,755 | | 22,113 |
Sinovac Biotech Ltd. (a) | 2,373 | | 11,509 |
Spectrum Pharmaceuticals, Inc. (a) | 2,391 | | 10,640 |
StemCells, Inc. (a) | 4,613 | | 4,890 |
Sunesis Pharmaceuticals, Inc. (a) | 1,875 | | 739 |
Synta Pharmaceuticals Corp. (a) | 1,267 | | 5,435 |
Talecris Biotherapeutics Holdings Corp. (a) | 4,791 | | 103,965 |
Targacept, Inc. (a) | 1,066 | | 22,599 |
Telik, Inc. (a) | 2,391 | | 1,722 |
Theravance, Inc. (a) | 2,299 | | 57,429 |
Common Stocks - continued |
| Shares | | Value |
HEALTH CARE - continued |
Biotechnology - continued |
Transcept Pharmaceuticals, Inc. (a) | 574 | | $ 3,697 |
Transition Therapeutics, Inc. (a) | 2,160 | | 5,407 |
Trimeris, Inc. (a) | 885 | | 2,239 |
Trius Therapeutics, Inc. | 938 | | 3,245 |
United Therapeutics Corp. (a) | 2,216 | | 139,453 |
Vanda Pharmaceuticals, Inc. (a) | 1,276 | | 10,285 |
Vertex Pharmaceuticals, Inc. (a) | 7,950 | | 263,384 |
Vical, Inc. (a) | 2,055 | | 4,028 |
XOMA Ltd. (a) | 491 | | 1,169 |
Zalicus, Inc. (a) | 3,496 | | 4,125 |
ZIOPHARM Oncology, Inc. (a) | 2,400 | | 9,864 |
| | 8,930,612 |
Health Care Equipment & Supplies - 1.6% |
Abaxis, Inc. (a) | 875 | | 23,625 |
Abiomed, Inc. (a) | 1,236 | | 14,189 |
Accuray, Inc. (a) | 2,161 | | 12,923 |
Align Technology, Inc. (a) | 2,745 | | 48,010 |
Alimera Sciences, Inc. (a)(d) | 1,324 | | 15,147 |
Alphatec Holdings, Inc. (a) | 2,655 | | 5,974 |
American Medical Systems Holdings, Inc. (a) | 2,811 | | 50,401 |
Analogic Corp. | 510 | | 23,700 |
Angiodynamics, Inc. (a) | 991 | | 13,844 |
Anika Therapeutics, Inc. (a) | 1,231 | | 7,521 |
ArthroCare Corp. (a) | 1,040 | | 31,491 |
Atrion Corp. | 85 | | 13,952 |
BioLase Technology, Inc. (a)(d) | 1,050 | | 1,607 |
Cardiac Science Corp. (a) | 1,056 | | 2,439 |
Cardica, Inc. (a) | 871 | | 2,343 |
Cardiovascular Systems, Inc. (a) | 456 | | 4,086 |
Cerus Corp. (a)(d) | 1,786 | | 4,304 |
China Medical Technologies, Inc. sponsored ADR (a) | 881 | | 10,070 |
Conceptus, Inc. (a) | 1,086 | | 14,281 |
CONMED Corp. (a) | 1,275 | | 27,425 |
Cutera, Inc. (a) | 421 | | 2,951 |
Cyberonics, Inc. (a) | 1,371 | | 36,839 |
Cynosure, Inc. Class A (a) | 330 | | 3,128 |
Delcath Systems, Inc. (a)(d) | 1,463 | | 14,718 |
DENTSPLY International, Inc. | 5,813 | | 179,738 |
DexCom, Inc. (a) | 2,196 | | 24,760 |
DynaVox, Inc. Class A (a) | 442 | | 1,741 |
Common Stocks - continued |
| Shares | | Value |
HEALTH CARE - continued |
Health Care Equipment & Supplies - continued |
Endologix, Inc. (a) | 2,340 | | $ 13,291 |
Exactech, Inc. (a) | 761 | | 13,561 |
Gen-Probe, Inc. (a) | 1,918 | | 99,467 |
Given Imaging Ltd. (a) | 1,477 | | 22,303 |
Hansen Medical, Inc. (a) | 1,221 | | 1,758 |
HeartWare International, Inc. (a) | 563 | | 51,773 |
Hologic, Inc. (a) | 10,366 | | 170,002 |
ICU Medical, Inc. (a) | 660 | | 24,189 |
IDEXX Laboratories, Inc. (a) | 2,255 | | 144,794 |
Immucor, Inc. (a) | 2,807 | | 51,565 |
Insulet Corp. (a) | 1,510 | | 20,491 |
Integra LifeSciences Holdings Corp. (a) | 1,076 | | 46,666 |
Intuitive Surgical, Inc. (a) | 1,525 | | 396,942 |
IRIS International, Inc. (a) | 1,066 | | 10,010 |
Kensey Nash Corp. (a) | 585 | | 15,877 |
Mako Surgical Corp. (a) | 1,110 | | 12,732 |
Masimo Corp. | 2,197 | | 67,799 |
Medical Action Industries, Inc. (a) | 690 | | 5,492 |
MELA Sciences, Inc. (a)(d) | 751 | | 2,674 |
Meridian Bioscience, Inc. | 1,656 | | 36,796 |
Merit Medical Systems, Inc. (a) | 981 | | 14,950 |
Natus Medical, Inc. (a) | 1,076 | | 13,837 |
Neogen Corp. (a) | 900 | | 33,435 |
NeuroMetrix, Inc. (a) | 586 | | 304 |
NMT Medical, Inc. (a) | 826 | | 173 |
NuVasive, Inc. (a) | 1,452 | | 33,919 |
NxStage Medical, Inc. (a) | 1,863 | | 40,315 |
OraSure Technologies, Inc. (a) | 1,785 | | 9,371 |
Orthofix International NV (a) | 668 | | 18,163 |
Orthovita, Inc. (a) | 3,111 | | 6,191 |
OTIX Global, Inc. (a) | 134 | | 1,475 |
Palomar Medical Technologies, Inc. (a) | 771 | | 9,599 |
Quidel Corp. (a) | 1,116 | | 14,742 |
Rochester Medical Corp. (a) | 525 | | 5,807 |
Rockwell Medical Technologies, Inc. (a) | 965 | | 7,517 |
RTI Biologics, Inc. (a) | 2,691 | | 7,293 |
Shamir Optical Industry Ltd. | 586 | | 7,964 |
Sirona Dental Systems, Inc. (a) | 2,226 | | 84,121 |
Solta Medical, Inc. (a) | 2,539 | | 5,154 |
SonoSite, Inc. (a) | 735 | | 22,329 |
Staar Surgical Co. (a) | 1,050 | | 5,618 |
Common Stocks - continued |
| Shares | | Value |
HEALTH CARE - continued |
Health Care Equipment & Supplies - continued |
Stereotaxis, Inc. (a) | 1,696 | | $ 5,851 |
SurModics, Inc. (a) | 690 | | 6,383 |
Syneron Medical Ltd. (a) | 1,309 | | 12,632 |
Synovis Life Technologies, Inc. (a) | 794 | | 12,823 |
The Spectranetics Corp. (a) | 1,800 | | 8,802 |
ThermoGenesis Corp. (a) | 826 | | 2,288 |
Thoratec Corp. (a) | 2,250 | | 57,274 |
TomoTherapy, Inc. (a) | 1,860 | | 6,510 |
Trinity Biotech PLC sponsored ADR (a) | 1,170 | | 9,407 |
Unilife Corp. (a)(d) | 2,000 | | 10,860 |
Urologix, Inc. (a) | 771 | | 567 |
Utah Medical Products, Inc. | 200 | | 5,446 |
Vascular Solutions, Inc. (a) | 1,201 | | 12,707 |
Vermillion, Inc. (a) | 568 | | 2,721 |
Volcano Corp. (a) | 2,036 | | 54,056 |
Winner Medical Group, Inc. (a) | 972 | | 5,521 |
Wright Medical Group, Inc. (a) | 1,425 | | 18,796 |
Young Innovations, Inc. | 510 | | 15,412 |
Zoll Medical Corp. (a) | 819 | | 27,371 |
| | 2,417,093 |
Health Care Providers & Services - 1.6% |
Addus HomeCare Corp. (a) | 435 | | 1,810 |
Air Methods Corp. (a) | 570 | | 28,061 |
Allied Healthcare International, Inc. (a) | 3,286 | | 9,529 |
Almost Family, Inc. (a) | 321 | | 11,376 |
Amedisys, Inc. (a) | 1,026 | | 29,118 |
America Service Group, Inc. | 451 | | 6,621 |
American Dental Partners, Inc. (a) | 391 | | 4,829 |
AmSurg Corp. (a) | 1,320 | | 24,262 |
Animal Health International, Inc. (a) | 901 | | 2,253 |
Bio-Reference Laboratories, Inc. (a) | 870 | | 18,244 |
BioScrip, Inc. (a) | 1,566 | | 6,295 |
CardioNet, Inc. (a) | 1,649 | | 6,662 |
Catalyst Health Solutions, Inc. (a) | 1,585 | | 68,028 |
Chindex International, Inc. (a) | 606 | | 9,229 |
Clarient, Inc. (a) | 3,000 | | 15,000 |
Corvel Corp. (a) | 480 | | 21,931 |
Cross Country Healthcare, Inc. (a) | 1,056 | | 8,110 |
Express Scripts, Inc. (a) | 21,349 | | 1,112,069 |
Genoptix, Inc. (a) | 666 | | 11,369 |
Common Stocks - continued |
| Shares | | Value |
HEALTH CARE - continued |
Health Care Providers & Services - continued |
Gentiva Health Services, Inc. (a) | 1,096 | | $ 25,186 |
Healthways, Inc. (a) | 1,491 | | 14,388 |
Henry Schein, Inc. (a) | 3,576 | | 205,370 |
HMS Holdings Corp. (a) | 1,051 | | 66,224 |
IPC The Hospitalist Co., Inc. (a) | 634 | | 20,554 |
LCA-Vision, Inc. (a) | 900 | | 4,662 |
LHC Group, Inc. (a) | 780 | | 20,631 |
LifePoint Hospitals, Inc. (a) | 2,136 | | 77,366 |
Lincare Holdings, Inc. | 3,811 | | 98,133 |
Magellan Health Services, Inc. (a) | 1,323 | | 64,430 |
Medcath Corp. (a) | 746 | | 9,415 |
MWI Veterinary Supply, Inc. (a) | 500 | | 30,550 |
NightHawk Radiology Holdings, Inc. (a) | 1,201 | | 7,794 |
NovaMed Eyecare, Inc. (a) | 320 | | 3,718 |
Patterson Companies, Inc. | 4,905 | | 145,826 |
PDI, Inc. (a) | 615 | | 5,818 |
Prospect Medical Holdings, Inc. (a) | 1,503 | | 12,685 |
Providence Service Corp. (a) | 810 | | 13,616 |
PSS World Medical, Inc. (a) | 2,361 | | 48,637 |
RadNet, Inc. (a) | 2,005 | | 5,153 |
ResCare, Inc. (a) | 1,365 | | 18,059 |
Rural/Metro Corp. (a) | 1,058 | | 11,987 |
Sharps Compliance Corp. (a) | 891 | | 4,045 |
Sun Healthcare Group, Inc. (a) | 778 | | 7,624 |
The Ensign Group, Inc. | 805 | | 17,316 |
U.S. Physical Therapy, Inc. (a) | 666 | | 12,781 |
VCA Antech, Inc. (a) | 3,030 | | 66,190 |
| | 2,412,954 |
Health Care Technology - 0.5% |
Allscripts-Misys Healthcare Solutions, Inc. (a) | 6,273 | | 110,091 |
athenahealth, Inc. (a) | 1,331 | | 54,584 |
Cerner Corp. (a) | 3,148 | | 276,583 |
Computer Programs & Systems, Inc. | 431 | | 20,123 |
MedAssets, Inc. (a) | 2,346 | | 43,507 |
Medidata Solutions, Inc. (a) | 1,100 | | 21,890 |
MedQuist, Inc. | 1,000 | | 8,920 |
Merge Healthcare, Inc. (a) | 2,716 | | 10,484 |
Omnicell, Inc. (a) | 1,401 | | 18,773 |
Quality Systems, Inc. | 1,034 | | 66,683 |
SXC Health Solutions Corp. (a) | 2,502 | | 95,659 |
Common Stocks - continued |
| Shares | | Value |
HEALTH CARE - continued |
Health Care Technology - continued |
Transcend Services, Inc. (a) | 481 | | $ 7,696 |
Vital Images, Inc. (a) | 979 | | 13,138 |
| | 748,131 |
Life Sciences Tools & Services - 1.0% |
Accelrys, Inc. (a) | 2,308 | | 19,433 |
Affymetrix, Inc. (a) | 3,366 | | 14,003 |
Albany Molecular Research, Inc. (a) | 1,371 | | 6,924 |
Arrowhead Research Corp. (a) | 2,070 | | 1,967 |
Bruker BioSciences Corp. (a) | 6,300 | | 97,146 |
Caliper Life Sciences, Inc. (a) | 1,785 | | 10,478 |
Complete Genomics, Inc. | 1,150 | | 8,913 |
Compugen Ltd. (a) | 2,285 | | 8,660 |
Dionex Corp. (a) | 776 | | 70,748 |
eResearchTechnology, Inc. (a) | 2,071 | | 11,618 |
Furiex Pharmaceuticals, Inc. (a) | 385 | | 4,743 |
Harvard Bioscience, Inc. (a) | 1,984 | | 7,777 |
ICON PLC sponsored ADR (a) | 2,286 | | 46,017 |
Illumina, Inc. (a) | 4,806 | | 288,937 |
Kendle International, Inc. (a) | 671 | | 6,046 |
Life Technologies Corp. (a) | 7,100 | | 353,616 |
Luminex Corp. (a) | 1,730 | | 29,202 |
Medtox Scientific, Inc. | 360 | | 4,176 |
Pacific Biosciences of California, Inc. | 2,480 | | 31,248 |
PAREXEL International Corp. (a) | 2,136 | | 37,508 |
Pharmaceutical Product Development, Inc. | 4,621 | | 115,155 |
Pure Bioscience (a) | 2,955 | | 6,353 |
QIAGEN NV (a)(d) | 9,016 | | 164,993 |
Sequenom, Inc. (a)(d) | 2,482 | | 17,051 |
Techne Corp. | 1,500 | | 90,105 |
| | 1,452,817 |
Pharmaceuticals - 2.2% |
Acura Pharmaceuticals, Inc. (a)(d) | 1,613 | | 4,258 |
Adolor Corp. (a) | 1,695 | | 2,119 |
Akorn, Inc. (a) | 3,231 | | 17,157 |
Alexza Pharmaceuticals, Inc. (a) | 3,650 | | 3,299 |
Angiotech Pharmaceuticals, Inc. (a) | 3,411 | | 781 |
Ardea Biosciences, Inc. (a) | 863 | | 19,184 |
Auxilium Pharmaceuticals, Inc. (a) | 1,774 | | 33,582 |
AVANIR Pharmaceuticals Class A (a)(d) | 4,295 | | 18,383 |
Biodel, Inc. (a)(d) | 1,499 | | 2,548 |
Common Stocks - continued |
| Shares | | Value |
HEALTH CARE - continued |
Pharmaceuticals - continued |
BioMimetic Therapeutics, Inc. (a) | 1,109 | | $ 12,376 |
BMP Sunstone Corp. (a) | 1,726 | | 17,053 |
Cadence Pharmaceuticals, Inc. (a)(d) | 1,886 | | 13,523 |
Cardiome Pharma Corp. (a) | 2,569 | | 12,512 |
China Nuokang Bio-Pharmaceutical, Inc. sponsored ADR (a) | 186 | | 744 |
Columbia Laboratories, Inc. (a) | 1,546 | | 2,072 |
Corcept Therapeutics, Inc. (a) | 2,565 | | 10,004 |
Cumberland Pharmaceuticals, Inc. (a) | 690 | | 4,733 |
Cypress Bioscience, Inc. (a) | 1,545 | | 6,149 |
DepoMed, Inc. (a) | 3,066 | | 16,740 |
Durect Corp. (a) | 3,921 | | 11,685 |
Endo Pharmaceuticals Holdings, Inc. (a) | 4,681 | | 168,563 |
Eurand NV (a) | 1,671 | | 18,331 |
Flamel Technologies SA sponsored ADR (a) | 1,035 | | 7,338 |
Hi-Tech Pharmacal Co., Inc. (a) | 406 | | 9,655 |
Impax Laboratories, Inc. (a) | 2,400 | | 42,960 |
Inspire Pharmaceuticals, Inc. (a) | 3,100 | | 21,638 |
Ista Pharmaceuticals, Inc. (a) | 1,926 | | 8,571 |
Jazz Pharmaceuticals, Inc. (a) | 1,289 | | 21,462 |
Jiangbo Pharmaceuticals, Inc. (a) | 497 | | 3,022 |
Labopharm, Inc. (a)(d) | 2,505 | | 2,416 |
MAP Pharmaceuticals, Inc. (a) | 1,059 | | 15,218 |
Matrixx Initiatives, Inc. (a) | 465 | | 2,409 |
Mylan, Inc. (a) | 16,974 | | 332,096 |
Nektar Therapeutics (a) | 3,696 | | 46,828 |
Novogen Ltd. sponsored ADR (a) | 316 | | 158 |
NuPathe, Inc. | 469 | | 2,800 |
Obagi Medical Products, Inc. (a) | 1,176 | | 12,842 |
Optimer Pharmaceuticals, Inc. (a) | 1,354 | | 12,822 |
Pain Therapeutics, Inc. | 2,176 | | 17,343 |
Perrigo Co. | 3,506 | | 211,201 |
Pozen, Inc. (a) | 1,191 | | 7,622 |
Questcor Pharmaceuticals, Inc. (a) | 2,536 | | 36,113 |
Salix Pharmaceuticals Ltd. (a) | 2,269 | | 101,311 |
Santarus, Inc. (a) | 2,436 | | 6,723 |
Shire PLC sponsored ADR | 2,164 | | 152,216 |
Skystar Bio-Pharmaceutical Co. Ltd. (a) | 595 | | 4,915 |
Somaxon Pharmaceuticals, Inc. (a)(d) | 1,712 | | 4,605 |
Sucampo Pharmaceuticals, Inc. Class A (a) | 751 | | 2,591 |
SuperGen, Inc. (a) | 1,906 | | 5,051 |
Teva Pharmaceutical Industries Ltd. sponsored ADR | 27,996 | | 1,400,920 |
Common Stocks - continued |
| Shares | | Value |
HEALTH CARE - continued |
Pharmaceuticals - continued |
The Medicines Company (a) | 1,941 | | $ 25,582 |
ViroPharma, Inc. (a) | 3,230 | | 49,904 |
Vivus, Inc. (a)(d) | 3,201 | | 20,807 |
Warner Chilcott PLC | 9,886 | | 187,933 |
XenoPort, Inc. (a) | 1,086 | | 8,417 |
| | 3,181,285 |
TOTAL HEALTH CARE | | 19,142,892 |
INDUSTRIALS - 5.3% |
Aerospace & Defense - 0.3% |
AeroVironment, Inc. (a) | 952 | | 23,514 |
American Science & Engineering, Inc. | 405 | | 32,651 |
Applied Energetics, Inc. (a) | 4,146 | | 3,317 |
Applied Signal Technology, Inc. | 651 | | 21,392 |
Ascent Solar Technologies, Inc. (a)(d) | 1,971 | | 6,287 |
BE Aerospace, Inc. (a) | 3,984 | | 141,432 |
Ceradyne, Inc. (a) | 1,041 | | 27,503 |
Elbit Systems Ltd. | 1,595 | | 74,646 |
GeoEye, Inc. (a) | 850 | | 33,881 |
Global Defense Technology & Systems, Inc. | 452 | | 6,165 |
Herley Industries, Inc. (a) | 765 | | 12,439 |
Innovative Solutions & Support, Inc. (a) | 856 | | 4,734 |
KEYW Holding Corp. | 1,000 | | 12,500 |
Kratos Defense & Security Solutions, Inc. (a) | 719 | | 7,600 |
Ladish Co., Inc. (a) | 606 | | 28,446 |
LMI Aerospace, Inc. (a) | 461 | | 7,500 |
Sypris Solutions, Inc. (a) | 981 | | 3,345 |
Taser International, Inc. (a) | 2,706 | | 10,905 |
| | 458,257 |
Air Freight & Logistics - 0.8% |
Air Transport Services Group, Inc. (a) | 2,160 | | 15,941 |
Atlas Air Worldwide Holdings, Inc. (a) | 865 | | 47,194 |
C.H. Robinson Worldwide, Inc. | 6,358 | | 468,648 |
Dynamex, Inc. (a) | 546 | | 13,186 |
Expeditors International of Washington, Inc. | 8,199 | | 433,727 |
Forward Air Corp. | 1,200 | | 33,024 |
Hub Group, Inc. Class A (a) | 1,385 | | 45,193 |
Pacer International, Inc. (a) | 1,536 | | 8,586 |
Common Stocks - continued |
| Shares | | Value |
INDUSTRIALS - continued |
Air Freight & Logistics - continued |
Park-Ohio Holdings Corp. (a) | 711 | | $ 13,758 |
UTI Worldwide, Inc. | 3,996 | | 76,923 |
| | 1,156,180 |
Airlines - 0.2% |
Allegiant Travel Co. | 716 | | 35,750 |
Hawaiian Holdings, Inc. (a) | 2,395 | | 18,921 |
JetBlue Airways Corp. (a) | 11,197 | | 76,028 |
Pinnacle Airlines Corp. (a) | 1,261 | | 10,252 |
Republic Airways Holdings, Inc. (a) | 1,686 | | 13,083 |
Ryanair Holdings PLC sponsored ADR | 4,488 | | 137,019 |
SkyWest, Inc. | 2,269 | | 36,735 |
| | 327,788 |
Building Products - 0.1% |
AAON, Inc. | 698 | | 17,904 |
American Woodmark Corp. | 641 | | 13,339 |
Apogee Enterprises, Inc. | 1,206 | | 13,568 |
Builders FirstSource, Inc. (a) | 4,781 | | 7,554 |
China Architectural Engineering, Inc. (a) | 5,793 | | 3,425 |
China Ceramics Co. Ltd. (a) | 800 | | 5,880 |
Gibraltar Industries, Inc. (a) | 1,131 | | 11,502 |
Insteel Industries, Inc. | 916 | | 9,499 |
PGT, Inc. (a) | 3,371 | | 7,416 |
Universal Forest Products, Inc. | 625 | | 20,425 |
| | 110,512 |
Commercial Services & Supplies - 0.8% |
APAC Customer Services, Inc. (a) | 2,018 | | 11,947 |
Casella Waste Systems, Inc. Class A (a) | 1,146 | | 5,226 |
CECO Environmental Corp. (a) | 516 | | 2,828 |
Cintas Corp. | 5,789 | | 154,827 |
Copart, Inc. (a) | 3,130 | | 111,052 |
Courier Corp. | 435 | | 6,181 |
EnerNOC, Inc. (a) | 886 | | 21,734 |
Fuel Tech, Inc. (a) | 971 | | 7,098 |
G&K Services, Inc. Class A | 701 | | 19,446 |
Guanwei Recycling Corp. (a) | 760 | | 2,782 |
Healthcare Services Group, Inc. | 2,547 | | 40,574 |
Heritage-Crystal Clean, Inc. (a) | 214 | | 2,072 |
Herman Miller, Inc. | 2,200 | | 47,388 |
Industrial Services of America, Inc. (a) | 459 | | 4,856 |
InnerWorkings, Inc. (a) | 2,041 | | 12,593 |
Common Stocks - continued |
| Shares | | Value |
INDUSTRIALS - continued |
Commercial Services & Supplies - continued |
Interface, Inc. Class A | 2,161 | | $ 31,205 |
Intersections, Inc. | 661 | | 6,874 |
Kimball International, Inc. Class B | 1,425 | | 8,351 |
McGrath RentCorp. | 1,260 | | 35,179 |
Mobile Mini, Inc. (a) | 1,500 | | 27,105 |
Multi-Color Corp. | 386 | | 7,546 |
Perma-Fix Environmental Services, Inc. (a) | 2,776 | | 4,192 |
R.R. Donnelley & Sons Co. | 8,100 | | 127,656 |
RINO International Corp. (a)(d) | 1,100 | | 6,688 |
Standard Parking Corp. (a) | 945 | | 16,783 |
Stericycle, Inc. (a) | 3,300 | | 243,870 |
Sykes Enterprises, Inc. (a) | 1,710 | | 31,464 |
Team, Inc. (a) | 990 | | 20,156 |
Tetra Tech, Inc. (a) | 2,532 | | 58,515 |
United Stationers, Inc. (a) | 966 | | 61,312 |
US Ecology, Inc. | 836 | | 13,134 |
WCA Waste Corp. (a) | 886 | | 5,112 |
| | 1,155,746 |
Construction & Engineering - 0.2% |
Foster Wheeler Ag (a) | 4,973 | | 139,244 |
Great Lakes Dredge & Dock Corp. | 1,716 | | 13,179 |
Insituform Technologies, Inc. Class A (a) | 1,302 | | 28,826 |
Integrated Electrical Services, Inc. (a) | 731 | | 2,303 |
Layne Christensen Co. (a) | 896 | | 29,541 |
MYR Group, Inc. (a) | 855 | | 13,483 |
Northwest Pipe Co. (a) | 495 | | 10,984 |
Primoris Services Corp. | 1,250 | | 11,050 |
Sterling Construction Co., Inc. (a) | 641 | | 8,647 |
UniTek Global Services, Inc. (a) | 1,300 | | 5,876 |
| | 263,133 |
Electrical Equipment - 0.4% |
A-Power Energy Generation Systems, Ltd. (a)(d) | 1,380 | | 8,777 |
A123 Systems, Inc. (a)(d) | 3,951 | | 30,383 |
Active Power, Inc. (a) | 4,641 | | 9,653 |
Advanced Battery Technologies, Inc. (a)(d) | 2,422 | | 9,155 |
American Superconductor Corp. (a) | 1,596 | | 53,115 |
Beacon Power Corp. (a) | 13,050 | | 3,148 |
Broadwind Energy, Inc. (a) | 3,623 | | 6,920 |
Capstone Turbine Corp. (a) | 6,826 | | 5,338 |
China BAK Battery, Inc. (a)(d) | 1,801 | | 3,386 |
Common Stocks - continued |
| Shares | | Value |
INDUSTRIALS - continued |
Electrical Equipment - continued |
China Electric Motor, Inc. | 1,000 | | $ 4,870 |
China Recycling Energy Corp. (a) | 1,590 | | 4,691 |
China Ritar Power Corp. (a) | 1,282 | | 3,795 |
Coleman Cable, Inc. (a) | 616 | | 3,542 |
Deswell Industries, Inc. | 861 | | 2,798 |
Encore Wire Corp. | 1,031 | | 23,486 |
Ener1, Inc. (a)(d) | 5,496 | | 23,908 |
Franklin Electric Co., Inc. | 921 | | 35,836 |
FuelCell Energy, Inc. (a) | 2,821 | | 3,188 |
Fushi Copperweld, Inc. (a) | 1,398 | | 12,554 |
Global Power Equipment Group, Inc. (a) | 586 | | 11,673 |
Harbin Electric, Inc. (a) | 1,136 | | 18,494 |
Highpower International, Inc. (a) | 470 | | 1,589 |
Hoku Corp. (a)(d) | 3,339 | | 8,481 |
Hydrogenics Corp. (a) | 259 | | 984 |
II-VI, Inc. (a) | 1,191 | | 48,629 |
Jinpan International Ltd. | 717 | | 7,335 |
Lihua International, Inc. (a) | 980 | | 11,740 |
Lime Energy Co. (a) | 1,124 | | 4,608 |
LSI Industries, Inc. | 696 | | 6,146 |
Ocean Power Technologies, Inc. (a) | 585 | | 3,329 |
Plug Power, Inc. (a) | 5,056 | | 2,048 |
Powell Industries, Inc. (a) | 606 | | 21,319 |
PowerSecure International, Inc. (a) | 710 | | 6,120 |
Preformed Line Products Co. | 176 | | 8,184 |
Satcon Technology Corp. (a) | 1,982 | | 6,996 |
Ultralife Corp. (a) | 901 | | 5,640 |
Valence Technology, Inc. (a)(d) | 4,926 | | 6,552 |
Vicor Corp. | 1,551 | | 26,026 |
Woodward Governor Co. | 2,676 | | 90,315 |
| | 544,751 |
Industrial Conglomerates - 0.0% |
Raven Industries, Inc. | 806 | | 35,786 |
Machinery - 1.4% |
3D Systems Corp. (a) | 996 | | 28,027 |
Altra Holdings, Inc. (a) | 1,161 | | 19,482 |
American Railcar Industries, Inc. (a) | 750 | | 11,258 |
Astec Industries, Inc. (a) | 911 | | 27,284 |
Bucyrus International, Inc. Class A | 3,133 | | 279,338 |
Chart Industries, Inc. (a) | 1,266 | | 40,044 |
Common Stocks - continued |
| Shares | | Value |
INDUSTRIALS - continued |
Machinery - continued |
China Fire & Security Group, Inc. (a) | 1,005 | | $ 7,256 |
China Valves Technology, Inc. (a) | 1,200 | | 12,132 |
China Wind Systems, Inc. (a) | 1,355 | | 5,000 |
Columbus McKinnon Corp. (NY Shares) (a) | 885 | | 14,523 |
Commercial Vehicle Group, Inc. (a) | 1,360 | | 19,271 |
Dynamic Materials Corp. | 450 | | 7,241 |
Energy Recovery, Inc. (a)(d) | 1,776 | | 5,914 |
Flow International Corp. (a) | 2,325 | | 7,696 |
Force Protection, Inc. (a) | 2,703 | | 13,866 |
FreightCar America, Inc. | 461 | | 11,451 |
Gencor Industries, Inc. (a) | 346 | | 2,446 |
Hardinge, Inc. | 390 | | 3,223 |
Hurco Companies, Inc. (a) | 225 | | 4,334 |
Joy Global, Inc. | 3,944 | | 301,006 |
L.B. Foster Co. Class A (a) | 576 | | 19,981 |
Lincoln Electric Holdings, Inc. | 1,716 | | 105,809 |
Makita Corp. sponsored ADR | 86 | | 3,099 |
Middleby Corp. (a) | 831 | | 66,871 |
NN, Inc. (a) | 1,041 | | 10,410 |
Nordson Corp. | 1,384 | | 109,931 |
Omega Flex, Inc. | 360 | | 6,109 |
PACCAR, Inc. | 14,225 | | 766,159 |
PMFG, Inc. (a) | 424 | | 6,318 |
Portec Rail Products, Inc. | 856 | | 9,930 |
RBC Bearings, Inc. (a) | 990 | | 36,521 |
SmartHeat, Inc. (a) | 1,250 | | 5,938 |
Sun Hydraulics Corp. | 701 | | 21,843 |
Tecumseh Products Co.: | | | |
Class A (non-vtg.) (a) | 801 | | 10,677 |
Class B (a) | 281 | | 3,816 |
Thermadyne Holdings Corp. (a) | 405 | | 6,059 |
TriMas Corp. (a) | 1,201 | | 23,960 |
Twin Disc, Inc. | 345 | | 8,418 |
Westport Innovations, Inc. | 1,397 | | 25,257 |
| | 2,067,898 |
Marine - 0.1% |
American Commercial Lines, Inc. (a) | 468 | | 15,444 |
DryShips, Inc. (a)(d) | 10,925 | | 56,482 |
Eagle Bulk Shipping, Inc. (a)(d) | 2,733 | | 13,665 |
Euroseas Ltd. | 1,365 | | 5,283 |
Common Stocks - continued |
| Shares | | Value |
INDUSTRIALS - continued |
Marine - continued |
FreeSeas, Inc. (a) | 291 | | $ 1,144 |
Newlead Holdings Ltd. (a) | 85 | | 227 |
OceanFreight, Inc. (a) | 3,456 | | 3,318 |
Star Bulk Carriers Corp. (d) | 2,781 | | 7,981 |
TBS International Ltd. Class A (a) | 1,115 | | 4,237 |
Ultrapetrol (Bahamas) Ltd. (a) | 1,156 | | 7,988 |
| | 115,769 |
Professional Services - 0.3% |
51job, Inc. sponsored ADR (a) | 382 | | 19,383 |
Acacia Research Corp. - Acacia Technologies (a) | 1,423 | | 38,777 |
Advisory Board Co. (a) | 761 | | 36,117 |
Barrett Business Services, Inc. | 420 | | 6,229 |
CoStar Group, Inc. (a) | 765 | | 40,346 |
CRA International, Inc. (a) | 480 | | 10,608 |
Exponent, Inc. (a) | 600 | | 20,952 |
Heidrick & Struggles International, Inc. | 756 | | 15,702 |
Hudson Highland Group, Inc. (a) | 976 | | 3,982 |
Huron Consulting Group, Inc. (a) | 836 | | 18,986 |
ICF International, Inc. (a) | 797 | | 19,080 |
Kelly Services, Inc. Class A (non-vtg.) (a) | 1,230 | | 21,986 |
Kforce, Inc. (a) | 1,701 | | 25,702 |
LECG Corp. (a) | 1,701 | | 1,603 |
Lightbridge Corp. (a) | 719 | | 3,710 |
Odyssey Marine Exploration, Inc. (a) | 3,919 | | 7,760 |
On Assignment, Inc. (a) | 1,606 | | 11,033 |
Resources Connection, Inc. | 1,691 | | 28,290 |
School Specialty, Inc. (a) | 750 | | 9,473 |
Verisk Analytics, Inc. (a) | 5,636 | | 170,602 |
VSE Corp. | 201 | | 6,104 |
| | 516,425 |
Road & Rail - 0.4% |
AMERCO (a) | 806 | | 78,134 |
Arkansas Best Corp. | 1,011 | | 24,906 |
Covenant Transport Group, Inc. Class A (a) | 856 | | 7,276 |
Frozen Food Express Industries, Inc. (a) | 1,725 | | 6,089 |
Heartland Express, Inc. | 3,488 | | 53,890 |
J.B. Hunt Transport Services, Inc. | 4,771 | | 174,142 |
Landstar System, Inc. | 1,920 | | 69,024 |
Marten Transport Ltd. | 786 | | 16,899 |
Old Dominion Freight Lines, Inc. (a) | 2,394 | | 69,139 |
Common Stocks - continued |
| Shares | | Value |
INDUSTRIALS - continued |
Road & Rail - continued |
P.A.M. Transportation Services, Inc. (a) | 646 | | $ 6,996 |
Patriot Transportation Holding, Inc. (a) | 146 | | 10,865 |
Quality Distribution, Inc. (a) | 846 | | 5,871 |
Saia, Inc. (a) | 637 | | 9,600 |
Universal Truckload Services, Inc. (a) | 891 | | 13,365 |
USA Truck, Inc. (a) | 420 | | 5,565 |
Vitran Corp., Inc. (a) | 946 | | 10,974 |
Werner Enterprises, Inc. | 2,688 | | 58,007 |
YRC Worldwide, Inc. (a)(d) | 1,568 | | 5,472 |
| | 626,214 |
Trading Companies & Distributors - 0.3% |
Aceto Corp. | 966 | | 7,235 |
Beacon Roofing Supply, Inc. (a) | 2,076 | | 35,686 |
DXP Enterprises, Inc. (a) | 391 | | 8,414 |
Fastenal Co. | 5,725 | | 306,402 |
H&E Equipment Services, Inc. (a) | 1,290 | | 12,836 |
Houston Wire & Cable Co. | 776 | | 8,264 |
Kaman Corp. | 1,038 | | 29,240 |
Lawson Products, Inc. | 600 | | 12,066 |
Mitsui & Co. Ltd. sponsored ADR | 40 | | 12,507 |
Rush Enterprises, Inc.: | | | |
Class A (a) | 1,043 | | 18,326 |
Class B (a) | 625 | | 10,950 |
Titan Machinery, Inc. (a) | 836 | | 17,527 |
| | 479,453 |
Transportation Infrastructure - 0.0% |
China Infrastructure Investment Corp. (a) | 3,900 | | 2,395 |
Grupo Aeroportuario Norte SAB de CV ADR (a) | 200 | | 3,032 |
| | 5,427 |
TOTAL INDUSTRIALS | | 7,863,339 |
INFORMATION TECHNOLOGY - 52.5% |
Communications Equipment - 7.5% |
Acme Packet, Inc. (a) | 2,426 | | 118,825 |
ADC Telecommunications, Inc. (a) | 3,807 | | 48,425 |
Adtran, Inc. | 2,157 | | 67,169 |
Alvarion Ltd. (a) | 2,981 | | 7,810 |
Anaren, Inc. (a) | 802 | | 14,604 |
Arris Group, Inc. (a) | 4,626 | | 46,306 |
Common Stocks - continued |
| Shares | | Value |
INFORMATION TECHNOLOGY - continued |
Communications Equipment - continued |
Aruba Networks, Inc. (a) | 4,149 | | $ 87,959 |
AudioCodes Ltd. (a) | 1,980 | | 8,969 |
Aviat Networks, Inc. (a) | 3,025 | | 12,524 |
Bel Fuse, Inc. Class B (non-vtg.) | 371 | | 8,329 |
BigBand Networks, Inc. (a) | 2,891 | | 8,615 |
Black Box Corp. | 780 | | 27,947 |
Blue Coat Systems, Inc. (a) | 1,596 | | 42,454 |
Brocade Communications Systems, Inc. (a) | 17,129 | | 85,302 |
Ceragon Networks Ltd. (a) | 1,336 | | 14,242 |
China TechFaith Wireless Communication Technology Ltd. sponsored ADR (a) | 1,185 | | 4,657 |
Ciena Corp. (a) | 3,646 | | 55,237 |
Cisco Systems, Inc. (a) | 222,900 | | 4,270,764 |
Cogo Group, Inc. (a) | 1,545 | | 11,557 |
Comtech Telecommunications Corp. | 1,006 | | 29,838 |
DG FastChannel, Inc. (a) | 1,097 | | 27,677 |
Dialogic, Inc. (a) | 1,081 | | 5,567 |
Digi International, Inc. (a) | 1,635 | | 15,696 |
Ditech Networks, Inc. (a) | 1,626 | | 2,341 |
DragonWave, Inc. (a) | 1,400 | | 10,542 |
EchoStar Holding Corp. Class A (a) | 1,821 | | 36,730 |
EMCORE Corp. (a)(d) | 2,736 | | 3,502 |
EMS Technologies, Inc. (a) | 668 | | 12,418 |
Endwave Corp. (a) | 891 | | 2,406 |
EXFO, Inc. (sub. vtg.) (a) | 907 | | 5,690 |
Extreme Networks, Inc. (a) | 3,522 | | 10,319 |
F5 Networks, Inc. (a) | 3,092 | | 407,773 |
Finisar Corp. (a) | 2,814 | | 53,804 |
Gilat Satellite Networks Ltd. (a) | 2,426 | | 11,718 |
Globecomm Systems, Inc. (a) | 721 | | 6,092 |
Harmonic, Inc. (a) | 4,396 | | 29,717 |
Hughes Communications, Inc. (a) | 853 | | 33,779 |
Infinera Corp. (a) | 3,871 | | 31,587 |
InterDigital, Inc. (a)(d) | 1,730 | | 57,211 |
Ituran Location & Control Ltd. | 1,485 | | 22,839 |
Ixia (a) | 3,000 | | 47,580 |
JDS Uniphase Corp. (a) | 8,481 | | 100,669 |
KVH Industries, Inc. (a) | 511 | | 6,771 |
Loral Space & Communications Ltd. (a) | 823 | | 60,145 |
Meru Networks, Inc. (a) | 574 | | 7,961 |
Mitel Networks, Inc. (a) | 1,991 | | 13,021 |
Common Stocks - continued |
| Shares | | Value |
INFORMATION TECHNOLOGY - continued |
Communications Equipment - continued |
NETGEAR, Inc. (a) | 1,260 | | $ 40,043 |
Network Engines, Inc. (a) | 1,962 | | 3,021 |
Network Equipment Technologies, Inc. (a) | 1,349 | | 5,477 |
Occam Networks, Inc. (a) | 1,380 | | 10,267 |
Oclaro, Inc. (a) | 1,879 | | 18,226 |
Oplink Communications, Inc. (a) | 687 | | 11,878 |
Opnext, Inc. (a) | 2,370 | | 3,247 |
ORBCOMM, Inc. (a) | 1,486 | | 3,923 |
Orckit Communications Ltd. (a) | 771 | | 2,066 |
Parkervision, Inc. (a)(d) | 1,071 | | 455 |
PC-Tel, Inc. (a) | 1,116 | | 7,008 |
Polycom, Inc. (a) | 3,186 | | 117,898 |
Powerwave Technologies, Inc. (a)(d) | 5,220 | | 11,014 |
QUALCOMM, Inc. | 62,700 | | 2,930,598 |
RADWARE Ltd. (a) | 749 | | 23,241 |
Research In Motion Ltd. (a) | 20,700 | | 1,280,295 |
Riverbed Technology, Inc. (a) | 5,490 | | 186,166 |
SeaChange International, Inc. (a) | 1,311 | | 10,540 |
ShoreTel, Inc. (a) | 2,706 | | 19,213 |
Sierra Wireless, Inc. (a) | 1,722 | | 18,988 |
Silicom Ltd. (a) | 345 | | 5,592 |
Sonus Networks, Inc. (a) | 10,536 | | 28,236 |
Sycamore Networks, Inc. | 1,169 | | 35,093 |
Symmetricom, Inc. (a) | 2,446 | | 16,266 |
Tekelec (a) | 2,626 | | 32,431 |
Telefonaktiebolaget LM Ericsson (B Shares) sponsored ADR | 9,400 | | 97,008 |
Telestone Technologies Corp. (a) | 314 | | 3,426 |
Tellabs, Inc. | 13,974 | | 88,176 |
Telular Corp. | 915 | | 4,868 |
Tollgrade Communications, Inc. (a) | 711 | | 6,086 |
UTStarcom, Inc. (a) | 4,161 | | 8,905 |
ViaSat, Inc. (a) | 1,375 | | 56,870 |
Westell Technologies, Inc. Class A (a) | 1,302 | | 3,867 |
Zhone Technologies, Inc. (a) | 2,720 | | 7,181 |
ZST Digital Networks, Inc. (a) | 1,005 | | 7,045 |
| | 11,099,702 |
Computers & Peripherals - 9.5% |
ActivIdentity Corp. (a) | 2,190 | | 7,118 |
Apple, Inc. (a) | 35,620 | | 11,083,133 |
Avid Technology, Inc. (a) | 1,551 | | 24,165 |
Common Stocks - continued |
| Shares | | Value |
INFORMATION TECHNOLOGY - continued |
Computers & Peripherals - continued |
Concurrent Computer Corp. (a) | 360 | | $ 1,721 |
Cray, Inc. (a) | 1,843 | | 13,159 |
Dell, Inc. (a) | 75,938 | | 1,003,900 |
Dot Hill Systems Corp. (a) | 3,411 | | 6,072 |
Electronics for Imaging, Inc. (a) | 1,324 | | 17,331 |
Hutchinson Technology, Inc. (a) | 1,056 | | 3,274 |
iGO, Inc. (a) | 1,366 | | 4,330 |
Immersion Corp. (a) | 1,335 | | 7,489 |
Intevac, Inc. (a) | 911 | | 12,116 |
Isilon Systems, Inc. (a) | 2,565 | | 86,569 |
LaserCard Corp. (a) | 503 | | 2,133 |
Logitech International SA (a)(d) | 7,101 | | 137,191 |
NetApp, Inc. (a) | 13,800 | | 702,834 |
Novatel Wireless, Inc. (a) | 1,997 | | 19,591 |
Presstek, Inc. (a) | 1,594 | | 2,949 |
QLogic Corp. (a) | 4,442 | | 79,467 |
Rimage Corp. (a) | 400 | | 6,120 |
SanDisk Corp. (a) | 9,028 | | 402,649 |
Seagate Technology (a) | 18,422 | | 247,039 |
Silicon Graphics International Corp. (a) | 1,011 | | 7,775 |
Smart Technologies, Inc. Class A (a) | 1,547 | | 15,386 |
STEC, Inc. (a)(d) | 1,881 | | 31,968 |
Stratasys, Inc. (a) | 722 | | 24,418 |
Super Micro Computer, Inc. (a) | 1,221 | | 12,576 |
Synaptics, Inc. (a) | 1,350 | | 38,475 |
Transact Technologies, Inc. (a) | 1,251 | | 11,334 |
Xyratex Ltd. (a) | 1,176 | | 17,969 |
| | 14,030,251 |
Electronic Equipment & Components - 1.3% |
Agilysys, Inc. (a) | 1,050 | | 5,387 |
Brightpoint, Inc. (a) | 3,126 | | 25,633 |
CalAmp Corp. (a) | 2,713 | | 6,837 |
Cogent, Inc. (a) | 3,600 | | 37,764 |
Cognex Corp. | 1,796 | | 50,216 |
Coherent, Inc. (a) | 975 | | 40,277 |
Comverge, Inc. (a) | 1,083 | | 7,224 |
CPI International, Inc. (a) | 885 | | 17,125 |
Daktronics, Inc. | 1,761 | | 23,738 |
DDi Corp. | 823 | | 8,633 |
DTS, Inc. (a) | 851 | | 39,946 |
Common Stocks - continued |
| Shares | | Value |
INFORMATION TECHNOLOGY - continued |
Electronic Equipment & Components - continued |
Echelon Corp. (a) | 1,830 | | $ 17,440 |
Electro Rent Corp. | 1,080 | | 16,006 |
Electro Scientific Industries, Inc. (a) | 1,335 | | 19,945 |
FARO Technologies, Inc. (a) | 690 | | 17,919 |
Flextronics International Ltd. (a) | 32,000 | | 232,000 |
FLIR Systems, Inc. (a) | 5,880 | | 157,613 |
Funtalk China Holdings Ltd. (a) | 1,550 | | 9,409 |
HLS Systems International Ltd. (a) | 1,991 | | 27,098 |
I. D. Systems Inc. (a) | 601 | | 1,599 |
Identive Group, Inc. (a) | 1,560 | | 3,682 |
Insight Enterprises, Inc. (a) | 2,136 | | 26,935 |
IPG Photonics Corp. (a) | 1,566 | | 44,882 |
Itron, Inc. (a) | 1,543 | | 87,596 |
Littelfuse, Inc. | 801 | | 37,062 |
LoJack Corp. (a) | 1,051 | | 5,181 |
Magal Security Systems Ltd. (a) | 1,506 | | 4,654 |
Maxwell Technologies, Inc. (a) | 855 | | 13,825 |
Measurement Specialties, Inc. (a) | 521 | | 13,327 |
Mercury Computer Systems, Inc. (a) | 951 | | 16,937 |
Microvision, Inc. (a)(d) | 3,433 | | 4,841 |
Molex, Inc. | 3,921 | | 81,557 |
Molex, Inc. Class A (non-vtg.) | 3,066 | | 53,410 |
MTS Systems Corp. | 776 | | 29,736 |
Multi-Fineline Electronix, Inc. (a) | 1,116 | | 26,003 |
National Instruments Corp. | 3,051 | | 104,100 |
NetList, Inc. (a)(d) | 2,862 | | 6,611 |
Newport Corp. (a) | 1,221 | | 17,741 |
NU Horizons Electronics Corp. (a) | 1,611 | | 11,213 |
Orbotech Ltd. (a) | 1,410 | | 15,538 |
OSI Systems, Inc. (a) | 716 | | 24,967 |
PC Connection, Inc. (a) | 691 | | 6,233 |
PC Mall, Inc. (a) | 556 | | 3,909 |
Planar Systems, Inc. (a) | 1,943 | | 4,177 |
Plexus Corp. (a) | 1,731 | | 46,971 |
Power-One, Inc. (a)(d) | 4,043 | | 38,206 |
RadiSys Corp. (a) | 936 | | 8,452 |
Richardson Electronics Ltd. | 1,201 | | 12,863 |
Rofin-Sinar Technologies, Inc. (a) | 1,121 | | 32,184 |
Sanmina-SCI Corp. (a) | 3,082 | | 32,207 |
ScanSource, Inc. (a) | 1,206 | | 35,179 |
SMART Modular Technologies (WWH), Inc. (a) | 2,116 | | 11,850 |
Common Stocks - continued |
| Shares | | Value |
INFORMATION TECHNOLOGY - continued |
Electronic Equipment & Components - continued |
Spectrum Control, Inc. (a) | 396 | | $ 6,047 |
Tech Data Corp. (a) | 1,650 | | 72,716 |
Trimble Navigation Ltd. (a) | 4,458 | | 166,016 |
TTM Technologies, Inc. (a) | 2,908 | | 38,546 |
Universal Display Corp. (a) | 1,500 | | 37,140 |
Viasystems Group, Inc. (a) | 708 | | 12,284 |
X-Rite, Inc. (a) | 3,195 | | 13,451 |
Zygo Corp. (a) | 1,006 | | 11,529 |
| | 1,981,567 |
Internet Software & Services - 7.8% |
Akamai Technologies, Inc. (a) | 7,000 | | 365,330 |
Ancestry.com, Inc. | 1,610 | | 46,014 |
Archipelago Learning, Inc. | 1,052 | | 9,079 |
Art Technology Group, Inc. (a) | 5,686 | | 33,945 |
Autobytel, Inc. (a) | 1,756 | | 1,317 |
Baidu.com, Inc. sponsored ADR (a) | 10,406 | | 1,094,607 |
China Finance Online Co. Ltd. ADR (a) | 915 | | 6,899 |
ChinaCache International Holdings Ltd. sponsored ADR | 225 | | 6,233 |
comScore, Inc. (a) | 1,086 | | 23,892 |
Constant Contact, Inc. (a) | 1,125 | | 28,789 |
CryptoLogic Ltd. | 480 | | 576 |
DealerTrack Holdings, Inc. (a) | 1,896 | | 36,214 |
Digital River, Inc. (a) | 1,521 | | 56,003 |
EarthLink, Inc. | 4,455 | | 39,939 |
eBay, Inc. (a) | 51,200 | | 1,491,456 |
Enternet Gold Golden Lines Ltd. (a) | 720 | | 19,836 |
Equinix, Inc. (a) | 1,731 | | 134,326 |
GigaMedia Ltd. (a) | 2,131 | | 2,983 |
Google, Inc. Class A (a) | 9,600 | | 5,334,816 |
GSI Commerce, Inc. (a) | 2,462 | | 58,719 |
HSW International, Inc. (a) | 177 | | 715 |
IAC/InterActiveCorp (a) | 3,295 | | 92,787 |
InfoSpace, Inc. (a) | 1,401 | | 10,816 |
Internap Network Services Corp. (a) | 2,287 | | 11,961 |
Internet Brands, Inc. Class A (a) | 1,440 | | 19,195 |
Internet Capital Group, Inc. (a) | 1,455 | | 18,027 |
Internet Initiative Japan, Inc. sponsored ADR | 711 | | 4,067 |
iPass, Inc. | 2,406 | | 2,863 |
j2 Global Communications, Inc. (a) | 1,719 | | 46,035 |
Keynote Systems, Inc. | 675 | | 8,262 |
Common Stocks - continued |
| Shares | | Value |
INFORMATION TECHNOLOGY - continued |
Internet Software & Services - continued |
KIT Digital, Inc. (a) | 743 | | $ 10,231 |
Ku6 Media Co. Ltd. sponsored ADR (a) | 1,681 | | 9,229 |
Limelight Networks, Inc. (a) | 3,326 | | 23,615 |
Liquidity Services, Inc. (a) | 1,191 | | 18,425 |
LivePerson, Inc. (a) | 2,295 | | 22,170 |
Local.com Corp. (a) | 299 | | 1,139 |
LogMeIn, Inc. (a) | 845 | | 37,003 |
LoopNet, Inc. (a) | 1,320 | | 14,071 |
Marchex, Inc. Class B | 1,791 | | 12,931 |
Market Leader, Inc. (a) | 861 | | 1,627 |
MediaMind Technologies, Inc. (a) | 704 | | 9,236 |
Mercadolibre, Inc. (a) | 1,716 | | 109,172 |
ModusLink Global Solutions, Inc. (a) | 1,665 | | 11,156 |
Move, Inc. (a) | 6,181 | | 15,638 |
NaviSite, Inc. (a) | 3,590 | | 12,709 |
NetEase.com, Inc. sponsored ADR (a) | 2,946 | | 112,478 |
NIC, Inc. | 2,461 | | 20,549 |
Open Text Corp. (a) | 2,210 | | 93,644 |
OpenTable, Inc. (a) | 949 | | 68,840 |
Openwave Systems, Inc. (a) | 3,561 | | 8,511 |
Perficient, Inc. (a) | 1,516 | | 17,100 |
QuinStreet, Inc. (d) | 1,753 | | 35,060 |
RADVision Ltd. (a) | 1,225 | | 9,567 |
RealNetworks, Inc. (a) | 5,541 | | 18,950 |
Rediff.com India Ltd. sponsored ADR (a)(d) | 1,411 | | 4,318 |
RightNow Technologies, Inc. (a) | 1,431 | | 36,247 |
Saba Software, Inc. (a) | 1,606 | | 9,684 |
SAVVIS, Inc. (a) | 2,286 | | 57,447 |
SciQuest, Inc. | 800 | | 10,728 |
Selectica, Inc. (a) | 342 | | 1,703 |
Sify Technologies Ltd. sponsored ADR (a)(d) | 3,442 | | 6,161 |
Sina Corp. (a) | 2,341 | | 149,871 |
Sohu.com, Inc. (a) | 1,395 | | 96,855 |
SPS Commerce, Inc. (a) | 530 | | 6,286 |
Stamps.com, Inc. | 675 | | 8,883 |
Subaye, Inc. (a) | 542 | | 3,864 |
Support.com, Inc. (a) | 2,745 | | 17,760 |
TechTarget, Inc. (a) | 1,500 | | 8,925 |
Terremark Worldwide, Inc. (a) | 2,116 | | 25,318 |
The Knot, Inc. (a) | 1,311 | | 12,258 |
TheStreet.com, Inc. | 1,096 | | 2,937 |
Common Stocks - continued |
| Shares | | Value |
INFORMATION TECHNOLOGY - continued |
Internet Software & Services - continued |
Travelzoo, Inc. (a) | 751 | | $ 32,285 |
United Online, Inc. | 3,243 | | 20,642 |
ValueClick, Inc. (a) | 3,087 | | 47,972 |
VeriSign, Inc. (a) | 7,247 | | 248,645 |
VistaPrint Ltd. (a) | 1,701 | | 68,584 |
Vocus, Inc. (a) | 821 | | 20,098 |
Web.com, Inc. (a) | 1,320 | | 10,679 |
WebMD Health Corp. (a) | 2,196 | | 112,743 |
WebMediaBrands, Inc. (a) | 1,696 | | 1,391 |
Yahoo!, Inc. (a) | 53,599 | | 845,256 |
Zix Corp. (a) | 4,116 | | 15,805 |
| | 11,582,097 |
IT Services - 2.2% |
Acorn Energy, Inc. (a) | 1,101 | | 4,393 |
Acxiom Corp. (a) | 3,216 | | 54,704 |
Automatic Data Processing, Inc. | 19,411 | | 865,148 |
Cass Information Systems, Inc. | 385 | | 13,614 |
China Information Technology, Inc. (a) | 1,900 | | 10,032 |
Cognizant Technology Solutions Corp. Class A (a) | 11,640 | | 756,367 |
Computer Task Group, Inc. (a) | 717 | | 7,062 |
CSG Systems International, Inc. (a) | 1,356 | | 25,520 |
Echo Global Logistics, Inc. (a) | 1,404 | | 16,076 |
Edgewater Technology, Inc. (a) | 876 | | 2,523 |
Euronet Worldwide, Inc. (a) | 1,986 | | 32,491 |
ExlService Holdings, Inc. (a) | 1,236 | | 25,548 |
Fiserv, Inc. (a) | 5,954 | | 329,256 |
Forrester Research, Inc. | 975 | | 33,784 |
Hackett Group, Inc. (a) | 1,695 | | 5,966 |
hiSoft Technology International Ltd. ADR (a)(d) | 463 | | 12,895 |
iGate Corp. | 2,041 | | 40,820 |
Information Services Group, Inc. (a) | 1,246 | | 2,754 |
Infosys Technologies Ltd. sponsored ADR | 4,154 | | 274,787 |
Innodata Isogen, Inc. (a) | 1,261 | | 3,707 |
Integral Systems, Inc. (a) | 1,311 | | 11,956 |
Lionbridge Technologies, Inc. (a) | 2,146 | | 6,996 |
LML Payment Systems, Inc. (a)(d) | 2,399 | | 7,173 |
ManTech International Corp. Class A (a) | 800 | | 31,936 |
NCI, Inc. Class A (a) | 491 | | 10,787 |
Ness Technologies, Inc. (a) | 1,176 | | 5,304 |
Online Resources Corp. (a) | 976 | | 4,226 |
Common Stocks - continued |
| Shares | | Value |
INFORMATION TECHNOLOGY - continued |
IT Services - continued |
Paychex, Inc. | 14,192 | | $ 405,040 |
PFSweb, Inc. (a) | 151 | | 590 |
PRG-Schultz International, Inc. (a) | 1,731 | | 10,057 |
Rainmaker Systems, Inc. (a) | 2,401 | | 3,145 |
Sapient Corp. | 4,614 | | 55,045 |
Syntel, Inc. | 1,458 | | 69,605 |
Teletech Holdings, Inc. (a) | 2,691 | | 51,021 |
Telvent GIT SA (a) | 1,232 | | 29,396 |
Virtusa Corp. (a) | 1,000 | | 13,640 |
Yucheng Technologies Ltd. (a) | 496 | | 1,612 |
| | 3,234,976 |
Office Electronics - 0.0% |
Zebra Technologies Corp. Class A (a) | 2,286 | | 83,302 |
Semiconductors & Semiconductor Equipment - 9.2% |
Advanced Analogic Technologies, Inc. (a) | 2,818 | | 10,314 |
Advanced Energy Industries, Inc. (a) | 1,500 | | 17,520 |
Aixtron AG sponsored ADR | 188 | | 5,764 |
Alpha & Omega Semiconductor Ltd. (a) | 820 | | 9,643 |
Altera Corp. | 11,643 | | 408,553 |
Amkor Technology, Inc. (a) | 7,661 | | 53,321 |
Amtech Systems, Inc. (a) | 401 | | 8,301 |
ANADIGICS, Inc. (a) | 3,015 | | 19,356 |
Applied Materials, Inc. | 52,152 | | 648,249 |
Applied Micro Circuits Corp. (a) | 2,420 | | 22,458 |
ARM Holdings PLC sponsored ADR | 3,037 | | 56,944 |
ASM International NV unit (a) | 345 | | 8,546 |
ASML Holding NV | 4,143 | | 135,186 |
Atheros Communications, Inc. (a) | 2,647 | | 86,186 |
Atmel Corp. (a) | 17,856 | | 185,524 |
ATMI, Inc. (a) | 1,291 | | 23,173 |
AuthenTec, Inc. (a) | 1,051 | | 2,260 |
Avago Technologies Ltd. | 9,352 | | 244,181 |
Axcelis Technologies, Inc. (a) | 4,561 | | 11,311 |
AXT, Inc. (a) | 1,989 | | 16,409 |
Broadcom Corp. Class A | 17,259 | | 767,853 |
Brooks Automation, Inc. (a) | 3,006 | | 21,794 |
Cabot Microelectronics Corp. (a) | 981 | | 38,720 |
Camtek Ltd. (a) | 1,486 | | 3,745 |
Canadian Solar, Inc. (a)(d) | 1,991 | | 25,923 |
Cavium Networks, Inc. (a) | 1,684 | | 61,963 |
Common Stocks - continued |
| Shares | | Value |
INFORMATION TECHNOLOGY - continued |
Semiconductors & Semiconductor Equipment - continued |
Ceva, Inc. (a) | 1,050 | | $ 24,360 |
China Sunergy Co. Ltd. ADR (a)(d) | 1,320 | | 5,755 |
ChipMOS TECHNOLOGIES (Bermuda) Ltd. (a) | 8,447 | | 11,910 |
Cirrus Logic, Inc. (a)(d) | 2,601 | | 39,717 |
Cohu, Inc. | 885 | | 12,815 |
Conexant Systems, Inc. (a) | 2,595 | | 3,529 |
Cree, Inc. (a) | 4,085 | | 266,260 |
Cymer, Inc. (a) | 1,206 | | 45,912 |
Cypress Semiconductor Corp. (a) | 6,050 | | 94,804 |
Diodes, Inc. (a) | 1,626 | | 40,162 |
DSP Group, Inc. (a) | 1,305 | | 9,983 |
Energy Conversion Devices, Inc. (a) | 1,811 | | 8,131 |
Entegris, Inc. (a) | 5,220 | | 33,930 |
Entropic Communications, Inc. (a) | 3,249 | | 29,046 |
Evergreen Solar, Inc. (a)(d) | 8,813 | | 6,857 |
Exar Corp. (a) | 1,755 | | 11,759 |
Ezchip Semiconductor Ltd. (a) | 1,020 | | 24,837 |
FEI Co. (a) | 1,455 | | 34,629 |
First Solar, Inc. (a)(d) | 3,298 | | 405,159 |
FormFactor, Inc. (a) | 1,856 | | 17,224 |
FSI International, Inc. (a) | 1,656 | | 5,846 |
GSI Technology, Inc. (a) | 1,220 | | 9,028 |
GT Solar International, Inc. (a) | 5,936 | | 39,712 |
Himax Technologies, Inc. sponsored ADR | 3,511 | | 7,303 |
Hittite Microwave Corp. (a) | 1,341 | | 76,759 |
Ikanos Communications, Inc. (a) | 1,860 | | 2,046 |
Integrated Device Technology, Inc. (a) | 7,126 | | 45,820 |
Integrated Silicon Solution, Inc. (a) | 1,011 | | 8,078 |
Intel Corp. | 217,000 | | 4,583,040 |
Intersil Corp. Class A | 4,941 | | 62,998 |
IXYS Corp. (a) | 1,626 | | 18,195 |
JA Solar Holdings Co. Ltd. ADR (a) | 4,791 | | 33,202 |
KLA-Tencor Corp. | 6,418 | | 235,348 |
Kopin Corp. (a) | 3,306 | | 13,290 |
Kulicke & Soffa Industries, Inc. (a) | 2,871 | | 19,035 |
Lam Research Corp. (a) | 4,935 | | 223,704 |
Lattice Semiconductor Corp. (a) | 4,891 | | 21,765 |
Linear Technology Corp. | 8,669 | | 282,609 |
LTX-Credence Corp. (a) | 2,029 | | 15,989 |
Marvell Technology Group Ltd. (a) | 24,740 | | 477,235 |
Mattson Technology, Inc. (a) | 2,176 | | 6,028 |
Common Stocks - continued |
| Shares | | Value |
INFORMATION TECHNOLOGY - continued |
Semiconductors & Semiconductor Equipment - continued |
Maxim Integrated Products, Inc. | 11,719 | | $ 272,467 |
Mellanox Technologies Ltd. (a) | 1,272 | | 30,312 |
Micrel, Inc. | 3,171 | | 39,257 |
Microchip Technology, Inc. | 7,211 | | 242,362 |
Micron Technology, Inc. (a) | 38,862 | | 282,138 |
Microsemi Corp. (a) | 3,096 | | 68,545 |
Microtune, Inc. (a) | 3,141 | | 9,172 |
Mindspeed Technologies, Inc. (a) | 1,178 | | 7,339 |
MIPS Technologies, Inc. (a) | 1,995 | | 27,112 |
MKS Instruments, Inc. (a) | 1,961 | | 39,946 |
Monolithic Power Systems, Inc. (a) | 1,386 | | 22,356 |
MoSys, Inc. (a) | 1,530 | | 6,242 |
Nanometrics, Inc. (a) | 801 | | 9,492 |
Netlogic Microsystems, Inc. (a) | 2,433 | | 75,910 |
Nova Measuring Instruments Ltd. (a) | 1,096 | | 7,288 |
Novellus Systems, Inc. (a) | 3,795 | | 114,419 |
NVE Corp. (a) | 210 | | 10,708 |
NVIDIA Corp. (a) | 21,452 | | 291,747 |
NXP Semiconductors NV | 9,657 | | 121,485 |
O2Micro International Ltd. sponsored ADR (a) | 1,626 | | 10,081 |
Omnivision Technologies, Inc. (a) | 2,101 | | 59,437 |
ON Semiconductor Corp. (a) | 16,281 | | 132,772 |
PDF Solutions, Inc. (a) | 1,350 | | 5,387 |
Pericom Semiconductor Corp. (a) | 1,356 | | 13,546 |
Photronics, Inc. (a) | 2,236 | | 14,288 |
Pixelworks, Inc. (a) | 598 | | 2,111 |
PLX Technology, Inc. (a) | 2,101 | | 7,059 |
PMC-Sierra, Inc. (a) | 8,936 | | 64,786 |
Power Integrations, Inc. | 1,000 | | 40,290 |
QuickLogic Corp. (a) | 1,546 | | 9,245 |
Rambus, Inc. (a) | 4,458 | | 89,205 |
Ramtron International Corp. (a) | 1,221 | | 4,444 |
RDA Microelectronics, Inc. sponsored ADR | 350 | | 5,607 |
RF Micro Devices, Inc. (a) | 11,151 | | 78,169 |
Rubicon Technology, Inc. (a)(d) | 951 | | 20,865 |
Rudolph Technologies, Inc. (a) | 1,086 | | 8,102 |
Semtech Corp. (a) | 2,601 | | 60,837 |
Sigma Designs, Inc. (a) | 1,146 | | 13,752 |
Silicon Image, Inc. (a) | 3,261 | | 25,012 |
Silicon Laboratories, Inc. (a) | 1,811 | | 76,931 |
Silicon Motion Technology Corp. sponsored ADR (a) | 1,231 | | 4,949 |
Common Stocks - continued |
| Shares | | Value |
INFORMATION TECHNOLOGY - continued |
Semiconductors & Semiconductor Equipment - continued |
Siliconware Precision Industries Co. Ltd. sponsored ADR | 4,347 | | $ 22,344 |
Skyworks Solutions, Inc. (a) | 6,621 | | 168,504 |
Solarfun Power Holdings Co. Ltd. ADR (a) | 1,791 | | 14,883 |
Spreadtrum Communications, Inc. ADR (a) | 1,338 | | 21,876 |
Standard Microsystems Corp. (a) | 956 | | 26,051 |
SunPower Corp.: | | | |
Class A (a) | 2,097 | | 24,451 |
Class B (a) | 1,660 | | 19,049 |
Supertex, Inc. (a) | 494 | | 12,355 |
Tessera Technologies, Inc. (a) | 1,821 | | 36,256 |
Tower Semiconductor Ltd. (a) | 9,998 | | 13,897 |
TranSwitch Corp. (a) | 804 | | 1,640 |
Trident Microsystems, Inc. (a) | 8,196 | | 15,163 |
TriQuint Semiconductor, Inc. (a) | 5,941 | | 70,757 |
Ultra Clean Holdings, Inc. (a) | 1,066 | | 8,357 |
Ultratech, Inc. (a) | 995 | | 18,278 |
Varian Semiconductor Equipment Associates, Inc. (a) | 2,991 | | 94,306 |
Veeco Instruments, Inc. (a)(d) | 1,502 | | 66,058 |
Verigy Ltd. (a) | 2,511 | | 21,494 |
Vimicro International Corp. sponsored ADR (a) | 2,017 | | 6,394 |
Volterra Semiconductor Corp. (a) | 1,266 | | 28,510 |
Xilinx, Inc. | 10,453 | | 283,485 |
Zoran Corp. (a) | 1,861 | | 12,804 |
| | 13,619,090 |
Software - 15.0% |
ACI Worldwide, Inc. (a) | 1,546 | | 39,253 |
Activision Blizzard, Inc. | 48,942 | | 574,579 |
Actuate Corp. (a) | 1,740 | | 9,814 |
Adobe Systems, Inc. (a) | 20,500 | | 568,465 |
Advent Software, Inc. (a) | 1,011 | | 52,147 |
Allot Communications Ltd. (a) | 945 | | 7,929 |
American Software, Inc. Class A | 846 | | 5,677 |
ANSYS, Inc. (a) | 3,591 | | 174,164 |
Ariba, Inc. (a) | 3,406 | | 68,920 |
AsiaInfo Holdings, Inc. (a) | 2,883 | | 48,002 |
Aspen Technology, Inc. (a) | 3,566 | | 44,575 |
Authentidate Holding Corp. (a) | 6,174 | | 3,890 |
Autodesk, Inc. (a) | 8,763 | | 309,246 |
Blackbaud, Inc. | 1,626 | | 41,154 |
Blackboard, Inc. (a)(d) | 1,342 | | 55,760 |
Common Stocks - continued |
| Shares | | Value |
INFORMATION TECHNOLOGY - continued |
Software - continued |
BluePhoenix Solutions Ltd. (a) | 1,260 | | $ 2,306 |
BMC Software, Inc. (a) | 6,983 | | 310,045 |
Bottomline Technologies, Inc. (a) | 1,041 | | 19,706 |
BroadSoft, Inc. (a) | 1,060 | | 24,094 |
CA, Inc. | 19,931 | | 456,221 |
Cadence Design Systems, Inc. (a) | 10,371 | | 81,516 |
Callidus Software, Inc. (a) | 2,656 | | 12,802 |
CDC Corp. Class A (a) | 1,412 | | 5,464 |
CDC Software Corp. ADR (a) | 605 | | 4,241 |
Changyou.com Ltd. (A Shares) ADR (a) | 374 | | 10,999 |
Check Point Software Technologies Ltd. (a) | 8,056 | | 345,361 |
China TransInfo Technlgy Corp. (a) | 870 | | 4,594 |
Cinedigm Digital Cinema Corp. (a) | 1,095 | | 1,533 |
Citrix Systems, Inc. (a) | 7,185 | | 477,228 |
ClickSoftware Technologies Ltd. (a) | 1,103 | | 7,170 |
CommVault Systems, Inc. (a) | 1,596 | | 46,491 |
Compuware Corp. (a) | 9,002 | | 92,721 |
Concur Technologies, Inc. (a) | 1,923 | | 98,477 |
Convio, Inc. (a) | 795 | | 5,811 |
Deltek, Inc. (a) | 2,316 | | 16,536 |
DemandTec, Inc. (a) | 1,131 | | 11,706 |
Descartes Systems Group, Inc. (a) | 2,985 | | 20,354 |
Digimarc Corp. (a) | 390 | | 10,959 |
ebix.com, Inc. (a) | 1,287 | | 26,705 |
Electronic Arts, Inc. (a) | 12,766 | | 190,341 |
Epicor Software Corp. (a) | 2,580 | | 24,149 |
EPIQ Systems, Inc. | 1,500 | | 19,110 |
Evolving Systems, Inc. | 1,325 | | 10,468 |
FalconStor Software, Inc. (a) | 2,536 | | 6,746 |
Fortinet, Inc. | 2,621 | | 83,531 |
Fundtech Ltd. (a) | 750 | | 11,798 |
Glu Mobile, Inc. (a) | 5,541 | | 12,246 |
Guidance Software, Inc. (a) | 1,292 | | 7,920 |
Informatica Corp. (a) | 3,711 | | 153,190 |
Interactive Intelligence, Inc. (a) | 1,041 | | 28,149 |
Intuit, Inc. (a) | 12,134 | | 544,695 |
Jack Henry & Associates, Inc. | 3,111 | | 85,055 |
JDA Software Group, Inc. (a) | 1,557 | | 41,113 |
Kenexa Corp. (a) | 971 | | 17,779 |
KongZhong Corp. sponsored ADR (a) | 1,000 | | 7,270 |
Lawson Software, Inc. (a) | 5,978 | | 51,351 |
Common Stocks - continued |
| Shares | | Value |
INFORMATION TECHNOLOGY - continued |
Software - continued |
Magic Software Enterprises Ltd. | 2,736 | | $ 17,757 |
Magma Design Automation, Inc. (a) | 2,621 | | 10,851 |
Majesco Entertainment Co. (a) | 2,000 | | 1,454 |
Manhattan Associates, Inc. (a) | 922 | | 28,665 |
Mentor Graphics Corp. (a) | 3,651 | | 41,056 |
MICROS Systems, Inc. (a) | 2,991 | | 130,767 |
Microsoft Corp. | 337,500 | | 8,508,375 |
MicroStrategy, Inc. Class A (a) | 375 | | 32,456 |
Monotype Imaging Holdings, Inc. (a) | 1,551 | | 17,371 |
Motricity, Inc. (a)(d) | 1,688 | | 50,201 |
Net 1 UEPS Technologies, Inc. (a) | 2,000 | | 24,300 |
NetScout Systems, Inc. (a) | 1,866 | | 41,220 |
Nice Systems Ltd. sponsored ADR (a) | 1,581 | | 48,442 |
Novell, Inc. (a) | 13,881 | | 82,731 |
Nuance Communications, Inc. (a) | 11,280 | | 199,374 |
Opnet Technologies, Inc. | 1,026 | | 24,952 |
Oracle Corp. | 195,900 | | 5,297,136 |
Parametric Technology Corp. (a) | 4,148 | | 88,850 |
Pegasystems, Inc. | 1,228 | | 38,007 |
Perfect World Co. Ltd. sponsored ADR Class B (a) | 1,575 | | 37,328 |
Pervasive Software, Inc. (a) | 1,606 | | 8,432 |
Progress Software Corp. (a) | 1,686 | | 65,029 |
QAD, Inc. | 1,651 | | 7,776 |
QLIK Technologies, Inc. | 3,023 | | 71,252 |
Quest Software, Inc. (a) | 3,555 | | 89,942 |
Radiant Systems, Inc. (a) | 1,320 | | 23,826 |
RealPage, Inc. | 2,672 | | 73,213 |
Renaissance Learning, Inc. | 1,200 | | 14,124 |
Retalix Ltd. (a) | 786 | | 10,218 |
Rovi Corp. (a) | 3,952 | | 218,032 |
S1 Corp. (a) | 2,685 | | 17,023 |
Scientific Learning Corp. (a) | 1,966 | | 6,291 |
Shanda Games Ltd. sponsored ADR (a) | 3,749 | | 20,994 |
Shanda Interactive Entertainment Ltd. sponsored ADR (a)(d) | 1,244 | | 49,175 |
Smith Micro Software, Inc. (a) | 1,336 | | 19,960 |
Sonic Foundry, Inc. (a) | 329 | | 4,688 |
Sonic Solutions, Inc. (a) | 2,245 | | 22,405 |
Sourcefire, Inc. (a) | 936 | | 25,394 |
SRS Labs, Inc. (a) | 833 | | 7,097 |
SS&C Technologies Holdings, Inc. (a) | 2,835 | | 55,027 |
SuccessFactors, Inc. (a) | 2,909 | | 87,765 |
Common Stocks - continued |
| Shares | | Value |
INFORMATION TECHNOLOGY - continued |
Software - continued |
Symantec Corp. (a) | 31,215 | | $ 524,412 |
Synchronoss Technologies, Inc. (a) | 1,251 | | 32,513 |
Synopsys, Inc. (a) | 5,735 | | 147,332 |
Take-Two Interactive Software, Inc. (a)(d) | 2,856 | | 31,602 |
Taleo Corp. Class A (a) | 1,407 | | 43,195 |
TeleCommunication Systems, Inc. Class A (a) | 1,500 | | 6,990 |
TeleNav, Inc. | 1,766 | | 11,514 |
The9 Ltd. sponsored ADR (a)(d) | 786 | | 5,030 |
THQ, Inc. (a) | 3,315 | | 16,907 |
TIBCO Software, Inc. (a) | 6,069 | | 119,195 |
TigerLogic Corp. (a)(d) | 987 | | 4,550 |
TiVo, Inc. (a) | 4,101 | | 33,710 |
Ulticom, Inc. | 764 | | 6,081 |
Ultimate Software Group, Inc. (a) | 975 | | 42,773 |
Vasco Data Security International, Inc. (a) | 1,515 | | 13,090 |
Verint Systems, Inc. (a) | 1,219 | | 40,105 |
Versant Corp. (a) | 315 | | 3,736 |
Voltaire Ltd. (a) | 1,084 | | 9,377 |
Wave Systems Corp. Class A (a)(d) | 3,219 | | 8,498 |
Websense, Inc. (a) | 1,626 | | 33,707 |
| | 22,144,799 |
TOTAL INFORMATION TECHNOLOGY | | 77,775,784 |
MATERIALS - 1.2% |
Chemicals - 0.4% |
A. Schulman, Inc. | 1,300 | | 26,325 |
Altair Nanotechnologies, Inc. (a)(d) | 1,335 | | 3,111 |
American Pacific Corp. (a) | 525 | | 3,218 |
Ampal-American Israel Corp. Class A (a) | 1,950 | | 3,842 |
Balchem Corp. | 1,200 | | 37,152 |
Cereplast, Inc. (a) | 450 | | 1,575 |
China Agritech, Inc. (a)(d) | 738 | | 8,487 |
Hawkins, Inc. | 555 | | 24,159 |
Innophos Holdings, Inc. | 810 | | 27,589 |
Innospec, Inc. (a) | 1,020 | | 21,879 |
KMG Chemicals, Inc. | 511 | | 7,307 |
Landec Corp. (a) | 1,071 | | 6,704 |
Material Sciences Corp. (a) | 570 | | 2,810 |
Methanex Corp. | 3,696 | | 108,295 |
Penford Corp. (a) | 476 | | 2,842 |
Common Stocks - continued |
| Shares | | Value |
MATERIALS - continued |
Chemicals - continued |
Senomyx, Inc. (a) | 1,501 | | $ 8,466 |
ShengdaTech, Inc. (a) | 2,025 | | 12,130 |
Sigma Aldrich Corp. | 4,707 | | 297,577 |
TPC Group, Inc. (a) | 698 | | 19,488 |
Yongye International, Inc. (a)(d) | 2,000 | | 15,640 |
Zagg, Inc. (a) | 899 | | 6,473 |
Zoltek Companies, Inc. (a) | 1,281 | | 11,644 |
| | 656,713 |
Construction Materials - 0.0% |
United States Lime & Minerals, Inc. (a) | 345 | | 14,145 |
Containers & Packaging - 0.1% |
AEP Industries, Inc. (a) | 300 | | 7,215 |
Silgan Holdings, Inc. | 2,978 | | 101,967 |
| | 109,182 |
Metals & Mining - 0.7% |
Century Aluminum Co. (a) | 3,466 | | 47,987 |
China Gerui Adv Mat Group Ltd. (a)(d) | 1,568 | | 8,765 |
China Natural Resources, Inc. (a)(d) | 816 | | 12,819 |
China Precision Steel, Inc. (a)(d) | 1,912 | | 2,906 |
DRDGOLD Ltd. sponsored ADR (d) | 970 | | 4,598 |
Globe Specialty Metals, Inc. | 2,759 | | 44,723 |
Gulf Resources, Inc. (a) | 1,170 | | 11,922 |
Haynes International, Inc. | 435 | | 16,821 |
Horsehead Holding Corp. (a) | 1,564 | | 18,189 |
Kaiser Aluminum Corp. | 821 | | 38,505 |
Olympic Steel, Inc. | 480 | | 10,099 |
Pan American Silver Corp. | 4,166 | | 156,017 |
Qiao Xing Universal Telephone, Inc. (a)(d) | 856 | | 1,515 |
Randgold Resources Ltd. sponsored ADR | 2,465 | | 231,858 |
Royal Gold, Inc. | 2,051 | | 105,668 |
Schnitzer Steel Industries, Inc. Class A | 866 | | 49,440 |
Silver Standard Resources, Inc. (a) | 3,100 | | 80,786 |
SinoCoking Coal and Coke Chemical Industries, Inc. (a) | 750 | | 6,195 |
Steel Dynamics, Inc. | 8,500 | | 135,490 |
Sutor Technology Group Ltd. (a) | 1,977 | | 3,578 |
Universal Stainless & Alloy Products, Inc. (a) | 469 | | 14,666 |
US Energy Corp. (a) | 1,078 | | 5,304 |
WHX Corp. (a) | 569 | | 6,185 |
| | 1,014,036 |
Common Stocks - continued |
| Shares | | Value |
MATERIALS - continued |
Paper & Forest Products - 0.0% |
Mercer International, Inc. (SBI) (a) | 2,261 | | $ 15,601 |
TOTAL MATERIALS | | 1,809,677 |
TELECOMMUNICATION SERVICES - 1.7% |
Diversified Telecommunication Services - 0.5% |
012 Smile.Communications Ltd. | 1,052 | | 31,834 |
8x8, Inc. (a) | 2,396 | | 6,325 |
Alaska Communication Systems Group, Inc. | 2,052 | | 21,628 |
Arbinet-thexchange, Inc. (a) | 237 | | 1,612 |
Atlantic Tele-Network, Inc. | 551 | | 18,894 |
Cbeyond, Inc. (a) | 1,101 | | 14,511 |
City Telecom (HK) Ltd. sponsored ADR | 561 | | 8,370 |
Cogent Communications Group, Inc. (a) | 1,770 | | 21,382 |
Consolidated Communications Holdings, Inc. | 1,291 | | 23,780 |
General Communications, Inc. Class A (a) | 2,256 | | 25,425 |
Global Crossing Ltd. (a) | 2,036 | | 27,221 |
Globalstar, Inc. (a) | 10,623 | | 16,359 |
HickoryTech Corp. | 570 | | 5,164 |
Iridium Communications, Inc. (a) | 2,453 | | 22,911 |
Level 3 Communications, Inc. (a)(d) | 62,595 | | 62,595 |
Neutral Tandem, Inc. (a) | 1,292 | | 18,566 |
PAETEC Holding Corp. (a) | 5,541 | | 20,502 |
SureWest Communications (a) | 705 | | 6,239 |
Telefonos de Mexico SA de CV Series A sponsored ADR | 176 | | 2,790 |
tw telecom, inc. (a) | 6,000 | | 98,880 |
VocalTec Communications Ltd. (a)(d) | 422 | | 11,867 |
Warwick Valley Telephone Co. | 571 | | 8,365 |
Windstream Corp. | 18,500 | | 241,240 |
| | 716,460 |
Wireless Telecommunication Services - 1.2% |
America Movil SAB de CV Series A sponsored ADR | 296 | | 15,981 |
Clearwire Corp. Class A (a)(d) | 8,936 | | 62,731 |
FiberTower Corp. (a) | 1,385 | | 6,039 |
ICO Global Communications Holdings Ltd. Class A (a) | 6,352 | | 9,592 |
Leap Wireless International, Inc. (a) | 2,826 | | 30,761 |
Millicom International Cellular SA | 4,234 | | 367,427 |
NII Holdings, Inc. (a) | 6,459 | | 250,351 |
NTELOS Holdings Corp. | 1,811 | | 30,751 |
Partner Communications Co. Ltd. ADR | 576 | | 11,929 |
SBA Communications Corp. Class A (a) | 4,672 | | 182,909 |
Common Stocks - continued |
| Shares | | Value |
TELECOMMUNICATION SERVICES - continued |
Wireless Telecommunication Services - continued |
Shenandoah Telecommunications Co. | 891 | | $ 15,584 |
USA Mobility, Inc. | 1,341 | | 22,824 |
Vodafone Group PLC sponsored ADR | 30,300 | | 759,318 |
| | 1,766,197 |
TOTAL TELECOMMUNICATION SERVICES | | 2,482,657 |
UTILITIES - 0.1% |
Electric Utilities - 0.1% |
MGE Energy, Inc. | 911 | | 37,615 |
Otter Tail Corp. | 1,098 | | 22,575 |
| | 60,190 |
Gas Utilities - 0.0% |
China Natural Gas, Inc. (a)(d) | 900 | | 4,545 |
Independent Power Producers & Energy Traders - 0.0% |
Synthesis Energy Systems, Inc. (a) | 2,880 | | 2,794 |
Water Utilities - 0.0% |
Artesian Resources Corp. Class A | 375 | | 7,039 |
Cadiz, Inc. (a) | 1,179 | | 13,299 |
Connecticut Water Service, Inc. | 465 | | 11,844 |
Consolidated Water Co., Inc. | 705 | | 6,225 |
Middlesex Water Co. | 510 | | 8,905 |
Tri-Tech Holding, Inc. (a) | 258 | | 2,766 |
York Water Co. | 426 | | 6,744 |
| | 56,822 |
TOTAL UTILITIES | | 124,351 |
TOTAL COMMON STOCKS (Cost $124,504,892) | 147,922,688 |
Money Market Funds - 2.3% |
| Shares | | Value |
Fidelity Securities Lending Cash Central Fund, 0.25% (b)(c)
(Cost $3,391,853) | 3,391,853 | | $ 3,391,853 |
TOTAL INVESTMENT PORTFOLIO - 102.2% (Cost $127,896,745) | | 151,314,541 |
NET OTHER ASSETS (LIABILITIES) - (2.2)% | | (3,290,248) |
NET ASSETS - 100% | $ 148,024,293 |
Legend |
(a) Non-income producing |
(b) Affiliated fund that is available only to investment companies and other accounts managed by Fidelity Investments. The rate quoted is the annualized seven-day yield of the fund at period end. A complete unaudited listing of the fund's holdings as of its most recent quarter end is available upon request. In addition, each Fidelity Central Fund's financial statements, which are not covered by the Fund's Report of Independent Registered Public Accounting Firm, are available on the SEC's website or upon request. |
(c) Investment made with cash collateral received from securities on loan. |
(d) Security or a portion of the security is on loan at period end. |
Affiliated Central Funds |
Information regarding fiscal year to date income earned by the Fund from investments in Fidelity Central Funds is as follows: |
Fund | Income earned |
Fidelity Cash Central Fund | $ 155 |
Fidelity Securities Lending Cash Central Fund | 151,832 |
Total | $ 151,987 |
Other Information |
The following is a summary of the inputs used, as of November 30, 2010, involving the Fund's assets and liabilities carried at fair value. The inputs or methodology used for valuing securities may not be an indication of the risk associated with investing in those securities. For more information on valuation inputs, and their aggregation into the levels used in the tables below, please refer to the Security Valuation section in the accompanying Notes to Financial Statements. |
Valuation Inputs at Reporting Date: |
Description | Total | Level 1 | Level 2 | Level 3 |
Investments in Securities: | | | | |
Equities: | | | | |
Consumer Discretionary | $ 22,765,313 | $ 22,765,313 | $ - | $ - |
Consumer Staples | 3,029,833 | 3,029,833 | - | - |
Energy | 2,434,105 | 2,433,837 | 268 | - |
Financials | 10,494,737 | 10,493,683 | 92 | 962 |
Health Care | 19,142,892 | 19,142,892 | - | - |
Industrials | 7,863,339 | 7,856,651 | - | 6,688 |
Information Technology | 77,775,784 | 77,775,784 | - | - |
Materials | 1,809,677 | 1,809,677 | - | - |
Telecommunication Services | 2,482,657 | 2,482,657 | - | - |
Utilities | 124,351 | 124,351 | - | - |
Money Market Funds | 3,391,853 | 3,391,853 | - | - |
Total Investments in Securities: | $ 151,314,541 | $ 151,306,531 | $ 360 | $ 7,650 |
The following is a reconciliation of Investments in Securities for which Level 3 inputs were used in determining value: |
Investments in Securities: | |
Beginning Balance | $ - |
Total Realized Gain (Loss) | 599 |
Total Unrealized Gain (Loss) | (32,790) |
Cost of Purchases | 4,253 |
Proceeds of Sales | (2,087) |
Amortization/Accretion | - |
Transfers in to Level 3 | 37,675 |
Transfers out of Level 3 | - |
Ending Balance | $ 7,650 |
The change in unrealized gain (loss) for the period attributable to Level 3 securities held at November 30, 2010 | $ (32,790) |
The information used in the above reconciliation represents fiscal year to date activity for any Investments in Securities identified as using Level 3 inputs at either the beginning or the end of the current fiscal period. Transfers in or out of Level 3 represent the beginning value of any Security or Instrument where a change in the pricing level occurred from the beginning to the end of the period. The cost of purchases and the proceeds of sales may include securities received or delivered through corporate actions or exchanges. Realized and unrealized gains (losses) disclosed in the reconciliation are included in Net Gain (Loss) on the Fund's Statement of Operations. |
Income Tax Information |
At November 30, 2010, the Fund had a capital loss carryforward of approximately $3,557,630 of which $2,006,543, $1,453,838 and $97,249 will expire in fiscal 2016, 2017 and 2018, respectively. Capital loss carryforwards are only available to offset future capital gains of the Fund to the extent provided by regulations and may be limited. |
See accompanying notes which are an integral part of the financial statements.
Annual Report
Statement of Assets and Liabilities
| November 30, 2010 |
| | |
Assets | | |
Investment in securities, at value (including securities loaned of $3,183,015) - See accompanying schedule: Unaffiliated issuers (cost $124,504,892) | $ 147,922,688 | |
Fidelity Central Funds (cost $3,391,853) | 3,391,853 | |
Total Investments (cost $127,896,745) | | $ 151,314,541 |
Receivable for investments sold | | 84,815 |
Dividends receivable | | 221,799 |
Distributions receivable from Fidelity Central Funds | | 20,223 |
Prepaid expenses | | 516 |
Receivable from investment adviser for expense reductions | | 35,969 |
Other receivables | | 113 |
Total assets | | 151,677,976 |
| | |
Liabilities | | |
Payable to custodian bank | $ 51,524 | |
Payable for investments purchased | 38,727 | |
Accrued management fee | 29,986 | |
Distribution and service plan fees payable | 32,306 | |
Other affiliated payables | 4,860 | |
Other payables and accrued expenses | 104,427 | |
Collateral on securities loaned, at value | 3,391,853 | |
Total liabilities | | 3,653,683 |
| | |
Net Assets | | $ 148,024,293 |
Net Assets consist of: | | |
Paid in capital | | $ 127,964,075 |
Undistributed net investment income | | 348,816 |
Accumulated undistributed net realized gain (loss) on investments and foreign currency transactions | | (3,706,394) |
Net unrealized appreciation (depreciation) on investments | | 23,417,796 |
Net Assets, for 1,500,000 shares outstanding | | $ 148,024,293 |
Net Asset Value, offering price and redemption price per share ($148,024,293 ÷ 1,500,000 shares) | | $ 98.68 |
See accompanying notes which are an integral part of the financial statements.
Annual Report
Financial Statements - continued
Statement of Operations
| Year ended November 30, 2010 |
| | |
Investment Income | | |
Dividends | | $ 1,393,129 |
Interest | | 8 |
Income from Fidelity Central Funds (including $151,832 from security lending) | | 151,987 |
Total income | | 1,545,124 |
| | |
Expenses | | |
Management fee | $ 343,253 | |
Transfer agent and custody fees | 96,238 | |
Distribution and service plan fees | 128,685 | |
Licensing fees | 85,791 | |
Accounting and security lending fees | 56,070 | |
Independent trustees' compensation | 790 | |
Audit | 115,833 | |
Legal | 625 | |
Miscellaneous | 8,086 | |
Total expenses before reductions | 835,371 | |
Expense reductions | (405,950) | 429,421 |
Net investment income (loss) | | 1,115,703 |
Realized and Unrealized Gain (Loss) Net realized gain (loss) on: | | |
Investment securities: | | |
Unaffiliated issuers | (203,144) | |
In-kind Redemptions | 5,524,544 | |
Foreign currency transactions | 560 | |
Capital gain distributions from Fidelity Central Funds | 251 | |
Total net realized gain (loss) | | 5,322,211 |
Change in net unrealized appreciation (depreciation) on investment securities | | 15,045,571 |
Net gain (loss) | | 20,367,782 |
Net increase (decrease) in net assets resulting from operations | | $ 21,483,485 |
See accompanying notes which are an integral part of the financial statements.
Annual Report
Statement of Changes in Net Assets
| Year ended
November 30,
2010 | Year ended
November 30,
2009 |
Increase (Decrease) in Net Assets | | |
Operations | | |
Net investment income (loss) | $ 1,115,703 | $ 761,203 |
Net realized gain (loss) | 5,322,211 | (2,455,543) |
Change in net unrealized appreciation (depreciation) | 15,045,571 | 35,356,212 |
Net increase (decrease) in net assets resulting
from operations | 21,483,485 | 33,661,872 |
Distributions to shareholders from net investment income | (935,000) | (646,000) |
Share transactions
Proceeds from sales of shares | 18,476,000 | 21,067,288 |
Cost of shares redeemed | (17,969,770) | (5,918,282) |
Net increase (decrease) in net assets resulting from share transactions | 506,230 | 15,149,006 |
Total increase (decrease) in net assets | 21,054,715 | 48,164,878 |
| | |
Net Assets | | |
Beginning of period | 126,969,578 | 78,804,700 |
End of period (including undistributed net investment income of $348,816 and undistributed net investment income of $235,878, respectively) | $ 148,024,293 | $ 126,969,578 |
Other Information Shares | | |
Sold | 200,000 | 300,000 |
Redeemed | (200,000) | (100,000) |
Net increase (decrease) | - | 200,000 |
See accompanying notes which are an integral part of the financial statements.
Annual Report
Financial Highlights
Years ended November 30, | 2010 | 2009 | 2008 | 2007 | 2006 |
Selected Per-Share Data | | | | | |
Net asset value, beginning of period | $ 84.65 | $ 60.62 | $ 104.53 | $ 95.70 | $ 88.26 |
Income from Investment Operations | | | | | |
Net investment income (loss) B | .71 | .55 | .69 | .51 | .47 |
Net realized and unrealized gain (loss) | 13.92 | 23.95 | (43.96) | 8.73 | 7.87 |
Total from investment operations | 14.63 | 24.50 | (43.27) | 9.24 | 8.34 |
Distributions from net investment income | (.60) | (.47) | (.53) | (.41) | (.40) |
Distributions from net realized gain | - | - | (.11) | - | (.50) |
Total distributions | (.60) | (.47) | (.64) | (.41) | (.90) |
Net asset value, end of period | $ 98.68 | $ 84.65 | $ 60.62 | $ 104.53 | $ 95.70 |
Total Return A | 17.35% | 40.62% | (41.62)% | 9.68% | 9.54% |
Ratios to Average Net Assets C, E | | | | | |
Expenses before reductions | .58% | .65% | .73% | .61% | .61% |
Expenses net of fee waivers,
if any | .30% | .30% | .30% | .30% | .30% |
Expenses net of all reductions | .30% | .30% | .30% | .30% | .30% |
Net investment income (loss) | .78% | .78% | .79% | .50% | .52% |
Supplemental Data | | | | | |
Net assets, end of period
(000 omitted) | $ 148,024 | $ 126,970 | $ 78,805 | $ 114,982 | $ 172,254 |
Portfolio turnover rate D, F | 6% | 7% | 10% | 9% | 7% |
A Total returns would have been lower had certain expenses not been reduced during the periods shown.
B Calculated based on average shares outstanding during the period.
C Fees and expenses of the underlying Fidelity Central Funds are not included in the Fund's expense ratio. The Fund indirectly bears its proportionate share of the expenses of any underlying Fidelity Central Funds.
D Amount does not include the portfolio activity of any underlying Fidelity Central Funds.
E Expense ratios reflect operating expenses of the Fund. Expenses before reductions do not reflect amounts reimbursed by the investment adviser or reductions from expense offset arrangements and do not represent the amount paid by the Fund during periods when reimbursements or reductions occur. Expenses net of fee waivers reflect expenses after reimbursement by the investment adviser but prior to reductions from expense offset arrangements. Expenses net of all reductions represent the net expenses paid by the Fund.
F Portfolio turnover rate excludes securities received or delivered in-kind.
See accompanying notes which are an integral part of the financial statements.
Annual Report
Notes to Financial Statements
For the period ended November 30, 2010
1. Organization.
Fidelity Nasdaq Composite Index Tracking Stock (the Fund) is an exchange-traded fund of Fidelity Commonwealth Trust (the Trust) and is authorized to issue an unlimited number of shares. The Trust is registered under the Investment Company Act of 1940, as amended (the 1940 Act), as an open-end management investment company organized as a Massachusetts business trust.
2. Investments in Fidelity Central Funds.
The Fund may invest in Fidelity Central Funds, which are open-end investment companies available only to other investment companies and accounts managed by Fidelity Management & Research Company (FMR) and its affiliates. The Fund's Schedule of Investments lists each of the Fidelity Central Funds held as of period end, if any, as an investment of the Fund, but does not include the underlying holdings of each Fidelity Central Fund. As an Investing Fund, the Fund indirectly bears its proportionate share of the expenses of the underlying Fidelity Central Funds.
The Money Market Central Funds seek preservation of capital and current income and are managed by Fidelity Investments Money Management, Inc. (FIMM), an affiliate of FMR.
A complete unaudited list of holdings for each Fidelity Central Fund is available upon request or at the Securities and Exchange Commission (the SEC) web site at www.sec.gov. In addition, the financial statements of the Fidelity Central Funds, which are not covered by the Fund's Report of Independent Registered Public Accounting Firm, are available on the SEC web site or upon request.
3. Significant Accounting Policies.
The financial statements have been prepared in conformity with accounting principles generally accepted in the United States of America (GAAP), which require management to make certain estimates and assumptions at the date of the financial statements. Actual results could differ from those estimates. The following summarizes the significant accounting policies of the Fund:
Security Valuation. Investments are valued as of 4:00 p.m. Eastern time on the last calendar day of the period. The Fund uses independent pricing services approved by the Board of Trustees to value its investments. When current market prices or quotations are not readily available or reliable, valuations may be determined in good faith in accordance with procedures adopted by the Board of Trustees. Factors used in determining value may include market or security specific events. The frequency with which these procedures are used cannot be predicted and they may be utilized to a significant extent. The value used for net asset value (NAV) calculation under these procedures may differ from published prices for the same securities.
Annual Report
3. Significant Accounting Policies - continued
Security Valuation - continued
The Fund categorizes the inputs to valuation techniques used to value its investments into a disclosure hierarchy consisting of three levels as shown below.
Level 1 - quoted prices in active markets for identical investments
Level 2 - other significant observable inputs (including quoted prices for similar investments, interest rates, prepayment speeds, etc.)
Level 3 - unobservable inputs (including the Fund's own assumptions based on the best information available)
Changes in valuation techniques may result in transfers in or out of an assigned level within the disclosure hierarchy. The aggregate value of investments by input level, as of November 30, 2010, as well as a roll forward of Level 3 securities, is included at the end of the Fund's Schedule of Investments. Valuation techniques used to value the Fund's investments by major category are as follows.
Equity securities, including restricted securities, for which market quotations are readily available, are valued at the last reported sale price or official closing price as reported by an independent pricing service on the primary market or exchange on which they are traded and are categorized as Level 1 in the hierarchy. In the event there were no sales during the day or closing prices are not available, securities are valued at the last quoted bid price or may be valued using the last available price and are generally categorized as Level 2 in the hierarchy. For foreign equity securities, when significant market or security specific events arise, comparisons to the valuation of American Depositary Receipts (ADRs), futures contracts, Exchange-traded funds (ETFs) and certain indexes as well as quoted prices for similar securities are used and are categorized as Level 2 in the hierarchy in these circumstances. Utilizing these techniques may result in transfers between Level 1 and Level 2. For restricted equity securities and private placements where observable inputs are limited, assumptions about market activity and risk are used and are categorized as Level 3 in the hierarchy.
Investments in open-end mutual funds, including the Fidelity Central Funds, are valued at their closing net asset value each business day and are categorized as Level 1 in the hierarchy.
Foreign Currency. The Fund uses foreign currency contracts to facilitate transactions in foreign-denominated securities. Gains and losses from these transactions may arise from changes in the value of the foreign currency or if the counterparties do not perform under the contracts' terms.
Annual Report
Notes to Financial Statements - continued
3. Significant Accounting Policies - continued
Foreign Currency - continued
Foreign-denominated assets, including investment securities, and liabilities are translated into U.S. dollars at the exchange rate at period end. Purchases and sales of investment securities, income and dividends received and expenses denominated in foreign currencies are translated into U.S. dollars at the exchange rate in effect on the transaction date.
The effects of exchange rate fluctuations on investments are included with the net realized and unrealized gain (loss) on investment securities. Other foreign currency transactions resulting in realized and unrealized gain (loss) are disclosed separately.
Investment Transactions and Income. For financial reporting purposes, the Fund's investment holdings and NAV include trades executed through the end of the last business day of the period. The NAV per share for processing shareholder transactions is calculated as of the close of regular trading hours on the NASDAQ exchange, normally 4:00 p.m. Eastern time and includes trades executed through the end of the prior business day. Gains and losses on securities sold are determined on the basis of identified cost and may include proceeds received from litigation. Dividend income is recorded on the ex-dividend date, except for certain dividends from foreign securities where the ex-dividend date may have passed, which are recorded as soon as the Fund is informed of the ex-dividend date. Non-cash dividends included in dividend income, if any, are recorded at the fair market value of the securities received. Distributions received on securities that represent a return of capital or capital gain are recorded as a reduction of cost of investments and/or as a realized gain. The Fund estimates the components of distributions received that may be considered return of capital distributions or capital gain distributions. Interest income and distributions from the Fidelity Central Funds are accrued as earned. Interest income includes coupon interest and amortization of premium and accretion of discount on debt securities. Investment income is recorded net of foreign taxes withheld where recovery of such taxes is uncertain.
Expenses. Most expenses of the Trust can be directly attributed to a fund. Expenses which cannot be directly attributed are apportioned amongst each fund in the Trust. Expense estimates are accrued in the period to which they relate and adjustments are made when actual amounts are known.
Income Tax Information and Distributions to Shareholders. Each year the Fund intends to qualify as a regulated investment company, including distributing substantially all of its taxable income and realized gains under Subchapter M of the Internal Revenue Code and filing its U.S. federal tax return. As a result, no provision for income taxes is required. As of November 30, 2010, the Fund did not have any unrecognized tax benefits in the accompanying financial statements. A fund's federal tax return is subject to examination by the Internal Revenue Service (IRS) for a period of three years.
Annual Report
3. Significant Accounting Policies - continued
Income Tax Information and Distributions to Shareholders - continued
Realized gain or loss resulting from in-kind redemptions is not taxable to the Fund and is not distributed to shareholders of the Fund. Foreign taxes are provided for based on the Fund's understanding of the tax rules and rates that exist in the foreign markets in which it invests.
Distributions are recorded on the ex-dividend date. Income and capital gain distributions are determined in accordance with income tax regulations, which may differ from GAAP.
Capital accounts within the financial statements are adjusted for permanent book-tax differences. These adjustments have no impact on net assets or the results of operations. Temporary book-tax differences will reverse in a subsequent period.
Book-tax differences are primarily due to the short-term gain distributions from the Fidelity Central Funds, foreign currency transactions, redemptions in kind, partnerships, capital loss carryforwards and losses deferred due to wash sales.
The federal tax cost of investment securities and unrealized appreciation (depreciation) as of period end were as follows:
Gross unrealized appreciation | $ 36,646,953 |
Gross unrealized depreciation | (13,293,170) |
Net unrealized appreciation (depreciation) | $ 23,353,783 |
| |
Tax Cost | $ 127,960,758 |
The tax-based components of distributable earnings as of period end were as follows:
Undistributed ordinary income | $ 348,816 |
Capital loss carryforward | $ (3,557,630) |
Net unrealized appreciation (depreciation) | $ 23,353,783 |
The tax character of distributions paid was as follows:
| November 30, 2010 | November 31, 2009 |
Ordinary Income | $ 935,000 | $ 646,000 |
4. Purchases and Sales of Investments.
Purchases and sales of securities, other than short-term securities and in-kind transactions, aggregated $8,609,115 and $8,394,377, respectively.
Securities received and delivered through in-kind subscriptions and redemptions aggregated $18,430,016 and $17,919,087, respectively.
Annual Report
Notes to Financial Statements - continued
5. Fees and Other Transactions with Affiliates.
Management Fee. FMR and its affiliates provide the Fund with investment management related services for which the Fund pays a monthly management fee that is based on an annual rate of .24% of the Fund's average net assets.
Sub-Adviser. Geode Capital Management, LLC (Geode), serves as sub-adviser for the Fund. Geode provides discretionary investment advisory services to the Fund and is paid by FMR for providing these services.
Distribution and Service Plan Fees. In accordance with Rule 12b-1 of the 1940 Act, the Fund has adopted a Distribution and Service Plan. The Fund pays Fidelity Distributors Corporation (FDC), an affiliate of FMR, a distribution fee based on an annual percentage of the Fund's average net assets of up to .25%. In addition, FDC pays NASDAQ for marketing services provided to the Fund. For the period, the distribution fees were equivalent to an annual rate of .09% of average net assets. The total fees and amounts retained by FDC were $128,685 and $0, respectively.
Accounting and Security Lending Fees. Fidelity Service Company, Inc. (FSC), an affiliate of FMR, maintains the Fund's accounting records. The accounting fee is based on the level of average net assets for the month. Under a separate contract, FSC administers the security lending program. The security lending fee is based on the number and duration of lending transactions.
Licensing Fees. Under the terms of a license agreement, FMR pays NASDAQ an annual licensing fee for the use of the NASDAQ Composite Index. FMR has entered into a sub-license agreement with the Fund whereby the Fund pays FMR the amount of the license fee at the rate of up to .06% of the Fund's average net assets.
6. Security Lending.
The Fund lends portfolio securities through a lending agent from time to time in order to earn additional income. On the settlement date of the loan, the Fund receives collateral (in the form of U.S. Treasury obligations, letters of credit and/or cash) against the loaned securities and maintains collateral in an amount not less than 100% of the market value of the loaned securities during the period of the loan. The market value of the loaned securities is determined at the close of business of the Fund and any additional required collateral is delivered to the Fund on the next business day. If the borrower defaults on its obligation to return the securities loaned because of insolvency or other reasons, a fund could experience delays and costs in recovering the securities loaned or in gaining access to the collateral. Any cash collateral received is invested in the Fidelity Securities Lending Cash Central Fund. The value of loaned securities and cash collateral at period end are disclosed on the Fund's Statement of Assets and Liabilities. Security lending
Annual Report
6. Security Lending - continued
income represents the income earned on investing cash collateral, less rebates paid to borrowers and lending agent fees associated with the loan, plus any premium payments received for lending certain types of securities. Security lending income is presented in the Statement of Operations as a component of income from Fidelity Central Funds.
7. Expense Reductions.
FMR contractually agreed to waive expenses of the Fund to the extent annual operating expenses exceeded .30% of average net assets. This waiver will remain in place through January 31, 2012. Some expenses, for example interest expense, are excluded from this waiver. During the period this waiver reduced the Fund's expenses by $405,934.
In addition, through arrangements with the Fund's custodian, credits realized as a result of uninvested cash balances were used to reduce the Fund's expenses. During the period, these credits reduced the Fund's custody expenses by $16.
8. Share Transactions.
The Fund issues and redeems shares at Net Asset Value only with certain authorized participants in large increments known as Creation Units. Purchases of Creation Units are made by tendering a basket of designated stocks to the Fund and redemption proceeds are paid with a basket of securities from the Fund's portfolio with a balancing cash component to equate the market value of the basket of securities delivered or redeemed to the NAV per Creation Unit on the transaction date. Cash may be substituted equivalent to the value of certain securities generally when they are not available in sufficient quantity for delivery. The Fund's shares are available in smaller increments to investors in the secondary market at market prices and may be subject to commissions. A transaction fee is charged by the shareholder servicing agent when authorized participants purchase or redeem Creation Units of the Fund. The fee is charged to cover the costs associated with the issuance and redemption of Creation Units. During the period, transaction fees totaled $15,000.
9. Other.
The Fund's organizational documents provide former and current trustees and officers with a limited indemnification against liabilities arising in connection with the performance of their duties to the Fund. In the normal course of business, the Fund may also enter into contracts that provide general indemnifications. The Fund's maximum exposure under these arrangements is unknown as this would be dependent on future claims that may be made against the Fund. The risk of material loss from such claims is considered remote.
Annual Report
To the Trustees of Fidelity Commonwealth Trust and the Shareholders of Fidelity® Nasdaq Composite® Index Tracking Stock:
In our opinion, the accompanying statement of assets and liabilities, including the schedule of investments, and the related statements of operations and of changes in net assets and the financial highlights present fairly, in all material respects, the financial position of Fidelity® Nasdaq Composite® Index Tracking Stock (a fund of Fidelity Commonwealth Trust) at November 30, 2010, the results of its operations for the year then ended, the changes in its net assets for each of the two years in the period then ended and the financial highlights for each of the five years in the period then ended, in conformity with accounting principles generally accepted in the United States of America. These financial statements and financial highlights (hereafter referred to as "financial statements") are the responsibility of the Fidelity® Nasdaq Composite® Index Tracking Stock's management. Our responsibility is to express an opinion on these financial statements based on our audits. We conducted our audits of these financial statements in accordance with the standards of the Public Company Accounting Oversight Board (United States). Those standards require that we plan and perform the audit to obtain reasonable assurance about whether the financial statements are free of material misstatement. An audit includes examining, on a test basis, evidence supporting the amounts and disclosures in the financial statements, assessing the accounting principles used and significant estimates made by management, and evaluating the overall financial statement presentation. We believe that our audits, which included confirmation of securities at November 30, 2010, by correspondence with the custodian and brokers, provide a reasonable basis for our opinion.
/s/ PricewaterhouseCoopers LLP
PricewaterhouseCoopers LLP
Boston, Massachusetts
January 18, 2011
Annual Report
The Trustees, Members of the Advisory Board, and executive officers of the trust and fund, as applicable, are listed below. The Board of Trustees governs the fund and is responsible for protecting the interests of shareholders. The Trustees are experienced executives who meet periodically throughout the year to oversee the fund's activities, review contractual arrangements with companies that provide services to the fund, oversee management of the risks associated with such activities and contractual arrangements, and review the fund's performance. Except for James C. Curvey, each of the Trustees oversees 219 funds advised by FMR or an affiliate. Mr. Curvey oversees 408 funds advised by FMR or an affiliate.
The Trustees hold office without limit in time except that (a) any Trustee may resign; (b) any Trustee may be removed by written instrument, signed by at least two-thirds of the number of Trustees prior to such removal; (c) any Trustee who requests to be retired or who has become incapacitated by illness or injury may be retired by written instrument signed by a majority of the other Trustees; and (d) any Trustee may be removed at any special meeting of shareholders by a two-thirds vote of the outstanding voting securities of the trust. Each Trustee who is not an interested person (as defined in the 1940 Act) (Independent Trustee), shall retire not later than the last day of the calendar year in which his or her 72nd birthday occurs. The Independent Trustees may waive this mandatory retirement age policy with respect to individual Trustees. The executive officers and Advisory Board Members hold office without limit in time, except that any officer and Advisory Board Member may resign or may be removed by a vote of a majority of the Trustees at any regular meeting or any special meeting of the Trustees. Except as indicated, each individual has held the office shown or other offices in the same company for the past five years.
Experience, Skills, Attributes, and Qualifications of the Fund's Trustees. The Governance and Nominating Committee has adopted a statement of policy that describes the experience, qualifications, attributes, and skills that are necessary and desirable for potential Independent Trustee candidates (Statement of Policy). The Board believes that each Trustee satisfied at the time he or she was initially elected or appointed a Trustee, and continues to satisfy, the standards contemplated by the Statement of Policy. The Governance and Nominating Committee also engages professional search firms to help identify potential Independent Trustee candidates who have the experience, qualifications, attributes, and skills consistent with the Statement of Policy. From time to time, additional criteria based on the composition and skills of the current Independent Trustees, as well as experience or skills that may be appropriate in light of future changes to board composition, business conditions, and regulatory or other developments, have also been considered by the professional search firms and the Governance and Nominating Committee. In addition, the Board takes into account the Trustees' commitment and participation in Board and committee meetings, as well as their leadership of standing and ad hoc committees throughout their tenure.
In determining that a particular Trustee was and continues to be qualified to serve as a Trustee, the Board has considered a variety of criteria, none of which, in isolation, was controlling. The Board believes that, collectively, the Trustees have balanced and diverse experience, qualifications, attributes, and skills, which allow the Board to operate effectively in governing the fund and protecting the interests of shareholders. Information about the specific experience, skills, attributes, and qualifications of each Trustee, which in each case led to the Board's conclusion that the Trustee should serve (or continue to serve) as a trustee of the fund, is provided below.
Annual Report
Trustees and Officers - continued
Board Structure and Oversight Function. James C. Curvey is an interested person (as defined in the 1940 Act) and currently serves as Acting Chairman. The Trustees have determined that an interested Chairman is appropriate and benefits shareholders because an interested Chairman has a personal and professional stake in the quality and continuity of services provided to the fund. Independent Trustees exercise their informed business judgment to appoint an individual of their choosing to serve as Chairman, regardless of whether the Trustee happens to be independent or a member of management. The Independent Trustees have determined that they can act independently and effectively without having an Independent Trustee serve as Chairman and that a key structural component for assuring that they are in a position to do so is for the Independent Trustees to constitute a substantial majority for the Board. The Independent Trustees also regularly meet in executive session. Ned C. Lautenbach serves as Chairman of the Independent Trustees and as such (i) acts as a liaison between the Independent Trustees and management with respect to matters important to the Independent Trustees and (ii) with management prepares agendas for Board meetings.
Fidelity funds are overseen by different Boards of Trustees. The fund's Board oversees Fidelity's equity and high income funds and another Board oversees Fidelity's investment-grade bond, money market, and asset allocation funds. The asset allocation funds may invest in Fidelity funds overseen by the fund's Board. The use of separate Boards, each with its own committee structure, allows the Trustees of each group of Fidelity funds to focus on the unique issues of the funds they oversee, including common research, investment, and operational issues. On occasion, the separate Boards establish joint committees to address issues of overlapping consequences for the Fidelity funds overseen by each Board.
The Trustees operate using a system of committees to facilitate the timely and efficient consideration of all matters of importance to the Trustees, the fund, and fund shareholders and to facilitate compliance with legal and regulatory requirements and oversight of the fund's activities and associated risks. The Board, acting through its committees, has charged FMR and its affiliates with (i) identifying events or circumstances the occurrence of which could have demonstrably adverse effects on the fund's business and/or reputation; (ii) implementing processes and controls to lessen the possibility that such events or circumstances occur or to mitigate the effects of such events or circumstances if they do occur; and (iii) creating and maintaining a system designed to evaluate continuously business and market conditions in order to facilitate the identification and implementation processes described in (i) and (ii) above. Because the day-to-day operations and activities of the fund are carried out by or through FMR, its affiliates and other service providers, the fund's exposure to risks is mitigated but not eliminated by the processes overseen by the Trustees. While each of the Board's committees has responsibility for overseeing different aspects of the fund's activities, oversight is exercised primarily through the Operations, Audit, and Compliance Committees. Appropriate personnel, including but not limited to the fund's Chief Compliance Officer (CCO), FMR's internal auditor, the independent accountants, the fund's Treasurer and portfolio management personnel, make periodic reports to the Board's committees, as appropriate. The responsibilities of each committee, including their oversight responsibilities, are described further under "Standing Committees of the Fund's Trustees."
Annual Report
The fund's Statement of Additional Information (SAI) includes more information about the Trustees. To request a free copy, call Fidelity at 1-800-FIDELITY.
Interested Trustees*:
Correspondence intended for each Trustee who is an interested person may be sent to Fidelity Investments, 82 Devonshire Street, Boston, Massachusetts 02109.
Name, Age; Principal Occupations and Other Relevant Experience+ |
James C. Curvey (75) |
| Year of Election or Appointment: 2007 Mr. Curvey is Trustee and Acting Chairman of the Board of Trustees of certain Trusts. Mr. Curvey also serves as Trustee (2007-present) of other investment companies advised by FMR. Mr. Curvey is a Director of Fidelity Investments Money Management, Inc. (2009-present), Director of Fidelity Research & Analysis Co. (2009-present) and Director of FMR and FMR Co., Inc. (2007-present). Mr. Curvey is also Vice Chairman (2007-present) and Director of FMR LLC. In addition, Mr. Curvey serves as an Overseer for the Boston Symphony Orchestra and a member of the Trustees of Villanova University. Previously, Mr. Curvey was the Vice Chairman (2006-2007) and Director (2000-2007) of FMR Corp. |
Ronald P. O'Hanley (54) |
| Year of Election or Appointment: 2011 Ronald P. O'Hanley is President, Asset Management and Corporate Services, for Fidelity Investments and a member of Fidelity's Executive Committee (2010-present). Previously, Mr. O'Hanley served as President and Chief Executive Officer of BNY Mellon Asset Management (2007-2010). Mr. O'Hanley also served as Vice Chairman of Bank New York Mellon Corp. and a member of that firm's Executive Committee. Prior to the 2007 merger of The Bank of New York and Mellon Financial Corporation, he was Vice Chairman of Mellon Financial Corporation and President and Chief Executive Officer of Mellon Asset Management. He joined Mellon in February 1997. Mr. O'Hanley currently serves as Chairman of the Boston Public Library Foundation Board of Directors and sits on the Board of Directors of Beth Israel Deaconess Medical Center, the Board of Trustees of the Marine Biological Laboratory and the Advisory Board of the Maxwell School of Citizenship and Public Administration at Syracuse University. Mr. O'Hanley also chairs the Council on Asset Management for the Financial Services Roundtable and is a member of the Board of Directors of Institutional Investor's U.S. Institute. |
* Trustees have been determined to be "Interested Trustees" by virtue of, among other things, their affiliation with the trust or various entities under common control with FMR.
+ The information above includes each Trustee's principal occupation during the last five years and other information relating to the experience, attributes, and skills relevant to each Trustee's qualifications to serve as a Trustee, which led to the conclusion that each Trustee should serve as a Trustee for the fund.
Annual Report
Independent Trustees:
Correspondence intended for each Independent Trustee (that is, the Trustees other than the Interested Trustees) may be sent to Fidelity Investments, P.O. Box 55235, Boston, Massachusetts 02205-5235.
Name, Age; Principal Occupations and Other Relevant Experience+ |
Dennis J. Dirks (62) |
| Year of Election or Appointment: 2005 Prior to his retirement in May 2003, Mr. Dirks was Chief Operating Officer and a member of the Board of The Depository Trust & Clearing Corporation (DTCC). He also served as President, Chief Operating Officer, and Board member of The Depository Trust Company (DTC) and President and Board member of the National Securities Clearing Corporation (NSCC). In addition, Mr. Dirks served as Chief Executive Officer and Board member of the Government Securities Clearing Corporation, Chief Executive Officer and Board member of the Mortgage-Backed Securities Clearing Corporation, as a Trustee and a member of the Finance Committee of Manhattan College (2005-2008), and as a Trustee and a member of the Finance Committee of AHRC of Nassau County (2006-2008). Mr. Dirks is a member of the Independent Directors Council (IDC) Governing Council (2010-Present) and Board of Directors for The Brookville Center for Children's Services, Inc. (2009-present). |
Alan J. Lacy (57) |
| Year of Election or Appointment: 2008 Mr. Lacy serves as Senior Adviser (2007-present) of Oak Hill Capital Partners, L.P. (private equity). Mr. Lacy also served as Chief Executive Officer (2000-2005) and Vice Chairman (2005-2006) of Sears Holdings Corporation and Sears, Roebuck and Co. (retail). In addition, Mr. Lacy serves as a member of the Board of Directors of The Western Union Company (global money transfer, 2006-present) and Bristol-Myers Squibb Company (global pharmaceuticals, 2007-present). Mr. Lacy is Chairman (2008-present) and a member (2006-present) of the Board of Trustees of The National Parks Conservation Association. |
Ned C. Lautenbach (66) |
| Year of Election or Appointment: 2000 Mr. Lautenbach is Chairman of the Independent Trustees of the Equity and High Income Funds (2006-present). Mr. Lautenbach currently serves as the Lead Director of the Eaton Corporation Board of Directors (diversified industrial, 1997-present). Mr. Lautenbach is also a member of the Board of Directors of the Philharmonic Center for the Arts in Naples, Florida (1999-present); a member of the Board of Trustees of Fairfield University (2005-present); and a member of the Council on Foreign Relations (1994-present). Previously, Mr. Lautenbach was a Partner/Advisory Partner at Clayton, Dubilier & Rice, Inc. (private equity investment, 1998-2010), as well as a Director of Sony Corporation (2006-2007). |
Joseph Mauriello (66) |
| Year of Election or Appointment: 2008 Prior to his retirement in January 2006, Mr. Mauriello served in numerous senior management positions including Deputy Chairman and Chief Operating Officer (2004-2005), and Vice Chairman of Financial Services (2002-2004) of KPMG LLP US (professional services, 1965-2005). Mr. Mauriello currently serves as a member of the Board of Directors of XL Group plc. (global insurance and re-insurance, 2006-present) and of Arcadia Resources Inc. (health care services and products, 2007-present). Previously, Mr. Mauriello served as a Director of the Hamilton Funds of the Bank of New York (2006-2007). |
Cornelia M. Small (66) |
| Year of Election or Appointment: 2005 Ms. Small is a member of the Board of Directors of the Teagle Foundation (2009-present). Ms. Small is also a member of the Investment Committee, and Chair (2008-present) and a member of the Board of Trustees of Smith College. In addition, Ms. Small serves on the Investment Committee of the Berkshire Taconic Community Foundation (2008-present). Previously, Ms. Small served as Chairperson of the Investment Committee (2002-2008) of Smith College. In addition, Ms. Small served as Chief Investment Officer, Director of Global Equity Investments, and a member of the Board of Directors of Scudder, Stevens & Clark and Scudder Kemper Investments. |
William S. Stavropoulos (71) |
| Year of Election or Appointment: 2002 Mr. Stavropoulos is Vice Chairman of the Independent Trustees of the Equity and High Income Funds (2006-present). Mr. Stavropoulos serves as President and Founder of the Michigan Baseball Foundation, the Great Lakes Loons (2007-present). Mr. Stavropoulos is Chairman Emeritus of the Board of Directors of The Dow Chemical Company, where he previously served in numerous senior management positions, including President, CEO (1995-2000; 2002-2004), Chairman of the Executive Committee (2000-2006), and as a member of the Board of Directors (1990-2006). Currently, Mr. Stavropoulos is Chairman of Univar (global distributor of commodity and specialty chemicals, 2010-present), a Director of Teradata Corporation (data warehousing and technology solutions, 2008-present), Chemical Financial Corporation, Maersk Inc. (industrial conglomerate), Tyco International, Inc. (multinational manufacturing and services, 2007-present), and a member of the Advisory Board for Metalmark Capital (private equity investment, 2005-present). Mr. Stavropoulos is a special advisor to Clayton, Dubilier & Rice, LLC (private equity investment). In addition, Mr. Stavropoulos is a member of the University of Notre Dame Advisory Council for the College of Science. |
David M. Thomas (61) |
| Year of Election or Appointment: 2008 Previously, Mr. Thomas served as Executive Chairman (2005-2006) and Chairman and Chief Executive Officer (2000-2005) of IMS Health, Inc. (pharmaceutical and healthcare information solutions). In addition, Mr. Thomas serves as a member of the Board of Directors of Fortune Brands, Inc. (consumer products), and Interpublic Group of Companies, Inc. (marketing communication, 2004-present). |
Michael E. Wiley (60) |
| Year of Election or Appointment: 2008 Mr. Wiley also serves as a Director of Asia Pacific Exploration Consolidated (international oil and gas exploration and production, 2008-present). Mr. Wiley serves as a Director of Tesoro Corporation (independent oil refiner and marketer, 2005-present), and a Director of Bill Barrett Corporation (exploration and production, 2005-present). In addition, Mr. Wiley also serves as a Director of Post Oak Bank (privately-held bank, 2004-present). Previously, Mr. Wiley served as a member of the Board of Trustees of the University of Tulsa (2000-2006; 2007-2010), as a Senior Energy Advisor of Katzenbach Partners, LLC (consulting, 2006-2007), as an Advisory Director of Riverstone Holdings (private investment), Chairman, President, and CEO of Baker Hughes, Inc. (oilfield services, 2000-2004), and as Director of Spinnaker Exploration Company (exploration and production, 2001-2005). |
+ The information above includes each Trustee's principal occupation during the last five years and other information relating to the experience, attributes, and skills relevant to each Trustee's qualifications to serve as a Trustee, which led to the conclusion that each Trustee should serve as a Trustee for the fund.
Advisory Board Members and Executive Officers:
Correspondence intended for each executive officer, Edward C. Johnson 3d, and Peter S. Lynch may be sent to Fidelity Investments, 82 Devonshire Street, Boston, Massachusetts 02109.
Name, Age; Principal Occupation |
Edward C. Johnson 3d (80) |
| Year of Election or Appointment: 2011 Member of the Advisory Board of Fidelity's Equity and High Income Funds. Formerly Trustee and Chairman of the Board of Trustees of certain Trusts, Mr. Johnson serves as Chief Executive Officer, Chairman, and a Director of FMR LLC; Chairman and a Director of FMR; and Chairman and a Director of FMR Co., Inc. In addition, Mr. Johnson serves as Chairman and Director of FIL Limited. Previously, Mr. Johnson served as President of FMR LLC (2006-2007). |
Peter S. Lynch (66) |
| Year of Election or Appointment: 2003 Member of the Advisory Board of Fidelity's Equity and High Income Funds. Mr. Lynch is Vice Chairman and a Director of FMR and FMR Co., Inc. In addition, Mr. Lynch serves as a Trustee of Boston College and as the Chairman of the Inner-City Scholarship Fund. Previously, Mr. Lynch served on the Special Olympics International Board of Directors (1997-2006). |
Kenneth B. Robins (41) |
| Year of Election or Appointment: 2008 President and Treasurer of Fidelity's Equity and High Income Funds. Mr. Robins also serves as President and Treasurer (2010-present) and Assistant Treasurer (2009-present) of other Fidelity funds and is an employee of Fidelity Investments (2004-present). Previously, Mr. Robins served as Deputy Treasurer of the Fidelity funds (2005-2008) and Treasurer and Chief Financial Officer of The North Carolina Capital Management Trust: Cash and Term Portfolios (2006-2008). |
Bruce T. Herring (45) |
| Year of Election or Appointment: 2006 Vice President of certain Equity Funds. Mr. Herring also serves as Chief Investment Officer and Director of Fidelity Management & Research (U.K.) Inc. (2010-present) and Group Chief Investments Officer of FMR. Previously, Mr. Herring served as Vice President (2005-2006) and Senior Vice President (2006-2007) of Fidelity Management & Research Company, Vice President of FMR Co., Inc. (2001-2007) and as a portfolio manager for Fidelity U.S. Equity Funds. |
Brian B. Hogan (46) |
| Year of Election or Appointment: 2009 Vice President of certain Equity Funds and Vice President of Sector Funds. Mr. Hogan also serves as President of FMR's Equity Division (2009-present). Previously, Mr. Hogan served as Senior Vice President, Equity Research of FMR (2006-2009) and as a portfolio manager. |
Scott C. Goebel (42) |
| Year of Election or Appointment: 2008 Secretary and Chief Legal Officer (CLO) of the Fidelity funds. Mr. Goebel also serves as Secretary and CLO of The North Carolina Capital Management Trust: Cash and Term Portfolio (2008-present); General Counsel, Secretary, and Senior Vice President of FMR (2008-present) and FMR Co., Inc. (2008-present); Deputy General Counsel of FMR LLC; Chief Legal Officer of Fidelity Management & Research (Hong Kong) Limited (2008-present) and Assistant Secretary of Fidelity Management & Research (Japan) Inc. (2008-present), Fidelity Investments Money Management, Inc. (2008-present), Fidelity Management & Research (U.K.) Inc. (2008-present), and Fidelity Research and Analysis Company (2008-present). Previously, Mr. Goebel served as Assistant Secretary of the Funds (2007-2008) and as Vice President and Secretary of Fidelity Distributors Corporation (FDC) (2005-2007). |
William C. Coffey (41) |
| Year of Election or Appointment: 2009 Assistant Secretary of Fidelity's Equity and High Income Funds. Mr. Coffey also serves as Senior Vice President and Deputy General Counsel of FMR LLC (2010-present), and is an employee of Fidelity Investments. Previously, Mr. Coffey served as Vice President and Associate General Counsel of FMR LLC (2005-2009). |
Holly C. Laurent (56) |
| Year of Election or Appointment: 2008 Anti-Money Laundering (AML) Officer of the Fidelity funds. Ms. Laurent also serves as AML Officer of The North Carolina Capital Management Trust: Cash and Term Portfolio (2008-present) and is an employee of Fidelity Investments. Previously, Ms. Laurent was Senior Vice President and Head of Legal for Fidelity Business Services India Pvt. Ltd. (2006-2008), and Senior Vice President, Deputy General Counsel and Group Head for FMR LLC (2005-2006). |
Christine Reynolds (52) |
| Year of Election or Appointment: 2008 Chief Financial Officer of the Fidelity funds. Ms. Reynolds became President of Fidelity Pricing and Cash Management Services (FPCMS) in August 2008. Ms. Reynolds served as Chief Operating Officer of FPCMS (2007-2008). Previously, Ms. Reynolds served as President, Treasurer, and Anti-Money Laundering officer of the Fidelity funds (2004-2007). |
Kenneth A. Rathgeber (63) |
| Year of Election or Appointment: 2004 Chief Compliance Officer of Fidelity's Equity and High Income Funds. Mr. Rathgeber is Chief Compliance Officer of Fidelity Management & Research (Hong Kong) Limited (2008-present), Fidelity Management & Research (Japan) Inc. (2008-present), FMR (2005-present), FMR Co., Inc. (2005-present), Fidelity Management & Research (U.K.) Inc. (2005-present), Fidelity Research & Analysis Company (2005-present), Fidelity Investments Money Management, Inc. (2005-present), Pyramis Global Advisors, LLC (2005-present), and Strategic Advisers, Inc. (2005-present). |
Jeffrey S. Christian (49) |
| Year of Election or Appointment: 2009 Deputy Treasurer of the Fidelity funds. Mr. Christian is an employee of Fidelity Investments. Previously, Mr. Christian served as Chief Financial Officer (2008-2009) of certain Fidelity funds and Senior Vice President of Fidelity Pricing and Cash Management Services (FPCMS) (2004-2009). |
Bryan A. Mehrmann (49) |
| Year of Election or Appointment: 2005 Deputy Treasurer of the Fidelity funds. Mr. Mehrmann is an employee of Fidelity Investments. |
Adrien E. Deberghes (43) |
| Year of Election or Appointment: 2008 Deputy Treasurer of Fidelity's Equity and High Income Funds. Mr. Deberghes also serves as Assistant Treasurer of other Fidelity funds (2010-present) and is an employee of Fidelity Investments (2008-present). Previously, Mr. Deberghes served as Senior Vice President of Mutual Fund Administration at State Street Corporation (2007-2008), Senior Director of Mutual Fund Administration at Investors Bank & Trust (2005-2007), and Director of Finance for Dunkin' Brands (2000-2005). |
Stephanie J. Dorsey (41) |
| Year of Election or Appointment: 2010 Assistant Treasurer of Fidelity's Equity and High Income Funds. Ms. Dorsey also serves as Deputy Treasurer of other Fidelity funds (2008-present) and is an employee of Fidelity Investments (2008-present). Previously, Ms. Dorsey served as Treasurer (2004-2008) of the JPMorgan Mutual Funds and Vice President (2004-2008) of JPMorgan Chase Bank. |
John R. Hebble (52) |
| Year of Election or Appointment: 2009 Assistant Treasurer of Fidelity's Equity and High Income Funds. Mr. Hebble also serves as Treasurer and Chief Financial Officer of The North Carolina Capital Management Trust: Cash and Term Portfolio (2008-present), President and Treasurer of other Fidelity funds (2008-present) and is an employee of Fidelity Investments. |
Gary W. Ryan (52) |
| Year of Election or Appointment: 2005 Assistant Treasurer of the Fidelity funds. Mr. Ryan is an employee of Fidelity Investments. Previously, Mr. Ryan served as Vice President of Fund Reporting in Fidelity Pricing and Cash Management Services (FPCMS) (1999-2005). |
Jonathan Davis (42) |
| Year of Election or Appointment: 2010 Assistant Treasurer of the Fidelity funds. Mr. Davis is an employee of Fidelity Investments. Previously, Mr. Davis served as Vice President and Associate General Counsel of FMR LLC (2003-2010). |
Annual Report
The fund designates 91%, for December, and 100% for March, June, and September of the dividends distributed during the fiscal year as qualifying for the dividends-received deduction for corporate shareholders.
The fund designates 92% for December, and 100% for March, June, and September of the dividends distributed during the fiscal year as amounts which may be taken into account as a dividend for the purposes of the maximum rate under section 1(h)(11) of the Internal Revenue Code.
The fund will notify shareholders in January 2011 of amounts for use in preparing 2010 income tax returns.
Annual Report
Board Approval of Investment Advisory Contracts and Management Fees
Fidelity Nasdaq Composite Index Tracking Stock
Each year, the Board of Trustees, including the Independent Trustees (together, the Board), votes on the renewal of the management contract and sub-advisory agreements (together, the Advisory Contracts) for the fund. The Board, assisted by the advice of fund counsel and Independent Trustees' counsel, requests and considers a broad range of information relevant to the renewal of the Advisory Contracts throughout the year.
The Board meets regularly and considers at each of its meetings factors that are relevant to its annual consideration of the renewal of the fund's Advisory Contracts, including the services and support provided to the fund and its shareholders. The Board has established various standing committees, each composed of Independent Trustees with varying backgrounds, to which the Board has assigned specific subject matter responsibilities in order to enhance effective decision-making by the Board. The Board, acting directly and through its Committees, requests and receives information concerning the annual consideration of the renewal of the fund's Advisory Contracts. The Board also meets as needed to consider matters specifically related to the Board's annual consideration of the renewal of Advisory Contracts. Members of the Board may also meet with trustees of other Fidelity funds through ad hoc joint committees to discuss certain matters relevant to the Fidelity funds.
At its July 2010 meeting, the Board of Trustees, including the Independent Trustees, unanimously determined to renew the fund's Advisory Contracts. In reaching its determination, the Board considered all factors it believed relevant, including (i) the nature, extent, and quality of the services to be provided to the fund and its shareholders (including the investment performance of the fund); (ii) the competitiveness of the fund's management fee and total expenses; (iii) the total costs of the services to be provided by and the profits to be realized by Fidelity from its relationship with the fund; (iv) the extent to which economies of scale would be realized as the fund grows; and (v) whether fee levels reflect these economies of scale, if any, for the benefit of fund shareholders.
In considering whether to renew the Advisory Contracts for the fund, the Board reached a determination, with the assistance of fund counsel and Independent Trustees' counsel and through the exercise of its business judgment, that the renewal of the Advisory Contracts is in the best interests of fund shareholders and that the compensation to be received by Fidelity under the management contract is fair and reasonable. The Board's decision to renew the Advisory Contracts was not based on any single factor noted above, but rather was based on a comprehensive consideration of all the information provided to the Board at its meetings throughout the year. The Board, in reaching its determination to renew the Advisory Contracts, is aware that shareholders in the fund have a broad range of investment choices available to them, including a wide choice among mutual funds offered by Fidelity's competitors, and that the fund's shareholders, with the opportunity to review and weigh the disclosure provided by the fund in its prospectus and other public disclosures, have chosen to invest in this fund, managed by Fidelity.
Annual Report
Nature, Extent, and Quality of Services Provided. The Board considered the staffing within the investment adviser, FMR, and the sub-advisers (together, the Investment Advisers), including the backgrounds of the fund's investment personnel and the fund's investment objective and discipline. The Independent Trustees also had discussions with senior management of Fidelity's investment operations and investment groups. The Board considered the structure of the portfolio manager compensation program and whether this structure provides appropriate incentives to act in the best interest of the fund.
Resources Dedicated to Investment Management and Support Services. The Board and the equity research subcommittee of the Board's Fund Oversight Committee reviewed the size, education, and experience of the Investment Advisers' investment staff, their use of technology, and the Investment Advisers' approach to recruiting, training, and retaining portfolio managers and other research, advisory, and management personnel. The Board noted FMR's continued focus on strengthening the organization and discipline of equity portfolio management and research.
Shareholder and Administrative Services. The Board considered (i) the nature, extent, quality, and cost of advisory, administrative, and shareholder services performed by the Investment Advisers and their affiliates under the Advisory Contracts and under separate agreements covering pricing and bookkeeping and securities lending services for the fund; (ii) the nature and extent of the investment adviser's supervision of third party service providers, principally transfer agents, custodians, and subcustodians; and (iii) the resources devoted to, and the record of compliance with, the fund's compliance policies and procedures. The Board also reviewed the allocation of fund brokerage, including allocations to brokers affiliated with the Investment Advisers.
The Board noted that the growth of fund assets over time across the complex allows Fidelity to reinvest in the development of services designed to enhance the value or convenience of the Fidelity funds as investment vehicles. These services include 24-hour access to account information and market information through phone representatives and over the Internet, and investor education materials and asset allocation tools.
Investment in a Large Fund Family. The Board considered the benefits to shareholders of investing in a Fidelity fund, including the benefits of investing in a fund that is part of a large family of funds offering a variety of investment disciplines and providing a large variety of mutual fund investor services. The Board noted that Fidelity had taken, or had made recommendations that resulted in the Fidelity funds taking, a number of actions over the previous year that benefited particular funds, including (i) dedicating additional resources to investment research and restructuring and broadening the focus of the investment research teams; (ii) bolstering the senior management team that oversees asset management; (iii) launching Class F of certain funds as a lower-fee class available to Freedom K and Freedom Index Funds; (iv) lowering the initial investment minimums and ongoing balance requirements for Real Estate High Income Fund; (v) eliminating subsequent purchase minimums for all funds and adding a waiver of the investment minimum requirement for new accounts opened with the proceeds of a systematic withdrawal plan; (vi) eliminating the withdrawal minimum and maximum limits for systematic withdrawals from Advisor funds; (vii) expanding sales load waivers on Class A shares for Destiny Planholders and expanding Institutional Class eligibility for Class O Destiny Planholders; and (viii) changing certain Class A and Class T sales charge structures to further align them with industry practices.
Annual Report
Board Approval of Investment Advisory Contracts and
Management Fees - continued
Investment Performance. The Board considered whether the fund has operated in accordance with its investment objective, as well as its record of compliance with its investment restrictions. It also reviewed the fund's absolute investment performance, as well as the fund's relative investment performance measured over multiple periods against a broad-based securities market index. The Board noted that FMR does not believe that a meaningful peer group exists against which to compare the fund's performance. The following charts considered by the Board show, over the one-, three-, and five-year periods ended December 31, 2009, the fund's cumulative total returns and the cumulative total returns of a broad-based securities market index ("benchmark").
Fidelity Nasdaq Composite Index Tracking Stock
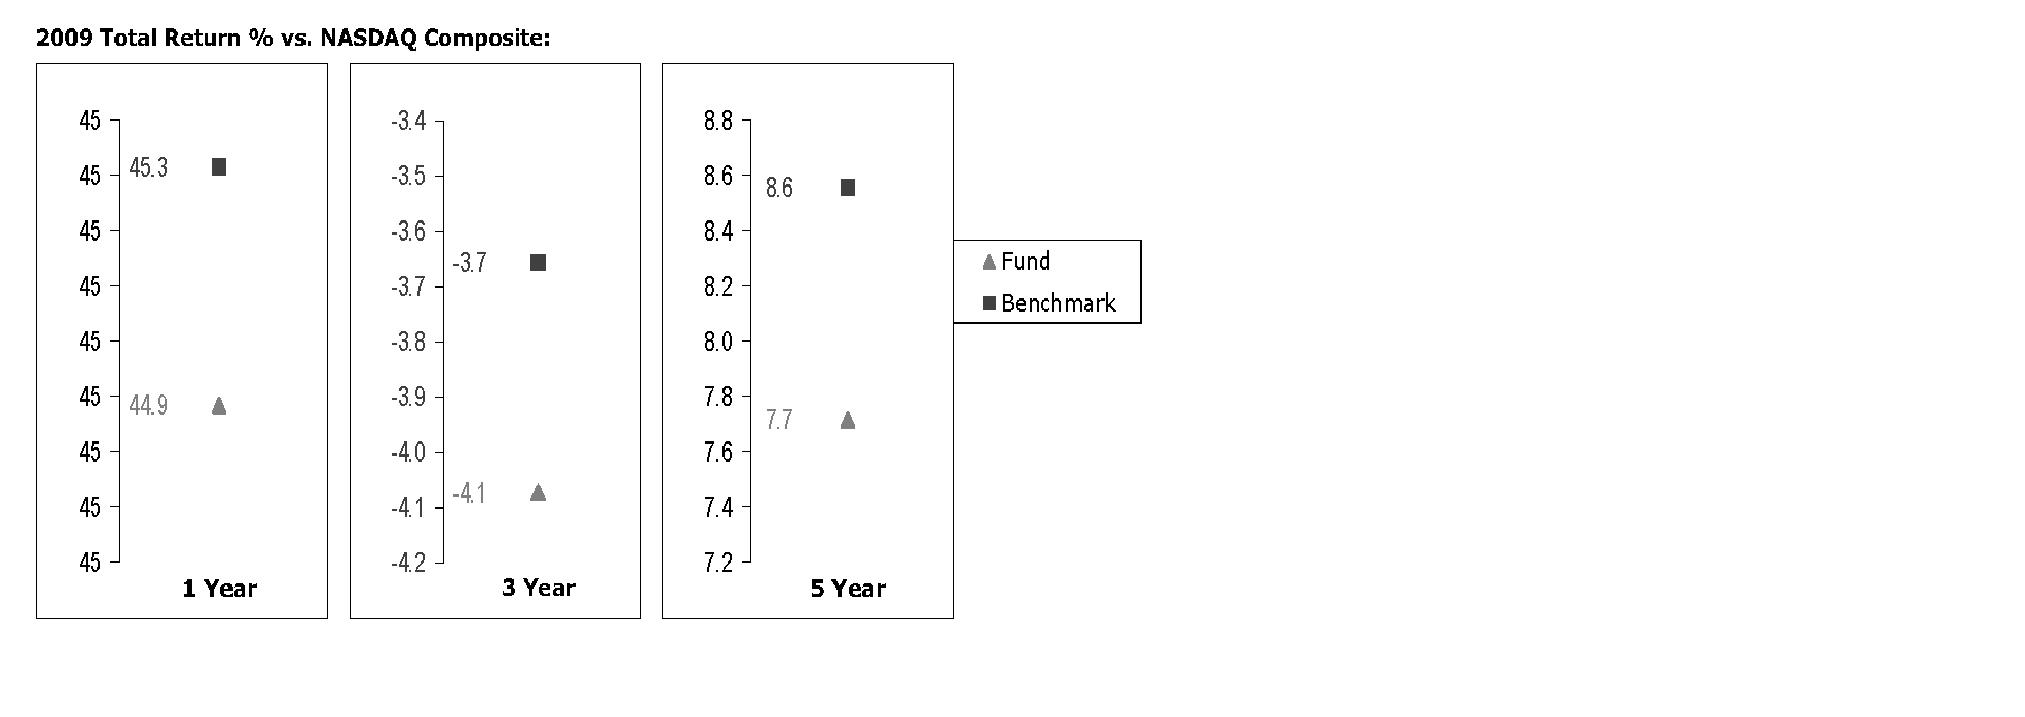
The Board noted that the investment performance of the fund was lower than its benchmark for all the periods shown, but considered that the performance of the fund and benchmark may vary due to valuation differences or due to fees and transaction costs, which apply to the fund but not to the benchmark. The Board also reviewed the fund's performance since inception as well as performance in the current year.
Based on its review, and giving particular weight to the nature and quality of the resources dedicated by the Investment Advisers to maintain and improve relative performance and factoring in the unprecedented market events in recent years, the Board concluded that the nature, extent, and quality of investment management and support services and of shareholder and administrative services provided to the fund will benefit the fund's shareholders, particularly in light of the Board's view that the fund's shareholders benefit from investing in a fund that is part of a large family of funds offering a variety of investment disciplines and services.
Annual Report
Competitiveness of Management Fee and Total Fund Expenses. The Board considered the fund's management fee and total expenses compared to "mapped groups" of competitive funds and classes. Fidelity creates "mapped groups" by combining similar Lipper investment objective categories that have comparable management fee characteristics. Combining Lipper investment objective categories aids the Board's management fee and total expense comparisons by broadening the competitive group used for comparison and by reducing the number of universes to which various Fidelity funds are compared.
Management Fee. The Board considered two proprietary management fee comparisons for the 12-month periods shown in the chart below. The group of Lipper funds used by the Board for management fee comparisons is referred to below as the "Total Mapped Group." The Total Mapped Group comparison focuses on a fund's standing relative to the total universe of comparable funds available to investors, in terms of gross management fees before expense reimbursements or caps. "TMG %" represents the percentage of funds in the Total Mapped Group that had management fees that were lower than the fund's. For example, a TMG % of 26% means that 74% of the funds in the Total Mapped Group had higher management fees than the fund. The "Asset-Size Peer Group" (ASPG) comparison focuses on a fund's standing relative to non-Fidelity funds similar in size to the fund within the Total Mapped Group. The ASPG represents at least 15% of the funds in the Total Mapped Group with comparable asset size and management fee characteristics, subject to a minimum of 50 funds (or all funds in the Total Mapped Group if fewer than 50). Additional information, such as the ASPG quartile in which the fund's management fee ranked, is also included in the chart and considered by the Board.
Annual Report
Board Approval of Investment Advisory Contracts and
Management Fees - continued
Fidelity Nasdaq Composite Index Tracking Stock
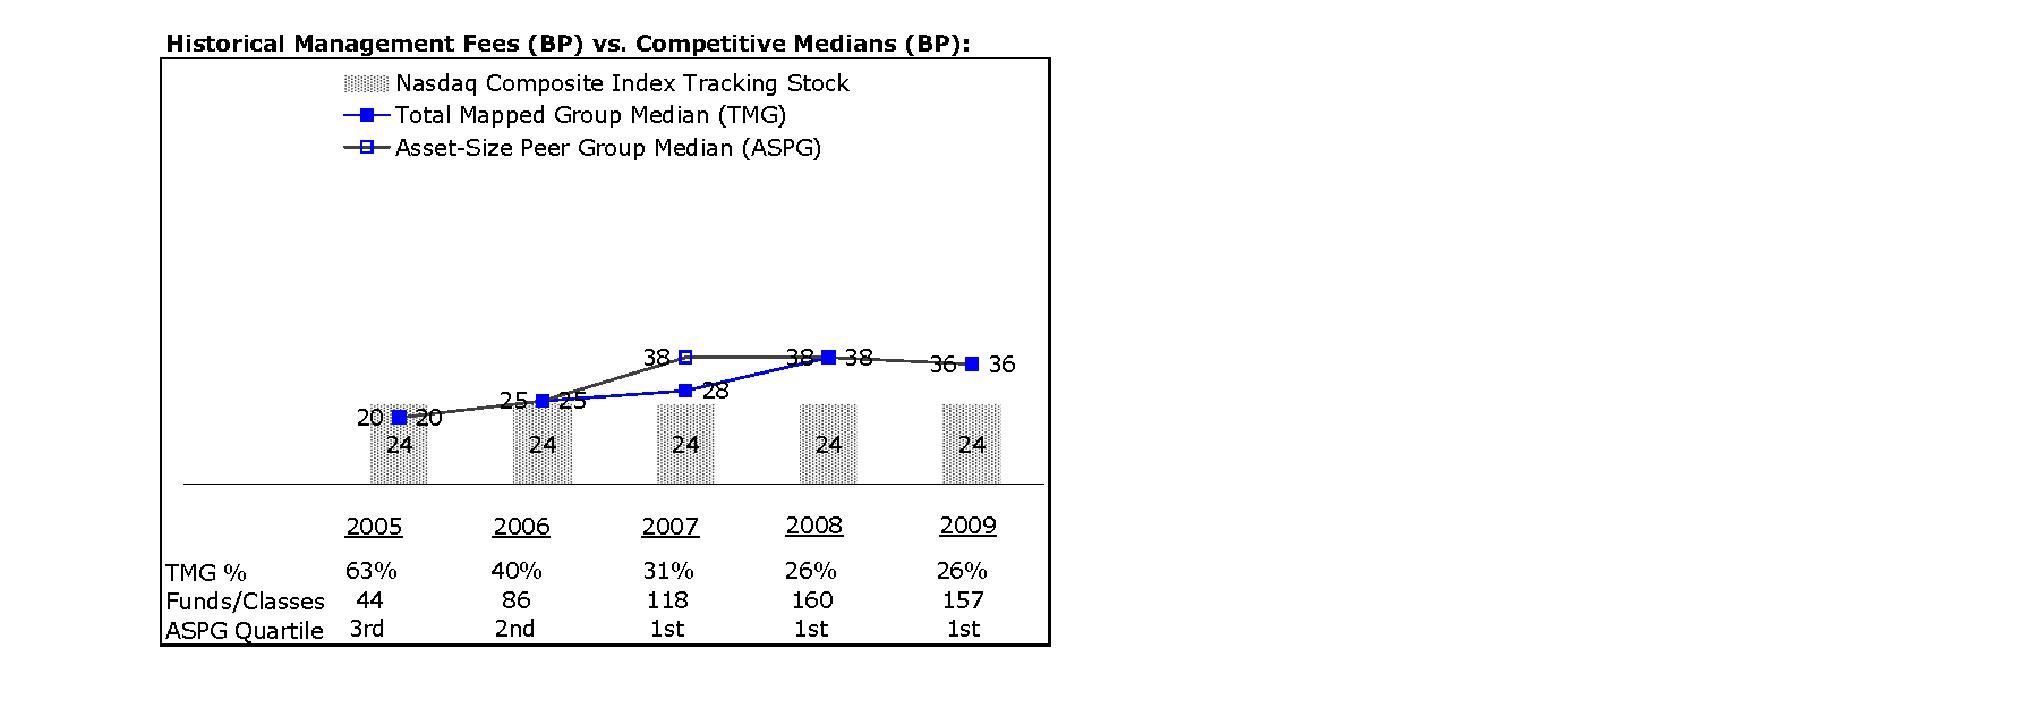
The Board noted that the fund's management fee ranked below the median of its Total Mapped Group and below the median of its ASPG for 2009.
Based on its review, the Board concluded that the fund's management fee is fair and reasonable in light of the services that the fund receives and the other factors considered.
Total Expenses. In its review of the fund's total expenses, the Board considered the fund's management fee as well as other fund expenses, such as transfer agent fees, pricing and bookkeeping fees, fund-paid 12b-1 fees, and custodial, legal, and audit fees. The Board also noted the effects of any waivers and reimbursements on fees and expenses. As part of its review, the Board also considered current and historical total expenses of the fund compared to competitive fund median expenses. The fund is compared to those funds and classes in the Total Mapped Group (used by the Board for management fee comparisons) that have a similar sales load structure.
The Board noted that the fund's total expenses ranked below its competitive median for 2009. The Board also considered that, following discussions with the Board, FMR contractually agreed to waive a portion of its management fee until January 31, 2011, to the extent necessary to maintain the fund's total operating expenses (excluding interest, taxes, certain securities lending costs, brokerage commissions, and extraordinary expenses) at 30 basis points.
Fees Charged to Other Fidelity Clients. The Board also considered Fidelity fee structures and other information with respect to clients of FMR and its affiliates, such as other mutual funds advised or subadvised by FMR or its affiliates, pension plan clients, and other institutional clients. In March 2010, the Board created an ad hoc joint committee with the board of other Fidelity funds (the Committee) to review and compare Fidelity's institutional investment advisory business with its business of providing services to the Fidelity funds, including the differences in services provided, fees charged, and costs incurred, as well as competition in their respective marketplaces.
Annual Report
Based on its review of total expenses and fees charged to other Fidelity clients, the Board concluded that the fund's total expenses were reasonable in light of the services that the fund and its shareholders receive and the other factors considered, including the findings of the Committee.
Costs of the Services and Profitability. The Board considered the revenues earned and the expenses incurred by Fidelity in conducting the business of developing, marketing, distributing, managing, administering and servicing the fund and its shareholders. The Board also considered the level of Fidelity's profits in respect of all the Fidelity funds.
On an annual basis, FMR presents to the Board Fidelity's profitability for the fund. Fidelity calculates the profitability for each fund, as well as aggregate profitability for groups of Fidelity funds and all Fidelity funds, using a series of detailed revenue and cost allocation methodologies which originate with the audited books and records of Fidelity. The Audit Committee of the Board reviews any significant changes from the prior year's methodologies.
PricewaterhouseCoopers LLP (PwC), independent registered public accounting firm and auditor to Fidelity and certain Fidelity funds, has been engaged annually by the Board as part of the Board's assessment of Fidelity's profitability analysis. PwC's engagement includes the review and assessment of Fidelity's methodologies used in determining the revenues and expenses attributable to Fidelity's mutual fund business, and completion of agreed-upon procedures surrounding the mathematical accuracy of fund profitability and its conformity to allocation methodologies. After considering PwC's reports issued under the engagement and information provided by Fidelity, the Board believes that while other allocation methods may also be reasonable, Fidelity's profitability methodologies are reasonable in all material respects.
The Board has also reviewed Fidelity's non-fund businesses and fall-out benefits related to the mutual fund business as well as cases where Fidelity's affiliates may benefit from or be related to the fund's business.
The Board considered the costs of the services provided by and the profits realized by Fidelity in connection with the operation of the fund and were satisfied that the profitability was not excessive in the circumstances.
Economies of Scale. The Board considered whether there have been economies of scale in respect of the management of the Fidelity funds, whether the Fidelity funds (including the fund) have appropriately benefited from any such economies of scale, and whether there is potential for realization of any further economies of scale. The Board considered the extent to which the fund will benefit from economies of scale through increased services to the fund, through waivers or reimbursements, or through fee or expense reductions.
Annual Report
Board Approval of Investment Advisory Contracts and
Management Fees - continued
In February 2009, the Board and the board of other Fidelity funds created an ad hoc committee (the Economies of Scale Committee) to analyze whether FMR attains economies of scale in respect of the management and servicing of the Fidelity funds, whether the Fidelity funds have appropriately benefited from such economies of scale, and whether there is potential for realization of any further economies of scale.
The Board concluded, considering the findings of the Economies of Scale Committee, that any potential economies of scale are being appropriately shared between fund shareholders and Fidelity.
Additional Information Requested by the Board. In order to develop fully the factual basis for consideration of the Fidelity funds' Advisory Contracts, the Board requested and received additional information on certain topics, including (i) fund performance trends, actions to be taken by FMR to improve certain funds' overall performance, and Fidelity's long-term strategies for certain funds; (ii) portfolio manager changes that have occurred during the past year and length of portfolio manager tenure for different categories of funds over time; (iii) Fidelity's compensation structure for portfolio managers, research analysts, and other key personnel, the rationale for the compensation structure, and how the compensation structure provides appropriate performance incentives; (iv) the amount of the investment that each portfolio manager has made in the Fidelity fund(s) that he or she manages; (v) management and other fees paid by FMR to affiliated sub-advisers on behalf of the Fidelity funds; (vi) Fidelity's fee structures and rationale for recommending different fees among different categories of funds; (vii) Fidelity's rationale for recommending which funds should have a performance adjustment component as part of their management fees; (viii) the rationale for any differences between fund fee structures and fee structures in place for other Fidelity clients; and (ix) explanations regarding the relative total expenses borne by certain funds and classes, total expense competitive trends, and actions that might be taken by FMR to reduce total expenses for certain funds and classes.
Based on its evaluation of all of the conclusions noted above, and after considering all factors it believed relevant, the Board ultimately concluded that the advisory fee structures are fair and reasonable, and that the fund's Advisory Contracts should be renewed.
Annual Report
Managing Your Investments
Fidelity offers several ways to conveniently manage your personal investments via your telephone or PC. You can access your account information, conduct trades and research your investments 24 hours a day.
By Phone
Fidelity Automated Service Telephone provides a single toll-free number to access account balances, positions, quotes and trading. It's easy to navigate the service, and on your first call, the system will help you create a personal identification number (PIN) for security.
(phone_graphic)
Fidelity Automated
Service Telephone (FAST®)
1-800-544-5555
Press
For mutual fund and brokerage trading.
For quotes.*
For account balances and holdings.
To review orders and mutual
fund activity.
To change your PIN.
To speak to a Fidelity representative.
By PC
Fidelity's web site on the Internet provides a wide range of information, including daily financial news, fund performance, interactive planning tools and news about Fidelity products and services.
(computer_graphic)
Fidelity's Web Site
www.fidelity.com
* When you call the quotes line, please remember that a fund's yield and return will vary and, except for money market funds, share price will also vary. This means that you may have a gain or loss when you sell your shares. There is no assurance that money market funds will be able to maintain a stable $1 share price; an investment in a money market fund is not insured or guaranteed by the U.S. government. Total returns are historical and include changes in share price, reinvestment of dividends and capital gains distributions, and the effects of any sales charges.
Annual Report
Investment Adviser
Fidelity Management & Research Company
Boston, MA
Investment Sub-Advisers
FMR Co., Inc.
Geode Capital Management, LLC
General Distributor
Fidelity Distributors Corporation
Boston, MA
Transfer and Service Agents
JPMorgan Chase Bank
New York, NY
Fidelity Service Company, Inc.
Boston, MA
Custodian
JPMorgan Chase Bank
New York, NY
The Fidelity Telephone Connection
1-800-FIDELITY
ETF-UANN-0111
1.795568.107
Fidelity® Series
100 Index
Fund
Annual Report
November 30, 2010
(2_fidelity_logos) (Registered_Trademark)
Contents
Performance | <Click Here> | How the fund has done over time. |
Management's Discussion of Fund Performance | <Click Here> | The Portfolio Manager's review of fund performance and strategy. |
Shareholder Expense Example | <Click Here> | An example of shareholder expenses. |
Investment Changes | <Click Here> | A summary of major shifts in the fund's investments over the past six months. |
Investments | <Click Here> | A complete list of the fund's investments with their market values. |
Financial Statements | <Click Here> | Statements of assets and liabilities, operations, and changes in net assets, as well as financial highlights. |
Notes | <Click Here> | Notes to the financial statements. |
Report of Independent Registered Public Accounting Firm | <Click Here> | |
Trustees and Officers | <Click Here> | |
Distributions | <Click Here> | |
Board Approval of Investment Advisory Contracts and Management Fees | <Click Here> | |
To view a fund's proxy voting guidelines and proxy voting record for the 12-month period ended June 30, visit http://www.fidelity.com/proxyvotingresults or visit the Securities and Exchange Commission's (SEC) web site at http://www.sec.gov. You may also call 1-800-544-8544 to request a free copy of the proxy voting guidelines.
Geode is a registered service mark of Geode Capital Management, LLC.
Standard & Poor's, S&P and S&P 500 are registered service marks of The McGraw-Hill Companies, Inc. and have been licensed for use by Fidelity Distributors Corporation.
Other third party marks appearing herein are the property of their respective owners.
All other marks appearing herein are registered or unregistered trademarks or service marks of FMR LLC or an affiliated company.
Annual Report
This report and the financial statements contained herein are submitted for the general information of the shareholders of the fund. This report is not authorized for distribution to prospective investors in the fund unless preceded or accompanied by an effective prospectus.
A fund files its complete schedule of portfolio holdings with the SEC for the first and third quarters of each fiscal year on Form N-Q. Forms N-Q are available on the SEC's web site at http://www.sec.gov. A fund's Forms N-Q may be reviewed and copied at the SEC's Public Reference Room in Washington, DC. Information regarding the operation of the SEC's Public Reference Room may be obtained by calling 1-800-SEC-0330. For a complete list of a fund's portfolio holdings, view the most recent holdings listing, semiannual report, or annual report on Fidelity's web site at http://www.fidelity.com, http://www.advisor.fidelity.com, or http://www.401k.com, as applicable.
NOT FDIC INSURED • MAY LOSE VALUE • NO BANK GUARANTEE
Neither the fund nor Fidelity Distributors Corporation is a bank.
Annual Report
Average annual total return reflects the change in the value of an investment, assuming reinvestment of the fund's distributions from dividend income and capital gains (the profits earned upon the sale of securities that have grown in value, if any) and assuming a constant rate of performance each year. The $10,000 table and the fund's returns do not reflect the deduction of taxes that a shareholder would pay on fund distributions or the redemption of fund shares. During periods of reimbursement by Fidelity, a fund's total return will be greater than it would be had the reimbursement not occurred. How a fund did yesterday is no guarantee of how it will do tomorrow.
Average Annual Total Returns
Periods ended November 30, 2010 | Past 1
year | Life of
fund A |
Fidelity® Series 100 Index Fund | 5.83% | -3.20% |
A From March 29, 2007.
$10,000 Over Life of Fund
Let's say hypothetically that $10,000 was invested in Fidelity® Series 100 Index Fund on March 29, 2007, when the fund started. The chart shows how the value of your investment would have changed, and also shows how the S&P 100® Index performed over the same period.
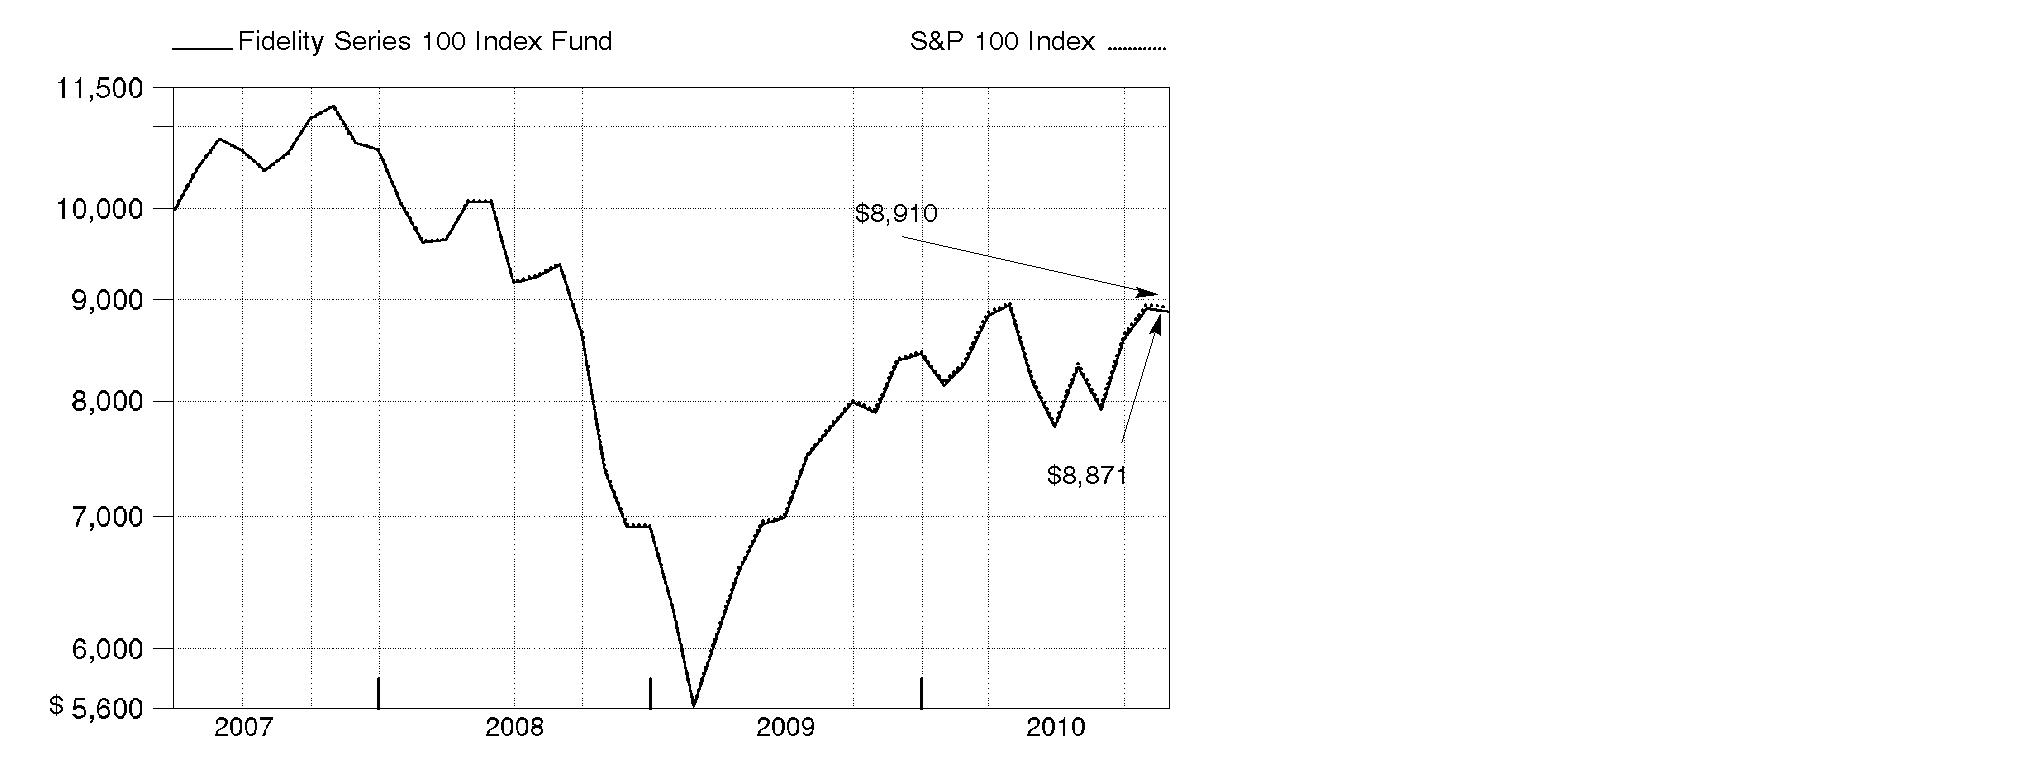
Annual Report
Market Recap: Despite bouts of volatility and concern over European debt woes, major U.S. stock markets recorded solid gains for the year ending November 30, 2010, lifted by economic optimism, encouraging earnings reports and a wave of corporate mergers. Stocks extended their 2009 upswing in the first five months of the period on signs the Great Recession was over. However, high unemployment in the U.S. and sovereign debt problems in Europe sent equities falling during the spring. Markets vacillated for much of the summer before regaining momentum in the fall, with the large-cap S&P 500® Index posting its best September/October performance since 1998. By November, however, Ireland's debt took center stage, along with slower growth in China and additional quantitative easing in the U.S., unnerving investors and cooling down markets. For the full 12 months, the S&P 500® rose 9.94%, while the blue-chip-laden Dow Jones Industrial AverageSM added 9.33%. Both were bested by the technology-heavy Nasdaq Composite® Index, which advanced 17.58%. Overall, it was a broad-based rally, with economically sensitive sectors among the biggest gainers. Stocks of mid- and small-sized companies fared better than their larger-cap counterparts, advancing 24.04% and 26.98%, respectively, as measured by the Russell Midcap® and Russell 2000® indexes.
Comments from Jeffrey Adams, who oversees Fidelity® Series 100 Index Fund's investment management team as Head of Indexing for Geode Capital Management, LLC: For the 12 months ending November 30, 2010, Fidelity Series 100 Index Fund returned 5.83%, compared with 6.02% for the S&P 100® Index. Personal computer and consumer electronics maker Apple was the top contributor by a very wide margin. The company benefited from continued strong revenue and earnings. Other helpful technology stocks included IBM and database-software maker Oracle. Solid financial results boosted shares of automaker Ford Motor, while oil-field services company Schlumberger, tobacco maker Philip Morris International, restaurant chain McDonald's and beverage company Coca-Cola also contributed. In contrast, the biggest detractor was Bank of America, whose stock price declined steadily from mid-April through the end of November. Shares of JPMorgan Chase also declined. Software giant Microsoft struggled in the spring, while two other large technology firms - network communications product maker Cisco Systems and computer and peripherals company Hewlett-Packard - also lagged. Other notable detractors included oil producer Exxon Mobil - the largest stock in the index - and agricultural biotechnology company Monsanto.
The views expressed above reflect those of the portfolio manager(s) only through the end of the period as stated on the cover of this report and do not necessarily represent the views of Fidelity or any other person in the Fidelity organization. Any such views are subject to change at any time based upon market or other conditions and Fidelity disclaims any responsibility to update such views. These views may not be relied on as investment advice and, because investment decisions for a Fidelity fund are based on numerous factors, may not be relied on as an indication of trading intent on behalf of any Fidelity fund.
Annual Report
Shareholder Expense Example
As a shareholder of the Fund, you incur two types of costs: (1) transaction costs, and (2) ongoing costs, including management fees and other Fund expenses. This Example is intended to help you understand your ongoing costs (in dollars) of investing in the Fund and to compare these costs with the ongoing costs of investing in other mutual funds.
The Example is based on an investment of $1,000 invested at the beginning of the period and held for the entire period (June 1, 2010 to November 30, 2010).
Actual Expenses
The first line of the accompanying table provides information about actual account values and actual expenses. You may use the information in this line, together with the amount you invested, to estimate the expenses that you paid over the period. Simply divide your account value by $1,000.00 (for example, an $8,600 account value divided by $1,000.00 = 8.6), then multiply the result by the number in the first line under the heading entitled "Expenses Paid During Period" to estimate the expenses you paid on your account during this period. An annual index fund fee of $10 that is charged once a year may apply for certain accounts with a value of less than $10,000. This fee is not included in the table below. If it was, the estimate of expenses you paid during the period would be higher, and your ending account value lower, by this amount. In addition, the Fund, as a shareholder in the underlying Fidelity Central Funds, will indirectly bear its pro-rata share of the fees and expenses incurred by the underlying Fidelity Central Funds. These fees and expenses are not included in the Fund's annualized expense ratio used to calculate the expense estimate in the table below.
Hypothetical Example for Comparison Purposes
The second line of the accompanying table provides information about hypothetical account values and hypothetical expenses based on the Fund's actual expense ratio and an assumed rate of return of 5% per year before expenses, which is not the Fund's actual return. The hypothetical account values and expenses may not be used to estimate the actual ending account balance or expenses you paid for the period. You may use this information to compare the ongoing costs of investing in the Fund and other funds. To do so, compare this 5% hypothetical example with the 5% hypothetical examples that appear in the shareholder reports of the other funds. An annual index fund fee of $10 that is charged once a year may apply for certain accounts with a value of less than $10,000. This fee is not included in the table below. If it was, the estimate of expenses you paid during the period would be higher, and your ending account value lower, by this amount. In addition, the Fund, as a shareholder in the underlying Fidelity Central Funds, will indirectly bear its pro-rata share of the fees and expenses incurred by the underlying Fidelity Central Funds. These fees and expenses are not included in the Fund's annualized expense ratio used to calculate the expense estimate in the table below.
Annual Report
Please note that the expenses shown in the table are meant to highlight your ongoing costs only and do not reflect any transaction costs. Therefore, the second line of the table is useful in comparing ongoing costs only, and will not help you determine the relative total costs of owning different funds.
| Annualized Expense Ratio | Beginning
Account Value
June 1, 2010 | Ending
Account Value
November 30, 2010 | Expenses Paid
During Period*
June 1, 2010 to
November 30, 2010 |
Actual | .20% | $ 1,000.00 | $ 1,086.00 | $ 1.05 |
Hypothetical (5% return per year before expenses) | | $ 1,000.00 | $ 1,024.07 | $ 1.01 |
* Expenses are equal to the Fund's annualized expense ratio, multiplied by the average account value over the period, multiplied by 183/365 (to reflect the one-half year period).
Annual Report
Investment Changes (Unaudited)
Top Ten Stocks as of November 30, 2010 |
| % of fund's
net assets | % of fund's net assets
6 months ago |
Exxon Mobil Corp. | 5.3 | 4.6 |
Apple, Inc. | 4.2 | 3.8 |
Microsoft Corp. | 2.8 | 3.2 |
International Business Machines Corp. | 2.7 | 2.6 |
Procter & Gamble Co. | 2.6 | 2.9 |
Johnson & Johnson | 2.5 | 2.6 |
General Electric Co. | 2.5 | 2.8 |
AT&T, Inc. | 2.4 | 2.3 |
Chevron Corp. | 2.4 | 2.4 |
JPMorgan Chase & Co. | 2.2 | 2.5 |
| 29.6 | |
Market Sectors as of November 30, 2010 |
| % of fund's
net assets | % of fund's net assets
6 months ago |
Information Technology | 21.4 | 21.6 |
Financials | 14.5 | 15.9 |
Consumer Staples | 13.8 | 14.0 |
Energy | 13.5 | 11.9 |
Health Care | 10.5 | 11.1 |
Industrials | 9.2 | 9.6 |
Consumer Discretionary | 8.1 | 8.0 |
Telecommunication Services | 4.0 | 3.8 |
Materials | 2.6 | 2.3 |
Utilities | 1.3 | 1.3 |
Annual Report
Investments November 30, 2010
Showing Percentage of Net Assets
Common Stocks - 98.9% |
| Shares | | Value |
CONSUMER DISCRETIONARY - 8.1% |
Automobiles - 0.8% |
Ford Motor Co. (a)(d) | 2,964,415 | | $ 47,252,775 |
Hotels, Restaurants & Leisure - 1.3% |
McDonald's Corp. | 917,373 | | 71,830,306 |
Internet & Catalog Retail - 0.9% |
Amazon.com, Inc. (a) | 304,931 | | 53,484,897 |
Media - 2.8% |
Comcast Corp. Class A | 2,419,038 | | 48,380,760 |
News Corp. Class A | 1,965,550 | | 26,810,102 |
The Walt Disney Co. | 1,648,514 | | 60,187,246 |
Time Warner, Inc. | 969,243 | | 28,582,976 |
| | 163,961,084 |
Multiline Retail - 0.6% |
Target Corp. | 621,831 | | 35,407,057 |
Specialty Retail - 1.2% |
Home Depot, Inc. | 1,435,355 | | 43,362,075 |
Lowe's Companies, Inc. | 1,209,511 | | 27,455,900 |
| | 70,817,975 |
Textiles, Apparel & Luxury Goods - 0.5% |
NIKE, Inc. Class B | 333,058 | | 28,686,286 |
TOTAL CONSUMER DISCRETIONARY | | 471,440,380 |
CONSUMER STAPLES - 13.8% |
Beverages - 3.7% |
PepsiCo, Inc. | 1,371,256 | | 88,624,275 |
The Coca-Cola Co. | 1,990,569 | | 125,744,244 |
| | 214,368,519 |
Food & Staples Retailing - 3.2% |
Costco Wholesale Corp. | 378,497 | | 25,590,182 |
CVS Caremark Corp. | 1,170,675 | | 36,290,925 |
Wal-Mart Stores, Inc. | 1,723,925 | | 93,247,103 |
Walgreen Co. | 838,801 | | 29,232,215 |
| | 184,360,425 |
Food Products - 1.3% |
Campbell Soup Co. | 166,810 | | 5,654,859 |
H.J. Heinz Co. | 274,379 | | 13,244,274 |
Kraft Foods, Inc. Class A | 1,503,237 | | 45,472,919 |
Sara Lee Corp. | 570,784 | | 8,561,760 |
| | 72,933,812 |
Common Stocks - continued |
| Shares | | Value |
CONSUMER STAPLES - continued |
Household Products - 3.1% |
Colgate-Palmolive Co. | 418,893 | | $ 32,066,259 |
Procter & Gamble Co. | 2,446,536 | | 149,409,954 |
| | 181,476,213 |
Personal Products - 0.2% |
Avon Products, Inc. | 369,720 | | 10,559,203 |
Tobacco - 2.3% |
Altria Group, Inc. | 1,796,209 | | 43,109,016 |
Philip Morris International, Inc. | 1,579,786 | | 89,874,026 |
| | 132,983,042 |
TOTAL CONSUMER STAPLES | | 796,681,214 |
ENERGY - 13.5% |
Energy Equipment & Services - 2.8% |
Baker Hughes, Inc. | 371,563 | | 19,380,726 |
Halliburton Co. | 785,084 | | 29,707,579 |
National Oilwell Varco, Inc. | 361,214 | | 22,138,806 |
Schlumberger Ltd. | 1,177,687 | | 91,082,313 |
| | 162,309,424 |
Oil, Gas & Consumable Fuels - 10.7% |
Chevron Corp. | 1,732,970 | | 140,318,581 |
ConocoPhillips | 1,278,538 | | 76,929,631 |
Devon Energy Corp. | 374,935 | | 26,459,163 |
Exxon Mobil Corp. | 4,388,724 | | 305,279,637 |
Occidental Petroleum Corp. | 700,088 | | 61,726,759 |
Williams Companies, Inc. | 503,939 | | 11,494,849 |
| | 622,208,620 |
TOTAL ENERGY | | 784,518,044 |
FINANCIALS - 14.5% |
Capital Markets - 2.2% |
Bank of New York Mellon Corp. | 1,046,406 | | 28,242,498 |
Goldman Sachs Group, Inc. | 444,419 | | 69,391,583 |
Morgan Stanley | 1,304,057 | | 31,897,234 |
| | 129,531,315 |
Commercial Banks - 2.9% |
Regions Financial Corp. | 1,082,521 | | 5,823,963 |
Common Stocks - continued |
| Shares | | Value |
FINANCIALS - continued |
Commercial Banks - continued |
U.S. Bancorp, Delaware | 1,652,437 | | $ 39,294,952 |
Wells Fargo & Co. | 4,510,789 | | 122,738,569 |
| | 167,857,484 |
Consumer Finance - 0.9% |
American Express Co. | 902,252 | | 38,995,331 |
Capital One Financial Corp. | 393,702 | | 14,657,525 |
| | 53,652,856 |
Diversified Financial Services - 5.6% |
Bank of America Corp. | 8,648,363 | | 94,699,575 |
Citigroup, Inc. (a) | 21,976,100 | | 92,299,620 |
JPMorgan Chase & Co. | 3,417,653 | | 127,751,869 |
NYSE Euronext | 224,595 | | 6,135,935 |
| | 320,886,999 |
Insurance - 2.8% |
Allstate Corp. | 463,772 | | 13,500,403 |
Berkshire Hathaway, Inc. Class B (a) | 1,491,017 | | 118,804,235 |
MetLife, Inc. | 780,906 | | 29,791,564 |
| | 162,096,202 |
Real Estate Investment Trusts - 0.1% |
Weyerhaeuser Co. | 461,655 | | 7,705,022 |
TOTAL FINANCIALS | | 841,729,878 |
HEALTH CARE - 10.5% |
Biotechnology - 1.2% |
Amgen, Inc. (a) | 826,127 | | 43,528,632 |
Gilead Sciences, Inc. (a) | 722,833 | | 26,383,405 |
| | 69,912,037 |
Health Care Equipment & Supplies - 1.0% |
Baxter International, Inc. | 503,680 | | 24,453,664 |
Medtronic, Inc. | 930,775 | | 31,208,886 |
| | 55,662,550 |
Health Care Providers & Services - 0.6% |
UnitedHealth Group, Inc. | 969,028 | | 35,388,903 |
Pharmaceuticals - 7.7% |
Abbott Laboratories | 1,330,828 | | 61,896,810 |
Bristol-Myers Squibb Co. | 1,478,056 | | 37,306,133 |
Johnson & Johnson | 2,374,109 | | 146,126,409 |
Common Stocks - continued |
| Shares | | Value |
HEALTH CARE - continued |
Pharmaceuticals - continued |
Merck & Co., Inc. | 2,652,623 | | $ 91,435,915 |
Pfizer, Inc. | 6,928,346 | | 112,862,756 |
| | 449,628,023 |
TOTAL HEALTH CARE | | 610,591,513 |
INDUSTRIALS - 9.2% |
Aerospace & Defense - 3.2% |
General Dynamics Corp. | 327,851 | | 21,667,673 |
Honeywell International, Inc. | 665,582 | | 33,086,081 |
Lockheed Martin Corp. | 256,204 | | 17,432,120 |
Raytheon Co. | 322,454 | | 14,913,498 |
The Boeing Co. | 630,649 | | 40,216,487 |
United Technologies Corp. | 800,784 | | 60,275,012 |
| | 187,590,871 |
Air Freight & Logistics - 1.5% |
FedEx Corp. | 271,108 | | 24,703,361 |
United Parcel Service, Inc. Class B | 853,900 | | 59,884,007 |
| | 84,587,368 |
Industrial Conglomerates - 3.4% |
3M Co. | 614,665 | | 51,619,567 |
General Electric Co. | 9,214,967 | | 145,872,928 |
| | 197,492,495 |
Machinery - 0.8% |
Caterpillar, Inc. | 543,417 | | 45,973,078 |
Road & Rail - 0.3% |
Norfolk Southern Corp. | 317,716 | | 19,116,972 |
TOTAL INDUSTRIALS | | 534,760,784 |
INFORMATION TECHNOLOGY - 21.4% |
Communications Equipment - 2.8% |
Cisco Systems, Inc. (a) | 4,922,551 | | 94,316,077 |
QUALCOMM, Inc. | 1,383,548 | | 64,667,034 |
| | 158,983,111 |
Computers & Peripherals - 6.6% |
Apple, Inc. (a) | 787,417 | | 245,004,800 |
Dell, Inc. (a) | 1,458,279 | | 19,278,448 |
Common Stocks - continued |
| Shares | | Value |
INFORMATION TECHNOLOGY - continued |
Computers & Peripherals - continued |
EMC Corp. (a) | 1,769,966 | | $ 38,036,569 |
Hewlett-Packard Co. | 1,954,610 | | 81,956,797 |
| | 384,276,614 |
Internet Software & Services - 2.1% |
Google, Inc. Class A (a) | 214,265 | | 119,069,203 |
IT Services - 3.0% |
International Business Machines Corp. | 1,087,119 | | 153,783,854 |
MasterCard, Inc. Class A | 83,464 | | 19,783,472 |
| | 173,567,326 |
Office Electronics - 0.2% |
Xerox Corp. | 1,192,075 | | 13,661,180 |
Semiconductors & Semiconductor Equipment - 2.3% |
Intel Corp. | 4,799,166 | | 101,358,386 |
Texas Instruments, Inc. | 1,030,162 | | 32,759,152 |
| | 134,117,538 |
Software - 4.4% |
Microsoft Corp. | 6,563,634 | | 165,469,213 |
Oracle Corp. | 3,335,808 | | 90,200,248 |
| | 255,669,461 |
TOTAL INFORMATION TECHNOLOGY | | 1,239,344,433 |
MATERIALS - 2.6% |
Chemicals - 1.7% |
Dow Chemical Co. | 999,702 | | 31,170,708 |
E.I. du Pont de Nemours & Co. | 781,340 | | 36,715,167 |
Monsanto Co. | 465,823 | | 27,912,114 |
| | 95,797,989 |
Metals & Mining - 0.9% |
Alcoa, Inc. | 880,205 | | 11,548,290 |
Freeport-McMoRan Copper & Gold, Inc. | 405,479 | | 41,083,132 |
| | 52,631,422 |
TOTAL MATERIALS | | 148,429,411 |
Common Stocks - continued |
| Shares | | Value |
TELECOMMUNICATION SERVICES - 4.0% |
Diversified Telecommunication Services - 3.8% |
AT&T, Inc. | 5,093,081 | | $ 141,536,721 |
Verizon Communications, Inc. | 2,436,424 | | 77,989,932 |
| | 219,526,653 |
Wireless Telecommunication Services - 0.2% |
Sprint Nextel Corp. (a) | 2,572,419 | | 9,723,744 |
TOTAL TELECOMMUNICATION SERVICES | | 229,250,397 |
UTILITIES - 1.3% |
Electric Utilities - 1.3% |
American Electric Power Co., Inc. | 413,237 | | 14,711,237 |
Entergy Corp. | 161,020 | | 11,471,065 |
Exelon Corp. | 569,724 | | 22,430,034 |
Southern Co. | 716,001 | | 27,007,558 |
| | 75,619,894 |
TOTAL COMMON STOCKS (Cost $6,761,253,546) | 5,732,365,948 |
U.S. Treasury Obligations - 0.2% |
| Principal Amount | | |
U.S. Treasury Bills, yield at date of purchase 0.14% to 0.29% 12/16/10 to 6/30/11 (e)
(Cost $9,341,121) | | $ 9,350,000 | | 9,341,417 |
Money Market Funds - 1.5% |
| Shares | | Value |
Fidelity Cash Central Fund, 0.24% (b) | 40,157,325 | | $ 40,157,325 |
Fidelity Securities Lending Cash Central Fund, 0.25% (b)(c) | 47,262,600 | | 47,262,600 |
TOTAL MONEY MARKET FUNDS (Cost $87,419,925) | 87,419,925 |
TOTAL INVESTMENT PORTFOLIO - 100.6% (Cost $6,858,014,592) | | 5,829,127,290 |
NET OTHER ASSETS (LIABILITIES) - (0.6)% | | (32,702,830) |
NET ASSETS - 100% | $ 5,796,424,460 |
Futures Contracts |
| Expiration Date | | Underlying Face Amount at Value | | Unrealized Appreciation/
(Depreciation) |
Purchased |
Equity Index Contracts |
124 CME E-mini S&P 500 Index Contracts | Dec. 2010 | | $ 7,313,520 | | $ 158,569 |
190 CME S&P 500 Index Contracts | Dec. 2010 | | 56,031,000 | | (1,177,952) |
TOTAL EQUITY INDEX CONTRACTS | | $ 63,344,520 | | $ (1,019,383) |
|
The face value of futures purchased as a percentage of net assets is 1.1% |
Legend |
(a) Non-income producing |
(b) Affiliated fund that is available only to investment companies and other accounts managed by Fidelity Investments. The rate quoted is the annualized seven-day yield of the fund at period end. A complete unaudited listing of the fund's holdings as of its most recent quarter end is available upon request. In addition, each Fidelity Central Fund's financial statements, which are not covered by the Fund's Report of Independent Registered Public Accounting Firm, are available on the SEC's website or upon request. |
(c) Investment made with cash collateral received from securities on loan. |
(d) Security or a portion of the security is on loan at period end. |
(e) Security or a portion of the security was pledged to cover margin requirements for futures contracts. At the period end, the value of securities pledged amounted to $5,245,174. |
Affiliated Central Funds |
Information regarding fiscal year to date income earned by the Fund from investments in Fidelity Central Funds is as follows: |
Fund | Income earned |
Fidelity Cash Central Fund | $ 48,189 |
Fidelity Securities Lending Cash Central Fund | 239,761 |
Total | $ 287,950 |
Other Information |
The following is a summary of the inputs used, as of November 30, 2010, involving the Fund's assets and liabilities carried at fair value. The inputs or methodology used for valuing securities may not be an indication of the risk associated with investing in those securities. For more information on valuation inputs, and their aggregation into the levels used in the table below, please refer to the Security Valuation section in the accompanying Notes to Financial Statements. |
Valuation Inputs at Reporting Date: |
Description | Total | Level 1 | Level 2 | Level 3 |
Investments in Securities: | | | | |
Equities: | | | | |
Consumer Discretionary | $ 471,440,380 | $ 471,440,380 | $ - | $ - |
Consumer Staples | 796,681,214 | 796,681,214 | - | - |
Energy | 784,518,044 | 784,518,044 | - | - |
Financials | 841,729,878 | 841,729,878 | - | - |
Health Care | 610,591,513 | 610,591,513 | - | - |
Industrials | 534,760,784 | 534,760,784 | - | - |
Information Technology | 1,239,344,433 | 1,239,344,433 | - | - |
Materials | 148,429,411 | 148,429,411 | - | - |
Telecommunication Services | 229,250,397 | 229,250,397 | - | - |
Utilities | 75,619,894 | 75,619,894 | - | - |
U.S. Government and Government Agency Obligations | 9,341,417 | - | 9,341,417 | - |
Money Market Funds | 87,419,925 | 87,419,925 | - | - |
Total Investments in Securities: | $ 5,829,127,290 | $ 5,819,785,873 | $ 9,341,417 | $ - |
Derivative Instruments: | | | | |
Assets | | | | |
Futures Contracts | $ 158,569 | $ 158,569 | $ - | $ - |
Liabilities | | | | |
Futures Contracts | $ (1,177,952) | $ (1,177,952) | $ - | $ - |
Total Derivative Instruments: | $ (1,019,383) | $ (1,019,383) | $ - | $ - |
Value of Derivative Instruments |
The following table is a summary of the Fund's value of derivative instruments by risk exposure as of November 30, 2010. For additional information on derivative instruments, please refer to the Derivative Instruments section in the accompanying Notes to Financial Statements. |
Risk Exposure /
Derivative Type | Value |
| Asset | Liability |
Equity Risk | | |
Futures Contracts (a) | $ 158,569 | $ (1,177,952) |
Total Value of Derivatives | $ 158,569 | $ (1,177,952) |
(a) Reflects cumulative appreciation/(depreciation) on futures contracts as disclosed on the Schedule of Investments. Only the period end variation margin is separately disclosed on the Statement of Assets and Liabilities. |
Income Tax Information |
At November 30, 2010, the Fund had a capital loss carryforward of approximately $802,801,874 of which $2,126,258, $83,145,934, $420,211,102 and $297,318,580 will expire in fiscal 2015, 2016, 2017 and 2018, respectively. Capital loss carryforwards are only available to offset future capital gains of the Fund to the extent provided by regulations and may be limited. |
See accompanying notes which are an integral part of the financial statements.
Annual Report
Statement of Assets and Liabilities
| November 30, 2010 |
| | |
Assets | | |
Investment in securities, at value (including securities loaned of $45,658,536) - See accompanying schedule: Unaffiliated issuers (cost $6,770,594,667) | $ 5,741,707,365 | |
Fidelity Central Funds (cost $87,419,925) | 87,419,925 | |
Total Investments (cost $6,858,014,592) | | $ 5,829,127,290 |
Cash | | 1 |
Receivable for fund shares sold | | 1,925,191 |
Dividends receivable | | 16,017,214 |
Distributions receivable from Fidelity Central Funds | | 16,635 |
Total assets | | 5,847,086,331 |
| | |
Liabilities | | |
Payable for fund shares redeemed | 2,046,105 | |
Accrued management fee | 983,999 | |
Payable for daily variation on futures contracts | 369,167 | |
Collateral on securities loaned, at value | 47,262,600 | |
Total liabilities | | 50,661,871 |
| | |
Net Assets | | $ 5,796,424,460 |
Net Assets consist of: | | |
Paid in capital | | $ 7,556,546,452 |
Undistributed net investment income | | 110,379,600 |
Accumulated undistributed net realized gain (loss) on investments | | (840,594,907) |
Net unrealized appreciation (depreciation) on investments | | (1,029,906,685) |
Net Assets, for 695,698,060 shares outstanding | | $ 5,796,424,460 |
Net Asset Value, offering price and redemption price per share ($5,796,424,460 ÷ 695,698,060 shares) | | $ 8.33 |
See accompanying notes which are an integral part of the financial statements.
Annual Report
Financial Statements - continued
Statement of Operations
| Year ended November 30, 2010 |
| | |
Investment Income | | |
Dividends | | $ 129,676,400 |
Interest | | 26,357 |
Income from Fidelity Central Funds | | 287,950 |
Total income | | 129,990,707 |
| | |
Expenses | | |
Management fee | $ 11,463,807 | |
Independent trustees' compensation | 32,196 | |
Interest | 12,364 | |
Miscellaneous | 22,634 | |
Total expenses before reductions | 11,531,001 | |
Expense reductions | (44) | 11,530,957 |
Net investment income (loss) | | 118,459,750 |
Realized and Unrealized Gain (Loss) Net realized gain (loss) on: | | |
Investment securities: | | |
Unaffiliated issuers | (282,777,073) | |
Futures contracts | 3,299,588 | |
Capital gain distributions from Fidelity Central Funds | 2,712 | |
Total net realized gain (loss) | | (279,474,773) |
Change in net unrealized appreciation (depreciation) on: Investment securities | 486,911,663 | |
Futures contracts | (3,063,906) | |
Total change in net unrealized appreciation (depreciation) | | 483,847,757 |
Net gain (loss) | | 204,372,984 |
Net increase (decrease) in net assets resulting from operations | | $ 322,832,734 |
See accompanying notes which are an integral part of the financial statements.
Annual Report
Statement of Changes in Net Assets
| Year ended
November 30, 2010 | Year ended
November 30, 2009 |
Increase (Decrease) in Net Assets | | |
Operations | | |
Net investment income (loss) | $ 118,459,750 | $ 135,839,342 |
Net realized gain (loss) | (279,474,773) | (442,010,081) |
Change in net unrealized appreciation (depreciation) | 483,847,757 | 1,354,038,244 |
Net increase (decrease) in net assets resulting
from operations | 322,832,734 | 1,047,867,505 |
Distributions to shareholders from net investment income | (130,745,785) | (152,513,329) |
Share transactions
Proceeds from sales of shares | 1,656,517,472 | 749,971,579 |
Reinvestment of distributions | 130,745,785 | 152,513,329 |
Cost of shares redeemed | (2,021,604,650) | (1,176,661,415) |
Net increase (decrease) in net assets resulting from share transactions | (234,341,393) | (274,176,507) |
Total increase (decrease) in net assets | (42,254,444) | 621,177,669 |
| | |
Net Assets | | |
Beginning of period | 5,838,678,904 | 5,217,501,235 |
End of period (including undistributed net investment income of $110,379,600 and undistributed net investment income of $122,693,342, respectively) | $ 5,796,424,460 | $ 5,838,678,904 |
Other Information Shares | | |
Sold | 207,372,332 | 107,575,612 |
Issued in reinvestment of distributions | 16,508,306 | 23,355,793 |
Redeemed | (253,532,352) | (168,153,109) |
Net increase (decrease) | (29,651,714) | (37,221,704) |
See accompanying notes which are an integral part of the financial statements.
Annual Report
Financial Highlights
Years ended November 30, | 2010 | 2009 | 2008 | 2007 G |
Selected Per-Share Data | | | | |
Net asset value, beginning of period | $ 8.05 | $ 6.84 | $ 10.79 | $ 10.00 |
Income from Investment Operations | | | | |
Net investment income (loss) D | .17 | .18 | .22 | .15 |
Net realized and unrealized gain (loss) | .29 | 1.23 | (4.06) | .64 |
Total from investment operations | .46 | 1.41 | (3.84) | .79 |
Distributions from net investment income | (.18) | (.20) | (.11) | - |
Net asset value, end of period | $ 8.33 | $ 8.05 | $ 6.84 | $ 10.79 |
Total Return B, C | 5.83% | 21.29% | (35.95)% | 7.90% |
Ratios to Average Net Assets E, H | | | | |
Expenses before reductions | .20% | .20% | .20% | .20% A |
Expenses net of fee waivers, if any | .20% | .20% | .20% | .20% A |
Expenses net of all reductions | .20% | .20% | .19% | .19% A |
Net investment income (loss) | 2.06% | 2.64% | 2.38% | 2.16% A |
Supplemental Data | | | | |
Net assets, end of period (000 omitted) | $ 5,796,424 | $ 5,838,679 | $ 5,217,501 | $ 6,400,763 |
Portfolio turnover rate F | 6% | 18% | 6% | 2% A |
A Annualized
B Total returns for periods of less than one year are not annualized.
C Total returns would have been lower had certain expenses not been reduced during the periods shown.
D Calculated based on average shares outstanding during the period.
E Fees and expenses of the underlying Fidelity Central Funds are not included in the Fund's expense ratio. The Fund indirectly bears its proportionate share of the expenses of any underlying Fidelity Central Funds.
F Amount does not include the portfolio activity of any underlying Fidelity Central Funds.
G For the period March 29, 2007 (commencement of operations) to November 30, 2007.
H Expense ratios reflect operating expenses of the Fund. Expenses before reductions do not reflect amounts reimbursed by the investment adviser or reductions from expense offset arrangements and do not represent the amount paid by the Fund during periods when reimbursements or reductions occur. Expenses net of fee waivers reflect expenses after reimbursement by the investment adviser but prior to reductions from expense offset arrangements. Expenses net of all reductions represent the net expenses paid by the Fund.
See accompanying notes which are an integral part of the financial statements.
Annual Report
Notes to Financial Statements
For the period ended November 30, 2010
1. Organization.
Fidelity Series 100 Index Fund (the Fund) is a fund of Fidelity Commonwealth Trust (the Trust) and is authorized to issue an unlimited number of shares. Shares of the Fund are only available for purchase by mutual funds for which Fidelity Management & Research Company (FMR) or an affiliate serves as an investment manager. The Trust is registered under the Investment Company Act of 1940, as amended (the 1940 Act), as an open-end management investment company organized as a Massachusetts business trust.
2. Investments in Fidelity Central Funds.
The Fund may invest in Fidelity Central Funds, which are open-end investment companies available only to other investment companies and accounts managed by FMR and its affiliates. The Fund's Schedule of Investments lists each of the Fidelity Central Funds held as of period end, if any, as an investment of the Fund, but does not include the underlying holdings of each Fidelity Central Fund. As an Investing Fund, the Fund indirectly bears its proportionate share of the expenses of the underlying Fidelity Central Funds.
The Money Market Central Funds seek preservation of capital and current income and are managed by Fidelity Investments Money Management, Inc. (FIMM), an affiliate of FMR.
A complete unaudited list of holdings for each Fidelity Central Fund is available upon request or at the Securities and Exchange Commission (the SEC) web site at www.sec.gov. In addition, the financial statements of the Fidelity Central Funds, which are not covered by the Fund's Report of Independent Registered Public Accounting Firm, are available on the SEC web site or upon request.
3. Significant Accounting Policies.
The financial statements have been prepared in conformity with accounting principles generally accepted in the United States of America (GAAP), which require management to make certain estimates and assumptions at the date of the financial statements. Actual results could differ from those estimates. The following summarizes the significant accounting policies of the Fund:
Security Valuation. Investments are valued as of 4:00 p.m. Eastern time on the last calendar day of the period. The Fund uses independent pricing services approved by the Board of Trustees to value its investments. When current market prices or quotations are not readily available or reliable, valuations may be determined in good faith in accordance with procedures adopted by the Board of Trustees. Factors used in determining
Annual Report
Notes to Financial Statements - continued
3. Significant Accounting Policies - continued
Security Valuation - continued
value may include market or security specific events, changes in interest rates and credit quality. The frequency with which these procedures are used cannot be predicted and they may be utilized to a significant extent. The value used for net asset value (NAV) calculation under these procedures may differ from published prices for the same securities.
The Fund categorizes the inputs to valuation techniques used to value its investments into a disclosure hierarchy consisting of three levels as shown below.
Level 1 - quoted prices in active markets for identical investments
Level 2 - other significant observable inputs (including quoted prices for similar investments, interest rates, prepayment speeds, etc.)
Level 3 - unobservable inputs (including the Fund's own assumptions based on the best information available)
Changes in valuation techniques may result in transfers in or out of an assigned level within the disclosure hierarchy. The aggregate value of investments by input level, as of November 30, 2010, is included at the end of the Fund's Schedule of Investments. Valuation techniques used to value the Fund's investments by major category are as follows.
Equity securities, including restricted securities, for which market quotations are readily available, are valued at the last reported sale price or official closing price as reported by an independent pricing service on the primary market or exchange on which they are traded and are categorized as Level 1 in the hierarchy. In the event there were no sales during the day or closing prices are not available, securities are valued at the last quoted bid price or may be valued using the last available price and are generally categorized as Level 2 in the hierarchy. For foreign equity securities, when significant market or security specific events arise, comparisons to the valuation of American Depositary Receipts (ADRs), futures contracts, Exchange-traded funds (ETFs) and certain indexes as well as quoted prices for similar securities are used and are categorized as Level 2 in the hierarchy in these circumstances. Utilizing these techniques may result in transfers between Level 1 and Level 2. For restricted equity securities and private placements where observable inputs are limited, assumptions about market activity and risk are used and are categorized as Level 3 in the hierarchy.
Debt securities, including restricted securities, are valued based on evaluated prices received from independent pricing services or from dealers who make markets in such securities. For U.S. government and government agency obligations, pricing services
Annual Report
3. Significant Accounting Policies - continued
Security Valuation - continued
utilize matrix pricing which considers yield or price of bonds of comparable quality, coupon, maturity and type as well as dealer supplied prices and are generally categorized as Level 2 in the hierarchy.
Futures contracts are valued at the settlement price established each day by the board of trade or exchange on which they are traded and are categorized as Level 1 in the hierarchy. Investments in open-end mutual funds, including the Fidelity Central Funds, are valued at their closing net asset value each business day and are categorized as Level 1 in the hierarchy.
When independent prices are unavailable or unreliable, debt securities may be valued utilizing pricing matrices which consider similar factors that would be used by independent pricing services. These are generally categorized as Level 2 in the hierarchy but may be Level 3 depending on the circumstances.
Investment Transactions and Income. For financial reporting purposes, the Fund's investment holdings and NAV include trades executed through the end of the last business day of the period. The NAV per share for processing shareholder transactions is calculated as of the close of business of the New York Stock Exchange (NYSE), normally 4:00 p.m. Eastern time and includes trades executed through the end of the prior business day. Gains and losses on securities sold are determined on the basis of identified cost and may include proceeds received from litigation. Dividend income is recorded on the ex-dividend date, except for certain dividends from foreign securities where the ex-dividend date may have passed, which are recorded as soon as the Fund is informed of the ex-dividend date. Non-cash dividends included in dividend income, if any, are recorded at the fair market value of the securities received. Distributions received on securities that represent a return of capital or capital gain are recorded as a reduction of cost of investments and/or as a realized gain. The Fund estimates the components of distributions received that may be considered return of capital distributions or capital gain distributions. Interest income and distributions from the Fidelity Central Funds are accrued as earned. Interest income includes coupon interest and amortization of premium and accretion of discount on debt securities.
Expenses. Most expenses of the Trust can be directly attributed to a fund. Expenses which cannot be directly attributed are apportioned amongst each fund in the Trust. Expense estimates are accrued in the period to which they relate and adjustments are made when actual amounts are known.
Annual Report
Notes to Financial Statements - continued
3. Significant Accounting Policies - continued
Income Tax Information and Distributions to Shareholders. Each year the Fund intends to qualify as a regulated investment company, including distributing substantially all of its taxable income and realized gains under Subchapter M of the Internal Revenue Code and filing its U.S. federal tax return. As a result, no provision for income taxes is required. As of November 30, 2010, the Fund did not have any unrecognized tax benefits in the accompanying financial statements. A fund's federal tax return is subject to examination by the Internal Revenue Service (IRS) for a period of three years.
Distributions are declared and recorded on the ex-dividend date. Income and capital gain distributions are determined in accordance with income tax regulations, which may differ from GAAP.
Capital accounts within the financial statements are adjusted for permanent book-tax differences. These adjustments have no impact on net assets or the results of operations. Temporary book-tax differences will reverse in a subsequent period.
Book-tax differences are primarily due to short-term gain distributions from the Fidelity Central Funds, futures transactions, contributions in kind, market discount, capital loss carryforwards, losses deferred due to wash sales and excise tax regulations.
The federal tax cost of investment securities and unrealized appreciation (depreciation) as of period end were as follows:
Gross unrealized appreciation | $ 451,806,954 |
Gross unrealized depreciation | (1,519,090,204) |
Net unrealized appreciation (depreciation) | $ (1,067,283,250) |
| |
Tax Cost | $ 6,896,410,540 |
The tax-based components of distributable earnings as of period end were as follows:
Undistributed ordinary income | $ 110,381,121 |
Capital loss carryforward | $ (802,801,874) |
Net unrealized appreciation (depreciation) | $ (1,067,283,250) |
The tax character of distributions paid was as follows:
| November 30, 2010 | November 30, 2009 |
Ordinary Income | $ 130,745,785 | $ 152,513,329 |
Annual Report
4. Derivative Instruments.
Risk Exposures and the Use of Derivative Instruments. The Fund uses derivative instruments (derivatives), including futures contracts, in order to meet its investment objectives. The strategy is to use derivatives to increase returns and to manage exposure to certain risks as defined below. The success of any strategy involving derivatives depends on analysis of numerous economic factors, and if the strategies for investment do not work as intended, the Fund may not achieve its objectives.
The Fund's use of derivatives may increase or decrease its exposure to the following risk:
Equity Risk | Equity risk relates to the fluctuations in the value of financial instruments as a result of changes in market prices (other than those arising from interest rate risk or foreign exchange risk), whether caused by factors specific to an individual investment, its issuer, or all factors affecting all instruments traded in a market or market segment. |
The Fund is also exposed to additional risks from investing in derivatives, such as liquidity risk and counterparty credit risk. Liquidity risk is the risk that the Fund will be unable to sell the derivative in the open market in a timely manner. Counterparty credit risk is the risk that the counterparty will not be able to fulfill its obligation to the Fund. The Fund's maximum risk of loss from counterparty credit risk is generally the aggregate unrealized appreciation and unpaid counterparty fees in excess of any collateral pledged by the counterparty to the Fund. Counterparty risk related to exchange-traded futures contracts is minimal because of the protection provided by the exchange on which they trade. Risk of loss may exceed the amounts recognized in the Statement of Assets and Liabilities.
Futures Contracts. A futures contract is an agreement between two parties to buy or sell a specified underlying instrument for a fixed price at a specified future date. The Fund uses futures contracts to manage its exposure to the stock market.
Upon entering into a futures contract, a fund is required to deposit either cash or securities (initial margin) with a clearing broker in an amount equal to a certain percentage of the face value of the contract. Futures contracts are marked-to-market daily and subsequent payments (variation margin) are made or received by a fund depending on the daily fluctuations in the value of the futures contracts and are recorded as unrealized appreciation or (depreciation). Realized gain or (loss) is recorded upon the expiration or closing of a futures contract.
Annual Report
Notes to Financial Statements - continued
4. Derivative Instruments - continued
Futures Contracts - continued
The underlying face amount at value of open futures contracts at period end is shown in the Schedule of Investments under the caption "Futures Contracts." This amount reflects each contract's exposure to the underlying instrument at period end and is representative of activity for the period. Securities deposited to meet initial margin requirements are identified in the Schedule of Investments. The receivable and/or payable for the variation margin are reflected in the Statement of Assets and Liabilities.
Certain risks may arise upon entering into futures contracts, including the risk that an illiquid market may limit the ability to close out a futures contract prior to settlement date.
During the period the Fund recognized net realized gain (loss) of $3,299,588 and a change in net unrealized appreciation (depreciation) of ($3,063,906) related to its investment in futures contracts. These amounts are included in the Statement of Operations.
5. Purchases and Sales of Investments.
Purchases and sales of securities, other than short-term securities, aggregated $361,087,120 and $630,294,394, respectively.
6. Fees and Other Transactions with Affiliates.
Management Fee. FMR and its affiliates provide the Fund with investment management related services for which the Fund pays a monthly management fee that is based on an annual rate of .20% of the Fund's average net assets. FMR pays all other expenses, except the compensation of the independent Trustees and certain exceptions such as interest expense, including commitment fees. The management fee paid to FMR by the Fund is reduced by an amount equal to the fees and expenses paid by the Fund to the independent Trustees.
Sub-Adviser. Geode Capital Management, LLC (Geode), serves as sub-adviser for the Fund. Geode provides discretionary investment advisory services to the Fund and is paid by FMR for providing these services.
Interfund Lending Program. Pursuant to an Exemptive Order issued by the SEC, the Fund, along with other registered investment companies having management contracts with FMR, may participate in an interfund lending program. This program provides an alternative credit facility allowing the funds to borrow from, or lend money to, other participating affiliated funds. At period end, there were no interfund loans outstanding.
Annual Report
6. Fees and Other Transactions with Affiliates - continued
Interfund Lending Program - continued
The Fund's activity in this program during the period for which loans were outstanding was as follows:
Borrower or Lender | Average Daily
Loan Balance | Weighted Average Interest Rate | Interest
Expense |
Borrower | $ 19,716,804 | .44% | $ 12,364 |
7. Committed Line of Credit.
The Fund participates with other funds managed by FMR or an affiliate in a $3.75 billion credit facility (the "line of credit") to be utilized for temporary or emergency purposes to fund shareholder redemptions or for other short-term liquidity purposes. The Fund has agreed to pay commitment fees on its pro-rata portion of the line of credit, which amounted to $22,634 and is reflected in Miscellaneous expenses on the Statement of Operations. During the period, there were no borrowings on this line of credit.
8. Security Lending.
The Fund lends portfolio securities through a lending agent from time to time in order to earn additional income. On the settlement date of the loan, the Fund receives collateral (in the form of U.S. Treasury obligations, letters of credit and/or cash) against the loaned securities and maintains collateral in an amount not less than 100% of the market value of the loaned securities during the period of the loan. The market value of the loaned securities is determined at the close of business of the Fund and any additional required collateral is delivered to the Fund on the next business day. If the borrower defaults on its obligation to return the securities loaned because of insolvency or other reasons, a fund could experience delays and costs in recovering the securities loaned or in gaining access to the collateral. Any cash collateral received is invested in the Fidelity Securities Lending Cash Central Fund. The value of loaned securities and cash collateral at period end are disclosed on the Fund's Statement of Assets and Liabilities. Security lending income represents the income earned on investing cash collateral, less rebates paid to borrowers and lending agent fees associated with the loan, plus any premium payments received for lending certain types of securities. Security lending income is presented in the Statement of Operations as a component of income from Fidelity Central Funds. Total security lending income during the period amounted to $239,761.
Annual Report
Notes to Financial Statements - continued
9. Expense Reductions.
Through arrangements with the Fund's custodian, credits realized as a result of uninvested cash balances were used to reduce the Fund's expenses. During the period, these credits reduced the Fund's custody expenses by $44.
10. Other.
The Fund's organizational documents provide former and current trustees and officers with a limited indemnification against liabilities arising in connection with the performance of their duties to the Fund. In the normal course of business, the Fund may also enter into contracts that provide general indemnifications. The Fund's maximum exposure under these arrangements is unknown as this would be dependent on future claims that may be made against the Fund. The risk of material loss from such claims is considered remote.
At the end of the period FMR or its affiliates were the owners of record of 100% of the total outstanding shares of the fund.
Annual Report
To the Trustees of Fidelity Commonwealth Trust and Shareholders of Fidelity Series 100 Index Fund:
We have audited the accompanying statement of assets and liabilities of Fidelity Series 100 Index Fund (the Fund), a fund of Fidelity Commonwealth Trust, including the schedule of investments, as of November 30, 2010, and the related statement of operations for the year then ended, the statement of changes in net assets for each of the two years in the period then ended, and the financial highlights for each of the three years in the period then ended and for the period from March 29, 2007 (commencement of operations) to November 30, 2007. These financial statements and financial highlights are the responsibility of the Fund's management. Our responsibility is to express an opinion on these financial statements and financial highlights based on our audits.
We conducted our audits in accordance with the standards of the Public Company Accounting Oversight Board (United States). Those standards require that we plan and perform the audit to obtain reasonable assurance about whether the financial statements and financial highlights are free of material misstatement. The Fund is not required to have, nor were we engaged to perform, an audit of its internal control over financial reporting. Our audits included consideration of internal control over financial reporting as a basis for designing audit procedures that are appropriate in the circumstances, but not for the purpose of expressing an opinion on the effectiveness of the Fund's internal control over financial reporting. Accordingly, we express no such opinion. An audit also includes examining, on a test basis, evidence supporting the amounts and disclosures in the financial statements, assessing the accounting principles used and significant estimates made by management, as well as evaluating the overall financial statement presentation. Our procedures included confirmation of securities owned as of November 30, 2010, by correspondence with the custodians and brokers; where replies were not received from brokers, we performed other auditing procedures. We believe that our audits provide a reasonable basis for our opinion.
In our opinion, the financial statements and financial highlights referred to above present fairly, in all material respects, the financial position of Fidelity Series 100 Index Fund as of November 30, 2010, the results of its operations for the year then ended, the changes in its net assets for each of the two years in the period then ended, and the financial highlights for each of the three years in the period then ended and for the period from March 29, 2007 (commencement of operations) to November 30, 2007, in conformity with accounting principles generally accepted in the United States of America.
/s/ Deloitte & Touche LLP
DELOITTE & TOUCHE LLP
Boston, Massachusetts
January 19, 2011
Annual Report
The Trustees, Members of the Advisory Board, and executive officers of the trust and fund, as applicable, are listed below. The Board of Trustees governs the fund and is responsible for protecting the interests of shareholders. The Trustees are experienced executives who meet periodically throughout the year to oversee the fund's activities, review contractual arrangements with companies that provide services to the fund, oversee management of the risks associated with such activities and contractual arrangements, and review the fund's performance. Except for James C. Curvey, each of the Trustees oversees 219 funds advised by FMR or an affiliate. Mr. Curvey oversees 408 funds advised by FMR or an affiliate.
The Trustees hold office without limit in time except that (a) any Trustee may resign; (b) any Trustee may be removed by written instrument, signed by at least two-thirds of the number of Trustees prior to such removal; (c) any Trustee who requests to be retired or who has become incapacitated by illness or injury may be retired by written instrument signed by a majority of the other Trustees; and (d) any Trustee may be removed at any special meeting of shareholders by a two-thirds vote of the outstanding voting securities of the trust. Each Trustee who is not an interested person (as defined in the 1940 Act) (Independent Trustee), shall retire not later than the last day of the calendar year in which his or her 72nd birthday occurs. The Independent Trustees may waive this mandatory retirement age policy with respect to individual Trustees. The executive officers and Advisory Board Members hold office without limit in time, except that any officer and Advisory Board Member may resign or may be removed by a vote of a majority of the Trustees at any regular meeting or any special meeting of the Trustees. Except as indicated, each individual has held the office shown or other offices in the same company for the past five years.
Experience, Skills, Attributes, and Qualifications of the Fund's Trustees. The Governance and Nominating Committee has adopted a statement of policy that describes the experience, qualifications, attributes, and skills that are necessary and desirable for potential Independent Trustee candidates (Statement of Policy). The Board believes that each Trustee satisfied at the time he or she was initially elected or appointed a Trustee, and continues to satisfy, the standards contemplated by the Statement of Policy. The Governance and Nominating Committee also engages professional search firms to help identify potential Independent Trustee candidates who have the experience, qualifications, attributes, and skills consistent with the Statement of Policy. From time to time, additional criteria based on the composition and skills of the current Independent Trustees, as well as experience or skills that may be appropriate in light of future changes to board composition, business conditions, and regulatory or other developments, have also been considered by the professional search firms and the Governance and Nominating Committee. In addition, the Board takes into account the Trustees' commitment and participation in Board and committee meetings, as well as their leadership of standing and ad hoc committees throughout their tenure.
In determining that a particular Trustee was and continues to be qualified to serve as a Trustee, the Board has considered a variety of criteria, none of which, in isolation, was controlling. The Board believes that, collectively, the Trustees have balanced and diverse experience, qualifications, attributes, and skills, which allow the Board to operate effectively in governing the fund and protecting the interests of shareholders. Information about the specific experience, skills, attributes, and qualifications of each Trustee, which in each case led to the Board's conclusion that the Trustee should serve (or continue to serve) as a trustee of the fund, is provided below.
Annual Report
Board Structure and Oversight Function. James C. Curvey is an interested person (as defined in the 1940 Act) and currently serves as Acting Chairman. The Trustees have determined that an interested Chairman is appropriate and benefits shareholders because an interested Chairman has a personal and professional stake in the quality and continuity of services provided to the fund. Independent Trustees exercise their informed business judgment to appoint an individual of their choosing to serve as Chairman, regardless of whether the Trustee happens to be independent or a member of management. The Independent Trustees have determined that they can act independently and effectively without having an Independent Trustee serve as Chairman and that a key structural component for assuring that they are in a position to do so is for the Independent Trustees to constitute a substantial majority for the Board. The Independent Trustees also regularly meet in executive session. Ned C. Lautenbach serves as Chairman of the Independent Trustees and as such (i) acts as a liaison between the Independent Trustees and management with respect to matters important to the Independent Trustees and (ii) with management prepares agendas for Board meetings.
Fidelity funds are overseen by different Boards of Trustees. The fund's Board oversees Fidelity's equity and high income funds and another Board oversees Fidelity's investment-grade bond, money market, and asset allocation funds. The asset allocation funds may invest in Fidelity funds overseen by the fund's Board. The use of separate Boards, each with its own committee structure, allows the Trustees of each group of Fidelity funds to focus on the unique issues of the funds they oversee, including common research, investment, and operational issues. On occasion, the separate Boards establish joint committees to address issues of overlapping consequences for the Fidelity funds overseen by each Board.
The Trustees operate using a system of committees to facilitate the timely and efficient consideration of all matters of importance to the Trustees, the fund, and fund shareholders and to facilitate compliance with legal and regulatory requirements and oversight of the fund's activities and associated risks. The Board, acting through its committees, has charged FMR and its affiliates with (i) identifying events or circumstances the occurrence of which could have demonstrably adverse effects on the fund's business and/or reputation; (ii) implementing processes and controls to lessen the possibility that such events or circumstances occur or to mitigate the effects of such events or circumstances if they do occur; and (iii) creating and maintaining a system designed to evaluate continuously business and market conditions in order to facilitate the identification and implementation processes described in (i) and (ii) above. Because the day-to-day operations and activities of the fund are carried out by or through FMR, its affiliates and other service providers, the fund's exposure to risks is mitigated but not eliminated by the processes overseen by the Trustees. While each of the Board's committees has responsibility for overseeing different aspects of the fund's activities, oversight is exercised primarily through the Operations, Audit, and Compliance Committees. Appropriate personnel, including but not limited to the fund's Chief Compliance Officer (CCO), FMR's internal auditor, the independent accountants, the fund's Treasurer and portfolio management personnel, make periodic reports to the Board's committees, as appropriate. The responsibilities of each committee, including their oversight responsibilities, are described further under "Standing Committees of the Fund's Trustees."
Annual Report
Trustees and Officers - continued
The fund's Statement of Additional Information (SAI) includes more information about the Trustees. To request a free copy, call Fidelity at 1-800-544-8544.
Interested Trustees*:
Correspondence intended for each Trustee who is an interested person may be sent to Fidelity Investments, 82 Devonshire Street, Boston, Massachusetts 02109.
Name, Age; Principal Occupations and Other Relevant Experience+ |
James C. Curvey (75) |
| Year of Election or Appointment: 2007 Mr. Curvey is Trustee and Acting Chairman of the Board of Trustees of certain Trusts. Mr. Curvey also serves as Trustee (2007-present) of other investment companies advised by FMR. Mr. Curvey is a Director of Fidelity Investments Money Management, Inc. (2009-present), Director of Fidelity Research & Analysis Co. (2009-present) and Director of FMR and FMR Co., Inc. (2007-present). Mr. Curvey is also Vice Chairman (2007-present) and Director of FMR LLC. In addition, Mr. Curvey serves as an Overseer for the Boston Symphony Orchestra and a member of the Trustees of Villanova University. Previously, Mr. Curvey was the Vice Chairman (2006-2007) and Director (2000-2007) of FMR Corp. |
Ronald P. O'Hanley (54) |
| Year of Election or Appointment: 2011 Ronald P. O'Hanley is President, Asset Management and Corporate Services, for Fidelity Investments and a member of Fidelity's Executive Committee (2010-present). Previously, Mr. O'Hanley served as President and Chief Executive Officer of BNY Mellon Asset Management (2007-2010). Mr. O'Hanley also served as Vice Chairman of Bank New York Mellon Corp. and a member of that firm's Executive Committee. Prior to the 2007 merger of The Bank of New York and Mellon Financial Corporation, he was Vice Chairman of Mellon Financial Corporation and President and Chief Executive Officer of Mellon Asset Management. He joined Mellon in February 1997. Mr. O'Hanley currently serves as Chairman of the Boston Public Library Foundation Board of Directors and sits on the Board of Directors of Beth Israel Deaconess Medical Center, the Board of Trustees of the Marine Biological Laboratory and the Advisory Board of the Maxwell School of Citizenship and Public Administration at Syracuse University. Mr. O'Hanley also chairs the Council on Asset Management for the Financial Services Roundtable and is a member of the Board of Directors of Institutional Investor's U.S. Institute. |
* Trustees have been determined to be "Interested Trustees" by virtue of, among other things, their affiliation with the trust or various entities under common control with FMR.
+ The information above includes each Trustee's principal occupation during the last five years and other information relating to the experience, attributes, and skills relevant to each Trustee's qualifications to serve as a Trustee, which led to the conclusion that each Trustee should serve as a Trustee for the fund.
Annual Report
Trustees and Officers - continued
Independent Trustees:
Correspondence intended for each Independent Trustee (that is, the Trustees other than the Interested Trustees) may be sent to Fidelity Investments, P.O. Box 55235, Boston, Massachusetts 02205-5235.
Name, Age; Principal Occupations and Other Relevant Experience+ |
Dennis J. Dirks (62) |
| Year of Election or Appointment: 2005 Prior to his retirement in May 2003, Mr. Dirks was Chief Operating Officer and a member of the Board of The Depository Trust & Clearing Corporation (DTCC). He also served as President, Chief Operating Officer, and Board member of The Depository Trust Company (DTC) and President and Board member of the National Securities Clearing Corporation (NSCC). In addition, Mr. Dirks served as Chief Executive Officer and Board member of the Government Securities Clearing Corporation, Chief Executive Officer and Board member of the Mortgage-Backed Securities Clearing Corporation, as a Trustee and a member of the Finance Committee of Manhattan College (2005-2008), and as a Trustee and a member of the Finance Committee of AHRC of Nassau County (2006-2008). Mr. Dirks is a member of the Independent Directors Council (IDC) Governing Council (2010-Present) and Board of Directors for The Brookville Center for Children's Services, Inc. (2009-present). |
Alan J. Lacy (57) |
| Year of Election or Appointment: 2008 Mr. Lacy serves as Senior Adviser (2007-present) of Oak Hill Capital Partners, L.P. (private equity). Mr. Lacy also served as Chief Executive Officer (2000-2005) and Vice Chairman (2005-2006) of Sears Holdings Corporation and Sears, Roebuck and Co. (retail). In addition, Mr. Lacy serves as a member of the Board of Directors of The Western Union Company (global money transfer, 2006-present) and Bristol-Myers Squibb Company (global pharmaceuticals, 2007-present). Mr. Lacy is Chairman (2008-present) and a member (2006-present) of the Board of Trustees of The National Parks Conservation Association. |
Ned C. Lautenbach (66) |
| Year of Election or Appointment: 2000 Mr. Lautenbach is Chairman of the Independent Trustees of the Equity and High Income Funds (2006-present). Mr. Lautenbach currently serves as the Lead Director of the Eaton Corporation Board of Directors (diversified industrial, 1997-present). Mr. Lautenbach is also a member of the Board of Directors of the Philharmonic Center for the Arts in Naples, Florida (1999 - present); a member of the Board of Trustees of Fairfield University (2005-present); and a member of the Council on Foreign Relations (1994 - present). Previously, Mr. Lautenbach was a Partner/Advisory Partner at Clayton, Dubilier & Rice, Inc. (private equity investment, 1998-2010), as well as a Director of Sony Corporation (2006-2007). |
Joseph Mauriello (66) |
| Year of Election or Appointment: 2008 Prior to his retirement in January 2006, Mr. Mauriello served in numerous senior management positions including Deputy Chairman and Chief Operating Officer (2004-2005), and Vice Chairman of Financial Services (2002-2004) of KPMG LLP US (professional services, 1965-2005). Mr. Mauriello currently serves as a member of the Board of Directors of XL Group plc. (global insurance and re-insurance, 2006-present) and of Arcadia Resources Inc. (health care services and products, 2007-present). Previously, Mr. Mauriello served as a Director of the Hamilton Funds of the Bank of New York (2006-2007). |
Cornelia M. Small (66) |
| Year of Election or Appointment: 2005 Ms. Small is a member of the Board of Directors of the Teagle Foundation (2009-present). Ms. Small is also a member of the Investment Committee, and Chair (2008-present) and a member of the Board of Trustees of Smith College. In addition, Ms. Small serves on the Investment Committee of the Berkshire Taconic Community Foundation (2008-present). Previously, Ms. Small served as Chairperson of the Investment Committee (2002-2008) of Smith College. In addition, Ms. Small served as Chief Investment Officer, Director of Global Equity Investments, and a member of the Board of Directors of Scudder, Stevens & Clark and Scudder Kemper Investments. |
William S. Stavropoulos (71) |
| Year of Election or Appointment: 2002 Mr. Stavropoulos is Vice Chairman of the Independent Trustees of the Equity and High Income Funds (2006-present). Mr. Stavropoulos serves as President and Founder of the Michigan Baseball Foundation, the Great Lakes Loons (2007-present). Mr. Stavropoulos is Chairman Emeritus of the Board of Directors of The Dow Chemical Company, where he previously served in numerous senior management positions, including President, CEO (1995-2000; 2002-2004), Chairman of the Executive Committee (2000-2006), and as a member of the Board of Directors (1990-2006). Currently, Mr. Stavropoulos is Chairman of Univar (global distributor of commodity and specialty chemicals, 2010-present), a Director of Teradata Corporation (data warehousing and technology solutions, 2008-present), Chemical Financial Corporation, Maersk Inc. (industrial conglomerate), Tyco International, Inc. (multinational manufacturing and services, 2007-present), and a member of the Advisory Board for Metalmark Capital (private equity investment, 2005-present). Mr. Stavropoulos is a special advisor to Clayton, Dubilier & Rice, LLC (private equity investment). In addition, Mr. Stavropoulos is a member of the University of Notre Dame Advisory Council for the College of Science. |
David M. Thomas (61) |
| Year of Election or Appointment: 2008 Previously, Mr. Thomas served as Executive Chairman (2005-2006) and Chairman and Chief Executive Officer (2000-2005) of IMS Health, Inc. (pharmaceutical and healthcare information solutions). In addition, Mr. Thomas serves as a member of the Board of Directors of Fortune Brands, Inc. (consumer products), and Interpublic Group of Companies, Inc. (marketing communication, 2004-present). |
Michael E. Wiley (60) |
| Year of Election or Appointment: 2008 Mr. Wiley also serves as a Director of Asia Pacific Exploration Consolidated (international oil and gas exploration and production, 2008-present). Mr. Wiley serves as a Director of Tesoro Corporation (independent oil refiner and marketer, 2005-present), and a Director of Bill Barrett Corporation (exploration and production, 2005-present). In addition, Mr. Wiley also serves as a Director of Post Oak Bank (privately-held bank, 2004-present). Previously, Mr. Wiley served as a member of the Board of Trustees of the University of Tulsa (2000-2006; 2007-2010), as a Senior Energy Advisor of Katzenbach Partners, LLC (consulting, 2006-2007), as an Advisory Director of Riverstone Holdings (private investment), Chairman, President, and CEO of Baker Hughes, Inc. (oilfield services, 2000-2004), and as Director of Spinnaker Exploration Company (exploration and production, 2001-2005). |
+ The information above includes each Trustee's principal occupation during the last five years and other information relating to the experience, attributes, and skills relevant to each Trustee's qualifications to serve as a Trustee, which led to the conclusion that each Trustee should serve as a Trustee for the fund.
Advisory Board Members and Executive Officers:
Correspondence intended for each executive officer, Edward C. Johnson 3d, and Peter S. Lynch may be sent to Fidelity Investments, 82 Devonshire Street, Boston, Massachusetts 02109.
Name, Age; Principal Occupation |
Edward C. Johnson 3d (80) |
| Year of Election or Appointment: 2011 Member of the Advisory Board of Fidelity's Equity and High Income Funds. Formerly Trustee and Chairman of the Board of Trustees of certain Trusts, Mr. Johnson serves as Chief Executive Officer, Chairman, and a Director of FMR LLC; Chairman and a Director of FMR; and Chairman and a Director of FMR Co., Inc. In addition, Mr. Johnson serves as Chairman and Director of FIL Limited. Previously, Mr. Johnson served as President of FMR LLC (2006-2007). |
Peter S. Lynch (66) |
| Year of Election or Appointment: 2003 Member of the Advisory Board of Fidelity's Equity and High Income Funds. Mr. Lynch is Vice Chairman and a Director of FMR and FMR Co., Inc. In addition, Mr. Lynch serves as a Trustee of Boston College and as the Chairman of the Inner-City Scholarship Fund. Previously, Mr. Lynch served on the Special Olympics International Board of Directors (1997-2006). |
Kenneth B. Robins (41) |
| Year of Election or Appointment: 2008 President and Treasurer of Fidelity's Equity and High Income Funds. Mr. Robins also serves as President and Treasurer (2010-present) and Assistant Treasurer (2009-present) of other Fidelity funds and is an employee of Fidelity Investments (2004-present). Previously, Mr. Robins served as Deputy Treasurer of the Fidelity funds (2005-2008) and Treasurer and Chief Financial Officer of The North Carolina Capital Management Trust: Cash and Term Portfolios (2006-2008). |
Bruce T. Herring (45) |
| Year of Election or Appointment: 2006 Vice President of certain Equity Funds. Mr. Herring also serves as Chief Investment Officer and Director of Fidelity Management & Research (U.K.) Inc. (2010-present) and Group Chief Investments Officer of FMR. Previously, Mr. Herring served as Vice President (2005-2006) and Senior Vice President (2006-2007) of Fidelity Management & Research Company, Vice President of FMR Co., Inc. (2001-2007) and as a portfolio manager for Fidelity U.S. Equity Funds. |
Brian B. Hogan (46) |
| Year of Election or Appointment: 2009 Vice President of certain Equity Funds and Vice President of Sector Funds. Mr. Hogan also serves as President of FMR's Equity Division (2009-present). Previously, Mr. Hogan served as Senior Vice President, Equity Research of FMR (2006-2009) and as a portfolio manager. |
Scott C. Goebel (42) |
| Year of Election or Appointment: 2008 Secretary and Chief Legal Officer (CLO) of the Fidelity funds. Mr. Goebel also serves as Secretary and CLO of The North Carolina Capital Management Trust: Cash and Term Portfolio (2008-present); General Counsel, Secretary, and Senior Vice President of FMR (2008-present) and FMR Co., Inc. (2008-present); Deputy General Counsel of FMR LLC; Chief Legal Officer of Fidelity Management & Research (Hong Kong) Limited (2008-present) and Assistant Secretary of Fidelity Management & Research (Japan) Inc. (2008-present), Fidelity Investments Money Management, Inc. (2008-present), Fidelity Management & Research (U.K.) Inc. (2008-present), and Fidelity Research and Analysis Company (2008-present). Previously, Mr. Goebel served as Assistant Secretary of the Funds (2007-2008) and as Vice President and Secretary of Fidelity Distributors Corporation (FDC) (2005-2007). |
William C. Coffey (41) |
| Year of Election or Appointment: 2009 Assistant Secretary of Fidelity's Equity and High Income Funds. Mr. Coffey also serves as Senior Vice President and Deputy General Counsel of FMR LLC (2010-present), and is an employee of Fidelity Investments. Previously, Mr. Coffey served as Vice President and Associate General Counsel of FMR LLC (2005-2009). |
Holly C. Laurent (56) |
| Year of Election or Appointment: 2008 Anti-Money Laundering (AML) Officer of the Fidelity funds. Ms. Laurent also serves as AML Officer of The North Carolina Capital Management Trust: Cash and Term Portfolio (2008-present) and is an employee of Fidelity Investments. Previously, Ms. Laurent was Senior Vice President and Head of Legal for Fidelity Business Services India Pvt. Ltd. (2006-2008), and Senior Vice President, Deputy General Counsel and Group Head for FMR LLC (2005-2006). |
Christine Reynolds (52) |
| Year of Election or Appointment: 2008 Chief Financial Officer of the Fidelity funds. Ms. Reynolds became President of Fidelity Pricing and Cash Management Services (FPCMS) in August 2008. Ms. Reynolds served as Chief Operating Officer of FPCMS (2007-2008). Previously, Ms. Reynolds served as President, Treasurer, and Anti-Money Laundering officer of the Fidelity funds (2004-2007). |
Kenneth A. Rathgeber (63) |
| Year of Election or Appointment: 2004 Chief Compliance Officer of Fidelity's Equity and High Income Funds. Mr. Rathgeber is Chief Compliance Officer of Fidelity Management & Research (Hong Kong) Limited (2008-present), Fidelity Management & Research (Japan) Inc. (2008-present), FMR (2005-present), FMR Co., Inc. (2005-present), Fidelity Management & Research (U.K.) Inc. (2005-present), Fidelity Research & Analysis Company (2005-present), Fidelity Investments Money Management, Inc. (2005-present), Pyramis Global Advisors, LLC (2005-present), and Strategic Advisers, Inc. (2005-present). |
Jeffrey S. Christian (49) |
| Year of Election or Appointment: 2009 Deputy Treasurer of the Fidelity funds. Mr. Christian is an employee of Fidelity Investments. Previously, Mr. Christian served as Chief Financial Officer (2008-2009) of certain Fidelity funds and Senior Vice President of Fidelity Pricing and Cash Management Services (FPCMS) (2004-2009). |
Bryan A. Mehrmann (49) |
| Year of Election or Appointment: 2005 Deputy Treasurer of the Fidelity funds. Mr. Mehrmann is an employee of Fidelity Investments. |
Adrien E. Deberghes (43) |
| Year of Election or Appointment: 2008 Deputy Treasurer of Fidelity's Equity and High Income Funds. Mr. Deberghes also serves as Assistant Treasurer of other Fidelity funds (2010-present) and is an employee of Fidelity Investments (2008-present). Previously, Mr. Deberghes served as Senior Vice President of Mutual Fund Administration at State Street Corporation (2007-2008), Senior Director of Mutual Fund Administration at Investors Bank & Trust (2005-2007), and Director of Finance for Dunkin' Brands (2000-2005). |
Stephanie J. Dorsey (41) |
| Year of Election or Appointment: 2010 Assistant Treasurer of Fidelity's Equity and High Income Funds. Ms. Dorsey also serves as Deputy Treasurer of other Fidelity funds (2008-present) and is an employee of Fidelity Investments (2008-present). Previously, Ms. Dorsey served as Treasurer (2004-2008) of the JPMorgan Mutual Funds and Vice President (2004-2008) of JPMorgan Chase Bank. |
John R. Hebble (52) |
| Year of Election or Appointment: 2009 Assistant Treasurer of Fidelity's Equity and High Income Funds. Mr. Hebble also serves as Treasurer and Chief Financial Officer of The North Carolina Capital Management Trust: Cash and Term Portfolio (2008-present), President and Treasurer of other Fidelity funds (2008-present) and is an employee of Fidelity Investments. |
Gary W. Ryan (52) |
| Year of Election or Appointment: 2005 Assistant Treasurer of the Fidelity funds. Mr. Ryan is an employee of Fidelity Investments. Previously, Mr. Ryan served as Vice President of Fund Reporting in Fidelity Pricing and Cash Management Services (FPCMS) (1999-2005). |
Jonathan Davis (42) |
| Year of Election or Appointment: 2010 Assistant Treasurer of the Fidelity funds. Mr. Davis is an employee of Fidelity Investments. Previously, Mr. Davis served as Vice President and Associate General Counsel of FMR LLC (2003-2010). |
Annual Report
The fund designates 100% of the dividend distributed during the fiscal year as qualifying for the dividends-received deduction for corporate shareholders.
The fund designates 100% of the dividend distributed during the fiscal year as amounts which may be taken into account as a dividend for the purposes of the maximum rate under section 1(h)(11) of the Internal Revenue Code.
The fund will notify shareholders in January 2011 of amounts for use in preparing 2010 income tax returns.
Annual Report
Board Approval of Investment Advisory Contracts and Management Fees
Fidelity Series 100 Index Fund
Each year, the Board of Trustees, including the Independent Trustees (together, the Board), votes on the renewal of the management contract and sub-advisory agreements (together, the Advisory Contracts) for the fund. The Board, assisted by the advice of fund counsel and Independent Trustees' counsel, requests and considers a broad range of information relevant to the renewal of the Advisory Contracts throughout the year.
The Board meets regularly and considers at each of its meetings factors that are relevant to its annual consideration of the renewal of the fund's Advisory Contracts, including the services and support provided to the fund and its shareholders. The Board has established various standing committees, each composed of Independent Trustees with varying backgrounds, to which the Board has assigned specific subject matter responsibilities in order to enhance effective decision-making by the Board. The Board, acting directly and through its Committees, requests and receives information concerning the annual consideration of the renewal of the fund's Advisory Contracts. The Board also meets as needed to consider matters specifically related to the Board's annual consideration of the renewal of Advisory Contracts. Members of the Board may also meet with trustees of other Fidelity funds through ad hoc joint committees to discuss certain matters relevant to the Fidelity funds.
At its July 2010 meeting, the Board of Trustees, including the Independent Trustees, unanimously determined to renew the fund's Advisory Contracts. In reaching its determination, the Board considered all factors it believed relevant, including (i) the nature, extent, and quality of the services to be provided to the fund and its shareholders (including the investment performance of the fund); (ii) the competitiveness of the fund's management fee and total expenses; (iii) the total costs of the services to be provided by and the profits to be realized by Fidelity from its relationship with the fund; (iv) the extent to which economies of scale would be realized as the fund grows; and (v) whether fee levels reflect these economies of scale, if any, for the benefit of fund shareholders.
In considering whether to renew the Advisory Contracts for the fund, the Board reached a determination, with the assistance of fund counsel and Independent Trustees' counsel and through the exercise of its business judgment, that the renewal of the Advisory Contracts is in the best interests of fund shareholders and that the compensation to be received by Fidelity under the management contract is fair and reasonable. The Board's decision to renew the Advisory Contracts was not based on any single factor noted above, but rather was based on a comprehensive consideration of all the information provided to the Board at its meetings throughout the year. The Board, in reaching its determination to renew the Advisory Contracts, is aware that shareholders in the fund have a broad range of investment choices available to them, including a wide choice among mutual funds offered by Fidelity's competitors, and that the fund's shareholders, with the opportunity to review and weigh the disclosure provided by the fund in its prospectus and other public disclosures, have chosen to invest in this fund, managed by Fidelity.
Annual Report
Board Approval of Investment Advisory Contracts and
Management Fees - continued
Nature, Extent, and Quality of Services Provided. The Board considered the staffing within the investment adviser, FMR, and the sub-advisers (together, the Investment Advisers), including the backgrounds of the fund's investment personnel and the fund's investment objective and discipline. The Independent Trustees also had discussions with senior management of Fidelity's investment operations and investment groups. The Board considered the structure of the portfolio manager compensation program and whether this structure provides appropriate incentives to act in the best interest of the fund.
Resources Dedicated to Investment Management and Support Services. The Board and the equity research subcommittee of the Board's Fund Oversight Committee reviewed the size, education, and experience of the Investment Advisers' investment staff, their use of technology, and the Investment Advisers' approach to recruiting, training, and retaining portfolio managers and other research, advisory, and management personnel.
Shareholder and Administrative Services. The Board considered (i) the nature, extent, quality, and cost of advisory, administrative, and shareholder services performed by the Investment Advisers and their affiliates under the Advisory Contracts and under separate agreements covering transfer agency, pricing and bookkeeping, and securities lending services for the fund; (ii) the nature and extent of the investment adviser's supervision of third party service providers, principally custodians and subcustodians; and (iii) the resources devoted to, and the record of compliance with, the fund's compliance policies and procedures. The Board also reviewed the allocation of fund brokerage, including allocations to brokers affiliated with the Investment Advisers.
The Board noted that the growth of fund assets over time across the complex allows Fidelity to reinvest in the development of services designed to enhance the value or convenience of the Fidelity funds as investment vehicles. These services include 24-hour access to account information and market information through phone representatives and over the Internet, and investor education materials and asset allocation tools.
Investment in a Large Fund Family. The Board considered the benefits to shareholders of investing in a Fidelity fund, including the benefits of investing in a fund that is part of a large family of funds offering a variety of investment disciplines and providing a large variety of mutual fund investor services. The Board noted that Fidelity had taken, or had made recommendations that resulted in the Fidelity funds taking, a number of actions over the previous year that benefited particular funds, including (i) dedicating additional resources to investment research and restructuring and broadening the focus of the investment research teams; (ii) bolstering the senior management team that oversees asset management; (iii) launching Class F of certain funds as a lower-fee class available to Freedom K and Freedom Index Funds; (iv) lowering the initial investment minimums and ongoing balance requirements for Real Estate High Income Fund; (v) eliminating subsequent purchase minimums for all funds and adding a waiver of the investment minimum requirement for new accounts opened with the proceeds of a systematic withdrawal plan; (vi) eliminating the withdrawal minimum and maximum limits for systematic withdrawals from Advisor funds; (vii) expanding sales load waivers on Class A shares for Destiny Planholders and expanding Institutional Class eligibility for Class O Destiny Planholders; and (viii) changing certain Class A and Class T sales charge structures to further align them with industry practices.
Annual Report
Investment Performance. The Board considered whether the fund has operated in accordance with its investment objective, as well as its record of compliance with its investment restrictions. It also reviewed the fund's absolute investment performance, as well as the fund's relative investment performance measured against a broad-based securities market index. The Board noted that FMR does not believe that a meaningful peer group exists against which to compare the fund's performance. Because the fund had been in existence less than three calendar years, the following chart considered by the Board shows, for the one-year period ended December 31, 2009, the fund's total return and the total return of a broad-based securities market index ("benchmark").
Fidelity Series 100 Index Fund
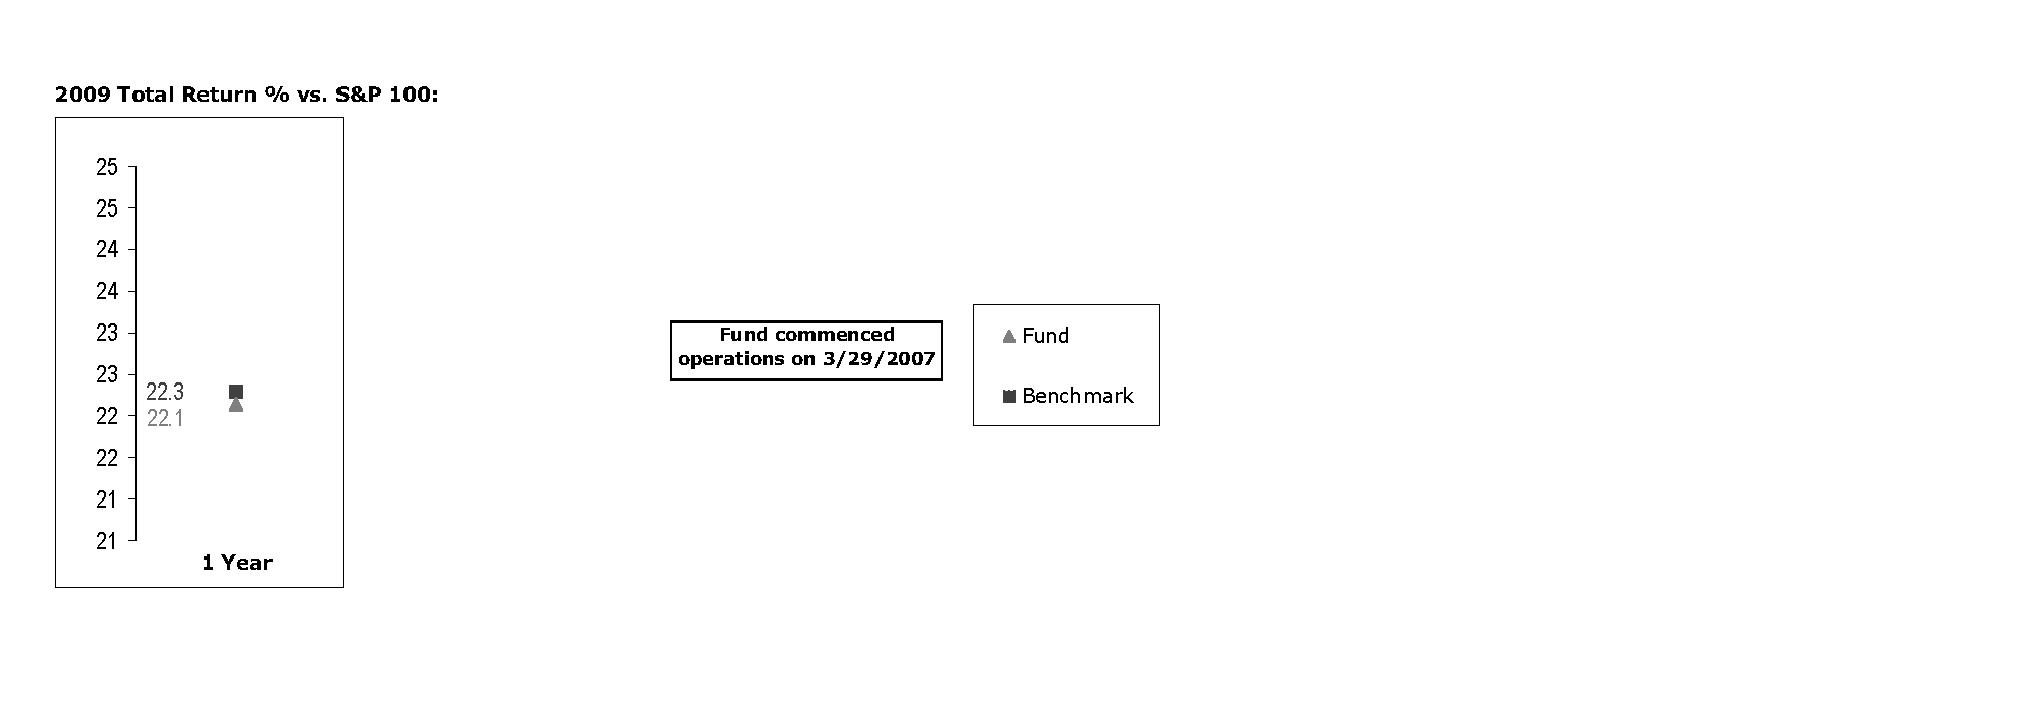
The Board noted that the investment performance of the fund was lower than its benchmark for the period shown, but considered that the performance of the fund and benchmark may vary due to valuation differences or due to fees and transaction costs, which apply to the fund but not to the benchmark. The Board also reviewed the fund's performance since inception as well as performance in the current year. The Board noted that it is difficult to evaluate in any comprehensive fashion the performance of the fund, in light of its relatively recent commencement of operations.
Annual Report
Board Approval of Investment Advisory Contracts and
Management Fees - continued
Based on its review, and giving particular weight to the nature and quality of the resources dedicated by the Investment Advisers to maintain and improve relative performance and factoring in the unprecedented market events in recent years, the Board concluded that the nature, extent, and quality of investment management and support services and of shareholder and administrative services provided to the fund will benefit the fund's shareholders, particularly in light of the Board's view that the fund's shareholders benefit from investing in a fund that is part of a large family of funds offering a variety of investment disciplines and services.
Competitiveness of Management Fee and Total Fund Expenses. The Board considered the fund's management fee and total expenses compared to "mapped groups" of competitive funds and classes. Fidelity creates "mapped groups" by combining similar Lipper investment objective categories that have comparable management fee characteristics. Combining Lipper investment objective categories aids the Board's management fee and total expense comparisons by broadening the competitive group used for comparison and by reducing the number of universes to which various Fidelity funds are compared.
Management Fee. The Board considered two proprietary management fee comparisons for the 12-month (or shorter) periods shown in the chart below. The group of Lipper funds used by the Board for management fee comparisons is referred to below as the "Total Mapped Group." The Total Mapped Group comparison focuses on a fund's standing relative to the total universe of comparable funds available to investors, in terms of gross management fees before expense reimbursements or caps. "TMG %" represents the percentage of funds in the Total Mapped Group that had management fees that were lower than the fund's. For example, a TMG % of 2% means that 98% of the funds in the Total Mapped Group had higher management fees than the fund. The "Asset-Size Peer Group" (ASPG) comparison focuses on a fund's standing relative to non-Fidelity funds similar in size to the fund within the Total Mapped Group. The ASPG represents at least 15% of the funds in the Total Mapped Group with comparable asset size and management fee characteristics, subject to a minimum of 50 funds (or all funds in the Total Mapped Group if fewer than 50). Additional information, such as the ASPG quartile in which the fund's management fee ranked, is also included in the chart and considered by the Board. For a more meaningful comparison of management fees, the fund is compared on the basis of a hypothetical "net management fee," which is derived by subtracting payments made by FMR for non-management expenses (including transfer agent fees, pricing and bookkeeping fees, and fees paid to non-affiliated custodians) from the fund's all-inclusive fee. In this regard, the Board realizes that the net management fees can vary from year to year because of differences in non-management expenses.
Annual Report
Fidelity Series 100 Index Fund
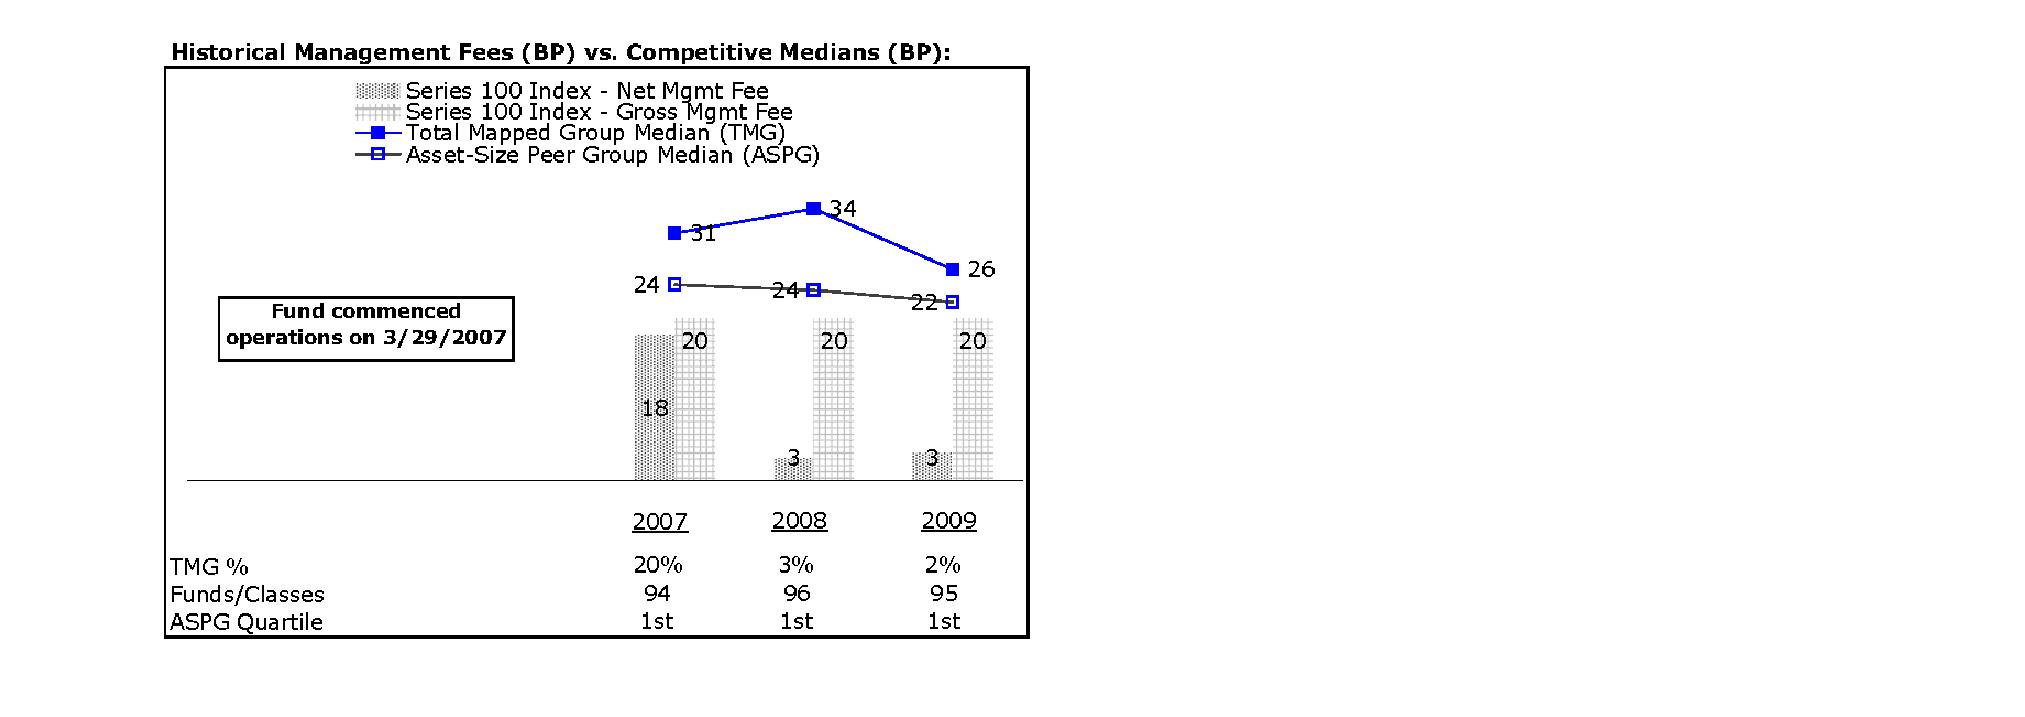
The Board noted that the fund's hypothetical net management fee ranked below the median of its Total Mapped Group and below the median of its ASPG for 2009.
Based on its review, the Board concluded that the fund's management fee is fair and reasonable in light of the services that the fund receives and the other factors considered.
Total Expenses. In its review of the fund's total expenses, the Board considered the fund's hypothetical net management fee as well as the fund's all-inclusive fee. The Board also considered other expenses, such as transfer agent fees, pricing and bookkeeping fees, and custodial, legal, and audit fees, paid by FMR under the all-inclusive arrangement. The Board also noted the effects of any waivers and reimbursements on fees and expenses. As part of its review, the Board also considered current and historical total expenses of the fund compared to competitive fund median expenses. The fund is compared to those funds and classes in the Total Mapped Group (used by the Board for management fee comparisons) that have a similar sales load structure.
The Board noted that the fund's total expenses ranked below its competitive median for 2009.
Fees Charged to Other Fidelity Clients. The Board also considered Fidelity fee structures and other information with respect to clients of FMR and its affiliates, such as other mutual funds advised or subadvised by FMR or its affiliates, pension plan clients, and other institutional clients. In March 2010, the Board created an ad hoc joint committee with the board of other Fidelity funds (the Committee) to review and compare Fidelity's institutional investment advisory business with its business of providing services to the Fidelity funds, including the differences in services provided, fees charged, and costs incurred, as well as competition in their respective marketplaces.
Annual Report
Board Approval of Investment Advisory Contracts and
Management Fees - continued
Based on its review of total expenses and fees charged to other Fidelity clients, the Board concluded that the fund's total expenses were reasonable in light of the services that the fund and its shareholders receive and the other factors considered, including the findings of the Committee.
Costs of the Services and Profitability. The Board considered the revenues earned and the expenses incurred by Fidelity in conducting the business of developing, marketing, distributing, managing, administering and servicing the fund and its shareholders. The Board also considered the level of Fidelity's profits in respect of all the Fidelity funds.
On an annual basis, FMR presents to the Board Fidelity's profitability for the fund. Fidelity calculates the profitability for each fund, as well as aggregate profitability for groups of Fidelity funds and all Fidelity funds, using a series of detailed revenue and cost allocation methodologies which originate with the audited books and records of Fidelity. The Audit Committee of the Board reviews any significant changes from the prior year's methodologies.
PricewaterhouseCoopers LLP (PwC), independent registered public accounting firm and auditor to Fidelity and certain Fidelity funds, has been engaged annually by the Board as part of the Board's assessment of Fidelity's profitability analysis. PwC's engagement includes the review and assessment of Fidelity's methodologies used in determining the revenues and expenses attributable to Fidelity's mutual fund business, and completion of agreed-upon procedures surrounding the mathematical accuracy of fund profitability and its conformity to allocation methodologies. After considering PwC's reports issued under the engagement and information provided by Fidelity, the Board believes that while other allocation methods may also be reasonable, Fidelity's profitability methodologies are reasonable in all material respects.
The Board has also reviewed Fidelity's non-fund businesses and fall-out benefits related to the mutual fund business as well as cases where Fidelity's affiliates may benefit from or be related to the fund's business.
The Board considered the costs of the services provided by and the profits realized by Fidelity in connection with the operation of the fund and were satisfied that the profitability was not excessive in the circumstances.
Economies of Scale. The Board considered whether there have been economies of scale in respect of the management of the Fidelity funds, whether the Fidelity funds (including the fund) have appropriately benefited from any such economies of scale, and whether there is potential for realization of any further economies of scale. The Board considered the extent to which the fund will benefit from economies of scale through increased services to the fund, through waivers or reimbursements, or through fee or expense reductions.
Annual Report
In February 2009, the Board and the board of other Fidelity funds created an ad hoc committee (the Economies of Scale Committee) to analyze whether FMR attains economies of scale in respect of the management and servicing of the Fidelity funds, whether the Fidelity funds have appropriately benefited from such economies of scale, and whether there is potential for realization of any further economies of scale.
The Board concluded, considering the findings of the Economies of Scale Committee, that any potential economies of scale are being appropriately shared between fund shareholders and Fidelity.
Additional Information Requested by the Board. In order to develop fully the factual basis for consideration of the Fidelity funds' Advisory Contracts, the Board requested and received additional information on certain topics, including (i) fund performance trends, actions to be taken by FMR to improve certain funds' overall performance, and Fidelity's long-term strategies for certain funds; (ii) portfolio manager changes that have occurred during the past year and length of portfolio manager tenure for different categories of funds over time; (iii) Fidelity's compensation structure for portfolio managers, research analysts, and other key personnel, the rationale for the compensation structure, and how the compensation structure provides appropriate performance incentives; (iv) the amount of the investment that each portfolio manager has made in the Fidelity fund(s) that he or she manages; (v) management and other fees paid by FMR to affiliated sub-advisers on behalf of the Fidelity funds; (vi) Fidelity's fee structures and rationale for recommending different fees among different categories of funds; (vii) Fidelity's rationale for recommending which funds should have a performance adjustment component as part of their management fees; (viii) the rationale for any differences between fund fee structures and fee structures in place for other Fidelity clients; and (ix) explanations regarding the relative total expenses borne by certain funds and classes, total expense competitive trends, and actions that might be taken by FMR to reduce total expenses for certain funds and classes.
Based on its evaluation of all of the conclusions noted above, and after considering all factors it believed relevant, the Board ultimately concluded that the advisory fee structures are fair and reasonable, and that the fund's Advisory Contracts should be renewed.
Annual Report
Investment Adviser
Fidelity Management & Research Company
Boston, MA
Investment Sub-Advisers
FMR Co., Inc.
Geode Capital Management, LLC
General Distributor
Fidelity Distributors Corporation
Boston, MA
Transfer and Service Agents
Fidelity Investments Institutional Operations Company, Inc.
Boston, MA
Fidelity Service Company, Inc.
Boston, MA
Custodian
JPMorgan Chase Bank, N.A.
New York, NY
HUN-ANN-0111
1.842443.103

Item 2. Code of Ethics
As of the end of the period, November 30, 2010, Fidelity Commonwealth Trust (the trust) has adopted a code of ethics, as defined in Item 2 of Form N-CSR, that applies to its President and Treasurer and its Chief Financial Officer. A copy of the code of ethics is filed as an exhibit to this Form N-CSR.
Item 3. Audit Committee Financial Expert
The Board of Trustees of the trust has determined that Joseph Mauriello is an audit committee financial expert, as defined in Item 3 of Form N-CSR. Mr. Mauriello is independent for purposes of Item 3 of Form N-CSR.
Item 4. Principal Accountant Fees and Services
Fees and Services
The following table presents fees billed by Deloitte & Touche LLP, the member firms of Deloitte Touche Tohmatsu, and their respective affiliates (collectively, "Deloitte Entities") in each of the last two fiscal years for services rendered to Fidelity Nasdaq Composite Index Fund and Fidelity Series 100 Index Fund (the "Funds"):
Services Billed by Deloitte Entities
November 30, 2010 FeesA
| Audit Fees | Audit-Related Fees | Tax Fees | All Other Fees |
Fidelity Nasdaq Composite Index Fund | $40,000 | $- | $5,700 | $- |
Fidelity Series 100 Index Fund | $49,000 | $- | $5,600 | $- |
November 30, 2009 FeesA
| Audit Fees | Audit-Related Fees | Tax Fees | All Other Fees |
Fidelity Nasdaq Composite Index Fund | $44,000 | $- | $5,700 | $- |
Fidelity Series 100 Index Fund | $52,000 | $- | $5,600 | $- |
A Amounts may reflect rounding.
The following table presents fees billed by PricewaterhouseCoopers LLP ("PwC") in each of the last two fiscal years for services rendered to Fidelity Nasdaq Composite Index Tracking Stock (the "Fund"):
Services Billed by PwC
November 30, 2010 FeesA
| Audit Fees | Audit-Related Fees | Tax Fees | All Other Fees |
Fidelity Nasdaq Composite Index Tracking Stock | $110,000 | $- | $4,100 | $1,900 |
November 30, 2009 FeesA
| Audit Fees | Audit-Related Fees | Tax Fees | All Other Fees |
Fidelity Nasdaq Composite Index Tracking Stock | $110,000 | $- | $4,200 | $1,500 |
A Amounts may reflect rounding.
The following table presents fees billed by PwC and Deloitte Entities that were required to be approved by the Audit Committee for services that relate directly to the operations and financial reporting of the Funds and that are rendered on behalf of Fidelity Management & Research Company ("FMR") and entities controlling, controlled by, or under common control with FMR (not including any sub-adviser whose role is primarily portfolio management and is subcontracted with or overseen by another investment adviser) that provide ongoing services to the Funds ("Fund Service Providers"):
Services Billed by Deloitte Entities
| November 30, 2010A | November 30, 2009A |
Audit-Related Fees | $650,000 | $790,000 |
Tax Fees | $- | $- |
All Other Fees | $665,000 | $515,000 |
A Amounts may reflect rounding.
Services Billed by PwC
| November 30, 2010A | November 30, 2009A |
Audit-Related Fees | $2,605,000 | $2,755,000 |
Tax Fees | $- | $- |
All Other Fees | $510,000 | $- |
A Amounts may reflect rounding.
"Audit-Related Fees" represent fees billed for assurance and related services that are reasonably related to the performance of the fund audit or the review of the fund's financial statements and that are not reported under Audit Fees.
"Tax Fees" represent fees billed for tax compliance, tax advice or tax planning that relate directly to the operations and financial reporting of the fund.
"All Other Fees" represent fees billed for services provided to the fund or Fund Service Provider, a significant portion of which are assurance related, that relate directly to the operations and financial reporting of the fund, excluding those services that are reported under Audit Fees, Audit-Related Fees or Tax Fees.
Assurance services must be performed by an independent public accountant.
* * *
The aggregate non-audit fees billed by PwC and Deloitte Entities for services rendered to the Funds, FMR (not including any sub-adviser whose role is primarily portfolio management and is subcontracted with or overseen by another investment adviser), and any Fund Service Provider for each of the last two fiscal years of the Funds are as follows:
Billed By | November 30, 2010 A | November 30, 2009 A |
PwC | $4,710,000 | $4,415,000 |
Deloitte Entities | $1,415,000 | $1,360,000 |
A Amounts may reflect rounding.
The trust's Audit Committee has considered non-audit services that were not pre-approved that were provided by PwC and Deloitte Entities to Fund Service Providers to be compatible with maintaining the independence of PwC and Deloitte Entities in their audits of the Funds, taking into account representations from PwC and Deloitte Entities, in accordance with Public Company Accounting Oversight Board rules, regarding their independence from the Funds and their related entities and FMR's review of the appropriateness and permissibility under applicable law of such non-audit services prior to their provision to the Fund Service Providers.
Audit Committee Pre-Approval Policies and Procedures
The trust's Audit Committee must pre-approve all audit and non-audit services provided by a fund's independent registered public accounting firm relating to the operations or financial reporting of the fund. Prior to the commencement of any audit or non-audit services to a fund, the Audit Committee reviews the services to determine whether they are appropriate and permissible under applicable law.
The Audit Committee has adopted policies and procedures to, among other purposes, provide a framework for the Committee's consideration of non-audit services by the audit firms that audit the Fidelity funds. The policies and procedures require that any non-audit service provided by a fund audit firm to a Fidelity fund and any non-audit service provided by a fund auditor to a Fund Service Provider that relates directly to the operations and financial reporting of a Fidelity fund ("Covered Service") are subject to approval by the Audit Committee before such service is provided.
All Covered Services must be approved in advance of provision of the service either: (i) by formal resolution of the Audit Committee, or (ii) by oral or written approval of the service by the Chair of the Audit Committee (or if the Chair is unavailable, such other member of the Audit Committee as may be designated by the Chair to act in the Chair's absence). The approval contemplated by (ii) above is permitted where the Treasurer determines that action on such an engagement is necessary before the next meeting of the Audit Committee.
Non-audit services provided by a fund audit firm to a Fund Service Provider that do not relate directly to the operations and financial reporting of a Fidelity fund are reported to the Audit Committee on a periodic basis.
Non-Audit Services Approved Pursuant to Rule 2-01(c)(7)(i)(C) and (ii) of Regulation S-X ("De Minimis Exception")
There were no non-audit services approved or required to be approved by the Audit Committee pursuant to the De Minimis Exception during the Funds' last two fiscal years relating to services provided to (i) the Funds or (ii) any Fund Service Provider that relate directly to the operations and financial reporting of the Funds.
Item 5. Audit Committee of Listed Registrants
Fidelity Commonwealth Trust: Fidelity Nasdaq Composite Index Tracking Stock:
The Board of Trustees of Fidelity Commonwealth Trust: Fidelity Nasdaq Composite Index Tracking Stock has established a separately-designated standing audit committee in accordance with Section 3(a)(58)(A) of the Securities Exchange Act of 1934. As of November 30, 2010, the members of the audit committee were Joseph Mauriello, Alan J. Lacy and Michael E. Wiley.
Fidelity Commonwealth Trust: Fidelity Nasdaq Composite Index Fund:
Fidelity Commonwealth Trust: Fidelity 100 Index Fund:
Not applicable.
Item 6. Investments
(a) Not applicable.
(b) Not applicable
Item 7. Disclosure of Proxy Voting Policies and Procedures for Closed-End Management Investment Companies
Not applicable.
Item 8. Portfolio Managers of Closed-End Management Investment Companies
Not applicable.
Item 9. Purchase of Equity Securities by Closed-End Management Investment Company and Affiliated Purchasers
Not applicable.
Item 10. Submission of Matters to a Vote of Security Holders
There were no material changes to the procedures by which shareholders may recommend nominees to the trust's Board of Trustees.
Item 11. Controls and Procedures
(a)(i) The President and Treasurer and the Chief Financial Officer have concluded that the trust's disclosure controls and procedures (as defined in Rule 30a-3(c) under the Investment Company Act) provide reasonable assurances that material information relating to the trust is made known to them by the appropriate persons, based on their evaluation of these controls and procedures as of a date within 90 days of the filing date of this report.
(a)(ii) There was no change in the trust's internal control over financial reporting (as defined in Rule 30a-3(d) under the Investment Company Act) that occurred during the second fiscal quarter of the period covered by this report that has materially affected, or is reasonably likely to materially affect, the trust's internal control over financial reporting.
Item 12. Exhibits
(a) | (1) | Code of Ethics pursuant to Item 2 of Form N-CSR is filed and attached hereto as EX-99.CODE ETH. |
(a) | (2) | Certification pursuant to Rule 30a-2(a) under the Investment Company Act of 1940 (17 CFR 270.30a-2(a)) is filed and attached hereto as Exhibit 99.CERT. |
(a) | (3) | Not applicable. |
(b) | | Certification pursuant to Rule 30a-2(b) under the Investment Company Act of 1940 (17 CFR 270.30a-2(b)) is furnished and attached hereto as Exhibit 99.906CERT. |
SIGNATURES
Pursuant to the requirements of the Securities Exchange Act of 1934 and the Investment Company Act of 1940, the registrant has duly caused this report to be signed on its behalf by the undersigned, thereunto duly authorized.
Fidelity Commonwealth Trust
By: | /s/Kenneth B. Robins |
| Kenneth B. Robins |
| President and Treasurer |
| |
Date: | January 27, 2011 |
Pursuant to the requirements of the Securities Exchange Act of 1934 and the Investment Company Act of 1940, this report has been signed below by the following persons on behalf of the registrant and in the capacities and on the dates indicated.
By: | /s/Kenneth B. Robins |
| Kenneth B. Robins |
| President and Treasurer |
| |
Date: | January 27, 2011 |
By: | /s/Christine Reynolds |
| Christine Reynolds |
| Chief Financial Officer |
| |
Date: | January 27, 2011 |