| | |
| UNITED STATES
SECURITIES AND EXCHANGE COMMISSION |
| | |
| CERTIFIED SHAREHOLDER REPORT OF REGISTERED
MANAGEMENT INVESTMENT COMPANIES
|
| | |
| Investment Company Act file number: | (811-02675) |
| | |
| Exact name of registrant as specified in charter: | Putnam Tax Exempt Income Fund |
| | |
| Address of principal executive offices: | One Post Office Square, Boston, Massachusetts 02109 |
| | |
| Name and address of agent for service: | Robert T. Burns, Vice President
One Post Office Square
Boston, Massachusetts 02109 |
| | |
| Copy to: | John W. Gerstmayr, Esq.
Ropes & Gray LLP
800 Boylston Street
Boston, Massachusetts 02199-3600 |
| | |
| Registrant’s telephone number, including area code: | (617) 292-1000 |
| | |
| Date of fiscal year end: | September 30, 2012 |
| | |
| Date of reporting period: | October 1, 2011 — March 31, 2012 |
| | |
|
Item 1. Report to Stockholders: | |
| | |
| The following is a copy of the report transmitted to stockholders pursuant to Rule 30e-1 under the Investment Company Act of 1940: | |
Putnam
Tax Exempt
Income Fund
Semiannual report
3 | 31 | 12
| | | |
| Message from the Trustees | 1 | | |
| | |
| About the fund | 2 | | |
| | |
| Performance snapshot | 4 | | |
| | |
| Interview with your fund’s portfolio manager | 5 | | |
| | |
| Your fund’s performance | 10 | | |
| | |
| Your fund’s expenses | 12 | | |
| | |
| Terms and definitions | 14 | | |
| | |
| Other information for shareholders | 15 | | |
| | |
| Financial statements | 16 | | |
| | |
Consider these risks before investing: Capital gains, if any, are taxable for federal and, in most cases, state purposes. For some investors, investment income may be subject to the federal alternative minimum tax. Income from federally tax exempt funds may be subject to state and local taxes. Funds that invest in bonds are subject to certain risks including interest-rate risk, credit risk, and inflation risk. As interest rates rise, the prices of bonds fall. Long-term bonds are more exposed to interest-rate risk than short-term bonds and credit risk is generally greater for below-investment-grade bonds. Unlike bonds, bond funds have ongoing fees and expenses. Since the fund invests in tax-exempt bonds, which, to be treated as tax-exempt under the Internal Revenue Code, may be issued only by limited types of issuers for limited types of projects, the fund’s investments may be focused in certain market segments. Consequently, the fund may be more vulnerable to fluctuations in the values of the securities it holds than a fund that invests more broadly. The prices of bonds in the fund’s portfolio may fall or fail to rise over extended periods of time for a variety of reasons, including both general financial market conditions and factors related to a specific issuer or industry.
Message from the Trustees
Dear Fellow Shareholder:
After a quarter century of trending lower, U.S. Treasury rates have shown some upward movement on signs of an improving economy during the past few months. Greece’s successful debt restructuring and some better-than-expected economic data in the United States have helped to coax investors off the sidelines and back into the markets. While we believe the historic bull market in government debt is likely near its close, fixed-income markets today continue to offer myriad investing opportunities.
Investing in fixed-income markets, however, requires particular expertise and the capacity for deep security-level research. We believe Putnam’s veteran fixed-income team is well suited to that task, and offers a long-term track record of uncovering attractive opportunities across all sectors of the bond markets.
In other news, please join us in welcoming the return of Elizabeth T. Kennan to the Board of Trustees. Dr. Kennan, who served as a Trustee from 1992 until 2010, has rejoined the Board, effective January 1, 2012. Dr. Kennan is a Partner of Cambus-Kenneth Farm (thoroughbred horse breeding and general farming), and is also President Emeritus of Mount Holyoke College.
We would also like to take this opportunity to welcome new shareholders to the fund and to thank all of our investors for your continued confidence in Putnam.

About the fund
Potential for income exempt from federal income tax
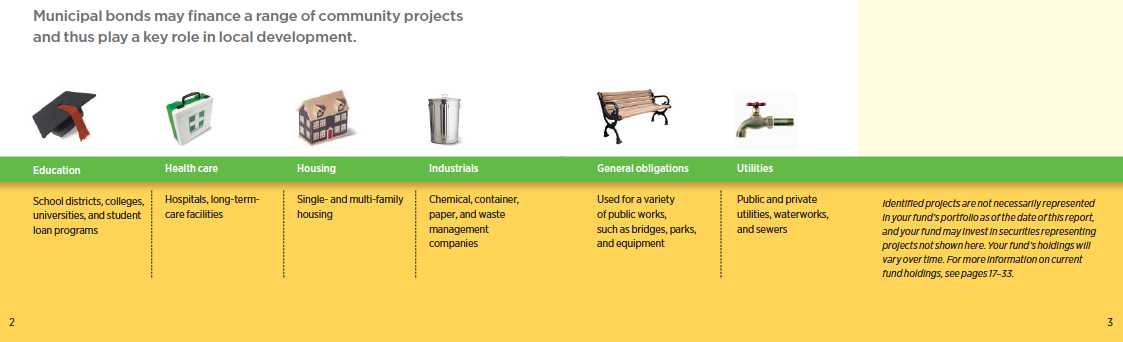
Municipal bonds finance important public projects, such as schools, roads, and hospitals, and they can help investors keep more of the income they receive from their investment. Putnam Tax Exempt Income Fund offers an additional advantage — the flexibility to invest in municipal bonds issued by any state in the country.
The income from a municipal bond is generally exempt from federal income tax. The bonds are backed by either the issuing city, town, or other government entity or by revenues collected from usage fees. The fund’s portfolio managers can select bonds from a variety of state and local governments. Because a state’s fiscal health can affect the prices of its bonds, this flexibility is a distinct advantage. The fund also combines two types of bonds to increase income potential. In addition to investing in high-quality bonds, the managers allocate a smaller portion of the portfolio to lower-rated bonds, which may offer higher income in return for more risk.
The portfolio managers are backed by the resources of Putnam’s fixed-income organization, in which municipal bond analysts are grouped into sector teams and conduct ongoing, rigorous research. Once a bond has been purchased, the fund’s managers continue to monitor developments that affect the bond market, the sector, and the issuer of the bond.
The goal of this in-depth research and active management is to stay a step ahead of the industry and pinpoint opportunities for investors.
Understanding tax-equivalent yield
To understand the value of tax-free income, it is helpful to compare a municipal bond’s yield with the “tax-equivalent yield” — the before-tax yield that must be offered by a taxable bond in order to equal the municipal bond’s yield after taxes.
How to calculate tax-equivalent yield: The tax-equivalent yield equals the municipal bond’s yield divided by “one minus the tax rate.” For example, if a municipal bond’s yield is 5%, then its tax-equivalent yield is 7.7%, assuming the maximum 35% federal tax rate for 2012.
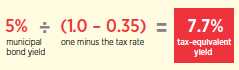
Results for investors subject to lower tax rates would not be as advantageous.
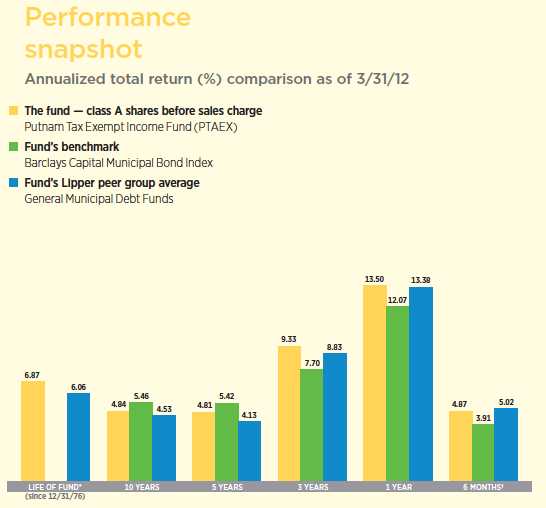
Current performance may be lower or higher than the quoted past performance, which cannot guarantee future results. Share price, principal value, and return will fluctuate, and you may have a gain or a loss when you sell your shares. Performance of class A shares assumes reinvestment of distributions and does not account for taxes. Fund returns in the bar chart do not reflect a sales charge of 4.00%; had they, returns would have been lower. See pages 5 and 10–12 for additional performance information. For a portion of the periods, the fund had expense limitations, without which returns would have been lower. To obtain the most recent month-end performance, visit putnam.com.
* The fund’s benchmark, Barclays Capital Municipal Bond Index, was introduced on 12/31/79, which post-dates the inception of the fund’s class A shares.
† Returns for the six-month period are not annualized, but cumulative.
4
Interview with your fund’s portfolio manager

How would you describe the environment in the municipal bond market during the semiannual period ended March 31, 2012?
The past six months marked another solid period for municipal bonds. While this recent period was a volatile one for other asset classes, municipal bonds recorded comparatively steady gains, fueled in part by their attractive yields versus certain taxable bonds, particularly Treasuries. We continued to see a healthy demand from investors as well. In addition, January and February tend to be light issuance months on a seasonal basis, and although the issuance in the first quarter of 2012 was slightly higher than it was one year ago, the new issue rate remains below the longer-term average for this time of year. This perceived scarcity in supply has helped support municipal bond prices so far in 2012.
Against this backdrop, tax-exempt bonds posted solid returns and outpaced the broad taxable bond market, as measured by the Barclays Capital U.S. Aggregate Bond Index. Moreover, I am pleased to report that the fund outperformed its benchmark, although it slightly trailed the average return of its Lipper peer group.
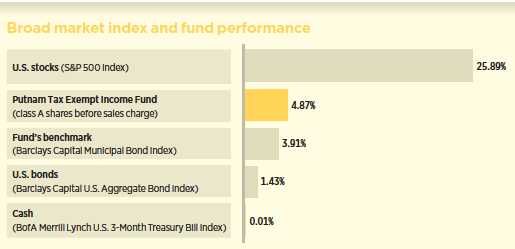
This comparison shows your fund’s performance in the context of broad market indexes for the six months ended 3/31/12. See pages 4 and 10–12 for additional fund performance information. Index descriptions can be found on pages 14–15.
5
In 2011, defaults in the municipal bond market rose markedly versus 2010, although they remained low overall. What contributed to that increase?
Since 2008, defaults in the municipal bond market have been trending lower, with the majority stemming from lower-rated or unrated securities, often in more speculative real-estate-backed sectors of the market. In the fourth quarter of 2011, however, we saw a significant uptick in the default rate, driven by three high-profile events.
The first was the bankruptcy filing of American Airlines. With about $3 billion of par-value bonds in the municipal market, that event had a significant effect on default levels. The second was a default by Jefferson County, Alabama, a county whose fiscal struggles had captured headlines for a number of years. The county’s bonds had been trading at distressed levels for some time, and their eventual default in 2011 was well anticipated by the market. The third was a subset of tobacco bonds that tapped into reserve funds to make a coupon payment during the fourth quarter. Although no payments were missed, the action technically constituted a default, and that added to the market total for 2011. Overall, the default rate remained relatively low for all of last year, finishing well below 1%. Looking ahead, we believe defaults will continue to be in line with historical averages. That said, it’s likely that certain cities or counties will continue to capture headlines in 2012, as a number of municipalities work to find their fiscal footing.
What effect have recent policy developments had on the tax-exempt bond market?
There continues to be a lot of discussion about tax reform. For example, in President Obama’s fiscal 2013 budget proposal, individuals and married couples earning more
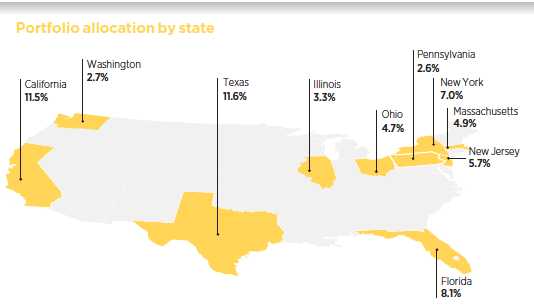
Top ten state allocations are shown as a percentage of the fund’s net assets as of 3/31/12. Investments in Puerto Rico represented 4.1% of net assets. Summary information may differ from the portfolio schedule in the financial statements due to the inclusion of accrued interest and the exclusion of as-of trades, if any. Holdings will vary over time.
6
than $200,000 and $250,000, respectively, would only be able to exclude from federal taxes 28 cents of every dollar of municipal bond income earned. Meanwhile, Republicans in general have been calling for a flatter rate on a broader tax base.

Income tax rates definitely matter to individual investors, and, at the margin, higher tax rates are generally positive for municipal bonds, as demand tends to be higher. But income tax rates are only one factor among many, including the prevailing interest-rate environment, the strength of the equity markets, and the tax picture more broadly — for example, what the potential tax deductions are in any given year.
We do believe there will be a much broader discussion on tax reform in 2013. In our view, there are a number of issues that likely will need to be addressed even before then, however, and it remains to be seen whether Congress will act on the debt ceiling, the alternative minimum tax, and the Bush-era tax cuts, which are slated to expire at the end of the year. As always, we’re monitoring the situation closely.
How did you position the portfolio during the past six months?
We sought to benefit from improving fundamentals in the municipal bond market. While we believed that the budget challenges faced by many states were significant, we were confident that conditions would improve as long as the broad economy did not stall.
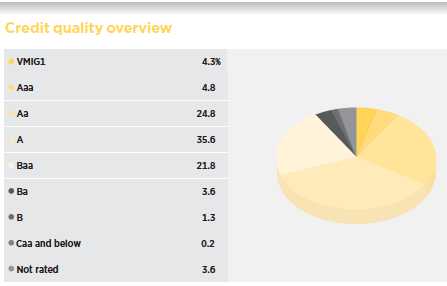
Credit qualities are shown as a percentage of portfolio market value as of 3/31/12. A bond rated Baa or higher (MIG3/VMIG3 or higher, for short-term debt) is considered investment grade. The chart reflects Moody’s ratings; percentages may include bonds or derivatives not rated by Moody’s but rated by Standard & Poor’s (S&P) or, if unrated by S&P, by Fitch, and then included in the closest equivalent Moody’s rating. Ratings will vary over time. Credit qualities are included for portfolio securities and are not included for derivative instruments and cash. The fund itself has not been rated by an independent rating agency.
7
Against this backdrop, we believed that essential service revenue bonds remained attractive, while we remained highly selective regarding the fund’s positioning in local general obligation bonds [G.O.s], which are securities issued at the city or county level. We believe that as the federal government looks to reduce transfer payments to the states — and as states, in turn, seek to close their deficits by reducing spending — these types of bonds are at risk for downgrades or other headline-driven price volatility. And unlike state general obligation bonds, local G.O.s rely more on property tax revenue than on income or sales taxes. With real-estate prices still under pressure in many markets, property taxes have been slower to recover than other tax sources.
From a credit perspective, we held an overweight position in A- and Baa-rated securities versus the fund’s benchmark. In terms of sectors, we favored higher education, utility, and health-care bonds, particularly those of larger, higher-quality hospitals and continuing-care retirement communities. Overall, this positioning generally helped the fund’s relative performance during the past six months.
What is your outlook for the months ahead?
While technical factors in the market have been positive — specifically, lighter supply and stable demand — we believe that uncertainty remains. We believe that states will continue to face financial challenges as the economy struggles to find its footing. For the most part, however, we believe that the fiscal conditions of states and municipalities are showing signs of improvement: Tax receipts are beginning to improve, albeit slowly, and we believe defaults will remain relatively low. We remain focused on the economy and Congress’s plans to reduce the deficit.
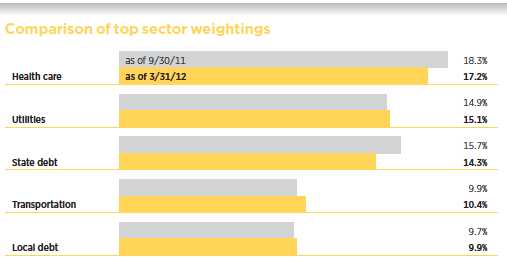
This chart shows how the fund’s top weightings have changed over the past six months. Weightings are shown as a percentage of net assets. Summary information may differ from the portfolio schedule included in the financial statements due to the inclusion of derivative securities, any interest accruals, and the exclusion of as-of trades, if any, and the use of different classifications of securities for presentation purposes. Holdings will vary over time.
8
Higher federal income tax rates, a change in the tax status of municipal bonds, and significant cuts in state funding all would have consequences for the municipal bond market in our view. But for investors with longer time horizons, we believe that our actively managed approach remains a prudent way to diversify holdings and generate tax-exempt income in the municipal bond market.
Thank you, Thalia, for your time and insights today.
The views expressed in this report are exclusively those of Putnam Management and are subject to change. They are not meant as investment advice.
Please note that the holdings discussed in this report may not have been held by the fund for the entire period. Portfolio composition is subject to review in accordance with the fund’s investment strategy and may vary in the future. Current and future portfolio holdings are subject to risk.
Portfolio Manager Thalia Meehan holds a B.A. from Williams College. A CFA charterholder, Thalia joined Putnam in 1989 and has been in the investment industry since 1983.
In addition to Thalia, your fund’s portfolio managers are Paul M. Drury, CFA, and Susan A. McCormack, CFA.
IN THE NEWS
Thirteen years after the 17-member eurozone adopted a single currency, Greece became the first member country to officially default. All three major ratings agencies — Standard & Poor’s, Moody’s Investors Service, and Fitch Ratings — have declared Greece to be in default on its sovereign debt. The majority of private holders of Greek bonds have agreed to exchange their existing bonds for new, longer-dated ones with lower interest rates and substantially lower face values. In addition to the country’s debt restructuring, sellers of credit-default swaps — a form of private insurance against default — have agreed to pay approximately $2.5 billion to settle their contracts. Both the debt restructuring and the credit-default swap settlement were completed without triggering a wave of deleveraging or a liquidity crisis within the European banking sector, thus avoiding the long-feared worst-case scenario for investors. Nonetheless, Europe’s structural imbalances likely will remain with us for some time.
9
Your fund’s performance
This section shows your fund’s performance, price, and distribution information for periods ended March 31, 2012, the end of the first half of its current fiscal year. In accordance with regulatory requirements for mutual funds, we also include expense information taken from the fund’s current prospectus. Performance should always be considered in light of a fund’s investment strategy. Data represent past performance. Past performance does not guarantee future results. More recent returns may be less or more than those shown. Investment return and principal value will fluctuate, and you may have a gain or a loss when you sell your shares. Performance information does not reflect any deduction for taxes a shareholder may owe on fund distributions or on the redemption of fund shares. For the most recent month-end performance, please visit the Individual Investors section at putnam.com or call Putnam at 1-800-225-1581. Class Y shares are not available to all investors. See the Terms and Definitions section in this report for definitions of the share classes offered by your fund.
Fund performance Total return for periods ended 3/31/12
| | | | | | | | | |
| | Class A | Class B | Class C | Class M | Class Y |
| (inception dates) | (12/31/76) | (1/4/93) | (7/26/99) | (2/16/95) | (1/2/08) |
|
| | Before | After | | | | | Before | After | Net |
| | sales | sales | Before | After | Before | After | sales | sales | asset |
| | charge | charge | CDSC | CDSC | CDSC | CDSC | charge | charge | value |
|
| Annual average | | | | | | | | | |
| (life of fund) | 6.87% | 6.75% | 6.09% | 6.09% | 6.01% | 6.01% | 6.46% | 6.36% | 6.91% |
|
| 10 years | 60.43 | 54.12 | 51.05 | 51.05 | 48.25 | 48.25 | 56.03 | 50.98 | 62.23 |
| Annual average | 4.84 | 4.42 | 4.21 | 4.21 | 4.02 | 4.02 | 4.55 | 4.21 | 4.96 |
|
| 5 years | 26.48 | 21.54 | 23.05 | 21.05 | 21.59 | 21.59 | 24.82 | 20.84 | 27.93 |
| Annual average | 4.81 | 3.98 | 4.24 | 3.89 | 3.99 | 3.99 | 4.53 | 3.86 | 5.05 |
|
| 3 years | 30.69 | 25.47 | 28.52 | 25.52 | 27.72 | 27.72 | 29.69 | 25.45 | 31.66 |
| Annual average | 9.33 | 7.86 | 8.72 | 7.87 | 8.50 | 8.50 | 9.05 | 7.85 | 9.60 |
|
| 1 year | 13.50 | 8.94 | 12.90 | 7.89 | 12.71 | 11.71 | 13.27 | 9.64 | 13.83 |
|
| 6 months | 4.87 | 0.66 | 4.66 | –0.34 | 4.46 | 3.46 | 4.84 | 1.41 | 5.09 |
|
Current performance may be lower or higher than the quoted past performance, which cannot guarantee future results. After-sales-charge returns for class A and M shares reflect the deduction of the maximum 4.00% and 3.25% sales charge, respectively, levied at the time of purchase. Class B share returns after contingent deferred sales charge (CDSC) reflect the applicable CDSC, which is 5% in the first year, declining over time to 1% in the sixth year, and is eliminated thereafter. Class C share returns after CDSC reflect a 1% CDSC for the first year that is eliminated thereafter. Class Y shares have no initial sales charge or CDSC. Performance for class B, C, M, and Y shares before their inception is derived from the historical performance of class A shares, adjusted for the applicable sales charge (or CDSC) and the higher operating expenses for such shares, except for class Y shares, for which 12b-1 fees are not applicable.
For a portion of the periods, the fund had expense limitations, without which returns would have been lower.
Class B share performance does not reflect conversion to class A shares.
10
Fund price and distribution information For the six-month period ended 3/31/12
| | | | | | | |
| Distributions | Class A | Class B | Class C | Class M | Class Y |
|
| Number | 6 | 6 | 6 | 6 | 6 |
|
| Income 1 | $0.184398 | $0.156869 | $0.150348 | $0.172080 | $0.193776 |
|
| Capital gains 2 | — | — | — | — | — |
|
| Total | $0.184398 | $0.156869 | $0.150348 | $0.172080 | $0.193776 |
|
| | Before | After | Net | Net | Before | After | Net |
| | sales | sales | asset | asset | sales | sales | asset |
| Share value | charge | charge | value | value | charge | charge | value |
|
| 9/30/11 | $8.59 | $8.95 | $8.59 | $8.61 | $8.61 | $8.90 | $8.60 |
|
| 3/31/12 | 8.82 | 9.19 | 8.83 | 8.84 | 8.85 | 9.15 | 8.84 |
|
| | Before | After | Net | Net | Before | After | Net |
| | sales | sales | asset | asset | sales | sales | asset |
| Current yield (end of period) | charge | charge | value | value | charge | charge | value |
|
| Current dividend rate 3 | 4.16% | 3.99% | 3.52% | 3.36% | 3.86% | 3.73% | 4.36% |
|
| Taxable equivalent 4 | 6.40 | 6.14 | 5.42 | 5.17 | 5.94 | 5.74 | 6.71 |
|
| Current 30-day SEC yield 5 | N/A | 2.78 | 2.26 | 2.11 | N/A | 2.52 | 3.11 |
|
| Taxable equivalent 4 | N/A | 4.28 | 3.48 | 3.25 | N/A | 3.88 | 4.78 |
|
The classification of distributions, if any, is an estimate. Before-sales-charge share value and current dividend rate for class A and M shares, if applicable, do not take into account any sales charge levied at the time of purchase. After-sales-charge share value, current dividend rate, and current 30-day SEC yield, if applicable, are calculated assuming that the maximum sales charge (4.00% for class A shares and 3.25% for class M shares) was levied at the time of purchase. Final distribution information will appear on your year-end tax forms.
1 For some investors, investment income may be subject to the federal alternative minimum tax.
2 Capital gains, if any, are taxable for federal and, in most cases, state purposes.
3 Most recent distribution, excluding capital gains, annualized and divided by share price before or after sales charge at period-end.
4 Assumes maximum 35.00% federal and state combined tax rate for 2012. Results for investors subject to lower tax rates would not be as advantageous.
5 Based only on investment income and calculated using the maximum offering price for each share class, in accordance with SEC guidelines.
11
Comparative index returns For periods ended 3/31/12
| | |
| | Barclays Capital Municipal | Lipper General Municipal Debt Funds |
| | Bond Index | category average* |
|
| Annual average (life of fund) | —† | 6.06% |
|
| 10 years | 70.18% | 56.12 |
| Annual average | 5.46 | 4.53 |
|
| 5 years | 30.20 | 22.61 |
| Annual average | 5.42 | 4.13 |
|
| 3 years | 24.93 | 29.10 |
| Annual average | 7.70 | 8.83 |
|
| 1 year | 12.07 | 13.38 |
|
| 6 months | 3.91 | 5.02 |
|
Index and Lipper results should be compared with fund performance before sales charge, before CDSC, or at net asset value.
* Over the 6-month, 1-year, 3-year, 5-year, 10-year, and life-of-fund periods ended 3/31/12, there were 254, 246, 221, 192, 166, and 9 funds, respectively, in this Lipper category.
† The fund’s benchmark, Barclays Capital Municipal Bond Index, was introduced on 12/31/79, which post-dates the inception of the fund’s class A shares.
Your fund’s expenses
As a mutual fund investor, you pay ongoing expenses, such as management fees, distribution fees (12b-1 fees), and other expenses. Using the following information, you can estimate how these expenses affect your investment and compare them with the expenses of other funds. You may also pay one-time transaction expenses, including sales charges (loads) and redemption fees, which are not shown in this section and would have resulted in higher total expenses. For more information, see your fund’s prospectus or talk to your financial representative.
Expense ratios
| | | | | |
| | Class A | Class B | Class C | Class M | Class Y |
|
| Total annual operating expenses for the fiscal year | | | | | |
| ended 9/30/11 | 0.75% | 1.38% | 1.53% | 1.03% | 0.53% |
|
| Annualized expense ratio for the six-month period | | | | | |
| ended 3/31/12 | 0.75% | 1.38% | 1.53% | 1.03% | 0.53% |
|
Fiscal-year expense information in this table is taken from the most recent prospectus, is subject to change, and may differ from that shown for the annualized expense ratio and in the financial highlights of this report. Expenses are shown as a percentage of average net assets.
12
Expenses per $1,000
The following table shows the expenses you would have paid on a $1,000 investment in the fund from October 1, 2011, to March 31, 2012. It also shows how much a $1,000 investment would be worth at the close of the period, assuming actual returns and expenses.
| | | | | |
| | Class A | Class B | Class C | Class M | Class Y |
|
| Expenses paid per $1,000*† | $3.84 | $7.06 | $7.82 | $5.27 | $2.72 |
|
| Ending value (after expenses) | $1,048.70 | $1,046.60 | $1,044.60 | $1,048.40 | $1,050.90 |
|
* Expenses for each share class are calculated using the fund’s annualized expense ratio for each class, which represents the ongoing expenses as a percentage of average net assets for the six months ended 3/31/12. The expense ratio may differ for each share class.
† Expenses are calculated by multiplying the expense ratio by the average account value for the period; then multiplying the result by the number of days in the period; and then dividing that result by the number of days in the year.
Estimate the expenses you paid
To estimate the ongoing expenses you paid for the six months ended March 31, 2012, use the following calculation method. To find the value of your investment on October 1, 2011, call Putnam at 1-800-225-1581.

Compare expenses using the SEC’s method
The Securities and Exchange Commission (SEC) has established guidelines to help investors assess fund expenses. Per these guidelines, the following table shows your fund’s expenses based on a $1,000 investment, assuming a hypothetical 5% annualized return. You can use this information to compare the ongoing expenses (but not transaction expenses or total costs) of investing in the fund with those of other funds. All mutual fund shareholder reports will provide this information to help you make this comparison. Please note that you cannot use this information to estimate your actual ending account balance and expenses paid during the period.
| | | | | |
| | Class A | Class B | Class C | Class M | Class Y |
|
| Expenses paid per $1,000*† | $3.79 | $6.96 | $7.72 | $5.20 | $2.68 |
|
| Ending value (after expenses) | $1,021.25 | $1,018.10 | $1,017.35 | $1,019.85 | $1,022.35 |
|
* Expenses for each share class are calculated using the fund’s annualized expense ratio for each class, which represents the ongoing expenses as a percentage of average net assets for the six months ended 3/31/12. The expense ratio may differ for each share class.
† Expenses are calculated by multiplying the expense ratio by the average account value for the period; then multiplying the result by the number of days in the period; and then dividing that result by the number of days in the year.
13
Terms and definitions
Important terms
Total return shows how the value of the fund’s shares changed over time, assuming you held the shares through the entire period and reinvested all distributions in the fund.
Before sales charge, or net asset value, is the price, or value, of one share of a mutual fund, without a sales charge. Before-sales-charge figures fluctuate with market conditions, and are calculated by dividing the net assets of each class of shares by the number of outstanding shares in the class.
After sales charge is the price of a mutual fund share plus the maximum sales charge levied at the time of purchase. After-sales-charge performance figures shown here assume the 4.00% maximum sales charge for class A shares and 3.25% for class M shares.
Contingent deferred sales charge (CDSC) is generally a charge applied at the time of the redemption of class B or C shares and assumes redemption at the end of the period. Your fund’s class B CDSC declines over time from a 5% maximum during the first year to 1% during the sixth year. After the sixth year, the CDSC no longer applies. The CDSC for class C shares is 1% for one year after purchase.
Share classes
Class A shares are generally subject to an initial sales charge and no CDSC (except on certain redemptions of shares bought without an initial sales charge).
Class B shares are not subject to an initial sales charge. They may be subject to a CDSC.
Class C shares are not subject to an initial sales charge and are subject to a CDSC only if the shares are redeemed during the first year.
Class M shares have a lower initial sales charge and a higher 12b-1 fee than class A shares and no CDSC.
Class Y shares are not subject to an initial sales charge or CDSC, and carry no 12b-1 fee. They are generally only available to corporate and institutional clients and clients in other approved programs.
Fixed-income terms
Current yield is the annual rate of return earned from dividends or interest of an investment. Current yield is expressed as a percentage of the price of a security, fund share, or principal investment.
Yield curve is a graph that plots the yields of bonds with equal credit quality against their differing maturity dates, ranging from shortest to longest. It is used as a benchmark for other debt, such as mortgage or bank lending rates.
Comparative indexes
Barclays Capital Municipal Bond Index is an unmanaged index of long-term fixed-rate investment-grade tax-exempt bonds.
Barclays Capital U.S. Aggregate Bond Index is an unmanaged index of U.S. investment-grade fixed-income securities.
BofA (Bank of America) Merrill Lynch U.S. 3-Month Treasury Bill Index is an unmanaged index that seeks to measure the performance of U.S. Treasury bills available in the marketplace.
S&P 500 Index is an unmanaged index of common stock performance.
Indexes assume reinvestment of all distributions and do not account for fees. Securities and performance of a fund and an index will differ. You cannot invest directly in an index.
Lipper is a third-party industry-ranking entity that ranks mutual funds. Its rankings do not reflect sales charges. Lipper rankings are based
14
on total return at net asset value relative to other funds that have similar current investment styles or objectives as determined by Lipper. Lipper may change a fund’s category assignment at its discretion. Lipper category averages reflect performance trends for funds within a category.
Other information for shareholders
Important notice regarding delivery of shareholder documents
In accordance with Securities and Exchange Commission (SEC) regulations, Putnam sends a single copy of annual and semiannual shareholder reports, prospectuses, and proxy statements to Putnam shareholders who share the same address, unless a shareholder requests otherwise. If you prefer to receive your own copy of these documents, please call Putnam at 1-800-225-1581, and Putnam will begin sending individual copies within 30 days.
Proxy voting
Putnam is committed to managing our mutual funds in the best interests of our shareholders. The Putnam funds’ proxy voting guidelines and procedures, as well as information regarding how your fund voted proxies relating to portfolio securities during the 12-month period ended June 30, 2011, are available in the Individual Investors section of putnam.com, and on the SEC’s website, www.sec.gov. If you have questions about finding forms on the SEC’s website, you may call the SEC at 1-800-SEC-0330. You may also obtain the Putnam funds’ proxy voting guidelines and procedures at no charge by calling Putnam’s Shareholder Services at 1-800-225-1581.
Fund portfolio holdings
The fund will file a complete schedule of its portfolio holdings with the SEC for the first and third quarters of each fiscal year on Form N-Q. Shareholders may obtain the fund’s Forms N-Q on the SEC’s website at www.sec.gov. In addition, the fund’s Forms N-Q may be reviewed and copied at the SEC’s Public Reference Room in Washington, D.C. You may call the SEC at 1-800-SEC-0330 for information about the SEC’s website or the operation of the Public Reference Room.
Trustee and employee fund ownership
Putnam employees and members of the Board of Trustees place their faith, confidence, and, most importantly, investment dollars in Putnam mutual funds. As of March 31, 2012, Putnam employees had approximately $353,000,000 and the Trustees had approximately $81,000,000 invested in Putnam mutual funds. These amounts include investments by the Trustees’ and employees’ immediate family members as well as investments through retirement and deferred compensation plans.
15
Financial statements
A guide to financial statements
These sections of the report, as well as the accompanying Notes, constitute the fund’s financial statements.
The fund’s portfolio lists all the fund’s investments and their values as of the last day of the reporting period. Holdings are organized by asset type and industry sector, country, or state to show areas of concentration and diversification.
Statement of assets and liabilities shows how the fund’s net assets and share price are determined. All investment and non-investment assets are added together. Any unpaid expenses and other liabilities are subtracted from this total. The result is divided by the number of shares to determine the net asset value per share, which is calculated separately for each class of shares. (For funds with preferred shares, the amount subtracted from total assets includes the liquidation preference of preferred shares.)
Statement of operations shows the fund’s net investment gain or loss. This is done by first adding up all the fund’s earnings — from dividends and interest income — and subtracting its operating expenses to determine net investment income (or loss). Then, any net gain or loss the fund realized on the sales of its holdings — as well as any unrealized gains or losses over the period — is added to or subtracted from the net investment result to determine the fund’s net gain or loss for the fiscal period.
Statement of changes in net assets shows how the fund’s net assets were affected by the fund’s net investment gain or loss, by distributions to shareholders, and by changes in the number of the fund’s shares. It lists distributions and their sources (net investment income or realized capital gains) over the current reporting period and the most recent fiscal year-end. The distributions listed here may not match the sources listed in the Statement of operations because the distributions are determined on a tax basis and may be paid in a different period from the one in which they were earned. Dividend sources are estimated at the time of declaration. Actual results may vary. Any non-taxable return of capital cannot be determined until final tax calculations are completed after the end of the fund’s fiscal year.
Financial highlights provide an overview of the fund’s investment results, per-share distributions, expense ratios, net investment income ratios, and portfolio turnover in one summary table, reflecting the five most recent reporting periods. In a semiannual report, the highlights table also includes the current reporting period.
16
The fund’s portfolio 3/31/12 (Unaudited)
| |
| Key to holding’s abbreviations | |
| AGM Assured Guaranty Municipal Corporation | G.O. Bonds General Obligation Bonds |
| AGO Assured Guaranty, Ltd. | GNMA Coll. Government National Mortgage |
| AMBAC AMBAC Indemnity Corporation | Association Collateralized |
| Cmnwlth. of PR Gtd. Commonwealth of | NATL National Public Finance Guarantee Corp. |
| Puerto Rico Guaranteed | PSFG Permanent School Fund Guaranteed |
| COP Certificates of Participation | Radian Insd. Radian Group Insured |
| FGIC Financial Guaranty Insurance Company | SGI Syncora Guarantee, Inc. |
| FHLMC Coll. Federal Home Loan Mortgage | U.S. Govt. Coll. U.S. Government Collateralized |
| Corporation Collateralized | VRDN Variable Rate Demand Notes, which are |
| FNMA Coll. Federal National Mortgage | floating-rate securities with long-term maturities, |
| Association Collateralized | that carry coupons that reset every one or seven |
| FRB Floating Rate Bonds: the rate shown is | days. The rate shown is the current interest rate at the |
| the current interest rate at the close of the | close of the reporting period. |
| reporting period | |
| | | |
| MUNICIPAL BONDS AND NOTES (98.6%)* | Rating** | Principal amount | Value |
|
| Alabama (1.0%) | | | |
| AL Hsg. Fin. Auth. Rev. Bonds (Single Fam. Mtge.), | | | |
| Ser. G, GNMA Coll., FNMA Coll., FHLMC | | | |
| Coll., 5 1/2s, 10/1/37 | Aaa | $1,125,000 | $1,157,164 |
|
| Courtland, Indl. Dev. Board Env. Impt. Rev. Bonds | | | |
| (Intl. Paper Co.), Ser. A, 5s, 11/1/13 | BBB | 1,500,000 | 1,584,780 |
|
| Cullman Cnty., Hlth. Care Auth. Rev. Bonds | | | |
| (Cullman Regl. Med. Ctr.), Ser. A, 7s, 2/1/36 | Ba1 | 5,000,000 | 5,058,650 |
|
| Selma, Indl. Dev. Board Rev. Bonds (Gulf Opportunity | | | |
| Zone Intl. Paper Co.), Ser. A, 6 1/4s, 11/1/33 | BBB | 3,500,000 | 3,877,510 |
|
| | | | 11,678,104 |
| Arizona (2.3%) | | | |
| Casa Grande, Indl. Dev. Auth. Rev. Bonds (Casa | | | |
| Grande Regl. Med. Ctr.), Ser. A, 7 5/8s, 12/1/29 | BB–/P | 3,850,000 | 3,969,004 |
|
| Cochise Cnty., Indl. Dev. Auth. Rev. Bonds (Sierra | | | |
| Vista Regl. Hlth. Ctr.), Ser. A, 6.2s, 12/1/21 | BBB+/P | 5,075,000 | 5,588,032 |
|
| Coconino Cnty., Poll. Control Rev. Bonds (Tucson | | | |
| Elec. Pwr. Co. — Navajo), Ser. A, 5 1/8s, 10/1/32 | Baa3 | 2,000,000 | 2,029,180 |
|
| Glendale, Indl. Dev. Auth. Rev. Bonds (Midwestern U.), | | | |
| 5 1/8s, 5/15/40 | A– | 3,500,000 | 3,630,270 |
|
| Maricopa Cnty., Poll. Control Rev. Bonds (El Paso | | | |
| Elec. Co.), Ser. A, 7 1/4s, 2/1/40 | Baa2 | 3,300,000 | 3,876,642 |
|
| Mesa, St. & Hwy. Rev. Bonds | | | |
| 5s, 7/1/22 ∆ | AA | 2,000,000 | 2,377,580 |
| 5s, 7/1/21 ∆ | AA | 1,500,000 | 1,784,505 |
|
| Mesa, Util. Syst. Rev. Bonds, FGIC, NATL, | | | |
| 7 1/4s, 7/1/12 | AA– | 3,635,000 | 3,696,250 |
|
| Yavapai Cnty., Indl. Dev. Auth. Hosp. Fac. Rev. Bonds | | | |
| (Yavapai Regl. Med. Ctr.), Ser. A, 6s, 8/1/33 | Baa2 | 500,000 | 505,910 |
|
| | | | 27,457,373 |
17
| | | |
| MUNICIPAL BONDS AND NOTES (98.6%)* cont. | Rating** | Principal amount | Value |
|
| Arkansas (0.1%) | | | |
| Rogers, Rev. Bonds (Sales and Use Tax), | | | |
| 3 3/4s, 11/1/34 | AA | $1,000,000 | $1,026,730 |
|
| | | | 1,026,730 |
| California (11.3%) | | | |
| Bay Area Toll Auth. of CA Rev. Bonds (San Francisco | | | |
| Bay Area), Ser. F-1, 5s, 4/1/39 | AA | 5,000,000 | 5,371,450 |
|
| CA Edl. Fac. Auth. Rev. Bonds | | | |
| (U. of The Pacific), 5s, 11/1/36 | A2 | 2,000,000 | 2,058,560 |
| (U. of La Verne), Ser. A, 5s, 6/1/35 | Baa2 | 2,000,000 | 2,000,440 |
| (Scripps College), 5s, 8/1/31 | A1 | 500,000 | 500,030 |
| (Pacific U.), Ser. A, 5s, 11/1/30 | A2 | 750,000 | 813,503 |
| (Lutheran U.), Ser. C, 5s, 10/1/24 | Baa1 | 1,215,000 | 1,244,124 |
|
| CA Hsg. Fin. Agcy. Rev. Bonds (Home Mtge.), Ser. K, | | | |
| 4 3/4s, 8/1/36 | A | 5,750,000 | 4,950,808 |
|
| CA Infrastructure & Econ. Dev. Bank Rev. Bonds | | | |
| (Science Ctr. Phase II), Ser. B, FGIC, NATL, 5s, 5/1/23 | BBB | 640,000 | 659,456 |
|
| CA Muni. Fin. Auth. COP (Cmnty. Hosp. Central CA), | | | |
| 5 1/4s, 2/1/37 | Baa2 | 2,600,000 | 2,614,092 |
|
| CA Muni. Fin. Auth. Rev. Bonds (Biola U.), | | | |
| 5 7/8s, 10/1/34 | Baa1 | 1,500,000 | 1,605,645 |
|
| CA Poll. Control Fin. Auth. VRDN (Pacific Gas & | | | |
| Electric Corp.), Ser. E, 0.2s, 11/1/26 | VMIG1 | 1,400,000 | 1,400,000 |
|
| CA State G.O. Bonds | | | |
| 6 1/2s, 4/1/33 | A1 | 10,000,000 | 12,108,500 |
| 5 3/4s, 4/1/31 | A1 | 15,000,000 | 17,017,350 |
| 5 1/2s, 3/1/40 | A1 | 10,300,000 | 11,279,736 |
| 5 1/4s, 2/1/29 | A1 | 2,000,000 | 2,221,960 |
| FGIC, NATL, 5s, 6/1/26 | A1 | 5,000,000 | 5,474,400 |
|
| CA State Dept. of Wtr. Resources Rev. Bonds | | | |
| (Central Valley), Ser. AE, 5s, 12/1/29 | AAA | 5,000,000 | 5,612,050 |
|
| CA State Pub. Wks. Board Rev. Bonds | | | |
| Ser. I-1, 6 5/8s, 11/1/34 | A2 | 10,000,000 | 11,385,200 |
| Ser. I-1, 6 1/8s, 11/1/29 | A2 | 2,000,000 | 2,303,520 |
| Ser. A-1, 6s, 3/1/35 | A2 | 3,100,000 | 3,428,135 |
| (Capital Projects), Ser. A, 5s, 4/1/29 | A2 | 3,605,000 | 3,748,767 |
|
| Golden State Tobacco Securitization Corp. Rev. Bonds | | | |
| (Tobacco Settlement), Ser. B, AMBAC, FHLMC Coll., | | | |
| 5s, 6/1/38 (Prerefunded 6/1/13) | Aaa | 530,000 | 558,779 |
|
| Los Angeles, Unified School Dist. G.O. Bonds, Ser. I, | | | |
| 5s, 7/1/26 | Aa2 | 5,000,000 | 5,618,650 |
|
| M-S-R Energy Auth. Rev. Bonds, Ser. A, | | | |
| 6 1/2s, 11/1/39 | A– | 2,250,000 | 2,799,180 |
|
| Port of Oakland, Rev. Bonds, Ser. L, FGIC, NATL | | | |
| 5 3/8s, 11/1/27 | A2 | 7,930,000 | 8,064,651 |
| 5 3/8s, 11/1/27 (Prerefunded 11/1/12) | A2 | 990,000 | 1,017,265 |
|
| Riverside Cnty., Asset Leasing Corp. Leasehold Rev. | | | |
| Bonds (Riverside Cnty. Hosp.), NATL, zero %, 6/1/25 | A2 | 4,000,000 | 1,877,840 |
|
| Sacramento, City Fin. Auth. Tax Alloc. Bonds, Ser. A, | | | |
| FGIC, NATL, zero %, 12/1/22 | A– | 7,500,000 | 4,353,000 |
|
18
| | | |
| MUNICIPAL BONDS AND NOTES (98.6%)* cont. | Rating** | Principal amount | Value |
|
| California cont. | | | |
| Sacramento, Muni. Util. Dist. Rev. Bonds, Ser. X, | | | |
| 5s, 8/15/28 | A1 | $1,650,000 | $1,864,368 |
|
| San Francisco City & Cnty. Arpt. Comm. Intl. Arpt. | | | |
| Rev. Bonds | | | |
| 5s, 5/1/29 | A1 | 200,000 | 223,838 |
| 5s, 5/1/28 | A1 | 1,000,000 | 1,123,690 |
|
| Solano, Cmnty. College Dist. G.O. Bonds (Election | | | |
| of 2002), Ser. B, FGIC, NATL, zero %, 8/1/26 | Aa3 | 9,560,000 | 4,679,333 |
|
| Turlock, Irrigation Dist. Rev. Bonds, Ser. A, 5s, 1/1/40 | A+ | 4,000,000 | 4,193,200 |
|
| | | | 134,171,520 |
| Colorado (1.3%) | | | |
| CO Hlth. Fac. Auth. Rev. Bonds | | | |
| (Valley View Assn.), 5 1/4s, 5/15/42 | BBB+ | 1,500,000 | 1,511,265 |
| (Evangelical Lutheran), 5 1/4s, 6/1/22 | A3 | 1,000,000 | 1,068,730 |
| (Evangelical Lutheran), 5s, 6/1/16 | A3 | 1,000,000 | 1,069,490 |
|
| CO Springs, Hosp. Rev. Bonds | | | |
| 6 3/8s, 12/15/30 | A3 | 2,520,000 | 2,523,956 |
| 6 1/4s, 12/15/33 | A3 | 3,000,000 | 3,342,240 |
|
| E-470 CO Pub. Hwy. Auth. Rev. Bonds, | | | |
| Ser. A, NATL, zero %, 9/1/34 | Baa2 | 13,000,000 | 3,433,950 |
| Ser. C1, NATL, 5 1/2s, 9/1/24 | Baa2 | 1,750,000 | 1,894,235 |
|
| Regl. Trans. Dist. Rev. Bonds (Denver Trans. Partners), | | | |
| 6s, 1/15/41 | Baa3 | 750,000 | 810,840 |
|
| | | | 15,654,706 |
| Connecticut (0.4%) | | | |
| CT State Dev. Auth. 1st. Mtg. Gross Rev. Hlth. Care | | | |
| Rev. Bonds (Elim Street Park Baptist, Inc.), | | | |
| 5.85s, 12/1/33 | BBB | 650,000 | 653,608 |
|
| CT State Dev. Auth. Poll. Control Rev. Bonds | | | |
| (Western MA Electric Co.), Ser. A, 5.85s, 9/1/28 | BBB+ | 3,000,000 | 3,014,370 |
|
| Hamden, Fac. Rev. Bonds (Whitney Ctr.), Ser. B, | | | |
| 6 1/8s, 1/1/14 | BB/P | 445,000 | 445,303 |
|
| | | | 4,113,281 |
| Delaware (0.9%) | | | |
| DE St. Econ. Dev. Auth. Rev. Bonds | | | |
| (Delmarva Pwr.), 5.4s, 2/1/31 | BBB+ | 1,700,000 | 1,839,485 |
| (Indian River Pwr.), 5 3/8s, 10/1/45 | Baa3 | 4,200,000 | 4,304,958 |
|
| DE State Hlth. Facs. Auth. VRDN (Christiana Care), | | | |
| Ser. A, 0.2s, 10/1/38 | VMIG1 | 3,970,000 | 3,970,000 |
|
| | | | 10,114,443 |
| District of Columbia (1.5%) | | | |
| DC G.O. Bonds, Ser. A, AGM, 5s, 6/1/26 | Aa2 | 5,005,000 | 5,333,879 |
|
| DC Rev. Bonds (Howard U.), Ser. A, 6 1/2s, 10/1/41 | A3 | 5,000,000 | 5,458,350 |
|
| DC Ballpark Rev. Bonds, Ser. B-1, FGIC, NATL, | | | |
| 5s, 2/1/25 | A3 | 1,035,000 | 1,066,495 |
|
| DC U. Rev. Bonds (Gallaudet U.) | | | |
| 5 1/2s, 4/1/41 | A+ | 2,000,000 | 2,183,640 |
| 5 1/2s, 4/1/34 | A+ | 1,000,000 | 1,107,570 |
|
| Metro. Washington, Arpt. Auth. Dulles Toll Rd. | | | |
| Rev. Bonds (Metrorail), Ser. A, zero %, 10/1/37 | Baa1 | 11,000,000 | 2,383,590 |
|
| | | | 17,533,524 |
19
| | | |
| MUNICIPAL BONDS AND NOTES (98.6%)* cont. | Rating** | Principal amount | Value |
|
| Florida (8.0%) | | | |
| Brevard Cnty., Hlth. Care Fac. Auth. Rev. Bonds | | | |
| (Health First, Inc.), 7s, 4/1/39 | A3 | $4,000,000 | $4,640,960 |
|
| Cape Coral, Wtr.& Swr. Rev. Bonds, AMBAC, | | | |
| 5s, 10/1/26 | A1 | 2,500,000 | 2,622,800 |
|
| FL Hsg. Fin. Corp. Rev. Bonds | | | |
| Ser. G, GNMA Coll., FNMA Coll., FHLMC Coll., | | | |
| 5 3/4s, 1/1/37 | Aa1 | 780,000 | 815,279 |
| (Homeowner Mtge.), Ser. 2, GNMA Coll, FNMA Coll, | | | |
| FHLMC Coll., 4.95s, 7/1/37 | Aa1 | 1,225,000 | 1,296,957 |
|
| FL State Board of Ed. G.O. Bonds (Capital Outlay | | | |
| 2011), Ser. F, 5s, 6/1/30 | AAA | 2,500,000 | 2,856,825 |
|
| FL State Muni. Pwr. Agcy. Rev. Bonds, Ser. A, | | | |
| 5s, 10/1/31 | A2 | 3,300,000 | 3,537,699 |
|
| Hernando Cnty., Rev. Bonds (Criminal Justice | | | |
| Complex Fin.), FGIC, NATL, 7.65s, 7/1/16 | BBB | 17,175,000 | 20,544,392 |
|
| Hillsborough Cnty., Cmnty. Investment Tax Rev. | | | |
| Bonds, AMBAC, 5s, 5/1/24 | Aa2 | 1,250,000 | 1,330,038 |
|
| Hillsborough Cnty., Indl. Dev. Auth. Poll. Control | | | |
| Mandatory Put Bonds (9/1/13) (Tampa Elec. Co.), | | | |
| Ser. B, 5.15s, 9/1/25 | Baa1 | 1,125,000 | 1,187,021 |
|
| Kissimmee, Util. Auth. Rev. Bonds, AGM, | | | |
| 5 1/4s, 10/1/18 | Aa3 | 2,270,000 | 2,384,749 |
|
| Lee Cnty., Rev. Bonds, SGI, 5s, 10/1/25 | Aa2 | 5,500,000 | 5,911,125 |
|
| Lee Cnty., Indl. Dev. Auth. Hlth. Care Fac. Rev. Bonds | | | |
| (Cypress Cove Hlth. Pk.), Ser. A, 6 3/8s, 10/1/25 | B/P | 1,250,000 | 1,053,275 |
|
| Leesburg, Cap. Impt. Rev. Bonds, FGIC, NATL, | | | |
| 5 1/4s, 10/1/27 | A1 | 1,600,000 | 1,672,096 |
|
| Miami Beach, Hlth. Fac. Auth. Hosp. Rev. Bonds | | | |
| (Mount Sinai Med. Ctr.), Ser. A | | | |
| 6.8s, 11/15/31 | Baa3 | 550,000 | 556,276 |
| 6.7s, 11/15/19 | Baa3 | 3,700,000 | 3,745,140 |
|
| Miami-Dade Cnty., G.O. Bonds (Parks Program), | | | |
| NATL, 5s, 11/1/25 | Aa2 | 5,000,000 | 5,336,500 |
|
| Miami-Dade Cnty., Aviation Rev. Bonds, Ser. B, | | | |
| 5s, 10/1/41 | A2 | 5,000,000 | 5,164,100 |
|
| Miami-Dade Cnty., Expressway Auth. Toll Syst. | | | |
| Rev. Bonds, Ser. B, FGIC, NATL, 5 1/4s, 7/1/26 | A | 3,000,000 | 3,149,130 |
|
| Palm Beach Cnty., Hlth. Fac. Auth. Rev. Bonds | | | |
| (Acts Retirement-Life Cmnty.), 5 1/2s, 11/15/33 | BBB+ | 5,000,000 | 5,247,900 |
|
| Palm Coast Pk. Cmnty. Dev. Dist. Special Assmt. | | | |
| Bonds, 5.7s, 5/1/37 | B–/P | 275,000 | 176,385 |
|
| Pinellas Cnty., Edl. Fac. Auth. Rev. Bonds (Barry U.), | | | |
| 5 1/4s, 10/1/30 | BBB | 1,300,000 | 1,380,821 |
|
| South Broward, Hosp. Dist. Rev. Bonds, NATL, | | | |
| 4 3/4s, 5/1/28 | Aa3 | 2,000,000 | 2,077,540 |
|
| St. Lucie Cnty., School Board COP, Ser. A, AGM, | | | |
| 5s, 7/1/23 | Aa3 | 4,300,000 | 4,466,883 |
|
20
| | | |
| MUNICIPAL BONDS AND NOTES (98.6%)* cont. | Rating** | Principal amount | Value |
|
| Florida cont. | | | |
| Sumter Cnty., School Dist. Rev. Bonds | | | |
| (Multi-Dist. Loan Program), AGM, 7.15s, 11/1/15 | | | |
| (Escrowed to maturity) | Aa3 | $4,800,000 | $5,868,240 |
|
| Sunrise, Util. Syst. Rev. Bonds, AMBAC | | | |
| 5.2s, 10/1/22 | AA– | 3,405,000 | 3,891,336 |
| U.S. Govt. Coll., 5.2s, 10/1/22 (Prerefunded | | | |
| 10/1/20) | AA– | 2,590,000 | 3,095,102 |
|
| Tolomato, Cmnty. Dev. Dist. Special Assmt. Bonds, | | | |
| 5.4s, 5/1/37 | CCC/P | 100,000 | 83,990 |
|
| Verandah, West Cmnty. Dev. Dist. Rev. Bonds (Cap. | | | |
| Impt.), Ser. A, 6 5/8s, 5/1/33 | BB/P | 850,000 | 852,465 |
|
| | | | 94,945,024 |
| Georgia (1.8%) | | | |
| Atlanta, Arpt. Rev. Bonds | | | |
| Ser. C, 5 7/8s, 1/1/24 | A1 | 1,895,000 | 2,294,864 |
| (Hartsfield-Jackson Intl. Arpt.), Ser. A, 5s, 1/1/35 | A1 | 2,000,000 | 2,133,280 |
|
| Atlanta, Wtr. & Waste Wtr. Rev. Bonds, Ser. A, | | | |
| 6 1/4s, 11/1/39 | A1 | 4,500,000 | 5,165,415 |
|
| Forsyth Cnty., Hosp. Auth. Rev. Bonds (Baptist | | | |
| Hlth. Care Syst.), U.S. Govt. Coll., 6 1/4s, | | | |
| 10/1/18 (Escrowed to maturity) | AA+ | 760,000 | 878,568 |
|
| Fulton Cnty., Dev. Auth. Rev. Bonds (GA Tech | | | |
| Athletic Assn.), Ser. A, 5s, 10/1/42 | A2 | 2,250,000 | 2,372,153 |
|
| GA State Private College & U. Auth. Rev. Bonds | | | |
| (Emory U.), Ser. B, 5s, 9/1/29 | Aa2 | 2,250,000 | 2,523,060 |
|
| Main St. Natural Gas, Inc. Rev. Bonds (GA Gas), | | | |
| Ser. A, 5 1/2s, 9/15/21 | A– | 370,000 | 405,971 |
|
| Marietta, Dev. Auth. Rev. Bonds (U. Fac. — Life | | | |
| U., Inc.), 7s, 6/15/39 | Ba3 | 3,450,000 | 3,529,350 |
|
| Richmond Cnty., Dev. Auth. Rev. Bonds (Amt.-Intl. | | | |
| Paper Co.), Ser. A, 6 1/4s, 2/1/25 | BBB | 1,950,000 | 1,968,194 |
|
| | | | 21,270,855 |
| Illinois (3.2%) | | | |
| Chicago, O’Hare Intl. Arpt. Rev. Bonds | | | |
| Ser. A, 5 3/4s, 1/1/39 | A1 | 1,650,000 | 1,866,332 |
| Ser. A, 5 5/8s, 1/1/35 | A1 | 2,000,000 | 2,262,840 |
| Ser. F, 5s, 1/1/40 | A1 | 3,700,000 | 3,826,873 |
|
| Chicago, Wtr. Rev. Bonds, AGM, 5s, 11/1/25 | Aa3 | 4,750,000 | 5,214,835 |
|
| Cook Cnty., G.O. Bonds, Ser. B, NATL, 5s, 11/15/29 | AA | 1,250,000 | 1,321,725 |
|
| IL Edl. Fac. Auth. Rev. Bonds (Northwestern U.), | | | |
| 5s, 12/1/33 | Aaa | 2,250,000 | 2,370,105 |
|
| IL Fin. Auth. Rev. Bonds | | | |
| (Rush U. Med. Ctr.), Ser. B, 7 1/4s, 11/1/38 | A2 | 2,520,000 | 3,064,043 |
| (Silver Cross Hosp. & Med. Ctr.), 7s, 8/15/44 | BBB– | 5,500,000 | 6,155,875 |
| (IL Rush U. Med Ctr.), Ser. C, 6 5/8s, 11/1/39 | A2 | 1,075,000 | 1,255,278 |
| (Roosevelt U.), 6 1/2s, 4/1/39 | Baa2 | 2,000,000 | 2,180,320 |
| (Elmhurst Memorial), Ser. A, 5 5/8s, 1/1/37 | Baa2 | 1,000,000 | 1,028,770 |
| (Newman Foundation), Radian Insd., 5s, 2/1/32 | BBB/P | 3,000,000 | 2,813,190 |
|
| IL State G.O. Bonds, 5s, 3/1/34 | A+ | 1,250,000 | 1,301,500 |
|
21
| | | |
| MUNICIPAL BONDS AND NOTES (98.6%)* cont. | Rating** | Principal amount | Value |
|
| Illinois cont. | | | |
| IL State Toll Hwy. Auth. Rev. Bonds, Ser. A-1, AGM, | | | |
| 5s, 1/1/22 | Aa3 | $1,000,000 | $1,123,120 |
|
| Railsplitter, Tobacco Settlement Auth. Rev. Bonds, | | | |
| 6s, 6/1/28 | A– | 2,150,000 | 2,422,405 |
|
| | | | 38,207,211 |
| Indiana (1.8%) | | | |
| IN Bk. Special Program Gas Rev. Bonds, Ser. A, | | | |
| 5 1/4s, 10/15/21 | Aa3 | 6,150,000 | 7,010,385 |
|
| IN Hlth. Fac. Fin. Auth. VRDN (Fayette Memorial | | | |
| Hosp. Assn.), Ser. A, 0.21s, 10/1/32 | A–1 | 1,735,000 | 1,735,000 |
|
| IN State Fin. Auth. Edl. Fac. Rev. Bonds | | | |
| (Valparaiso U.), 5s, 10/1/27 | A2 | 1,405,000 | 1,505,837 |
|
| Indianapolis, Arpt. Auth. Rev. Bonds (Federal | | | |
| Express Corp.), 5.1s, 1/15/17 | Baa1 | 4,500,000 | 5,060,655 |
|
| Jasper Cnty., Indl. Poll. Control Rev. Bonds | | | |
| AMBAC, 5.7s, 7/1/17 | Baa2 | 2,500,000 | 2,827,600 |
| NATL, 5.6s, 11/1/16 | Baa2 | 2,750,000 | 3,093,530 |
|
| | | | 21,233,007 |
| Iowa (0.3%) | | | |
| IA Fin. Auth. Rev. Bonds (Single Fam. Mtge.), Ser. D, | | | |
| GNMA Coll., FNMA Coll., 5s, 1/1/36 | Aaa | 140,000 | 144,168 |
|
| IA Fin. Auth. Hlth. Fac. Rev. Bonds (Care Initiatives), | | | |
| Ser. A, 5 1/2s, 7/1/21 | BB+ | 2,500,000 | 2,379,700 |
|
| Tobacco Settlement Auth. of IA Rev. Bonds, Ser. C, | | | |
| 5 3/8s, 6/1/38 | B+ | 750,000 | 605,363 |
|
| | | | 3,129,231 |
| Kansas (0.7%) | | | |
| KS State Dev. Fin. Auth. Rev. Bonds | | | |
| Ser. K, NATL, 5 1/4s, 11/1/26 | Aa2 | 1,355,000 | 1,500,879 |
| Ser. K, NATL, 5 1/4s, 11/1/25 | Aa2 | 1,620,000 | 1,801,408 |
| (Lifespace Cmnty’s. Inc.), Ser. S, 5s, 5/15/30 | A/F | 2,900,000 | 3,047,813 |
|
| Lenexa, Hlth. Care Fac. Rev. Bonds | | | |
| (LakeView Village, Inc.), Ser. C, 6 7/8s, 5/15/32 | | | |
| (Prerefunded 5/15/12) | AA+ | 500,000 | 508,825 |
| 5 1/2s, 5/15/39 | BB/P | 1,500,000 | 1,320,195 |
|
| | | | 8,179,120 |
| Kentucky (0.8%) | | | |
| KY Econ. Dev. Fin. Auth. Rev. Bonds (Louisville Arena), | | | |
| Ser. A-1, AGO, 6s, 12/1/42 | Aa3 | 3,500,000 | 3,761,870 |
|
| Louisville & Jefferson Cnty., Metro. Govt. Hlth. Syst. | | | |
| Rev. Bonds (Norton Hlth. Care, Inc.), 5s, 10/1/30 | A– | 4,000,000 | 4,147,960 |
|
| Louisville/Jefferson Cnty., Metro. Govt. College | | | |
| Rev. Bonds (Bellarmine U.), Ser. A, 6s, 5/1/38 | Baa3 | 855,000 | 902,948 |
|
| Owen Cnty., Wtr. Wks. Syst. Rev. Bonds (American | | | |
| Wtr. Co.), Ser. A, 6 1/4s, 6/1/39 | BBB+ | 1,000,000 | 1,088,150 |
|
| | | | 9,900,928 |
| Louisiana (0.6%) | | | |
| LA Pub. Fac. Auth. Rev. Bonds (Entergy LA LLC), | | | |
| 5s, 6/1/30 | A3 | 5,000,000 | 5,218,500 |
|
| Tobacco Settlement Fin. Corp. Rev. Bonds, Ser. 01-B, | | | |
| 5 1/2s, 5/15/30 | A | 1,885,000 | 1,895,858 |
|
| | | | 7,114,358 |
22
| | | |
| MUNICIPAL BONDS AND NOTES (98.6%)* cont. | Rating** | Principal amount | Value |
|
| Maine (—%) | | | |
| ME Hlth. & Higher Edl. Fac. Auth. Rev. Bonds, Ser. C, | | | |
| AGM, 5 3/4s, 7/1/30 | Aa3 | $50,000 | $50,316 |
|
| | | | 50,316 |
| Maryland (0.3%) | | | |
| MD Econ. Dev. Corp. Poll. Control Rev. Bonds | | | |
| (Potomac Electric Power Co.), 6.2s, 9/1/22 | A | 1,100,000 | 1,329,570 |
|
| MD State Hlth. & Higher Edl. Fac. Auth. Rev. Bonds | | | |
| (Washington Cnty. Hosp.), 6s, 1/1/43 | BBB– | 1,590,000 | 1,665,143 |
|
| | | | 2,994,713 |
| Massachusetts (4.8%) | | | |
| MA Edl. Fin. Auth. Rev. Bonds, Ser. B, 5.7s, 1/1/31 | AA | 4,665,000 | 4,976,902 |
|
| MA State Dept. Trans. Rev. Bonds (Metro Hwy. Syst.), | | | |
| Ser. B, 5s, 1/1/37 | A | 6,750,000 | 7,227,698 |
|
| MA State Dev. Fin. Agcy. Rev. Bonds | | | |
| (Sabis Intl.), Ser. A, 8s, 4/15/39 | BBB | 920,000 | 1,059,619 |
| (Berklee College of Music), 5 1/4s, 10/1/41 | A2 | 5,500,000 | 5,881,535 |
| (Wheelock College), Ser. C, 5 1/4s, 10/1/29 | BBB | 3,300,000 | 3,414,378 |
| (Suffolk U.), 5 1/8s, 7/1/40 | Baa2 | 2,000,000 | 2,102,020 |
|
| MA State Hlth. & Edl. Fac. Auth. Rev. Bonds | | | |
| (Civic Investments, Inc.), Ser. A, U.S. Govt. | | | |
| Coll., 9s, 12/15/15 (Prerefunded 12/15/12) | AAA/P | 425,000 | 457,028 |
| (Jordan Hosp.), Ser. E, 6 3/4s, 10/1/33 | BB– | 2,950,000 | 3,005,047 |
| (Berkshire Hlth. Syst.), Ser. E, 6 1/4s, 10/1/31 | BBB+ | 1,000,000 | 1,010,480 |
| (Hlth. Care Syst.-Covenant Hlth.), 6s, 7/1/31 | A | 1,065,000 | 1,079,069 |
| (Suffolk U.), Ser. A, 5 3/4s, 7/1/39 | Baa2 | 4,000,000 | 4,339,200 |
| (Baystate Med. Ctr.), Ser. I, 5 3/4s, 7/1/36 | A+ | 2,000,000 | 2,168,320 |
| (Springfield College), 5 5/8s, 10/15/40 | Baa1 | 2,550,000 | 2,652,179 |
| (Springfield College), 5 1/2s, 10/15/31 | Baa1 | 600,000 | 624,348 |
| (Milton Hosp.), Ser. D, 5 3/8s, 7/1/35 | BB– | 450,000 | 427,365 |
| (Sterling & Francine Clark), Ser. A, 5s, 7/1/36 | AA | 3,305,000 | 3,505,349 |
| (Northeastern U.), Ser. A, 5s, 10/1/35 | A2 | 4,100,000 | 4,395,774 |
|
| MA State Hsg. Fin. Agcy. Rev. Bonds, Ser. A, | | | |
| 5.1s, 12/1/30 | Aa3 | 2,500,000 | 2,586,475 |
|
| MA State Port Auth. Rev. Bonds, U.S. Govt. Coll., | | | |
| 13s, 7/1/13 (Escrowed to maturity) | AA–/P | 1,980,000 | 2,163,546 |
|
| Metro. Boston, Trans. Pkg. Corp. Rev. Bonds | | | |
| 5 1/4s, 7/1/36 | A1 | 2,000,000 | 2,178,540 |
| (Systemwide Pkg.), 5 1/4s, 7/1/33 | A1 | 2,000,000 | 2,188,200 |
|
| | | | 57,443,072 |
| Michigan (2.6%) | | | |
| Detroit, G.O. Bonds | | | |
| Ser. A-1, AMBAC, 5 1/4s, 4/1/24 | B2 | 500,000 | 439,755 |
| (Cap. Impt.), Ser. A-1, 5s, 4/1/15 | B | 3,120,000 | 2,875,236 |
|
| Detroit, Wtr. Supply Syst. Rev. Bonds, Ser. B, AGM, | | | |
| 6 1/4s, 7/1/36 | AA– | 4,040,000 | 4,587,299 |
|
| Flint, Hosp. Bldg. Auth. Rev. Bonds (Hurley Med. Ctr.), | | | |
| 7 3/8s, 7/1/35 | Ba1 | 2,500,000 | 2,724,000 |
|
| Garden City, Hosp. Fin. Auth. Rev. Bonds (Garden | | | |
| City Hosp.), Ser. A, 5 3/4s, 9/1/17 | Ba3 | 470,000 | 470,273 |
|
23
| | | |
| MUNICIPAL BONDS AND NOTES (98.6%)* cont. | Rating** | Principal amount | Value |
|
| Michigan cont. | | | |
| MI State Hosp. Fin. Auth. Rev. Bonds | | | |
| Ser. A, 6 1/8s, 6/1/39 | A1 | $2,500,000 | $2,821,075 |
| (Henry Ford Hlth. Syst.), Ser. A, 5 1/4s, 11/15/46 | A1 | 8,160,000 | 8,429,198 |
| (Chelsea Cmnty. Hosp. Oblig.), 5s, 5/15/25 | | | |
| (Prerefunded 5/15/15) | AA+ | 915,000 | 1,035,670 |
|
| MI State Strategic Fund Ltd. Mandatory Put Bonds | | | |
| (Dow Chemical) | | | |
| (6/2/14) Ser. A-1, 6 3/4s, 12/1/28 | BBB | 700,000 | 772,625 |
| (6/1/13) Ser. A-2, 5 1/2s, 12/1/28 | BBB | 3,500,000 | 3,652,635 |
|
| U. of MI VRDN (Hosp.), Ser. A, 0.2s, 12/1/37 | VMIG1 | 2,500,000 | 2,500,000 |
|
| | | | 30,307,766 |
| Minnesota (0.9%) | | | |
| Douglas Cnty., Gross Hlth. Care Fac. Rev. Bonds | | | |
| (Douglas Cnty. Hosp.), Ser. A, 6 1/4s, 7/1/38 | BBB– | 1,600,000 | 1,723,440 |
|
| Minneapolis & St. Paul, Hsg. & Redev. Auth. Hlth. Care | | | |
| VRDN (Allina Hlth. Syst.), Ser. B-1, 0.22s, 11/15/35 | VMIG1 | 600,000 | 600,000 |
|
| Minneapolis, Rev. Bonds (National Marrow Donor | | | |
| Program), 4 7/8s, 8/1/25 | BBB | 2,000,000 | 2,031,960 |
|
| MN Agricultural & Econ. Dev. Board Rev. Bonds | | | |
| (Evangelical Lutheran), 6s, 2/1/27 | A3 | 1,625,000 | 1,643,314 |
|
| MN State Hsg. Fin. Agcy. Rev. Bonds (Res. Hsg.), | | | |
| Ser. H, 4.3s, 1/1/13 | Aa1 | 475,000 | 480,634 |
|
| St. Paul, Hsg. & Redev. Auth. Hlth. Care Fac. | | | |
| Rev. Bonds (HealthPartners Oblig. Group), | | | |
| 5 1/4s, 5/15/36 | A3 | 2,155,000 | 2,210,728 |
|
| St. Paul, Hsg. & Redev. Auth. Hosp. Rev. Bonds | | | |
| (Healtheast), 6s, 11/15/35 | Ba1 | 1,250,000 | 1,270,138 |
|
| Winona, Hlth. Care Fac. Rev. Bonds (Winona Hlth. | | | |
| Oblig. Group), Ser. A, 6s, 7/1/34 | BBB– | 500,000 | 507,575 |
|
| | | | 10,467,789 |
| Mississippi (1.2%) | | | |
| MS State Bus. Fin. Comm. Poll. Control Rev. Bonds | | | |
| (Syst. Energy Resources, Inc.), 5 7/8s, 4/1/22 | BBB | 3,000,000 | 3,005,430 |
|
| MS State Bus. Fin. Comm. Gulf Opportunity Zone | | | |
| VRDN (Chevron USA, Inc.) | | | |
| Ser. A, 0.18s, 12/1/30 | VMIG1 | 1,930,000 | 1,930,000 |
| Ser. C, 0.15s, 12/1/30 | VMIG1 | 8,050,000 | 8,050,000 |
|
| MS Home Corp. Rev. Bonds, Ser. B-2, GNMA Coll., | | | |
| FNMA Coll., 6.45s, 12/1/33 | Aaa | 1,090,000 | 1,145,557 |
|
| | | | 14,130,987 |
| Missouri (1.0%) | | | |
| MO State Hlth. & Edl. Fac. Auth. Rev. Bonds | | | |
| (Washington U. (The)), Ser. A, 5 3/8s, 3/15/39 | Aaa | 2,250,000 | 2,566,665 |
| (Still U. Hlth. Sciences), 5 1/4s, 10/1/31 | A– | 1,000,000 | 1,057,420 |
|
| MO State Hlth. & Edl. Fac. Auth. VRDN | | | |
| (Washington U. (The)) | | | |
| Ser. A, 0.22s, 9/1/30 | VMIG1 | 2,200,000 | 2,200,000 |
| Ser. B, 0.22s, 9/1/30 | VMIG1 | 4,300,000 | 4,300,000 |
|
24
| | | |
| MUNICIPAL BONDS AND NOTES (98.6%)* cont. | Rating** | Principal amount | Value |
|
| Missouri cont. | | | |
| MO State Hsg. Dev. Comm. Rev. Bonds (Single | | | |
| Fam. Home Ownership Loan), Ser. A-1, GNMA Coll., | | | |
| FNMA Coll., 6 3/4s, 3/1/34 | AA+ | $125,000 | $131,536 |
|
| MS State Dev. Fin. Board Infrastructure Fac. Rev. | | | |
| Bonds (Independence, Elec. Syst. Dogwood | | | |
| Project), Ser. A, 5s, 6/1/37 | A– | 2,000,000 | 1,997,020 |
|
| | | | 12,252,641 |
| Montana (0.2%) | | | |
| MT Fac. Fin. Auth. VRDN (Sisters of Charity), Ser. A, | | | |
| 0.2s, 12/1/25 | VMIG1 | 2,760,000 | 2,760,000 |
|
| | | | 2,760,000 |
| Nebraska (0.5%) | | | |
| NE Edl. Fin. Auth. VRDN (Creighton U.), 0.2s, 7/1/35 | VMIG1 | 4,300,000 | 4,300,000 |
|
| NE Pub. Pwr. Dist. Rev. Bonds, Ser. A | | | |
| 5s, 1/1/34 | A1 | 1,000,000 | 1,108,920 |
| 5s, 1/1/33 | A1 | 1,000,000 | 1,114,120 |
|
| | | | 6,523,040 |
| Nevada (0.8%) | | | |
| Clark Cnty., Indl. Dev. Rev. Bonds (Southwest | | | |
| Gas Corp.), Ser. A, AMBAC, 5 1/4s, 7/1/34 | Baa1 | 7,570,000 | 7,634,572 |
|
| Clark Cnty., Local Impt. Dist. Special Assmt. Bonds | | | |
| (No. 142), 6.1s, 8/1/18 | BB/P | 1,605,000 | 1,660,276 |
|
| | | | 9,294,848 |
| New Hampshire (0.4%) | | | �� |
| NH Higher Edl. & Hlth. Fac. Auth. Rev. Bonds | | | |
| (Rivermead at Peterborough), 5 3/4s, 7/1/28 | BB+/P | 1,000,000 | 969,140 |
|
| NH Hlth. & Ed. Fac. Auth. VRDN (U. of NH), Ser. B, | | | |
| 0.23s, 7/1/33 | VMIG1 | 2,000,000 | 2,000,000 |
|
| NH State Bus. Fin. Auth. Rev. Bonds (Elliot Hosp. | | | |
| Oblig. Group), Ser. A, 6 1/8s, 10/1/39 | Baa1 | 2,000,000 | 2,104,700 |
|
| | | | 5,073,840 |
| New Jersey (5.7%) | | | |
| Middlesex Cnty., Impt. Auth. Lease Rev. Bonds (Perth | | | |
| Amboy Muni. Complex), FGIC, NATL, 5s, 3/15/31 | BBB+/P | 3,500,000 | 3,515,330 |
|
| NJ Econ. Dev. Auth. Rev. Bonds | | | |
| (MSU Student Hsg.), 5 7/8s, 6/1/42 | Baa3 | 3,840,000 | 4,153,382 |
| (Cigarette Tax), 5 1/2s, 6/15/24 | BBB | 9,750,000 | 9,835,215 |
| (School Fac. Construction), Ser. AA, | | | |
| 5 1/4s, 12/15/33 | A1 | 5,500,000 | 6,008,640 |
| (Motor Vehicle), Ser. A, NATL, 5s, 7/1/27 | A | 7,000,000 | 7,526,680 |
|
| NJ Econ. Dev. Auth. Wtr. Fac. Rev. Bonds | | | |
| (NJ American Wtr. Co.) | | | |
| Ser. B, 5.6s, 11/1/34 | A2 | 2,000,000 | 2,136,340 |
| Ser. D, 4 7/8s, 11/1/29 | A2 | 1,100,000 | 1,140,931 |
|
| NJ Hlth. Care Fac. Fin. Auth. Rev. Bonds | | | |
| (St. Joseph Hlth. Care Syst.), 6 5/8s, 7/1/38 | BBB– | 3,000,000 | 3,265,020 |
| (St. Peter’s U. Hosp.), 6 1/4s, 7/1/35 | Baa3 | 2,000,000 | 2,155,400 |
| (Holy Name Hosp.), 5s, 7/1/36 | Baa2 | 3,000,000 | 2,946,000 |
|
| NJ State Rev. Bonds (Trans. Syst.), Ser. C, AMBAC, | | | |
| zero %, 12/15/24 | A1 | 8,760,000 | 4,935,559 |
|
| NJ State Higher Ed. Assistance Auth. Rev. Bonds | | | |
| (Student Loan), Ser. A, 5 5/8s, 6/1/30 | AA | 2,250,000 | 2,452,118 |
|
25
| | | |
| MUNICIPAL BONDS AND NOTES (98.6%)* cont. | Rating** | Principal amount | Value |
|
| New Jersey cont. | | | |
| NJ State Tpk. Auth. Rev. Bonds, Ser. E, 5 1/4s, 1/1/40 | A+ | $3,000,000 | $3,327,900 |
|
| NJ State Trans. Trust Fund Auth. Rev. Bonds | | | |
| (Trans. Syst.), Ser. A, 6s, 6/15/35 | A1 | 3,000,000 | 3,538,710 |
|
| Tobacco Settlement Fin. Corp. Rev. Bonds | | | |
| 6 3/4s, 6/1/39 (Prerefunded 6/1/13) | Aaa | 2,000,000 | 2,150,260 |
| 6 3/8s, 6/1/32 (Prerefunded 6/1/12) | Aaa | 1,775,000 | 1,877,027 |
| 6 1/8s, 6/1/42 (Prerefunded 6/1/12) | Aaa | 1,600,000 | 1,615,072 |
|
| Union Cnty., Util. Auth. Resource Recvy. Fac. Lease | | | |
| Rev. Bonds (Covanta Union), Ser. A, 5 1/4s, 12/1/31 | AA+ | 4,750,000 | 5,080,078 |
|
| | | | 67,659,662 |
| New Mexico (0.6%) | | | |
| Farmington, Poll. Control Rev. Bonds | | | |
| (San Juan), Ser. B, 4 7/8s, 4/1/33 | Baa3 | 2,110,000 | 2,136,544 |
| (AZ Pub. Svc. Co.), Ser. B, 4.7s, 9/1/24 | Baa2 | 4,500,000 | 4,900,410 |
|
| | | | 7,036,954 |
| New York (6.9%) | | | |
| Hudson Yards, Infrastructure Corp. Rev. Bonds, | | | |
| Ser. A, 5 3/4s, 2/15/47 | A2 | 3,000,000 | 3,355,140 |
|
| Metro. Trans. Auth. Rev. Bonds, Ser. D, 5s, 11/15/36 | A2 | 2,500,000 | 2,699,875 |
|
| Metro. Trans. Auth. Dedicated Tax Rev. Bonds, Ser. A, | | | |
| 5 1/2s, 11/15/39 | AA | 2,000,000 | 2,183,660 |
|
| NY City, Indl. Dev. Agcy. Rev. Bonds (Queens | | | |
| Baseball Stadium — Pilot), AMBAC, 5s, 1/1/23 | Ba1 | 300,000 | 305,808 |
|
| NY City, Indl. Dev. Agcy. Special Arpt. Fac. Rev. | | | |
| Bonds (Airis JFK I LLC), Ser. A, 6s, 7/1/27 | BBB– | 9,910,000 | 9,753,521 |
|
| NY City, Indl. Dev. Agcy. Special Fac. Rev. Bonds | | | |
| (British Airways PLC), 5 1/4s, 12/1/32 | BB– | 200,000 | 170,770 |
|
| NY State Dorm. Auth. Rev. Bonds | | | |
| (Construction City U. Syst.), Ser. A, 6s, 7/1/20 | Aa3 | 10,900,000 | 13,469,239 |
| (City U.), Ser. A, 5 3/4s, 7/1/18 | Aa3 | 12,485,000 | 14,414,557 |
| (Winthrop-U. Hosp. Assn.), Ser. A, 5 1/2s, 7/1/32 | Baa1 | 600,000 | 607,266 |
| (Winthrop Nassau U.), 5 1/2s, 7/1/23 | Baa1 | 750,000 | 762,810 |
| (State U. Edl. Fac.), Ser. A, 5 1/2s, 5/15/19 | Aa3 | 23,100,000 | 27,414,156 |
| (Brooklyn Law School), Ser. B, SGI, 5 3/8s, 7/1/22 | Baa1 | 1,000,000 | 1,022,410 |
|
| NY State Dorm. Auth. Personal Income Tax Rev. | | | |
| Bonds (Ed.), Ser. B, 5 3/4s, 3/15/36 | AAA | 500,000 | 575,825 |
|
| Orange Cnty., Indl. Dev. Agcy. Rev. Bonds (Arden | | | |
| Hill Care Ctr. Newburgh), Ser. C, 7s, 8/1/31 | B/P | 750,000 | 685,628 |
|
| Port Auth. NY & NJ Special Oblig. Rev. | | | |
| Bonds (Kennedy Intl. Arpt. — 5th Installment), | | | |
| 6 3/4s, 10/1/19 | BB+/P | 2,200,000 | 2,163,326 |
|
| Port Auth. of NY & NJ Rev. Bonds, 5s, 7/15/30 | Aa2 | 2,250,000 | 2,599,988 |
|
| | | | 82,183,979 |
| North Carolina (1.5%) | | | |
| NC Eastern Muni. Pwr. Agcy. Syst. Rev. Bonds | | | |
| Ser. C, 6 3/4s, 1/1/24 | A– | 1,250,000 | 1,514,563 |
| AMBAC, 6s, 1/1/18 | Baa1 | 7,000,000 | 8,511,440 |
|
| NC Hsg. Fin. Agcy. FRB (Homeownership), Ser. 26-A, | | | |
| 5 1/2s, 1/1/38 | Aa2 | 440,000 | 441,914 |
|
| NC Med. Care Cmnty. Hlth. Care Fac. Rev. Bonds | | | |
| (Deerfield), Ser. A, 6s, 11/1/33 | BBB+/F | 2,345,000 | 2,458,873 |
|
26
| | | |
| MUNICIPAL BONDS AND NOTES (98.6%)* cont. | Rating** | Principal amount | Value |
|
| North Carolina cont. | | | |
| NC Med. Care Comm. Retirement Fac. Rev. Bonds | | | |
| (First Mtge.-Forest at Duke), U.S. Govt. Coll., 6 3/8s, | | | |
| 9/1/32 (Prerefunded 9/1/12) | AAA/P | $3,000,000 | $3,070,290 |
|
| NC State Muni. Pwr. Agcy. Rev. Bonds (No. 1, | | | |
| Catawba Elec.), Ser. A, 5s, 1/1/30 | A2 | 1,200,000 | 1,298,964 |
|
| | | | 17,296,044 |
| Ohio (4.6%) | | | |
| American Muni. Pwr. — Ohio, Inc. Rev. Bonds | | | |
| (Prairie State Energy Campus), Ser. A, 5s, 2/15/38 | A1 | 5,000,000 | 5,261,500 |
|
| Buckeye, Tobacco Settlement Fin. Auth. Rev. Bonds, | | | |
| Ser. A-2 | | | |
| 5 3/4s, 6/1/34 | B3 | 9,600,000 | 7,120,512 |
| 5 1/8s, 6/1/24 | B3 | 4,905,000 | 3,908,844 |
|
| Cleveland, Arpt. Syst. Rev. Bonds, Ser. A, 5s, 1/1/31 | A– | 1,200,000 | 1,256,460 |
|
| Hamilton Cnty., Swr. Syst. Rev. Rev. Bonds | | | |
| (Metro. Swr. Dist.), Ser. A, NATL, 5s, 12/1/28 | AA+ | 6,130,000 | 6,706,527 |
|
| Lorain Cnty., Hosp. Rev. Bonds (Catholic), Ser. C-2, | | | |
| AGM, 5s, 4/1/24 | Aa3 | 5,000,000 | 5,357,350 |
|
| Midview, Local School Dist. COP (Elementary School | | | |
| Bldg. Fac.), 5 1/4s, 11/1/30 | A1 | 3,500,000 | 3,630,235 |
|
| OH Hsg. Fin. Agcy. Rev. Bonds (Single Fam. Mtge.), | | | |
| Ser. 1, 5s, 11/1/28 | Aaa | 1,890,000 | 2,043,392 |
|
| OH State Higher Edl. Fac. Mandatory Put Bonds | | | |
| (7/1/15) (Kenyon College), 4.95s, 7/1/37 | A1 | 5,300,000 | 5,763,856 |
|
| OH State Higher Edl. Fac. Rev. Bonds (Case | | | |
| Western Reserve U.), Ser. B, 5 1/2s, 10/1/22 | | | |
| (Prerefunded 10/1/12) | AA– | 1,000,000 | 1,025,930 |
|
| OH State Higher Edl. Fac. Commn. Rev. Bonds | | | |
| (U. Hosp. Hlth. Syst.), Ser. 09-A, 6 3/4s, 1/15/39 | A2 | 5,000,000 | 5,426,650 |
|
| Scioto Cnty., Hosp. Rev. Bonds (Southern Med. Ctr.), | | | |
| 5 1/2s, 2/15/28 | A2 | 5,000,000 | 5,380,200 |
|
| Youngstown State U. Rev. Bonds, 5s, 12/15/25 | A1 | 2,000,000 | 2,186,340 |
|
| | | | 55,067,796 |
| Oklahoma (1.1%) | | | |
| OK Hsg. Fin. Agcy. Single Fam. Rev. Bonds | | | |
| (Homeownership Loan), Ser. B, 4.2s, 9/1/25 | Aaa | 430,000 | 427,674 |
|
| OK State Tpk. Auth. VRDN | | | |
| Ser. E, 0.2s, 1/1/28 | VMIG1 | 8,150,000 | 8,150,000 |
| Ser. F, 0.2s, 1/1/28 | VMIG1 | 4,250,000 | 4,250,000 |
|
| | | | 12,827,674 |
| Oregon (0.2%) | | | |
| OR Hlth. Sciences U. Rev. Bonds, Ser. A, | | | |
| 5 3/4s, 7/1/39 | A1 | 2,000,000 | 2,254,180 |
|
| | | | 2,254,180 |
| Pennsylvania (2.6%) | | | |
| Allegheny Cnty., Hosp. Dev. Auth. Rev. Bonds | | | |
| (UPMC Hlth.), Ser. B, NATL, 6s, 7/1/24 | Aa3 | 2,210,000 | 2,771,230 |
| (Hlth. Syst.-West PA), Ser. A, 5 3/8s, 11/15/40 | B+ | 2,650,000 | 2,173,557 |
|
| Chester Cnty., Hlth. & Ed. Fac. Auth. Rev. Bonds | | | |
| (Jenners Pond, Inc.), 7 1/4s, 7/1/24 | | | |
| (Prerefunded 7/1/12) | AAA/P | 500,000 | 518,480 |
|
27
| | | |
| MUNICIPAL BONDS AND NOTES (98.6%)* cont. | Rating** | Principal amount | Value |
|
| Pennsylvania cont. | | | |
| Cumberland Cnty., Muni. Auth. Rev. Bonds | | | |
| (Presbyterian Homes Oblig.), Ser. A | | | |
| 5 1/4s, 1/1/19 | BBB+ | $1,465,000 | $1,595,663 |
| 5.15s, 1/1/18 | BBB+ | 665,000 | 723,753 |
|
| East Stroudsburg, Area School Dist. G.O. Bonds, | | | |
| AGM, 5s, 9/1/27 | Aa3 | 5,500,000 | 5,964,200 |
|
| Erie, Higher Ed. Bldg. Auth. Rev. Bonds (Mercyhurst | | | |
| College), 5 1/2s, 3/15/38 | BBB | 1,275,000 | 1,330,412 |
|
| Franklin Cnty., Indl. Dev. Auth. Rev. Bonds | | | |
| (Chambersburg Hosp.), 5 3/8s, 7/1/42 | A2 | 1,000,000 | 1,042,830 |
|
| Geisinger, Auth. Hlth. Syst. VRDN (Geisinger | | | |
| Hlth. Syst.), Ser. C, 0.2s, 6/1/41 | A–1 | 800,000 | 800,000 |
|
| Montgomery Cnty., Indl. Dev. Auth. Wtr. Fac. Rev. | | | |
| Bonds (Aqua PA, Inc.), Ser. A, 5 1/4s, 7/1/42 | AA– | 3,250,000 | 3,393,715 |
|
| PA Rev. Bonds (Philadelphia Biosolids Fac.), | | | |
| 6 1/4s, 1/1/32 | BBB+/F | 500,000 | 550,790 |
|
| PA State Higher Edl. Fac. Auth. Rev. Bonds | | | |
| (Edinboro U. Foundation), 6s, 7/1/43 | Baa3 | 1,000,000 | 1,061,230 |
|
| Philadelphia, Arpt. Rev. Bonds, Ser. D, | | | |
| 5 1/4s, 6/15/25 | A+ | 2,750,000 | 2,982,073 |
|
| Philadelphia, Hosp. & Higher Ed. Fac. Auth. Rev. | | | |
| Bonds (Graduate Hlth. Syst.), 7 1/4s, 7/1/12 | | | |
| (In default) † | D/P | 5,415,577 | 542 |
|
| Pittsburgh G.O. Bonds, Ser. B, 5s, 9/1/25 | A1 | 2,500,000 | 2,764,900 |
|
| Pittsburgh & Allegheny Cnty., Passports & Exhib. | | | |
| Auth. Hotel Rev. Bonds, AGM, 5s, 2/1/35 | Aa3 | 3,000,000 | 3,094,590 |
|
| | | | 30,767,965 |
| Puerto Rico (4.1%) | | | |
| Cmnwlth. of PR, G.O. Bonds, Ser. A, 5 1/4s, 7/1/22 | Baa1 | 850,000 | 907,766 |
|
| Cmnwlth. of PR, Elec. Pwr. Auth. Rev. Bonds | | | |
| Ser. XX, 5 1/4s, 7/1/40 | Baa1 | 2,500,000 | 2,589,425 |
| Ser. TT, 5s, 7/1/37 | Baa1 | 5,000,000 | 5,094,200 |
| Ser. RR, FGIC, NATL, 5s, 7/1/23 | Baa1 | 4,395,000 | 4,599,280 |
|
| Cmnwlth. of PR, Govt. Dev. Bank Rev. Bonds, Ser. B, | | | |
| 5s, 12/1/13 | Baa1 | 250,000 | 262,670 |
|
| Cmnwlth. of PR, Indl. Tourist Edl. Med. & Env. Control | | | |
| Facs. Rev. Bonds (Cogen. Fac.-AES), 6 5/8s, 6/1/26 | Ba1 | 250,000 | 250,043 |
|
| Cmnwlth. of PR, Pub. Bldg. Auth. Rev. Bonds | | | |
| (Govt. Fac.) | | | |
| Ser. M, Cmnwlth. of PR Gtd., 6 1/4s, 7/1/31 | Baa1 | 1,895,000 | 2,280,348 |
| Ser. P, Cmnwlth. of PR Gtd., 6 1/8s, 7/1/23 | Baa1 | 8,000,000 | 9,026,960 |
| Ser. I, Cmnwlth. of PR Gtd., 5s, 7/1/36 | Baa1 | 2,220,000 | 2,227,770 |
|
| Cmnwlth. of PR, Sales Tax Fin. Corp. Rev. Bonds | | | |
| Ser. A, 6s, 8/1/42 | A1 | 15,000,000 | 16,796,700 |
| Ser. C, 5 1/4s, 8/1/41 | A1 | 4,500,000 | 4,789,755 |
|
| | | | 48,824,917 |
| Rhode Island (0.3%) | | | |
| RI State Hlth. & Edl. Bldg. Corp. Higher Edl. Fac. Rev. | | | |
| Bonds (Providence College), 5s, 11/1/34 | A2 | 750,000 | 821,025 |
|
| RI State Hlth. & Edl. Corp. Higher Edl. Fac. Rev. Bonds | | | |
| (Providence College), 5s, 11/1/41 | A2 | 2,000,000 | 2,156,080 |
|
| | | | 2,977,105 |
28
| | | |
| MUNICIPAL BONDS AND NOTES (98.6%)* cont. | Rating** | Principal amount | Value |
|
| South Carolina (0.6%) | | | |
| Berkeley Cnty., School Dist. Rev. Bonds (Installment | | | |
| Lease Securing Assets for Ed.), 5 1/8s, 12/1/30 | A1 | $5,000,000 | $5,308,650 |
|
| SC Hsg. Fin. & Dev. Auth. Mtge. Rev. Bonds, Ser. A-2, | | | |
| AMBAC, 5s, 7/1/35 | Aa1 | 385,000 | 395,060 |
|
| SC Jobs Econ. Dev. Auth. Hosp. Fac. Rev. Bonds | | | |
| (Palmetto Hlth.), Ser. C | | | |
| 6s, 8/1/20 (Prerefunded 8/1/13) | Baa1 | 1,115,000 | 1,196,651 |
| U.S. Govt. Coll., 6s, 8/1/20 (Prerefunded 8/1/13) | Baa1 | 135,000 | 144,886 |
|
| | | | 7,045,247 |
| South Dakota (—%) | | | |
| SD Hsg. Dev. Auth. Rev. Bonds (Home Ownership | | | |
| Mtge.), Ser. J, 4.55s, 5/1/18 | AAA | 525,000 | 547,129 |
|
| | | | 547,129 |
| Tennessee (1.4%) | | | |
| Johnson City, Hlth. & Edl. Fac. Board Hosp. Rev. Bonds | | | |
| (First Mtge. Mountain States Hlth.), Ser. A, | | | |
| NATL, 7 1/2s, 7/1/25 (Prerefunded 7/1/12) | Baa1 | 5,000,000 | 5,218,550 |
| (Mountain States Hlth. Alliance), 6s, 7/1/38 | Baa1 | 4,550,000 | 5,054,959 |
|
| Memphis-Shelby Cnty., Arpt. Auth. Rev. Bonds | | | |
| (Federal Express Corp.), 5.05s, 9/1/12 | Baa1 | 2,000,000 | 2,035,820 |
|
| TN Energy Acquisition Corp. Gas Rev. Bonds, Ser. A, | | | |
| 5 1/4s, 9/1/20 | A2 | 4,000,000 | 4,453,560 |
|
| | | | 16,762,889 |
| Texas (11.5%) | | | |
| Abilene, Hlth. Fac. Dev. Corp. Rev. Bonds | | | |
| (Sears Methodist Retirement), Ser. A | | | |
| 7s, 11/15/33 | B+/P | 715,000 | 643,965 |
| 5 7/8s, 11/15/18 | B+/P | 1,692,000 | 1,598,415 |
|
| Aldine, Indpt. School Dist. G.O. Bonds (School Bldg.), | | | |
| PSFG, 5s, 2/15/25 | Aaa | 2,000,000 | 2,247,100 |
|
| Angleton, Indpt. School Dist. G.O. Bonds | | | |
| (School Bldg.), PSFG, 5s, 2/15/30 | Aaa | 4,095,000 | 4,464,860 |
|
| Beaumont, Indpt. School Dist. G.O. Bonds (School | | | |
| Bldg.), AGO, 5 1/8s, 2/15/30 | AA– | 2,550,000 | 2,859,672 |
|
| Brazos River Harbor Naval Dist. Env. FRB (Dow | | | |
| Chemical Co.), Ser. A-4, 5.95s, 5/15/33 | BBB | 1,100,000 | 1,181,521 |
|
| Brazos, Harbor Indl. Dev. Corp. Env. Fac. Mandatory | | | |
| Put Bonds (5/1/18) (Dow Chemical), 5.9s, 5/1/38 | BBB | 3,450,000 | 3,723,102 |
|
| Dallas Cnty., Util. & Reclamation Dist. G.O. Bonds, | | | |
| Ser. B, AMBAC, 5 3/8s, 2/15/29 | A3 | 9,500,000 | 9,994,475 |
|
| Dallas, Indpt. School Dist. G.O. Bonds (School Bldg.), | | | |
| PSFG, 6s, 2/15/27 | Aaa | 3,260,000 | 3,857,167 |
|
| Houston, Arpt. Syst. Rev. Bonds, Ser. A, 5s, 7/1/25 | A | 3,500,000 | 3,830,260 |
|
| Houston, Util. Syst. Rev. Bonds, Ser. A, 5s, 11/15/33 | AA | 6,500,000 | 7,209,215 |
|
| La Vernia, Higher Ed. Fin. Corp. Rev. Bonds | | | |
| (Kipp, Inc.), Ser. A, 6 3/8s, 8/15/44 | BBB | 1,700,000 | 1,869,847 |
|
| Laredo, Intl. Toll Bridge Rev. Bonds, Ser. B, AGM, | | | |
| 5s, 10/1/16 | Aa3 | 750,000 | 833,558 |
|
| Leander, Indpt. School Dist. G.O. Bonds (School | | | |
| Bldg.), PSFG, zero %, 8/15/19 | AAA | 5,000,000 | 4,211,200 |
|
29
| | | |
| MUNICIPAL BONDS AND NOTES (98.6%)* cont. | Rating** | Principal amount | Value |
|
| Texas cont. | | | |
| Lower CO River Auth. Rev. Bonds | | | |
| Ser. A, FHLMC Coll., FNMA Coll., 7 1/4s, 5/15/37 | | | |
| (Prerefunded 5/15/15) | A/P | $1,965,000 | $2,370,222 |
| 5 3/4s, 5/15/37 | A1 | 1,200,000 | 1,303,704 |
| 5 3/4s, 5/15/28 | A1 | 2,000,000 | 2,216,960 |
|
| Mansfield, Indpt. School Dist. G.O. Bonds, PSFG, | | | |
| 5s, 2/15/27 | Aaa | 3,630,000 | 3,917,859 |
|
| Matagorda Cnty., Poll. Control Rev. Bonds (Dist. | | | |
| No. 1), Ser. A, AMBAC, 4.4s, 5/1/30 | Baa2 | 2,250,000 | 2,233,305 |
|
| Montgomery Cnty., G.O. Bonds, Ser. A, AGM, | | | |
| 5s, 3/1/21 | Aa1 | 1,750,000 | 1,980,930 |
|
| North TX, Tollway Auth. Rev. Bonds | | | |
| (Toll 2nd Tier), Ser. F, 5 3/4s, 1/1/38 | A3 | 2,750,000 | 2,945,003 |
| Ser. A, 6s, 1/1/25 | A2 | 5,200,000 | 5,990,244 |
| Ser. A, 5 5/8s, 1/1/33 | A2 | 3,000,000 | 3,249,270 |
| Ser. A, NATL, 5 1/8s, 1/1/28 | A2 | 5,000,000 | 5,351,900 |
| Ser. D, AGO, zero %, 1/1/28 | Aa3 | 11,620,000 | 5,465,002 |
|
| North TX, Tollway Auth. stepped-coupon Rev. | | | |
| Bonds, zero %, (6 1/2s, 1/1/15), 1/1/43 †† | A2 | 9,700,000 | 9,578,168 |
|
| Paris, Indpt. School Dist. G.O. Bonds (School Bldg.), | | | |
| PSFG, 5s, 2/15/25 | Aaa | 1,000,000 | 1,115,740 |
|
| Sam Rayburn, Muni. Pwr. Agcy. Rev. Bonds, | | | |
| 6s, 10/1/21 | Baa2 | 1,400,000 | 1,418,144 |
|
| San Antonio, Arpt. Syst. Rev. Bonds, AGM, | | | |
| 5 1/4s, 7/1/32 | Aa3 | 1,415,000 | 1,480,090 |
|
| Tarrant Cnty., Cultural Ed. Fac. Fin. Corp. Retirement | | | |
| Fac. Rev. Bonds (Buckner Retirement Svcs., Inc.) | | | |
| 5 1/4s, 11/15/27 | A– | 1,000,000 | 1,037,800 |
| 5 1/4s, 11/15/22 | A– | 2,500,000 | 2,651,750 |
|
| Tarrant Cnty., Hosp. Dist. Rev. Bonds, NATL, | | | |
| 5 1/2s, 8/15/19 | Aa3 | 1,870,000 | 1,892,515 |
|
| TX Muni. Gas Acquisition & Supply Corp. I Rev. Bonds, | | | |
| Ser. A, 5 1/4s, 12/15/26 | A– | 5,000,000 | 5,410,900 |
|
| TX Private Activity Surface Trans. Corp. Rev. Bonds | | | |
| (NTE Mobility), 6 7/8s, 12/31/39 | BBB–/F | 1,650,000 | 1,880,489 |
|
| TX State VRDN (Veterans Hsg. Assistance II), Ser. D, | | | |
| 0.18s, 12/1/36 | VMIG1 | 635,000 | 635,000 |
|
| TX State Affordable Hsg. Corp. Single Fam. Mtge. | | | |
| Rev. Bonds (Professional Ed. Home Loan), Ser. A-3, | | | |
| FHLMC Coll., GNMA Coll., FNMA Coll., 5.6s, 2/1/39 | Aaa | 1,289,834 | 1,363,380 |
|
| TX State Indl. Dev. Corp. Rev. Bonds (Arco | | | |
| Pipelines Co.), 7 3/8s, 10/1/20 | A2 | 4,000,000 | 5,396,120 |
|
| TX State Tpk. Auth. Rev. Bonds (Central Texas | | | |
| Tpk. Syst.), Ser. A, AMBAC, 5 1/2s, 8/15/39 | Baa1 | 1,000,000 | 1,004,000 |
|
| TX State, Trans. Comm. Rev. Bonds, 5s, 4/1/26 | Aaa | 7,585,000 | 8,547,006 |
|
| Victoria, Indpt. School Dist. G.O. Bonds (School Bldg.), | | | |
| PSFG, 5s, 2/15/24 | Aaa | 3,375,000 | 3,870,653 |
|
| Victoria, Util. Syst. Rev. Bonds, AMBAC, 5s, 12/1/27 | AA– | 3,960,000 | 4,317,509 |
|
| | | | 137,148,020 |
30
| | | |
| MUNICIPAL BONDS AND NOTES (98.6%)* cont. | Rating** | Principal amount | Value |
|
| Utah (0.7%) | | | |
| Murray City, Hosp. Rev. VRDN (IHC Hosp., Inc.), | | | |
| Ser. B, 0.2s, 5/15/37 | VMIG1 | $4,665,000 | $4,665,000 |
|
| Salt Lake City, Hosp. Rev. Bonds | | | |
| (IHC Hosp., Inc.), Ser. A, U.S. Govt. Coll., | | | |
| 8 1/8s, 5/15/15 (Escrowed to maturity) | AA+ | 1,805,000 | 1,920,989 |
| (IHC Hosp., Inc.), AMBAC, U.S. Govt. Coll., | | | |
| 6 3/4s, 5/15/20 (Escrowed to maturity) | AAA/P | 1,800,000 | 1,805,094 |
|
| | | | 8,391,083 |
| Vermont (—%) | | | |
| VT Hsg. Fin. Agcy. Rev. Bonds (Single Fam.), Ser. 23, | | | |
| AGM, 5s, 5/1/34 | Aa3 | 160,000 | 162,101 |
|
| | | | 162,101 |
| Virginia (2.6%) | | | |
| Chesterfield Cnty., Econ. Dev. Auth. Poll. Control Rev. | | | |
| Bonds (VA Elec. & Pwr.), Ser. A, 5s, 5/1/23 | A3 | 1,575,000 | 1,778,711 |
|
| Henrico Cnty., Econ. Dev. Auth. Res. Care Fac. Rev. | | | |
| Bonds (United Methodist), Ser. A, 6 1/2s, 6/1/22 | BB+/P | 4,475,000 | 4,488,515 |
|
| Henrico Cnty., Indl. Dev. Auth. Rev. Bonds, AGM, | | | |
| 5.929s, 8/23/27 | Aa3 | 15,000,000 | 17,180,400 |
|
| Washington Cnty., Indl. Dev. Auth. Hosp. Fac. Rev. | | | |
| Bonds (Mountain States Hlth. Alliance), Ser. C, | | | |
| 7 3/4s, 7/1/38 | Baa1 | 6,100,000 | 7,371,362 |
|
| | | | 30,818,988 |
| Washington (2.7%) | | | |
| Cowlitz Cnty., Pub. Util. Rev. Bonds (Dist. No. 1 | | | |
| Production Syst.), FGIC, NATL | | | |
| 5s, 9/1/25 | A1 | 695,000 | 722,446 |
| 5s, 9/1/24 | A1 | 615,000 | 641,168 |
|
| Tobacco Settlement Auth. of WA Rev. Bonds, | | | |
| 6 1/2s, 6/1/26 | A3 | 1,125,000 | 1,171,541 |
|
| WA State G.O. Bonds | | | |
| Ser. D, AGM, 5s, 1/1/28 (Prerefunded 1/1/15) | Aa1 | 8,320,000 | 9,323,558 |
| (Motor Vehicle Fuel), Ser. B, NATL, 5s, 7/1/24 | | | |
| (Prerefunded 7/1/14) | Aa1 | 5,270,000 | 5,805,432 |
|
| WA State Higher Ed. Fac. Auth. Rev. Bonds | | | |
| (Whitworth U.) | | | |
| 5 1/4s, 10/1/37 | Baa1 | 1,110,000 | 1,145,709 |
| 5s, 10/1/27 | Baa1 | 1,000,000 | 1,061,380 |
|
| WA State Hlth. Care Fac. Auth. Rev. Bonds | | | |
| (WA Hlth. Svcs.), 7s, 7/1/39 | Baa2 | 1,250,000 | 1,388,175 |
| (Catholic Hlth. Initiatives), Ser. D, 6 3/8s, 10/1/36 | Aa2 | 7,050,000 | 8,485,521 |
| Ser. B, NATL, 5s, 2/15/27 | Baa2 | 2,235,000 | 2,338,525 |
|
| WA State Hsg. Fin. Comm. Rev. Bonds (Single | | | |
| Family Program), Ser. 2A, GNMA Coll., FNMA Coll., | | | |
| 5s, 12/1/25 | Aaa | 135,000 | 137,142 |
|
| | | | 32,220,597 |
| West Virginia (0.8%) | | | |
| Econ. Dev. Auth. Lease Rev. Bonds (Correctional | | | |
| Juvenile Safety), Ser. A, NATL, 5s, 6/1/29 | Aa2 | 6,200,000 | 6,461,020 |
|
| Pleasants Cnty., Poll. Control Rev. Bonds (Allegheny), | | | |
| Ser. F, 5 1/4s, 10/15/37 | BBB | 2,500,000 | 2,580,975 |
|
| WV Econ. Dev. Auth. Solid Waste Disp. Fac. FRB | | | |
| (Appalachian Pwr. Co.), Ser. A, 5 3/8s, 12/1/38 | Baa2 | 1,000,000 | 1,052,580 |
|
| | | | 10,094,575 |
31
| | | |
| MUNICIPAL BONDS AND NOTES (98.6%)* cont. | Rating** | Principal amount | Value |
|
| Wisconsin (1.2%) | | | |
| Badger, Tobacco Settlement Asset | | | |
| Securitization Corp. Rev. Bonds U.S. Govt. Coll. | | | |
| 7s, 6/1/28 (Prerefunded 6/1/12) | Aaa | $1,000,000 | $1,010,800 |
| 6 3/8s, 6/1/32 (Prerefunded 6/1/12) | Aaa | 5,615,000 | 5,670,139 |
|
| WI State Rev. Bonds, Ser. A, 6s, 5/1/27 | Aa3 | 3,500,000 | 4,251,800 |
|
| WI State Hlth. & Edl. Fac. Auth. Rev. Bonds | | | |
| (Prohealth Care, Inc.), 6 5/8s, 2/15/39 | A1 | 3,000,000 | 3,468,420 |
|
| | | | 14,401,159 |
| Wyoming (0.8%) | | | |
| Campbell Cnty., Solid Waste Fac. Rev. Bonds (Basin | | | |
| Elec. Pwr. Co-op), Ser. A, 5 3/4s, 7/15/39 | A1 | 3,000,000 | 3,306,660 |
|
| Gillette, Poll. Control VRDN, 0.17s, 1/1/18 | P–1 | 1,400,000 | 1,400,000 |
|
| WY Muni. Pwr. Agcy. Pwr. Supply Rev. Bonds, Ser. A | | | |
| 5 1/2s, 1/1/38 | A2 | 2,800,000 | 2,998,548 |
| 5 1/2s, 1/1/33 | A2 | 1,410,000 | 1,523,447 |
|
| | | | 9,228,655 |
| | | | |
| Total municipal bonds and notes (cost $1,077,022,899) | | | $1,170,745,146 |
| |
| |
| PREFERRED STOCKS (0.6%)* | | Shares | Value |
|
| MuniMae Tax Exempt Bond Subsidiary, LLC 144A Ser. A, | | |
| 7 1/2s cum. pfd. | | 5,035,572 | $4,919,804 |
|
| MuniMae Tax Exempt Bond Subsidiary, LLC 144A Ser. B, | | | |
| 7 3/4s cum. pfd. | | 2,000,000 | 1,720,460 |
|
| Total preferred stocks (cost $7,035,572) | | | $6,640,264 |
| |
| |
| TOTAL INVESTMENTS | | | |
|
| Total investments (cost $1,084,058,471) | | | $1,177,385,410 |
Notes to the fund’s portfolio
Unless noted otherwise, the notes to the fund’s portfolio are for the close of the fund’s reporting period, which ran from October 1, 2011 through March 31, 2012 (the reporting period). Within the following notes to the portfolio, references to “ASC 820” represent Accounting Standards Codification ASC 820 Fair Value Measurements and Disclosures.
* Percentages indicated are based on net assets of $1,187,960,996.
** The Moody’s, Standard & Poor’s or Fitch ratings indicated are believed to be the most recent ratings available at the close of the reporting period for the securities listed. Ratings are generally ascribed to securities at the time of issuance. While the agencies may from time to time revise such ratings, they undertake no obligation to do so, and the ratings do not necessarily represent what the agencies would ascribe to these securities at the close of the reporting period. Securities rated by Putnam are indicated by “/P.” Securities rated by Fitch are indicated by “/F.” The rating of an insured security represents what is believed to be the most recent rating of the insurer’s claims-paying ability available at the close of the reporting period and does not reflect any subsequent changes. Security ratings are defined in the Statement of Additional Information.
† Non-income-producing security.
†† The interest rate and date shown parenthetically represent the new interest rate to be paid and the date the fund will begin accruing interest at this rate.
∆ Forward commitment, in part or in entirety (Note 1).
144A after the name of an issuer represents securities exempt from registration under Rule 144A under the Securities Act of 1933, as amended. These securities may be resold in transactions exempt from registration, normally to qualified institutional buyers.
32
The rates shown on Mandatory Put Bonds are the current interest rates at the close of the reporting period.
The dates shown parenthetically on prerefunded bonds represent the next prerefunding dates.
The dates shown parenthetically on Mandatory Put Bonds represent the next mandatory put dates.
The dates shown on debt obligations are the original maturity dates.
The fund had the following sector concentrations greater than 10% at the close of the reporting period (as a percentage of net assets):
| |
| Health care | 18.4% |
| Utilities | 15.1 |
| State government | 14.1 |
| Transportation | 11.4 |
The fund had the following insurance concentration greater than 10% at the close of the reporting period (as a percentage of net assets):
ASC 820 establishes a three-level hierarchy for disclosure of fair value measurements. The valuation hierarchy is based upon the transparency of inputs to the valuation of the fund’s investments. The three levels are defined as follows:
Level 1: Valuations based on quoted prices for identical securities in active markets.
Level 2: Valuations based on quoted prices in markets that are not active or for which all significant inputs are observable, either directly or indirectly.
Level 3: Valuations based on inputs that are unobservable and significant to the fair value measurement.
The following is a summary of the inputs used to value the fund’s net assets as of the close of the reporting period:
| | | |
| | | Valuation inputs | |
|
| Investments in securities: | Level 1 | Level 2 | Level 3 |
|
| Municipal bonds and notes | $— | $1,170,745,146 | $— |
|
| Preferred stocks | — | 6,640,264 | — |
|
| Totals by level | $— | $1,177,385,410 | $— |
The accompanying notes are an integral part of these financial statements.
33
Statement of assets and liabilities 3/31/12 (Unaudited)
| |
| ASSETS | |
|
| Investment in securities, at value (Note 1): | |
| Unaffiliated issuers (identified cost $1,084,058,471) | $1,177,385,410 |
|
| Cash | 4,531,560 |
|
| Interest and other receivables | 17,053,521 |
|
| Receivable for shares of the fund sold | 1,746,395 |
|
| Receivable for investments sold | 1,762,402 |
|
| Total assets | 1,202,479,288 |
| |
| LIABILITIES | |
|
| Distributions payable to shareholders | 1,056,494 |
|
| Payable for purchases of delayed delivery securities (Note 1) | 4,220,000 |
|
| Payable for investments purchased | 5,734,095 |
|
| Payable for shares of the fund repurchased | 1,962,081 |
|
| Payable for compensation of Manager (Note 2) | 446,566 |
|
| Payable for investor servicing fees (Note 2) | 47,757 |
|
| Payable for custodian fees (Note 2) | 7,551 |
|
| Payable for Trustee compensation and expenses (Note 2) | 335,610 |
|
| Payable for administrative services (Note 2) | 4,819 |
|
| Payable for distribution fees (Note 2) | 635,550 |
|
| Other accrued expenses | 67,769 |
|
| Total liabilities | 14,518,292 |
| | |
| Net assets | $1,187,960,996 |
|
| |
| REPRESENTED BY | |
|
| Paid-in capital (Unlimited shares authorized) (Notes 1 and 4) | $1,131,524,199 |
|
| Distributions in excess of net investment income (Note 1) | (145,738) |
|
| Accumulated net realized loss on investments (Note 1) | (36,744,404) |
|
| Net unrealized appreciation of investments | 93,326,939 |
|
| Total — Representing net assets applicable to capital shares outstanding | $1,187,960,996 |
| |
| COMPUTATION OF NET ASSET VALUE AND OFFERING PRICE | |
|
| Net asset value and redemption price per class A share | |
| ($1,113,816,127 divided by 126,231,715 shares) | $8.82 |
|
| Offering price per class A share (100/96.00 of $8.82)* | $9.19 |
|
| Net asset value and offering price per class B share ($8,636,443 divided by 978,585 shares)** | $8.83 |
|
| Net asset value and offering price per class C share ($31,878,863 divided by 3,606,496 shares)** | $8.84 |
|
| Net asset value and redemption price per class M share ($5,908,954 divided by 667,871 shares) | $8.85 |
|
| Offering price per class M share (100/96.75 of $8.85)† | $9.15 |
|
| Net asset value, offering price and redemption price per class Y share | |
| ($27,720,609 divided by 3,136,714 shares) | $8.84 |
|
* On single retail sales of less than $100,000. On sales of $100,000 or more the offering price is reduced.
** Redemption price per share is equal to net asset value less any applicable contingent deferred sales charge.
† On single retail sales of less than $50,000. On sales of $50,000 or more the offering price is reduced.
The accompanying notes are an integral part of these financial statements.
34
Statement of operations Six months ended 3/31/12 (Unaudited)
| |
| INTEREST INCOME | $29,305,522 |
|
| EXPENSES | |
|
| Compensation of Manager (Note 2) | 2,588,212 |
|
| Investor servicing fees (Note 2) | 290,999 |
|
| Custodian fees (Note 2) | 7,305 |
|
| Trustee compensation and expenses (Note 2) | 50,574 |
|
| Administrative services (Note 2) | 15,011 |
|
| Distribution fees — Class A (Note 2) | 1,181,936 |
|
| Distribution fees — Class B (Note 2) | 34,245 |
|
| Distribution fees — Class C (Note 2) | 147,759 |
|
| Distribution fees — Class M (Note 2) | 13,516 |
|
| Other | 140,498 |
|
| Total expenses | 4,470,055 |
| | |
| Expense reduction (Note 2) | (1,378) |
|
| Net expenses | 4,468,677 |
| | |
| Net investment income | 24,836,845 |
|
| |
| Net realized gain on investments (Notes 1 and 3) | 2,598,840 |
|
| Net unrealized appreciation of investments during the period | 27,886,347 |
|
| Net gain on investments | 30,485,187 |
| | |
| Net increase in net assets resulting from operations | $55,322,032 |
|
The accompanying notes are an integral part of these financial statements.
35
Statement of changes in net assets
| | |
| INCREASE (DECREASE) IN NET ASSETS | Six months ended 3/31/12* | Year ended 9/30/11 |
|
| Operations: | | |
| Net investment income | $24,836,845 | $53,814,473 |
|
| Net realized gain (loss) on investments | 2,598,840 | (10,183,746) |
|
| Net unrealized appreciation (depreciation) of investments | 27,886,347 | (12,684,086) |
|
| Net increase in net assets resulting from operations | 55,322,032 | 30,946,641 |
|
| Distributions to shareholders (Note 1): | | |
| From ordinary income | | |
| Taxable net investment income | | |
| Class A | (162,833) | (79,228) |
|
| Class B | (1,168) | (675) |
|
| Class C | (4,404) | (2,231) |
|
| Class M | (793) | (448) |
|
| Class Y | (3,244) | (1,156) |
|
| From tax-exempt net investment income | | |
| Class A | (23,121,100) | (49,316,220) |
|
| Class B | (143,996) | (333,686) |
|
| Class C | (505,336) | (1,058,584) |
|
| Class M | (106,107) | (238,613) |
|
| Class Y | (538,384) | (912,458) |
|
| Increase in capital from settlement payments (Note 6) | — | 128,547 |
|
| Increase (decrease) from capital share transactions (Note 4) | 17,184,310 | (74,077,683) |
|
| Total increase (decrease) in net assets | 47,918,977 | (94,945,794) |
| |
| NET ASSETS | | |
|
| Beginning of period | 1,140,042,019 | 1,234,987,813 |
|
| End of period (including distributions in excess of net | | |
| investment income of $145,738 and $395,218, respectively) | $1,187,960,996 | $1,140,042,019 |
|
* Unaudited
The accompanying notes are an integral part of these financial statements.
36
|
| This page left blank intentionally. |
37
Financial highlights (For a common share outstanding throughout the period)
| | | | | | | | | | | | | | |
| INVESTMENT OPERATIONS: | | LESS DISTRIBUTIONS: | | | | RATIOS AND SUPPLEMENTAL DATA: |
|
| | | | | | | | | | | | | Ratio | Ratio | |
| | | | Net realized | | | | | | | | | of expenses | of net investment | |
| | Net asset value, | | and unrealized | Total from | From | | | | | Total return | Net assets, | to average | income (loss) | Portfolio |
| | beginning | Net investment | gain (loss) | investment | net investment | Total | Redemption | Non-recurring | Net asset value, | at net asset | end of period | net assets | to average | turnover |
| Period ended | of period | income (loss) | on investments | operations | income | distributions | fees | reimbursements | end of period | value (%) a | (in thousands) | (%) b | net assets (%) | (%) |
|
| Class A | | | | | | | | | | | | | | |
| March 31, 2012 ** | $8.59 | .19 | .22 | .41 | (.18) | (.18) | — | — | $8.82 | 4.87 * | $1,113,816 | .38 * | 2.15 * | 7 * |
| September 30, 2011 | 8.71 | .40 | (.14) | .26 | (.38) | (.38) | — | — c,d | 8.59 | 3.25 | 1,077,869 | .75 | 4.74 | 9 |
| September 30, 2010 | 8.60 | .39 | .10 | .49 | (.38) | (.38) | — c | — c,e | 8.71 | 5.97 | 1,168,501 | .75 h | 4.59 h | 13 |
| September 30, 2009 | 7.92 | .38 | .68 | 1.06 | (.38) | (.38) | — c | — c,f,g | 8.60 | 14.03 | 1,156,735 | .82 h | 4.88 h | 19 |
| September 30, 2008 | 8.64 | .38 | (.72) | (.34) | (.38) | (.38) | — c | — | 7.92 | (4.13) | 1,141,001 | .82 | 4.49 | 46 |
| September 30, 2007 | 8.79 | .37 | (.16) | .21 | (.36) | (.36) | — c | — | 8.64 | 2.49 | 1,311,819 | .79 | 4.26 | 25 |
|
| Class B | | | | | | | | | | | | | | |
| March 31, 2012 ** | $8.59 | .16 | .24 | .40 | (.16) | (.16) | — | — | $8.83 | 4.66 * | $8,636 | .69 * | 1.83 * | 7 * |
| September 30, 2011 | 8.71 | .34 | (.13) | .21 | (.33) | (.33) | — | — c,d | 8.59 | 2.59 | 7,683 | 1.38 | 4.12 | 9 |
| September 30, 2010 | 8.60 | .34 | .10 | .44 | (.33) | (.33) | — c | — c,e | 8.71 | 5.37 | 10,561 | 1.39 h | 3.96 h | 13 |
| September 30, 2009 | 7.92 | .34 | .68 | 1.02 | (.34) | (.34) | — c | — c,f,g | 8.60 | 13.43 | 17,347 | 1.46 h | 4.27 h | 19 |
| September 30, 2008 | 8.64 | .34 | (.73) | (.39) | (.33) | (.33) | — c | — | 7.92 | (4.67) | 26,427 | 1.46 | 3.85 | 46 |
| September 30, 2007 | 8.79 | .32 | (.16) | .16 | (.31) | (.31) | — c | — | 8.64 | 1.92 | 39,730 | 1.44 | 3.61 | 25 |
|
| Class C | | | | | | | | | | | | | | |
| March 31, 2012 ** | $8.61 | .15 | .23 | .38 | (.15) | (.15) | — | — | $8.84 | 4.46 * | $31,879 | .77 * | 1.75 * | 7 * |
| September 30, 2011 | 8.72 | .33 | (.12) | .21 | (.32) | (.32) | — | — c,d | 8.61 | 2.57 | 26,932 | 1.53 | 3.96 | 9 |
| September 30, 2010 | 8.61 | .32 | .11 | .43 | (.32) | (.32) | — c | — c,e | 8.72 | 5.12 | 32,627 | 1.54 h | 3.79 h | 13 |
| September 30, 2009 | 7.93 | .32 | .68 | 1.00 | (.32) | (.32) | — c | — c,f,g | 8.61 | 13.10 | 25,227 | 1.61 h | 4.07 h | 19 |
| September 30, 2008 | 8.65 | .31 | (.72) | (.41) | (.31) | (.31) | — c | — | 7.93 | (4.92) | 16,564 | 1.61 | 3.71 | 46 |
| September 30, 2007 | 8.80 | .30 | (.16) | .14 | (.29) | (.29) | — c | — | 8.65 | 1.64 | 8,432 | 1.59 | 3.46 | 25 |
|
| Class M | | | | | | | | | | | | | | |
| March 31, 2012 ** | $8.61 | .18 | .23 | .41 | (.17) | (.17) | — | — | $8.85 | 4.84 * | $5,909 | .52 * | 2.00 * | 7 * |
| September 30, 2011 | 8.73 | .37 | (.13) | .24 | (.36) | (.36) | — | — c,d | 8.61 | 2.95 | 5,131 | 1.03 | 4.47 | 9 |
| September 30, 2010 | 8.62 | .37 | .10 | .47 | (.36) | (.36) | — c | — c,e | 8.73 | 5.66 | 6,217 | 1.04 h | 4.30 h | 13 |
| September 30, 2009 | 7.94 | .36 | .68 | 1.04 | (.36) | (.36) | — c | — c,f,g | 8.62 | 13.68 | 6,107 | 1.11 h | 4.58 h | 19 |
| September 30, 2008 | 8.66 | .36 | (.72) | (.36) | (.36) | (.36) | — c | — | 7.94 | (4.39) | 5,235 | 1.11 | 4.20 | 46 |
| September 30, 2007 | 8.81 | .35 | (.16) | .19 | (.34) | (.34) | — c | — | 8.66 | 2.19 | 5,346 | 1.09 | 3.96 | 25 |
|
| Class Y | | | | | | | | | | | | | | |
| March 31, 2012 ** | $8.60 | .20 | .23 | .43 | (.19) | (.19) | — | — | $8.84 | 5.09 * | $27,721 | .27 * | 2.25 * | 7 * |
| September 30, 2011 | 8.72 | .41 | (.13) | .28 | (.40) | (.40) | — | — c,d | 8.60 | 3.47 | 22,427 | .53 | 4.93 | 9 |
| September 30, 2010 | 8.61 | .41 | .10 | .51 | (.40) | (.40) | — c | — c,e | 8.72 | 6.21 | 17,081 | .54 h | 4.74 h | 13 |
| September 30, 2009 | 7.92 | .40 | .69 | 1.09 | (.40) | (.40) | — c | — c,f,g | 8.61 | 14.39 | 5,106 | .61 h | 5.05 h | 19 |
| September 30, 2008† | 8.62 | .30 | (.70) | (.40) | (.30) | (.30) | — c | — | 7.92 | (4.77) * | 718 | .45* | 3.52* | 46 |
|
See notes to financial highlights at the end of this section.
The accompanying notes are an integral part of these financial statements.
Financial highlights (Continued)
* Not annualized.
** Unaudited.
† For the period January 2, 2008 (commencement of operations) to September 30, 2008.
a Total return assumes dividend reinvestment and does not reflect the effect of sales charges.
b Includes amounts paid through expense offset arrangements (Note 2).
c Amount represents less than $0.01 per share.
d Reflects a non-recurring reimbursement related to restitution amounts in connection with a distribution plan approved by the Securities and Exchange Commission (the SEC) which amounted to less than $0.01 per share outstanding on July 21, 2011. Also reflects a non-recurring reimbursement related to short-term trading related lawsuits, which amounted to less than $0.01 per share outstanding on May 11, 2011 (Note 6).
e Reflects a non-recurring reimbursement pursuant to a settlement between the SEC and Prudential Securities, Inc. which amounted to less than $0.01 per share outstanding as of March 30, 2010.
f Reflects a non-recurring reimbursement pursuant to a settlement between the SEC and Bear Stearns & Co., Inc. and Bear Stearns Securities Corp., which amounted to less than $0.01 per share outstanding as of May 21, 2009.
g Reflects a non-recurring reimbursement pursuant to a settlement between the SEC and Millennium Partners, L.P., Millennium Management, L.L.C., and Millennium International Management, L.L.C., which amounted to less than $0.01 per share outstanding as of June 23, 2009.
h Reflects an involuntary contractual expense limitation in effect during the period. As a result of such limitation the expenses of each class for the periods ended September 30, 2010 and September 30, 2009 reflect a reduction of 0.01% and 0.01% of average net assets, respectively.
The accompanying notes are an integral part of these financial statements.
40
Notes to financial statements 3/31/12 (Unaudited)
Within the following Notes to financial statements, references to “State Street” represent State Street Bank and Trust Company, references to “the SEC” represent the Securities and Exchange Commission and references to “Putnam Management” represent Putnam Investment Management, LLC, the fund’s manager, an indirect wholly-owned subsidiary of Putnam Investments, LLC.
Putnam Tax Exempt Income Fund (the fund) is a Massachusetts business trust, which is registered under the Investment Company Act of 1940, as amended, as a diversified open-end management investment company. The investment objective of the fund is to seek as high a level of current income exempt from federal income tax as Putnam Management believes is consistent with preservation of capital. The fund invests mainly in bonds that pay interest that is exempt from federal tax (but that may be subject to federal alternative minimum tax (AMT)), are investment-grade in quality, and have intermediate to long-term maturities (three years or longer).
The fund offers class A, class B, class C, class M and class Y shares. Class A and class M shares are sold with a maximum front-end sales charge of 4.00% and 3.25%, respectively, and generally do not pay a contingent deferred sales charge. Class B shares, which convert to class A shares after approximately eight years, do not pay a front-end sales charge and are subject to a contingent deferred sales charge if those shares are redeemed within six years of purchase. Class C shares have a one-year 1.00% contingent deferred sales charge and do not convert to class A shares. The expenses for class A, class B, class C, and class M shares may differ based on the distribution fee of each class, which is identified in Note 2. Class Y shares, which are sold at net asset value, are generally subject to the same expenses as class A, class B, class C, and class M shares, but do not bear a distribution fee. Class Y shares are not available to all investors.
Investment income, realized and unrealized gains and losses and expenses of the fund are borne pro-rata based on the relative net assets of each class to the total net assets of the fund, except that each class bears expenses unique to that class (including the distribution fees applicable to such classes). Each class votes as a class only with respect to its own distribution plan or other matters on which a class vote is required by law or determined by the Trustees. If the fund were liquidated, shares of each class would receive their pro-rata share of the net assets of the fund. In addition, the Trustees declare separate dividends on each class of shares.
In the normal course of business, the fund enters into contracts that may include agreements to indemnify another party under given circumstances. The fund’s maximum exposure under these arrangements is unknown as this would involve future claims that may be, but have not yet been, made against the fund. However, the fund’s management team expects the risk of material loss to be remote.
Note 1: Significant accounting policies
The following is a summary of significant accounting policies consistently followed by the fund in the preparation of its financial statements. The preparation of financial statements is in conformity with accounting principles generally accepted in the United States of America and requires management to make estimates and assumptions that affect the reported amounts of assets and liabilities in the financial statements and the reported amounts of increases and decreases in net assets from operations. Actual results could differ from those estimates. Subsequent events after the Statement of assets and liabilities date through the date that the financial statements were issued have been evaluated in the preparation of the financial statements. Unless otherwise noted, the “reporting period” represents the period from October 1, 2011 through March 31, 2012.
Security valuation Tax-exempt bonds and notes are generally valued on the basis of valuations provided by an independent pricing service approved by the Trustees. Such services use information with respect to transactions in bonds, quotations from bond dealers, market transactions in comparable securities and various relationships between securities in determining value. These securities will generally be categorized as Level 2.
Certain investments, including certain restricted and illiquid securities and derivatives, are also valued at fair value following procedures approved by the Trustees. Such valuations and procedures are reviewed periodically by the Trustees. These valuations consider such factors as significant market or specific security events such as interest rate or credit quality changes, various relationships with other securities, discount rates, U.S. Treasury, U.S. swap and credit yields, index levels, convexity exposures and recovery rates. These securities are classified as Level 2 or as Level 3 depending on the priority of the significant inputs. The fair value of securities is generally determined as the amount that the fund could reasonably expect to realize from an orderly disposition of such securities over a reasonable period of time. By its nature, a fair value price is a good faith estimate of the value of a security in a current sale and does not reflect an actual market price, which may be different by a material amount.
41
Security transactions and related investment income Security transactions are recorded on the trade date (the date the order to buy or sell is executed). Gains or losses on securities sold are determined on the identified cost basis.
Interest income is recorded on the accrual basis. All premiums/discounts are amortized/accreted on a yield-to-maturity basis. The premium in excess of the call price, if any, is amortized to the call date; thereafter, any remaining premium is amortized to maturity.
Securities purchased or sold on a forward commitment or delayed delivery basis may be settled a month or more after the trade date; interest income is accrued based on the terms of the securities. Losses may arise due to changes in the market value of the underlying securities or if the counterparty does not perform under the contract.
Interfund lending The fund, along with other Putnam funds, may participate in an interfund lending program pursuant to an exemptive order issued by the SEC. This program allows the fund to borrow from other Putnam funds that permit such transactions. Interfund lending transactions are subject to each fund’s investment policies and borrowing and lending limits. Interest earned or paid on the interfund lending transaction will be based on the average of certain current market rates. During the reporting period, the fund did not utilize the program.
Line of credit The fund participates, along with other Putnam funds, in a $325 million unsecured committed line of credit and a $185 million unsecured uncommitted line of credit, both provided by State Street. Borrowings may be made for temporary or emergency purposes, including the funding of shareholder redemption requests and trade settlements. Interest is charged to the fund based on the fund’s borrowing at a rate equal to the Federal Funds rate plus 1.25% for the committed line of credit and the Federal Funds rate plus 1.30% for the uncommitted line of credit. A closing fee equal to 0.02% of the committed line of credit and $50,000 for the uncommitted line of credit has been paid by the participating funds. In addition, a commitment fee of 0.13% per annum on any unutilized portion of the committed line of credit is allocated to the participating funds based on their relative net assets and paid quarterly. During the reporting period, the fund had no borrowings against these arrangements.
Federal taxes It is the policy of the fund to distribute all of its income within the prescribed time period and otherwise comply with the provisions of the Internal Revenue Code of 1986, as amended (the Code), applicable to regulated investment companies. It is also the intention of the fund to distribute an amount sufficient to avoid imposition of any excise tax under Section 4982 of the Code.
The fund is subject to the provisions of Accounting Standards Codification ASC 740 Income Taxes (ASC 740). ASC 740 sets forth a minimum threshold for financial statement recognition of the benefit of a tax position taken or expected to be taken in a tax return. The fund did not have a liability to record for any unrecognized tax benefits in the accompanying financial statements. No provision has been made for federal taxes on income, capital gains or unrealized appreciation on securities held nor for excise tax on income and capital gains. Each of the fund’s federal tax returns for the prior three fiscal years remains subject to examination by the Internal Revenue Service.
At September 30, 2011, the fund had a capital loss carryover of $27,910,761 available to the extent allowed by the Code to offset future net capital gain, if any. The amounts of the carryovers and the expiration dates are:
| | | |
| Loss carryover |
|
| Short-term | Long-term | Total | Expiration |
|
| $4,466,195 | $— | $4,466,195 | September 30, 2012 |
|
| 430,649 | — | 430,649 | September 30, 2013 |
|
| 1,248,409 | — | 1,248,409 | September 30, 2014 |
|
| 150,375 | — | 150,375 | September 30, 2016 |
|
| 6,919,758 | — | 6,919,758 | September 30, 2017 |
|
| 13,617,607 | — | 13,617,607 | September 30, 2018 |
|
| 1,077,768 | — | 1,077,768 | September 30, 2019 |
|
Under the recently enacted Regulated Investment Company Modernization Act of 2010, the fund will be permitted to carry forward capital losses incurred in taxable years beginning after December 22, 2010 for an unlimited period. However, any losses incurred during those future years will be required to be utilized prior to the losses incurred in pre-enactment tax years. As a result of this ordering rule, pre-enactment capital loss carryforwards may be more likely to expire unused. Additionally, post-enactment capital losses that are carried forward will retain their character as either short-term or long-term capital losses rather than being considered all short-term as under previous law.
42
Pursuant to federal income tax regulations applicable to regulated investment companies, the fund has elected to defer $10,872,611 of losses recognized during the period from November 1, 2010 to its fiscal year ending September 30, 2011.
The aggregate identified cost on a tax basis is $1,083,924,549, resulting in gross unrealized appreciation and depreciation of $104,362,846 and $10,901,985, respectively, or net unrealized appreciation of $93,460,861.
Distributions to shareholders Income dividends are recorded daily by the fund and are paid monthly. Distributions from capital gains, if any, are recorded on the ex-dividend date and paid at least annually. The amount and character of income and gains to be distributed are determined in accordance with income tax regulations which may differ from generally accepted accounting principles. Dividend sources are estimated at the time of declaration. Actual results may vary. Any non-taxable return of capital cannot be determined until final tax calculations are completed after the end of the fund’s fiscal year. Reclassifications are made to the fund’s capital accounts to reflect income and gains available for distribution (or available capital loss carryovers) under income tax regulations.
Note 2: Management fee, administrative services and other transactions
The fund pays Putnam Management a management fee (based on the fund’s average net assets and computed and paid monthly) at annual rates that may vary based on the average of the aggregate net assets of most open-end funds, as defined in the fund’s management contract, sponsored by Putnam Management. Such annual rates may vary as follows:
| |
| 0.590% | of the first $5 billion, |
| 0.540% | of the next $5 billion, |
| 0.490% | of the next $10 billion, |
| 0.440% | of the next $10 billion, |
| 0.390% | of the next $50 billion, |
| 0.370% | of the next $50 billion, |
| 0.360% | of the next $100 billion and |
| 0.355% | of any excess thereafter. |
Putnam Management has contractually agreed, through June 30, 2012, to waive fees or reimburse the fund’s expenses to the extent necessary to limit the cumulative expenses of the fund, exclusive of brokerage, interest, taxes, investment-related expenses, extraordinary expenses and payments under the fund’s investor servicing contract, investment management contract and distribution plans, on a fiscal year-to-date basis to an annual rate of 0.20% of the fund’s average net assets over such fiscal year-to-date period. During the reporting period, the fund’s expenses were not reduced as a result of this limit.
Putnam Investments Limited (PIL), an affiliate of Putnam Management, is authorized by the Trustees to manage a separate portion of the assets of the fund as determined by Putnam Management from time to time. Putnam Management pays a quarterly sub-management fee to PIL for its services at an annual rate of 0.40% of the average net assets of the portion of the fund managed by PIL.
The fund reimburses Putnam Management an allocated amount for the compensation and related expenses of certain officers of the fund and their staff who provide administrative services to the fund. The aggregate amount of all such reimbursements is determined annually by the Trustees.
Custodial functions for the fund’s assets are provided by State Street. Custody fees are based on the fund’s asset level, the number of its security holdings and transaction volumes.
Putnam Investor Services, Inc., an affiliate of Putnam Management, provides investor servicing agent functions to the fund. Putnam Investor Services, Inc. received fees for investor servicing based on the fund’s retail asset level, the number of shareholder accounts in the fund and the level of defined contribution plan assets in the fund. Investor servicing fees will not exceed an annual rate of 0.32% of the fund’s average net assets. Prior to March 1, 2012, investor servicing fees could not exceed an annual rate of 0.375% of the fund’s average net assets. The amounts incurred for investor servicing agent functions during the reporting period are included in Investor servicing fees in the Statement of operations.
The fund has entered into expense offset arrangements with Putnam Investor Services, Inc. and State Street whereby Putnam Investor Services, Inc.’s and State Street’s fees are reduced by credits allowed on cash balances. For the reporting period, the fund’s expenses were reduced by $1,378 under the expense offset arrangements.
43
Each independent Trustee of the fund receives an annual Trustee fee, of which $889, as a quarterly retainer, has been allocated to the fund, and an additional fee for each Trustees meeting attended. Trustees also are reimbursed for expenses they incur relating to their services as Trustees.
The fund has adopted a Trustee Fee Deferral Plan (the Deferral Plan) which allows the Trustees to defer the receipt of all or a portion of Trustees fees payable on or after July 1, 1995. The deferred fees remain invested in certain Putnam funds until distribution in accordance with the Deferral Plan.
The fund has adopted an unfunded noncontributory defined benefit pension plan (the Pension Plan) covering all Trustees of the fund who have served as a Trustee for at least five years and were first elected prior to 2004. Benefits under the Pension Plan are equal to 50% of the Trustee’s average annual attendance and retainer fees for the three years ended December 31, 2005. The retirement benefit is payable during a Trustee’s lifetime, beginning the year following retirement, for the number of years of service through December 31, 2006. Pension expense for the fund is included in Trustee compensation and expenses in the Statement of operations. Accrued pension liability is included in Payable for Trustee compensation and expenses in the Statement of assets and liabilities. The Trustees have terminated the Pension Plan with respect to any Trustee first elected after 2003.
The fund has adopted distribution plans (the Plans) with respect to its class A, class B, class C and class M shares pursuant to Rule 12b–1 under the Investment Company Act of 1940. The purpose of the Plans is to compensate Putnam Retail Management Limited Partnership, a wholly-owned subsidiary of Putnam Investments, LLC and Putnam Retail Management GP, Inc., for services provided and expenses incurred in distributing shares of the fund. The Plans provide for payments by the fund to Putnam Retail Management Limited Partnership at an annual rate of up to 0.35%, 1.00%, 1.00% and 1.00% of the average net assets attributable to class A, class B, class C and class M shares, respectively. The Trustees have approved payment by the fund at the annual rate of 0.85%, 1.00% and 0.50% of the average net assets for class B, class C and class M shares, respectively. For class A shares, the annual payment rate will equal the weighted average of (i) 0.20% on the net assets of the fund attributable to class A shares purchased and paid for prior to April 1, 2005 and (ii) 0.25% on all other net assets of the fund attributable to class A shares.
For the reporting period, Putnam Retail Management Limited Partnership, acting as underwriter, received net commissions of $56,836 and $175 from the sale of class A and class M shares, respectively, and received $4,525 and $609 in contingent deferred sales charges from redemptions of class B and class C shares, respectively.
A deferred sales charge of up to 1.00% is assessed on certain redemptions of class A shares. For the reporting period, Putnam Retail Management Limited Partnership, acting as underwriter, received no monies on class A redemptions.
Note 3: Purchases and sales of securities
During the reporting period, cost of purchases and proceeds from sales of investment securities other than short-term investments aggregated $86,619,271 and $72,155,700, respectively. There were no purchases or proceeds from sales of long-term U.S. government securities.
Note 4: Capital shares
At the close of the reporting period, there was an unlimited number of shares of beneficial interest authorized. Transactions in capital shares were as follows:
| | | | |
| | Six months ended 3/31/12 | Year ended 9/30/11 |
|
| Class A | Shares | Amount | Shares | Amount |
|
| Shares sold | 7,160,163 | $62,555,310 | 10,696,750 | $89,580,873 |
|
| Shares issued in connection with | | | | |
| reinvestment of distributions | 2,041,039 | 17,813,187 | 4,344,331 | 36,225,932 |
|
| | 9,201,202 | 80,368,497 | 15,041,081 | 125,806,805 |
|
| Shares repurchased | (8,424,320) | (73,427,765) | (23,740,144) | (196,811,737) |
|
| Net increase (decrease) | 776,882 | $6,940,732 | (8,699,063) | $(71,004,932) |
|
44
| | | | |
| | Six months ended 3/31/12 | Year ended 9/30/11 |
|
| Class B | Shares | Amount | Shares | Amount |
|
| Shares sold | 202,463 | $1,768,748 | 274,695 | $2,303,100 |
|
| Shares issued in connection with | | | | |
| reinvestment of distributions | 12,160 | 106,139 | 26,617 | 221,800 |
|
| | 214,623 | 1,874,887 | 301,312 | 2,524,900 |
|
| Shares repurchased | (130,155) | (1,131,670) | (619,475) | (5,154,942) |
|
| Net increase (decrease) | 84,468 | $743,217 | (318,163) | $(2,630,042) |
|
| |
| | Six months ended 3/31/12 | Year ended 9/30/11 |
|
| Class C | Shares | Amount | Shares | Amount |
|
| Shares sold | 669,086 | $5,829,777 | 741,462 | $6,245,205 |
|
| Shares issued in connection with | | | | |
| reinvestment of distributions | 46,367 | 405,452 | 95,455 | 797,216 |
|
| | 715,453 | 6,235,229 | 836,917 | 7,042,421 |
|
| Shares repurchased | (238,255) | (2,077,200) | (1,447,280) | (11,957,386) |
|
| Net increase (decrease) | 477,198 | $4,158,029 | (610,363) | $(4,914,965) |
|
| |
| | Six months ended 3/31/12 | Year ended 9/30/11 |
|
| Class M | Shares | Amount | Shares | Amount |
|
| Shares sold | 76,097 | $672,592 | 36,074 | $302,334 |
|
| Shares issued in connection with | | | | |
| reinvestment of distributions | 11,326 | 99,154 | 23,225 | 194,134 |
|
| | 87,423 | 771,746 | 59,299 | 496,468 |
|
| Shares repurchased | (15,147) | (132,855) | (175,629) | (1,452,233) |
|
| Net increase (decrease) | 72,276 | $638,891 | (116,330) | $(955,765) |
|
| |
| | Six months ended 3/31/12 | Year ended 9/30/11 |
|
| Class Y | Shares | Amount | Shares | Amount |
|
| Shares sold | 1,092,942 | $9,589,795 | 3,038,754 | $25,501,413 |
|
| Shares issued in connection with | | | | |
| reinvestment of distributions | 42,877 | 375,218 | 63,562 | 531,921 |
|
| | 1,135,819 | 9,965,013 | 3,102,316 | 26,033,334 |
|
| Shares repurchased | (605,501) | (5,261,572) | (2,454,597) | (20,605,313) |
|
| Net increase | 530,318 | $4,703,441 | 647,719 | $5,428,021 |
|
Note 5: Market, credit and other risks
In the normal course of business, the fund trades financial instruments and enters into financial transactions where risk of potential loss exists due to changes in the market (market risk) or failure of the contracting party to the transaction to perform (credit risk). The fund may be exposed to additional credit risk that an institution or other entity with which the fund has unsettled or open transactions will default.
Note 6: Regulatory matters and litigation
In late 2003 and 2004, Putnam Management settled charges brought by the SEC and the Massachusetts Securities Division in connection with excessive short-term trading in Putnam funds. In July 2011, the fund recorded a receivable of $126,153 related to restitution amounts in connection with a distribution plan approved by the SEC. This amount, which was received by the fund in December 2011, is reported as part of Increase in capital from settlement payments on the Statement of changes in net assets. These allegations and related matters have served as the general basis for certain lawsuits, including purported class action lawsuits against Putnam Management and,
45
in a limited number of cases, some Putnam funds. In May 2011, the fund received a payment of $2,394 related to settlement of those lawsuits. This amount is reported as a part of Increase in capital from settlement payments on the Statement of changes in net assets. Putnam Management has agreed to bear any costs incurred by the Putnam funds as a result of these matters.
Note 7: New accounting pronouncements
In May 2011, the Financial Accounting Standards Board (FASB) issued Accounting Standards Update (ASU) 2011–04 “Fair Value Measurements and Disclosures (Topic 820) — Amendments to Achieve Common Fair Value Measurement and Disclosure Requirements in U.S. GAAP and IFRS”. ASU 2011–04 amends FASB Topic 820 “Fair Value Measurement” and seeks to develop common requirements for measuring fair value and for disclosing information about fair value measurements in accordance with GAAP. ASU 2011–04 is effective for fiscal years and interim periods beginning after December 15, 2011. The application of ASU 2011–04 will not have a material on the fund’s financial statements.
In December 2011, the FASB issued ASU No. 2011–11 “Disclosures about Offsetting Assets and Liabilities”. The update creates new disclosure requirements requiring entities to disclose both gross and net information for derivatives and other financial instruments that are either offset in the Statement of assets and liabilities or subject to an enforceable master netting arrangement or similar agreement. The disclosure requirements are effective for annual reporting periods beginning on or after January 1, 2013 and interim periods within those annual periods. Putnam Management is currently evaluating the application of ASU 2011–11 and its impact, if any, on the fund’s financial statements.
46
Services for shareholders
Investor services
Systematic investment plan Tell us how much you wish to invest regularly — weekly, semimonthly, or monthly — and the amount you choose will be transferred automatically from your checking or savings account. There’s no additional fee for this service, and you can suspend it at any time. This plan may be a great way to save for college expenses or to plan for your retirement.
Please note that regular investing does not guarantee a profit or protect against loss in a declining market. Before arranging a systematic investment plan, consider your financial ability to continue making purchases in periods when prices are low.
Systematic exchange You can make regular transfers from one Putnam fund to another Putnam fund. There are no additional fees for this service, and you can cancel or change your options at any time.
Dividends PLUS You can choose to have the dividend distributions from one of your Putnam funds automatically reinvested in another Putnam fund at no additional charge.
Free exchange privilege You can exchange money between Putnam funds free of charge, as long as they are the same class of shares. A signature guarantee is required if you are exchanging more than $500,000. The fund reserves the right to revise or terminate the exchange privilege.
Reinstatement privilege If you’ve sold Putnam shares or received a check for a dividend or capital gain, you may reinvest the proceeds with Putnam within 90 days of the transaction and they will be reinvested at the fund’s current net asset value — with no sales charge. However, reinstatement of class B shares may have special tax consequences. Ask your financial or tax representative for details.
Check-writing service You have ready access to many Putnam accounts. It’s as simple as writing a check, and there are no special fees or service charges. For more information about the check-writing service, call Putnam or visit our website.
Dollar cost averaging When you’re investing for long-term goals, it’s time, not timing, that counts. Investing on a systematic basis is a better strategy than trying to figure out when the markets will go up or down. This means investing the same amount of money regularly over a long period. This method of investing is called dollar cost averaging. When a fund’s share price declines, your investment dollars buy more shares at lower prices. When it increases, they buy fewer shares. Over time, you will pay a lower average price per share.
For more information
Visit the Individual Investors section at putnam.com A secure section of our website contains complete information on your account, including balances and transactions, updated daily. You may also conduct transactions, such as exchanges, additional investments, and address changes. Log on today to get your password.
Call us toll free at 1-800-225-1581 Ask a helpful Putnam representative or your financial advisor for details about any of these or other services, or see your prospectus.
47
The Putnam family of funds
The following is a list of Putnam’s open-end mutual funds offered to the public. Investors should carefully consider the investment objective, risks, charges, and expenses of a fund before investing. For a prospectus, or a summary prospectus if available, containing this and other information for any Putnam fund or product, call your financial advisor at 1-800-225-1581 and ask for a prospectus. Please read the prospectus carefully before investing.
| |
| Growth | Income |
| Growth Opportunities Fund | American Government Income Fund |
| International Growth Fund | Diversified Income Trust |
| Multi-Cap Growth Fund | Floating Rate Income Fund |
| Small Cap Growth Fund | Global Income Trust |
| Voyager Fund | High Yield Advantage Fund |
| High Yield Trust |
| Blend | Income Fund |
| Asia Pacific Equity Fund | Money Market Fund* |
| Capital Opportunities Fund | Short Duration Income Fund |
| Capital Spectrum Fund | U.S. Government Income Trust |
| Emerging Markets Equity Fund | |
| Equity Spectrum Fund | Tax-free income |
| Europe Equity Fund | AMT-Free Municipal Fund |
| Global Equity Fund | Tax Exempt Income Fund |
| International Capital Opportunities Fund | Tax Exempt Money Market Fund* |
| International Equity Fund | Tax-Free High Yield Fund |
| Investors Fund | |
| Multi-Cap Core Fund | State tax-free income funds: |
| Research Fund | Arizona, California, Massachusetts, Michigan, |
| Minnesota, New Jersey, New York, Ohio, |
| Value | and Pennsylvania. |
| Convertible Securities Fund | |
| Equity Income Fund | Absolute Return |
| George Putnam Balanced Fund | Absolute Return 100 Fund |
| The Putnam Fund for Growth and Income | Absolute Return 300 Fund |
| International Value Fund | Absolute Return 500 Fund |
| Multi-Cap Value Fund | Absolute Return 700 Fund |
| Small Cap Value Fund | |
* An investment in a money market fund is not insured or guaranteed by the Federal Deposit Insurance Corporation or any other government agency. Although the fund seeks to preserve the value of your investment at $1.00 per share, it is possible to lose money by investing in the fund.
48
| |
| Global Sector | Putnam RetirementReady Funds — portfolios |
| Global Consumer Fund | with automatically adjusting allocations to |
| Global Energy Fund | stocks, bonds, and money market instruments, |
| Global Financials Fund | becoming more conservative over time. |
| Global Health Care Fund | |
| Global Industrials Fund | RetirementReady 2055 Fund |
| Global Natural Resources Fund | RetirementReady 2050 Fund |
| Global Sector Fund | RetirementReady 2045 Fund |
| Global Technology Fund | RetirementReady 2040 Fund |
| Global Telecommunications Fund | RetirementReady 2035 Fund |
| Global Utilities Fund | RetirementReady 2030 Fund |
| RetirementReady 2025 Fund |
| Asset Allocation | RetirementReady 2020 Fund |
| Putnam Global Asset Allocation Funds — | RetirementReady 2015 Fund |
| portfolios with allocations to stocks, bonds, | |
| and money market instruments that are | Putnam Retirement Income Lifestyle |
| adjusted dynamically within specified ranges | Funds — portfolios with managed |
| as market conditions change. | allocations to stocks, bonds, and money |
| market investments to generate |
| Dynamic Asset Allocation Balanced Fund | retirement income. |
| Prior to November 30, 2011, this fund was known as | |
| Putnam Asset Allocation: Balanced Portfolio. | Retirement Income Fund Lifestyle 1 |
| Dynamic Asset Allocation | Prior to June 16, 2011, this fund was known as |
| Conservative Fund | Putnam RetirementReady Maturity Fund. |
| Prior to November 30, 2011, this fund was known as | Retirement Income Fund Lifestyle 2 |
| Putnam Asset Allocation: Conservative Portfolio. | Retirement Income Fund Lifestyle 3 |
| Dynamic Asset Allocation Growth Fund | Prior to June 16, 2011, this fund was known as |
| Prior to November 30, 2011, this fund was known as | Putnam Income Strategies Fund. |
| Putnam Asset Allocation: Growth Portfolio. | |
| Dynamic Risk Allocation Fund | |
A short-term trading fee of 1% may apply to redemptions or exchanges from certain funds within the time period specified in the fund's prospectus.
Check your account balances and the most recent month-end performance in the Individual Investors section at putnam.com.
49
Putnam’s commitment to confidentiality
In order to conduct business with our shareholders, we must obtain certain personal information such as account holders’ names, addresses, Social Security numbers, and dates of birth. Using this information, we are able to maintain accurate records of accounts and transactions.
It is our policy to protect the confidentiality of our shareholder information, whether or not a shareholder currently owns shares of our funds. In particular, it is our policy not to sell information about you or your accounts to outside marketing firms. We have safeguards in place designed to prevent unauthorized access to our computer systems and procedures to protect personal information from unauthorized use.
Within the Putnam organization, your information is shared with those who need it to service your account or provide you with information about other Putnam products or services. Under certain circumstances, we must also share account information with outside vendors who provide services to us, such as mailings and proxy solicitations. In these cases, the service providers enter into confidentiality agreements with us, and we provide only the information necessary to process transactions and perform other services related to your account. It is also our policy to share account information with your financial advisor, if you've provided us with information about your advisor and that person is listed on your Putnam account.
If you would like clarification about our confidentiality policies or have any questions or concerns, please don't hesitate to contact us at 1-800-225-1581, Monday through Friday, 8:00 a.m. to 8:00 p.m. Eastern Time.
50
Fund information
Founded 75 years ago, Putnam Investments was built around the concept that a balance between risk and reward is the hallmark of a well-rounded financial program. We manage over 100 funds across income, value, blend, growth, asset allocation, absolute return, and global sector categories.
| | |
| Investment Manager | Robert E. Patterson | Robert T. Burns |
| Putnam Investment | George Putnam, III | Vice President and |
| Management, LLC | Robert L. Reynolds | Chief Legal Officer |
| One Post Office Square | W. Thomas Stephens | |
| Boston, MA 02109 | | James P. Pappas |
| | Officers | Vice President |
| Investment Sub-Manager | Robert L. Reynolds | |
| Putnam Investments Limited | President | Judith Cohen |
| 57–59 St James’s Street | | Vice President, Clerk and |
| London, England SW1A 1LD | Jonathan S. Horwitz | Assistant Treasurer |
| | Executive Vice President, | |
| Marketing Services | Principal Executive | Michael Higgins |
| Putnam Retail Management | Officer, Treasurer and | Vice President, Senior Associate |
| One Post Office Square | Compliance Liaison | Treasurer and Assistant Clerk |
| Boston, MA 02109 | | |
| | Steven D. Krichmar | Nancy E. Florek |
| Custodian | Vice President and | Vice President, Assistant Clerk, |
| State Street Bank | Principal Financial Officer | Assistant Treasurer and |
| and Trust Company | | Proxy Manager |
| | Janet C. Smith | |
| Legal Counsel | Vice President, Assistant | Susan G. Malloy |
| Ropes & Gray LLP | Treasurer and Principal | Vice President and |
| | Accounting Officer | Assistant Treasurer |
| Trustees | | |
| Jameson A. Baxter, Chair | Robert R. Leveille | |
| Ravi Akhoury | Vice President and | |
| Barbara M. Baumann | Chief Compliance Officer | |
| Charles B. Curtis | | |
| Robert J. Darretta | Mark C. Trenchard | |
| John A. Hill | Vice President and | |
| Paul L. Joskow | BSA Compliance Officer | |
| Elizabeth T. Kennan | | |
| Kenneth R. Leibler | | |
51
This report is for the information of shareholders of Putnam Tax Exempt Income Fund. It may also be used as sales literature when preceded or accompanied by the current prospectus, the most recent copy of Putnam’s Quarterly Performance Summary, and Putnam’s Quarterly Ranking Summary. For more recent performance, please visit putnam.com. Investors should carefully consider the investment objectives, risks, charges, and expenses of a fund, which are described in its prospectus. For this and other information or to request a prospectus or summary prospectus, call 1-800-225-1581 toll free. Please read the prospectus carefully before investing. The fund’s Statement of Additional Information contains additional information about the fund’s Trustees and is available without charge upon request by calling 1-800-225-1581.
52
| |
| Item 3. Audit Committee Financial Expert: |
| |
| Item 4. Principal Accountant Fees and Services: |
| |
| Item 5. Audit Committee of Listed Registrants |
| |
| Item 6. Schedule of Investments: |
| |
| The registrant’s schedule of investments in unaffiliated issuers is included in the report to shareholders in Item 1 above. |
| |
| Item 7. Disclosure of Proxy Voting Policies and Procedures For Closed-End Management Investment Companies: |
| |
| Item 8. Portfolio Managers of Closed-End Investment Companies |
| |
| Item 9. Purchases of Equity Securities by Closed-End Management Investment Companies and Affiliated Purchasers: |
| |
| Item 10. Submission of Matters to a Vote of Security Holders: |
| |
| Item 11. Controls and Procedures: |
| |
| (a) The registrant’s principal executive officer and principal financial officer have concluded, based on their evaluation of the effectiveness of the design and operation of the registrant’s disclosure controls and procedures as of a date within 90 days of the filing date of this report, that the design and operation of such procedures are generally effective to provide reasonable assurance that information required to be disclosed by the registrant in this report is recorded, processed, summarized and reported within the time periods specified in the Commission’s rules and forms. |
| |
| (b) Changes in internal control over financial reporting: Not applicable |
| |
| (a)(2) Separate certifications for the principal executive officer and principal financial officer of the registrant as required by Rule 30a-2(a) under the Investment Company Act of 1940, as amended, are filed herewith. |
| |
| (b) The certifications required by Rule 30a-2(b) under the Investment Company Act of 1940, as amended, are filed herewith. |
| |
| Putnam Tax Exempt Income Fund |
| |
| By (Signature and Title): |
| |
| /s/Janet C. Smith
Janet C. Smith
Principal Accounting Officer
|
| |
| Pursuant to the requirements of the Securities Exchange Act of 1934 and the Investment Company Act of 1940, this report has been signed below by the following persons on behalf of the registrant and in the capacities and on the dates indicated. |
| |
| By (Signature and Title): |
| |
| /s/Jonathan S. Horwitz
Jonathan S. Horwitz
Principal Executive Officer
|
| |
| By (Signature and Title): |
| |
| /s/Steven D. Krichmar
Steven D. Krichmar
Principal Financial Officer
|
