UNITED STATES
SECURITIES AND EXCHANGE COMMISSION
Washington, D.C. 20549
FORM N-CSR
CERTIFIED SHAREHOLDER REPORT OF REGISTERED
MANAGEMENT INVESTMENT COMPANIES
Investment Company Act file number 811-02676
Fidelity School Street Trust
(Exact name of registrant as specified in charter)
245 Summer St., Boston, MA 02210
(Address of principal executive offices) (Zip code)
William C. Coffey, Secretary
245 Summer St.
Boston, Massachusetts 02210
(Name and address of agent for service)
Registrant's telephone number, including area code:
617-563-7000
| |
Date of fiscal year end: | December 31 |
|
|
Date of reporting period: | June 30, 2019 |
Item 1.
Reports to Stockholders
Fidelity Advisor® Multi-Asset Income Fund
Semi-Annual Report June 30, 2019 Includes Fidelity and Fidelity Advisor share classes |
 |
Beginning on January 1, 2021, as permitted by regulations adopted by the Securities and Exchange Commission, paper copies of a fund’s shareholder reports will no longer be sent by mail, unless you specifically request paper copies of the reports from the fund or from your financial intermediary, such as a financial advisor, broker-dealer or bank. Instead, the reports will be made available on a website, and you will be notified by mail each time a report is posted and provided with a website link to access the report.
If you already elected to receive shareholder reports electronically, you will not be affected by this change and you need not take any action. You may elect to receive shareholder reports and other communications from a fund electronically, by contacting your financial intermediary. For Fidelity customers, visit Fidelity's web site or call Fidelity using the contact information listed below.
You may elect to receive all future reports in paper free of charge. If you wish to continue receiving paper copies of your shareholder reports, you may contact your financial intermediary or, if you are a Fidelity customer, visit Fidelity’s website, or call Fidelity at the applicable toll-free number listed below. Your election to receive reports in paper will apply to all funds held with the fund complex/your financial intermediary.
| Account Type | Website | Phone Number |
| Brokerage, Mutual Fund, or Annuity Contracts: | fidelity.com/mailpreferences | 1-800-343-3548 |
| Employer Provided Retirement Accounts: | netbenefits.fidelity.com/preferences (choose 'no' under Required Disclosures to continue to print) | 1-800-343-0860 |
| Advisor Sold Accounts Serviced Through Your Financial Intermediary: | Contact Your Financial Intermediary | Your Financial Intermediary's phone number |
| Advisor Sold Accounts Serviced by Fidelity: | institutional.fidelity.com | 1-877-208-0098 |
Contents
To view a fund's proxy voting guidelines and proxy voting record for the 12-month period ended June 30, visit http://www.fidelity.com/proxyvotingresults or visit the Securities and Exchange Commission's (SEC) web site at http://www.sec.gov.
You may also call 1-800-544-8544 if you’re an individual investing directly with Fidelity, call 1-800-835-5092 if you’re a plan sponsor or participant with Fidelity as your recordkeeper or call 1-877-208-0098 on institutional accounts or if you’re an advisor or invest through one to request a free copy of the proxy voting guidelines.
Standard & Poor's, S&P and S&P 500 are registered service marks of The McGraw-Hill Companies, Inc. and have been licensed for use by Fidelity Distributors Corporation.
Other third-party marks appearing herein are the property of their respective owners.
All other marks appearing herein are registered or unregistered trademarks or service marks of FMR LLC or an affiliated company. © 2019 FMR LLC. All rights reserved.
This report and the financial statements contained herein are submitted for the general information of the shareholders of the Fund. This report is not authorized for distribution to prospective investors in the Fund unless preceded or accompanied by an effective prospectus.
A fund files its complete schedule of portfolio holdings with the SEC for the first and third quarters of each fiscal year on Form N-PORT. Forms N-PORT are available on the SEC’s web site at http://www.sec.gov. A fund's Forms N-PORT may be reviewed and copied at the SEC’s Public Reference Room in Washington, DC. Information regarding the operation of the SEC's Public Reference Room may be obtained by calling 1-800-SEC-0330.
For a complete list of a fund's portfolio holdings, view the most recent holdings listing, semiannual report, or annual report on Fidelity's web site at http://www.fidelity.com, http://www.institutional.fidelity.com, or http://www.401k.com, as applicable.
NOT FDIC INSURED •MAY LOSE VALUE •NO BANK GUARANTEE
Neither the Fund nor Fidelity Distributors Corporation is a bank.
Investment Summary (Unaudited)
Top Five Holdings as of June 30, 2019
| (by issuer, excluding cash equivalents) | % of fund's net assets |
| U.S. Treasury Obligations | 10.4 |
| Brazilian Federative Republic | 3.1 |
| Liberty Media Corp. | 2.0 |
| DISH Network Corp. | 1.7 |
| Microsoft Corp. | 1.7 |
| | 18.9 |
Top Five Market Sectors as of June 30, 2019
| | % of fund's net assets |
| Consumer Discretionary | 12.0 |
| Financials | 11.7 |
| Industrials | 10.0 |
| Energy | 9.8 |
| Communication Services | 9.8 |
Quality Diversification (% of fund's net assets)
| As of June 30, 2019 |
| | U.S. Government and U.S. Government Agency Obligations | 10.4% |
| | BBB | 2.9% |
| | BB | 11.5% |
| | B | 10.7% |
| | CCC,CC,C | 4.8% |
| | Not Rated | 4.0% |
| | Equities | 55.4% |
| | Short-Term Investments and Net Other Assets | 0.3% |

We have used ratings from Moody's Investors Service, Inc. Where Moody's® ratings are not available, we have used S&P® ratings. All ratings are as of the date indicated and do not reflect subsequent changes.
Asset Allocation (% of fund's net assets)
| As of June 30, 2019* |
| | Preferred Securities | 3.2% |
| | Corporate Bonds | 20.7% |
| | U.S. Government and U.S. Government Agency Obligations | 10.4% |
| | Foreign Government & Government Agency Obligations | 3.1% |
| | Bank Loan Obligations | 6.9% |
| | Stocks | 54.4% |
| | Other Investments | 1.0% |
| | Short-Term Investments and Net Other Assets (Liabilities) | 0.3% |
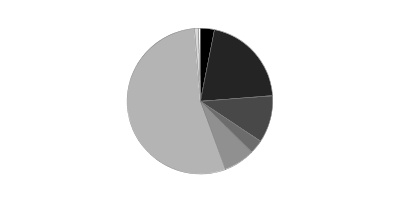
* Foreign investments - 25.5%
Schedule of Investments June 30, 2019 (Unaudited)
Showing Percentage of Net Assets
| Corporate Bonds - 20.7% | | | |
| | | Principal Amount | Value |
| Convertible Bonds - 7.6% | | | |
| COMMUNICATION SERVICES - 3.7% | | | |
| Media - 3.7% | | | |
| DISH Network Corp. 3.375% 8/15/26 | | $1,424,000 | $1,384,390 |
| Liberty Media Corp.: | | | |
| 1.375% 10/15/23 | | 914,000 | 1,025,915 |
| 2.25% 9/30/46 | | 1,210,000 | 646,663 |
| | | | 3,056,968 |
| CONSUMER DISCRETIONARY - 2.0% | | | |
| Hotels, Restaurants & Leisure - 1.6% | | | |
| Caesars Entertainment Corp. 5% 10/1/24 | | 610,399 | 1,044,805 |
| Sea Ltd. 2.25% 7/1/23 | | 161,000 | 292,572 |
| | | | 1,337,377 |
| Internet & Direct Marketing Retail - 0.4% | | | |
| MercadoLibre, Inc. 2% 8/15/28 (a) | | 238,000 | 366,623 |
| TOTAL CONSUMER DISCRETIONARY | | | 1,704,000 |
| HEALTH CARE - 0.7% | | | |
| Life Sciences Tools & Services - 0.7% | | | |
| Illumina, Inc. 0.5% 6/15/21 | | 356,000 | 549,047 |
| INFORMATION TECHNOLOGY - 1.2% | | | |
| Semiconductors & Semiconductor Equipment - 1.2% | | | |
| Micron Technology, Inc. 3.125% 5/1/32 | | 159,000 | 612,240 |
| ON Semiconductor Corp. 1% 12/1/20 | | 287,000 | 352,578 |
| | | | 964,818 |
|
| TOTAL CONVERTIBLE BONDS | | | 6,274,833 |
|
| Nonconvertible Bonds - 13.1% | | | |
| COMMUNICATION SERVICES - 2.6% | | | |
| Diversified Telecommunication Services - 1.7% | | | |
| Cumulus Media New Holdings, Inc. 6.75% 7/1/26 (a) | | 265,000 | 264,338 |
| Intelsat Luxembourg SA 8.125% 6/1/23 | | 640,000 | 494,400 |
| Sprint Capital Corp. 8.75% 3/15/32 | | 565,000 | 653,988 |
| | | | 1,412,726 |
| Entertainment - 0.5% | | | |
| Viacom, Inc. 6.25% 2/28/57 (b) | | 425,000 | 439,875 |
| Media - 0.4% | | | |
| Altice SA 7.625% 2/15/25 (a) | | 285,000 | 268,078 |
| Charter Communications Operating LLC/Charter Communications Operating Capital Corp. 4.908% 7/23/25 | | 5,000 | 5,425 |
| Time Warner Cable, Inc. 6.55% 5/1/37 | | 5,000 | 5,772 |
| | | | 279,275 |
| Wireless Telecommunication Services - 0.0% | | | |
| Sprint Communications, Inc. 7% 3/1/20 (a) | | 25,000 | 25,625 |
| TOTAL COMMUNICATION SERVICES | | | 2,157,501 |
| CONSUMER DISCRETIONARY - 1.0% | | | |
| Diversified Consumer Services - 1.0% | | | |
| Laureate Education, Inc. 8.25% 5/1/25 (a) | | 778,000 | 849,965 |
| CONSUMER STAPLES - 2.9% | | | |
| Food Products - 2.9% | | | |
| CF Industries Holdings, Inc. 4.95% 6/1/43 | | 705,000 | 630,975 |
| JBS Investments II GmbH 7% 1/15/26 (a) | | 735,000 | 796,005 |
| JBS U.S.A. LLC/JBS U.S.A. Finance, Inc. 6.75% 2/15/28 (a) | | 920,000 | 999,350 |
| | | | 2,426,330 |
| ENERGY - 2.8% | | | |
| Oil, Gas & Consumable Fuels - 2.8% | | | |
| California Resources Corp. 8% 12/15/22 (a) | | 355,000 | 267,581 |
| Comstock Escrow Corp. 9.75% 8/15/26 | | 355,000 | 272,463 |
| Consolidated Energy Finance SA 6.5% 5/15/26 (a) | | 450,000 | 446,625 |
| DCP Midstream LLC 5.85% 5/21/43 (a)(b) | | 505,000 | 473,438 |
| MEG Energy Corp.: | | | |
| 6.375% 1/30/23 (a) | | 365,000 | 347,663 |
| 7% 3/31/24 (a) | | 515,000 | 489,250 |
| Petroleos Mexicanos 6.75% 9/21/47 | | 14,000 | 12,419 |
| The Williams Companies, Inc. 5.75% 6/24/44 | | 20,000 | 23,319 |
| | | | 2,332,758 |
| FINANCIALS - 0.7% | | | |
| Banks - 0.0% | | | |
| Royal Bank of Scotland Group PLC 6% 12/19/23 | | 30,000 | 32,658 |
| Capital Markets - 0.1% | | | |
| Goldman Sachs Group, Inc. 5.15% 5/22/45 | | 30,000 | 34,284 |
| Morgan Stanley 5% 11/24/25 | | 30,000 | 33,193 |
| | | | 67,477 |
| Consumer Finance - 0.2% | | | |
| Ally Financial, Inc. 8% 11/1/31 | | 150,000 | 196,500 |
| Diversified Financial Services - 0.4% | | | |
| Financial & Risk U.S. Holdings, Inc. 8.25% 11/15/26 (a) | | 280,000 | 287,980 |
| TOTAL FINANCIALS | | | 584,615 |
| HEALTH CARE - 0.3% | | | |
| Health Care Providers & Services - 0.3% | | | |
| Community Health Systems, Inc. 6.25% 3/31/23 | | 180,000 | 173,250 |
| CVS Health Corp.: | | | |
| 4.1% 3/25/25 | | 5,000 | 5,271 |
| 4.3% 3/25/28 | | 4,000 | 4,216 |
| 4.78% 3/25/38 | | 2,000 | 2,085 |
| 5.05% 3/25/48 | | 3,000 | 3,191 |
| HCA Holdings, Inc. 6.5% 2/15/20 | | 10,000 | 10,230 |
| | | | 198,243 |
| INDUSTRIALS - 2.3% | | | |
| Aerospace & Defense - 1.0% | | | |
| Bombardier, Inc. 7.5% 12/1/24 (a) | | 500,000 | 510,000 |
| TransDigm, Inc. 7.5% 3/15/27 (a) | | 330,000 | 344,438 |
| | | | 854,438 |
| Air Freight & Logistics - 0.7% | | | |
| Aercap Global Aviation Trust 6.5% 6/15/45 (a)(b) | | 570,000 | 595,650 |
| Commercial Services & Supplies - 0.3% | | | |
| LBC Tank Terminals Holding Netherlands BV 6.875% 5/15/23 (a) | | 240,000 | 237,600 |
| Road & Rail - 0.3% | | | |
| Hertz Corp. 5.5% 10/15/24 (a) | | 215,000 | 205,390 |
| TOTAL INDUSTRIALS | | | 1,893,078 |
| INFORMATION TECHNOLOGY - 0.5% | | | |
| Electronic Equipment & Components - 0.2% | | | |
| TTM Technologies, Inc. 5.625% 10/1/25 (a) | | 165,000 | 161,330 |
| IT Services - 0.3% | | | |
| Banff Merger Sub, Inc. 9.75% 9/1/26 (a) | | 265,000 | 229,888 |
| TOTAL INFORMATION TECHNOLOGY | | | 391,218 |
| REAL ESTATE - 0.0% | | | |
| Equity Real Estate Investment Trusts (REITs) - 0.0% | | | |
| Omega Healthcare Investors, Inc. 4.5% 4/1/27 | | 17,000 | 17,769 |
| UTILITIES - 0.0% | | | |
| Independent Power and Renewable Electricity Producers - 0.0% | | | |
| Dolphin Subsidiary II, Inc. 7.25% 10/15/21 | | 14,000 | 15,050 |
|
| TOTAL NONCONVERTIBLE BONDS | | | 10,866,527 |
|
| TOTAL CORPORATE BONDS | | | |
| (Cost $16,332,049) | | | 17,141,360 |
|
| U.S. Government and Government Agency Obligations - 10.4% | | | |
| U.S. Treasury Inflation-Protected Obligations - 0.2% | | | |
| U.S. Treasury Inflation-Indexed Bonds 0.75% 2/15/45 | | 21,704 | 21,491 |
| U.S. Treasury Inflation-Indexed Notes: | | | |
| 0.375% 7/15/25 | | $32,328 | $32,680 |
| 0.625% 1/15/26 | | 64,529 | 66,070 |
|
| TOTAL U.S. TREASURY INFLATION-PROTECTED OBLIGATIONS | | | 120,241 |
|
| U.S. Treasury Obligations - 10.2% | | | |
| U.S. Treasury Bonds: | | | |
| 3% 2/15/49 | | 81,000 | 88,834 |
| 3.375% 11/15/48 | | 6,685,000 | 7,858,001 |
| U.S. Treasury Notes: | | | |
| 2% 12/31/21 | | 99,000 | 99,638 |
| 2.125% 12/31/22 | | 80,000 | 81,066 |
| 2.125% 3/31/24 | | 99,000 | 100,605 |
| 2.625% 2/15/29 | | 100,000 | 105,395 |
| 2.75% 2/28/25 | | 110,000 | 115,504 |
|
| TOTAL U.S. TREASURY OBLIGATIONS | | | 8,449,043 |
|
| TOTAL U.S. GOVERNMENT AND GOVERNMENT AGENCY OBLIGATIONS | | | |
| (Cost $7,914,911) | | | 8,569,284 |
|
| Municipal Securities - 0.0% | | | |
| Illinois Gen. Oblig. Series 2003, 5.1% 6/1/33 | | | |
| (Cost $14,032) | | 15,000 | 15,796 |
|
| Foreign Government and Government Agency Obligations - 3.1% | | | |
Brazilian Federative Republic 5.625% 2/21/47
(Cost $2,363,233) | | $2,370,000 | $2,529,975 |
| | | Shares | Value |
|
| Common Stocks - 52.2% | | | |
| COMMUNICATION SERVICES - 3.5% | | | |
| Diversified Telecommunication Services - 0.2% | | | |
| Verizon Communications, Inc. | | 2,720 | 155,394 |
| Entertainment - 0.8% | | | |
| The Walt Disney Co. | | 4,856 | 678,092 |
| Interactive Media & Services - 1.5% | | | |
| Alphabet, Inc. Class A (c) | | 495 | 535,986 |
| Facebook, Inc. Class A (c) | | 3,450 | 665,850 |
| | | | 1,201,836 |
| Media - 0.4% | | | |
| Comcast Corp. Class A | | 7,800 | 329,784 |
| Wireless Telecommunication Services - 0.6% | | | |
| T-Mobile U.S., Inc. (c) | | 6,861 | 508,675 |
|
| TOTAL COMMUNICATION SERVICES | | | 2,873,781 |
|
| CONSUMER DISCRETIONARY - 5.4% | | | |
| Hotels, Restaurants & Leisure - 0.9% | | | |
| Marriott International, Inc. Class A | | 2,900 | 406,841 |
| McDonald's Corp. | | 1,425 | 295,916 |
| Royal Caribbean Cruises Ltd. | | 78 | 9,454 |
| | | | 712,211 |
| Household Durables - 0.6% | | | |
| Sony Corp. sponsored ADR | | 9,600 | 502,944 |
| Internet & Direct Marketing Retail - 1.4% | | | |
| Amazon.com, Inc. (c) | | 515 | 975,219 |
| Pinduoduo, Inc. ADR | | 10,900 | 224,867 |
| | | | 1,200,086 |
| Leisure Products - 0.6% | | | |
| BRP, Inc. | | 13,000 | 464,587 |
| Multiline Retail - 0.7% | | | |
| Dollarama, Inc. | | 16,400 | 576,952 |
| Specialty Retail - 0.7% | | | |
| Lowe's Companies, Inc. | | 2,904 | 293,043 |
| TJX Companies, Inc. | | 5,533 | 292,585 |
| | | | 585,628 |
| Textiles, Apparel & Luxury Goods - 0.5% | | | |
| PVH Corp. | | 33 | 3,123 |
| Tapestry, Inc. | | 13,800 | 437,874 |
| | | | 440,997 |
|
| TOTAL CONSUMER DISCRETIONARY | | | 4,483,405 |
|
| CONSUMER STAPLES - 6.0% | | | |
| Beverages - 0.5% | | | |
| Diageo PLC | | 156 | 6,714 |
| PepsiCo, Inc. | | 2,953 | 387,227 |
| | | | 393,941 |
| Food & Staples Retailing - 1.2% | | | |
| Alimentation Couche-Tard, Inc. Class B (sub. vtg.) | | 4,300 | 270,599 |
| Sysco Corp. | | 4,000 | 282,880 |
| Walmart, Inc. | | 4,004 | 442,402 |
| | | | 995,881 |
| Food Products - 3.1% | | | |
| Archer Daniels Midland Co. | | 7,600 | 310,080 |
| Bunge Ltd. | | 11,900 | 662,949 |
| Darling International, Inc. (c) | | 25,600 | 509,184 |
| JBS SA | | 65,900 | 364,171 |
| McCormick & Co., Inc. (non-vtg.) | | 27 | 4,185 |
| Nestle SA sponsored ADR | | 4,550 | 470,470 |
| The Kraft Heinz Co. | | 8,256 | 256,266 |
| | | | 2,577,305 |
| Household Products - 0.7% | | | |
| Colgate-Palmolive Co. | | 4,300 | 308,181 |
| Procter & Gamble Co. | | 2,100 | 230,265 |
| | | | 538,446 |
| Personal Products - 0.5% | | | |
| Unilever NV: | | | |
| (Certificaten Van Aandelen) (Bearer) | | 155 | 9,418 |
| (NY Reg.) | | 6,850 | 415,932 |
| | | | 425,350 |
| Tobacco - 0.0% | | | |
| Altria Group, Inc. | | 134 | 6,345 |
| Philip Morris International, Inc. | | 134 | 10,523 |
| | | | 16,868 |
|
| TOTAL CONSUMER STAPLES | | | 4,947,791 |
|
| ENERGY - 5.7% | | | |
| Oil, Gas & Consumable Fuels - 5.7% | | | |
| BP PLC sponsored ADR | | 9,100 | 379,470 |
| Cheniere Energy, Inc. (c) | | 7,300 | 499,685 |
| Chevron Corp. | | 146 | 18,168 |
| ConocoPhillips Co. | | 6,112 | 372,832 |
| DHT Holdings, Inc. | | 125,500 | 741,705 |
| Enterprise Products Partners LP | | 24,200 | 698,654 |
| Phillips 66 Co. | | 78 | 7,296 |
| PrairieSky Royalty Ltd. | | 17,400 | 244,481 |
| Scorpio Tankers, Inc. | | 24,500 | 723,240 |
| Suncor Energy, Inc. | | 225 | 7,019 |
| Targa Resources Corp. | | 12,000 | 471,120 |
| The Williams Companies, Inc. | | 20,800 | 583,232 |
| Valero Energy Corp. | | 78 | 6,678 |
| | | | 4,753,580 |
| FINANCIALS - 7.9% | | | |
| Banks - 5.4% | | | |
| Bank of America Corp. | | 25,828 | 749,012 |
| Citigroup, Inc. | | 9,400 | 658,282 |
| JPMorgan Chase & Co. | | 8,704 | 973,107 |
| M&T Bank Corp. | | 2,794 | 475,176 |
| PNC Financial Services Group, Inc. | | 4,750 | 652,080 |
| SunTrust Banks, Inc. | | 6,178 | 388,287 |
| U.S. Bancorp | | 10,200 | 534,480 |
| Wells Fargo & Co. | | 384 | 18,171 |
| | | | 4,448,595 |
| Capital Markets - 1.1% | | | |
| BM&F BOVESPA SA | | 96,500 | 941,390 |
| Diversified Financial Services - 0.6% | | | |
| Berkshire Hathaway, Inc. Class B (c) | | 2,227 | 474,730 |
| Insurance - 0.8% | | | |
| Chubb Ltd. | | 4,704 | 692,852 |
| Marsh & McLennan Companies, Inc. | | 78 | 7,781 |
| MetLife, Inc. | | 152 | 7,550 |
| | | | 708,183 |
|
| TOTAL FINANCIALS | | | 6,572,898 |
|
| HEALTH CARE - 3.9% | | | |
| Biotechnology - 0.3% | | | |
| Amgen, Inc. | | 1,532 | 282,317 |
| Health Care Equipment & Supplies - 0.3% | | | |
| Alcon, Inc. (c) | | 25 | 1,551 |
| Becton, Dickinson & Co. | | 875 | 220,509 |
| | | | 222,060 |
| Health Care Providers & Services - 1.0% | | | |
| Cigna Corp. | | 24 | 3,781 |
| HCA Holdings, Inc. | | 2,800 | 378,476 |
| UnitedHealth Group, Inc. | | 1,662 | 405,545 |
| | | | 787,802 |
| Pharmaceuticals - 2.3% | | | |
| AstraZeneca PLC (United Kingdom) | | 104 | 8,502 |
| Bristol-Myers Squibb Co. | | 6,066 | 275,093 |
| Corteva, Inc. | | 73 | 2,159 |
| Eli Lilly & Co. | | 5 | 554 |
| Johnson & Johnson | | 3,775 | 525,782 |
| Merck & Co., Inc. | | 4,300 | 360,555 |
| Roche Holding AG: | | | |
| (participation certificate) | | 41 | 11,529 |
| sponsored ADR (c) | | 12,450 | 436,995 |
| Sanofi SA sponsored ADR | | 7,478 | 323,573 |
| | | | 1,944,742 |
|
| TOTAL HEALTH CARE | | | 3,236,921 |
|
| INDUSTRIALS - 6.1% | | | |
| Aerospace & Defense - 1.8% | | | |
| CAE, Inc. | | 11,300 | 303,824 |
| General Dynamics Corp. | | 2,121 | 385,640 |
| Northrop Grumman Corp. | | 1,559 | 503,728 |
| The Boeing Co. | | 700 | 254,807 |
| United Technologies Corp. | | 71 | 9,244 |
| | | | 1,457,243 |
| Air Freight & Logistics - 0.5% | | | |
| Deutsche Post AG | | 57 | 1,873 |
| FedEx Corp. | | 2,400 | 394,056 |
| | | | 395,929 |
| Airlines - 0.3% | | | |
| Delta Air Lines, Inc. | | 5,100 | 289,425 |
| Electrical Equipment - 0.5% | | | |
| Fortive Corp. | | 5,200 | 423,904 |
| Industrial Conglomerates - 1.5% | | | |
| General Electric Co. | | 56,269 | 590,825 |
| Honeywell International, Inc. | | 3,575 | 624,159 |
| | | | 1,214,984 |
| Machinery - 1.1% | | | |
| Deere & Co. | | 3,600 | 596,556 |
| Ingersoll-Rand PLC | | 2,606 | 330,102 |
| | | | 926,658 |
| Professional Services - 0.0% | | | |
| Equifax, Inc. | | 29 | 3,922 |
| Road & Rail - 0.4% | | | |
| Norfolk Southern Corp. | | 1,865 | 371,750 |
|
| TOTAL INDUSTRIALS | | | 5,083,815 |
|
| INFORMATION TECHNOLOGY - 6.7% | | | |
| Communications Equipment - 1.5% | | | |
| Cisco Systems, Inc. | | 14,036 | 768,190 |
| Telefonaktiebolaget LM Ericsson (B Shares) sponsored ADR | | 47,600 | 452,200 |
| | | | 1,220,390 |
| Electronic Equipment & Components - 0.5% | | | |
| Corning, Inc. | | 12,900 | 428,667 |
| IT Services - 0.0% | | | |
| Amdocs Ltd. | | 29 | 1,801 |
| Paychex, Inc. | | 42 | 3,456 |
| | | | 5,257 |
| Semiconductors & Semiconductor Equipment - 1.6% | | | |
| Lam Research Corp. | | 1,900 | 356,896 |
| NXP Semiconductors NV | | 5,158 | 503,472 |
| Qualcomm, Inc. | | 6,361 | 483,881 |
| | | | 1,344,249 |
| Software - 1.7% | | | |
| Microsoft Corp. | | 10,308 | 1,380,860 |
| Technology Hardware, Storage & Peripherals - 1.4% | | | |
| Apple, Inc. | | 5,851 | 1,158,030 |
|
| TOTAL INFORMATION TECHNOLOGY | | | 5,537,453 |
|
| MATERIALS - 5.3% | | | |
| Chemicals - 0.5% | | | |
| CF Industries Holdings, Inc. | | 9,400 | 439,074 |
| Dow, Inc. (c) | | 73 | 3,600 |
| DowDuPont, Inc. | | 73 | 5,480 |
| | | | 448,154 |
| Containers & Packaging - 0.5% | | | |
| Ardagh Group SA | | 23,227 | 406,473 |
| Metals & Mining - 3.9% | | | |
| Barrick Gold Corp. (Canada) | | 22,000 | 347,249 |
| BHP Billiton Ltd. sponsored ADR (d) | | 9,300 | 540,423 |
| Franco-Nevada Corp. | | 7,400 | 628,086 |
| Newmont Goldcorp Corp. | | 9,300 | 357,771 |
| Royal Gold, Inc. | | 5,900 | 604,691 |
| Wheaton Precious Metals Corp. | | 30,100 | 727,935 |
| | | | 3,206,155 |
| Paper & Forest Products - 0.4% | | | |
| Louisiana-Pacific Corp. | | 13,200 | 346,104 |
|
| TOTAL MATERIALS | | | 4,406,886 |
|
| REAL ESTATE - 1.7% | | | |
| Equity Real Estate Investment Trusts (REITs) - 1.7% | | | |
| American Tower Corp. | | 99 | 20,241 |
| Equinix, Inc. | | 615 | 310,138 |
| Simon Property Group, Inc. | | 2,635 | 420,968 |
| Weyerhaeuser Co. | | 23,000 | 605,820 |
| | | | 1,357,167 |
| UTILITIES - 0.0% | | | |
| Electric Utilities - 0.0% | | | |
| Exelon Corp. | | 269 | 12,896 |
| Vistra Energy Corp. | | 311 | 7,041 |
| | | | 19,937 |
| Multi-Utilities - 0.0% | | | |
| Ameren Corp. | | 124 | 9,314 |
|
| TOTAL UTILITIES | | | 29,251 |
|
| TOTAL COMMON STOCKS | | | |
| (Cost $39,407,548) | | | 43,282,948 |
|
| Convertible Preferred Stocks - 2.2% | | | |
| HEALTH CARE - 0.6% | | | |
| Health Care Technology - 0.6% | | | |
| Change Healthcare, Inc. 6.00% (c) | | 8,500 | 472,175 |
| INDUSTRIALS - 0.6% | | | |
| Trading Companies & Distributors - 0.6% | | | |
| Avantor, Inc. Series A 6.25% | | 8,100 | 533,466 |
| UTILITIES - 1.0% | | | |
| Electric Utilities - 1.0% | | | |
| Vistra Energy Corp. 7.00% | | 8,650 | 798,828 |
| TOTAL CONVERTIBLE PREFERRED STOCKS | | | |
| (Cost $1,741,785) | | | 1,804,469 |
| | | Principal Amount | Value |
|
| Bank Loan Obligations - 6.9% | | | |
| CONSUMER DISCRETIONARY - 3.6% | | | |
| Diversified Consumer Services - 1.6% | | | |
| Spin Holdco, Inc. Tranche B, term loan 3 month U.S. LIBOR + 3.250% 5.851% 11/14/22 (b)(e) | | 1,022,268 | 1,000,729 |
| WASH Multifamily Acquisition, Inc. Tranche B 1LN, term loan: | | | |
| 3 month U.S. LIBOR + 3.250% 5.6524% 5/14/22 (b)(e) | | 280,008 | 274,408 |
| 3 month U.S. LIBOR + 3.250% 5.6524% 5/14/22 (b)(e) | | 43,386 | 42,518 |
| | | | 1,317,655 |
| Hotels, Restaurants & Leisure - 0.5% | | | |
| Delta 2 SARL Tranche B, term loan 3 month U.S. LIBOR + 2.500% 4.9024% 2/1/24 (b)(e) | | 415,000 | 404,833 |
| Internet & Direct Marketing Retail - 1.5% | | | |
| Bass Pro Shops LLC. Tranche B, term loan 3 month U.S. LIBOR + 5.000% 7.4024% 9/25/24 (b)(e) | | 1,363,581 | 1,300,229 |
|
| TOTAL CONSUMER DISCRETIONARY | | | 3,022,717 |
|
| ENERGY - 0.9% | | | |
| Oil, Gas & Consumable Fuels - 0.9% | | | |
| California Resources Corp.: | | | |
| Tranche 1LN, term loan 3 month U.S. LIBOR + 10.375% 12.7774% 12/31/21 (b)(e) | | 435,000 | 440,655 |
| Tranche B, term loan 3 month U.S. LIBOR + 4.750% 7.1524% 12/31/22 (b)(e) | | 320,000 | 305,373 |
| | | | 746,028 |
| FINANCIALS - 0.5% | | | |
| Diversified Financial Services - 0.5% | | | |
| Financial & Risk U.S. Holdings, Inc. Tranche B, term loan 3 month U.S. LIBOR + 3.750% 6.1524% 10/1/25 (b)(e) | | 412,925 | 400,149 |
| INDUSTRIALS - 0.7% | | | |
| Commercial Services & Supplies - 0.7% | | | |
| Lineage Logistics Holdings, LLC. Tranche B, term loan 3 month U.S. LIBOR + 3.000% 5.4024% 2/27/25 (b)(e) | | 591,693 | 585,592 |
| INFORMATION TECHNOLOGY - 0.9% | | | |
| IT Services - 0.4% | | | |
| Web.com Group, Inc.: | | | |
| 2LN, term loan 3 month U.S. LIBOR + 7.750% 10.1606% 10/11/26 (b)(e) | | 178,753 | 175,178 |
| Tranche B 1LN, term loan 3 month U.S. LIBOR + 3.750% 6.1606% 10/11/25 (b)(e) | | 212,217 | 209,034 |
| | | | 384,212 |
| Software - 0.5% | | | |
| Landesk Group, Inc. term loan 3 month U.S. LIBOR + 4.250% 6.67% 1/20/24 (b)(e) | | 199,038 | 198,292 |
| Vertafore, Inc. Tranche B 1LN, term loan 3 month U.S. LIBOR + 3.250% 5.6524% 7/2/25 (b)(e) | | 199,000 | 190,956 |
| | | | 389,248 |
|
| TOTAL INFORMATION TECHNOLOGY | | | 773,460 |
|
| MATERIALS - 0.3% | | | |
| Containers & Packaging - 0.3% | | | |
| Flex Acquisition Co., Inc. Tranche B 1LN, term loan 3 month U.S. LIBOR + 3.000% 5.44% 12/29/23 (b)(e) | | 232,365 | 220,456 |
| TOTAL BANK LOAN OBLIGATIONS | | | |
| (Cost $5,833,385) | | | 5,748,402 |
| | | Shares | Value |
|
| Fixed-Income Funds - 1.0% | | | |
| iShares JPMorgan USD Emerging Markets Bond ETF | | | |
| (Cost $780,378) | | 7,480 | 847,409 |
| | | Principal Amount | Value |
|
| Preferred Securities - 3.2% | | | |
| ENERGY - 0.3% | | | |
| Oil, Gas & Consumable Fuels - 0.3% | | | |
| Energy Transfer Partners LP 6.25% (b)(f) | | 280,000 | 266,938 |
| FINANCIALS - 2.6% | | | |
| Banks - 2.3% | | | |
| Bank of America Corp. 5.125% (b)(f) | | 300,000 | 302,337 |
| Barclays PLC 8% (b)(f) | | 205,000 | 219,265 |
| Citigroup, Inc. 5.9% (b)(f) | | 280,000 | 296,409 |
| JPMorgan Chase & Co. 5.15% (b)(f) | | 210,000 | 214,680 |
| Lloyds Bank PLC 6.75% (b)(f) | | 235,000 | 241,229 |
| Wachovia Capital Trust III 3 month U.S. LIBOR + 0.930% 5.5698% (b)(e)(f) | | 590,000 | 591,549 |
| | | | 1,865,469 |
| Capital Markets - 0.3% | | | |
| Goldman Sachs Group, Inc. 5.5% (b)(f) | | 275,000 | 282,107 |
|
| TOTAL FINANCIALS | | | 2,147,576 |
|
| INDUSTRIALS - 0.3% | | | |
| Industrial Conglomerates - 0.3% | | | |
| General Electric Co. 5% (b)(f) | | 270,000 | 259,590 |
| TOTAL PREFERRED SECURITIES | | | |
| (Cost $2,558,456) | | | 2,674,104 |
| | | Shares | Value |
|
| Money Market Funds - 1.8% | | | |
| Fidelity Cash Central Fund 2.42% (g) | | 1,100,813 | 1,101,034 |
| Fidelity Securities Lending Cash Central Fund 2.42% (g)(h) | | 404,569 | 404,610 |
| TOTAL MONEY MARKET FUNDS | | | |
| (Cost $1,505,642) | | | 1,505,644 |
| TOTAL INVESTMENT IN SECURITIES - 101.5% | | | |
| (Cost $78,451,419) | | | 84,119,391 |
| NET OTHER ASSETS (LIABILITIES) - (1.5)% | | | (1,204,978) |
| NET ASSETS - 100% | | | $82,914,413 |
Security Type Abbreviations
ETF – Exchange-Traded Fund
Legend
(a) Security exempt from registration under Rule 144A of the Securities Act of 1933. These securities may be resold in transactions exempt from registration, normally to qualified institutional buyers. At the end of the period, the value of these securities amounted to $8,166,817 or 9.8% of net assets.
(b) Coupon rates for floating and adjustable rate securities reflect the rates in effect at period end.
(c) Non-income producing
(d) Security or a portion of the security is on loan at period end.
(e) Coupon is indexed to a floating interest rate which may be multiplied by a specified factor and/or subject to caps or floors.
(f) Security is perpetual in nature with no stated maturity date.
(g) Affiliated fund that is generally available only to investment companies and other accounts managed by Fidelity Investments. The rate quoted is the annualized seven-day yield of the fund at period end. A complete unaudited listing of the fund's holdings as of its most recent quarter end is available upon request. In addition, each Fidelity Central Fund's financial statements are available on the SEC's website or upon request.
(h) Investment made with cash collateral received from securities on loan.
Affiliated Central Funds
Information regarding fiscal year to date income earned by the Fund from investments in Fidelity Central Funds is as follows:
| Fund | Income earned |
| Fidelity Cash Central Fund | $11,553 |
| Fidelity Securities Lending Cash Central Fund | 1,550 |
| Total | $13,103 |
Amounts in the income column in the above table include any capital gain distributions from underlying funds, which are presented in the corresponding line-item in the Statement of Operations, if applicable. Amount for Fidelity Securities Lending Cash Central Fund represents securities lending income earned from the reinvestment of cash collateral from loaned securities, net of payments to and from borrowers of securities.
Investment Valuation
The following is a summary of the inputs used, as of June 30, 2019, involving the Fund's assets and liabilities carried at fair value. The inputs or methodology used for valuing securities may not be an indication of the risk associated with investing in those securities. For more information on valuation inputs, and their aggregation into the levels used below, please refer to the Investment Valuation section in the accompanying Notes to Financial Statements.
| | Valuation Inputs at Reporting Date: |
| Description | Total | Level 1 | Level 2 | Level 3 |
| Investments in Securities: | | | | |
| Equities: | | | | |
| Communication Services | $2,873,781 | $2,873,781 | $-- | $-- |
| Consumer Discretionary | 4,483,405 | 4,483,405 | -- | -- |
| Consumer Staples | 4,947,791 | 4,931,659 | 16,132 | -- |
| Energy | 4,753,580 | 4,753,580 | -- | -- |
| Financials | 6,572,898 | 6,572,898 | -- | -- |
| Health Care | 3,709,096 | 3,216,890 | 492,206 | -- |
| Industrials | 5,617,281 | 5,083,815 | 533,466 | -- |
| Information Technology | 5,537,453 | 5,537,453 | -- | -- |
| Materials | 4,406,886 | 4,406,886 | -- | -- |
| Real Estate | 1,357,167 | 1,357,167 | -- | -- |
| Utilities | 828,079 | 29,251 | 798,828 | -- |
| Corporate Bonds | 17,141,360 | -- | 17,141,360 | -- |
| U.S. Government and Government Agency Obligations | 8,569,284 | -- | 8,569,284 | -- |
| Municipal Securities | 15,796 | -- | 15,796 | -- |
| Foreign Government and Government Agency Obligations | 2,529,975 | -- | 2,529,975 | -- |
| Bank Loan Obligations | 5,748,402 | -- | 5,748,402 | -- |
| Fixed-Income Funds | 847,409 | 847,409 | -- | -- |
| Preferred Securities | 2,674,104 | -- | 2,674,104 | -- |
| Money Market Funds | 1,505,644 | 1,505,644 | -- | -- |
| Total Investments in Securities: | $84,119,391 | $45,599,838 | $38,519,553 | $-- |
Other Information
Distribution of investments by country or territory of incorporation, as a percentage of Total Net Assets, is as follows (Unaudited):
| United States of America | 74.5% |
| Canada | 6.0% |
| Brazil | 4.6% |
| Luxembourg | 2.6% |
| Switzerland | 1.9% |
| Marshall Islands | 1.8% |
| Netherlands | 1.4% |
| Multi-National | 1.2% |
| United Kingdom | 1.1% |
| Others (Individually Less Than 1%) | 4.9% |
| | 100.0% |
See accompanying notes which are an integral part of the financial statements.
Financial Statements
Statement of Assets and Liabilities
| | | June 30, 2019 (Unaudited) |
| Assets | | |
Investment in securities, at value (including securities loaned of $395,148) — See accompanying schedule:
Unaffiliated issuers (cost $76,945,777) | $82,613,747 | |
| Fidelity Central Funds (cost $1,505,642) | 1,505,644 | |
| Total Investment in Securities (cost $78,451,419) | | $84,119,391 |
| Cash | | 424,784 |
| Receivable for investments sold | | 2,014,248 |
| Receivable for fund shares sold | | 156,736 |
| Dividends receivable | | 50,987 |
| Interest receivable | | 339,158 |
| Distributions receivable from Fidelity Central Funds | | 1,265 |
| Receivable from investment adviser for expense reductions | | 4,323 |
| Other receivables | | 1,191 |
| Total assets | | 87,112,083 |
| Liabilities | | |
| Payable for investments purchased | $3,622,560 | |
| Payable for fund shares redeemed | 71,101 | |
| Distributions payable | 5,128 | |
| Accrued management fee | 35,902 | |
| Distribution and service plan fees payable | 8,072 | |
| Other affiliated payables | 10,443 | |
| Other payables and accrued expenses | 39,864 | |
| Collateral on securities loaned | 404,600 | |
| Total liabilities | | 4,197,670 |
| Net Assets | | $82,914,413 |
| Net Assets consist of: | | |
| Paid in capital | | $77,532,821 |
| Total distributable earnings (loss) | | 5,381,592 |
| Net Assets | | $82,914,413 |
| Net Asset Value and Maximum Offering Price | | |
| Class A: | | |
| Net Asset Value and redemption price per share ($18,398,247 ÷ 1,684,994 shares)(a) | | $10.92 |
| Maximum offering price per share (100/96.00 of $10.92) | | $11.38 |
| Class M: | | |
| Net Asset Value and redemption price per share ($8,533,980 ÷ 781,542 shares)(a) | | $10.92 |
| Maximum offering price per share (100/96.00 of $10.92) | | $11.38 |
| Class C: | | |
| Net Asset Value and offering price per share ($3,370,225 ÷ 309,053 shares)(a) | | $10.91 |
| Fidelity Multi-Asset Income Fund: | | |
| Net Asset Value, offering price and redemption price per share ($27,432,072 ÷ 2,511,104 shares) | | $10.92 |
| Class I: | | |
| Net Asset Value, offering price and redemption price per share ($25,014,030 ÷ 2,290,374 shares) | | $10.92 |
| Class Z: | | |
| Net Asset Value, offering price and redemption price per share ($165,859 ÷ 15,184 shares) | | $10.92 |
(a) Redemption price per share is equal to net asset value less any applicable contingent deferred sales charge.
See accompanying notes which are an integral part of the financial statements.
Statement of Operations
| | | Six months ended June 30, 2019 (Unaudited) |
| Investment Income | | |
| Dividends | | $554,730 |
| Interest | | 688,192 |
| Income from Fidelity Central Funds (including $1,550 from security lending) | | 13,103 |
| Total income | | 1,256,025 |
| Expenses | | |
| Management fee | $180,654 | |
| Transfer agent fees | 40,928 | |
| Distribution and service plan fees | 55,560 | |
| Accounting and security lending fees | 16,083 | |
| Custodian fees and expenses | 14,618 | |
| Independent trustees' fees and expenses | 110 | |
| Registration fees | 59,479 | |
| Audit | 53,275 | |
| Legal | 2,143 | |
| Miscellaneous | 158 | |
| Total expenses before reductions | 423,008 | |
| Expense reductions | (97,281) | |
| Total expenses after reductions | | 325,727 |
| Net investment income (loss) | | 930,298 |
| Realized and Unrealized Gain (Loss) | | |
| Net realized gain (loss) on: | | |
| Investment securities: | | |
| Unaffiliated issuers | 931,539 | |
| Fidelity Central Funds | (14) | |
| Foreign currency transactions | (2,519) | |
| Total net realized gain (loss) | | 929,006 |
| Change in net unrealized appreciation (depreciation) on: | | |
| Investment securities: | | |
| Unaffiliated issuers | 5,743,206 | |
| Fidelity Central Funds | 1 | |
| Assets and liabilities in foreign currencies | (1,582) | |
| Total change in net unrealized appreciation (depreciation) | | 5,741,625 |
| Net gain (loss) | | 6,670,631 |
| Net increase (decrease) in net assets resulting from operations | | $7,600,929 |
See accompanying notes which are an integral part of the financial statements.
Statement of Changes in Net Assets
| | Six months ended June 30, 2019 (Unaudited) | Year ended December 31, 2018 |
| Increase (Decrease) in Net Assets | | |
| Operations | | |
| Net investment income (loss) | $930,298 | $1,051,343 |
| Net realized gain (loss) | 929,006 | (572,901) |
| Change in net unrealized appreciation (depreciation) | 5,741,625 | (2,191,825) |
| Net increase (decrease) in net assets resulting from operations | 7,600,929 | (1,713,383) |
| Distributions to shareholders | (919,718) | (1,284,010) |
| Share transactions - net increase (decrease) | 23,405,204 | 6,963,706 |
| Total increase (decrease) in net assets | 30,086,415 | 3,966,313 |
| Net Assets | | |
| Beginning of period | 52,827,998 | 48,861,685 |
| End of period | $82,914,413 | $52,827,998 |
See accompanying notes which are an integral part of the financial statements.
Financial Highlights
Fidelity Advisor Multi-Asset Income Fund Class A
| | Six months ended (Unaudited) June 30, | Years endedDecember 31, | | | |
| | 2019 | 2018 | 2017 | 2016 | 2015 A |
| Selected Per–Share Data | | | | | |
| Net asset value, beginning of period | $9.81 | $10.41 | $10.14 | $9.91 | $10.00 |
| Income from Investment Operations | | | | | |
| Net investment income (loss)B | .145 | .223 | .243 | .438C | .097 |
| Net realized and unrealized gain (loss) | 1.108 | (.558) | .348 | .584 | (.060) |
| Total from investment operations | 1.253 | (.335) | .591 | 1.022 | .037 |
| Distributions from net investment income | (.143) | (.207)D | (.210) | (.439) | (.096) |
| Distributions from net realized gain | – | (.058)D | (.069) | (.353) | (.031) |
| Tax return of capital | – | – | (.042) | – | – |
| Total distributions | (.143) | (.265) | (.321) | (.792) | (.127) |
| Net asset value, end of period | $10.92 | $9.81 | $10.41 | $10.14 | $9.91 |
| Total ReturnE,F,G | 12.83% | (3.25)% | 5.94% | 10.55% | .36% |
| Ratios to Average Net AssetsH,I | | | | | |
| Expenses before reductions | 1.38%J | 1.38% | 1.38% | 1.73% | 2.10%J |
| Expenses net of fee waivers, if any | 1.10%J | 1.10% | 1.10% | 1.10% | 1.10%J |
| Expenses net of all reductions | 1.09%J | 1.08% | 1.09% | 1.10% | 1.10%J |
| Net investment income (loss) | 2.80%J | 2.19% | 2.38% | 4.32%C | 3.10%J |
| Supplemental Data | | | | | |
| Net assets, end of period (000 omitted) | $18,398 | $9,513 | $10,443 | $9,524 | $6,284 |
| Portfolio turnover rateK | 365%J | 367% | 299% | 239% | 71%L |
A For the period September 9, 2015 (commencement of operations) to December 31, 2015.
B Calculated based on average shares outstanding during the period.
C Net investment income per share reflects a large, non-recurring dividend which amounted to $.031 per share. Excluding this non-recurring dividend, the ratio of net investment income (loss) to average net assets would have been 4.01%.
D The amounts shown reflect certain reclassifications related to book to tax differences that were made in the year shown.
E Total returns for periods of less than one year are not annualized.
F Total returns would have been lower if certain expenses had not been reduced during the applicable periods shown.
G Total returns do not include the effect of the sales charges.
H Fees and expenses of any underlying Fidelity Central Funds are not included in the Fund's expense ratio. The Fund indirectly bears its proportionate share of the expenses of any underlying Fidelity Central Funds.
I Expense ratios reflect operating expenses of the class. Expenses before reductions do not reflect amounts reimbursed by the investment adviser or reductions from brokerage service arrangements or reductions from other expense offset arrangements and do not represent the amount paid by the class during periods when reimbursements or reductions occur. Expense ratios before reductions for start-up periods may not be representative of longer-term operating periods. Expenses net of fee waivers reflect expenses after reimbursement by the investment adviser but prior to reductions from brokerage service arrangements or other expense offset arrangements. Expenses net of all reductions represent the net expenses paid by the class.
J Annualized
K Amount does not include the portfolio activity of any underlying Fidelity Central Funds.
L Amount not annualized.
See accompanying notes which are an integral part of the financial statements.
Fidelity Advisor Multi-Asset Income Fund Class M
| | Six months ended (Unaudited) June 30, | Years endedDecember 31, | | | |
| | 2019 | 2018 | 2017 | 2016 | 2015 A |
| Selected Per–Share Data | | | | | |
| Net asset value, beginning of period | $9.81 | $10.41 | $10.14 | $9.91 | $10.00 |
| Income from Investment Operations | | | | | |
| Net investment income (loss)B | .146 | .223 | .243 | .439C | .097 |
| Net realized and unrealized gain (loss) | 1.107 | (.558) | .348 | .583 | (.060) |
| Total from investment operations | 1.253 | (.335) | .591 | 1.022 | .037 |
| Distributions from net investment income | (.143) | (.207)D | (.210) | (.439) | (.096) |
| Distributions from net realized gain | – | (.058)D | (.069) | (.353) | (.031) |
| Tax return of capital | – | – | (.042) | – | – |
| Total distributions | (.143) | (.265) | (.321) | (.792) | (.127) |
| Net asset value, end of period | $10.92 | $9.81 | $10.41 | $10.14 | $9.91 |
| Total ReturnE,F,G | 12.83% | (3.25)% | 5.94% | 10.55% | .36% |
| Ratios to Average Net AssetsH,I | | | | | |
| Expenses before reductions | 1.44%J | 1.40% | 1.40% | 1.75% | 2.11%J |
| Expenses net of fee waivers, if any | 1.10%J | 1.10% | 1.10% | 1.10% | 1.10%J |
| Expenses net of all reductions | 1.09%J | 1.08% | 1.09% | 1.10% | 1.10%J |
| Net investment income (loss) | 2.80%J | 2.19% | 2.38% | 4.32%C | 3.10%J |
| Supplemental Data | | | | | |
| Net assets, end of period (000 omitted) | $8,534 | $7,441 | $7,511 | $7,171 | $5,578 |
| Portfolio turnover rateK | 365%J | 367% | 299% | 239% | 71%L |
A For the period September 9, 2015 (commencement of operations) to December 31, 2015.
B Calculated based on average shares outstanding during the period.
C Net investment income per share reflects a large, non-recurring dividend which amounted to $.031 per share. Excluding this non-recurring dividend, the ratio of net investment income (loss) to average net assets would have been 4.01%.
D The amounts shown reflect certain reclassifications related to book to tax differences that were made in the year shown.
E Total returns for periods of less than one year are not annualized.
F Total returns would have been lower if certain expenses had not been reduced during the applicable periods shown.
G Total returns do not include the effect of the sales charges.
H Fees and expenses of any underlying Fidelity Central Funds are not included in the Fund's expense ratio. The Fund indirectly bears its proportionate share of the expenses of any underlying Fidelity Central Funds.
I Expense ratios reflect operating expenses of the class. Expenses before reductions do not reflect amounts reimbursed by the investment adviser or reductions from brokerage service arrangements or reductions from other expense offset arrangements and do not represent the amount paid by the class during periods when reimbursements or reductions occur. Expense ratios before reductions for start-up periods may not be representative of longer-term operating periods. Expenses net of fee waivers reflect expenses after reimbursement by the investment adviser but prior to reductions from brokerage service arrangements or other expense offset arrangements. Expenses net of all reductions represent the net expenses paid by the class.
J Annualized
K Amount does not include the portfolio activity of any underlying Fidelity Central Funds.
L Amount not annualized.
See accompanying notes which are an integral part of the financial statements.
Fidelity Advisor Multi-Asset Income Fund Class C
| | Six months ended (Unaudited) June 30, | Years endedDecember 31, | | | |
| | 2019 | 2018 | 2017 | 2016 | 2015 A |
| Selected Per–Share Data | | | | | |
| Net asset value, beginning of period | $9.80 | $10.41 | $10.14 | $9.91 | $10.00 |
| Income from Investment Operations | | | | | |
| Net investment income (loss)B | .107 | .147 | .166 | .363C | .074 |
| Net realized and unrealized gain (loss) | 1.108 | (.561) | .351 | .583 | (.059) |
| Total from investment operations | 1.215 | (.414) | .517 | .946 | .015 |
| Distributions from net investment income | (.105) | (.138)D | (.148) | (.363) | (.074) |
| Distributions from net realized gain | – | (.058)D | (.069) | (.353) | (.031) |
| Tax return of capital | – | – | (.030) | – | – |
| Total distributions | (.105) | (.196) | (.247) | (.716) | (.105) |
| Net asset value, end of period | $10.91 | $9.80 | $10.41 | $10.14 | $9.91 |
| Total ReturnE,F,G | 12.44% | (4.00)% | 5.18% | 9.74% | .14% |
| Ratios to Average Net AssetsH,I | | | | | |
| Expenses before reductions | 2.30%J | 2.14% | 2.14% | 2.50% | 2.86%J |
| Expenses net of fee waivers, if any | 1.85%J | 1.85% | 1.85% | 1.85% | 1.85%J |
| Expenses net of all reductions | 1.84%J | 1.83% | 1.84% | 1.85% | 1.85%J |
| Net investment income (loss) | 2.05%J | 1.44% | 1.63% | 3.57%C | 2.35%J |
| Supplemental Data | | | | | |
| Net assets, end of period (000 omitted) | $3,370 | $8,003 | $8,683 | $7,162 | $5,468 |
| Portfolio turnover rateK | 365%J | 367% | 299% | 239% | 71%L |
A For the period September 9, 2015 (commencement of operations) to December 31, 2015.
B Calculated based on average shares outstanding during the period.
C Net investment income per share reflects a large, non-recurring dividend which amounted to $.031 per share. Excluding this non-recurring dividend, the ratio of net investment income (loss) to average net assets would have been 3.26%.
D The amounts shown reflect certain reclassifications related to book to tax differences that were made in the year shown.
E Total returns for periods of less than one year are not annualized.
F Total returns would have been lower if certain expenses had not been reduced during the applicable periods shown.
G Total returns do not include the effect of the contingent deferred sales charge.
H Fees and expenses of any underlying Fidelity Central Funds are not included in the Fund's expense ratio. The Fund indirectly bears its proportionate share of the expenses of any underlying Fidelity Central Funds.
I Expense ratios reflect operating expenses of the class. Expenses before reductions do not reflect amounts reimbursed by the investment adviser or reductions from brokerage service arrangements or reductions from other expense offset arrangements and do not represent the amount paid by the class during periods when reimbursements or reductions occur. Expense ratios before reductions for start-up periods may not be representative of longer-term operating periods. Expenses net of fee waivers reflect expenses after reimbursement by the investment adviser but prior to reductions from brokerage service arrangements or other expense offset arrangements. Expenses net of all reductions represent the net expenses paid by the class.
J Annualized
K Amount does not include the portfolio activity of any underlying Fidelity Central Funds.
L Amount not annualized.
See accompanying notes which are an integral part of the financial statements.
Fidelity Advisor Multi-Asset Income Fund
| | Six months ended (Unaudited) June 30, | Years endedDecember 31, |
| | 2019 | 2018 A |
| Selected Per–Share Data | | |
| Net asset value, beginning of period | $9.81 | $10.00 |
| Income from Investment Operations | | |
| Net investment income (loss)B | .158 | .168 |
| Net realized and unrealized gain (loss) | 1.107 | (.135) |
| Total from investment operations | 1.265 | .033 |
| Distributions from net investment income | (.155) | (.165)C |
| Distributions from net realized gain | – | (.058)C |
| Total distributions | (.155) | (.223) |
| Net asset value, end of period | $10.92 | $9.81 |
| Total ReturnD,E | 12.96% | .30% |
| Ratios to Average Net AssetsF,G | | |
| Expenses before reductions | 1.07%H | 1.05%H |
| Expenses net of fee waivers, if any | .85%H | .85%H |
| Expenses net of all reductions | .84%H | .84%H |
| Net investment income (loss) | 3.05%H | 2.17%H |
| Supplemental Data | | |
| Net assets, end of period (000 omitted) | $27,432 | $5,819 |
| Portfolio turnover rateI | 365%H | 367% |
A For the period March 28, 2018 (commencement of sale of shares) to December 31, 2018.
B Calculated based on average shares outstanding during the period.
C The amounts shown reflect certain reclassifications related to book to tax differences that were made in the year shown.
D Total returns for periods of less than one year are not annualized.
E Total returns would have been lower if certain expenses had not been reduced during the applicable periods shown.
F Fees and expenses of any underlying Fidelity Central Funds are not included in the Fund's expense ratio. The Fund indirectly bears its proportionate share of the expenses of any underlying Fidelity Central Funds.
G Expense ratios reflect operating expenses of the class. Expenses before reductions do not reflect amounts reimbursed by the investment adviser or reductions from brokerage service arrangements or reductions from other expense offset arrangements and do not represent the amount paid by the class during periods when reimbursements or reductions occur. Expense ratios before reductions for start-up periods may not be representative of longer-term operating periods. Expenses net of fee waivers reflect expenses after reimbursement by the investment adviser but prior to reductions from brokerage service arrangements or other expense offset arrangements. Expenses net of all reductions represent the net expenses paid by the class.
H Annualized
I Amount does not include the portfolio activity of any underlying Fidelity Central Funds.
See accompanying notes which are an integral part of the financial statements.
Fidelity Advisor Multi-Asset Income Fund Class I
| | Six months ended (Unaudited) June 30, | Years endedDecember 31, | | | |
| | 2019 | 2018 | 2017 | 2016 | 2015 A |
| Selected Per–Share Data | | | | | |
| Net asset value, beginning of period | $9.81 | $10.41 | $10.14 | $9.92 | $10.00 |
| Income from Investment Operations | | | | | |
| Net investment income (loss)B | .159 | .249 | .268 | .464C | .104 |
| Net realized and unrealized gain (loss) | 1.107 | (.558) | .349 | .573 | (.050) |
| Total from investment operations | 1.266 | (.309) | .617 | 1.037 | .054 |
| Distributions from net investment income | (.156) | (.233)D | (.231) | (.464) | (.103) |
| Distributions from net realized gain | – | (.058)D | (.069) | (.353) | (.031) |
| Tax return of capital | – | – | (.047) | – | – |
| Total distributions | (.156) | (.291) | (.347) | (.817) | (.134) |
| Net asset value, end of period | $10.92 | $9.81 | $10.41 | $10.14 | $9.92 |
| Total ReturnE,F | 12.96% | (3.01)% | 6.20% | 10.72% | .54% |
| Ratios to Average Net AssetsG,H | | | | | |
| Expenses before reductions | 1.13%I | 1.08% | 1.10% | 1.47% | 1.80%I |
| Expenses net of fee waivers, if any | .85%I | .85% | .85% | .85% | .85%I |
| Expenses net of all reductions | .84%I | .83% | .84% | .85% | .85%I |
| Net investment income (loss) | 3.05%I | 2.44% | 2.63% | 4.57%C | 3.35%I |
| Supplemental Data | | | | | |
| Net assets, end of period (000 omitted) | $25,014 | $21,904 | $22,224 | $20,092 | $21,614 |
| Portfolio turnover rateJ | 365%I | 367% | 299% | 239% | 71%K |
A For the period September 9, 2015 (commencement of operations) to December 31, 2015.
B Calculated based on average shares outstanding during the period.
C Net investment income per share reflects a large, non-recurring dividend which amounted to $.031 per share. Excluding this non-recurring dividend, the ratio of net investment income (loss) to average net assets would have been 4.26%.
D The amounts shown reflect certain reclassifications related to book to tax differences that were made in the year shown.
E Total returns for periods of less than one year are not annualized.
F Total returns would have been lower if certain expenses had not been reduced during the applicable periods shown.
G Fees and expenses of any underlying Fidelity Central Funds are not included in the Fund's expense ratio. The Fund indirectly bears its proportionate share of the expenses of any underlying Fidelity Central Funds.
H Expense ratios reflect operating expenses of the class. Expenses before reductions do not reflect amounts reimbursed by the investment adviser or reductions from brokerage service arrangements or reductions from other expense offset arrangements and do not represent the amount paid by the class during periods when reimbursements or reductions occur. Expense ratios before reductions for start-up periods may not be representative of longer-term operating periods. Expenses net of fee waivers reflect expenses after reimbursement by the investment adviser but prior to reductions from brokerage service arrangements or other expense offset arrangements. Expenses net of all reductions represent the net expenses paid by the class.
I Annualized
J Amount does not include the portfolio activity of any underlying Fidelity Central Funds.
K Amount not annualized.
See accompanying notes which are an integral part of the financial statements.
Fidelity Advisor Multi-Asset Income Fund Class Z
| | Six months ended (Unaudited) June 30, | Years endedDecember 31, |
| | 2019 | 2018 A |
| Selected Per–Share Data | | |
| Net asset value, beginning of period | $9.81 | $10.37 |
| Income from Investment Operations | | |
| Net investment income (loss)B | .163 | .052 |
| Net realized and unrealized gain (loss) | 1.107 | (.515) |
| Total from investment operations | 1.270 | (.463) |
| Distributions from net investment income | (.160) | (.039)C |
| Distributions from net realized gain | – | (.058)C |
| Total distributions | (.160) | (.097) |
| Net asset value, end of period | $10.92 | $9.81 |
| Total ReturnD,E | 13.01% | (4.46)% |
| Ratios to Average Net AssetsF,G | | |
| Expenses before reductions | 1.09%H | .89%H |
| Expenses net of fee waivers, if any | .76%H | .76%H |
| Expenses net of all reductions | .75%H | .74%H |
| Net investment income (loss) | 3.13%H | 2.04%H |
| Supplemental Data | | |
| Net assets, end of period (000 omitted) | $166 | $148 |
| Portfolio turnover rateI | 365%H | 367% |
A For the period October 2, 2018 (commencement of sale of shares) to December 31, 2018.
B Calculated based on average shares outstanding during the period.
C The amounts shown reflect certain reclassifications related to book to tax differences that were made in the year shown.
D Total returns for periods of less than one year are not annualized.
E Total returns would have been lower if certain expenses had not been reduced during the applicable periods shown.
F Fees and expenses of any underlying Fidelity Central Funds are not included in the Fund's expense ratio. The Fund indirectly bears its proportionate share of the expenses of any underlying Fidelity Central Funds.
G Expense ratios reflect operating expenses of the class. Expenses before reductions do not reflect amounts reimbursed by the investment adviser or reductions from brokerage service arrangements or reductions from other expense offset arrangements and do not represent the amount paid by the class during periods when reimbursements or reductions occur. Expense ratios before reductions for start-up periods may not be representative of longer-term operating periods. Expenses net of fee waivers reflect expenses after reimbursement by the investment adviser but prior to reductions from brokerage service arrangements or other expense offset arrangements. Expenses net of all reductions represent the net expenses paid by the class.
H Annualized
I Amount does not include the portfolio activity of any underlying Fidelity Central Funds.
See accompanying notes which are an integral part of the financial statements.
Notes to Financial Statements (Unaudited)
For the period ended June 30, 2019
1. Organization.
Fidelity Advisor Multi-Asset Income Fund (the Fund) is a fund of Fidelity School Street Trust (the Trust) and is authorized to issue an unlimited number of shares. The Trust is registered under the Investment Company Act of 1940, as amended (the 1940 Act), as an open-end management investment company organized as a Massachusetts business trust. The Fund offers Class A, Class M, Class C, Fidelity Multi-Asset Income Fund, Class I and Class Z shares, each of which has equal rights as to assets and voting privileges. Each class has exclusive voting rights with respect to matters that affect that class. Effective March 1, 2019, Class C shares will automatically convert to Class A shares after a holding period of ten years from the initial date of purchase, with certain exceptions.
2. Investments in Fidelity Central Funds.
The Fund invests in Fidelity Central Funds, which are open-end investment companies generally available only to other investment companies and accounts managed by the investment adviser and its affiliates. The Fund's Schedule of Investments lists each of the Fidelity Central Funds held as of period end, if any, as an investment of the Fund, but does not include the underlying holdings of each Fidelity Central Fund. As an Investing Fund, the Fund indirectly bears its proportionate share of the expenses of the underlying Fidelity Central Funds.
The Money Market Central Funds seek preservation of capital and current income and are managed by Fidelity Investments Money Management, Inc. (FIMM), an affiliate of the investment adviser. Annualized expenses of the Money Market Central Funds as of their most recent shareholder report date ranged from less than .005% to .01%.
A complete unaudited list of holdings for each Fidelity Central Fund is available upon request or at the Securities and Exchange Commission (the SEC) website at www.sec.gov. In addition, the financial statements of the Fidelity Central Funds are available on the SEC website or upon request.
3. Significant Accounting Policies.
The Fund is an investment company and applies the accounting and reporting guidance of the Financial Accounting Standards Board (FASB) Accounting Standards Codification Topic 946 Financial Services – Investments Companies. The financial statements have been prepared in conformity with accounting principles generally accepted in the United States of America (GAAP), which require management to make certain estimates and assumptions at the date of the financial statements. Actual results could differ from those estimates. Subsequent events, if any, through the date that the financial statements were issued have been evaluated in the preparation of the financial statements. The following summarizes the significant accounting policies of the Fund:
Investment Valuation. Investments are valued as of 4:00 p.m. Eastern time on the last calendar day of the period. The Board of Trustees (the Board) has delegated the day to day responsibility for the valuation of the Fund's investments to the Fair Value Committee (the Committee) established by the Fund's investment adviser. In accordance with valuation policies and procedures approved by the Board, the Fund attempts to obtain prices from one or more third party pricing vendors or brokers to value its investments. When current market prices, quotations or currency exchange rates are not readily available or reliable, investments will be fair valued in good faith by the Committee, in accordance with procedures adopted by the Board. Factors used in determining fair value vary by investment type and may include market or investment specific events, changes in interest rates and credit quality. The frequency with which these procedures are used cannot be predicted and they may be utilized to a significant extent. The Committee oversees the Fund's valuation policies and procedures and reports to the Board on the Committee's activities and fair value determinations. The Board monitors the appropriateness of the procedures used in valuing the Fund's investments and ratifies the fair value determinations of the Committee.
The Fund categorizes the inputs to valuation techniques used to value its investments into a disclosure hierarchy consisting of three levels as shown below:
- Level 1 – quoted prices in active markets for identical investments
- Level 2 – other significant observable inputs (including quoted prices for similar investments, interest rates, prepayment speeds, etc.)
- Level 3 – unobservable inputs (including the Fund's own assumptions based on the best information available)
Valuation techniques used to value the Fund's investments by major category are as follows:
Debt securities, including restricted securities, are valued based on evaluated prices received from third party pricing vendors or from brokers who make markets in such securities. Corporate bonds, bank loan obligations, foreign government and government agency obligations, municipal securities, preferred securities, and U.S. government and government agency obligations are valued by pricing vendors who utilize matrix pricing which considers yield or price of bonds of comparable quality, coupon, maturity and type or by broker-supplied prices. When independent prices are unavailable or unreliable, debt securities may be valued utilizing pricing methodologies which consider similar factors that would be used by third party pricing vendors. Debt securities are generally categorized as Level 2 in the hierarchy but may be Level 3 depending on the circumstances. The Fund invests a significant portion of its assets in below investment grade securities. The value of these securities can be more volatile due to changes in the credit quality of the issuer and is sensitive to changes in economic, market and regulatory conditions.
Equity securities, including restricted securities, for which market quotations are readily available, are valued at the last reported sale price or official closing price as reported by a third party pricing vendor on the primary market or exchange on which they are traded and are categorized as Level 1 in the hierarchy. In the event there were no sales during the day or closing prices are not available, securities are valued at the last quoted bid price or may be valued using the last available price and are generally categorized as Level 2 in the hierarchy. For foreign equity securities, when market or security specific events arise, comparisons to the valuation of American Depositary Receipts (ADRs), futures contracts, Exchange-Traded Funds (ETFs) and certain indexes as well as quoted prices for similar securities may be used and would be categorized as Level 2 in the hierarchy. For equity securities, including restricted securities, where observable inputs are limited, assumptions about market activity and risk are used and these securities may be categorized as Level 3 in the hierarchy.
ETFs are valued at their last sale price or official closing price as reported by a third party pricing vendor on the primary market or exchange on which they are traded and are categorized as Level 1 in the hierarchy. In the event there were no sales during the day but the exchange reports a closing bid level, ETFs are valued at the closing bid and would be categorized as Level 1 in the hierarchy. In the event there was no closing bid, ETFs may be valued by another method that the Board believes reflects fair value in accordance with the Board's fair value pricing policies and may be categorized as Level 2 in the hierarchy.
Investments in open-end mutual funds, including the Fidelity Central Funds, are valued at their closing net asset value (NAV) each business day and are categorized as Level 1 in the hierarchy.
Changes in valuation techniques may result in transfers in or out of an assigned level within the disclosure hierarchy. The aggregate value of investments by input level as of June 30, 2019 is included at the end of the Fund's Schedule of Investments.
Foreign Currency. The Fund may use foreign currency contracts to facilitate transactions in foreign-denominated securities. Gains and losses from these transactions may arise from changes in the value of the foreign currency or if the counterparties do not perform under the contracts' terms.
Foreign-denominated assets, including investment securities, and liabilities are translated into U.S. dollars at the exchange rates at period end. Purchases and sales of investment securities, income and dividends received and expenses denominated in foreign currencies are translated into U.S. dollars at the exchange rate in effect on the transaction date.
The effects of exchange rate fluctuations on investments are included with the net realized and unrealized gain (loss) on investment securities. Other foreign currency transactions resulting in realized and unrealized gain (loss) are disclosed separately.
Investment Transactions and Income. For financial reporting purposes, the Fund's investment holdings and NAV include trades executed through the end of the last business day of the period. The NAV per share for processing shareholder transactions is calculated as of the close of business of the New York Stock Exchange (NYSE), normally 4:00 p.m. Eastern time and includes trades executed through the end of the prior business day. Gains and losses on securities sold are determined on the basis of identified cost and include proceeds received from litigation. Dividend income is recorded on the ex-dividend date, except for certain dividends from foreign securities where the ex-dividend date may have passed, which are recorded as soon as the Fund is informed of the ex-dividend date. Non-cash dividends included in dividend income, if any, are recorded at the fair market value of the securities received. Income and capital gain distributions from Fidelity Central Funds, if any, are recorded on the ex-dividend date. Certain distributions received by the Fund represent a return of capital or capital gain. The Fund determines the components of these distributions subsequent to the ex-dividend date, based upon receipt of tax filings or other correspondence relating to the underlying investment. These distributions are recorded as a reduction of cost of investments and/or as a realized gain. Interest income is accrued as earned and includes coupon interest and amortization of premium and accretion of discount on debt securities as applicable. The principal amount on inflation-indexed securities is periodically adjusted to the rate of inflation and interest is accrued based on the principal amount. The adjustments to principal due to inflation are reflected as increases or decreases to Interest in the accompanying Statement of Operations. Investment income is recorded net of foreign taxes withheld where recovery of such taxes is uncertain. Debt obligations may be placed on non-accrual status and related interest income may be reduced by ceasing current accruals and writing off interest receivables when the collection of all or a portion of interest has become doubtful based on consistently applied procedures. A debt obligation is removed from non-accrual status when the issuer resumes interest payments or when collectability of interest is reasonably assured.
Class Allocations and Expenses. Investment income, realized and unrealized capital gains and losses, common expenses of the Fund, and certain fund-level expense reductions, if any, are allocated daily on a pro-rata basis to each class based on the relative net assets of each class to the total net assets of the Fund. Each class differs with respect to transfer agent and distribution and service plan fees incurred. Certain expense reductions may also differ by class. For the reporting period, the allocated portion of income and expenses to each class as a percent of its average net assets may vary due to the timing of recording these transactions in relation to fluctuating net assets of the classes. Expenses directly attributable to a fund are charged to that fund. Expenses attributable to more than one fund are allocated among the respective funds on the basis of relative net assets or other appropriate methods. Expense estimates are accrued in the period to which they relate and adjustments are made when actual amounts are known.
Income Tax Information and Distributions to Shareholders. Each year, the Fund intends to qualify as a regulated investment company under Subchapter M of the Internal Revenue Code, including distributing substantially all of its taxable income and realized gains. As a result, no provision for U.S. Federal income taxes is required. The Fund files a U.S. federal tax return, in addition to state and local tax returns as required. The Fund's federal income tax returns are subject to examination by the Internal Revenue Service (IRS) for a period of three fiscal years after they are filed. State and local tax returns may be subject to examination for an additional fiscal year depending on the jurisdiction. Foreign taxes are provided for based on the Fund's understanding of the tax rules and rates that exist in the foreign markets in which it invests.
Distributions are declared and recorded daily and paid monthly from net investment income. Distributions from realized gains, if any, are declared and recorded on the ex-dividend date. Income and capital gain distributions are declared separately for each class. Income and capital gain distributions are determined in accordance with income tax regulations, which may differ from GAAP.
Capital accounts within the financial statements are adjusted for permanent book-tax differences. These adjustments have no impact on net assets or the results of operations. Capital accounts are not adjusted for temporary book-tax differences which will reverse in a subsequent period.
Book-tax differences are primarily due to foreign currency transactions, certain conversion ratio adjustments, equity-debt classifications, partnerships and losses deferred due to wash sales and excise tax regulations.
As of period end, the cost and unrealized appreciation (depreciation) in securities, and derivatives if applicable, for federal income tax purposes were as follows:
| Gross unrealized appreciation | $5,938,968 |
| Gross unrealized depreciation | (631,200) |
| Net unrealized appreciation (depreciation) | $5,307,768 |
| Tax cost | $78,811,623 |
The Fund elected to defer to its next fiscal year approximately $662,077 of capital losses recognized during the period November 1, 2018 to December 31, 2018.
Restricted Securities. The Fund may invest in securities that are subject to legal or contractual restrictions on resale. These securities generally may be resold in transactions exempt from registration or to the public if the securities are registered. Disposal of these securities may involve time-consuming negotiations and expense, and prompt sale at an acceptable price may be difficult. Information regarding restricted securities is included at the end of the Fund's Schedule of Investments.
Loans and Other Direct Debt Instruments. The Fund invests in direct debt instruments which are interests in amounts owed to lenders by corporate or other borrowers. These instruments may be in the form of loans, trade claims or other receivables and may include standby financing commitments such as revolving credit facilities that obligate the Fund to supply additional cash to the borrower on demand. Loans may be acquired through assignment or participation. The Fund did not have any unfunded loan commitments, which are contractual obligations for future funding, at period end.
4. Purchases and Sales of Investments.
Purchases and sales of securities, other than short-term securities and U.S. government securities, aggregated $118,356,253 and $85,253,590, respectively.
5. Fees and Other Transactions with Affiliates.
Management Fee. Fidelity Management & Research Company (the investment adviser) and its affiliates provide the Fund with investment management related services for which the Fund pays a monthly management fee. The management fee is the sum of an individual fund fee rate that is based on an annual rate of .45% of the Fund's average net assets and an annualized group fee rate that averaged .10% during the period. The group fee rate is based upon the average net assets of all the mutual funds advised by the investment adviser, including any mutual funds previously advised by the investment adviser that are currently advised by Fidelity SelectCo, LLC, an affiliate of the investment adviser. The group fee rate decreases as assets under management increase and increases as assets under management decrease. For the reporting period, the total annualized management fee rate was .55% of the Fund's average net assets.
Distribution and Service Plan Fees. In accordance with Rule 12b-1 of the 1940 Act, the Fund has adopted separate Distribution and Service Plans for each class of shares. Certain classes pay Fidelity Distributors Corporation (FDC), an affiliate of the investment adviser, separate Distribution and Service Fees, each of which is based on an annual percentage of each class' average net assets. In addition, FDC may pay financial intermediaries for selling shares of the Fund and providing shareholder support services. For the period, the Distribution and Service Fee rates, total fees and amounts retained by FDC were as follows:
| | Distribution Fee | Service Fee | Total Fees | Retained by FDC |
| Class A | -% | .25% | $17,223 | $10,966 |
| Class M | -% | .25% | 9,914 | 7,174 |
| Class C | .75% | .25% | 28,423 | 15,755 |
| | | | $55,560 | $33,895 |
Sales Load. FDC may receive a front-end sales charge of up to 4.00% for selling Class A shares and Class M shares, some of which is paid to financial intermediaries for selling shares of the Fund. Depending on the holding period, FDC may receive contingent deferred sales charges levied on Class A, Class M and Class C redemptions. The deferred sales charges are 1.00% for Class C shares, 1.00% for certain purchases of Class A shares and .25% for certain purchases of Class M shares.
For the period, sales charge amounts retained by FDC were as follows:
| | Retained by FDC |
| Class A | $1,829 |
| Class M | 418 |
| Class C(a) | 48 |
| | $2,295 |
(a) When Class C shares are initially sold, FDC pays commissions from its own resources to financial intermediaries through which the sales are made.
Transfer Agent Fees. Fidelity Investments Institutional Operations Company, Inc., (FIIOC), an affiliate of the investment adviser, is the transfer, dividend disbursing and shareholder servicing agent for each class of the Fund. FIIOC receives account fees and asset-based fees that vary according to the account size and type of account of the shareholders of the respective classes of the Fund, except for Class Z. FIIOC receives an asset-based fee of Class Z's average net assets. FIIOC pays for typesetting, printing and mailing of shareholder reports, except proxy statements.
For the period, transfer agent fees for each class were as follows:
| | Amount | % of Class-Level Average Net Assets(a) |
| Class A | $10,277 | .15 |
| Class M | 6,162 | .16 |
| Class C | 3,691 | .13 |
| Fidelity Multi-Asset Income Fund | 9,663 | .14 |
| Class I | 11,094 | .09 |
| Class Z | 41 | .05 |
| | $40,928 | |
(a) Annualized
Accounting and Security Lending Fees. Fidelity Service Company, Inc. (FSC), an affiliate of the investment adviser, maintains the Fund's accounting records. The accounting fee is based on the level of average net assets for each month. Prior to April 1, 2019, FSC had a separate agreement with the Fund for administration of the security lending program, based on the number and duration of lending transactions. For the period, the total fees paid for accounting and administration of securities lending were equivalent to an annualized rate of .05%.
Brokerage Commissions. The Fund placed a portion of its portfolio transactions with brokerage firms which are affiliates of the investment adviser. Brokerage commissions are included in net realized gain (loss) and change in net unrealized appreciation (depreciation) in the Statement of Operations. The commissions paid to these affiliated firms were $1,049 for the period.
Interfund Trades. The Fund may purchase from or sell securities to other Fidelity Funds under procedures adopted by the Board. The procedures have been designed to ensure these interfund trades are executed in accordance with Rule 17a-7 of the 1940 Act. Interfund trades are included within the respective purchases and sales amounts shown in the Purchases and Sales of Investments note.
6. Committed Line of Credit.
The Fund participates with other funds managed by the investment adviser or an affiliate in a $4.25 billion credit facility (the "line of credit") to be utilized for temporary or emergency purposes to fund shareholder redemptions or for other short-term liquidity purposes. The Fund has agreed to pay commitment fees on its pro-rata portion of the line of credit, which amounted to $78 and is reflected in Miscellaneous expenses on the Statement of Operations. During the period, the Fund did not borrow on this line of credit.
7. Security Lending.
The Fund lends portfolio securities from time to time in order to earn additional income. For equity securities, lending agents are used, including National Financial Services (NFS), an affiliate of the Fund. Pursuant to a securities lending agreement, NFS will receive a fee, which is capped at 9.9% of daily lending revenue, for its services as lending agent. The Fund may lend securities to certain qualified borrowers, including NFS. On the settlement date of the loan, the Fund receives collateral (in the form of U.S. Treasury obligations, letters of credit and/or cash) against the loaned securities and maintains collateral in an amount not less than 100% of the market value of the loaned securities during the period of the loan. The market value of the loaned securities is determined at the close of business of the Fund and any additional required collateral is delivered to the Fund on the next business day. The Fund or borrower may terminate the loan at any time, and if the borrower defaults on its obligation to return the securities loaned because of insolvency or other reasons, the Fund may apply collateral received from the borrower against the obligation. The Fund may experience delays and costs in recovering the securities loaned. Any cash collateral received is invested in the Fidelity Securities Lending Cash Central Fund. The value of loaned securities and cash collateral at period end are disclosed on the Fund's Statement of Assets and Liabilities. Security lending income represents the income earned on investing cash collateral, less rebates paid to borrowers and any lending agent fees associated with the loan, plus any premium payments received for lending certain types of securities. Security lending income is presented in the Statement of Operations as a component of income from Fidelity Central Funds. During the period, there were no securities loaned to NFS.
8. Expense Reductions.
The investment adviser contractually agreed to reimburse each class to the extent annual operating expenses exceeded certain levels of class-level average net assets as noted in the table below. This reimbursement will remain in place through April 30, 2020. Some expenses, for example the compensation of the independent Trustees, and certain miscellaneous expenses such as proxy and shareholder meeting expenses, are excluded from this reimbursement.
The following classes were in reimbursement during the period:
| | Expense Limitations | Reimbursement |
| Class A | 1.10% | $16,375 |
| Class M | 1.10% | 11,163 |
| Class C | 1.85% | 10,172 |
| Fidelity Multi-Asset Income Fund | .85% | 13,154 |
| Class I | .85% | 25,860 |
| Class Z | .76% | 211 |
| | | $76,935 |
Commissions paid to certain brokers with whom the investment adviser, or its affiliates, places trades on behalf of the Fund include an amount in addition to trade execution, which may be rebated back to the Fund to offset certain expenses. This amount totaled $4,120 for the period. In addition, through arrangements with the Fund's custodian, credits realized as a result of certain uninvested cash balances were used to reduce the Fund's expenses. During the period, these credits reduced the Fund's custody expenses by $60.
In addition, during the period the investment adviser reimbursed and/or waived a portion of fund-level operating expenses in the amount of $129 and a portion of class-level operating expenses as follows:
| | Amount |
| Class A | $2,869 |
| Class M | 2,124 |
| Class C | 2,373 |
| Fidelity Multi-Asset Income Fund | 2,294 |
| Class I | 6,334 |
| Class Z | 43 |
| | $16,037 |
9. Distributions to Shareholders.
Distributions to shareholders of each class were as follows:
| | Six months ended
June 30, 2019 | Year ended
December 31, 2018(a) |
| Distributions to shareholders | | |
| Class A | $191,460 | $264,409 |
| Class M | 107,965 | 191,413 |
| Class C | 54,400 | 157,555 |
| Fidelity Multi-Asset Income Fund | 213,451 | 68,751 |
| Class I | 350,019 | 600,501 |
| Class Z | 2,423 | 1,381 |
| Total | $919,718 | $1,284,010 |
(a) Distributions for Fidelity Multi-Asset Income Fund are for the period March 28, 2018 (commencement of sale of shares) to December 31, 2018. Distributions for Class Z are for the period October 2, 2018 (commencement of sale of shares) to December 31, 2018.
10. Share Transactions.
Share transactions for each class were as follows and may contain automatic conversions between classes or exchanges between affiliated funds:
| | Shares | Shares | Dollars | Dollars |
| | Six months ended June 30, 2019 | Year ended December 31, 2018(a) | Six months ended June 30, 2019 | Year ended December 31, 2018(a) |
| Class A | | | | |
| Shares sold | 766,699 | 119,686 | $8,042,296 | $1,223,027 |
| Reinvestment of distributions | 17,997 | 26,241 | 190,933 | 264,261 |
| Shares redeemed | (69,728) | (178,964) | (729,897) | (1,790,397) |
| Net increase (decrease) | 714,968 | (33,037) | $7,503,332 | $(303,109) |
| Class M | | | | |
| Shares sold | 41,418 | 74,344 | $441,522 | $738,489 |
| Reinvestment of distributions | 9,848 | 18,263 | 104,216 | 183,865 |
| Shares redeemed | (28,437) | (55,304) | (290,150) | (561,617) |
| Net increase (decrease) | 22,829 | 37,303 | $255,588 | $360,737 |
| Class C | | | | |
| Shares sold | 74,033 | 57,671 | $771,940 | $586,512 |
| Reinvestment of distributions | 4,234 | 15,543 | 44,502 | 155,749 |
| Shares redeemed | (586,126) | (90,586) | (6,102,973) | (938,179) |
| Net increase (decrease) | (507,859) | (17,372) | $(5,286,531) | $(195,918) |
| Fidelity Multi-Asset Income Fund | | | | |
| Shares sold | 2,195,713 | 658,249 | $23,223,088 | $6,665,457 |
| Reinvestment of distributions | 18,746 | 6,629 | 199,545 | 65,822 |
| Shares redeemed | (296,455) | (71,778) | (3,119,623) | (722,492) |
| Net increase (decrease) | 1,918,004 | 593,100 | $20,303,010 | $6,008,787 |
| Class I | | | | |
| Shares sold | 166,586 | 405,246 | $1,750,525 | $4,092,145 |
| Reinvestment of distributions | 32,732 | 58,126 | 346,333 | 585,667 |
| Shares redeemed | (141,795) | (364,622) | (1,468,626) | (3,738,778) |
| Net increase (decrease) | 57,523 | 98,750 | $628,232 | $939,034 |
| Class Z | | | | |
| Shares sold | – | 14,940 | $– | $153,237 |
| Reinvestment of distributions | 149 | 95 | 1,573 | 938 |
| Net increase (decrease) | 149 | 15,035 | $1,573 | $154,175 |
(a) Share transactions for Fidelity Multi-Asset Income Fund are for the period March 28, 2018 (commencement of sale of shares) to December 31, 2018. Share transactions for Class Z are for the period October 2, 2018 (commencement of sale of shares) to December 31, 2018.
11. Other.
The Fund's organizational documents provide former and current trustees and officers with a limited indemnification against liabilities arising in connection with the performance of their duties to the Fund. In the normal course of business, the Fund may also enter into contracts that provide general indemnifications. The Fund's maximum exposure under these arrangements is unknown as this would be dependent on future claims that may be made against the Fund. The risk of material loss from such claims is considered remote.
At the end of the period, the investment adviser or its affiliates were the owners of record of 28% of the total outstanding shares of the Fund.
Shareholder Expense Example
As a shareholder of the Fund, you incur two types of costs: (1) transaction costs, including sales charges (loads) on purchase payments or redemption proceeds, and (2) ongoing costs, including management fees, distribution and/or service (12b-1) fees and other Fund expenses. This Example is intended to help you understand your ongoing costs (in dollars) of investing in the Fund and to compare these costs with the ongoing costs of investing in other mutual funds.
The Example is based on an investment of $1,000 invested at the beginning of the period and held for the entire period (January 1, 2019 to June 30, 2019).
Actual Expenses
The first line of the accompanying table for each class of the Fund provides information about actual account values and actual expenses. You may use the information in this line, together with the amount you invested, to estimate the expenses that you paid over the period. Simply divide your account value by $1,000.00 (for example, an $8,600 account value divided by $1,000.00 = 8.6), then multiply the result by the number in the first line for a class of the Fund under the heading entitled "Expenses Paid During Period" to estimate the expenses you paid on your account during this period. In addition, the Fund, as a shareholder in the underlying Fidelity Central Funds, will indirectly bear its pro-rata share of the fees and expenses incurred by the underlying Fidelity Central Funds. These fees and expenses are not included in the Fund's annualized expense ratio used to calculate the expense estimate in the table below.
Hypothetical Example for Comparison Purposes
The second line of the accompanying table for each class of the Fund provides information about hypothetical account values and hypothetical expenses based on a Class' actual expense ratio and an assumed rate of return of 5% per year before expenses, which is not the Class' actual return. The hypothetical account values and expenses may not be used to estimate the actual ending account balance or expenses you paid for the period. You may use this information to compare the ongoing costs of investing in the Fund and other funds. To do so, compare this 5% hypothetical example with the 5% hypothetical examples that appear in the shareholder reports of the other funds. In addition, the Fund, as a shareholder in the underlying Fidelity Central Funds, will indirectly bear its pro-rata share of the fees and expenses incurred by the underlying Fidelity Central Funds. These fees and expenses are not included in the Fund's annualized expense ratio used to calculate the expense estimate in the table below.
Please note that the expenses shown in the table are meant to highlight your ongoing costs only and do not reflect any transaction costs. Therefore, the second line of the table is useful in comparing ongoing costs only, and will not help you determine the relative total costs of owning different funds. In addition, if these transactional costs were included, your costs would have been higher.
| | Annualized Expense Ratio-A | Beginning
Account Value
January 1, 2019 | Ending
Account Value
June 30, 2019 | Expenses Paid
During Period-B
January 1, 2019
to June 30, 2019 |
| Class A | 1.10% | | | |
| Actual | | $1,000.00 | $1,128.30 | $5.80 |
| Hypothetical-C | | $1,000.00 | $1,019.34 | $5.51 |
| Class M | 1.10% | | | |
| Actual | | $1,000.00 | $1,128.30 | $5.80 |
| Hypothetical-C | | $1,000.00 | $1,019.34 | $5.51 |
| Class C | 1.85% | | | |
| Actual | | $1,000.00 | $1,124.40 | $9.74 |
| Hypothetical-C | | $1,000.00 | $1,015.62 | $9.25 |
| Fidelity Multi-Asset Income Fund | .85% | | | |
| Actual | | $1,000.00 | $1,129.60 | $4.49 |
| Hypothetical-C | | $1,000.00 | $1,020.58 | $4.26 |
| Class I | .85% | | | |
| Actual | | $1,000.00 | $1,129.60 | $4.49 |
| Hypothetical-C | | $1,000.00 | $1,020.58 | $4.26 |
| Class Z | .76% | | | |
| Actual | | $1,000.00 | $1,130.10 | $4.01 |
| Hypothetical-C | | $1,000.00 | $1,021.03 | $3.81 |
A Annualized expense ratio reflects expenses net of applicable fee waivers.
B Expenses are equal to each Class' annualized expense ratio, multiplied by the average account value over the period, multiplied by 181/365 (to reflect the one-half year period).
C 5% return per year before expenses

AMAI-SANN-0819
1.9865889.103
Fidelity® Global Credit Fund
Semi-Annual Report June 30, 2019 Includes Fidelity and Fidelity Advisor share classes |
|
Beginning on January 1, 2021, as permitted by regulations adopted by the Securities and Exchange Commission, paper copies of a fund’s shareholder reports will no longer be sent by mail, unless you specifically request paper copies of the reports from the fund or from your financial intermediary, such as a financial advisor, broker-dealer or bank. Instead, the reports will be made available on a website, and you will be notified by mail each time a report is posted and provided with a website link to access the report.
If you already elected to receive shareholder reports electronically, you will not be affected by this change and you need not take any action. You may elect to receive shareholder reports and other communications from a fund electronically, by contacting your financial intermediary. For Fidelity customers, visit Fidelity's web site or call Fidelity using the contact information listed below.
You may elect to receive all future reports in paper free of charge. If you wish to continue receiving paper copies of your shareholder reports, you may contact your financial intermediary or, if you are a Fidelity customer, visit Fidelity’s website, or call Fidelity at the applicable toll-free number listed below. Your election to receive reports in paper will apply to all funds held with the fund complex/your financial intermediary.
| Account Type | Website | Phone Number |
| Brokerage, Mutual Fund, or Annuity Contracts: | fidelity.com/mailpreferences | 1-800-343-3548 |
| Employer Provided Retirement Accounts: | netbenefits.fidelity.com/preferences (choose 'no' under Required Disclosures to continue to print) | 1-800-343-0860 |
| Advisor Sold Accounts Serviced Through Your Financial Intermediary: | Contact Your Financial Intermediary | Your Financial Intermediary's phone number |
| Advisor Sold Accounts Serviced by Fidelity: | institutional.fidelity.com | 1-877-208-0098 |
Contents
To view a fund's proxy voting guidelines and proxy voting record for the 12-month period ended June 30, visit http://www.fidelity.com/proxyvotingresults or visit the Securities and Exchange Commission's (SEC) web site at http://www.sec.gov.
You may also call 1-800-544-8544 if you’re an individual investing directly with Fidelity, call 1-800-835-5092 if you’re a plan sponsor or participant with Fidelity as your recordkeeper or call 1-877-208-0098 on institutional accounts or if you’re an advisor or invest through one to request a free copy of the proxy voting guidelines.
Standard & Poor's, S&P and S&P 500 are registered service marks of The McGraw-Hill Companies, Inc. and have been licensed for use by Fidelity Distributors Corporation.
Other third-party marks appearing herein are the property of their respective owners.
All other marks appearing herein are registered or unregistered trademarks or service marks of FMR LLC or an affiliated company. © 2019 FMR LLC. All rights reserved.
This report and the financial statements contained herein are submitted for the general information of the shareholders of the Fund. This report is not authorized for distribution to prospective investors in the Fund unless preceded or accompanied by an effective prospectus.
A fund files its complete schedule of portfolio holdings with the SEC for the first and third quarters of each fiscal year on Form N-PORT. Forms N-PORT are available on the SEC’s web site at http://www.sec.gov. A fund's Forms N-PORT may be reviewed and copied at the SEC’s Public Reference Room in Washington, DC. Information regarding the operation of the SEC's Public Reference Room may be obtained by calling 1-800-SEC-0330.
For a complete list of a fund's portfolio holdings, view the most recent holdings listing, semiannual report, or annual report on Fidelity's web site at http://www.fidelity.com, http://www.institutional.fidelity.com, or http://www.401k.com, as applicable.
NOT FDIC INSURED •MAY LOSE VALUE •NO BANK GUARANTEE
Neither the Fund nor Fidelity Distributors Corporation is a bank.
Investment Summary (Unaudited)
Geographic Diversification (% of fund's net assets)
| As of June 30, 2019 |
| | United States of America | 33.1% |
| | United Kingdom | 13.0% |
| | Netherlands | 8.0% |
| | Luxembourg | 5.9% |
| | Germany | 5.8% |
| | Italy | 4.3% |
| | Switzerland | 3.9% |
| | Denmark | 3.6% |
| | Canada | 2.1% |
| | Other | 20.3% |
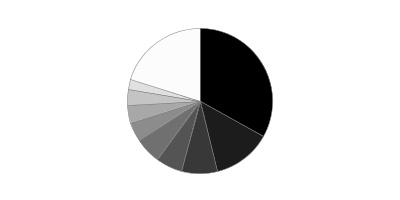
Percentages are based on country or territory of incorporation and include the effect of futures contracts, options and swaps, as applicable. Foreign currency contracts and other assets and liabilities are included within United States of America, as applicable.
Quality Diversification (% of fund's net assets)
| As of June 30, 2019 |
| | U.S. Government and U.S. Government Agency Obligations | 0.8% |
| | AA | 1.1% |
| | A | 2.6% |
| | BBB | 64.3% |
| | BB and Below | 24.6% |
| | Not Rated | 3.7% |
| | Equities | 0.4% |
| | Short-Term Investments and Net Other Assets | 2.5% |
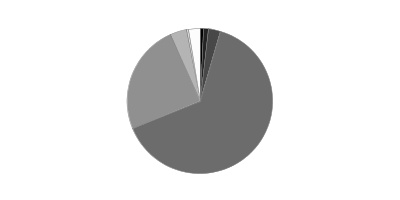
We have used ratings from Moody's Investors Service, Inc. Where Moody's® ratings are not available, we have used S&P® ratings. All ratings are as of the date indicated and do not reflect subsequent changes.
Asset Allocation (% of fund's net assets)
| As of June 30, 2019*,** |
| | Corporate Bonds | 72.8% |
| | U.S. Government and Government Agency Obligations | 0.8% |
| | Nonconvertible Preferred Stocks | 0.4% |
| | Preferred Securities | 19.5% |
| | Short-Term Investments and Net Other Assets (Liabilities) | 2.5% |

* Futures and Swaps - 14.2%
** Foreign Currency Contracts - (55.8)%
Schedule of Investments June 30, 2019 (Unaudited)
Showing Percentage of Net Assets
| Nonconvertible Bonds - 72.8% | | | |
| | | Principal Amount(a) | Value |
| Argentina - 0.9% | | | |
| YPF SA 8.5% 3/23/21 (Reg. S) | | $560,000 | $569,450 |
| Bailiwick of Jersey - 1.0% | | | |
| Heathrow Funding Ltd. 7.125% 2/14/24 | GBP | 450,000 | 691,866 |
| Canada - 1.4% | | | |
| Cenovus Energy, Inc.: | | | |
| 3% 8/15/22 | | 373,000 | 374,505 |
| 4.25% 4/15/27 | | 514,000 | 531,533 |
|
| TOTAL CANADA | | | 906,038 |
|
| Denmark - 2.9% | | | |
| Danske Bank A/S: | | | |
| 1.375% 5/24/22 (Reg. S) | EUR | 150,000 | 174,467 |
| 5% 1/12/22 (b) | | 425,000 | 444,441 |
| 5.375% 1/12/24 (Reg. S) | | 502,000 | 542,360 |
| DONG Energy A/S 2.125% 5/17/27 (Reg. S) | GBP | 200,000 | 261,397 |
| Nykredit Realkredit A/S 4% 6/3/36 (Reg. S) (c) | EUR | 400,000 | 479,640 |
|
| TOTAL DENMARK | | | 1,902,305 |
|
| Estonia - 0.2% | | | |
| Luminor Bank A/S Estonia 1.375% 10/21/22 (Reg. S) | EUR | 120,000 | 137,725 |
| France - 2.3% | | | |
| Casino Guichard Perrachon SA 5.244% 3/9/20 (c) | EUR | 200,000 | 223,156 |
| Iliad SA 0.625% 11/25/21 (Reg. S) | EUR | 500,000 | 566,503 |
| Lagardere S.C.A.: | | | |
| 1.625% 6/21/24 (Reg. S) | EUR | 300,000 | 342,077 |
| 2.75% 4/13/23 (Reg. S) | EUR | 300,000 | 358,340 |
|
| TOTAL FRANCE | | | 1,490,076 |
|
| Germany - 4.7% | | | |
| alstria office REIT-AG 1.5% 11/15/27 (Reg. S) | EUR | 300,000 | 347,017 |
| Bayer AG: | | | |
| 2.375% 4/2/75 (Reg. S) (c) | EUR | 450,000 | 510,989 |
| 3% 7/1/75 (Reg S.) (c) | EUR | 100,000 | 115,539 |
| Deutsche Bank AG: | | | |
| 1.625% 2/12/21 (Reg. S) | EUR | 1,100,000 | 1,260,632 |
| 5% 6/24/20 | EUR | 700,000 | 822,645 |
|
| TOTAL GERMANY | | | 3,056,822 |
|
| Ireland - 2.9% | | | |
| AerCap Ireland Capital Ltd./AerCap Global Aviation Trust: | | | |
| 3.3% 1/23/23 | | 500,000 | 504,259 |
| 4.625% 7/1/22 | | 210,000 | 219,246 |
| Allied Irish Banks PLC 4.125% 11/26/25 (Reg. S) (c) | EUR | 350,000 | 416,767 |
| Bank Ireland Group PLC 3.125% 9/19/27 (Reg. S) (c) | GBP | 200,000 | 249,393 |
| Shire Acquisitions Investments Ireland DAC 3.2% 9/23/26 | | 500,000 | 504,911 |
|
| TOTAL IRELAND | | | 1,894,576 |
|
| Italy - 2.7% | | | |
| Banca Monte dei Paschi di Siena SpA 5.375% 1/18/28 (c) | EUR | 275,000 | 189,576 |
| Telecom Italia SpA 4% 4/11/24 (Reg. S) | EUR | 200,000 | 245,498 |
| UniCredit SpA: | | | |
| 4.375% 1/3/27 (Reg. S) (c) | EUR | 500,000 | 593,452 |
| 6.572% 1/14/22 (b) | | 700,000 | 743,928 |
|
| TOTAL ITALY | | | 1,772,454 |
|
| Luxembourg - 3.3% | | | |
| Blackstone Property Partners Europe LP: | | | |
| 1.4% 7/6/22 (Reg. S) | EUR | 150,000 | 174,493 |
| 2% 2/15/24 (Reg. S) | EUR | 100,000 | 119,235 |
| 2.2% 7/24/25 (Reg. S) | EUR | 550,000 | 660,256 |
| CPI Property Group SA 1.45% 4/14/22 (Reg. S) | EUR | 550,000 | 633,613 |
| Millicom International Cellular SA 6.625% 10/15/26 (b) | | 295,000 | 321,423 |
| SELP Finance SARL 1.5% 12/20/26 (Reg. S) | EUR | 240,000 | 277,514 |
|
| TOTAL LUXEMBOURG | | | 2,186,534 |
|
| Mexico - 3.5% | | | |
| CEMEX S.A.B. de CV 3.125% 3/19/26 (Reg. S) | EUR | 450,000 | 523,594 |
| Gruma S.A.B. de CV 4.875% 12/1/24 (Reg. S) | | 200,000 | 212,500 |
| Petroleos Mexicanos: | | | |
| 2.5% 11/24/22 (Reg. S) | EUR | 100,000 | 110,157 |
| 3.625% 11/24/25 (Reg. S) | EUR | 270,000 | 293,009 |
| 3.75% 2/21/24 (Reg. S) | EUR | 1,000,000 | 1,131,770 |
|
| TOTAL MEXICO | | | 2,271,030 |
|
| Netherlands - 3.4% | | | |
| Deutsche Annington Finance BV 5% 10/2/23 (b) | | 314,000 | 330,755 |
| Mylan NV 2.25% 11/22/24 (Reg. S) | EUR | 200,000 | 231,377 |
| Petrobras Global Finance BV 8.75% 5/23/26 | | 400,000 | 494,040 |
| Samvardhana Motherson Automotive Systems Group BV 1.8% 7/6/24 (Reg. S) | EUR | 650,000 | 676,202 |
| Teva Pharmaceutical Finance Netherlands III BV 4.5% 3/1/25 | EUR | 150,000 | 163,311 |
| WPC Eurobond BV 2.25% 4/9/26 | EUR | 300,000 | 363,594 |
|
| TOTAL NETHERLANDS | | | 2,259,279 |
|
| Portugal - 0.1% | | | |
| Banco Espirito Santo SA 4% 12/31/49 (Reg. S) (d) | EUR | 200,000 | 50,032 |
| Spain - 0.9% | | | |
| CaixaBank SA 1.75% 10/24/23 (Reg. S) | EUR | 400,000 | 474,580 |
| Indra Sistemas SA 3% 4/19/24 (Reg. S) | EUR | 100,000 | 116,530 |
|
| TOTAL SPAIN | | | 591,110 |
|
| Sweden - 2.6% | | | |
| Heimstaden Bostad AB 1.75% 12/7/21 (Reg. S) | EUR | 760,000 | 890,773 |
| Samhallsbyggnadsbolaget I Norden AB 1.75% 1/14/25 (Reg. S) | EUR | 710,000 | 820,967 |
|
| TOTAL SWEDEN | | | 1,711,740 |
|
| Switzerland - 3.9% | | | |
| Credit Suisse Group AG: | | | |
| 5.75% 9/18/25 (Reg. S) (c) | EUR | 150,000 | 181,439 |
| 6.5% 8/8/23 (Reg. S) | | 1,050,000 | 1,155,000 |
| UBS AG 4.75% 2/12/26 (Reg. S) (c) | EUR | 1,007,000 | 1,220,892 |
|
| TOTAL SWITZERLAND | | | 2,557,331 |
|
| Turkey - 1.0% | | | |
| Turkiye Garanti Bankasi A/S: | | | |
| 3.375% 7/8/19 (Reg. S) | EUR | 207,000 | 234,791 |
| 6.25% 4/20/21 (Reg. S) | | 440,000 | 446,600 |
|
| TOTAL TURKEY | | | 681,391 |
|
| United Kingdom - 5.2% | | | |
| Barclays PLC: | | | |
| 2% 2/7/28 (Reg. S) (c) | EUR | 200,000 | 223,237 |
| 2.625% 11/11/25 (Reg. S) (c) | EUR | 350,000 | 403,066 |
| 3.932% 5/7/25 (c) | | 200,000 | 203,451 |
| BAT International Finance PLC 1.25% 3/13/27 (Reg. S) | EUR | 150,000 | 168,668 |
| CYBG PLC 3.125% 6/22/25 (Reg. S) (c) | GBP | 200,000 | 247,473 |
| Imperial Tobacco Finance PLC: | | | |
| 1.125% 8/14/23 (Reg. S) | EUR | 400,000 | 463,839 |
| 3.375% 2/26/26 (Reg. S) | EUR | 150,000 | 192,784 |
| 8.125% 3/15/24 | GBP | 500,000 | 806,399 |
| John Lewis PLC 6.125% 1/21/25 | GBP | 136,000 | 193,715 |
| Nationwide Building Society 3.622% 4/26/23 (b)(c) | | 200,000 | 203,638 |
| Travis Perkins PLC 4.5% 9/7/23 (Reg. S) | GBP | 240,000 | 312,688 |
|
| TOTAL UNITED KINGDOM | | | 3,418,958 |
|
| United States of America - 29.9% | | | |
| American Airlines, Inc. 3.75% 10/15/25 | | 195,171 | 196,450 |
| Anheuser-Busch InBev Worldwide, Inc. 4.75% 1/23/29 | | 400,000 | 452,240 |
| Ares Capital Corp. 4.25% 3/1/25 | | 650,000 | 657,738 |
| AT&T, Inc. 5.45% 3/1/47 | | 185,000 | 212,306 |
| Bank of America Corp. 3.95% 4/21/25 | | 215,000 | 225,317 |
| Bayer U.S. Finance II LLC 4.25% 12/15/25 (b) | | 700,000 | 740,215 |
| Brandywine Operating Partnership LP 4.1% 10/1/24 | | 160,000 | 166,630 |
| Brixmor Operating Partnership LP 4.125% 6/15/26 | | 26,000 | 26,866 |
| CBRE Group, Inc. 4.875% 3/1/26 | | 190,000 | 206,302 |
| CEMEX Finance LLC 4.625% 6/15/24 | EUR | 250,000 | 298,508 |
| Citigroup, Inc.: | | | |
| 4.3% 11/20/26 | | 82,000 | 87,047 |
| 4.45% 9/29/27 | | 600,000 | 646,569 |
| Cleco Corporate Holdings LLC 3.743% 5/1/26 | | 650,000 | 656,110 |
| Conagra Brands, Inc. 4.6% 11/1/25 | | 650,000 | 707,183 |
| DCP Midstream LLC 4.75% 9/30/21 (b) | | 613,000 | 628,325 |
| DDR Corp. 4.7% 6/1/27 | | 550,000 | 589,430 |
| Diamond 1 Finance Corp./Diamond 2 Finance Corp. 5.45% 6/15/23 (b) | | 600,000 | 646,682 |
| Discover Financial Services 3.75% 3/4/25 | | 550,000 | 568,416 |
| Dolphin Subsidiary II, Inc. 7.25% 10/15/21 | | 185,000 | 198,875 |
| Elanco Animal Health, Inc.: | | | |
| 4.272% 8/28/23 | | 200,000 | 209,828 |
| 4.9% 8/28/28 | | 350,000 | 390,701 |
| Emera U.S. Finance LP 3.55% 6/15/26 | | 500,000 | 511,567 |
| Express Scripts Holding Co. 3.4% 3/1/27 | | 500,000 | 507,098 |
| Ford Motor Credit Co. LLC 1.514% 2/17/23 | EUR | 600,000 | 686,586 |
| Goldman Sachs Group, Inc. 4.25% 10/21/25 | | 527,000 | 558,841 |
| Hudson Pacific Properties LP 3.95% 11/1/27 | | 350,000 | 356,139 |
| Marsh & McLennan Companies, Inc. 1.349% 9/21/26 | EUR | 200,000 | 236,627 |
| Michael Kors U.S.A., Inc. 4% 11/1/24 (b) | | 212,000 | 214,895 |
| Morgan Stanley: | | | |
| 3.95% 4/23/27 | | 156,000 | 163,101 |
| 4.35% 9/8/26 | | 200,000 | 214,380 |
| 5% 11/24/25 | | 355,000 | 392,779 |
| NextEra Energy Partners LP 4.25% 9/15/24 (b) | | 550,000 | 552,915 |
| Omega Healthcare Investors, Inc. 4.95% 4/1/24 | | 550,000 | 582,001 |
| Plains All American Pipeline LP/PAA Finance Corp. 4.65% 10/15/25 | | 400,000 | 425,807 |
| Reynolds American, Inc. 4.45% 6/12/25 | | 1,029,000 | 1,090,561 |
| Sunoco Logistics Partner Operations LP 4% 10/1/27 | | 600,000 | 617,862 |
| The Williams Companies, Inc. 4.55% 6/24/24 | | 500,000 | 538,449 |
| Time Warner Cable, Inc. 4.5% 9/15/42 | | 505,000 | 474,493 |
| Toll Brothers Finance Corp. 4.875% 3/15/27 | | 650,000 | 681,883 |
| Unum Group 4% 3/15/24 | | 755,000 | 787,053 |
| Voya Financial, Inc. 3.65% 6/15/26 | | 575,000 | 588,957 |
| Westinghouse Air Brake Co. 4.4% 3/15/24 | | 400,000 | 423,296 |
| Willis Group North America, Inc. 3.6% 5/15/24 | | 505,000 | 521,882 |
|
| TOTAL UNITED STATES OF AMERICA | | | 19,638,910 |
|
| TOTAL NONCONVERTIBLE BONDS | | | |
| (Cost $47,314,088) | | | 47,787,627 |
|
| U.S. Government and Government Agency Obligations - 0.8% | | | |
| U.S. Treasury Obligations - 0.8% | | | |
| U.S. Treasury Bonds 2.5% 2/15/45 (e) | | 13,000 | 12,936 |
| U.S. Treasury Notes: | | | |
| 2.125% 11/30/24 (e)(f) | | $400,000 | $406,656 |
| 2.625% 2/15/29 (e)(f) | | 135,000 | 142,283 |
| | | | 561,875 |
| TOTAL U.S. GOVERNMENT AND GOVERNMENT AGENCY OBLIGATIONS | | | |
| (Cost $538,434) | | | 561,875 |
|
| Foreign Government and Government Agency Obligations - 4.0% | | | |
| Germany - 0.8% | | | |
| German Federal Republic: | | | |
| 0.25% 2/15/29 | EUR | $450,000 | $540,633 |
| 1.25% 8/15/48 | EUR | 10,000 | 14,512 |
|
| TOTAL GERMANY | | | 555,145 |
|
| Indonesia - 1.1% | | | |
| Indonesian Republic 2.625% 6/14/23 | EUR | 580,000 | 711,455 |
| Italy - 1.0% | | | |
| Italian Republic 3.75% 5/1/21 (b) | EUR | 550,000 | 665,437 |
| United Kingdom - 1.1% | | | |
| United Kingdom, Great Britain and Northern Ireland: | | | |
| 1.75% 9/7/37 (e)(f) | GBP | 179,000 | 241,938 |
| 4.25% 6/7/32 | GBP | 10,000 | 17,568 |
| 4.25% 12/7/49 (e)(f) | GBP | 205,000 | 438,308 |
|
| TOTAL UNITED KINGDOM | | | 697,814 |
|
| TOTAL FOREIGN GOVERNMENT AND GOVERNMENT AGENCY OBLIGATIONS | | | |
| (Cost $2,563,268) | | | 2,629,851 |
| | | Shares | Value |
|
| Nonconvertible Preferred Stocks - 0.4% | | | |
| United Kingdom - 0.4% | | | |
| Nationwide Building Society 10.25% | | | |
| (Cost $281,170) | | 1,350 | 258,665 |
| | | Principal Amount(a) | Value |
|
| Preferred Securities - 19.5% | | | |
| Australia - 0.6% | | | |
| QBE Insurance Group Ltd. 5.25% (Reg. S) (c)(g) | | 400,000 | 393,868 |
| Canada - 0.7% | | | |
| Bank of Nova Scotia 4.65% (c)(g) | | 450,000 | 435,094 |
| Denmark - 0.7% | | | |
| Danske Bank A/S 5.875% (Reg. S) (c)(g) | EUR | 400,000 | 486,152 |
| France - 1.3% | | | |
| Credit Agricole Assurances SA 4.25% (Reg. S) (c)(g) | EUR | 500,000 | 629,941 |
| Danone SA 1.75% (Reg. S) (c)(g) | EUR | 200,000 | 231,487 |
|
| TOTAL FRANCE | | | 861,428 |
|
| Germany - 0.3% | | | |
| Deutsche Bank AG 6% (Reg. S) (c)(g) | EUR | 200,000 | 204,377 |
| Ireland - 0.4% | | | |
| Allied Irish Banks PLC 7.375% (Reg. S) (c)(g) | EUR | 200,000 | 246,616 |
| Italy - 0.6% | | | |
| Assicurazioni Generali SpA 6.416% (c)(g) | GBP | 300,000 | 408,659 |
| Luxembourg - 2.6% | | | |
| CPI Property Group SA 4.375% (Reg. S) (c)(g) | EUR | 450,000 | 518,821 |
| Grand City Properties SA 3.75% (c)(g) | EUR | 1,000,000 | 1,217,005 |
|
| TOTAL LUXEMBOURG | | | 1,735,826 |
|
| Netherlands - 4.6% | | | |
| Deutsche Annington Finance BV 4% (Reg. S) (c)(g) | EUR | 200,000 | 247,940 |
| Stichting AK Rabobank Certificaten 6.5% (Reg. S) (g) | EUR | 125,000 | 173,674 |
| Volkswagen International Finance NV: | | | |
| 2.5%(Reg. S) (c)(g) | EUR | 600,000 | 697,094 |
| 2.7%(Reg. S) (c)(g) | EUR | 900,000 | 1,052,276 |
| 3.75% (c)(g) | EUR | 700,000 | 836,032 |
|
| TOTAL NETHERLANDS | | | 3,007,016 |
|
| Spain - 0.7% | | | |
| Banco Bilbao Vizcaya Argentaria SA 5.875% (Reg. S) (c)(g) | EUR | 400,000 | 470,744 |
| Sweden - 0.8% | | | |
| Samhallsbyggnadsbolaget I Norden AB 4.625% (Reg. S) (c)(g) | EUR | 430,000 | 501,599 |
| United Kingdom - 6.2% | | | |
| Aviva PLC: | | | |
| 5.9021% (c)(g) | GBP | 250,000 | 344,416 |
| 6.125% (c)(g) | GBP | 1,180,000 | 1,687,581 |
| Barclays Bank PLC 7.625% 11/21/22 | | 578,000 | 635,999 |
| Barclays PLC 7.125% (c)(g) | GBP | 400,000 | 531,989 |
| CYBG PLC 9.25% (Reg. S) (c)(g) | GBP | 400,000 | 534,308 |
| HSBC Holdings PLC 5.25% (c)(g) | EUR | 250,000 | 310,681 |
|
| TOTAL UNITED KINGDOM | | | 4,044,974 |
|
| TOTAL PREFERRED SECURITIES | | | |
| (Cost $12,692,672) | | | 12,796,353 |
| | | Shares | Value |
|
| Money Market Funds - 1.0% | | | |
| Fidelity Cash Central Fund 2.42% (h) | | | |
| (Cost $649,317) | | 649,189 | 649,318 |
| Purchased Swaptions - 0.0%(i) | | | | |
| | | Expiration Date | Notional Amount | Value |
| Put Options - 0.0% | | | | |
| Option with an exercise rate of 2.75% on a credit default swap with Citibank, N.A. to buy protection on the 5-Year iTraxx Europe Crossover Series 31 Index expiring June 2024, paying 5% quarterly. | | 8/21/19 | 4,900,000 | $26,937 |
| Option with an exercise rate of 3.00% on a credit default swap with Goldman Sachs Bank USA to buy protection on the 5-Year iTraxx Europe Crossover Series 31 Index expiring June 2024, paying 5% quarterly. | | 7/17/19 | 8,400,000 | 5,932 |
|
| TOTAL PUT OPTIONS | | | | 32,869 |
|
| TOTAL PURCHASED SWAPTIONS | | | | |
| (Cost $130,225) | | | | 32,869 |
| TOTAL INVESTMENT IN SECURITIES - 98.5% | | | | |
| (Cost $64,169,174) | | | | 64,716,558 |
| NET OTHER ASSETS (LIABILITIES) - 1.5% | | | | 959,290 |
| NET ASSETS - 100% | | | | $65,675,848 |
| Futures Contracts | | | | | |
| | Number of contracts | Expiration Date | Notional Amount | Value | Unrealized Appreciation/(Depreciation) |
| Purchased | | | | | |
| Bond Index Contracts | | | | | |
| ASX 10 Year Treasury Bond Index Contracts (Australia) | 3 | Sept. 2019 | $302,549 | $2,920 | $2,920 |
| Eurex Euro-Bund Contracts (Germany) | 1 | Sept. 2019 | 196,423 | (103) | (103) |
| TME 10 Year Canadian Note Contracts (Canada) | 13 | Sept. 2019 | 1,418,877 | 6,475 | 6,475 |
| TOTAL BOND INDEX CONTRACTS | | | | | 9,292 |
| Treasury Contracts | | | | | |
| CBOT 10-Year U.S. Treasury Note Contracts (United States) | 7 | Sept. 2019 | 895,781 | 9,018 | 9,018 |
| CBOT 2-Year U.S. Treasury Note Contracts (United States) | 9 | Sept. 2019 | 1,936,617 | 9,717 | 9,717 |
| CBOT Long Term U.S. Treasury Bond Contracts (United States) | 27 | Sept. 2019 | 4,201,031 | 84,532 | 84,532 |
| CBOT Ultra 10-Year U.S. Treasury Note Contracts (United States) | 5 | Sept. 2019 | 690,625 | 11,693 | 11,693 |
| CBOT Ultra Long Term U.S. Treasury Bond Contracts (United States) | 27 | Sept. 2019 | 4,794,188 | 125,443 | 125,443 |
| TOTAL TREASURY CONTRACTS | | | | | 240,403 |
|
| TOTAL PURCHASED | | | | | 249,695 |
|
| Sold | | | | | |
| Bond Index Contracts | | | | | |
| Eurex Euro-Bobl Contracts (Germany) | 3 | Sept. 2019 | 458,615 | (979) | (979) |
| Treasury Contracts | | | | | |
| CBOT 5-Year U.S. Treasury Note Contracts (United States) | 49 | Sept. 2019 | 5,789,656 | (88,415) | (88,415) |
|
| TOTAL SOLD | | | | | (89,394) |
|
| TOTAL FUTURES CONTRACTS | | | | | $160,301 |
The notional amount of futures purchased as a percentage of Net Assets is 22.0%
The notional amount of futures sold as a percentage of Net Assets is 9.5%
For the period, the average monthly notional amount at value for futures contracts in the aggregate was $18,522,206.
| Forward Foreign Currency Contracts | | | | | | |
| Currency Purchased | Currency Sold | Counterparty | Settlement Date | Unrealized Appreciation/(Depreciation) |
| CAD | 31,000 | USD | 23,216 | Goldman Sachs Bank USA | 8/27/19 | $483 |
| EUR | 34,000 | USD | 38,466 | Bank of America N.A. | 8/27/19 | 375 |
| EUR | 30,000 | USD | 34,331 | JPMorgan Chase Bank | 8/27/19 | (59) |
| GBP | 153,000 | USD | 192,547 | State Street Bank and Trust Co. | 8/27/19 | 2,279 |
| USD | 35,699 | CAD | 48,000 | Bank of America N.A. | 8/27/19 | (997) |
| USD | 251,998 | EUR | 224,000 | BNP Paribas SA | 8/27/19 | (3,898) |
| USD | 35,224 | EUR | 31,000 | BNP Paribas SA | 8/27/19 | (191) |
| USD | 5,186,148 | EUR | 4,557,000 | BNP Paribas SA | 8/27/19 | (19,725) |
| USD | 691,639 | EUR | 610,000 | BNP Paribas SA | 8/27/19 | (5,220) |
| USD | 76,230 | EUR | 67,000 | BNP Paribas SA | 8/27/19 | (311) |
| USD | 222,748 | EUR | 198,000 | Bank of America N.A. | 8/27/19 | (3,446) |
| USD | 240,057 | EUR | 210,000 | Bank of America N.A. | 8/27/19 | 155 |
| USD | 45,104 | EUR | 40,000 | Goldman Sachs Bank USA | 8/27/19 | (591) |
| USD | 104,243 | EUR | 92,000 | JPMorgan Chase Bank | 8/27/19 | (857) |
| USD | 41,763 | EUR | 37,000 | JPMorgan Chase Bank | 8/27/19 | (505) |
| USD | 72,561 | EUR | 64,000 | Royal Bank of Canada | 8/27/19 | (552) |
| USD | 10,781,455 | EUR | 9,514,000 | State Street Bank and Trust Co. | 8/27/19 | (87,247) |
| USD | 334,234 | EUR | 298,000 | State Street Bank and Trust Co. | 8/27/19 | (6,199) |
| USD | 204,731 | GBP | 161,000 | BNP Paribas SA | 8/27/19 | (282) |
| USD | 20,419 | GBP | 16,000 | Bank of America N.A. | 8/27/19 | 45 |
| USD | 4,321,039 | GBP | 3,319,000 | Goldman Sachs Bank USA | 8/27/19 | 94,717 |
| USD | 144,569 | GBP | 114,000 | Goldman Sachs Bank USA | 8/27/19 | (595) |
| USD | 275,430 | GBP | 216,000 | Goldman Sachs Bank USA | 8/27/19 | 382 |
| USD | 40,741 | GBP | 32,000 | Goldman Sachs Bank USA | 8/27/19 | (6) |
| USD | 2,567,023 | GBP | 2,016,000 | Royal Bank of Canada | 8/27/19 | (95) |
| USD | 42,033 | GBP | 33,000 | State Street Bank and Trust Co. | 8/27/19 | 12 |
| USD | 11,098,000 | EUR | 9,792,978 | JPMorgan Chase Bank | 8/30/19 | (92,082) |
| TOTAL FORWARD FOREIGN CURRENCY CONTRACTS | | | | | | $(124,410) |
| | | | | | Unrealized Appreciation | 98,448 |
| | | | | | Unrealized Depreciation | (222,858) |
For the period, the average contract value for forward foreign currency contracts was $27,003,300. Contract value represents contract amount in United States dollars plus or minus unrealized appreciation or depreciation, respectively
Swaps
| Underlying Reference | Rating(1) | Maturity Date | Clearinghouse / Counterparty(2) | Fixed Payment Received/(Paid) | Payment Frequency | Notional Amount(3) | Value(1) | Upfront Premium Received/(Paid)(4) | Unrealized Appreciation/(Depreciation) |
| Credit Default Swaps | | | | | | | | | |
| Buy Protection | | | | | | | | | |
| 5-Year iTraxx Europe Series 25 Index | | Jun. 2021 | ICE | (1%) | Quarterly | EUR 1,000,000 | $(7,113) | $0 | $(7,113) |
| Accor SA | | Jun. 2022 | Citibank, N.A. | (1%) | Quarterly | EUR 500,000 | (11,106) | 6,628 | (4,478) |
| Gas Natural Capital Markets SA | | Jun. 2022 | BNP Paribas SA | (1%) | Quarterly | EUR 500,000 | (13,679) | 8,611 | (5,068) |
| Standard Chartered PLC | | Jun. 2021 | Goldman Sachs Bank USA | (1%) | Quarterly | EUR 550,000 | (9,841) | (21,843) | (31,684) |
| TOTAL BUY PROTECTION | | | | | | | (41,739) | (6,604) | (48,343) |
| Sell Protection | | | | | | | | | |
| 5-Year iTraxx Europe Senior Financial Series 25 Index | NR | Jun. 2021 | ICE | 1% | Quarterly | EUR 1,000,000 | 16,506 | 0 | 16,506 |
|
| TOTAL CREDIT DEFAULT SWAPS | | | | | | | $(25,233) | $(6,604) | $(31,837) |
|
(1) Ratings are presented for credit default swaps in which the Fund has sold protection on the underlying referenced debt. Ratings for an underlying index represent a weighted average of the ratings of all securities included in the index. The credit rating or value can be measures of the current payment/performance risk. Ratings are from Moody's Investors Service, Inc. Where Moody's® ratings are not available, S&P® ratings are disclosed and are indicated as such. All ratings are as of the report date and do not reflect subsequent changes.
(2) Swaps with Intercontinental Exchange (ICE) are centrally cleared over-the-counter (OTC) swaps.
(3) The notional amount of each credit default swap where the Fund has sold protection approximates the maximum potential amount of future payments that the Fund could be required to make if a credit event were to occur.
(4) Any premiums for centrally cleared over-the-counter (OTC) swaps are recorded periodically throughout the term of the swap to variation margin and included in unrealized appreciation (depreciation).
Swaps
| Payment Received | Payment Frequency | Payment Paid | Payment Frequency | Clearinghouse / Counterparty(1) | Maturity Date | Notional Amount | Value | Upfront Premium Received/(Paid)(4) | Unrealized Appreciation/(Depreciation) |
| Interest Rate Swaps | | | | | | | | | |
| 0.75% | Annual | 6-month EURIBOR(3) | Semi - annual | LCH | Dec. 2029 | EUR 870,000 | $27,825 | $0 | $27,825 |
| 1.25% | Annual | 6-month EURIBOR(3) | Semi - annual | LCH | Dec. 2034 | EUR 1,050,000 | 41,416 | 0 | 41,416 |
| 1.25% | Semi - annual | 6-month EURIBOR(3) | Semi - annual | LCH | Dec. 2039 | EUR 370,000 | 7,096 | 0 | 7,096 |
|
| TOTAL INTEREST RATE SWAPS | | | | | | | $76,337 | $0 | $76,337 |
|
(1) Swaps with LCH Clearnet Group (LCH) are centrally cleared over-the-counter (OTC) swaps.
(2) Any premiums for centrally cleared over-the-counter (OTC) swaps are recorded periodically throughout the term of the swap to variation margin and included in unrealized appreciation (depreciation).
(3) Represents floating rate.
For the period, the average monthly notional amount for swaps in the aggregate was $5,967,240.
Currency Abbreviations
CAD – Canadian dollar
EUR – European Monetary Unit
GBP – British pound
USD – U.S. dollar
Categorizations in the Schedule of Investments are based on country or territory of incorporation.
Legend
(a) Amount is stated in United States dollars unless otherwise noted.
(b) Security exempt from registration under Rule 144A of the Securities Act of 1933. These securities may be resold in transactions exempt from registration, normally to qualified institutional buyers. At the end of the period, the value of these securities amounted to $5,492,654 or 8.4% of net assets.
(c) Coupon rates for floating and adjustable rate securities reflect the rates in effect at period end.
(d) Non-income producing - Security is in default.
(e) Security or a portion of the security was pledged to cover margin requirements for futures contracts. At period end, the value of securities pledged amounted to $205,945.
(f) Security or a portion of the security was pledged to cover margin requirements for centrally cleared OTC swaps. At period end, the value of securities pledged amounted to $165,817.
(g) Security is perpetual in nature with no stated maturity date.
(h) Affiliated fund that is generally available only to investment companies and other accounts managed by Fidelity Investments. The rate quoted is the annualized seven-day yield of the fund at period end. A complete unaudited listing of the fund's holdings as of its most recent quarter end is available upon request. In addition, each Fidelity Central Fund's financial statements are available on the SEC's website or upon request.
(i) For the period, the average monthly notional amount for purchased swaptions was $9,236,305.
Affiliated Central Funds
Information regarding fiscal year to date income earned by the Fund from investments in Fidelity Central Funds is as follows:
| Fund | Income earned |
| Fidelity Cash Central Fund | $9,081 |
| Total | $9,081 |
Amounts in the income column in the above table include any capital gain distributions from underlying funds, which are presented in the corresponding line-item in the Statement of Operations, if applicable.
Investment Valuation
The following is a summary of the inputs used, as of June 30, 2019, involving the Fund's assets and liabilities carried at fair value. The inputs or methodology used for valuing securities may not be an indication of the risk associated with investing in those securities. For more information on valuation inputs, and their aggregation into the levels used below, please refer to the Investment Valuation section in the accompanying Notes to Financial Statements.
| | Valuation Inputs at Reporting Date: |
| Description | Total | Level 1 | Level 2 | Level 3 |
| Investments in Securities: | | | | |
| Equities: | | | | |
| Financials | $258,665 | $-- | $258,665 | $-- |
| Corporate Bonds | 47,787,627 | -- | 47,787,627 | -- |
| U.S. Government and Government Agency Obligations | 561,875 | -- | 561,875 | -- |
| Foreign Government and Government Agency Obligations | 2,629,851 | -- | 2,629,851 | -- |
| Preferred Securities | 12,796,353 | -- | 12,796,353 | -- |
| Money Market Funds | 649,318 | 649,318 | -- | -- |
| Purchased Swaptions | 32,869 | -- | 32,869 | -- |
| Total Investments in Securities: | $64,716,558 | $649,318 | $64,067,240 | $-- |
| Derivative Instruments: | | | | |
| Assets | | | | |
| Forward Foreign Currency Contracts | $98,448 | $-- | $98,448 | $-- |
| Futures Contracts | 249,798 | 249,798 | -- | -- |
| Swaps | 92,843 | -- | 92,843 | -- |
| Total Assets | $441,089 | $249,798 | $191,291 | $-- |
| Liabilities | | | | |
| Forward Foreign Currency Contracts | $(222,858) | $-- | $(222,858) | $-- |
| Futures Contracts | (89,497) | (89,497) | -- | -- |
| Swaps | (41,739) | -- | (41,739) | -- |
| Total Liabilities | $(354,094) | $(89,497) | $(264,597) | $-- |
| Total Derivative Instruments: | $86,995 | $160,301 | $(73,306) | $-- |
Value of Derivative Instruments
The following table is a summary of the Fund's value of derivative instruments by primary risk exposure as of June 30, 2019. For additional information on derivative instruments, please refer to the Derivative Instruments section in the accompanying Notes to Financial Statements.
| Primary Risk Exposure / Derivative Type | Value |
| | Asset | Liability |
| Credit Risk | | |
| Purchased Swaptions(a) | $32,869 | $0 |
| Swaps(b) | 16,506 | (41,739) |
| Total Credit Risk | 49,375 | (41,739) |
| Foreign Exchange Risk | | |
| Forward Foreign Currency Contracts(c) | 98,448 | (222,858) |
| Total Foreign Exchange Risk | 98,448 | (222,858) |
| Interest Rate Risk | | |
| Futures Contracts(d) | 249,798 | (89,497) |
| Swaps(b) | 76,337 | 0 |
| Total Interest Rate Risk | 326,135 | (89,497) |
| Total Value of Derivatives | $473,958 | $(354,094) |
(a) Gross value is included in the Statement of Assets and Liabilities in the investments, at value line-item.
(b) For bi-lateral over-the-counter (OTC) swaps, reflects gross value which is presented in the Statement of Assets and Liabilities in the bi-lateral OTC swaps, at value line-items. For centrally cleared OTC swaps, reflects gross cumulative appreciation (depreciation) as presented in the Schedule of Investments. In the Statement of Assets and Liabilities, the period end daily variation margin for centrally cleared OTC swaps is included in receivable or payable for daily variation margin on centrally cleared OTC swaps, and the net cumulative appreciation (depreciation) for centrally cleared OTC swaps is included in distributable earnings.
(c) Gross value is presented in the Statement of Assets and Liabilities in the unrealized appreciation/depreciation on forward foreign currency contracts line-items.
(d) Reflects gross cumulative appreciation (depreciation) on futures contracts as presented in the Schedule of Investments. In the Statement of Assets and Liabilities, the period end daily variation margin is included in receivable or payable for daily variation margin on futures contracts, and the net cumulative appreciation (depreciation) is included in distributable earnings.
The following table is a summary of the Fund's derivatives inclusive of potential netting arrangements.
| Counterparty | Value of Derivative Assets | Value of Derivative Liabilities | Collateral Received(a) | Collateral Pledged(a) | Net(b) |
| Goldman Sachs Bank USA | $101,514 | $(11,033) | $-- | $-- | $90,481 |
| Centrally Cleared OTC Swaps | 92,843 | (7,113) | -- | -- | 85,730 |
| Citibank, N.A. | 26,937 | (11,106) | -- | -- | 15,831 |
| State Street Bank and Trust Co. | 2,291 | (93,446) | -- | -- | (91,155) |
| Bank of America N.A. | 575 | (4,443) | -- | -- | (3,868) |
| BNP Paribas SA | -- | (43,306) | -- | -- | (43,306) |
| JPMorgan Chase Bank | -- | (93,503) | -- | -- | (93,503) |
| Royal Bank of Canada | -- | (647) | -- | -- | (647) |
| Exchange Traded Futures | 249,798 | (89,497) | -- | -- | 160,301 |
| Total | $473,958 | $(354,094) | | | |
(a) Reflects collateral received from or pledged to an individual counterparty, excluding any excess of initial collateral amounts.
(b) Net represents the receivable / (payable) that would be due from / (to) the counterparty in an event of default. Netting may be allowed across transactions traded under the same legal agreement with the same legal entity. Please refer to Derivative Instruments - Risk Exposures and the Use of Derivative Instruments section in the accompanying Notes to Financial Statements.
See accompanying notes which are an integral part of the financial statements.
Financial Statements
Statement of Assets and Liabilities
| | | June 30, 2019 (Unaudited) |
| Assets | | |
Investment in securities, at value — See accompanying schedule:
Unaffiliated issuers (cost $63,519,857) | $64,067,240 | |
| Fidelity Central Funds (cost $649,317) | 649,318 | |
| Total Investment in Securities (cost $64,169,174) | | $64,716,558 |
| Cash | | 29 |
| Foreign currency held at value (cost $182,351) | | 182,609 |
| Receivable for investments sold | | 447,180 |
| Unrealized appreciation on forward foreign currency contracts | | 98,448 |
| Receivable for fund shares sold | | 20,768 |
| Dividends receivable | | 527 |
| Interest receivable | | 560,080 |
| Distributions receivable from Fidelity Central Funds | | 2,133 |
| Receivable for daily variation margin on centrally cleared OTC swaps | | 9,133 |
| Receivable from investment adviser for expense reductions | | 11,892 |
| Total assets | | 66,049,357 |
| Liabilities | | |
| Payable for investments purchased | $17,582 | |
| Unrealized depreciation on forward foreign currency contracts | 222,858 | |
| Payable for fund shares redeemed | 798 | |
| Bi-lateral OTC swaps, at value | 34,626 | |
| Accrued management fee | 26,837 | |
| Distribution and service plan fees payable | 2,817 | |
| Payable for daily variation margin on futures contracts | 10,526 | |
| Other affiliated payables | 7,563 | |
| Audit fee payable | 47,755 | |
| Other payables and accrued expenses | 2,147 | |
| Total liabilities | | 373,509 |
| Net Assets | | $65,675,848 |
| Net Assets consist of: | | |
| Paid in capital | | $64,947,055 |
| Total distributable earnings (loss) | | 728,793 |
| Net Assets | | $65,675,848 |
| Net Asset Value and Maximum Offering Price | | |
| Class A: | | |
| Net Asset Value and redemption price per share ($4,122,369 ÷ 435,030 shares)(a) | | $9.48 |
| Maximum offering price per share (100/96.00 of $9.48) | | $9.88 |
| Class M: | | |
| Net Asset Value and redemption price per share ($1,859,051 ÷ 196,222 shares)(a) | | $9.47 |
| Maximum offering price per share (100/96.00 of $9.47) | | $9.86 |
| Class C: | | |
| Net Asset Value and offering price per share ($1,921,728 ÷ 203,010 shares)(a) | | $9.47 |
| Global Credit: | | |
| Net Asset Value, offering price and redemption price per share ($51,890,232 ÷ 5,471,802 shares) | | $9.48 |
| Class I: | | |
| Net Asset Value, offering price and redemption price per share ($2,187,975 ÷ 230,770 shares) | | $9.48 |
| Class Z: | | |
| Net Asset Value, offering price and redemption price per share ($3,694,493 ÷ 389,543 shares) | | $9.48 |
(a) Redemption price per share is equal to net asset value less any applicable contingent deferred sales charge.
See accompanying notes which are an integral part of the financial statements.
Statement of Operations
| | | Six months ended June 30, 2019 (Unaudited) |
| Investment Income | | |
| Dividends | | $155,822 |
| Interest | | 584,290 |
| Income from Fidelity Central Funds | | 9,081 |
| Income before foreign taxes withheld | | 749,193 |
| Less foreign taxes withheld | | (949) |
| Total income | | 748,244 |
| Expenses | | |
| Management fee | $128,630 | |
| Transfer agent fees | 30,002 | |
| Distribution and service plan fees | 17,673 | |
| Accounting fees and expenses | 12,019 | |
| Custodian fees and expenses | 2,041 | |
| Independent trustees' fees and expenses | 79 | |
| Registration fees | 92,672 | |
| Audit | 67,293 | |
| Legal | 20 | |
| Miscellaneous | 351 | |
| Total expenses before reductions | 350,780 | |
| Expense reductions | (160,630) | |
| Total expenses after reductions | | 190,150 |
| Net investment income (loss) | | 558,094 |
| Realized and Unrealized Gain (Loss) | | |
| Net realized gain (loss) on: | | |
| Investment securities: | | |
| Unaffiliated issuers | (251,139) | |
| Fidelity Central Funds | 1 | |
| Forward foreign currency contracts | 380,855 | |
| Foreign currency transactions | 56,176 | |
| Futures contracts | 450,569 | |
| Swaps | 95,114 | |
| Total net realized gain (loss) | | 731,576 |
| Change in net unrealized appreciation (depreciation) on: | | |
| Investment securities: | | |
| Unaffiliated issuers | 2,936,872 | |
| Fidelity Central Funds | (1) | |
| Forward foreign currency contracts | (21,612) | |
| Assets and liabilities in foreign currencies | 4,916 | |
| Futures contracts | (837) | |
| Swaps | 74,850 | |
| Total change in net unrealized appreciation (depreciation) | | 2,994,188 |
| Net gain (loss) | | 3,725,764 |
| Net increase (decrease) in net assets resulting from operations | | $4,283,858 |
See accompanying notes which are an integral part of the financial statements.
Statement of Changes in Net Assets
| | Six months ended June 30, 2019 (Unaudited) | Year ended December 31, 2018 |
| Increase (Decrease) in Net Assets | | |
| Operations | | |
| Net investment income (loss) | $558,094 | $1,080,166 |
| Net realized gain (loss) | 731,576 | 747,448 |
| Change in net unrealized appreciation (depreciation) | 2,994,188 | (3,073,448) |
| Net increase (decrease) in net assets resulting from operations | 4,283,858 | (1,245,834) |
| Distributions to shareholders | (248,315) | (882,051) |
| Distributions to shareholders from tax return of capital | – | (164,576) |
| Total distributions | (248,315) | (1,046,627) |
| Share transactions - net increase (decrease) | 22,135,127 | (1,050,596) |
| Total increase (decrease) in net assets | 26,170,670 | (3,343,057) |
| Net Assets | | |
| Beginning of period | 39,505,178 | 42,848,235 |
| End of period | $65,675,848 | $39,505,178 |
See accompanying notes which are an integral part of the financial statements.
Financial Highlights
Fidelity Global Credit Fund Class A
| | Six months ended (Unaudited) June 30, | Years endedDecember 31, | | | | |
| | 2019 | 2018 | 2017 | 2016 | 2015 | 2014 |
| Selected Per–Share Data | | | | | | |
| Net asset value, beginning of period | $8.70 | $9.19 | $8.61 | $8.68 | $9.38 | $9.56 |
| Income from Investment Operations | | | | | | |
| Net investment income (loss)A | .101 | .214 | .141 | .156 | .205 | .199 |
| Net realized and unrealized gain (loss) | .724 | (.493) | .596 | .055 | (.692) | (.187) |
| Total from investment operations | .825 | (.279) | .737 | .211 | (.487) | .012 |
| Distributions from net investment income | (.045) | (.178) | – | (.175) | – | (.006) |
| Distributions from net realized gain | – | – | – | (.100) | – | – |
| Tax return of capital | – | (.033) | (.157) | (.006) | (.213) | (.186) |
| Total distributions | (.045) | (.211) | (.157) | (.281) | (.213) | (.192) |
| Net asset value, end of period | $9.48 | $8.70 | $9.19 | $8.61 | $8.68 | $9.38 |
| Total ReturnB,C,D | 9.50% | (3.05)% | 8.60% | 2.39% | (5.24)% | .08% |
| Ratios to Average Net AssetsE,F | | | | | | |
| Expenses before reductions | 1.77%G | 1.50% | 1.63% | 1.52% | 1.46% | 1.44% |
| Expenses net of fee waivers, if any | 1.00%G | 1.00% | 1.00% | 1.00% | 1.00% | 1.00% |
| Expenses net of all reductions | 1.00%G | 1.00% | 1.00% | 1.00% | 1.00% | 1.00% |
| Net investment income (loss) | 2.22%G | 2.40% | 1.56% | 1.72% | 2.26% | 2.05% |
| Supplemental Data | | | | | | |
| Net assets, end of period (000 omitted) | $4,122 | $3,830 | $4,320 | $4,667 | $4,781 | $4,770 |
| Portfolio turnover rateH | 81%G | 83% | 150% | 105% | 110% | 227% |
A Calculated based on average shares outstanding during the period.
B Total returns for periods of less than one year are not annualized.
C Total returns would have been lower if certain expenses had not been reduced during the applicable periods shown.
D Total returns do not include the effect of the sales charges.
E Fees and expenses of any underlying Fidelity Central Funds are not included in the Fund's expense ratio. The Fund indirectly bears its proportionate share of the expenses of any underlying Fidelity Central Funds.
F Expense ratios reflect operating expenses of the class. Expenses before reductions do not reflect amounts reimbursed by the investment adviser or reductions from expense offset arrangements and do not represent the amount paid by the class during periods when reimbursements or reductions occur. Expenses net of fee waivers reflect expenses after reimbursement by the investment adviser but prior to reductions from expense offset arrangements. Expenses net of all reductions represent the net expenses paid by the class.
G Annualized
H Amount does not include the portfolio activity of any underlying Fidelity Central Funds.
See accompanying notes which are an integral part of the financial statements.
Fidelity Global Credit Fund Class M
| | Six months ended (Unaudited) June 30, | Years endedDecember 31, | | | | |
| | 2019 | 2018 | 2017 | 2016 | 2015 | 2014 |
| Selected Per–Share Data | | | | | | |
| Net asset value, beginning of period | $8.70 | $9.19 | $8.61 | $8.68 | $9.38 | $9.56 |
| Income from Investment Operations | | | | | | |
| Net investment income (loss)A | .101 | .214 | .141 | .156 | .204 | .199 |
| Net realized and unrealized gain (loss) | .714 | (.494) | .596 | .058 | (.691) | (.187) |
| Total from investment operations | .815 | (.280) | .737 | .214 | (.487) | .012 |
| Distributions from net investment income | (.045) | (.177) | – | (.178) | – | (.006) |
| Distributions from net realized gain | – | – | – | (.100) | – | – |
| Tax return of capital | – | (.033) | (.157) | (.006) | (.213) | (.186) |
| Total distributions | (.045) | (.210) | (.157) | (.284) | (.213) | (.192) |
| Net asset value, end of period | $9.47 | $8.70 | $9.19 | $8.61 | $8.68 | $9.38 |
| Total ReturnB,C,D | 9.39% | (3.06)% | 8.60% | 2.42% | (5.24)% | .08% |
| Ratios to Average Net AssetsE,F | | | | | | |
| Expenses before reductions | 1.85%G | 1.58% | 1.70% | 1.55% | 1.48% | 1.46% |
| Expenses net of fee waivers, if any | 1.00%G | 1.00% | 1.00% | 1.00% | 1.00% | 1.00% |
| Expenses net of all reductions | 1.00%G | 1.00% | 1.00% | 1.00% | 1.00% | 1.00% |
| Net investment income (loss) | 2.22%G | 2.40% | 1.56% | 1.72% | 2.26% | 2.05% |
| Supplemental Data | | | | | | |
| Net assets, end of period (000 omitted) | $1,859 | $1,757 | $2,150 | $2,874 | $3,037 | $3,012 |
| Portfolio turnover rateH | 81%G | 83% | 150% | 105% | 110% | 227% |
A Calculated based on average shares outstanding during the period.
B Total returns for periods of less than one year are not annualized.
C Total returns would have been lower if certain expenses had not been reduced during the applicable periods shown.
D Total returns do not include the effect of the sales charges.
E Fees and expenses of any underlying Fidelity Central Funds are not included in the Fund's expense ratio. The Fund indirectly bears its proportionate share of the expenses of any underlying Fidelity Central Funds.
F Expense ratios reflect operating expenses of the class. Expenses before reductions do not reflect amounts reimbursed by the investment adviser or reductions from expense offset arrangements and do not represent the amount paid by the class during periods when reimbursements or reductions occur. Expenses net of fee waivers reflect expenses after reimbursement by the investment adviser but prior to reductions from expense offset arrangements. Expenses net of all reductions represent the net expenses paid by the class.
G Annualized
H Amount does not include the portfolio activity of any underlying Fidelity Central Funds.
See accompanying notes which are an integral part of the financial statements.
Fidelity Global Credit Fund Class C
| | Six months ended (Unaudited) June 30, | Years endedDecember 31, | | | | |
| | 2019 | 2018 | 2017 | 2016 | 2015 | 2014 |
| Selected Per–Share Data | | | | | | |
| Net asset value, beginning of period | $8.70 | $9.17 | $8.60 | $8.67 | $9.37 | $9.55 |
| Income from Investment Operations | | | | | | |
| Net investment income (loss)A | .067 | .147 | .073 | .088 | .137 | .126 |
| Net realized and unrealized gain (loss) | .726 | (.489) | .589 | .056 | (.690) | (.185) |
| Total from investment operations | .793 | (.342) | .662 | .144 | (.553) | (.059) |
| Distributions from net investment income | (.023) | (.108) | – | (.110) | – | (.004) |
| Distributions from net realized gain | – | – | – | (.100) | – | – |
| Tax return of capital | – | (.020) | (.092) | (.004) | (.147) | (.117) |
| Total distributions | (.023) | (.128) | (.092) | (.214) | (.147) | (.121) |
| Net asset value, end of period | $9.47 | $8.70 | $9.17 | $8.60 | $8.67 | $9.37 |
| Total ReturnB,C,D | 9.12% | (3.74)% | 7.71% | 1.64% | (5.94)% | (.65)% |
| Ratios to Average Net AssetsE,F | | | | | | |
| Expenses before reductions | 2.60%G | 2.31% | 2.44% | 2.30% | 2.25% | 2.22% |
| Expenses net of fee waivers, if any | 1.75%G | 1.75% | 1.75% | 1.75% | 1.75% | 1.75% |
| Expenses net of all reductions | 1.75%G | 1.75% | 1.75% | 1.75% | 1.75% | 1.75% |
| Net investment income (loss) | 1.47%G | 1.65% | .82% | .97% | 1.51% | 1.30% |
| Supplemental Data | | | | | | |
| Net assets, end of period (000 omitted) | $1,922 | $2,290 | $2,552 | $3,514 | $3,541 | $4,340 |
| Portfolio turnover rateH | 81%G | 83% | 150% | 105% | 110% | 227% |
A Calculated based on average shares outstanding during the period.
B Total returns for periods of less than one year are not annualized.
C Total returns would have been lower if certain expenses had not been reduced during the applicable periods shown.
D Total returns do not include the effect of the contingent deferred sales charge.
E Fees and expenses of any underlying Fidelity Central Funds are not included in the Fund's expense ratio. The Fund indirectly bears its proportionate share of the expenses of any underlying Fidelity Central Funds.
F Expense ratios reflect operating expenses of the class. Expenses before reductions do not reflect amounts reimbursed by the investment adviser or reductions from expense offset arrangements and do not represent the amount paid by the class during periods when reimbursements or reductions occur. Expenses net of fee waivers reflect expenses after reimbursement by the investment adviser but prior to reductions from expense offset arrangements. Expenses net of all reductions represent the net expenses paid by the class.
G Annualized
H Amount does not include the portfolio activity of any underlying Fidelity Central Funds.
See accompanying notes which are an integral part of the financial statements.
Fidelity Global Credit Fund
| | Six months ended (Unaudited) June 30, | Years endedDecember 31, | | | | |
| | 2019 | 2018 | 2017 | 2016 | 2015 | 2014 |
| Selected Per–Share Data | | | | | | |
| Net asset value, beginning of period | $8.70 | $9.19 | $8.61 | $8.68 | $9.38 | $9.56 |
| Income from Investment Operations | | | | | | |
| Net investment income (loss)A | .112 | .237 | .164 | .179 | .227 | .223 |
| Net realized and unrealized gain (loss) | .719 | (.495) | .598 | .055 | (.691) | (.188) |
| Total from investment operations | .831 | (.258) | .762 | .234 | (.464) | .035 |
| Distributions from net investment income | (.051) | (.196) | – | (.197) | – | (.007) |
| Distributions from net realized gain | – | – | – | (.100) | – | – |
| Tax return of capital | – | (.036) | (.182) | (.007) | (.236) | (.208) |
| Total distributions | (.051) | (.232) | (.182) | (.304) | (.236) | (.215) |
| Net asset value, end of period | $9.48 | $8.70 | $9.19 | $8.61 | $8.68 | $9.38 |
| Total ReturnB,C | 9.57% | (2.82)% | 8.90% | 2.65% | (5.00)% | .32% |
| Ratios to Average Net AssetsD,E | | | | | | |
| Expenses before reductions | 1.42%F | 1.18% | 1.30% | 1.14% | 1.09% | 1.09% |
| Expenses net of fee waivers, if any | .75%F | .75% | .75% | .75% | .75% | .75% |
| Expenses net of all reductions | .75%F | .75% | .75% | .75% | .75% | .75% |
| Net investment income (loss) | 2.47%F | 2.65% | 1.82% | 1.97% | 2.51% | 2.30% |
| Supplemental Data | | | | | | |
| Net assets, end of period (000 omitted) | $51,890 | $30,263 | $32,493 | $41,569 | $44,497 | $46,242 |
| Portfolio turnover rateG | 81%F | 83% | 150% | 105% | 110% | 227% |
A Calculated based on average shares outstanding during the period.
B Total returns for periods of less than one year are not annualized.
C Total returns would have been lower if certain expenses had not been reduced during the applicable periods shown.
D Fees and expenses of any underlying Fidelity Central Funds are not included in the Fund's expense ratio. The Fund indirectly bears its proportionate share of the expenses of any underlying Fidelity Central Funds.
E Expense ratios reflect operating expenses of the class. Expenses before reductions do not reflect amounts reimbursed by the investment adviser or reductions from expense offset arrangements and do not represent the amount paid by the class during periods when reimbursements or reductions occur. Expenses net of fee waivers reflect expenses after reimbursement by the investment adviser but prior to reductions from expense offset arrangements. Expenses net of all reductions represent the net expenses paid by the class.
F Annualized
G Amount does not include the portfolio activity of any underlying Fidelity Central Funds.
See accompanying notes which are an integral part of the financial statements.
Fidelity Global Credit Fund Class I
| | Six months ended (Unaudited) June 30, | Years endedDecember 31, | | | | |
| | 2019 | 2018 | 2017 | 2016 | 2015 | 2014 |
| Selected Per–Share Data | | | | | | |
| Net asset value, beginning of period | $8.70 | $9.19 | $8.61 | $8.68 | $9.38 | $9.56 |
| Income from Investment Operations | | | | | | |
| Net investment income (loss)A | .112 | .237 | .163 | .179 | .226 | .223 |
| Net realized and unrealized gain (loss) | .719 | (.495) | .599 | .055 | (.690) | (.188) |
| Total from investment operations | .831 | (.258) | .762 | .234 | (.464) | .035 |
| Distributions from net investment income | (.051) | (.196) | – | (.197) | – | (.007) |
| Distributions from net realized gain | – | – | – | (.100) | – | – |
| Tax return of capital | – | (.036) | (.182) | (.007) | (.236) | (.208) |
| Total distributions | (.051) | (.232) | (.182) | (.304) | (.236) | (.215) |
| Net asset value, end of period | $9.48 | $8.70 | $9.19 | $8.61 | $8.68 | $9.38 |
| Total ReturnB,C | 9.57% | (2.82)% | 8.90% | 2.65% | (5.00)% | .32% |
| Ratios to Average Net AssetsD,E | | | | | | |
| Expenses before reductions | 1.30%F | 1.14% | 1.30% | 1.16% | 1.14% | 1.15% |
| Expenses net of fee waivers, if any | .75%F | .75% | .75% | .75% | .75% | .75% |
| Expenses net of all reductions | .75%F | .75% | .75% | .75% | .75% | .75% |
| Net investment income (loss) | 2.47%F | 2.65% | 1.81% | 1.97% | 2.51% | 2.30% |
| Supplemental Data | | | | | | |
| Net assets, end of period (000 omitted) | $2,188 | $1,265 | $1,333 | $2,415 | $2,932 | $2,718 |
| Portfolio turnover rateG | 81%F | 83% | 150% | 105% | 110% | 227% |
A Calculated based on average shares outstanding during the period.
B Total returns for periods of less than one year are not annualized.
C Total returns would have been lower if certain expenses had not been reduced during the applicable periods shown.
D Fees and expenses of any underlying Fidelity Central Funds are not included in the Fund's expense ratio. The Fund indirectly bears its proportionate share of the expenses of any underlying Fidelity Central Funds.
E Expense ratios reflect operating expenses of the class. Expenses before reductions do not reflect amounts reimbursed by the investment adviser or reductions from expense offset arrangements and do not represent the amount paid by the class during periods when reimbursements or reductions occur. Expenses net of fee waivers reflect expenses after reimbursement by the investment adviser but prior to reductions from expense offset arrangements. Expenses net of all reductions represent the net expenses paid by the class.
F Annualized
G Amount does not include the portfolio activity of any underlying Fidelity Central Funds.
See accompanying notes which are an integral part of the financial statements.
Fidelity Global Credit Fund Class Z
| | Six months ended (Unaudited) June 30, | Years endedDecember 31, |
| | 2019 | 2018 A |
| Selected Per–Share Data | | |
| Net asset value, beginning of period | $8.70 | $8.92 |
| Income from Investment Operations | | |
| Net investment income (loss)B | .116 | .065 |
| Net realized and unrealized gain (loss) | .715 | (.164) |
| Total from investment operations | .831 | (.099) |
| Distributions from net investment income | (.051) | (.102) |
| Tax return of capital | – | (.019) |
| Total distributions | (.051) | (.121) |
| Net asset value, end of period | $9.48 | $8.70 |
| Total ReturnC,D | 9.57% | (1.11)% |
| Ratios to Average Net AssetsE,F | | |
| Expenses before reductions | 1.37%G | .95%G |
| Expenses net of fee waivers, if any | .66%G | .66%G |
| Expenses net of all reductions | .66%G | .66%G |
| Net investment income (loss) | 2.56%G | 2.97%G |
| Supplemental Data | | |
| Net assets, end of period (000 omitted) | $3,694 | $100 |
| Portfolio turnover rateH | 81%G | 83% |
A For the period October 2, 2018 (commencement of sale of shares) to December 31, 2018.
B Calculated based on average shares outstanding during the period.
C Total returns for periods of less than one year are not annualized.
D Total returns would have been lower if certain expenses had not been reduced during the applicable periods shown.
E Fees and expenses of any underlying Fidelity Central Funds are not included in the Fund's expense ratio. The Fund indirectly bears its proportionate share of the expenses of any underlying Fidelity Central Funds.
F Expense ratios reflect operating expenses of the class. Expenses before reductions do not reflect amounts reimbursed by the investment adviser or reductions from expense offset arrangements and do not represent the amount paid by the class during periods when reimbursements or reductions occur. Expense ratios before reductions for start-up periods may not be representative of longer-term operating periods. Expenses net of fee waivers reflect expenses after reimbursement by the investment adviser but prior to reductions from expense offset arrangements. Expenses net of all reductions represent the net expenses paid by the class.
G Annualized
H Amount does not include the portfolio activity of any underlying Fidelity Central Funds.
See accompanying notes which are an integral part of the financial statements.
Notes to Financial Statements (Unaudited)
For the period ended June 30, 2019
1. Organization.
Fidelity Global Credit Fund (the Fund) is a fund of Fidelity School Street Trust (the Trust) and is authorized to issue an unlimited number of shares. The Trust is registered under the Investment Company Act of 1940, as amended (the 1940 Act), as an open-end management investment company organized as a Massachusetts business trust. The Fund offers Class A, Class M, Class C, Global Credit, Class I and Class Z shares, each of which has equal rights as to assets and voting privileges. Each class has exclusive voting rights with respect to matters that affect that class. Effective March 1, 2019, Class C shares will automatically convert to Class A shares after a holding period of ten years from the initial date of purchase, with certain exceptions.
2. Investments in Fidelity Central Funds.
The Fund invests in Fidelity Central Funds, which are open-end investment companies generally available only to other investment companies and accounts managed by the investment adviser and its affiliates. The Fund's Schedule of Investments lists each of the Fidelity Central Funds held as of period end, if any, as an investment of the Fund, but does not include the underlying holdings of each Fidelity Central Fund. As an Investing Fund, the Fund indirectly bears its proportionate share of the expenses of the underlying Fidelity Central Funds.
The Money Market Central Funds seek preservation of capital and current income and are managed by Fidelity Investments Money Management, Inc. (FIMM), an affiliate of the investment adviser. Annualized expenses of the Money Market Central Funds as of their most recent shareholder report date ranged from less than .005% to .01%.
A complete unaudited list of holdings for each Fidelity Central Fund is available upon request or at the Securities and Exchange Commission (the SEC) website at www.sec.gov. In addition, the financial statements of the Fidelity Central Funds are available on the SEC website or upon request.
3. Significant Accounting Policies.
The Fund is an investment company and applies the accounting and reporting guidance of the Financial Accounting Standards Board (FASB) Accounting Standards Codification Topic 946 Financial Services – Investments Companies. The financial statements have been prepared in conformity with accounting principles generally accepted in the United States of America (GAAP), which require management to make certain estimates and assumptions at the date of the financial statements. Actual results could differ from those estimates. Subsequent events, if any, through the date that the financial statements were issued have been evaluated in the preparation of the financial statements. The following summarizes the significant accounting policies of the Fund:
Investment Valuation. Investments are valued as of 4:00 p.m. Eastern time on the last calendar day of the period. The Board of Trustees (the Board) has delegated the day to day responsibility for the valuation of the Fund's investments to the Fair Value Committee (the Committee) established by the Fund's investment adviser. In accordance with valuation policies and procedures approved by the Board, the Fund attempts to obtain prices from one or more third party pricing vendors or brokers to value its investments. When current market prices, quotations or currency exchange rates are not readily available or reliable, investments will be fair valued in good faith by the Committee, in accordance with procedures adopted by the Board. Factors used in determining fair value vary by investment type and may include market or investment specific events, changes in interest rates and credit quality. The frequency with which these procedures are used cannot be predicted and they may be utilized to a significant extent. The Committee oversees the Fund's valuation policies and procedures and reports to the Board on the Committee's activities and fair value determinations. The Board monitors the appropriateness of the procedures used in valuing the Fund's investments and ratifies the fair value determinations of the Committee.
The Fund categorizes the inputs to valuation techniques used to value its investments into a disclosure hierarchy consisting of three levels as shown below:
- Level 1 – quoted prices in active markets for identical investments
- Level 2 – other significant observable inputs (including quoted prices for similar investments, interest rates, prepayment speeds, etc.)
- Level 3 – unobservable inputs (including the Fund's own assumptions based on the best information available)
Valuation techniques used to value the Fund's investments by major category are as follows:
Debt securities, including restricted securities, are valued based on evaluated prices received from third party pricing vendors or from brokers who make markets in such securities. Corporate bonds, foreign government and government agency obligations, preferred securities and U.S. government and government agency obligations are valued by pricing vendors who utilize matrix pricing which considers yield or price of bonds of comparable quality, coupon, maturity and type or by broker-supplied prices. Swaps are marked-to-market daily based on valuations from third party pricing vendors, registered derivatives clearing organizations (clearinghouses) or broker-supplied valuations. These pricing sources may utilize inputs such as interest rate curves, credit spread curves, default possibilities and recovery rates. When independent prices are unavailable or unreliable, debt securities and swaps may be valued utilizing pricing methodologies which consider similar factors that would be used by third party pricing vendors. For foreign debt securities, when significant market or security specific events arise, valuations may be determined in good faith in accordance with procedures adopted by the Board. Debt securities and swaps are generally categorized as Level 2 in the hierarchy but may be Level 3 depending on the circumstances.
Equity securities, including restricted securities, for which market quotations are readily available, are valued at the last reported sale price or official closing price as reported by a third party pricing vendor on the primary market or exchange on which they are traded and are categorized as Level 1 in the hierarchy. In the event there were no sales during the day or closing prices are not available, securities are valued at the last quoted bid price or may be valued using the last available price and are generally categorized as Level 2 in the hierarchy. For foreign equity securities, when market or security specific events arise, comparisons to the valuation of American Depositary Receipts (ADRs), futures contracts, Exchange-Traded Funds (ETFs) and certain indexes as well as quoted prices for similar securities may be used and would be categorized as Level 2 in the hierarchy. For equity securities, including restricted securities, where observable inputs are limited, assumptions about market activity and risk are used and these securities may be categorized as Level 3 in the hierarchy.
The U.S. dollar value of foreign currency contracts is determined using currency exchange rates supplied by a pricing service and are categorized as Level 2 in the hierarchy. Futures contracts are valued at the settlement price established each day by the board of trade or exchange on which they are traded and are categorized as Level 1 in the hierarchy. Options traded over-the-counter are valued using vendor or broker-supplied valuations and are categorized as Level 2 in the hierarchy. Investments in open-end mutual funds, including the Fidelity Central Funds, are valued at their closing net asset value (NAV) each business day and are categorized as Level 1 in the hierarchy.
Changes in valuation techniques may result in transfers in or out of an assigned level within the disclosure hierarchy. The aggregate value of investments by input level as of June 30, 2019 is included at the end of the Fund's Schedule of Investments.
Foreign Currency. Foreign-denominated assets, including investment securities, and liabilities are translated into U.S. dollars at the exchange rates at period end. Purchases and sales of investment securities, income and dividends received and expenses denominated in foreign currencies are translated into U.S. dollars at the exchange rate in effect on the transaction date.
The effects of exchange rate fluctuations on investments are included with the net realized and unrealized gain (loss) on investment securities. Other foreign currency transactions resulting in realized and unrealized gain (loss) are disclosed separately.
Realized gains and losses on foreign currency transactions arise from the disposition of foreign currency, realized changes in the value of foreign currency between the trade and settlement dates on security transactions, and the difference between the amounts of dividends, interest and foreign withholding taxes recorded on transaction date and the U.S. dollar equivalent of the amounts actually received or paid. Unrealized gains and losses on assets and liabilities in foreign currencies arise from changes in the value of foreign currency, and from assets and liabilities denominated in foreign currencies, other than investments, which are held at period end.
Investment Transactions and Income. For financial reporting purposes, the Fund's investment holdings and NAV include trades executed through the end of the last business day of the period. The NAV per share for processing shareholder transactions is calculated as of the close of business of the New York Stock Exchange (NYSE), normally 4:00 p.m. Eastern time and includes trades executed through the end of the prior business day. Gains and losses on securities sold are determined on the basis of identified cost and include proceeds received from litigation. Dividend income is recorded on the ex-dividend date, except for certain dividends from foreign securities where the ex-dividend date may have passed, which are recorded as soon as the Fund is informed of the ex-dividend date. Non-cash dividends included in dividend income, if any, are recorded at the fair market value of the securities received. Income and capital gain distributions from Fidelity Central Funds, if any, are recorded on the ex-dividend date. Interest income is accrued as earned and includes coupon interest and amortization of premium and accretion of discount on debt securities as applicable. Investment income is recorded net of foreign taxes withheld where recovery of such taxes is uncertain. Debt obligations may be placed on non-accrual status and related interest income may be reduced by ceasing current accruals and writing off interest receivables when the collection of all or a portion of interest has become doubtful based on consistently applied procedures. A debt obligation is removed from non-accrual status when the issuer resumes interest payments or when collectability of interest is reasonably assured.
Class Allocations and Expenses. Investment income, realized and unrealized capital gains and losses, common expenses of the Fund, and certain fund-level expense reductions, if any, are allocated daily on a pro-rata basis to each class based on the relative net assets of each class to the total net assets of the Fund. Each class differs with respect to transfer agent and distribution and service plan fees incurred. Certain expense reductions may also differ by class. For the reporting period, the allocated portion of income and expenses to each class as a percent of its average net assets may vary due to the timing of recording these transactions in relation to fluctuating net assets of the classes. Expenses directly attributable to a fund are charged to that fund. Expenses attributable to more than one fund are allocated among the respective funds on the basis of relative net assets or other appropriate methods. Expense estimates are accrued in the period to which they relate and adjustments are made when actual amounts are known.
Income Tax Information and Distributions to Shareholders. Each year, the Fund intends to qualify as a regulated investment company under Subchapter M of the Internal Revenue Code, including distributing substantially all of its taxable income and realized gains. As a result, no provision for U.S. Federal income taxes is required. The Fund files a U.S. federal tax return, in addition to state and local tax returns as required. The Fund's federal income tax returns are subject to examination by the Internal Revenue Service (IRS) for a period of three fiscal years after they are filed. State and local tax returns may be subject to examination for an additional fiscal year depending on the jurisdiction. Foreign taxes are provided for based on the Fund's understanding of the tax rules and rates that exist in the foreign markets in which it invests.
Distributions are declared and recorded on the ex-dividend date. Income and capital gain distributions are declared separately for each class. Income and capital gain distributions are determined in accordance with income tax regulations, which may differ from GAAP.
Capital accounts within the financial statements are adjusted for permanent book-tax differences. These adjustments have no impact on net assets or the results of operations. Capital accounts are not adjusted for temporary book-tax differences which will reverse in a subsequent period.
Book-tax differences are primarily due to futures contracts, swaps, foreign currency transactions, market discount, tax return of capital distribution, capital loss carryforwards and losses deferred due to wash sales and excise tax regulations.
For the period ending December 31, 2018, the Fund's distributions exceeded the aggregate amount of taxable income and net realized gains resulting in a return of capital for tax purposes. This was due to reductions in taxable income available for distribution after certain distributions had been made.
As of period end, the cost and unrealized appreciation (depreciation) in securities, and derivatives if applicable, for federal income tax purposes were as follows:
| Gross unrealized appreciation | $1,862,626 |
| Gross unrealized depreciation | (1,259,433) |
| Net unrealized appreciation (depreciation) | $603,193 |
| Tax cost | $64,193,756 |
Capital loss carryforwards are only available to offset future capital gains of the Fund to the extent provided by regulations and may be limited. Under the Regulated Investment Company Modernization Act of 2010 (the Act), the Fund is permitted to carry forward capital losses incurred in taxable years beginning after December 22, 2010 for an unlimited period and such capital losses are required to be used prior to any losses that expire. The capital loss carryforward information presented below, including any applicable limitation, is estimated as of prior fiscal period end and is subject to adjustment.
| No expiration | |
| Short-term | $(100,633) |
| Long-term | (1,056,043) |
| Total capital loss carryforward | $(1,156,676) |
Restricted Securities. The Fund may invest in securities that are subject to legal or contractual restrictions on resale. These securities generally may be resold in transactions exempt from registration or to the public if the securities are registered. Disposal of these securities may involve time-consuming negotiations and expense, and prompt sale at an acceptable price may be difficult. Information regarding restricted securities is included at the end of the Fund's Schedule of Investments.
4. Derivative Instruments.
Risk Exposures and the Use of Derivative Instruments. The Fund's investment objective allows the Fund to enter into various types of derivative contracts, including futures contracts, forward foreign currency contracts, options and swaps. Derivatives are investments whose value is primarily derived from underlying assets, indices or reference rates and may be transacted on an exchange or over-the-counter (OTC). Derivatives may involve a future commitment to buy or sell a specified asset based on specified terms, to exchange future cash flows at periodic intervals based on a notional principal amount, or for one party to make one or more payments upon the occurrence of specified events in exchange for periodic payments from the other party.
The Fund used derivatives to increase returns, to gain exposure to certain types of assets, to facilitate transactions in foreign-denominated securities and to manage exposure to certain risks as defined below. The success of any strategy involving derivatives depends on analysis of numerous economic factors, and if the strategies for investment do not work as intended, the Fund may not achieve its objectives.
The Fund's use of derivatives increased or decreased its exposure to the following risks:
| Credit Risk | Credit risk relates to the ability of the issuer of a financial instrument to make further principal or interest payments on an obligation or commitment that it has to the Fund.
|
| Foreign Exchange Risk | Foreign exchange rate risk relates to fluctuations in the value of an asset or liability due to changes in currency exchange rates.
|
| Interest Rate Risk | Interest rate risk relates to the fluctuations in the value of interest-bearing securities due to changes in the prevailing levels of market interest rates. |
The Fund is also exposed to additional risks from investing in derivatives, such as liquidity risk and counterparty credit risk. Liquidity risk is the risk that the Fund will be unable to close out the derivative in the open market in a timely manner. Counterparty credit risk is the risk that the counterparty will not be able to fulfill its obligation to the Fund. Derivative counterparty credit risk is managed through formal evaluation of the creditworthiness of all potential counterparties. On certain OTC derivatives such as forward foreign currency contracts, options and bi-lateral swaps, the Fund attempts to reduce its exposure to counterparty credit risk by entering into an International Swaps and Derivatives Association, Inc. (ISDA) Master Agreement with each of its counterparties. The ISDA Master Agreement gives the Fund the right to terminate all transactions traded under such agreement upon the deterioration in the credit quality of the counterparty beyond specified levels. The ISDA Master Agreement gives each party the right, upon an event of default by the other party or a termination of the agreement, to close out all transactions traded under such agreement and to net amounts owed under each transaction to one net payable by one party to the other. To mitigate counterparty credit risk on bi-lateral OTC derivatives, the Fund receives collateral in the form of cash or securities once the Fund's net unrealized appreciation on outstanding derivative contracts under an ISDA Master Agreement exceeds certain applicable thresholds, subject to certain minimum transfer provisions. The collateral received is held in segregated accounts with the Fund's custodian bank in accordance with the collateral agreements entered into between the Fund, the counterparty and the Fund's custodian bank. The Fund could experience delays and costs in gaining access to the collateral even though it is held by the Fund's custodian bank. The Fund's maximum risk of loss from counterparty credit risk related to bi-lateral OTC derivatives is generally the aggregate unrealized appreciation and unpaid counterparty payments in excess of any collateral pledged by the counterparty to the Fund. The Fund may be required to pledge collateral for the benefit of the counterparties on bi-lateral OTC derivatives in an amount not less than each counterparty's unrealized appreciation on outstanding derivative contracts, subject to certain minimum transfer provisions, and any such pledged collateral is identified in the Schedule of Investments. Exchange-traded futures contracts are not covered by the ISDA Master Agreement; however counterparty credit risk related to exchange-traded futures contracts may be mitigated by the protection provided by the exchange on which they trade. Counterparty credit risk related to centrally cleared OTC swaps may be mitigated by the protection provided by the clearinghouse. A summary of the Fund's derivatives inclusive of potential netting arrangements is presented at the end of the Schedule of Investments.
Investing in derivatives may involve greater risks than investing in the underlying assets directly and, to varying degrees, may involve risk of loss in excess of any initial investment and collateral received and amounts recognized in the Statement of Assets and Liabilities. In addition, there may be the risk that the change in value of the derivative contract does not correspond to the change in value of the underlying instrument.
Net Realized Gain (Loss) and Change in Net Unrealized Appreciation (Depreciation) on Derivatives. The table below, which reflects the impacts of derivatives on the financial performance of the Fund, summarizes the net realized gain (loss) and change in net unrealized appreciation (depreciation) for derivatives during the period as presented in the Statement of Operations.
| Primary Risk Exposure / Derivative Type | Net Realized Gain (Loss) | Change in Net Unrealized Appreciation (Depreciation) |
| Credit Risk | | |
| Purchased Options | $(77,315) | $(98,600) |
| Swaps | (30,244) | 17,193 |
| Total Credit Risk | (107,559) | (81,407) |
| Foreign Exchange Risk | | |
| Forward Foreign Currency Contracts | 380,855 | (21,612) |
| Total Foreign Exchange Risk | 380,855 | (21,612) |
| Interest Rate Risk | | |
| Futures Contracts | 450,569 | (837) |
| Swaps | 125,358 | 57,657 |
| Total Interest Rate Risk | 575,927 | 56,820 |
| Totals | $849,223 | $(46,199) |
A summary of the value of derivatives by primary risk exposure as of period end is included at the end of the Schedule of Investments.
Forward Foreign Currency Contracts. Forward foreign currency contracts represent obligations to purchase or sell foreign currency on a specified future date at a price fixed at the time the contracts are entered into. The Fund used forward foreign currency contracts to facilitate transactions in foreign-denominated securities and to manage exposure to certain foreign currencies.
Forward foreign currency contracts are valued daily and fluctuations in exchange rates on open contracts are recorded as unrealized appreciation or (depreciation) and reflected in the Statement of Assets and Liabilities. When the contract is closed, the Fund realizes a gain or loss equal to the difference between the closing value and the value at the time it was opened. Non-deliverable forward foreign currency exchange contracts are settled with the counterparty in cash without the delivery of foreign currency. The net realized gain (loss) and change in net unrealized appreciation (depreciation) on forward foreign currency contracts during the period is presented in the Statement of Operations.
Any open forward foreign currency contracts at period end are presented in the Schedule of Investments under the caption "Forward Foreign Currency Contracts." The contract amount and unrealized appreciation (depreciation) reflects each contract's exposure to the underlying currency at period end.
Futures Contracts. A futures contract is an agreement between two parties to buy or sell a specified underlying instrument for a fixed price at a specified future date. The Fund used futures contracts to manage its exposure to the bond market and fluctuations in interest rates.
Upon entering into a futures contract, a fund is required to deposit either cash or securities (initial margin) with a clearing broker in an amount equal to a certain percentage of the face value of the contract. Futures contracts are marked-to-market daily and subsequent daily payments (variation margin) are made or received by a fund depending on the daily fluctuations in the value of the futures contracts and are recorded as unrealized appreciation or (depreciation). This receivable and/or payable, if any, is included in daily variation margin on futures contracts in the Statement of Assets and Liabilities. Realized gain or (loss) is recorded upon the expiration or closing of a futures contract. The net realized gain (loss) and change in net unrealized appreciation (depreciation) on futures contracts during the period is presented in the Statement of Operations.
Any open futures contracts at period end are presented in the Schedule of Investments under the caption "Futures Contracts". The notional amount at value reflects each contract's exposure to the underlying instrument or index at period end. Securities deposited to meet initial margin requirements are identified in the Schedule of Investments.
Options. Options give the purchaser the right, but not the obligation, to buy (call) or sell (put) an underlying security or financial instrument at an agreed exercise or strike price between or on certain dates. Options obligate the seller (writer) to buy (put) or sell (call) an underlying instrument at the exercise or strike price or cash settle an underlying derivative instrument if the holder exercises the option on or before the expiration date. The Fund uses OTC options, such as swaptions, which are options where the underlying instrument is a swap, to manage its exposure to potential credit events.
Upon entering into an options contract, a fund will pay or receive a premium. Premiums paid on purchased options are reflected as cost of investments and premiums received on written options are reflected as a liability on the Statement of Assets and Liabilities. Certain options may be purchased or written with premiums to be paid or received on a future date. Options are valued daily and any unrealized appreciation (depreciation) is reflected on the Statement of Assets and Liabilities. When an option is exercised, the cost or proceeds of the underlying instrument purchased or sold is adjusted by the amount of the premium. When an option is closed the Fund will realize a gain or loss depending on whether the proceeds or amount paid for the closing sale transaction is greater or less than the premium received or paid. When an option expires, gains and losses are realized to the extent of premiums received and paid, respectively. The net realized and unrealized gains (losses) on purchased options are included in the Statement of Operations in net realized gain (loss) and change in net unrealized appreciation (depreciation) on investment securities. The net realized gain (loss) and change in net unrealized appreciation (depreciation) on written options are presented in the Statement of Operations.
Any open options at period end are presented in the Schedule of Investments under the captions "Purchased Options," "Purchased Swaptions," "Written Options" and "Written Swaptions," as applicable.
Writing puts and buying calls tend to increase exposure to the underlying instrument while buying puts and writing calls tend to decrease exposure to the underlying instrument. For purchased options, risk of loss is limited to the premium paid, and for written options, risk of loss is the change in value in excess of the premium received.
Swaps. A swap is a contract between two parties to exchange future cash flows at periodic intervals based on a notional principal amount. A bi-lateral OTC swap is a transaction between a fund and a dealer counterparty where cash flows are exchanged between the two parties for the life of the swap. A centrally cleared OTC swap is a transaction executed between a fund and a dealer counterparty, then cleared by a futures commission merchant (FCM) through a clearinghouse. Once cleared, the clearinghouse serves as a central counterparty, with whom a fund exchanges cash flows for the life of the transaction, similar to transactions in futures contracts.
Bi-lateral OTC swaps are marked-to-market daily and changes in value are reflected in the Statement of Assets and Liabilities in the bi-lateral OTC swaps at value line items. Any upfront premiums paid or received upon entering a bi-lateral OTC swap to compensate for differences between stated terms of the swap and prevailing market conditions (e.g. credit spreads, interest rates or other factors) are recorded in net unrealized appreciation (depreciation) in the Statement of Assets and Liabilities and amortized to realized gain or (loss) ratably over the term of the swap. Any unamortized upfront premiums are presented in the Schedule of Investments.
Centrally cleared OTC swaps require a fund to deposit either cash or securities (initial margin) with the FCM, at the instruction of and for the benefit of the clearinghouse. Securities deposited to meet initial margin requirements are identified in the Schedule of Investments. Centrally cleared OTC swaps are marked-to-market daily and subsequent payments (variation margin) are made or received depending on the daily fluctuations in the value of the swaps and are recorded as unrealized appreciation or (depreciation). These daily payments, if any, are included in receivable or payable for daily variation margin on centrally cleared OTC swaps in the Statement of Assets and Liabilities. Any premiums for centrally cleared OTC swaps are recorded periodically throughout the term of the swap to variation margin and included in unrealized appreciation (depreciation) in the Statement of Assets and Liabilities. Any premiums are recognized as realized gain (loss) upon termination or maturity of the swap.
For both bi-lateral and centrally cleared OTC swaps, payments are exchanged at specified intervals, accrued daily commencing with the effective date of the contract and recorded as realized gain or (loss). Some swaps may be terminated prior to the effective date and realize a gain or loss upon termination. The net realized gain (loss) and change in net unrealized appreciation (depreciation) on swaps during the period is presented in the Statement of Operations.
Any open swaps at period end are included in the Schedule of Investments under the caption "Swaps".
Credit Default Swaps. Credit default swaps enable the Fund to buy or sell protection against specified credit events on a single-name issuer or a traded credit index. Under the terms of a credit default swap the buyer of protection (buyer) receives credit protection in exchange for making periodic payments to the seller of protection (seller) based on a fixed percentage applied to a notional principal amount. In return for these payments, the seller will be required to make a payment upon the occurrence of one or more specified credit events. The Fund enters into credit default swaps as a seller to gain credit exposure to an issuer and/or as a buyer to obtain a measure of protection against defaults of an issuer. Periodic payments are made over the life of the contract by the buyer provided that no credit event occurs.
For credit default swaps on most corporate and sovereign issuers, credit events include bankruptcy, failure to pay or repudiation/moratorium. For credit default swaps on corporate or sovereign issuers, the obligation that may be put to the seller is not limited to the specific reference obligation described in the Schedule of Investments. For credit default swaps on asset-backed securities, a credit event may be triggered by events such as failure to pay principal, maturity extension, rating downgrade or write-down. For credit default swaps on asset-backed securities, the reference obligation described represents the security that may be put to the seller. For credit default swaps on a traded credit index, a specified credit event may affect all or individual underlying securities included in the index.
As a seller, if an underlying credit event occurs, the Fund will pay a net settlement amount of cash equal to the notional amount of the swap less the recovery value of the reference obligation or underlying securities comprising an index. Only in the event of the industry's inability to value the underlying asset will the Fund be required to take delivery of the reference obligation or underlying securities comprising an index and pay an amount equal to the notional amount of the swap.
As a buyer, if an underlying credit event occurs, the Fund will receive a net settlement amount of cash equal to the notional amount of the swap less the recovery value of the reference obligation or underlying securities comprising an index. Only in the event of the industry's inability to value the underlying asset will the Fund be required to deliver the reference obligation or underlying securities comprising an index in exchange for payment of an amount equal to the notional amount of the swap.
Typically, the value of each credit default swap and credit rating disclosed for each reference obligation in the Schedule of Investments, where the Fund is the seller, can be used as measures of the current payment/performance risk of the swap. As the value of the swap changes as a positive or negative percentage of the total notional amount, the payment/performance risk may decrease or increase, respectively. In addition to these measures, the investment adviser monitors a variety of factors including cash flow assumptions, market activity and market sentiment as part of its ongoing process of assessing payment/performance risk.
Interest Rate Swaps. Interest rate swaps are agreements between counterparties to exchange cash flows, one based on a fixed rate, and the other on a floating rate. The Fund entered into interest rate swaps to manage its exposure to interest rate changes. Changes in interest rates can have an effect on both the value of bond holdings as well as the amount of interest income earned. In general, the value of bonds can fall when interest rates rise and can rise when interest rates fall.
5. Purchases and Sales of Investments.
Purchases and sales of securities, other than short-term securities and U.S. government securities, aggregated $39,662,360 and $18,183,382, respectively.
6. Fees and Other Transactions with Affiliates.
Management Fee. Fidelity Management & Research Company (the investment adviser) and its affiliates provide the Fund with investment management related services for which the Fund pays a monthly management fee. The management fee is the sum of an individual fund fee rate that is based on an annual rate of .45% of the Fund's average net assets and an annualized group fee rate that averaged .10% during the period. The group fee rate is based upon the average net assets of all the mutual funds advised by the investment adviser, including any mutual funds previously advised by the investment adviser that are currently advised by Fidelity SelectCo, LLC, an affiliate of the investment adviser. The group fee rate decreases as assets under management increase and increases as assets under management decrease. For the reporting period, the total annualized management fee rate was .55% of the Fund's average net assets.
Distribution and Service Plan Fees. In accordance with Rule 12b-1 of the 1940 Act, the Fund has adopted separate Distribution and Service Plans for each class of shares. Certain classes pay Fidelity Distributors Corporation (FDC), an affiliate of the investment adviser, separate Distribution and Service Fees, each of which is based on an annual percentage of each class' average net assets. In addition, FDC may pay financial intermediaries for selling shares of the Fund and providing shareholder support services. For the period, the Distribution and Service Fee rates, total fees and amounts retained by FDC were as follows:
| | Distribution Fee | Service Fee | Total Fees | Retained by FDC |
| Class A | -% | .25% | $4,915 | $918 |
| Class M | -% | .25% | 2,257 | 846 |
| Class C | .75% | .25% | 10,501 | 3,333 |
| | | | $17,673 | $5,097 |
Sales Load. FDC may receive a front-end sales charge of up to 4.00% for selling Class A shares and Class M shares, some of which is paid to financial intermediaries for selling shares of the Fund. Depending on the holding period, FDC may receive contingent deferred sales charges levied on Class A, Class M and Class C redemptions. The deferred sales charges are 1.00% for Class C shares,.75% for certain purchases of Class A shares and .25% for certain purchases of Class M shares.
For the period, sales charge amounts retained by FDC were as follows:
| | Retained by FDC |
| Class A | $1,102 |
| Class M | 50 |
| Class C(a) | 23 |
| | $1,175 |
(a) When Class C shares are initially sold, FDC pays commissions from its own resources to financial intermediaries through which the sales are made.
Transfer Agent Fees. Fidelity Investments Institutional Operations Company, Inc., (FIIOC), an affiliate of the investment adviser, is the transfer, dividend disbursing and shareholder servicing agent for each class of the Fund. FIIOC receives account fees and asset-based fees that vary according to the account size and type of account of the shareholders of the respective classes of the Fund, except for Class Z. FIIOC receives an asset-based fee of Class Z's average net assets. FIIOC pays for typesetting, printing and mailing of shareholder reports, except proxy statements.
For the period, transfer agent fees for each class were as follows:
| | Amount | % of Class-Level Average Net Assets(a) |
| Class A | $3,743 | .19 |
| Class M | 2,406 | .27 |
| Class C | 2,660 | .25 |
| Global Credit | 20,002 | .12 |
| Class I | 534 | .07 |
| Class Z | 657 | .05 |
| | $30,002 | |
(a) Annualized
Accounting Fees. Fidelity Service Company, Inc. (FSC), an affiliate of the investment adviser, maintains the Fund's accounting records. The fee is based on the level of average net assets for each month. For the period, the fees were equivalent to an annualized rate of .05%.
Interfund Trades. The Fund may purchase from or sell securities to other Fidelity Funds under procedures adopted by the Board. The procedures have been designed to ensure these interfund trades are executed in accordance with Rule 17a-7 of the 1940 Act. Interfund trades are included within the respective purchases and sales amounts shown in the Purchases and Sales of Investments note.
7. Committed Line of Credit.
The Fund participates with other funds managed by the investment adviser or an affiliate in a $4.25 billion credit facility (the "line of credit") to be utilized for temporary or emergency purposes to fund shareholder redemptions or for other short-term liquidity purposes. The Fund has agreed to pay commitment fees on its pro-rata portion of the line of credit, which amounted to $59 and is reflected in Miscellaneous expenses on the Statement of Operations. During the period, the Fund did not borrow on this line of credit.
8. Expense Reductions.
The investment adviser contractually agreed to reimburse each class to the extent annual operating expenses exceeded certain levels of class-level average net assets as noted in the table below. This reimbursement will remain in place through April 30, 2020. Some expenses, for example the compensation of the independent Trustees, and certain miscellaneous expenses such as proxy and shareholder meeting expenses, are excluded from this reimbursement.
The following classes were in reimbursement during the period:
| | Expense Limitations | Reimbursement |
| Class A | 1.00% | $13,666 |
| Class M | 1.00% | 6,945 |
| Class C | 1.75% | 8,011 |
| Global Credit | .75% | 103,899 |
| Class I | .75% | 3,512 |
| Class Z | .66% | 8,461 |
| | | $144,494 |
In addition, during the period the investment adviser reimbursed and/or waived a portion of fund-level operating expenses in the amount of $99 and a portion of class-level operating expenses as follows:
| | Amount |
| Class A | $1,432 |
| Class M | 679 |
| Class C | 886 |
| Global Credit | 11,746 |
| Class I | 441 |
| Class Z | 853 |
| | $16,037 |
9. Distributions to Shareholders.
Distributions to shareholders of each class were as follows:
| | Six months ended
June 30, 2019 | Year ended
December 31, 2018(a) |
| Distributions to shareholders | | |
| Class A | $19,573 | $80,759 |
| Class M | 8,976 | 37,547 |
| Class C | 4,649 | 28,370 |
| Global Credit | 187,978 | 705,880 |
| Class I | 6,882 | 28,343 |
| Class Z | 20,257 | 1,152 |
| Total | $248,315 | $882,051 |
| Tax return of capital | | |
| Class A | $– | $15,068 |
| Class M | – | 7,006 |
| Class C | – | 5,293 |
| Global Credit | – | 131,706 |
| Class I | – | 5,288 |
| Class Z | – | 215 |
| Total | $– | $164,576 |
(a) Distributions for Class Z are for the period October 2, 2018 (commencement of sale of shares) to December 31, 2018.
10. Share Transactions.
Share transactions for each class were as follows and may contain automatic conversions between classes or exchanges between affiliated funds:
| | Shares | Shares | Dollars | Dollars |
| | Six months ended June 30, 2019 | Year ended December 31, 2018(a) | Six months ended June 30, 2019 | Year ended December 31, 2018(a) |
| Class A | | | | |
| Shares sold | 37,710 | 40,118 | $345,576 | $360,692 |
| Reinvestment of distributions | 2,139 | 10,803 | 19,509 | 95,375 |
| Shares redeemed | (44,919) | (80,872) | (405,555) | (722,084) |
| Net increase (decrease) | (5,070) | (29,951) | $(40,470) | $(266,017) |
| Class M | | | | |
| Shares sold | 3,667 | 15,128 | $33,008 | $135,904 |
| Reinvestment of distributions | 978 | 5,039 | 8,923 | 44,483 |
| Shares redeemed | (10,374) | (52,325) | (93,762) | (467,585) |
| Net increase (decrease) | (5,729) | (32,158) | $(51,831) | $(287,198) |
| Class C | | | | |
| Shares sold | 6,251 | 39,154 | $55,938 | $347,788 |
| Reinvestment of distributions | 509 | 3,812 | 4,649 | 33,647 |
| Shares redeemed | (66,813) | (58,062) | (610,093) | (518,694) |
| Net increase (decrease) | (60,053) | (15,096) | $(549,506) | $(137,259) |
| Global Credit | | | | |
| Shares sold | 2,417,882 | 1,077,080 | $22,400,799 | $9,666,484 |
| Reinvestment of distributions | 20,038 | 92,424 | 182,750 | 815,929 |
| Shares redeemed | (443,077) | (1,228,512) | (3,991,632) | (10,947,198) |
| Net increase (decrease) | 1,994,843 | (59,008) | $18,591,917 | $(464,785) |
| Class I | | | | |
| Shares sold | 99,802 | 18,185 | $922,950 | $163,537 |
| Reinvestment of distributions | 708 | 3,471 | 6,457 | 30,633 |
| Shares redeemed | (15,105) | (21,415) | (134,076) | (191,675) |
| Net increase (decrease) | 85,405 | 241 | $795,331 | $2,495 |
| Class Z | | | | |
| Shares sold | 395,158 | 11,302 | $3,548,290 | $100,801 |
| Reinvestment of distributions | 1,148 | 157 | 10,467 | 1,367 |
| Shares redeemed | (18,222) | – | (169,071) | – |
| Net increase (decrease) | 378,084 | 11,459 | $3,389,686 | $102,168 |
(a) Share transactions for Class Z are for the period October 2, 2018 (commencement of sale of shares) to December 31, 2018
11. Other.
The Fund's organizational documents provide former and current trustees and officers with a limited indemnification against liabilities arising in connection with the performance of their duties to the Fund. In the normal course of business, the Fund may also enter into contracts that provide general indemnifications. The Fund's maximum exposure under these arrangements is unknown as this would be dependent on future claims that may be made against the Fund. The risk of material loss from such claims is considered remote.
At the end of the period, the investment adviser or its affiliates were the owners of record of 17% of the total outstanding shares of the Fund. Mutual funds managed by the investment adviser or its affiliates were the owners of record, in the aggregate, of approximately 23% of the total outstanding shares of the Fund.
12. Risks of Investing in European Countries.
The recent global financial crisis has created uncertainty surrounding the sovereign debt of many European countries. If there is a default or debt restructuring by any European country, or if one or more countries leave the European Monetary Union or the European Monetary Union dissolves, there may be wide-ranging effects on global markets. Such events could significantly affect the value or liquidity of the Fund's investments in the region or with exposure to the region.
Shareholder Expense Example
As a shareholder of the Fund, you incur two types of costs: (1) transaction costs, including sales charges (loads) on purchase payments or redemption proceeds, and (2) ongoing costs, including management fees, distribution and/or service (12b-1) fees and other Fund expenses. This Example is intended to help you understand your ongoing costs (in dollars) of investing in the Fund and to compare these costs with the ongoing costs of investing in other mutual funds.
The Example is based on an investment of $1,000 invested at the beginning of the period and held for the entire period (January 1, 2019 to June 30, 2019).
Actual Expenses
The first line of the accompanying table for each class of the Fund provides information about actual account values and actual expenses. You may use the information in this line, together with the amount you invested, to estimate the expenses that you paid over the period. Simply divide your account value by $1,000.00 (for example, an $8,600 account value divided by $1,000.00 = 8.6), then multiply the result by the number in the first line for a class of the Fund under the heading entitled "Expenses Paid During Period" to estimate the expenses you paid on your account during this period. In addition, the Fund, as a shareholder in the underlying Fidelity Central Funds, will indirectly bear its pro-rata share of the fees and expenses incurred by the underlying Fidelity Central Funds. These fees and expenses are not included in the Fund's annualized expense ratio used to calculate the expense estimate in the table below.
Hypothetical Example for Comparison Purposes
The second line of the accompanying table for each class of the Fund provides information about hypothetical account values and hypothetical expenses based on a Class' actual expense ratio and an assumed rate of return of 5% per year before expenses, which is not the Class' actual return. The hypothetical account values and expenses may not be used to estimate the actual ending account balance or expenses you paid for the period. You may use this information to compare the ongoing costs of investing in the Fund and other funds. To do so, compare this 5% hypothetical example with the 5% hypothetical examples that appear in the shareholder reports of the other funds. In addition, the Fund, as a shareholder in the underlying Fidelity Central Funds, will indirectly bear its pro-rata share of the fees and expenses incurred by the underlying Fidelity Central Funds. These fees and expenses are not included in the Fund's annualized expense ratio used to calculate the expense estimate in the table below.
Please note that the expenses shown in the table are meant to highlight your ongoing costs only and do not reflect any transaction costs. Therefore, the second line of the table is useful in comparing ongoing costs only, and will not help you determine the relative total costs of owning different funds. In addition, if these transactional costs were included, your costs would have been higher.
| | Annualized Expense Ratio-A | Beginning
Account Value
January 1, 2019 | Ending
Account Value
June 30, 2019 | Expenses Paid
During Period-B
January 1, 2019
to June 30, 2019 |
| Class A | 1.00% | | | |
| Actual | | $1,000.00 | $1,095.00 | $5.19 |
| Hypothetical-C | | $1,000.00 | $1,019.84 | $5.01 |
| Class M | 1.00% | | | |
| Actual | | $1,000.00 | $1,093.90 | $5.19 |
| Hypothetical-C | | $1,000.00 | $1,019.84 | $5.01 |
| Class C | 1.75% | | | |
| Actual | | $1,000.00 | $1,091.20 | $9.07 |
| Hypothetical-C | | $1,000.00 | $1,016.12 | $8.75 |
| Global Credit | .75% | | | |
| Actual | | $1,000.00 | $1,095.70 | $3.90 |
| Hypothetical-C | | $1,000.00 | $1,021.08 | $3.76 |
| Class I | .75% | | | |
| Actual | | $1,000.00 | $1,095.70 | $3.90 |
| Hypothetical-C | | $1,000.00 | $1,021.08 | $3.76 |
| Class Z | .66% | | | |
| Actual | | $1,000.00 | $1,095.70 | $3.43 |
| Hypothetical-C | | $1,000.00 | $1,021.52 | $3.31 |
A Annualized expense ratio reflects expenses net of applicable fee waivers.
B Expenses are equal to each Class' annualized expense ratio, multiplied by the average account value over the period, multiplied by 181/365 (to reflect the one-half year period).
C 5% return per year before expenses
GLB-SANN-0819
1.939064.107
Fidelity® Intermediate Municipal Income Fund
Semi-Annual Report June 30, 2019 Includes Fidelity and Fidelity Advisor share classes |
|
Beginning on January 1, 2021, as permitted by regulations adopted by the Securities and Exchange Commission, paper copies of a fund’s shareholder reports will no longer be sent by mail, unless you specifically request paper copies of the reports from the fund or from your financial intermediary, such as a financial advisor, broker-dealer or bank. Instead, the reports will be made available on a website, and you will be notified by mail each time a report is posted and provided with a website link to access the report.
If you already elected to receive shareholder reports electronically, you will not be affected by this change and you need not take any action. You may elect to receive shareholder reports and other communications from a fund electronically, by contacting your financial intermediary. For Fidelity customers, visit Fidelity's web site or call Fidelity using the contact information listed below.
You may elect to receive all future reports in paper free of charge. If you wish to continue receiving paper copies of your shareholder reports, you may contact your financial intermediary or, if you are a Fidelity customer, visit Fidelity’s website, or call Fidelity at the applicable toll-free number listed below. Your election to receive reports in paper will apply to all funds held with the fund complex/your financial intermediary.
| Account Type | Website | Phone Number |
| Brokerage, Mutual Fund, or Annuity Contracts: | fidelity.com/mailpreferences | 1-800-343-3548 |
| Employer Provided Retirement Accounts: | netbenefits.fidelity.com/preferences (choose 'no' under Required Disclosures to continue to print) | 1-800-343-0860 |
| Advisor Sold Accounts Serviced Through Your Financial Intermediary: | Contact Your Financial Intermediary | Your Financial Intermediary's phone number |
| Advisor Sold Accounts Serviced by Fidelity: | institutional.fidelity.com | 1-877-208-0098 |
Contents
To view a fund's proxy voting guidelines and proxy voting record for the 12-month period ended June 30, visit http://www.fidelity.com/proxyvotingresults or visit the Securities and Exchange Commission's (SEC) web site at http://www.sec.gov.
You may also call 1-800-544-8544 if you’re an individual investing directly with Fidelity, call 1-800-835-5092 if you’re a plan sponsor or participant with Fidelity as your recordkeeper or call 1-877-208-0098 on institutional accounts or if you’re an advisor or invest through one to request a free copy of the proxy voting guidelines.
Standard & Poor's, S&P and S&P 500 are registered service marks of The McGraw-Hill Companies, Inc. and have been licensed for use by Fidelity Distributors Corporation.
Other third-party marks appearing herein are the property of their respective owners.
All other marks appearing herein are registered or unregistered trademarks or service marks of FMR LLC or an affiliated company. © 2019 FMR LLC. All rights reserved.
This report and the financial statements contained herein are submitted for the general information of the shareholders of the Fund. This report is not authorized for distribution to prospective investors in the Fund unless preceded or accompanied by an effective prospectus.
A fund files its complete schedule of portfolio holdings with the SEC for the first and third quarters of each fiscal year on Form N-PORT. Forms N-PORT are available on the SEC’s web site at http://www.sec.gov. A fund's Forms N-PORT may be reviewed and copied at the SEC’s Public Reference Room in Washington, DC. Information regarding the operation of the SEC's Public Reference Room may be obtained by calling 1-800-SEC-0330.
For a complete list of a fund's portfolio holdings, view the most recent holdings listing, semiannual report, or annual report on Fidelity's web site at http://www.fidelity.com, http://www.institutional.fidelity.com, or http://www.401k.com, as applicable.
NOT FDIC INSURED •MAY LOSE VALUE •NO BANK GUARANTEE
Neither the Fund nor Fidelity Distributors Corporation is a bank.
Investment Summary (Unaudited)
Top Five States as of June 30, 2019
| | % of fund's net assets |
| Texas | 16.1 |
| Illinois | 15.3 |
| Florida | 11.5 |
| New York | 4.7 |
| Pennsylvania | 3.9 |
Top Five Sectors as of June 30, 2019
| | % of fund's net assets |
| General Obligations | 36.4 |
| Health Care | 17.5 |
| Transportation | 15.4 |
| Electric Utilities | 7.2 |
| Escrowed/Pre-Refunded | 4.9 |
Quality Diversification (% of fund's net assets)
| As of June 30, 2019 |
| | AAA | 6.9% |
| | AA,A | 70.9% |
| | BBB | 12.8% |
| | BB and Below | 1.4% |
| | Not Rated | 4.0% |
| | Short-Term Investments and Net Other Assets | 4.0% |

We have used ratings from Moody's Investors Service, Inc. Where Moody's® ratings are not available, we have used S&P® ratings. All ratings are as of the date indicated and do not reflect subsequent changes.
Schedule of Investments June 30, 2019 (Unaudited)
Showing Percentage of Net Assets
| Municipal Bonds - 95.8% | | | |
| | | Principal Amount (000s) | Value (000s) |
| Alabama - 0.9% | | | |
| Jefferson County Gen. Oblig. Series 2018 B, 5% 4/1/21 | | 5,630 | 5,974 |
| Mobile County Board of School Commissioners Series 2016 B: | | | |
| 5% 3/1/29 | | $5,875 | $6,855 |
| 5% 3/1/30 | | 6,125 | 7,111 |
| 5% 3/1/31 | | 6,135 | 7,088 |
| 5% 3/1/32 | | 4,930 | 5,663 |
| 5% 3/1/33 | | 7,165 | 8,210 |
| Mobile Indl. Dev. Board Poll. Cont. Rev. Bonds Series 2009 E, 1.85%, tender 3/24/20 (a) | | 7,355 | 7,365 |
| Montgomery Med. Clinic Facilities: | | | |
| 5% 3/1/26 | | 1,940 | 2,257 |
| 5% 3/1/27 | | 3,915 | 4,527 |
| 5% 3/1/28 | | 4,225 | 4,865 |
| 5% 3/1/29 | | 3,465 | 3,971 |
| 5% 3/1/30 | | 4,180 | 4,762 |
|
| TOTAL ALABAMA | | | 68,648 |
|
| Alaska - 0.3% | | | |
| Alaska Gen. Oblig. Series 2016 A, 5% 8/1/33 | | 7,235 | 8,454 |
| Alaska Int'l. Arpts. Revs. Series 2016 B, 5% 10/1/33 | | 7,575 | 8,759 |
| North Slope Borough Gen. Oblig. Series 2017 A, 5% 6/30/21 (Pre-Refunded to 6/30/20 @ 100) | | 1,695 | 1,758 |
|
| TOTAL ALASKA | | | 18,971 |
|
| Arizona - 3.9% | | | |
| Arizona Ctfs. of Prtn.: | | | |
| Series 2010 A, 5.25% 10/1/20 (FSA Insured) | | 6,500 | 6,563 |
| Series 2019 A: | | | |
| 5% 10/1/20 (b) | | 3,515 | 3,672 |
| 5% 10/1/21 (b) | | 3,090 | 3,338 |
| 5% 10/1/22 (b) | | 3,290 | 3,663 |
| 5% 10/1/23 (b) | | 4,320 | 4,955 |
| Arizona State Lottery Rev. Series 2019, 5% 7/1/24 (b) | | 4,000 | 4,640 |
| Chandler Indl. Dev. Auth. Indl. Dev. Rev. Bonds (Intel Corp. Proj.) Series 2019, 5%, tender 6/3/24 (a)(c) | | 36,345 | 41,700 |
| Glendale Gen. Oblig.: | | | |
| Series 2015, 4% 7/1/21 (FSA Insured) | | 2,145 | 2,258 |
| Series 2017: | | | |
| 5% 7/1/23 | | 3,570 | 4,061 |
| 5% 7/1/25 | | 3,250 | 3,891 |
| 5% 7/1/28 | | 1,465 | 1,814 |
| 5% 7/1/32 | | 2,915 | 3,524 |
| Glendale Sr. Excise Tax Rev. Series 2015 A: | | | |
| 5% 7/1/27 | | 7,770 | 9,249 |
| 5% 7/1/28 | | 7,255 | 8,618 |
| 5% 7/1/29 | | 7,905 | 9,350 |
| Glendale Trans. Excise Tax Rev.: | | | |
| 5% 7/1/24 (FSA Insured) | | 1,765 | 2,067 |
| 5% 7/1/25 (FSA Insured) | | 2,065 | 2,475 |
| 5% 7/1/26 (FSA Insured) | | 3,565 | 4,241 |
| Maricopa County Indl. Dev. Auth. Bonds Series 2019 B, 5%, tender 9/1/24 (a) | | 10,690 | 12,350 |
| Maricopa County Indl. Dev. Auth. Sr. Living Facilities Series 2016: | | | |
| 5.75% 1/1/36 (d) | | 800 | 839 |
| 6% 1/1/48 (d) | | 4,910 | 5,130 |
| Maricopa County Rev.: | | | |
| Bonds: | | | |
| Series 2019 D, 5%, tender 5/15/26 (a) | | 12,495 | 15,122 |
| Series B, 5%, tender 10/18/22 (a) | | 14,370 | 15,968 |
| Series C, 5%, tender 10/18/24 (a) | | 9,710 | 11,342 |
| Series 2016 A: | | | |
| 4% 1/1/24 | | 6,310 | 6,993 |
| 5% 1/1/22 | | 2,430 | 2,643 |
| 5% 1/1/23 | | 4,855 | 5,440 |
| 5% 1/1/24 | | 1,990 | 2,292 |
| 5% 1/1/25 | | 7,560 | 8,925 |
| McAllister Academic Village LLC Rev. (Arizona State Univ. Hassayampa Academic Village Proj.) Series 2016, 5% 7/1/21 | | 1,735 | 1,862 |
| Phoenix Civic Impt. Board Arpt. Rev. Series 2017 A: | | | |
| 5% 7/1/27 (c) | | 2,185 | 2,692 |
| 5% 7/1/28 (c) | | 3,085 | 3,778 |
| 5% 7/1/42 (c) | | 2,210 | 2,575 |
| Phoenix Civic Impt. Corp. Excise Tax Rev.: | | | |
| Series 2011 A, 5% 7/1/20 | | 1,020 | 1,058 |
| Series 2011 C, 5% 7/1/21 | | 970 | 1,041 |
| Phoenix Indl. Solid Waste Disp. Rev. Bonds (Republic Svc., Inc. Proj.) Series 2013, 1.9%, tender 8/1/19 (a)(c) | | 39,500 | 39,511 |
| Pima County Swr. Sys. Rev.: | | | |
| Series 2011 B: | | | |
| 5% 7/1/20 | | 2,090 | 2,167 |
| 5% 7/1/25 (Pre-Refunded to 7/1/21 @ 100) | | 1,940 | 2,081 |
| Series 2012 A: | | | |
| 5% 7/1/22 | | 485 | 537 |
| 5% 7/1/23 | | 1,070 | 1,185 |
| Salt River Proj. Agricultural Impt. & Pwr. District Elec. Sys. Rev. Series 2017 A, 5% 1/1/33 | | 4,955 | 6,144 |
| Tempe Indl. Dev. Auth. Rev.: | | | |
| (Mirabella At ASU, Inc. Proj.) Series 2017 A: | | | |
| 6.125% 10/1/47 (d) | | 490 | 554 |
| 6.125% 10/1/52 (d) | | 490 | 552 |
| (Mirabella At Asu, Inc. Proj.) Series 2017 B, 4% 10/1/23 (d) | | 7,475 | 7,556 |
| (Mirabella At ASU, Inc. Proj.) Series 2017 B, 6% 10/1/37 (d) | | 250 | 285 |
|
| TOTAL ARIZONA | | | 280,701 |
|
| Arkansas - 0.0% | | | |
| Little Rock School District Series 2017, 3% 2/1/22 | | 3,070 | 3,178 |
| California - 3.1% | | | |
| ABAG Fin. Auth. for Nonprofit Corps. Rev. (Sharp HealthCare Proj.) Series 2009 B, 6.25% 8/1/39 (Pre-Refunded to 8/1/19 @ 100) | | 1,650 | 1,657 |
| Alameda Corridor Trans. Auth. Rev. Series 2013 A, 5% 10/1/23 | | 2,100 | 2,424 |
| Bay Area Toll Auth. San Francisco Bay Toll Bridge Rev. Bonds: | | | |
| Series A, 2.95%, tender 4/1/26 (a) | | 8,590 | 9,237 |
| Series B, 2.85%, tender 4/1/25 (a) | | 7,020 | 7,461 |
| Series C, 2.1%, tender 4/1/22 (a) | | 6,555 | 6,642 |
| California Dept. of Wtr. Resources Series AI: | | | |
| 5% 12/1/25 | | 2,130 | 2,326 |
| 5% 12/1/29 (Pre-Refunded to 12/1/21 @ 100) | | 4,725 | 5,169 |
| California Gen. Oblig.: | | | |
| Series 2004, 5.25% 12/1/33 | | 110 | 110 |
| Series 2007, 5.625% 5/1/20 | | 50 | 50 |
| Series 2016, 5% 9/1/29 | | 2,755 | 3,389 |
| 5% 8/1/26 | | 14,565 | 18,077 |
| 5% 8/1/29 | | 6,970 | 8,560 |
| 5.25% 4/1/34 | | 30 | 30 |
| 5.5% 4/1/30 | | 5 | 5 |
| California Health Facilities Fing. Auth. Rev.: | | | |
| (St. Joseph Health Sys. Proj.) Series 2013 A, 5% 7/1/25 | | 3,885 | 4,465 |
| Series 2011 D, 5% 8/15/35 | | 2,915 | 3,116 |
| California Muni. Fin. Auth. Rev. (LINXS APM Proj.) Series 2018 A: | | | |
| 5% 6/30/28 (c) | | 1,925 | 2,380 |
| 5% 12/31/28 (c) | | 1,555 | 1,915 |
| 5% 6/30/29 (c) | | 1,940 | 2,380 |
| 5% 12/31/29 (c) | | 970 | 1,184 |
| 5% 6/30/31 (c) | | 3,010 | 3,635 |
| 5% 12/31/31 (c) | | 2,915 | 3,514 |
| California Poll. Cont. Fing. Auth. Solid Waste Disp. Rev. Bonds (Republic Svcs., Inc. Proj.) Series 2010 A, 1.9%, tender 8/1/19 (a)(c)(d) | | 18,600 | 18,605 |
| California Pub. Works Board Lease Rev.: | | | |
| (Various Cap. Projs.): | | | |
| Series 2011 A: | | | |
| 5.25% 10/1/24 | | 3,885 | 4,226 |
| 5.25% 10/1/25 | | 3,885 | 4,225 |
| Series 2012 A: | | | |
| 5% 4/1/22 | | 2,040 | 2,247 |
| 5% 4/1/23 | | 4,855 | 5,344 |
| Series 2012 G: | | | |
| 5% 11/1/23 | | 970 | 1,087 |
| 5% 11/1/24 | | 970 | 1,087 |
| (Various Judicial Council Projs.) Series 2011 D, 5% 12/1/21 | | 2,430 | 2,648 |
| Golden State Tobacco Securitization Corp. Tobacco Settlement Rev.: | | | |
| Series 2013 A, 5% 6/1/29 | | 4,855 | 5,565 |
| Series 2017 A1: | | | |
| 5% 6/1/25 | | 3,885 | 4,491 |
| 5% 6/1/26 | | 970 | 1,141 |
| Series A, 0% 6/1/24 (AMBAC Insured) | | 5,840 | 5,384 |
| Los Angeles Cmnty. College District Series 2008 A, 6% 8/1/33 (Pre-Refunded to 8/1/19 @ 100) | | 3,885 | 3,900 |
| Los Angeles Dept. of Wtr. & Pwr. Rev. Series 2015 A, 5% 7/1/29 | | 9,710 | 11,593 |
| Modesto Irrigation District Elec. Rev. Series 2011 A: | | | |
| 5% 7/1/22 | | 970 | 1,044 |
| 5% 7/1/23 | | 3,690 | 3,964 |
| Northern California Pwr. Agcy. Rev. (Hydroelectric #1 Proj.) Series 2010 A: | | | |
| 5% 7/1/19 (Escrowed to Maturity) | | 1,150 | 1,150 |
| 5% 7/1/22 | | 2,185 | 2,185 |
| Oakland Unified School District Alameda County Series 2015 A: | | | |
| 5% 8/1/26 (FSA Insured) | | 3,400 | 4,074 |
| 5% 8/1/28 | | 970 | 1,149 |
| Oakland-Alameda County Coliseum Auth. (Oakland Coliseum Proj.) Series 2012 A, 5% 2/1/23 | | 5,695 | 6,235 |
| Port of Oakland Rev. Series 2012 P, 5% 5/1/22 (c) | | 4,855 | 5,328 |
| Poway Unified School District Pub. Fing.: | | | |
| 5% 9/1/25 | | 1,115 | 1,298 |
| 5% 9/1/28 | | 1,550 | 1,787 |
| 5% 9/1/32 | | 1,630 | 1,851 |
| Sacramento City Fing. Auth. Rev. Series A, 0% 12/1/26 (Nat'l. Pub. Fin. Guarantee Corp. Insured) | | 3,025 | 2,561 |
| San Bernardino County Ctfs. of Prtn. (Arrowhead Proj.) Series 2009 A, 5.25% 8/1/26 | | 2,135 | 2,142 |
| San Diego Convention Ctr. Expansion Series 2012 A, 5% 4/15/23 | | 8,645 | 9,541 |
| San Diego Unified School District Series 2008 C, 0% 7/1/34 | | 2,525 | 1,694 |
| San Marcos Unified School District Series 2010 B: | | | |
| 0% 8/1/35 | | 3,570 | 2,301 |
| 0% 8/1/37 | | 1,940 | 1,167 |
| Santa Monica-Malibu Unified School District Series 1999, 0% 8/1/20 (Nat'l. Pub. Fin. Guarantee Corp. Insured) | | 1,845 | 1,819 |
| Union Elementary School District Series A, 0% 9/1/20 (Nat'l. Pub. Fin. Guarantee Corp. Insured) | | 1,270 | 1,251 |
| Washington Township Health Care District Gen. Oblig. Series 2013 A, 5.5% 8/1/40 | | 3,400 | 3,981 |
| West Contra Costa Unified School District Series 2012, 5% 8/1/26 | | 7,665 | 8,516 |
|
| TOTAL CALIFORNIA | | | 224,307 |
|
| Colorado - 1.3% | | | |
| Colorado Health Facilities Auth. (Parkview Med. Ctr., Inc. Proj.) Series 2016, 5% 9/1/46 | | 6,310 | 7,153 |
| Colorado Health Facilities Auth. Retirement Hsg. Rev. (Liberty Heights Proj.) 0% 7/15/22 (Escrowed to Maturity) | | 12,460 | 11,911 |
| Colorado Health Facilities Auth. Rev. Bonds Series 2008 D3, 5%, tender 11/12/21 (a) | | 7,365 | 7,916 |
| Colorado Hsg. & Fin. Auth. Series 2019 H, 4.25% 11/1/49 (b) | | 2,295 | 2,525 |
| Colorado Univ. Co. Hosp. Auth. Rev. Bonds Series 2017C-2, 5%, tender 3/1/22 (a) | | 7,085 | 7,611 |
| Denver City & County Arpt. Rev.: | | | |
| Series 2017 A: | | | |
| 5% 11/15/24 (c) | | 2,230 | 2,616 |
| 5% 11/15/27 (c) | | 1,025 | 1,270 |
| 5% 11/15/28 (c) | | 4,855 | 5,975 |
| 5% 11/15/29 (c) | | 4,855 | 5,936 |
| 5% 11/15/30 (c) | | 3,885 | 4,711 |
| Series 2018 A: | | | |
| 5% 12/1/30 (c) | | 7,415 | 9,365 |
| 5% 12/1/31 (c) | | 15,915 | 19,479 |
| E-470 Pub. Hwy. Auth. Rev.: | | | |
| Series 2000 B, 0% 9/1/20 (Nat'l. Pub. Fin. Guarantee Corp. Insured) | | 4,765 | 4,678 |
| Series 2010 A: | | | |
| 0% 9/1/35 | | 1,940 | 1,154 |
| 0% 9/1/37 | | 2,915 | 1,591 |
| 0% 9/1/38 | | 3,650 | 1,914 |
|
| TOTAL COLORADO | | | 95,805 |
|
| Connecticut - 1.9% | | | |
| Connecticut Gen. Oblig.: | | | |
| Series 2012 E, 5% 9/15/23 | | 2,915 | 3,214 |
| Series 2016 A, 5% 3/15/26 | | 2,940 | 3,525 |
| Series 2016 E: | | | |
| 5% 10/15/26 | | 3,445 | 4,178 |
| 5% 10/15/29 | | 4,975 | 5,938 |
| Series 2018 E: | | | |
| 5% 9/15/27 | | 4,050 | 4,981 |
| 5% 9/15/28 | | 4,000 | 4,989 |
| 5% 9/15/29 | | 4,000 | 4,954 |
| 5% 9/15/30 | | 4,000 | 4,913 |
| Series 2018 F, 5% 9/15/27 | | 1,000 | 1,230 |
| Series 2019 A: | | | |
| 5% 4/15/30 | | 2,320 | 2,886 |
| 5% 4/15/34 | | 2,635 | 3,212 |
| 5% 4/15/35 | | 915 | 1,110 |
| Connecticut Health & Edl. Facilities Auth. Rev.: | | | |
| Bonds: | | | |
| Series 2010 A4, 2%, tender 2/8/22 (a) | | 11,195 | 11,372 |
| Series 2014 B, 1.8%, tender 7/1/24 (a)(b) | | 7,890 | 7,944 |
| Series 2015 A, 2.05%, tender 7/21/21 (a) | | 34,610 | 35,117 |
| Series U2, 2%, tender 2/8/22 (a) | | 9,650 | 9,804 |
| Series 2018 S: | | | |
| 5% 7/1/26 | | 2,200 | 2,652 |
| 5% 7/1/29 | | 970 | 1,202 |
| Series 2019 A, 5% 7/1/34 (d) | | 6,000 | 6,559 |
| Series 2019 Q-1: | | | |
| 5% 11/1/22 | | 1,630 | 1,811 |
| 5% 11/1/24 | | 1,760 | 2,051 |
| 5% 11/1/25 | | 1,205 | 1,436 |
| 5% 11/1/27 | | 3,115 | 3,861 |
| 5% 11/1/28 | | 1,780 | 2,239 |
| Stratford Gen. Oblig. Series 2019, 5% 1/1/29 | | 2,490 | 3,005 |
| Univ. of Connecticut Gen. Oblig. Series 2019 A: | | | |
| 5% 11/1/27 | | 1,720 | 2,126 |
| 5% 11/1/27 | | 2,050 | 2,534 |
| 5% 11/1/28 | | 1,260 | 1,580 |
|
| TOTAL CONNECTICUT | | | 140,423 |
|
| Delaware, New Jersey - 0.1% | | | |
| Delaware River & Bay Auth. Rev. Series 2014 C: | | | |
| 5% 1/1/22 | | 2,915 | 3,176 |
| 5% 1/1/24 | | 1,235 | 1,424 |
| 5% 1/1/25 | | 2,670 | 3,070 |
|
| TOTAL DELAWARE, NEW JERSEY | | | 7,670 |
|
| District Of Columbia - 1.1% | | | |
| District of Columbia Income Tax Rev. Series 2011 A, 5% 12/1/36 | | 4,080 | 4,404 |
| District of Columbia Rev. Series A, 5% 6/1/40 | | 6,505 | 6,686 |
| Metropolitan Washington DC Arpts. Auth. Sys. Rev.: | | | |
| Series 2011 C: | | | |
| 5% 10/1/22 (c) | | 3,075 | 3,314 |
| 5% 10/1/23 (c) | | 3,270 | 3,524 |
| 5% 10/1/24 (c) | | 2,955 | 3,185 |
| 5% 10/1/25 (c) | | 3,985 | 4,295 |
| Series 2017 A: | | | |
| 5% 10/1/29 (c) | | 5,445 | 6,669 |
| 5% 10/1/31 (c) | | 2,335 | 2,826 |
| 5% 10/1/34 (c) | | 1,940 | 2,322 |
| 5% 10/1/36 (c) | | 1,820 | 2,166 |
| Series 2018 A: | | | |
| 5% 10/1/28 (c) | | 3,885 | 4,889 |
| 5% 10/1/29 (c) | | 4,030 | 5,032 |
| 5% 10/1/30 (c) | | 3,165 | 3,922 |
| 5% 10/1/31 (c) | | 4,540 | 5,590 |
| Series 2019 A: | | | |
| 5% 10/1/21 (b)(c) | | 1,390 | 1,497 |
| 5% 10/1/22 (b)(c) | | 795 | 882 |
| 5% 10/1/23 (b)(c) | | 1,160 | 1,323 |
| 5% 10/1/24 (b)(c) | | 2,000 | 2,338 |
| 5% 10/1/25 (b)(c) | | 1,530 | 1,828 |
| Washington D.C. Metropolitan Transit Auth. Rev. Series 2017 B, 5% 7/1/34 | | 7,990 | 9,682 |
|
| TOTAL DISTRICT OF COLUMBIA | | | 76,374 |
|
| Florida - 11.5% | | | |
| Brevard County School Board Ctfs. of Prtn.: | | | |
| Series 2014: | | | |
| 5% 7/1/27 | | 3,205 | 3,719 |
| 5% 7/1/30 | | 7,240 | 8,315 |
| Series 2015 C, 5% 7/1/24 | | 2,915 | 3,401 |
| Broward County Arpt. Sys. Rev.: | | | |
| Series 2012 Q1, 5% 10/1/23 | | 3,010 | 3,369 |
| Series 2017: | | | |
| 5% 10/1/30 (c) | | 2,050 | 2,482 |
| 5% 10/1/31 (c) | | 3,100 | 3,734 |
| Series A: | | | |
| 5% 10/1/29 (c) | | 4,090 | 4,795 |
| 5% 10/1/31 (c) | | 2,915 | 3,389 |
| 5% 10/1/32 (c) | | 3,885 | 4,498 |
| Broward County School Board Ctfs. of Prtn.: | | | |
| (Broward County School District) Series 2012 A: | | | |
| 5% 7/1/25 | | 1,450 | 1,596 |
| 5% 7/1/26 | | 4,320 | 4,738 |
| Series 2012 A: | | | |
| 5% 7/1/21 | | 5,225 | 5,600 |
| 5% 7/1/22 | | 4,855 | 5,368 |
| 5% 7/1/25 (Pre-Refunded to 7/1/22 @ 100) | | 4,020 | 4,447 |
| 5% 7/1/26 (Pre-Refunded to 7/1/22 @ 100) | | 19,555 | 21,633 |
| Series 2015 A: | | | |
| 5% 7/1/26 | | 11,170 | 13,274 |
| 5% 7/1/27 | | 8,900 | 10,565 |
| 5% 7/1/28 | | 3,885 | 4,569 |
| Series 2015 B: | | | |
| 5% 7/1/25 | | 2,100 | 2,519 |
| 5% 7/1/26 | | 11,335 | 13,463 |
| 5% 7/1/27 | | 7,670 | 9,105 |
| 5% 7/1/28 | | 13,120 | 15,428 |
| Series 2016, 5% 7/1/32 | | 2,430 | 2,880 |
| Citizens Property Ins. Corp. Series 2012 A1: | | | |
| 5% 6/1/21 | | 2,630 | 2,808 |
| 5% 6/1/22 | | 2,100 | 2,315 |
| Clearwater Wtr. and Swr. Rev. Series 2011: | | | |
| 5% 12/1/21 | | 1,260 | 1,369 |
| 5% 12/1/23 (Pre-Refunded to 12/1/21 @ 100) | | 2,180 | 2,362 |
| 5% 12/1/24 (Pre-Refunded to 12/1/21 @ 100) | | 2,295 | 2,486 |
| Duval County School Board Ctfs. of Prtn. Series 2015 B: | | | |
| 5% 7/1/27 | | 4,260 | 5,022 |
| 5% 7/1/28 | | 970 | 1,141 |
| 5% 7/1/30 | | 6,440 | 7,553 |
| Florida Board of Ed. Pub. Ed. Cap. Outlay: | | | |
| Series 2011 C: | | | |
| 5% 6/1/20 | | 12,022 | 12,431 |
| 5% 6/1/22 | | 9,711 | 10,402 |
| Series 2011 E, 5% 6/1/24 | | 4,855 | 5,195 |
| Florida Dept. of Mgmt. Svcs. Ctfs. of Prtn. Series 2018 A, 5% 11/1/29 | | 6,245 | 8,139 |
| Florida Mid-Bay Bridge Auth. Rev. Series 2015 A: | | | |
| 5% 10/1/27 | | 3,495 | 4,062 |
| 5% 10/1/28 | | 4,855 | 5,628 |
| 5% 10/1/29 | | 2,645 | 3,051 |
| 5% 10/1/30 | | 2,405 | 2,756 |
| Florida Muni. Pwr. Agcy. Rev.: | | | |
| (Requirements Pwr. Supply Proj.) Series 2016 A: | | | |
| 5% 10/1/30 | | 1,775 | 2,148 |
| 5% 10/1/31 | | 1,940 | 2,337 |
| (St. Lucie Proj.) Series 2012 A, 5% 10/1/26 | | 11,945 | 13,183 |
| (Stanton II Proj.) Series 2012 A, 5% 10/1/22 | | 2,750 | 3,068 |
| Series 2015 B: | | | |
| 5% 10/1/24 | | 970 | 1,143 |
| 5% 10/1/27 | | 1,455 | 1,737 |
| Gainesville Utils. Sys. Rev. Series 2019 A, 5% 10/1/44 | | 10,500 | 12,867 |
| Greater Orlando Aviation Auth. Arpt. Facilities Rev. Series 2017 A: | | | |
| 5% 10/1/28 (c) | | 3,380 | 4,138 |
| 5% 10/1/30 (c) | | 1,970 | 2,378 |
| Halifax Hosp. Med. Ctr. Rev.: | | | |
| 5% 6/1/28 | | 1,245 | 1,428 |
| 5% 6/1/35 | | 2,430 | 2,714 |
| Highlands County Health Facilities Auth. Rev. Series 2008: | | | |
| 6% 11/15/37 | | 11,625 | 11,820 |
| 6% 11/15/37 (Pre-Refunded to 11/15/19 @ 100) | | 30 | 31 |
| Hillsborough Co. Sldwst and Resource Receivables Series 2016 A: | | | |
| 5% 9/1/20 (c) | | 1,320 | 1,373 |
| 5% 9/1/21 (c) | | 1,260 | 1,350 |
| 5% 9/1/22 (c) | | 1,600 | 1,765 |
| 5% 9/1/23 (c) | | 1,940 | 2,196 |
| 5% 9/1/24 (c) | | 2,135 | 2,471 |
| 5% 9/1/25 (c) | | 2,150 | 2,540 |
| 5% 9/1/26 (c) | | 2,200 | 2,654 |
| Hillsborough County Indl. Dev. Auth. Indl. Dev. Rev. (Health Facilities/Univ. Cmnty. Hosp. Proj.) Series 2008 B, 8% 8/15/32 (Pre-Refunded to 8/15/19 @ 101) | | 3,495 | 3,557 |
| Indian River County School Board Ctfs. of Prtn. Series 2014: | | | |
| 5% 7/1/24 | | 2,595 | 3,022 |
| 5% 7/1/25 | | 1,940 | 2,314 |
| Indian River County Wtr. & Swr. Rev.: | | | |
| 5% 9/1/21 | | 1,800 | 1,811 |
| 5% 9/1/22 | | 2,205 | 2,217 |
| Jacksonville Elec. Auth. Elec. Sys. Rev. Series 2017 B, 5% 10/1/26 | | 6,680 | 8,066 |
| Jacksonville Sales Tax Rev. Series 2012: | | | |
| 5% 10/1/22 | | 3,885 | 4,316 |
| 5% 10/1/23 | | 5,165 | 5,735 |
| Lake County School Board Ctfs. of Prtn. Series 2014 A: | | | |
| 5% 6/1/25 (FSA Insured) | | 970 | 1,119 |
| 5% 6/1/26 (FSA Insured) | | 1,750 | 2,015 |
| 5% 6/1/28 (FSA Insured) | | 485 | 554 |
| Lee Memorial Health Sys. Hosp. Rev.: | | | |
| Bonds Series 2019 A2, 5%, tender 4/1/26 (a) | | 11,585 | 13,657 |
| Series 2019 A1: | | | |
| 5% 4/1/33 | | 1,450 | 1,782 |
| 5% 4/1/34 | | 3,250 | 3,973 |
| 5% 4/1/35 | | 6,325 | 7,689 |
| 5% 4/1/37 | | 2,190 | 2,635 |
| 5% 4/1/39 | | 1,500 | 1,791 |
| Manatee County School District Series 2017, 5% 10/1/25 (FSA Insured) | | 1,940 | 2,335 |
| Miami-Dade County Aviation Rev.: | | | |
| Series 2010 A, 5.375% 10/1/41 (Pre-Refunded to 10/1/20 @ 100) | | 4,565 | 4,794 |
| Series 2010 B, 5% 10/1/35 (FSA Insured) | | 9,930 | 10,351 |
| Series 2010, 5% 10/1/22 | | 2,970 | 3,110 |
| Series 2012 A: | | | |
| 5% 10/1/22 (c) | | 2,915 | 3,233 |
| 5% 10/1/24 (c) | | 9,710 | 10,791 |
| 5% 10/1/24 | | 2,100 | 2,352 |
| Series 2014 A: | | | |
| 5% 10/1/27 (c) | | 1,770 | 2,056 |
| 5% 10/1/29 (c) | | 2,725 | 3,142 |
| 5% 10/1/33 (c) | | 5,440 | 6,189 |
| 5% 10/1/37 | | 7,185 | 8,212 |
| Series 2015 A: | | | |
| 5% 10/1/21 (c) | | 2,710 | 2,919 |
| 5% 10/1/35 (c) | | 2,430 | 2,753 |
| Series 2016 A: | | | |
| 5% 10/1/30 | | 2,430 | 2,931 |
| 5% 10/1/31 | | 970 | 1,164 |
| Series 2017 B, 5% 10/1/20 (c) | | 3,580 | 3,736 |
| Miami-Dade County Cap. Asset Acquisition: | | | |
| Series 2012 A, 5% 10/1/25 | | 2,185 | 2,425 |
| Series 2016: | | | |
| 5% 10/1/28 | | 5,385 | 6,549 |
| 5% 10/1/29 | | 3,985 | 4,834 |
| 5% 10/1/30 | | 7,215 | 8,720 |
| Miami-Dade County Expressway Auth.: | | | |
| Series 2010 A, 5% 7/1/40 | | 7,965 | 8,221 |
| Series 2014 A, 5% 7/1/44 | | 2,815 | 3,138 |
| Series 2016 A: | | | |
| 5% 7/1/32 | | 3,865 | 4,570 |
| 5% 7/1/33 | | 3,205 | 3,778 |
| Series A: | | | |
| 5% 7/1/31 | | 1,455 | 1,729 |
| 5% 7/1/34 | | 970 | 1,138 |
| Miami-Dade County Gen. Oblig. (Parks Prog.) Series 2015 A, 5% 11/1/23 | | 3,955 | 4,557 |
| Miami-Dade County Pub. Facilities Rev. (Jackson Health Sys. Proj.) Series 2005 B, 5% 6/1/20 (Nat'l. Pub. Fin. Guarantee Corp. Insured) | | 6,985 | 7,211 |
| Miami-Dade County School Board Ctfs. of Prtn.: | | | |
| Series 2014 D: | | | |
| 5% 11/1/24 | | 11,340 | 13,276 |
| 5% 11/1/25 | | 11,880 | 13,856 |
| 5% 11/1/26 | | 7,720 | 8,965 |
| Series 2015 A, 5% 5/1/27 (FSA Insured) | | 4,100 | 4,841 |
| Series 2015 B, 5% 5/1/28 | | 13,295 | 15,571 |
| Series 2015 D: | | | |
| 5% 2/1/29 | | 3,935 | 4,665 |
| 5% 2/1/30 | | 6,310 | 7,444 |
| Series 2016 A: | | | |
| 5% 8/1/27 | | 7,340 | 8,847 |
| 5% 5/1/31 | | 19,200 | 22,628 |
| Miami-Dade County Transit Sales Surtax Rev. Series 2012: | | | |
| 5% 7/1/21 | | 1,240 | 1,330 |
| 5% 7/1/42 | | 1,625 | 1,765 |
| Orange County Health Facilities Auth.: | | | |
| (Orlando Health, Inc.) Series 2009, 5.25% 10/1/20 | | 4,390 | 4,433 |
| Series 2012 A, 5% 10/1/42 | | 12,285 | 13,060 |
| Series 2012 B, 5% 10/1/42 | | 5,050 | 5,370 |
| Series 2016 A, 5% 10/1/39 | | 3,100 | 3,585 |
| Orange County School Board Ctfs. of Prtn.: | | | |
| Series 2012 B, 5% 8/1/26 (Pre-Refunded to 8/1/22 @ 100) | | 3,885 | 4,321 |
| Series 2015 C, 5% 8/1/29 | | 6,800 | 8,047 |
| Orlando & Orange County Expressway Auth. Rev. Series 2012, 5% 7/1/20 | | 1,940 | 2,011 |
| Orlando Utils. Commission Util. Sys. Rev.: | | | |
| Series 2011 B: | | | |
| 5% 10/1/19 | | 1,455 | 1,468 |
| 5% 10/1/20 | | 3,400 | 3,557 |
| Series 2012 A: | | | |
| 5% 10/1/23 | | 1,650 | 1,899 |
| 5% 10/1/25 | | 875 | 1,061 |
| Palm Beach County Health Facilities Auth. Hosp. Rev. Series 2014: | | | |
| 5% 12/1/23 | | 330 | 376 |
| 5% 12/1/24 | | 660 | 772 |
| Palm Beach County School Board Ctfs. of Prtn.: | | | |
| (Palm Beach County School District Proj.) Series 2018 A: | | | |
| 5% 8/1/22 | | 1,865 | 2,069 |
| 5% 8/1/23 | | 1,115 | 1,274 |
| 5% 8/1/24 | | 1,270 | 1,491 |
| 5% 8/1/25 | | 4,550 | 5,476 |
| 5% 8/1/26 | | 1,880 | 2,312 |
| (Palm Beach County School District) Series 2017 A, 5% 8/1/26 | | 21,905 | 26,939 |
| Series 2014 B, 5% 8/1/25 | | 3,110 | 3,743 |
| Series 2015 B: | | | |
| 5% 8/1/25 | | 1,580 | 1,901 |
| 5% 8/1/27 | | 8,045 | 9,594 |
| 5% 8/1/28 | | 5,325 | 6,333 |
| Series 2015 D: | | | |
| 5% 8/1/26 | | 23,370 | 27,944 |
| 5% 8/1/27 | | 10,595 | 12,635 |
| 5% 8/1/28 | | 3,620 | 4,305 |
| 5% 8/1/26 | | 10,160 | 12,149 |
| Palm Beach County Solid Waste Auth. Rev. Series 2011, 5% 10/1/24 | | 8,350 | 9,028 |
| Saint Lucie County School Board Ctfs. of Prtn. Series 2013 A: | | | |
| 5% 7/1/25 | | 1,940 | 2,184 |
| 5% 7/1/27 | | 4,130 | 4,622 |
| Seminole County School Board Ctfs. of Prtn. Series 2016 C: | | | |
| 5% 7/1/23 | | 1,940 | 2,202 |
| 5% 7/1/24 | | 1,700 | 1,981 |
| South Florida Wtr. Mgmt. District Ctfs. of Prtn. Series 2015, 5% 10/1/30 | | 3,885 | 4,635 |
| South Lake County Hosp. District (South Lake Hosp., Inc.) Series 2009 A, 6.25% 4/1/39 | | 2,620 | 2,628 |
| South Miami Health Facilities Auth. Hosp. Rev. (Baptist Med. Ctr., FL. Proj.) Series 2017: | | | |
| 5% 8/15/24 | | 2,460 | 2,876 |
| 5% 8/15/25 | | 3,980 | 4,761 |
| Tallahassee Health Facilities Rev.: | | | |
| (Tallahassee Memorial Healthcare, Inc. Proj.) Series 2016 A: | | | |
| 5% 12/1/19 | | 515 | 522 |
| 5% 12/1/20 | | 100 | 104 |
| 5% 12/1/21 | | 1,095 | 1,178 |
| Series 2015 A, 5% 12/1/40 | | 1,750 | 1,946 |
| Tampa Bay Wtr. Reg'l. Wtr. Supply Auth. Util. Sys. Rev.: | | | |
| Series 2001 A, 6% 10/1/29 | | 2,430 | 3,370 |
| Series 2005, 5.5% 10/1/22 (FGIC Insured) | | 2,335 | 2,642 |
| Tampa Health Sys. Rev. Series 2010, 5% 11/15/19 | | 1,455 | 1,475 |
| Tampa Solid Waste Sys. Rev. Series 2010, 5% 10/1/19 (FSA Insured) (c) | | 5,795 | 5,845 |
| Tampa Tax Allocation (H. Lee Moffitt Cancer Ctr. Proj.) Series 2012 A, 5% 9/1/28 | | 1,845 | 2,029 |
| Volusia County School Board Ctfs. of Prtn. (Florida Master Lease Prog.) Series 2016 A, 5% 8/1/32 (Build America Mutual Assurance Insured) | | 4,855 | 5,688 |
|
| TOTAL FLORIDA | | | 827,168 |
|
| Georgia - 2.1% | | | |
| Atlanta Wtr. & Wastewtr. Rev.: | | | |
| 5% 11/1/27 | | 970 | 1,161 |
| 5% 11/1/29 | | 2,430 | 2,888 |
| Burke County Indl. Dev. Auth. Poll. Cont. Rev. Bonds (Georgia Pwr. Co. Plant Vogtle Proj.): | | | |
| Series 2008, 2.925%, tender 3/12/24 (a) | | 5,000 | 5,180 |
| Series 2013 1st, 2.925%, tender 3/12/24 (a) | | 7,770 | 8,049 |
| Colquitt County Dev. Auth. Rev. Series C, 0% 12/1/21 (Escrowed to Maturity) | | 6,810 | 6,550 |
| DeKalb County Hosp. Auth. Rev. (DeKalb Med. Ctr., Inc. Proj.) Series 2010: | | | |
| 6% 9/1/30 (Pre-Refunded to 9/1/20 @ 100) | | 5,630 | 5,917 |
| 6.125% 9/1/40 (Pre-Refunded to 9/1/20 @ 100) | | 10,485 | 11,035 |
| DeKalb County Wtr. & Swr. Rev. Series 2011 A, 5.25% 10/1/25 | | 1,435 | 1,557 |
| Fulton County Dev. Auth. Rev. Series 2019, 5% 6/15/44 | | 2,365 | 2,895 |
| Georgia Muni. Elec. Auth. Pwr. Rev.: | | | |
| (Proj. One) Series 2008 A, 5.25% 1/1/20 | | 1,580 | 1,609 |
| Series 2011 A, 5% 1/1/21 | | 8,960 | 9,418 |
| Series GG: | | | |
| 5% 1/1/24 | | 3,520 | 3,919 |
| 5% 1/1/25 | | 1,215 | 1,351 |
| 5% 1/1/26 | | 4,855 | 5,384 |
| Georgia Muni. Gas Auth. Rev. (Gas Portfolio III Proj.): | | | |
| Series 2014 U, 5% 10/1/24 | | 1,360 | 1,588 |
| Series Q, 5% 10/1/22 | | 1,940 | 2,155 |
| Series S: | | | |
| 5% 10/1/22 | | 1,240 | 1,377 |
| 5% 10/1/24 | | 2,355 | 2,610 |
| Main Street Natural Gas, Inc. Bonds: | | | |
| Series 2018 C, 4%, tender 12/1/23 (a) | | 28,250 | 30,864 |
| Series 2019 B, 4%, tender 12/2/24 (a) | | 26,260 | 29,130 |
| Metropolitan Atlanta Rapid Transit Auth. Sales Tax Rev. Third Series 2009 A, 5.25% 7/1/36 (Pre-Refunded to 7/1/19 @ 100) | | 11,265 | 11,265 |
| Monroe County Dev. Auth. Poll. Cont. Rev. Bonds (Georgia Pwr. Co. Plant Scherer Proj.) Series 2009, 2.35%, tender 12/11/20 (a) | | 6,590 | 6,654 |
|
| TOTAL GEORGIA | | | 152,556 |
|
| Hawaii - 0.8% | | | |
| Hawaii Arpts. Sys. Rev. Series 2015 A, 5% 7/1/45 (c) | | 3,945 | 4,465 |
| Hawaii Gen. Oblig. Series 2019 FW: | | | |
| 5% 1/1/31 | | 1,250 | 1,587 |
| 5% 1/1/32 | | 14,000 | 17,685 |
| 5% 1/1/33 | | 10,000 | 12,569 |
| 5% 1/1/35 | | 5,000 | 6,227 |
| Honolulu City & County Gen. Oblig.: | | | |
| Series 2017 D: | | | |
| 5% 9/1/22 | | 3,885 | 4,328 |
| 5% 9/1/26 | | 3,110 | 3,841 |
| Series 2019 A: | | | |
| 5% 9/1/27 | | 2,000 | 2,522 |
| 5% 9/1/30 | | 6,500 | 8,220 |
|
| TOTAL HAWAII | | | 61,444 |
|
| Idaho - 0.3% | | | |
| Idaho Hsg. & Fin. Assoc. Single Family Mtg.: | | | |
| (Idaho St Garvee Proj.) Series 2017 A: | | | |
| 5% 7/15/20 | | 1,980 | 2,054 |
| 5% 7/15/21 | | 2,955 | 3,163 |
| 5% 7/15/22 | | 3,285 | 3,626 |
| 5% 7/15/23 | | 1,575 | 1,787 |
| 5% 7/15/24 | | 1,260 | 1,467 |
| 5% 7/15/25 | | 1,260 | 1,499 |
| 5% 7/15/27 | | 3,140 | 3,890 |
| Series 2019 A, 4% 1/1/50 | | 1,140 | 1,245 |
|
| TOTAL IDAHO | | | 18,731 |
|
| Illinois - 14.6% | | | |
| Chicago Board of Ed.: | | | |
| Series 1999 A, 5.25% 12/1/21 (Nat'l. Pub. Fin. Guarantee Corp. Insured) | | 1,455 | 1,551 |
| Series 2010 F, 5% 12/1/20 | | 1,030 | 1,073 |
| Series 2011 A: | | | |
| 5% 12/1/41 | | 2,075 | 2,142 |
| 5.5% 12/1/39 | | 5,730 | 5,988 |
| Series 2012 A, 5% 12/1/42 | | 1,880 | 1,961 |
| Series 2015 C, 5.25% 12/1/39 | | 1,455 | 1,569 |
| Series 2016 B, 6.5% 12/1/46 | | 700 | 836 |
| Series 2017 A, 7% 12/1/46 (d) | | 2,400 | 2,987 |
| Series 2017 C: | | | |
| 5% 12/1/25 | | 2,025 | 2,269 |
| 5% 12/1/26 | | 905 | 1,026 |
| Series 2017 D, 5% 12/1/27 | | 2,500 | 2,865 |
| Series 2018 A: | | | |
| 5% 12/1/24 | | 560 | 619 |
| 5% 12/1/27 | | 6,280 | 7,198 |
| 5% 12/1/33 | | 700 | 784 |
| 5% 12/1/34 | | 1,400 | 1,563 |
| Series 2018 C: | | | |
| 5% 12/1/24 | | 725 | 801 |
| 5% 12/1/25 | | 15,335 | 17,185 |
| 5% 12/1/26 | | 4,625 | 5,246 |
| 5% 12/1/46 | | 5,795 | 6,336 |
| Chicago Gen. Oblig. (City Colleges Proj.) Series 1999, 0% 1/1/20 (Nat'l. Pub. Fin. Guarantee Corp. Insured) | | 16,810 | 16,628 |
| Chicago Midway Arpt. Rev.: | | | |
| Series 2014 A, 5% 1/1/32 (c) | | 6,310 | 7,048 |
| Series 2014 B: | | | |
| 5% 1/1/22 | | 970 | 1,054 |
| 5% 1/1/24 | | 3,235 | 3,713 |
| Series 2016 A: | | | |
| 5% 1/1/29 (c) | | 2,155 | 2,531 |
| 5% 1/1/30 (c) | | 3,290 | 3,845 |
| 5% 1/1/31 (c) | | 2,430 | 2,826 |
| Series 2016 B, 5% 1/1/41 | | 3,390 | 3,885 |
| Chicago O'Hare Int'l. Arpt. Rev.: | | | |
| Series 2011 B, 5% 1/1/20 | | 4,300 | 4,376 |
| Series 2011 C, 6.5% 1/1/41 (Pre-Refunded to 1/1/21 @ 100) | | 14,055 | 15,142 |
| Series 2012 A, 5% 1/1/22 | | 1,700 | 1,848 |
| Series 2012 B, 5% 1/1/22 (c) | | 6,800 | 7,355 |
| Series 2016 C: | | | |
| 5% 1/1/22 | | 2,155 | 2,343 |
| 5% 1/1/23 | | 1,360 | 1,522 |
| 5% 1/1/24 | | 1,455 | 1,673 |
| 5% 1/1/25 | | 2,185 | 2,573 |
| 5% 1/1/26 | | 1,940 | 2,334 |
| 5% 1/1/33 | | 2,305 | 2,684 |
| 5% 1/1/34 | | 2,670 | 3,101 |
| Series 2017 D: | | | |
| 5% 1/1/27 (c) | | 2,065 | 2,492 |
| 5% 1/1/28 (c) | | 460 | 552 |
| 5% 1/1/31 (c) | | 2,850 | 3,361 |
| 5% 1/1/33 (c) | | 1,455 | 1,702 |
| Chicago O'Hare Int'l. Arpt. Spl. Facilities Rev. Series 2018, 5% 7/1/38 (c) | | 2,470 | 2,859 |
| Chicago Transit Auth. Cap. Grant Receipts Rev. Series 2017: | | | |
| 5% 6/1/22 | | 1,685 | 1,836 |
| 5% 6/1/23 | | 1,520 | 1,696 |
| Chicago Wastewtr. Transmission Rev. Series 2012, 5% 1/1/23 | | 1,260 | 1,356 |
| Chicago Wtr. Rev. Series 2017, 5.25% 11/1/33 (FSA Insured) | | 990 | 993 |
| Cook County Forest Preservation District: | | | |
| Series 2012 B: | | | |
| 5% 12/15/23 | | 970 | 1,047 |
| 5% 12/15/24 | | 1,310 | 1,412 |
| Series 2012 C, 5% 12/15/25 | | 2,060 | 2,214 |
| Cook County Gen. Oblig.: | | | |
| Series 2010 A, 5.25% 11/15/24 | | 17,405 | 18,238 |
| Series 2010 G, 5% 11/15/25 | | 2,855 | 2,977 |
| Series 2011 A, 5.25% 11/15/24 | | 1,455 | 1,561 |
| Series 2012 C: | | | |
| 5% 11/15/22 | | 2,000 | 2,203 |
| 5% 11/15/23 | | 4,835 | 5,315 |
| 5% 11/15/24 | | 18,115 | 19,889 |
| 5% 11/15/25 (FSA Insured) | | 505 | 557 |
| Cook, Kane Lake & McHenry Countys Cmnty. College District #512 Series 2017 B, 5% 12/1/24 | | 5,140 | 6,056 |
| Grundy & Will Counties Cmnty. School Gen. Obligan Series 2018, 5% 2/1/29 | | 1,190 | 1,420 |
| Illinois Dev. Fin. Auth. Retirement Hsg. Regency Park Rev. 0% 7/15/23 (Escrowed to Maturity) | | 28,065 | 26,327 |
| Illinois Fin. Auth. Rev.: | | | |
| (Bradley Univ. Proj.) Series 2017 C: | | | |
| 5% 8/1/22 | | 1,340 | 1,464 |
| 5% 8/1/24 | | 1,480 | 1,691 |
| (Centegra Health Sys. Proj.) Series 2014 A, 5% 9/1/34 | | 585 | 663 |
| (Northwestern Memorial Hosp.,IL. Proj.) Series 2017 A: | | | |
| 5% 7/15/25 | | 1,385 | 1,655 |
| 5% 7/15/26 | | 1,940 | 2,369 |
| 5% 7/15/28 | | 2,040 | 2,555 |
| (OSF Healthcare Sys.) Series 2018 A: | | | |
| 5% 5/15/29 | | 9,870 | 12,195 |
| 5% 5/15/30 | | 9,845 | 12,053 |
| 5% 5/15/31 | | 21,400 | 25,891 |
| (Presence Health Proj.) Series 2016 C: | | | |
| 5% 2/15/26 | | 2,590 | 3,136 |
| 5% 2/15/29 | | 10,570 | 12,940 |
| 5% 2/15/36 | | 2,200 | 2,586 |
| (Presence Health) Series 2016 C, 5% 2/15/28 | | 6,800 | 8,373 |
| (Provena Health Proj.) Series 2010 A: | | | |
| 6% 5/1/20 (Escrowed to Maturity) | | 2,000 | 2,077 |
| 6.25% 5/1/21 (Pre-Refunded to 5/1/20 @ 100) | | 6,210 | 6,460 |
| (Rosalind Franklin Univ. Research Bldg. Proj.) Series 2017 C, 5% 8/1/49 | | 845 | 940 |
| (Rush Univ. Med. Ctr. Proj.) Series 2015 A, 5% 11/15/34 | | 1,980 | 2,248 |
| (Silver Cross Health Sys. Proj.) Series 2015 C, 5% 8/15/27 | | 875 | 1,012 |
| Bonds: | | | |
| (Ascension Health Cr. Group Proj.) Series 2012 E2, 1.75%, tender 4/1/21 (a) | | 1,885 | 1,893 |
| Series 2017 B, 5%, tender 12/15/22 (a) | | 15,020 | 16,771 |
| Series 2009: | | | |
| 5% 8/15/23 | | 3,035 | 3,159 |
| 5% 8/15/23 (Pre-Refunded to 8/15/20 @ 100) | | 1,530 | 1,592 |
| 7% 8/15/44 (Pre-Refunded to 8/15/19 @ 100) | | 12,540 | 12,623 |
| Series 2010 A: | | | |
| 5.5% 8/15/24 (Pre-Refunded to 2/15/20 @ 100) | | 2,085 | 2,138 |
| 5.75% 8/15/29 (Pre-Refunded to 2/15/20 @ 100) | | 1,400 | 1,438 |
| Series 2011 IL, 5% 12/1/22 (Pre-Refunded to 12/1/21 @ 100) | | 2,030 | 2,202 |
| Series 2012 A, 5% 5/15/23 | | 1,435 | 1,571 |
| Series 2012: | | | |
| 5% 9/1/32 | | 7,865 | 8,590 |
| 5% 9/1/38 | | 10,595 | 11,474 |
| 5% 11/15/43 | | 3,170 | 3,369 |
| Series 2013: | | | |
| 5% 11/15/26 | | 2,600 | 2,852 |
| 5% 11/15/29 | | 780 | 851 |
| 5% 5/15/43 | | 7,665 | 8,105 |
| Series 2015 A: | | | |
| 5% 11/15/21 | | 410 | 444 |
| 5% 11/15/27 | | 1,015 | 1,193 |
| 5% 11/15/28 | | 1,215 | 1,423 |
| 5% 11/15/29 | | 1,830 | 2,129 |
| 5% 11/15/32 | | 3,375 | 3,871 |
| 5% 11/15/45 | | 2,390 | 2,654 |
| Series 2015 C: | | | |
| 5% 8/15/35 | | 5,925 | 6,667 |
| 5% 8/15/44 | | 28,260 | 31,344 |
| Series 2016 A: | | | |
| 5% 2/15/24 | | 1,455 | 1,671 |
| 5% 2/15/25 | | 995 | 1,169 |
| 5% 2/15/26 | | 1,455 | 1,744 |
| 5% 7/1/30 | | 2,545 | 2,997 |
| 5% 8/15/33 | | 3,205 | 3,648 |
| 5% 7/1/34 | | 1,650 | 1,900 |
| 5% 7/1/36 | | 5,715 | 6,533 |
| Series 2016 C: | | | |
| 3.75% 2/15/34 | | 1,250 | 1,320 |
| 4% 2/15/36 | | 5,330 | 5,834 |
| 5% 2/15/22 | | 1,250 | 1,366 |
| 5% 2/15/24 | | 565 | 654 |
| 5% 2/15/31 | | 1,650 | 1,990 |
| 5% 2/15/32 | | 12,195 | 14,619 |
| 5% 2/15/33 | | 4,855 | 5,793 |
| 5% 2/15/41 | | 10,620 | 12,330 |
| Series 2016: | | | |
| 4% 2/15/41 | | 16,235 | 17,561 |
| 4% 2/15/41 (Pre-Refunded to 2/15/27 @ 100) | | 35 | 41 |
| 5% 5/15/28 | | 2,380 | 2,815 |
| 5% 5/15/29 | | 1,330 | 1,568 |
| 5% 12/1/29 | | 1,755 | 2,055 |
| 5% 12/1/40 | | 4,765 | 5,360 |
| 5% 12/1/46 | | 3,250 | 3,637 |
| Series 2017 A: | | | |
| 5% 1/1/34 | | 2,485 | 2,870 |
| 5% 8/1/47 | | 750 | 837 |
| Series 2017: | | | |
| 5% 7/1/29 | | 5,030 | 6,165 |
| 5% 1/1/30 | | 4,855 | 5,933 |
| 5% 7/1/31 | | 8,630 | 10,460 |
| Series 2018 A, 5% 1/1/44 | | 19,010 | 21,605 |
| 5% 11/15/26 | | 2,940 | 3,450 |
| Illinois Gen. Oblig.: | | | |
| Series 2010, 5% 1/1/21 (FSA Insured) | | 11,655 | 11,852 |
| Series 2012 A: | | | |
| 4% 1/1/23 | | 2,130 | 2,207 |
| 5% 1/1/33 | | 3,495 | 3,665 |
| Series 2012: | | | |
| 5% 8/1/19 | | 4,345 | 4,356 |
| 5% 3/1/20 | | 3,210 | 3,280 |
| 5% 3/1/21 | | 2,670 | 2,804 |
| 5% 8/1/21 | | 1,555 | 1,652 |
| 5% 3/1/22 | | 4,855 | 5,225 |
| 5% 8/1/22 | | 6,410 | 6,972 |
| 5% 8/1/23 | | 3,310 | 3,659 |
| Series 2013, 5.5% 7/1/38 | | 3,885 | 4,239 |
| Series 2014: | | | |
| 5% 4/1/23 | | 7,400 | 8,122 |
| 5% 2/1/26 | | 2,195 | 2,414 |
| 5% 2/1/27 | | 2,590 | 2,843 |
| 5% 4/1/28 | | 2,070 | 2,273 |
| 5% 5/1/28 | | 910 | 1,000 |
| 5% 5/1/32 | | 2,430 | 2,637 |
| 5% 5/1/33 | | 6,410 | 6,944 |
| 5.25% 2/1/31 | | 10,195 | 11,196 |
| Series 2016: | | | |
| 5% 11/1/20 | | 4,050 | 4,225 |
| 5% 1/1/22 | | 7,480 | 8,016 |
| 5% 2/1/23 | | 1,530 | 1,673 |
| 5% 6/1/25 | | 7,620 | 8,607 |
| 5% 6/1/26 | | 1,035 | 1,182 |
| 5% 2/1/27 | | 11,790 | 13,534 |
| 5% 2/1/28 | | 5,965 | 6,819 |
| 5% 2/1/29 | | 5,605 | 6,380 |
| Series 2017 D: | | | |
| 5% 11/1/23 | | 9,670 | 10,746 |
| 5% 11/1/25 | | 13,645 | 15,512 |
| 5% 11/1/26 | | 13,050 | 14,983 |
| Series 2019 B: | | | |
| 5% 9/1/21 | | 5,580 | 5,942 |
| 5% 9/1/22 | | 5,475 | 5,967 |
| 5% 9/1/23 | | 5,580 | 6,179 |
| 5% 9/1/24 | | 5,580 | 6,283 |
| Illinois Hsg. Dev. Auth. Multi-family Hsg. Rev. Series 2019, 2.9% 7/1/35 | | 9,080 | 9,082 |
| Illinois Muni. Elec. Agcy. Pwr. Supply Series 2015 A: | | | |
| 5% 2/1/28 | | 9,710 | 11,405 |
| 5% 2/1/31 | | 3,465 | 4,035 |
| Illinois Reg'l. Trans. Auth. Series 2017 A: | | | |
| 5% 7/1/20 | | 2,430 | 2,515 |
| 5% 7/1/21 | | 2,380 | 2,545 |
| Illinois Toll Hwy. Auth. Toll Hwy. Rev.: | | | |
| Series 2014 C, 5% 1/1/38 | | 4,470 | 5,057 |
| Series 2014 D, 5% 1/1/24 | | 5,890 | 6,747 |
| Series 2015 A, 5% 1/1/40 | | 12,335 | 14,041 |
| Series 2016 A, 5% 12/1/31 | | 1,735 | 2,023 |
| Joliet School District #86 Gen. Oblig. Series 2002, 0% 11/1/21 (FSA Insured) | | 6,670 | 6,381 |
| Kane, Cook & DuPage Counties School District #46 Elgin Series 2003 B, 0% 1/1/22 (Escrowed to Maturity) | | 4,040 | 3,888 |
| Kane, McHenry, Cook & DeKalb Counties Unit School District #300: | | | |
| Series 2017, 5% 1/1/29 | | 1,790 | 2,157 |
| 5% 1/1/26 | | 8,660 | 10,068 |
| Lake County Cmnty. High School District #117, Antioch Series 2000 B, 0% 12/1/20 (Nat'l. Pub. Fin. Guarantee Corp. Insured) | | 5,145 | 5,002 |
| McHenry & Kane Counties Cmnty. Consolidated School District #158 Series 2004, 0% 1/1/24 (FSA Insured) | | 7,810 | 7,056 |
| McHenry County Cmnty. School District #200 Series 2006 B: | | | |
| 0% 1/15/24 | | 7,205 | 6,547 |
| 0% 1/15/25 | | 7,510 | 6,656 |
| 0% 1/15/26 | | 5,645 | 4,866 |
| McHenry County Conservation District Gen. Oblig. Series 2014: | | | |
| 5% 2/1/24 | | 2,235 | 2,570 |
| 5% 2/1/27 | | 5,825 | 6,791 |
| Metropolitan Pier & Exposition: | | | |
| (McCormick Place Expansion Proj.): | | | |
| Series 1992 A, 0% 6/15/20 (Nat'l. Pub. Fin. Guarantee Corp. Insured) | | 2,570 | 2,522 |
| Series 1996 A, 0% 6/15/23 (Nat'l. Pub. Fin. Guarantee Corp. Insured) | | 3,595 | 3,281 |
| Series 2010 B1: | | | |
| 0% 6/15/43 (FSA Insured) | | 18,970 | 7,957 |
| 0% 6/15/44 (FSA Insured) | | 36,320 | 14,584 |
| 0% 6/15/47 (FSA Insured) | | 3,870 | 1,362 |
| Series 2012 B, 0% 12/15/51 | | 47,100 | 12,521 |
| Series 2002: | | | |
| 0% 12/15/23 | | 4,015 | 3,614 |
| 0% 12/15/23 (Escrowed to Maturity) | | 100 | 93 |
| Railsplitter Tobacco Settlement Auth. Rev.: | | | |
| Series 2010, 5.5% 6/1/23 (Pre-Refunded to 6/1/21 @ 100) | | 6,440 | 6,942 |
| Series 2017: | | | |
| 5% 6/1/23 | | 10,460 | 11,743 |
| 5% 6/1/24 | | 13,685 | 15,734 |
| Univ. of Illinois Rev. Series 2013: | | | |
| 6% 10/1/42 | | 3,785 | 4,294 |
| 6.25% 10/1/38 | | 3,785 | 4,343 |
| Will County Cmnty. Unit School District #365-U Series 2007 B, 0% 11/1/26 (FSA Insured) | | 5,600 | 4,765 |
|
| TOTAL ILLINOIS | | | 1,049,704 |
|
| Indiana - 2.8% | | | |
| Hobart Bldg. Corp. Series 2006, 6.5% 1/15/29 (Pre-Refunded to 1/15/20 @ 100) | | 11,050 | 11,355 |
| Indiana Fin. Auth. Econ. Dev. Rev. Bonds (Republic Svcs., Inc. Proj.): | | | |
| Series 2012, 1.6%, tender 9/3/19 (a)(c) | | 12,100 | 12,101 |
| Series A, 1.6%, tender 9/3/19 (a)(c) | | 17,300 | 17,302 |
| Indiana Fin. Auth. Health Sys. Rev. Bonds Series 2019 B, 2.25%, tender 7/1/25 (a)(b) | | 5,045 | 5,185 |
| Indiana Fin. Auth. Hosp. Rev.: | | | |
| Bonds Series 2015 B, 1.65%, tender 7/2/22 (a)(b) | | 8,410 | 8,424 |
| Series 2013, 5% 8/15/25 | | 3,020 | 3,421 |
| Indiana Fin. Auth. Rev.: | | | |
| (Cmnty. Foundation of Northwest Indiana Obligated Group) Series 2016, 5% 9/1/25 | | 970 | 1,153 |
| Series 2012: | | | |
| 5% 3/1/22 | | 970 | 1,057 |
| 5% 3/1/23 | | 1,455 | 1,585 |
| 5% 3/1/30 | | 1,020 | 1,101 |
| 5% 3/1/41 | | 5,155 | 5,509 |
| Series 2015, 5% 3/1/36 | | 8,060 | 9,157 |
| Series 2016: | | | |
| 5% 9/1/26 | | 970 | 1,176 |
| 5% 9/1/29 | | 485 | 578 |
| 5% 9/1/36 | | 2,090 | 2,433 |
| Indiana Fin. Auth. Wastewtr. Util. Rev.: | | | |
| (CWA Auth. Proj.): | | | |
| Series 2012 A, 5% 10/1/25 | | 2,100 | 2,344 |
| Series 2015 A: | | | |
| 5% 10/1/26 | | 2,405 | 2,812 |
| 5% 10/1/28 | | 1,145 | 1,333 |
| Series 2011 A, 5.25% 10/1/24 | | 3,910 | 4,236 |
| Indiana Health Facility Fing. Auth. Rev. Bonds Series 2001 A2, 2%, tender 2/1/23 (a) | | 8,930 | 9,055 |
| Indiana Muni. Pwr. Agcy. Pwr. Supply Sys. Rev. Series 2012 A: | | | |
| 5% 1/1/24 | | 690 | 758 |
| 5% 1/1/24 (Pre-Refunded to 7/1/22 @ 100) | | 280 | 311 |
| 5% 1/1/25 | | 695 | 763 |
| 5% 1/1/25 (Pre-Refunded to 7/1/22 @ 100) | | 275 | 305 |
| 5% 1/1/26 | | 1,895 | 2,080 |
| 5% 1/1/26 (Pre-Refunded to 7/1/22 @ 100) | | 770 | 854 |
| Indianapolis Thermal Energy Sys.: | | | |
| Series 2010 B: | | | |
| 5% 10/1/20 | | 8,070 | 8,428 |
| 5% 10/1/21 | | 5,340 | 5,753 |
| Series 2016 A: | | | |
| 5% 10/1/24 | | 10,585 | 12,310 |
| 5% 10/1/25 | | 11,400 | 13,558 |
| Lake Central Multi-District School Bldg. Corp. Series 2012 B: | | | |
| 4% 1/15/22 | | 1,415 | 1,504 |
| 5% 7/15/22 | | 970 | 1,071 |
| 5% 7/15/23 | | 2,620 | 2,936 |
| 5% 7/15/24 | | 4,065 | 4,551 |
| 5% 7/15/25 | | 4,205 | 4,703 |
| Whiting Envir. Facilities Rev.: | | | |
| (BP Products North America, Inc. Proj.) Series 2009, 5.25% 1/1/21 | | 7,170 | 7,568 |
| Bonds (BP Products North America, Inc. Proj.) Series 2015, 5%, tender 11/1/22 (a)(c) | | 32,790 | 36,160 |
|
| TOTAL INDIANA | | | 204,930 |
|
| Iowa - 0.1% | | | |
| Iowa Fin. Auth. Rev. Series A: | | | |
| 5% 5/15/43 | | 1,410 | 1,550 |
| 5% 5/15/48 | | 3,365 | 3,686 |
|
| TOTAL IOWA | | | 5,236 |
|
| Kansas - 0.2% | | | |
| Kansas Dev. Fin. Agcy. Series 2009: | | | |
| 5% 11/15/19 | | 265 | 269 |
| 5% 11/15/19 (Escrowed to Maturity) | | 10 | 10 |
| Kansas Dev. Fin. Auth. Health Facilities Rev. (KU Health Sys. Proj.) Series 2011 H, 5% 3/1/25 | | 970 | 992 |
| Wyandotte County/Kansas City Unified Govt. Util. Sys. Rev.: | | | |
| Series 2012 A: | | | |
| 5% 9/1/23 | | 995 | 1,098 |
| 5% 9/1/24 | | 4,285 | 4,725 |
| Series 2012 B, 5% 9/1/24 | | 1,455 | 1,605 |
| Series 2016 A: | | | |
| 5% 9/1/30 | | 970 | 1,133 |
| 5% 9/1/32 | | 1,115 | 1,295 |
|
| TOTAL KANSAS | | | 11,127 |
|
| Kentucky - 2.1% | | | |
| Kenton County Arpt. Board Arpt. Rev. Series 2016: | | | |
| 5% 1/1/25 | | 800 | 949 |
| 5% 1/1/26 | | 585 | 710 |
| 5% 1/1/29 | | 1,555 | 1,861 |
| 5% 1/1/30 | | 1,625 | 1,932 |
| Kentucky Bond Dev. Corp. (Lexington Ctr. Corp. Proj.) Series 2018 A: | | | |
| 5% 9/1/26 | | 1,745 | 2,116 |
| 5% 9/1/28 | | 1,880 | 2,351 |
| 5% 9/1/30 | | 520 | 639 |
| Kentucky Econ. Dev. Fin. Auth. Hosp. Rev. Series 2015 A: | | | |
| 5% 6/1/25 | | 1,725 | 1,961 |
| 5% 6/1/26 | | 1,815 | 2,069 |
| 5% 6/1/27 | | 1,910 | 2,171 |
| 5% 6/1/28 | | 2,005 | 2,273 |
| 5% 6/1/29 | | 2,105 | 2,377 |
| 5% 6/1/30 | | 2,215 | 2,490 |
| Kentucky Econ. Dev. Fin. Auth. Rev. Louisville Arena Auth., Inc. Series 2017 A, 5% 12/1/47 (FSA Insured) | | 1,485 | 1,617 |
| Kentucky State Property & Buildings Commission Rev.: | | | |
| (#106 Proj.) Series 2013 A, 5% 10/1/27 | | 3,755 | 4,233 |
| (Kentucky St Proj.) Series D, 5% 5/1/21 | | 1,850 | 1,971 |
| (Kentucky St Proj.): | | | |
| Series D, 5% 5/1/26 | | 1,180 | 1,405 |
| Series D: | | | |
| 5% 5/1/27 | | 970 | 1,169 |
| 5% 5/1/28 | | 970 | 1,165 |
| (Proj. No. 112) Series 2016 B, 5% 11/1/27 | | 9,595 | 11,455 |
| (Proj. No. 119) Series 2018: | | | |
| 5% 5/1/28 | | 4,855 | 5,943 |
| 5% 5/1/29 | | 565 | 688 |
| 5% 5/1/31 | | 1,425 | 1,734 |
| Series 2016 A: | | | |
| 5% 2/1/29 | | 5,555 | 6,499 |
| 5% 2/1/30 | | 5,670 | 6,601 |
| 5% 2/1/32 | | 2,230 | 2,574 |
| 5% 2/1/33 | | 2,770 | 3,190 |
| Kentucky, Inc. Pub. Energy Bonds Series C1, 4%, tender 6/1/25 (a) | | 28,000 | 30,852 |
| Louisville & Jefferson County: | | | |
| Series 2013 A: | | | |
| 5.5% 10/1/33 | | 2,430 | 2,759 |
| 5.75% 10/1/38 | | 6,245 | 7,119 |
| Series 2016 A: | | | |
| 5% 10/1/29 | | 17,585 | 20,949 |
| 5% 10/1/32 | | 3,230 | 3,780 |
| Louisville/Jefferson County Metropolitan Gov. Series 2012 A: | | | |
| 5% 12/1/28 | | 1,910 | 2,077 |
| 5% 12/1/29 | | 5,100 | 5,540 |
| 5% 12/1/30 | | 720 | 779 |
|
| TOTAL KENTUCKY | | | 147,998 |
|
| Louisiana - 0.5% | | | |
| Louisiana Pub. Facilities Auth. Hosp. Rev. (Franciscan Missionaries of Our Lady Health Sys. Proj.) Series 2009, 6.75% 7/1/39 (Pre-Refunded to 7/1/19 @ 100) | | 1,650 | 1,650 |
| Louisiana Pub. Facilities Auth. Rev.: | | | |
| (Tulane Univ. of Louisiana Proj.) Series 2016 A: | | | |
| 5% 12/15/22 | | 1,260 | 1,408 |
| 5% 12/15/23 | | 2,915 | 3,352 |
| Series 2018 E: | | | |
| 5% 7/1/35 | | 1,655 | 2,004 |
| 5% 7/1/36 | | 1,795 | 2,166 |
| Louisiana Stadium and Exposition District Series 2013 A, 5% 7/1/24 | | 2,065 | 2,338 |
| New Orleans Aviation Board Rev.: | | | |
| (North Term. Proj.): | | | |
| Series 2015 B: | | | |
| 5% 1/1/24 (c) | | 2,430 | 2,752 |
| 5% 1/1/25 (c) | | 2,915 | 3,370 |
| 5% 1/1/27 (c) | | 2,185 | 2,518 |
| Series 2017 B: | | | |
| 5% 1/1/29 (c) | | 390 | 464 |
| 5% 1/1/31 (c) | | 730 | 859 |
| 5% 1/1/36 (c) | | 630 | 729 |
| 5% 1/1/37 (c) | | 485 | 559 |
| Series 2017 D2: | | | |
| 5% 1/1/26 (c) | | 730 | 861 |
| 5% 1/1/29 (c) | | 485 | 577 |
| 5% 1/1/30 (c) | | 665 | 787 |
| 5% 1/1/32 (c) | | 1,495 | 1,750 |
| 5% 1/1/35 (c) | | 1,115 | 1,293 |
| 5% 1/1/38 (c) | | 570 | 655 |
| New Orleans Gen. Oblig. Series 2012, 5% 12/1/20 | | 3,110 | 3,262 |
|
| TOTAL LOUISIANA | | | 33,354 |
|
| Maine - 0.2% | | | |
| Maine Health & Higher Edl. Facilities Auth. Rev.: | | | |
| (Eastern Maine Healthcare Systems Proj.) Series 2013, 5% 7/1/43 | | 4,215 | 4,509 |
| Series 2016 A: | | | |
| 4% 7/1/41 | | 2,030 | 2,087 |
| 4% 7/1/46 | | 2,765 | 2,837 |
| 5% 7/1/41 | | 860 | 950 |
| 5% 7/1/46 | | 585 | 645 |
| Series 2017 D, 5.75% 7/1/38 | | 645 | 647 |
| Maine Tpk. Auth. Tpk. Rev. Series 2015: | | | |
| 5% 7/1/25 | | 2,230 | 2,687 |
| 5% 7/1/27 | | 1,940 | 2,307 |
|
| TOTAL MAINE | | | 16,669 |
|
| Maryland - 1.1% | | | |
| Baltimore Proj. Rev.: | | | |
| Series 2017 C: | | | |
| 5% 7/1/28 | | 3,465 | 4,282 |
| 5% 7/1/31 | | 6,580 | 7,996 |
| 5% 7/1/33 | | 6,635 | 8,017 |
| Series 2017 D, 5% 7/1/33 | | 5,630 | 6,790 |
| Maryland Econ. Dev. Auth. Rev. (Ports America Chesapeake LLC. Proj.) Series 2017 A: | | | |
| 5% 6/1/23 | | 1,435 | 1,605 |
| 5% 6/1/24 | | 1,455 | 1,667 |
| 5% 6/1/25 | | 1,455 | 1,697 |
| 5% 6/1/26 | | 1,940 | 2,306 |
| 5% 6/1/27 | | 1,310 | 1,582 |
| 5% 6/1/31 | | 970 | 1,165 |
| 5% 6/1/32 | | 970 | 1,161 |
| Maryland Econ. Dev. Corp. (Purple Line Lt. Rail Proj.) Series 2016 D: | | | |
| 5% 3/31/30 (c) | | 1,215 | 1,426 |
| 5% 3/31/51 (c) | | 2,235 | 2,523 |
| Maryland Health & Higher Edl. Facilities Auth. Rev.: | | | |
| (Doctors Cmnty. Hosp. Proj.) Series 2010, 5.75% 7/1/38 (Pre-Refunded to 7/1/20 @ 100) | | 7,530 | 7,861 |
| (Univ. of Maryland Med. Sys. Proj.) Series 2010, 5.125% 7/1/39 (Pre-Refunded to 7/1/19 @ 100) | | 3,495 | 3,495 |
| Series 2010, 5.625% 7/1/30 (Pre-Refunded to 7/1/20 @ 100) | | 2,330 | 2,430 |
| Series 2013 A: | | | |
| 5% 7/1/24 | | 1,210 | 1,330 |
| 5% 7/1/25 | | 1,030 | 1,130 |
| Series 2015: | | | |
| 5% 7/1/27 | | 970 | 1,129 |
| 5% 7/1/28 | | 1,260 | 1,463 |
| 5% 7/1/29 | | 2,135 | 2,469 |
| 5% 7/1/31 | | 970 | 1,110 |
| Series 2016 A: | | | |
| 4% 7/1/42 | | 1,410 | 1,469 |
| 5% 7/1/33 | | 2,185 | 2,515 |
| 5% 7/1/34 | | 1,600 | 1,832 |
| 5% 7/1/35 | | 605 | 691 |
| 5% 7/1/36 | | 1,700 | 1,933 |
| Maryland St Cmnty. Dev. Admin Dept. Hsg. & Cmnty. Dev. Series 2019 B, 4% 9/1/49 | | 6,325 | 6,912 |
|
| TOTAL MARYLAND | | | 79,986 |
|
| Massachusetts - 1.9% | | | |
| Massachusetts Bay Trans. Auth. Sales Tax Rev. Series 2015 A, 5% 7/1/45 | | 1,535 | 1,771 |
| Massachusetts Dept. of Trans. Metropolitan Hwy. Sys. Rev. Bonds Series 2019 A, 5%, tender 1/1/23 (a) | | 16,960 | 18,968 |
| Massachusetts Dev. Fin. Agcy. Rev.: | | | |
| (Boston College Proj.) Series Q1, 5% 7/1/21 | | 1,785 | 1,790 |
| (Partners Healthcare Sys., Inc. Proj.): | | | |
| Series 2017 S: | | | |
| 5% 7/1/24 | | 3,885 | 4,551 |
| 5% 7/1/30 | | 3,565 | 4,443 |
| Series 2017, 5% 7/1/23 | | 1,550 | 1,767 |
| Bonds (Partners Healthcare Sys., Inc. Proj.) Series 2017 S-4, 5%, tender 1/25/24 (a) | | 11,290 | 12,955 |
| Series 2013 A, 6.25% 11/15/28 (Pre-Refunded to 11/15/23 @ 100) (d) | | 4,580 | 5,344 |
| Series 2015 D, 5% 7/1/44 | | 4,715 | 5,215 |
| Series 2016 A, 5% 7/15/22 | | 2,165 | 2,410 |
| Series 2017 A, 5% 1/1/40 | | 2,980 | 3,453 |
| Series 2019 S1: | | | |
| 5% 10/1/22 (b) | | 2,195 | 2,451 |
| 5% 10/1/23 (b) | | 2,400 | 2,760 |
| 5% 10/1/24 (b) | | 1,190 | 1,405 |
| 5% 10/1/25 (b) | | 2,670 | 3,228 |
| Series 2019: | | | |
| 5% 7/1/30 | | 1,435 | 1,770 |
| 5% 7/1/32 | | 1,040 | 1,267 |
| Massachusetts Gen. Oblig.: | | | |
| Series 2004 B, 5.25% 8/1/20 | | 13,465 | 14,041 |
| Series 2011 A, 5% 4/1/23 (Pre-Refunded to 4/1/21 @ 100) | | 9,710 | 10,335 |
| Series 2016 B, 5% 7/1/22 | | 2,950 | 3,273 |
| Series C, 5% 4/1/23 | | 17,445 | 19,805 |
| Massachusetts Health & Edl. Facilities Auth. Rev. (Partners HealthCare Sys., Inc. Proj.) Series 2009 I3: | | | |
| 5% 7/1/20 | | 7,285 | 7,305 |
| 5% 7/1/21 (Pre-Refunded to 7/1/19 @ 100) | | 4,565 | 4,565 |
|
| TOTAL MASSACHUSETTS | | | 134,872 |
|
| Michigan - 3.5% | | | |
| Clarkston Cmnty. Schools 5% 5/1/22 | | 2,800 | 3,078 |
| Detroit Downtown Dev. Auth. Tax: | | | |
| Series 2018 A, 5% 7/1/36 (FSA Insured) | | 1,000 | 1,112 |
| Series A, 5% 7/1/35 (FSA Insured) | | 1,200 | 1,337 |
| Detroit Swr. Disp. Rev. Series 2006 D, 3 month U.S. LIBOR + 0.600% 2.336% 7/1/32 (a)(e) | | 5,360 | 5,347 |
| Grand Rapids Pub. Schools: | | | |
| Series 2016: | | | |
| 5% 5/1/30 (FSA Insured) | | 3,400 | 4,058 |
| 5% 5/1/31 (FSA Insured) | | 4,855 | 5,766 |
| 5% 5/1/32 (FSA Insured) | | 730 | 864 |
| 5% 5/1/33 (FSA Insured) | | 3,030 | 3,580 |
| 5% 5/1/27 (FSA Insured) | | 1,310 | 1,624 |
| 5% 5/1/29 (FSA Insured) | | 1,890 | 2,317 |
| Kalamazoo Hosp. Fin. Auth. Hosp. Facilities Rev. Series 2016: | | | |
| 5% 5/15/27 | | 3,275 | 3,917 |
| 5% 5/15/28 | | 2,475 | 2,943 |
| Kent County Bldg. Auth. Series 2005, 5.5% 6/1/22 | | 3,310 | 3,688 |
| Kent Hosp. Fin. Auth. Hosp. Facilities Rev. (Spectrum Health Sys. Proj.) Series 2011 A: | | | |
| 5% 11/15/20 | | 970 | 1,017 |
| 5% 11/15/21 | | 630 | 680 |
| Lake Orion Cmnty. School District Series 2019, 5% 5/1/29 | | 1,685 | 2,157 |
| Michigan Bldg. Auth. Rev. (Facilities Prog.) Series 2016 I: | | | |
| 5% 10/15/34 | | 16,710 | 19,878 |
| 5% 4/15/35 | | 2,720 | 3,231 |
| Michigan Fin. Auth. Rev.: | | | |
| (Trinity Health Proj.) Series 2017: | | | |
| 5% 12/1/23 | | 1,455 | 1,677 |
| 5% 12/1/24 | | 1,700 | 2,012 |
| 5% 12/1/25 | | 2,915 | 3,528 |
| 5% 12/1/26 | | 1,270 | 1,569 |
| 5% 12/1/27 | | 1,215 | 1,528 |
| 5% 12/1/28 | | 1,940 | 2,428 |
| Bonds Series 2019 MI2, 5%, tender 2/1/25 (a) | | 10,655 | 12,468 |
| Series 2012 A: | | | |
| 5% 6/1/21 (Escrowed to Maturity) | | 1,495 | 1,595 |
| 5% 6/1/27 (Pre-Refunded to 6/1/22 @ 100) | | 2,235 | 2,466 |
| 5% 6/1/39 (Pre-Refunded to 6/1/22 @ 100) | | 4,790 | 5,285 |
| Series 2012: | | | |
| 5% 11/15/36 | | 6,895 | 7,512 |
| 5% 11/15/42 | | 1,515 | 1,636 |
| Series 2013: | | | |
| 5% 8/15/28 | | 5,425 | 6,116 |
| 5% 8/15/29 | | 1,940 | 2,184 |
| Series 2015 D1: | | | |
| 5% 7/1/27 | | 415 | 490 |
| 5% 7/1/29 | | 970 | 1,138 |
| 5% 7/1/31 | | 1,165 | 1,355 |
| 5% 7/1/32 | | 970 | 1,127 |
| 5% 7/1/33 | | 825 | 958 |
| Series 2019 A, 5% 11/15/48 | | 2,955 | 3,512 |
| Michigan Gen. Oblig. Series 2016, 5% 3/15/27 | | 3,230 | 4,000 |
| Michigan Hosp. Fin. Auth. Rev.: | | | |
| (Trinity Health Proj.) Series 2008 C: | | | |
| 5% 12/1/24 | | 1,455 | 1,722 |
| 5% 12/1/25 | | 1,260 | 1,525 |
| 5% 12/1/26 | | 1,940 | 2,396 |
| 5% 12/1/27 | | 1,295 | 1,628 |
| (Trinity Health Proj.) Series 2008 C, 5% 12/1/28 | | 2,040 | 2,554 |
| Bonds: | | | |
| (Ascension Health Cr. Group Proj.) Series F5, 2.4%, tender 3/15/23 (a) | | 6,020 | 6,147 |
| Series 2010 F3, 4%, tender 7/1/24 (a) | | 23,785 | 26,438 |
| Michigan Strategic Fund Ltd. Oblig. Rev. Bonds: | | | |
| Series 2008 ET2, 1.45%, tender 9/1/21 (a) | | 9,710 | 9,671 |
| Series CC, 1.45%, tender 9/1/21 (a) | | 1,130 | 1,126 |
| Michigan Trunk Line Fund Rev. Series 2005, 5.5% 11/1/20 (FSA Insured) | | 9,455 | 9,980 |
| Portage Pub. Schools Series 2016: | | | |
| 5% 11/1/27 | | 1,215 | 1,473 |
| 5% 11/1/29 | | 3,080 | 3,710 |
| Royal Oak Hosp. Fin. Auth. Hosp. Rev. Series 2014 D: | | | |
| 5% 9/1/22 | | 970 | 1,076 |
| 5% 9/1/24 | | 1,940 | 2,231 |
| Utica Cmnty. Schools Series 2019: | | | |
| 5% 5/1/30 | | 1,650 | 2,077 |
| 5% 5/1/31 | | 1,400 | 1,750 |
| 5% 5/1/32 | | 2,300 | 2,863 |
| 5% 5/1/33 | | 1,875 | 2,324 |
| 5% 5/1/34 | | 2,450 | 3,017 |
| Warren Consolidated School District Series 2016: | | | |
| 5% 5/1/30 | | 4,415 | 5,211 |
| 5% 5/1/31 | | 4,660 | 5,473 |
| 5% 5/1/32 | | 4,955 | 5,801 |
| Wayne County Arpt. Auth. Rev.: | | | |
| Series 2017 A: | | | |
| 5% 12/1/21 | | 460 | 501 |
| 5% 12/1/29 | | 245 | 305 |
| 5% 12/1/30 | | 380 | 470 |
| 5% 12/1/31 | | 390 | 479 |
| 5% 12/1/36 | | 535 | 646 |
| Series 2017 B: | | | |
| 5% 12/1/29 (c) | | 685 | 837 |
| 5% 12/1/30 (c) | | 485 | 589 |
| 5% 12/1/31 (c) | | 525 | 635 |
| 5% 12/1/33 (c) | | 375 | 451 |
| 5% 12/1/36 (c) | | 810 | 964 |
| Series 2017 C: | | | |
| 5% 12/1/22 | | 1,940 | 2,180 |
| 5% 12/1/23 | | 2,185 | 2,524 |
| 5% 12/1/24 | | 2,305 | 2,729 |
| 5% 12/1/25 | | 1,940 | 2,355 |
| 5% 12/1/26 | | 1,455 | 1,803 |
| 5% 12/1/27 | | 1,460 | 1,842 |
|
| TOTAL MICHIGAN | | | 250,681 |
|
| Minnesota - 0.2% | | | |
| Maple Grove Health Care Sys. Rev. Series 2015, 5% 9/1/26 | | 1,940 | 2,289 |
| Minnesota Agric. & Econ. Dev. Board Rev. (Essentia Health Obligated Group Proj.) Series 2008 C1: | | | |
| 5% 2/15/21 (Assured Guaranty Corp. Insured) | | 4,045 | 4,135 |
| 5% 2/15/22 (Assured Guaranty Corp. Insured) | | 5,475 | 5,598 |
| Northern Muni. Pwr. Agcy. Elec. Sys. Rev. Series 2010 A1, 5% 1/1/20 | | 4,370 | 4,449 |
| Saint Paul Hsg. & Redev. Auth. Hosp. Rev. (HealthEast Care Sys. Proj.) Series 2015 A, 5% 11/15/40 (Pre-Refunded to 11/15/25 @ 100) | | 1,410 | 1,703 |
|
| TOTAL MINNESOTA | | | 18,174 |
|
| Mississippi - 0.1% | | | |
| Mississippi Gen. Oblig. Series 2017 A, 5% 10/1/30 | | 5,340 | 6,619 |
| Missouri - 0.5% | | | |
| Cape Girardeau County Indl. Dev. Auth.: | | | |
| (South Eastern Health Proj.) Series 2017 A, 5% 3/1/27 | | 970 | 1,141 |
| (Southeast Hosp. Proj.) Series 2017 A, 5% 3/1/36 | | 1,215 | 1,374 |
| Kansas City Santn Swr. Sys. R Series 2018 B: | | | |
| 5% 1/1/24 | | 660 | 764 |
| 5% 1/1/29 | | 550 | 690 |
| 5% 1/1/31 | | 415 | 515 |
| 5% 1/1/34 | | 380 | 466 |
| Missouri Dev. Fin. Board Infrastructure Facilities Rev. (City of Branson-Branson Landing Proj.) Series 2005 A, 6% 6/1/20 | | 200 | 208 |
| Missouri Envir. Impt. & Energy Resources Auth. Wtr. Poll. Cont.& Drinking Wtr. Rev. 5.125% 1/1/20 | | 360 | 361 |
| Missouri Health & Edl. Facilities Auth. Edl. Facilities Rev. Series 2015 B: | | | |
| 4% 2/1/40 | | 680 | 718 |
| 5% 2/1/30 | | 2,395 | 2,808 |
| 5% 2/1/32 | | 2,645 | 3,073 |
| 5% 2/1/36 | | 2,145 | 2,457 |
| 5% 2/1/45 | | 3,495 | 3,946 |
| Missouri Health & Edl. Facilities Rev. Series 2016: | | | |
| 5% 5/15/29 | | 970 | 1,158 |
| 5% 5/15/30 | | 970 | 1,150 |
| 5% 5/15/31 | | 970 | 1,143 |
| 5% 5/15/36 | | 2,915 | 3,368 |
| Missouri Hsg. Dev. Commission Single Family Mtg. Rev. Series 2019, 4% 5/1/50 (b) | | 1,350 | 1,481 |
| Saint Louis Arpt. Rev. Series 2019 C, 5% 7/1/30 | | 3,660 | 4,638 |
| Saint Louis County Indl. Dev. Auth. Sr. Living Facilities Rev. Series 2018 A: | | | |
| 5% 9/1/38 | | 1,800 | 2,006 |
| 5.125% 9/1/48 | | 3,170 | 3,530 |
|
| TOTAL MISSOURI | | | 36,995 |
|
| Montana - 0.2% | | | |
| Montana Board Hsg. Single Family Series 2019 B, 4% 6/1/50 (b) | | 660 | 732 |
| Montana Facility Fin. Auth. Rev. Series 2016: | | | |
| 5% 2/15/21 | | 1,215 | 1,284 |
| 5% 2/15/22 | | 1,260 | 1,371 |
| 5% 2/15/23 | | 1,990 | 2,224 |
| 5% 2/15/24 | | 2,080 | 2,382 |
| 5% 2/15/25 | | 1,940 | 2,274 |
| 5% 2/15/26 | | 3,105 | 3,705 |
|
| TOTAL MONTANA | | | 13,972 |
|
| Nebraska - 0.3% | | | |
| Nebraska Invt. Fin. Auth. Single Family Hsg. Rev. Series 2019 B, 4% 9/1/49 (c) | | 3,725 | 4,011 |
| Nebraska Pub. Pwr. District Rev. Series 2016 B: | | | |
| 5% 1/1/31 | | 3,885 | 4,617 |
| 5% 1/1/34 | | 4,235 | 4,988 |
| 5% 1/1/36 | | 5,135 | 6,006 |
|
| TOTAL NEBRASKA | | | 19,622 |
|
| Nevada - 1.3% | | | |
| Carson City Hosp. Rev. (Carson Tahoe Hosp. Proj.): | | | |
| Series 2017 5% 9/1/32 | | 725 | 841 |
| Series 2017: | | | |
| 5% 9/1/24 | | 730 | 834 |
| 5% 9/1/28 | | 445 | 532 |
| 5% 9/1/30 | | 730 | 860 |
| 5% 9/1/34 | | 740 | 854 |
| Clark County Arpt. Rev.: | | | |
| Series 2017 C, 5% 7/1/21 (c) | | 9,460 | 10,113 |
| Series 2019 A: | | | |
| 5% 7/1/23 (b) | | 8,335 | 9,523 |
| 5% 7/1/26 (b) | | 2,965 | 3,638 |
| Clark County Poll. Cont. Rev. Bonds Series 2010, 1.875%, tender 4/1/20 (a) | | 11,655 | 11,626 |
| Clark County School District: | | | |
| Series 2016 A: | | | |
| 5% 6/15/21 | | 2,575 | 2,754 |
| 5% 6/15/23 | | 2,250 | 2,549 |
| Series 2017 A: | | | |
| 5% 6/15/25 | | 5,770 | 6,846 |
| 5% 6/15/26 | | 5,000 | 6,066 |
| Series 2018 B, 5% 6/15/35 | | 8,000 | 9,667 |
| Las Vegas Valley Wtr. District Wtr. Impt. Gen. Oblig.: | | | |
| Series 2012 B: | | | |
| 5% 6/1/22 | | 970 | 1,072 |
| 5% 6/1/23 | | 1,940 | 2,144 |
| 5% 6/1/24 | | 1,940 | 2,144 |
| 5% 6/1/25 | | 1,020 | 1,126 |
| Series 2016 A: | | | |
| 5% 6/1/32 | | 2,815 | 3,370 |
| 5% 6/1/33 | | 4,855 | 5,794 |
| 5% 6/1/34 | | 5,145 | 6,117 |
| Nevada Gen. Oblig.: | | | |
| Series 2012 B, 5% 8/1/21 | | 1,355 | 1,458 |
| Series 2013 D1, 5% 3/1/25 | | 2,745 | 3,099 |
|
| TOTAL NEVADA | | | 93,027 |
|
| New Hampshire - 0.7% | | | |
| Nat'l. Fin. Auth. Solid Bonds (Waste Mgmt., Inc. Proj.): | | | |
| Series 2019 A1, 2.15%, tender 7/1/24 (a)(c) | | 1,500 | 1,509 |
| Series 2019 A2, 2.15%, tender 7/1/24 (a)(c) | | 2,955 | 2,974 |
| Series 2019 A3, 2.15%, tender 7/1/24 (a)(c) | | 2,145 | 2,159 |
| New Hampshire Health & Ed. Facilities Auth.: | | | |
| (Partners Healthcare Sys., Inc. Proj.) Series 2017: | | | |
| 5% 7/1/24 | | 1,335 | 1,564 |
| 5% 7/1/30 | | 2,360 | 2,941 |
| Series 2017 B, 4.125% 7/1/24 (d) | | 1,755 | 1,757 |
| Series 2017 C, 3.5% 7/1/22 (d) | | 580 | 581 |
| Series 2017, 5% 7/1/36 | | 2,105 | 2,438 |
| New Hampshire Health & Ed. Facilities Auth. Rev.: | | | |
| Series 2012: | | | |
| 4% 7/1/22 | | 1,310 | 1,398 |
| 5% 7/1/26 | | 1,245 | 1,361 |
| Series 2013 A, 5% 10/1/43 | | 2,360 | 2,552 |
| Series 2016: | | | |
| 4% 10/1/38 | | 800 | 852 |
| 5% 10/1/26 | | 4,560 | 5,503 |
| 5% 10/1/27 | | 4,860 | 5,819 |
| 5% 10/1/28 | | 1,940 | 2,312 |
| 5% 10/1/30 | | 7,070 | 8,315 |
| New Hampshire Tpk. Sys. Rev. Series 2012 B: | | | |
| 5% 2/1/22 | | 2,185 | 2,383 |
| 5% 2/1/23 | | 2,150 | 2,341 |
| 5% 2/1/24 | | 1,725 | 1,877 |
|
| TOTAL NEW HAMPSHIRE | | | 50,636 |
|
| New Jersey - 3.6% | | | |
| Bayonne Gen. Oblig. Series 2016: | | | |
| 5% 7/1/31 (Build America Mutual Assurance Insured) | | 1,430 | 1,689 |
| 5% 7/1/32 (Build America Mutual Assurance Insured) | | 970 | 1,142 |
| 5% 7/1/33 (Build America Mutual Assurance Insured) | | 970 | 1,139 |
| Camden County Impt. Auth. Health Care Redev. Rev. Series 2014 A: | | | |
| 5% 2/15/24 | | 1,940 | 2,209 |
| 5% 2/15/25 | | 970 | 1,101 |
| New Jersey Econ. Dev. Auth. Rev.: | | | |
| (Provident Montclair Proj.) Series 2017: | | | |
| 5% 6/1/25 (FSA Insured) | | 975 | 1,146 |
| 5% 6/1/27 (FSA Insured) | | 1,360 | 1,656 |
| 5% 6/1/28 (FSA Insured) | | 1,940 | 2,347 |
| 5% 6/1/29 (FSA Insured) | | 1,455 | 1,747 |
| Series 2012 II, 5% 3/1/21 | | 7,380 | 7,744 |
| Series 2013 I, 5.5% 9/1/19 (Escrowed to Maturity) | | 4,260 | 4,288 |
| Series 2013: | | | |
| 5% 3/1/23 | | 9,030 | 9,986 |
| 5% 3/1/24 | | 12,430 | 13,720 |
| 5% 3/1/25 | | 1,360 | 1,492 |
| Series 2015 XX, 5% 6/15/26 | | 19,420 | 22,144 |
| Series 2018 EEE, 5% 6/15/30 | | 2,170 | 2,572 |
| New Jersey Econ. Dev. Auth. Spl. Facilities Rev. (Port Newark Container Term. LLC. Proj.): | | | |
| Series 2017: | | | |
| 5% 10/1/24 (c) | | 2,000 | 2,254 |
| 5% 10/1/25 (c) | | 2,750 | 3,144 |
| Series 2017, 5% 10/1/37 (c) | | 6,230 | 6,943 |
| New Jersey Edl. Facility Series 2016 A, 5% 7/1/29 | | 1,820 | 2,143 |
| New Jersey Gen. Oblig. Series Q, 5% 8/15/19 | | 3,690 | 3,706 |
| New Jersey Health Care Facilities Fing. Auth. Rev.: | | | |
| Series 2016 A: | | | |
| 5% 7/1/21 | | 285 | 303 |
| 5% 7/1/22 | | 770 | 843 |
| 5% 7/1/23 | | 2,940 | 3,294 |
| 5% 7/1/24 | | 790 | 904 |
| 5% 7/1/25 | | 855 | 996 |
| 5% 7/1/26 | | 285 | 338 |
| 5% 7/1/27 | | 425 | 502 |
| 5% 7/1/28 | | 1,185 | 1,394 |
| 5% 7/1/28 | | 1,265 | 1,488 |
| 5% 7/1/28 | | 440 | 534 |
| 5% 7/1/33 | | 1,465 | 1,745 |
| Series 2016, 5% 7/1/41 | | 3,665 | 4,120 |
| New Jersey Higher Ed. Student Assistance Auth. Student Ln. Rev.: | | | |
| Series 2017 1A: | | | |
| 5% 12/1/22 (c) | | 1,285 | 1,419 |
| 5% 12/1/24 (c) | | 3,400 | 3,926 |
| Series 2017 1B, 5% 12/1/21 (c) | | 1,365 | 1,469 |
| Series 2019 A: | | | |
| 5% 12/1/21 | | 1,070 | 1,160 |
| 5% 12/1/22 | | 1,520 | 1,697 |
| 5% 12/1/23 | | 1,810 | 2,075 |
| 5% 12/1/24 | | 1,045 | 1,226 |
| 5% 12/1/25 | | 1,925 | 2,307 |
| New Jersey Tpk. Auth. Tpk. Rev.: | | | |
| Bonds Series 2017 C5, 1 month U.S. LIBOR + 0.460% 2.168%, tender 1/1/21 (a)(e) | | 18,725 | 18,747 |
| Series 2017 C1, 1 month U.S. LIBOR + 0.340% 2.048% 1/1/21 (a)(e) | | 2,090 | 2,091 |
| New Jersey Trans. Trust Fund Auth.: | | | |
| (Trans. Prog.) Series 2019 AA: | | | |
| 5% 6/15/30 | | 3,500 | 4,161 |
| 5% 6/15/31 | | 2,250 | 2,656 |
| 5% 6/15/32 | | 5,660 | 6,646 |
| Series 2003 B. 5.25% 12/15/19 | | 2,945 | 2,994 |
| Series 2008 A, 0% 12/15/35 | | 5,345 | 3,018 |
| Series 2010 A: | | | |
| 0% 12/15/27 | | 13,270 | 10,346 |
| 0% 12/15/28 | | 3,025 | 2,266 |
| Series 2012 AA: | | | |
| 5% 6/15/23 | | 7,285 | 7,920 |
| 5% 6/15/24 | | 11,655 | 12,658 |
| Series 2014 AA: | | | |
| 5% 6/15/25 | | 12,140 | 13,701 |
| 5% 6/15/26 | | 7,285 | 8,189 |
| Series 2016 A, 5% 6/15/27 | | 14,620 | 17,327 |
| Series 2018 A: | | | |
| 5% 12/15/33 | | 6,395 | 7,464 |
| 5% 12/15/34 | | 5,070 | 5,890 |
| 5% 12/15/35 | | 6,130 | 7,081 |
|
| TOTAL NEW JERSEY | | | 259,207 |
|
| New Mexico - 0.2% | | | |
| Farmington Poll. Cont. Rev. Bonds (Southern California Edison Co. Four Corners Proj.) Series 2005 A, 1.875%, tender 4/1/20 (a) | | 11,470 | 11,441 |
| New York - 4.2% | | | |
| Dorm. Auth. New York Univ. Rev. Series 2016 A: | | | |
| 5% 7/1/23 | | 1,090 | 1,235 |
| 5% 7/1/25 | | 2,430 | 2,889 |
| Dutchess County Local Dev. Corp. Rev. (Health Quest Systems, Inc. Proj.) Series 2010 A: | | | |
| 5% 7/1/20 (Assured Guaranty Corp. Insured) (FSA Insured) | | 1,040 | 1,079 |
| 5.75% 7/1/40 | | 970 | 1,014 |
| Hudson Yards Infrastructure Corp. New York Rev. Series 2017 A: | | | |
| 5% 2/15/32 | | 3,885 | 4,771 |
| 5% 2/15/35 | | 7,285 | 8,795 |
| Long Island Pwr. Auth. Elec. Sys. Rev. Series 2016 B: | | | |
| 5% 9/1/22 | | 1,940 | 2,161 |
| 5% 9/1/23 | | 1,455 | 1,668 |
| 5% 9/1/24 | | 1,310 | 1,543 |
| MTA Hudson Rail Yards Trust Oblig. Series 2016 A: | | | |
| 5% 11/15/51 | | 12,380 | 13,151 |
| 5% 11/15/56 | | 11,925 | 13,108 |
| New York City Gen. Oblig.: | | | |
| Series 2014 J, 5% 8/1/22 | | 2,990 | 3,324 |
| Series 2015 A, 5% 8/1/22 | | 1,985 | 2,207 |
| Series 2015 C, 5% 8/1/27 | | 2,965 | 3,514 |
| Series 2016 A, 5% 8/1/22 | | 4,390 | 4,880 |
| New York City Transitional Fin. Auth. Rev.: | | | |
| Series 2003 B: | | | |
| 4% 2/1/21 | | 4,855 | 5,064 |
| 5% 2/1/21 | | 3,410 | 3,610 |
| Series 2012 A, 5% 11/1/21 | | 5,300 | 5,759 |
| Series 2018 C2, 5% 5/1/32 | | 9,175 | 11,421 |
| Series 2019 A, 5% 8/1/35 | | 7,520 | 9,231 |
| Series 2019 B1: | | | |
| 5% 8/1/34 | | 3,300 | 4,074 |
| 5% 8/1/35 | | 8,400 | 10,312 |
| Series B: | | | |
| 5% 11/1/20 | | 25,825 | 26,144 |
| 5% 11/1/20 (Pre-Refunded to 11/1/19 @ 100) | | 10,295 | 10,423 |
| New York Dorm. Auth. Mental Health Svcs. Facilities Impt. Rev. Series 2012 A, 5% 5/15/23 | | 12,970 | 14,342 |
| New York Dorm. Auth. Personal Income Tax Rev.: | | | |
| Series 2010 A, 5% 2/15/20 (Escrowed to Maturity) | | 5 | 5 |
| Series 2016 B, 5% 2/15/20 | | 10 | 10 |
| New York Dorm. Auth. Revs. Series 2009 A: | | | |
| 5% 7/1/20 | | 4,855 | 4,866 |
| 5% 7/1/21 | | 11,980 | 12,006 |
| New York Dorm. Auth. Sales Tax Rev. Series 2018 C, 5% 3/15/32 | | 13,810 | 17,291 |
| New York Metropolitan Trans. Auth. Rev.: | | | |
| Bonds Series 2018 A, 5%, tender 11/15/20 (a) | | 25,820 | 27,004 |
| Series 2003 B, 5.25% 11/15/19 (Nat'l. Pub. Fin. Guarantee Corp. Insured) | | 7,660 | 7,771 |
| Series 2017 C-2, 0% 11/15/33 | | 9,795 | 6,564 |
| New York State Dorm. Auth. Series 2, 5% 2/15/20 | | 2,900 | 2,967 |
| New York Thruway Auth. Second Gen. Hwy. & Bridge Trust Fund: | | | |
| Series 2010 A, 5% 4/1/23 (Pre-Refunded to 4/1/20 @ 100) | | 7,960 | 8,189 |
| Series 2011 A1, 5% 4/1/20 | | 2,155 | 2,216 |
| Series 2011 A2, 5% 4/1/21 | | 1,940 | 2,067 |
| New York Trans. Dev. Corp.: | | | |
| (Laguardia Arpt. Term. Redev. Proj.) Series 2016 A, 5% 7/1/41 (c) | | 8,155 | 8,978 |
| Series 2016 A, 5.25% 1/1/50 (c) | | 13,305 | 14,734 |
| New York Urban Dev. Corp. Rev.: | | | |
| Gen. Oblig. (New York State Gen. Oblig. Proj.) Series 2017 A, 5% 3/15/32 | | 2,745 | 3,350 |
| Series 2011 A, 5% 3/15/22 | | 7,385 | 7,852 |
| Series 2017 A, 5% 3/15/22 | | 2,215 | 2,434 |
| Triborough Bridge & Tunnel Auth. Revs. Series 2013 A: | | | |
| 5% 11/15/23 | | 2,915 | 3,384 |
| 5% 11/15/24 | | 3,885 | 4,490 |
|
| TOTAL NEW YORK | | | 301,897 |
|
| North Carolina - 1.0% | | | |
| Nash Health Care Sys. Health Care Facilities Rev. Series 2012, 5% 11/1/41 | | 3,340 | 3,541 |
| North Carolina Cap. Facilities Fin. Agcy. Rev. Bonds (Republic Svcs., Inc. Proj.) Series 2013, 1.75%, tender 9/16/19 (a)(c) | | 4,890 | 4,890 |
| North Carolina Grant Anticipation Rev. Series 2017: | | | |
| 5% 3/1/22 | | 11,015 | 12,074 |
| 5% 3/1/23 | | 9,715 | 10,979 |
| North Carolina Med. Care Commission Health Care Facilities Rev. Bonds: | | | |
| Series 2019 B, 2.2%, tender 12/1/22 (a) | | 9,865 | 9,972 |
| Series 2019 C, 2.55%, tender 6/1/26 (a) | | 17,085 | 17,452 |
| North Carolina Med. Care Commission Hosp. Rev. (North Carolina Baptist Hosp. Proj.) Series 2010: | | | |
| 5% 6/1/21 | | 5,825 | 6,016 |
| 5% 6/1/22 | | 3,885 | 4,011 |
| North Carolina Muni. Pwr. Agcy. #1 Catawba Elec. Rev. Series 2009 A, 5% 1/1/30 | | 475 | 476 |
|
| TOTAL NORTH CAROLINA | | | 69,411 |
|
| Ohio - 1.8% | | | |
| Allen County Hosp. Facilities Rev. Bonds (Mercy Health) Series 2017 B, 5%, tender 5/5/22 (a) | | 2,670 | 2,926 |
| American Muni. Pwr., Inc. Rev.: | | | |
| (Amp Freemont Energy Ctr. Proj.): | | | |
| Series 2012 B: | | | |
| 5% 2/15/22 | | 1,945 | 2,126 |
| 5% 2/15/23 (Pre-Refunded to 2/15/22 @ 100) | | 2,110 | 2,306 |
| Series 2012: | | | |
| 5% 2/15/21 | | 1,455 | 1,539 |
| 5% 2/15/24 (Pre-Refunded to 2/15/22 @ 100) | | 1,940 | 2,121 |
| Bonds Series 2019 A, 2.3%, tender 2/15/22 (a) | | 12,100 | 12,283 |
| Series 2012 B: | | | |
| 5% 2/15/42 | | 1,365 | 1,466 |
| 5% 2/15/42 (Pre-Refunded to 2/15/22 @ 100) | | 390 | 426 |
| Series 2017 A, 5% 2/15/36 | | 5,000 | 5,937 |
| Cleveland Arpt. Sys. Rev. Series 2016 A: | | | |
| 5% 1/1/26 (FSA Insured) | | 970 | 1,137 |
| 5% 1/1/28 (FSA Insured) | | 1,480 | 1,724 |
| 5% 1/1/29 (FSA Insured) | | 2,165 | 2,512 |
| 5% 1/1/30 (FSA Insured) | | 1,940 | 2,244 |
| Cleveland Wtr. Rev. Series 2012 A: | | | |
| 5% 1/1/26 (Pre-Refunded to 1/1/22 @ 100) | | 1,215 | 1,324 |
| 5% 1/1/27 (Pre-Refunded to 1/1/22 @ 100) | | 1,455 | 1,586 |
| Columbus City School District 5% 12/1/32 | | 1,770 | 2,116 |
| Fairfield County Hosp. Facilities Rev. (Fairfield Med. Ctr. Proj.) Series 2013: | | | |
| 5% 6/15/25 | | 2,395 | 2,625 |
| 5% 6/15/26 | | 2,515 | 2,747 |
| 5% 6/15/27 | | 2,640 | 2,872 |
| 5% 6/15/28 | | 2,770 | 3,003 |
| Franklin County Hosp. Facilities Rev. Series 2016 C: | | | |
| 5% 11/1/25 | | 1,940 | 2,338 |
| 5% 11/1/26 | | 2,040 | 2,511 |
| Lake County Hosp. Facilities Rev. Series 2015, 5% 8/15/27 | | 2,195 | 2,556 |
| Lancaster Port Auth. Gas Rev. Bonds Series 2019, 5%, tender 2/1/25 (a) | | 13,270 | 15,442 |
| Lucas County Hosp. Rev. (ProMedica Healthcare Oblig. Group Proj.) Series 2011 A, 6.5% 11/15/37 (Pre-Refunded to 11/15/21 @ 100) | | 4,465 | 4,996 |
| Miami County Hosp. Facilities Rev. (Kettering Health Network Obligated Group Proj.) Series 2019: | | | |
| 5% 8/1/31 | | 1,000 | 1,215 |
| 5% 8/1/32 | | 1,000 | 1,208 |
| 5% 8/1/33 | | 1,000 | 1,203 |
| Muskingum County Hosp. Facilities: | | | |
| (Genesis Healthcare Sys. Obligated Group Proj.) Series 2013, 5% 2/15/27 | | 5,715 | 6,233 |
| Series 2013, 5% 2/15/20 | | 1,160 | 1,179 |
| Ohio Bldg. Auth.: | | | |
| (Administrative Bldg. Fund Proj.) Series 2009 B, 5% 10/1/21 | | 3,010 | 3,037 |
| (Adult Correctional Bldg. Fund Proj.) Series 2009 B: | | | |
| 5% 10/1/21 | | 4,835 | 4,879 |
| 5% 10/1/22 | | 1,940 | 1,958 |
| 5% 10/1/23 | | 2,915 | 2,941 |
| Ohio Higher Edl. Facility Commission Rev. (Univ. Hosp. Health Sys. Proj.) Series 2010 A, 5.25% 1/15/21 | | 4,650 | 4,745 |
| Ohio Hosp. Facilities Rev. Series 2017 A: | | | |
| 5% 1/1/27 | | 2,470 | 3,060 |
| 5% 1/1/29 | | 4,855 | 6,103 |
| Ohio Hsg. Fin. Agcy. Residential Mtg. Rev. (Mtg. Backed Securities Prog.) Series 2019 B, 4.5% 3/1/50 (b) | | 960 | 1,075 |
| Ohio Tpk. Commission Tpk. Rev. (Infrastructure Proj.) Series 2005 A, 0% 2/15/42 | | 11,265 | 5,503 |
| Scioto County Hosp. Facilities Rev. Series 2016, 5% 2/15/29 | | 2,250 | 2,640 |
| Wood County Hosp. Facilities Rev. (Wood County Hosp. Assoc. Proj.) Series 2012: | | | |
| 5% 12/1/32 | | 690 | 729 |
| 5% 12/1/42 | | 875 | 914 |
|
| TOTAL OHIO | | | 131,485 |
|
| Oklahoma - 0.8% | | | |
| Canadian Cny Edl. Facilities Auth. (Mustang Pub. Schools Proj.) Series 2017, 5% 9/1/26 | | 2,015 | 2,458 |
| Grand River Dam Auth. Rev. Series 2014 A: | | | |
| 5% 6/1/27 | | 1,165 | 1,354 |
| 5% 6/1/28 | | 1,455 | 1,688 |
| Oklahoma City Pub. Property Auth. Hotel Tax Rev. Series 2015: | | | |
| 5% 10/1/25 | | 1,020 | 1,221 |
| 5% 10/1/26 | | 1,455 | 1,731 |
| 5% 10/1/27 | | 1,155 | 1,371 |
| Oklahoma Dev. Fin. Auth. Health Sys. Rev. (OU Medicine Proj.) Series 2018 B: | | | |
| 5% 8/15/27 | | 970 | 1,163 |
| 5% 8/15/28 | | 970 | 1,180 |
| 5% 8/15/29 | | 410 | 496 |
| 5% 8/15/33 | | 1,070 | 1,269 |
| Oklahoma Dev. Fin. Auth. Rev. (Saint John Health Sys. Proj.) Series 2012: | | | |
| 5% 2/15/23 (Pre-Refunded to 2/15/22 @ 100) | | 3,010 | 3,290 |
| 5% 2/15/42 (Pre-Refunded to 2/15/22 @ 100) | | 6,975 | 7,624 |
| Oklahoma Pwr. Auth. Pwr. Supply Sys. Rev.: | | | |
| Series 2010 A: | | | |
| 5% 1/1/21 (FSA Insured) | | 3,885 | 3,956 |
| 5% 1/1/22 (FSA Insured) | | 12,095 | 12,306 |
| Series 2014 A: | | | |
| 5% 1/1/26 | | 1,650 | 1,930 |
| 5% 1/1/27 | | 5,825 | 6,795 |
| 5% 1/1/28 | | 1,940 | 2,259 |
| 5% 1/1/29 | | 1,525 | 1,773 |
| Series 2014 B, 5% 1/1/27 | | 2,085 | 2,432 |
|
| TOTAL OKLAHOMA | | | 56,296 |
|
| Oregon - 0.1% | | | |
| Clackamas County Hosp. Facility Auth. (Willamette View Proj.) Series 2017 B, 3% 11/15/22 | | 735 | 737 |
| Oregon Facilities Auth. Rev. (Legacy Health Proj.) Series 2016 A, 5% 6/1/22 | | 900 | 991 |
| Washington, Multnomah & Yamhill County School District #1J Series 2017, 5% 6/15/30 | | 2,915 | 3,601 |
|
| TOTAL OREGON | | | 5,329 |
|
| Pennsylvania - 3.9% | | | |
| Allegheny County Hosp. Dev. Auth. Rev. Series 2019 A: | | | |
| 5% 7/15/21 | | 1,515 | 1,623 |
| 5% 7/15/22 | | 1,715 | 1,895 |
| 5% 7/15/23 | | 765 | 870 |
| 5% 7/15/24 | | 2,300 | 2,687 |
| 5% 7/15/25 | | 3,030 | 3,621 |
| Erie County Hosp. Auth. Rev. (Saint Vincent Health Ctr. Proj.) Series 2010 A, 7% 7/1/27 (Pre-Refunded to 7/1/20 @ 100) | | 7,350 | 7,756 |
| Lehigh County Indl. Dev. Auth. Poll. Cont. Rev. Bonds: | | | |
| (PPL Elec. Utils. Corp. Proj.) Series 2016 A, 1.8%, tender 9/1/22 (a) | | 4,210 | 4,214 |
| Series B, 1.8%, tender 8/15/22 (a) | | 10,600 | 10,664 |
| Monroeville Fin. Auth. UPMC Rev. Series 2012, 5% 2/15/26 | | 3,205 | 3,878 |
| Montgomery County Higher Ed. & Health Auth. Hosp. Rev. (Abington Memorial Hosp. Proj.) Series 1993 A, 6% 6/1/22 (AMBAC Insured) | | 3,815 | 4,208 |
| Montgomery County Higher Ed. & Health Auth. Rev.: | | | |
| Series 2014 A, 5% 10/1/23 | | 330 | 364 |
| Series 2016 A: | | | |
| 5% 10/1/28 | | 1,385 | 1,585 |
| 5% 10/1/29 | | 1,495 | 1,701 |
| 5% 10/1/32 | | 4,670 | 5,237 |
| 5% 10/1/36 | | 7,560 | 8,382 |
| 5% 10/1/40 | | 3,490 | 3,838 |
| Series 2019: | | | |
| 5% 9/1/30 | | 1,250 | 1,553 |
| 5% 9/1/31 | | 2,500 | 3,092 |
| 5% 9/1/33 | | 1,370 | 1,678 |
| Northampton County Gen. Purp. Auth. Hosp. Rev. (St. Luke's Univ. Health Network Proj.) Series 2018 A, 4% 8/15/48 | | 2,485 | 2,610 |
| Pennsylvania Econ. Dev. Auth. Governmental Lease (Forum Place Proj.) Series 2012: | | | |
| 5% 3/1/21 | | 3,025 | 3,190 |
| 5% 3/1/22 | | 1,940 | 2,108 |
| Pennsylvania Econ. Dev. Fing. Auth. Solid Waste Disp. Rev. Bonds: | | | |
| (Republic Svcs., Inc. Proj.): | | | |
| Series 2019 A, 1.95%, tender 7/15/19 (a)(c) | | 3,050 | 3,050 |
| Series 2019 B1, 1.95%, tender 7/15/19 (a)(c) | | 3,450 | 3,451 |
| (Waste Mgmt., Inc. Proj.) Series 2017 A, 1.7%, tender 8/3/20 (a)(c) | | 5,545 | 5,541 |
| Series 2011, 2.625%, tender 7/1/24 (a)(c) | | 5,015 | 5,015 |
| Pennsylvania Gen. Oblig.: | | | |
| Series 2011, 5% 7/1/21 | | 2,040 | 2,189 |
| Series 2013, 5% 10/15/27 | | 9,710 | 11,109 |
| Series 2014, 5% 7/1/23 | | 1,500 | 1,713 |
| Series 2015 1, 5% 3/15/31 | | 3,615 | 4,200 |
| Series 2016, 5% 9/15/29 | | 27,190 | 32,854 |
| Series 2017, 5% 1/1/27 | | 8,765 | 10,804 |
| Pennsylvania Higher Edl. Facilities Auth. Rev.: | | | |
| (Univ. of Penn Health Systems Proj.): | | | |
| Series 2017 A: | | | |
| 5% 8/15/28 | | 1,215 | 1,507 |
| 5% 8/15/30 | | 2,090 | 2,555 |
| Series 2017, 5% 8/15/27 | | 1,165 | 1,455 |
| (Univ. of Pennsylvania Health Sys. Proj.) Series 2009 A, 5.25% 8/15/21 (Pre-Refunded to 8/15/19 @ 100) | | 2,040 | 2,050 |
| Pennsylvania Pub. School Bldg. Auth. School Rev. (The School District of Harrisburg Proj.) Series 2016 A: | | | |
| 5% 12/1/28 (FSA Insured) | | 6,100 | 7,343 |
| 5% 12/1/33 (FSA Insured) | | 4,300 | 5,021 |
| Pennsylvania Tpk. Commission Tpk. Rev.: | | | |
| Series 2013 A2: | | | |
| 5% 12/1/28 | | 1,215 | 1,504 |
| 5% 12/1/33 | | 1,215 | 1,462 |
| Series 2017 A1: | | | |
| 5% 12/1/22 | | 485 | 543 |
| 5% 12/1/23 | | 535 | 616 |
| 5% 12/1/29 | | 1,455 | 1,798 |
| 5% 12/1/34 | | 970 | 1,169 |
| Philadelphia Arpt. Rev. Series 2017 B: | | | |
| 5% 7/1/30 (c) | | 1,720 | 2,063 |
| 5% 7/1/31 (c) | | 2,430 | 2,896 |
| Philadelphia Gas Works Rev. Series 15: | | | |
| 5% 8/1/23 | | 970 | 1,102 |
| 5% 8/1/24 | | 730 | 850 |
| 5% 8/1/25 | | 775 | 918 |
| Philadelphia Gen. Oblig.: | | | |
| Series 2015 B: | | | |
| 5% 8/1/27 | | 2,915 | 3,432 |
| 5% 8/1/29 | | 10,165 | 11,883 |
| 5% 8/1/30 | | 10,705 | 12,455 |
| 5% 8/1/31 | | 11,280 | 13,068 |
| Series 2019 A: | | | |
| 5% 8/1/21 | | 1,835 | 1,969 |
| 5% 8/1/22 | | 1,180 | 1,306 |
| 5% 8/1/23 | | 1,910 | 2,176 |
| 5% 8/1/24 | | 3,425 | 4,006 |
| 5% 8/1/26 | | 3,225 | 3,935 |
| Philadelphia School District Series 2010 C: | | | |
| 5% 9/1/20 | | 13,595 | 14,118 |
| 5% 9/1/21 | | 5,825 | 6,053 |
| Pittsburgh School District Series 2010 A: | | | |
| 5% 9/1/19 (FSA Insured) | | 1,455 | 1,464 |
| 5% 9/1/20 (FSA Insured) | | 970 | 1,011 |
| Pittsburgh Wtr. & Swr. Auth. Wtr. & Swr. Sys. Rev.: | | | |
| Series 2019 A, 5% 9/1/38 (FSA Insured) (b) | | 570 | 693 |
| Series 2019 B: | | | |
| 5% 9/1/31 (FSA Insured) (b) | | 1,855 | 2,362 |
| 5% 9/1/33 (FSA Insured) (b) | | 1,250 | 1,624 |
| Southcentral Pennsylvania Gen. Auth. Rev. Series 2019 A: | | | |
| 5% 6/1/38 | | 2,890 | 3,518 |
| 5% 6/1/39 | | 4,690 | 5,694 |
| State Pub. School Bldg. Auth. Lease Rev. (Philadelphia School District Proj.) Series 2015 A, 5% 6/1/26 | | 1,345 | 1,575 |
|
| TOTAL PENNSYLVANIA | | | 283,874 |
|
| Rhode Island - 0.5% | | | |
| Rhode Island Health & Edl. Bldg. Corp. Higher Ed. Facilities Rev.: | | | |
| Series 2016 B: | | | |
| 5% 9/1/31 | | 6,625 | 7,503 |
| 5% 9/1/36 | | 320 | 357 |
| Series 2016, 5% 5/15/39 | | 5,475 | 6,182 |
| Rhode Island Health & Edl. Bldg. Corp. Pub. Schools Rev. Series 2015, 5% 5/15/25 (FSA Insured) | | 7,985 | 9,427 |
| Rhode Island Hsg. & Mtg. Fin. Corp. Series 2019 70, 4% 10/1/49 | | 2,415 | 2,641 |
| Rhode Island Student Ln. Auth. Student Ln. Rev. Series A, 3.5% 12/1/34 (c) | | 3,540 | 3,672 |
| Tobacco Setlement Fing. Corp. Series 2015 A: | | | |
| 5% 6/1/27 | | 1,770 | 2,005 |
| 5% 6/1/28 | | 2,330 | 2,632 |
|
| TOTAL RHODE ISLAND | | | 34,419 |
|
| South Carolina - 1.6% | | | |
| Beaufort-Jasper Wtr. & Swr. Sys. Series 2016 B: | | | |
| 5% 3/1/22 | | 970 | 1,064 |
| 5% 3/1/24 | | 970 | 1,129 |
| 5% 3/1/25 | | 970 | 1,158 |
| Scago Edl. Facilities Corp. for Colleton School District (School District of Colleton County Proj.) Series 2015: | | | |
| 5% 12/1/27 | | 3,885 | 4,552 |
| 5% 12/1/29 | | 3,155 | 3,674 |
| South Carolina Hsg. Fin. & Dev. Auth. Mtg. Rev. Series 2019 A, 4% 1/1/50 (b) | | 3,625 | 4,001 |
| South Carolina Jobs-Econ. Dev. Auth.: | | | |
| (Anmed Health Proj.) Series 2016: | | | |
| 5% 2/1/22 | | 2,135 | 2,316 |
| 5% 2/1/24 | | 970 | 1,108 |
| 5% 2/1/26 | | 1,650 | 1,964 |
| (Anmed Heath Proj.) Series 2016, 5% 2/1/25 | | 1,700 | 1,985 |
| South Carolina Jobs-Econ. Dev. Auth. Econ. Dev. Rev. (Bon Secours Health Sys. Proj.) Series 2013, 5% 11/1/28 (Pre-Refunded to 11/1/22 @ 100) | | 3,100 | 3,470 |
| South Carolina Ports Auth. Ports Rev. Series 2018: | | | |
| 5% 7/1/28 (c) | | 2,235 | 2,796 |
| 5% 7/1/30 (c) | | 4,790 | 5,909 |
| South Carolina Pub. Svc. Auth. Rev.: | | | |
| Series 2013 E, 5.5% 12/1/53 | | 6,335 | 7,059 |
| Series 2014 A: | | | |
| 5% 12/1/49 | | 12,620 | 13,957 |
| 5.5% 12/1/54 | | 17,285 | 19,478 |
| Series 2014 C: | | | |
| 5% 12/1/25 | | 3,885 | 4,532 |
| 5% 12/1/26 | | 3,885 | 4,522 |
| 5% 12/1/27 | | 3,010 | 3,494 |
| 5% 12/1/46 | | 3,540 | 3,958 |
| Series 2016 B: | | | |
| 5% 12/1/35 | | 6,250 | 7,346 |
| 5% 12/1/36 | | 9,280 | 10,876 |
| South Carolina Trans. Infrastructure Bank Rev. Series 2016 A, 5% 10/1/25 | | 1,645 | 1,978 |
|
| TOTAL SOUTH CAROLINA | | | 112,326 |
|
| South Dakota - 0.1% | | | |
| South Dakota Health & Edl. Facilities Auth. Rev.: | | | |
| (Avera Health Proj.) Series 2017, 5% 7/1/23 | | 970 | 1,100 |
| Series 2014 B: | | | |
| 5% 11/1/24 | | 1,200 | 1,409 |
| 5% 11/1/25 | | 1,175 | 1,378 |
| 5% 11/1/26 | | 195 | 228 |
| Series 2017: | | | |
| 5% 7/1/24 | | 435 | 507 |
| 5% 7/1/27 | | 365 | 450 |
| 5% 7/1/33 | | 1,700 | 2,021 |
| 5% 7/1/35 | | 1,360 | 1,601 |
|
| TOTAL SOUTH DAKOTA | | | 8,694 |
|
| Tennessee - 0.9% | | | |
| Greeneville Health & Edl. Facilities Board Series 2018 A: | | | |
| 5% 7/1/29 | | 970 | 1,191 |
| 5% 7/1/30 | | 1,165 | 1,418 |
| Knox County Health Edl. & Hsg. Facilities Board Rev.: | | | |
| Series 2016: | | | |
| 5% 9/1/22 | | 1,170 | 1,272 |
| 5% 9/1/24 | | 995 | 1,128 |
| Series 2017: | | | |
| 5% 4/1/24 | | 970 | 1,090 |
| 5% 4/1/25 | | 1,315 | 1,506 |
| Lewisburg Indl. Dev. Board Bonds (Waste Mgmt. Tennessee Proj.) Series 2012, 1.95%, tender 8/1/19 (a)(c) | | 5,000 | 5,002 |
| Memphis-Shelby County Arpt. Auth. Arpt. Rev. Series 2010 B, 5.625% 7/1/20 (c) | | 4,855 | 5,048 |
| Tennergy Corp. Gas Rev. Bonds Series 2019 A, 5%, tender 10/1/24 (a) | | 18,440 | 21,302 |
| Tennessee Energy Acquisition Corp. Bonds: | | | |
| (Gas Rev. Proj.) Series A, 4%, tender 5/1/23 (a) | | 11,735 | 12,579 |
| Series 2018, 4%, tender 11/1/49 | | 10,670 | 11,757 |
|
| TOTAL TENNESSEE | | | 63,293 |
|
| Texas - 14.3% | | | |
| Arlington Spl. Tax Rev. Series 2018 C, 5% 2/15/45 | | 2,955 | 3,086 |
| Austin Arpt. Sys. Rev. Series 2014, 5% 11/15/29 (c) | | 2,690 | 3,110 |
| Austin Cmnty. College District Rev. (Convention Ctr. Proj.) Series 2002, 0% 2/1/22 (AMBAC Insured) | | 1,295 | 1,242 |
| Austin Elec. Util. Sys. Rev. Series 2012 A, 5% 11/15/23 | | 1,455 | 1,622 |
| Brownsville Independent School District Series 2017, 4% 8/15/22 | | 4,000 | 4,312 |
| Central Reg'l. Mobility Auth.: | | | |
| Series 2015 A: | | | |
| 5% 1/1/31 | | 1,165 | 1,345 |
| 5% 1/1/32 | | 970 | 1,115 |
| 5% 1/1/34 | | 1,940 | 2,217 |
| 5% 1/1/40 | | 5,340 | 6,028 |
| Series 2016: | | | |
| 5% 1/1/31 | | 2,305 | 2,685 |
| 5% 1/1/32 | | 4,855 | 5,632 |
| 5% 1/1/35 | | 3,240 | 3,723 |
| 5% 1/1/36 | | 1,580 | 1,812 |
| Cypress-Fairbanks Independent School District: | | | |
| Bonds: | | | |
| Series 2014 B2, 1.4%, tender 8/17/20 (a) | | 5,545 | 5,544 |
| Series 2014 B3, 1.4%, tender 8/17/20 (a) | | 6,005 | 6,004 |
| Series 2014 C, 5% 2/15/44 | | 3,025 | 3,397 |
| Series 2016: | | | |
| 5% 2/15/22 | | 4,855 | 5,318 |
| 5% 2/15/23 | | 4,855 | 5,480 |
| 5% 2/15/24 | | 24,410 | 28,346 |
| 5% 2/15/25 | | 20,810 | 24,775 |
| 5% 2/15/27 | | 3,475 | 4,214 |
| Dallas Area Rapid Transit Sales Tax Rev. Series 2007, 5.25% 12/1/29 | | 7,135 | 9,502 |
| Dallas County Util. and Reclamation District Series 2013, 5% 2/15/24 | | 6,130 | 7,044 |
| Dallas Fort Worth Int'l. Arpt. Rev.: | | | |
| Series 2009 A, 5% 11/1/19 | | 970 | 982 |
| Series 2014 B: | | | |
| 5% 11/1/26 (c) | | 2,920 | 3,217 |
| 5% 11/1/27 (c) | | 1,245 | 1,370 |
| 5% 11/1/28 (c) | | 2,765 | 3,038 |
| 5% 11/1/30 (c) | | 5,280 | 5,772 |
| 5% 11/1/31 (c) | | 11,155 | 12,172 |
| 5% 11/1/32 (c) | | 14,110 | 15,378 |
| 5% 11/1/33 (c) | | 9,710 | 10,573 |
| 5% 11/1/34 (c) | | 2,295 | 2,496 |
| Dallas Gen. Oblig.: | | | |
| Series 2012, 5% 2/15/23 | | 4,295 | 4,690 |
| Series 2014, 5% 2/15/24 | | 5,770 | 6,664 |
| Series 2019 B: | | | |
| 5% 2/15/30 | | 4,080 | 5,183 |
| 5% 2/15/32 | | 7,095 | 8,909 |
| 5% 2/15/33 | | 7,585 | 9,462 |
| Dallas Independent School District: | | | |
| Bonds: | | | |
| Series 2016, 5%, tender 2/15/22 (a) | | 60 | 66 |
| Series 2019: | | | |
| 5%, tender 2/15/22 (a) | | 690 | 754 |
| 5%, tender 2/15/22 (a) | | 2,880 | 3,135 |
| Series 2019: | | | |
| 5% 2/15/28 | | 1,750 | 2,207 |
| 5% 2/15/29 | | 2,355 | 2,956 |
| 5% 2/15/30 | | 5,095 | 6,354 |
| Denton Independent School District Series 2016, 0% 8/15/25 | | 2,770 | 2,497 |
| El Paso Gen. Oblig. Series 2019 A: | | | |
| 5% 8/15/30 | | 5,100 | 6,310 |
| 5% 8/15/31 | | 3,610 | 4,440 |
| 5% 8/15/32 | | 3,620 | 4,440 |
| 5% 8/15/33 | | 5,890 | 7,174 |
| 5% 8/15/34 | | 2,945 | 3,570 |
| Fort Bend Independent School District Bonds: | | | |
| Series 2019 A, 1.95%, tender 8/1/22 (a) | | 3,180 | 3,219 |
| Series C, 1.35%, tender 8/1/20 (a) | | 3,025 | 3,023 |
| Series D, 1.5%, tender 8/1/21 (a) | | 5,450 | 5,434 |
| Fort Worth Gen. Oblig. Series 2016, 5% 3/1/27 | | 5,755 | 6,949 |
| Fort Worth Independent School District: | | | |
| Series 2015, 5% 2/15/22 | | 2,760 | 3,022 |
| Series 2016, 5% 2/15/26 | | 3,530 | 4,303 |
| Frisco Independent School District Series 2009, 5.375% 8/15/39 (Assured Guaranty Corp. Insured) | | 2,500 | 2,512 |
| Grand Parkway Trans. Corp.: | | | |
| Bonds Series 2018 B, 5%, tender 10/1/23 (a) | | 40,590 | 46,083 |
| Series 2013 B: | | | |
| 5% 4/1/53 | | 1,130 | 1,234 |
| 5.25% 10/1/51 | | 2,430 | 2,723 |
| 5.5% 4/1/53 | | 5,730 | 6,427 |
| Series 2013 C, 5.125% 10/1/43 | | 2,430 | 2,678 |
| Series 2018 A: | | | |
| 5% 10/1/31 | | 4,965 | 6,156 |
| 5% 10/1/32 | | 4,210 | 5,202 |
| 5% 10/1/33 | | 6,420 | 7,901 |
| 5% 10/1/34 | | 4,855 | 5,949 |
| Harris County Cultural Ed. Facilities Fin. Corp. Rev. Series 2019 A: | | | |
| 4% 10/1/35 (b) | | 1,750 | 1,968 |
| 4% 10/1/36 (b) | | 3,000 | 3,361 |
| Harris County Gen. Oblig. Series 2012 C: | | | |
| 5% 8/15/24 | | 1,045 | 1,155 |
| 5% 8/15/25 | | 3,750 | 4,141 |
| Houston Arpt. Sys. Rev.: | | | |
| Series 2011 A, 5% 7/1/20 (c) | | 7,770 | 8,042 |
| Series 2012 A, 5% 7/1/23 (c) | | 6,750 | 7,432 |
| Series 2018 A: | | | |
| 5% 7/1/26 (c) | | 1,635 | 1,965 |
| 5% 7/1/27 (c) | | 2,050 | 2,505 |
| 5% 7/1/28 (c) | | 970 | 1,205 |
| Series 2018 B: | | | |
| 5% 7/1/28 | | 3,110 | 3,932 |
| 5% 7/1/29 | | 12,140 | 15,246 |
| 5% 7/1/30 | | 6,385 | 7,959 |
| Houston Convention and Entertainment Facilities Dept. Hotel Occupancy Tax and Spl. Rev. Series 2019: | | | |
| 5% 9/1/29 | | 1,000 | 1,254 |
| 5% 9/1/30 | | 1,250 | 1,555 |
| 5% 9/1/31 | | 1,650 | 2,035 |
| 5% 9/1/33 | | 1,535 | 1,878 |
| 5% 9/1/34 | | 1,250 | 1,523 |
| 5% 9/1/35 | | 1,700 | 2,063 |
| Houston Gen. Oblig. Series 2017 A: | | | |
| 5% 3/1/23 | | 2,095 | 2,360 |
| 5% 3/1/24 | | 9,710 | 11,242 |
| 5% 3/1/25 | | 4,080 | 4,838 |
| Houston Util. Sys. Rev.: | | | |
| Series 2014 C, 5% 5/15/28 | | 2,525 | 2,918 |
| Series 2016 B, 5% 11/15/33 | | 2,330 | 2,792 |
| Irving Hosp. Auth. Hosp. Rev. Series 2017 A: | | | |
| 5% 10/15/24 | | 485 | 560 |
| 5% 10/15/26 | | 680 | 811 |
| 5% 10/15/27 | | 485 | 575 |
| 5% 10/15/29 | | 630 | 740 |
| 5% 10/15/31 | | 990 | 1,146 |
| 5% 10/15/35 | | 1,425 | 1,621 |
| 5% 10/15/36 | | 965 | 1,095 |
| 5% 10/15/39 | | 1,215 | 1,368 |
| 5% 10/15/44 | | 1,440 | 1,611 |
| Love Field Arpt. Modernization Rev. Series 2015: | | | |
| 5% 11/1/30 (c) | | 1,360 | 1,585 |
| 5% 11/1/31 (c) | | 3,070 | 3,565 |
| Lower Colorado River Auth. Rev.: | | | |
| (LCRA Transmission Svcs. Corp. Proj.): | | | |
| Series 2018: | | | |
| 5% 5/15/32 | | 4,565 | 5,644 |
| 5% 5/15/34 | | 2,430 | 2,982 |
| 5% 5/15/36 | | 2,430 | 2,962 |
| Series 2019: | | | |
| 5% 5/15/32 | | 1,500 | 1,885 |
| 5% 5/15/33 | | 2,250 | 2,813 |
| 5% 5/15/34 | | 2,250 | 2,797 |
| 5% 5/15/35 | | 5,575 | 6,898 |
| 5% 5/15/36 | | 1,075 | 1,323 |
| Series 2015 B: | | | |
| 5% 5/15/25 | | 6,615 | 7,887 |
| 5% 5/15/27 | | 2,915 | 3,438 |
| 5% 5/15/28 | | 2,845 | 3,333 |
| 5% 5/15/29 | | 8,255 | 9,703 |
| Series 2015 D: | | | |
| 5% 5/15/22 | | 825 | 908 |
| 5% 5/15/23 | | 680 | 771 |
| 5% 5/15/24 | | 1,185 | 1,380 |
| 5% 5/15/26 | | 1,360 | 1,615 |
| Midway Independent School District Series 2000, 0% 8/15/19 | | 1,360 | 1,358 |
| Mission Econ. Dev. Corp. Solid Waste Disp. Rev. Bonds (Republic Svcs., Inc. Proj.) Series 2008 A, 1.9%, tender 8/1/19 (a)(c) | | 6,900 | 6,902 |
| New Hope Cultural Ed. Facilities Finc (Childrens Med. Ctr. of Dallas) Series 2017 A: | | | |
| 5% 8/15/24 | | 1,960 | 2,293 |
| 5% 8/15/25 | | 2,430 | 2,908 |
| 5% 8/15/26 | | 1,505 | 1,839 |
| 5% 8/15/27 | | 1,565 | 1,946 |
| 5% 8/15/30 | | 2,330 | 2,839 |
| Newark Higher Ed. Fin. Corp. (Abilene Christian Univ. Proj.) Series 2016 A: | | | |
| 5% 4/1/27 | | 2,135 | 2,507 |
| 5% 4/1/28 | | 1,395 | 1,630 |
| North East Texas Independent School District Bonds: | | | |
| Series 2013 B, 1.42%, tender 8/1/21 (a) | | 4,125 | 4,103 |
| Series 2019, 2.2%, tender 8/1/24 (a) | | 4,310 | 4,421 |
| North Harris County Reg'l. Wtr. Auth. Series 2013: | | | |
| 4% 12/15/23 | | 995 | 1,079 |
| 4% 12/15/24 | | 1,770 | 1,916 |
| North Texas Tollway Auth. Rev.: | | | |
| (Sr. Lien Proj.) Series 2017 A: | | | |
| 5% 1/1/30 | | 1,240 | 1,475 |
| 5% 1/1/33 | | 1,280 | 1,532 |
| (Sub Lien Proj.) Series 2017 B: | | | |
| 5% 1/1/30 | | 470 | 555 |
| 5% 1/1/31 | | 660 | 775 |
| 5% 1/1/32 | | 2,915 | 3,483 |
| Series 2011 A: | | | |
| 5.5% 9/1/41 (Pre-Refunded to 9/1/21 @ 100) | | 12,490 | 13,589 |
| 6% 9/1/41 (Pre-Refunded to 9/1/21 @ 100) | | 970 | 1,066 |
| Series 2014 A: | | | |
| 5% 1/1/23 | | 1,735 | 1,946 |
| 5% 1/1/24 | | 4,855 | 5,596 |
| Series 2015 B: | | | |
| 5% 1/1/29 | | 9,710 | 11,333 |
| 5% 1/1/30 | | 4,855 | 5,646 |
| Series 2016 A, 5% 1/1/39 | | 6,800 | 7,867 |
| Series 2017 A, 5% 1/1/43 | | 10,000 | 11,815 |
| Northside Independent School District Bonds Series 2018, 2.75%, tender 8/1/23 (a) | | 22,990 | 24,012 |
| Prosper Independent School District Series 2019: | | | |
| 5% 2/15/41 | | 1,600 | 1,961 |
| 5% 2/15/44 | | 4,955 | 6,048 |
| Rockwall Independent School District Series 2015, 0% 2/15/25 | | 1,615 | 1,466 |
| San Antonio Elec. & Gas Sys. Rev.: | | | |
| Bonds Series 2015 B, 2%, tender 12/1/21 (a) | | 6,875 | 6,921 |
| Series 2012, 5.25% 2/1/25 | | 3,110 | 3,742 |
| Series 2017: | | | |
| 5% 2/1/29 | | 1,455 | 1,817 |
| 5% 2/1/30 | | 970 | 1,203 |
| 5% 2/1/31 | | 1,455 | 1,791 |
| 5% 2/1/33 | | 1,165 | 1,422 |
| San Antonio Pub. Facilities Corp. and Rfdg. Lease (Convention Ctr. Proj.) Series 2012: | | | |
| 5% 9/15/23 | | 4,660 | 5,164 |
| 5% 9/15/24 | | 7,275 | 8,058 |
| 5% 9/15/25 | | 9,025 | 9,990 |
| San Antonio Wtr. Sys. Rev.: | | | |
| Bonds Series 2014 B, 2%, tender 11/1/22 (a) | | 13,110 | 13,259 |
| Series 2012, 5% 5/15/22 (Pre-Refunded to 5/15/22 @ 100) | | 5,825 | 6,422 |
| Southwest Higher Ed. Auth. Rev. (Southern Methodist Univ. Proj.) Series 2009: | | | |
| 5% 10/1/19 | | 2,955 | 2,982 |
| 5% 10/1/20 (Pre-Refunded to 10/1/19 @ 100) | | 2,115 | 2,134 |
| Tarrant County Cultural Ed. Facilities Fin. Corp. Hosp. Rev.: | | | |
| (Scott & White Healthcare Proj.) Series 2013 A: | | | |
| 5% 8/15/25 | | 970 | 1,104 |
| 5% 8/15/26 | | 1,485 | 1,686 |
| 5% 8/15/28 | | 1,575 | 1,780 |
| 5% 8/15/33 | | 3,690 | 4,116 |
| 5.5% 9/1/43 | | 5,195 | 5,805 |
| Tarrant County Cultural Ed. Facilities Fin. Corp. Rev. Series 2016 A: | | | |
| 5% 2/15/25 | | 5,585 | 6,613 |
| 5% 2/15/34 | | 2,040 | 2,412 |
| Texas A&M Univ. Rev. Series 2016 C, 5% 5/15/23 | | 5,475 | 6,227 |
| Texas Dept. of Hsg. & Cmnty. Affairs Multi-family Hsg. Rev. Series 2019, 2.95% 7/1/36 | | 6,620 | 6,625 |
| Texas Gen. Oblig.: | | | |
| Series 2011 A: | | | |
| 5% 8/1/19 (c) | | 1,500 | 1,504 |
| 5% 8/1/21 (c) | | 1,485 | 1,593 |
| Series 2011 C: | | | |
| 5% 8/1/20 (c) | | 1,580 | 1,641 |
| 5% 8/1/21 (c) | | 1,420 | 1,523 |
| Series 2013 B, 5% 8/1/25 (c) | | 11,725 | 13,363 |
| Series 2014, 5% 8/1/26 (c) | | 5,020 | 5,839 |
| Texas Private Activity Bond Surface Trans. Corp. Series 2013, 7% 12/31/38 (c) | | 15,540 | 18,262 |
| Texas Pub. Fin. Auth. Lease Rev. Series 2019: | | | |
| 5% 2/1/23 | | 1,500 | 1,688 |
| 5% 2/1/24 | | 1,130 | 1,307 |
| 5% 2/1/26 | | 2,600 | 3,149 |
| 5% 2/1/27 | | 2,500 | 3,093 |
| 5% 2/1/28 | | 1,315 | 1,659 |
| Texas State Univ. Sys. Fing. Rev. Series 2017 A, 5% 3/15/29 | | 4,530 | 5,572 |
| Texas Trans. Commission Central Texas Tpk. Sys. Rev. Bonds Series 2015 A, 5%, tender 4/1/20 (a) | | 23,115 | 23,692 |
| Texas Wtr. Dev. Board Rev.: | | | |
| Series 2017 A: | | | |
| 5% 4/15/22 | | 4,125 | 4,541 |
| 5% 4/15/25 | | 6,055 | 7,238 |
| 5% 10/15/25 | | 2,555 | 3,092 |
| 5% 4/15/26 | | 4,195 | 5,134 |
| 5% 4/15/29 | | 6,310 | 7,915 |
| 5% 4/15/30 | | 16,995 | 21,201 |
| Series 2018 B: | | | |
| 5% 4/15/29 | | 2,750 | 3,525 |
| 5% 10/15/29 | | 2,250 | 2,874 |
| 5% 10/15/30 | | 3,240 | 4,111 |
| 5% 4/15/31 | | 5,000 | 6,324 |
| Series 2019: | | | |
| 5% 8/1/30 | | 8,650 | 11,145 |
| 5% 8/1/31 | | 4,500 | 5,760 |
| 5% 8/1/32 | | 3,000 | 3,822 |
| 5% 8/1/33 | | 3,450 | 4,376 |
| 5% 8/1/34 | | 4,500 | 5,679 |
| 5% 8/1/35 | | 5,500 | 6,909 |
| Travis County Gen. Oblig.: | | | |
| Series 2016 A, 5% 3/1/24 | | 2,905 | 3,370 |
| Series 2019 A: | | | |
| 5% 3/1/34 | | 5,645 | 7,081 |
| 5% 3/1/35 | | 17,080 | 21,324 |
| Univ. of Houston Univ. Revs.: | | | |
| Series 2017 A, 5% 2/15/30 | | 6,325 | 7,548 |
| 5.25% 2/15/25 (FSA Insured) | | 380 | 381 |
| Univ. of Texas Board of Regents Sys. Rev.: | | | |
| Series 2010, 5% 8/15/22 | | 2,970 | 3,309 |
| Series 2016 D: | | | |
| 5% 8/15/20 | | 1,940 | 2,021 |
| 5% 8/15/21 | | 2,245 | 2,420 |
| 5% 8/15/22 | | 2,430 | 2,707 |
| Series 2016 E, 5% 8/15/22 | | 2,605 | 2,902 |
| Series 2016 J, 5% 8/15/22 | | 2,590 | 2,885 |
| Univ. of Texas Permanent Univ. Fund Rev. Series 2016 B: | | | |
| 5% 7/1/22 | | 1,695 | 1,878 |
| 5% 7/1/29 | | 1,740 | 2,121 |
|
| TOTAL TEXAS | | | 1,033,219 |
|
| Utah - 0.1% | | | |
| Salt Lake City Arpt. Rev. Series 2017 A: | | | |
| 5% 7/1/26 (c) | | 1,120 | 1,349 |
| 5% 7/1/28 (c) | | 3,885 | 4,741 |
| Utah Associated Muni. Pwr. Sys. Rev. (Payson Pwr. Proj.) 5% 9/1/24 (Pre-Refunded to 9/1/22 @ 100) | | 2,915 | 3,241 |
|
| TOTAL UTAH | | | 9,331 |
|
| Virginia - 1.1% | | | |
| Chesapeake Trans. Sys. Toll Road Rev. Series 2012 A, 5% 7/15/22 | | 970 | 1,063 |
| Fredericksburg Econ. Dev. Auth. Rev. Series 2014: | | | |
| 5% 6/15/27 | | 1,260 | 1,451 |
| 5% 6/15/29 | | 1,385 | 1,586 |
| 5% 6/15/33 | | 1,475 | 1,673 |
| Norfolk Econ. Dev. Auth. Hosp. Facilities Rev. Bonds Series 2018 A, 5%, tender 11/1/28 (a) | | 1,455 | 1,832 |
| Stafford County Econ. Dev. Auth. Hosp. Facilities Rev. Series 2016: | | | |
| 4% 6/15/37 | | 615 | 650 |
| 5% 6/15/32 | | 1,750 | 2,058 |
| 5% 6/15/34 | | 2,235 | 2,607 |
| Virginia College Bldg. Auth. Edl. Facilities Rev.: | | | |
| (21st Century College and Equip. Prog.): | | | |
| Series 2017 C, 5% 2/1/26 | | 5,540 | 6,752 |
| Series 2017 E, 5% 2/1/31 | | 10,295 | 12,864 |
| (Virginia Gen. Oblig.) Series 2017 E, 5% 2/1/30 | | 8,875 | 11,175 |
| Virginia Commonwealth Trans. Board Rev. (Virginia Gen. Oblig. Proj.) Series 2017 A: | | | |
| 5% 5/15/29 | | 6,160 | 7,749 |
| 5% 5/15/30 | | 12,035 | 15,044 |
| Virginia Small Bus. Fing. Auth. (95 Express Lane LLC Proj.) Series 2012, 5% 1/1/40 (c) | | 7,380 | 7,813 |
| Winchester Econ. Dev. Auth. Series 2015: | | | |
| 5% 1/1/32 | | 1,940 | 2,261 |
| 5% 1/1/33 | | 2,515 | 2,915 |
| Wise County Indl. Dev. Auth. Waste & Sewage Rev. Bonds Series 2009 A, 2.15%, tender 9/1/20 (a) | | 2,700 | 2,719 |
|
| TOTAL VIRGINIA | | | 82,212 |
|
| Washington - 2.5% | | | |
| Chelan County Pub. Util. District #1 Columbia River-Rock Island Hydro-Elec. Sys. Rev. Series 1997 A, 0% 6/1/24 (Nat'l. Pub. Fin. Guarantee Corp. Insured) | | 1,990 | 1,825 |
| Clark County School District #37, Vancouver Series 2001 C, 0% 12/1/19 (Nat'l. Pub. Fin. Guarantee Corp. Insured) | | 2,915 | 2,898 |
| Grant County Pub. Util. District #2 Series 2012 A: | | | |
| 5% 1/1/22 | | 970 | 1,056 |
| 5% 1/1/23 | | 970 | 1,073 |
| 5% 1/1/24 | | 2,265 | 2,495 |
| Port of Seattle Rev.: | | | |
| Series 2016 B, 5% 10/1/29 (c) | | 4,615 | 5,454 |
| Series 2016: | | | |
| 5% 2/1/27 | | 1,205 | 1,452 |
| 5% 2/1/29 | | 2,430 | 2,904 |
| Port of Seattle Spl. Facility Rev. Series 2013, 5% 6/1/23 (c) | | 860 | 970 |
| Tacoma Elec. Sys. Rev. Series 2017: | | | |
| 5% 1/1/29 | | 1,050 | 1,290 |
| 5% 1/1/36 | | 1,140 | 1,357 |
| Tobacco Settlement Auth. Rev. Series 2018: | | | |
| 5% 6/1/23 | | 2,430 | 2,693 |
| 5% 6/1/24 | | 3,430 | 3,795 |
| Washington Gen. Oblig.: | | | |
| Series 2018 A, 5% 8/1/32 | | 14,420 | 17,672 |
| Series 2018 D: | | | |
| 5% 8/1/32 | | 24,300 | 29,780 |
| 5% 8/1/33 | | 30,735 | 37,482 |
| Series 2019 A, 5% 8/1/31 | | 10,495 | 13,157 |
| Series 2019 B, 5% 6/1/34 | | 3,300 | 4,067 |
| Series R 97A, 0% 7/1/19 (Escrowed to Maturity) | | 3,340 | 3,340 |
| Series R-2017 A: | | | |
| 5% 8/1/27 | | 1,735 | 2,134 |
| 5% 8/1/28 | | 1,735 | 2,124 |
| 5% 8/1/30 | | 1,735 | 2,097 |
| Washington Health Care Facilities Auth. Rev.: | | | |
| (Overlake Hosp. Med. Ctr. Proj.) Series 2010, 5.5% 7/1/30 (Pre-Refunded to 7/1/20 @ 100) | | 2,135 | 2,224 |
| (Overlake Hosp. Med. Ctr., WA. Proj.) Series 2017 B: | | | |
| 5% 7/1/25 | | 240 | 285 |
| 5% 7/1/26 | | 1,935 | 2,345 |
| 5% 7/1/29 | | 3,100 | 3,822 |
| 5% 7/1/34 | | 610 | 731 |
| 5% 7/1/42 | | 3,900 | 4,538 |
| (Providence Health Systems Proj.) Series 2018 B: | | | |
| 5% 10/1/27 | | 2,430 | 3,022 |
| 5% 10/1/28 | | 1,940 | 2,455 |
| (Virginia Mason Med. Ctr. Proj.) Series 2017, 5% 8/15/28 | | 3,625 | 4,289 |
| (Virginia Mason Med. Ctr. Proj.) Series 2017, 5% 8/15/31 | | 5,505 | 6,391 |
| Series 2015, 5% 1/1/29 | | 1,260 | 1,465 |
| Series 2017, 5% 8/15/32 | | 1,520 | 1,758 |
| Washington Higher Ed. Facilities Auth. Rev.: | | | |
| (Whitworth Univ. Proj.) Series 2016 A: | | | |
| 5% 10/1/29 | | 550 | 639 |
| 5% 10/1/31 | | 2,635 | 3,028 |
| 5% 10/1/33 | | 560 | 640 |
| Series 2016 A, 5% 10/1/30 | | 2,510 | 2,899 |
|
| TOTAL WASHINGTON | | | 181,646 |
|
| West Virginia - 0.0% | | | |
| West Virginia Hosp. Fin. Auth. Hosp. Rev. Series 2018 A, 5% 1/1/36 | | 3,000 | 3,532 |
| Wisconsin - 1.4% | | | |
| Pub. Fin. Auth. Hosp. Rev. Series 2019 A, 5% 10/1/44 | | 8,185 | 9,663 |
| Pub. Fin. Auth. Sr Liv Rev. (Mary's Woods At Marylhurst, Inc. Proj.): | | | |
| Series 2017 A: | | | |
| 5% 5/15/23 (d) | | 1,245 | 1,338 |
| 5% 5/15/30 (d) | | 1,135 | 1,243 |
| 5.25% 5/15/37 (d) | | 345 | 378 |
| 5.25% 5/15/42 (d) | | 420 | 455 |
| 5.25% 5/15/47 (d) | | 420 | 454 |
| 5.25% 5/15/52 (d) | | 790 | 852 |
| Series 2017 B-1 3.95% 11/15/24 (d) | | 305 | 306 |
| Pub. Fin. Auth. Solid Waste Bonds (Waste Mgmt., Inc. Proj.): | | | |
| Series 2017 A, 1.95%, tender 8/1/19 (a)(c) | | 5,000 | 5,002 |
| Series 2017 A-1, 1.95%, tender 8/1/19 (a)(c) | | 5,000 | 5,002 |
| Pub. Fin. Auth. Wisconsin Retirement Facility Rev. Series 2018: | | | |
| 5% 10/1/43 (d) | | 890 | 976 |
| 5% 10/1/48 (d) | | 1,075 | 1,175 |
| 5% 10/1/53 (d) | | 3,010 | 3,282 |
| Wisconsin Health & Edl. Facilities: | | | |
| Series 2010: | | | |
| 5.75% 7/1/30 (Pre-Refunded to 7/1/20 @ 100) | | 715 | 746 |
| 5.75% 7/1/30 (Pre-Refunded to 7/1/20 @ 100) | | 1,230 | 1,283 |
| Series 2014 A: | | | |
| 5% 11/15/24 | | 8,510 | 9,977 |
| 5% 11/15/27 | | 6,515 | 7,562 |
| Series 2014: | | | |
| 5% 5/1/26 | | 810 | 911 |
| 5% 5/1/28 | | 1,750 | 1,961 |
| 5% 5/1/29 | | 865 | 968 |
| Series 2016, 4% 2/15/38 (Pre-Refunded to 8/15/25 @ 100) | | 1,260 | 1,436 |
| Series 2017 A: | | | |
| 5% 9/1/34 | | 1,750 | 1,985 |
| 5% 9/1/36 | | 2,100 | 2,357 |
| Wisconsin Health & Edl. Facilities Auth. Rev.: | | | |
| (Agnesian HealthCare, Inc. Proj.): | | | |
| Series 2010, 5.5% 7/1/40 (Pre-Refunded to 7/1/20 @ 100) | | 1,750 | 1,822 |
| Series 2013 B: | | | |
| 5% 7/1/25 (Pre-Refunded to 7/1/23 @ 100) | | 970 | 1,104 |
| 5% 7/1/36 (Pre-Refunded to 7/1/23 @ 100) | | 6,785 | 7,723 |
| Series 2012: | | | |
| 5% 6/1/27 | | 1,750 | 1,890 |
| 5% 6/1/32 | | 995 | 1,069 |
| 5% 8/15/32 (Pre-Refunded to 8/15/22 @ 100) | | 1,600 | 1,777 |
| 5% 6/1/39 | | 2,345 | 2,497 |
| Wisconsin St Gen. Fund Annual Appropriation Series 2019 A: | | | |
| 5% 5/1/26 | | 8,580 | 10,537 |
| 5% 5/1/27 | | 12,590 | 15,798 |
|
| TOTAL WISCONSIN | | | 103,529 |
|
| Wyoming - 0.1% | | | |
| Campbell County Solid Waste Facilities Rev. (Basin Elec. Pwr. Coop. - Dry Fork Station Facilities Proj.) Series 2009 A, 5.75% 7/15/39 | | 6,165 | 6,175 |
| TOTAL MUNICIPAL BONDS | | | |
| (Cost $6,614,360) | | | 6,906,894 |
|
| Municipal Notes - 3.1% | | | |
| Illinois - 0.7% | | | |
| Chicago Board of Ed.: | | | |
| Participating VRDN Series Floaters XG 01 08, 2.08% 7/5/19 (a)(f)(g) | | 24,985 | $24,985 |
| TAN Series 2018 G, 2% 10/1/19 | | 28,200 | 28,204 |
|
| TOTAL ILLINOIS | | | 53,189 |
|
| New York - 0.5% | | | |
| Genessee Valley Central School District BAN Series 2018, 4% 8/28/19 | | 7,205 | 7,231 |
| New York City Transitional Fin. Auth. Rev. Series 2019 C4, 1.97% 7/1/19 (Liquidity Facility Barclays Bank PLC), VRDN (a) | | 3,300 | 3,300 |
| New York Metropolitan Trans. Auth. Rev. BAN: | | | |
| Series 2018 B, 5% 5/15/20 | | 7,470 | 7,702 |
| Series 2018 C, 5% 9/1/21 | | 14,000 | 15,047 |
| Ravena Coeymans Selkirk Central School District BAN Series 2018, 4% 8/16/19 | | 1,261 | 1,265 |
|
| TOTAL NEW YORK | | | 34,545 |
|
| Texas - 1.8% | | | |
| Texas Gen. Oblig. TRAN Series 2018, 4% 8/29/19 | | 130,600 | 131,111 |
| Wisconsin - 0.1% | | | |
| Sun Prairie Area School District BAN Series 2019, 3% 12/31/19 (b) | | 6,300 | 6,315 |
| TOTAL MUNICIPAL NOTES | | | |
| (Cost $224,746) | | | 225,160 |
| | | Shares | Value (000s) |
|
| Money Market Funds - 1.6% | | | |
| Fidelity Municipal Cash Central Fund 2.00% (h)(i) | | | |
| (Cost $113,624) | | 113,612,639 | 113,624 |
| TOTAL INVESTMENT IN SECURITIES - 100.5% | | | |
| (Cost $6,952,730) | | | 7,245,678 |
| NET OTHER ASSETS (LIABILITIES) - (0.5)% | | | (36,391) |
| NET ASSETS - 100% | | | $7,209,287 |
Security Type Abbreviations
BAN – BOND ANTICIPATION NOTE
TAN – TAX ANTICIPATION NOTE
TRAN – TAX AND REVENUE ANTICIPATION NOTE
VRDN – VARIABLE RATE DEMAND NOTE (A debt instrument that is payable upon demand, either daily, weekly or monthly)
Legend
(a) Coupon rates for floating and adjustable rate securities reflect the rates in effect at period end.
(b) Security or a portion of the security purchased on a delayed delivery or when-issued basis.
(c) Private activity obligations whose interest is subject to the federal alternative minimum tax for individuals.
(d) Security exempt from registration under Rule 144A of the Securities Act of 1933. These securities may be resold in transactions exempt from registration, normally to qualified institutional buyers. At the end of the period, the value of these securities amounted to $61,208,000 or 0.8% of net assets.
(e) Coupon is indexed to a floating interest rate which may be multiplied by a specified factor and/or subject to caps or floors.
(f) Provides evidence of ownership in one or more underlying municipal bonds.
(g) Coupon rates are determined by re-marketing agents based on current market conditions.
(h) Information in this report regarding holdings by state and security types does not reflect the holdings of the Fidelity Municipal Cash Central Fund.
(i) Affiliated fund that is available only to investment companies and other accounts managed by Fidelity Investments. The rate quoted is the annualized seven-day yield of the fund at period end. A complete unaudited listing of the fund's holdings as of its most recent quarter end is available upon request. In addition, each Fidelity Central Fund's financial statements are available on the SEC's website or upon request.
Affiliated Central Funds
Information regarding fiscal year to date income earned by the Fund from investments in Fidelity Central Funds is as follows:
| Fund | Income earned |
| | (Amounts in thousands) |
| Fidelity Municipal Cash Central Fund | $1,504 |
| Total | $1,504 |
Amounts in the income column in the above table include any capital gain distributions from underlying funds, which are presented in the corresponding line-item in the Statement of Operations, if applicable.
Investment Valuation
The following is a summary of the inputs used, as of June 30, 2019, involving the Fund's assets and liabilities carried at fair value. The inputs or methodology used for valuing securities may not be an indication of the risk associated with investing in those securities. For more information on valuation inputs, and their aggregation into the levels used below, please refer to the Investment Valuation section in the accompanying Notes to Financial Statements.
| | Valuation Inputs at Reporting Date: |
| Description | Total | Level 1 | Level 2 | Level 3 |
| (Amounts in thousands) | | | | |
| Investments in Securities: | | | | |
| Municipal Securities | $7,132,054 | $-- | $7,132,054 | $-- |
| Money Market Funds | 113,624 | 113,624 | -- | -- |
| Total Investments in Securities: | $7,245,678 | $113,624 | $7,132,054 | $-- |
Other Information
The distribution of municipal securities by revenue source, as a percentage of total Net Assets, is as follows (Unaudited):
| General Obligations | 36.4% |
| Health Care | 17.5% |
| Transportation | 15.4% |
| Electric Utilities | 7.2% |
| Others* (Individually Less Than 5%) | 23.5% |
| | 100.0% |
* Includes net other assets
See accompanying notes which are an integral part of the financial statements.
Financial Statements
Statement of Assets and Liabilities
| Amounts in thousands (except per-share amounts) | | June 30, 2019 (Unaudited) |
| Assets | | |
Investment in securities, at value — See accompanying schedule:
Unaffiliated issuers (cost $6,839,106) | $7,132,054 | |
| Fidelity Central Funds (cost $113,624) | 113,624 | |
| Total Investment in Securities (cost $6,952,730) | | $7,245,678 |
| Cash | | 59 |
| Receivable for investments sold | | 600 |
| Receivable for fund shares sold | | 4,777 |
| Interest receivable | | 86,087 |
| Distributions receivable from Fidelity Central Funds | | 206 |
| Other receivables | | 14 |
| Total assets | | 7,337,421 |
| Liabilities | | |
| Payable for investments purchased | | |
| Regular delivery | $18,472 | |
| Delayed delivery | 97,671 | |
| Payable for fund shares redeemed | 6,328 | |
| Distributions payable | 3,469 | |
| Accrued management fee | 1,422 | |
| Distribution and service plan fees payable | 54 | |
| Other affiliated payables | 667 | |
| Other payables and accrued expenses | 51 | |
| Total liabilities | | 128,134 |
| Net Assets | | $7,209,287 |
| Net Assets consist of: | | |
| Paid in capital | | $6,917,139 |
| Total distributable earnings (loss) | | 292,148 |
| Net Assets | | $7,209,287 |
| Net Asset Value and Maximum Offering Price | | |
| Class A: | | |
| Net Asset Value and redemption price per share ($97,364 ÷ 9,196 shares)(a) | | $10.59 |
| Maximum offering price per share (100/96.00 of $10.59) | | $11.03 |
| Class M: | | |
| Net Asset Value and redemption price per share ($18,771 ÷ 1,774 shares)(a) | | $10.58 |
| Maximum offering price per share (100/96.00 of $10.58) | | $11.02 |
| Class C: | | |
| Net Asset Value and offering price per share ($35,396 ÷ 3,342 shares)(a) | | $10.59 |
| Intermediate Municipal Income: | | |
| Net Asset Value, offering price and redemption price per share ($4,385,386 ÷ 414,469 shares) | | $10.58 |
| Class I: | | |
| Net Asset Value, offering price and redemption price per share ($1,169,686 ÷ 110,376 shares) | | $10.60 |
| Class Z: | | |
| Net Asset Value, offering price and redemption price per share ($1,502,684 ÷ 141,749 shares) | | $10.60 |
(a) Redemption price per share is equal to net asset value less any applicable contingent deferred sales charge.
See accompanying notes which are an integral part of the financial statements.
Statement of Operations
| Amounts in thousands | | Six months ended June 30, 2019 (Unaudited) |
| Investment Income | | |
| Interest | | $95,167 |
| Income from Fidelity Central Funds | | 1,504 |
| Total income | | 96,671 |
| Expenses | | |
| Management fee | $8,232 | |
| Transfer agent fees | 3,505 | |
| Distribution and service plan fees | 335 | |
| Accounting fees and expenses | 367 | |
| Custodian fees and expenses | 23 | |
| Independent trustees' fees and expenses | 12 | |
| Registration fees | 154 | |
| Audit | 44 | |
| Legal | 4 | |
| Miscellaneous | 24 | |
| Total expenses before reductions | 12,700 | |
| Expense reductions | (31) | |
| Total expenses after reductions | | 12,669 |
| Net investment income (loss) | | 84,002 |
| Realized and Unrealized Gain (Loss) | | |
| Net realized gain (loss) on: | | |
| Investment securities: | | |
| Unaffiliated issuers | 84 | |
| Total net realized gain (loss) | | 84 |
| Change in net unrealized appreciation (depreciation) on investment securities | | 222,235 |
| Net gain (loss) | | 222,319 |
| Net increase (decrease) in net assets resulting from operations | | $306,321 |
See accompanying notes which are an integral part of the financial statements.
Statement of Changes in Net Assets
| Amounts in thousands | Six months ended June 30, 2019 (Unaudited) | Year ended December 31, 2018 |
| Increase (Decrease) in Net Assets | | |
| Operations | | |
| Net investment income (loss) | $84,002 | $162,282 |
| Net realized gain (loss) | 84 | 2,231 |
| Change in net unrealized appreciation (depreciation) | 222,235 | (93,476) |
| Net increase (decrease) in net assets resulting from operations | 306,321 | 71,037 |
| Distributions to shareholders | (83,948) | (167,871) |
| Share transactions - net increase (decrease) | 638,598 | (66,114) |
| Total increase (decrease) in net assets | 860,971 | (162,948) |
| Net Assets | | |
| Beginning of period | 6,348,316 | 6,511,264 |
| End of period | $7,209,287 | $6,348,316 |
See accompanying notes which are an integral part of the financial statements.
Financial Highlights
Fidelity Intermediate Municipal Income Fund Class A
| | Six months ended (Unaudited) June 30, | Years endedDecember 31, | | | | |
| | 2019 | 2018 | 2017 | 2016 | 2015 | 2014 |
| Selected Per–Share Data | | | | | | |
| Net asset value, beginning of period | $10.25 | $10.40 | $10.21 | $10.51 | $10.56 | $10.18 |
| Income from Investment Operations | | | | | | |
| Net investment income (loss)A | .112 | .230 | .238 | .231 | .234 | .256 |
| Net realized and unrealized gain (loss) | .340 | (.142) | .192 | (.262) | (.048) | .388 |
| Total from investment operations | .452 | .088 | .430 | (.031) | .186 | .644 |
| Distributions from net investment income | (.112) | (.229) | (.237) | (.231) | (.234) | (.257) |
| Distributions from net realized gain | – | (.009) | (.003) | (.038) | (.002) | (.007) |
| Total distributions | (.112) | (.238) | (.240) | (.269) | (.236) | (.264) |
| Redemption fees added to paid in capital | – | – | – | –A,B | –A,B | –A,B |
| Net asset value, end of period | $10.59 | $10.25 | $10.40 | $10.21 | $10.51 | $10.56 |
| Total ReturnC,D,E | 4.43% | .88% | 4.25% | (.34)% | 1.79% | 6.38% |
| Ratios to Average Net AssetsF,G | | | | | | |
| Expenses before reductions | .68%H | .68% | .69% | .68% | .69% | .67% |
| Expenses net of fee waivers, if any | .68%H | .68% | .69% | .68% | .69% | .67% |
| Expenses net of all reductions | .68%H | .68% | .69% | .67% | .69% | .67% |
| Net investment income (loss) | 2.18%H | 2.25% | 2.29% | 2.19% | 2.24% | 2.45% |
| Supplemental Data | | | | | | |
| Net assets, end of period (in millions) | $97 | $87 | $91 | $134 | $148 | $115 |
| Portfolio turnover rateI | 13%H | 19%J | 26% | 28% | 14% | 17% |
A Calculated based on average shares outstanding during the period.
B Amount represents less than $.0005 per share.
C Total returns for periods of less than one year are not annualized.
D Total returns would have been lower if certain expenses had not been reduced during the applicable periods shown.
E Total returns do not include the effect of the sales charges.
F Fees and expenses of any underlying Fidelity Central Funds are not included in the Fund's expense ratio. The Fund indirectly bears its proportionate share of the expenses of any underlying Fidelity Central Funds.
G Expense ratios reflect operating expenses of the class. Expenses before reductions do not reflect amounts reimbursed by the investment adviser or reductions from expense offset arrangements and do not represent the amount paid by the class during periods when reimbursements or reductions occur. Expenses net of fee waivers reflect expenses after reimbursement by the investment adviser but prior to reductions from expense offset arrangements. Expenses net of all reductions represent the net expenses paid by the class.
H Annualized
I Amount does not include the portfolio activity of any underlying Fidelity Central Funds.
J Portfolio turnover rate excludes securities received or delivered in-kind.
See accompanying notes which are an integral part of the financial statements.
Fidelity Intermediate Municipal Income Fund Class M
| | Six months ended (Unaudited) June 30, | Years endedDecember 31, | | | | |
| | 2019 | 2018 | 2017 | 2016 | 2015 | 2014 |
| Selected Per–Share Data | | | | | | |
| Net asset value, beginning of period | $10.24 | $10.39 | $10.21 | $10.51 | $10.55 | $10.17 |
| Income from Investment Operations | | | | | | |
| Net investment income (loss)A | .114 | .233 | .239 | .235 | .239 | .260 |
| Net realized and unrealized gain (loss) | .340 | (.141) | .183 | (.262) | (.039) | .388 |
| Total from investment operations | .454 | .092 | .422 | (.027) | .200 | .648 |
| Distributions from net investment income | (.114) | (.233) | (.239) | (.235) | (.238) | (.261) |
| Distributions from net realized gain | – | (.009) | (.003) | (.038) | (.002) | (.007) |
| Total distributions | (.114) | (.242) | (.242) | (.273) | (.240) | (.268) |
| Redemption fees added to paid in capital | – | – | – | –A,B | –A,B | –A,B |
| Net asset value, end of period | $10.58 | $10.24 | $10.39 | $10.21 | $10.51 | $10.55 |
| Total ReturnC,D,E | 4.45% | .92% | 4.17% | (.30)% | 1.93% | 6.43% |
| Ratios to Average Net AssetsF,G | | | | | | |
| Expenses before reductions | .65%H | .65% | .66% | .64% | .65% | .63% |
| Expenses net of fee waivers, if any | .65%H | .65% | .66% | .64% | .65% | .63% |
| Expenses net of all reductions | .65%H | .64% | .66% | .64% | .65% | .63% |
| Net investment income (loss) | 2.21%H | 2.28% | 2.31% | 2.22% | 2.28% | 2.48% |
| Supplemental Data | | | | | | |
| Net assets, end of period (in millions) | $19 | $15 | $18 | $19 | $19 | $18 |
| Portfolio turnover rateI | 13%H | 19%J | 26% | 28% | 14% | 17% |
A Calculated based on average shares outstanding during the period.
B Amount represents less than $.0005 per share.
C Total returns for periods of less than one year are not annualized.
D Total returns would have been lower if certain expenses had not been reduced during the applicable periods shown.
E Total returns do not include the effect of the sales charges.
F Fees and expenses of any underlying Fidelity Central Funds are not included in the Fund's expense ratio. The Fund indirectly bears its proportionate share of the expenses of any underlying Fidelity Central Funds.
G Expense ratios reflect operating expenses of the class. Expenses before reductions do not reflect amounts reimbursed by the investment adviser or reductions from expense offset arrangements and do not represent the amount paid by the class during periods when reimbursements or reductions occur. Expenses net of fee waivers reflect expenses after reimbursement by the investment adviser but prior to reductions from expense offset arrangements. Expenses net of all reductions represent the net expenses paid by the class.
H Annualized
I Amount does not include the portfolio activity of any underlying Fidelity Central Funds.
J Portfolio turnover rate excludes securities received or delivered in-kind.
See accompanying notes which are an integral part of the financial statements.
Fidelity Intermediate Municipal Income Fund Class C
| | Six months ended (Unaudited) June 30, | Years endedDecember 31, | | | | |
| | 2019 | 2018 | 2017 | 2016 | 2015 | 2014 |
| Selected Per–Share Data | | | | | | |
| Net asset value, beginning of period | $10.25 | $10.40 | $10.22 | $10.52 | $10.56 | $10.18 |
| Income from Investment Operations | | | | | | |
| Net investment income (loss)A | .074 | .153 | .160 | .152 | .156 | .176 |
| Net realized and unrealized gain (loss) | .340 | (.141) | .183 | (.262) | (.038) | .389 |
| Total from investment operations | .414 | .012 | .343 | (.110) | .118 | .565 |
| Distributions from net investment income | (.074) | (.153) | (.160) | (.152) | (.156) | (.178) |
| Distributions from net realized gain | – | (.009) | (.003) | (.038) | (.002) | (.007) |
| Total distributions | (.074) | (.162) | (.163) | (.190) | (.158) | (.185) |
| Redemption fees added to paid in capital | – | – | – | –A,B | –A,B | –A,B |
| Net asset value, end of period | $10.59 | $10.25 | $10.40 | $10.22 | $10.52 | $10.56 |
| Total ReturnC,D,E | 4.05% | .13% | 3.37% | (1.08)% | 1.13% | 5.58% |
| Ratios to Average Net AssetsF,G | | | | | | |
| Expenses before reductions | 1.44%H | 1.43% | 1.43% | 1.42% | 1.44% | 1.43% |
| Expenses net of fee waivers, if any | 1.44%H | 1.43% | 1.43% | 1.42% | 1.44% | 1.43% |
| Expenses net of all reductions | 1.43%H | 1.43% | 1.43% | 1.42% | 1.44% | 1.43% |
| Net investment income (loss) | 1.43%H | 1.50% | 1.54% | 1.44% | 1.49% | 1.69% |
| Supplemental Data | | | | | | |
| Net assets, end of period (in millions) | $35 | $45 | $54 | $61 | $60 | $61 |
| Portfolio turnover rateI | 13%H | 19%J | 26% | 28% | 14% | 17% |
A Calculated based on average shares outstanding during the period.
B Amount represents less than $.0005 per share.
C Total returns for periods of less than one year are not annualized.
D Total returns would have been lower if certain expenses had not been reduced during the applicable periods shown.
E Total returns do not include the effect of the contingent deferred sales charge.
F Fees and expenses of any underlying Fidelity Central Funds are not included in the Fund's expense ratio. The Fund indirectly bears its proportionate share of the expenses of any underlying Fidelity Central Funds.
G Expense ratios reflect operating expenses of the class. Expenses before reductions do not reflect amounts reimbursed by the investment adviser or reductions from expense offset arrangements and do not represent the amount paid by the class during periods when reimbursements or reductions occur. Expenses net of fee waivers reflect expenses after reimbursement by the investment adviser but prior to reductions from expense offset arrangements. Expenses net of all reductions represent the net expenses paid by the class.
H Annualized
I Amount does not include the portfolio activity of any underlying Fidelity Central Funds.
J Portfolio turnover rate excludes securities received or delivered in-kind.
See accompanying notes which are an integral part of the financial statements.
Fidelity Intermediate Municipal Income Fund
| | Six months ended (Unaudited) June 30, | Years endedDecember 31, | | | | |
| | 2019 | 2018 | 2017 | 2016 | 2015 | 2014 |
| Selected Per–Share Data | | | | | | |
| Net asset value, beginning of period | $10.24 | $10.39 | $10.21 | $10.51 | $10.55 | $10.17 |
| Income from Investment Operations | | | | | | |
| Net investment income (loss)A | .129 | .261 | .270 | .265 | .269 | .287 |
| Net realized and unrealized gain (loss) | .340 | (.141) | .183 | (.262) | (.038) | .389 |
| Total from investment operations | .469 | .120 | .453 | .003 | .231 | .676 |
| Distributions from net investment income | (.129) | (.261) | (.270) | (.265) | (.269) | (.289) |
| Distributions from net realized gain | – | (.009) | (.003) | (.038) | (.002) | (.007) |
| Total distributions | (.129) | (.270) | (.273) | (.303) | (.271) | (.296) |
| Redemption fees added to paid in capital | – | – | – | –A,B | –A,B | –A,B |
| Net asset value, end of period | $10.58 | $10.24 | $10.39 | $10.21 | $10.51 | $10.55 |
| Total ReturnC,D | 4.60% | 1.19% | 4.48% | (.01)% | 2.23% | 6.71% |
| Ratios to Average Net AssetsE,F | | | | | | |
| Expenses before reductions | .36%G | .37% | .36% | .35% | .36% | .37% |
| Expenses net of fee waivers, if any | .36%G | .37% | .36% | .35% | .36% | .37% |
| Expenses net of all reductions | .36%G | .37% | .36% | .35% | .36% | .36% |
| Net investment income (loss) | 2.50%G | 2.56% | 2.61% | 2.51% | 2.57% | 2.75% |
| Supplemental Data | | | | | | |
| Net assets, end of period (in millions) | $4,385 | $4,867 | $5,372 | $4,953 | $4,746 | $4,453 |
| Portfolio turnover rateH | 13%G | 19%I | 26% | 28% | 14% | 17% |
A Calculated based on average shares outstanding during the period.
B Amount represents less than $.0005 per share.
C Total returns for periods of less than one year are not annualized.
D Total returns would have been lower if certain expenses had not been reduced during the applicable periods shown.
E Fees and expenses of any underlying Fidelity Central Funds are not included in the Fund's expense ratio. The Fund indirectly bears its proportionate share of the expenses of any underlying Fidelity Central Funds.
F Expense ratios reflect operating expenses of the class. Expenses before reductions do not reflect amounts reimbursed by the investment adviser or reductions from expense offset arrangements and do not represent the amount paid by the class during periods when reimbursements or reductions occur. Expenses net of fee waivers reflect expenses after reimbursement by the investment adviser but prior to reductions from expense offset arrangements. Expenses net of all reductions represent the net expenses paid by the class.
G Annualized
H Amount does not include the portfolio activity of any underlying Fidelity Central Funds.
I Portfolio turnover rate excludes securities received or delivered in-kind.
See accompanying notes which are an integral part of the financial statements.
Fidelity Intermediate Municipal Income Fund Class I
| | Six months ended (Unaudited) June 30, | Years endedDecember 31, | | | | |
| | 2019 | 2018 | 2017 | 2016 | 2015 | 2014 |
| Selected Per–Share Data | | | | | | |
| Net asset value, beginning of period | $10.26 | $10.41 | $10.22 | $10.52 | $10.57 | $10.19 |
| Income from Investment Operations | | | | | | |
| Net investment income (loss)A | .125 | .253 | .263 | .257 | .261 | .282 |
| Net realized and unrealized gain (loss) | .340 | (.140) | .193 | (.261) | (.048) | .389 |
| Total from investment operations | .465 | .113 | .456 | (.004) | .213 | .671 |
| Distributions from net investment income | (.125) | (.254) | (.263) | (.258) | (.261) | (.284) |
| Distributions from net realized gain | – | (.009) | (.003) | (.038) | (.002) | (.007) |
| Total distributions | (.125) | (.263) | (.266) | (.296) | (.263) | (.291) |
| Redemption fees added to paid in capital | – | – | – | –A,B | –A,B | –A,B |
| Net asset value, end of period | $10.60 | $10.26 | $10.41 | $10.22 | $10.52 | $10.57 |
| Total ReturnC,D | 4.56% | 1.13% | 4.50% | (.09)% | 2.05% | 6.65% |
| Ratios to Average Net AssetsE,F | | | | | | |
| Expenses before reductions | .44%G | .44% | .44% | .43% | .44% | .41% |
| Expenses net of fee waivers, if any | .44%G | .44% | .44% | .43% | .44% | .41% |
| Expenses net of all reductions | .44%G | .44% | .44% | .43% | .44% | .41% |
| Net investment income (loss) | 2.42%G | 2.49% | 2.54% | 2.43% | 2.49% | 2.70% |
| Supplemental Data | | | | | | |
| Net assets, end of period (in millions) | $1,170 | $1,013 | $976 | $760 | $663 | $609 |
| Portfolio turnover rateH | 13%G | 19%I | 26% | 28% | 14% | 17% |
A Calculated based on average shares outstanding during the period.
B Amount represents less than $.0005 per share.
C Total returns for periods of less than one year are not annualized.
D Total returns would have been lower if certain expenses had not been reduced during the applicable periods shown.
E Fees and expenses of any underlying Fidelity Central Funds are not included in the Fund's expense ratio. The Fund indirectly bears its proportionate share of the expenses of any underlying Fidelity Central Funds.
F Expense ratios reflect operating expenses of the class. Expenses before reductions do not reflect amounts reimbursed by the investment adviser or reductions from expense offset arrangements and do not represent the amount paid by the class during periods when reimbursements or reductions occur. Expenses net of fee waivers reflect expenses after reimbursement by the investment adviser but prior to reductions from expense offset arrangements. Expenses net of all reductions represent the net expenses paid by the class.
G Annualized
H Amount does not include the portfolio activity of any underlying Fidelity Central Funds.
I Portfolio turnover rate excludes securities received or delivered in-kind.
See accompanying notes which are an integral part of the financial statements.
Fidelity Intermediate Municipal Income Fund Class Z
| | Six months ended (Unaudited) June 30, | Years endedDecember 31, |
| | 2019 | 2018 A |
| Selected Per–Share Data | | |
| Net asset value, beginning of period | $10.26 | $10.17 |
| Income from Investment Operations | | |
| Net investment income (loss)B | .131 | .070 |
| Net realized and unrealized gain (loss) | .341 | .086C |
| Total from investment operations | .472 | .156 |
| Distributions from net investment income | (.132) | (.065) |
| Distributions from net realized gain | – | (.001) |
| Total distributions | (.132) | (.066) |
| Net asset value, end of period | $10.60 | $10.26 |
| Total ReturnD,E | 4.62% | 1.54% |
| Ratios to Average Net AssetsF,G | | |
| Expenses before reductions | .31%H | .31%H |
| Expenses net of fee waivers, if any | .31%H | .31%H |
| Expenses net of all reductions | .31%H | .31%H |
| Net investment income (loss) | 2.55%H | 2.62%H |
| Supplemental Data | | |
| Net assets, end of period (in millions) | $1,503 | $321 |
| Portfolio turnover rateI | 13%H | 19%J |
A For the period October 2, 2018 (commencement of sale of shares) to December 31, 2018.
B Calculated based on average shares outstanding during the period.
C The amount shown for a share outstanding does not correspond with the aggregate net gain (loss) on investments for the period due to the timing of sales and repurchases of shares in relation to fluctuating market values of the investments of the Fund.
D Total returns for periods of less than one year are not annualized.
E Total returns would have been lower if certain expenses had not been reduced during the applicable periods shown.
F Fees and expenses of any underlying Fidelity Central Funds are not included in the Fund's expense ratio. The Fund indirectly bears its proportionate share of the expenses of any underlying Fidelity Central Funds.
G Expense ratios reflect operating expenses of the class. Expenses before reductions do not reflect amounts reimbursed by the investment adviser or reductions from expense offset arrangements and do not represent the amount paid by the class during periods when reimbursements or reductions occur. Expense ratios before reductions for start-up periods may not be representative of longer-term operating periods. Expenses net of fee waivers reflect expenses after reimbursement by the investment adviser but prior to reductions from expense offset arrangements. Expenses net of all reductions represent the net expenses paid by the class.
H Annualized
I Amount does not include the portfolio activity of any underlying Fidelity Central Funds.
J Portfolio turnover rate excludes securities received or delivered in-kind.
See accompanying notes which are an integral part of the financial statements.
Notes to Financial Statements (Unaudited)
For the period ended June 30, 2019
(Amounts in thousands except percentages)
1. Organization.
Fidelity Intermediate Municipal Income Fund (the Fund) is a fund of Fidelity School Street Trust (the Trust) and is authorized to issue an unlimited number of shares. The Trust is registered under the Investment Company Act of 1940, as amended (the 1940 Act), as an open-end management investment company organized as a Massachusetts business trust. The Fund offers Class A, Class M, Class C, Intermediate Municipal Income, Class I and Class Z shares, each of which has equal rights as to assets and voting privileges. Each class has exclusive voting rights with respect to matters that affect that class. Effective March 1, 2019, Class C shares will automatically convert to Class A shares after a holding period of ten years from the initial date of purchase, with certain exceptions.
2. Investments in Fidelity Central Funds.
The Fund invests in Fidelity Central Funds, which are open-end investment companies generally available only to other investment companies and accounts managed by the investment adviser and its affiliates. The Fund's Schedule of Investments lists each of the Fidelity Central Funds held as of period end, if any, as an investment of the Fund, but does not include the underlying holdings of each Fidelity Central Fund. As an Investing Fund, the Fund indirectly bears its proportionate share of the expenses of the underlying Fidelity Central Funds.
The Money Market Central Funds seek preservation of capital and current income and are managed by Fidelity Investments Money Management, Inc. (FIMM), an affiliate of the investment adviser. Annualized expenses of the Money Market Central Funds as of their most recent shareholder report date ranged from less than .005% to .01%.
A complete unaudited list of holdings for each Fidelity Central Fund is available upon request or at the Securities and Exchange Commission (the SEC) website at www.sec.gov. In addition, the financial statements of the Fidelity Central Funds are available on the SEC website or upon request.
3. Significant Accounting Policies.
The Fund is an investment company and applies the accounting and reporting guidance of the Financial Accounting Standards Board (FASB) Accounting Standards Codification Topic 946 Financial Services – Investments Companies. The financial statements have been prepared in conformity with accounting principles generally accepted in the United States of America (GAAP), which require management to make certain estimates and assumptions at the date of the financial statements. Actual results could differ from those estimates. Subsequent events, if any, through the date that the financial statements were issued have been evaluated in the preparation of the financial statements. The following summarizes the significant accounting policies of the Fund:
Investment Valuation. Investments are valued as of 4:00 p.m. Eastern time on the last calendar day of the period. The Board of Trustees (the Board) has delegated the day to day responsibility for the valuation of the Fund's investments to the Fair Value Committee (the Committee) established by the Fund's investment adviser. In accordance with valuation policies and procedures approved by the Board, the Fund attempts to obtain prices from one or more third party pricing vendors or brokers to value its investments. When current market prices, quotations or currency exchange rates are not readily available or reliable, investments will be fair valued in good faith by the Committee, in accordance with procedures adopted by the Board. Factors used in determining fair value vary by investment type and may include market or investment specific events, changes in interest rates and credit quality. The frequency with which these procedures are used cannot be predicted and they may be utilized to a significant extent. The Committee oversees the Fund's valuation policies and procedures and reports to the Board on the Committee's activities and fair value determinations. The Board monitors the appropriateness of the procedures used in valuing the Fund's investments and ratifies the fair value determinations of the Committee.
The Fund categorizes the inputs to valuation techniques used to value its investments into a disclosure hierarchy consisting of three levels as shown below:
- Level 1 – quoted prices in active markets for identical investments
- Level 2 – other significant observable inputs (including quoted prices for similar investments, interest rates, prepayment speeds, etc.)
- Level 3 – unobservable inputs (including the Fund's own assumptions based on the best information available)
Valuation techniques used to value the Fund's investments by major category are as follows:
Debt securities, including restricted securities, are valued based on evaluated prices received from third party pricing vendors or from brokers who make markets in such securities. Municipal securities are valued by pricing vendors who utilize matrix pricing which considers yield or price of bonds of comparable quality, coupon, maturity and type or by broker-supplied prices. When independent prices are unavailable or unreliable, debt securities may be valued utilizing pricing methodologies which consider similar factors that would be used by third party pricing vendors. Debt securities are generally categorized as Level 2 in the hierarchy but may be Level 3 depending on the circumstances.
Changes in valuation techniques may result in transfers in or out of an assigned level within the disclosure hierarchy. The aggregate value of investments by input level as of June 30, 2019 is included at the end of the Fund's Schedule of Investments.
Investment Transactions and Income. For financial reporting purposes, the Fund's investment holdings and NAV include trades executed through the end of the last business day of the period. The NAV per share for processing shareholder transactions is calculated as of the close of business of the New York Stock Exchange (NYSE), normally 4:00 p.m. Eastern time and includes trades executed through the end of the prior business day. Gains and losses on securities sold are determined on the basis of identified cost. Income and capital gain distributions from Fidelity Central Funds, if any, are recorded on the ex-dividend date. Interest income is accrued as earned and includes coupon interest and amortization of premium and accretion of discount on debt securities as applicable. Debt obligations may be placed on non-accrual status and related interest income may be reduced by ceasing current accruals and writing off interest receivables when the collection of all or a portion of interest has become doubtful based on consistently applied procedures. A debt obligation is removed from non-accrual status when the issuer resumes interest payments or when collectability of interest is reasonably assured.
Class Allocations and Expenses. Investment income, realized and unrealized capital gains and losses, common expenses of the Fund, and certain fund-level expense reductions, if any, are allocated daily on a pro-rata basis to each class based on the relative net assets of each class to the total net assets of the Fund. Each class differs with respect to transfer agent and distribution and service plan fees incurred. Certain expense reductions may also differ by class. For the reporting period, the allocated portion of income and expenses to each class as a percent of its average net assets may vary due to the timing of recording these transactions in relation to fluctuating net assets of the classes. Expenses directly attributable to a fund are charged to that fund. Expenses attributable to more than one fund are allocated among the respective funds on the basis of relative net assets or other appropriate methods. Expense estimates are accrued in the period to which they relate and adjustments are made when actual amounts are known.
Income Tax Information and Distributions to Shareholders. Each year, the Fund intends to qualify as a regulated investment company under Subchapter M of the Internal Revenue Code, including distributing substantially all of its taxable income and realized gains. As a result, no provision for U.S. Federal income taxes is required. The Fund files a U.S. federal tax return, in addition to state and local tax returns as required. The Fund's federal income tax returns are subject to examination by the Internal Revenue Service (IRS) for a period of three fiscal years after they are filed. State and local tax returns may be subject to examination for an additional fiscal year depending on the jurisdiction.
Distributions are declared and recorded daily and paid monthly from net investment income. Distributions from realized gains, if any, are declared and recorded on the ex-dividend date. Income and capital gain distributions are declared separately for each class. Income and capital gain distributions are determined in accordance with income tax regulations, which may differ from GAAP.
Capital accounts within the financial statements are adjusted for permanent book-tax differences. These adjustments have no impact on net assets or the results of operations. Capital accounts are not adjusted for temporary book-tax differences which will reverse in a subsequent period.
Book-tax differences are primarily due to market discount, deferred trustees compensation and losses deferred due to wash sales and excise tax regulations.
The Fund purchases municipal securities whose interest, in the opinion of the issuer, is free from federal income tax. There is no assurance that the Internal Revenue Service (IRS) will agree with this opinion. In the event the IRS determines that the issuer does not comply with relevant tax requirements, interest payments from a security could become federally taxable, possibly retroactively to the date the security was issued.
As of period end, the cost and unrealized appreciation (depreciation) in securities, and derivatives if applicable, for federal income tax purposes were as follows:
| Gross unrealized appreciation | $293,702 |
| Gross unrealized depreciation | (362) |
| Net unrealized appreciation (depreciation) | $293,340 |
| Tax cost | $6,952,338 |
The Fund elected to defer to its next fiscal year approximately $1,495 of capital losses recognized during the period November 1, 2018 to December 31, 2018.
Delayed Delivery Transactions and When-Issued Securities. During the period, the Fund transacted in securities on a delayed delivery or when-issued basis. Payment and delivery may take place after the customary settlement period for that security. The price of the underlying securities and the date when the securities will be delivered and paid for are fixed at the time the transaction is negotiated. The securities purchased on a delayed delivery or when-issued basis are identified as such in the Fund's Schedule of Investments. The Fund may receive compensation for interest forgone in the purchase of a delayed delivery or when-issued security. With respect to purchase commitments, the Fund identifies securities as segregated in its records with a value at least equal to the amount of the commitment. Losses may arise due to changes in the value of the underlying securities or if the counterparty does not perform under the contract's terms, or if the issuer does not issue the securities due to political, economic, or other factors.
Restricted Securities. The Fund may invest in securities that are subject to legal or contractual restrictions on resale. These securities generally may be resold in transactions exempt from registration or to the public if the securities are registered. Disposal of these securities may involve time-consuming negotiations and expense, and prompt sale at an acceptable price may be difficult. Information regarding restricted securities is included at the end of the Fund's Schedule of Investments.
4. Purchases and Sales of Investments.
Purchases and sales of securities, other than short-term securities, aggregated $1,262,213 and $400,739, respectively.
Prior Fiscal Year Unaffiliated Redemptions In-Kind. During the prior period, 18,537 shares of the Fund were redeemed in-kind for investments, including accrued interest, and cash with a value of $190,000. The Fund had a net realized gain of $2,651 on investments delivered through in-kind redemptions. The amount of the in-kind redemptions is included in share transactions in the accompanying Statement of Changes in Net Assets as well as the Notes to Financial Statements. The Fund recognized no gain or loss for federal income tax purposes.
5. Fees and Other Transactions with Affiliates.
Management Fee. Fidelity Management & Research Company (the investment adviser) and its affiliates provide the Fund with investment management related services for which the Fund pays a monthly management fee. The fee is based on an annual asset based fee of .10% of the Fund's average net assets plus an income based fee of 5% of the Fund's gross income throughout the month. For the reporting period, the total annualized management fee rate was .24% of average net assets.
Distribution and Service Plan Fees. In accordance with Rule 12b-1 of the 1940 Act, the Fund has adopted separate Distribution and Service Plans for each class of shares. Certain classes pay Fidelity Distributors Corporation (FDC), an affiliate of the investment adviser, separate Distribution and Service Fees, each of which is based on an annual percentage of each class' average net assets. In addition, FDC may pay financial intermediaries for selling shares of the Fund and providing shareholder support services. For the period, the Distribution and Service Fee rates, total fees and amounts retained by FDC were as follows:
| | Distribution Fee | Service Fee | Total Fees | Retained by FDC |
| Class A | -% | .25% | $115 | $5 |
| Class M | -% | .25% | 21 | – |
| Class C | .75% | .25% | 199 | 10 |
| | | | $335 | $15 |
Sales Load. FDC may receive a front-end sales charge of up to 4.00% for selling Class A shares and Class M shares, some of which is paid to financial intermediaries for selling shares of the Fund. Depending on the holding period, FDC may receive contingent deferred sales charges levied on Class A, Class M and Class C redemptions. The deferred sales charges are 1.00% for Class C shares, .75% for certain purchases of Class A shares and .25% for certain purchases of Class M shares.
For the period, sales charge amounts retained by FDC were as follows:
| | Retained by FDC |
| Class A | $2 |
| Class M | –(a) |
| Class C(b) | 1 |
| | $3 |
(a) In the amount of less than $500.
(b) When Class C shares are initially sold, FDC pays commissions from its own resources to financial intermediaries through which the sales are made.
Transfer Agent Fees. Fidelity Investments Institutional Operations Company, Inc. (FIIOC), an affiliate of the investment adviser, is the transfer, dividend disbursing and shareholder servicing agent for the Fund. FIIOC receives account fees and asset-based fees that vary according to the account size and type of account of the shareholders of the respective classes of the Fund, except for Class Z. FIIOC receives an asset-based fee of Class Z's average net assets. FIIOC pays for typesetting, printing and mailing of shareholder reports, except proxy statements. For the period, transfer agent fees for each class were as follows:
| | Amount | % of Class-Level Average Net Assets(a) |
| Class A | $78 | .17 |
| Class M | 11 | .14 |
| Class C | 32 | .16 |
| Intermediate Municipal Income | 2,134 | .10 |
| Class I | 947 | .18 |
| Class Z | 303 | .05 |
| | $3,505 | |
(a) Annualized
Accounting Fees. Fidelity Service Company, Inc. (FSC), an affiliate of the investment adviser, maintains the Fund's accounting records. The fee is based on the level of average net assets for each month. For the period, the fees were equivalent to an annualized rate of .01%.
Interfund Trades. The Fund may purchase from or sell securities to other Fidelity Funds under procedures adopted by the Board. The procedures have been designed to ensure these interfund trades are executed in accordance with Rule 17a-7 of the 1940 Act. Interfund trades are included within the respective purchases and sales amounts shown in the Purchases and Sales of Investments note.
6. Committed Line of Credit.
The Fund participates with other funds managed by the investment adviser or an affiliate in a $4.25 billion credit facility (the "line of credit") to be utilized for temporary or emergency purposes to fund shareholder redemptions or for other short-term liquidity purposes. The Fund has agreed to pay commitment fees on its pro-rata portion of the line of credit, which amounted to $9 and is reflected in Miscellaneous expenses on the Statement of Operations. During the period, the Fund did not borrow on this line of credit.
7. Expense Reductions.
Through arrangements with the Fund's custodian, credits realized as a result of certain uninvested cash balances were used to reduce the Fund's expenses. During the period, these credits reduced the Fund's custody expenses by $15.
In addition, during the period the investment adviser reimbursed and/or waived a portion of class-level operating expenses as follows:
| | Amount |
| Intermediate Municipal Income | $ 10 |
| Class I | 2 |
| Class Z | 3 |
| | $16 |
8. Distributions to Shareholders.
Distributions to shareholders of each class were as follows:
| | Six months ended
June 30, 2019 | Year ended
December 31, 2018(a) |
| Distributions to shareholders | | |
| Class A | $994 | $1,965 |
| Class M | 180 | 383 |
| Class C | 282 | 773 |
| Intermediate Municipal Income | 54,269 | 134,917 |
| Class I | 12,944 | 28,725 |
| Class Z | 15,279 | 1,108 |
| Total | $83,948 | $167,871 |
(a) Distributions for Class Z are for the period October 2, 2018 (commencement of sale of shares) to December 31, 2018.
9. Share Transactions.
Share transactions for each class were as follows and may contain automatic conversions between classes or exchanges between affiliated funds:
| | Shares | Shares | Dollars | Dollars |
| | Six months ended June 30, 2019 | Year ended December 31, 2018(a) | Six months ended June 30, 2019 | Year ended December 31, 2018(a) |
| Class A | | | | |
| Shares sold | 1,505 | 2,380 | $15,677 | $24,290 |
| Reinvestment of distributions | 89 | 176 | 925 | 1,800 |
| Shares redeemed | (870) | (2,837) | (9,070) | (28,960) |
| Net increase (decrease) | 724 | (281) | $7,532 | $(2,870) |
| Class M | | | | |
| Shares sold | 381 | 154 | $3,967 | $1,568 |
| Reinvestment of distributions | 16 | 35 | 171 | 362 |
| Shares redeemed | (106) | (485) | (1,096) | (4,947) |
| Net increase (decrease) | 291 | (296) | $3,042 | $(3,017) |
| Class C | | | | |
| Shares sold | 209 | 468 | $2,177 | $4,774 |
| Reinvestment of distributions | 24 | 67 | 250 | 688 |
| Shares redeemed | (1,316) | (1,328) | (13,688) | (13,565) |
| Net increase (decrease) | (1,083) | (793) | $(11,261) | $(8,103) |
| Intermediate Municipal Income | | | | |
| Shares sold | 45,924 | 188,152 | $477,787 | $1,919,955 |
| Reinvestment of distributions | 3,520 | 9,098 | 36,755 | 92,840 |
| Shares redeemed | (110,175) | (238,894)(b) | (1,138,234) | (2,437,317)(b) |
| Net increase (decrease) | (60,731) | (41,644) | $(623,692) | $(424,522) |
| Class I | | | | |
| Shares sold | 21,881 | 65,564 | $228,177 | $670,790 |
| Reinvestment of distributions | 1,125 | 2,612 | 11,776 | 26,680 |
| Shares redeemed | (11,416) | (63,108) | (118,872) | (640,916) |
| Net increase (decrease) | 11,590 | 5,068 | $121,081 | $56,554 |
| Class Z | | | | |
| Shares sold | 125,316 | 32,913 | $1,296,671 | $332,677 |
| Reinvestment of distributions | 1,316 | 107 | 13,783 | 1,093 |
| Shares redeemed | (16,146) | (1,757) | (168,558) | (17,926) |
| Net increase (decrease) | 110,486 | 31,263 | $1,141,896 | $315,844 |
(a) Share transactions for Class Z are for the period October 2, 2018 (commencement of sale of shares) to December 31, 2018
(b) Amount includes in-kind redemptions (see the Prior Fiscal Year Unaffiliated Redemptions In-Kind note for additional details).
10. Other.
The Fund's organizational documents provide former and current trustees and officers with a limited indemnification against liabilities arising in connection with the performance of their duties to the Fund. In the normal course of business, the Fund may also enter into contracts that provide general indemnifications. The Fund's maximum exposure under these arrangements is unknown as this would be dependent on future claims that may be made against the Fund. The risk of material loss from such claims is considered remote.
Shareholder Expense Example
As a shareholder of the Fund, you incur two types of costs: (1) transaction costs, including sales charges (loads) on purchase payments or redemption proceeds, and (2) ongoing costs, including management fees, distribution and/or service (12b-1) fees and other Fund expenses. This Example is intended to help you understand your ongoing costs (in dollars) of investing in the Fund and to compare these costs with the ongoing costs of investing in other mutual funds.
The Example is based on an investment of $1,000 invested at the beginning of the period and held for the entire period (January 1, 2019 to June 30, 2019).
Actual Expenses
The first line of the accompanying table for each class of the Fund provides information about actual account values and actual expenses. You may use the information in this line, together with the amount you invested, to estimate the expenses that you paid over the period. Simply divide your account value by $1,000.00 (for example, an $8,600 account value divided by $1,000.00 = 8.6), then multiply the result by the number in the first line for a class of the Fund under the heading entitled "Expenses Paid During Period" to estimate the expenses you paid on your account during this period. In addition, the Fund, as a shareholder in the underlying Fidelity Central Funds, will indirectly bear its pro-rata share of the fees, and expenses incurred by the underlying Fidelity Central Funds. These fees and expenses are not included in the Fund's annualized expense ratio used to calculate the expense estimate in the table below.
Hypothetical Example for Comparison Purposes
The second line of the accompanying table for each class of the Fund provides information about hypothetical account values and hypothetical expenses based on a Class' actual expense ratio and an assumed rate of return of 5% per year before expenses, which is not the Class' actual return. The hypothetical account values and expenses may not be used to estimate the actual ending account balance or expenses you paid for the period. You may use this information to compare the ongoing costs of investing in the Fund and other funds. To do so, compare this 5% hypothetical example with the 5% hypothetical examples that appear in the shareholder reports of the other funds. In addition, the Fund, as a shareholder in the underlying Fidelity Central Funds, will indirectly bear its pro-rata share of the fees and expenses incurred by the underlying Fidelity Central Funds. These fees and expenses are not included in the Fund's annualized expense ratio used to calculate the expense estimate in the table below.
Please note that the expenses shown in the table are meant to highlight your ongoing costs only and do not reflect any transaction costs. Therefore, the second line of the table is useful in comparing ongoing costs only, and will not help you determine the relative total costs of owning different funds. In addition, if these transactional costs were included, your costs would have been higher.
| | Annualized Expense Ratio-A | Beginning
Account Value
January 1, 2019 | Ending
Account Value
June 30, 2019 | Expenses Paid
During Period-B
January 1, 2019
to June 30, 2019 |
| Class A | .68% | | | |
| Actual | | $1,000.00 | $1,044.30 | $3.45 |
| Hypothetical-C | | $1,000.00 | $1,021.42 | $3.41 |
| Class M | .65% | | | |
| Actual | | $1,000.00 | $1,044.50 | $3.30 |
| Hypothetical-C | | $1,000.00 | $1,021.57 | $3.26 |
| Class C | 1.44% | | | |
| Actual | | $1,000.00 | $1,040.50 | $7.29 |
| Hypothetical-C | | $1,000.00 | $1,017.65 | $7.20 |
| Intermediate Municipal Income | .36% | | | |
| Actual | | $1,000.00 | $1,046.00 | $1.83 |
| Hypothetical-C | | $1,000.00 | $1,023.01 | $1.81 |
| Class I | .44% | | | |
| Actual | | $1,000.00 | $1,045.60 | $2.23 |
| Hypothetical-C | | $1,000.00 | $1,022.61 | $2.21 |
| Class Z | .31% | | | |
| Actual | | $1,000.00 | $1,046.20 | $1.57 |
| Hypothetical-C | | $1,000.00 | $1,023.26 | $1.56 |
A Annualized expense ratio reflects expenses net of applicable fee waivers.
B Expenses are equal to each Class' annualized expense ratio, multiplied by the average account value over the period, multiplied by 181/365 (to reflect the one-half year period).
C 5% return per year before expenses
LIM-SANN-0819
1.706327.121
Fidelity® Series International Credit Fund
Semi-Annual Report June 30, 2019 |
|
Beginning on January 1, 2021, as permitted by regulations adopted by the Securities and Exchange Commission, paper copies of a fund’s shareholder reports will no longer be sent by mail, unless you specifically request paper copies of the reports from the fund or from your financial intermediary, such as a financial advisor, broker-dealer or bank. Instead, the reports will be made available on a website, and you will be notified by mail each time a report is posted and provided with a website link to access the report.
If you already elected to receive shareholder reports electronically, you will not be affected by this change and you need not take any action. You may elect to receive shareholder reports and other communications from a fund electronically, by contacting your financial intermediary. For Fidelity customers, visit Fidelity's web site or call Fidelity using the contact information listed below.
You may elect to receive all future reports in paper free of charge. If you wish to continue receiving paper copies of your shareholder reports, you may contact your financial intermediary or, if you are a Fidelity customer, visit Fidelity’s website, or call Fidelity at the applicable toll-free number listed below. Your election to receive reports in paper will apply to all funds held with the fund complex/your financial intermediary.
| Account Type | Website | Phone Number |
| Brokerage, Mutual Fund, or Annuity Contracts: | fidelity.com/mailpreferences | 1-800-343-3548 |
| Employer Provided Retirement Accounts: | netbenefits.fidelity.com/preferences (choose 'no' under Required Disclosures to continue to print) | 1-800-343-0860 |
| Advisor Sold Accounts Serviced Through Your Financial Intermediary: | Contact Your Financial Intermediary | Your Financial Intermediary's phone number |
| Advisor Sold Accounts Serviced by Fidelity: | institutional.fidelity.com | 1-877-208-0098 |
Contents
To view a fund's proxy voting guidelines and proxy voting record for the 12-month period ended June 30, visit http://www.fidelity.com/proxyvotingresults or visit the Securities and Exchange Commission's (SEC) web site at http://www.sec.gov.
You may also call 1-800-544-8544 to request a free copy of the proxy voting guidelines.
Standard & Poor's, S&P and S&P 500 are registered service marks of The McGraw-Hill Companies, Inc. and have been licensed for use by Fidelity Distributors Corporation.
Other third-party marks appearing herein are the property of their respective owners.
All other marks appearing herein are registered or unregistered trademarks or service marks of FMR LLC or an affiliated company. © 2019 FMR LLC. All rights reserved.
This report and the financial statements contained herein are submitted for the general information of the shareholders of the Fund. This report is not authorized for distribution to prospective investors in the Fund unless preceded or accompanied by an effective prospectus.
A fund files its complete schedule of portfolio holdings with the SEC for the first and third quarters of each fiscal year on Form N-PORT. Forms N-PORT are available on the SEC’s web site at http://www.sec.gov. A fund's Forms N-PORT may be reviewed and copied at the SEC’s Public Reference Room in Washington, DC. Information regarding the operation of the SEC's Public Reference Room may be obtained by calling 1-800-SEC-0330.
For a complete list of a fund's portfolio holdings, view the most recent holdings listing, semiannual report, or annual report on Fidelity's web site at http://www.fidelity.com, http://www.institutional.fidelity.com, or http://www.401k.com, as applicable.
NOT FDIC INSURED •MAY LOSE VALUE •NO BANK GUARANTEE
Neither the Fund nor Fidelity Distributors Corporation is a bank.
Investment Summary (Unaudited)
Geographic Diversification (% of fund's net assets)
| As of June 30, 2019 |
| | United States of America | 19.4% |
| | United Kingdom | 14.6% |
| | Netherlands | 9.6% |
| | Luxembourg | 8.0% |
| | Denmark | 6.5% |
| | Switzerland | 6.3% |
| | Italy | 6.2% |
| | Germany | 5.9% |
| | France | 4.9% |
| | Other | 18.6% |

Percentages are based on country or territory of incorporation and are adjusted for the effect of futures contracts, options and swaps, as applicable. Foreign currency contracts and other assets and liabilities are included within the United States of America, as applicable.
Quality Diversification (% of fund's net assets)
| As of June 30, 2019 |
| | U.S. Government and U.S. Government Agency Obligations | 2.5% |
| | AA | 1.7% |
| | A | 2.7% |
| | BBB | 60.5% |
| | BB and Below | 19.2% |
| | Not Rated | 6.2% |
| | Equities | 0.6% |
| | Short-Term Investments and Net Other Assets | 6.6% |

We have used ratings from Moody's Investors Service, Inc. Where Moody's® ratings are not available, we have used S&P® ratings. All ratings are as of the date indicated and do not reflect subsequent changes.
Asset Allocation (% of fund's net assets)
| As of June 30, 2019*,** |
| | Corporate Bonds | 65.4% |
| | U.S. Government and U.S. Government Agency Obligations | 2.5% |
| | Foreign Government and Government Agency Obligations | 6.2% |
| | Nonconvertible Preferred Stocks | 0.6% |
| | Preferred Securities | 18.7% |
| | Short-Term Investments and Net Other Assets (Liabilities) | 6.6% |

* Futures and Swaps - 27.5%
** Foreign Currency Contracts - (77.7)%
Schedule of Investments June 30, 2019 (Unaudited)
Showing Percentage of Net Assets
| Nonconvertible Bonds - 65.4% | | | |
| | | Principal Amount(a) | Value |
| Argentina - 0.9% | | | |
| YPF SA 8.5% 3/23/21 (Reg. S) | | $950,000 | $966,031 |
| Bailiwick of Jersey - 0.9% | | | |
| Heathrow Funding Ltd. 7.125% 2/14/24 | GBP | 650,000 | 999,362 |
| Denmark - 6.3% | | | |
| Danske Bank A/S: | | | |
| 1.375% 5/24/22 (Reg. S) | EUR | 450,000 | 523,402 |
| 5% 1/12/22 (b) | | 1,000,000 | 1,045,744 |
| 5.375% 1/12/24 (Reg. S) | | 1,250,000 | 1,350,499 |
| DONG Energy A/S 2.125% 5/17/27 (Reg. S) | GBP | 500,000 | 653,493 |
| Nykredit Realkredit A/S 4% 6/3/36 (Reg. S) (c) | EUR | 2,312,000 | 2,772,317 |
| Vestas Wind Systems A/S 2.75% 3/11/22 (Reg. S) | EUR | 405,000 | 487,411 |
|
| TOTAL DENMARK | | | 6,832,866 |
|
| Estonia - 0.3% | | | |
| Luminor Bank A/S Estonia 1.375% 10/21/22 (Reg. S) | EUR | 260,000 | 298,404 |
| France - 3.8% | | | |
| Casino Guichard Perrachon SA 5.244% 3/9/20 (c) | EUR | 300,000 | 334,734 |
| Iliad SA 0.625% 11/25/21 (Reg. S) | EUR | 1,700,000 | 1,926,111 |
| Lagardere S.C.A.: | | | |
| 1.625% 6/21/24 (Reg. S) | EUR | 900,000 | 1,026,231 |
| 2.75% 4/13/23 (Reg. S) | EUR | 700,000 | 836,127 |
|
| TOTAL FRANCE | | | 4,123,203 |
|
| Germany - 5.5% | | | |
| alstria office REIT-AG 1.5% 11/15/27 (Reg. S) | EUR | 500,000 | 578,362 |
| Bayer AG: | | | |
| 2.375% 4/2/75 (Reg. S) (c) | EUR | 700,000 | 794,872 |
| 3% 7/1/75 (Reg S.) (c) | EUR | 450,000 | 519,924 |
| Deutsche Bank AG: | | | |
| 1.625% 2/12/21 (Reg. S) | EUR | 2,800,000 | 3,208,881 |
| 5% 6/24/20 | EUR | 700,000 | 822,645 |
|
| TOTAL GERMANY | | | 5,924,684 |
|
| Ireland - 1.3% | | | |
| Allied Irish Banks PLC 4.125% 11/26/25 (Reg. S) (c) | EUR | 1,005,000 | 1,196,716 |
| Bank Ireland Group PLC 3.125% 9/19/27 (Reg. S) (c) | GBP | 200,000 | 249,393 |
|
| TOTAL IRELAND | | | 1,446,109 |
|
| Italy - 2.6% | | | |
| Banca Monte dei Paschi di Siena SpA 5.375% 1/18/28 (c) | EUR | 440,000 | 303,321 |
| Telecom Italia SpA 4% 4/11/24 (Reg. S) | EUR | 450,000 | 552,371 |
| UniCredit SpA: | | | |
| 4.375% 1/3/27 (Reg. S) (c) | EUR | 400,000 | 474,762 |
| 6.572% 1/14/22 (b) | | 1,350,000 | 1,434,718 |
|
| TOTAL ITALY | | | 2,765,172 |
|
| Luxembourg - 5.5% | | | |
| Alpha Trains Finance SA 2.064% 6/30/25 | EUR | 802,000 | 959,476 |
| Blackstone Property Partners Europe LP: | | | |
| 1.4% 7/6/22 (Reg. S) | EUR | 360,000 | 418,783 |
| 2% 2/15/24 (Reg. S) | EUR | 400,000 | 476,940 |
| 2.2% 7/24/25 (Reg. S) | EUR | 1,272,000 | 1,526,993 |
| CPI Property Group SA 1.45% 4/14/22 (Reg. S) | EUR | 1,540,000 | 1,774,118 |
| Millicom International Cellular SA 6.625% 10/15/26 (b) | | 185,000 | 201,570 |
| SELP Finance SARL 1.5% 12/20/26 (Reg. S) | EUR | 520,000 | 601,281 |
|
| TOTAL LUXEMBOURG | | | 5,959,161 |
|
| Mexico - 3.7% | | | |
| CEMEX S.A.B. de CV 3.125% 3/19/26 (Reg. S) | EUR | 550,000 | 639,948 |
| Gruma S.A.B. de CV 4.875% 12/1/24 (Reg. S) | | 465,000 | 494,063 |
| Petroleos Mexicanos: | | | |
| 2.5% 11/24/22 (Reg. S) | EUR | 100,000 | 110,157 |
| 3.625% 11/24/25 (Reg. S) | EUR | 390,000 | 423,236 |
| 3.75% 2/21/24 (Reg. S) | EUR | 2,050,000 | 2,320,128 |
|
| TOTAL MEXICO | | | 3,987,532 |
|
| Netherlands - 5.5% | | | |
| ABN AMRO Bank NV 4.4% 3/27/28 (Reg. S) (c) | | 400,000 | 412,283 |
| Demeter Investments BV: | | | |
| 5.625% 8/15/52 (Reg. S) (c) | | 250,000 | 267,188 |
| 5.75% 8/15/50 (Reg. S) (c) | | 550,000 | 592,625 |
| Koninklijke Ahold Delhaize NV 0.25% 6/26/25 (Reg. S) | EUR | 700,000 | 792,492 |
| Mylan NV 2.25% 11/22/24 (Reg. S) | EUR | 490,000 | 566,874 |
| Petrobras Global Finance BV 8.75% 5/23/26 | | 700,000 | 864,570 |
| Samvardhana Motherson Automotive Systems Group BV 1.8% 7/6/24 (Reg. S) | EUR | 790,000 | 821,845 |
| Teva Pharmaceutical Finance Netherlands III BV: | | | |
| 0.375% 7/25/20 (Reg. S) | EUR | 502,000 | 559,408 |
| 4.5% 3/1/25 | EUR | 350,000 | 381,058 |
| WPC Eurobond BV 2.25% 4/9/26 | EUR | 560,000 | 678,709 |
|
| TOTAL NETHERLANDS | | | 5,937,052 |
|
| Spain - 1.8% | | | |
| CaixaBank SA 1.75% 10/24/23 (Reg. S) | EUR | 1,200,000 | 1,423,740 |
| Indra Sistemas SA 3% 4/19/24 (Reg. S) | EUR | 400,000 | 466,120 |
|
| TOTAL SPAIN | | | 1,889,860 |
|
| Sweden - 3.3% | | | |
| Heimstaden Bostad AB 1.75% 12/7/21 (Reg. S) | EUR | 1,560,000 | 1,828,430 |
| Samhallsbyggnadsbolaget I Norden AB 1.75% 1/14/25 (Reg. S) | EUR | 1,060,000 | 1,225,669 |
| Vattenfall AB 0.5% 6/24/26 (Reg. S) | EUR | 400,000 | 459,932 |
|
| TOTAL SWEDEN | | | 3,514,031 |
|
| Switzerland - 6.3% | | | |
| Credit Suisse Group AG: | | | |
| 5.75% 9/18/25 (Reg. S) (c) | EUR | 800,000 | 967,672 |
| 6.5% 8/8/23 (Reg. S) | | 2,300,000 | 2,530,000 |
| UBS AG 4.75% 2/12/26 (Reg. S) (c) | EUR | 2,765,000 | 3,352,301 |
|
| TOTAL SWITZERLAND | | | 6,849,973 |
|
| Turkey - 1.0% | | | |
| Turkiye Garanti Bankasi A/S: | | | |
| 3.375% 7/8/19 (Reg. S) | EUR | 486,000 | 551,249 |
| 6.25% 4/20/21 (Reg. S) | | 530,000 | 537,950 |
|
| TOTAL TURKEY | | | 1,089,199 |
|
| United Kingdom - 6.2% | | | |
| Barclays PLC: | | | |
| 2% 2/7/28 (Reg. S) (c) | EUR | 500,000 | 558,093 |
| 2.625% 11/11/25 (Reg. S) (c) | EUR | 900,000 | 1,036,457 |
| 3.932% 5/7/25 (c) | | 200,000 | 203,451 |
| BAT International Finance PLC 1.25% 3/13/27 (Reg. S) | EUR | 590,000 | 663,429 |
| CYBG PLC 3.125% 6/22/25 (Reg. S) (c) | GBP | 295,000 | 365,023 |
| Imperial Tobacco Finance PLC: | | | |
| 1.125% 8/14/23 (Reg. S) | EUR | 950,000 | 1,101,619 |
| 3.375% 2/26/26 (Reg. S) | EUR | 400,000 | 514,090 |
| 8.125% 3/15/24 | GBP | 550,000 | 887,039 |
| John Lewis PLC 6.125% 1/21/25 | GBP | 214,000 | 304,817 |
| Nationwide Building Society 3.622% 4/26/23 (b)(c) | | 355,000 | 361,457 |
| Travis Perkins PLC: | | | |
| 4.375% 9/15/21 (Reg. S) | GBP | 150,000 | 196,588 |
| 4.5% 9/7/23 (Reg. S) | GBP | 350,000 | 456,003 |
|
| TOTAL UNITED KINGDOM | | | 6,648,066 |
|
| United States of America - 10.5% | | | |
| Bayer U.S. Finance II LLC 4.25% 12/15/25 (b) | | 1,650,000 | 1,744,793 |
| CEMEX Finance LLC 4.625% 6/15/24 | EUR | 1,210,000 | 1,444,779 |
| Citigroup, Inc. 4.3% 11/20/26 | | 192,000 | 203,818 |
| Ford Motor Credit Co. LLC 1.514% 2/17/23 | EUR | 1,300,000 | 1,487,602 |
| Goldman Sachs Group, Inc. 4.25% 10/21/25 | | 1,013,000 | 1,074,204 |
| International Flavors & Fragrances, Inc. 1.8% 9/25/26 | EUR | 900,000 | 1,090,590 |
| Marsh & McLennan Companies, Inc. 1.349% 9/21/26 | EUR | 550,000 | 650,723 |
| Morgan Stanley: | | | |
| 3.95% 4/23/27 | | 362,000 | 378,479 |
| 4.35% 9/8/26 | | 600,000 | 643,139 |
| Reynolds American, Inc. 4.45% 6/12/25 | | 2,057,000 | 2,180,063 |
| Time Warner Cable, Inc. 4.5% 9/15/42 | | 475,000 | 446,305 |
|
| TOTAL UNITED STATES OF AMERICA | | | 11,344,495 |
|
| TOTAL NONCONVERTIBLE BONDS | | | |
| (Cost $70,599,367) | | | 70,575,200 |
|
| U.S. Government and Government Agency Obligations - 2.5% | | | |
| U.S. Treasury Obligations - 2.5% | | | |
| U.S. Treasury Bonds: | | | |
| 2.5% 2/15/45 (d) | | $64,000 | $63,685 |
| 3% 5/15/47 (d)(e) | | 318,000 | 347,899 |
| 5% 5/15/37 | | 50,000 | 70,441 |
| U.S. Treasury Notes: | | | |
| 1.25% 10/31/21 | | 100,000 | 98,852 |
| 2.125% 11/30/24 (f) | | 1,500,000 | 1,524,961 |
| 2.125% 5/15/25 (e) | | 375,000 | 381,123 |
| 2.625% 2/15/29 | | 170,000 | 179,171 |
| | | | 2,666,132 |
| TOTAL U.S. GOVERNMENT AND GOVERNMENT AGENCY OBLIGATIONS | | | |
| (Cost $2,541,750) | | | 2,666,132 |
|
| Foreign Government and Government Agency Obligations - 6.2% | | | |
| Indonesia - 1.4% | | | |
| Indonesian Republic 2.625% 6/14/23 | EUR | $1,220,000 | $1,496,509 |
| Italy - 3.0% | | | |
| Italian Republic 3.75% 5/1/21 (b) | EUR | 2,700,000 | 3,266,692 |
| United Kingdom - 1.8% | | | |
| United Kingdom, Great Britain and Northern Ireland: | | | |
| 1.625% 10/22/28 | GBP | 100,000 | 135,937 |
| 1.75% 9/7/37 (e) | GBP | 708,000 | 956,938 |
| 4.25% 12/7/49(d)(e) | GBP | 407,000 | 870,202 |
|
| TOTAL UNITED KINGDOM | | | 1,963,077 |
|
| TOTAL FOREIGN GOVERNMENT AND GOVERNMENT AGENCY OBLIGATIONS | | | |
| (Cost $6,615,662) | | | 6,726,278 |
| | | Shares | Value |
|
| Nonconvertible Preferred Stocks - 0.6% | | | |
| United Kingdom - 0.6% | | | |
| Nationwide Building Society 10.25% | | | |
| (Cost $677,724) | | 3,254 | 623,478 |
| | | Principal Amount(a) | Value |
|
| Preferred Securities - 18.7% | | | |
| Australia - 0.6% | | | |
| QBE Insurance Group Ltd. 5.25% (Reg. S) (c)(g) | | 700,000 | 689,268 |
| Canada - 0.7% | | | |
| Bank of Nova Scotia 4.65% (c)(g) | | 800,000 | 773,499 |
| Denmark - 0.2% | | | |
| Danske Bank A/S 5.875% (Reg. S) (c)(g) | EUR | 220,000 | 267,384 |
| France - 1.1% | | | |
| Credit Agricole Assurances SA 4.25% (Reg. S) (c)(g) | EUR | 600,000 | 755,929 |
| Danone SA 1.75% (Reg. S) (c)(g) | EUR | 400,000 | 462,974 |
|
| TOTAL FRANCE | | | 1,218,903 |
|
| Germany - 0.4% | | | |
| Deutsche Bank AG 6% (Reg. S) (c)(g) | EUR | 400,000 | 408,753 |
| Ireland - 0.5% | | | |
| Allied Irish Banks PLC 7.375% (Reg. S) (c)(g) | EUR | 400,000 | 493,232 |
| Italy - 0.6% | | | |
| Assicurazioni Generali SpA 6.416% (c)(g) | GBP | 500,000 | 681,097 |
| Luxembourg - 2.5% | | | |
| CPI Property Group SA 4.375% (Reg. S) (c)(g) | EUR | 750,000 | 864,701 |
| Grand City Properties SA 3.75% (c)(g) | EUR | 1,500,000 | 1,825,507 |
|
| TOTAL LUXEMBOURG | | | 2,690,208 |
|
| Netherlands - 4.1% | | | |
| Deutsche Annington Finance BV 4% (Reg. S) (c)(g) | EUR | 300,000 | 371,910 |
| Stichting AK Rabobank Certificaten 6.5% (Reg. S) (g) | EUR | 510,000 | 708,590 |
| Volkswagen International Finance NV: | | | |
| 2.5%(Reg. S) (c)(g) | EUR | 1,395,000 | 1,620,745 |
| 2.7%(Reg. S) (c)(g) | EUR | 500,000 | 584,598 |
| 3.75% (c)(g) | EUR | 950,000 | 1,134,615 |
|
| TOTAL NETHERLANDS | | | 4,420,458 |
|
| Spain - 1.5% | | | |
| Banco Bilbao Vizcaya Argentaria SA: | | | |
| 5.875% (Reg. S) (c)(g) | EUR | 600,000 | 706,117 |
| 6.75% (Reg. S) (c)(g) | EUR | 800,000 | 942,015 |
|
| TOTAL SPAIN | | | 1,648,132 |
|
| Sweden - 0.7% | | | |
| Samhallsbyggnadsbolaget I Norden AB 4.625% (Reg. S) (c)(g) | EUR | 600,000 | 699,905 |
| United Kingdom - 5.8% | | | |
| Aviva PLC: | | | |
| 5.9021% (c)(g) | GBP | 350,000 | 482,182 |
| 6.125% (c)(g) | GBP | 1,740,000 | 2,488,462 |
| Barclays Bank PLC 7.625% 11/21/22 | | 920,000 | 1,012,345 |
| Barclays PLC 7.125% (c)(g) | GBP | 400,000 | 531,989 |
| CYBG PLC 9.25% (Reg. S) (c)(g) | GBP | 300,000 | 400,731 |
| HSBC Holdings PLC 5.25% (c)(g) | EUR | 505,000 | 627,576 |
| Pennon Group PLC 2.875% (Reg. S) (c)(g) | GBP | 550,000 | 702,988 |
|
| TOTAL UNITED KINGDOM | | | 6,246,273 |
|
| TOTAL PREFERRED SECURITIES | | | |
| (Cost $20,480,577) | | | 20,237,112 |
| | | Shares | Value |
|
| Money Market Funds - 1.0% | | | |
| Fidelity Cash Central Fund 2.42% (h) | | | |
| (Cost $1,087,913) | | 1,087,706 | 1,087,924 |
| Purchased Swaptions - 0.1%(i) | | | | |
| | | Expiration Date | Notional Amount | Value |
| Put Options - 0.1% | | | | |
| Option with an exercise rate of 2.75% on a credit default swap with Citibank, N.A. to buy protection on the 5-Year iTraxx Europe Crossover Series 31 Index expiring June 2024, paying 5% quarterly. | | 8/21/19 | EUR 8,100,000 | $44,529 |
| Option with an exercise rate of 3.00% on a credit default swap with Goldman Sachs Bank USA to buy protection on the 5-Year iTraxx Europe Crossover Series 31 Index expiring June 2024, paying 5% quarterly. | | 7/17/19 | EUR 18,700,000 | 13,205 |
|
| TOTAL PUT OPTIONS | | | | 57,734 |
|
| TOTAL PURCHASED SWAPTIONS | | | | |
| (Cost $271,387) | | | | 57,734 |
| TOTAL INVESTMENT IN SECURITIES - 94.5% | | | | |
| (Cost $102,274,380) | | | | 101,973,858 |
| NET OTHER ASSETS (LIABILITIES) - 5.5% | | | | 5,992,092 |
| NET ASSETS - 100% | | | | $107,965,950 |
| Futures Contracts | | | | | |
| | Number of contracts | Expiration Date | Notional Amount | Value | Unrealized Appreciation/(Depreciation) |
| Purchased | | | | | |
| Bond Index Contracts | | | | | |
| ASX 10 Year Treasury Bond Index Contracts (Australia) | 8 | Sept. 2019 | $806,797 | $9,161 | $9,161 |
| Eurex Euro-Bund Contracts (Germany) | 2 | Sept. 2019 | 392,845 | (206) | (206) |
| ICE Long Gilt Contracts (United Kingdom) | 6 | Sept. 2019 | 992,847 | 9,404 | 9,404 |
| TME 10 Year Canadian Note Contracts (Canada) | 33 | Sept. 2019 | 3,601,764 | 26,403 | 26,403 |
| TOTAL BOND INDEX CONTRACTS | | | | | 44,762 |
| Treasury Contracts | | | | | |
| CBOT 10-Year U.S. Treasury Note Contracts (United States) | 3 | Sept. 2019 | 383,906 | 89 | 89 |
| CBOT 2-Year U.S. Treasury Note Contracts (United States) | 20 | Sept. 2019 | 4,303,594 | 23,555 | 23,555 |
| CBOT 5-Year U.S. Treasury Note Contracts (United States) | 48 | Sept. 2019 | 5,671,500 | 69,279 | 69,279 |
| CBOT Long Term U.S. Treasury Bond Contracts (United States) | 12 | Sept. 2019 | 1,867,125 | 50,130 | 50,130 |
| CBOT Ultra 10-Year U.S. Treasury Note Contracts (United States) | 36 | Sept. 2019 | 4,972,500 | 102,437 | 102,437 |
| CBOT Ultra Long Term U.S. Treasury Bond Contracts (United States) | 16 | Sept. 2019 | 2,841,000 | 83,824 | 83,824 |
| TOTAL TREASURY CONTRACTS | | | | | 329,314 |
|
| TOTAL PURCHASED | | | | | 374,076 |
|
| Sold | | | | | |
| Bond Index Contracts | | | | | |
| Eurex Euro-Bobl Contracts (Germany) | 8 | Sept. 2019 | 1,222,974 | (2,099) | (2,099) |
| TOTAL FUTURES CONTRACTS | | | | | $371,977 |
The notional amount of futures purchased as a percentage of Net Assets is 23.9%
The notional amount of futures sold as a percentage of Net Assets is 1.1%
For the period, the average monthly notional amount at value for futures contracts in the aggregate was $32,899,983.
| Forward Foreign Currency Contracts | | | | | | |
| Currency Purchased | Currency Sold | Counterparty | Settlement Date | Unrealized Appreciation/(Depreciation) |
| CAD | 74,000 | USD | 55,607 | Citibank, N.A. | 8/27/19 | $965 |
| EUR | 93,000 | USD | 105,217 | Bank Of America, N.A. | 8/27/19 | 1,025 |
| EUR | 62,000 | USD | 70,040 | Goldman Sachs Bank USA | 8/27/19 | 788 |
| EUR | 71,000 | USD | 81,218 | Goldman Sachs Bank USA | 8/27/19 | (108) |
| EUR | 73,000 | USD | 83,058 | JPMorgan Chase Bank, N.A. | 8/27/19 | 336 |
| EUR | 110,000 | USD | 125,881 | JPMorgan Chase Bank, N.A. | 8/27/19 | (218) |
| USD | 60,985 | CAD | 82,000 | Bank Of America, N.A. | 8/27/19 | (1,703) |
| USD | 114,761 | EUR | 101,000 | BNP Paribas SA | 8/27/19 | (621) |
| USD | 261,684 | EUR | 230,000 | BNP Paribas SA | 8/27/19 | (1,066) |
| USD | 685,877 | EUR | 600,000 | Bank Of America, N.A. | 8/27/19 | 443 |
| USD | 60,474 | EUR | 53,000 | Goldman Sachs Bank USA | 8/27/19 | (73) |
| USD | 124,037 | EUR | 110,000 | Goldman Sachs Bank USA | 8/27/19 | (1,626) |
| USD | 104,973 | EUR | 93,000 | JPMorgan Chase Bank, N.A. | 8/27/19 | (1,269) |
| USD | 65,204 | EUR | 57,000 | JPMorgan Chase Bank, N.A. | 8/27/19 | 87 |
| USD | 36,571,276 | EUR | 32,272,000 | State Street Bank and Trust Co | 8/27/19 | (295,945) |
| USD | 2,242,058 | EUR | 1,999,000 | State Street Bank and Trust Co | 8/27/19 | (41,580) |
| USD | 11,732,813 | GBP | 9,012,000 | Goldman Sachs Bank USA | 8/27/19 | 257,182 |
| USD | 86,234 | GBP | 68,000 | Goldman Sachs Bank USA | 8/27/19 | (355) |
| USD | 507,505 | GBP | 398,000 | Goldman Sachs Bank USA | 8/27/19 | 703 |
| USD | 63,659 | GBP | 50,000 | Goldman Sachs Bank USA | 8/27/19 | (10) |
| USD | 106,993 | GBP | 84,000 | State Street Bank and Trust Co | 8/27/19 | 30 |
| USD | 31,292,000 | EUR | 27,612,351 | JPMorgan Chase Bank, N.A. | 8/30/19 | (259,634) |
| TOTAL FORWARD FOREIGN CURRENCY CONTRACTS | | | | | | $(342,649) |
| | | | | | Unrealized Appreciation | 261,559 |
| | | | | | Unrealized Depreciation | (604,208) |
For the period, the average contract value for forward foreign currency contracts was $83,029,805. Contract value represents contract amount in United States dollars plus or minus unrealized appreciation or depreciation, respectively
Swaps
| Underlying Reference | Maturity Date | Clearinghouse / Counterparty | Fixed Payment Received/(Paid) | Payment Frequency | Notional Amount | Value | Upfront Premium Received/(Paid) | Unrealized Appreciation/(Depreciation) |
| Credit Default Swaps | | | | | | | | |
| Buy Protection | | | | | | | | |
| Accor SA | Jun. 2022 | Citibank, N.A. | (1%) | Quarterly | EUR 1,250,000 | $(27,766) | $16,572 | $(11,194) |
| Gas Natural Capital Markets SA | Jun. 2022 | BNP Paribas SA | (1%) | Quarterly | EUR 1,250,000 | (34,197) | 21,528 | (12,669) |
|
| TOTAL CREDIT DEFAULT SWAPS | | | | | | $(61,963) | $38,100 | $(23,863) |
|
Swaps
| Payment Received | Payment Frequency | Payment Paid | Payment Frequency | Clearinghouse / Counterparty(1) | Maturity Date | Notional Amount | Value | Upfront Premium Received/(Paid)(2) | Unrealized Appreciation/(Depreciation) |
| Interest Rate Swaps | | | | | | | | | |
| 0.75% | Annual | 6-month EURIBOR(3) | Semi - annual | LCH | Dec. 2029 | EUR 1,970,000 | $61,813 | $0 | $61,813 |
| 1.25% | Annual | 6-month EURIBOR(3) | Semi - annual | LCH | Dec. 2034 | EUR 3,850,000 | 151,859 | 0 | 151,859 |
| 1.25% | Semi - annual | 6-month EURIBOR(3) | Semi - annual | LCH | Dec. 2039 | EUR 540,000 | 18,108 | 0 | 18,108 |
|
| TOTAL INTEREST RATE SWAPS | | | | | | | $231,780 | $0 | $231,780 |
|
(1) Swaps with LCH Clearnet Group (LCH) are centrally cleared over-the-counter (OTC) swaps.
(2) Any premiums for centrally cleared over-the-counter (OTC) swaps are recorded periodically throughout the term of the swap to variation margin and included in unrealized appreciation (depreciation).
(3) Represents floating rate.
Currency Abbreviations
CAD – Canadian dollar
EUR – European Monetary Unit
GBP – British pound
USD – U.S. dollar
Categorizations in the Schedule of Investments are based on country or territory of incorporation.
Legend
(a) Amount is stated in United States dollars unless otherwise noted.
(b) Security exempt from registration under Rule 144A of the Securities Act of 1933. These securities may be resold in transactions exempt from registration, normally to qualified institutional buyers. At the end of the period, the value of these securities amounted to $8,054,974 or 7.5% of net assets.
(c) Coupon rates for floating and adjustable rate securities reflect the rates in effect at period end.
(d) Security or a portion of the security was pledged to cover margin requirements for futures contracts. At period end, the value of securities pledged amounted to $302,251.
(e) Security or a portion of the security was pledged to cover margin requirements for centrally cleared OTC swaps. At period end, the value of securities pledged amounted to $366,288.
(f) Security or a portion of the security has been segregated as collateral for open forward foreign currency contracts. At period end, the value of securities pledged amounted to $365,012.
(g) Security is perpetual in nature with no stated maturity date.
(h) Affiliated fund that is generally available only to investment companies and other accounts managed by Fidelity Investments. The rate quoted is the annualized seven-day yield of the fund at period end. A complete unaudited listing of the fund's holdings as of its most recent quarter end is available upon request. In addition, each Fidelity Central Fund's financial statements are available on the SEC's website or upon request.
(i) For the period, the average monthly notional amount for purchased swaptions was $20,879,141.
Affiliated Central Funds
Information regarding fiscal year to date income earned by the Fund from investments in Fidelity Central Funds is as follows:
| Fund | Income earned |
| Fidelity Cash Central Fund | $15,451 |
| Total | $15,451 |
Amounts in the income column in the above table include any capital gain distributions from underlying funds, which are presented in the corresponding line-item in the Statement of Operations, if applicable.
Investment Valuation
The following is a summary of the inputs used, as of June 30, 2019, involving the Fund's assets and liabilities carried at fair value. The inputs or methodology used for valuing securities may not be an indication of the risk associated with investing in those securities. For more information on valuation inputs, and their aggregation into the levels used below, please refer to the Investment Valuation section in the accompanying Notes to Financial Statements.
| | Valuation Inputs at Reporting Date: |
| Description | Total | Level 1 | Level 2 | Level 3 |
| Investments in Securities: | | | | |
| Equities: | | | | |
| Financials | $623,478 | $-- | $623,478 | $-- |
| Corporate Bonds | 70,575,200 | -- | 70,575,200 | -- |
| U.S. Government and Government Agency Obligations | 2,666,132 | -- | 2,666,132 | -- |
| Foreign Government and Government Agency Obligations | 6,726,278 | -- | 6,726,278 | -- |
| Preferred Securities | 20,237,112 | -- | 20,237,112 | -- |
| Money Market Funds | 1,087,924 | 1,087,924 | -- | -- |
| Purchased Swaptions | 57,734 | -- | 57,734 | -- |
| Total Investments in Securities: | $101,973,858 | $1,087,924 | $100,885,934 | $-- |
| Derivative Instruments: | | | | |
| Assets | | | | |
| Futures Contracts | $374,282 | $374,282 | $-- | $-- |
| Forward Foreign Currency Contracts | 261,559 | -- | 261,559 | -- |
| Swaps | 231,780 | -- | 231,780 | -- |
| Total Assets | $867,621 | $374,282 | $493,339 | $-- |
| Liabilities | | | | |
| Futures Contracts | $(2,305) | $(2,305) | $-- | $-- |
| Forward Foreign Currency Contracts | (604,208) | -- | (604,208) | -- |
| Swaps | (61,963) | -- | (61,963) | -- |
| Total Liabilities | $(668,476) | $(2,305) | $(666,171) | $-- |
| Total Derivative Instruments: | $199,145 | $371,977 | $(172,832) | $-- |
Value of Derivative Instruments
The following table is a summary of the Fund's value of derivative instruments by primary risk exposure as of June 30, 2019. For additional information on derivative instruments, please refer to the Derivative Instruments section in the accompanying Notes to Financial Statements.
| Primary Risk Exposure / Derivative Type | Value |
| | Asset | Liability |
| Credit Risk | | |
| Purchased Swaptions(a) | $57,734 | $0 |
| Swaps(b) | 0 | (61,963) |
| Total Credit Risk | 57,734 | (61,963) |
| Foreign Exchange Risk | | |
| Forward Foreign Currency Contracts(c) | 261,559 | (604,208) |
| Total Foreign Exchange Risk | 261,559 | (604,208) |
| Interest Rate Risk | | |
| Futures Contracts(d) | 374,282 | (2,305) |
| Swaps(e) | 231,780 | 0 |
| Total Interest Rate Risk | 606,062 | (2,305) |
| Total Value of Derivatives | $925,355 | $(668,476) |
(a) Gross value is included in the Statement of Assets and Liabilities in the investments, at value line-item.
(b) For bi-lateral over-the-counter (OTC) swaps, reflects gross value which is presented in the Statement of Assets and Liabilities in the bi-lateral OTC swaps, at value line-items.
(c) Gross value is presented in the Statement of Assets and Liabilities in the unrealized appreciation/depreciation on forward foreign currency contracts line-items.
(d) Reflects gross cumulative appreciation (depreciation) on futures contracts as presented in the Schedule of Investments. In the Statement of Assets and Liabilities, the period end daily variation margin is included in receivable or payable for daily variation margin on futures contracts, and the net cumulative appreciation (depreciation) is included in distributable earnings.
(e) For centrally cleared over-the-counter (OTC) swaps, reflects gross cumulative appreciation (depreciation) as presented in the Schedule of Investments. In the Statement of Assets and Liabilities, the period end daily variation margin for centrally cleared OTC swaps is included in receivable or payable for daily variation margin on centrally cleared OTC swaps, and the net cumulative appreciation (depreciation) for centrally cleared OTC swaps is included in distributable earnings.
The following table is a summary of the Fund's derivatives inclusive of potential netting arrangements.
| Counterparty | Value of Derivative Assets | Value of Derivative Liabilities | Collateral Received(a) | Collateral Pledged(a) | Net(b) |
| Goldman Sachs Bank USA | $271,878 | $(2,172) | $-- | $-- | $269,706 |
| Centrally Cleared OTC Swaps | 231,780 | -- | -- | -- | 231,780 |
| Citibank, N.A. | 45,494 | (27,766) | -- | -- | 17,728 |
| Bank Of America, N.A. | 1,468 | (1,703) | -- | -- | (235) |
| JPMorgan Chase Bank, N.A. | 423 | (261,121) | -- | -- | (260,698) |
| State Street Bank and Trust Co | 30 | (337,525) | -- | 337,495 | -- |
| BNP Paribas SA | -- | (35,884) | -- | -- | (35,884) |
| Exchange Traded Futures | 374,282 | (2,305) | -- | -- | 371,977 |
| Total | $925,355 | $(668,476) | | | |
(a) Reflects collateral received from or pledged to an individual counterparty, excluding any excess or initial collateral amounts.
(b) Net represents the receivable / (payable) that would be due from / (to) the counterparty in an event of default. Netting may be allowed across transactions traded under the same legal agreement with the same legal entity. Please refer to Derivative Instruments - Risk Exposures and the Use of Derivative Instruments section in the accompanying Notes to Financial Statements.
See accompanying notes which are an integral part of the financial statements.
Financial Statements
Statement of Assets and Liabilities
| | | June 30, 2019 (Unaudited) |
| Assets | | |
Investment in securities, at value — See accompanying schedule:
Unaffiliated issuers (cost $101,186,467) | $100,885,934 | |
| Fidelity Central Funds (cost $1,087,913) | 1,087,924 | |
| Total Investment in Securities (cost $102,274,380) | | $101,973,858 |
| Foreign currency held at value (cost $4,772,828) | | 4,824,481 |
| Receivable for investments sold | | 621,303 |
| Unrealized appreciation on forward foreign currency contracts | | 261,559 |
| Receivable for fund shares sold | | 430 |
| Dividends receivable | | 63,349 |
| Interest receivable | | 879,183 |
| Distributions receivable from Fidelity Central Funds | | 2,458 |
| Receivable for daily variation margin on futures contracts | | 7,681 |
| Receivable for daily variation margin on centrally cleared OTC swaps | | 2,013 |
| Other receivables | | 522 |
| Total assets | | 108,636,837 |
| Liabilities | | |
| Unrealized depreciation on forward foreign currency contracts | $604,208 | |
| Bi-lateral OTC swaps, at value | 61,963 | |
| Other payables and accrued expenses | 4,716 | |
| Total liabilities | | 670,887 |
| Net Assets | | $107,965,950 |
| Net Assets consist of: | | |
| Paid in capital | | $105,085,888 |
| Total distributable earnings (loss) | | 2,880,062 |
| Net Assets, for 10,592,574 shares outstanding | | $107,965,950 |
| Net Asset Value, offering price and redemption price per share ($107,965,950 ÷ 10,592,574 shares) | | $10.19 |
See accompanying notes which are an integral part of the financial statements.
Statement of Operations
| | | Six months ended June 30, 2019 (Unaudited) |
| Investment Income | | |
| Dividends | | $424,416 |
| Interest | | 986,440 |
| Income from Fidelity Central Funds | | 15,451 |
| Income before foreign taxes withheld | | 1,426,307 |
| Less foreign taxes withheld | | (8,729) |
| Total income | | 1,417,578 |
| Expenses | | |
| Custodian fees and expenses | $4,759 | |
| Independent trustees' fees and expenses | 187 | |
| Commitment fees | 143 | |
| Total expenses | | 5,089 |
| Net investment income (loss) | | 1,412,489 |
| Realized and Unrealized Gain (Loss) | | |
| Net realized gain (loss) on: | | |
| Investment securities: | | |
| Unaffiliated issuers | (1,183,400) | |
| Fidelity Central Funds | 16 | |
| Forward foreign currency contracts | 1,623,138 | |
| Foreign currency transactions | (76,571) | |
| Futures contracts | 1,031,499 | |
| Swaps | 421,329 | |
| Total net realized gain (loss) | | 1,816,011 |
| Change in net unrealized appreciation (depreciation) on: | | |
| Investment securities: | | |
| Unaffiliated issuers | 5,684,765 | |
| Fidelity Central Funds | (16) | |
| Forward foreign currency contracts | 41,413 | |
| Assets and liabilities in foreign currencies | 56,394 | |
| Futures contracts | (134,026) | |
| Swaps | 185,855 | |
| Total change in net unrealized appreciation (depreciation) | | 5,834,385 |
| Net gain (loss) | | 7,650,396 |
| Net increase (decrease) in net assets resulting from operations | | $9,062,885 |
See accompanying notes which are an integral part of the financial statements.
Statement of Changes in Net Assets
| | Six months ended June 30, 2019 (Unaudited) | Year ended December 31, 2018 |
| Increase (Decrease) in Net Assets | | |
| Operations | | |
| Net investment income (loss) | $1,412,489 | $2,748,205 |
| Net realized gain (loss) | 1,816,011 | 2,477,522 |
| Change in net unrealized appreciation (depreciation) | 5,834,385 | (6,326,804) |
| Net increase (decrease) in net assets resulting from operations | 9,062,885 | (1,101,077) |
| Distributions to shareholders | (1,725,570) | (4,035,459) |
| Share transactions | | |
| Proceeds from sales of shares | 430 | 13,406 |
| Reinvestment of distributions | 1,725,570 | 4,035,460 |
| Cost of shares redeemed | (1,190) | (1,973,125) |
| Net increase (decrease) in net assets resulting from share transactions | 1,724,810 | 2,075,741 |
| Total increase (decrease) in net assets | 9,062,125 | (3,060,795) |
| Net Assets | | |
| Beginning of period | 98,903,825 | 101,964,620 |
| End of period | $107,965,950 | $98,903,825 |
| Other Information | | |
| Shares | | |
| Sold | 42 | 1,365 |
| Issued in reinvestment of distributions | 177,551 | 419,668 |
| Redeemed | (121) | (200,726) |
| Net increase (decrease) | 177,472 | 220,307 |
See accompanying notes which are an integral part of the financial statements.
Financial Highlights
Fidelity Series International Credit Fund
| | Six months ended (Unaudited) June 30, | Years endedDecember 31, | |
| | 2019 | 2018 | 2017 A |
| Selected Per–Share Data | | | |
| Net asset value, beginning of period | $9.50 | $10.00 | $10.00 |
| Income from Investment Operations | | | |
| Net investment income (loss)B | .134 | .269 | .100 |
| Net realized and unrealized gain (loss) | .721 | (.373) | .090 |
| Total from investment operations | .855 | (.104) | .190 |
| Distributions from net investment income | (.067) | (.257) | (.103) |
| Distributions from net realized gain | (.098) | (.139) | (.021) |
| Tax return of capital | – | – | (.066) |
| Total distributions | (.165) | (.396) | (.190) |
| Net asset value, end of period | $10.19 | $9.50 | $10.00 |
| Total ReturnC,D | 9.09% | (1.04)% | 1.91% |
| Ratios to Average Net AssetsE,F | | | |
| Expenses before reductions | .01%G | .01% | .01%G |
| Expenses net of fee waivers, if any | .01%G | .01% | .01%G |
| Expenses net of all reductions | .01%G | .01% | .01%G |
| Net investment income (loss) | 2.75%G | 2.74% | 2.27%G |
| Supplemental Data | | | |
| Net assets, end of period (000 omitted) | $107,966 | $98,904 | $101,965 |
| Portfolio turnover rateH | 104%G | 94% | 40%I |
A For the period July 25, 2017 (commencement of operations) to December 31, 2017.
B Calculated based on average shares outstanding during the period.
C Total returns for periods of less than one year are not annualized.
D Total returns would have been lower if certain expenses had not been reduced during the applicable periods shown.
E Fees and expenses of any underlying Fidelity Central Funds are not included in the Fund's expense ratio. The Fund indirectly bears its proportionate share of the expenses of any underlying Fidelity Central Funds.
F Expense ratios reflect operating expenses of the Fund. Expenses before reductions do not reflect amounts reimbursed by the investment adviser or reductions from expense offset arrangements and do not represent the amount paid by the Fund during periods when reimbursements or reductions occur. Expense ratios before reductions for start-up periods may not be representative of longer term operating periods. Expenses net of fee waivers reflect expenses after reimbursement by the investment adviser but prior to reductions from expense offset arrangements. Expenses net of all reductions represent the net expenses paid by the Fund.
G Annualized
H Amount does not include the portfolio activity of any underlying Fidelity Central Funds.
I Amount not annualized.
See accompanying notes which are an integral part of the financial statements.
Notes to Financial Statements (Unaudited)
For the period ended June 30, 2019
1. Organization.
Fidelity Series International Credit Fund (the Fund) is a fund of Fidelity School Street Trust (the Trust) and is authorized to issue an unlimited number of shares. Shares of the Fund are only available for purchase by mutual for which Fidelity Management & Research Company (FMR) or an affiliate serves as an investment manager. The Trust is registered under the Investment Company Act of 1940, as amended (the 1940 Act), as an open-end management investment company organized as a Massachusetts business trust.
2. Investments in Fidelity Central Funds.
The Fund invests in Fidelity Central Funds, which are open-end investment companies generally available only to other investment companies and accounts managed by the investment adviser and its affiliates. The Fund's Schedule of Investments lists each of the Fidelity Central Funds held as of period end, if any, as an investment of the Fund, but does not include the underlying holdings of each Fidelity Central Fund. As an Investing Fund, the Fund indirectly bears its proportionate share of the expenses of the underlying Fidelity Central Funds.
The Money Market Central Funds seek preservation of capital and current income and are managed by Fidelity Investments Money Management, Inc. (FIMM), an affiliate of the investment adviser. Annualized expenses of the Money Market Central Funds as of their most recent shareholder report date ranged from less than .005% to .01%.
A complete unaudited list of holdings for each Fidelity Central Fund is available upon request or at the Securities and Exchange Commission (the SEC) website at www.sec.gov. In addition, the financial statements of the Fidelity Central Funds are available on the SEC website or upon request.
3. Significant Accounting Policies.
The Fund is an investment company and applies the accounting and reporting guidance of the Financial Accounting Standards Board (FASB) Accounting Standards Codification Topic 946 Financial Services – Investments Companies. The financial statements have been prepared in conformity with accounting principles generally accepted in the United States of America (GAAP), which require management to make certain estimates and assumptions at the date of the financial statements. Actual results could differ from those estimates. Subsequent events, if any, through the date that the financial statements were issued have been evaluated in the preparation of the financial statements. The following summarizes the significant accounting policies of the Fund:
Investment Valuation. Investments are valued as of 4:00 p.m. Eastern time on the last calendar day of the period. The Board of Trustees (the Board) has delegated the day to day responsibility for the valuation of the Fund's investments to the Fair Value Committee (the Committee) established by the Fund's investment adviser. In accordance with valuation policies and procedures approved by the Board, the Fund attempts to obtain prices from one or more third party pricing vendors or brokers to value its investments. When current market prices, quotations or currency exchange rates are not readily available or reliable, investments will be fair valued in good faith by the Committee, in accordance with procedures adopted by the Board. Factors used in determining fair value vary by investment type and may include market or investment specific events, changes in interest rates and credit quality. The frequency with which these procedures are used cannot be predicted and they may be utilized to a significant extent. The Committee oversees the Fund's valuation policies and procedures and reports to the Board on the Committee's activities and fair value determinations. The Board monitors the appropriateness of the procedures used in valuing the Fund's investments and ratifies the fair value determinations of the Committee.
The Fund categorizes the inputs to valuation techniques used to value its investments into a disclosure hierarchy consisting of three levels as shown below:
- Level 1 – quoted prices in active markets for identical investments
- Level 2 – other significant observable inputs (including quoted prices for similar investments, interest rates, prepayment speeds, etc.)
- Level 3 – unobservable inputs (including the Fund's own assumptions based on the best information available)
Valuation techniques used to value the Fund's investments by major category are as follows:
Debt securities, including restricted securities, are valued based on evaluated prices received from third party pricing vendors or from brokers who make markets in such securities. Corporate bonds, foreign government and government agency obligations, preferred securities and U.S. government and government agency obligations are valued by pricing vendors who utilize matrix pricing which considers yield or price of bonds of comparable quality, coupon, maturity and type or by broker-supplied prices. Swaps are marked-to-market daily based on valuations from third party pricing vendors, registered derivatives clearing organizations (clearinghouses) or broker-supplied valuations. These pricing sources may utilize inputs such as interest rate curves, credit spread curves, default possibilities and recovery rates. When independent prices are unavailable or unreliable, debt securities and swaps may be valued utilizing pricing methodologies which consider similar factors that would be used by third party pricing vendors. For foreign debt securities, when significant market or security specific events arise, valuations may be determined in good faith in accordance with procedures adopted by the Board. Debt securities and swaps are generally categorized as Level 2 in the hierarchy but may be Level 3 depending on the circumstances.
Equity securities, including restricted securities, for which market quotations are readily available, are valued at the last reported sale price or official closing price as reported by a third party pricing vendor on the primary market or exchange on which they are traded and are categorized as Level 1 in the hierarchy. In the event there were no sales during the day or closing prices are not available, securities are valued at the last quoted bid price or may be valued using the last available price and are generally categorized as Level 2 in the hierarchy. For foreign equity securities, when market or security specific events arise, comparisons to the valuation of American Depositary Receipts (ADRs), futures contracts, Exchange-Traded Funds (ETFs) and certain indexes as well as quoted prices for similar securities may be used and would be categorized as Level 2 in the hierarchy. For equity securities, including restricted securities, where observable inputs are limited, assumptions about market activity and risk are used and these securities may be categorized as Level 3 in the hierarchy.
The U.S. dollar value of foreign currency contracts is determined using currency exchange rates supplied by a pricing service and are categorized as Level 2 in the hierarchy. Futures contracts are valued at the settlement price established each day by the board of trade or exchange on which they are traded and are categorized as Level 1 in the hierarchy. Options traded over-the-counter are valued using vendor or broker-supplied valuations and are categorized as Level 2 in the hierarchy. Investments in open-end mutual funds, including the Fidelity Central Funds, are valued at their closing net asset value (NAV) each business day and are categorized as Level 1 in the hierarchy.
Changes in valuation techniques may result in transfers in or out of an assigned level within the disclosure hierarchy. The aggregate value of investments by input level as of June 30, 2019 is included at the end of the Fund's Schedule of Investments.
Foreign Currency. Foreign-denominated assets, including investment securities, and liabilities are translated into U.S. dollars at the exchange rates at period end. Purchases and sales of investment securities, income and dividends received and expenses denominated in foreign currencies are translated into U.S. dollars at the exchange rate in effect on the transaction date.
The effects of exchange rate fluctuations on investments are included with the net realized and unrealized gain (loss) on investment securities. Other foreign currency transactions resulting in realized and unrealized gain (loss) are disclosed separately.
Realized gains and losses on foreign currency transactions arise from the disposition of foreign currency, realized changes in the value of foreign currency between the trade and settlement dates on security transactions, and the difference between the amounts of dividends, interest and foreign withholding taxes recorded on transaction date and the U.S. dollar equivalent of the amounts actually received or paid. Unrealized gains and losses on assets and liabilities in foreign currencies arise from changes in the value of foreign currency, and from assets and liabilities denominated in foreign currencies, other than investments, which are held at period end.
Investment Transactions and Income. For financial reporting purposes, the Fund's investment holdings and NAV include trades executed through the end of the last business day of the period. The NAV per share for processing shareholder transactions is calculated as of the close of business of the New York Stock Exchange (NYSE), normally 4:00 p.m. Eastern time and includes trades executed through the end of the prior business day. Gains and losses on securities sold are determined on the basis of identified cost. Dividend income is recorded on the ex-dividend date, except for certain dividends from foreign securities where the ex-dividend date may have passed, which are recorded as soon as the Fund is informed of the ex-dividend date. Non-cash dividends included in dividend income, if any, are recorded at the fair market value of the securities received. Income and capital gain distributions from Fidelity Central Funds, if any, are recorded on the ex-dividend date. Interest income is accrued as earned and includes coupon interest and amortization of premium and accretion of discount on debt securities as applicable. Investment income is recorded net of foreign taxes withheld where recovery of such taxes is uncertain. Debt obligations may be placed on non-accrual status and related interest income may be reduced by ceasing current accruals and writing off interest receivables when the collection of all or a portion of interest has become doubtful based on consistently applied procedures. A debt obligation is removed from non-accrual status when the issuer resumes interest payments or when collectability of interest is reasonably assured.
Expenses. Expenses directly attributable to a fund are charged to that fund. Expenses attributable to more than one fund are allocated among the respective funds on the basis of relative net assets or other appropriate methods. Expense estimates are accrued in the period to which they relate and adjustments are made when actual amounts are known.
Income Tax Information and Distributions to Shareholders. Each year, the Fund intends to qualify as a regulated investment company under Subchapter M of the Internal Revenue Code, including distributing substantially all of its taxable income and realized gains. As a result, no provision for U.S. Federal income taxes is required. The Fund files a U.S. federal tax return, in addition to state and local tax returns as required. The Fund's federal income tax returns are subject to examination by the Internal Revenue Service (IRS) for a period of three fiscal years after they are filed. State and local tax returns may be subject to examination for an additional fiscal year depending on the jurisdiction. Foreign taxes are provided for based on the Fund's understanding of the tax rules and rates that exist in the foreign markets in which it invests.
Distributions are declared and recorded on the ex-dividend date. Income and capital gain distributions are determined in accordance with income tax regulations, which may differ from GAAP.
Capital accounts within the financial statements are adjusted for permanent book-tax differences. These adjustments have no impact on net assets or the results of operations. Capital accounts are not adjusted for temporary book-tax differences which will reverse in a subsequent period.
Book-tax differences are primarily due to futures contracts, swaps, foreign currency transactions, market discount, capital loss carryforwards and losses deferred due to wash sales, futures contracts and excise tax regulations.
As of period end, the cost and unrealized appreciation (depreciation) in securities, and derivatives if applicable, for federal income tax purposes were as follows:
| Gross unrealized appreciation | $2,672,603 |
| Gross unrealized depreciation | (2,661,335) |
| Net unrealized appreciation (depreciation) | $11,268 |
| Tax cost | $102,199,835 |
Capital loss carryforwards are only available to offset future capital gains of the Fund to the extent provided by regulations and may be limited. Under the Regulated Investment Company Modernization Act of 2010 (the Act), the Fund is permitted to carry forward capital losses incurred in taxable years beginning after December 22, 2010 for an unlimited period and such capital losses are required to be used prior to any losses that expire. The capital loss carryforward information presented below, including any applicable limitation, is estimated as of prior fiscal period end and is subject to adjustment.
| No expiration | |
| Short-term | $(434,666) |
| Long-term | (472,941) |
| Total no expiration | $(907,607) |
Restricted Securities. The Fund may invest in securities that are subject to legal or contractual restrictions on resale. These securities generally may be resold in transactions exempt from registration or to the public if the securities are registered. Disposal of these securities may involve time-consuming negotiations and expense, and prompt sale at an acceptable price may be difficult. Information regarding restricted securities is included at the end of the Fund's Schedule of Investments.
4. Derivative Instruments.
Risk Exposures and the Use of Derivative Instruments. The Fund's investment objective allows the Fund to enter into various types of derivative contracts, including futures contracts, forward foreign currency contracts, options and swaps. Derivatives are investments whose value is primarily derived from underlying assets, indices or reference rates and may be transacted on an exchange or over-the-counter (OTC). Derivatives may involve a future commitment to buy or sell a specified asset based on specified terms, to exchange future cash flows at periodic intervals based on a notional principal amount, or for one party to make one or more payments upon the occurrence of specified events in exchange for periodic payments from the other party.
The Fund used derivatives to increase returns, to gain exposure to certain types of assets, to facilitate transactions in foreign-denominated securities and to manage exposure to certain risks as defined below. The success of any strategy involving derivatives depends on analysis of numerous economic factors, and if the strategies for investment do not work as intended, the Fund may not achieve its objectives.
The Fund's use of derivatives increased or decreased its exposure to the following risks:
| Credit Risk | Credit risk relates to the ability of the issuer of a financial instrument to make further principal or interest payments on an obligation or commitment that it has to the Fund.
|
| Foreign Exchange Risk | Foreign exchange rate risk relates to fluctuations in the value of an asset or liability due to changes in currency exchange rates.
|
| Interest Rate Risk | Interest rate risk relates to the fluctuations in the value of interest-bearing securities due to changes in the prevailing levels of market interest rates. |
The Fund is also exposed to additional risks from investing in derivatives, such as liquidity risk and counterparty credit risk. Liquidity risk is the risk that the Fund will be unable to close out the derivative in the open market in a timely manner. Counterparty credit risk is the risk that the counterparty will not be able to fulfill its obligation to the Fund. Derivative counterparty credit risk is managed through formal evaluation of the creditworthiness of all potential counterparties. On certain OTC derivatives such as forward foreign currency contracts, options and bi-lateral swaps, the Fund attempts to reduce its exposure to counterparty credit risk by entering into an International Swaps and Derivatives Association, Inc. (ISDA) Master Agreement with each of its counterparties. The ISDA Master Agreement gives the Fund the right to terminate all transactions traded under such agreement upon the deterioration in the credit quality of the counterparty beyond specified levels. The ISDA Master Agreement gives each party the right, upon an event of default by the other party or a termination of the agreement, to close out all transactions traded under such agreement and to net amounts owed under each transaction to one net payable by one party to the other. To mitigate counterparty credit risk on bi-lateral OTC derivatives, the Fund receives collateral in the form of cash or securities once the Fund's net unrealized appreciation on outstanding derivative contracts under an ISDA Master Agreement exceeds certain applicable thresholds, subject to certain minimum transfer provisions. The collateral received is held in segregated accounts with the Fund's custodian bank in accordance with the collateral agreements entered into between the Fund, the counterparty and the Fund's custodian bank. The Fund could experience delays and costs in gaining access to the collateral even though it is held by the Fund's custodian bank. The Fund's maximum risk of loss from counterparty credit risk related to bi-lateral OTC derivatives is generally the aggregate unrealized appreciation and unpaid counterparty payments in excess of any collateral pledged by the counterparty to the Fund. The Fund may be required to pledge collateral for the benefit of the counterparties on bi-lateral OTC derivatives in an amount not less than each counterparty's unrealized appreciation on outstanding derivative contracts, subject to certain minimum transfer provisions, and any such pledged collateral is identified in the Schedule of Investments. Exchange-traded futures contracts are not covered by the ISDA Master Agreement; however counterparty credit risk related to exchange-traded futures contracts may be mitigated by the protection provided by the exchange on which they trade. Counterparty credit risk related to centrally cleared OTC swaps may be mitigated by the protection provided by the clearinghouse. A summary of the Fund's derivatives inclusive of potential netting arrangements is presented at the end of the Schedule of Investments.
Investing in derivatives may involve greater risks than investing in the underlying assets directly and, to varying degrees, may involve risk of loss in excess of any initial investment and collateral received and amounts recognized in the Statement of Assets and Liabilities. In addition, there may be the risk that the change in value of the derivative contract does not correspond to the change in value of the underlying instrument.
Net Realized Gain (Loss) and Change in Net Unrealized Appreciation (Depreciation) on Derivatives. The table below, which reflects the impacts of derivatives on the financial performance of the Fund, summarizes the net realized gain (loss) and change in net unrealized appreciation (depreciation) for derivatives during the period as presented in the Statement of Operations.
| Primary Risk Exposure / Derivative Type | Net Realized Gain (Loss) | Change in Net Unrealized Appreciation (Depreciation) |
| Credit Risk | | |
| Purchased Options | $(202,486) | $(217,177) |
| Swaps | (49,728) | 26,349 |
| Total Credit Risk | (252,214) | (190,828) |
| Foreign Exchange Risk | | |
| Forward Foreign Currency Contracts | 1,623,138 | 41,413 |
| Interest Rate Risk | | |
| Futures Contracts | 1,031,499 | (134,026) |
| Swaps | 471,057 | 159,506 |
| Total Interest Rate Risk | 1,502,556 | 25,480 |
| Totals | $2,873,480 | $(123,935) |
A summary of the value of derivatives by primary risk exposure as of period end is included at the end of the Schedule of Investments.
Forward Foreign Currency Contracts. Forward foreign currency contracts represent obligations to purchase or sell foreign currency on a specified future date at a price fixed at the time the contracts are entered into. The Fund used forward foreign currency contracts to facilitate transactions in foreign-denominated securities and to manage exposure to certain foreign currencies.
Forward foreign currency contracts are valued daily and fluctuations in exchange rates on open contracts are recorded as unrealized appreciation or (depreciation) and reflected in the Statement of Assets and Liabilities. When the contract is closed, the Fund realizes a gain or loss equal to the difference between the closing value and the value at the time it was opened. Non-deliverable forward foreign currency exchange contracts are settled with the counterparty in cash without the delivery of foreign currency. The net realized gain (loss) and change in net unrealized appreciation (depreciation) on forward foreign currency contracts during the period is presented in the Statement of Operations.
Any open forward foreign currency contracts at period end are presented in the Schedule of Investments under the caption "Forward Foreign Currency Contracts." The contract amount and unrealized appreciation (depreciation) reflects each contract's exposure to the underlying currency at period end.
Futures Contracts. A futures contract is an agreement between two parties to buy or sell a specified underlying instrument for a fixed price at a specified future date. The Fund used futures contracts to manage its exposure to the bond market and fluctuations in interest rates.
Upon entering into a futures contract, a fund is required to deposit either cash or securities (initial margin) with a clearing broker in an amount equal to a certain percentage of the face value of the contract. Futures contracts are marked-to-market daily and subsequent daily payments (variation margin) are made or received by a fund depending on the daily fluctuations in the value of the futures contracts and are recorded as unrealized appreciation or (depreciation). This receivable and/or payable, if any, is included in daily variation margin on futures contracts in the Statement of Assets and Liabilities. Realized gain or (loss) is recorded upon the expiration or closing of a futures contract. The net realized gain (loss) and change in net unrealized appreciation (depreciation) on futures contracts during the period is presented in the Statement of Operations.
Any open futures contracts at period end are presented in the Schedule of Investments under the caption "Futures Contracts". The notional amount at value reflects each contract's exposure to the underlying instrument or index at period end. Securities deposited to meet initial margin requirements are identified in the Schedule of Investments.
Options. Options give the purchaser the right, but not the obligation, to buy (call) or sell (put) an underlying security or financial instrument at an agreed exercise or strike price between or on certain dates. Options obligate the seller (writer) to buy (put) or sell (call) an underlying instrument at the exercise or strike price or cash settle an underlying derivative instrument if the holder exercises the option on or before the expiration date. The Fund uses OTC options, such as swaptions, which are options where the underlying instrument is a swap, to manage its exposure to potential credit events.
Upon entering into an options contract, a fund will pay or receive a premium. Premiums paid on purchased options are reflected as cost of investments and premiums received on written options are reflected as a liability on the Statement of Assets and Liabilities. Certain options may be purchased or written with premiums to be paid or received on a future date. Options are valued daily and any unrealized appreciation (depreciation) is reflected on the Statement of Assets and Liabilities. When an option is exercised, the cost or proceeds of the underlying instrument purchased or sold is adjusted by the amount of the premium. When an option is closed the Fund will realize a gain or loss depending on whether the proceeds or amount paid for the closing sale transaction is greater or less than the premium received or paid. When an option expires, gains and losses are realized to the extent of premiums received and paid, respectively. The net realized and unrealized gains (losses) on purchased options are included in the Statement of Operations in net realized gain (loss) and change in net unrealized appreciation (depreciation) on investment securities. The net realized gain (loss) and change in net unrealized appreciation (depreciation) on written options are presented in the Statement of Operations.
Any open options at period end are presented in the Schedule of Investments under the captions "Purchased Options," "Purchased Swaptions," "Written Options" and "Written Swaptions," as applicable.
Writing puts and buying calls tend to increase exposure to the underlying instrument while buying puts and writing calls tend to decrease exposure to the underlying instrument. For purchased options, risk of loss is limited to the premium paid, and for written options, risk of loss is the change in value in excess of the premium received.
Swaps. A swap is a contract between two parties to exchange future cash flows at periodic intervals based on a notional principal amount. A bi-lateral OTC swap is a transaction between a fund and a dealer counterparty where cash flows are exchanged between the two parties for the life of the swap. A centrally cleared OTC swap is a transaction executed between a fund and a dealer counterparty, then cleared by a futures commission merchant (FCM) through a clearinghouse. Once cleared, the clearinghouse serves as a central counterparty, with whom a fund exchanges cash flows for the life of the transaction, similar to transactions in futures contracts.
Bi-lateral OTC swaps are marked-to-market daily and changes in value are reflected in the Statement of Assets and Liabilities in the bi-lateral OTC swaps at value line items. Any upfront premiums paid or received upon entering a bi-lateral OTC swap to compensate for differences between stated terms of the swap and prevailing market conditions (e.g. credit spreads, interest rates or other factors) are recorded in net unrealized appreciation (depreciation) in the Statement of Assets and Liabilities and amortized to realized gain or (loss) ratably over the term of the swap. Any unamortized upfront premiums are presented in the Schedule of Investments.
Centrally cleared OTC swaps require a fund to deposit either cash or securities (initial margin) with the FCM, at the instruction of and for the benefit of the clearinghouse. Securities deposited to meet initial margin requirements are identified in the Schedule of Investments. Centrally cleared OTC swaps are marked-to-market daily and subsequent payments (variation margin) are made or received depending on the daily fluctuations in the value of the swaps and are recorded as unrealized appreciation or (depreciation). These daily payments, if any, are included in receivable or payable for daily variation margin on centrally cleared OTC swaps in the Statement of Assets and Liabilities. Any premiums for centrally cleared OTC swaps are recorded periodically throughout the term of the swap to variation margin and included in unrealized appreciation (depreciation) in the Statement of Assets and Liabilities. Any premiums are recognized as realized gain (loss) upon termination or maturity of the swap.
For both bi-lateral and centrally cleared OTC swaps, payments are exchanged at specified intervals, accrued daily commencing with the effective date of the contract and recorded as realized gain or (loss). Some swaps may be terminated prior to the effective date and realize a gain or loss upon termination. The net realized gain (loss) and change in net unrealized appreciation (depreciation) on swaps during the period is presented in the Statement of Operations.
Any open swaps at period end are included in the Schedule of Investments under the caption "Swaps" and are representative of volume of activity during the period.
Credit Default Swaps. Credit default swaps enable the Fund to buy or sell protection against specified credit events on a single-name issuer or a traded credit index. Under the terms of a credit default swap the buyer of protection (buyer) receives credit protection in exchange for making periodic payments to the seller of protection (seller) based on a fixed percentage applied to a notional principal amount. In return for these payments, the seller will be required to make a payment upon the occurrence of one or more specified credit events. The Fund enters into credit default swaps as a seller to gain credit exposure to an issuer and/or as a buyer to obtain a measure of protection against defaults of an issuer. Periodic payments are made over the life of the contract by the buyer provided that no credit event occurs.
For credit default swaps on most corporate and sovereign issuers, credit events include bankruptcy, failure to pay or repudiation/moratorium. For credit default swaps on corporate or sovereign issuers, the obligation that may be put to the seller is not limited to the specific reference obligation described in the Schedule of Investments. For credit default swaps on asset-backed securities, a credit event may be triggered by events such as failure to pay principal, maturity extension, rating downgrade or write-down. For credit default swaps on asset-backed securities, the reference obligation described represents the security that may be put to the seller. For credit default swaps on a traded credit index, a specified credit event may affect all or individual underlying securities included in the index.
As a seller, if an underlying credit event occurs, the Fund will pay a net settlement amount of cash equal to the notional amount of the swap less the recovery value of the reference obligation or underlying securities comprising an index. Only in the event of the industry's inability to value the underlying asset will the Fund be required to take delivery of the reference obligation or underlying securities comprising an index and pay an amount equal to the notional amount of the swap.
As a buyer, if an underlying credit event occurs, the Fund will receive a net settlement amount of cash equal to the notional amount of the swap less the recovery value of the reference obligation or underlying securities comprising an index. Only in the event of the industry's inability to value the underlying asset will the Fund be required to deliver the reference obligation or underlying securities comprising an index in exchange for payment of an amount equal to the notional amount of the swap.
Typically, the value of each credit default swap and credit rating disclosed for each reference obligation in the Schedule of Investments, where the Fund is the seller, can be used as measures of the current payment/performance risk of the swap. As the value of the swap changes as a positive or negative percentage of the total notional amount, the payment/performance risk may decrease or increase, respectively. In addition to these measures, the investment adviser monitors a variety of factors including cash flow assumptions, market activity and market sentiment as part of its ongoing process of assessing payment/performance risk.
Interest Rate Swaps. Interest rate swaps are agreements between counterparties to exchange cash flows, one based on a fixed rate, and the other on a floating rate. The Fund entered into interest rate swaps to manage its exposure to interest rate changes. Changes in interest rates can have an effect on both the value of bond holdings as well as the amount of interest income earned. In general, the value of bonds can fall when interest rates rise and can rise when interest rates fall.
5. Purchases and Sales of Investments.
Purchases and sales of securities, other than short-term securities and U.S. government securities, aggregated $49,488,873 and $47,727,802, respectively.
6. Fees and Other Transactions with Affiliates.
Management Fee. Fidelity Management & Research Company (the investment adviser) and its affiliates provide the Fund with investment management related services for which the Fund does not pay a management fee. Under the management contract, the investment adviser or an affiliate pays all ordinary operating expenses of the Fund, except custody fees, fees and expenses of the independent Trustees, and certain miscellaneous expenses such as proxy and shareholder meeting expenses.
Interfund Trades. The Fund may purchase from or sell securities to other Fidelity Funds under procedures adopted by the Board. The procedures have been designed to ensure these interfund trades are executed in accordance with Rule 17a-7 of the 1940 Act. Interfund trades are included within the respective purchases and sales amounts shown in the Purchases and Sales of Investments note.
7. Committed Line of Credit.
The Fund participates with other funds managed by the investment adviser or an affiliate in a $4.25 billion credit facility (the "line of credit") to be utilized for temporary or emergency purposes to fund shareholder redemptions or for other short-term liquidity purposes. The Fund has agreed to pay commitment fees on its pro-rata portion of the line of credit, which amounted to $143 and is reflected in Commitment fees on the Statement of Operations. During the period, the Fund did not borrow on this line of credit.
8. Other.
The Fund's organizational documents provide former and current trustees and officers with a limited indemnification against liabilities arising in connection with the performance of their duties to the Fund. In the normal course of business, the Fund may also enter into contracts that provide general indemnifications. The Fund's maximum exposure under these arrangements is unknown as this would be dependent on future claims that may be made against the Fund. The risk of material loss from such claims is considered remote.
At the end of the period, mutual funds managed by the investment adviser or its affiliates were the owners of record of all of the outstanding shares of the Fund.
9. Risks of Investing in European Countries.
The recent global financial crisis has created uncertainty surrounding the sovereign debt of many European countries. If there is a default or debt restructuring by any European country, or if one or more countries leave the European Monetary Union or the European Monetary Union dissolves, there may be wide-ranging effects on global markets. Such events could significantly affect the value or liquidity of the Fund's investments in the region or with exposure to the region.
Shareholder Expense Example
As a shareholder of the Fund, you incur two types of costs: (1) transaction costs and (2) ongoing costs, including other Fund expenses. This Example is intended to help you understand your ongoing costs (in dollars) of investing in the Fund and to compare these costs with the ongoing costs of investing in other mutual funds.
The Example is based on an investment of $1,000 invested at the beginning of the period and held for the entire period (January 1, 2019 to June 30, 2019).
Actual Expenses
The first line of the accompanying table provides information about actual account values and actual expenses. You may use the information in this line, together with the amount you invested, to estimate the expenses that you paid over the period. Simply divide your account value by $1,000.00 (for example, an $8,600 account value divided by $1,000.00 = 8.6), then multiply the result by the number in the first line under the heading entitled "Expenses Paid During Period" to estimate the expenses you paid on your account during this period. In addition, the Fund, as a shareholder in the underlying Fidelity Central Funds, will indirectly bear its pro-rata share of the fees and expenses incurred by the underlying Fidelity Central Funds. These fees and expenses are not included in the Fund's annualized expense ratio used to calculate the expense estimate in the table below.
Hypothetical Example for Comparison Purposes
The second line of the accompanying table provides information about hypothetical account values and hypothetical expenses based on the Fund's actual expense ratio and an assumed rate of return of 5% per year before expenses, which is not the Fund's actual return. The hypothetical account values and expenses may not be used to estimate the actual ending account balance or expenses you paid for the period. You may use this information to compare the ongoing costs of investing in the Fund and other funds. To do so, compare this 5% hypothetical example with the 5% hypothetical examples that appear in the shareholder reports of the other funds. In addition, the Fund, as a shareholder in the underlying Fidelity Central Funds, will indirectly bear its pro-rata share of the fees and expenses incurred by the underlying Fidelity Central Funds. These fees and expenses are not included in the Fund's annualized expense ratio used to calculate the expense estimate in the table below.
Please note that the expenses shown in the table are meant to highlight your ongoing costs only and do not reflect any transaction costs. Therefore, the second line of the table is useful in comparing ongoing costs only, and will not help you determine the relative total costs of owning different funds.
| | Annualized Expense Ratio-A | Beginning
Account Value
January 1, 2019 | Ending
Account Value
June 30, 2019 | Expenses Paid
During Period-B
January 1, 2019
to June 30, 2019 |
| Actual | .01% | $1,000.00 | $1,090.90 | $.05 |
| Hypothetical-C | | $1,000.00 | $1,024.74 | $.05 |
A Annualized expense ratio reflects expenses net of applicable fee waivers.
B Expenses are equal to the Fund's annualized expense ratio, multiplied by the average account value over the period, multiplied by 181/365 (to reflect the one-half year period).
C 5% return per year before expenses
SUN-SANN-0819
1.9882622.101
Item 2.
Code of Ethics
Not applicable.
Item 3.
Audit Committee Financial Expert
Not applicable.
Item 4.
Principal Accountant Fees and Services
Not applicable.
Item 5.
Audit Committee of Listed Registrants
Not applicable.
Item 6.
Investments
(a)
Not applicable.
(b)
Not applicable
Item 7.
Disclosure of Proxy Voting Policies and Procedures for Closed-End Management Investment Companies
Not applicable.
Item 8.
Portfolio Managers of Closed-End Management Investment Companies
Not applicable.
Item 9.
Purchase of Equity Securities by Closed-End Management Investment Company and Affiliated Purchasers
Not applicable.
Item 10.
Submission of Matters to a Vote of Security Holders
There were no material changes to the procedures by which shareholders may recommend nominees to the Fidelity School Street Trust’s Board of Trustees.
Item 11.
Controls and Procedures
(a)(i) The President and Treasurer and the Chief Financial Officer have concluded that the Fidelity School Street Trust’s (the “Trust”) disclosure controls and procedures (as defined in Rule 30a-3(c) under the Investment Company Act) provide reasonable
assurances that material information relating to the Trust is made known to them by the appropriate persons, based on their evaluation of these controls and procedures as of a date within 90 days of the filing date of this report.
(a)(ii) There was no change in the Trust’s internal control over financial reporting (as defined in Rule 30a-3(d) under the Investment Company Act) that occurred during the period covered by this report that has materially affected, or is reasonably likely to materially affect, the Trust’s internal control over financial reporting.
Item 12.
Disclosure of Securities Lending Activities for Closed-End Management
Investment Companies
Not applicable.
Item 13.
Exhibits
| | |
(a) | (1) | Not applicable. |
(a) | (2) | Certification pursuant to Rule 30a-2(a) under the Investment Company Act of 1940 (17 CFR 270.30a-2(a)) is filed and attached hereto as Exhibit 99.CERT. |
(a) | (3) | Not applicable. |
(b) |
| Certification pursuant to Rule 30a-2(b) under the Investment Company Act of 1940 (17 CFR 270.30a-2(b)) is furnished and attached hereto as Exhibit 99.906CERT. |
SIGNATURES
Pursuant to the requirements of the Securities Exchange Act of 1934 and the Investment Company Act of 1940, the registrant has duly caused this report to be signed on its behalf by the undersigned, thereunto duly authorized.
Fidelity School Street Trust
| |
By: | /s/Laura M. Del Prato |
| Laura M. Del Prato |
| President and Treasurer |
|
|
Date: | August 26, 2019 |
Pursuant to the requirements of the Securities Exchange Act of 1934 and the Investment Company Act of 1940, this report has been signed below by the following persons on behalf of the registrant and in the capacities and on the dates indicated.
| |
By: | /s/Laura M. Del Prato |
| Laura M. Del Prato |
| President and Treasurer |
|
|
Date: | August 26, 2019 |
| |
By: | /s/John J. Burke III |
| John J. Burke III |
| Chief Financial Officer |
|
|
Date: | August 26, 2019 |