Washington, D.C. 20549
The Gateway Trust, Rookwood Tower, 3805 Edwards Road, Suite 600, Cincinnati, OH 45209
Form N-CSR is to be used by management investment companies to file reports with the Commission not later than 10 days after the transmission to stockholders of any report that is required to be transmitted to stockholders under Rule 30e-1 under the Investment Company Act of 1940 (17 CFR 270.30e-1). The Commission may use the information provided on Form N-CSR in its regulatory, disclosure review, inspection, and policymaking roles.
A registrant is required to disclose the information specified by Form N-CSR, and the Commission will make this information public. A registrant is not required to respond to the collection of information contained in Form N-CSR unless the Form displays a currently valid Office of Management and Budget (“OMB”) control number. Please direct comments concerning the accuracy of the information collection burden estimate and any suggestions for reducing the burden to Secretary, Securities and Exchange Commission, 450 Fifth Street, NW, Washington, DC 20549-0609. The OMB has reviewed this collection of information under the clearance requirements of 44 U.S.C. § 3507.
Item 1. Reports to Stockholders.
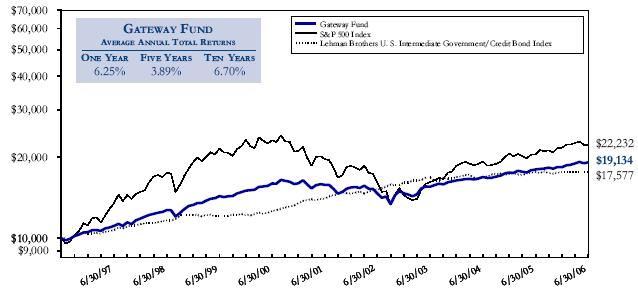
TOTAL RETURNS - JUNE 30, 2006 (UNAUDITED)
| | | Average Annual Total Return | | 6/30/06 Price Per Share | |
| | | One Year | | Three Years | | Five Years | | Ten Years | | Since Inception on 12/7/77 | |
| | | | | | | | | | | | | | |
GATEWAY FUND | | | 6.25% | | | 7.13% | | | 3.89% | | | 6.70% | | | 9.03% | | $ | 25.91 | |
| | | | | | | | | | | | | | | | | | | |
| S&P 500 Index | | | 8.62% | | | 11.21% | | | 2.49% | | | 8.32% | | | | | | | |
| | | | | | | | | | | | | | | | | | | |
| Lehman Brothers U. S. Intermediate | | | -0.19% | | | 1.48% | | | 4.61% | | | 5.80% | | | | | | | |
| Government/Credit Bond Index | | | | | | | | | | | | | | | | | | | |
| | | Cumulative Total Return | |
| | | One Year | | Three Years | | Five Years | | Ten Years | | Since Inception on 12/7/77 | |
| | | | | | | | | | | | |
GATEWAY FUND | | | 6.25% | | | 22.95% | | | 21.02% | | | 91.34% | | | 1,080.12% | |
| | | | | | | | | | | | | | | | |
| S&P 500 Index | | | 8.62% | | | 37.53% | | | 13.08% | | | 122.32% | | | | |
| | | | | | | | | | | | | | | | |
| Lehman Brothers U. S. Intermediate | | | -0.19% | | | 4.51% | | | 25.28% | | | 75.77% | | | | |
| Government/Credit Bond Index | | | | | | | | | | | | | | | | |
Data sources throughout this report: Gateway Investment Advisers, L.P. and Thomson Financial Inc.
Performance data throughout this report represents past performance and is no guarantee of future results. The total return figures assume the reinvestment of distributions, but do not reflect the deduction of taxes paid on distributions or on the redemption of your shares. Your investment return and principal value of an investment will fluctuate so that your shares, when redeemed, may be worth more or less than the original cost. Gateway Fund returns throughout this document are net of fees and expenses. An investor may be subject to additional fees and charges if the Fund is sold through intermediaries.
Current performance may be lower or higher than the performance data quoted. Gateway Fund performance data that is current to the most recent month-end is available by calling 800.354.6339 or by accessing our website at www.gatewayfund.com.
LETTER TO SHAREHOLDERS
Dear Shareholder:
Throughout its history, the Gateway Fund has endeavored to deliver the rewards of effective risk management to its investors. That remains its highest priority. The Fund not only strives for consistent returns, but also returns in excess of those available from other investments comparable in volatility. In the following pages we review the Fund’s risk-management strategy, provide a 2006 year-to-date overview of the markets, discuss the Fund’s performance for the six months ended June 30, 2006, and offer our perspective for the remainder of the year.
STRATEGY REVIEW
The investment objective of the Fund is to capture the majority of the higher returns associated with equity market investments, while exposing investors to significantly less risk than other equity investments. The Fund employs a strategy comprised of three integrated components: sale of cash-settled index call options on its equity portfolio; purchase of index put options; and ownership of a broadly diversified common stock portfolio designed to support its index-option-based risk management strategy.
By selling index call options, the Fund receives cash flow from option premiums in exchange for the uncertain future potential of its equity portfolio. The degree of uncertainty in the equity markets determines the magnitude of the cash flow available to the Fund. In highly volatile markets, uncertainty is magnified and cash flow available from index call options rises. Conversely, when markets exhibit reduced volatility, this cash flow decreases. The Fund seeks to optimize the cash flow earned from the sale of index call options, which serves as the Fund’s primary source of return.
As the cash flow from the sale of index call options varies over time and is somewhat limited in its ability to reduce downside exposure, the Fund also buys index put options to protect against a significant market decline over a short period of time. The value of an index put option generally rises as the underlying stock prices decline. The Fund seeks the most cost-effective protection available from index put options, which serve as a key component in reducing the overall volatility of the Fund.
The final component of the Fund’s strategy is the continuous ownership of a diversified common stock portfolio generally representative of the broad U. S. equity market. The common stock portfolio is constructed to provide support for the index option strategy by minimizing the difference between the performance of the stock portfolio and that of the index or indexes underlying the Fund’s option positions while also considering other factors, such as predicted dividend yield of the portfolio.
The interaction of the three components of the Fund’s strategy is designed to provide fairly consistent returns over a wide range of market conditions. Accordingly, the total return of the Fund over a given time period is a combination of the change in market value and the dividend yield associated with the common stock portfolio, the cash flow earned from index call options, the cost of purchasing index put options and the operating expenses of the Fund.
ASSET ALLOCATION AS A PERCENTAGE OF NET ASSETS AS OF JUNE 30, 2006 |
| | | | | |
| Common Stocks | | | 99.0 | % |
| Put Options | | | 0.2 | % |
| Repurchase Agreements | | | 2.0 | % |
| Call Options Written | | | (1.4 | %) |
| Other Assets and Liabilities, Net | | | 0.2 | % |
| | | | 100.0 | % |
| | | | | |
LETTER TO SHAREHOLDERS
2006 YEAR-TO-DATE MARKET OVERVIEW
In the first six months of 2006, equity markets struggled to find direction. Manufacturing, business investment and raw material sectors have been making up for the slowdown in automobiles and housing. Overall, the economy has surged forward and corporate America has delivered robust profit growth. The Federal Reserve Board’s continuing efforts to curtail incipient inflation by raising rates (four times in the first half of 2006) have served to dampen the housing market, but little else. Although earnings continued to reflect a strong economy, equity investors increasingly became concerned that persistent interest rate increases may overshoot their goal and inhibit economic growth. In the face of uncertainties posed by an aggressive monetary policy and ongoing geopolitical factors, the S&P 500 Index managed a return of 2.71% for the six months ended June 30, 2006.
Bond markets also struggled with the steady escalation in short-term interest rates, combined with dramatic increases in the prices of gold, commodities and energy. The Federal Reserve Bank was joined by many central banks worldwide in raising interest rates to restrain liquidity, leaving bond investors no place to hide. Even with indications of a readiness by the Federal Reserve Board to pause in its persistent interest rate increases, bond investors remained cautious and generally withheld their support. Bonds, as represented by the Lehman Brothers U. S. Intermediate Government/Credit Bond Index, lost ground in the first six months of 2006, suffering a decline in excess of their average coupons and posting a loss of 0.18%.
The CBOE Volatility Index (the “VIX”), a key gauge of option pricing and headline measure of equity market volatility, continued near the low end of its historical range throughout most of the first quarter of 2006. In the second quarter, investors’ collective anxiety was heightened during a market sell-off fueled by inflationary fears, early indications of an economic slowdown and global instability. As a result, volatility, as measured by the VIX, increased significantly as the first half of 2006 progressed, climbing to its highest level in over three years. Since market volatility largely determines option prices, net cash flow available from index option premiums improved as the VIX trended upward. Higher net cash flow from option premiums can add to total return in a flat- or moderately-rising market or help to buffer against falling stock values in a declining market.
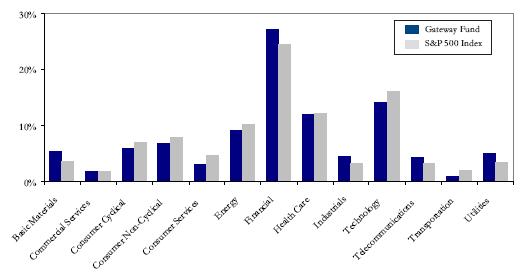
PORTFOLIO SECTOR WEIGHTING
% OF COMMON STOCKS
AS OF JUNE 30, 2006
LETTER TO SHAREHOLDERS
2006 YEAR-TO-DATE PERFORMANCE COMMENTARY
The following discussion of the Fund’s comparative performance to the S&P 500 Index and the Lehman Brothers U. S. Intermediate Government/Credit Bond Index focuses on the results of the Fund’s index-option-based risk management strategy since its diversified common stock portfolio is designed to support this strategy. For the six months ended June 30, 2006, the Fund rewarded investors with a total return of 4.15%, outperforming both the 2.71% return for the unhedged S&P 500 Index and the 0.18% loss incurred by the Lehman Brothers U. S. Intermediate Government/Credit Bond Index during the same period. The Fund’s favorable comparative return was achieved while remaining hedged with index call and put options during a period of relatively low volatility which limited net cash flows available from option premiums.
As the first quarter of 2006 unfolded, the equity markets entered January with renewed enthusiasm reflecting pent-up consumer demand. A strong economy, stabilizing energy prices and greater consumer spending led to another round of favorable corporate profit reports. Overall, investors remained confident that the Federal Reserve Board would successfully control inflation and that the geopolitical situation, particularly the war in Iraq, would not pose a significant drag on the economy. Reflecting this buoyed consumer confidence, the S&P 500 Index gained 4.21% for the first quarter of 2006. While the expected control of inflationary pressures excited equity investors, it failed to convince bond investors. The Lehman Brothers U. S. Intermediate Government/Credit Bond Index ended the quarter down 0.39%. On the strength of an appreciating market and a dividend yield above S&P 500 Index levels, the Fund posted a 3.24% return for the three months ended March 31, 2006. However, the Fund lagged the return for the S&P 500 Index as the Fund’s hedging techniques, while successful in reducing risk exposure, limited its participation in January’s strong short-term
market advance.
GROWTH OF A $10,000 INVESTMENT
June 30, 1996 - June 30, 2006
Past performance does not guarantee future results. The average annual total return figures assume the reinvestment of distributions, but do not reflect the deduction of taxes paid on distributions or on the redemption of your shares.
LETTER TO SHAREHOLDERS
The economy steamed ahead in April despite the restraining influences of rapidly escalating oil prices, another Federal Reserve Board interest rate increase in late March and continuing violence in the Middle East. Although equity markets were generally supported by positive earnings, the rally ended in May when inflationary fears and uncertainty over the intent and effectiveness of monetary policy unnerved investors. Only a strong rally, following a favorable interpretation of a June 29 Federal Reserve Board policy statement, limited the second quarter 2006 loss for the S&P 500 Index to 1.44%. The bond markets, represented by the Lehman Brothers U. S. Intermediate Government/Credit Bond Index, advanced by a disappointing 0.21% for the same period as inflationary fears and persistent interest rate increases continued to apply downward pressure. During the second quarter, the Fund’s positive return of 0.88% resulted from increased cash flow earned from both net option premiums and common stock dividends, more than offsetting the decline in value of its common stocks.
During the first six months of 2006, the Fund has performed true to its hedged equity investment objective. The Fund’s combined net option premium cash flow and dividend income accrued to the benefit of total return in the first quarter and allowed it to fully offset declining stock valuations in the second quarter. This enabled the Fund to finish the first six months of the year 1.44% ahead of the S&P 500 Index while remaining hedged with both index call and put options throughout the period. The Fund was able to provide shareholders with exceptional risk-adjusted performance and reinforce to investors the value of a hedged equity portfolio.
SECOND HALF 2006 PERSPECTIVE
Coping with rising interest rates and concerns over both geopolitical issues and monetary policy was a major challenge for investors during the first six months of 2006. With most traditional asset classes still performing below their historical averages, investors continue to search for attractive equity alternatives. However, while allocations to particular sectors of the market may be cyclically attractive, these inevitably will cool as other opportunities arise. Attempting to correctly identify which sectors may next outperform in the near-term is a risky proposition given existing economic uncertainties and increasing market volatility as we head into the second half of 2006.
Thus far in 2006, investors have focused more on favorable domestic news and less on unsettled international events, but sentiments can change very quickly, given the considerable uncertainties at play. Regardless of how the market performs for the remainder of 2006, we believe the Fund should continue to provide investors with a rather stable alternative - as it has for more than 18 years. While no investment strategy can assure returns in all market environments, we believe the Fund’s disciplined hedged equity strategy, which results in measurable cash flow and a low risk profile, delivers performance that represents an attractive trade-off between risk and reward.
SECOND QUARTER 2006 DISTRIBUTION
The Fund paid an ordinary income dividend of $0.125 per share on June 28, 2006, to shareholders of record as of June 27, 2006. Beginning with this second quarter 2006 dividend, the Fund will distribute net investment income near the end of each calendar quarter. The Fund will continue to distribute net capital gains, if any, annually at the end of December. We invite you to visit our website at www.gatewayfund.com for updates on the Fund’s distributions, investment results and portfolio statistics.
As always, we appreciate your support and continued confidence.
| Walter G. Sall | Patrick Rogers, CFA |
| Chairman | President |
PORTFOLIO OF INVESTMENTS - JUNE 30, 2006 (UNAUDITED)
SHARES | | COMMON STOCKS - 99.0% | VALUE (000’S) | |
| | | BASIC MATERIALS - 5.3% | | | |
| 198,150 | | 3M Co. | $ | 16,005 | |
| 116,670 | | Alcoa Inc. | | 3,775 | |
| 46,500 | | Avery Dennison Corporation | | 2,700 | |
| 308,900 | | Companhia Siderurgica Nacional SA - ADR | | 9,947 | |
| 66,700 | | CONSOL Energy Inc. | | 3,116 | |
| 460,448 | | Dow Chemical Company | | 17,971 | |
| 519,400 | | E. I. du Pont de Nemours and Company | | 21,607 | |
| 141,600 | | Eastman Chemical Company | | 7,646 | |
| 120,900 | | Gerdau SA - ADR | | 1,803 | |
| 158,950 | | Lubrizol Corporation | | 6,334 | |
| 198,450 | | Lyondell Chemical Company | | 4,497 | |
| 121,125 | | MeadWestvaco Corporation | | 3,383 | |
| 131,100 | | Nucor Corporation | | 7,112 | |
| 397,650 | | Olin Corporation | | 7,130 | |
| 516,250 | | Packaging Corporation of America | | 11,368 | |
| 46,000 | | Peabody Energy Corporation | | 2,564 | |
| 262,150 | | RPM International, Inc. | | 4,719 | |
| 297,000 | | Sonoco Products Company | | 9,400 | |
| 109,000 | | Southern Copper Corporation | | 9,715 | |
| 46,383 | | USEC Inc. * | | 550 | |
| 251,900 | | Worthington Industries, Inc. | | 5,277 | |
| | | | | 156,619 | |
| | | COMMERCIAL SERVICES - 1.7% | | | |
| 181,750 | | Automatic Data Processing, Inc. | | 8,242 | |
| 126,600 | | Cendant Corporation | | 2,062 | |
| 55,400 | | Cognizant Technology Solutions Corporation - Class A * | | 3,732 | |
| 12,600 | | Corporate Executive Board Company | | 1,262 | |
| 52,900 | | DST Systems, Inc. * | | 3,148 | |
| 120,800 | | Dun & Bradstreet Corporation * | | 8,417 | |
| 97,550 | | Electronic Data Systems Corporation | | 2,347 | |
| 39,319 | | First Data Corporation | | 1,771 | |
| 74,000 | | Laidlaw International Inc. | | 1,865 | |
| 38,700 | | Omnicom Group Inc. | | 3,448 | |
| 98,000 | | Paychex, Inc. | | 3,820 | |
| 52,000 | | R. H. Donnelley Corp. * | | 2,812 | |
| 55,500 | | Robert Half International Inc. | | 2,331 | |
| 100,000 | | Sabre Holdings Corporation - Class A | | 2,200 | |
| 469,950 | | ServiceMaster Company | | 4,855 | |
| | | | | 52,312 | |
| | | CONSUMER CYCLICAL - 5.8% | | | |
| 115,100 | | Abercrombie & Fitch Co. - Class A | | 6,380 | |
| 150,900 | | American Axle & Manufacturing Holdings, Inc. | | 2,582 | |
| 150,100 | | American Eagle Outfitters, Inc. | | 5,109 | |
| | | | | | |
See accompanying notes to financial statements.
PORTFOLIO OF INVESTMENTS - JUNE 30, 2006 (UNAUDITED)
SHARES | | | VALUE (000’S) | |
| | | CONSUMER CYCLICAL (CONTINUED) | | | |
| 188,175 | | Best Buy Co., Inc. | $ | 10,320 | |
| 121,400 | | Chico’s FAS, Inc. * | | 3,275 | |
| 91,400 | | Claire’s Stores, Inc. | | 2,332 | |
| 15,600 | | Cummins, Inc. | | 1,907 | |
| 63,000 | | Ethan Allen Interiors Inc. | | 2,303 | |
| 130,860 | | Federated Department Stores, Inc. | | 4,789 | |
| 692,663 | | Ford Motor Company | | 4,800 | |
| 128,000 | | Furniture Brands International, Inc. | | 2,668 | |
| 174,250 | | Gap, Inc. | | 3,032 | |
| 173,250 | | General Motors Corporation | | 5,161 | |
| 99,750 | | Genuine Parts Company | | 4,156 | |
| 502,550 | | Home Depot, Inc. | | 17,986 | |
| 26,300 | | J. C. Penney Company, Inc. | | 1,775 | |
| 58,900 | | Lear Corporation | | 1,308 | |
| 175,000 | | Leggett & Platt, Incorporated | | 4,371 | |
| 262,850 | | Limited Brands | | 6,726 | |
| 35,500 | | Longs Drug Stores Corporation | | 1,620 | |
| 157,850 | | Lowe’s Companies, Inc. | | 9,577 | |
| 69,250 | | Michaels Stores, Inc. | | 2,856 | |
| 189,100 | | Nordstrom, Inc. | | 6,902 | |
| 57,500 | | OfficeMax Inc. | | 2,343 | |
| 151,300 | | Pier 1 Imports, Inc. | | 1,056 | |
| 106,500 | | RadioShack Corporation | | 1,491 | |
| 19,909 | | Sears Holding Corporation * | | 3,083 | |
| 95,700 | | Talbots, Inc. | | 1,766 | |
| 55,400 | | Tiffany & Co. | | 1,829 | |
| 88,350 | | TJX Companies, Inc. | | 2,020 | |
| 49,000 | | Tomkins PLC - ADR | | 1,056 | |
| 119,700 | | Tuesday Morning Corporation | | 1,574 | |
| 77,200 | | Urban Outfitters, Inc. * | | 1,350 | |
| 53,900 | | Volvo AB - ADR | | 2,642 | |
| 638,650 | | Wal-Mart Stores, Inc. | | 30,764 | |
| 97,574 | | Whirlpool Corporation | | 8,064 | |
| | | | | 170,973 | |
| | | CONSUMER NON-CYCLICAL - 6.8% | | | |
| 709,300 | | Altria Group, Inc. | | 52,084 | |
| 130,350 | | Avon Products, Inc. | | 4,041 | |
| 410,150 | | Coca-Cola Company | | 17,645 | |
| 156,150 | | Colgate-Palmolive Company | | 9,353 | |
| 156,250 | | ConAgra Foods, Inc. | | 3,455 | |
| 67,400 | | Estee Lauder Companies Inc. - Class A | | 2,606 | |
| 117,100 | | Kimberly-Clark Corporation | | 7,225 | |
| 117,950 | | Loews Corporation - Carolina Group | | 6,059 | |
| | | | | | |
See accompanying notes to financial statements.
PORTFOLIO OF INVESTMENTS - JUNE 30, 2006 (UNAUDITED)
SHARES | | | VALUE (000’S) | |
| | | CONSUMER NON-CYCLICAL (CONTINUED) | | | |
| 379,900 | | Newell Rubbermaid Inc. | $ | 9,813 | |
| 180,780 | | PepsiCo, Inc. | | 10,854 | |
| 793,251 | | Procter & Gamble Company | | 44,105 | |
| 52,500 | | Reynolds American Inc. | | 6,053 | |
| 541,450 | | Sara Lee Corporation | | 8,674 | |
| 71,990 | | Supervalu Inc. | | 2,210 | |
| 441,750 | | Tupperware Corporation | | 8,698 | |
| 228,298 | | Vector Group Ltd. | | 3,710 | |
| 64,600 | | Whole Foods Market, Inc. | | 4,176 | |
| | | | | 200,761 | |
| | | CONSUMER SERVICES - 3.1% | | | |
| 58,300 | | Aztar Corporation * | | 3,029 | |
| 35,000 | | Brunswick Corporation | | 1,164 | |
| 227,800 | | Citadel Broadcasting Company | | 2,027 | |
| 144,800 | | Deluxe Corporation | | 2,531 | |
| 150,000 | | Dow Jones & Company, Inc. | | 5,251 | |
| 123,200 | | Eastman Kodak Company | | 2,930 | |
| 220,400 | | GTECH Holdings Corporation | | 7,666 | |
| 56,000 | | Harrah’s Entertainment, Inc. | | 3,986 | |
| 95,300 | | International Game Technology | | 3,616 | |
| 55,400 | | Kerzner International Limited * | | 4,392 | |
| 233,000 | | Mattel, Inc. | | 3,847 | |
| 359,600 | | McDonald’s Corporation | | 12,083 | |
| 77,500 | | New York Times Company - Class A | | 1,902 | |
| 57,500 | | OSI Restaurant Partners, Inc. | | 1,989 | |
| 53,500 | | Polaris Industries Inc. | | 2,317 | |
| 112,250 | | R. R. Donnelley & Sons Company | | 3,586 | |
| 790,250 | | Regal Entertainment Group - Class A | | 16,058 | |
| 320,200 | | Sirius Satellite Radio Inc. * | | 1,521 | |
| 96,150 | | Standard Register Company | | 1,139 | |
| 298,550 | | Time Warner Inc. | | 5,165 | |
| 75,100 | | Walt Disney Company | | 2,253 | |
| 43,000 | | Wendy’s International, Inc. | | 2,506 | |
| | | | | 90,958 | |
| | | ENERGY - 9.1% | | | |
| 82,000 | | BJ Services Company | | 3,055 | |
| 59,500 | | BP PLC - ADR | | 4,142 | |
| 84,000 | | Chesapeake Energy Corporation | | 2,541 | |
| 584,764 | | Chevron Corporation | | 36,290 | |
| 331,762 | | ConocoPhillips | | 21,740 | |
| 90,200 | | Diamond Offshore Drilling, Inc. | | 7,571 | |
| 141,800 | | Eni SPA - ADR | | 8,331 | |
| 72,450 | | ENSCO International Incorporated | | 3,334 | |
See accompanying notes to financial statements.
PORTFOLIO OF INVESTMENTS - JUNE 30, 2006 (UNAUDITED)
SHARES | | | VALUE (000’S) | |
| | | ENERGY (CONTINUED) | | | |
| 1,687,432 | | Exxon Mobil Corporation | $ | 103,524 | |
| 191,850 | | Halliburton Company | | 14,237 | |
| 266,900 | | Kerr-McGee Corporation | | 18,510 | |
| 83,949 | | Patterson-UTI Energy, Inc. | | 2,377 | |
| 118,900 | | Royal Dutch Shell PLC - Class A - ADR | | 7,964 | |
| 296,300 | | Schlumberger Limited | | 19,292 | |
| 135,100 | | Smith International, Inc. | | 6,008 | |
| 208,150 | | Tidewater Inc. | | 10,241 | |
| | | | 269,157 | |
| | | FINANCIAL - 26.7% | | | |
| 68,450 | | A. G. Edwards, Inc. | | 3,787 | |
| 106,400 | | Aegon NV - ADR | | 1,816 | |
| 155,400 | | Allstate Corporation | | 8,505 | |
| 92,800 | | American Express Company | | 4,939 | |
| 248,000 | | American Home Mortgage Investment Corp. | | 9,141 | |
| 527,186 | | American International Group, Inc. | | 31,130 | |
| 73,100 | | Aon Corporation | | 2,545 | |
| 239,750 | | Arthur J. Gallagher & Co. | | 6,075 | |
| 157,000 | | Axa - ADR | | 5,146 | |
| 3,292 | | Banco Santander Chile SA - ADR | | 133 | |
| 1,559,941 | | Bank of America Corporation | | 75,033 | |
| 42,000 | | Barclays PLC - ADR | | 1,923 | |
| 155,020 | | Brandywine Realty Trust | | 4,987 | |
| 35,191 | | Capital One Financial Corporation | | 3,007 | |
| 88,650 | | Capitol Federal Financial | | 3,040 | |
| 152,975 | | Charles Schwab Corporation | | 2,445 | |
| 40,800 | | Chicago Mercantile Exchange | | 20,039 | |
| 1,590,515 | | Citigroup Inc. | | 76,726 | |
| 35,000 | | City National Corporation | | 2,278 | |
| 91,000 | | Colonial Properties Trust | | 4,495 | |
| 47,900 | | Commerce Bancorp, Inc. | | 1,709 | |
| 214,177 | | Converium Holding AG - ADR | | 1,180 | |
| 59,048 | | Countrywide Financial Corporation | | 2,249 | |
| 104,100 | | Eaton Vance Corp. | | 2,598 | |
| 394,300 | | Equity Office Properties Trust | | 14,396 | |
| 211,750 | | Fidelity National Financial, Inc. | | 8,248 | |
| 225,000 | | First Horizon National Corporation | | 9,045 | |
| 77,900 | | FirstMerit Corporation | | 1,631 | |
| 2,902,936 | | General Electric Company | | 95,681 | |
| 95,000 | | Genworth Financial Inc. - Class A | | 3,310 | |
| 75,900 | | Goldman Sachs Group, Inc. | | 11,418 | |
| 33,800 | | Hartford Financial Services Group, Inc. | | 2,859 | |
| 168,700 | | Healthcare Realty Trust, Inc. | | 5,373 | |
s
ee accompanying notes to financial statements.
PORTFOLIO OF INVESTMENTS - JUNE 30, 2006 (UNAUDITED)
SHARES | | | VALUE (000’S) | |
| | | FINANCIAL (CONTINUED) | | | |
| 375,000 | | Hospitality Properties Trust | $ | 16,470 | |
| 307,500 | | HSBC Holdings PLC - ADR | | 27,168 | |
| 46,600 | | ING Groep NV - ADR | | 1,832 | |
| 1,097,977 | | JPMorgan Chase & Co. | | 46,115 | |
| 69,100 | | Legg Mason, Inc. | | 6,877 | |
| 93,500 | | Lexington Corporate Properties Trust | | 2,020 | |
| 284,723 | | Lincoln National Corporation | | 16,070 | |
| 806,800 | | Lloyds TSB Group PLC - ADR | | 31,844 | |
| 192,100 | | Marsh & McLennan Companies, Inc. | | 5,166 | |
| 59,950 | | Mercury General Corporation | | 3,379 | |
| 113,550 | | Merrill Lynch & Co., Inc. | | 7,899 | |
| 305,350 | | Morgan Stanley | | 19,301 | |
| 36,900 | | National Australia Bank Limited - ADR | | 4,808 | |
| 182,000 | | Nationwide Financial Services, Inc. - Class A | | 8,023 | |
| 425,450 | | Nationwide Health Properties, Inc. | | 9,577 | |
| 107,200 | | New Century Financial Corporation | | 4,904 | |
| 787,900 | | New York Community Bancorp, Inc. | | 13,008 | |
| 91,450 | | Newcastle Investment Corporation | | 2,316 | |
| 85,700 | | North Fork Bancorporation, Inc. | | 2,586 | |
| 89,250 | | Old Republic International Corporation | | 1,907 | |
| 55,700 | | Royal & Sun Alliance Insurance Group PLC - ADR | | 697 | |
| 261,000 | | Senior Housing Properties Trust | | 4,674 | |
| 383,500 | | St. Paul Travelers Companies, Inc. | | 17,096 | |
| 118,600 | | TCF Financial Corporation | | 3,137 | |
| 881,483 | | U. S. Bancorp | | 27,220 | |
| 163,950 | | Unitrin, Inc. | | 7,147 | |
| 513,159 | | Wachovia Corporation | | 27,752 | |
| 279,700 | | Waddell & Reed Financial, Inc. - Class A | | 5,751 | |
| 244,200 | | Washington Mutual, Inc. | | 11,131 | |
| 386,650 | | Wells Fargo & Company | | 25,936 | |
| 56,250 | | XL Capital Ltd. - Class A | | 3,448 | |
| | | | | 792,146 | |
| | | HEALTH CARE - 11.8% | | | |
| 413,150 | | Abbott Laboratories | | 18,018 | |
| 158,200 | | Aetna Inc. | | 6,317 | |
| 239,000 | | Alderwoods Group, Inc. * | | 4,651 | |
| 163,527 | | Amgen Inc. * | | 10,667 | |
| 148,500 | | Baxter International Inc. | | 5,459 | |
| 42,200 | | Biogen Idec Inc. * | | 1,955 | |
| 147,310 | | Boston Scientific Corporation * | | 2,481 | |
| 1,354,900 | | Bristol-Myers Squibb Company | | 35,038 | |
| 109,750 | | Caremark Rx, Inc. | | 5,473 | |
| 28,925 | | Coventry Health Care, Inc. * | | 1,589 | |
See accompanying notes to financial statements.
PORTFOLIO OF INVESTMENTS - JUNE 30, 2006 (UNAUDITED)
SHARES | | | VALUE (000’S) | |
| | | HEALTH CARE (CONTINUED) | | | |
| 130,000 | | Diagnostic Products Corporation | $ | 7,562 | |
| 344,100 | | Eli Lilly and Company | | 19,018 | |
| 49,900 | | Genentech, Inc. * | | 4,082 | |
| 189,250 | | GlaxoSmithKline PLC - ADR | | 10,560 | |
| 787,822 | | Johnson & Johnson | | 47,206 | |
| 174,100 | | Lincare Holdings Inc. * | | 6,588 | |
| 38,813 | | Medco Health Solutions, Inc. * | | 2,223 | |
| 213,500 | | Medtronic Inc. | | 10,018 | |
| 38,600 | | Mentor Corporation | | 1,679 | |
| 1,053,400 | | Merck & Co., Inc. | | 38,375 | |
| 69,400 | | Novartis AG - ADR | | 3,742 | |
| 2,413,500 | | Pfizer Inc. | | 56,645 | |
| 143,950 | | Schering-Plough Corporation | | 2,739 | |
| 365,590 | | UnitedHealth Group Incorporated | | 16,371 | |
| 60,000 | | Universal Health Services, Inc. - Class B | | 3,016 | |
| 178,100 | | WellPoint, Inc. * | | 12,960 | |
| 320,300 | | Wyeth | | 14,225 | |
| | | | | 348,657 | |
| | | INDUSTRIALS - 4.3% | | | |
| 81,600 | | American Power Conversion Corporation | | 1,590 | |
| 37,950 | | Black & Decker Corporation | | 3,205 | |
| 145,000 | | Briggs & Stratton Corporation | | 4,511 | |
| 225,900 | | Caterpillar Inc. | | 16,825 | |
| 66,900 | | Deere & Company | | 5,585 | |
| 27,400 | | Eaton Corporation | | 2,066 | |
| 182,100 | | Emerson Electric Co. | | 15,262 | |
| 161,650 | | Hubbell Incorporated - Class B | | 7,703 | |
| 47,700 | | Ingersoll-Rand Company | | 2,041 | |
| 33,000 | | Parker-Hannifin Corporation | | 2,561 | |
| 87,350 | | Pentair, Inc. | | 2,986 | |
| 62,900 | | Snap-on Incorporated | | 2,542 | |
| 210,400 | | SPX Corporation | | 11,772 | |
| 126,300 | | Stanley Works | | 5,964 | |
| 833,500 | | Synagro Technologies, Inc. | | 3,276 | |
| 94,800 | | Timken Company | | 3,177 | |
| 402,403 | | Tyco International Ltd. | | 11,066 | |
| 283,500 | | United Technologies Corporation | | 17,980 | |
| 235,300 | | Waste Management, Inc. | | 8,442 | |
| | | | | 128,554 | |
| | | TECHNOLOGY - 14.1% | | | |
| 262,600 | | Activision, Inc. * | | 2,988 | |
| 156,371 | | Adobe Systems Incorporated * | | 4,747 | |
| 59,850 | | ADTRAN, Inc. | | 1,342 | |
See accompanying notes to financial statements.
PORTFOLIO OF INVESTMENTS - JUNE 30, 2006 (UNAUDITED)
SHARES | | | VALUE (000’S) | |
| | | TECHNOLOGY (CONTINUED) | | | |
| 145,175 | | Advanced Micro Devices, Inc. * | $ | 3,545 | |
| 36,300 | | Akamai Technologies, Inc. * | | 1,314 | |
| 25,000 | | Alliant Techsystems Inc. * | | 1,909 | |
| 86,000 | | Altera Corporation * | | 1,509 | |
| 103,400 | | Amazon.com, Inc. * | | 3,999 | |
| 135,050 | | Analog Devices, Inc. | | 4,340 | |
| 204,600 | | Apple Computer, Inc. * | | 11,687 | |
| 367,700 | | Applied Materials, Inc. | | 5,986 | |
| 40,300 | | Autodesk, Inc. * | | 1,389 | |
| 166,300 | | Aviall, Inc. * | | 7,903 | |
| 219,252 | | Boeing Company | | 17,959 | |
| 155,725 | | Broadcom Corporation - Class A * | | 4,680 | |
| 1,153,125 | | Cisco Systems, Inc. * | | 22,521 | |
| 359,275 | | Corning Incorporated * | | 8,691 | |
| 289,900 | | Dell Inc. * | | 7,076 | |
| 333,795 | | eBay Inc. * | | 9,777 | |
| 35,550 | | Goodrich Corporation | | 1,432 | |
| 71,200 | | Google Inc. - Class A * | | 29,856 | |
| 600,505 | | Hewlett-Packard Company | | 19,024 | |
| 317,400 | | Honeywell International Inc. | | 12,791 | |
| 1,845,778 | | Intel Corporation | | 34,977 | |
| 335,350 | | International Business Machines Corporation | | 25,762 | |
| 1,008,000 | | JDS Uniphase Corporation * | | 2,550 | |
| 45,000 | | KLA-Tencor Corporation | | 1,871 | |
| 52,600 | | Linear Technology Corporation | | 1,762 | |
| 699,190 | | Lucent Technologies Inc. * | | 1,692 | |
| 119,200 | | Maxim Integrated Products, Inc. | | 3,828 | |
| 178,450 | | Microchip Technology Incorporated | | 5,987 | |
| 2,437,500 | | Microsoft Corporation | | 56,794 | |
| 496,771 | | Motorola, Inc. | | 10,010 | |
| 86,750 | | National Semiconductor Corporation | | 2,069 | |
| 96,400 | | NVIDIA Corporation * | | 2,052 | |
| 1,204,367 | | Oracle Corporation * | | 17,451 | |
| 410,700 | | QUALCOMM Incorporated | | 16,457 | |
| 91,900 | | Raytheon Company | | 4,096 | |
| 76,800 | | Red Hat, Inc. * | | 1,797 | |
| 239,187 | | Symantec Corporation * | | 3,717 | |
| 368,737 | | Taiwan Semiconductor Manufacturing Company Ltd. - ADR | | 3,385 | |
| 368,400 | | Texas Instruments Incorporated | | 11,159 | |
| 404,300 | | United Online, Inc. | | 4,852 | |
| 57,800 | | VeriSign, Inc. * | | 1,339 | |
| 128,500 | | Xilinx, Inc. | | 2,911 | |
| 421,150 | | Yahoo! Inc. * | | 13,898 | |
| | | | | 416,881 | |
See accompanying notes to financial statements.
PORTFOLIO OF INVESTMENTS - JUNE 30, 2006 (UNAUDITED)
SHARES | | | VALUE (000’S) | |
| | | TELECOMMUNICATIONS - 4.2% | | | |
| 1,348,223 | | AT&T Inc. | $ | 37,602 | |
| 544,150 | | BellSouth Corporation | | 19,698 | |
| 92,000 | | China Mobile HK Limited - ADR | | 2,632 | |
| 1,204,490 | | Citizens Communications Company | | 15,719 | |
| 18,306 | | Embarq Corporation * | | 750 | |
| 69,300 | | France Telecom SA - ADR | | 1,515 | |
| 366,130 | | Sprint Nextel Corporation | | 7,319 | |
| 65,500 | | Telstra Corporation Ltd. - ADR | | 897 | |
| 124,400 | | Valor Communications Group, Inc. | | 1,424 | |
| 1,070,068 | | Verizon Communications Inc. | | 35,837 | |
| | | | | 123,393 | |
| | | TRANSPORTATION - 1.0% | | | |
| 143,200 | | AMR Corporation * | | 3,640 | |
| 182,100 | | JetBlue Airways Corporation * | | 2,211 | |
| 51,300 | | Macquarie Infrastructure Company Trust | | 1,415 | |
| 132,700 | | Southwest Airlines Co. | | 2,172 | |
| 247,400 | | United Parcel Service, Inc. - Class B | | 20,369 | |
| | | | | 29,807 | |
| | | UTILITIES - 5.1% | | | |
| 115,900 | | Ameren Corporation | | 5,853 | |
| 612,600 | | Atmos Energy Corporation | | 17,098 | |
| 42,000 | | Companhia Energetica de Minas Gerais SA - ADR | | 1,790 | |
| 214,500 | | Consolidated Edison, Inc. | | 9,532 | |
| 536,600 | | Duke Energy Corporation | | 15,760 | |
| 208,850 | | Duquesne Light Holdings Inc. | | 3,433 | |
| 48,600 | | Enel SPA - ADR | | 2,091 | |
| 127,000 | | Energy East Corporation | | 3,039 | |
| 304,550 | | Great Plains Energy Incorporated | | 8,485 | |
| 295,500 | | KeySpan Corporation | | 11,938 | |
| 152,000 | | National Fuel Gas Company | | 5,341 | |
| 338,300 | | NICOR Inc. | | 14,040 | |
| 155,550 | | OGE Energy Corp. | | 5,449 | |
| 149,900 | | ONEOK, Inc. | | 5,103 | |
| 304,100 | | Peoples Energy Corporation | | 10,920 | |
| 177,450 | | Pepco Holdings, Inc. | | 4,184 | |
| 252,703 | | Progress Energy, Inc. | | 10,833 | |
| 95,950 | | Public Service Enterprise Group Inc. | | 6,344 | |
| 407,400 | | United Utilities PLC - ADR | | 9,660 | |
| | | | | 150,893 | |
| | | | | | |
| | | Total common stocks (cost $2,488,981) | | 2,931,111 | |
See accompanying notes to financial statements.
PORTFOLIO OF INVESTMENTS - JUNE 30, 2006 (UNAUDITED)
CONTRACTS | | | VALUE (000’S) | |
| | | PUT OPTIONS - 0.2% | | | |
| 3,400 | | On S&P 500 Index expiring July 22, 2006 at 1150 | $ | 187 | |
| 3,420 | | On S&P 500 Index expiring July 22, 2006 at 1175 | | 325 | |
| 6,167 | | On S&P 500 Index expiring July 22, 2006 at 1200 | | 1,048 | |
| 2,645 | | On S&P 500 Index expiring July 22, 2006 at 1225 | | 873 | |
| 3,662 | | On S&P 500 Index expiring August 19, 2006 at 1150 | | 934 | |
| 3,444 | | On S&P 500 Index expiring August 19, 2006 at 1175 | | 1,343 | |
| | | | | | |
| | | Total put options (cost $13,517) | | 4,710 | |
| | | | | | |
| | | REPURCHASE AGREEMENT - 2.0% ** | | | |
| | | 4.10% repurchase agreement with U. S. Bank, N. A. dated June 30, 2006 due July 3, 2006 (repurchase proceeds $59,891) | | 59,871 | |
| | | | | | |
| | | Total common stocks, put options and repurchase agreement - 101.2% | | 2,995,692 | |
| | | | | | |
| | | CALL OPTIONS WRITTEN - (1.4%) *** | | | |
| (2,841) | | On S&P 500 Index expiring July 22, 2006 at 1250 | | (8,452 | ) |
| (5,805) | | On S&P 500 Index expiring July 22, 2006 at 1275 | | (7,372 | ) |
| (2,571) | | On S&P 500 Index expiring July 22, 2006 at 1300 | | (765 | ) |
| (2,572) | | On S&P 500 Index expiring August 19, 2006 at 1250 | | (10,224 | ) |
| (3,018) | | On S&P 500 Index expiring August 19, 2006 at 1275 | | (6,926 | ) |
| (3,019) | | On S&P 500 Index expiring August 19, 2006 at 1300 | | (3,200 | ) |
| (2,912) | | On S&P 500 Index expiring September 16, 2006 at 1300 | | (5,300 | ) |
| | | | | | |
| | | Total call options written (premiums received $60,682) | | (42,239 | ) |
| | | | | | |
| | | OTHER ASSETS AND LIABILITIES, NET - 0.2% | | 6,883 | |
| | | | | | |
| | | NET ASSETS - 100.0% | $ | 2,960,336 | |
*Non-income producing.
**Repurchase agreement fully collateralized by U. S. Government Agency obligations.
***The $2,931,111,000 aggregate value of common stocks covers call options written.
ADR - American Depository Receipt.
Common stocks are grouped by sector.
See accompanying notes to financial statements.
STATEMENT OF ASSETS AND LIABILITIES - JUNE 30, 2006 (UNAUDITED)
| | | (000's) | |
ASSETS: | | | |
| Common stocks, at value (cost $2,488,981) | | $ | 2,931,111 | |
| Put options, at value (cost $13,517) | | | 4,710 | |
| Repurchase agreement | | | 59,871 | |
| Dividends and interest receivable | | | 5,920 | |
| Receivable for Fund shares sold | | | 4,345 | |
| Other assets | | | 102 | |
| Total assets | | | 3,006,059 | |
| | | | | |
LIABILITIES: | | | | |
| Call options written, at value (premiums received $60,682) | | | 42,239 | |
| Payable for Fund shares redeemed | | | 2,480 | |
| Accrued distribution expenses | | | 856 | |
| Accrued investment advisory and management fees | | | 58 | |
| Other accrued expenses and liabilities | | | 90 | |
| Total liabilities | | | 45,723 | |
| | | | | |
NET ASSETS | | $ | 2,960,336 | |
| | | | | |
NET ASSETS CONSIST OF: | | | | |
| Paid-in capital | | $ | 2,623,627 | |
| Undistributed net investment income | | | 14,501 | |
| Accumulated net realized loss on investment transactions | | | (129,558 | ) |
| Net unrealized appreciation on investments | | | 451,766 | |
| Net assets | | $ | 2,960,336 | |
| | | | | |
FUND SHARES OUTSTANDING | | | | |
| (unlimited number of shares authorized) | | | 114,245 | |
| | | | | |
NET ASSET VALUE, OFFERING PRICE AND | | | | |
REDEMPTION PRICE PER SHARE | | $ | 25.91 | |
| | | | | |
See accompanying notes to financial statements.
STATEMENT OF OPERATIONS - FOR THE SIX MONTHS ENDED JUNE 30, 2006 (UNAUDITED)
| | | | (000's) | |
INVESTMENT INCOME: | | | | |
| Dividends | | $ | 40,058 | |
| Interest | | | 1,917 | |
| Other income | | | 189 | |
| Total investment income | | | 42,164 | |
| | | | | |
EXPENSES: | | | | |
| Investment advisory and management fees | | | 8,321 | |
| Distribution expenses | | | 4,771 | |
| Trustees’ fees | | | 114 | |
| Professional fees | | | 76 | |
| Insurance expense | | | 37 | |
| Registration fees | | | 30 | |
| Custodian fees | | | 24 | |
| Other expenses | | | 48 | |
| Total expenses | | | 13,421 | |
| | | | | |
NET INVESTMENT INCOME | | | 28,743 | |
| | | | | |
REALIZED AND UNREALIZED GAIN ON INVESTMENTS: | | | | |
Realized gain (loss) on investment transactions: | | | | |
| Common stocks | | | (12,427 | ) |
| Put options expired and closed | | | (16,564 | ) |
| Call options expired and closed | | | 61,329 | |
| Net realized gain on investment transactions | | | 32,338 | |
| | | | | |
Change in unrealized appreciation/depreciation on investments: | | | | |
| Common stocks | | | 70,179 | |
| Put options | | | (7,828 | ) |
| Call options | | | (9,173 | ) |
| Net change in unrealized appreciation/depreciation on investments | | | 53,178 | |
| | | | | |
NET REALIZED AND UNREALIZED GAIN ON INVESTMENTS | | | 85,516 | |
| | | | | |
NET INCREASE IN NET ASSETS FROM OPERATIONS | | $ | 114,259 | |
See accompanying notes to financial statements.
STATEMENTS OF CHANGES IN NET ASSETS
| | | | | | |
| | | Six Months Ended June 30, 2006 (Unaudited) | | Year Ended December 31, 2005 | |
FROM OPERATIONS: | | | | | |
| Net investment income | | $ | 28,743 | | $ | 45,804 | |
| Net realized gain (loss) on investment transactions | | | 32,338 | | | (6,570 | ) |
| Net change in unrealized appreciation/depreciation on investments | | | 53,178 | | | 73,039 | |
| Net increase in net assets from operations | | | 114,259 | | | 112,273 | |
| | | | | | | | |
DISTRIBUTIONS TO SHAREHOLDERS: | | | | | | | |
| From net investment income | | | (14,242 | ) | | (47,247 | ) |
| | | | | | | | |
FROM FUND SHARE TRANSACTIONS: | | | | | | | |
| Proceeds from shares sold | | | 499,772 | | | 1,029,880 | |
Net asset value of shares issued in reinvestment of distributions to shareholders | | | 12,451 | | | 40,866 | |
| Payments for shares redeemed | | | (359,547 | ) | | (532,064 | ) |
| Net increase in net assets from Fund shares transactions | | | 152,676 | | | 538,682 | |
| | | | | | | | |
NET INCREASE IN NET ASSETS | | | 252,693 | | | 603,708 | |
| | | | | | | | |
NET ASSETS: | | | | | | | |
| Beginning of period | | | 2,707,643 | | | 2,103,935 | |
| End of period | | $ | 2,960,336 | | $ | 2,707,643 | |
| | | | | | | | |
UNDISTRIBUTED NET INVESTMENT INCOME | | $ | 14,501 | | $ | ¾ | |
| | | | | | | | |
FUND SHARE TRANSACTIONS: | | | | | | | |
| Shares sold | | | 19,491 | | | 41,538 | |
| Shares issued in reinvestment of distributions to shareholders | | | 486 | | | 1,631 | |
| Shares redeemed | | | (14,029 | ) | | (21,402 | |
| Net increase in Fund shares outstanding | | | 5,948 | | | 21,767 | |
| Shares outstanding, beginning of period | | | 108,297 | | | 86,530 | |
| Shares outstanding, end of period | | | 114,245 | | | 108,297 | |
See accompanying notes to financial statements.
FINANCIAL HIGHLIGHTS - PER SHARE DATA FOR A SHARE OUTSTANDING THROUGHOUT EACH PERIOD
| | | Six Months Ended June 30, 2006 | | Year Ended December 31, |
| | | (Unaudited) | | 2005 | | 2004 | | 2003 | | 2002 | | 2001 | |
| | | | | | | | | | | | | | | | | | | | |
BEGINNING NET ASSET VALUE | | $ | 25.00 | | $ | 24.31 | | $ | 23.00 | | $ | 20.76 | | $ | 21.98 | | $ | 22.92 | |
| | | | | | | | | | | | | | | | | | | | |
INVESTMENT OPERATIONS: | | | | | | | | | | | | | | | | | | | |
| Net investment income | | | 0.25 | | | 0.44 | | | 0.29 | | | 0.17 | | | 0.15 | | | 0.11 | |
| Net realized and unrealized gain (loss) | | | 0.79 | | | 0.70 | | | 1.31 | | | 2.24 | | | (1.22 | ) | | (0.92 | ) |
| Total from investment operations | | | 1.04 | | | 1.14 | | | 1.60 | | | 2.41 | | | (1.07 | ) | | (0.81 | ) |
| | | | | | | | | | | | | | | | | | | | |
DISTRIBUTIONS: | | | | | | | | | | | | | | | | | | | |
| Dividends from net investment income | | | (0.13 | ) | | (0.45 | ) | | (0.29 | ) | | (0.17 | ) | | (0.15 | ) | | (0.11 | ) |
| Distributions from net realized gain | | | ¾ | | | ¾ | | | ¾ | | | ¾ | | | ¾ | | | | ) |
| Total distributions | | | (0.13 | ) | | (0.45 | ) | | (0.29 | ) | | (0.17 | ) | | (0.15 | ) | | (0.13 | ) |
| | | | | | | | | | | | | | | | | | | | |
ENDING NET ASSET VALUE | | $ | 25.91 | | $ | 25.00 | | $ | 24.31 | | $ | 23.00 | | $ | 20.76 | | $ | 21.98 | |
| | | | | | | | | | | | | | | | | | | | |
TOTAL RETURN | | | 4.15% | (1) | | 4.66 | % | | 6.95 | % | | 11.61 | % | | (4.86 | %) | | (3.53 | %) |
| | | | | | | | | | | | | | | | | | | | |
ENDING NET ASSETS (000’S) | | $ | 2,960,336 | | $ | 2,707,643 | | $ | 2,103,935 | | $ | 1,405,561 | | $ | 1,068,448 | | $ | 1,285,131 | |
| | | | | | | | | | | | | | | | | | | | |
AVERAGE NET ASSETS RATIOS: | | | | | | | | | | | | | | | | | | | |
| Total expenses | | | 0.95 | %(2) | | 0.95 | % | | 0.97 | % | | 0.97 | % | | 0.97 | % | | 0.97 | % |
| Net investment income | | | 2.03 | %(2) | | 1.87 | % | | 1.42 | % | | 0.86 | % | | 0.66 | % | | 0.43 | % |
| | | | | | | | | | | | | | | | | | | | |
PORTFOLIO TURNOVER RATE | | | 11 | %(2) | | 15 | % | | 71 | % | | 5 | % | | 13 | % | | 18 | % |
(1) Unannualized.
(2) Annualized.
See accompanying notes to financial statements.
NOTES TO FINANCIAL STATEMENTS - JUNE 30, 2006 (UNAUDITED)
1. ORGANIZATION AND SIGNIFICANT ACCOUNTING POLICIES
The Gateway Trust (the “Trust”) is an Ohio business trust, registered under the Investment Company Act of 1940, which is authorized to establish and operate one or more separate series of mutual funds. The Trust currently operates one diversified mutual fund, the Gateway Fund (the “Fund”). The investment objective of the Fund is to capture the majority of the higher returns associated with equity market investments, while exposing investors to significantly less risk than other equity investments. The Fund attempts to achieve its investment objective primarily by owning a broadly diversified portfolio of common stocks and by selling index call options. The Fund also buys index put options that can protect the Fund from a significant market decline over a short period of time.
The following is a summary of the Fund’s significant accounting policies:
Investments valuation - The Fund values its portfolio securities as of the close of the regular session of trading on the New York Stock Exchange (the “NYSE”), normally 4:00 P.M. Eastern time. Securities, other than option contracts, traded on a national stock exchange are valued at the last reported sales price on the primary exchange on which the security is traded. Securities traded in the over-the-counter market, and which are quoted by NASDAQ, are valued at the NASDAQ Official Closing Price. Option contracts (both purchased and written) are valued at the average of the closing bid and asked quotations. Securities, other than option contracts, for which market quotations are not readily available or in which trading has been suspended during the day, and option contracts for which closing market quotations are not considered to reflect option contract values as of the close of the NYSE, are valued at fair value as determined in good faith under procedures adopted by the Board of Trustees.
Share valuation - The net asset value per share of the Fund is calculated daily by dividing the total value of the Fund’s assets, less liabilities, by the number of shares outstanding. The offering price and redemption price per share are equal to the net asset value per share.
Investment transactions and investment income - Investment transactions are recorded on the trade date. Capital gains and losses are calculated on an identified cost basis. Dividend income is recorded on the ex-dividend date and interest income is accrued daily.
Option transactions - The Fund purchases index put options and writes (sells) index call options. When the Fund writes an index call option, an amount equal to the net premium received (the premium less commission) is recorded as a liability and is subsequently adjusted to the current value until the option expires or the Fund enters into a closing purchase transaction. When an index call option expires on its stipulated expiration date or the Fund enters into a closing purchase transaction, the difference between the net premium received and any amount paid at expiration or on effecting a closing purchase transaction, including commission, is treated as a realized gain or, if the net premium received is less than the amount paid, as a realized loss. The Fund, as writer of an index call option, bears the risk of an unfavorable change in the market value of the index underlying the written option.
Distributions to shareholders - Distributions from net investment income are recorded on the ex-dividend date and are declared and paid to shareholders quarterly beginning in June 2006. Distributions from net realized capital gains, if any, are recorded on the ex-dividend date and are declared and paid to shareholders annually.
NOTES TO FINANCIAL STATEMENTS - JUNE 30, 2006 (UNAUDITED)
Federal income taxes - The Fund intends to comply with the provisions of Subchapter M of the Internal Revenue Code applicable to regulated investment companies and distribute substantially all of its taxable income to shareholders. Based on this policy, the Fund makes no provision for income taxes.
At December 31, 2005 the components of distributable earnings on a tax basis were as follows (000’s):
| | | | | |
| Cost of common stocks and options | | $ | 2,241,014 | |
| | | | | |
| Gross unrealized appreciation | | $ | 430,824 | |
| Gross unrealized depreciation | | | (72,037 | ) |
| Net unrealized appreciation | | | 358,787 | |
| Capital loss carryforwards | | | (122,095 | ) |
| Distributable earnings | | $ | 236,692 | |
The Fund’s capital loss carryforwards expire December 31, 2011. For the year ended December 31, 2005, the Fund utilized $28,553,000 of the capital loss carryforwards to offset realized gains. The difference between the book basis and tax basis of distributable earnings resulted from the tax deferral of losses on wash sales and the tax recognition of net unrealized appreciation on open option contracts at December 31, 2005. There was no difference between the book basis and tax basis of distributions paid for the year ended December 31, 2005.
For the year ended December 31, 2005, the Fund reclassified distributions in excess of net investment income of $1,376,000 against paid-in capital on the Statement of Assets and Liabilities. Such reclassification, the result of permanent differences between book and tax reporting requirements, has no effect on the Fund’s net assets or net asset value per share.
At June 30, 2006, based on a $2,454,852,000 federal tax cost of common stocks and options, gross unrealized appreciation totaled $521,841,000, gross unrealized depreciation totaled $83,111,000 and net unrealized appreciation totaled $438,730,000. The difference between the book cost and the federal income tax cost of common stocks and options resulted from the tax deferral of losses on wash sales.
Repurchase agreements - The Fund requires the custodian to hold sufficient collateral to secure repurchase agreements. To reduce the chance of loss in its repurchase transactions, the Fund enters into repurchase agreements only with banks that have more than $1 billion in assets and are creditworthy in the judgment of Gateway Investment Advisers, L.P. (the “Adviser”).
Estimates - The preparation of financial statements in conformity with accounting principles generally accepted in the United States requires management to make estimates and assumptions that affect the reported amounts of assets and liabilities at the date of the financial statements and the reported amounts of income and expenses during the reporting period. Actual results could differ from those estimates.
2. TRANSACTIONS WITH AFFILIATES
The Fund pays the Adviser an investment advisory and management fee under the terms of a Management Agreement at an annual rate of 0.925% of average daily net assets minus all distribution expenses. The Fund has adopted a Distribution Plan pursuant to Rule 12b-1 of the Investment Company Act of 1940 that allows for the payment of distribution expenses by the Fund related to the sale and distribution of its shares. In any year, distribution expenses cannot exceed 0.50% of average daily net assets. The Adviser receives no separate fee for its transfer agency, fund accounting and other services to the Fund, and the Adviser pays the Fund’s expenses of reporting to shareholders under the Management Agreement.
NOTES TO FINANCIAL STATEMENTS - JUNE 30, 2006 (UNAUDITED)
If total annual operating expenses (excluding taxes, interest, brokerage commissions and expenses of an extraordinary nature) exceed 1.50% of the Fund’s average daily net assets, the Adviser has agreed to reduce its fee as necessary to limit the Fund’s expenses to this level.
3. INVESTMENT TRANSACTIONS
For the six months ended June 30, 2006, cost of purchases of investment securities (excluding any short-term investments and U. S. government securities) totaled $396,741,000 and proceeds from sales totaled $157,718,000.
The Fund may write (sell) call options on stock indexes in exchange for cash (that is, the premium received) to enhance earnings on the portfolio securities. However, using these call options limits the opportunity to participate in appreciation of the underlying portfolio beyond certain upper limits set by the contracts. In general, the liability recorded upon receipt of written option premiums increases to offset rises and decreases to offset declines in portfolio value. For the six months ended June 30, 2006, transactions in written options were as follows:
| | | Contracts | | Premiums (000’s) | |
| Outstanding at December 31, 2005 | | | 21,015 | | $ | 67,987 | |
| Options written | | | 83,220 | | | 246,578 | |
| Options terminated in closing | | | | | | | |
| purchase transactions | | | (74,928 | ) | | (237,478 | ) |
| Options expired | | | (6,569 | ) | | (16,405 | ) |
| Outstanding at June 30, 2006 | | | 22,738 | | $ | 60,682 | |
4. BANK LINE OF CREDIT
The Fund has an uncommitted $85 million bank line of credit to be used as a temporary liquidity source for meeting redemption requests. Borrowings under this arrangement, expiring October 31, 2006, bear interest at the bank’s prime rate minus 0.50%. There are no fees associated with maintaining this facility. During the six months ended June 30, 2006, there were no borrowings on this line of credit.
5. COMMITMENTS AND CONTINGENCIES
The Fund indemnifies the Trustees and officers of the Trust for certain liabilities that might arise from the performance of their duties to the Fund. Additionally, in the normal course of business, the Fund enters into contracts that contain a variety of representations and warranties and which provide general indemnifications. The Fund’s maximum exposure under these arrangements is unknown, as this would involve future claims that may be made against the Fund that have not yet occurred. However, based on experience, the Fund expects the risk of loss to be remote.
6. TAX INFORMATION
On June 28, 2006, the Fund declared and paid an income dividend of $14,242,000 or $0.1250 per share to shareholders of record as of June 27, 2006.
FUND EXPENSES (UNAUDITED)
As a shareholder of the Gateway Fund (the “Fund”), you may incur two types of costs: (1) transaction costs, including any transaction fees that you may be charged if you purchase or redeem the Fund through certain financial institutions; and (2) ongoing costs, including investment advisory and management fees, distribution expenses and other Fund expenses. The example below is intended to help you understand your ongoing costs (in dollars) of investing in the Fund and to compare these costs with the ongoing costs of investing in other mutual funds. The example is based on an investment of $1,000 invested at the beginning of the period (January 1, 2006) and held for the six-month period ended June 30, 2006.
ACTUAL EXPENSES
The first line in the table below provides information about actual account values and actual Fund expenses. You may use the information in this line, together with the amount you invested, to estimate the expenses that you paid over the period. Simply divide your account value by $1,000 (for example, an $8,600 account value divided by $1,000 = 8.6), then multiply the result by the number in the first line under the heading entitled “Expenses Paid During Period” to estimate the expenses you paid on your account during the period.
HYPOTHETICAL EXAMPLE FOR COMPARISON PURPOSES
The second line in the table below provides information about hypothetical account values and hypothetical expenses based on the Fund’s actual expense ratio and an assumed rate of return of 5% per year before expenses, which is not the Fund’s actual return. The hypothetical account values and expenses may not be used to estimate the actual ending account balance or expenses you paid for the period. You may use this information to compare the ongoing costs of investing in the Fund to other mutual funds. To do so, compare this 5% hypothetical example with the 5% hypothetical examples that appear in the shareholder reports of the other funds.
Please note that the expenses shown in the table are meant to highlight ongoing costs only and do not reflect any transaction costs charged by certain financial institutions. Therefore, the second line of the table is useful in comparing ongoing costs only, and will not help you determine the relative total costs of owning different mutual funds. In addition, if you incurred transaction costs, your costs would have been higher. Please refer to the Fund’s prospectus for additional information on applicability of transaction costs for the Fund.
| | | Beginning Account Value 1/1/06 | | Ending Account Value 6/30/06 | | Expenses Paid During Period 1/1/06 - 6/30/06* | |
| | | | | | | | |
| Actual | | $ | 1,000.00 | | $ | 1,041.46 | | $ | 4.81 | |
| Hypothetical (5% return before expenses) | | $ | 1,000.00 | | $ | 1,020.08 | | $ | 4.76 | |
* | Expenses are equal to the Fund’s annualized expense ratio of 0.95%, multiplied by the average account value over the period, multiplied by 181/365 (to reflect the most recent fiscal half-year period). |
For general information regarding the Gateway Fund,
visit us at www.gatewayfund.com.
INVESTMENT ADVISER
Gateway Investment Advisers, L.P.
Rookwood Tower
3805 Edwards Road, Suite 600
Cincinnati, Ohio 45209
CUSTODIAN
U.S. Bank, N.A.
425 Walnut Street
Cincinnati, Ohio 45202
INDEPENDENT REGISTERED
PUBLIC ACCOUNTING FIRM
Ernst & Young LLP
312 Walnut Street
Cincinnati, Ohio 45202
LEGAL COUNSEL
Thompson Hine LLP
312 Walnut Street
Cincinnati, Ohio 45202
A description of the policies and procedures that the Fund uses to determine how to vote proxies relating to portfolio securities, and information regarding how the Fund voted those proxies during the most recent twelve-month period ended June 30, are available without charge, upon request, by calling the Fund at 800.354.6339, or on the Securities and Exchange Commission’s (the “SEC”) website at www.sec.gov.
The Fund files its complete schedule of portfolio holdings with the SEC for the first and third quarters of each fiscal year (quarters ended March 31 and September 30) on Form N-Q. The filings are available without charge, upon request, by calling the Fund at 800.354.6339. They are also available on the SEC’s website at www.sec.gov and may be reviewed and copied at the SEC’s Public Reference Room in Washington, D.C. Information on the operation of the Public Reference Room may be obtained by calling 800.SEC.0330.
This report must be preceded by or accompanied by a prospectus.
Item 2. Code of Ethics.
Applicable to Annual Reports only.
Applicable to Annual Reports only.
Applicable to Annual Reports only.
Item 5. Audit Committee of Listed Registrants.
Not applicable.
Item 6. Schedule of Investments.
Schedule of Investments is included as part of the report to shareholders filed under Item 1 of this Form.
Item 7. Disclosure of Proxy Voting Policies and Procedures for Closed-End Management Investment Companies.
Not applicable.
Item 8. Portfolio Managers of Closed-End Management Investment Companies.
Not applicable.
Item 9. Purchases of Equity Securities by Closed-End Management Investment Companies and Affiliated Purchasers.
Not applicable.
Item 10. Submission of Matters to a Vote of Security Holders.
The registrant has not adopted procedures by which shareholders may recommend nominees to the registrant's board of trustees.
(a) Based on an evaluation of the registrant’s disclosure controls and procedures as of August 28, 2006, the disclosure controls and procedures are reasonably designed to ensure that the information required in filings of Form N-CSR is recorded, processed, summarized, and reported on a timely basis.
(b) There were no changes in the registrant’s internal control over financial reporting that occurred during the second fiscal quarter of the period covered by this report that have materially affected, or are reasonably likely to materially affect, the registrant’s internal control over financial reporting.
Item 12. Exhibits.
(a)(1) Applicable to Annual Reports only.
(a)(2) EX-99.CERT Certifications required by Rule 30a-2(a) of the Investment Company Act of 1940 are filed herewith.
(a)(3) Not Applicable.
(b) EX-99.906.CERT Certification required by Rule 30a-2(b) of the Investment Company Act of 1940 is filed herewith.