| OMB APPROVAL |
| |
| OMB Number: 3235-0570 |
| |
| Expires: April 30, 2008 |
| |
| Estimated average burden |
| hours per response: 19.4 |
| |
UNITED STATES
SECURITIES AND EXCHANGE COMMISSION
Washington, D.C. 20549
FORM N-CSR
CERTIFIED SHAREHOLDER REPORT OF REGISTERED MANAGEMENT INVESTMENT COMPANIES
Investment Company Act file number: 811-02773
The Gateway Trust
(Exact name of registrant as specified in charter)
Rookwood Tower, 3805 Edwards Road, Suite 600, Cincinnati, OH 45209
(Address of principal executive offices) (Zip code)
Geoffrey Keenan
The Gateway Trust, Rookwood Tower, 3805 Edwards Road, Suite 600, Cincinnati, OH 45209
(Name and address of agent for service)
Registrant’s telephone number, including area code: (513) 719-1100
Date of fiscal year end: December 31
Date of reporting period: June 30, 2007
Form N-CSR is to be used by management investment companies to file reports with the Commission not later than 10 days after the transmission to stockholders of any report that is required to be transmitted to stockholders under Rule 30e-1 under the Investment Company Act of 1940 (17 CFR 270.30e-1). The Commission may use the information provided on Form N-CSR in its regulatory, disclosure review, inspection, and policymaking roles.
A registrant is required to disclose the information specified by Form N-CSR, and the Commission will make this information public. A registrant is not required to respond to the collection of information contained in Form N-CSR unless the Form displays a currently valid Office of Management and Budget (“OMB”) control number. Please direct comments concerning the accuracy of the information collection burden estimate and any suggestions for reducing the burden to Secretary, Securities and Exchange Commission, 450 Fifth Street, NW, Washington, DC 20549-0609. The OMB has reviewed this collection of information under the clearance requirements of 44 U.S.C. § 3507.
| Item 1. | Reports to Stockholders. |
SEMI-ANNUAL REPORT
JUNE 30, 2007
(Unaudited)
THE
GATEWAY
TRUST
P.O. BOX 5211
CINCINNATI, OH 45201-5211
800.354.6339 |
GATEWAY FUND
TOTAL RETURNS – JUNE 30, 2007 (UNAUDITED)
| | | Average Annual Total Return | | | |
| | | One
Year | | Three
Years | | Five
Years | | Ten
Years | | Since
Inception
on 12/7/77 | | 6/30/07
Price Per Share | |
| | | | | | | | | | | | | | | | | | | | |
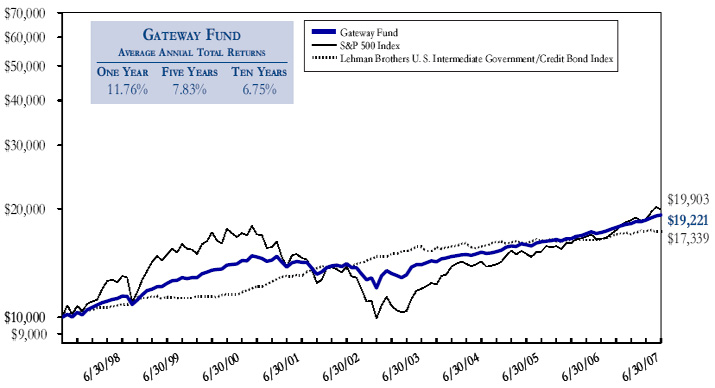
GATEWAY FUND | | | 11.76 | % | | 8.21 | % | | 7.83 | % | | 6.75 | % | | 9.12% | | | $28.29 | |
| | | | | | | | | | | | | | | | | | | | |
| S&P 500 Index | | | 20.59 | % | | 11.67 | % | | 10.70 | % | | 7.13 | % | | | | | | |
| | | | | | | | | | | | | | | | | | | | |
Lehman Brothers U. S. Intermediate
Government/Credit Bond Index | | | 5.76 | % | | 3.41 | % | | 4.14 | % | | 5.66 | % | | | | | | |
| | | Cumulative Total Return | |
| | | | | | | | | | | Since Inception
on 12/7/77 | |
| | | | | | | | | | | | |
GATEWAY FUND | | | 11.76 | % | | 26.71 | % | | 45.78 | % | | 92.21 | % | | 1,218.86% | |
| | | | | | | | | | | | | | | | | |
| S&P 500 Index | | | 20.59 | % | | 39.25 | % | | 66.27 | % | | 99.03 | % | | | |
| | | | | | | | | | | | | | | | | |
Lehman Brothers U. S. Intermediate
Government/Credit Bond Index | | | 5.76 | % | | 10.60 | % | | 22.49 | % | | 73.39 | % | | | |
Data sources throughout this report: Gateway Investment Advisers, L.P. and Thomson Financial Inc.
Performance data throughout this report represents past performance and is no guarantee of future results. The total return figures assume the reinvestment of distributions, but do not reflect the deduction of taxes paid on distributions or on the redemption of your shares. Your investment return and principal value of an investment will fluctuate so that your shares, when redeemed, may be worth more or less than the original cost. Gateway Fund returns throughout this document are net of fees and expenses. An investor may be subject to additional fees and charges if the Fund is sold through intermediaries.
Current performance may be lower or higher than the performance data quoted. Gateway Fund performance data that is current to the most recent month-end is available by calling 800.354.6339 or by accessing our website at www.gatewayfund.com.
GATEWAY FUND
LETTER TO SHAREHOLDERS
Dear Shareholder:
The Gateway Fund has endeavored to deliver the rewards of effective risk management to its investors for nearly thirty years. That remains its highest priority. The Fund not only strives for consistent returns, but also returns in excess of those available from other investments comparable in volatility. In the following pages we review the Fund’s risk management strategy, provide a 2007 year-to-date market overview, discuss the Fund’s performance for the six months ended June 30, 2007, and offer our perspective for the remainder of the year.
STRATEGY REVIEW
The investment objective of the Fund is to capture the majority of the higher returns associated with equity market investments, while exposing investors to significantly less risk than other equity investments. The Fund employs a strategy comprised of three integrated components: sale of cash-settled index call options; purchase of index put options; and ownership of a broadly diversified common stock portfolio designed to support its index option-based risk management strategy.
By selling index call options, the Fund receives cash flow from option premiums in exchange for the uncertain future appreciation of its equity portfolio. The degree of uncertainty in the equity markets determines the magnitude of the cash flow available to the Fund. In highly volatile markets, uncertainty is magnified and cash flow available from index call options rises. Conversely, when markets exhibit reduced volatility, this cash flow decreases. The Fund seeks to optimize the cash flow earned from the sale of index call options, which is an important source of the Fund’s total return.
As the cash flow from the sale of index call options varies over time and is somewhat limited in its ability to reduce downside exposure, the Fund also buys index put options that can help protect against a significant market decline over a short period of time. The value of an index put option generally rises as the underlying stock prices decline. The Fund seeks the most cost-effective protection available from index put options, which serve as a key component in reducing the overall volatility of the Fund.
The final component of the Fund’s strategy is the continuous ownership of a diversified common stock portfolio generally representative of the broad U. S. equity market. The common stock portfolio is constructed to provide support for the index option-based risk management strategy by minimizing the difference between the performance of the stock portfolio and that of the equity index underlying the Fund’s option positions while also considering other factors, such as predicted dividend yield of the portfolio.
ASSET ALLOCATION
AS A PERCENTAGE OF NET ASSETS
AS OF JUNE 30, 2007 |
| Common Stocks | | | 97.1 | % |
| Put Options | | | | |
| Repurchase Agreements | | | | |
| Call Options Written | | | | |
| Other Assets and Liabilities, Net | | | | |
| | | | 100.0 | % |
The interaction of the three components of the Fund’s strategy is designed to provide fairly consistent returns over a wide range of market conditions. Accordingly, the total return of the Fund over a given time period is a combination of the change in market value and the dividend yield associated with the common stock portfolio, the cash flow earned from selling index call options, the cost of purchasing index put options and the operating expenses of the Fund.
GATEWAY FUND
LETTER TO SHAREHOLDERS
2007 YEAR-TO-DATE MARKET OVERVIEW
In the first half of 2007, improving global economic conditions, with particular strength in Europe and Asia, continued to foster overall growth in the United States and around the world. Favorable corporate earnings and a plethora of high-profile mergers and acquisitions propelled broad market indexes to all-time highs. U. S. consumers, despite record high oil prices and a deepening slowdown in the housing markets, did their part to keep the economy growing, albeit at a slower pace. Ongoing economic growth and inflationary fears associated with the rising oil prices, however, inhibited bond investors. Throughout the six months ended June 30, 2007, the Federal Reserve Board maintained the federal funds rate at 5.25% as, on balance, market conditions remained within monetary policy tolerances.
The S&P 500 Index, after a lackluster first quarter, surged ahead in the second quarter on strong corporate earnings and the injection of fresh investment capital, much of it through private equity. Equity investors shrugged off political and military setbacks in the Middle East and focused instead on peace and prosperity at home. Despite the turbulence produced by losses in the Asian markets in February and the sub-prime mortgage market in June, the S&P 500 Index returned 6.96% for the six months ended June 30, 2007. Bond investors continued to be driven by short-term interest rate expectations and, as the first half of 2007 progressed, their hope for a reduction in interest rates turned to fear of a potential near-term increase. As they mostly have since the bond market peaked in late 2002, bonds experienced below-average returns with the Lehman Brothers U. S. Intermediate Government/Credit Bond Index advancing just 1.45% during the first half of 2007.
The market sell-offs in February and June appeared to remind investors of the risk factors associated with equities. The CBOE Volatility Index (the “VIX”), a key gauge of option pricing and headline measure of equity market volatility, reflected this reassessment of risk. After the unsettling plunge in Asian markets and the associated 3.47% decline in the S&P 500 Index on February 27, 2007, the VIX clearly shifted to a higher range than that seen in recent years, yet it still remained below historical averages. During the six months ended June 30, 2007, the VIX reached a high in early March and ended the period up over 40%. Since market volatility largely determines option prices, net cash flow available from index option premiums was enhanced as the year progressed.
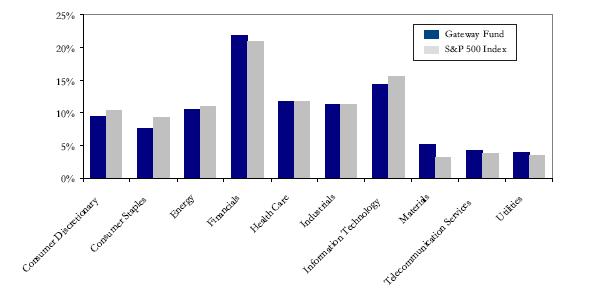
PORTFOLIO SECTOR WEIGHTING
% OF COMMON STOCKS
AS OF JUNE 30, 2007
GATEWAY FUND
LETTER TO SHAREHOLDERS
2007 YEAR-TO-DATE PERFORMANCE COMMENTARY
The following discussion of the Fund’s comparative performance to the S&P 500 Index and the Lehman Brothers U. S. Intermediate Government/Credit Bond Index focuses on the results of the Fund’s index option-based risk management strategy since its diversified common stock portfolio is designed to support this strategy. For the six months ended June 30, 2007, the Fund provided investors with a total return of 5.68%, as compared to the 6.96% return for the unhedged S&P 500 Index and the 1.45% return for the Lehman Brothers U. S. Intermediate Government/Credit Bond Index. The Fund, while remaining continuously hedged with index call and put options, benefited from a modest improvement in cash flow available from option premiums and an overall rising equity market.
After a positive start to 2007, global financial markets were rattled on February 27, 2007, by a rapid and unexpected plunge in the Shanghai, China stock market. This plunge, coupled with a fear of global liquidity tightening, unnerved stock investors and drove the year-to-date return of the S&P 500 Index through the end of February into negative territory. The remainder of the quarter saw only a partial reversal of the February sell-off as equity investors rebalanced and reassessed risk in the financial marketplace. For the three months ended March 31, 2007, the S&P 500 Index achieved a modest return of 0.64%. Bonds earned most of their quarterly return in February as the rapidly deteriorating stock market led hopeful bond investors and fearful equity investors to push bond prices higher. The Lehman Brothers U. S. Intermediate Government/Credit Bond Index ended the quarter up 1.59%. True to its risk management strategy, the Fund’s cash flow from hedging activity helped preserve early first quarter gains when the equity markets declined significantly in late February. Higher option premiums, resulting from increased market volatility, largely propelled the Fund to a first quarter 2007 gain of 2.44%, outperforming both the S&P 500 Index and the Lehman Brothers U. S. Intermediate Government/Credit Bond Index.
GROWTH OF A $10,000 INVESTMENT
July 1, 1997 – June 30, 2007
Past performance does not guarantee future results. The average total return figures assume the reinvestment of distributions, but do not reflect the deduction of taxes paid on distributions or on the redemption of your shares.
GATEWAY FUND
LETTER TO SHAREHOLDERS
The second quarter of 2007 was initially marked by a steady increase in the broad equity markets as favorable trends in corporate profits, employment data and consumer spending overcame the dampening effects of high gasoline prices and a weak housing sector. The S&P 500 Index reached what was then an all-time high of 1539.18 on June 4, 2007. Shortly thereafter, equity markets were roiled by fears of spreading weakness induced by losses in the sub-prime mortgage market. However, despite its June sell-off, the S&P 500 Index turned in a stellar quarterly return of 6.28%. The bond market was less fortunate. Already inhibited by fears of increased inflationary pressures, bond investors dramatically felt the impact of the woes in the mortgage markets. As consumer interest rates rose and bond prices fell, the Lehman Brothers U. S. Intermediate Government/Credit Bond Index posted a 0.14% loss for the quarter. Fund investors, on the other hand, hardly noticed the market turmoil as the Fund achieved positive returns in each of the three months during the second quarter. Benefiting from a modest improvement in available option premiums resulting from a corresponding increase in volatility, the Fund earned a total return of 3.16% for the quarter.
COMMON STOCK PORTFOLIO COMPOSITION
AS OF JUNE 30, 2007 |
| | | | | | |
| | | GATEWAY
FUND | | S&P 500
INDEX | |
| Total Holdings | | | 323 | | | 500 | |
| Total S&P Holdings | | | 193 | | | 500 | |
| Total Non-S&P Holdings | | | 130 | | | — | |
Dividend Yield(2) | | | 2.57 | %(1) | | 1.82 | % |
Average Market Cap, $B(2) | | | 36.91 | | | 27.75 | |
Weighted Average Price/Earnings Ratio(2) | | | 18.13 | | | 18.58 | |
Weighted Average Price/Book Ratio(2) | | | 3.81 | | | 3.78 | |
| (1) | This percentage represents the dividend yield of the equity securities in the Gateway Fund, not the dividend yield of the Fund itself. |
| (2) | Calculations obtained from Bloomberg, L.P. |
The moderate rise in volatility and the resilience of the equity markets during the first half of 2007 were good news for Fund investors. The increase in volatility contributed to improved cash flow from call option premiums. The general upward trend in equities has allowed this cash flow to accrue to the Fund’s positive performance. The Fund’s focus on earning its return via cash flow also allowed it to maintain its momentum despite the equity market pullbacks in February and June. Throughout the first six months of 2007, the Fund performed true to its investment objective and provided shareholders with impressive risk-adjusted performance, thereby reinforcing the value of a hedged equity portfolio.
SECOND HALF 2007 PERSPECTIVE
As we move into the second half of 2007, the investment climate continues to reflect the major uncertainties of the first half. Corporate earnings and domestic labor markets continue as economic strengths. However, geopolitical risk persists with attendant potential for further increases in oil prices. Inflation remains within limits, but threats linger, which makes any loosening of monetary policy uncertain. In addition, the end and depth of the housing decline remains unclear. One of the lessons learned from the first half of the year appears to be that global financial markets are more interconnected than ever and that isolated incidents in obscure markets can have wide ranging effects around the world. As a result, there seems to be an ongoing reassessment by global investors as to whether financial risk is properly priced across equity and credit markets or whether this risk has been priced too cheaply over the past several years.
GATEWAY FUND
LETTER TO SHAREHOLDERS
One result of this ongoing reassessment of risk has been a higher level of broad market volatility as seen in the VIX. This elevated volatility translates into higher option premiums resulting in more generous cash flow available from the Fund’s call option activity. Meanwhile, the Fund’s vigilant adherence to its investment objective continues to serve investors by helping to mitigate sharp downside surprises. As the second half of 2007 unfolds, shareholders can rest assured that the Fund’s long-term investment strategy of selling index call options and hedging with index put options will remain in place to address the risks and opportunities of today’s capital markets.
PENDING ADVISER ACQUISITION AND FUND REORGANIZATION
As previously reported, Gateway Investment Advisers, L.P., the investment adviser for the Fund, has agreed to be acquired by Natixis Global Asset Management, L.P. (formerly known as IXIS Asset Management US Group, L.P.), a global financial service organization headquartered in Paris and Boston. One of the strengths of the acquisition is that the Fund’s strategy and management will not change. The transaction is subject to the approval of the shareholders of the Fund and to the satisfaction of certain other conditions. Proxy materials relating to a special meeting of Fund shareholders are expected to be mailed to shareholders in late November 2007.
We invite you to visit our website at www.gatewayfund.com for regular updates on the Fund’s investment results, portfolio statistics and quarterly distributions.
As always, we appreciate your support and continued confidence.
| Walter G. Sall | Patrick Rogers, CFA | Paul R. Stewart, CFA |
| Chairman | Co-Portfolio Manager | Co-Portfolio Manager |
GATEWAY FUND
PORTFOLIO OF INVESTMENTS – JUNE 30, 2007 (UNAUDITED)
SHARES | | | COMMON STOCKS – 97.1% | | VALUE (000’s) | |
| | | | CONSUMER DISCRETIONARY – 9.1% | | | | |
| 115,100 | | | Abercrombie & Fitch Co. - Class A | | $ | 8,400 | |
| 135,880 | | | Amazon.com, Inc. * | | | 9,296 | |
| 233,270 | | | American Axle & Manufacturing Holdings, Inc. | | | 6,909 | |
| 232,150 | | | American Eagle Outfitters, Inc. | | | 5,957 | |
| 188,175 | | | Best Buy Co., Inc. | | | 8,782 | |
| 37,950 | | | Black & Decker Corporation | | | 3,351 | |
| 35,000 | | | Brunswick Corporation | | | 1,142 | |
| 196,425 | | | Chico’s FAS, Inc. * | | | 4,781 | |
| 106,746 | | | Citadel Broadcasting Company | | | 689 | |
| 262,890 | | | Cooper Tire & Rubber Company | | | 7,261 | |
| 150,000 | | | Dow Jones & Company, Inc. | | | 8,617 | |
| 123,200 | | | Eastman Kodak Company | | | 3,429 | |
| 39,100 | | | Entercom Communications Corp. - Class A | | | 973 | |
| 63,000 | | | Ethan Allen Interiors Inc. | | | 2,158 | |
| 1,059,481 | | | Ford Motor Company * | | | 9,980 | |
| 203,600 | | | Furniture Brands International, Inc. | | | 2,891 | |
| 174,250 | | | Gap, Inc. | | | 3,328 | |
| 173,250 | | | General Motors Corporation | | | 6,549 | |
| 105,750 | | | Genuine Parts Company | | | 5,245 | |
| 7,459 | | | Getty Images, Inc. * | | | 357 | |
| 56,000 | | | Harrah’s Entertainment, Inc. | | | 4,775 | |
| 889,284 | | | Home Depot, Inc. | | | 34,993 | |
| 49,843 | | | Idearc Inc. | | | 1,761 | |
| 95,300 | | | International Game Technology | | | 3,783 | |
| 26,300 | | | J. C. Penney Company, Inc. | | | 1,904 | |
| 2,550 | | | KB HOME | | | 100 | |
| 8,800 | | | Lear Corporation * | | | 313 | |
| 175,000 | | | Leggett & Platt, Incorporated | | | 3,859 | |
| 16,100 | | | Liberty Media Corp. - Class A * | | | 1,895 | |
| 262,850 | | | Limited Brands | | | 7,215 | |
| 315,700 | | | Lowe’s Companies, Inc. | | | 9,689 | |
| 138,860 | | | Macy’s Inc. | | | 5,524 | |
| 233,000 | | | Mattel, Inc. | | | 5,893 | |
| 393,100 | | | McDonald’s Corporation | | | 19,954 | |
| 77,500 | | | New York Times Company - Class A | | | 1,968 | |
| 379,900 | | | Newell Rubbermaid Inc. | | | 11,180 | |
| 189,100 | | | Nordstrom, Inc. | | | 9,667 | |
| 57,500 | | | OfficeMax Inc. | | | 2,260 | |
| 77,400 | | | Omnicom Group Inc. | | | 4,096 | |
| 385,160 | | | Pier 1 Imports, Inc. * | | | 3,270 | |
| 53,500 | | | Polaris Industries Inc. | | | 2,898 | |
| 71,700 | | | R. H. Donnelley Corp. * | | | 5,433 | |
| 106,500 | | | RadioShack Corporation | | | 3,529 | |
See accompanying notes to financial statements.
GATEWAY FUND
PORTFOLIO OF INVESTMENTS – JUNE 30, 2007 (UNAUDITED)
SHARES | | | | | VALUE (000’s) | |
| | | | CONSUMER DISCRETIONARY (CONTINUED) | | | | |
| 43,900 | | | RCN Corporation * | | $ | 825 | |
| 641,705 | | | Regal Entertainment Group - Class A | | | 14,073 | |
| 19,909 | | | Sears Holding Corporation * | | | 3,375 | |
| 469,950 | | | ServiceMaster Company | | | 7,265 | |
| 565,860 | | | Sirius Satellite Radio Inc. * | | | 1,709 | |
| 62,900 | | | Snap-on Incorporated | | | 3,177 | |
| 126,300 | | | Stanley Works | | | 7,666 | |
| 138,900 | | | Staples, Inc. | | | 3,296 | |
| 68,848 | | | Starwood Hotels & Resorts Worldwide, Inc. | | | 4,618 | |
| 211,190 | | | Talbots, Inc. | | | 5,286 | |
| 55,400 | | | Tiffany & Co. | | | 2,940 | |
| 80,033 | | | Tim Hortons, Inc. | | | 2,461 | |
| 355,050 | | | Time Warner Inc. | | | 7,470 | |
| 88,350 | | | TJX Companies, Inc. | | | 2,430 | |
| 37,500 | | | TravelCenters of America LLC * | | | 1,517 | |
| 217,970 | | | Tuesday Morning Corporation | | | 2,694 | |
| 441,750 | | | Tupperware Corporation | | | 12,696 | |
| 77,200 | | | Urban Outfitters, Inc. * | | | 1,855 | |
| 133,700 | | | Walt Disney Company | | | 4,565 | |
| 43,000 | | | Wendy’s International, Inc. | | | 1,580 | |
| 178,980 | | | Westwood One, Inc. | | | 1,287 | |
| 97,574 | | | Whirlpool Corporation | | | 10,850 | |
| 3,980 | | | Wyndham Worldwide Corporation * | | | 144 | |
| 668,006 | | | XM Satellite Radio Holdings Inc. - Class A * | | | 7,862 | |
| | | | | | | 357,695 | |
| | | | CONSUMER STAPLES – 7.3% | | | | |
| 744,300 | | | Altria Group, Inc. | | | 52,205 | |
| 97,350 | | | Avon Products, Inc. | | | 3,578 | |
| 586,650 | | | Coca-Cola Company | | | 30,688 | |
| 179,650 | | | Colgate-Palmolive Company | | | 11,650 | |
| 156,250 | | | ConAgra Foods, Inc. | | | 4,197 | |
| 306,452 | | | CVS/Caremark Corporation | | | 11,170 | |
| 139,100 | | | Kimberly-Clark Corporation | | | 9,304 | |
| 822,073 | | | Kraft Foods Inc. - Class A | | | 28,978 | |
| 115,850 | | | Loews Corporation - Carolina Group | | | 8,952 | |
| 31,600 | | | Longs Drug Stores Corporation | | | 1,660 | |
| 219,980 | | | PepsiCo, Inc. | | | 14,266 | |
| 829,251 | | | Procter & Gamble Company | | | 50,742 | |
| 129,256 | | | Reynolds American Inc. | | | 8,427 | |
| 541,450 | | | Sara Lee Corporation | | | 9,421 | |
| 78,990 | | | Supervalu, Inc. | | | 3,659 | |
| 239,712 | | | Vector Group Ltd. | | | 5,401 | |
| 675,650 | | | Wal-Mart Stores, Inc. | | | 32,505 | |
See accompanying notes to financial statements.
GATEWAY FUND
PORTFOLIO OF INVESTMENTS – JUNE 30, 2007 (UNAUDITED)
SHARES | | | | | VALUE (000’s) | |
| | | | CONSUMER STAPLES (CONTINUED) | | | | |
| 64,600 | | | Whole Foods Market, Inc. | | $ | 2,474 | |
| | | | | | | 289,277 | |
| | | | ENERGY – 10.2% | | | | |
| 50,200 | | | Baker Hughes Incorporated | | | 4,223 | |
| 257,545 | | | BJ Services Company | | | 7,325 | |
| 97,900 | | | BP PLC - ADR | | | 7,062 | |
| 64,000 | | | CARBO Ceramics Inc. | | | 2,804 | |
| 84,000 | | | Chesapeake Energy Corporation | | | 2,906 | |
| 707,264 | | | Chevron Corporation | | | 59,580 | |
| 44,200 | | | CNOOC Limited - ADR | | | 5,025 | |
| 358,262 | | | ConocoPhillips | | | 28,124 | |
| 66,700 | | | CONSOL Energy Inc. | | | 3,076 | |
| 40,131 | | | Crosstex Energy, Inc. | | | 1,153 | |
| 114,100 | | | Diamond Offshore Drilling, Inc. | | | 11,588 | |
| 148,800 | | | Eni SPA - ADR | | | 10,766 | |
| 72,450 | | | ENSCO International Incorporated | | | 4,420 | |
| 1,737,932 | | | Exxon Mobil Corporation | | | 145,778 | |
| 389,700 | | | Halliburton Company | | | 13,445 | |
| 116,389 | | | Norsk Hydro ASA - ADR | | | 4,454 | |
| 315,970 | | | Occidental Petroleum Corporation | | | 18,288 | |
| 104,949 | | | Patterson-UTI Energy, Inc. | | | 2,751 | |
| 40,000 | | | Peabody Energy Corporation | | | 1,935 | |
| 156,900 | | | Royal Dutch Shell PLC - Class A - ADR | | | 12,740 | |
| 335,600 | | | Schlumberger Limited | | | 28,506 | |
| 135,100 | | | Smith International, Inc. | | | 7,922 | |
| 5,500 | | | Spectra Energy Corporation | | | 143 | |
| 208,150 | | | Tidewater Inc. | | | 14,754 | |
| 45,383 | | | USEC Inc. * | | | 997 | |
| 2,480 | | | YPF SA - ADR | | | 112 | |
| | | | | | | 399,877 | |
| | | | FINANCIALS – 21.1% | | | | |
| 68,450 | | | A. G. Edwards, Inc. | | | 5,787 | |
| 106,400 | | | Aegon NV - ADR | | | 2,091 | |
| 178,900 | | | Allstate Corporation | | | 11,004 | |
| 118,300 | | | American Express Company | | | 7,238 | |
| 252,177 | | | American Home Mortgage Investment Corp. | | | 4,635 | |
| 565,186 | | | American International Group, Inc. | | | 39,580 | |
| 73,100 | | | Aon Corporation | | | 3,115 | |
| 271,550 | | | Arthur J. Gallagher & Co. | | | 7,571 | |
| 157,000 | | | Axa - ADR | | | 6,757 | |
| 1,612,441 | | | Bank of America Corporation | | | 78,832 | |
| 39,900 | | | Barclays PLC - ADR | | | 2,226 | |
| 155,020 | | | Brandywine Realty Trust | | | 4,431 | |
See accompanying notes to financial statements.
GATEWAY FUND
PORTFOLIO OF INVESTMENTS – JUNE 30, 2007 (UNAUDITED)
SHARES | | | | VALUE (000’s) | |
| | | | FINANCIALS (CONTINUED) | | | |
| 6,347 | | | Capital One Financial Corporation | $ | 498 | |
| 151,300 | | | CapitalSource Inc. | | 3,720 | |
| 88,650 | | | Capitol Federal Financial | | 3,273 | |
| 269,475 | | | Charles Schwab Corporation | | 5,530 | |
| 1,726,675 | | | Citigroup Inc. | | 88,561 | |
| 40,800 | | | CME Group Inc. | | 21,802 | |
| 91,000 | | | Colonial Properties Trust | | 3,317 | |
| 47,900 | | | Commerce Bancorp, Inc. | | 1,772 | |
| 166,288 | | | Converium Holding AG - ADR | | 1,518 | |
| 59,048 | | | Countrywide Financial Corporation | | 2,146 | |
| 104,100 | | | Eaton Vance Corp. | | 4,599 | |
| 527,857 | | | Fidelity National Financial, Inc. | | 12,510 | |
| 225,000 | | | First Horizon National Corporation | | 8,775 | |
| 96,400 | | | FirstMerit Corporation | | 2,018 | |
| 95,000 | | | Genworth Financial Inc. - Class A | | 3,268 | |
| 80,400 | | | Goldman Sachs Group, Inc. | | 17,427 | |
| 54,800 | | | Hartford Financial Services Group, Inc. | | 5,398 | |
| 168,700 | | | Healthcare Realty Trust, Inc. | | 4,687 | |
| 453,000 | | | Hospitality Properties Trust | | 18,795 | |
| 367,900 | | | HSBC Holdings PLC - ADR | | 33,762 | |
| 43,000 | | | ING Groep NV - ADR | | 1,891 | |
| 1,145,477 | | | JPMorgan Chase & Co. | | 55,498 | |
| 69,100 | | | Legg Mason, Inc. | | 6,798 | |
| 145,211 | | | Lexington Corporate Properties Trust | | 3,020 | |
| 291,723 | | | Lincoln National Corporation | | 20,698 | |
| 816,800 | | | Lloyds TSB Group PLC - ADR | | 36,527 | |
| 192,100 | | | Marsh & McLennan Companies, Inc. | | 5,932 | |
| 76,750 | | | Mercury General Corporation | | 4,230 | |
| 141,550 | | | Merrill Lynch & Co., Inc. | | 11,831 | |
| 313,350 | | | Morgan Stanley | | 26,284 | |
| 199,800 | | | Nationwide Financial Services, Inc. - Class A | | 12,631 | |
| 425,450 | | | Nationwide Health Properties, Inc. | | 11,572 | |
| 831,200 | | | New York Community Bancorp, Inc. | | 14,147 | |
| 91,450 | | | Newcastle Investment Corporation | | 2,293 | |
| 121,450 | | | Old Republic International Corporation | | 2,582 | |
| 261,000 | | | Senior Housing Properties Trust | | 5,311 | |
| 118,600 | | | TCF Financial Corporation | | 3,297 | |
| 383,500 | | | Travelers Companies, Inc. | | 20,517 | |
| 986,983 | | | U. S. Bancorp | | 32,521 | |
| 163,950 | | | Unitrin, Inc. | | 8,063 | |
| 542,659 | | | Wachovia Corporation | | 27,811 | |
| 279,700 | | | Waddell & Reed Financial, Inc. - Class A | | 7,275 | |
| 278,700 | | | Washington Mutual, Inc. | | 11,884 | |
See accompanying notes to financial statements.
GATEWAY FUND
PORTFOLIO OF INVESTMENTS – JUNE 30, 2007 (UNAUDITED)
SHARES | | | | VALUE (000’s) | |
| | | | FINANCIALS (CONTINUED) | | | |
| 2,200,850 | | | Wells Fargo & Company | $ | 77,404 | |
| 48,246 | | | XL Capital Ltd. - Class A | | 4,067 | |
| | | | | | 830,727 | |
| | | | HEALTH CARE – 11.3% | | | |
| 450,150 | | | Abbott Laboratories | | 24,105 | |
| 158,200 | | | Aetna Inc. | | 7,815 | |
| 222,227 | | | Amgen Inc. * | | 12,287 | |
| 148,500 | | | Baxter International Inc. | | 8,366 | |
| 42,200 | | | Biogen Idec Inc. * | | 2,258 | |
| 219,012 | | | Boston Scientific Corporation * | | 3,360 | |
| 1,929,623 | | | Bristol-Myers Squibb Company | | 60,899 | |
| 16,800 | | | Cephalon, Inc. * | | 1,351 | |
| 118,825 | | | Coventry Health Care, Inc. * | | 6,850 | |
| 374,600 | | | Eli Lilly and Company | | 20,933 | |
| 81,000 | | | Genentech, Inc. * | | 6,128 | |
| 176,950 | | | GlaxoSmithKline PLC - ADR | | 9,267 | |
| 1,087,122 | | | Johnson & Johnson | | 66,988 | |
| 119,200 | | | Lincare Holdings Inc. * | | 4,750 | |
| 120,613 | | | Medco Health Solutions, Inc. * | | 9,407 | |
| 260,100 | | | Medtronic Inc. | | 13,489 | |
| 55,300 | | | Mentor Corporation | | 2,250 | |
| 1,071,400 | | | Merck & Co., Inc. | | 53,356 | |
| 2,413,500 | | | Pfizer Inc. | | 61,713 | |
| 143,950 | | | Schering-Plough Corporation | | 4,382 | |
| 413,990 | | | UnitedHealth Group Incorporated | | 21,171 | |
| 76,500 | | | Universal Health Services, Inc. - Class B | | 4,705 | |
| 240,000 | | | WellPoint, Inc. * | | 19,159 | |
| 359,800 | | | Wyeth | | 20,631 | |
| | | | | | 445,620 | |
| | | | INDUSTRIALS – 11.0% | | | |
| 304,650 | | | 3M Co. | | 26,441 | |
| 15,800 | | | Alliant Techsystems Inc. * | | 1,567 | |
| 143,200 | | | AMR Corporation * | | 3,773 | |
| 46,500 | | | Avery Dennison Corporation | | 3,091 | |
| 6,750 | | | Avis Budget Group, Inc. * | | 192 | |
| 244,752 | | | Boeing Company | | 23,535 | |
| 145,000 | | | Briggs & Stratton Corporation | | 4,576 | |
| 254,900 | | | Caterpillar Inc. | | 19,959 | |
| 12,600 | | | Corporate Executive Board Company | | 818 | |
| 201,310 | | | CSX Corporation | | 9,075 | |
| 31,200 | | | Cummins, Inc. | | 3,158 | |
| 66,900 | | | Deere & Company | | 8,078 | |
| 265,400 | | | Deluxe Corporation | | 10,778 | |
See accompanying notes to financial statements.
GATEWAY FUND
PORTFOLIO OF INVESTMENTS – JUNE 30, 2007 (UNAUDITED)
SHARES | | | | VALUE (000’s) | |
| | | | INDUSTRIALS (CONTINUED) | | | |
| 84,600 | | | Dun & Bradstreet Corporation | $ | 8,712 | |
| 27,400 | | | Eaton Corporation | | 2,548 | |
| 905,200 | | | Emerson Electric Co. | | 42,363 | |
| 2,971,136 | | | General Electric Company | | 113,735 | |
| 35,550 | | | Goodrich Corporation | | 2,117 | |
| 326,400 | | | Honeywell International Inc. | | 18,370 | |
| 161,650 | | | Hubbell Incorporated - Class B | | 8,765 | |
| 47,700 | | | Ingersoll-Rand Company Ltd. - Class A | | 2,615 | |
| 182,100 | | | JetBlue Airways Corporation * | | 2,140 | |
| 74,000 | | | Laidlaw International Inc. | | 2,557 | |
| 33,000 | | | Parker-Hannifin Corporation | | 3,231 | |
| 87,350 | | | Pentair, Inc. | | 3,369 | |
| 112,250 | | | R. R. Donnelley & Sons Company | | 4,884 | |
| 91,900 | | | Raytheon Company | | 4,953 | |
| 55,500 | | | Robert Half International Inc. | | 2,026 | |
| 132,700 | | | Southwest Airlines Co. | | 1,979 | |
| 210,400 | | | SPX Corporation | | 18,475 | |
| 96,150 | | | Standard Register Company | | 1,096 | |
| 94,800 | | | Timken Company | | 3,423 | |
| 49,000 | | | Tomkins PLC - ADR | | 1,018 | |
| 402,403 | | | Tyco International Ltd. | | 13,597 | |
| 274,400 | | | United Parcel Service, Inc. - Class B | | 20,031 | |
| 311,000 | | | United Technologies Corporation | | 22,059 | |
| 269,500 | | | Volvo AB - ADR | | 5,360 | |
| 235,300 | | | Waste Management, Inc. | | 9,188 | |
| | | | | | 433,652 | |
| | | | INFORMATION TECHNOLOGY – 14.0% | | | |
| 262,600 | | | Activision, Inc. * | | 4,903 | |
| 162,371 | | | Adobe Systems Incorporated * | | 6,519 | |
| 59,850 | | | ADTRAN, Inc. | | 1,554 | |
| 82,275 | | | Advanced Micro Devices, Inc. * | | 1,177 | |
| 42,300 | | | Akamai Technologies, Inc. * | | 2,057 | |
| 112,589 | | | Alcatel-Lucent - ADR | | 1,576 | |
| 93,000 | | | Altera Corporation | | 2,058 | |
| 135,050 | | | Analog Devices, Inc. | | 5,083 | |
| 227,600 | | | Apple Computer, Inc. * | | 27,776 | |
| 415,700 | | | Applied Materials, Inc. | | 8,260 | |
| 57,300 | | | Autodesk, Inc. * | | 2,698 | |
| 189,750 | | | Automatic Data Processing, Inc. | | 9,197 | |
| 131,475 | | | Broadcom Corporation - Class A * | | 3,846 | |
| 47,437 | | | Broadridge Financial Solutions Inc. | | 907 | |
| 1,292,125 | | | Cisco Systems, Inc. * | | 35,986 | |
| 55,400 | | | Cognizant Technology Solutions Corporation - Class A * | | 4,160 | |
See accompanying notes to financial statements.
GATEWAY FUND
PORTFOLIO OF INVESTMENTS – JUNE 30, 2007 (UNAUDITED)
SHARES | | | | VALUE (000’s) | |
| | | | INFORMATION TECHNOLOGY (CONTINUED) | | | |
| 369,275 | | | Corning Incorporated * | $ | 9,435 | |
| 403,200 | | | Dell Inc. * | | 11,511 | |
| 70,200 | | | DST Systems, Inc. * | | 5,561 | |
| 290,659 | | | eBay Inc. * | | 9,353 | |
| 97,550 | | | Electronic Data Systems Corporation | | 2,705 | |
| 113,796 | | | Fidelity National Information Services, Inc. | | 6,177 | |
| 39,319 | | | First Data Corporation | | 1,285 | |
| 75,200 | | | Google Inc. - Class A * | | 39,358 | |
| 614,505 | | | Hewlett-Packard Company | | 27,419 | |
| 2,128,368 | | | Intel Corporation | | 50,570 | |
| 461,850 | | | International Business Machines Corporation | | 48,610 | |
| 126,000 | | | JDS Uniphase Corporation * | | 1,692 | |
| 63,000 | | | KLA-Tencor Corporation | | 3,462 | |
| 72,100 | | | Linear Technology Corporation | | 2,609 | |
| 133,000 | | | Maxim Integrated Products, Inc. | | 4,444 | |
| 194,050 | | | Microchip Technology Incorporated | | 7,188 | |
| 2,669,000 | | | Microsoft Corporation | | 78,655 | |
| 496,771 | | | Motorola, Inc. | | 8,793 | |
| 86,750 | | | National Semiconductor Corporation | | 2,452 | |
| 64,130 | | | NAVTEQ Corporation * | | 2,715 | |
| 96,400 | | | NVIDIA Corporation * | | 3,982 | |
| 299,580 | | | Openwave Systems Inc. * | | 1,875 | |
| 1,229,867 | | | Oracle Corporation * | | 24,241 | |
| 137,000 | | | Paychex, Inc. | | 5,359 | |
| 54,560 | | | Plantronics, Inc. | | 1,431 | |
| 354,140 | | | PMC-Sierra, Inc. * | | 2,738 | |
| 439,200 | | | QUALCOMM Incorporated | | 19,057 | |
| 68,100 | | | Red Hat, Inc. * | | 1,517 | |
| 204,184 | | | Symantec Corporation * | | 4,125 | |
| 450,180 | | | Taiwan Semiconductor Manufacturing Company Ltd. - ADR | | 5,010 | |
| 368,400 | | | Texas Instruments Incorporated | | 13,863 | |
| 478,098 | | | United Online, Inc. | | 7,884 | |
| 57,800 | | | VeriSign, Inc. * | | 1,834 | |
| 34,019 | | | Western Union Company | | 709 | |
| 149,700 | | | Xilinx, Inc. | | 4,007 | |
| 436,650 | | | Yahoo! Inc. * | | 11,846 | |
| | | | | | 551,229 | |
| | | | MATERIALS – 5.0% | | | |
| 116,670 | | | Alcoa Inc. | | 4,729 | |
| 156,422 | | | Bowater Incorporated | | 3,903 | |
| 5,100 | | | Chesapeake Corporation * | | 64 | |
| 276,136 | | | Companhia Siderurgica Nacional SA - ADR | | 14,282 | |
| 471,448 | | | Dow Chemical Company | | 20,847 | |
See accompanying notes to financial statements.
GATEWAY FUND
PORTFOLIO OF INVESTMENTS – JUNE 30, 2007 (UNAUDITED)
SHARES | | | | VALUE (000’s) | |
| | | | MATERIALS (CONTINUED) | | | |
| 530,900 | | | E. I. du Pont de Nemours and Company | $ | 26,991 | |
| 141,600 | | | Eastman Chemical Company | | 9,109 | |
| 120,900 | | | Gerdau SA - ADR | | 3,109 | |
| 158,950 | | | Lubrizol Corporation | | 10,260 | |
| 198,450 | | | Lyondell Chemical Company | | 7,366 | |
| 121,125 | | | MeadWestvaco Corporation | | 4,278 | |
| 105,100 | | | Nucor Corporation | | 6,164 | |
| 397,650 | | | Olin Corporation | | 8,351 | |
| 516,250 | | | Packaging Corporation of America | | 13,066 | |
| 262,150 | | | RPM International, Inc. | | 6,058 | |
| 297,000 | | | Sonoco Products Company | | 12,715 | |
| 426,869 | | | Southern Copper Corporation | | 40,237 | |
| 251,900 | | | Worthington Industries, Inc. | | 5,454 | |
| | | | | | 196,983 | |
| | | | TELECOMMUNICATION SERVICES – 4.2% | | | |
| 2,099,221 | | | AT&T Inc. | | 87,118 | |
| 89,900 | | | China Mobile HK Limited - ADR | | 4,846 | |
| 1,217,990 | | | Citizens Communications Company | | 18,599 | |
| 69,300 | | | France Telecom SA - ADR | | 1,904 | |
| 308,124 | | | Sprint Nextel Corporation | | 6,381 | |
| 1,088,568 | | | Verizon Communications Inc. | | 44,816 | |
| | | | | | 163,664 | |
| | | | UTILITIES – 3.9% | | | |
| 280,700 | | | Ameren Corporation | | 13,757 | |
| 612,600 | | | Atmos Energy Corporation | | 18,415 | |
| 221,500 | | | Consolidated Edison, Inc. | | 9,994 | |
| 542,600 | | | Duke Energy Corporation | | 9,930 | |
| 39,300 | | | Enel SPA - ADR | | 2,110 | |
| 127,000 | | | Energy East Corporation | | 3,313 | |
| 312,550 | | | Great Plains Energy Incorporated | | 9,102 | |
| 250,882 | | | Integrys Energy Group, Inc. | | 12,727 | |
| 295,500 | | | KeySpan Corporation | | 12,405 | |
| 169,500 | | | National Fuel Gas Company | | 7,341 | |
| 338,300 | | | NICOR Inc. | | 14,520 | |
| 155,550 | | | OGE Energy Corp. | | 5,701 | |
| 149,900 | | | ONEOK, Inc. | | 7,557 | |
| 177,450 | | | Pepco Holdings, Inc. | | 5,004 | |
| 260,703 | | | Progress Energy, Inc. | | 11,885 | |
| 95,950 | | | Public Service Enterprise Group Inc. | | 8,423 | |
| | | | | | 152,184 | |
| | | | | | | |
| | | | Total common stocks (cost $2,812,877) | | 3,820,908 | |
See accompanying notes to financial statements.
GATEWAY FUND
PORTFOLIO OF INVESTMENTS – JUNE 30, 2007 (UNAUDITED)
CONTRACTS | | | | VALUE (000’s) | |
| | | | PUT OPTIONS – 0.4% | | | |
| 3,608 | | | On S&P 500 Index expiring July 21, 2007 at 1325 | $ | 162 | |
| 3,608 | | | On S&P 500 Index expiring July 21, 2007 at 1350 | | 307 | |
| 3,582 | | | On S&P 500 Index expiring August 18, 2007 at 1350 | | 1,719 | |
| 3,529 | | | On S&P 500 Index expiring August 18, 2007 at 1375 | | 2,294 | |
| 160 | | | On S&P 500 Index expiring August 18, 2007 at 1400 | | 141 | |
| 3,672 | | | On S&P 500 Index expiring September 22, 2007 at 1325 | | 2,570 | |
| 3,539 | | | On S&P 500 Index expiring September 22, 2007 at 1350 | | 3,150 | |
| 3,405 | | | On S&P 500 Index expiring September 22, 2007 at 1375 | | 3,882 | |
| | | | | | | |
| | | | Total put options (cost $19,343) | | 14,225 | |
| | | | | | | |
| | | | REPURCHASE AGREEMENT – 4.6% ** | | | |
| | | | 4.10% repurchase agreement with U. S. Bank, N. A. | | | |
| | | | dated June 29, 2007, due July 2, 2007 (repurchase proceeds $179,213) | | 179,152 | |
| | | | | | | |
| | | | Total common stocks, put options and repurchase agreement - 102.1% | | 4,014,285 | |
| | | | | | | |
| | | | CALL OPTIONS WRITTEN – (2.3%) *** | | | |
| (6,180 | ) | | On S&P 500 Index expiring July 21, 2007 at 1475 | | (26,172 | ) |
| (4,782 | ) | | On S&P 500 Index expiring July 21, 2007 at 1500 | | (11,644 | ) |
| (3,271 | ) | | On S&P 500 Index expiring July 21, 2007 at 1525 | | (3,565 | ) |
| (3,099 | ) | | On S&P 500 Index expiring August 18, 2007 at 1475 | | (17,463 | ) |
| (2,972 | ) | | On S&P 500 Index expiring August 18, 2007 at 1500 | | (11,606 | ) |
| (1,801 | ) | | On S&P 500 Index expiring August 18, 2007 at 1525 | | (4,421 | ) |
| (2,998 | ) | | On S&P 500 Index expiring September 22, 2007 at 1500 | | (15,665 | ) |
| | | | | | | |
| | | | Total call options written (premiums received $123,794) | | (90,536 | ) |
| | | | | | | |
| | | | OTHER ASSETS AND LIABILITIES, NET – 0.2% | | 9,663 | |
| | | | | | | |
| | | | NET ASSETS – 100.0% | $ | 3,933,412 | |
| | | | | | | |
| | | | | | | |
| | | | * Non-income producing. | | | |
| | | | ** Repurchase agreement fully collateralized by U.S. Government Agency obligations. | | | |
| | | | *** The $3,820,908,000 aggregate value of common stocks covers outstanding call options. | | | |
| | | | | | | |
| | | | ADR - American Depository Receipt. | | | |
| | | | | | | |
| | | | Common stocks are grouped by sector. | | | |
See accompanying notes to financial statements.
GATEWAY FUND
STATEMENT OF ASSETS AND LIABILITIES – JUNE 30, 2007 (UNAUDITED)
| | | (000’s) | |
ASSETS: | | | |
| Common stocks, at value (cost $2,812,877) | | $ | 3,820,908 | |
| Put options, at value (cost $19,343) | | | 14,225 | |
| Repurchase agreement | | | 179,152 | |
| Receivable for Fund shares sold | | | 6,047 | |
| Dividends and interest receivable | | | 6,206 | |
| Other assets | | | 120 | |
| Total assets | | | 4,026,658 | |
| | | | | |
LIABILITIES: | | | | |
| Call options written, at value (premiums received $123,794) | | | 90,536 | |
| Payable for Fund shares redeemed | | | 1,491 | |
| Accrued distribution expenses | | | 1,056 | |
| Accrued investment advisory and management fees | | | 67 | |
| Other accrued expenses and liabilities | | | 96 | |
| Total liabilities | | | 93,246 | |
| | | | | |
NET ASSETS | | $ | 3,933,412 | |
| | | | | |
NET ASSETS CONSIST OF: | | | | |
| Paid-in capital | | $ | 3,303,856 | |
| Undistributed net investment income | | | 2,167 | |
| Accumulated net realized loss on investment transactions | | | (408,782 | ) |
| Net unrealized appreciation on investments | | | 1,036,171 | |
| Net assets | | $ | 3,933,412 | |
| | | | | |
FUND SHARES OUTSTANDING | | | | |
| (unlimited number of shares authorized) | | | 139,063 | |
| | | | | |
| | | | | |
NET ASSET VALUE, OFFERING PRICE AND
REDEMPTION PRICE PER SHARE | | $ | 28.29 | |
See accompanying notes to financial statements.
GATEWAY FUND
STATEMENT OF OPERATIONS – FOR THE SIX MONTHS ENDED JUNE 30, 2007 (UNAUDITED)
| | | (000’s) | |
INVESTMENT INCOME: | | | |
| Dividends | | $ | 52,815 | |
| Interest | | | 3,335 | |
| Other income | | | 135 | |
| Total investment income | | | 56,285 | |
| | | | | |
EXPENSES: | | | | |
| Investment advisory and management fees | | | 10,736 | |
| Distribution expenses | | | 5,805 | |
| Trustees’ fees | | | 99 | |
| Professional fees | | | 59 | |
| Insurance expense | | | 48 | |
| Registration fees | | | 36 | |
| Custodian fees | | | 26 | |
| Other expenses | | | 49 | |
| Total expenses | | | 16,858 | |
| | | | | |
NET INVESTMENT INCOME | | | 39,427 | |
| | | | | |
REALIZED AND UNREALIZED GAIN (LOSS) ON INVESTMENTS: | | | | |
Realized gain (loss) on investment transactions: | | | | |
| Common stocks | | | 14,607 | |
| Put options expired and closed | | | (28,843 | ) |
| Call options expired and closed | | | (94,613 | ) |
| Net realized loss on investment transactions | | | (108,849 | ) |
| | | | | |
Change in unrealized appreciation/depreciation on investments: | | | | |
| Common stocks | | | 227,277 | |
| Put options | | | (1,398 | ) |
| Call options | | | 42,894 | |
| Net change in unrealized appreciation/depreciation on investments | | | 268,773 | |
| | | | | |
NET REALIZED AND UNREALIZED GAIN ON INVESTMENTS | | | 159,924 | |
| | | | | |
NET INCREASE IN NET ASSETS FROM OPERATIONS | | $ | 199,351 | |
See accompanying notes to financial statements.
GATEWAY FUND
STATEMENTS OF CHANGES IN NET ASSETS
| | | | | (000’s) | |
| | | Six Months
Ended
June 30, 2007
(Unaudited) | | Year Ended
December 31, 2006 | |
| FROM OPERATIONS: | | | | | |
| Net investment income | | $ | 39,427 | | $ | 57,532 | |
| Net realized loss on investment transactions | | | (108,849 | ) | | (138,037 | ) |
| Net change in unrealized appreciation/depreciation on investments | | | 268,773 | | | 368,810 | |
| Net increase in net assets from operations | | | 199,351 | | | 288,305 | |
| | | | | | | | |
DISTRIBUTIONS TO SHAREHOLDERS: | | | | | | | |
| From net investment income | | | (37,531 | ) | | (57,261 | ) |
| | | | | | | | |
FROM FUND SHARE TRANSACTIONS: | | | | | | | |
| Proceeds from shares sold | | | 767,147 | | | 960,602 | |
| Net asset value of shares issued in reinvestment of | | | | | | | |
| distributions to shareholders | | | 33,016 | | | 50,163 | |
| Payments for shares redeemed | | | (358,511 | ) | | (619,512 | ) |
| Net increase in net assets from Fund shares transactions | | | 441,652 | | | 391,253 | |
| | | | | | | | |
NET INCREASE IN NET ASSETS | | | 603,472 | | | 622,297 | |
| | | | | | | | |
NET ASSETS: | | | | | | | |
| Beginning of period | | | 3,329,940 | | | 2,707,643 | |
| End of period | | $ | 3,933,412 | | $ | 3,329,940 | |
| | | | | | | | |
UNDISTRIBUTED NET INVESTMENT INCOME | | $ | 2,167 | | | 271 | |
| | | | | | | | |
FUND SHARE TRANSACTIONS: | | | | | | | |
| Shares sold | | | 27,642 | | | 36,754 | |
| Shares issued in reinvestment of distributions to shareholders | | | 1,186 | | | 1,888 | |
| Shares redeemed | | | (12,916 | ) | | (23,788 | ) |
| Net increase in Fund shares outstanding | | | | | | 14,854 | |
| Shares outstanding, beginning of period | | | 123,151 | | | 108,297 | |
| Shares outstanding, end of period | | | 139,063 | | | 123,151 | |
See accompanying notes to financial statements.
GATEWAY FUND
FINANCIAL HIGHLIGHTS – PER SHARE DATA FOR A SHARE OUTSTANDING THROUGHOUT EACH PERIOD
| | | Six Months
Ended
June 30, 2007 | | Year Ended December 31, | |
| | | (Unaudited) | | 2006 | | 2005 | | 2004 | | 2003 | | 2002 | |
| | | | | | | | | | | | | | |
BEGINNING NET ASSET VALUE | | $ | 27.04 | | $ | 25.00 | | $ | 24.31 | | $ | 23.00 | | $ | 20.76 | | $ | 21.98 | |
| | | | | | | | | | | | | | | | | | | | |
INVESTMENT OPERATIONS: | | | | | | | | | | | | | | | | | | | |
| Net investment income | | | 0.29 | | | 0.48 | | | 0.44 | | | 0.29 | | | 0.17 | | | 0.15 | |
| Net realized and unrealized gain (loss) | | | 1.24 | | | 2.04 | | | 0.70 | | | 1.31 | | | 2.24 | | | (1.22 | ) |
| Total from investment operations | | | 1.53 | | | 2.52 | | | 1.14 | | | 1.60 | | | 2.41 | | | (1.07 | ) |
| | | | | | | | | | | | | | | | | | | | |
DISTRIBUTIONS: | | | | | | | | | | | | | | | | | | | |
| Dividends from net investment income | | | (0.28 | ) | | (0.48 | ) | | (0.45 | ) | | (0.29 | ) | | (0.17 | ) | | (0.15 | ) |
| Distributions from net realized gain | | | — | | | — | | | — | | | — | | | — | | | — | |
| Total distributions | | | (0.28 | ) | | (0.48 | ) | | (0.45 | ) | | (0.29 | ) | | (0.17 | ) | | (0.15 | ) |
| | | | | | | | | | | | | | | | | | | | |
ENDING NET ASSET VALUE | | $ | 28.29 | | $ | 27.04 | | $ | 25.00 | | $ | 24.31 | | $ | 23.00 | | $ | 20.76 | |
| | | | | | | | | | | | | | | | | | | | |
TOTAL RETURN | | | 5.68 | %(1) | | 10.14 | % | | 4.66 | % | | 6.95 | % | | 11.61 | % | | (4.86 | )% |
| | | | | | | | | | | | | | | | | | | | |
ENDING NET ASSETS (000’S) | | $ | 3,933,412 | | $ | 3,329,940 | | $ | 2,707,643 | | $ | 2,103,935 | | $ | 1,405,561 | | $ | 1,068,448 | |
| | | | | | | | | | | | | | | | | | | | |
AVERAGE NET ASSETS RATIOS: | | | | | | | | | | | | | | | | | | | |
| Total expenses | | | 0.94 | %(2) | | 0.95 | % | | 0.95 | % | | 0.97 | % | | 0.97 | % | | 0.97 | % |
| Net investment income | | | 2.20 | %(2) | | 1.92 | % | | 1.87 | % | | 1.42 | % | | 0.86 | % | | 0.66 | % |
| | | | | | | | | | | | | | | | | | | | |
PORTFOLIO TURNOVER RATE | | | 6 | %(2) | | 9 | % | | 15 | % | | 71 | % | | 5 | % | | 13 | % |
(1) Unannualized.
(2)Annualized.
See accompanying notes to financial statements.
GATEWAY FUND
NOTES TO FINANCIAL STATEMENTS – JUNE 30, 2007 (UNAUDITED)
| 1. | ORGANIZATION AND SIGNIFICANT ACCOUNTING POLICIES |
The Gateway Trust (the “Trust”) is an Ohio business trust, registered under the Investment Company Act of 1940, which is authorized to establish and operate one or more separate series of mutual funds. The Trust currently operates one diversified mutual fund, the Gateway Fund (the “Fund”). The investment objective of the Fund is to capture the majority of the higher returns associated with equity market investments, while exposing investors to significantly less risk than other equity investments. The Fund attempts to achieve its investment objective primarily by owning a broadly diversified portfolio of common stocks and by selling index call options. The Fund also buys index put options that can protect the Fund from a significant market decline over a short period of time.
The following is a summary of the Fund’s significant accounting policies:
Investments valuation– The Fund values its portfolio securities as of the close of the regular session of trading on the New York Stock Exchange (the “NYSE”), normally 4:00 p.m. Eastern time. Securities, other than option contracts, traded on a national stock exchange are valued at the last reported sales price on the primary exchange on which the security is traded. Securities traded in the over-the-counter market, and which are quoted by NASDAQ, are valued at the NASDAQ Official Closing Price. Option contracts (both purchased and written) are valued at the average of the closing bid and asked quotations. Securities, other than option contracts, for which market quotations are not readily available or in which trading has been suspended during the day, and option contracts for which closing market quotations are not considered to reflect option contract values as of the close of the NYSE, are valued at fair value as determined in good faith under procedures adopted by the Board of Trustees.
Share valuation– The net asset value per share of the Fund is calculated daily by dividing the total value of the Fund’s assets, less liabilities, by the number of shares outstanding. The offering price and redemption price per share are equal to the net asset value per share.
Investment transactions and investment income– Investment transactions are recorded on the trade date. Realized gains and losses are calculated on an identified cost basis. Dividend income is recorded on the ex-dividend date and interest income is accrued daily.
Option transactions– The Fund purchases index put options and writes (sells) index call options. When the Fund writes an index call option, an amount equal to the net premium received (the premium less commission) is recorded as a liability and is subsequently adjusted to the current value until the option expires or the Fund enters into a closing purchase transaction. When an index call option expires on its stipulated expiration date or the Fund enters into a closing purchase transaction, the difference between the net premium received and any amount paid at expiration or on effecting a closing purchase transaction, including commission, is treated as a realized gain or, if the net premium received is less than the amount paid, as a realized loss. The Fund, as writer of an index call option, bears the risk of an unfavorable change in the market value of the index underlying the written option.
Distributions to shareholders– Distributions from net investment income are recorded on the ex-dividend date and are declared and paid to shareholders quarterly. Distributions from net realized capital gains, if any, are recorded on the ex-dividend date and are declared and paid to shareholders annually.
GATEWAY FUND
NOTES TO FINANCIAL STATEMENTS – JUNE 30, 2007 (UNAUDITED)
Federal income taxes– The Fund intends to comply with the provisions of Subchapter M of the Internal Revenue Code applicable to regulated investment companies and distribute substantially all of its taxable income to shareholders. Based on this policy, the Fund makes no provision for income taxes.
At June 30, 2007, based on a $2,720,833,000 federal tax cost of common stocks and options, gross unrealized appreciation totaled $1,059,580,000, gross unrealized depreciation totaled $35,816,000 and net unrealized appreciation totaled $1,023,764,000. The difference between the book cost and federal tax cost of common stocks and options resulted from the tax deferral of losses on wash sales.
At December 31, 2006, the components of distributable earnings on a tax basis were as follows (000’s):
| Cost of common stocks and options | | $ | 2,413,472 | |
| | | | | |
| Gross unrealized appreciation | | $ | 802,204 | |
| Gross unrealized depreciation | | | (34,478 | ) |
| Net unrealized appreciation | | | 767,726 | |
| Undistributed ordinary income | | | 271 | |
| Capital loss carryforwards | | | (300,261 | ) |
| Distributable earnings | | $ | 467,736 | |
The difference between the book basis and tax basis of distributable earnings resulted from the tax deferral of losses on wash sales and the tax recognition of net unrealized appreciation on open option contracts at December 31, 2006. There was no difference between the book basis and tax basis of distributions paid for the year ended December 31, 2006. The Fund’s capital loss carryforwards expire December 31, 2011 and December 31, 2014 in the amounts of $122,095,000 and $178,166,000, respectively.
Repurchase agreements– The Fund requires the custodian to hold sufficient collateral to secure repurchase agreements. To reduce the chance of loss in its repurchase transactions, the Fund enters into repurchase agreements only with banks that have more than $1 billion in assets and are creditworthy in the judgment of Gateway Investment Advisers, L.P. (the “Adviser”).
Estimates– The preparation of financial statements in conformity with accounting principles generally accepted in the United States requires management to make estimates and assumptions that affect the reported amounts of assets and liabilities at the date of the financial statements and the reported amounts of income and expenses during the reporting period. Actual results could differ from those estimates.
| 2. | TRANSACTIONS WITH AFFILIATES |
The Fund pays the Adviser an investment advisory and management fee under the terms of a Management Agreement at an annual rate of 0.925% of average daily net assets minus all distribution expenses. The Fund has adopted a Distribution Plan pursuant to Rule 12b-1 of the Investment Company Act of 1940 that allows for the payment of distribution expenses by the Fund related to the sale and distribution of its shares. In any year, distribution expenses cannot exceed 0.50% of average daily net assets. The Adviser receives no separate fee for its transfer agency, fund accounting and other services to the Fund, and the Adviser pays the Fund’s expenses of reporting to shareholders under the Management Agreement.
If total annual operating expenses (excluding taxes, interest, brokerage commissions and expenses of an extraordinary nature) exceed 1.50% of the Fund’s average daily net assets, the Adviser has agreed to reduce its fee as necessary to limit the Fund’s expenses to this level.
GATEWAY FUND
NOTES TO FINANCIAL STATEMENTS – JUNE 30, 2007 (UNAUDITED)
| 3. | INVESTMENT TRANSACTIONS |
For the six months ended June 30, 2007, cost of purchases of investment securities (excluding any short-term investments and U. S. government securities) totaled $384,019,000 and proceeds from sales totaled $98,284,000.
The Fund may write (sell) call options on stock indexes in exchange for cash (that is, the premium received) to enhance earnings on the portfolio securities. However, using these call options limits the opportunity to participate in appreciation of the underlying portfolio beyond certain upper limits set by the contracts. In general, the liability recorded upon receipt of written option premiums increases to offset rises and decreases to offset declines in portfolio value. For the six months ended June 30, 2007, transactions in written options were as follows:
| | | Contracts | | Premiums
(000’s) | |
| Outstanding at December 31, 2006 | | | 23,038 | | | $ 108,874 | |
| Options written | | | 84,123 | | | 320,123 | |
Options terminated in closing
purchase transactions | | | (82,058 | ) | | (305,203 | ) |
| Outstanding at June 30, 2007 | | | 25,103 | | | $ 123,794 | |
The Fund has an uncommitted $100 million bank line of credit to be used as a temporary liquidity source for meeting redemption requests. Borrowings under this arrangement, expiring October 31, 2007, bear interest at the bank’s prime rate minus 0.50%. There are no fees associated with maintaining this facility. During the six months ended June 30, 2007, there were no borrowings on this line of credit.
| 5. | COMMITMENTS AND CONTINGENCIES |
The Fund indemnifies the Trustees and officers of the Trust for certain liabilities that might arise from the performance of their duties to the Fund. Additionally, in the normal course of business, the Fund enters into contracts that contain a variety of representations and warranties and which provide general indemnifications. The Fund’s maximum exposure under these arrangements is unknown, as this would involve future claims that may be made against the Fund that have not yet occurred. However, based on experience, the Fund expects the risk of loss to be remote.
| 6. | RECENT ACCOUNTING PRONOUNCEMENTS |
In June 2007, the Fund adopted Financial Accounting Standards Board (“FASB”) Interpretation No. 48, “Accounting for Uncertainty in Income Taxes” (“FIN 48”). FIN 48 provides guidance for how uncertain tax positions should be recognized, measured, presented and disclosed in the financial statements. FIN 48 requires the evaluation of tax positions taken or expected to be taken in the course of preparing the Fund’s tax returns to determine whether the tax positions are “more-likely-than-not” of being sustained by the applicable tax authority. Tax positions not deemed to meet the more-likely-than-not threshold would be recorded as a tax benefit or expense in the current year. Based on its evaluation, management believes that the Fund’s tax positions meet the more-likely-than-not threshold and that, accordingly, the adoption of FIN 48 has no material impact on the financial statements of the Fund.
GATEWAY FUND
NOTES TO FINANCIAL STATEMENTS – JUNE 30, 2007 (UNAUDITED)
In September 2006, FASB issued Statement on Financial Accounting Standards No. 157, “Fair Value Measurements” (“SFAS 157”). This standard clarifies the definition of fair value for financial reporting, establishes a framework for measuring fair value and requires additional disclosures about the use of fair value measurements. SFAS 157 is effective for financial statements issued for fiscal years beginning after November 15, 2007 and for interim periods within those fiscal years. Management currently believes that the adoption of SFAS 157 will have no impact on the financial statements of the Fund; however, additional disclosures may be required about the inputs used to develop the measurements of fair value and the effect of certain of the measurements reported in the statement of operations for a fiscal period.
| 7. | PENDING FUND REORGANIZATION |
On June 29, 2007, the Adviser announced that it has agreed to sell and transfer substantially all of its assets to Gateway Investment Advisers, LLC, a newly formed, wholly-owned subsidiary of Natixis Global Asset Management, L.P. (formerly known as IXIS Asset Management US Group, L.P.). The closing of the sale, which is anticipated to occur in the first quarter of 2008, is subject to certain regulatory approvals, client consents (including approval of Fund shareholders) and other conditions.
In connection with the planned sale of the Adviser, the Board of Trustees of the Trust unanimously approved an Agreement and Plan of Reorganization pursuant to which a newly organized fund (the “New Gateway Fund”), advised by Gateway Investment Advisers, LLC, will acquire all of the assets and assume all of the liabilities of the Fund in exchange for shares of the New Gateway Fund, which will be immediately distributed to Fund shareholders in complete liquidation of the Fund. The New Gateway Fund will be managed by the same investment personnel and using the same investment program as the current Fund. This transaction is subject to the approval of the shareholders of the Fund and to the satisfaction of certain other conditions. Proxy materials relating to a special meeting of Fund shareholders are expected to be mailed to shareholders in late November 2007.
GATEWAY FUND
FUND EXPENSES (UNAUDITED)
As a shareholder of the Gateway Fund (the “Fund”), you may incur two types of costs: (1) transaction costs, including any transaction fees that you may be charged if you purchase or redeem the Fund through certain financial institutions; and (2) ongoing costs, including investment advisory and management fees, distribution expenses and other Fund expenses. The example below is intended to help you understand your ongoing costs (in dollars) of investing in the Fund and to compare these costs with the ongoing costs of investing in other mutual funds. The example is based on an investment of $1,000 invested at the beginning of the period (January 1, 2007) and held for the six-month period ended June 30, 2007.
ACTUAL EXPENSES
The first line in the table below provides information about actual account values and actual Fund expenses. You may use the information in this line, together with the amount you invested, to estimate the expenses that you paid over the period. Simply divide your account value by $1,000 (for example, an $8,600 account value divided by $1,000 = 8.6), then multiply the result by the number in the first line under the heading entitled “Expenses Paid During Period” to estimate the expenses you paid on your account during the period.
HYPOTHETICAL EXAMPLE FOR COMPARISON PURPOSES
The second line in the table below provides information about hypothetical account values and hypothetical expenses based on the Fund’s actual expense ratio and an assumed rate of return of 5% per year before expenses, which is not the Fund’s actual return. The hypothetical account values and expenses may not be used to estimate the actual ending account balance or expenses you paid for the period. You may use this information to compare the ongoing costs of investing in the Fund to other mutual funds. To do so, compare this 5% hypothetical example with the 5% hypothetical examples that appear in the shareholder reports of the other funds.
Please note that the expenses shown in the table are meant to highlight ongoing costs only and do not reflect any transaction costs charged by certain financial institutions. Therefore, the second line of the table is useful in comparing ongoing costs only, and will not help you determine the relative total costs of owning different mutual funds. In addition, if you incurred transaction costs, your costs would have been higher. Please refer to the Fund’s prospectus for additional information on applicability of transaction costs for the Fund.
| | | Beginning
Account Value
1/1/07 | | Ending
Account Value
6/30/07 | | Expenses Paid
During Period
1/1/07 - 6/30/07* | |
| | | | | | | | |
| Actual | | $1,000.00 | | $1,056.78 | | $4.79 | |
| Hypothetical (5% return before expenses) | | $1,000.00 | | $1,020.13 | | $4.71 | |
| * | Expenses are equal to the Fund’s annualized expense ratio of 0.94%, multiplied by the average account value over the period, multiplied by 181/365 (to reflect the most recent fiscal half-year period). |
WEB SITE
For general information regarding the Gateway Fund,
visit us at www.gatewayfund.com.
INVESTMENT ADVISER
Gateway Investment Advisers, L.P.
Rookwood Tower
3805 Edwards Road, Suite 600
Cincinnati, Ohio 45209
CUSTODIAN
U.S. Bank, N.A.
425 Walnut Street
Cincinnati, Ohio 45202
INDEPENDENT REGISTERED
PUBLIC ACCOUNTING FIRM
Ernst & Young LLP
312 Walnut Street
Cincinnati, Ohio 45202
LEGAL COUNSEL
Thompson Hine LLP
312 Walnut Street
Cincinnati, Ohio 45202
A description of the policies and procedures that the Fund uses to determine how to vote proxies relating to portfolio securities, and information regarding how the Fund voted those proxies during the most recent twelve-month period ended June 30, are available without charge, upon request, by calling the Fund at 800.354.6339, or on the Securities and Exchange Commission’s (the “SEC”) website at www.sec.gov.
The Fund files its complete schedule of portfolio holdings with the SEC for the first and third quarters of each fiscal year (quarters ended March 31 and September 30) on Form N-Q. The filings are available without charge, upon request, by calling the Fund at 800.354.6339. They are also available on the SEC’s website at www.sec.gov and may be reviewed and copied at the SEC’s Public Reference Room in Washington, D.C. Information on the operation of the Public Reference Room may be obtained by calling 800.SEC.0330.
This report must be preceded by or accompanied by a prospectus.
Applicable to Annual Reports only.
Applicable to Annual Reports only.
Applicable to Annual Reports only.
| Item 5. | Audit Committee of Listed Registrants. |
Not applicable.
| Item 6. | Schedule of Investments. |
Schedule of Investments is included as part of the report to shareholders filed under Item 1 of this Form.
| Item 7. | Disclosure of Proxy Voting Policies and Procedures for Closed-End Management Investment Companies. |
Not applicable.
| Item 8. | Portfolio Managers of Closed-End Management Investment Companies. |
Not applicable.
| Item 9. | Purchases of Equity Securities by Closed-End Management Investment Companies and Affiliated Purchasers. |
Not applicable.
| Item 10. | Submission of Matters to a Vote of Security Holders. |
The registrant has not adopted procedures by which shareholders may recommend nominees to the registrant's board of trustees.
(a) Based on an evaluation of the registrant’s disclosure controls and procedures as of August 24, 2007, the disclosure controls and procedures are reasonably designed to ensure that the information required in filings of Form N-CSR is recorded, processed, summarized, and reported on a timely basis.
(b) There were no changes in the registrant’s internal control over financial reporting that occurred during the second fiscal quarter of the period covered by this report that have materially affected, or are reasonably likely to materially affect, the registrant’s internal control over financial reporting.
| (a)(1) | Applicable to Annual Reports only. |
| (a)(2) | EX-99.CERT Certifications required by Rule 30a-2(a) of the Investment Company Act of 1940 are filed herewith. |
| (b) | EX-99.906.CERT Certification required by Rule 30a-2(b) of the Investment Company Act of 1940 is filed herewith. |
SIGNATURES
Pursuant to the requirements of the Securities Exchange Act of 1934 and the Investment Company Act of 1940, the registrant has duly caused this report to be signed on its behalf by the undersigned, thereunto duly authorized.
| The Gateway Trust | | | |
| | | | | |
| By | /s/ Walter G. Sall | | | |
| |
Walter G. Sall, Chairman | | | |
| | | | | |
| Date | August 24, 2007 | | | |
Pursuant to the requirements of the Securities Exchange Act of 1934 and the Investment Company Act of 1940, this report has been signed below by the following persons on behalf of the registrant and in the capacities and on the dates indicated.
| | | | | |
| By | /s/ Walter G. Sall | | | |
| |
Walter G. Sall, Chairman | | | |
| | | | | |
| Date | August 24, 2007 | | | |
| | | | | |
| By | /s/ Gary H. Goldschmidt | | | |
| |
Gary H. Goldschmidt Vice President and Treasurer | | | |
| | | | | |
| Date | August 24, 2007 | | | |