QuickLinks -- Click here to rapidly navigate through this documentExhibit 99.C.1

Hon Dr Michael Cullen
MINISTER OF FINANCE
DECEMBER ECONOMIC AND FISCAL UPDATE 2003
18 DECEMBER 2003
ISBN 0-478-18255-4
Contents
December Economic and Fiscal Update
| Statement of Responsibility | | |
Economic Outlook |
|
|
| |
Summary |
|
|
| |
Recent and Current Developments |
|
|
| |
Forecasts to June 2005 |
|
|
| |
2005/06 and the Medium Outlook |
|
|
Fiscal Outlook |
|
|
| |
Summary of the December Update |
|
|
| |
Comparison of OBERAC with Budget Update |
|
|
| |
Revenues and Expenses |
|
|
| |
Expenses |
|
|
| |
Risks to Forecasts |
|
|
Risks and Scenarios |
|
|
| |
Summary |
|
|
| |
Economic Risks |
|
|
| |
Economic Scenarios |
|
|
| |
Fiscal Scenarios |
|
|
| |
Fiscal Sensitivities |
|
|
Specific Fiscal Risks |
|
|
| |
Introduction |
|
|
| |
Specific fiscal risks |
|
|
| |
Contingent liabilities |
|
|
Generally Accepted Accounting Practice (GAAP) Series Tables |
|
|
| |
Statement of Accounting Policies and Forecast Assumptions |
|
|
| |
Reporting Entity as at 8 December 2003 |
|
|
| |
Forecast Statements |
|
|
| |
Notes to the Forecast Financial Statements |
|
|
Glossary of Terms |
|
|
Statement of Responsibility
On the basis of the economic and fiscal information available to it, the Treasury has used its best professional judgement in supplying the Minister of Finance with this Economic and Fiscal Update. The Update incorporates the fiscal and economic implications both of Government decisions and circumstances as at 8 December 2003 that were communicated to me, and of other economic and fiscal information available to the Treasury in accordance with the provisions of the Fiscal Responsibility Act 1994.
John Whitehead
Secretary to the Treasury
11 December 2003
This Economic and Fiscal Update has been prepared in accordance with the Fiscal Responsibility Act 1994. I accept overall responsibility for the integrity of the disclosures contained in this Update, and the consistency and completeness of the Update information in accordance with the requirements of the Fiscal Responsibility Act 1994.
To enable the Treasury to prepare this Update, I have ensured that the Secretary to the Treasury has been advised of all Government decisions and other circumstances as at 8 December 2003 of which I was aware and that had material economic or fiscal implications.
Hon Dr Michael Cullen
Minister of Finance
11 December 2003
1
Economic Outlook
Summary
- •
- The economy has grown strongly over the past two years. Annual growth was 4.0% in the year ended June. Employment growth has been strong, and the unemployment rate has fallen to 4.4%, which is lower than at any time since the late-1980s.
Figure 1.1—Real GDP growth
Sources: Statistics New Zealand, The Treasury
- •
- However, in the last year strong overall growth has come to be increasingly dominated by domestic demand.
- •
- The Iraq conflict, the SARS outbreak and drought have all been partly responsible for slower export growth, and also led to an overall "growth pause" over the June quarter.
- •
- But in general, strong domestic demand can be explained by strong employment and household wealth, and more immigration, while declining net export earnings can be explained by the increasing exchange rate.
- •
- Over the short term, GDP growth is expected to continue to be robust, owing to ongoing strong household and business spending. Housing investment growth will be particularly strong.
- •
- The strong end to the year sees real GDP growth of 2.8% for the year to March 2004, compared with 2.2% forecast in the Budget Update.
- •
- As calendar 2004 progresses the pace of domestic demand growth is forecast to abate, with the housing investment cycle running its course and households easing back their other spending. Together with export growth remaining low quarterly GDP growth will slow. For the year ended March 2005, 2.8% growth is forecast, declining further to 2.5% by June.
- •
- From mid-2005, the rebound in global growth is forecast to provide a greater stimulus to exports, with the exchange rate acting as less of a drag given its assumed decline. Households are expected to continue to consolidate their financial position so that despite steady business investment and rising infrastructure investment, domestic demand will slow further, implying more balanced growth than has occurred over 2003. With import growth also slowing, GDP growth of around 3.4% is forecast for 2005/06 and 2006/07.
- •
- At the end of the forecast period, economic growth is expected to have been relatively robust for a decade. An economic growth cycle is forecast, with the period of slower growth in 2004/05 representing the trough, but the fluctuation is expected to be less than in past cycles.
- •
- Over most of the forecast period, annual CPI inflation is expected to fluctuate between 2.0% and 2.5%. Non-tradable inflation will persist for a time even after domestic demand growth
Figure 1.2—Monetary conditions
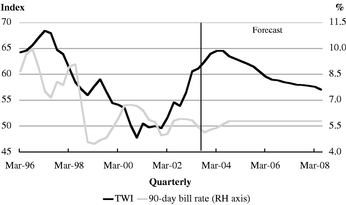
Sources: Reserve Bank of New Zealand, The Treasury
- •
- Monetary policy is assumed to lean against these inflation pressures. Modest increases in the Reserve Bank's Official Cash Rate (OCR) are expected to see 90-day bank bills at around 5.8% from the middle of 2004. This represents a modest interest rate cycle by historical standards.
- •
- The current account deficit is forecast to increase to 6% of GDP by early 2005, because of the strength of domestic demand and the high exchange rate, both of which will draw in imports. As growth becomes more balanced, however, the deficit will decrease to around 5% of GDP.
- •
- Overall, the view of the economy implied by this forecast is similar to that presented in the 2003 Budget Update. However, the level of nominal GDP is higher throughout the forecast period than forecast in the Budget Update, because of historical revisions and a higher starting level of labour market earnings. This implies higher tax revenue for the Government.
Table 1.1—Economic outlook: central forecast(1)
(Annual average % change, March years)
| | 2002
Actual
| | 2003
Actual
| | 2004
Forecast
| | 2005
Forecast
| | 2006
Forecast
| | 2007
Forecast
| | 2008
Forecast
|
|---|
| Private consumption | | 2.8 | | 3.8 | | 4.3 | | 3.1 | | 2.9 | | 2.9 | | 3.0 |
| Public consumption(2) | | 3.9 | | 5.0 | | 5.0 | | 3.5 | | 3.0 | | 4.5 | | 2.8 |
| Total Consumption | | 3.1 | | 4.1 | | 4.5 | | 3.2 | | 2.9 | | 3.3 | | 3.0 |
| | |
| |
| |
| |
| |
| |
| |
|
Residential investment |
|
3.3 |
|
23.3 |
|
20.3 |
|
5.2 |
|
- -7.9 |
|
- -1.6 |
|
0.9 |
| Market investment | | 5.4 | | 4.1 | | 9.1 | | 5.8 | | 5.7 | | 3.2 | | 4.1 |
| Non-market investment | | 3.7 | | 2.8 | | 5.1 | | 4.8 | | 9.7 | | 3.8 | | 2.8 |
| Total Investment | | 4.7 | | 8.6 | | 11.6 | | 5.6 | | 2.3 | | 2.1 | | 3.2 |
| | |
| |
| |
| |
| |
| |
| |
|
Stock change(3) |
|
0.3 |
|
- -0.4 |
|
0.0 |
|
0.1 |
|
0.2 |
|
- -0.2 |
|
- -0.1 |
| Gross National Expenditure | | 3.7 | | 4.5 | | 5.4 | | 3.8 | | 2.9 | | 2.8 | | 2.9 |
| | |
| |
| |
| |
| |
| |
| |
|
Exports |
|
2.0 |
|
7.0 |
|
1.7 |
|
4.2 |
|
6.1 |
|
5.5 |
|
3.5 |
| Imports | | 2.4 | | 9.4 | | 11.9 | | 7.1 | | 4.7 | | 3.7 | | 3.0 |
| | |
| |
| |
| |
| |
| |
| |
|
| GDP (production measure) | | 3.4 | | 4.4 | | 2.8 | | 2.8 | | 3.4 | | 3.4 | | 3.0 |
| | |
| |
| |
| |
| |
| |
| |
|
| —annual % change | | 4.1 | | 4.0 | | 3.0 | | 2.3 | | 4.1 | | 3.0 | | 3.0 |
Nominal GDP (expenditure basis) |
|
7.9 |
|
4.0 |
|
4.7 |
|
5.6 |
|
5.3 |
|
5.2 |
|
5.1 |
| GDP deflator | | 3.7 | | -0.6 | | 2.3 | | 2.7 | | 1.9 | | 1.8 | | 2.0 |
Employment(4) |
|
2.5 |
|
2.6 |
|
3.0 |
|
1.4 |
|
0.9 |
|
1.4 |
|
1.4 |
| Unemployment(5) | | 5.2 | | 4.9 | | 4.4 | | 4.8 | | 4.9 | | 4.8 | | 4.8 |
Wages(6) |
|
3.5 |
|
2.9 |
|
3.7 |
|
4.2 |
|
3.9 |
|
3.6 |
|
3.6 |
| CPI inflation(7) | | 2.6 | | 2.5 | | 1.4 | | 2.4 | | 2.4 | | 2.2 | | 2.0 |
| Export prices(8) | | 3.1 | | -13.0 | | -9.8 | | -2.1 | | 3.4 | | 3.5 | | 1.2 |
| Import prices(8) | | -0.9 | | -7.2 | | -10.2 | | -2.2 | | 3.1 | | 3.2 | | 0.8 |
Current account balance |
|
|
|
|
|
|
|
|
|
|
|
|
|
|
| —$ million | | -2,795 | | -5,035 | | -7,340 | | -8,488 | | -8,603 | | -8,660 | | -8,704 |
| —% of GDP | | -2.3 | | -3.9 | | -5.5 | | -6.0 | | -5.8 | | -5.5 | | -5.3 |
TWI(9) |
|
51.6 |
|
60.6 |
|
64.5 |
|
62.5 |
|
59.5 |
|
58.3 |
|
57.6 |
| 90-day bank bill rate(9) | | 5.0 | | 5.8 | | 5.4 | | 5.8 | | 5.8 | | 5.8 | | 5.8 |
| 10-year bond rate(9) | | 6.7 | | 6.0 | | 6.3 | | 6.4 | | 6.0 | | 6.0 | | 6.0 |
Sources: Statistics New Zealand, Reserve Bank of New Zealand, The Treasury
NOTES:
- (1)
- Forecasts finalised 21 November 2003. Text finalised 11 December 2003. Additional tables are available on the Internet at www.treasury.govt.nz/forecasts/defu/2003/.
- (2)
- The forecast profile for public consumption is influenced by government defence spending.
- (3)
- Contribution to GDP growth.
- (4)
- Household Labour Force Survey, full-time equivalent employment.
- (5)
- Household Labour Force Survey, percentage of the labour force, March quarter, seasonally adjusted.
- (6)
- Quarterly Employment Survey, average hourly ordinary time earnings.
- (7)
- Annual % change, March quarter
- (8)
- Overseas Trade Index basis, annual average percentage change, March quarter.
- (9)
- Average for the March quarter.
Assumptions Underlying the Central Forecast
Global economic activity—global economic growth, inflation and interest rate forecasts are assumed to conform to those presented in the November Asia Pacific Consensus Forecasts. Long-term forecasts (beyond 2004) are taken from the October Consensus Forecasts. For a more detailed discussion of the global outlook, see the 'Global economic growth' box on page 21.
Oil prices—oil prices are assumed to decline gradually over the short term, consistent with the price of oil futures at the time the forecasts were put together. Thereafter, oil prices are assumed to converge to a long-term average of around US$18.50 per barrel.
Net migration—the net number of migrants has started to decline from a peak early in 2003 and is assumed to continue declining to approximately 10,000 per year by 2005/06. This assumption is higher than the one used in the Budget Update.
Monetary conditions—from the middle of 2004, the exchange rate (TWI) is assumed to decline steadily to its estimated equilibrium of around 57. This is a technical assumption. The forecasts assume a neutral short-term interest rate of 5.8%.
Climate—agricultural growing conditions and the level of hydroelectricity storage lakes are assumed to be normal over the forecast period.
Recent and Current Developments
The economy as a whole has performed well over the past two years...
Annual real GDP growth was 4.0% in the year ended June 2003, following growth of 3.6% during the previous year. New Zealand's performance easily exceeded the OECD average over this period.
Nominal GDP growth is estimated to have been slightly slower at 3.8%. However, with Statistics New Zealand revising up official estimates of nominal GDP by approximately $1.5 billion dollars over two years, the level of nominal GDP is higher than the forecasts contained in the Budget Update. This helps explain the increase in tax revenue experienced over the past year.
... but growth has become increasingly domestically based over the past year
Figure 1.3—Contributions to GDP growth
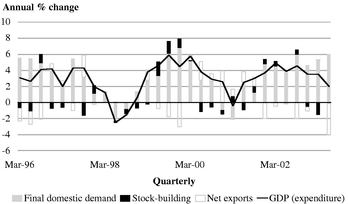
Sources: Statistics New Zealand, The Treasury
Digging more deeply into the GDP statistics, it is clear that some components of production, income and spending have grown faster than others.
Household and business spending has grown quickly...
Household spending grew rapidly over 2003/04, the result of more purchases of consumption items, but also vastly more investment in new housing. The value of houses constructed rose by almost 25% over the year ended June.
More jobs and steady wage increases have provided the foundation for household spending over this period. Employment growth has been healthy since the end of 2002, and became very rapid in mid-2003, driving the unemployment rate down to 4.4% by September. The unemployment rate has declined in spite of a growing number of people choosing to enter the labour force.
The strength of employment growth means that the level of employment at the beginning of the forecast period is considerably higher than expected in the Budget Update. Although the view of employment growth from this point on has not changed dramatically since the Budget, growth so far together with slightly faster wage growth is likely to translate into higher income tax receipts over the forecast period.
Greater household wealth has also provided a basis for more consumption and investment over the past year. The average price of houses, which are the most widely held of household assets, has gone up by 17%, not only encouraging more house building but also making householders more willing to purchase consumption items on credit.
Meanwhile, business investment has been given a boost by low prices for imported capital equipment. Computer prices, in particular, have fallen dramatically in real terms. Adding to the incentive to invest, capacity utilisation rates have been relatively high in recent quarters, particularly in the construction sector, implying a need for more investment. Overall utilisation peaked at a ten-year high of 91.4% in mid-2003. It has since declined slightly to 89.5% but remains above the average for the period since 1990 (88.9%).
As a consequence of more domestic spending, but also because of lower prices, demand for imports has been strong. The volume of imports rose 10.3% over the year ended June, although the value declined 0.3%.
Consumer price inflation ran at an annual rate of less than 1.5% over the middle of 2003. A rising exchange rate has caused import and export prices to decline, offsetting non-tradable inflation. The non-tradable inflation rate, which was 4.1% in September, has been driven up partly by housing and household operation costs.
... while export earnings growth has been slow
In contrast to domestic spending, export earnings have been declining. The volume of exports increased 5.0% over the year ended June 2003, but falling prices meant export receipts fell 5.9%.
Figure 1.4—Nominal export earnings
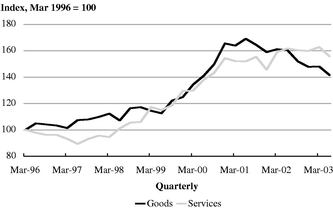
Sources: Statistics New Zealand, The Treasury
The important point here is that in contrast to household incomes and profits for most businesses, exporters' incomes have declined.
Falling New Zealand dollar prices have been widespread. The agricultural sector has been hit particularly hard over the last year, and farm incomes have declined from high levels in previous years.
Exporters of services, such as tourist operators and educational institutions, have been less affected by falling prices, but the quarterly volume of service exports was reduced over the period from March to June.
Unusual events explain some of the dichotomy between export earnings and domestic spending...
One of the reasons for the uneven growth of different parts of the economy is that a series of shocks that hit the economy over the first half of this year mostly affected exporters.
- •
- the US-Iraq conflict added to a climate of general geo-political uncertainty, caused oil prices to fluctuate and acted to delay global recovery
- •
- the outbreak of Severe Acute Respiratory Syndrome (SARS), principally in Asia, led to a marked fall in visitor arrivals
- •
- dry weather led to poor agricultural growing conditions, and reduced the level of hydroelectric storage lakes, causing some manufacturers to conserve energy by cutting back production.
The quarterly GDP growth rate was reduced to 0.2% in June, following 0.6% in March. Quarterly export volumes fell by 3.1%, while domestic spending was largely unaffected.
These events were discussed in detail in the Budget Update, and their effects have been broadly as expected.
... but less fleeting influences have also been fundamental.
The shocks that hit the March and June quarters were temporary and, it appears, their effects were short-lived. But it is expected that the divide between domestic spending and net export growth will continue to widen for a time. This is because more fundamental forces have also been at work this year.
In the household sector, high levels of net migration have been increasing the demand for consumption goods and services in general, and housing in particular. The annual net number of migrants peaked at over 40,000 in the March quarter and has remained relatively high.
Figure 1.5—Exchange rates
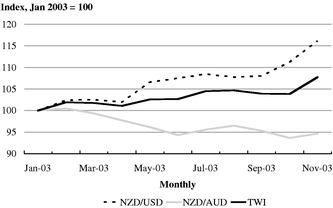
Sources: Statistics of New Zealand, The Treasury
At the same time, a rising exchange rate has reduced the prices of both imports and exports. This has encouraged households and businesses to spend on imported goods, sometimes at the expense of domestic producers, and is also the main reason for lower incomes in the export sector.
Although export earnings have been significantly lower this year than in 2002, the effect of the exchange rate appreciation on overall GDP growth has been moderate so far, and the 4.0% growth rate over the year ended June is evidence of that. Partly, this is due to the fact that it can take a long time—one to two years is typical—for exchange rate developments to impact on export volumes and to flow through to the rest of the economy. This year's rise in the exchange rate is expected to have its greatest negative effect on economic activity from late-2004.
Another reason why the effect of the rising exchange rate on total GDP might not so far have been as large as expected is that components of the Trade Weighted Index (TWI) have been moving in opposite directions. On one hand, compared with most major currencies, the US dollar has been losing value, and the New Zealand dollar has consequently been gaining value. On the other hand, since the beginning of 2003, the New Zealand dollar has lost ground to the Australian dollar. Exporters of primary commodities will generally be worse off because of the weakening US dollar, since their exports are priced in that currency. But some manufacturing exporters, particularly those which buy raw materials in US dollars and sell finished products in Australian dollars, could be better off.
Growth appears to have been strong over the second half of 2003
Turning to the very recent past, most indicators of economic activity are indicating a rebound in GDP growth over the September quarter.
Figure 1.6—Selected real activity indicators
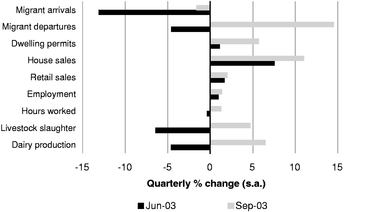
Sources: Statistics New Zealand, Real Estate Institute of New Zealand, Fonterra, The Treasury
Retail trade turnover and the number of building permits granted for new houses both rose significantly, suggesting that household spending continued to grow rapidly, supported by increased job security and further house price rises.
Agricultural production also appears to have increased, and tourist numbers have rebounded, following sharp declines over the June quarter. Export prices are still subdued, but it seems that exporters did increase their real output over the quarter.
Global economic growth also accelerated over the September quarter, following concerns that the recovery of several of New Zealand's trading partners' economies would stall as a result of geo-political uncertainty and disease. The 2.0% rate of quarterly expansion in the US was the fastest in a decade. See box, "Global economic growth" on page 21, for a summary of international growth developments and forecasts.
Export Performance
The performance of the export sector is an important component of the economic outlook. Exports fell sharply in the June quarter of 2003. This in part reflected the effect of dry climatic conditions over the beginning of 2003, which saw dairy production fall and a surge in meat slaughtering in the March quarter, followed by a slump in June. The outbreak of SARS had a negative impact on the exports of some foods, particularly seafood, while visitor arrivals fell sharply.
The unwinding of these negative factors is expected to see a lift in export volumes in the September quarter, with services exports in particular bouncing back.
Export volume growth is forecast to be subdued over the final quarter of 2003 and over much of 2004, as this year's exchange rate appreciation impacts on exporters' competitiveness, despite stronger global growth. The greatest impact of the appreciation of the exchange rate is likely to be on non-commodity exports, particularly manufactured goods, forestry and services. Analysis suggests that there is a lag of around 11/2 years between a rise in the currency and any impact on export volumes.
A further complication is that it is the bilateral exchange rate between New Zealand and trading partners that is important when considering competitiveness. With Australia accounting for around 50% of New Zealand's manufactured goods exports, and an important source of visitor arrivals, the smaller appreciation in the New Zealand/Australian exchange rate compared to the New Zealand/United States rate will mitigate some of the impact of the appreciation of the TWI. The central forecast sees annual average manufactures export growth slow to 4.6% and 4.2% in the March 2004 and 2005 years, down from 8.5% in the year to March 2003, and substantially weaker than expected at the time of the Budget Update. It will also be lower than the average since 1990 of about 8%. Forestry export volumes are forecast to fall 3.8% in the year to March 2004, with growth recovering to just 2.3% in the year to March 2005.
A return to normal growing conditions in the agricultural sector is expected to boost primary exports and help offset some of the weakness described above.
Figure 1.7—Export volume growth
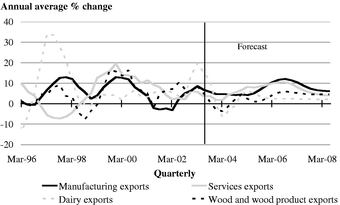
Sources: Statistics NZ, The Treasury
The level of the TWI means that New Zealand dollar prices and exporter receipts will be weak for a while yet, although an improved outlook for the world prices of many of New Zealand's exports will provide some offset.
As the rebound in global growth becomes embedded and the exchange rate becomes less of a drag, export volume and receipts growth are forecast to lift, with manufacturing, forestry and services exports all contributing to a solid 6.1% rise in export volumes in the March 2006 year.
Global Economic Growth
Consensus Forecasts based forecasts of trading partner growth point to growth returning to a little above its long-term average in 2004, and then to around its average, following three years of being below-par. The expected rebound in 2004 is pretty much across the board with better growth in the US, Australia and non-Japan Asia, offsetting only modest growth in Japan and Europe. These are consistent with other views the Treasury monitors.
Calendar years
| | 2002(a)
| | 2003(e)
| | 2004(f)
| | 2005(f)
| | 2006(f)
| | 2007(f)
| | 2008(f)
|
|---|
| Australia | | 3.6 | | 2.5 | | 3.8 | | 3.7 | | 3.5 | | 3.4 | | 3.6 |
| Japan | | 0.2 | | 2.4 | | 1.3 | | 0.9 | | 1.9 | | 1.8 | | 1.9 |
| US | | 2.4 | | 2.7 | | 4.0 | | 3.5 | | 3.3 | | 3.3 | | 3.2 |
| Europe* | | 1.1 | | 1.0 | | 2.0 | | 2.1 | | 2.1 | | 2.0 | | 2.0 |
| Non-Japan Asia** | | 5.3 | | 4.3 | | 5.7 | | 5.7 | | 5.6 | | 5.4 | | 5.2 |
Trading partner growth |
|
2.8 |
|
2.7 |
|
3.6 |
|
3.5 |
|
3.5 |
|
3.4 |
|
3.4 |
- *
- UK, Germany, Italy, France (weighted by export share).
- **
- Korea, Taiwan, China, Malaysia, Hong Kong, Singapore (weighted by export share).
- (a)
- Actual.
- (e)
- Estimate.
- (f)
- Forecast.
However, other scenarios are also plausible. In the short term, for example, there is a risk that Consensus Forecasts are underestimating the momentum that major economies—and particularly the US—are building up. If this were the case, trading partner growth could be materially higher than that underpinning the central forecast over the next year or so.
Figure 1.8—Quarterly GDP growth
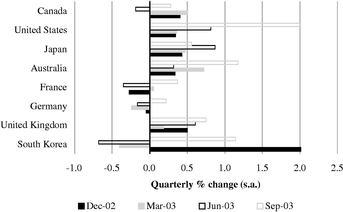
Sources: Datastream, The Treasury
Alternatively, the rebound in growth currently underway could give way to weaker growth, either because of unforeseen shocks or because of structural imbalances present in some countries acting as a constraint to ongoing growth.
For instance, the US has large government budget and current account deficits. These look to be a factor behind the current depreciation in the US dollar. Thus far the decline has been orderly and a necessary part of unwinding these imbalances, but if sentiment around lending to American consumers and businesses were to change significantly for the worse a less benign adjustment path is possible. This could make exporters in other countries uncompetitive (especially if the exchange rate adjustment is pushed onto a small group of countries) and lead to sharply reduced export earnings and in those
countries where economic recoveries are fragile (like Europe and Japan), spark a relapse into slow growth or recession. Moreover, some of these countries also face their own structural challenges with regard to increasing trend growth above the 2% level that many see currently (see table above).
A retreat from open markets would also lead in the same direction, hurting future productivity and growth prospects in developed countries as well harming global development objectives.
Forecasts to June 2005
The pace and composition of GDP growth are expected to change gradually over the next two years
Through to mid-2004 the economy is forecast to record robust, though moderating growth. From mid-2004, a period of slower growth is forecast, and the gap between household and business spending growth and export earnings growth is expected to begin to close. The amplitude of the economic cycle will seem quite small by historical standards, but this will conceal larger—partly offsetting—movements of the components of GDP.
Figure 1.9—Forecasts of GDP components
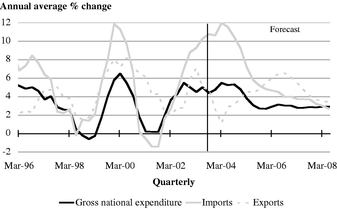
Sources: Statistics New Zealand, The Treasury
The exact timing and depth of the growth slowdown are sources of uncertainty in this forecast. An alternative scenario, incorporating a more substantial slowing of growth, is examined in Chapter 3.
Business and household spending will continue to provide the short-term impetus...
Household spending and business investment will continue to increase rapidly.
Steady employment growth is expected to continue, keeping the unemployment rate at current levels, which are the lowest in over a decade. And because employees will be harder to find, annual wage inflation is forecast to pick up too.
The residential construction boom is projected to persist. House prices are likely to continue to head upward at a fast rate, partly owing to the momentum they have built up already, and this is predicted to contribute directly to greater household wealth.
Business investment is forecast to benefit from a relatively low cost of capital, but also the commencement of investment projects which were delayed during the period of slower growth—and increased economic uncertainty—in the first half of 2003. Relatively high rates of capacity utilisation and healthy corporate balance sheets are also reasons for more business investment.
The healthy state of domestic demand, combined with low import prices, will push import volumes steadily upward.
Meanwhile, export volumes will begin to grow again following the contraction during the June quarter. But the recovery will not be underpinned by rising earnings, because prices will still be weak.
Global economic growth is expected to be more firmly established by this time, and this should boost demand for New Zealand's exports, but the high and rising exchange rate will undermine New-Zealand-dollar returns.
As a consequence of the continuing uneven performance of the economy, with domestic demand pulling in imports and export growth still not convincing, the annual current account deficit is expected to exceed 5.5% of GDP by the middle of 2004, with the quarterly deficit at 6.0% of GDP.
The CPI annual inflation rate is expected to rise over the next nine months too, from the current rate of 1.5% to about 2.0%, despite only modest quarterly increases in December and March, and even though import and export prices will be falling. Prices for housing and household operation will be rising particularly rapidly because of the residential property boom.
Figure 1.10—Consumer price inflation forecasts
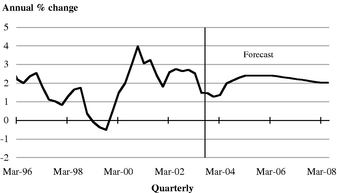
Sources: Statistics New Zealand, The Treasury
Because prices in some areas will have been rising rapidly for a prolonged period, there is a risk that inflation expectations will begin to be raised. Once changed, expectations can resist moving again. Consistent with the inflation outlook, the Reserve Bank is expected to increase its Official Cash Rate slightly over this period. Even so, the rate of inflation for non-tradable goods and services is expected to remain quite high for a prolonged period.
... but the economy will lose some momentum from the September quarter of 2004
By mid-2004, the rate of economic growth is expected to slow. Over the year ended June 2005, GDP growth of 2.5% is forecast, below the average of recent years although not especially low for the trough of an economic cycle.
A period of less house building and buying will be influential...
Growth in house prices and new house construction is forecast to run its course over 2004 and some modest falls in activity are expected in 2005. The housing cycle will be the second greatest negative influence on GDP growth over the year to June 2005, behind the rising volume of imports.
As house prices stop rising, further household wealth growth will be constrained. And to the extent that households were counting on further capital gains, spending plans are likely to be cut back.
Employment growth is also forecast to be relatively slow from mid-2004, as businesses look to maintain profitability in the face of slower overall economic growth and higher wages.
Businesses are likely to cut back on investment as well as employment, although investment will still grow faster than GDP. The price of imported capital equipment will still be low, particularly relative to labour costs, and firms will be making an effort to increase labour productivity by building up the capital stock.
... and the improvement in exporters' prospects will be gradual at this stage
Exporters will begin to see an improvement in their incomes over 2004/05, as export prices (in New Zealand dollars) rise. Export volumes will also grow steadily, but still not as fast as import volumes until the following year. Recovering exports of dairy products and services (tourism) will provide a solid base for growth.
Reasons for slower growth will include fewer immigrants and more debt
The net number of migrants is assumed to decline from about 40,000 per year now to 15,000 by June 2005 and 10,000 at the beginning of 2006. This will translate directly into slower population growth, with a consequent effect on the demand for housing, as well as for other goods and services. This is likely to be a key influence on house construction and prices over the period of slower GDP growth.
Figure 1.11—Net immigration
Sources: Statistics New Zealand, The Treasury
Other housing-related variables are also relevant, however. Interest rates will be marginally higher, and households in aggregate have built up significant debt to finance investment in housing and consumption over recent years. In an environment in which house prices are no longer increasing, and slower population growth is increasing the chance of rental housing lying empty, higher debt servicing costs are likely to mean households will cut back on discretionary spending.
But government spending will provide some support...
Government consumption and investment are expected to increase steadily through the whole forecast. Non-market investment is likely to be boosted by infrastructure investment, including spending on roads, although the precise timing and magnitude are uncertain.
... and the seeds of an export recovery will have been sown
The exchange rate is assumed to decline from about June 2004. The exchange rate path used in the forecasts is purely technical, but a decline at some stage over the forecast period would be consistent with a growing balance of payments deficit, a smaller gap between New Zealand's GDP growth and that of New Zealand's trading partners, and reduced interest rate differentials.
The lower exchange rate will eventually lead to a gradual reduction of the real net export deficit, as export and import prices increase. This is unlikely to happen before the end of 2005, but there will be some signs of improved export earnings and volumes before that.
Export volumes will not respond faster because many exporters have exchange rate hedges in place, and because it takes time to increase productive capacity, particularly in the agricultural and silvicultural industries.
Similarly, import volumes will continue to increase steadily over much of 2005, because it will take time for households and businesses to find domestic sources of production for some goods and services previously imported. In some cases, those sources of production will not exist and will need to be established.
Higher export and import prices will contribute to steady CPI inflation over 2005, in spite of lower housing costs.
Quarterly GDP growth is not expected to slow dramatically
Through the entire period of slower economic growth—from mid-2004 to mid-2005—it is important to note that the quarterly GDP growth rate is not expected to be slower than 0.5%. This is only slightly below the long-term average of about 0.8%.
The growth recession is therefore mild.
Figure 1.12—GDP growth
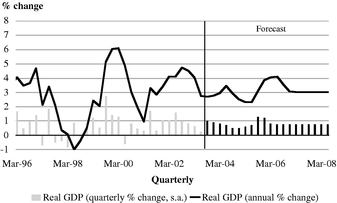
Sources: Statistics NZ, The Treasury
But as noted earlier, this does conceal some larger cyclical movements of the different components of GDP. The annual Gross National Expenditure growth rate is expected to slow from more than 5% in mid-2004 to about 3% by mid-2005. And the contribution of net exports to total GDP will move from a strongly negative one to one that is almost neutral.
Over the year to June 2005, nominal GDP growth will be 5.0%. Slower real economic growth will be partly offset by higher inflation, as import and export prices rise.
Recent Labour Market Developments
Statistics New Zealand and business survey data through 2003 has shown a labour market characterised by strong employment growth, high participation rates, and very low unemployment, combined with moderate wage pressure.
Together the latest Quarterly Employment Survey and Household Labour Force Survey results show a labour market continuing to operate with little slack. Fulltime equivalent employment grew 2.5% in the year to September, with an increase of 1.4% in the September quarter. The big sectoral employment gains have tended to come from the non-tradable sector, which is consistent with the sources of GDP growth. To date, however, wage inflation has risen only slightly. A further mild increase is forecast (to over 4% from the current 3.1% pace), but wage outturns appear well anchored.
The impact of fast employment growth on overall labour market conditions has been somewhat eased by high participation rates, currently at 66.6%. The ongoing strength of the labour market has pulled additional people into the labour force, particularly women.
With strong increases in employment, the seasonally adjusted unemployment rate fell to 4.4% in the September quarter. The unemployment rate is at its lowest level since December 1987 when it was 4.2% and is the 5th lowest rate in the OECD. The extent to which these low levels of unemployment flow through to wages represents a key area of uncertainty in these forecasts.
The rate of unemployment that the economy can sustain without a marked increase in wage or price pressure is commonly referred as the NAIRU—or non-accelerating inflation rate of unemployment. In other words, at what level of unemployment will wage or price inflation begin to rise? If the NAIRU falls over time then medium term trend growth will rise as the workforce can increase (and vice versa) without generating extra inflation.
New Zealand's current low unemployment rate combined with wage and price developments raises the question about whether it has fallen below its NAIRU. While estimation of the NAIRU is imprecise as it cannot be directly observed, it appears to have changed over time. Work by the OECD published in 2000 suggested that New Zealand's NAIRU may have fallen by around 1/2% per annum over the last decade.
Figure 1.13—A range of NAIRU estimates using the Kalman filter
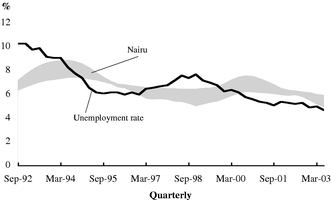
Sources: Statistics New Zealand, The Treasury
More recent work by the Treasury backs this up and is suggestive of structural unemployment continuing to fall over recent years. The analysis used a number of models of the NAIRU with different model specifications and various measures of inflation. The filtering process uses the rule that stable inflation implies an unemployment rate that is at the NAIRU but rising (falling) inflation is suggestive of an unemployment rate that is below (above) the NAIRU. Figure 1.13 indicates the range estimates generated using Kalman Filter specifications (note that these estimates also have large standard error bands around them).
The results indicate that: the concept of the NAIRU appears to be valid to the extent that estimates indicate that the rate of unemployment does have some impact on inflation; the spread of results indicates that estimates of the NAIRU are imprecise; and the NAIRU appears to have fallen over the estimation period.
While the modelling process does not examine the reasons for a falling NAIRU, there are a number of plausible factors that may have contributed, including strong growth, population demographics, labour market reforms, improved information technology and matching services from Work and Income New Zealand reducing frictional unemployment, and more appropriate skills.
A falling structural unemployment rate is included as one of the scenarios in the Risks and Scenarios chapter.
2005/06 and the Medium-term Outlook
From mid-2005, economic conditions and growth are expected to become more balanced
Economic growth is forecast to rebound to around 31/2% over 2005/06 and 2006/07, with the negative contribution net exports made from 2001/02 to 2004/05 disappearing, and domestic demand growth stabilising.
Over 2005 and 2006, export earnings will accelerate
From about the end of 2005, export earnings and the volume of exports are expected to begin to increase rapidly. Nominal growth of 9.2% over the year to March 2006 and real growth of 6.1% will be higher than the averages (5.7% and 4.9% respectively) for the period since 1990.
Exporters will have had time to increase production to take advantage of the higher prices which will have been prevailing for several quarters by this time.
Domestic spending will also increase steadily, although not as fast as export earnings
Consumer and business spending will also grow faster over the end of 2005 and in 2006, following the period of sluggishness in the previous year. But rather than returning to the rapid rates of 2003/04, consumption and investment growth is likely to return only to the long term average.
Employment growth will remain gradual rather than impressive over this period, partly because annual wage inflation is forecast to persist at 31/2% or so, encouraging businesses to keep improving labour productivity. But the unemployment rate will start to edge down from 5.0%, which it reached during the period of slower growth in 2004/05.
A lower exchange rate and a sustained global recovery will help achieve this balance
More balanced growth—with net exports making a slightly positive contribution to overall GDP growth—will be largely the result of global economic growth and the exchange rate acting as less of a drag on growth.
By 2006, the TWI is assumed to have fallen to less than 60.0, and will be steadily declining.
Meanwhile, household and business spending will be rising slightly faster.
By 2007/08, both the rate and composition of growth are assumed to be back to "normal"...
Because it is not possible to predict unexpected shocks, and because the effects of past shocks will have mostly worked their way through the economy, forecasts for the latter year or so of the forecast period flow from assumptions made about the long-term determinants of economic growth.
By 2007/08, domestic demand is forecast to be growing at approximately the same rate as total GDP, and the real value of net exports is predicted to be close to zero. Real GDP growth of 3.0% is forecast, and nominal GDP growth will be rising at a rate of approximately 5% per annum.
Real GDP growth will come from approximately equal parts labour force growth, capital stock growth, and multi-factor productivity. This is in line with the contributions observed over the last decade.
Figure 1.14—Contributions to annual average GDP growth
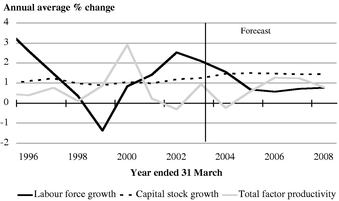
Sources: Statistics New Zealand, The Treasury
Employment and labour force growth are assumed to have stabilised, with the unemployment rate settling at just under 5%, around the level at which wage inflation is expected to be relatively stable. However, it is acknowledged that wage pressures could be either stronger than forecast, or weaker. The effects of an ongoing fall in the rate of unemployment the economy can sustain without generating increased inflation are considered in Chapter 3. Also see the box, "Recent labour market developments and implications" on page 26.
The balance of payments deficit will be about 5% of GDP, which is expected to be sustainable over the long run without increasing the nation's debt-to-GDP ratio.
CPI inflation is forecast to gradually decline to about 2% per year, the mid-point of the Reserve Bank's 1-3% target.
... because many of the determinants of growth will be "at trend"
The contribution of net migration to population is assumed to have stabilised at around 10,000 people per year.
Interest rates are expected to be at "neutral" levels of around 53/4% for short-term rates and 6% for long-term rates. The exchange rate (TWI) is also expected to have moved down to its assumed equilibrium of around 57.
Figure 1.15—Investment to GDP ratio (excluding housing investment)
Sources: Statistics New Zealand, The Treasury
The rate of global economic growth will be approximately the same as the historical average. Furthermore, it will have been there for some years.
The capital-to-labour ratio is expected to rise over the whole forecast period. With real wage inflation running at around 1.5% per year over much of the forecast, and the price of imported capital equipment rising by considerably less, there is expected to be an incentive to increase investment.
The other ratio which is expected to still be changing at the end of the forecast period is the household debt-servicing ratio. Household spending is forecast to outpace disposable income growth consistently. At some point the gap between the two may prompt households to cut back their spending significantly.
Fiscal Impulse and Structural Fiscal Balances
The government's spending actions show up in the economic forecasts discussed in this Chapter in a number of ways. Public consumption incorporates government spending on employees and purchases of other goods and services, including military equipment. Non-market investment includes new physical investment undertaken by the government in areas like education, health and on roads. Other government spending such as transfers (e.g., New Zealand Superannuation and unemployment benefits) flows through the household sector and into private consumption. In addition, the government withdraws money from the economy through income tax, corporate tax and GST.
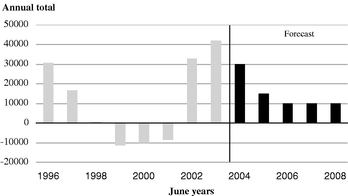
Fiscal impulse is a measure of whether changes in fiscal policy are adding to, or subtracting from, aggregate demand pressures in the economy. In Figure 1.16, a positive fiscal impulse represents a tightening of policy relative to the previous year. The fiscal impulse indicator presented here removes estimated cyclical influences and net interest payments to provide a measure of "discretionary" fiscal policy changes. Fiscal impulse is calculated as the change in the estimated structural primary cash balance. (The concept of a structural fiscal balance is discussed below.) The fiscal impulse indicator treats selected capital items as components of expenditure and is derived from (Core Crown) cash flow information.
Figure 1.16—Estimates of fiscal impulse
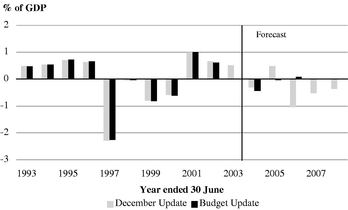
Sources: Statistics New Zealand, The Treasury
Indicators based on fiscal aggregates have limitations. At best they can only provide an indication of the first round impact of changes in fiscal policy. They focus only on the net impact of tax and spending decisions and so do not take into account the composition of changes in fiscal policy. Aggregate indicators do not allow for any supply side effects of the fiscal policy change (which may be relevant for the assessment of inflationary impacts).
Ex post estimates of fiscal impulse may differ from the ex ante (or "real time") view because of revisions to the evolution of the structural component of the fiscal balance and changes in the implementation of spending plans. For example, the Budget Update estimate of fiscal impulse for the year ended June 2003 was neutral. Subsequent information suggests the outturn provided a small contractionary impulse. Forecast impulses across the years 2005 to 2008 are on average expansionary, at around a third of a percent of GDP. Fiscal impulses are sensitive to the cyclical adjustment and the
removal of net interest payments. For example, removing the forecast cycle and net interest impact for the year ended June 2006 reduces the impulse by just under 1/2 percent of GDP.
The fiscal forecasts in the next Chapter focus on aggregates such as the OBERAC. The structural (or cyclically-adjusted) fiscal balance adjusts the actual fiscal balance for fluctuations of output around trend output. This provides a picture of the underlying fiscal position—that is, what the fiscal balance would be if the economy was operating at trend.(1)
- (1)
- Treasury's approach to estimating structural fiscal balances and fiscal impulses is set out in Treasury Working Papers 01/10 and 02/30. The 2002 December Update discussed some of the alternative techniques used to estimate trend output.
The forecast fiscal surplus (not shown) is close to the forecast structural surplus because forecast deviations from trend output are relatively small. The increase in the structural fiscal surplus relative to the Budget Update reflects the view that the increase in tax revenues seen over the past few years is likely to be more structural than previously thought. Figure 1.17 also indicates that changes to fiscal plans in the latter years of the forecast period result in a change in the trajectory of the structural balance (see the 2004 Budget Policy Statement).
Figure 1.17—Estimates of the structural fiscal balance, OBERAC basis (ex net NZS Fund returns)
Sources: Statistics New Zealand, The Treasury
Fiscal Forecasts—Finalisation Dates and Key Assumptions
Finalisation Dates
| Economic outlook (refer Chapter 1) | | 21 November |
| Tax revenue forecasts | | 27 November |
| Fiscal forecasts | | 8 December |
| Government decisions and circumstances | | 8 December |
| Actual asset revaluations | | 31 October |
| Foreign exchange rates | | 31 October |
| Specific fiscal risks (refer Chapter 4) | | 8 December |
| Contingent liabilities and commitments (refer Chapter 4) | | 31 October |
Key assumptions
The fiscal forecasts have been prepared in accordance with the Fiscal Responsibility Act 1994. They are based on the Crown's accounting policies and assumptions (refer page 88 of the GAAP tables). As with all assumptions, there is a degree of uncertainty surrounding them. This uncertainty increases as the forecast horizon extends. A summary of the key economic assumptions that are
particularly relevant to the fiscal forecasts is provided below (on a June-year-end basis to align with the Crown's balance date of 30 June):
| | 2003/04
| | 2004/05
| | 2005/06
| | 2006/07
| | 2007/08
|
|---|
June Years
|
|---|
| | BEFU
| | DEFU
| | DEFU
| | DEFU
| | DEFU
| | DEFU
|
|---|
| Real GDP (P) (ann avg % chg) | | 2.1 | | 3.0 | | 2.5 | | 3.8 | | 3.2 | | 3.0 |
| Nominal GDP (E) ($m) | | 134,034 | | 136,112 | | 142,932 | | 150,944 | | 158,512 | | 166,744 |
| CPI (ann avg %) | | 1.7 | | 1.5 | | 2.3 | | 2.4 | | 2.2 | | 2.1 |
| Govt 10-year bonds (qty avg %) | | 6.2 | | 6.4 | | 6.3 | | 6.0 | | 6.0 | | 6.0 |
| 90-day bill rate (qty avg %) | | 5.3 | | 5.6 | | 5.8 | | 5.8 | | 5.8 | | 5.8 |
Unemployment rate (HLFS) basis
(ann avg %) | | 5.5 | | 4.4 | | 4.7 | | 4.9 | | 4.8 | | 4.8 |
Full-time equivalent employment
(ann avg %) | | 1.0 | | 3.2 | | 0.9 | | 1.1 | | 1.4 | | 1.4 |
| Current account (% of GDP) | | -5.1 | | -5.7 | | -6.1 | | -5.6 | | -5.7 | | -5.2 |
Source: The Treasury
New Zealand Superannuation (NZS) Fund
The estimated annual contribution to the NZS Fund for the year ending 30 June 2005 is $1.979 billion. The contribution to the NZS Fund is calculated over a 40-year rolling horizon to ensure superannuation entitlements over the next 40 years could be met if the contribution rate were to be held constant at that level for 40 years.
The Government is making the required annual contribution for 2003/04 as calculated by the formula set out in the NZS Fund Act.
$ billion (June year end)
| | 2002
| | 2003
| | 2004
| | 2005
| | 2006
| | 2007
| | 2008
|
|---|
| Required contribution | | N/A | | N/A | | 1.879 | | 1.979 | | 2.156 | | 2.265 | | 2.410 |
| Intended contribution | | 600 | | 1.200 | | 1.879 | | 1.979 | | 2.156 | | 2.265 | | 2.410 |
The underlying assumptions in calculating the contribution are the nominal GDP series to 2048, the New Zealand Superannuation (NZS) expense series to 2048, and the expected long run net after-tax annual return of the NZS Fund (6.8%) (7.0% Budget Update). The forecast rate-of-return is based on the forecasts of the Guardians of NZS. The GDP and NZS expense series were projected using the assumptions stated on page 29 of the 2003 FSR.
The Treasury website contains further information on the NZS Fund, as well as a copy of the NZS Fund model.
2
Fiscal Outlook
Summary of the December Update
The forecast fiscal outlook is stronger in the earlier forecast years than that contained in the Budget Update. Key influences on the operating balance/OBERAC and debt tracks include:
- •
- a stronger starting position due to higher-than-forecast OBERAC and cash flows in 2002/03
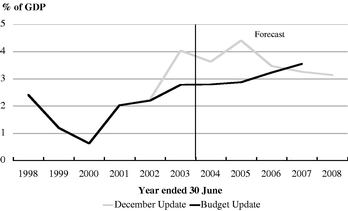
Figure 2.1—OBERAC comparison
Source: The Treasury
- •
- a slightly stronger actual and forecast economic position, resulting in lower benefit expenses and stronger tax revenues; tax revenues are also forecast to be higher based on recent outturns indicating a stronger corporate tax base
- •
- the Government's decision to increase spending consistent with the proposals in the 2003 FSR, produces a relatively flat OBERAC trend from 2005/06 onwards, compared to a rising profile in the Budget Update. The extent of the change is outlined in the 2004 BPS and on page 43.
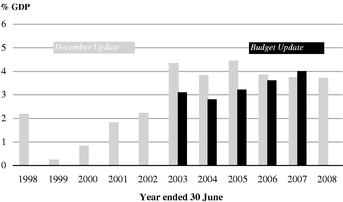
Figure 2.2—Core Crown revenue growth and expense growth (excluding Government Superannuation Fund (GSF) valuation)
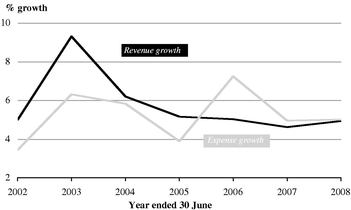
Source: The Treasury
These influences translate into:
- •
- an OBERAC forecast at $5.2 billion (3.8% of GDP) in 2003/04; lower than last year largely due to Crown entity surpluses (excluding valuations) expected to be lower in 2003/04
- •
- an OBERAC that rises in 2004/05 to 4.4% of GDP ($6.3 billion) due to revenue growth outpacing expense growth, before decreasing to 3.8% of GDP in 2005/06 as the trend reverses
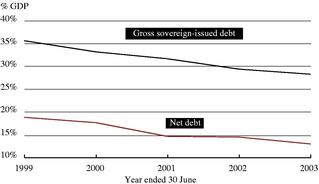
Figure 2.3—Debt comparison
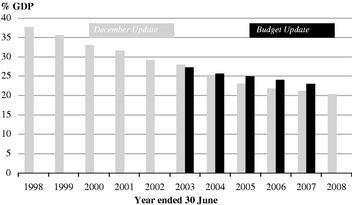
Source: The Treasury
- •
- an improved net cash position from 2002/03 and 2003/04 reduces debt during 2003/04 compared with the Budget Update
- •
- in nominal terms, debt is forecast to decrease from $36 billion towards $33 billion by 2005/06 (due to the improved cash position from last year and the current year). Over the remaining forecast horizon debt remains stable between $33 billion and $34 billion
- •
- gross sovereign-issued debt is forecast to fall from 28% of GDP in 2002/03 to 20.4% of GDP by 2007/08
- •
- as a result of the improved overall cash position through last year and the current year, the Government's domestic bond programme has been lowered for 2003/04 to $2.2 billion (from $3.2 billion). In addition, the forecast bond programme for 2004/05 has also been lowered to $2.3 billion (from $3.5 billion)
- •
- Tables of the key indicators are located on pages 44 and 45.
Key Trends
OBERAC rises before flattening towards the end of the forecast horizon ...
The OBERAC is forecast at $5.2 billion (3.8% of GDP) in the current year, rising to $6.3 billion (4.4% of GDP) in 2004/05 before reducing to between $5.8 billion and $6.2 billion (3.7% of GDP) by 2007/08. The OBERAC, as a percentage of GDP, falls from 2004/05 due to the inclusion in the forecasts of additional new spending (previously signalled in the 2003 FSR).
The amount of additional spending included in the fiscal forecasts is more than signalled in the 2003 FSR, however the tax forecasts are also higher and so the OBERAC remains above 3% of GDP.
... enabling the Government to apply operating cash flows to its investment programme ...
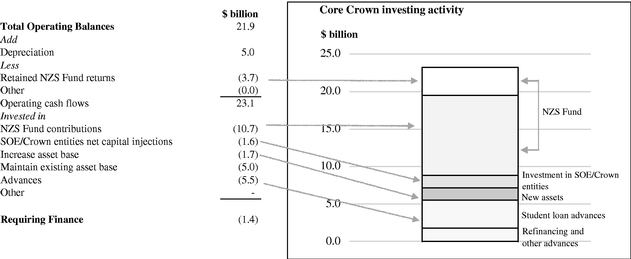
The core Crown operating balance sums to around $21.9 billion over the 2003/04 to 2007/08 period, which generates cash for the core Crown of around $23.1 billion over the same period.
As outlined in Table 2.1, this cash is invested primarily in NZS Fund contributions of $10.7 billion, advances of $5.5 billion (mainly student loans and refinancing existing private sector debt of the health and housing sectors) and purchases of physical assets of $6.7 billion (schools, hospitals, defence equipment, for example). There is a residual financing requirement of around $1.4 billion, which is primarily met by reducing the holdings of marketable securities and deposits which have accumulated from 2002/03. To see the year-on-year capital programme relative to the annual OBERAC and operating cash flows, refer to figure 1 in the BPS.
Table 2.1—Impact of core Crown operating surpluses on the balance sheet from 2003/04 to 2007/08
Source: The Treasury
... while gross debt as a percentage of GDP continues to fall
Gross sovereign-issued debt falls in nominal terms until 2004/05, and then remains relatively stable between $33 billion and $34 billion. As a percentage of GDP, debt falls from 28% in 2002/03 to 20.4% by 2007/08.
Figure 2.4—Gross sovereign-issued debt (% of GDP and $ million)
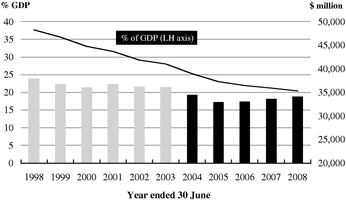
Source: The Treasury
The initial decrease in debt reflects surplus cash from the strong OBERAC results in 2002/03 and the expected result in 2003/04, and then remains flat as the cash flows from the OBERAC and surplus financial assets are broadly sufficient to fund all capital spending.
Net Crown debt reduces over the forecast horizon from around 13% of GDP in 2002/03 towards 8% of GDP by 2007/08.
The improved cash position for 2002/03 and 2003/04 has resulted in a decrease to the Government's 2003/04 and forecast 2004/05 bond programmes. The improved cash position (reflected in holdings of financial assets) has effectively been spread over the two programmes. The 2003/04 bond programme has been reduced to $2.2 billion, compared with $3.2 billion at the Budget Update. The forecast 2004/05 programme has been reduced to $2.3 billion from the $3.5 billion previously forecast.
Comparison of OBERAC with Budget Update
Compared with the Budget Update the OBERAC was stronger in 2002/03 than forecast and is expected to be stronger in 2003/04 and 2004/05, largely reflecting improvements to tax revenue.
From 2005/06, the OBERAC/operating balance is broadly similar in nominal terms to the Budget Update forecasts, reflecting improved tax revenues and SOEs'/Crown entities' surpluses, offset by increases to forecast new spending. However, the OBERAC is flatter as a percentage of GDP, whereas the Budget Update forecasts had a rising profile.
Table 2.2—Operating balance reconciliation (explains changes to the operating balance since the Budget Update)
($ million)
| | 2002/03
Actual
| | 2003/04
Forecast
| | 2004/05
Forecast
| | 2005/06
Forecast
| | 2006/07
Forecast
| |
|---|
| Operating balance 2003 Budget Update | | 1,361 | | 3,761 | | 4,474 | | 4,929 | | 6,181 | |
| Changes (core Crown revenues and net SOEs/CEs) | | | | | | | | | | | |
| Tax revenue forecasting changes | | 395 | | 1,600 | | 1,741 | | 1,730 | | 1,727 | |
| Other sovereign revenue | | (13 | ) | 70 | | 123 | | 113 | | 99 | |
| Investment income | | 420 | | 154 | | 274 | | 332 | | 302 | |
| Other revenue | | 135 | | 41 | | 86 | | 80 | | 90 | |
| Other change to SOEs and Crown entities (excluding ACC valuation change) | | 637 | | 179 | | 225 | | 634 | | 310 | |
| Valuation changes (GSF and ACC liability movements) | | (889 | ) | 694 | | — | | — | | — | |
Changes (core Crown expenses excl GSF 2003/04) |
|
|
|
|
|
|
|
|
|
|
|
| Change to future operating spending | | — | | — | | (383 | ) | (1,572 | ) | (2,367 | ) |
| Welfare benefits | | 47 | | 233 | | 401 | | 270 | | 237 | |
| Education | | 136 | | 37 | | (28 | ) | (112 | ) | (143 | ) |
| Health | | 85 | | (69 | ) | (22 | ) | (21 | ) | 76 | |
| Transport | | (4 | ) | (119 | ) | (67 | ) | (82 | ) | (150 | ) |
| Other core Crown functional expenses | | (36 | ) | (288 | ) | (467 | ) | (490 | ) | (433 | ) |
| Finance costs | | (308 | ) | (201 | ) | (19 | ) | (16 | ) | (11 | ) |
| | |
| |
| |
| |
| |
| |
| Total core Crown expense change | | (80 | ) | (407 | ) | (585 | ) | (2,023 | ) | (2,791 | ) |
| | |
| |
| |
| |
| |
| |
| Total Changes | | 605 | | 2,331 | | 1,864 | | 866 | | (263 | ) |
| | |
| |
| |
| |
| |
| |
| Operating balance 2003 December Update | | 1,966 | | 6,092 | | 6,338 | | 5,795 | | 5,918 | |
Source: The Treasury
Major changes to the components within the operating balance forecasts include:
- •
- tax revenue is higher over the forecast horizon. The following section contains an outline of the reasons for the improved tax forecasts
- •
- the SOE and Crown entity surpluses were higher in 2002/03, reflecting strength in SOEs and surpluses in the transport sector (as more was spent on capital rather than operating activity for example). From 2003/04 forward, the improvement against Budget Update is more muted, largely reflecting a mix of higher SOE forecasts and the transport sector forecasting to spend more of its revenue on capital expenditure rather than operating (which is debt neutral)
- •
- the valuation of the GSF and ACC unfunded liabilities are lower in 2003/04 compared with the Budget Update, primarily due to the increase in discount rates since the time of the Budget valuations, partially offset by updated scheme data for the GSF liability calculation
- •
- future new operating spending has been increased from previous forecasts from 2004/05 onwards, reflecting the Government moving on its previously signalled intentions to increase spending should economic and fiscal conditions continue as previously forecast (some of which has already been allocated to baselines). Refer page 43 for further details
- •
- welfare benefit costs are lower over the forecast period primarily through lower unemployment benefits reflecting lower unemployment levels than forecast in the Budget Update
- •
- transport expenses have increased reflecting forecast changes, though these are somewhat offset by additional revenues
- •
- net finance costs (investment income less finance costs) are effectively lower across the forecast horizon, reflecting a lower net debt position. While this appears to be reflected in higher investment income rather than lower finance costs, the movements since the Budget Update also reflect a gross up to both investment income and finance costs (reflecting a change in disclosure)
- •
- the change in other functional expenses (education, health and other core Crown functional expense in Table 2.2) represent forecast changes largely driven by demographics (impacting on GSF expenses and education expenses) and the specific allocation of new policy spending since the Budget Update (refer Table 2.3).
Table 2.3—Specific decisions for new policy since the 2003 Budget Update
($ million)
| | 2003/04
| | 2004/05
| | 2005/06
| | 2006/07
|
|---|
| Review of Child Youth and Family Services | | 29 | | 61 | | 66 | | 66 |
| Large budget film subsidies | | 40 | | 40 | | 40 | | 40 |
| State sector employment based superannuation | | 1 | | 19 | | 33 | | 33 |
| NZDF contribution to operation enduring freedom | | 28 | | 5 | | — | | — |
| Solomon Islands deployment | | 22 | | 5 | | — | | — |
| Painted Apple Moth | | 24 | | — | | — | | — |
| Other decisions | | 199 | | 177 | | 162 | | 118 |
| | |
| |
| |
| |
|
| Total decisions since the 2003 Budget Update (GST inclusive) | | 342 | | 307 | | 301 | | 257 |
Source: The Treasury
Revenue and Expenses
Table 2.4—Revenue and expenses comparison with Budget Update
Revenue and Expenses
(% of GDP)
| | 2003
Actual
| | 2004
Forecast
| | 2005
Forecast
| | 2006
Forecast
| | 2007
Forecast
| | 2008
Forecast
|
|---|
| Core Crown Revenue | | | | | | | | | | | | |
| December Update | | 33.9 | | 34.0 | | 34.1 | | 33.9 | | 33.8 | | 33.7 |
| Budget Update | | | | 33.2 | | 32.9 | | 33.0 | | 33.1 | | |
Total Tax Revenue |
|
|
|
|
|
|
|
|
|
|
|
|
| December Update | | 30.9 | | 31.0 | | 30.9 | | 30.5 | | 30.2 | | 30.1 |
| Budget Update | | | | 30.3 | | 30.0 | | 30.0 | | 29.8 | | |
Total Crown Revenue |
|
|
|
|
|
|
|
|
|
|
|
|
| December Update | | 44.3 | | 43.7 | | 44.2 | | 43.9 | | 43.6 | | 43.3 |
| Budget Update | | | | 42.7 | | 42.6 | | 42.6 | | 42.5 | | |
Core Crown Expenses |
|
|
|
|
|
|
|
|
|
|
|
|
| December Update | | 32.4 | | 30.8 | | 30.7 | | 31.2 | | 31.2 | | 31.1 |
| Budget Update | | | | 31.1 | | 30.7 | | 30.4 | | 30.1 | | |
Total Crown Expenses |
|
|
|
|
|
|
|
|
|
|
|
|
| December Update | | 42.9 | | 39.3 | | 39.8 | | 40.1 | | 39.9 | | 39.6 |
| Budget Update | | | | 40.0 | | 39.5 | | 39.1 | | 38.5 | | |
Source: The Treasury
Over the forecast period, the total Crown revenue-to-GDP and expenses-to-GDP ratios are reasonably stable, though tend to drift down slowly.
The revenue-to-GDP trend of the total Crown is driven mainly from the trend in "core Crown" revenue forecasts, which are discussed in more detail under tax revenue.
The core Crown expenses-to-GDP ratio rises marginally in 2005/06 reflecting the impact of the increased budget package (refer following expense section) and then levels out at around 31.2% of GDP.
Tax Revenue
Table 2.5—Tax revenue indicators
Tax Revenue
| | 2003
Actual
| | 2004
Forecast
| | 2005
Forecast
| | 2006
Forecast
| | 2007
Forecast
| | 2008
Forecast
|
|---|
| ($ million) | | | | | | | | | | | | |
| Total Crown | | 39,785 | | 42,251 | | 44,114 | | 46,043 | | 47,944 | | 50,140 |
(% GDP) |
|
|
|
|
|
|
|
|
|
|
|
|
| Total Crown | | 30.9 | | 31.0 | | 30.9 | | 30.5 | | 30.2 | | 30.1 |
Source: The Treasury
The tax revenue forecasts have been increased substantially in every year of the forecast period.
Table 2.6—Change in tax revenue forecasts since Budget Update
($ million)
| | 2002/03
Actual
| | 2003/04
Forecast
| | 2004/05
Forecast
| | 2005/06
Forecast
| | 2006/07
Forecast
| |
|---|
| Tax revenue 2003 Budget Update Changes | | 39,390 | | 40,651 | | 42,373 | | 44,313 | �� | 46,217 | |
| Corporate taxes | | 234 | | 897 | | 694 | | 756 | | 778 | |
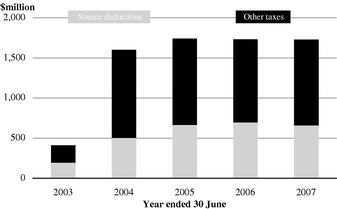
| Source deductions | | 194 | | 501 | | 662 | | 694 | | 658 | |
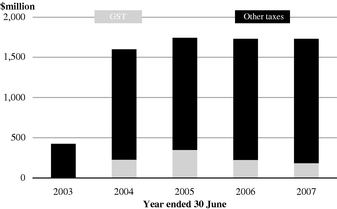
| Goods and services tax | | (28 | ) | 224 | | 347 | | 219 | | 183 | |
| Resident withholding tax | | 38 | | 89 | | 90 | | 77 | | 77 | |
| Other persons tax | | (63 | ) | (166 | ) | (138 | ) | (127 | ) | (91 | ) |
| Other | | 20 | | 55 | | 86 | | 111 | | 122 | |
| Total Changes | | 395 | | 1,600 | | 1,741 | | 1,730 | | 1,727 | |
| | |
| |
| |
| |
| |
| |
| Tax Revenue 2003 December Update | | 39,785 | | 42,251 | | 44,114 | | 46,043 | | 47,944 | |
Source: The Treasury
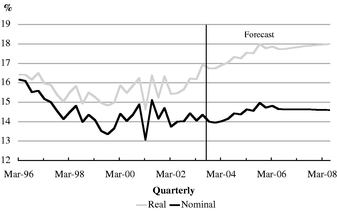
Tax-to-GDP higher than Budget Update
In the Budget Update forecasts, the ratio of tax to GDP was expected to peak at 30.7% in 2002/03. At the time, we believed that the sudden, sharp rise in the tax-to-GDP ratio was something of an anomaly and that the spike would eventually be smoothed out by a combination of revisions to GDP and a moderation in future tax revenue growth.
Figure 2.5—Ratio of total tax revenue to nominal GDP
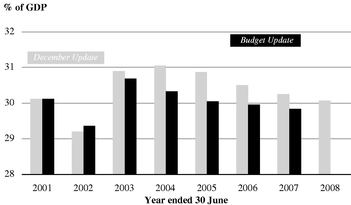
Source: The Treasury
Since the Budget Update, more data has come to hand that indicate the tax-to-GDP ratio may persist at its current level for some time yet.
There are two tax types that are mainly responsible for the recent rise in the tax-to-GDP ratio:
- •
- A recent run-down of corporate tax losses has contributed to rapid company tax revenue growth.
- •
- A rise in the average tax rate coupled with strong labour market growth has spurred growth in source deductions.
These are discussed in more detail in the relevant sections below.
The ratio of tax to GDP gradually subsides after 2004/05. This is because we have decided to exercise a little caution in the later years of the forecast period. For instance, it remains to be seen whether or not company tax loss utilisation will remain at relatively low levels. A sudden build-up of losses can have an adverse effect on the tax take, as explained in the section on corporate taxes below.
Corporate taxes contribute the largest portion of the increase to the forecast ...
Figure 2.6—Change in corporate tax forecasts since Budget Update
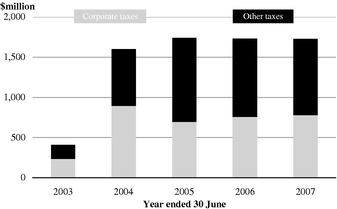
Source: The Treasury
As mentioned above, several new pieces of information have come to hand since the Budget Update forecasts were finalised:
- •
- Corporate tax outturns are running well ahead of forecast.
- •
- Provisional tax payments and assessments lodged for the 2004 tax year indicate that tax revenue for 2003/04 will be considerably higher than previously expected.
- •
- Annual tax returns lodged over the last six months or so indicate that the stock of tax losses available to be used to offset taxable income has dropped markedly over the last few years and is now much lower than previously thought.
Putting all of these factors together, the corporate tax forecast for 2003/04 is now about $900 million higher than at the Budget Update. With company profits forecast to continue to increase steadily each year, the relatively low level of loss utilisation is expected to persist, resulting in similar increases to the corporate tax forecast in the later years of the forecast period.
However, if the level of loss utilisation were to rise again, company tax could take a sharp fall, as happened in 1991, for instance, when losses built up in the early 1990s' recession contributed to a fall of nearly 30% in company tax. Since we are not certain of a continued low level of loss offset in the company tax base, we have taken a cautious approach to corporate tax growth further out. For this reason, forecast corporate tax growth is lower than forecast growth in corporate profits from 2005/06 onwards.
... and source deductions' forecasts are also much higher than Budget
Figure 2.7—Change in source deductions forecasts since Budget Update
Source: The Treasury
Source deductions' outturns to October are about $100 million above forecast. This follows on from 2002/03 when source deductions finished the year nearly $200 million above forecast.
There appears to be two factors causing this:
- •
- PAYE outturns indicate a notable rise in the average tax rate on employees' remuneration.
- •
- Growth in the labour market has been higher than forecast in the Budget Update.
The current variance from forecast is expected to continue to grow, reaching about $500 million by the end of 2003/04. This lift in the base flows through to the later forecast years, where source deductions' forecasts have been increased by between $650 million and $700 million each year.
With the labour market growing at a faster rate than total GDP over the past few years, employees' compensation now makes up a bigger part of total GDP than before. Since employees' compensation has a higher effective tax rate than most other tax bases, this will tend to drive up the overall tax-to-GDP ratio. Employees' compensation is forecast to remain at about 40% of GDP throughout the forecast period.
The GST forecasts are also up...
Figure 2.8—Change in GST forecasts since Budget Update
Source: The Treasury
Although nominal consumption is more or less in line with expectations, growth in residential investment has continued to outpace the Budget Update forecasts, providing an extra boost to the GST base in 2003/04. Our current view is that GST will finish the year around $220 million above the Budget Update forecast.
Rises in the forecast levels of domestic consumption and residential investment drive up the GST forecasts for 2004/05 and beyond by between $180 million and $350 million.
... but other persons tax forecasts have been lowered
At the time of the Budget Update, there was some uncertainty around the income levels of taxpayers in the other persons tax base. The tax outturns have subsequently come in below forecast, mainly as a result of farmers expecting their tax liability for the 2004 tax year to be somewhat lower than we had forecast. Thus the other persons tax forecast has been reduced by about $170 million for 2003/04.
With income levels in subsequent years now expected to be lower than forecast in the Budget Update, the other persons tax forecast has also been reduced slightly in later forecast years.
Effects on the tax forecasts of tax policy changes
One of the proposed changes to the Fiscal Responsibility Act (which is being merged with the Public Finance Act) will be the requirement for an annual statement on new government tax decisions that materially affect the tax revenue forecasts. Although disclosure of such information is not yet required, it has been included in the December Update.
The only new tax decision to materially affect the December Update forecasts was the decision to remove the freeze on tariff rates from 1 July 2006. This is expected to reduce customs duty by $20 million in 2006/07 and $50 million in 2007/08.
Inland Revenue's tax forecasts
In line with established practice, Inland Revenue has prepared an independent set of tax forecasts, based in the short term on more detailed analysis of taxpayer information, and in the longer term reflecting the same underlying macroeconomic trends that underpin the Treasury's tax forecasts.
Differing views on individuals' taxes are the major point of difference between the two sets of forecasts in 2003/04 and 2004/05. From 2005/06 onwards, the total Inland Revenue and Treasury tax forecasts are relatively close to each other (also refer www.treasury.govt.nz/forecasts/defu/2003/).
Table 2.7—Treasury and Inland Revenue tax revenue forecasts
($ million)
| | 2003/04
Forecast
| | 2004/05
Forecast
| | 2005/06
Forecast
| | 2006/07
Forecast
| | 2007/08
Forecast
| |
|---|
| Individuals' Taxes | | | | | | | | | | | |
| Treasury | | 21,791 | | 22,886 | | 24,060 | | 25,243 | | 26,518 | |
| Inland Revenue | | 21,580 | | 22,626 | | 23,863 | | 25,173 | | 26,514 | |
| | |
| |
| |
| |
| |
| |
| Difference | | 211 | | 260 | | 197 | | 70 | | 4 | |
Corporate Taxes |
|
|
|
|
|
|
|
|
|
|
|
| Treasury | | 6,832 | | 6,994 | | 7,268 | | 7,431 | | 7,747 | |
| Inland Revenue | | 6,876 | | 7,036 | | 7,331 | | 7,553 | | 7,862 | |
| | |
| |
| |
| |
| |
| |
| Difference | | (44 | ) | (42 | ) | (63 | ) | (122 | ) | (115 | ) |
Goods and services Tax |
|
|
|
|
|
|
|
|
|
|
|
| Treasury | | 9,338 | | 9,824 | | 10,179 | | 10,625 | | 11,145 | |
| Inland Revenue | | 9,304 | | 9,816 | | 10,206 | | 10,620 | | 11,068 | |
| | |
| |
| |
| |
| |
| |
| Difference | | 34 | | 8 | | (27 | ) | 5 | | 77 | |
Other Taxes |
|
|
|
|
|
|
|
|
|
|
|
| Treasury | | 4,290 | | 4,411 | | 4,536 | | 4,645 | | 4,730 | |
| Inland Revenue | | 4,296 | | 4,426 | | 4,546 | | 4,638 | | 4,713 | |
| | |
| |
| |
| |
| |
| |
| Difference | | (6 | ) | (15 | ) | (10 | ) | 7 | | 17 | |
Total Tax |
|
|
|
|
|
|
|
|
|
|
|
| Treasury | | 42,251 | | 44,115 | | 46,043 | | 47,944 | | 50,140 | |
| Inland Revenue | | 42,056 | | 43,904 | | 45,946 | | 47,984 | | 50,157 | |
| | |
| |
| |
| |
| |
| |
| Difference | | 195 | | 211 | | 97 | | (40 | ) | (17 | ) |
Source: The Treasury
Expenses
Table 2.8—Total expenses indicators
Expenses
| | 2003
Actual
| | 2004
Forecast
| | 2005
Forecast
| | 2006
Forecast
| | 2007
Forecast
| | 2008
Forecast
|
|---|
| ($ million) | | | | | | | | | | | | |
| Core Crown | | 41,749 | | 41,868 | | 43,877 | | 47,054 | | 49,385 | | 51,865 |
| Core Crown (excluding GSF valuation) | | 39,905 | | 42,232 | | 43,877 | | 47,054 | | 49,385 | | 51,865 |
| Total Crown | | 55,224 | | 53,508 | | 56,900 | | 60,508 | | 63,240 | | 66,022 |
(% of GDP) |
|
|
|
|
|
|
|
|
|
|
|
|
| Core Crown | | 32.4 | | 30.8 | | 30.7 | | 31.2 | | 31.2 | | 31.1 |
| Core Crown (excluding GSF valuation) | | 31.0 | | 31.0 | | 30.7 | | 31.2 | | 31.2 | | 31.1 |
| Total Crown | | 42.9 | | 39.3 | | 39.8 | | 40.1 | | 39.9 | | 39.6 |
Source: The Treasury
Expenses as a percentage of nominal GDP constant over the forecast horizon
Total Crown expenses remain relatively stable as a percentage of GDP at around 40%. Total Crown expenses as a percentage of GDP in 2003/04 are lower than the 2002/03 actual outturn, largely reflecting the GSF and ACC liability valuation increases.
Figure 2.9—Expenses excluding valuations ($ and % of GDP)
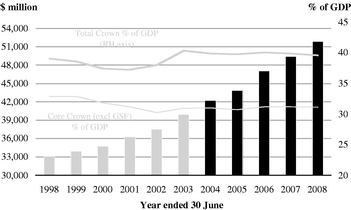
Source: The Treasury
Core Crown operating expenses (excluding valuation items) also remain relatively constant as a percentage of GDP at around 31%.
Core Crown expenses (excluding GSF valuation movements) increase on average by around 5.7% per year.
Nominally, core Crown expenses increase around $10 billion between 2002/03 and 2007/08. Removing the GSF liability movements from 2002/03 and 2003/04, expenses increase by $12 billion over the same period. The major drivers of these expense increases are indexation of benefits and forecast new spending for future Budgets.
New forecast spending
In terms of new spending Budget 2004 intends to commit $2.1 billion (GST inclusive) of new operating spending in the first year, rising to $3.3 billion (GST inclusive) in future years. Of this, $1.1 billion had already been incorporated into previous fiscal forecasts.
Budget 2004 also includes increased capital expenditure. Forecasts of capital spending have increased $500 million since the Budget, to a total of $2.2 billion spread over the next four years, plus the legislatively required NZS Fund contributions.
The 2004 BPS broadly outlines the focus for Budget 2004.
The Government has also signalled in the 2004 BPS that it plans to fund smaller increases to Budgets in 2005 and 2006. The fiscal forecasts therefore also include additional operating spending of $1.8 billion in the 2005 Budget and $1.6 billion in the 2006 Budget (which in each case includes the $1.1 billion already incorporated into previous fiscal forecasts). For the 2007/08 year $1.6 billion for the 2007 Budget has been incorporated. All these amounts are GST inclusive.
Some of the new operating spending for Budgets 2004 to 2006 has already been allocated and incorporated into the fiscal forecasts as indicated in Table 2.2 and Table 2.3.
Table 2.9—2003 December Update fiscal indicators
Fiscal Indicators
($ million)
| | 2003
Actual
| | 2004
Forecast
| | 2005
Forecast
| | 2006
Forecast
| | 2007
Forecast
| | 2008
Forecast
| |
|---|
| Revenue | | | | | | | | | | | | | |
| Total revenue | | 57,027 | | 59,522 | | 63,160 | | 66,223 | | 69,077 | | 72,128 | |
| Total core Crown revenue | | 43,624 | | 46,330 | | 48,718 | | 51,173 | | 53,539 | | 56,180 | |
Expenses |
|
|
|
|
|
|
|
|
|
|
|
|
|
| Total expenses | | 55,224 | | 53,508 | | 56,900 | | 60,508 | | 63,240 | | 66,022 | |
| Total core Crown expenses | | 41,749 | | 41,868 | | 43,877 | | 47,054 | | 49,385 | | 51,865 | |
Operating balance—Core Crown |
|
1,875 |
|
4,462 |
|
4,841 |
|
4,119 |
|
4,154 |
|
4,315 |
|
| Operating balance—Crown entities | | (123 | ) | 1,308 | | 1,028 | | 1,084 | | 1,178 | | 1,276 | |
| Operating balance—SOEs | | 428 | | 606 | | 781 | | 981 | | 1,032 | | 1,088 | |
| Dividend elimination | | (214 | ) | (284 | ) | (312 | ) | (389 | ) | (446 | ) | (492 | ) |
| | |
| |
| |
| |
| |
| |
| |
| Total operating balance | | 1,966 | | 6,092 | | 6,338 | | 5,795 | | 5,918 | | 6,187 | |
OBERAC |
|
5,580 |
|
5,207 |
|
6,338 |
|
5,795 |
|
5,918 |
|
6,187 |
|
Debt Indicators |
|
|
|
|
|
|
|
|
|
|
|
|
|
| Gross sovereign-issued debt | | 36,086 | | 34,469 | | 32,940 | | 33,019 | | 33,604 | | 34,057 | |
| Total Crown debt | | 38,285 | | 36,118 | | 35,091 | | 34,937 | | 34,103 | | 33,154 | |
| Net core Crown debt | | 16,935 | | 16,935 | | 15,442 | | 14,619 | | 13,878 | | 13,439 | |
Net worth |
|
23,781 |
|
29,920 |
|
36,258 |
|
42,053 |
|
47,971 |
|
54,158 |
|
Domestic bond programme |
|
2,551 |
|
2,235 |
|
2,317 |
|
2,841 |
|
3,314 |
|
— |
|
Nominal GDP |
|
128,810 |
|
136,112 |
|
142,932 |
|
150,944 |
|
158,512 |
|
166,744 |
|
| |
Fiscal Indicators as a % of GDP |
|
|
|
|
|
|
|
|
|
|
|
|
|
| Revenue | | | | | | | | | | | | | |
| Total Crown revenue | | 44.3 | | 43.7 | | 44.2 | | 43.9 | | 43.6 | | 43.3 | |
| Total core Crown revenue | | 33.9 | | 34.0 | | 34.1 | | 33.9 | | 33.8 | | 33.7 | |
Expenses |
|
|
|
|
|
|
|
|
|
|
|
|
|
| Total Crown expenses | | 42.9 | | 39.3 | | 39.8 | | 40.1 | | 39.9 | | 39.6 | |
| Total core Crown expenses | | 32.4 | | 30.8 | | 30.7 | | 31.2 | | 31.2 | | 31.1 | |
Operating balance |
|
1.5 |
|
4.5 |
|
4.4 |
|
3.8 |
|
3.7 |
|
3.7 |
|
| OBERAC | | 4.3 | | 3.8 | | 4.4 | | 3.8 | | 3.7 | | 3.7 | |
Debt Indicators |
|
|
|
|
|
|
|
|
|
|
|
|
|
| Gross sovereign-issued debt | | 28.0 | | 25.3 | | 23.0 | | 21.9 | | 21.2 | | 20.4 | |
| Total Crown debt | | 29.7 | | 26.5 | | 24.6 | | 23.1 | | 21.5 | | 19.9 | |
Net core Crown debt |
|
13.1 |
|
12.4 |
|
10.8 |
|
9.7 |
|
8.8 |
|
8.1 |
|
| Net core Crown debt plus assets of NZS Fund | | 11.7 | | 9.6 | | 6.5 | | 3.8 | | 1.3 | | -1.0 | |
Net worth |
|
18.5 |
|
22.0 |
|
25.4 |
|
27.9 |
|
30.3 |
|
32.5 |
|
| |
New Zealand Superannuation Fund |
|
|
|
|
|
|
|
|
|
|
|
|
|
| Fund asset returns (after tax) | | 69 | | 122 | | 328 | | 491 | | 673 | | 878 | |
| Fund contributions | | 1,200 | | 1,879 | | 1,979 | | 2,156 | | 2,265 | | 2,410 | |
| Fund assets (year end) | | 1,884 | | 3,885 | | 6,192 | | 8,839 | | 11,777 | | 15,065 | |
| % of GDP | | 1.5 | | 2.9 | | 4.3 | | 5.9 | | 7.4 | | 9.0 | |
Source: The Treasury
Table 2.10—2003 Budget Update fiscal indicators (revised for TEI accounting change)
Fiscal Indicators
($ million)
| | 2003
Actual
| | 2004
Forecast
| | 2005
Forecast
| | 2006
Forecast
| | 2007
Forecast
| |
|---|
| Revenue | | | | | | | | | | | |
| Total revenue | | 57,027 | | 57,270 | | 60,110 | | 62,991 | | 65,806 | |
| Total core Crown revenue | | 43,624 | | 44,469 | | 46,449 | | 48,842 | | 51,270 | |
Expenses |
|
|
|
|
|
|
|
|
|
|
|
| Total expenses | | 55,224 | | 53,586 | | 55,714 | | 57,782 | | 59,706 | |
| Total core Crown expenses | | 41,749 | | 41,738 | | 43,292 | | 45,031 | | 46,594 | |
Operating balance—Core Crown |
|
1,875 |
|
2,731 |
|
3,157 |
|
3,811 |
|
4,676 |
|
| Operating balance—Crown entities | | (123 | ) | 681 | | 853 | | 936 | | 1,013 | |
| Operating balance—SOEs | | 428 | | 623 | | 723 | | 825 | | 904 | |
| Dividend elimination | | (214 | ) | (274 | ) | (259 | ) | (283 | ) | (412 | ) |
| | |
| |
| |
| |
| |
| |
| Total operating balance | | 1,966 | | 3,761 | | 4,474 | | 5,289 | | 6,181 | |
OBERAC |
|
5,580 |
|
3,761 |
|
4,474 |
|
5,289 |
|
6,181 |
|
Debt Indicators |
|
|
|
|
|
|
|
|
|
|
|
| Gross sovereign-issued debt | | 36,086 | | 34,459 | | 35,066 | | 35,515 | | 35,559 | |
| Total Crown debt | | 38,285 | | 36,378 | | 36,990 | | 36,857 | | 35,812 | |
| Net core Crown debt | | 16,935 | | 18,435 | | 18,352 | | 17,822 | | 16,629 | |
Net worth |
|
23,781 |
|
23,958 |
|
28,432 |
|
33,721 |
|
39,902 |
|
Domestic bond programme |
|
2,551 |
|
3,234 |
|
3,471 |
|
3,028 |
|
2,775 |
|
Nominal GDP |
|
128,810 |
|
134,034 |
|
141,021 |
|
147,911 |
|
154,906 |
|
| |
Fiscal Indicators as a % of GDP |
|
|
|
|
|
|
|
|
|
|
|
| Revenue | | | | | | | | | | | |
| Total Crown revenue | | 44.3 | | 42.7 | | 42.6 | | 42.6 | | 42.5 | |
| Total core Crown revenue | | 33.9 | | 33.2 | | 32.9 | | 33.0 | | 33.1 | |
Expenses |
|
|
|
|
|
|
|
|
|
|
|
| Total Crown expenses | | 42.9 | | 40.0 | | 39.5 | | 39.1 | | 38.5 | |
| Total core Crown expenses | | 32.4 | | 31.1 | | 30.7 | | 30.4 | | 30.1 | |
Operating balance |
|
1.5 |
|
2.8 |
|
3.2 |
|
3.6 |
|
4.0 |
|
| OBERAC | | 4.3 | | 2.8 | | 3.2 | | 3.6 | | 4.0 | |
Debt Indicators |
|
|
|
|
|
|
|
|
|
|
|
| Gross sovereign-issued debt | | 28.0 | | 25.7 | | 24.9 | | 24.0 | | 23.0 | |
| Total Crown debt | | 29.7 | | 27.1 | | 26.2 | | 24.9 | | 23.1 | |
Net core Crown debt |
|
13.1 |
|
13.8 |
|
13.0 |
|
12.0 |
|
10.7 |
|
| Net core Crown debt plus assets of NZS Fund | | 11.7 | | 10.8 | | 8.5 | | 5.8 | | 2.7 | |
Net worth |
|
18.5 |
|
17.9 |
|
20.2 |
|
22.8 |
|
25.8 |
|
| |
New Zealand Superannuation Fund |
|
|
|
|
|
|
|
|
|
|
|
| Fund asset returns (after tax) | | 69 | | 187 | | 347 | | 525 | | 726 | |
| Fund contributions | | 1,200 | | 1,879 | | 2,114 | | 2,299 | | 2,433 | |
| Fund assets (year end) | | 1,884 | | 3,950 | | 6,411 | | 9,235 | | 12,394 | |
| % of GDP | | 1.5 | | 2.9 | | 4.5 | | 6.2 | | 8.0 | |
Source: The Treasury
Risks to Forecasts
The forecasts were finalised on 8 December 2003 in accordance with the forecast accounting policies. There are certain risks around the forecast results. To assist in evaluating such risks the following chapters should be read in conjunction with the fiscal forecasts.
Specific fiscal risks (Chapter 4)—The fiscal forecasts incorporate government decisions up to 8 December 2003. The specific fiscal risks chapter covers specific policy decisions that are under active consideration by the Government at the time of the finalisation of the forecasts.
Risks and scenarios (Chapter 3)—The fiscal forecasts are based on the economic forecasts presented in Chapter 1 and any variation from the economic forecast will impact on the fiscal forecasts, in particular tax revenue and benefit expenses. The risks and scenarios chapter discusses the impact to the forecasts under different circumstances.
In addition to the specific fiscal risks and the link to the economic forecasts, there are a number of forecasting issues that may impact in future.
State-owned enterprises forecasts
The forecast financial information included in these forecasts for large SOEs was provided in October 2003 and is based on their best assessments at that time.
Some entities have indicated they are assessing their future capital investment plans which are not sufficiently definitive to be included in these forecasts. As these plans develop they will be included in future forecasts.
International financial reporting standards
The New Zealand Accounting Standards Review Board announced in December 2002 that International Financial Reporting Standards (IFRSs) will apply to financial reporting by both public and private sector entities from 1 January 2007, but with entities having the option to adopt from 1 January 2005. The Crown plans to adopt the New Zealand IFRSs in the 2007 Budget.
It is likely that the adoption of the New Zealand IFRSs will impact on the way financial results are reported.
Tertiary Education Institutions (TEIs) accounting treatment
The forecast information presented in the Budget Update combined TEIs on a line-by-line basis. As noted in previous publications the combination treatment of TEIs was an issue still to resolve. The combination method adopted in these forecasts is to equity account for the TEIs net surpluses and net investment and not the TEI revenues, expenses, assets and liabilities on a line-by-line method. This is consistent with the treatment adopted in the 2003 Crown financial statements.
To ensure comparability, the forecasts contained in the Budget Update have been restated where published as part of the December Update. The key indicators are unchanged as a result of the combination approach for TEIs (refer page 60 of the 30 June 2003 Crown financial statements).
3
Risks and Scenarios
Summary
- •
- The December Update forecasts reflect the balancing of a number of judgements about how the various factors affecting the economy will evolve.
- •
- If actual events evolve differently from these judgements, the economy could go down an alternative path to that of our central forecast, with consequent impacts on the fiscal outlook.
- •
- Weighing up the strength of domestic demand against the effects of the appreciation of the exchange rate on the economy has been a key judgement in forming the central forecast. The extent to which the fall in export receipts flows through into domestic spending behaviour poses a risk to the outlook for GDP growth.
Figure 3.1—Real GDP
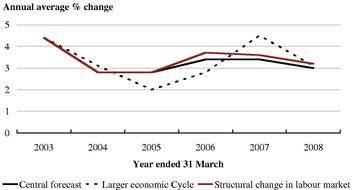
Source: The Treasury
- •
- In addition, a larger negative impact on export volumes from the exchange rate appreciation than in the central forecast would see lower real and nominal GDP growth.
- •
- Such a fall in GDP growth can be expected to flow through to the fiscal position with the OBERAC being smaller than under the central forecast and gross debt higher.
- •
- A lower, sustainable, long-run rate of unemployment than in the central forecast would see higher real GDP for a period, lower inflation and slightly lower nominal GDP.
Economic Risks
The central forecast reflects the balancing of the upside and downside risks facing the economy to arrive at our best assessment of the way the economy is likely to evolve. This requires a number of key judgements to be made about how the various forces affecting the economy will evolve. These judgements include those about cyclical drivers of activity and those about the structural characteristics of the economy. If actual events differ from these judgements, the economy may deviate from our central forecast.
The international back-drop remains important ...
Developments in the world economy can be an important driver of economic activity in New Zealand, through the impact on both the prices and volumes of New Zealand's exports and imports. Chapter 1 describes the outlook for trading partner growth that underpins the central forecast. This outlook would represent the best two-year period of growth since 1999 and 2000. In addition, the risks around the world outlook look to be more balanced than in the past, with evidence of growth picking up in the US and elsewhere.
As we have noted in previous Updates, the Consensus based forecasts point to a more muted recovery than normal, with growth returning only to something like trend rather than rising above it. The very rapid September quarter GDP growth out-turns in the US, Australia and Asia are a timely reminder that a much stronger rebound is possible at least for a period. However, looking further out, a number of major economies, including the US, face a number of structural challenges. The Consensus forecasts incorporate a view that these challenges will be worked through in a relatively benign manner. A less sanguine scenario leading to weaker trading partner growth would provide downside risk to the rebound in export growth built into the central forecast.
While some of the uncertainties and risks flowing from non-economic factors, including conflict in Iraq and SARS, have dissipated as assumed in the Budget Update, they have not disappeared. Perhaps the most visible outlet of risk is in the outlook for oil prices. A pick-up in geo-political uncertainty could see the gradual decline in oil prices over 2004 built into the central forecast fail to eventuate, and impact adversely on the outlook for the global economy, and New Zealand's terms of trade. More generally, in the central forecast a positive outlook for the price of a number of New Zealand's agricultural commodities provides an important boost for the terms of trade and incomes. Should this not eventuate, or the price of other categories of exports, with forestry prices perhaps the most likely candidate, fall further, the terms of trade will decline relative to the central forecast, with a subsequent flow-on to economic activity.
Weighing up the effects of the appreciation of the exchange rate on the economy has been a key judgement in forming the central forecast. Analysis of the effects on the economy of the exchange rate appreciation is complicated by the differing paths of the bilateral exchange rates of New Zealand's trading partners. The central forecast incorporates a sustained period of slow growth in non-commodity exports. A larger negative impact on export volumes would see a fall in real and nominal GDP growth. Another dimension of the appreciation of the exchange rate is through the effect on incomes. Exporters' incomes have fallen with the appreciation of the exchange rate. The extent to which this feeds through into domestic spending behaviour poses a risk to the outlook. The central forecast may underestimate the impact of the pass-through from the exchange rate into domestic spending, particularly if exports are more negatively affected. This would see a sharper slowing in consumption and investment spending.
... but many of the key risks are domestic this time around
With the outlook for the world economy improving and the risks more balanced compared with those which have prevailed in recent years, more of the key judgements underpinning the economic outlook centre around home grown drivers of growth.
If the judgements around net migration, labour income growth and the willingness of households to take on debt prove incorrect, the economy would evolve differently from that described in the central forecast.
Higher levels of net migration or employment growth continuing at the same pace as in the past 12 months would see further boosts to household spending, prolonging the expansion in residential investment and stimulating further increases in wealth through house prices. This could also see growth put further pressure on resources and increase inflationary pressures in the non-tradables sector of the economy. Wage developments are also an area of uncertainty. With the unemployment rate currently at the lowest point in 16 years, and forecast to remain low in the near term, wages could accelerate more sharply than contained in the central forecast. This could then flow into a more widespread increase in inflation pressure than is currently the case.
The central forecast incorporates an on-going build-up in household debt, with the cost of debt servicing rising. The ratio of debt to household income is at record high levels and households' willingness to continue to take this even higher, as well as the associated cash-flow implications of higher interest payments, are key areas of uncertainty around the growth outlook.
These risks largely relate to different cyclical drivers of economic activity. The structural characteristics of the economy, including such concepts as the long-term trend economic and productivity growth, and the long-term sustainable rate of unemployment, are important determinants of economic activity and national income over the longer term. Such concepts are difficult to measure and any estimates tend to have substantial uncertainty around the precise magnitudes. The second scenario in the subsequent section considers how the economy may develop if one of the judgements about the underlying structure of the economy, and specifically the labour market, is different from that underpinning the central forecast.
Economic Scenarios
The following scenarios present two possible growth paths for the economy if some of the key judgements underlying the central forecast are altered. The first scenario illustrates a larger GDP growth cycle, where initial momentum in domestic demand is stronger and the subsequent slowdown in the economy sharper. The second scenario assumes some changes in the underlying structure of the economy. The scenarios are two of a large number of possible examples, and do not represent upper or lower bounds for the central forecast, with more extreme paths possible.
Table 3.1—Alternative scenarios: summary
| | 2002/03
Actual
| | 2003/04
Forecast
| | 2004/05
Forecast
| | 2005/06
Forecast
| | 2006/07
Forecast
| | 2007/08
Forecast
|
|---|
| Production GDP (annual average % change, March years) | | | | | | | | | | | | |
| Central forecast | | 4.4 | | 2.8 | | 2.8 | | 3.4 | | 3.4 | | 3.0 |
| Larger economic cycle | | 4.4 | | 3.1 | | 2.0 | | 2.8 | | 4.5 | | 3.1 |
| Structural change in labour market | | 4.4 | | 2.8 | | 2.8 | | 3.7 | | 3.6 | | 3.2 |
| Nominal Expenditure GDP (annual average % change, March years) | | | | | | | | | | | | |
| Central forecast | | 4.0 | | 4.7 | | 5.6 | | 5.3 | | 5.2 | | 5.1 |
| Larger economic cycle | | 4.0 | | 5.0 | | 5.0 | | 4.2 | | 5.4 | | 5.0 |
| Structural change in labour market | | 4.0 | | 4.7 | | 5.3 | | 5.2 | | 5.1 | | 5.0 |
| OBERAC ($ billion, June years) | | | | | | | | | | | | |
| Central forecast | | 5.6 | | 5.2 | | 6.4 | | 5.8 | | 5.9 | | 6.2 |
| Larger economic cycle | | 5.6 | | 5.5 | | 5.0 | | 3.9 | | 4.1 | | 4.2 |
| Structural change in labour market | | 5.6 | | 5.2 | | 6.2 | | 5.7 | | 5.8 | | 6.1 |
Sources: Statistics New Zealand, The Treasury
A larger economic cycle
Under the central forecast, real GDP growth slows from 4.4% in 2002/03 to 2.8% in 2003/04 and 2004/05, before lifting to 3.4% in 2005/06 and 2006/07.
This first scenario illustrates a larger economic cycle, where initial momentum in domestic demand is stronger than the central forecast, and the subsequent slowdown in the economy is sharper. In this scenario, exogenous drivers of growth, including net migration, the exchange rate in the near term, and the global economy evolve in line with the central forecast.
We have proxied a larger economic cycle by assuming a greater impact on export volumes from the current exchange rate appreciation and by households being less willing to fund residential investment and consumption out of debt. In the short term there is more momentum in domestic demand, contributing to real GDP growth of 3.1% in 2003/04. The stronger cycle comes about through a greater fall in activity in 2004/05, with weaker export volume growth and a larger slowing in household spending, seeing real GDP growth fall to 2.0% in 2004/05. GDP growth recovers to 2.8% in 2005/06 and 4.5% in 2006/07, in part due to the recovery in exports.
Momentum in domestic demand sees consumption and residential investment both grow more strongly over the end of the 2003/04 year. Consumption growth reaches 4.5% and residential investment grows 23.2%.
In this scenario, the current appreciation of the exchange rate is assumed to have a greater impact on the competitiveness of New Zealand exporters, leading to slower growth in export volumes of 3.0% and 4.0% in 2004/05 and 2005/06 respectively. Smaller growth in exports sees the current account deficit widen to 6.5% of GDP in 2005/06. In the domestic sectors, consumption and residential investment growth slows relative to the central forecast as households are less willing to take on debt.
With slower growth, businesses cut back on employment plans and employment falls in the 2005/06 year, pushing the unemployment rate to a peak of 6.6%. An increase in labour market slack sees lower wage growth, which, together with the slowing in employment growth, see smaller growth in labour income than in the central forecast.
Figure 3.2—90 Day Bill Rates
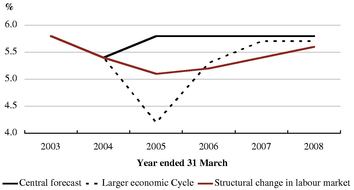
Source: The Treasury
Reduced income growth and job security flows into household behaviour, compounding the impact of reduced household willingness to take on debt. Consumption growth slows to 2.6% in the 2004/05 year and 2.0% in the 2005/06 year. Residential investment also experiences a larger cycle than in the central forecast, with growth of 4.4% in 2004/05 and a fall of 11.0% in 2005/06. With weaker domestic activity imports fall. Annual average GDP growth slows to 2.0% in 2004/05 and 2.8% in 2005/06.
While in annual average terms growth holds up at 2.0% in 2004/05, and 2.8% in 2005/06, this hides a prolonged period of weak growth. Growth over the second half of the 2004 calendar year is very weak, with some quarters where the economy contracts, and by March 2005 the level of real GDP is only slightly higher than the level in March 2004.
Table 3.2—Larger economic cycle
(Annual average % change, March years)
| | 2002/03
Actual
| | 2003/04
Forecast
| | 2004/05
Forecast
| | 2005/06
Forecast
| | 2006/07
Forecast
| | 2007/08
Forecast
|
|---|
| Private consumption | | 3.8 | | 4.5 | | 2.6 | | 2.0 | | 2.4 | | 2.9 |
| Residential investment | | 23.3 | | 23.2 | | 4.4 | | -11.0 | | 2.0 | | -0.6 |
| Business investment | | 4.1 | | 9.2 | | 6.2 | | 9.7 | | 3.9 | | 1.4 |
| Gross national expenditure | | 4.5 | | 5.7 | | 3.6 | | 2.7 | | 2.8 | | 2.4 |
Exports of goods and services |
|
7.0 |
|
1.7 |
|
3.0 |
|
4.0 |
|
8.3 |
|
4.3 |
| Imports of goods and services | | 9.4 | | 12.0 | | 7.5 | | 3.3 | | 3.6 | | 2.5 |
| | |
| |
| |
| |
| |
| |
|
| GDP (production measure) | | 4.4 | | 3.1 | | 2.0 | | 2.8 | | 4.5 | | 3.1 |
| | |
| |
| |
| |
| |
| |
|
| Employment growth | | 2.6 | | 3.0 | | 1.2 | | -1.1 | | 1.7 | | 2.2 |
| Unemployment rate(1) | | 4.9 | | 4.3 | | 5.5 | | 6.6 | | 5.6 | | 5.3 |
| 90-day bank bill rate(2) | | 5.8 | | 5.4 | | 4.2 | | 5.3 | | 5.7 | | 5.7 |
| TWI(2) | | 60.6 | | 64.5 | | 61.7 | | 58.4 | | 57.6 | | 57.7 |
| CPI(3) | | 2.5 | | 1.4 | | 2.5 | | 1.5 | | 1.8 | | 1.9 |
| Current account balance (% GDP) | | -3.9 | | -5.5 | | -6.4 | | -6.5 | | -5.4 | | -4.7 |
| Nominal GDP (expenditure measure) | | 4.0 | | 5.0 | | 5.0 | | 4.2 | | 5.4 | | 5.0 |
Sources: Statistics New Zealand, Reserve Bank of New Zealand, The Treasury
| NOTES: | | (1) | | Percentage of labour force, March quarter, seasonally adjusted. |
|
|
(2) |
|
Average for March quarter. |
|
|
(3) |
|
Annual percentage change, March quarter. |
Weaker growth and in particular reduced domestic demand flow through to lower inflationary pressures, with annual CPI inflation remaining low at 1.5% in 2005/06. This sees interest rates fall from the second half of 2004, with 90-day bank bills falling to 4.2% during 2005, around one and a half percentage points lower than under the central forecast. Lower interest rates help support business investment, with growth of 6.2% in the 2004/05 year and 9.7% in 2005/06.
Figure 3.3—Nominal GDP
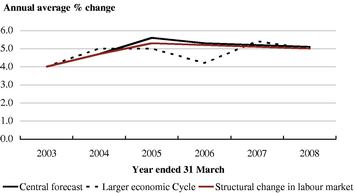
Source: The Treasury
With weaker growth the exchange rate is assumed to decline a little faster than in the central forecast, boosting export growth in 2006/07 and suppressing import growth. This helps support a rebound in GDP growth in 2006/07. In turn, businesses begin hiring again, and the unemployment rate falls back to 5.3% by the end of the forecast period. With excess capacity declining over the latter part of the forecast horizon, interest rates gradually rise to offset any emerging inflationary pressures.
The level of nominal GDP is initially higher than in the central forecast due to the extra impetus to domestic demand. From the 2004/05 year onwards, the combined effect of lower output growth and
lower inflation is a lower level of nominal GDP throughout the forecast period, despite a rebound in real GDP growth in 2006/07. By the end of the forecast period real economic activity is almost back to the central forecast level. However, the price level shock is permanent, and nominal GDP is about $2.3 billion lower than in the central forecast at the end of the forecast period. Moreover, with a number of years of weak GDP growth, profit growth will be under considerable pressure, to the extent of an increased build-up of tax losses.
Structural change in the labour market
Structural factors are also important determinants of economic activity, determining the growth path of the economy over the long term. This scenario considers the impact of ongoing falls in the long-run sustainable rate of unemployment over the rest of the forecast period. The actual unemployment rate is lower than in the central forecast and the economy grows more strongly, with growth of 3.7% and 3.6% in 2005/06 and 2006/07 respectively.
Estimates of the rate of unemployment that the economy can sustain without a marked build-up in inflationary pressures have declined over the past decade. The actual rate of unemployment has followed a similar pattern. A recent OECD paper suggested that a number of countries, including New Zealand, had experienced falls of around 0.5% per annum in structural unemployment over the past decade. In the New Zealand context this has occurred alongside improved economic performance and changes to the way the labour market operates. Increasing skill levels may also push the rate down. Treasury analysis supports the OECD's conclusion, although there is considerable uncertainty about precise estimates and future developments. In the central forecast, unemployment settles at around 5%. This scenario assumes a further fall of around one percentage point over the forecast period.
Figure 3.4—Unemployment rate
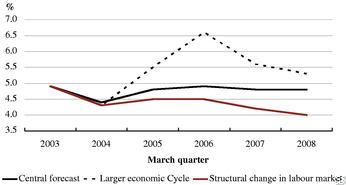
Source: The Treasury
With the cyclical drivers of activity in this scenario the same as in the central forecast, it is labour market dynamics that drive developments in other sectors of the economy relative to the central forecast. With a lower sustainable unemployment rate, ongoing employment growth generates less pressure on resources in the economy, weaker wage growth and reduced inflationary pressures. Greater utilisation of labour allows trend output to increase for a period. CPI inflation is around 0.4 percentage
points weaker than in the central forecast, staying around 2.0% for the entire forecast period, excluding the 2003/04 year where falls in tradable sector inflation see overall inflation of just 1.3%.
Figure 3.5—CPI inflation
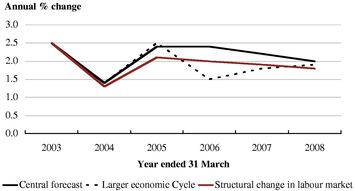
Source: The Treasury
Reduced inflationary pressure sees a lower track for interest rates. Lower interest rates provide a boost to both residential and business investment, increasing growth in 2005/06 and 2006/07. With higher investment than the central forecast, imports are also higher and the current account deficit is 5.6% of GDP at the end of the forecast period. Stronger economic growth drives a stronger labour market as firms look to take on more workers and employment growth is higher than in the central forecast. The unemployment rate gradually falls to 4.0% over the course of the forecast period.
Overall the lower long-term structural rate of unemployment sees real GDP growth lift relative to the central forecast for a period, with growth reaching 3.7% and 3.6% in 2005/06 and 2006/07 respectively, before falling back to 3.2% in 2007/08. This all translates into higher growth in real GDP per capita of 2.7% in 2005/06 and 2006/07.
Table 3.3—Structural change in the labour market
(Annual average % change, March years)
| | 2002/03
Actual
| | 2003/04
Forecast
| | 2004/05
Forecast
| | 2005/06
Forecast
| | 2006/07
Forecast
| | 2007/08
Forecast
|
|---|
| Private consumption | | 3.8 | | 4.3 | | 2.9 | | 2.9 | | 3.1 | | 3.2 |
| Residential investment | | 23.3 | | 20.3 | | 5.4 | | -4.6 | | 0.9 | | 1.5 |
| Business investment | | 4.1 | | 9.1 | | 5.9 | | 7.8 | | 4.5 | | 4.3 |
| Gross national expenditure | | 4.5 | | 5.4 | | 3.8 | | 3.4 | | 3.2 | | 3.1 |
Exports of goods and services |
|
7.0 |
|
1.7 |
|
4.2 |
|
6.1 |
|
5.7 |
|
3.8 |
| Imports of goods and services | | 9.4 | | 11.9 | | 7.1 | | 5.1 | | 4.6 | | 3.4 |
| | |
| |
| |
| |
| |
| |
|
| GDP (production measure) | | 4.4 | | 2.8 | | 2.8 | | 3.7 | | 3.6 | | 3.2 |
| | |
| |
| |
| |
| |
| |
|
| Employment growth | | 2.6 | | 3.0 | | 1.4 | | 0.9 | | 1.7 | | 1.7 |
| Unemployment rate(1) | | 4.9 | | 4.3 | | 4.5 | | 4.5 | | 4.2 | | 4.0 |
| 90-day bank bill rate(2) | | 5.8 | | 5.4 | | 5.1 | | 5.2 | | 5.4 | | 5.6 |
| TWI(2) | | 60.6 | | 64.5 | | 63.3 | | 61.0 | | 59.8 | | 58.9 |
| CPI(3) | | 2.5 | | 1.3 | | 2.1 | | 2.0 | | 1.9 | | 1.8 |
| Current account balance (% GDP) | | -3.9 | | -5.5 | | -5.9 | | -5.8 | | -5.8 | | -5.6 |
| Nominal GDP (expenditure measure) | | 4.0 | | 4.7 | | 5.3 | | 5.2 | | 5.1 | | 5.0 |
Sources: Statistics New Zealand, Reserve Bank of New Zealand, The Treasury
| NOTES: | | (1) | | Percentage of labour force, March quarter, seasonally adjusted. |
|
|
(2) |
|
Average for March quarter. |
|
|
(3) |
|
Annual percentage change, March quarter. |
Under this scenario, the level of real GDP is just over $0.8 billion larger than in the central forecast by the end of the forecast period. However, with less inflation than the central forecast the nominal economy gets progressively smaller than under the central forecast, with nominal GDP being $1.0 billion lower at the end of the forecast period.
Fiscal Scenarios
The fiscal position is strongly influenced by the economy. The major economic determinants, and how they impact on the fiscal position, are listed below. While each effect is expressed in terms of an increase, the opposite impact applies for a decrease.
- •
- Nominal GDP—stronger GDP levels are reflected in a higher tax take, which increases the operating balance and lowers the Government's debt.
- •
- Interest rates—higher interest rates lead to increased debt financing costs. While interest-based revenue increases too, the negative effect of higher finance costs on the operating balance dominates, meaning debt increases.
- •
- The level of unemployment—higher levels of unemployment translate to increased spending, because the numbers of unemployment beneficiaries rise. This decreases the operating balance and raises debt levels.
- •
- CPI inflation—as most benefits are indexed to CPI movements, higher inflation results in increased benefit costs. This reduces the operating balance and increases debt.
Table 3.4 shows the effects of the two scenarios on the operating balance and gross debt.
Table 3.4—Alternative scenarios: OBERAC and gross debt
June years
| | 2002/03
Actual
| | 2003/04
Forecast
| | 2004/05
Forecast
| | 2005/06
Forecast
| | 2006/07
Forecast
| | 2007/08
Forecast
| |
|---|
| OBERAC ($ billion) | | | | | | | | | | | | | |
| Central Forecast | | 5.6 | | 5.2 | | 6.4 | | 5.8 | | 5.9 | | 6.2 | |
| Larger Economic Cycle | | 5.6 | | 5.5 | | 5.0 | | 3.9 | | 4.1 | | 4.2 | |
| Structural Change in the Labour Market | | 5.6 | | 5.2 | | 6.2 | | 5.7 | | 5.8 | | 6.1 | |
Gross sovereign-issued debt ($ b) |
|
|
|
|
|
|
|
|
|
|
|
|
|
| Central Forecast | | 36.1 | | 34.5 | | 32.9 | | 33.0 | | 33.6 | | 34.1 | |
| Larger Economic Cycle | | 36.1 | | 34.2 | | 34.0 | | 35.9 | | 38.3 | | 40.7 | |
| Structural Change in the Labour Market | | 36.1 | | 34.5 | | 33.1 | | 33.3 | | 34.0 | | 34.6 | |
OBERAC (% GDP) |
|
|
|
|
|
|
|
|
|
|
|
|
|
| Central Forecast | | 4.3 | % | 3.8 | % | 4.4 | % | 3.8 | % | 3.7 | % | 3.7 | % |
| Larger Economic Cycle | | 4.3 | % | 4.0 | % | 3.5 | % | 2.6 | % | 2.6 | % | 2.6 | % |
| Structural Change in the Labour Market | | 4.3 | % | 3.8 | % | 4.3 | % | 3.8 | % | 3.7 | % | 3.7 | % |
Gross sovereign-issued debt (% GDP) |
|
|
|
|
|
|
|
|
|
|
|
|
|
| Central Forecast | | 28.0 | % | 25.3 | % | 23.0 | % | 21.9 | % | 21.2 | % | 20.4 | % |
| Larger Economic Cycle | | 28.0 | % | 25.0 | % | 24.0 | % | 24.1 | % | 24.5 | % | 24.8 | % |
| Structural Change in the Labour Market | | 28.0 | % | 25.3 | % | 23.3 | % | 22.2 | % | 21.6 | % | 20.9 | % |
Sources: Statistics New Zealand, The Treasury
Of the two alternative scenarios, the differences from the central forecast are far more marked in the "larger economic cycle" scenario.
Strong growth in corporate tax has been a notable feature of the increase in tax revenue and in ratio of tax-to-GDP of the last two years, and the central forecast largely maintains this ratio over forecast period. However, it is possible that some of the increase of recent years is not sustained and that the overall tax-to-GDP ratio over the forecast period is lower than anticipated.
In the "larger economic cycle" scenario, we have proxied this by lowering corporate tax, over and above that implied by the weaker economy. This could come about if there was an increase in the amount of tax losses available to offset taxable income as a result of the two years of lower profit growth. It could also arise if more of the recent rise is due to cyclical factors than we currently anticipate.
The OBERAC track across the forecast years 2003/04 to 2007/08 is only slightly weaker, under the "structural change in the labour market" scenario, than it is in the central forecast. A marginally weaker GDP track results in small annual decreases in tax revenue. Much of this effect is negated by a
lower expense track, chiefly due to reduced expenditure on unemployment benefits. The latter occurs because, in this scenario, the unemployment rate is considerably lower between 2005/06 and 2007/08.
Figure 3.6—OBERAC
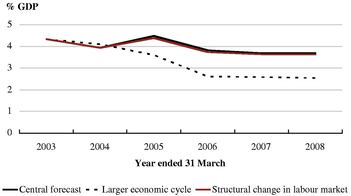
Source: The Treasury
By contrast, from 2004/05 onwards, OBERAC follows a significantly reduced pathway under the "larger economic cycle" scenario. Two factors are largely responsible. Firstly, as mentioned above, this scenario features a large corporate tax reaction to the reduced economic growth. By 2007/08, this loss in corporate tax revenue strips over $1 billion out of the operating balance. Secondly, economic growth is weaker in this scenario, so the ensuing reduction in other tax types, such as PAYE and GST, is more pronounced. Higher inflation in the early years increase benefit expenses above those in the central forecast, and a higher unemployment rate also pushes up benefit costs. While lower interest rates initially reduce the cost of debt, the build-up of debt results in significantly higher finance costs by 2007/08. The combination of weaker revenues and increased expenses means a reduced operating balance.
The small difference in the OBERAC track, between the "structural change in the labour market" scenario and the central forecast, translates to minor changes in the pathway of gross sovereign-issued debt (GSID). The slightly reduced operating balances result in a marginally higher debt track.
Figure 3.7—Gross soverign-issued debt
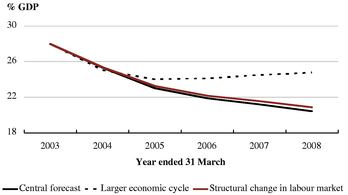
Source: The Treasury
For the "larger economic cycle" scenario, the cumulative effect of increasingly larger reductions in the operating balance over the forecast years results in quite a large wedge between this scenario's GSID track and that of the central forecast. Each year after 2003/04 sees less tax dollars available to pay for spending, and hence higher borrowing requirements. Added to this are higher non-finance expenses in the first years, and an increasing finance cost as the debt stock grows. By 2007/08, GSID is nearly 4.5% higher, as a percentage of GDP, than under the central forecast.
Fiscal Sensitivities
The scenario above indicates the sensitivity of fiscal aggregates to changes in economic conditions. Table 3.5 provides some "rules of thumb" on the sensitivities of the fiscal position to changes in specific variables.
Table 3.5—Fiscal sensitivity analysis
June Years
($ million)
| | 2003/04
Forecast
Actual
| | 2004/05
Forecast
| | 2005/06
Forecast
| | 2006/07
Forecast
| | 2007/08
Forecast
| |
|---|
| 1% Lower Nominal GDP Growth per Annum | | | | | | | | | | | |
| | Revenue | | (435 | ) | (900 | ) | (1,400 | ) | (1,975 | ) | (2,560 | ) |
| | Expenses (mainly debt servicing) | | 15 | | 55 | | 120 | | 225 | | 360 | |
| | |
| |
| |
| |
| |
| |
| Impact on the Operating Balance | | (450 | ) | (955 | ) | (1,520 | ) | (2,200 | ) | (2,920 | ) |
Revenue Impact of a 1% Decrease in the Growth Rates of rates of: |
|
|
|
|
|
|
|
|
|
|
|
| | Wages and salaries | | (170 | ) | (355 | ) | (560 | ) | (780 | ) | (1,020 | ) |
| | Taxable business profits | | (85 | ) | (200 | ) | (325 | ) | (450 | ) | (595 | ) |
One Percentage Point Lower Interest Rates |
|
|
|
|
|
|
|
|
|
|
|
| | Interest income | | (9 | ) | (17 | ) | (21 | ) | (26 | ) | (33 | ) |
| | Expenses | | (74 | ) | (139 | ) | (165 | ) | (197 | ) | (218 | ) |
| | |
| |
| |
| |
| |
| |
| Impact on the Operating Balance | | 65 | | 122 | | 144 | | 171 | | 185 | |
One Percentage Point Lower Real Interest Rates |
|
|
|
|
|
|
|
|
|
|
|
| | ACC liability (SOE and Crown entity surpluses) | | (700 | ) | | | | | | | | |
| | Government Superannuation Fund liability (expenses) | | (1,900 | ) | | | | | | | | |
| | |
| | | | | | | | | |
| Impact on the Operating Balance | | (2,600 | ) | | | | | | | | |
The forecasts of capital contributions for 2004/05 to 2007/08 are sensitive to the expected net after-tax annual return of the New Zealand Super Fund, which in turn depends on the expected gross rate of return assumed on the Fund's assets:
Table 3.6—New Zealand Superannuation Fund contributions sensitivity analysis
| |
| | Effect on
net return
after tax
(%age points)
| | Effect on capital contribution ($ billion)
|
|---|
Variable
| | Marginal change
(%age points)
|
|---|
| | 2004/05
| | 2005/06
| | 2006/07
| | 2007/08
|
|---|
| Expected gross rate of return | | -1 | % | -0.67 | % | +0.150 | | +0.160 | | +0.175 | | +0.190 |
A +1% change in the gross rate of return would have symmetrical, negative effects on the required capital contribution track across these years.
4
Specific Fiscal Risks
Introduction
This chapter describes the specific fiscal risks of the Crown, including contingent liabilities. The risks are disclosed as either quantified or unquantified, depending on their characteristics. Only contingent liabilities and other specific fiscal risks involving amounts of $10 million or more in any one year are separately disclosed. Contingent liabilities below $10 million are included in the "other quantifiable contingent liabilities" total. Comparatives for 30 June 2003 have been adjusted where appropriate to align with the disclosure of new "material" contingent liabilities. The total amount of contingent liabilities remains unchanged.
Specific Fiscal Risks
Specific fiscal risks (excluding contingent liabilities) are a category of government decisions or circumstances that may have a material impact on the fiscal position. The risks have not been included in the main forecasts because their fiscal impact cannot be reasonably quantified, the likelihood of realisation is uncertain and/or the timing is uncertain. The risks disclosed may not eventuate into Government policy and the final cost or saving may differ from the amount disclosed if the policy is developed.
To ensure a practicable and consistent disclosure approach, risks have been reported that have an expected cost or saving of over $10 million in any one forecast year and either:
- •
- reflect Government decisions or legislative commitments with uncertain fiscal consequences or timing, or
- •
- are generally being actively considered by the Minister of Finance and responsible Ministers (e.g. they have considered written advice or Cabinet papers), or
- •
- are decisions that have been deferred until a later date.
The risks outlined in this chapter would, if they eventuate, impact on the Government's forecast new operating and capital spending amounts. If the total of all risks considered exceeds the forecast new operating spending amounts in the forecasts, this would impact on the operating balance.
The forecasts incorporate operating and capital forecast spending amounts to accommodate policy initiatives on which decisions have yet to be made. Some risks outlined in this chapter, if they eventuate, would be covered by these amounts and therefore have no impact on the forecasts. These risks have been disclosed to provide an indication of the pressure the risks place upon the forecast spending amounts.
There are a number of other "pressures" on the fiscal position that have not been included as risks. These "pressures" comprise proposals largely generated within individual departments and not yet considered by the Minister of Finance and responsible Ministers. Such items are also expected to be managed within the forecast spending amounts noted above.
Specific fiscal risks do not include:
- •
- normal forecasting risks, such as uncertainty around welfare benefits, SOE/Crown entity surpluses, the impact of regular revaluations of physical assets, finance costs, or fluctuations in external markets
- •
- possible changes to the interpretation of accounting policies, such as the changes to revenue recognition rules and recognition of liabilities
- •
- discussion documents containing proposals that the Minister of Finance and responsible Ministers will not actively consider until the consultation process has been completed.
The Fiscal Responsibility Act 1994 requires that all specific fiscal risks be disclosed, except where it is determined by the Minister of Finance that disclosing a risk is likely to:
- •
- prejudice the substantial economic interests of New Zealand, or
- •
- prejudice the security or defence of New Zealand or international relations of the Government, or
- •
- compromise the Crown in a material way in negotiation, litigation or commercial activity, or
- •
- result in a material loss of value to the Crown.
In addition, the Minister of Finance has to determine that there is no reasonable or prudent way the Government can avoid this prejudice, compromise or material loss by making a decision on the fiscal risk before the finalisation of the forecasts, or by disclosing the fiscal risk without reference to its fiscal implications.
Time-Limited Funding
Time-limited funding does not meet the definition of a "risk" under the Fiscal Responsibility Act, but is further information that is prepared to increase transparency about initiatives with funding profiles that cease or decrease during the forecast period.
The following tables outline those areas where initiatives have time-limited funding that decreases or ceases at some point, using a $5 million materiality threshold. They are often related to pilot programmes that may or may not be extended. If operating funding were to be appropriated to maintain funding levels for these nine initiatives (ie extend the initiatives beyond their current scheduled completion dates), the total impact would be up to $2 million in 2003/04, $59 million in 2004/05 and $86 million from 2005/06, which would impact on the operating balance.
Vote
| | Description of initiative
| | Operating impact ($ million)
|
|---|
| Agriculture and Forestry | | Sustainable Farming Fund | | 3 in 2004/05, 13 from 2005/06 |
Corrections |
|
Auckland Central Remand Prison |
|
2 in 2004/05, 7 from 2005/06 |
Defence Force |
|
Enduring Freedom deployments |
|
18 in 2004/05, 22 from 2005/06 |
Defence Force |
|
Iraq Provincial Reconstruction Team deployments |
|
4 in 2004/05, 5 from 2005/06 |
Education |
|
Microsoft Software Licensing |
|
2 in 2003/04, 5 from 2004/05 |
Education |
|
Tertiary Education Commission |
|
9 from 2004/05 |
Internal Affairs |
|
Weathertight Homes Resolution Service |
|
5 in 2004/05, 8 from 2005/06 |
Maori Affairs |
|
Direct Resourcing of Local-Level Solutions |
|
3 in 2004/05, 7 from 2005/06 |
Social Development |
|
Community Employment Organisations |
|
10 from 2004/05 |
Statement of Specific Fiscal Risks
The fiscal risks included in the following tables were finalised as at 8 December 2003.
Quantified Risks(1)
The risks outlined in these tables would, if they eventuate, impact on the Government's forecast new operating and capital spending amounts.
Risks as at 8 December 2003
| | Operating
balance
| | Gross
debt
| | Net worth
| | ($ million)
|
|---|
| New risks | | | | | | | | |
ACC—Public Health Acute |
|
Decrease |
|
Increase |
|
Decrease |
|
- -11 operating from 2003/04 |
ACC—Treatment Costs |
|
Decrease |
|
Increase |
|
Decrease |
|
- -30 operating from 2004/05 |
Child, Youth and Family Services—2003 Residential Services Strategy |
|
Decrease |
|
Increase |
|
Decrease |
|
- -13 operating in 2004/05, rising to -31 from 2008/09; -27 capital in 2006/07 and 2007/08 |
Corrections—Funding of Staff Pay Settlements |
|
Decrease |
|
Increase |
|
Decrease |
|
- -11 operating in 2003/04, -18 in 2004/05, -22 from 2005/06 |
Customs—Enhanced Border Management |
|
Decrease |
|
Increase |
|
Decrease |
|
- -3 operating in 2003/04, -14 from 2004/05; -3 capital in 2003/04, -4 in 2004/05 and 2005/06 |
Health—Extension of the Health Capital Envelope |
|
Decrease |
|
Increase |
|
Decrease |
|
- -140 capital in 2006/07 and -100 in 200708 |
Health—Extension of the Health Funding Path |
|
Decrease |
|
Increase |
|
Decrease |
|
- -550 operating in 2006/07 |
New Zealand Defence Force—Environmental Clean-ups of Defence Bases |
|
Decrease |
|
Increase |
|
Decrease |
|
- -10 operating in 2005/06 and -5 in 2006/07 |
New Zealand Defence Force—NZDF Pay and Allowances |
|
Decrease |
|
Increase |
|
Decrease |
|
- -25 operating from 2004/05 |
New Zealand Defence Force—RNZAF—Personnel Increases |
|
Decrease |
|
Increase |
|
Decrease |
|
- -16 operating from 2004/05 |
New Zealand Defence Force—Stand-alone Security Response Organisation |
|
Decrease |
|
Increase |
|
Decrease |
|
- -6 operating in 2004/05, -7 from 2005/06; -21 capital in 2004/05 |
Revenue—Changes to Paid Parental Leave Scheme |
|
Decrease |
|
Increase |
|
Decrease |
|
- -30 from 2004/05 |
Social Development—Future Directions |
|
Decrease |
|
Increase |
|
Decrease |
|
low hundreds of millions in 2004/05, rising to high hundreds of millions in outyears |
Transport—Auckland Transport |
|
Decrease |
|
Increase |
|
Decrease |
|
- -900 over ten years |
Changed risks |
|
|
|
|
|
|
|
|
Corrections—Capital Projects |
|
Decrease |
|
Increase |
|
Decrease |
|
- -393 capital over 4 years; -126 operating over 4 years |
Health—District Health Board Deficits |
|
Decrease |
|
Increase |
|
Decrease |
|
- -79 operating in 2003/04, -46 in 2004/05, -45 in 2005/06 |
Revenue—Exemption for Overseas Earnings |
|
Decrease |
|
Increase |
|
Decrease |
|
- -20 operating from 2004/05 |
Revenue—Taxation of Offshore Portfolio Investment |
|
Decrease |
|
Increase |
|
Decrease |
|
- -20 operating from 2004/05 |
Unchanged risks |
|
|
|
|
|
|
|
|
ACC—Medical Misadventure Review |
|
Decrease |
|
Increase |
|
Decrease |
|
- -25 operating from 2003/04 |
Customs—Container Security |
|
Decrease |
|
Increase |
|
Decrease |
|
- -20 operating from 2004/05 |
Education—ECE Strategic Plan |
|
Decrease |
|
Increase |
|
Decrease |
|
- -120 operating over 4 years |
Education—School Property |
|
Decrease |
|
Increase |
|
Decrease |
|
- -75 capital in 2003/04, -115 from 2004/05; -1 operating in 2003/04, -9 in 2004/05, -21 in 2005/06, -30 in 2006/07 |
Education—United Nations Convention on the Rights of the Child |
|
Decrease |
|
Increase |
|
Decrease |
|
- -14 operating from 2003/04 |
Health—Mental Health Blueprint |
|
Decrease |
|
Increase |
|
Decrease |
|
- -25 operating in 2004/05, -50 operating in 2005/06, -75 operating in 2006/07, -100 operating in 2007/08, plus additional -25 each year until Budget 2020 |
New Zealand Defence Force—Defence Capital Injections |
|
Decrease |
|
Increase |
|
Decrease |
|
- -749 capital over 4 to 9 years |
Revenue—Tax Simplification for Small and Medium Enterprises |
|
Decrease |
|
Increase |
|
Decrease |
|
- -20 operating from 2004/05 |
- (1)
- In the summary tables listing specific risks:
- •
- negative numbers indicate a deterioration in the Crown's financial position
- •
- "N/A" means no effect
- •
- "Unclear" means insufficient information is available to determine the risk's effect.
In this chapter, "Gross Debt" refers to gross sovereign-issued debt.
Unquantified Risks
The risks outlined in this table would, if they eventuate, impact on the Government's forecast new operating and capital spending amounts.
Risks as at 8 December 2003
| | Operating
balance
| | Gross debt
| | Net worth
|
|---|
| New risks | | | | | | |
Education—Collective Employment Agreements |
|
Decrease |
|
Increase |
|
Decrease |
Education—Student Support |
|
Decrease |
|
Increase |
|
Decrease |
Finance—Crown Overseas Properties |
|
Unclear |
|
Unclear |
|
Unclear |
Health—Refinancing of District Health Board Private Debt |
|
Decrease |
|
Increase |
|
Decrease |
Health—Quality and Safety |
|
Decrease |
|
Increase |
|
Decrease |
Justice—Courts Capability |
|
Decrease |
|
Increase |
|
Decrease |
Lands and Conservation—Achievement of the Government's Objectives for the South Island High Country |
|
Decrease |
|
Increase |
|
Decrease |
New Zealand Defence Force—Relocation of NZDF Headquarters |
|
Decrease |
|
Increase |
|
Decrease |
Pay and Employment Equity Taskforce |
|
Decrease |
|
Increase |
|
Decrease |
State Owned Enterprise Capital Injections |
|
N/A |
|
Increase |
|
N/A |
State Services—Electronic Authentication of Identity |
|
Decrease |
|
Increase |
|
Decrease |
Changed risks |
|
|
|
|
|
|
Air New Zealand |
|
Unclear |
|
Unclear |
|
Unclear |
Unchanged risks |
|
|
|
|
|
|
Education—Partnerships for Excellence |
|
Potentially Increase |
|
Increase |
|
Potentially increase |
Education—Wananga Capital Injection |
|
N/A |
|
Increase |
|
N/A |
Climate Change and Energy Efficiency—Climate Change |
|
Unclear |
|
Unclear |
|
Unclear |
Foreign Affairs and Trade—Official Development Assistance |
|
Decrease |
|
Increase |
|
Decrease |
Gas Supply |
|
Decrease |
|
Increase |
|
Decrease |
Health—Wage Bargaining |
|
Decrease |
|
Increase |
|
Decrease |
Housing—Housing Strategy |
|
Decrease |
|
Increase |
|
Decrease |
Housing—State Housing Project at Hobsonville |
|
Decrease |
|
Increase |
|
Decrease |
Immigration—Immigration Policy |
|
Unclear |
|
Unclear |
|
Unclear |
New Zealand Defence Force—Sale of Skyhawks and Aermacchi Trainers |
|
Increase |
|
Decrease |
|
Increase |
Police—Capital Projects |
|
Decrease |
|
Increase |
|
Decrease |
Revenue—Fringe Benefit Tax Review |
|
Unclear |
|
Unclear |
|
Unclear |
Revenue—Gaming Review |
|
Unclear |
|
Unclear |
|
Unclear |
Revenue—Taxation of Savings and Investment Vehicles, Including Superannuation Funds |
|
Unclear |
|
Unclear |
|
Unclear |
Social Development—Benefit Payment Systems |
|
Decrease |
|
Increase |
|
Decrease |
Tourism—Marketing Opportunities with Team New Zealand |
|
Decrease |
|
Increase |
|
Decrease |
Risks Removed Since the 2003 Budget Update
Risks
| | Comment
|
|---|
| Agriculture and Forestry—Painted Apple Moth | | In the forecasts |
| Child, Youth and Family—Baseline Review | | In the forecasts |
| Conservation—Recognition of Fencing on the Conservation Estate | | In the forecasts |
| Corrections—Output Price Review | | In the forecasts |
| Education—Capital Injections for Tertiary Education Institutions | | Not under active consideration |
| Education—Collective Employment Agreements (principals) | | In the forecasts |
| Education—Improved Internet Access—Project Probe | | In the forecasts |
| Foreign Affairs and Trade—Ministry of Foreign Affairs and Trade Capability | | In the forecasts |
| Government Response to Growth and Innovation Framework Sector Taskforces | | In the forecasts |
| Police—Wage Bargaining | | In the forecasts |
| Social Development—Response to Joychild Report | | In the forecasts |
Quantified Fiscal Risks
New risks
ACC—Public Health Acute (new risk)
The Government is currently considering 2003/04 funding to reflect increased demand for ACC-funded services through the hospital system. While costs are still being determined, the Government-funded proportion of this is likely to be up to $11 million in 2003/04 and outyears, which would decrease the operating balance.
This risk would, if it eventuates, impact on the Government's forecast new operating spending amount.
The Minister of Finance has yet to fully consider the quantum of this risk.
Source: Department of Labour
ACC—Treatment Costs (new risk)
The Government is considering several options to increase access to ACC treatment providers. The potential cost of these options is up to $30 million operating from 2004/05, which would decrease the operating balance.
This risk would, if it eventuates, impact on the Government's forecast new operating spending amount.
The Minister of Finance has yet to fully consider the quantum of this risk.
Source: Department of Labour
Child, Youth and Family Services—2003 Residential Services Strategy (new risk)
The Department of Child, Youth and Family Services has undertaken a comprehensive review of existing residential services and practices, including consideration of desired outcomes, a review of international good practice and formal forecasting of demand. From this the department has developed
a strategy for future residential services—the 2003 Residential Services Strategy. The 2003 Strategy builds on the considerable investment in facilities made in implementing the 1996 Residential Services Strategy.
The Government has agreed in principle to the 2003 Strategy, subject to fully developed and costed proposals. The maximum operating cost is estimated to be up to $13 million in 2004/05, increasing each year to $31 million in 2008/09 and outyears, which would decrease the operating balance. The maximum capital cost is estimated to be up to $27 million in each of 2006/07 and 2007/08, which would increase gross debt.
The risk would, if it eventuates, impact on the Government's forecast new operating and capital spending amounts.
The Minister of Finance has yet to fully consider the quantum of this risk.
Source: Department of Child, Youth and Family Services
Corrections—Funding of Staff Pay Settlements (new risk)
The Department of Corrections has concluded pay negotiations for all major employment groups within the Department. The Government is now considering options to fund these settlements. The estimated operating costs of meeting the settlements are $11 million in 2003/04 and $18 million in 2004/05, rising to $22 million in 2005/06 and outyears, which would decrease the operating balance.
This risk would, if it eventuates, impact on the Government's forecast new operating spending amounts.
The Minister of Finance has yet to fully consider the quantum of this risk.
Source: Department of Corrections
Customs—Enhanced Border Management (new risk)
The Government is considering Customs' responses to heightened security concerns, which include proposals for significant increases in Customs' presence at air and sea ports, including additional launches for harbours, estuaries and navigable waterways. This proposal may require operating funding of up to $3 million in 2003/04 and $14 million in outyears, which would decrease the operating balance; and capital injections of $3 million in 2003/04 and $4 million in 2004/05 and 2005/06, which would increase gross debt.
This risk, if it eventuates, would impact on the Government's forecast new operating and capital spending amounts.
The Minister of Finance has yet to fully consider the quantum of this risk.
Source: New Zealand Customs Service
Health—Extension of the Capital Envelope (new risk)
The Government is considering an extension of the Health capital envelope to 2007/08 to provide adequate planning horizons for DHB capital projects. The cost of this extension has yet to be fully considered by the Government but is likely to be in the order of $140 million in 2006/07 and $100 million in 2007/08, which would increase gross debt.
This risk would, if it eventuates, impact on the Government's forecast new capital spending amount.
Source: Ministry of Health
Health—Extension of the Health Funding Path (new risk)
The Government is considering an extension of the Health Funding Path to 2006/07. The cost of this extension has yet to be fully considered by the Government but is likely to be in the order of $550 million from 2006/07, which would decrease the operating balance.
This risk, if it eventuates, would impact on the Government's forecast new operating spending amount.
Source: Ministry of Health
New Zealand Defence Force—Environmental Clean-ups of Defence Bases (new risk)
The Government is considering the options for dealing with areas of historic contamination at several New Zealand Defence Force (NZDF) bases, including the seabed adjacent to the Calliope Dock at the Devonport Naval Base. The estimated cost of cleaning up identified areas is $10 million in 2005/06 and $5 million in 2006/07, which would decrease the operating balance.
This risk would, if it eventuates, impact on the Government's forecast new operating spending amount.
The Minister of Finance has yet to fully consider the quantum of this risk.
Source: New Zealand Defence Force
New Zealand Defence Force—NZDF Pay and Allowances (new risk)
The NZDF is in the fourth year of a four-year programme to reinstate market relativity to Defence pay and allowances. The Government is considering its options for funding pay and allowances in the NZDF. The estimated operating cost is up to $25 million in 2004/05 and outyears, which would decrease the operating balance.
This risk would, if it eventuates, impact on the Government's forecast new operating spending amount.
The Minister of Finance has yet to fully consider the quantum of this risk.
Source: New Zealand Defence Force
New Zealand Defence Force—RNZAF—Personnel Increases (new risk)
The Government is considering what the appropriate personnel levels are to sustain Royal New Zealand Air Force (RNZAF) capabilities over the coming period and to have them aligned to future force structure, now that the RNZAF intends to consolidate its operational capability at Ohakea by 2008. The potential ongoing operating cost of further personnel is up to $16 million in 2004/05 and outyears, which would decrease the operating balance.
This risk would, if it eventuates, impact on the Government's forecast new operating spending amounts.
The Minister of Finance has yet to fully consider the quantum of this risk.
Source: New Zealand Defence Force
New Zealand Defence Force—Stand-Alone Security Response Organisation (new risk)
New Zealand's ability to respond to chemical, biological, radiological and explosive threats has been under review since 2001. The 2002 Budget provided funding for the establishment of a national chemical and biological response capability. The Government is considering proposals for a more comprehensive and responsive approach to deal with these threats. The estimated operating costs of a stand-alone security response organisation are $6 million in 2004/05 and $7 million in 2005/06 and outyears, which would decrease the operating balance, and capital costs of $21 million in 2004/05 only, which would increase gross debt.
This risk would, if it eventuates, impact on the Government's forecast new operating and capital spending amounts.
The Minister of Finance has yet to fully consider the quantum of this risk.
Source: New Zealand Defence Force
Revenue—Changes to Paid Parental Leave Scheme (new risk)
The Government will consider changes to the Paid Parental Leave scheme for introduction, at the earliest, during 2004/05. Depending on the composition of the final package of changes, the proposals may have an operating cost of up to $30 million per year, which would decrease the operating balance.
This risk would, if it eventuates, impact on the Government's forecast new operating spending amount.
The Minister of Finance has yet to fully consider the quantum of this risk.
Source: Department of Labour
Social Development—Future Directions (new risk)
The Government is considering various options for social assistance changes, involving potential changes to Family Income Assistance, the Childcare Subsidy, the Accommodation Supplement and Hardship Assistance. A variety of options are being considered, which may be implemented in a phased approach. The final package will be decided as part of the 2004 Budget, taking into account the affordability of any package in the context of the economic and fiscal situation at the time. The potential costs of the options under consideration at present are in the low hundreds of millions in 2004/05 to the high hundreds of millions in outyears.
This risk has been factored into the Government's forecast new operating spending amounts, therefore any decisions taken will not affect the forecast operating balance.
The Minister of Finance has yet to fully consider the quantum of this risk.
Source: Ministry of Social Development
Transport—Auckland Transport (new risk)
The Government has announced its proposed initiatives towards Auckland's transport issues, which involves an integrated solution including funding, governance and regulatory measures.
The proposals include a 5c per litre increase in petrol excise from 1 April 2005 and a potential Crown contribution of $900 million over ten years from 2005/06 into the National Land Transport Account, which would increase gross debt. The Government expects to make final decisions on the budget and fiscal management implications arising from these proposals in early 2004.
This risk would, if it eventuates, impact on the Government's forecast new operating and capital spending amounts.
Source: Ministry of Transport
Changed risks
Corrections—Capital Projects (changed risk)
The Department of Corrections has estimated that up to a total of $393 million of capital injections and operating funding of $126 million will be required over the forecasting period for capital projects to meet future prison muster forecasts ($398 million capital and $110 million operating in Budget Update).
The actual amounts will depend on the specification and timing of the individual projects and the contracted prices. These estimates include consideration of funding for the:
- •
- Spring Hill Corrections Facility
- •
- Otago Men's Corrections Facility
- •
- Mt Eden Prison
- •
- Auckland Women's Corrections Facility.
Capital injections would increase gross debt while operating funding would decrease the operating balance. This risk would, if it eventuates, impact on the Government's forecast new operating and capital spending amounts.
The Minister of Finance has yet to fully consider the quantum of these risks.
Source: Department of Corrections
Health—District Health Board Deficits (changed risk)
District health board (DHB) current annual plans signal forecast deficits of $79 million in 2003/04, $46 million in 2004/05 and $45 million in 2005/06 ($120 million in 2003/04 in the Budget Update). The Government has not accepted all the individual plans at this time, and is actively discussing with DHBs their plans and performance against them.
The impact on the operating balance, if any, is unclear. Any deficits above that provided for within the Health Funding Path will decrease the operating balance and increase gross debt. This risk would, if it eventuates, impact on the Government's forecast new operating and capital spending amounts.
The Minister of Finance has yet to fully consider the quantum of this risk.
Source: Ministry of Health
Revenue—Exemption for Overseas Earnings (changed risk)
The Government is considering options to reduce the tax-related costs for businesses of recruiting overseas workers.
The Government has released a discussion document proposing a time-limited exemption from tax on some or all overseas investment income, for people coming to work as employees in New Zealand. However, any proposal is not expected to be implemented before 2004/05.
The impact of this proposal on the operating balance is likely to be a decrease in the order of $20 million per annum (unquantified in the Budget Update), however the final impact remains unclear as it depends on the options chosen. This risk would, if it eventuates, impact on the Government's forecast new operating spending amount.
The Minister of Finance has yet to fully consider the quantum of this risk.
Source: Inland Revenue
Revenue—Taxation of Offshore Portfolio Investment (changed risk)
The Government intends to release an Issues Paper by the end of this year on reforms to the tax rules for offshore portfolio investment in equity. This paper will contain options arising from work on the offshore application of the Risk Free Return Method but is not limited to that approach (this risk referred only to the Risk Free Return Method in the Budget Update).
The impact on the operating balance is unclear at this stage and would depend on the options selected. It is expected to range from being broadly operating balance neutral to increasing the operating balance by between $20 million and $40 million per year.
This risk would, if it eventuates, impact on the Government's forecast new operating spending amount.
The Minister of Finance has yet to fully consider the quantum of this risk.
Source: Inland Revenue
Unchanged risks
ACC—Medical Misadventure Review (unchanged risk)
The Medical Misadventure Account is currently funded partly from the Earners' Account and partly by the Crown through the Non-Earners' Account. A review of the Medical Misadventure Account is underway, considering all aspects of the Account. Potential costs resulting from the Review range from zero to $47 million, some of which will be covered by ACC Earners' Levy payers.
The potential impact on the operating balance ranges from zero to a decrease of $25 million per annum from 2003/04.
This risk would, if it eventuates, impact on the Government's forecast new operating spending amount.
The Minister of Finance has yet to fully consider the quantum of this risk.
Source: Accident Compensation Corporation
Customs—Container Security (unchanged risk)
The Government has approved operating and capital funding in 2003/04 to provide real-time risk assurance and, where necessary, X-ray screening of export containers. The Government has yet to determine the appropriate arrangements for meeting operating costs in 2004/05 and outyears, but is considering fees to be imposed on exporters, importers and transport operators.
The ongoing operating cost is expected to be up to $20 million in 2004/05 and outyears, which would decrease the operating balance depending on the level of cost recovery. Any additional costs would impact on the Government's forecast new operating spending amount.
The Minister of Finance has yet to fully consider the quantum of this risk.
Source: New Zealand Customs Service
Education—ECE Strategic Plan (unchanged risk)
The Early Childhood Education (ECE) Strategic Plan, which sets out a 10-year action plan for the sector, was released in September 2002. This Plan signals major changes to the funding, regulation and ownership of ECE services. The Government is considering a number of issues related to implementation details, flow-on effects of kindergarten teachers' pay parity, and the balance of Government funding and parent fees.
These decisions may require operating funding that is estimated up to $120 million by 2006/07 and would decrease the operating balance. This risk would, if it eventuates, impact on the Government's forecast new operating spending amount.
The Minister of Finance has yet to fully consider the quantum of this risk.
Source: Ministry of Education
Education—School Property (unchanged risk)
The Government has provided $38 million in 2003/04 for school accommodation in the 2003 Budget. Additional capital injections for school accommodation are likely to be required in future years to meet roll growth. Capital injections are estimated to be up to $75 million in 2003/04 and $115 million in 2004/05 and each subsequent outyear.
In addition to capital injections, consequential operating costs are likely to be incurred. These are estimated at $1 million in 2003/04, $8 million in 2004/05, $21 million in 2005/06 and $30 million in 2006/07.
This risk would, if it eventuates, impact on the Government's forecast new operating and capital spending amounts.
The Minister of Finance has yet to fully consider the quantum of this risk.
Source: Ministry of Education
Education—United Nations Convention on the Rights of the Child (unchanged risk)
The United Nations Convention on the Rights of the Child obliges New Zealand to confer the rights of the Convention on all children. New Zealand has reserved its right to distinguish between persons according to the nature of their authority to be in New Zealand. However, the Government has indicated that it will undertake work to see if this reservation can be removed. This would involve making some changes to eligibility for some health and education services, which may decrease the operating balance by approximately $14 million per year.
This risk would, if it eventuates, impact on the Government's forecast new operating spending amount.
The Minister of Finance has yet to fully consider the quantum of this risk.
Source: Ministry of Education
Health—Mental Health Blueprint (unchanged risk)
The Mental Health Blueprint recommends an increasing funding profile for mental health services. This growth in funding has been included in forecasts to 2003/04, which was the furthest it could be extended to at the time the decision was taken. The Government is expected to consider further increases outside the Health Funding Path of $25 million in 2004/05, $50 million in 2005/06, $75 million in 2006/07, and $100 million in 2007/08 and an additional $25 million each year until Budget 2020, which would decrease the operating balance.
This risk would, if it eventuates, impact on the Government's forecast new operating spending amount.
Source: Ministry of Health
New Zealand Defence Force—Defence Capital Injections (unchanged risk)
Implementing the Government's decisions on the future force structure of the NZDF will involve a series of capital acquisitions across all three armed services to achieve the required capability upgrades. The Government has agreed to a capital injection of up to $1 billion between 2001/02 and 2010/11, of which $251 million has been agreed(2), with the bulk likely to be required within the next four years to enable these acquisitions to occur.
- (2)
- The total amount already agreed was listed as $287 million in the Budget Update. That figure included some funding that was not part of the $1 billion planned injection, so should have read $251 million. The substance of this risk has not changed since the Budget Update.
The actual expenditure profile will depend on the specification and timing of the individual projects, the contracted prices, and the prevailing exchange rate at the time of purchase.
The Minister of Finance is engaged in a process to consider the individual projects of this risk as they occur. Any capital injections would increase gross debt. This risk would, if it eventuates, impact on the Government's forecast new capital spending amount.
Source: New Zealand Defence Force
Revenue—Tax Simplification for Small and Medium Enterprises (unchanged risk)
The Government released a discussion document in September 2003 containing proposals to reduce tax compliance costs for small to medium enterprises. Depending upon the composition of the package of measures decided after consultation on the discussion document, the proposals may have a fiscal cost of between $20 million and $40 million per year, commencing at the earliest from 2004/05, which would decrease the operating balance.
This risk would, if it eventuates, impact on the Government's forecast new operating spending amount.
The Minister of Finance has yet to fully consider the quantum of this risk.
Source: Inland Revenue
Unquantified Fiscal Risks
New risks
Education—Collective Employment Agreements (new risk)
The primary and secondary teachers' collective agreements will expire on 30 April 2004. The Government will need to meet any fiscal impact in 2004/05 and beyond due to the renegotiation of these agreements, including any agreed contribution to the teachers' retirement savings scheme, and any adjustments to individual employment agreements. Any increase in funding required will decrease the operating balance.
This risk is unquantified, as disclosure could compromise the Crown in negotiations.
Education—Student Support (new risk)
Following the release of a discussion document in September 2003, the Government is now considering a package of initiatives relating to Student Support.
The impact, if any, of this proposal on the operating balance or debt is unclear as it depends on the options chosen. Any additional operating cost would decrease the operating balance and any capital injections would increase gross debt.
This risk would, if it eventuates, impact on the Government's forecast new operating spending amount.
Finance—Crown Overseas Properties (new risk)
The Government is considering options relating to the continued use of certain Crown overseas properties. The risk is unquantified as disclosure could compromise any negotiations the Crown may enter, but any additional operating funding will decrease the operating balance, while capital funding would increase gross debt. Alternatively, the sale of any properties would decrease gross debt.
The risk would, if it eventuates, impact on the Government's forecast new capital spending amount.
Health—Refinancing of District Health Board Private Debt (new risk)
All DHB debt owed to private lenders is currently being refinanced with debt supplied by the Crown. The Government is considering early refinancing of DHB private sector debt that was originally set to mature outside the current forecasting period. This would increase gross debt within the forecast period, but reduce the need for refinancing beyond the forecasting period.
Health—Quality and Safety (new risk)
The Government is considering options to improve the quality and safety of the services provided in the disability support sector. The risk is unquantified as policy options have yet to be developed and the amount and timing of any change in funding have yet to be determined.
This risk, if not funded from within the Health Funding Path, would impact on the Government's forecast new operating spending amount.
Justice—Courts Capability (new risk)
The Government is considering options to address immediate and significant operating and capital fiscal pressures in the Ministry of Justice's courts business. This risk is unquantified as the amount of any change in departmental funding is unclear, but any increase in funding to meet additional operating and capital costs would decrease the operating balance and increase gross debt.
This risk would, if it eventuates, impact on the Government's forecast new operating and capital spending amounts.
Lands and Conservation—Achievement of the Government's Objectives for the South Island High Country (new risk)
In 2003 the Government agreed a set of objectives for the South Island high country. It is now considering options to achieve and fund these objectives, including the Land Tenure Reform process, and is expected to make decisions as part of the 2004 Budget.
The risk is unquantified as disclosure could compromise the Crown in negotiations, but any additional operating funding would decrease the operating balance and additional capital would increase debt.
This risk would, if it eventuates, impact on the Government's forecast new operating and capital spending amounts.
New Zealand Defence Force—Relocation of NZDF Headquarters (new risk)
The NZDF current accommodation leases expire between 2004 and 2006, with the primary location at Stout Street needing to be vacated by March 2006. The NZDF is in negotiations with Capital Properties to consolidate all accommodation requirements for the NZDF, Ministry of Defence and NZ Security Intelligence Service. The Government is considering the options for the term of the lease and the rental mechanisms that will apply.
This risk would, if it eventuates, impact on the Government's forecast new operating and capital spending amounts. The risk is unquantified as disclosure could compromise the Crown in negotiations.
Pay and Employment Equity Taskforce (new risk)
The Government has established a taskforce to look into issues of pay and employment equity in the public service, public health and education sectors. The taskforce is expected to make recommendations for the Government to consider in March 2004. Given the timing of those recommendations, the uncertainty about the shape of any proposals that may flow from those recommendations and the difficulty in gauging whether any initiatives could be funded within baselines, it is not possible to determine the fiscal cost. However, any increased operating funding would decrease the operating balance.
This risk would, if it eventuates, impact on the Government's forecast new operating spending amounts.
State Owned Enterprise Capital Injections (new risk)
The Government is considering providing additional capital injections to SOEs, subject to there being favourable investment proposals available that would warrant an injection of equity. Proposals to provide additional Crown equity will be considered on a case-by-case basis.
This risk is unquantified because the Minister of Finance has yet to fully consider the quantum of any additional equity to be provided to SOEs, and also because disclosure of amounts in relation to any specific proposal from an SOE could compromise the Crown in commercial activities. This risk would, if it eventuates, impact on the Government's forecast new capital spending amounts.
State Services—Electronic Authentication of Identity (new risk)
The Government has provided funding for the State Services Commission to develop a scoping business case for electronic authentication of identity. It is expected to consider this business case in March 2004. Should the Government proceed with the electronic identification of identity then further funding may be required.
The risk is unquantified as disclosure could compromise the Crown in negotiations, but any additional operating funding will decrease the operating balance, while capital funding would increase debt.
This risk would, if it eventuates, impact on the Government's forecast new operating and capital spending amounts.
Changed risks
Air New Zealand (changed risk)
Air New Zealand and Qantas have announced they wish to form a strategic alliance, with Qantas acquiring a minority equity interest in Air New Zealand. Competition authorities (the Commerce Commission in New Zealand and the Australian Competition and Consumer Commission) have rejected the proposed alliance, as the authorities could not be satisfied that the public benefits from the proposed alliance would outweigh the detriment, but the airlines are appealing these decisions in both countries.
Should the appeal succeed, there may be an impact on the Government's share of Air New Zealand's future earnings, which would impact on the operating balance. This risk would, if it eventuates, impact on the Government's forecast new operating spending amount.
Unchanged risks
Education—Partnerships for Excellence (unchanged risk)
The Government has decided to establish an arrangement called "Partnerships for Excellence" whereby the Crown matches private sector investment in the tertiary sector. This risk is unquantified as funds will be considered on an annual basis subject to budgetary pressures. Depending on the nature of the partnership the operating balance may increase but any capital injections will increase gross debt.
This risk would, if it eventuates, impact on the Government's forecast new operating and capital spending amount.
Education—Wananga Capital Injection (unchanged risk)
Ministers are currently negotiating with one wananga (Mâori tertiary institution) over settlement of its Waitangi Tribunal claim. The Waitangi Tribunal has recommended that the wananga be compensated for capital expenditure that has been incurred on facilities to date, and be provided with funding to bring its facilities up to a standard comparable with other tertiary institutions and to meet additional capital requirements. Any capital injection will increase gross debt.
The fiscal risk is unquantified as disclosure could compromise the Crown in negotiations.
This risk would, if it eventuates, impact on the Government's forecast new capital spending amount.
Climate Change and Energy Efficiency—Climate Change (unchanged risk)
The Government has ratified the Kyoto Protocol, and has approved a policy package to meet commitments under the Protocol. The package contains the following elements, which will be targeted at different sectors as appropriate and may be funded through cash or emission units:
- •
- Existing policies aimed at greenhouse gas reduction, including the Waste Strategy renewable programme, and the Energy Efficiency and Conservation strategy.
- •
- A carbon charge with negotiated greenhouse agreements for those firms deemed to be "competitiveness at risk".
- •
- Emissions' reduction projects.
- •
- Methane and nitrous oxide mitigation research.
- •
- Mechanisms to incentivise the establishment and enhancement of carbon sinks.
At this stage, it is unclear what impact the decision to ratify the Protocol will have on the operating balance, either positive or negative, since this is closely related to the detailed design of the policy options.
This risk would, if it eventuates, impact on the Government's forecast new operating spending amount.
Foreign Affairs and Trade—Official Development Assistance (unchanged risk)
The Government is considering increasing the aid budget as and when resources allow, in line with United Nations commitments. This will involve looking at a range of options for increasing and allocating any additional funding, which would decrease the operating balance.
Gas Supply (unchanged risk)
The Government is considering options to improve certainty of gas supply, including for electricity generation. This involves direct negotiations with industry parties.
This risk is unquantified as disclosure could compromise the Crown in negotiations and commercial activities. This risk would, if it eventuates, impact on the Government's forecast new operating spending amount.
Health—Wage Bargaining (unchanged risk)
The New Zealand Nurses' Organisation has indicated it will be seeking substantial pay increases in a series of wage negotiations over the next six to twelve months. The Minister of Health has indicated to DHBs that the outcome of these negotiations must be met within their three-year Health Funding Paths. If this were not the case it would decrease the operating balance.
This risk is unquantified, as disclosure could compromise the Crown in negotiations. This risk, if not funded from within the Health Funding Path, would impact on the Government's forecast new operating spending amount.
Housing—Housing Strategy (unchanged risk)
In December 2002 the Government agreed that the Housing New Zealand Corporation (HNZC) would develop a New Zealand Housing Strategy involving consultation with all key stakeholders in the housing and wider social sectors.
The risk is unquantified as the amount or timing of any change in funding is unclear, but any increase in funding to meet additional operating costs would decrease the operating balance and any new capital contributions would increase gross debt.
This risk would, if it eventuates, impact on the Government's forecast new operating and capital spending amounts.
Housing—State Housing Project at Hobsonville (unchanged risk)
The Government has announced that the HNZC will acquire, under the Housing Act 1955, NZDF land at Hobsonville deemed surplus to Defence requirements but suitable for state housing purposes. Land made available for purchase by Defence was acquired by HNZC at the end of 2002/03. Additional land is expected to become available over the next three to four years.
Depending on development options taken and timing, the Corporation may require additional capital from the Crown, which would increase gross debt. This risk would, if it eventuates, impact on the Government's forecast new capital spending amount.
Immigration—Immigration Policy (unchanged risk)
The Government has made some high-level decisions about business immigration policies and is presently considering a number of implementation issues. The impacts on the operating balance and debt are unclear as they depend on the options chosen.
This risk would, if it eventuates, impact on the Government's forecast new operating spending amount.
New Zealand Defence Force—Sale of Skyhawks and Aermacchi Trainers (unchanged risk)
As a result of the Government's decisions on the future force structure of the NZDF, the NZDF is in the process of selling the Skyhawks and Aermacchi trainers. These sale proceeds would increase the operating balance and decrease gross debt.
This risk is unquantified as disclosure could compromise the Crown in the sale process. This risk would, if it eventuates, be considered against the Government's forecast new operating and capital spending amounts.
Police—Capital Projects (unchanged risk)
New Zealand Police has identified a number of Police stations that require capital work to bring them up to a modern operating standard.
The timing, scale and funding for new assets are unclear at this stage, but any capital injections would increase gross debt. This risk would, if it eventuates, impact on the Government's forecast new capital spending amount.
Revenue—Fringe Benefit Tax Review (unchanged risk)
The Government has decided to review the fringe benefit tax regime. The review will focus on reducing the difficulty and cost to employers of complying with fringe benefit tax, while ensuring the revenue base is maintained. A discussion document on this issue was released in December 2003. Any legislative changes resulting from the review will be introduced in 2004.
Any impact on the operating balance from any legislative amendments is unclear at this stage. This risk would, if it eventuates, impact on the Government's forecast new operating spending amount.
Revenue—Gaming Review (unchanged risk)
The Gaming Review was completed and the Gambling Act has now been passed. The Government, however, is still considering the taxation of gaming. Any impact on the operating balance arising from a response, whether positive or negative, is unclear.
This risk would, if it eventuates, impact on the Government's forecast new operating spending amount.
Revenue—Taxation of Savings and Investment Vehicles, Including Superannuation Funds (unchanged risk)
The Government is broadly considering whether the tax system creates impediments to adequate saving, whether savings intermediaries are correctly taxed, and whether the current taxation of retirement saving is equitable.
The impact of any proposal on the operating balance would vary widely by the options chosen and the method of implementation. This risk would, if it eventuates, impact on the Government's forecast new operating spending amount.
Social Development—Benefit Payment Systems (unchanged risk)
The Ministry of Social Development is considering the future development and/or replacement of its income benefit payment systems (SWIFTT and TRACE). Decisions will be made when an information technology strategy has been developed taking into account the Ministry's Statement of Intent and the results of the work on the reform of the social assistance system. Capital injections for development costs will have an impact on debt, and operating funding will affect the operating balance. The quantum of the risk cannot be determined until decisions have been made about which options are to be chosen.
This risk would, if it eventuates, impact on the Government's forecast new operating and capital spending amounts.
Tourism—Marketing Opportunities with Team New Zealand (unchanged risk)
The Government has announced that it has initially committed $6 million to Team New Zealand to retain team members for the 2007 America's Cup in Spain.
The Government may commit up to a maximum of $34 million in total as a marketing partner for the challenge. The final level of the Government's contribution will depend on an assessment of the potential economic benefits that can be leveraged off the next regatta in Europe and Team New Zealand's ability to raise substantial funding from the private sector.
This risk would, if it eventuates, impact on the Government's forecast new operating spending amount.
Contingent Liabilities
Contingent liabilities are costs that the Crown will have to face if a particular event occurs. Typically, contingent liabilities consist of guarantees and indemnities, legal disputes and claims, and uncalled capital. The contingent liabilities facing the Crown are a mixture of operating and balance sheet risks, and they can vary greatly in magnitude and likelihood of realisation. In general, if a contingent liability were realised it would reduce the operating balance and net worth, and increase net Crown debt. However, in the case of contingencies for uncalled capital, the negative impact would be restricted to net Crown debt.
Where contingent liabilities have arisen as a consequence of legal action being taken against the Crown, the amount shown is the amount claimed and thus the maximum potential cost. It does not represent either an admission that the claim is valid or an estimation of the possible amount of any award against the Crown.
Contingent liabilities have been stated as at 31 October 2003, being the last set of published contingent liabilities.
Details of each of the following contingent liabilities can be accessed from the Treasury website at www.treasury.govt.nz/forecasts/defu/2003/.
Quantifiable Contingent Liabilities
Guarantees and indemnities
| | Status(3)
| | ($ million)
|
|---|
| Cook Islands—Asian Development Bank loans | | Unchanged | | 18 |
Indemnification of receivers and managers—Terralink Limited |
|
Unchanged |
|
10 |
Indemnification of touring exhibitions |
|
Changed |
|
164 |
Mighty River Power Limited—guaranteed payment obligations |
|
Unchanged |
|
50 |
Ministry of Transport—funding guarantee |
|
Unchanged |
|
10 |
Post Office Bank—guaranteed deposits |
|
Changed |
|
13 |
Guarantees and indemnities of state-owned enterprises and Crown entities |
|
Changed |
|
4 |
Other guarantees and indemnities |
|
Changed |
|
78 |
|
|
|
|
|
|
|
|
|
347 |
Uncalled capital |
|
|
|
|
Asian Development Bank |
|
Changed |
|
1,159 |
European Bank for Reconstruction and Development |
|
Unchanged |
|
14 |
International Bank for Reconstruction and Development |
|
Changed |
|
1,345 |
|
|
|
|
|
|
|
|
|
2,518 |
Legal proceedings and disputes |
|
|
|
|
Health—legal claims |
|
Unchanged |
|
104 |
Tax in dispute |
|
Changed |
|
187 |
Legal claims and disputes of state-owned enterprises and Crown entities |
|
Changed |
|
9 |
Other legal claims |
|
Changed |
|
81 |
|
|
|
|
|
|
|
|
|
381 |
Other quantifiable contingent liabilities |
|
|
|
|
International finance organisations |
|
Changed |
|
1,016 |
Reserve Bank—demonetised currency |
|
Unchanged |
|
23 |
Social Development—claim for judicial review |
|
Changed |
|
70 |
Transpower New Zealand Limited |
|
Changed |
|
60 |
Other quantifiable contingent liabilities of state-owned enterprises and Crown entities |
|
Changed |
|
9 |
Other quantifiable contingent liabilities |
|
Changed |
|
44 |
|
|
|
|
1,222 |
|
|
|
|
|
|
|
|
|
4,468 |
- (3)
- Relative to reporting in the 30 June 2003 Crown financial statements.
Unquantifiable Contingent Liabilities
Institutional guarantees and indemnities
| | Status
|
|---|
| Air New Zealand Limited | | Unchanged |
Asure New Zealand Limited |
|
Unchanged |
At Work Insurance Limited |
|
Unchanged |
Auckland rail lease |
|
Unchanged |
Crown research institutes |
|
Unchanged |
DFC New Zealand Limited (under statutory management) |
|
Unchanged |
District Court Judges, Justices of the Peace, Coroners and Disputes Tribunal Referees |
|
Unchanged |
District health boards |
|
Unchanged |
Earthquake Commission |
|
Unchanged |
Electricity Corporation of New Zealand Limited |
|
Unchanged |
Fletcher Challenge Limited |
|
Unchanged |
Ministry of Fisheries—indemnity provided for delivery of registry services |
|
Unchanged |
Housing New Zealand Corporation |
|
Unchanged |
Indemnities against acts of war and terrorism |
|
Unchanged |
Maui Partners |
|
Unchanged |
National Provident Fund |
|
Unchanged |
New Zealand Railways Corporation |
|
Changed |
Persons exercising investigating powers |
|
Unchanged |
Public Trust |
|
Unchanged |
Purchasers of Crown operations |
|
Unchanged |
Reserve Bank of New Zealand |
|
Unchanged |
State Insurance Office tax liabilities |
|
Unchanged |
Works Civil Construction |
|
Unchanged |
Works Consultancy Services |
|
Unchanged |
Other unquantifiable contingent liabilities |
|
|
Environmental liabilities |
|
Unchanged |
Genesis Power Limited |
|
Unchanged |
New Zealand Post Primary Teachers' Association |
|
Unchanged |
Sale of Crown assets |
|
Unchanged |
Treaty of Waitangi claims |
|
Unchanged |
Treaty of Waitangi claims—settlement relativity payments |
|
Unchanged |
Generally Accepted Accounting
Practice (GAAP) Series Tables
Forecast Financial Statements
These forecasts have been prepared in accordance with the Fiscal Responsibility Act 1994.
They are based on the accounting policies and assumptions that follow. As with all such assumptions, there is a degree of uncertainty surrounding them. This uncertainty increases as the forecast horizon extends.
The forecasts have been prepared in accordance with the Statement of Responsibility and reflect the judgements and information known at the time they were prepared. They reflect all Government decisions and circumstances communicated to 8 December 2003.
Finalisation dates and key assumptions that underpin the preparation of the GAAP tables are outlined at the start of the Fiscal Outlook chapter on page 32.
10 year trend information
Summary indicators
(% of GDP)
| | 1999
Actual
| | 2000
Actual
| | 2001
Actual
| | 2002
Actual
| | 2003
Actual
| | 2004
Forecast
| | 2005
Forecast
| | 2006
Forecast
| | 2007
Forecast
| | 2008
Forecast
|
|---|
Revenue |
|
|
|
|
|
|
|
|
|
|
|
|
|
|
|
|
|
|
|
|
| Core Crown | | 33.8 | | 32.1 | | 32.7 | | 32.1 | | 33.9 | | 34.0 | | 34.1 | | 33.9 | | 33.8 | | 33.7 |
| Tax Revenue | | 29.3 | | 29.4 | | 29.9 | | 29.2 | | 30.9 | | 31.0 | | 30.9 | | 30.5 | | 30.2 | | 30.1 |
| Total Crown | | 40.7 | | 38.2 | | 39.1 | | 40.3 | | 44.3 | | 43.7 | | 44.2 | | 43.9 | | 43.6 | | 43.3 |
Expenses |
|
|
|
|
|
|
|
|
|
|
|
|
|
|
|
|
|
|
|
|
| Core Crown | | 33.3 | | 31.7 | | 31.5 | | 30.6 | | 32.4 | | 30.8 | | 30.7 | | 31.2 | | 31.2 | | 31.1 |
| Total Crown | | 39.0 | | 36.9 | | 38.0 | | 38.4 | | 42.9 | | 39.3 | | 39.8 | | 40.1 | | 39.9 | | 39.6 |
Operating balance |
|
1.7 |
|
1.4 |
|
1.2 |
|
1.9 |
|
1.5 |
|
4.5 |
|
4.4 |
|
3.8 |
|
3.7 |
|
3.7 |
OBERAC |
|
0.2 |
|
0.8 |
|
1.8 |
|
2.2 |
|
4.3 |
|
3.8 |
|
4.4 |
|
3.8 |
|
3.7 |
|
3.7 |
Net Worth |
|
5.8 |
|
7.9 |
|
9.9 |
|
15.2 |
|
18.5 |
|
22.0 |
|
25.4 |
|
27.9 |
|
30.3 |
|
32.5 |
Gross sovereign-issued debt |
|
35.6 |
|
33.1 |
|
31.6 |
|
29.2 |
|
28.0 |
|
25.3 |
|
23.0 |
|
21.9 |
|
21.2 |
|
20.4 |
Net Crown debt |
|
18.8 |
|
17.6 |
|
14.6 |
|
14.3 |
|
13.1 |
|
12.4 |
|
10.8 |
|
9.7 |
|
8.8 |
|
8.1 |
NZS Fund Balance |
|
0.0 |
|
0.0 |
|
0.0 |
|
0.5 |
|
1.5 |
|
2.9 |
|
4.3 |
|
5.9 |
|
7.4 |
|
9.0 |
Statement of Accounting Policies and Forecast Assumptions
General Accounting Policies and Forecast Assumptions
General Accounting Policies
Accounting policy
These Forecast Financial Statements comply with generally accepted accounting practice. The measurement base applied is historical cost adjusted for revaluations of property, plant and equipment (where appropriate), commercial forests and marketable securities & deposits and equity investments held for trading purposes.
Revaluations are made to reflect the forecast service potential or economic benefit obtained through control of the assets. The accrual basis of accounting has been used.
Forecast assumptions
For forecast purposes, no revaluations of property, plant and equipment are projected beyond the current year.
Specific Accounting Policies and Forecast Assumptions
Forecast periods
The reporting periods covered by these Forecast Financial Statements are the years ending 30 June 2004, 30 June 2005, 30 June 2006, 30 June 2007 and 30 June 2008.
Certain state-owned enterprises and Crown entities have different reporting periods from the Crown.
The forecasts for 30 June 2004 have generally been prepared using actual data to 30 September or 31 October 2003 (in some instances). Transactions for the remainder of the year are forecast in accordance with the Crown's accounting policies and forecast assumptions.
Changes in Accounting Policies
All policies have been applied on a consistent basis during the forecast period. There have been no changes in accounting policies during the period.
Changes in Presentation of Previous Budget Comparatives
The forecast information presented in the 2003 Budget Update presumed that the TEIs would be combined on a line-by-line basis. It was noted in previous publications that the combination treatment of TEIs was an issue still to resolve. The combination treatment adopted in the 30 June 2003 Crown financial statements and the 2003 December Update is to equity account for the TEIs net surpluses and net investment and not the TEI revenues, expenses, assets and liabilities on a line-by-line basis.
To ensure that valid comparisons can be made, the financial statements contain reclassified Budget Update information. The classification has reduced previously presented forecast information on total Crown revenues and expenses and replaced the removed revenues and expenses with the net surplus of TEIs, and reduced total Crown assets and liabilities and replaced them with the net investment in TEIs.
The previously presented forecasts of the operating balance, core Crown information, debt indicators and net worth are unchanged as a result of the combination approach for TEIs.
Changes in Forecast Assumptions
Changes to the forecast assumptions used for the forecasts published in the 2003 Budget Update are outlined on page 32.
Detailed Accounting Policies and Forecast Assumptions
The specific accounting and forecasting policies are reproduced in full on Treasury's website at www.treasury.govt.nz/forecasts/defu/2003/.
Reporting Entity as at 8 December 2003
These Forecast Financial Statements are for the Crown reporting entity as specified in Part III of the Public Finance Act 1989. This comprises Ministers of the Crown and the following entities:
Departments
| | Departments
| | State-owned enterprises
|
|---|
Agriculture and Forestry
Archives New Zealand
Child, Youth and Family Services
Conservation
Corrections
Crown Law
Culture and Heritage
Customs
Defence
Economic Development
Education
Education Review Office
Environment
Fisheries
Foreign Affairs and Trade
Government Communications Security Bureau
Health
Housing
Inland Revenue
Internal Affairs |
|
Justice
Labour
Land Information New Zealand
Maori Development
National Library
New Zealand Defence Force
Office of the Clerk
Pacific Island Affairs
Parliamentary Counsel Office
Parliamentary Service
Police
Prime Minister and Cabinet
Research, Science and Technology
Security Intelligence Service
Serious Fraud Office
Social Development
State Services Commission
Statistics
Transport
Treasury
Women's Affairs |
|
Agriquality New Zealand Limited
Airways Corporation of New Zealand Limited
Asure New Zealand Limited
Electricity Corporation of New
Zealand Limited
Genesis Power Limited
Landcorp Farming Limited
Meridian Energy Limited
Meteorological Service of New Zealand
Limited
Mighty River Power Limited
New Zealand Post Limited
New Zealand Railways Corporation
Solid Energy New Zealand Limited
Terralink New Zealand Limited (in liquidation)
Timberlands West Coast Limited
Transpower New Zealand Limited
Air New Zealand Limited (included for disclosure purposes as if it were a SOE) |
Crown entities
| |
|
|---|
Accident Compensation Corporation
Accounting Standards Review Board
Agriculture and Marketing Research and
Development Trust
Alcohol Advisory Council of New Zealand
Animal Control Products Limited
Arts Council of New Zealand Toi Aotearoa
Asia 2000 Foundation of New Zealand
Broadcasting Commission
Broadcasting Standards Authority
Building Industry Authority
Career Services
Casino Control Authority
Civil Aviation Authority of New Zealand
Commerce Commission
Commissioner for Children
Crown research institutes (9)
District health boards (21)
Early Childhood Development Board
Earthquake Commission
Electoral Commission
Electricity Governance Board
Energy Efficiency and Conservation Authority
Environmental Risk Management Authority
Fish and game councils (12)
Foundation for Research, Science and Technology | | New Zealand Film Commission
New Zealand Fire Service Commission
New Zealand Fish and Game Council
New Zealand Game Bird Habitat Trust Board
New Zealand Government Property Corporation
New Zealand Lotteries Commission
New Zealand Lottery Grants Board
New Zealand Qualifications Authority
New Zealand Sports Drug Agency
New Zealand Symphony Orchestra Limited
New Zealand Teacher's Council
New Zealand Trade and Enterprise
New Zealand Venture Investment Fund Limited
Ngai Tahu Ancillary Claims Trust
Office of Film and Literature Classification
Pacific Islands Employment Development Board
Pharmaceutical Management Agency
Police Complaints Authority
Privacy Commissioner
Public Trust
Quotable Value New Zealand Limited
Radio New Zealand Limited
Reserve boards (33)
Residual Health Management Unit
Retirement Commissioner
Road Safety Trust |
Government Superannuation Fund Authority
Health and Disability Commissioner
Health Research Council of New Zealand
Health Sponsorship Council
Housing New Zealand Corporation
Human Rights Commission
Land Transport Safety Authority of New Zealand
Law Commission
Leadership Development Centre Trust
Learning Media Limited
Legal Services Agency
Maritime Safety Authority of New Zealand
Mental Health Commission
Museum of New Zealand Te Papa Tongarewa
New Zealand Antarctic Institute
New Zealand Artificial Limb Board
New Zealand Blood Service | | School boards of trustees (2,599)
Securities Commission
Social Workers Registration Board
Sport and Recreation New Zealand
Standards Council
Takeovers Panel
Te Reo Whakapuaki Irirangi (Te Mangai Paho)
Te Taura Whiri I Te Reo Maori (Maori Language Commission)
Television New Zealand Limited
Tertiary education institutions (35)
Testing Laboratory Registration Council
The Guardians of New Zealand Superannuation
Tourism New Zealand
Transfund New Zealand
Transit New Zealand
Transport Accident Investigation Commission |
Reserve Bank of New Zealand |
|
Government Superannuation Fund |
Forecast Statement of Financial Performance
for the years ending 30 June
($ million)
| | Note
| | 2003
Actual
| | 2004
Previous
Budget
| | 2004
Forecast
| | 2005
Forecast
| | 2006
Forecast
| | 2007
Forecast
| | 2008
Forecast
| |
|---|
| Revenue | | | | | | | | | | | | | | | | | |
| Taxation revenue | | 1 | | 39,785 | | 40,651 | | 42,251 | | 44,114 | | 46,043 | | 47,944 | | 50,140 | |
| Levies, fees, fines and penalties | | 1 | | 2,763 | | 2,826 | | 3,013 | | 3,170 | | 3,241 | | 3,303 | | 3,377 | |
| | | | |
| |
| |
| |
| |
| |
| |
| |
| Total Revenue Levied through the Crown's Sovereign Power | | 1 | | 42,548 | | 43,477 | | 45,264 | | 47,284 | | 49,284 | | 51,247 | | 53,517 | |
Sales of goods and services |
|
2 |
|
10,385 |
|
10,281 |
|
10,380 |
|
11,657 |
|
12,297 |
|
12,709 |
|
13,034 |
|
| Investment income | | 3 | | 1,859 | | 1,831 | | 2,091 | | 2,452 | | 2,886 | | 3,335 | | 3,772 | |
| Other revenue | | 4 | | 2,235 | | 1,681 | | 1,787 | | 1,767 | | 1,756 | | 1,786 | | 1,805 | |
| | | | |
| |
| |
| |
| |
| |
| |
| |
| Total Revenue Earned through the Crown's Operations | | | | 14,479 | | 13,793 | | 14,258 | | 15,876 | | 16,939 | | 17,830 | | 18,611 | |
| | | | |
| |
| |
| |
| |
| |
| |
| |
| Total Crown Revenue | | | | 57,027 | | 57,270 | | 59,522 | | 63,160 | | 66,223 | | 69,077 | | 72,128 | |
| | | | |
| |
| |
| |
| |
| |
| |
| |
Expenses
By input type | | | | | | | | | | | | | | | | | |
| Subsidies and transfer payments | | 5 | | 15,107 | | 15,787 | | 15,516 | | 15,869 | | 16,584 | | 17,296 | | 18,060 | |
| Personnel expenses | | 6 | | 11,620 | | 12,099 | | 12,245 | | 12,640 | | 12,945 | | 12,993 | | 13,056 | |
| Operating expenses | | 7 | | 22,565 | | 22,888 | | 23,476 | | 24,318 | | 25,302 | | 25,688 | | 25,966 | |
| New operating spending for Budget 2004 | | 8 | | — | | 175 | | 35 | | 1,153 | | 1,679 | | 1,910 | | 2,113 | |
| Forecast new operating spending | | 8 | | — | | — | | — | | — | | 978 | | 2,422 | | 3,915 | |
| Finance costs | | | | 2,550 | | 2,225 | | 2,556 | | 2,419 | | 2,511 | | 2,427 | | 2,406 | |
| Net foreign-exchange (gains)/losses | | | | 81 | | — | | (38 | ) | — | | — | | — | | — | |
| Movement in total GSF liability | | 15 | | 1,647 | | (87 | ) | (364 | ) | (51 | ) | (75 | ) | (108 | ) | (128 | ) |
| Movement in total ACC liability | | 16 | | 1,654 | | 499 | | 82 | | 552 | | 584 | | 612 | | 634 | |
| | | | |
| |
| |
| |
| |
| |
| |
| |
| Total Crown expenses | | | | 55,224 | | 53,586 | | 53,508 | | 56,900 | | 60,508 | | 63,240 | | 66,022 | |
| | | | |
| |
| |
| |
| |
| |
| |
| |
| Revenues less Expenses | | | | 1,803 | | 3,684 | | 6,014 | | 6,260 | | 5,715 | | 5,837 | | 6,106 | |
| Net surplus of TEIs | | | | 151 | | 77 | | 78 | | 78 | | 80 | | 81 | | 81 | |
| Operating balance (including minority interest) | | | | 1,954 | | 3,761 | | 6,092 | | 6,338 | | 5,795 | | 5,918 | | 6,187 | |
| Minority interest | | | | 12 | | — | | — | | — | | — | | — | | — | |
| | | | |
| |
| |
| |
| |
| |
| |
| |
| Operating Balance | | | | 1,966 | | 3,761 | | 6,092 | | 6,338 | | 5,795 | | 5,918 | | 6,187 | |
| | | | |
| |
| |
| |
| |
| |
| |
| |
The revenues and expenses are GST exclusive.
The accompanying Notes and Accounting policies are an integral part of these Statements.
Below is an analysis of total Crown expenses and core Crown expenses by functional classification. This information reconciles to segmental information within the Statement of Segments.
($ million)
| | 2003
Actual
| | 2004
Previous
Budget
| | 2004
Forecast
| | 2005
Forecast
| | 2006
Forecast
| | 2007
Forecast
| | 2008
Forecast
|
|---|
| Total Crown expenses by functional classification | | | | | | | | | | | | | | |
| Social security and welfare | | 17,084 | | 16,534 | | 15,971 | | 16,865 | | 17,614 | | 18,354 | | 19,120 |
| GSF pension expenses | | 2,625 | | 923 | | 622 | | 956 | | 976 | | 981 | | 981 |
| Health | | 7,412 | | 7,970 | | 7,961 | | 8,166 | | 8,809 | | 8,731 | | 8,666 |
| Education | | 7,788 | | 8,134 | | 8,245 | | 8,491 | | 8,704 | | 8,872 | | 9,078 |
| Core government services | | 1,655 | | 1,623 | | 1,683 | | 1,592 | | 1,642 | | 1,595 | | 1,606 |
| Law and order | | 1,911 | | 1,966 | | 1,999 | | 2,035 | | 2,063 | | 2,077 | | 2,064 |
| Defence | | 1,154 | | 1,151 | | 1,204 | | 1,153 | | 1,146 | | 1,148 | | 1,150 |
| Transport and communications | | 5,619 | | 5,738 | | 5,329 | | 5,982 | | 6,190 | | 6,330 | | 6,446 |
| Economic and industrial services | | 4,280 | | 3,792 | | 4,509 | | 4,643 | | 4,727 | | 4,849 | | 4,877 |
| Primary services | | 1,023 | | 1,083 | | 1,142 | | 1,113 | | 1,126 | | 1,157 | | 1,173 |
| Heritage, culture and recreation | | 1,425 | | 1,556 | | 1,561 | | 1,616 | | 1,632 | | 1,672 | | 1,711 |
| Housing and community development | | 542 | | 607 | | 620 | | 610 | | 607 | | 611 | | 612 |
| Other | | 75 | | 109 | | 109 | | 106 | | 104 | | 104 | | 104 |
| Finance costs | | 2,550 | | 2,225 | | 2,556 | | 2,419 | | 2,511 | | 2,427 | | 2,406 |
| Net foreign-exchange (gains)/losses | | 81 | | — | | (38 | ) | — | | — | | — | | — |
| New operating spending for the 2004 Budget | | — | | 175 | | 35 | | 1,153 | | 1,679 | | 1,910 | | 2,113 |
| Forecast new operating spending | | — | | — | | — | | — | | 978 | | 2,422 | | 3,915 |
| | |
| |
| |
| |
| |
| |
| |
|
| Total Crown Expenses | | 55,224 | | 53,586 | | 53,508 | | 56,900 | | 60,508 | | 63,240 | | 66,022 |
| | |
| |
| |
| |
| |
| |
| |
|
| Core Crown expenses by functional classification | | | | | | | | | | | | | | |
| Social security and welfare | | 13,907 | | 14,446 | | 14,296 | | 14,685 | | 15,316 | | 15,953 | | 16,634 |
| GSF pension expenses | | 2,625 | | 923 | | 622 | | 956 | | 976 | | 981 | | 981 |
| Health | | 7,501 | | 8,176 | | 8,245 | | 8,527 | | 9,194 | | 9,187 | | 9,149 |
| Education | | 7,016 | | 7,607 | | 7,570 | | 7,802 | | 7,981 | | 8,132 | | 8,218 |
| Core government services | | 1,780 | | 1,693 | | 1,757 | | 1,664 | | 1,719 | | 1,669 | | 1,681 |
| Law and order | | 1,734 | | 1,774 | | 1,826 | | 1,861 | | 1,884 | | 1,883 | | 1,874 |
| Defence | | 1,199 | | 1,192 | | 1,247 | | 1,201 | | 1,194 | | 1,194 | | 1,194 |
| Transport and communications | | 1,408 | | 1,316 | | 1,436 | | 1,413 | | 1,457 | | 1,501 | | 1,553 |
| Economic and industrial services | | 1,054 | | 1,226 | | 1,297 | | 1,283 | | 1,285 | | 1,253 | | 1,234 |
| Primary services | | 355 | | 367 | | 417 | | 359 | | 354 | | 353 | | 351 |
| Heritage, culture and recreation | | 515 | | 575 | | 641 | | 651 | | 647 | | 647 | | 648 |
| Housing and community development | | 102 | | 135 | | 146 | | 122 | | 117 | | 113 | | 111 |
| Other | | 75 | | 110 | | 109 | | 106 | | 104 | | 105 | | 105 |
| Finance costs | | 2,360 | | 2,023 | | 2,249 | | 2,094 | | 2,169 | | 2,082 | | 2,104 |
| Net foreign-exchange losses/(gains) | | 118 | | — | | (25 | ) | — | | — | | — | | — |
| New operating spending for the 2004 Budget | | — | | 175 | | 35 | | 1,153 | | 1,679 | | 1,910 | | 2,113 |
| Forecast new operating spending | | — | | — | | — | | — | | 978 | | 2,422 | | 3,915 |
| | |
| |
| |
| |
| |
| |
| |
|
| Total Core Crown Expenses | | 41,749 | | 41,738 | | 41,868 | | 43,877 | | 47,054 | | 49,385 | | 51,865 |
| | |
| |
| |
| |
| |
| |
| |
|
Forecast Statement of Cash Flows
for the year ending 30 June
($ million)
| | 2003
Actual
| | 2004
Previous
Budget
| | 2004
Forecast
| | 2005
Forecast
| | 2006
Forecast
| | 2007
Forecast
| | 2008
Forecast
| |
|---|
| Cash Flows from Operations | | | | | | | | | | | | | | | |
| Cash was Provided from | | | | | | | | | | | | | | | |
| Total tax receipts (refer Note 1) | | 39,468 | | 40,609 | | 42,215 | | 44,131 | | 46,026 | | 47,920 | | 50,117 | |
| Total other sovereign receipts (refer Note 1) | | 2,531 | | 2,724 | | 2,867 | | 2,940 | | 3,002 | | 3,076 | | 3,096 | |
| Interest | | 1,200 | | 919 | | 1,151 | | 1,093 | | 1,098 | | 1,212 | | 1,257 | |
| Dividends | | 45 | | 47 | | 60 | | 68 | | 78 | | 87 | | 97 | |
| Sales of goods and services | | 10,543 | | 9,798 | | 10,276 | | 11,290 | | 12,034 | | 12,432 | | 12,761 | |
| Other operating receipts | | 1,503 | | 1,816 | | 1,482 | | 1,416 | | 1,425 | | 1,485 | | 1,525 | |
| | |
| |
| |
| |
| |
| |
| |
| |
| Total Cash Provided from Operations | | 55,290 | | 55,913 | | 58,051 | | 60,938 | | 63,663 | | 66,212 | | 68,853 | |
Cash was Disbursed to |
|
|
|
|
|
|
|
|
|
|
|
|
|
|
|
| Subsidies and transfer payments | | 15,305 | | 16,187 | | 15,965 | | 16,374 | | 17,115 | | 17,841 | | 18,625 | |
| Personnel and operating payments | | 30,087 | | 31,412 | | 32,385 | | 32,746 | | 33,822 | | 34,052 | | 34,454 | |
| Finance costs | | 2,203 | | 2,168 | | 2,360 | | 2,328 | | 2,310 | | 2,130 | | 2,111 | |
| Forecast new operating spending | | — | | 175 | | 35 | | 1,153 | | 2,657 | | 4,332 | | 6,028 | |
| | |
| |
| |
| |
| |
| |
| |
| |
| Total Cash Disbursed to Operations | | 47,595 | | 49,942 | | 50,745 | | 52,601 | | 55,904 | | 58,355 | | 61,218 | |
| | |
| |
| |
| |
| |
| |
| |
| |
| Net Cash Flows from Operations | | 7,695 | | 5,971 | | 7,306 | | 8,337 | | 7,759 | | 7,857 | | 7,635 | |
| | |
| |
| |
| |
| |
| |
| |
| |
| Cash Flows from Investing Activities | | | | | | | | | | | | | | | |
| Cash was Provided from | | | | | | | | | | | | | | | |
| Sale of physical assets | | 240 | | 103 | | 28 | | — | | — | | — | | — | |
| | |
| |
| |
| |
| |
| |
| |
| |
| Total Cash Provided | | 240 | | 103 | | 28 | | — | | — | | — | | — | |
Cash was Disbursed to |
|
|
|
|
|
|
|
|
|
|
|
|
|
|
|
| Purchase of physical assets | | 3,492 | | 3,619 | | 3,893 | | 4,112 | | 3,459 | | 3,074 | | 3,063 | |
| Net increase in advances | | 1,341 | | 1,527 | | 1,366 | | 1,333 | | 1,364 | | 1,140 | | 1,010 | |
| Net purchase/(sale) of marketable securities, deposits and other equity investments | | 5,023 | | (35 | ) | (87 | ) | 1,720 | | 2,705 | | 2,560 | | 2,223 | |
| Forecast new capital spending | | — | | 206 | | 124 | | 661 | | 448 | | 500 | | 550 | |
| | |
| |
| |
| |
| |
| |
| |
| |
| Total Cash Disbursed | | 9,856 | | 5,317 | | 5,296 | | 7,826 | | 7,976 | | 7,274 | | 6,846 | |
| | |
| |
| |
| |
| |
| |
| |
| |
| Net Cash Flows from Investing Activities | | (9,616 | ) | (5,214 | ) | (5,268 | ) | (7,826 | ) | (7,976 | ) | (7,274 | ) | (6,846 | ) |
| | |
| |
| |
| |
| |
| |
| |
| |
| Net Cash Flows from Operating and Investing Activities | | (1,921 | ) | 757 | | 2,038 | | 511 | | (217 | ) | 583 | | 789 | |
| | |
| |
| |
| |
| |
| |
| |
| |
| Cash Flows from Financing Activities | | | | | | | | | | | | | | | |
| Cash was Provided from | | | | | | | | | | | | | | | |
| Issue of circulating currency | | 147 | | — | | 33 | | — | | — | | — | | — | |
| Net issue/(repayment) of Government stock(1) | | 292 | | (506 | ) | (1,018 | ) | (711 | ) | (169 | ) | 286 | | (288 | ) |
| | |
| |
| |
| |
| |
| |
| |
| |
| Total Cash Provided | | 439 | | (506 | ) | (985 | ) | (711 | ) | (169 | ) | 286 | | (288 | ) |
Cash was Disbursed to |
|
|
|
|
|
|
|
|
|
|
|
|
|
|
|
| Net repayment/(issue) of foreign-currency borrowing | | (392 | ) | 327 | | 1,330 | | 456 | | 105 | | 107 | | 109 | |
| Net repayment/(issue) of other New Zealand-dollar borrowing | | (1,542 | ) | (6 | ) | 11 | | (619 | ) | (575 | ) | 596 | | 210 | |
| | |
| |
| |
| |
| |
| |
| |
| |
| Total Cash Disbursed | | (1,934 | ) | 321 | | 1,341 | | (163 | ) | (470 | ) | 703 | | 319 | |
| | |
| |
| |
| |
| |
| |
| |
| |
| Net Cash Flows from Financing Activities | | 2,373 | | (827 | ) | (2,326 | ) | (548 | ) | 301 | | (417 | ) | (607 | ) |
| | |
| |
| |
| |
| |
| |
| |
| |
Net Movement in Cash |
|
452 |
|
(70 |
) |
(288 |
) |
(37 |
) |
84 |
|
166 |
|
182 |
|
| Opening Cash Balance | | 2,274 | | 2,147 | | 2,732 | | 2,455 | | 2,425 | | 2,516 | | 2,689 | |
| | |
| |
| |
| |
| |
| |
| |
| |
| Foreign-exchange gains on opening cash balances | | 6 | | (4 | ) | 11 | | 7 | | 7 | | 7 | | 7 | |
| | |
| |
| |
| |
| |
| |
| |
| |
| Closing Cash Balance | | 2,732 | | 2,073 | | 2,455 | | 2,425 | | 2,516 | | 2,689 | | 2,878 | |
| | |
| |
| |
| |
| |
| |
| |
| |
- (1)
- Net issues of Government stock include movements within government stock holdings of entities such as NZS Fund, GSF, ACC and EQC. The Bonds Reconciliation at the end of these forecasts outlines NZDMO issues of Government stock.
The accompanying Notes and Accounting policies are an integral part of these Statements.
($ million)
| | 2003
Actual
| | 2004
Previous
Budget
| | 2004
Forecast
| | 2005
Forecast
| | 2006
Forecast
| | 2007
Forecast
| | 2008
Forecast
| |
|---|
| Reconciliation Between the Forecast Net Cash Flows from Operations and the Operating Balance | | | | | | | | | | | | | | | |
| Net Cash Flows from Operations | | 7,695 | | 5,971 | | 7,306 | | 8,337 | | 7,759 | | 7,857 | | 7,635 | |
Items included in the operating balance but not in net cash flows from operations |
|
|
|
|
|
|
|
|
|
|
|
|
|
|
|
Valuation Changes |
|
|
|
|
|
|
|
|
|
|
|
|
|
|
|
| (Increase)/decrease in pension liabilities | | (1,647 | ) | 87 | | 364 | | 51 | | 75 | | 108 | | 128 | |
| (Increase)/decrease in ACC liability | | (1,654 | ) | (499 | ) | (82 | ) | (552 | ) | (584 | ) | (612 | ) | (634 | ) |
| Decrease/(increase) in NPF guarantee | | (197 | ) | — | | — | | — | | — | | — | | — | |
| Unrealised net foreign exchange losses | | (247 | ) | — | | — | | — | | — | | — | | — | |
| Non-cash movements in investments | | (349 | ) | 108 | | — | | — | | — | | — | | — | |
| Unrealised losses arising from changes in the value of commercial forests | | (20 | ) | — | | — | | — | | — | | — | | — | |
| | |
| |
| |
| |
| |
| |
| |
| |
| Total Valuation Changes | | (4,114 | ) | (304 | ) | 282 | | (501 | ) | (509 | ) | (504 | ) | (506 | ) |
Physical Asset Movements |
|
|
|
|
|
|
|
|
|
|
|
|
|
|
|
| Depreciation | | (2,177 | ) | (2,340 | ) | (2,446 | ) | (2,551 | ) | (2,642 | ) | (2,722 | ) | (2,789 | ) |
| (Loss)/gain on sale of assets | | (19 | ) | — | | — | | — | | — | | — | | — | |
| | |
| |
| |
| |
| |
| |
| |
| |
| Total Physical Asset Movements | | (2,196 | ) | (2,340 | ) | (2,446 | ) | (2,551 | ) | (2,642 | ) | (2,722 | ) | (2,789 | ) |
Other Non-cash Items |
|
|
|
|
|
|
|
|
|
|
|
|
|
|
|
| Student Loans | | (79 | ) | (99 | ) | (49 | ) | (36 | ) | (13 | ) | 9 | | 38 | |
| Amortisation of goodwill | | (84 | ) | (47 | ) | (47 | ) | (47 | ) | (47 | ) | (47 | ) | (47 | ) |
| Accrued income from NZS Fund | | — | | 187 | | 72 | | 300 | | 449 | | 616 | | 804 | |
| Other | | 127 | | 77 | | 77 | | 78 | | 80 | | 81 | | 81 | |
| | |
| |
| |
| |
| |
| |
| |
| |
| Total Other Non-cash Items | | (36 | ) | 118 | | 53 | | 295 | | 469 | | 659 | | 876 | |
Movements in Working Capital |
|
|
|
|
|
|
|
|
|
|
|
|
|
|
|
| (Decrease)/increase in taxes receivable | | 685 | | 37 | | 23 | | (5 | ) | 9 | | 19 | | 17 | |
| Increase/(decrease) in other receivables | | 854 | | (113 | ) | (517 | ) | 167 | | 210 | | 93 | | 203 | |
| Increase/(decrease) in inventories | | (56 | ) | 35 | | 84 | | 68 | | 46 | | (4 | ) | (6 | ) |
| (Increase)/decrease in payables | | (866 | ) | 357 | | 1,307 | | 528 | | 453 | | 520 | | 757 | |
| | |
| |
| |
| |
| |
| |
| |
| |
| Total Movements in Working Capital | | 617 | | 316 | | 897 | | 758 | | 718 | | 628 | | 971 | |
| | |
| |
| |
| |
| |
| |
| |
| |
| Operating Balance | | 1,966 | | 3,761 | | 6,092 | | 6,338 | | 5,795 | | 5,918 | | 6,187 | |
| | |
| |
| |
| |
| |
| |
| |
| |
The accompanying Notes and Accounting policies are an integral part of these Statements.
Forecast Statement of Movement in Equity
for the year ending 30 June
($ million)
| | 2003
Actual
| | 2004
Previous
Budget
| | 2004
Forecast
| | 2005
Forecast
| | 2006
Forecast
| | 2007
Forecast
| | 2008
Forecast
|
|---|
| Opening Crown Balance | | 18,820 | | 20,197 | | 23,781 | | 29,920 | | 36,258 | | 42,053 | | 47,971 |
Operating balance for the year |
|
1,966 |
|
3,761 |
|
6,092 |
|
6,338 |
|
5,795 |
|
5,918 |
|
6,187 |
| Net revaluations | | 2,995 | | — | | 47 | | — | | — | | — | | — |
| | |
| |
| |
| |
| |
| |
| |
|
| Total Recognised Revenues and Expenses | | 4,961 | | 3,761 | | 6,139 | | 6,338 | | 5,795 | | 5,918 | | 6,187 |
Asset and liability recognition policy changes |
|
— |
|
— |
|
— |
|
— |
|
— |
|
— |
|
— |
| | |
| |
| |
| |
| |
| |
| |
|
| Closing Crown Balance | | 23,781 | | 23,958 | | 29,920 | | 36,258 | | 42,053 | | 47,971 | | 54,158 |
| | |
| |
| |
| |
| |
| |
| |
|
The accompanying Notes and Accounting policies are an integral part of these Statements.
Forecast Statement of Financial Position
as at 30 June
($ million)
| | Note
| | 2003
Actual
| | 2004
Previous
Budget
| | 2004
Forecast
| | 2005
Forecast
| | 2006
Forecast
| | 2007
Forecast
| | 2008
Forecast
|
|---|
| Assets | | | | | | | | | | | | | | | | |
| Cash and bank balances | | 9 | | 2,732 | | 2,073 | | 2,455 | | 2,425 | | 2,516 | | 2,689 | | 2,878 |
| Marketable securities, deposits & equity investments | | 9 | | 21,306 | | 19,453 | | 21,742 | | 23,728 | | 26,939 | | 30,565 | | 34,234 |
| Advances | | 10 | | 6,300 | | 7,222 | | 7,587 | | 8,860 | | 10,118 | | 10,948 | | 11,832 |
| Receivables | | 11 | | 10,143 | | 8,325 | | 9,649 | | 9,811 | | 10,030 | | 10,142 | | 10,362 |
| Inventories | | | | 840 | | 902 | | 924 | | 992 | | 1,038 | | 1,034 | | 1,028 |
| Other investments | | 12 | | 264 | | 396 | | 261 | | 261 | | 261 | | 261 | | 261 |
| Property, plant and equipment | | 13 | | 52,667 | | 52,105 | | 53,527 | | 55,035 | | 55,794 | | 56,112 | | 56,249 |
| TEI investment | | | | 4,212 | | 3,976 | | 4,428 | | 4,534 | | 4,614 | | 4,696 | | 4,777 |
| Commercial forests | | | | 312 | | 302 | | 305 | | 306 | | 306 | | 306 | | 306 |
| Intangible assets (including goodwill) | | | | 1,075 | | 618 | | 1,130 | | 1,009 | | 912 | | 844 | | 776 |
| Forecast new capital spending | | | | — | | 206 | | 124 | | 785 | | 1,233 | | 1,733 | | 2,283 |
| | | | |
| |
| |
| |
| |
| |
| |
|
| Total Assets | | | | 99,851 | | 95,578 | | 102,132 | | 107,746 | | 113,761 | | 119,330 | | 124,986 |
| | | | |
| |
| |
| |
| |
| |
| |
|
| Liabilities | | | | | | | | | | | | | | | | |
| Payables and provisions | | 14 | | 11,878 | | 9,744 | | 10,436 | | 10,238 | | 10,103 | | 10,082 | | 9,997 |
| Currency issued | | | | 2,895 | | 2,963 | | 2,928 | | 2,928 | | 2,928 | | 2,928 | | 2,928 |
| Borrowings—sovereign guaranteed | | | | 31,077 | | 28,957 | | 29,063 | | 26,769 | | 26,002 | | 25,686 | | 25,207 |
| Borrowings—non-sovereign guaranteed | | | | 7,208 | | 7,421 | | 7,055 | | 8,322 | | 8,935 | | 8,419 | | 7,946 |
| Provision for GSF pension liability | | 15 | | 13,857 | | 13,335 | | 13,493 | | 13,442 | | 13,367 | | 13,259 | | 13,131 |
| Provision for ACC outstanding claims liability | | 16 | | 9,155 | | 9,200 | | 9,237 | | 9,789 | | 10,373 | | 10,985 | | 11,619 |
| | | | |
| |
| |
| |
| |
| |
| |
|
| Total Liabilities | | | | 76,070 | | 71,620 | | 72,212 | | 71,488 | | 71,708 | | 71,359 | | 70,828 |
| | | | |
| |
| |
| |
| |
| |
| |
|
| Total Assets less Total Liabilities | | | | 23,781 | | 23,958 | | 29,920 | | 36,258 | | 42,053 | | 47,971 | | 54,158 |
| | | | |
| |
| |
| |
| |
| |
| |
|
| Crown Balance | | | | | | | | | | | | | | | | |
| Taxpayer funds | | | | 8,063 | | 11,172 | | 14,257 | | 20,595 | | 26,390 | | 32,308 | | 38,495 |
| Revaluation reserve | | 17 | | 15,624 | | 12,786 | | 15,663 | | 15,663 | | 15,663 | | 15,663 | | 15,663 |
| Minority Interest | | | | 94 | | — | | — | | — | | — | | — | | — |
| | | | |
| |
| |
| |
| |
| |
| |
|
| Crown Balance | | | | 23,781 | | 23,958 | | 29,920 | | 36,258 | | 42,053 | | 47,971 | | 54,158 |
| | | | |
| |
| |
| |
| |
| |
| |
|
The accompanying Notes and Accounting policies are an integral part of these Statements.
Below is an analysis of the NZS Fund and Gross and Net Debt information. The notes to the accounts provide breakdown of other key items.
($ million)
| | 2003
Actual
| | 2004
Previous
Budget
| | 2004
Forecast
| | 2005
Forecast
| | 2006
Forecast
| | 2007
Forecast
| | 2008
Forecast
|
|---|
| New Zealand Superannuation Fund | | | | | | | | | | | | | | |
Within MSDs & equity investments is the NZS Fund (except for cross holdings of investments with other parts of the Crown, for example the NZS Fund will hold NZ Government Stock). The following information includes all investments and income, including cross-holdings of NZ Government Stock and accrued interest on such stock.
| Opening balance | | 615 | | 1,884 | | 1,884 | | 3,885 | | 6,192 | | 8,839 | | 11,777 |
| Gross contribution | | 1,200 | | 1,879 | | 1,879 | | 1,979 | | 2,156 | | 2,265 | | 2,410 |
| Income after tax | | 69 | | 187 | | 122 | | 328 | | 491 | | 673 | | 878 |
| | |
| |
| |
| |
| |
| |
| |
|
| NZS Fund balance | | 1,884 | | 3,950 | | 3,885 | | 6,192 | | 8,839 | | 11,777 | | 15,065 |
Gross and Net Debt Information
Definitions of debt:
Total Crown gross debt is the total borrowings (both sovereign-guaranteed and non-sovereign guaranteed) of the total Crown. This equates to the amount in the total Crown balance sheet and represents the complete picture of whole-of-Crown debt obligations to external parties.
The balance sheet splits total Crown debt into sovereign-guaranteed and non-sovereign-guaranteed debt. This split reflects the fact that debt held by SOEs and Crown entities is not explicitly guaranteed by the Crown. Any such debt that may be guaranteed is included in the sovereign-guaranteed total. No debt of SOEs and Crown entities is currently guaranteed by the Crown.
Total sovereign-issued debt is debt issued by the sovereign (i.e., core Crown) and includes Government stock held by the NZS Fund, GSF, ACC or EQC for example. In other words, the total sovereign-issued debt does not eliminate any internal cross-holdings. The Government's debt objective uses this measure of debt.
| Total Crown Debt | | | | | | | | | | | | | | | |
| | |
| |
| |
| |
| |
| |
| |
| |
| Total Crown gross debt | | 38,285 | | 36,378 | | 36,118 | | 35,091 | | 34,937 | | 34,105 | | 33,153 | |
| | |
| |
| |
| |
| |
| |
| |
| |
| Total gross sovereign-issued debt | | 36,086 | | 34,160 | | 34,469 | | 32,940 | | 33,019 | | 33,604 | | 34,057 | |
| | |
| |
| |
| |
| |
| |
| |
| |
| Core Crown | | | | | | | | | | | | | | | |
| Gross sovereign issued debt | | 36,086 | | 34,160 | | 34,469 | | 32,940 | | 33,019 | | 33,604 | | 34,057 | |
| Financial assets | | (23,029 | ) | (22,382 | ) | (23,963 | ) | (26,050 | ) | (29,369 | ) | (33,364 | ) | (37,234 | ) |
| | |
| |
| |
| |
| |
| |
| |
| |
| Borrowings less Financial Assets | | 13,057 | | 11,778 | | 10,506 | | 6,890 | | 3,650 | | 240 | | (3,177 | ) |
NZS Fund and GSF financial assets |
|
4,520 |
|
6,677 |
|
6,429 |
|
8,552 |
|
10,969 |
|
13,638 |
|
16,616 |
|
| | |
| |
| |
| |
| |
| |
| |
| |
| Net Crown Debt | | 17,577 | | 18,455 | | 16,935 | | 15,442 | | 14,619 | | 13,878 | | 13,439 | |
| | |
| |
| |
| |
| |
| |
| |
| |
The accompanying Notes and Accounting policies are an integral part of these Statements.
Forecast Statement of Borrowings
for the years ending 30 June
($ million)
| | 2003
Actual
| | 2004
Previous
Budget
| | 2004
Forecast
| | 2005
Forecast
| | 2006
Forecast
| | 2007
Forecast
| | 2008
Forecast
| |
|---|
| Sovereign Guaranteed Debt | | | | | | | | | | | | | | | |
| New Zealand-Dollar Debt | | | | | | | | | | | | | | | |
| Government stock | | 18,745 | | 18,259 | | 17,345 | | 16,152 | | 15,438 | | 15,143 | | 14,275 | |
| Treasury bills | | 5,317 | | 5,270 | | 5,389 | | 5,344 | | 5,244 | | 5,222 | | 5,202 | |
| Loans and foreign-exchange contracts | | (500 | ) | (1,183 | ) | (159 | ) | (778 | ) | (655 | ) | (655 | ) | (246 | ) |
| Retail stock and other | | 818 | | 632 | | 659 | | 558 | | 482 | | 483 | | 483 | |
| | |
| |
| |
| |
| |
| |
| |
| |
| Total New Zealand-Dollar Debt | | 24,380 | | 22,978 | | 23,234 | | 21,276 | | 20,509 | | 20,193 | | 19,714 | |
Foreign-Currency Debt |
|
|
|
|
|
|
|
|
|
|
|
|
|
|
|
| United States dollars | | 2,495 | | 3,591 | | 1,608 | | 1,272 | | 1,272 | | 1,272 | | 1,272 | |
| Japanese yen | | 835 | | 106 | | 983 | | 983 | | 983 | | 983 | | 983 | |
| European and other currencies | | 3,367 | | 2,282 | | 3,238 | | 3,238 | | 3,238 | | 3,238 | | 3,238 | |
| | |
| |
| |
| |
| |
| |
| |
| |
| Total Foreign-Currency Debt | | 6,697 | | 5,979 | | 5,829 | | 5,493 | | 5,493 | | 5,493 | | 5,493 | |
| | |
| |
| |
| |
| |
| |
| |
| |
| Total Sovereign Guaranteed Debt | | 31,077 | | 28,957 | | 29,063 | | 26,769 | | 26,002 | | 25,686 | | 25,207 | |
| | |
| |
| |
| |
| |
| |
| |
| |
| Non-Sovereign Guaranteed Debt | | | | | | | | | | | | | | | |
| New Zealand | | 5,739 | | 6,469 | | 6,039 | | 7,426 | | 8,143 | | 7,734 | | 7,370 | |
| United States dollars | | 977 | | 829 | | 893 | | 773 | | 669 | | 562 | | 453 | |
| Japanese yen | | 212 | | — | | — | | — | | — | | — | | — | |
| European and other currencies | | 280 | | 123 | | 123 | | 123 | | 123 | | 123 | | 123 | |
| | |
| |
| |
| |
| |
| |
| |
| |
| Total Non-Sovereign Guaranteed Debt | | 7,208 | | 7,421 | | 7,055 | | 8,322 | | 8,935 | | 8,419 | | 7,946 | |
| | |
| |
| |
| |
| |
| |
| |
| |
| Total Borrowings (Gross Debt) | | 38,285 | | 36,378 | | 36,118 | | 35,091 | | 34,937 | | 34,105 | | 33,153 | |
| | |
| |
| |
| |
| |
| |
| |
| |
| Less | | | | | | | | | | | | | | | |
| Financial Assets (including restricted assets) | | | | | | | | | | | | | | | |
| Marketable Securities, Deposits and Equity Investments | | | | | | | | | | | | | | | |
| New Zealand dollars | | 8,276 | | 7,670 | | 5,842 | | 5,556 | | 5,825 | | 6,238 | | 6,416 | |
| United States dollars | | 4,144 | | 5,211 | | 3,808 | | 3,737 | | 4,036 | | 4,364 | | 4,726 | |
| Japanese yen | | 838 | | 143 | | 1,017 | | 1,017 | | 1,017 | | 1,017 | | 1,017 | |
| European and other currencies | | 2,247 | | 607 | | 1,153 | | 982 | | 794 | | 591 | | 377 | |
| Reserve Position at IMF | | 1,067 | | 1,074 | | 1,225 | | 1,394 | | 1,581 | | 1,783 | | 1,997 | |
| NZ equity investments | | 1,401 | | 1,362 | | 2,301 | | 2,921 | | 3,625 | | 4,381 | | 5,196 | |
| Foreign equity investments | | 3,333 | | 3,386 | | 6,396 | | 8,121 | | 10,061 | | 12,191 | | 14,505 | |
| | |
| |
| |
| |
| |
| |
| |
| |
| Total | | 21,306 | | 19,453 | | 21,742 | | 23,728 | | 26,939 | | 30,565 | | 34,234 | |
Advances and Cash |
|
|
|
|
|
|
|
|
|
|
|
|
|
|
|
| Student loans | | 5,370 | | 5,926 | | 6,073 | | 6,790 | | 7,549 | | 8,357 | | 9,219 | |
| Other advances | | 930 | | 1,296 | | 1,514 | | 2,070 | | 2,569 | | 2,591 | | 2,613 | |
| Cash | | 2,732 | | 2,073 | | 2,455 | | 2,425 | | 2,516 | | 2,689 | | 2,878 | |
| | |
| |
| |
| |
| |
| |
| |
| |
| Total | | 9,032 | | 9,295 | | 10,042 | | 11,285 | | 12,634 | | 13,637 | | 14,710 | |
| | |
| |
| |
| |
| |
| |
| |
| |
| Total Financial Assets | | 30,338 | | 28,748 | | 31,784 | | 35,013 | | 39,573 | | 44,202 | | 48,944 | |
| | |
| |
| |
| |
| |
| |
| |
| |
| Borrowings less Financial Assets | | 7,947 | | 7,630 | | 4,334 | | 78 | | (4,636 | ) | (10,097 | ) | (15,791 | ) |
| | |
| |
| |
| |
| |
| |
| |
| |
| Net New Zealand-dollar debt | | 11,478 | | 11,120 | | 11,088 | | 8,940 | | 6,568 | | 3,671 | | 762 | |
| Net foreign-currency debt | | (3,531 | ) | (3,490 | ) | (6,754 | ) | (8,862 | ) | (11,204 | ) | (13,768 | ) | (16,553 | ) |
| | |
| |
| |
| |
| |
| |
| |
| |
| Borrowings less Financial Assets | | 7,947 | | 7,630 | | 4,334 | | 78 | | (4,636 | ) | (10,097 | ) | (15,791 | ) |
| | |
| |
| |
| |
| |
| |
| |
| |
The accompanying Notes and Accounting policies are an integral part of these Statements.
Statement of Actual Commitments
as at 31 October
($ million)
| | As at
31 October
2003
| | As at
30 June
2003
|
|---|
| Capital Commitments | | | | |
| Specialist military equipment | | 160 | | 292 |
| Land and buildings | | 934 | | 987 |
| Other property, plant and equipment | | 455 | | 862 |
| Other capital commitments | | 100 | | 145 |
| Investments | | 32 | | 32 |
| | |
| |
|
| Total Capital Commitments | | 1,681 | | 2,318 |
Operating Commitments |
|
|
|
|
| Non-cancellable accommodation leases | | 1,220 | | 1,268 |
| Other non-cancellable leases | | 3,131 | | 3,174 |
| Non-cancellable contracts for the supply of goods and services | | 3,265 | | 1,907 |
| Other operating commitments | | 2,054 | | 2,645 |
| TEIs | | 316 | | 316 |
| | |
| |
|
| Total Operating Commitments | | 9,986 | | 9,310 |
| | |
| |
|
| Total Commitments | | 11,667 | | 11,628 |
| | |
| |
|
| Total Commitments by Institutional Segment | | | | |
| Core Crown | | 4,923 | | 4,731 |
| Crown entities | | 4,698 | | 4,783 |
| State-owned enterprises | | 2,046 | | 2,114 |
| | |
| |
|
| Total Commitments | | 11,667 | | 11,628 |
| | |
| |
|
The accompanying Notes and Accounting policies are an integral part of these Statements.
Statement of Actual Contingent Liabilities
as at 31 October
($ million)
| | As at
31 October
2003
| | As at
30 June
2003
|
|---|
| Guarantees and indemnities | | 347 | | 418 |
| Uncalled capital | | 2,518 | | 2,641 |
| Legal proceedings and disputes | | 381 | | 242 |
| Other quantifiable contingent liabilities | | 1,222 | | 1,316 |
| | |
| |
|
| Total Quantifiable Contingent Liabilities | | 4,468 | | 4,617 |
| | |
| |
|
| Total Quantifiable Contingent Liabilities by Institutional Segment | | | | |
| Core Crown | | 4,336 | | 4,418 |
| Crown Entities | | 10 | | 45 |
| State-owned enterprises | | 122 | | 154 |
| | |
| |
|
| Total Quantifiable Contingent Liabilities | | 4,468 | | 4,617 |
| | |
| |
|
| Quantifiable Contingent Assets | | | | |
| Core Crown—Education and Transport | | 129 | | 129 |
| | |
| |
|
| Total Quantifiable Contingent Assets | | 129 | | 129 |
| | |
| |
|
The accompanying Notes and Accounting policies are an integral part of these Statements.
A detailed Statement of Contingent Liabilities and Assets (quantified and unquantified) is outlined on pages 83 to 85 of the Specific Fiscal Risk chapter.
The Statement of Specific Risks (quantified and unquantified) is outlined on pages 59 to 85 of the Specific Fiscal Risk chapter.
Forecast Statement of Segments
Statement of Financial Performance (institutional form)
for the year ended 30 June 2003
($ million)
| | Core
Crown
2003
| | Crown
entities
2003
| | State-owned
enterprises
2003
| | Inter-
segment
eliminations
2003
| | Total
Crown
2003
|
|---|
| | $m
| | $m
| | $m
| | $m
| | $m
|
|---|
| Revenue | | | | | | | | | | |
| Taxation revenue | | 40,168 | | — | | — | | (383 | ) | 39,785 |
| Other sovereign levied income | | 517 | | 2,297 | | — | | (51 | ) | 2,763 |
| Sales of goods and services | | 730 | | 1,245 | | 8,797 | | (387 | ) | 10,385 |
| Investment income | | 1,539 | | 718 | | 104 | | (502 | ) | 1,859 |
| Other revenues | | 670 | | 13,600 | | 588 | | (12,623 | ) | 2,235 |
| | |
| |
| |
| |
| |
|
| Total revenue | | 43,624 | | 17,860 | | 9,489 | | (13,946 | ) | 57,027 |
| | |
| |
| |
| |
| |
|
| Expenses by input type | | | | | | | | | | |
| Subsidies and transfer payments | | 13,798 | | 1,309 | | — | | — | | 15,107 |
| Personnel expenses | | 4,011 | | 6,054 | | 1,557 | | (2 | ) | 11,620 |
| Operating expenses | | 19,815 | | 8,867 | | 7,334 | | (13,451 | ) | 22,565 |
| Finance costs | | 2,360 | | 202 | | 267 | | (279 | ) | 2,550 |
| FX losses/(gains) | | 118 | | 48 | | (85 | ) | — | | 81 |
| GSF and ACC liability revaluation movements | | 1,647 | | 1,654 | | — | | — | | 3,301 |
| | |
| |
| |
| |
| |
|
| Total expenses | | 41,749 | | 18,134 | | 9,073 | | (13,732 | ) | 55,224 |
| | |
| |
| |
| |
| |
|
| Expenses by functional classification | | | | | | | | | | |
| Social security and welfare | | 13,907 | | 3,587 | | — | | (410 | ) | 17,084 |
| Health | | 7,501 | | 5,934 | | — | | (6,023 | ) | 7,412 |
| Education | | 7,016 | | 4,724 | | — | | (3,952 | ) | 7,788 |
| Other functional classifications | | 10,847 | | 3,639 | | 8,891 | | (3,068 | ) | 20,309 |
| Forecast new operating spending | | — | | — | | — | | — | | — |
| Finance costs and FX losses/(gains) | | 2,478 | | 250 | | 182 | | (279 | ) | 2,631 |
| | |
| |
| |
| |
| |
|
| Total expenses | | 41,749 | | 18,134 | | 9,073 | | (13,732 | ) | 55,224 |
| | |
| |
| |
| |
| |
|
| TEI's and Minority Interest | | | | 151 | | 12 | | — | | 163 |
| | |
| |
| |
| |
| |
|
| Operating balance | | 1,875 | | (123 | ) | 428 | | (214 | ) | 1,966 |
| | |
| |
| |
| |
| |
|
Statement of Financial Position (institutional form)
as at 30 June 2003
($ million)
| | Core
Crown
2003
| | Crown
entities
2003
| | State-owned
enterprises
2003
| | Inter-segment
eliminations
2003
| | Total Crown
2003
|
|---|
| | $m
| | $m
| | $m
| | $m
| | $m
|
|---|
| Assets | | | | | | | | | | |
| Financial assets | | 23,029 | | 10,947 | | 2,016 | | (5,654 | ) | 30,338 |
| Physical assets | | 17,450 | | 25,253 | | 9,964 | | — | | 52,667 |
| Investment in SOEs and CEs (including TEIs) | | 23,166 | | 4,212 | | — | | (23,166 | ) | 4,212 |
| Other assets | | 8,589 | | 2,334 | | 2,508 | | (797 | ) | 12,634 |
| | |
| |
| |
| |
| |
|
| Total assets | | 72,234 | | 42,746 | | 14,488 | | (29,617 | ) | 99,851 |
| | |
| |
| |
| |
| |
|
| Liabilities | | | | | | | | | | |
| Borrowings | | 35,575 | | 3,167 | | 5,197 | | (5,654 | ) | 38,285 |
| Other liabilities | | 23,661 | | 12,753 | | 2,663 | | (1,292 | ) | 37,785 |
| | |
| |
| |
| |
| |
|
| Total liabilities | | 59,236 | | 15,920 | | 7,860 | | (6,946 | ) | 76,070 |
| | |
| |
| |
| |
| |
|
| Net worth | | 12,998 | | 26,826 | | 6,628 | | (22,671 | ) | 23,781 |
| | |
| |
| |
| |
| |
|
| Taxpayer funds | | 8,316 | | 17,160 | | 5,258 | | (22,671 | ) | 8,063 |
| Revaluation reserves | | 4,682 | | 9,666 | | 1,276 | | — | | 15,624 |
| Minority Interest | | — | | — | | 94 | | — | | 94 |
| | |
| |
| |
| |
| |
|
| Net worth | | 12,998 | | 26,826 | | 6,628 | | (22,671 | ) | 23,781 |
| | |
| |
| |
| |
| |
|
| Analysis of financial assets and borrowings | | | | | | | | | | |
| Advances and cash | | 6,994 | | 1,501 | | 1,541 | | (1,004 | ) | 9,032 |
| MSDs and equity investments | | 16,035 | | 9,446 | | 475 | | (4,650 | ) | 21,306 |
| | |
| |
| |
| |
| |
|
| Total financial assets | | 23,029 | | 10,947 | | 2,016 | | (5,654 | ) | 30,338 |
| | |
| |
| |
| |
| |
|
| Borrowings—Sovereign guaranteed | | 35,575 | | — | | — | | (4,498 | ) | 31,077 |
| Borrowings—Non-sovereign guaranteed | | — | | 3,167 | | 5,197 | | (1,156 | ) | 7,208 |
| | |
| |
| |
| |
| |
|
| Total borrowings | | 35,575 | | 3,167 | | 5,197 | | (5,654 | ) | 38,285 |
| | |
| |
| |
| |
| |
|
| Borrowings less financial assets | | 12,546 | | (7,780 | ) | 3,181 | | — | | 7,947 |
| | |
| |
| |
| |
| |
|
| Net Crown debt | | 17,577 | | | | | | | | |
| Gross sovereign-issued debt | | 36,086 | | | | | | | | |
Net Crown debt and gross sovereign-issued debt differ from the analysis above due to elimination of cross-holdings of Govt stock and adding back the NZS Fund and GSF assets.
Forecast Statement of Financial Performance (institutional form)
for the year ended 30 June 2004
($ million)
| | Core
Crown
2004
| | Crown
entities
2004
| | State-owned
enterprises
2004
| | Inter-segment
eliminations
2004
| | Total
Crown
2004
| |
|---|
| | $m
| | $m
| | $m
| | $m
| | $m
| |
|---|
| Revenue | | | | | | | | | | | |
| Taxation revenue | | 42,614 | | — | | — | | (363 | ) | 42,251 | |
| Other sovereign levied income | | 594 | | 2,472 | | — | | (53 | ) | 3,013 | |
| Sales of goods and services | | 759 | | 1,223 | | 8,814 | | (416 | ) | 10,380 | |
| Investment income | | 1,803 | | 693 | | 108 | | (513 | ) | 2,091 | |
| Other revenues | | 560 | | 15,756 | | 531 | | (15,060 | ) | 1,787 | |
| | |
| |
| |
| |
| |
| |
| Total revenue | | 46,330 | | 20,144 | | 9,453 | | (16,405 | ) | 59,522 | |
| | |
| |
| |
| |
| |
| |
| Expenses by input type | | | | | | | | | | | |
| Subsidies and transfer payments | | 14,129 | | 1,387 | | — | | — | | 15,516 | |
| Personnel expenses | | 4,203 | | 6,387 | | 1,658 | | (3 | ) | 12,245 | |
| Operating expenses | | 21,676 | | 10,832 | | 6,888 | | (15,885 | ) | 23,511 | |
| Finance costs | | 2,248 | | 226 | | 315 | | (233 | ) | 2,556 | |
| FX losses/(gains) | | (24 | ) | — | | (14 | ) | — | | (38 | ) |
| GSF and ACC liability revaluation movements | | (364 | ) | 82 | | — | | — | | (282 | ) |
| | |
| |
| |
| |
| |
| |
| Total expenses | | 41,868 | | 18,914 | | 8,847 | | (16,121 | ) | 53,508 | |
| | |
| |
| |
| |
| |
| |
| Expenses by functional classification | | | | | | | | | | | |
| Social security and welfare | | 14,296 | | 2,099 | | — | | (424 | ) | 15,971 | |
| Health | | 8,245 | | 6,861 | | — | | (7,145 | ) | 7,961 | |
| Education | | 7,570 | | 5,907 | | — | | (5,232 | ) | 8,245 | |
| Other functional classifications | | 9,498 | | 3,821 | | 8,546 | | (3,087 | ) | 18,778 | |
| Forecast new operating spending | | 35 | | — | | — | | — | | 35 | |
| Finance costs and FX losses/(gains) | | 2,224 | | 226 | | 301 | | (233 | ) | 2,518 | |
| | |
| |
| |
| |
| |
| |
| Total expenses | | 41,868 | | 18,914 | | 8,847 | | (16,121 | ) | 53,508 | |
| | |
| |
| |
| |
| |
| |
| Net surplus TEIs | | — | | 78 | | | | — | | 78 | |
| | |
| |
| |
| |
| |
| |
| Operating balance | | 4,462 | | 1,308 | | 606 | | (284 | ) | 6,092 | |
| | |
| |
| |
| |
| |
| |
Forecast Statement of Financial Position (institutional form)
as at 30 June 2004
($ million)
| | Core
Crown
2004
$m
| | Crown
entities
2004
$m
| | State-owned
enterprises
2004
$m
| | Inter-segment
eliminations
2004
$m
| | Total
Crown
2004
$m
|
|---|
| | $m
| | $m
| | $m
| | $m
| | $m
|
|---|
| Assets | | | | | | | | | | |
| Financial assets | | 23,963 | | 12,103 | | 2,537 | | (6,819 | ) | 31,784 |
| Physical assets | | 17,616 | | 25,610 | | 10,301 | | — | | 53,527 |
| Investment in SOEs and CEs (including TEIs) | | 24,020 | | 4,428 | | — | | (24,020 | ) | 4,428 |
| Other assets | | 8,310 | | 2,428 | | 2,696 | | (1,041 | ) | 12,393 |
| | |
| |
| |
| |
| |
|
| Total assets | | 73,909 | | 44,569 | | 15,534 | | (31,880 | ) | 102,132 |
| | |
| |
| |
| |
| |
|
| Liabilities | | | | | | | | | | |
| Borrowings | | 33,754 | | 3,402 | | 5,781 | | (6,819 | ) | 36,118 |
| Other liabilities | | 22,686 | | 12,814 | | 2,570 | | (1,976 | ) | 36,094 |
| | |
| |
| |
| |
| |
|
| Total liabilities | | 56,440 | | 16,216 | | 8,351 | | (8,795 | ) | 72,212 |
| | |
| |
| |
| |
| |
|
| Net worth | | 17,469 | | 28,353 | | 7,183 | | (23,085 | ) | 29,920 |
| | |
| |
| |
| |
| |
|
| Taxpayer funds | | 12,781 | | 18,654 | | 5,907 | | (23,085 | ) | 14,257 |
| Revaluation reserves | | 4,688 | | 9,699 | | 1,276 | | — | | 15,663 |
| Minority Interest | | — | | — | | — | | — | | — |
| | |
| |
| |
| |
| |
|
| Net worth | | 17,469 | | 28,353 | | 7,183 | | (23,085 | ) | 29,920 |
| | |
| |
| |
| |
| |
|
| Analysis of financial assets and borrowings | | | | | | | | | | |
| Advances and cash | | 8,474 | | 1,446 | | 2,190 | | (2,068 | ) | 10,042 |
| MSDs and equity investments | | 15,489 | | 10,657 | | 347 | | (4,751 | ) | 21,742 |
| | |
| |
| |
| |
| |
|
| Total financial assets | | 23,963 | | 12,103 | | 2,537 | | (6,819 | ) | 31,784 |
| | |
| |
| |
| |
| |
|
| Borrowings—Sovereign guaranteed | | 33,754 | | — | | — | | (4,691 | ) | 29,063 |
| Borrowings—Non-sovereign guaranteed | | — | | 3,402 | | 5,781 | | (2,128 | ) | 7,055 |
| | |
| |
| |
| |
| |
|
| Total borrowings | | 33,754 | | 3,402 | | 5,781 | | (6,819 | ) | 36,118 |
| | |
| |
| |
| |
| |
|
| Borrowings less financial assets | | 9,791 | | (8,701 | ) | 3,244 | | — | | 4,334 |
| | |
| |
| |
| |
| |
|
| Net Crown debt | | 16,935 | | | | | | | | |
| Gross sovereign-issued debt | | 34,469 | | | | | | | | |
Net Crown debt and gross sovereign-issued debt differ from the analysis above due to elimination of cross-holdings of Govt stock and adding back the NZS Fund and GSF assets.
Forecast Statement of Financial Performance (institutional form)
for the year ended 30 June 2005
($ million)
| | Core
Crown
2005
| | Crown
entities
2005
| | State-owned
enterprises
2005
| | Inter-segment
eliminations
2005
| | Total
Crown
2005
|
|---|
| | $m
| | $m
| | $m
| | $m
| | $m
|
|---|
| Revenue | | | | | | | | | | |
| Taxation revenue | | 44,583 | | — | | — | | (469 | ) | 44,114 |
| Other sovereign levied income | | 654 | | 2,568 | | — | | (52 | ) | 3,170 |
| Sales of goods and services | | 736 | | 1,275 | | 10,045 | | (399 | ) | 11,657 |
| Investment income | | 2,154 | | 785 | | 97 | | (584 | ) | 2,452 |
| Other revenues | | 591 | | 16,423 | | 466 | | (15,713 | ) | 1,767 |
| | |
| |
| |
| |
| |
|
| Total revenue | | 48,718 | | 21,051 | | 10,608 | | (17,217 | ) | 63,160 |
| | |
| |
| |
| |
| |
|
| Expenses by input type | | | | | | | | | | |
| Subsidies and transfer payments | | 14,446 | | 1,423 | | — | | — | | 15,869 |
| Personnel expenses | | 4,260 | | 6,658 | | 1,727 | | (5 | ) | 12,640 |
| Operating expenses | | 23,128 | | 11,228 | | 7,743 | | (16,628 | ) | 25,471 |
| Finance costs | | 2,094 | | 240 | | 357 | | (272 | ) | 2,419 |
| FX losses/(gains) | | — | | — | | — | | — | | — |
| GSF and ACC liability revaluation movements | | (51 | ) | 552 | | — | | — | | 501 |
| | |
| |
| |
| |
| |
|
| Total expenses | | 43,877 | | 20,101 | | 9,827 | | (16,905 | ) | 56,900 |
| | |
| |
| |
| |
| |
|
| Expenses by functional classification | | | | | | | | | | |
| Social security and welfare | | 14,685 | | 2,613 | | — | | (433 | ) | 16,865 |
| Health | | 8,527 | | 7,289 | | — | | (7,650 | ) | 8,166 |
| Education | | 7,802 | | 6,070 | | — | | (5,381 | ) | 8,491 |
| Other functional classifications | | 9,616 | | 3,889 | | 9,470 | | (3,169 | ) | 19,806 |
| Forecast new operating spending | | 1,153 | | — | | — | | — | | 1,153 |
| Finance costs and FX losses/(gains) | | 2,094 | | 240 | | 357 | | (272 | ) | 2,419 |
| | |
| |
| |
| |
| |
|
| Total expenses | | 43,877 | | 20,101 | | 9,827 | | (16,905 | ) | 56,900 |
| | |
| |
| |
| |
| |
|
| Net surplus TEIs | | — | | 78 | | — | | — | | 78 |
| | |
| |
| |
| |
| |
|
| Operating balance | | 4,841 | | 1,028 | | 781 | | (312 | ) | 6,338 |
| | |
| |
| |
| |
| |
|
Forecast Statement of Financial Position (institutional form)
as at 30 June 2005 |
($ million)
|
|
Core
Crown
2005
|
|
Crown
entities
2005
|
|
State-owned
enterprises
2005
|
|
Inter-segment
eliminations
2005
|
|
Total
Crown
2005
|
|---|
| | $m
| | $m
| | $m
| | $m
| | $m
|
|---|
| Assets | | | | | | | | | | |
| Financial assets | | 26,050 | | 13,318 | | 3,135 | | (7,490 | ) | 35,013 |
| Physical assets | | 17,343 | | 26,140 | | 11,552 | | — | | 55,035 |
| Investment in SOEs and CEs (including TEIs) | | 24,458 | | 4,534 | | — | | (24,458 | ) | 4,534 |
| Other assets | | 9,037 | | 2,419 | | 2,774 | | (1,066 | ) | 13,164 |
| | |
| |
| |
| |
| |
|
| Total assets | | 76,888 | | 46,411 | | 17,461 | | (33,014 | ) | 107,746 |
| | |
| |
| |
| |
| |
|
| Liabilities | | | | | | | | | | |
| Borrowings | | 31,990 | | 3,508 | | 7,083 | | (7,490 | ) | 35,091 |
| Other liabilities | | 22,561 | | 13,378 | | 2,574 | | (2,116 | ) | 36,397 |
| | |
| |
| |
| |
| |
|
| Total liabilities | | 54,551 | | 16,886 | | 9,657 | | (9,606 | ) | 71,488 |
| | |
| |
| |
| |
| |
|
| Net worth | | 22,337 | | 29,525 | | 7,804 | | (23,408 | ) | 36,258 |
| | |
| |
| |
| |
| |
|
| Taxpayer Funds | | 17,649 | | 19,826 | | 6,528 | | (23,408 | ) | 20,595 |
| Revaluation reserves | | 4,688 | | 9,699 | | 1,276 | | — | | 15,663 |
| Minority Interest | | — | | — | | — | | — | | — |
| | |
| |
| |
| |
| |
|
| Net worth | | 22,337 | | 29,525 | | 7,804 | | (23,408 | ) | 36,258 |
| | |
| |
| |
| |
| |
|
| Analysis of financial assets and borrowings | | | | | | | | | | |
| Advances and cash | | 9,333 | | 1,439 | | 2,709 | | (2,196 | ) | 11,285 |
| MSDs and equity investments | | 16,717 | | 11,879 | | 426 | | (5,294 | ) | 23,728 |
| | |
| |
| |
| |
| |
|
| Total financial assets | | 26,050 | | 13,318 | | 3,135 | | (7,490 | ) | 35,013 |
| | |
| |
| |
| |
| |
|
| Borrowings—Sovereign guaranteed | | 31,990 | | — | | — | | (5,221 | ) | 26,769 |
| Borrowings—Non-sovereign guaranteed | | — | | 3,508 | | 7,083 | | (2,269 | ) | 8,322 |
| | |
| |
| |
| |
| |
|
| Total borrowings | | 31,990 | | 3,508 | | 7,083 | | (7,490 | ) | 35,091 |
| | |
| |
| |
| |
| |
|
| Borrowings less financial assets | | 5,940 | | (9,810 | ) | 3,948 | | — | | 78 |
| | |
| |
| |
| |
| |
|
| Net Crown debt | | 15,442 | | | | | | | | |
| Gross sovereign-issued debt | | 32,940 | | | | | | | | |
Net Crown debt and gross sovereign-issued debt differ from the analysis above due to elimination of cross-holdings of Govt stock and adding back the NZS Fund and GSF assets.
Forecast Statement of Financial Performance (institutional form)
for the year ended 30 June 2006
($ million)
| | Core
Crown
2006
| | Crown
entities
2006
| | State-owned
enterprises
2006
| | Inter-segment
eliminations
2006
| | Total
Crown
2006
| |
|---|
| | $m
| | $m
| | $m
| | $m
| | $m
| |
|---|
| Revenue | | | | | | | | | | | |
| Taxation revenue | | 46,606 | | — | | — | | (563 | ) | 46,043 | |
| Other sovereign levied income | | 653 | | 2,639 | | — | | (51 | ) | 3,241 | |
| Sales of goods and services | | 744 | | 1,330 | | 10,626 | | (403 | ) | 12,297 | |
| Investment income | | 2,586 | | 878 | | 120 | | (698 | ) | 2,886 | |
| Other revenues | | 584 | | 17,025 | | 428 | | (16,281 | ) | 1,756 | |
| | |
| |
| |
| |
| |
| |
| Total revenue | | 51,173 | | 21,872 | | 11,174 | | (17,996 | ) | 66,223 | |
| | |
| |
| |
| |
| |
| |
| Expenses by input type | | | | | | | | | | | |
| Subsidies and transfer payments | | 15,096 | | 1,488 | | — | | — | | 16,584 | |
| Personnel expenses | | 4,366 | | 6,802 | | 1,781 | | (4 | ) | 12,945 | |
| Operating expenses | | 25,498 | | 11,744 | | 8,019 | | (17,302 | ) | 27,959 | |
| Finance costs | | 2,169 | | 250 | | 393 | | (301 | ) | 2,511 | |
| FX losses/(gains) | | — | | — | | — | | — | | — | |
| GSF and ACC liability revaluation movements | | (75 | ) | 584 | | — | | — | | 509 | |
| | |
| |
| |
| |
| |
| |
| Total expenses | | 47,054 | | 20,868 | | 10,193 | | (17,607 | ) | 60,508 | |
| | |
| |
| |
| |
| |
| |
| Expenses by functional classification | | | | | | | | | | | |
| Social security and welfare | | 15,316 | | 2,739 | | — | | (441 | ) | 17,614 | |
| Health | | 9,194 | | 7,591 | | — | | (7,976 | ) | 8,809 | |
| Education | | 7,981 | | 6,287 | | — | | (5,564 | ) | 8,704 | |
| Other functional classifications | | 9,737 | | 4,001 | | 9,800 | | (3,325 | ) | 20,213 | |
| Forecast new operating spending | | 2,657 | | — | | — | | — | | 2,657 | |
| Finance costs and FX losses/(gains) | | 2,169 | | 250 | | 393 | | (301 | ) | 2,511 | |
| | |
| |
| |
| |
| |
| |
| Total expenses | | 47,054 | | 20,868 | | 10,193 | | (17,607 | ) | 60,508 | |
| | |
| |
| |
| |
| |
| |
| Net surplus TEIs | | — | | 80 | | — | | — | | 80 | |
| | |
| |
| |
| |
| |
| |
| Operating balance | | 4,119 | | 1,084 | | 981 | | (389 | ) | 5,795 | |
| | |
| |
| |
| |
| |
| |
Forecast Statement of Financial Position (institutional form)
as at 30 June 2006 |
|
($ million)
|
|
Core
Crown
2006
|
|
Crown
entities
2006
|
|
State-owned
enterprises
2006
|
|
Inter-segment
eliminations
2006
|
|
Total
Crown
2006
|
|
|---|
| | $m
| | $m
| | $m
| | $m
| | $m
| |
|---|
| Assets | | | | | | | | | | | |
| Financial assets | | 29,369 | | 14,643 | | 3,771 | | (8,210 | ) | 39,573 | |
| Physical assets | | 17,060 | | 26,429 | | 12,305 | | — | | 55,794 | |
| Investment in SOEs and CEs (including TEIs) | | 24,592 | | 4,614 | | — | | (24,592 | ) | 4,614 | |
| Other assets | | 9,408 | | 2,507 | | 2,848 | | (983 | ) | 13,780 | |
| | |
| |
| |
| |
| |
| |
| Total assets | | 80,429 | | 48,193 | | 18,924 | | (33,785 | ) | 113,761 | |
| | |
| |
| |
| |
| |
| |
| Liabilities | | | | | | | | | | | |
| Borrowings | | 31,800 | | 3,609 | | 7,738 | | (8,210 | ) | 34,937 | |
| Other liabilities | | 22,264 | | 13,955 | | 2,634 | | (2,082 | ) | 36,771 | |
| | |
| |
| |
| |
| |
| |
| Total liabilities | | 54,064 | | 17,564 | | 10,372 | | (10,292 | ) | 71,708 | |
| | |
| |
| |
| |
| |
| |
| Net worth | | 26,365 | | 30,629 | | 8,552 | | (23,493 | ) | 42,053 | |
| | |
| |
| |
| |
| |
| |
| Taxpayer Funds | | 21,677 | | 20,930 | | 7,276 | | (23,493 | ) | 26,390 | |
| Revaluation reserves | | 4,688 | | 9,699 | | 1,276 | | — | | 15,663 | |
| Minority Interest | | — | | — | | — | | — | | — | |
| | |
| |
| |
| |
| |
| |
| Net worth | | 26,365 | | 30,629 | | 8,552 | | (23,493 | ) | 42,053 | |
| | |
| |
| |
| |
| |
| |
| Analysis of financial assets and borrowings | | | | | | | | | | | |
| Advances and cash | | 10,240 | | 1,424 | | 3,297 | | (2,327 | ) | 12,634 | |
| MSDs and equity investments | | 19,129 | | 13,219 | | 474 | | (5,883 | ) | 26,939 | |
| | |
| |
| |
| |
| |
| |
| Total financial assets | | 29,369 | | 14,643 | | 3,771 | | (8,210 | ) | 39,573 | |
| | |
| |
| |
| |
| |
| |
| Borrowings—Sovereign guaranteed | | 31,800 | | — | | — | | (5,798 | ) | 26,002 | |
| Borrowings—Non-sovereign guaranteed | | — | | 3,609 | | 7,738 | | (2,412 | ) | 8,935 | |
| | |
| |
| |
| |
| |
| |
| Total borrowings | | 31,800 | | 3,609 | | 7,738 | | (8,210 | ) | 34,937 | |
| | |
| |
| |
| |
| |
| |
| Borrowings less financial assets | | 2,431 | | (11,034 | ) | 3,967 | | — | | (4,636 | ) |
| | |
| |
| |
| |
| |
| |
| Net Crown debt | | 14,619 | | | | | | | | | |
| Gross sovereign-issued debt | | 33,019 | | | | | | | | | |
Net Crown debt and gross sovereign-issued debt differ from the analysis above due to elimination of cross-holdings of Govt stock and adding back the NZS Fund and GSF assets.
Forecast Statement of Financial Performance (institutional form)
for the year ended 30 June 2007
($ million)
| | Core
Crown
2007
| | Crown
entities
2007
| | State-owned
enterprises
2007
| | Inter-segment
eliminations
2007
| | Total
Crown
2007
|
|---|
| | $m
| | $m
| | $m
| | $m
| | $m
|
|---|
| Revenue | | | | | | | | | | |
| Taxation revenue | | 48,529 | | — | | — | | (585 | ) | 47,944 |
| Other sovereign levied income | | 648 | | 2,707 | | — | | (52 | ) | 3,303 |
| Sales of goods and services | | 752 | | 1,390 | | 10,954 | | (387 | ) | 12,709 |
| Investment income | | 3,029 | | 970 | | 120 | | (784 | ) | 3,335 |
| Other revenues | | 581 | | 17,144 | | 435 | | (16,374 | ) | 1,786 |
| | |
| |
| |
| |
| |
|
| Total revenue | | 53,539 | | 22,211 | | 11,509 | | (18,182 | ) | 69,077 |
| | |
| |
| |
| |
| |
|
| Expenses by input type | | | | | | | | | | |
| Subsidies and transfer payments | | 15,743 | | 1,553 | | — | | — | | 17,296 |
| Personnel expenses | | 4,363 | | 6,830 | | 1,804 | | (4 | ) | 12,993 |
| Operating expenses | | 27,305 | | 11,866 | | 8,249 | | (17,400 | ) | 30,020 |
| Finance costs | | 2,082 | | 253 | | 424 | | (332 | ) | 2,427 |
| FX losses/(gains) | | — | | — | | — | | — | | — |
| GSF and ACC liability revaluation movements | | (108 | ) | 612 | | — | | — | | 504 |
| | |
| |
| |
| |
| |
|
| Total expenses | | 49,385 | | 21,114 | | 10,477 | | (17,736 | ) | 63,240 |
| | |
| |
| |
| |
| |
|
| Expenses by functional classification | | | | | | | | | | |
| Social security and welfare | | 15,953 | | 2,848 | | — | | (447 | ) | 18,354 |
| Health | | 9,187 | | 7,551 | | — | | (8,007 | ) | 8,731 |
| Education | | 8,132 | | 6,327 | | — | | (5,587 | ) | 8,872 |
| Other functional classifications | | 9,699 | | 4,135 | | 10,053 | | (3,363 | ) | 20,524 |
| Forecast new operating spending | | 4,332 | | — | | — | | — | | 4,332 |
| Finance costs and FX losses/(gains) | | 2,082 | | 253 | | 424 | | (332 | ) | 2,427 |
| | |
| |
| |
| |
| |
|
| Total expenses | | 49,385 | | 21,114 | | 10,477 | | (17,736 | ) | 63,240 |
| | |
| |
| |
| |
| |
|
| Net surplus TEIs | | — | | 81 | | — | | — | | 81 |
| | |
| |
| |
| |
| |
|
| Operating balance | | 4,154 | | 1,178 | | 1,032 | | (446 | ) | 5,918 |
| | |
| |
| |
| |
| |
|
Forecast Statement of Financial Position (institutional form)
as at 30 June 2007
($ million)
| | Core
Crown
2007
| | Crown
entities
2007
| | State-owned
enterprises
2007
| | Inter-segment
eliminations
2007
| | Total
Crown
2007
| |
|---|
| | $m
| | $m
| | $m
| | $m
| | $m
| |
|---|
| Assets | | | | | | | | | | | |
| Financial assets | | 33,364 | | 16,061 | | 3,986 | | (9,209 | ) | 44,202 | |
| Physical assets | | 16,752 | | 26,659 | | 12,701 | | — | | 56,112 | |
| Investment in SOEs and CEs (including TEIs) | | 24,703 | | 4,696 | | — | | (24,703 | ) | 4,696 | |
| Other assets | | 9,777 | | 2,552 | | 2,858 | | (867 | ) | 14,320 | |
| | |
| |
| |
| |
| |
| |
| Total assets | | 84,596 | | 49,968 | | 19,545 | | (34,779 | ) | 119,330 | |
| | |
| |
| |
| |
| |
| |
| Liabilities | | | | | | | | | | | |
| Borrowings | | 32,086 | | 3,628 | | 7,600 | | (9,209 | ) | 34,105 | |
| Other liabilities | | 22,118 | | 14,564 | | 2,636 | | (2,064 | ) | 37,254 | |
| | |
| |
| |
| |
| |
| |
| Total liabilities | | 54,204 | | 18,192 | | 10,236 | | (11,273 | ) | 71,359 | |
| | |
| |
| |
| |
| |
| |
| Net worth | | 30,392 | | 31,776 | | 9,309 | | (23,506 | ) | 47,971 | |
| | |
| |
| |
| |
| |
| |
| Taxpayer Funds | | 25,704 | | 22,077 | | 8,033 | | (23,506 | ) | 32,308 | |
| Revaluation reserves | | 4,688 | | 9,699 | | 1,276 | | — | | 15,663 | |
| Minority Interest | | — | | — | | — | | — | | — | |
| | |
| |
| |
| |
| |
| |
| Net worth | | 30,392 | | 31,776 | | 9,309 | | (23,506 | ) | 47,971 | |
| | |
| |
| |
| |
| |
| |
| Analysis of financial assets and borrowings | | | | | | | | | | | |
| Advances and cash | | 11,414 | | 1,415 | | 3,515 | | (2,707 | ) | 13,637 | |
| MSDs and equity investments | | 21,950 | | 14,646 | | 471 | | (6,502 | ) | 30,565 | |
| | |
| |
| |
| |
| |
| |
| Total financial assets | | 33,364 | | 16,061 | | 3,986 | | (9,209 | ) | 44,202 | |
| | |
| |
| |
| |
| |
| |
| Borrowings—Sovereign guaranteed | | 32,086 | | — | | — | | (6,400 | ) | 25,686 | |
| Borrowings—Non-sovereign guaranteed | | — | | 3,628 | | 7,600 | | (2,809 | ) | 8,419 | |
| | |
| |
| |
| |
| |
| |
| Total borrowings | | 32,086 | | 3,628 | | 7,600 | | (9,209 | ) | 34,105 | |
| | |
| |
| |
| |
| |
| |
| Borrowings less financial assets | | (1,278 | ) | (12,433 | ) | 3,614 | | — | | (10,097 | ) |
| | |
| |
| |
| |
| |
| |
| Net Crown debt | | 13,878 | | | | | | | | | |
| Gross sovereign-issued debt | | 33,604 | | | | | | | | | |
Net Crown debt and gross sovereign-issued debt differ from the analysis above due to elimination of cross-holdings of Govt stock and adding back the NZS Fund and GSF assets.
Forecast Statement of Financial Performance (institutional form)
for the year ended 30 June 2008
($ million)
| | Core
Crown
2008
| | Crown
entities
2008
| | State-owned
enterprises
2008
| | Inter-segment
eliminations
2008
| | Total
Crown
2008
|
|---|
| | $m
| | $m
| | $m
| | $m
| | $m
|
|---|
| Revenue | | | | | | | | | | |
| Taxation revenue | | 50,753 | | — | | — | | (613 | ) | 50,140 |
| Other sovereign levied income | | 646 | | 2,783 | | — | | (52 | ) | 3,377 |
| Sales of goods and services | | 734 | | 1,447 | | 11,248 | | (395 | ) | 13,034 |
| Investment income | | 3,470 | | 1,054 | | 120 | | (872 | ) | 3,772 |
| Other revenues | | 577 | | 17,251 | | 440 | | (16,463 | ) | 1,805 |
| | |
| |
| |
| |
| |
|
| Total revenue | | 56,180 | | 22,535 | | 11,808 | | (18,395 | ) | 72,128 |
| | |
| |
| |
| |
| |
|
| Expenses by input type | | | | | | | | | | |
| Subsidies and transfer payments | | 16,441 | | 1,619 | | — | | — | | 18,060 |
| Personnel expenses | | 4,383 | | 6,849 | | 1,828 | | (4 | ) | 13,056 |
| Operating expenses | | 29,065 | | 11,985 | | 8,472 | | (17,528 | ) | 31,994 |
| Finance costs | | 2,104 | | 253 | | 420 | | (371 | ) | 2,406 |
| FX losses/(gains) | | — | | — | | — | | — | | — |
| GSF and ACC liability revaluation movements | | (128 | ) | 634 | | — | | — | | 506 |
| | |
| |
| |
| |
| |
|
| Total expenses | | 51,865 | | 21,340 | | 10,720 | | (17,903 | ) | 66,022 |
| | |
| |
| |
| |
| |
|
| Expenses by functional classification | | | | | | | | | | |
| Social security and welfare | | 16,634 | | 2,942 | | — | | (456 | ) | 19,120 |
| Health | | 9,149 | | 7,554 | | — | | (8,037 | ) | 8,666 |
| Education | | 8,218 | | 6,360 | | | | (5,500 | ) | 9,078 |
| Other functional classifications | | 9,732 | | 4,231 | | 10,300 | | (3,539 | ) | 20,724 |
| Forecast new operating spending | | 6,028 | | — | | — | | — | | 6,028 |
| Finance costs and FX losses/(gains) | | 2,104 | | 253 | | 420 | | (371 | ) | 2,406 |
| | |
| |
| |
| |
| |
|
| Total expenses | | 51,865 | | 21,340 | | 10,720 | | (17,903 | ) | 66,022 |
| | |
| |
| |
| |
| |
|
| Net surplus TEIs | | | | 81 | | — | | — | | 81 |
| | |
| |
| |
| |
| |
|
| Operating balance | | 4,315 | | 1,276 | | 1,088 | | (492 | ) | 6,187 |
| | |
| |
| |
| |
| |
|
Forecast Statement of Financial Position (institutional form)
as at 30 June 2008
($ million)
| | Core
Crown
2008
| | Crown
entities
2008
| | State-owned
enterprises
2008
| | Inter-segment
eliminations
2008
| | Total
Crown
2008
| |
|---|
| | $m
| | $m
| | $m
| | $m
| | $m
| |
|---|
| Assets | | | | | | | | | | | |
| Financial assets | | 37,234 | | 17,475 | | 4,210 | | (9,975 | ) | 48,944 | |
| Physical assets | | 16,460 | | 26,726 | | 13,063 | | — | | 56,249 | |
| Investment in SOEs and CEs (including TEIs) | | 24,804 | | 4,777 | | — | | (24,804 | ) | 4,777 | |
| Other assets | | 10,286 | | 2,641 | | 2,850 | | (761 | ) | 15,016 | |
| | |
| |
| |
| |
| |
| |
| Total assets | | 88,784 | | 51,619 | | 20,123 | | (35,540 | ) | 124,986 | |
| | |
| |
| |
| |
| |
| |
| Liabilities | | | | | | | | | | | |
| Borrowings | | 32,210 | | 3,504 | | 7,414 | | (9,975 | ) | 33,153 | |
| Other liabilities | | 21,966 | | 15,097 | | 2,639 | | (2,027 | ) | 37,675 | |
| | |
| |
| |
| |
| |
| |
| Total liabilities | | 54,176 | | 18,601 | | 10,053 | | (12,002 | ) | 70,828 | |
| | |
| |
| |
| |
| |
| |
| Net worth | | 34,608 | | 33,018 | | 10,070 | | (23,538 | ) | 54,158 | |
| | |
| |
| |
| |
| |
| |
| Taxpayer Funds | | 29,920 | | 23,319 | | 8,794 | | (23,538 | ) | 38,495 | |
| Revaluation reserves | | 4,688 | | 9,699 | | 1,276 | | — | | 15,663 | |
| Minority Interest | | — | | — | | — | | — | | — | |
| | |
| |
| |
| |
| |
| |
| Net worth | | 34,608 | | 33,018 | | 10,070 | | (23,538 | ) | 54,158 | |
| | |
| |
| |
| |
| |
| |
| Analysis of financial assets and borrowings | | | | | | | | | | | |
| Advances and cash | | 12,371 | | 1,447 | | 3,743 | | (2,851 | ) | 14,710 | |
| MSDs and equity investments | | 24,863 | | 16,028 | | 467 | | (7,124 | ) | 34,234 | |
| | |
| |
| |
| |
| |
| |
| Total financial assets | | 37,234 | | 17,475 | | 4,210 | | (9,975 | ) | 48,944 | |
| | |
| |
| |
| |
| |
| |
| Borrowings—Sovereign guaranteed | | 32,210 | | — | | — | | (7,003 | ) | 25,207 | |
| Borrowings—Non-sovereign guaranteed | | — | | 3,504 | | 7,414 | | (2,972 | ) | 7,946 | |
| | |
| |
| |
| |
| |
| |
| Total borrowings | | 32,210 | | 3,504 | | 7,414 | | (9,975 | ) | 33,153 | |
| | |
| |
| |
| |
| |
| |
| Borrowings less financial assets | | (5,024 | ) | (13,971 | ) | 3,204 | | — | | (15,791 | ) |
| | |
| |
| |
| |
| |
| |
| Net Crown debt | | 13,439 | | | | | | | | | |
| Gross sovereign-issued debt | | 34,057 | | | | | | | | | |
Net Crown debt and gross sovereign-issued debt differ from the analysis above due to elimination of cross-holdings of Govt stock and adding back the NZS Fund and GSF assets.
Notes to the Forecast Financial Statements
($ million)
| | 2003
Actual
| | 2004
Previous
Budget
| | 2004
Forecast
| | 2005
Forecast
| | 2006
Forecast
| | 2007
Forecast
| | 2008
Forecast
| |
|---|
| NOTE 1: Revenue Collected Through the Crown's Sovereign Power | | | | | | | | | | | | | | | |
Income Tax Revenue (accrual) |
|
|
|
|
|
|
|
|
|
|
|
|
|
|
|
Individuals |
|
|
|
|
|
|
|
|
|
|
|
|
|
|
|
| Source deductions | | 15,933 | | 16,396 | | 16,897 | | 17,782 | | 18,681 | | 19,586 | | 20,575 | |
| Other persons | | 4,195 | | 4,328 | | 4,172 | | 4,366 | | 4,600 | | 4,859 | | 5,128 | |
| Refunds | | (834 | ) | (834 | ) | (844 | ) | (844 | ) | (844 | ) | (844 | ) | (844 | ) |
| Fringe benefit tax | | 375 | | 373 | | 403 | | 417 | | 436 | | 455 | | 472 | |
| | |
| |
| |
| |
| |
| |
| |
| |
| Total Individuals | | 19,669 | | 20,263 | | 20,628 | | 21,721 | | 22,873 | | 24,056 | | 25,331 | |
Corporate Tax |
|
|
|
|
|
|
|
|
|
|
|
|
|
|
|
| Gross companies tax | | 5,244 | | 5,190 | | 5,964 | | 6,168 | | 6,406 | | 6,541 | | 6,812 | |
| Refunds | | (191 | ) | (138 | ) | (142 | ) | (151 | ) | (160 | ) | (165 | ) | (174 | ) |
| Non-resident withholding tax | | 732 | | 702 | | 821 | | 788 | | 832 | | 864 | | 916 | |
| Foreign-source dividend withholding payments | | 154 | | 126 | | 135 | | 135 | | 135 | | 135 | | 135 | |
| | |
| |
| |
| |
| |
| |
| |
| |
| Total Corporate Tax | | 5,939 | | 5,880 | | 6,778 | | 6,940 | | 7,213 | | 7,375 | | 7,689 | |
Other Income Tax |
|
|
|
|
|
|
|
|
|
|
|
|
|
|
|
| Resident withholding tax on interest income | | 1,111 | | 1,074 | | 1,163 | | 1,164 | | 1,187 | | 1,187 | | 1,187 | |
| Resident withholding tax on dividend income | | 57 | | 52 | | 55 | | 54 | | 55 | | 56 | | 58 | |
| Estate and gift duties | | 1 | | 1 | | 2 | | 2 | | 2 | | 2 | | 2 | |
| | |
| |
| |
| |
| |
| |
| |
| |
| Total Other Income Tax | | 1,169 | | 1,127 | | 1,220 | | 1,220 | | 1,244 | | 1,245 | | 1,247 | |
| | |
| |
| |
| |
| |
| |
| |
| |
| Total Income Tax | | 26,777 | | 27,270 | | 28,626 | | 29,881 | | 31,330 | | 32,676 | | 34,267 | |
| | |
| |
| |
| |
| |
| |
| |
| |
| Goods and Services Tax | | | | | | | | | | | | | | | |
| Gross goods and services tax | | 14,961 | | 15,579 | | 15,752 | | 16,732 | | 17,437 | | 18,308 | | 19,244 | |
| Refunds | | (6,221 | ) | (6,465 | ) | (6,415 | ) | (6,908 | ) | (7,258 | ) | (7,683 | ) | (8,099 | ) |
| | |
| |
| |
| |
| |
| |
| |
| |
| Total Goods and Services Tax | | 8,740 | | 9,114 | | 9,337 | | 9,824 | | 10,179 | | 10,625 | | 11,145 | |
Other Taxation |
|
|
|
|
|
|
|
|
|
|
|
|
|
|
|
| Petroleum fuels excise | | 995 | | 918 | | 952 | | 966 | | 981 | | 998 | | 1,015 | |
| Tobacco excise | | 850 | | 876 | | 855 | | 859 | | 871 | | 883 | | 895 | |
| Customs duty | | 750 | | 745 | | 738 | | 770 | | 804 | | 816 | | 805 | |
| Road user charges | | 621 | | 631 | | 646 | | 669 | | 703 | | 739 | | 777 | |
| Alcohol excise | | 465 | | 492 | | 482 | | 489 | | 503 | | 517 | | 531 | |
| Gaming duties | | 247 | | 281 | | 273 | | 306 | | 323 | | 338 | | 355 | |
| Motor vehicle fees | | 197 | | 193 | | 203 | | 211 | | 215 | | 219 | | 223 | |
| Energy resources levies | | 94 | | 86 | | 84 | | 81 | | 76 | | 74 | | 67 | |
| Approved issuer levy (AIL) and cheque duty | | 49 | | 45 | | 55 | | 58 | | 58 | | 59 | | 60 | |
| | |
| |
| |
| |
| |
| |
| |
| |
| Total Other Indirect Taxation | | 4,268 | | 4,267 | | 4,288 | | 4,409 | | 4,534 | | 4,643 | | 4,728 | |
| | |
| |
| |
| |
| |
| |
| |
| |
| Total Indirect Taxation | | 13,008 | | 13,381 | | 13,625 | | 14,233 | | 14,713 | | 15,268 | | 15,873 | |
| | |
| |
| |
| |
| |
| |
| |
| |
| Total Tax Revenue Collected | | 39,785 | | 40,651 | | 42,251 | | 44,114 | | 46,043 | | 47,944 | | 50,140 | |
| | |
| |
| |
| |
| |
| |
| |
| |
| Other Sovereign Revenues (accrual) | | | | | | | | | | | | | | | |
| ACC levies | | 1,854 | | 1,897 | | 2,033 | | 2,127 | | 2,197 | | 2,263 | | 2,338 | |
| Fire Service levies | | 228 | | 224 | | 224 | | 225 | | 225 | | 225 | | 225 | |
| EQC levies | | 77 | | 78 | | 78 | | 80 | | 82 | | 83 | | 85 | |
| Other miscellaneous items | | 604 | | 627 | | 678 | | 738 | | 737 | | 732 | | 729 | |
| | |
| |
| |
| |
| |
| |
| |
| |
| Total Other Sovereign Revenues | | 2,763 | | 2,826 | | 3,013 | | 3,170 | | 3,241 | | 3,303 | | 3,377 | |
| | |
| |
| |
| |
| |
| |
| |
| |
| Total Sovereign Revenue | | 42,548 | | 43,477 | | 45,264 | | 47,284 | | 49,284 | | 51,247 | | 53,517 | |
| | |
| |
| |
| |
| |
| |
| |
| |
($ million)
| | 2003
Actual
| | 2004
Previous
Budget
| | 2004
Forecast
| | 2005
Forecast
| | 2006
Forecast
| | 2007
Forecast
| | 2008
Forecast
| |
|---|
| NOTE 1: Revenue Collected Through the Crown's Sovereign Power | | | | | | | | | | | | | | | |
Individuals |
|
|
|
|
|
|
|
|
|
|
|
|
|
|
|
| Source deductions | | 15,623 | | 16,396 | | 16,897 | | 17,782 | | 18,681 | | 19,586 | | 20,575 | |
| Other persons | | 4,500 | | 4,734 | | 4,631 | | 4,825 | | 5,059 | | 5,317 | | 5,586 | |
| Refunds | | (1,287 | ) | (1,240 | ) | (1,302 | ) | (1,302 | ) | (1,302 | ) | (1,302 | ) | (1,302 | ) |
| Fringe benefit tax | | 374 | | 373 | | 400 | | 414 | | 431 | | 451 | | 468 | |
| | |
| |
| |
| |
| |
| |
| |
| |
| Total Individuals | | 19,210 | | 20,263 | | 20,626 | | 21,719 | | 22,869 | | 24,052 | | 25,327 | |
Corporate Tax |
|
|
|
|
|
|
|
|
|
|
|
|
|
|
|
| Gross companies tax | | 6,021 | | 5,775 | | 6,668 | | 6,846 | | 7,022 | | 7,158 | | 7,417 | |
| Refunds | | (821 | ) | (722 | ) | (869 | ) | (811 | ) | (796 | ) | (803 | ) | (800 | ) |
| Non-resident withholding tax | | 741 | | 710 | | 824 | | 788 | | 832 | | 864 | | 916 | |
| Foreign-source dividend withholding payments | | 160 | | 126 | | 129 | | 135 | | 135 | | 135 | | 135 | |
| | |
| |
| |
| |
| |
| |
| |
| |
| Total Corporate Tax | | 6,101 | | 5,889 | | 6,752 | | 6,958 | | 7,193 | | 7,354 | | 7,668 | |
Other Income Tax |
|
|
|
|
|
|
|
|
|
|
|
|
|
|
|
| Resident withholding tax on interest income | | 1,104 | | 1,074 | | 1,163 | | 1,164 | | 1,187 | | 1,187 | | 1,187 | |
| Resident withholding tax on dividend income | | 56 | | 52 | | 55 | | 54 | | 55 | | 56 | | 58 | |
| Estate and gift duties | | 1 | | 1 | | 2 | | 2 | | 2 | | 2 | | 2 | |
| | |
| |
| |
| |
| |
| |
| |
| |
| Total Other Income Tax | | 1,161 | | 1,127 | | 1,220 | | 1,220 | | 1,244 | | 1,245 | | 1,247 | |
| | |
| |
| |
| |
| |
| |
| |
| |
| Total Income Tax | | 26,472 | | 27,279 | | 28,598 | | 29,897 | | 31,306 | | 32,651 | | 34,242 | |
| | |
| |
| |
| |
| |
| |
| |
| |
| Goods and Services Tax | | | | | | | | | | | | | | | |
| Gross goods and services tax | | 14,489 | | 15,229 | | 15,503 | | 16,482 | | 17,187 | | 18,058 | | 18,994 | |
| Refunds | | (5,718 | ) | (6,165 | ) | (6,165 | ) | (6,658 | ) | (7,008 | ) | (7,433 | ) | (7,849 | ) |
| | |
| |
| |
| |
| |
| |
| |
| |
| Total Goods and Services Tax | | 8,771 | | 9,064 | | 9,338 | | 9,824 | | 10,179 | | 10,625 | | 11,145 | |
Other Taxation |
|
|
|
|
|
|
|
|
|
|
|
|
|
|
|
| Petroleum fuels excise | | 971 | | 918 | | 952 | | 966 | | 981 | | 998 | | 1,015 | |
| Tobacco excise | | 867 | | 876 | | 850 | | 859 | | 871 | | 883 | | 895 | |
| Customs duty | | 712 | | 745 | | 738 | | 770 | | 804 | | 816 | | 805 | |
| Road user charges | | 620 | | 629 | | 644 | | 669 | | 703 | | 739 | | 777 | |
| Alcohol excise | | 461 | | 492 | | 479 | | 489 | | 503 | | 517 | | 531 | |
| Gaming duties | | 245 | | 281 | | 272 | | 307 | | 324 | | 339 | | 356 | |
| Motor vehicle fees | | 201 | | 193 | | 203 | | 211 | | 220 | | 219 | | 223 | |
| Energy resources levies | | 97 | | 87 | | 85 | | 82 | | 77 | | 74 | | 68 | |
| Approved issuer levy (AIL) and cheque duty | | 51 | | 45 | | 56 | | 57 | | 58 | | 59 | | 60 | |
| | |
| |
| |
| |
| |
| |
| |
| |
| Total Other Indirect Taxation | | 4,225 | | 4,266 | | 4,279 | | 4,410 | | 4,541 | | 4,644 | | 4,730 | |
| | |
| |
| |
| |
| |
| |
| |
| |
| Total Indirect Taxation | | 12,996 | | 13,330 | | 13,617 | | 14,234 | | 14,720 | | 15,269 | | 15,875 | |
| | |
| |
| |
| |
| |
| |
| |
| |
| Total Tax Receipts Collected | | 39,468 | | 40,609 | | 42,215 | | 44,131 | | 46,026 | | 47,920 | | 50,117 | |
| | |
| |
| |
| |
| |
| |
| |
| |
| Other Sovereign Receipts (cash) | | | | | | | | | | | | | | | |
| ACC levies | | 1,638 | | 1,931 | | 1,999 | | 2,020 | | 2,080 | | 2,143 | | 2,151 | |
| Fire Service levies | | 227 | | 226 | | 226 | | 226 | | 226 | | 226 | | 226 | |
| EQC levies | | 77 | | 79 | | 79 | | 81 | | 82 | | 84 | | 85 | |
| Other miscellaneous items | | 589 | | 488 | | 563 | | 613 | | 614 | | 623 | | 634 | |
| | |
| |
| |
| |
| |
| |
| |
| |
| Total Other Sovereign Receipts | | 2,531 | | 2,724 | | 2,867 | | 2,940 | | 3,002 | | 3,076 | | 3,096 | |
| | |
| |
| |
| |
| |
| |
| |
| |
| Total Sovereign Receipts | | 41,999 | | 43,333 | | 45,082 | | 47,071 | | 49,028 | | 50,996 | | 53,213 | |
| | |
| |
| |
| |
| |
| |
| |
| |
NOTE 2: Sale of Goods and Services
The Statement of Segments shows the sale of goods and services as a total for each area of the Crown Estate (ie, total sales for core Crown, Crown entities and SOEs). The total for Crown entities includes such items as lottery sales, housing rental, CRI sales, tertiary fees and so on. The total sales of SOEs represents the majority of their income from electricity generation and distribution services, postal services, advertising, air travel sales and so on.
NOTE 3: Investment Income
($ million)
| | 2003
Actual
| | 2004
Previous
Budget
| | 2004
Forecast
| | 2005
Forecast
| | 2006
Forecast
| | 2007
Forecast
| | 2008
Forecast
|
|---|
| NZS Fund investment income | | — | | 222 | | 136 | | 461 | | 690 | | 948 | | 1,236 |
| Other investment income | | 1,466 | | 1,162 | | 1,553 | | 1,523 | | 1,661 | | 1,780 | | 1,858 |
| Student loans | | 393 | | 447 | | 402 | | 468 | | 535 | | 607 | | 678 |
| | |
| |
| |
| |
| |
| |
| |
|
| Total Investment Income | | 1,859 | | 1,831 | | 2,091 | | 2,452 | | 2,886 | | 3,335 | | 3,772 |
| | |
| |
| |
| |
| |
| |
| |
|
NOTE 4: Other Revenue |
|
|
|
|
|
|
|
|
|
|
|
|
|
|
Unrealised gains/(losses) arising from changes in the value of commercial forests |
|
(20 |
) |
— |
|
— |
|
— |
|
— |
|
— |
|
— |
| GSF contributions | | 130 | | 103 | | 110 | | 101 | | 91 | | 80 | | 69 |
| Petroleum royalties | | 44 | | 30 | | 38 | | 28 | | 25 | | 28 | | 28 |
| Cost recovery income from Fisheries | | 31 | | 33 | | — | | 31 | | 30 | | 30 | | 30 |
| Other | | 2,050 | | 1,515 | | 1,639 | | 1,607 | | 1,610 | | 1,648 | | 1,678 |
| | |
| |
| |
| |
| |
| |
| |
|
| Total Other Revenue | | 2,235 | | 1,681 | | 1,787 | | 1,767 | | 1,756 | | 1,786 | | 1,805 |
| | |
| |
| |
| |
| |
| |
| |
|
NOTE 5: Subsidies and Transfer Payments |
|
|
|
|
|
|
|
|
|
|
|
|
|
|
Social assistance grants |
|
|
|
|
|
|
|
|
|
|
|
|
|
|
| New Zealand Superannuation | | 5,642 | | 5,894 | | 5,890 | | 6,088 | | 6,419 | | 6,810 | | 7,206 |
| ACC payments | | 1,309 | | 1,383 | | 1,386 | | 1,423 | | 1,488 | | 1,553 | | 1,618 |
| Unemployment Benefit | | 1,274 | | 1,317 | | 1,146 | | 1,117 | | 1,193 | | 1,214 | | 1,261 |
| Domestic Purposes Benefit | | 1,520 | | 1,567 | | 1,561 | | 1,595 | | 1,647 | | 1,701 | | 1,756 |
| Family Support | | 862 | | 815 | | 836 | | 798 | | 794 | | 792 | | 791 |
| Student allowances | | 387 | | 433 | | 391 | | 405 | | 418 | | 432 | | 449 |
| Other social assistance grants | | 3,742 | | 3,965 | | 3,883 | | 4,042 | | 4,226 | | 4,391 | | 4,576 |
| Subsidies | | 113 | | 135 | | 145 | | 128 | | 128 | | 129 | | 129 |
| Other transfer payments | | | | | | | | | | | | | | |
| Official development assistance | | 230 | | 246 | | 245 | | 245 | | 245 | | 246 | | 246 |
| Other | | 28 | | 32 | | 33 | | 28 | | 26 | | 28 | | 28 |
| | |
| |
| |
| |
| |
| |
| |
|
| Total Subsidies and Transfer Payments | | 15,107 | | 15,787 | | 15,516 | | 15,869 | | 16,584 | | 17,296 | | 18,060 |
| | |
| |
| |
| |
| |
| |
| |
|
NOTE 6: Personnel Expenses
The Statement of Institutional Segments shows the personnel expenses as a total for each area of the Crown Estate (ie, total personnel expenses for core Crown, Crown entities and SOEs).
($ million)
| | 2003
Actual
| | 2004
Previous
Budget
| | 2004
Forecast
| | 2005
Forecast
| | 2006
Forecast
| | 2007
Forecast
| | 2008
Forecast
|
|---|
| GSF pension costs (excluding liability movement) | | 978 | | 1,010 | | 986 | | 1,007 | | 1,051 | | 1,089 | | 1,109 |
| Other pension expenses | | 78 | | 81 | | 77 | | 113 | | 114 | | 114 | | 114 |
| Other personnel expenses | | 10,564 | | 11,008 | | 11,182 | | 11,520 | | 11,780 | | 11,790 | | 11,833 |
| | |
| |
| |
| |
| |
| |
| |
|
| Total Personnel Expenses | | 11,620 | | 12,099 | | 12,245 | | 12,640 | | 12,945 | | 12,993 | | 13,056 |
| | |
| |
| |
| |
| |
| |
| |
|
NOTE 7: Operating Expenses
Operating expenses relate to those expenses incurred in the course of undertaking the functions and activities of every entity included in the Crown financial statements, excluding those separately identified in the Statement of Financial Performance and other notes. Items disclosed separately are those required by accounting standards (and are expanded on further in the annual Crown financial statements). These include depreciation, rental costs and goodwill amortised.
Other operating costs is the large residual. Most of it represents the payment made for services provided by third parties (roading maintenance for example) or for raw materials (fuel, medicines or inventory for example). It also includes other day-to-day operating costs.
| Depreciation expense (by class of asset): | | | | | | | | | | | | | | |
| Buildings | | 701 | | 550 | | 737 | | 742 | | 735 | | 756 | | 754 |
| Electricity distribution network | | 86 | | 110 | | 116 | | 119 | | 124 | | 124 | | 124 |
| Electricity generation assets | | 143 | | 155 | | 161 | | 183 | | 203 | | 224 | | 225 |
| Specialist military equipment (SME) | | 168 | | 178 | | 182 | | 212 | | 213 | | 213 | | 213 |
| State highways | | 199 | | 223 | | 211 | | 235 | | 261 | | 285 | | 308 |
| Aircraft (ex SME) | | 105 | | 84 | | 137 | | 97 | | 92 | | 93 | | 93 |
| Other plant and equipment | | 676 | | 762 | | 816 | | 870 | | 918 | | 926 | | 967 |
| Other assets | | 99 | | 278 | | 86 | | 93 | | 96 | | 101 | | 105 |
| | |
| |
| |
| |
| |
| |
| |
|
| Total depreciation costs | | 2,177 | | 2,340 | | 2,446 | | 2,551 | | 2,642 | | 2,722 | | 2,789 |
Other operating items: |
|
|
|
|
|
|
|
|
|
|
|
|
|
|
| Rental and leasing costs | | 712 | | 797 | | 703 | | 817 | | 812 | | 821 | | 828 |
| Change in provision for doubtful debts | | 67 | | 338 | | 217 | | 203 | | 200 | | 217 | | 214 |
| Write off of bad debts | | 188 | | 41 | | 67 | | 64 | | 66 | | 66 | | 65 |
| Goodwill amortised | | 84 | | 47 | | 47 | | 47 | | 47 | | 47 | | 47 |
| Grants paid | | 306 | | 293 | | 252 | | 257 | | 265 | | 271 | | 279 |
| Lottery prize payments | | 301 | | 313 | | 303 | | 314 | | 331 | | 349 | | 367 |
| Loss/(gain) on sale of assets | | 19 | | — | | — | | — | | — | | — | | — |
| Other operating | | 18,711 | | 18,719 | | 19,441 | | 20,065 | | 20,939 | | 21,195 | | 21,377 |
| | |
| |
| |
| |
| |
| |
| |
|
| Total operating expenses | | 22,565 | | 22,888 | | 23,476 | | 24,318 | | 25,302 | | 25,688 | | 25,966 |
| | |
| |
| |
| |
| |
| |
| |
|
NOTE 8: Forecast New Operating Spending |
|
|
|
|
|
|
|
|
|
|
|
|
|
|
New operating spending up to Budget 2004 |
|
— |
|
175 |
|
— |
|
— |
|
— |
|
— |
|
— |
| New operating spending for the 2004 Budget | | — | | — | | 35 | | 1,153 | | 1,679 | | 1,910 | | 2,113 |
| Forecast new operating spending | | — | | — | | — | | — | | 978 | | 2,422 | | 3,915 |
| | |
| |
| |
| |
| |
| |
| |
|
| Total Forecast for Future New Spending | | — | | 175 | | 35 | | 1,153 | | 2,657 | | 4,332 | | 6,028 |
| | |
| |
| |
| |
| |
| |
| |
|
The forecast new operating spending represents an amount that indicates in broad terms the potential spending increases that could be introduced in each future budget round. The amounts for spending in the 2004 Budget are $2.2 billion (GST inclusive) in 2004/05 increasing to $3.4 billion by 2007/08, though some has already been allocated (e.g. as part of the Health package and other decisions since Budget 2003) leaving $1.2 billion (GST inclusive) in 2004/05 ranging up to $2.4 billion in 2007/08 for Budget 2004. The forecasts include $1.8 billion for Budget 2005 and $1.6 billion for 2006/07 and 2007/08, though the remaining amounts for 2005/06 and 2006/07 are lower as some has already been allocated (e.g. as part of Health sector funding packages including removal of asset testing and some Education funding), leaving indicative totals of around $1.1 billion (GST inclusive) for Budget 2005 and $1.56 billion (GST inclusive) for 2006/07.
NOTE 9: Cash and Marketable Securities, Deposits & Equity Investments
($ million)
| | 2003
Actual
| | 2004
Previous
Budget
| | 2004
Forecast
| | 2005
Forecast
| | 2006
Forecast
| | 2007
Forecast
| | 2008
Forecast
|
|---|
| By category: | | | | | | | | | | | | | | |
| Total Cash | | 2,732 | | 2,073 | | 2,455 | | 2,425 | | 2,516 | | 2,689 | | 2,878 |
Marketable securities and deposits |
|
15,505 |
|
13,632 |
|
11,819 |
|
11,293 |
|
11,672 |
|
12,210 |
|
12,535 |
| Equity investments (e.g. shares) | | 4,734 | | 4,747 | | 8,698 | | 11,041 | | 13,686 | | 16,572 | | 19,702 |
| Reserve position at the International Monetary Fund | | 1,067 | | 1,074 | | 1,225 | | 1,394 | | 1,581 | | 1,783 | | 1,997 |
| | |
| |
| |
| |
| |
| |
| |
|
| Total MSDs and Equity Investments | | 21,306 | | 19,453 | | 21,742 | | 23,728 | | 26,939 | | 30,565 | | 34,234 |
| | |
| |
| |
| |
| |
| |
| |
|
| Total Cash and MSDs & Equity Investments | | 24,038 | | 21,526 | | 24,197 | | 26,153 | | 29,455 | | 33,254 | | 37,112 |
| | |
| |
| |
| |
| |
| |
| |
|
| By portfolio management: | | | | | | | | | | | | | | |
| Reserve Bank and DMO managed funds | | 11,348 | | 7,506 | | 8,976 | | 8,048 | | 8,023 | | 8,171 | | 8,099 |
| New Zealand Superannuation Fund | | 1,884 | | 3,950 | | 3,496 | | 5,573 | | 7,955 | | 10,597 | | 13,558 |
| Government Superannuation Fund | | 2,636 | | 2,727 | | 2,933 | | 2,979 | | 3,014 | | 3,041 | | 3,058 |
| ACC portfolio | | 3,403 | | 2,829 | | 3,996 | | 4,608 | | 5,278 | | 6,001 | | 6,675 |
| EQC portfolio | | 1,224 | | 1,384 | | 1,539 | | 1,658 | | 1,777 | | 1,896 | | 2,016 |
| Other holdings | | 811 | | 1,057 | | 802 | | 862 | | 892 | | 859 | | 828 |
| | |
| |
| |
| |
| |
| |
| |
|
| Total MSDs and Equity Investments | | 21,306 | | 19,453 | | 21,742 | | 23,728 | | 26,939 | | 30,565 | | 34,234 |
| | |
| |
| |
| |
| |
| |
| |
|
The asset values above are net of any cross-holdings. For example the asset portfolios of the GSF, EQC and ACC currently all hold amounts of NZ Government Stock. For financial reporting purposes these amounts are eliminated within the consolidated financial statements. The total portfolios are shown below, along with commentary on the restricted nature of some of the assets (for example the GSF assets are only available for the payment of GSF benefits—because of the restricted nature of these assets they are excluded from the definition of net debt).
Nature of financial assets—some are restricted in their purpose
Within the financial assets above, several portfolios are restricted in their nature in that they are only available to meet very specified purposes and are not available (by statute or other reasons) for general use by the Crown. It is for this reason that such assets are excluded from the definition of net debt—one of the Crown's key fiscal policy indicators.
New Zealand Superannuation Fund
The assets of the NZS Fund is the Government's means of building up assets to partially pre-fund future NZS expenses and may only be used for NZ Superannuation. The Government's contributions to the NZS Fund are calculated over a 40-year rolling horizon to ensure Superannuation entitlements over the next 40 years can be met.
Government Superannuation Fund
The GSF Authority administers the financial assets of the GSF totalling around $3 billion. These assets result from contributions by employees built up through time and can only be applied to the ongoing payment of GSF benefits (as provided by the GSF Act). Also refer Note 15 Outstanding Liability associated with GSF benefits.
EQC—Natural Disaster Fund (NDF)
The EQC is New Zealand's primary provider of seismic disaster insurance to residential property owners. EQC administers the NDF, comprising capital and reserves. EQC draws on the NDF money to pay out claims for damage caused by natural disasters.
ACC portfolio
The ACC manages the ACC scheme. At present there is a substantial outstanding claims liability associated with past claims in excess of $9.1 billion and is expected to increase. To manage the payment of these claims in the future, ACC is building up a matching portfolio of assets. The target is to have the residual claims fully funded by 2014. Also refer Note 16 Outstanding Claims Liability.
| |
| |
| |
| |
| |
| |
| |
|
|---|
| NZS Fund | | 1,884 | | 3,950 | | 3,885 | | 6,192 | | 8,839 | | 11,777 | | 15,065 |
| GSF financial assets | | 3,182 | | 3,026 | | 3,259 | | 3,310 | | 3,349 | | 3,379 | | 3,398 |
| ACC portfolio | | 4,922 | | 4,981 | | 5,779 | | 6,664 | | 7,634 | | 8,679 | | 9,655 |
| EQC portfolio | | 4,062 | | 4,303 | | 4,356 | | 4,700 | | 5,078 | | 5,477 | | 5,899 |
NOTE 10: Advances
($ million)
| | 2003
Actual
| | 2004
Previous
Budget
| | 2004
Forecast
| | 2005
Forecast
| | 2006
Forecast
| | 2007
Forecast
| | 2008
Forecast
| |
|---|
| Student loans (see analysis below) | | 5,370 | | 5,926 | | 6,073 | | 6,790 | | 7,549 | | 8,357 | | 9,219 | |
| Kiwibank deposits | | 501 | | 857 | | 1,069 | | 1,581 | | 2,052 | | 2,052 | | 2,052 | |
| Residential care loans | | 68 | | 80 | | 75 | | 85 | | 95 | | 105 | | 115 | |
| Maori development rural lending | | 43 | | 45 | | 49 | | 49 | | 48 | | 48 | | 48 | |
| Forestry encouragement loans | | 28 | | 29 | | 28 | | 27 | | 26 | | 25 | | 24 | |
| Catchment authorities | | 6 | | 6 | | 4 | | 4 | | 4 | | 4 | | 4 | |
| Other | | 284 | | 279 | | 289 | | 324 | | 344 | | 357 | | 370 | |
| | |
| |
| |
| |
| |
| |
| |
| |
| Total Advances | | 6,300 | | 7,222 | | 7,587 | | 8,860 | | 10,118 | | 10,948 | | 11,832 | |
| | |
| |
| |
| |
| |
| |
| |
| |
| Analysis of Student Loans | | | | | | | | | | | | | | | |
| Outstanding balance | | | | | | | | | | | | | | | |
| Total loans outstanding (including interest) | | 6,094 | | 6,942 | | 6,870 | | 7,676 | | 8,534 | | 9,438 | | 10,403 | |
| Total provisions (capital and interest) | | (724 | ) | (1,016 | ) | (797 | ) | (886 | ) | (985 | ) | (1,081 | ) | (1,184 | ) |
| | |
| |
| |
| |
| |
| |
| |
| |
| Total Student Loans | | 5,370 | | 5,926 | | 6,073 | | 6,790 | | 7,549 | | 8,357 | | 9,219 | |
| | |
| |
| |
| |
| |
| |
| |
| |
| Movement during the year | | | | | | | | | | | | | | | |
| Opening balance | | 4,749 | | 5,322 | | 5,368 | | 6,073 | | 6,790 | | 7,549 | | 8,357 | |
| Amount advanced in current year | | 952 | | 996 | | 1,028 | | 1,082 | | 1,138 | | 1,203 | | 1,272 | |
| Interest accrued on outstanding loan balances | | 393 | | 447 | | 402 | | 468 | | 535 | | 607 | | 678 | |
| Repayment of base capital | | (252 | ) | (301 | ) | (282 | ) | (337 | ) | (374 | ) | (413 | ) | (454 | ) |
| Repayment of accrued interest | | (186 | ) | (189 | ) | (210 | ) | (212 | ) | (237 | ) | (264 | ) | (293 | ) |
| Interest written off and movement in provision for interest write-offs and doubtful debts | | (291 | ) | (357 | ) | (241 | ) | (292 | ) | (311 | ) | (334 | ) | (347 | ) |
| Other movements | | 5 | | 8 | | 8 | | 8 | | 8 | | 9 | | 6 | |
| | |
| |
| |
| |
| |
| |
| |
| |
| Closing Balance | | 5,370 | | 5,926 | | 6,073 | | 6,790 | | 7,549 | | 8,357 | | 9,219 | |
| | |
| |
| |
| |
| |
| |
| |
| |
NOTE 11: Receivables
| |
| |
| |
| |
| |
| |
| |
|
|---|
| Taxes receivable | | 5,375 | | 4,533 | | 5,398 | | 5,393 | | 5,402 | | 5,421 | | 5,438 |
| Accounts receivable | | 4,262 | | 3,453 | | 3,820 | | 3,941 | | 4,212 | | 4,344 | | 4,529 |
| Receivable from the sale and purchase of Maui gas | | 200 | | 166 | | 153 | | 216 | | 156 | | 119 | | 133 |
| Prepayments | | 306 | | 173 | | 278 | | 261 | | 260 | | 258 | | 262 |
| | |
| |
| |
| |
| |
| |
| |
|
| Total Receivables | | 10,143 | | 8,325 | | 9,649 | | 9,811 | | 10,030 | | 10,142 | | 10,362 |
| | |
| |
| |
| |
| |
| |
| |
|
NOTE 12: Other Investments
| |
| |
| |
| |
| |
| |
| |
|
|---|
| International Bank for Reconstruction and Development | | 89 | | 99 | | 89 | | 89 | | 89 | | 89 | | 89 |
| Asian Development Bank | | 92 | | 96 | | 92 | | 92 | | 92 | | 92 | | 92 |
| Other | | 83 | | 201 | | 80 | | 80 | | 80 | | 80 | | 80 |
| | |
| |
| |
| |
| |
| |
| |
|
| Total Other Investments | | 264 | | 396 | | 261 | | 261 | | 261 | | 261 | | 261 |
| | |
| |
| |
| |
| |
| |
| |
|
NOTE 13: Property, Plant and Equipment
($ million)
| | 2003
Actual
| | 2004
Previous
Budget
| | 2004
Forecast
| | 2005
Forecast
| | 2006
Forecast
| | 2007
Forecast
| | 2008
Forecast
|
|---|
| By Type | | | | | | | | | | | | | | |
| Gross Carrying Value | | | | | | | | | | | | | | |
| Land (valuation) | | 6,748 | | 5,824 | | 6,532 | | 6,787 | | 6,830 | | 6,893 | | 6,896 |
| Properties intended for sale (valuation) | | 454 | | 423 | | 459 | | 439 | | 436 | | 436 | | 436 |
| Buildings (valuation) | | 19,092 | | 19,756 | | 20,270 | | 20,965 | | 21,962 | | 22,971 | | 23,782 |
| Electricity distribution network (valuation) | | 2,178 | | 2,370 | | 2,293 | | 2,456 | | 2,601 | | 2,746 | | 2,891 |
| Electricity generation assets (cost) | | 1,253 | | 2,067 | | 1,383 | | 1,658 | | 1,884 | | 2,034 | | 2,184 |
| Aircraft (ex SME) (valuation) | | 1,234 | | 2,024 | | 1,400 | | 1,742 | | 1,994 | | 2,144 | | 2,298 |
| State highways (valuation) | | 12,556 | | 12,466 | | 12,980 | | 13,440 | | 13,916 | | 14,398 | | 14,886 |
| Specialist military equipment (valuation) | | 3,098 | | 3,576 | | 2,929 | | 3,081 | | 3,036 | | 3,082 | | 3,127 |
| Other plant and equipment (cost) | | 8,584 | | 9,285 | | 9,556 | | 11,034 | | 11,989 | | 12,774 | | 13,623 |
| Other assets (valuation) | | 5,331 | | 5,365 | | 5,320 | | 5,300 | | 5,363 | | 5,409 | | 5,446 |
| | |
| |
| |
| |
| |
| |
| |
|
| Total Gross Carrying Value | | 60,528 | | 63,156 | | 63,122 | | 66,902 | | 70,011 | | 72,887 | | 75,569 |
| | |
| |
| |
| |
| |
| |
| |
|
| Accumulated Depreciation | | | | | | | | | | | | | | |
| Buildings | | 1,503 | | 3,040 | | 2,297 | | 3,006 | | 3,800 | | 4,616 | | 5,333 |
| Electricity distribution network | | 198 | | 326 | | 310 | | 406 | | 512 | | 644 | | 776 |
| Electricity generation assets | | 174 | | 227 | | 232 | | 295 | | 359 | | 424 | | 488 |
| Aircraft (ex SME) | | | | 170 | | 137 | | 234 | | 326 | | 419 | | 512 |
| State highways | | | | 432 | | 210 | | 446 | | 707 | | 993 | | 1,301 |
| Specialist military equipment | | 756 | | 934 | | 487 | | 699 | | 802 | | 1,015 | | 1,227 |
| Other plant and equipment | | 4,776 | | 5,282 | | 5,462 | | 6,295 | | 7,195 | | 8,114 | | 9,092 |
| Other assets | | 454 | | 640 | | 460 | | 486 | | 516 | | 550 | | 591 |
| | |
| |
| |
| |
| |
| |
| |
|
| Total Accumulated Depreciation | | 7,861 | | 11,051 | | 9,595 | | 11,867 | | 14,217 | | 16,775 | | 19,320 |
| | |
| |
| |
| |
| |
| |
| |
|
| Net Carrying Value | | | | | | | | | | | | | | |
| Land (valuation) | | 6,748 | | 5,824 | | 6,532 | | 6,787 | | 6,830 | | 6,893 | | 6,896 |
| Properties intended for sale (valuation) | | 454 | | 423 | | 459 | | 439 | | 436 | | 436 | | 436 |
| Buildings (valuation) | | 17,589 | | 16,716 | | 17,973 | | 17,959 | | 18,162 | | 18,355 | | 18,449 |
| Electricity distribution network (valuation) | | 1,980 | | 2,044 | | 1,983 | | 2,050 | | 2,089 | | 2,102 | | 2,115 |
| Electricity generation assets (cost) | | 1,079 | | 1,840 | | 1,151 | | 1,363 | | 1,525 | | 1,610 | | 1,696 |
| Aircraft (ex SME) (valuation) | | 1,234 | | 1,854 | | 1,263 | | 1,508 | | 1,668 | | 1,725 | | 1,786 |
| State highways (valuation) | | 12,556 | | 12,034 | | 12,770 | | 12,994 | | 13,209 | | 13,405 | | 13,585 |
| Specialist military equipment (valuation) | | 2,342 | | 2,642 | | 2,442 | | 2,382 | | 2,234 | | 2,067 | | 1,900 |
| Other plant and equipment (cost) | | 3,808 | | 4,725 | | 4,094 | | 4,739 | | 4,794 | | 4,660 | | 4,531 |
| Other assets (valuation) | | 4,877 | | 4,003 | | 4,860 | | 4,814 | | 4,847 | | 4,859 | | 4,855 |
| | |
| |
| |
| |
| |
| |
| |
|
| Total Net Carrying Value | | 52,667 | | 52,105 | | 53,527 | | 55,035 | | 55,794 | | 56,112 | | 56,249 |
| | |
| |
| |
| |
| |
| |
| |
|
| By Holding | | | | | | | | | | | | | | |
| Freehold assets | | 52,167 | | 51,383 | | 53,121 | | 54,612 | | 55,367 | | 55,689 | | 55,829 |
| Leasehold assets | | 500 | | 722 | | 406 | | 423 | | 427 | | 423 | | 420 |
| | |
| |
| |
| |
| |
| |
| |
|
| Net carrying value | | 52,667 | | 52,105 | | 53,527 | | 55,035 | | 55,794 | | 56,112 | | 56,249 |
| | |
| |
| |
| |
| |
| |
| |
|
NOTE 14: Payables and Provisions
| |
| |
| |
| |
| |
| |
| |
|
|---|
| Accounts payable and accruals | | 7,054 | | 5,754 | | 5,763 | | 5,558 | | 5,430 | | 5,426 | | 5,367 |
| Taxes repayable | | 2,154 | | 1,919 | | 2,139 | | 2,134 | | 2,134 | | 2,134 | | 2,134 |
| Provisions | | 588 | | 242 | | 488 | | 465 | | 447 | | 434 | | 422 |
| National Provident Fund guarantee | | 882 | | 685 | | 882 | | 882 | | 882 | | 882 | | 882 |
| Provisions for employee entitlements | | 1,200 | | 1,144 | | 1,164 | | 1,199 | | 1,210 | | 1,206 | | 1,192 |
| | |
| |
| |
| |
| |
| |
| |
|
| Total Payables and Provisions | | 11,878 | | 9,744 | | 10,436 | | 10,238 | | 10,103 | | 10,082 | | 9,997 |
| | |
| |
| |
| |
| |
| |
| |
|
NOTE 15: GSF Liability
The Government Superannuation Fund (GSF) assets and liabilities have been calculated by the Government Actuary as at 31 October 2003 for inclusion within the 2003 December Economic and Fiscal Update (DEFU). The liability arises from closed schemes for past and present public sector employees (set out in the GSF Act 1956). A projected Aggregate Funding method is used for the valuation, based on membership data as at the valuation date. The funding method requires the benefits payable from the GSF in respect of past service to be calculated and then discounted back to the valuation date.
The GSF liability included in the 2003 DEFU was calculated using discount rates derived from the market yield curve as at the balance date (31 October 2003). This resulted in a long-term after-tax discount rate of 4.5% (4.0% as at 30 June 2003). The other principal long-term financial assumptions used in the calculation remained unchanged from 30 June 2003, which were an inflation rate of 2.0%, and an annual salary increases rate, before any promotional effects of 3.0%.
The total change in the net unfunded liability is $466 million in 2003/04 (reflecting a decrease in the gross liability of $364 million and an increase in the net assets of $102 million). There are essentially three components to the change, being the net movement in expected investment income and net benefit payments, changes to economic assumptions and actual GSF experience to 31 October 2003. The change in underlying economic assumptions as at 31 October 2003 accounted for approximately $479 million of the decrease in the net liabilities, primarily due to discount rate movements which were partially offset by changes in demographic assumptions. The net liability decrease by $50 million due to actual GSF experience to 31 October 2003. Finally the net liability is expected to increase $165 million reflecting expected contributions and investment income offset by benefit payments. The changes in 2004/05 onwards reflect the net movement expected between investment income and contributions less benefit payments.
Presentation approach
The projected gross liability is included within total liabilities. The GSF has available to it a portfolio of assets that partially offset the gross liability. The assets (less cross holdings of NZ Government stock) are included in the asset portion of the Crown's overall balance sheet. The component parts are shown in the reconciliation below.
($ million)
| | 2003
Actual
| | 2004
Previous
Budget
| | 2004
Forecast
| | 2005
Forecast
| | 2006
Forecast
| | 2007
Forecast
| | 2008
Forecast
| |
|---|
| GSF liability and asset information | | | | | | | | | | | | | | | |
| Gross GSF liability | | | | | | | | | | | | | | | |
| Opening gross liability | | 12,210 | | 13,422 | | 13,857 | | 13,493 | | 13,442 | | 13,367 | | 13,259 | |
| Net projected change | | 1,647 | | (87 | ) | (364 | ) | (51 | ) | (75 | ) | (108 | ) | (128 | ) |
| | |
| |
| |
| |
| |
| |
| |
| |
| Closing gross liability | | 13,857 | | 13,335 | | 13,493 | | 13,442 | | 13,367 | | 13,259 | | 13,131 | |
| | |
| |
| |
| |
| |
| |
| |
| |
| Less net assets available to the GSF scheme | | | | | | | | | | | | | | | |
| Opening asset value | | 3,287 | | 2,993 | | 3,182 | | 3,284 | | 3,334 | | 3,372 | | 3,400 | |
| Net projected change (investment income & contributions less membership payments) | | (105 | ) | 33 | | 102 | | 50 | | 38 | | 28 | | 19 | |
| | |
| |
| |
| |
| |
| |
| |
| |
| Closing net asset values | | 3,182 | | 3,026 | | 3,284 | | 3,334 | | 3,372 | | 3,400 | | 3,419 | |
Net unfunded liability of the GSF schemes |
|
|
|
|
|
|
|
|
|
|
|
|
|
|
|
| Opening unfunded liability | | 8,923 | | 10,429 | | 10,675 | | 10,209 | | 10,108 | | 9,995 | | 9,859 | |
| Net projected change | | 1,752 | | (120 | ) | (466 | ) | (101 | ) | (113 | ) | (136 | ) | (147 | ) |
| | |
| |
| |
| |
| |
| |
| |
| |
| Net unfunded liability | | 10,675 | | 10,309 | | 10,209 | | 10,108 | | 9,995 | | 9,859 | | 9,712 | |
NOTE 16: ACC Claims Liability
Calculation information
Trowbridge Deloitte Limited, Consulting Actuaries, have prepared the independent actuarial estimate of the ACC outstanding claims liability as at 30 June 2003. This estimate includes the expected future payments relating to accidents that occurred prior to balance date (whether or not the associated claims have been reported to, or accepted by, ACC) and also the expected administrative expenses of managing these claims.
The key economic variables that impact on changes to the valuation are the long-term Labour Cost Index (LCI) of 2.3% (unchanged from 30 June 2003) and discount rate of 6.0% (5.5% at 30 June 2003). Other key variables in each valuation is the assumed rate at which long-term claimants will leave the scheme over the period. This assessment is largely based on scheme history.
Explanation of change
The total change in the gross unfunded liability compared to the expected movement for 2003/04 from the estimate as at 30 June 2003 is $419 million. The main driver of the change has been the increase in discount rates since the 30 June 2003 valuation.
Presentation approach
The projected gross liability is included within total liabilities. The ACC has available to it a portfolio of assets that partially offset the gross liability. The assets (less cross holdings of NZ Government stock) are included in the asset portion of the Crowns' overall balance sheet.
The approach followed in the past has been to show the movement in the ACC liability as a single net movement in the Statement of Financial Performance as part of the net surplus of SOEs and Crown entities. Now movements are shown within the component assets and liabilities.
($ million)
| | 2003
Actual
| | 2004
Previous
Budget
| | 2004
Forecast
| | 2005
Forecast
| | 2006
Forecast
| | 2007
Forecast
| | 2008
Forecast
| |
|---|
| ACC liability and asset information | | | | | | | | | | | | | | | |
| Gross ACC liability | | | | | | | | | | | | | | | |
| Opening gross liability | | 7,501 | | 8,701 | | 9,155 | | 9,237 | | 9,789 | | 10,373 | | 10,985 | |
| Net projected change | | 1,654 | | 499 | | 82 | | 552 | | 584 | | 612 | | 634 | |
| | |
| |
| |
| |
| |
| |
| |
| |
| Closing gross liability | | 9,155 | | 9,200 | | 9,237 | | 9,789 | | 10,373 | | 10,985 | | 11,619 | |
| | |
| |
| |
| |
| |
| |
| |
| |
Less net assets available to ACC |
|
|
|
|
|
|
|
|
|
|
|
|
|
|
|
| Opening net asset value | | 3,865 | | 4,527 | | 4,901 | | 5,730 | | 6,645 | | 7,639 | | 8,708 | |
| Net projected change | | 1,036 | | 766 | | 829 | | 915 | | 994 | | 1,069 | | 1,151 | |
| | |
| |
| |
| |
| |
| |
| |
| |
| Closing net asset values | | 4,901 | | 5,293 | | 5,730 | | 6,645 | | 7,639 | | 8,708 | | 9,859 | |
Net ACC reserves (net liability) |
|
|
|
|
|
|
|
|
|
|
|
|
|
|
|
| Opening reserves position | | (3,636 | ) | (4,174 | ) | (4,254 | ) | (3,507 | ) | (3,144 | ) | (2,734 | ) | (2,277 | ) |
| Net projected change | | (618 | ) | 267 | | 747 | | 363 | | 410 | | 457 | | 517 | |
| | |
| |
| |
| |
| |
| |
| |
| |
| Closing reserves position (net liability) | | (4,254 | ) | (3,907 | ) | (3,507 | ) | (3,144 | ) | (2,734 | ) | (2,277 | ) | (1,760 | ) |
NOTE 17: Revaluation reserves |
|
|
|
|
|
|
|
|
|
|
|
|
|
|
|
Asset Revaluation Reserves |
|
|
|
|
|
|
|
|
|
|
|
|
|
|
|
| Opening Balance | | 12,672 | | 12,786 | | 15,624 | | 15,663 | | 15,663 | | 15,663 | | 15,663 | |
| Net revaluations | | | | | | | | | | | | | | | |
| Land and buildings | | 2,078 | | — | | 18 | | — | | — | | — | | — | |
| State highways | | 444 | | — | | — | | — | | — | | — | | — | |
| TEIs | | 275 | | — | | — | | — | | — | | — | | — | |
| Aircraft (ex SME) | | — | | — | | — | | — | | — | | — | | — | |
| Electricity distribution network | | — | | — | | — | | — | | — | | — | | — | |
| Other assets | | 198 | | — | | 29 | | — | | — | | — | | — | |
| | |
| |
| |
| |
| |
| |
| |
| |
| Total Net Revaluations | | 2,995 | | — | | 47 | | — | | — | | — | | — | |
| Transfer to taxpayer funds | | (43 | ) | — | | (8 | ) | — | | — | | — | | — | |
| | |
| |
| |
| |
| |
| |
| |
| |
| Closing Balance | | 15,624 | | 12,786 | | 15,663 | | 15,663 | | 15,663 | | 15,663 | | 15,663 | |
| | |
| |
| |
| |
| |
| |
| |
| |
($ million)
| | 2003
Actual
| | 2004
Previous
Budget
| | 2004
Forecast
| | 2005
Forecast
| | 2006
Forecast
| | 2007
Forecast
| | 2008
Forecast
| |
|---|
| NOTE 18: Core Crown Reconciliation of Core Crown Forecast Net Cash Flows from Operations with Forecast Net Cash Proceeds from Domestic Bonds (flows of Government stock involving NZS Fund and GSF are not eliminated) | | | | | | | | | | | | | | | |
Core Crown Cash Flows from Operations |
|
|
|
|
|
|
|
|
|
|
|
|
|
|
|
| Total tax receipts | | 39,842 | | 41,056 | | 42,579 | | 44,603 | | 46,609 | | 48,526 | | 50,750 | |
| Total other sovereign receipts | | 399 | | 384 | | 438 | | 488 | | 489 | | 498 | | 509 | |
| Interest, profits and dividends | | 1,310 | | 953 | | 1,161 | | 1,167 | | 1,372 | | 1,601 | | 1,779 | |
| Sale of goods & services and other receipts | | 1,185 | | 1,119 | | 1,307 | | 1,321 | | 1,304 | | 1,332 | | 1,290 | |
| Subsidies and transfer payments | | (14,071 | ) | (14,510 | ) | (14,351 | ) | (14,722 | ) | (15,391 | ) | (16,047 | ) | (16,756 | ) |
| Personnel and operating expenses | | (21,703 | ) | (23,297 | ) | (24,231 | ) | (24,367 | ) | (25,303 | ) | (25,408 | ) | (25,471 | ) |
| Finance costs | | (2,106 | ) | (2,058 | ) | (2,083 | ) | (1,986 | ) | (1,986 | ) | (1,826 | ) | (1,856 | ) |
| Forecast new operating spending | | — | | (175 | ) | (35 | ) | (1,153 | ) | (2,657 | ) | (4,332 | ) | (6,028 | ) |
| | |
| |
| |
| |
| |
| |
| |
| |
| Net Cash Flows from Core Crown Operations | | 4,856 | | 3,472 | | 4,785 | | 5,351 | | 4,437 | | 4,344 | | 4,217 | |
Net purchase of physical assets |
|
(1,059 |
) |
(1,285 |
) |
(1,359 |
) |
(842 |
) |
(689 |
) |
(703 |
) |
(713 |
) |
| Net increase in advances | | (896 | ) | (1,619 | ) | (1,729 | ) | (830 | ) | (873 | ) | (1,132 | ) | (973 | ) |
| Net purchase of investments | | (484 | ) | (659 | ) | (781 | ) | (348 | ) | (238 | ) | (156 | ) | (101 | ) |
| Purchase of marketable securities and deposits by NZS Fund | | (1,200 | ) | (1,879 | ) | (1,879 | ) | (1,979 | ) | (2,156 | ) | (2,265 | ) | (2,410 | ) |
| Forecast new capital spending | | — | | (180 | ) | (144 | ) | (700 | ) | (475 | ) | (500 | ) | (550 | ) |
| | |
| |
| |
| |
| |
| |
| |
| |
| Available to Repay Debt/(Required to be Financed) | | 1,217 | | (2,150 | ) | (1,107 | ) | 652 | | 6 | | (412 | ) | (530 | ) |
Financed by: |
|
|
|
|
|
|
|
|
|
|
|
|
|
|
|
| Other net sale/(purchase) of marketable securities and deposits | | (1,944 | ) | 2,483 | | 2,391 | | 904 | | (43 | ) | (152 | ) | 52 | |
| | |
| |
| |
| |
| |
| |
| |
| |
| Total Operating and Investing Activities | | (727 | ) | 333 | | 1,284 | | 1,556 | | (37 | ) | (564 | ) | (478 | ) |
Used in: |
|
|
|
|
|
|
|
|
|
|
|
|
|
|
|
| Net (repayment)/issue of other New Zealand-dollar borrowing | | (417 | ) | (238 | ) | 61 | | (718 | ) | (20 | ) | 3 | | 411 | |
| Decrease/(increase) in cash | | 69 | | 16 | | 278 | | (13 | ) | (10 | ) | 24 | | 67 | |
| Issue of circulating currency | | 147 | | — | | 33 | | — | | — | | — | | — | |
| Net issue/(repayment) of foreign-currency borrowing | | 1,658 | | (105 | ) | (868 | ) | (336 | ) | — | | — | | — | |
| | |
| |
| |
| |
| |
| |
| |
| |
| | | 1,457 | | (327 | ) | (496 | ) | (1,067 | ) | (30 | ) | 27 | | 478 | |
| | |
| |
| |
| |
| |
| |
| |
| |
| Net Cash (Outflow)/Inflow to be Offset by Domestic Bonds | | 730 | | 6 | | 788 | | 489 | | (67 | ) | (537 | ) | — | |
| | |
| |
| |
| |
| |
| |
| |
| |
| Gross Cash Proceeds from Domestic Bonds | | | | | | | | | | | | | | | |
| Domestic bonds (market) | | 2,551 | | 3,234 | | 2,235 | | 2,317 | | 2,841 | | 3,314 | | — | |
| Domestic bonds (non-market) | | 279 | | 357 | | 396 | | 263 | | 160 | | 376 | | — | |
| | |
| |
| |
| |
| |
| |
| |
| |
| Total Gross Cash Proceeds from Domestic Bonds | | 2,830 | | 3,591 | | 2,631 | | 2,580 | | 3,001 | | 3,690 | | — | |
Repayment of domestic bonds (market) |
|
(2,823 |
) |
(3,044 |
) |
(3,044 |
) |
(2,797 |
) |
(2,774 |
) |
(2,777 |
) |
— |
|
| Repayment of domestic bonds (non-market) | | (737 | ) | (553 | ) | (375 | ) | (272 | ) | (160 | ) | (376 | ) | — | |
| | |
| |
| |
| |
| |
| |
| |
| |
| Net Cash Proceeds from/(Repayments of) Domestic Bonds | | (730 | ) | (6 | ) | (788 | ) | (489 | ) | 67 | | 537 | | — | |
| | |
| |
| |
| |
| |
| |
| |
| |
Glossary of Terms
ACC unfunded liability
The future cost of past ACC claims, less the asset reserves held to meet these claims. The ACC outstanding claims liability is the gross liability of the future cost of past ACC claims.
Baselines
The level of funding approved for any given spending area (eg, Education). All amounts within baselines are included in the forecasts.
Contingent liability
Contingent liabilities are costs, which the Crown will have to face if a particular event occurs. Typically, contingent liabilities consist of guarantees and indemnities, legal disputes and claims, and uncalled capital.
Core Crown
The core Crown represents the revenues, expenses, assets and liabilities of departments, the Reserve Bank, GSF and the NZS Fund.
Corporate tax
The sum of net company tax, non-resident withholding tax (NRWT) and foreign dividend withholding payments (FDWP).
Current account
A measure of the flows of income between New Zealand and the rest of the world. A net inflow to New Zealand is a current account surplus, while a net outflow is a deficit. The current account balance is commonly expressed as a percentage of GDP.
Customs duty
Duty levied on the imports of certain goods.
Cyclically adjusted or structural fiscal balance
An estimate of the operating balance adjusted for short-term fluctuations of actual GDP around the productive potential of the economy. The estimate provides a picture of the underlying trend fiscal position and an indication of the effects of policy decisions. Because it is based on a number of assumptions and is sensitive to new information, the estimate is subject to some uncertainty. Trends in the cyclically adjusted balance are, however, more reliable.
Demographic changes
Changes to structure of the population, for example the age, sex or ethnic make-up of the population.
Domestic bond programme
The amount of new government stock (taking into account the repayment of maturing government stock) expected to be issued over the financial year to fund the Government's cash flow requirements.
Excise duties
Tax levied on the domestic production of alcohol, tobacco and light petroleum products (CNG, LPG and petrol).
Financial assets
Either cash or shares (equity) or a right to receive a financial instrument, which can be converted to cash (see net Crown debt).
Fiscal allowance
The amount included in the Fiscal Strategy Report and Budget Policy Statement projections for Government decisions on new spending and cost pressures.
Fiscal Objectives (long-term)
The Government's long-term goals for operating expenses, operating revenue, the operating balance, debt and net worth, as required by the Fiscal Responsibility Act 1994. The objectives must be consistent with the principles of responsible fiscal management outlined in the Act.
Forecast new capital spending
An amount provided in the forecasts to represent the balance sheet impact of capital initiatives expected to be introduced over the forecast period.
Forecast new operating spending
An amount included in the forecasts to provide for the operating balance impact of policy initiatives and changes to demographics and other forecasting changes expected to occur over the forecast period.
Fringe benefit tax (FBT)
Tax levied on non-cash benefits provided to employees as part of remuneration packages.
Gross Crown debt
Total borrowings (financial liabilities).
Gross domestic product (GDP)
A measure of the value of all goods and services produced in New Zealand; changes in GDP measure growth in economic activity or output. GDP can be measured as the actual dollar value of goods and services measured at today's prices (nominal GDP), or excluding the effects of price changes over time (real GDP).
Gross domestic product (expenditure)
This is the sum of total final expenditures on goods and services in the economy.
Gross national expenditure (GNE)
Measures total expenditure on goods and services by New Zealand residents.
Labour productivity
Measures output per input of labour (where labour inputs might be measured as hours worked or people).
Line-by-line consolidation
This is a term used to refer to the change required to the presentation of the Crown financial statements. It means that the revenues, expenses, assets and liabilities of all departments, the Reserve Bank, SOEs and Crown entities are included in the Crown financial statements.
Marketable securities and deposits
Assets held with financial institutions. These assets are held for both cash flow and investment purposes, and include any funds the Government has invested in the International Monetary Fund.
Monetary conditions
The combination of interest rates and the exchange rate.
Monetary policy
Action taken by the Reserve Bank to affect interest rates and the exchange rate in order to control inflation. Tightening monetary policy refers to actions taken by the Reserve Bank to raise interest rates (which can influence the exchange rate) in order to moderate demand pressures to reduce inflationary pressures.
Net Crown debt
Borrowings (financial liabilities) less cash and bank balances, marketable securities and deposits, and advances (financial assets). Net debt excludes the assets of the NZS Fund and GSF. Net Crown debt is a measure of the Core Crown.
Net worth
Assets less liabilities (also referred to as Crown balance).
Operating balance
The operating balance is the residual of revenues less expenses plus surpluses from state-owned enterprises and Crown entities. It is the Government's profit or loss.
Operating balance excluding revaluation and accounting policy changes (OBERAC)
The OBERAC is the operating balance adjusted for revaluation movements and accounting policy changes. It provides a measure of underlying stewardship.
Participation rate
Measures the percentage of the working age population in work or actively looking for work.
Projections
Tracks of the key fiscal indicators for a further five years beyond the five-year forecast period. The tracks are based on long-run economic assumptions and current fiscal policy settings. For example, the projections assume no economic cycle with constant long-run interest rate, inflation rate and unemployment assumptions.
Provisional tax
A thrice-yearly payment of tax on income that has not been taxed, or been under-taxed, at source (relates only to company tax and other persons' tax).
Scenarios
Tracks of the key fiscal indicators based on long-run economic and fiscal assumptions. For example growth in expense categories reflects the sum of the change in the appropriate population cohort, inflation and a real growth factor (to reflect rising real wages and technology costs).
Short-term intentions
In the Budget Policy Statement the Government must, under the Fiscal Responsibility Act 1994, indicate explicitly its planned track for operating expenses, operating revenues, the operating balance, debt and net worth over the Government's planning horizon (defined as the two financial years following the current financial year).
Source deductions
Tax withheld on wages, salaries, social welfare benefits, bonuses, lump-sum payments and superannuation fund contributions. About 80% of source deductions come from PAYE on wages and salaries. Source deductions is the biggest single tax type.
Specific fiscal risks
These are a category of Government decisions or circumstances which may have a material impact on the fiscal position (excluding contingent liabilities). They are not included in the main forecasts because their fiscal impact cannot be reasonably quantified, the likelihood of realisation is uncertain and/or the timing is uncertain.
Stock change
The change in the value of stocks (raw materials, work in progress, and finished goods) during a given period.
System of National Accounts (SNA)
SNA is a comprehensive, consistent and flexible set of macroeconomic accounts to meet the needs of government and private sector analysts, policy-makers, and decision-takers. See www.imf.org for further information.
Tax revenue
The accrual, rather than the cash ("tax receipts") measure of taxation. It is a measure of tax due, regardless of whether or not it has actually been paid.
Trade weighted index (TWI)
A measure of movements in the New Zealand dollar against the currencies of our major trading partners. The currencies comprise the US dollar, the Australian dollar, the Japanese yen, the euro and the UK pound.
Unit labour costs
The wages and other costs associated with employment per unit of output.
Year ended
Graphs and tables use different expressions of the timeframe. For example, 2003/04 or 2004 will generally mean "year ended 30 June" unless otherwise stated.
QuickLinks
ContentsStatement of Responsibility1 Economic Outlook2 Fiscal Outlook3 Risks and Scenarios4 Specific Fiscal RisksGenerally Accepted Accounting Practice (GAAP) Series TablesForecast Financial StatementsStatement of Accounting Policies and Forecast Assumptions