Exhibit 99.2
19 May 2005
Budget 2005
Fiscal Strategy Report
Fiscal Strategy Report
Sustainable economic growth is a key focus for the Government
In our first Budget Policy Statement (BPS) in 2000 the Government committed itself to making real and sustainable improvements in the lives and living standards of all New Zealanders – at work, in their homes and communities, in education and in retirement. We recognised that a sound and growing economy requires prudent fiscal management coupled with policies that foster a society which generates innovative businesses, effective government and strong communities. To achieve this, our focus has been on improving skills, enhancing our environment, strengthening national identity and closing income gaps. Five years on, we are reaping the benefits of this strategy and remain committed to further increasing New Zealand’s long-term rate of economic growth for the benefit of all.
Our fiscal strategy remains focused on preparing for the future fiscal costs of ageing
In BPS 2000 we stressed that:
Our policy programme will only be sustainable if it is grounded in sound fiscal policy. Sound fiscal policy takes a longer view and recognises the emergence of spending pressures long before they impact.
Figure 1 – Dependency ratio(1)

Source: The Treasury
(1) | Dependency ratio shows the proportion of dependent people per person of a working age. |
This Government’s fiscal strategy, in place since the start of our first term, is to strengthen public finances to prepare for the future fiscal costs associated with an ageing population (see Figure 1). Given the uncertainties associated with the size of these pressures, our approach comprises two complementary elements (see Figure 2):
Figure 2 – Gross sovereign issued debt and NZS Fund assets

Source: The Treasury
• The accumulation of financial assets through contributions to the New Zealand Superannuation (NZS) Fund.
• Managing debt at prudent levels with gross sovereign-issued debt as a percentage of GDP slowly reducing over the longer term.
Under current tax-to-GDP ratios, a sustained increase in spending would cause the Government’s operating balance to move into deficit and ultimately lead to a rise in the ratio of debt to GDP. Eventually this would require lower spending and/or higher taxes.
The NZS Fund helps smooth the effects of population ageing by increasing the net worth (via accumulated financial assets) of the Crown in order to partly finance the required extra spending in the future. Lowering debt also increases net worth and it allows funds that would otherwise pay debt servicing costs to be used for other spending. Both elements of the fiscal strategy allow time to assess the impact of demographic and other changes and to develop and implement policy responses. Our long-term fiscal strategy requires us to limit growth in spending over the next decade or so – the so-called golden years (Figure 1) – so we can avoid entering the period of more marked demographic change in a poor fiscal position.
To give effect to this fiscal strategy, the Government runs operating surpluses over the economic cycle sufficient to meet the NZS Fund contributions and most of the Government’s other capital spending needs. The decision to fund capital spending largely through current revenue rather than through borrowing emerges from the need to balance the potential benefits of capital spending against the fiscal position and the wider impacts on the economy. For example, there is the need to consider the impact of certain rising gross debt and associated finance costs against the quite uncertain financial or growth returns from some capital spending (eg, defence spending, hospitals and schools).
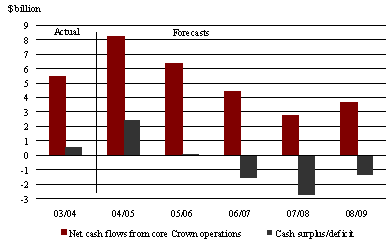
Once capital spending is accounted for, there is very little cash available for initiatives above those already included in the forecasts or, as is the case in the forecast years, there is a need to borrow to make up the shortfall. Consequently it cannot be assumed that a large
operating surplus is indicative of substantial funds available for tax cuts or extra expenditure since it does not take account of certain areas of capital spending regarded as a priority by this Government, eg, contributions to the NZS Fund, student loans and defence and infrastructure (eg, roading, schools and hospitals).
Figure 3 – Net cash flows from core Crown operations and cash surplus/deficit
Source: The Treasury
We have gone a long way towards meeting these fiscal objectives
Since we have been in office, gross sovereign-issued debt has fallen from 35% of GDP at 30 June 1999 to an estimated 23% by the end of June 2005. Alongside this, assets accumulated in the NZS Fund will stand at around $6.5 billion by June 2005. This progress has been more rapid than expected when we put together our first Budget in 2000. At that time long-term projections showed gross debt to GDP falling to just under 25% of GDP by 2009/10.
Figure 4 – An international comparison of government debt – calendar year 2004

Sources: OECD Economic Outlook 76, Treasury Crown Financial Statements, six months ended 31 December 2004.
Note: For New Zealand, gross debt is Gross sovereign-issued debt. Net debt is defined here to include NZS Fund assets.
The lower debt objective announced in the 2004 Fiscal Strategy Report (FSR) reinforced the importance of keeping debt at low levels by locking in this progress. By also putting a timeframe to this objective we provided greater transparency about the extent of improvement we want to see in the fiscal position in the period before ageing really begins to impact.
New Zealand’s government debt is now low in historical and also in international terms. This is appropriate given future fiscal pressures together with the fact that we are a small, distant, open economy with comparatively high levels of external debt. Lower levels of government debt have reduced the need to react sharply to shocks and lowered the risk premium in interest rates. In this way, sound public finances have made a significant contribution to improved economic growth.
… while taking account of the impact of fiscal policy on the economy
Faster than expected progress has allowed us to move the emphasis of fiscal policy over the short term from building up operating surpluses to consolidating operating surpluses at levels sufficient to make ongoing but more gradual progress on our long-term objectives. This will see lower operating surpluses in the future than over the recent past.
The speed of this adjustment allows for the impact of spending and tax decisions on the wider economy. It also depends on our assessment of how much of the change in the fiscal position we think is structural and how much is due to cyclical factors. We have been cautious not to spend what may have been cyclical increases in operating surpluses. This has enabled us to make faster progress on our debt and NZS Fund objectives over the past four years. However, the persistence of these surpluses and their composition have made us more confident that structural factors have been at work.
Budget 2004 and the Working for Families initiative was the first phase of this transition to lower operating surpluses. Budget 2005 with its Business and KiwiSaver Packages completes this move, given our current assessment of the fiscal outlook.
The economy has been amongst the best performing in the OECD and this has flowed through to the fiscal position
The economy grew 4.8% in real terms over 2004 and by 8.4% in nominal terms. Employment growth has also been strong, helping unemployment rates to fall to record low levels. This is reflected in the OBERAC – the operating balance adjusted for revaluation movements and accounting policy changes (Figure 5). Furthermore, after adjusting for the economic cycle the majority of the increase in the OBERAC remains pointing to a structural improvement in the fiscal position.
Figure 5 – Historical and forecast OBERAC and cyclically adjusted balance

Source: The Treasury
A significant structural increase in the fiscal position has enabled us to deliver on our key policy priorities in Budgets 2004 and 2005…
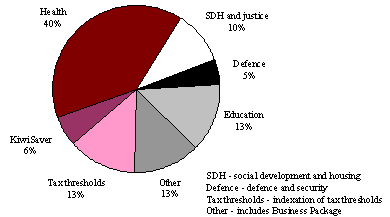
Budget 2005 covers decisions around core Crown expenses that amount to $48.2 billion for 2005/06 together with capital spending of $2.1 billion. It will deliver $2.0 billion of new funding in 2005/06 (net of initiatives to increase revenue, such as Thin Capitalisation Rules for Banks), rising to $2.7 billion in 2008/09. This includes significant new operating funding in health, education, justice, defence and social development.
This new funding is larger than was indicated in the 2005 BPS although the BPS signalled there may be scope for additional spending to advance initiatives around savings and business. In designing the KiwiSaver and Business Packages we have been mindful of the current economic position and sought to contribute to economic growth over the longer term. The KiwiSaver Package will provide mechanisms to encourage saving for retirement and home ownership. The Business Package introduces changes to the tax system to improve the efficiency of business investment, reduce compliance costs and boost business performance and economic growth. The aim of each of these packages is to provide an economic environment that encourages businesses and households to plan and invest. In addition, from 1 April 2008 personal income tax thresholds will be indexed every three years in line with the mid-point of the Reserve Bank’s inflation target band. The composition of new operating initiatives in Budget 2005 is presented in Figure 6.
Figure 6 – Spending and revenue initiatives in Budget 2005 – final year impact
Source: The Treasury
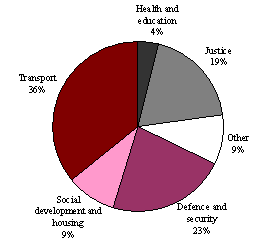
In addition to this operating spending, Budget 2005 will deliver a further $1.3 billion of capital spending in excess of what was signalled in the BPS, taking total capital spending over the forecast horizon to $4.2 billion. The composition of new capital spending over the forecast period is presented in Figure 7.
Figure 7 – The cumulative composition of allocated new capital spending for the forecast period
Source: The Treasury
Note: $2.2 billion forecast capital spending remains unallocated.
But future Budget packages will be smaller in order to remain on track to meet our fiscal objectives…
As indicated in the 2005 BPS, the increased spending on future Budget initiatives will be smaller than in the last two Budgets. These Budgets included specific one-off initiatives such as the Working for Families and Business Package. Our current plans are for an additional funding $1.9 billion over existing baselines in Budget 2006 rising by 2% (the mid-point of the CPI inflation target range) in Budgets 2007 and 2008. In addition we are intending to spend $2.2 billion on new capital initiatives over Budgets 2006 to 2008. In accordance with our stated fiscal management approach, we will review the operating and
capital amounts as we get closer to each Budget to ensure they remain consistent with maintaining progress toward our fiscal objectives and policy goals and with economic conditions.
… requiring the growth of government spending to slow from recent rates
The ability to meet our fiscal objectives will ultimately depend on the pace of growth in government spending. Structural increases in revenue combined with lower finance, social security and welfare costs provided us with the extra fiscal headroom to implement the new initiatives contained in this and previous Budgets, as well as deliver funding in key areas such as health, education, defence and transport. In our second term, the nominal average annual growth rate for health increased to 7.8%, education rose to 7.6% and defence to 4.4%.
Figure 8 – Final forecast year impact of net Budget packages

Source: The Treasury
Current forecasts do not see the increases in revenue or reductions in finance and welfare costs being replicated. As a result, maintaining recent growth rates in expenditure would compromise our ability to achieve our fiscal objectives and reduce future policy options particularly as population ageing begins to impact. Unless new initiatives are growth enhancing, they may also fuel inflationary pressures.
Although additional expenditure in future Budgets cannot be as large as that of Budgets 2004 and 2005, it will remain sizeable compared with pre-2004 Budgets (as seen in Figure 8). Consequently, the level of spending in future Budgets will enable us to continue to deliver on our key economic and social objectives. Furthermore, it will build on a solid base of spending.
This Government has implemented a large number of policy changes during its last two terms in office. It is now time to consolidate on what we have done and continue to test the effectiveness of the spending that has been implemented. It may also be the case that new programmes have made other spending less relevant.
We will be looking for opportunities to address total expenditure across all sectors to ensure that it is delivering value for money. To the extent that we can identify low-priority spending across various areas we will be in a position to free up funds and hence implement new initiatives in future Budgets.
The Government remains committed to achieving its long-term fiscal objectives
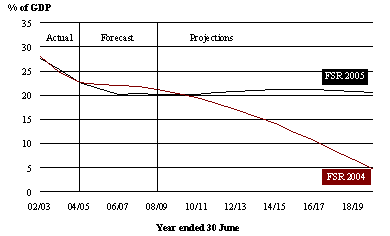
Figure 9 shows gross debt falling to 20% of GDP by 2006/07 and remaining close to but slightly above this objective thereafter. This result is a consequence of a number of factors. First, there has been an increase in new operating and capital spending from the levels indicated a year ago and in the 2005 BPS. As noted earlier, this spending enabled us to deliver on a number of key policy areas and completes the transition to lower operating surpluses. Beyond 2008/09, the projections assume operating and capital allowances of $1.9 billion and $750 million respectively (compared with $1.4 billion and $550 million in the 2004 FSR). However, although operating and capital spending allowances have increased, they now rise with assumed inflation (rather than nominal GDP). Third, the Treasury has reviewed the rate of return assumption used to calculate the NZS Fund contributions, details of which are included in the accompanying box.
Figure 9 – Gross sovereign-issued debt
Source: The Treasury
Review of the Rate of Return on Crown Financial Institutions
To ensure a consistent approach is taken in preparing projections for financial asset portfolios of Crown financial institutions (CFIs), the Treasury has reviewed the assumptions and methodology around the rate of return earned on investments for the purpose of long-term fiscal projections. The review took account of historical evidence, an assessment of the longer-term economic outlook and the current portfolio mix.
The CFI that has the biggest impact on the forecasts and projections of gross debt is the NZS Fund. The Treasury’s work results in a decline in the expected gross annual return for the NZS Fund. The work also suggests a fall in the tax rate applied to NZS Fund investment returns that provides a partial offset to the lower gross return. The net result is a decrease in the after-tax expected annual rate of return from 6.8% to 6.1%. This is currently the Treasury’s best estimate given the current state of capital markets and the research around them.
Changing the rate of return on the NZS Fund affects capital contributions in every year because under the legislation they are set using a 40-year rolling horizon. Over the forecast period the contributions are required to increase by around $760 million as a result of changing the assumed rate of return. Higher contributions, all else equal, result in lower cash flow balances and higher debt than otherwise. By 2015 it results in gross debt to GDP being approximately 2% of GDP higher.
Our ability to meet the objective is very sensitive to any changes in the short term or in the assumptions underlying the projections. A number of changes can take place in the economic environment between now and the projection period which could have a significant influence on the debt track. This includes drivers of both spending and revenue. For example, on the revenue side the projections assume that taxes grow with nominal GDP beyond 2008/09 (ie, they assume no fiscal drag). While our decision to inflation index personal income tax thresholds will remove one component of fiscal drag there will still be some drag associated with remaining increases in personal incomes as a consequence of other factors (eg, productivity movements, job turnover). As a result, the projections of tax revenue are somewhat conservative and hence the debt track would look more favourable than is assumed for projection purposes.
Nevertheless, the impacts of these changes on the projected debt track reinforce the need to control expenditure growth in order to deliver on the Budgets built into the projections.
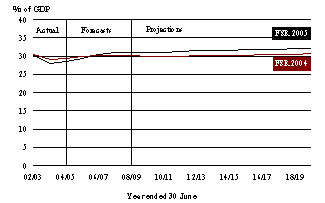
Figure 10 presents the core Crown expenditure as a percentage of GDP. Consistent with our objectives, this remains around current levels for the projection period.
Figure 10 – Core Crown expenses excluding finance costs
Source: The Treasury
Our long-term fiscal objectives remain unchanged but we intend to take stock of them in advance of the 2006 FSR
Following the lowering of the gross debt objective and introduction of a specific timeframe last year, the Government is leaving its long-term fiscal objectives unchanged (see Annex 1).
Over the next parliamentary term the Government will continue its fiscal strategy of running structural operating surpluses sufficient to meet the required contributions to the NZS Fund. In addition, we will continue to balance capital and operating expenditure to ensure we continue to maintain debt at prudent levels.
Looking forward, a number of factors suggest it may be timely to refresh the objectives in advance of the 2006 FSR. These include taking stock of our achievements at the start of a new government and clarifying the preferred movement in debt beyond 2015. This will ensure ongoing consistency with the Public Finance Act 1989 (PFA) requirement for a timeframe of at least 10 years in relation to the long-term fiscal objectives. In addition, the Government will adopt the New Zealand International Financial Reporting Standards (NZ IFRS) in 2007, which may result in greater volatility for some fiscal aggregates.
The Treasury will also be releasing the first statement of the long-term fiscal position required under the PFA. This will provide us with an updated assessment of the impact of ageing and other drivers on the fiscal position over the long term.
Prudent fiscal management, coupled with solid economic growth and a structural improvement in the fiscal position over recent years, has provided a platform from which to implement the Government’s flagship priorities. These included the Working for Families package in 2004 and the Business package and KiwiSaver in 2005. The nature of the structural improvement enabled us to fund these priorities on a scale that reflects their importance in progressing our overarching economic and social goals. Furthermore, the significant level of funding directed towards these key areas ensures their future successful implementation.
This Government has built a reputation for prudent fiscal management. It has advanced a significant policy programme in the short and medium term while at the same time being fiscally responsible over the longer term. The current Government’s fiscal strategy – running operating surpluses sufficient to meet contributions to the NZS Fund and cover other capital spending while also reducing Crown debt to prudent levels – has put future governments in a better position to manage the demographic and other costs that New Zealand will face. Looking forward we remain committed to ensuring that the opportunities we take in the short term remain consistent with a stable future for New Zealand.
Hon Dr Michael Cullen
Minister of Finance
12 May 2005
Long-Term Fiscal Objectives
Table A1.1 – Long-term fiscal objectives
Long-term fiscal objectives | | To achieve the objectives, the Government’s high-level focus is on: | |
| | | |
Operating balance Operating surplus on average over the economic cycle sufficient to meet the requirements for contributions to the NZS Fund and ensure consistency with the debt objective. Revenue Ensure sufficient revenue to meet the operating balance objective. Expenses Ensure expenses are consistent with the operating balance objective. | | • Operating surpluses (measured by the OBERAC) during the build-up phase of the NZS Fund. The focus is on core Crown revenues and expenses, with tax to GDP and core Crown expenses to GDP around current levels. • Because the OBERAC surplus includes the net (after-tax) return on the NZS Fund, which the NZS Fund will retain, the Government is effectively targeting OBERAC surpluses excluding the NZS Fund’s retained investment returns. • A robust, broad-based tax system that raises revenue in a fair and efficient way. • SOEs and Crown entities contributing to surpluses, consistent with their legislation and Government policy. | |
| | | |
Debt Manage total debt at prudent levels. Gross sovereign-issued debt as a percentage of GDP slowly reducing over the longer term and passing through 20% of GDP before 2015. | | • SOEs will have debt structures that reflect best commercial practice. Changes in the level of debt will reflect specific circumstances. • Gross sovereign-issued debt to GDP will be reducing during the period ahead of the major demographic changes associated with population ageing. • Net debt, with NZS Fund assets, is expected to fall towards minus 15% of GDP by 2015 (ie, a net financial asset position). | |
| | | |
Net worth Increase net worth consistent with the operating balance objective. | | • Increasing net worth consistent with the operating balance objective will see net worth at above 50% of GDP by 2015. • The NZS Fund is expected to be 21% of GDP by 2015. • Consistent with the net worth objective, there will also be a focus on quality investment. | |
Short-Term Fiscal Intentions
Table A2.1 – Short-term fiscal intentions
2005 Fiscal Strategy Report | | 2005 Budget Policy Statement | |
| | | |
Operating balance Based on operating amounts for the 2005 Budget, and indicative amounts for the next two Budgets, the operating surplus on an OBERAC basis and excluding net returns on the NZS Fund will be around 3% of GDP, remaining consistent with the long-term objective for the operating balance. | | Operating balance Based on operating amounts for the 2005 Budget, and indicative amounts for the next two Budgets, the operating surplus on an OBERAC basis and excluding net returns on the NZS Fund will be around 3% of GDP, remaining consistent with the long-term objective for the operating balance. | |
| | | |
Debt Gross sovereign-issued debt is forecast to be 20.2% of GDP in 2008/09. The Government will set forecast new capital spending amounts that ensure progress is made toward the long-term objective for debt. The Government’s bias is towards debt to GDP trending down over time. | | Debt Gross sovereign-issued debt is forecast to be 19.6% of GDP in 2008/09. The Government will set forecast new capital spending amounts that ensure progress is made toward the long-term objective for debt. The Government’s bias is towards debt to GDP trending down over time. | |
| | | |
Expenses Total Crown expenses are forecast to be 41.0% of GDP in 2008/09. Core Crown expenses are forecast to average 31.4% over the forecast period and be 32.1% of GDP in 2008/09. This assumes new operating expense amounts of $2.7 billion for the 2005 Budget and $1.9 billion for the 2006, 2007 and 2008 Budgets (GST exclusive). | | Expenses Total Crown expenses are forecast to be 41.0% of GDP in 2008/09. Core Crown expenses are forecast to average 31.5% over the forecast period and be 32.3% of GDP in 2008/09. This assumes new operating expense amounts of $2.1 billion; $1.9 billion; $2.0 billion; and $2.0 billion for the 2005, 2006, 2007 and 2008 Budgets respectively (GST exclusive). | |
| | | |
Revenues Total Crown revenues are forecast to be 43.9% of GDP in 2008/09. Within this, core Crown revenues are forecast to be 34.1% of GDP in 2008/09. The Government will set revenue plans that ensure progress is made towards the long-term revenue objective. | | Revenues Total Crown revenues are forecast to be 44.0% of GDP in 2008/09. Within this, core Crown revenues are forecast to be 34.3% of GDP in 2008/09. The Government will set revenue plans that ensure progress is made towards the long-term revenue objective. | |
| | | |
Net worth Net worth is forecast to be 35.4% of GDP in 2008/09, including NZS Fund assets of 10.9% of GDP. | | Net worth Net worth is forecast to be 35.4% of GDP in 2008/09, including NZS Fund assets of 10.6% of GDP. | |
The differences between short-term intentions set out in the 2005 BPS and those in the 2005 FSR are discussed in the text. The Budget Economic and Fiscal Update fiscal forecasts are consistent with our short-term fiscal intentions. For example, as seen in Table A2.2 gross sovereign-issued debt trends down over time from 22.6% of GDP in 2005 to 20.2% in 2009. The operating surplus, on an OBERAC basis, for 2006 to 2009 averages 2.8% of GDP and hence is consistent with our intentions set out in the 2005 BPS.
Table A2.2 – Budget Update fiscal forecasts (% of GDP)
Year end June | | 2002 | | 2003 | | 2004 | | 2005 | | 2006 | | 2007 | | 2008 | | 2009 | |
| | | | Actual | | | | | | | | Forecast | | | | | |
Financial Performance | | | | | | | | | | | | | | | | | |
Total Crown revenue | | 39.9 | | 43.6 | | 43.0 | | 43.3 | | 44.1 | | 44.1 | | 43.6 | | 43.9 | |
Core Crown revenue | | 31.8 | | 33.4 | | 33.4 | | 33.9 | | 34.2 | | 34.0 | | 33.7 | | 34.1 | |
Total Crown expenses | | 38.0 | | 42.3 | | 37.8 | | 39.5 | | 39.9 | | 40.9 | | 41.4 | | 41.0 | |
Core Crown expenses | | 30.3 | | 31.9 | | 29.6 | | 30.1 | | 30.9 | | 31.8 | | 32.3 | | 32.1 | |
OBERAC | | 2.2 | | 4.3 | | 4.7 | | 4.9 | | 4.3 | | 3.3 | | 2.3 | | 3.0 | |
Core Crown operating expenses + contributions to NZS Fund | | 30.8 | | 32.9 | | 30.9 | | 31.5 | | 32.4 | | 33.2 | | 33.8 | | 33.6 | |
OBERAC ex Fund returns | | 2.2 | | 4.2 | | 4.6 | | 4.7 | | 4.0 | | 2.9 | | 1.8 | | 2.4 | |
Financial Position | | | | | | | | | | | | | | | | | |
Net worth | | 15.0 | | 18.2 | | 25.2 | | 27.8 | | 31.2 | | 33.4 | | 34.1 | | 35.4 | |
Total Crown gross debt | | 29.3 | | 29.7 | | 26.2 | | 23.7 | | 23.2 | | 21.9 | | 21.8 | | 21.2 | |
Gross sovereign-issued debt | | 28.9 | | 27.6 | | 25.3 | | 22.6 | | 21.3 | | 20.2 | | 20.4 | | 20.2 | |
Core Crown net debt | | 15.4 | | 13.4 | | 10.8 | | 7.7 | | 6.6 | | 6.6 | | 7.4 | | 7.5 | |
Net debt with NZS Fund assets | | 14.9 | | 12.0 | | 8.0 | | 3.4 | | 0.6 | | (1.0 | ) | (1.8 | ) | (3.4 | ) |
Cash | | | | | | | | | | | | | | | | | |
Net cash flows from core Crown operations | | 3.0 | | 3.7 | | 3.9 | | 5.5 | | 4.1 | | 2.7 | | 1.6 | | 2.1 | |
Available to pay debt/(required to be financed) | | (0.3 | ) | 0.9 | | 0.4 | | 1.6 | | — | | (1.0 | ) | (1.6 | ) | (0.8 | ) |
NZS Fund | | | | | | | | | | | | | | | | | |
Contributions | | 0.5 | | 0.9 | | 1.3 | | 1.4 | | 1.5 | | 1.5 | | 1.5 | | 1.5 | |
NZS Fund returns (after tax) | | — | | 0.1 | | 0.1 | | 0.3 | | 0.3 | | 0.4 | | 0.5 | | 0.6 | |
Accumulated assets | | 0.5 | | 1.4 | | 2.8 | | 4.3 | | 5.9 | | 7.6 | | 9.2 | | 10.9 | |
Fiscal Projections
Projections for revenue, expenses, the operating balance, net worth and debt are shown below.
Figure A3.1 – Revenue
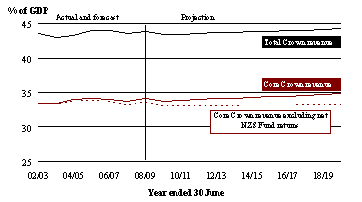
Figure A3.2 – Expenses
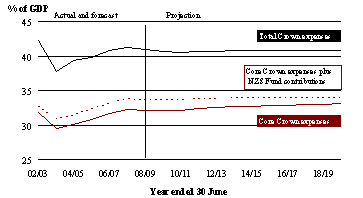
Figure A3.3 – Operating balance
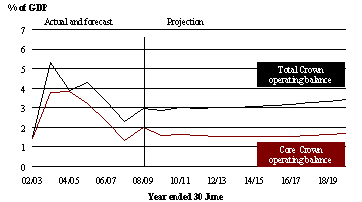
Figure A3.4 – Net worth
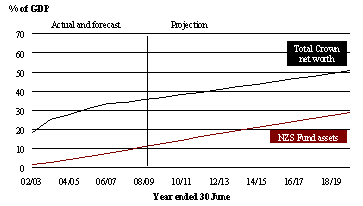
Figure A3.5 – Total Crown gross debt

Source: The Treasury
Economic, demographic and fiscal assumptions
From 2005/06 to 2008/09, the fiscal projections incorporate the economic and fiscal forecasts detailed in the Budget Update. Beyond 2008/09, the fiscal projections are based on long-run technical and policy assumptions and are not forecasts. The following assumptions apply beyond 2008/09:
• Nominal GDP grows with assumed labour productivity growth (average annual rate of 1.5%), projected changes in the labour force and inflation (average annual rate of 2%).
• Demographic and labour force trends are based on Statistics New Zealand (SNZ) population projections with medium fertility, medium mortality and long-term net migration of 10,000 a year. These projections are based on SNZ 2004 (base) National Population Projections, updated with the Treasury’s short-term migration and population estimates to ensure consistency with the Budget Update forecasts.
As a result, the projections beyond 2008/09 are the result of assumptions about the long-run economic drivers of growth. For example, a stronger labour productivity growth assumption will, keeping other factors constant, lead to a higher projection of real GDP growth.
Table A3.1 – Summary of economic assumptions*
June Year(2) | | 2006 | | 2007 | | 2008 | | 2009 | | 2010 | | 2011 | | 2012 | | 2013 | | 2014 | | 2020 | |
| | Forecasts | | Projections | |
Labour force growth | | 1.3 | | 1.2 | | 1.2 | | 1.3 | | 1.2 | | 1.0 | | 0.7 | | 0.7 | | 0.6 | | 0.4 | |
Unemployment rate | | 3.7 | | 4.1 | | 4.3 | | 4.5 | | 4.5 | | 4.5 | | 4.5 | | 4.5 | | 4.5 | | 4.5 | |
Employment growth | | 1.1 | | 0.7 | | 1.0 | | 1.2 | | 1.2 | | 1.0 | | 0.7 | | 0.7 | | 0.6 | | 0.4 | |
Labour productivity growth** | | 1.4 | | 2.1 | | 2.3 | | 1.8 | | 1.5 | | 1.5 | | 1.5 | | 1.5 | | 1.5 | | 1.5 | |
Real GDP | | 2.2 | | 2.8 | | 3.4 | | 3.0 | | 2.7 | | 2.5 | | 2.3 | | 2.2 | | 2.1 | | 2.0 | |
Consumer price index (annual % change) | | 2.6 | | 2.7 | | 2.3 | | 2.0 | | 2.0 | | 2.0 | | 2.0 | | 2.0 | | 2.0 | | 2.0 | |
Government 10-year bonds (quarterly avg %) | | 6.4 | | 6.3 | | 6.0 | | 6.0 | | 6.0 | | 6.0 | | 6.0 | | 6.0 | | 6.0 | | 6.0 | |
Nominal average hourly wage growth | | 4.6 | | 3.8 | | 3.5 | | 3.5 | | 3.5 | | 3.5 | | 3.5 | | 3.5 | | 3.5 | | 3.5 | |
* | Annual average % change unless otherwise stated. |
** | Full-time equivalent employed measure |
Sources: The Treasury, Statistics New Zealand
(2) | Note that the economic forecasts in the Budget Update are based on a March year. |
Table A3.2 – Summary of fiscal assumptions beyond 2008/09
Tax revenue | | GDP linked, with assumptions of constant tax rate boundaries. |
NZS | | Demographically adjusted and linked to nominal wages after reaching 65% wage floor. |
Other benefits | | Demographically adjusted and linked to inflation. |
Health and education | | Demographically adjusted. |
Finance costs | | A function of debt levels and interest rates. |
Other | | Not demographically adjusted. |
Operating allowance | | $1.8 billion (GST exclusive) in 2009/10, increasing at the rate of 2% per annum. |
Capital allowance | | $750 million in 2009/10, increasing at the rate of 2% per annum. |
NZS Fund | | Contributions to the Fund are assumed to be consistent with the New Zealand Superannuation Fund Act 2001(3). |
Source: The Treasury
For the FSR projections, expenses are modelled using a “top-down” approach (with the exception of NZS, which is always modelled so as to capture demographics and wage adjustments). The demographic adjustments in health and education mean that nominal spending will be affected by population changes (both total and composition). In the case of “other benefits”, there is both demographic and inflation adjustment (to reflect benefit indexation to the CPI). Other expenses (eg, core government) are not demographically or inflation adjusted. On an ex post basis, the ”operating allowance” will be allocated across expense areas to reflect choices about non-demographic factors such as wages and new initiatives. This modelling approach provides a sense of the top-down aggregate expenditure control inherent in a particular fiscal strategy.
An alternative approach is to model expenses on a “bottom-up” basis. In this case there is no operating allowance. Rather, expense areas are modelled so as to capture demographics, inflation and a real growth factor (typically in per capita or per recipient terms). The growth factor can be varied to reflect different views about cost and policy drivers. This modelling approach provides a sense of spending trends, aggregate and by sector, under alternative assumptions. It is often used in long-term fiscal sustainability analysis. Examples of the bottom-up approach can be found in the 2005 BPS (Figure 4, page 7) and Treasury Working Papers(4).
Further details of the modelling approach can be found in Treasury Working Paper 00/02 “Manual for the Long-term Fiscal Model”, available at www.treasury.govt.nz.
(3) | A more detailed review of the assumptions involved in projecting the NZS Fund contributions and earnings can be found on page 59 of the Budget Update. Further details can be found in “Financing New Zealand Superannuation”, a Treasury Working Paper by McCulloch and Frances, available at www.treasury.govt.nz. |
| |
(4) | See “Long Term Fiscal Projections and their Relationship with the Intertemporal Budget Constraint: An Application to New Zealand”, Treasury Working Paper 02/04 and “Population Ageing and Government Health Expenditures in New Zealand, 1951-2051”, Treasury Working Paper 04/14. |
In addition to the effect of revised short-term fiscal forecasts, the fiscal projections differ from the 2004 FSR for four main reasons:
• The operating allowance has been increased from $1.4 billion to $1.8 billion (excluding demographics). This new assumption approximates the $2.0 billion new forecast spending amount in the first year of the projections. (The operating allowance is lower because it does not cover demographic expense increases. These are incorporated in the relevant expense areas.) The capital allowance has also been increased from $550 million to $750 million.
• The 2004 FSR had the operating and capital allowances growing with the rate of GDP in the projected years. The operating and capital allowances are now assumed to grow with the rate of inflation to smooth the transition period between forecast and projection years.
• There has been a change in the rate of return assumption used to calculate the NZS Fund contribution rate. This is detailed in the “Long-Term Fiscal Outlook” section.
• Statistics New Zealand has changed its long-term medium net migration assumption from 5,000 to 10,000 (the average net migration over the past 15 years) per year, to reflect changes in immigration policy during the past 20 years. This has been incorporated into the fiscal projections.


