Statement of Responsibility
On the basis of the economic and fiscal information available to it, the Treasury has used its best professional judgement in supplying the Minister of Finance with this Economic and Fiscal Update. The Update incorporates the fiscal and economic implications both of Government decisions and circumstances as at 9 May 2005 that were communicated to me, and of other economic and fiscal information available to the Treasury in accordance with the provisions of the Public Finance Act 1989.
John Whitehead
Secretary to the Treasury
12 May 2005
This Economic and Fiscal Update has been prepared in accordance with the Public Finance Act 1989. I accept overall responsibility for the integrity of the disclosures contained in this Update, and the consistency and completeness of the Update information in accordance with the requirements of the Public Finance Act 1989.
To enable the Treasury to prepare this Update, I have ensured that the Secretary to the Treasury has been advised of all Government decisions and other circumstances as at 9 May 2005 of which I was aware and that had material economic or fiscal implications.
Hon Dr Michael Cullen
Minister of Finance
12 May 2005
1
Economic Outlook
• The New Zealand economy has averaged 4.0% annual growth in the past six years, well above the OECD average of 2.6%. The drivers of this growth have included both cyclical and structural factors.
Figure 1.1 – Growth in real GDP

Source: Statistics New Zealand, OECD
• Growth in 2004 was sustained by continuing income growth and rising household wealth stemming from the strong labour and housing markets and high international commodity prices. Consumption expenditure remained strong but residential investment fell in the second half of 2004.
• Growth slowed in the second half of 2004 partly as a result of temporary factors and we expect some rebound in the first quarter of 2005. However, the economy appears to be at a turning point and we are forecasting slower growth for the next two years, with a recovery in the year to March 2008.
• High exchange and interest rates, declining net migration inflows, slower trading partner growth and a forecast decline in the terms of trade are the main drivers of lower growth. Further out, a projected fall in exchange and interest rates and a return to trend growth in the global economy are expected to lead to stronger growth.
• Employment growth is forecast to slow from its recent record rate and the unemployment rate to rise slightly. Wage growth is expected to pick up as a result of pressures in the labour market and as the mix of employment rebalances.
• We expect lower net migration inflows to have a negative effect on growth in consumption and residential investment. Higher interest rates and cyclical factors are expected to compound the slowdown in residential investment.
• Business investment growth is expected to remain robust in the near term but to decline as demand and profitability decline, labour shortages ease and the price of capital goods increases with the projected fall in the exchange rate.
• Government consumption and investment are expected to make a positive contribution to growth in the economy throughout the forecast period. Increased transfers are also expected to sustain private consumption.
• The global economy is strengthening again after a period of weaker growth, but growth is assumed to be lower (on an annual average basis) in calendar year 2005 than in 2004. Areas of concern in the global economy are the growth differential between the United States and other advanced economies and the resulting financial imbalances.
• We expect export volume growth to decline in the March 2006 year as a result of the delayed impact of the high exchange rate and slower world growth. A recovery is forecast for the following two years as the projected lower exchange rate has a positive impact.
• Import volume growth is expected to decline as the domestic economy cools and the exchange rate falls. Growth in imports is expected to strengthen again later in the forecast period as the domestic economy recovers.
• We expect annual CPI inflation to remain just below the top of the Reserve Bank’s target band for the next year as tradables inflation increases but non-tradables inflation pressures ease. Short-term interest rates are forecast to remain at current levels until the end of 2005 and then to revert to their assumed neutral level of 5.8% by March 2009 in line with forecast inflation.
• Growth in nominal GDP is forecast to decline from 8.4% in calendar year 2004 to 4.3% in the year to March 2006. In the near term, the higher growth in nominal GDP is expected to be reflected in higher corporate profits, but this component is likely to decline as the economy slows.
Figure 1.2 – Growth in real and nominal GDP
Sources: Statistics New Zealand, The Treasury
• The deficit on the current account is expected to increase further, peaking at around 7.0% of GDP in late 2006 – early 2007, driven by an increase in the deficit on goods as a result of high import growth, while export growth slows as a result of the high exchange rate and slower global growth. The deficit is expected to decline slightly over the remainder of the forecast period, but to remain at 6.1% of GDP in March 2009.
• There are both upside and downside risks to this central scenario, including a more cyclical path for real and nominal GDP growth. Some of the risks on the downside, while of low probability, could have a greater impact on the economy than the upside risks, if they were to eventuate. (See chapter 3 page 87 for a discussion of some of the risks associated with the forecasts and the elaboration of two other scenarios.)
Table 1.1 – Economic outlook: central forecast(1)
(Annual average % change,
March years) | | 2004
Actual | | 2005
Estimate | | 2006
Forecast | | 2007
Forecast | | 2008
Forecast | | 2009
Forecast | |
| | | | | | | | | | | | | |
Private consumption | | 5.6 | | 5.3 | | 2.8 | | 2.2 | | 3.0 | | 2.7 | |
Public consumption(2) | | 3.1 | | 7.1 | | 6.3 | | 4.4 | | 3.8 | | 3.3 | |
Total Consumption | | 5.1 | | 5.7 | | 3.6 | | 2.7 | | 3.2 | | 2.8 | |
Residential investment | | 15.9 | | 0.7 | | -8.6 | | -4.1 | | 0.8 | | 1.2 | |
Central Government Investment | | 0.5 | | 4.1 | | 6.6 | | 4.3 | | 7.0 | | 1.5 | |
Other Investment | | 14.3 | | 12.9 | | 4.3 | | 0.3 | | 2.1 | | 3.4 | |
Total Investment | | 13.7 | | 8.8 | | 1.4 | | -0.4 | | 2.1 | | 2.8 | |
Stock change(3) | | 0.2 | | 0.5 | | -0.5 | | 0.0 | | 0.0 | | 0.0 | |
Gross National Expenditure | | 7.0 | | 7.1 | | 2.4 | | 1.9 | | 2.9 | | 2.8 | |
Exports | | 1.0 | | 4.5 | | 3.3 | | 4.1 | | 4.0 | | 3.3 | |
Imports | | 11.9 | | 12.8 | | 4.1 | | 2.4 | | 2.5 | | 2.6 | |
GDP (Production Measure) | | 3.6 | | 4.2 | | 2.3 | | 2.5 | | 3.5 | | 3.0 | |
- annual % change | | 5.0 | | 2.8 | | 2.0 | | 3.0 | | 3.3 | | 2.9 | |
| | | | | | | | | | | | | |
Real GDP per capita | | 1.9 | | 3.0 | | 1.3 | | 1.6 | | 2.6 | | 2.1 | |
Nominal GDP (expenditure basis) | | 6.3 | | 8.2 | | 4.3 | | 3.0 | | 4.8 | | 5.0 | |
GDP deflator | | 2.8 | | 4.1 | | 2.0 | | 0.5 | | 1.3 | | 1.9 | |
| | | | | | | | | | | | | |
Employment(4) | | 2.9 | | 3.6 | | 1.5 | | 0.6 | | 1.1 | | 1.2 | |
Unemployment(5) | | 4.3 | | 3.4 | | 3.8 | | 4.2 | | 4.3 | | 4.5 | |
| | | | | | | | | | | | | |
Wages(6) | | 3.4 | | 3.3 | | 4.2 | | 4.0 | | 3.5 | | 3.5 | |
CPI inflation | | 1.5 | | 2.8 | | 2.8 | | 2.7 | | 2.4 | | 2.0 | |
Export prices(7) | | -8.2 | | 3.6 | | 0.3 | | 3.7 | | 1.3 | | 1.1 | |
Import prices(7) | | -11.6 | | -1.9 | | 2.0 | | 7.1 | | 3.0 | | 1.0 | |
| | | | | | | | | | | | | |
Current account balance | | | | | | | | | | | | | |
- $ million | | -6,326 | | -9,881 | | -10,316 | | -10,952 | | -11,011 | | -10,731 | |
- % of GDP | | -4.6 | | -6.6 | | -6.7 | | -6.9 | | -6.6 | | -6.1 | |
| | | | | | | | | | | | | |
TWI(8) | | 66.9 | | 69.6 | | 66.2 | | 62.1 | | 59.9 | | 58.8 | |
90-day bank bill rate(8) | | 5.5 | | 6.9 | | 6.8 | | 6.3 | | 5.8 | | 5.8 | |
10-year bond rate(8) | | 5.8 | | 6.0 | | 6.4 | | 6.4 | | 6.0 | | 6.0 | |
Sources: Statistics New Zealand, Reserve Bank of New Zealand, The Treasury
NOTES: | (1) | Forecasts finalised on 18 April 2005. Text finalised on 12 May 2005. |
| (2) | The forecast profile for public consumption is influenced by government defence spending. |
| (3) | Contribution to GDP growth. |
| (4) | Household Labour Force Survey, full-time equivalent employment. |
| (5) | Household Labour Force Survey, percentage of the labour force, March quarter, seasonally adjusted. |
| (6) | Quarterly Employment Survey, average hourly ordinary time earnings. |
| (7) | Overseas Trade Index basis, annual average percentage change, March quarter. |
| (8) | Average for the March quarter. |
Assumptions Underlying the Central Forecast
Global economic activity – global economic growth, inflation and interest rate forecasts are assumed to conform to those presented in the March 2005 Consensus Forecasts and Asia Pacific Consensus Forecasts. Economic growth for New Zealand’s top 14 trading partners is forecast at 3.2% for calendar 2005, a fall from the estimate of 4.1% for 2004. Growth then returns to trend of around 3.5% from 2006 onwards. The forecast for 2005 has been revised down since the December Economic and Fiscal Update 2004 (December Update) as a result of a weaker outlook for Australia and Japan.
• In Australia recent quarterly growth has been slow and the central bank has raised interest rates to forestall inflation pressures. This has been translated into forecasts of a lower annual growth rate over the next year.
• In Japan downward revisions to historical data have led to an adjustment of forecasts. Private consumption has again become the main source of weakness, following evidence of a long-awaited recovery over the three quarters to mid-2004.
See The Global Economic Outlook box on page 53 for further discussion.
Oil prices – Brent crude oil prices have increased since the December Update and are assumed to rise from their estimated level of US$47.80 per barrel in the March quarter 2005 to US$56 per barrel in the third quarter of 2005 before declining gradually over the remainder of the forecast period to US$47 per barrel in the March quarter 2009. This outlook is based on futures pricing at the time the forecasts were finalised.
Net migration – net migrant inflows have continued to decline and are assumed to fall to 5,000 in calendar year 2005, before increasing again to their assumed long-term average of 10,000 per annum in calendar year 2006.
Monetary conditions – the New Zealand dollar exchange rate as measured by the Trade Weighted Index (TWI) is assumed to remain at around 70 until the third quarter of 2005, before declining steadily to its estimated equilibrium level of around 59. A neutral short-term interest rate of 5.8% is assumed.
Climate – agricultural growing conditions and the level of hydro electricity storage lakes are assumed to be normal over the forecast period.
The economy has enjoyed a period of sustained expansion…
The New Zealand economy has grown strongly in the past six years after emerging from the 1997/98 recession. Annual GDP growth averaged 4.0% in the period from 1999 to 2004, well above the average for OECD member countries of 2.6%. The drivers of this strong performance have been well canvassed in the past (see December Update, pages 17-20) and include a range of cyclical and structural factors.
… but growth eased in the second half of 2004…
The rate of growth in the economy slowed sharply in the second half of 2004 to 2.2% (annual rate) from 5.2% in the first half. The first half-year’s growth was broad-based, with robust domestic and external demand. Strong consumption and investment led to rapid growth in imports, detracting from the positive contribution of exports. In the second half of the year all of the components of final domestic demand made a smaller contribution to growth, with a decline in residential investment. Exports fell in the third quarter and were negative for the second half as a whole. An increase in inventory levels and a smaller negative contribution from imports provided only a partial offset.
Figure 1.3 – Contributions to GDP growth 2004 (six-month annualised)

Sources: Statistics New Zealand, The Treasury
… and will slow further
The slower growth in real GDP in the final quarter of 2004 was partly due to temporary factors, such as poor weather affecting consumer spending. Although we expect a rebound in this component in the first quarter of 2005, the economy appears to be at a turning point, with many of the drivers of slower growth already apparent. We are forecasting growth to be weaker for the next two years before a recovery begins in the year to March 2008.
Recent growth sustained by robust employment growth…
Final domestic demand sustained growth in the economy in 2004 despite making a smaller contribution to overall growth in the second half of the year. The main factors supporting the domestic economy in 2004 were continuing household and corporate
income growth and rising household wealth stemming from the strength of the labour and housing markets and international commodity prices.
Robust growth in employment in 2004 and continuing wage growth combined to boost household incomes and sustain private consumption growth. Total gross earnings increased by 7.0% in 2004, while real private consumption expenditure increased by 6.1%. (See the Labour Market Performance box on page 46.)
… a buoyant housing market…
Rapid population growth (arising from high net migration inflows since late 2001) and relatively low interest rates (especially in 2003) led to a buoyant housing market and accompanying strong growth in residential investment in the past three years. Although the housing market peaked in late 2003 in terms of the number of sales, it has remained strong, with prices continuing to show gains (but at a slower rate) and the number of sales remaining high. Growth in residential investment was just under 20% in both 2002 and 2003, but it declined in the final two quarters of 2004. Residential building consents fell 17.5% in the year to November 2004 (on a trend basis), but the rate of decline eased to 6.2% in the year to March 2005.
Figure 1.4 – Housing market indicators
Sources: Statistics New Zealand, REINZ
Increasing house prices have seen household wealth continue to rise over the past few years, fuelling some of the growth in consumer expenditure. Household debt as a percentage of current income has increased rapidly in the past three years and the savings rate has become more negative (ie, in aggregate households are spending more than they are earning). However, rising asset prices have more than offset this increase, leading to significant increases in household net wealth over the same period. The increase in residential investment also led to an increase in consumption, particularly of durables to complement the new investment in housing.
… and external factors
Favourable terms of trade and strong trading partner growth also contributed to growth in the second half of 2004, especially growth in nominal GDP. Prices for New Zealand’s main export commodities remained at high levels in this period, as a result of strong demand and – in the case of dairy, beef and lamb – supply factors. High prices for these products, which together account for nearly 50% of commodity exports, sustained the terms of trade. The strong growth in some of our trading partner economies, particularly
China, has also lifted prices for a number of raw materials, including oil, over the past year.
Figure 1.5 – Commodity prices

Source: ANZ Banking Group
Strong growth has resulted in spare capacity being used up…
Capacity utilisation in the manufacturing and construction industries reached a 43-year high of 92.6% in the December 2004 quarter according to the Quarterly Survey of Business Opinion (QSBO) and remained just below this level in the March 2005 quarter. More than half of the respondents to the QSBO in recent quarters identified supply factors as the main constraint on the expansion of their output. In the March 2005 survey, more than a quarter stated that labour was the main constraint on expansion of their business.
… emerging inflation pressures…
High capacity utilisation, strong employment growth and low unemployment have led to increased inflation pressures. In the March 2005 QSBO, a net 40% of firms reported facing higher costs in the quarter, up from a net 35% in the previous quarter. A net 23% of firms raised their prices in the March quarter and 31% intended to do so in the following quarter. These figures point to increasing inflation pressure and declining profit margins as firms are squeezed by increased input costs, and competitive markets, the strong exchange rate and lower manufacturing costs in Asia restrict their ability to raise prices to final consumers.
… higher non-tradables inflation…
The rate of inflation, measured by the Consumers’ Price Index (CPI), has remained within the Reserve Bank’s target band of 1% to 3% in the recent period, despite increasing inflation pressures. The annual increase in the CPI in the year to March 2005 was 2.8%, up from 1.5% the year before. There has been a wide disparity between tradables and non-tradables inflation, with the high exchange rate holding down tradables inflation but the strong domestic economy leading to higher non-tradables inflation.
Figure 1.6 – Consumer price inflation
Source: Statistics New Zealand
… and an increase in the current account deficit
The continuing strong growth in the economy has also resulted in an increase in the current account deficit from 4.2% of GDP in 2003 to 6.4% in 2004. This is mainly due to the increased deficit on investment income resulting from the high profits of foreign-owned companies in New Zealand, and a decline in the balance on goods and services as imports increased with the rapid growth in domestic demand and the high exchange rate. (See Current Account Adjustment box on page 57.)
Labour Market Performance
Recent developments
The labour market has performed well in the recent period, reflecting strong growth in the economy as a whole. The number of people employed has grown by an average of 2.8% per annum in the past six years and by 4.4% in 2004, lifting the labour force participation rate to 67.7% of the working age population and lowering the unemployment rate to 3.6%. Both these results were a record for the Household Labour Force Survey (which began in 1986) and the unemployment rate was the lowest amongst the OECD member countries that calculate a comparable rate.(5)
Figure 1.7 – Participation and unemployment rates
Sources: Statistics New Zealand, The Treasury
The rapid expansion in employment and fall in unemployment have increased the difficulty of finding both skilled and unskilled staff to record levels, according to the QSBO. In the March 2005 quarter, a net 60% of firms reported increased difficulty finding skilled staff and a net 49% reported increased difficulty finding unskilled staff, the second highest and highest levels (respectively) in the 30-year series.
Figure 1.8 – Wage growth
Sources: Statistics New Zealand, The Treasury
(5) | Employment increased slightly in the March 2005 quarter but the participation rate dipped to 67.6% and the unemployment rate increased to 3.9%. |
Wage growth has also increased as spare labour resources have reduced. The broadest measure of wage growth, the unadjusted Labour Cost Index (LCI), which captures merit increases but holds the composition of employment constant, rose by 4.6% in the year to March 2005, its highest year-on-year increase since the start of the series in 1996. The adjusted LCI, which excludes merit increases while holding the composition of employment constant, increased by 2.4% in the same period, and average hourly earnings, measured by the Quarterly Employment Survey (QES) which includes changes in the composition of employment, increased by 3.4% in the year to March 2005 from the previous March year.
Total gross earnings have increased by an average of 6.1% per annum in the past six years, driven equally by growth in employment and growth in average hourly earnings, and indicating that the benefit of the strong labour market has been evenly split between more people working and higher earnings for those in employment. Compensation of employees increased at a similar rate to total gross earnings (5.0% per annum over the six years to March 2004) and labour’s share of national income over this period has been relatively steady at an average of 42.5% of GDP.
Outlook
We expect employment growth to ease in the forecast period as the economy slows, but because labour supply growth will also be low (as a result of the assumed easing in net migration inflows), the unemployment rate is expected to remain below 4.0% until the third quarter of 2006, before rising to around 4.5% by the end of the forecast period. Wage growth, as measured by the QES, is projected to increase because of the increased difficulty finding labour and as it recovers from its recent dip (which reflects changes in the composition of employment as more low-paid jobs were added). Further out, firms’ ability to pay higher wages will be limited by declining profitability as economic growth slows. Growth in non-farm net operating surplus (a measure of business profits) is forecast to decline from an estimated 12.6% in the year to March 2005 to average less than 3.0% per annum in the next four years.
We expect the strong business investment of the past two years to lead to further growth in labour productivity as the benefits of new plant and equipment are realised and the effects of the recent rapid expansion in employment pass. (There is some evidence that the addition of more low-skill and low-paid jobs recently has lowered productivity growth.) Slower employment growth also implies that growth in labour input makes a smaller contribution to real GDP growth than in recent years.
Figure 1.9 – Labour productivity and real wage growth
Sources: Statistics New Zealand, The Treasury
Over the forecast period, we expect labour productivity to increase to around 2% per annum in the year to March 2007 as recent entrants to the labour force become more productive and as continuing business investment leads to an increase in the capital-to-labour ratio. By the end of the forecast period, labour productivity growth is expected to be around our assessment of trend productivity growth of 1.5%. Real wage growth (measured by the unadjusted Labour Cost Index deflated by the Consumers’ Price Index) has been positive over the past six years and has broadly reflected productivity growth.
We expect growth to ease further…
The easing in growth in the second half of 2004 was mainly due to a reversal of some of the factors which sustained growth over the previous six years. In our central forecast, we expect the rate of year-on-year growth in the New Zealand economy to slow in the next two years as the effects of these cyclical factors – most of which are already in place – flow through. The chief amongst them are high exchange and interest rates, the continuing slowdown in net migration inflows, slower trading partner growth in 2005 and a forecast decline in the terms of trade. We estimate that growth in real GDP peaked at 4.8% in calendar year 2004 and will slow to 2.3% in the March 2006 year and 2.5% in the March 2007 year, but will then pick up to 3.5% in the following year and 3.0% in the year to March 2009.
Figure 1.10 – Growth in real GDP
Sources: Statistics New Zealand, The Treasury
… with some renewed strength possible in the first half of 2005…
We estimate that growth was stronger in the first quarter of 2005 as the economy recovered from the temporary factors which slowed growth in the final quarter of 2004. Some recovery in private consumption is expected to have occurred in the first quarter of 2005 as part of a pick-up from weak retail sales in the final quarter of 2004 (sales volumes were affected by poor weather pre-Christmas), although the timing of Easter may have affected the seasonal pattern of sales in the first quarter of 2005.
Meat production and exports recovered in the March 2005 quarter after farmers held stock over for slaughter at the end of 2004; dairy exports also increased in the March 2005 quarter. We estimate that a recovery in business investment occurred in early 2005 as investment intentions remained high; non-residential construction is estimated to have grown strongly with increased business investment and infrastructure projects, while residential investment continued to fall.
... but signs of the slowdown are becoming more apparent
Signs of the slower growth have become more apparent recently with falls in consumer and business confidence in the latest monthly surveys. Although these are only single observations, they point to weaker growth in private consumption and business investment in the period ahead. As always, there is a wide distribution of possible outcomes around our central forecast, with different probabilities associated with different risks. (See chapter 3 page 87 for a full discussion of the risks associated with our forecasts and the development of two other scenarios.)
Private consumption growth expected to ease…
We expect slower employment growth, falling net migration and the effects of higher interest rates to lead to a fall in private consumption growth from an estimated 5.3% in the year to March 2005 to 2.8% in the year to March 2006 and 2.2% in the following year. Increasing labour and export incomes and a projected fall in interest rates will lead to a recovery in private consumption growth to just under 3.0% by the end of the forecast period.
… as the labour market slows…
We forecast employment growth to slow in the next two years as the economy slows, but there will be some offset to total labour income from increased wage growth. Growth in full-time equivalent employment is forecast to fall to a low of 0.5% in the year to June 2006, but to recover to 1.2% by the end of 2007. Some recovery from the recent weakness in the QES wage growth measure is likely in the near term as the mix of employment rebalances and employers pay higher wages because of the increased difficulty of finding labour. Wage growth is forecast to peak in late 2006 at 4.7% on an annual average basis and then to ease back to around 3.5%.
Annual growth in compensation of employees is forecast to peak at 7.8% in mid-2005 and to fall below 4.0% in 2006, leading to slower private consumption growth. In the short term, the risks are skewed to employment growth holding up for longer and the participation rate increasing further than forecast, lending more support to consumption.
… and net migration declines
Net migration gains have been declining from a peak in mid-2003. This is the result of an increasing number of New Zealanders travelling overseas for a year or more, declining numbers of young people coming to New Zealand to study, and increased outflows of young people who have completed courses in New Zealand. Departures of New Zealanders have increased as safety concerns have subsided and employment conditions have become more attractive in the main destination countries (Australia and the United Kingdom). These trends are expected to continue, with net migration inflows falling from 10,000 in the year to March 2005 to 5,000 in calendar year 2005. Net inflows are expected to recover again to 10,000 by the end of 2006.
The housing market is also expected to cool
A weaker labour market and continued slowing in net migration inflows are expected to lead to a fall in residential investment in the next two years. The impact of higher
mortgage interest rates (albeit delayed because of the high proportion of home loans which are at fixed rates) will also contribute to the fall. In addition, residential rents have not kept pace with construction costs and house prices, reducing the returns from investment in housing; and rapid growth in the number of apartments, combined with a downturn in the numbers of foreign students, has increased the risk of an over-supply in that part of the market.
Figure 1.11 – Net migration and house sales
Sources: Statistics New Zealand, REINZ
Residential investment growth is estimated to have fallen to zero in the March 2005 year and is forecast to be negative in the 2006 and 2007 March years before stabilising. The fall in residential investment will also contribute to slower consumption growth, especially for consumer durables which are associated with residential investment.
Residential investment in the second half of 2004 was weaker than we expected in the December Update and there may be a catch-up in the first half of 2005. The continued buoyancy in house sales (a leading indicator of residential investment) may also portend a short-term resurgence in residential investment, although the increase in house sales may merely reflect the mortgage rate war in late 2004. The anecdotes of a backlog of work which has built up in the housing construction industry (chiefly because of the shortage of skilled trades people) provides a further risk of higher than forecast residential investment for a period. For these reasons, residential investment in the first half of 2005 may be higher than envisaged in the central scenario, although if this is the case there would be lower activity later.
Business investment is expected to hold up in the near term
Business investment strengthened considerably from annual average growth between 1999 and 2003 of 7.7% to 17.9% in 2004 as a result of a combination of continuing robust demand, rising firm profitability, increased difficulty finding labour and lower prices for imported capital goods resulting from the high exchange rate. Investment intentions remain positive, and so we expect business investment to hold up in the near term. Thereafter, however, we expect growth in business investment to slow as the supportive factors just mentioned are reversed. We forecast investment growth to fall to 0.3% in the March 2007 year, and then to recover to 3.4% in the year to March 2009 as the determinants of investment stabilise.
Figure 1.12 – Plant and machinery investment
Sources: Statistics New Zealand, NZIER
Government spending and transfers will add to demand
Increased government transfers as part of the Working for Families package (announced in the 2004 Budget) have previously been incorporated in the consumption forecasts. As these transfers go to households with a higher propensity to consume (because they spend a high proportion of their total income), the package is likely to have a positive effect on consumption.
Sustained growth over the forecast period in government spending on goods and services, particularly in the areas of health and education, will also provide some offset to easing private consumption. Government defence spending, much of which is counted as current expenditure, is also set to continue to grow in the forecast period. On current plans, public consumption growth is forecast to decline from an estimated 7.1% in the year to March 2005 to 3.3% per annum at the end of the forecast period, but is above the growth rate in total GDP throughout that period.
Central government investment growth is forecast to increase from an estimated 4.1% in the March 2005 year to 6.6% in the March 2006 year and will make a positive contribution to growth in the forecast period. This item includes budgeted investment in non-weapons military equipment and other capital spending in the health and housing areas.
The contribution from exports is forecast to decline
December 2004 quarter export volumes remained below December Update forecasts, despite their recovery from a weak September quarter. Unseasonal patterns in dairy export volumes as a result of climatic factors and changes in stock-holding policies were the main causes of the variability in exports in the second half of 2004. We are forecasting export volume growth of 4.5% in the year to March 2005 to slow to 3.3% in the following year due to the delayed impact of the high exchange rate and slower world growth. The lower exchange rate and strengthening world growth in subsequent years are expected to lead to export growth of around 4.0% in the March 2007 and 2008 years.
There is uncertainty about the track for the exchange rate…
Our forecasts assume that the New Zealand dollar (TWI basis) will remain at its March 2005 quarter average for the June and September quarters, before declining to our estimate of its long-run equilibrium value by the end of the forecast period. Factors that could contribute to a fall in the exchange rate from its current level include a slowing in economic growth, the growing current account deficit and forecast decline in the terms of trade. The forecast narrowing of the positive differential between New Zealand and global interest rates may also reduce the attractiveness of the New Zealand dollar. However, there is considerable uncertainty surrounding the timing and extent of any depreciation in the exchange rate. This is particularly the case at the present time given uncertainties about the path of global currencies, especially the United States dollar. Indeed, some further exchange rate appreciation in the short term cannot be ruled out.
Figure 1.13 – New Zealand dollar exchange rate (TWI)

Sources: Reserve Bank of New Zealand, The Treasury
… and its impact on exports
There is also uncertainty about how negatively the high exchange rate will impact on export receipts in the near term. For some commodity exports, notably dairy, beef and lamb, the exchange rate has been offset by historically high international prices, leaving prices above their decade average in New Zealand dollar terms. Forestry products are a notable exception to this commodity picture. For manufactured product exporters, the effect of the exchange rate depends on the markets they export to; while the New Zealand dollar has appreciated strongly against the United States dollar, it has not posted such large gains against other currencies. Some manufacturing exporters have a natural hedge in imported raw materials or componentry and some took out long-term forward contracts to protect their returns. However, many of these forward contracts are about to expire, leaving firms to face a potentially abrupt transition to current exchange rates.
In the services sector, especially inbound tourism, the appreciation of the New Zealand dollar has only limited impact on the number of visitors in the short term, but it does reduce the amount travellers are prepared to spend once they arrive in New Zealand. In the longer term the high exchange rate begins to affect the number of visitor arrivals as New Zealand loses competitiveness as a holiday destination. The strong exchange rate also encourages more New Zealanders to travel overseas for holidays, detracting from services export receipts. (For the development of alternative scenarios associated with the exchange rate and weaker demand for New Zealand’s exports, see chapter 3 page 90.)
Import volume growth is expected to decline
Strong consumption and investment growth led to an acceleration in import volume growth from 8.1% in calendar year 2003 to 15.7% in 2004. The forecast falls in these major components of domestic demand will lead to a decline in import growth from an estimated 12.8% in the year to March 2005, to 4.1% in the year to March 2006, and then to average 2.5% growth in the following three years. March 2005 quarter trade data suggest that import volume growth may be stronger than in our central forecast as a result of the stronger domestic economy and high exchange rate. However, we consider that this strength in the domestic economy is a rebound from temporary weakness in late 2004 and is unlikely to be sustained.
We expect the net contribution of the export sector to GDP growth to be positive in the March 2006 year as export growth exceeds import growth, and this pattern will continue in subsequent years as export growth outpaces import growth as the exchange rate depreciates. (See The Global Economic Outlook box on the following two pages for more discussion.)
The Global Economic Outlook
Recent and current developments
Global economic growth slowed steadily between September 2003 and September 2004, but quickened slightly in the December quarter of 2004. The quarterly growth rate (New Zealand-export weighted) was most influenced – up until the December quarter of 2004 – by a sharp slowing of Australian growth, but growth rates were in fact declining in most of New Zealand’s major export markets.
Figure 1.14 – New Zealand trading partner growth, export weighted

Sources: Datastream, IMF, The Treasury
Consensus Forecasts point to quarterly growth recovering over the remainder of 2005, building on the rebound seen in the final quarter of 2004. Nevertheless, annual average growth rates for 2005 will remain below those recorded in late 2003 and early 2004. In subsequent years, steady growth of about 3½% per year is expected. However, there is considerable uncertainty about these predictions, largely stemming from large growth and current account imbalances and high oil prices. There have also been commentaries suggesting a more rapid increase in global interest rates than forecast as the United States Federal Reserve moves to control inflationary pressures. Another source of uncertainty is slower GDP growth in Australia.
Global GDP growth (annual average % change)
Calendar year | | 2003 | | 2004 | | 2005 | | 2006 | | 2007 | | 2008 | | 2009 | |
| | | | | | | | | | | | | | | |
Consensus Forecasts (March 2005, October 2004 for 2007-2009) | | | | | | | | | | | | | | | |
| | | | | | | | | | | | | | | |
Australia | | 3.4 | | 3.2 | | 2.6 | | 3.2 | | 3.4 | | 3.7 | | 3.4 | |
United States | | 3.0 | | 4.4 | | 3.7 | | 3.4 | | 3.3 | | 3.2 | | 3.2 | |
Europe | | 1.1 | | 2.3 | | 1.8 | | 2.0 | | 1.9 | | 1.7 | | 1.8 | |
Japan | | 1.4 | | 2.6 | | 1.0 | | 1.7 | | 1.5 | | 1.7 | | 1.7 | |
Non-Japan Asia | | 5.1 | | 7.3 | | 5.8 | | 5.8 | | 6.0 | | 6.2 | | 5.9 | |
Trading partner average | | 3.0 | | 4.1 | | 3.2 | | 3.4 | | 3.4 | | 3.5 | | 3.4 | |
| | | | | | | | | | | | | | | |
IMF (April 2005) | | | | | | | | | | | | | | | |
| | | | | | | | | | | | | | | |
Advanced Economies | | 2.0 | | 3.4 | | 2.6 | | 3.0 | | | | | | | |
World | | 4.0 | | 5.1 | | 4.3 | | 4.4 | | | | | | | |
Sources: Consensus Economics, IMF, The Treasury
Weight of risks points to weaker outlook
In considering the uncertainties which affect the Consensus Forecasts, it is notable that the most widely discussed alternative scenarios all imply slower global growth.
A major concern is the large growth differential and increasing imbalances between countries. Although the US current account deficit is similar to New Zealand’s as a percentage of GDP, such a large deficit in dollar terms places much higher demands on the supply of world investment funds. While there is currently a plentiful supply of global capital, it is possible that this will not be sustained. Either a reduction in supply or withdrawal of investor support for US assets could lead to an unruly decline in the US dollar and a turbulent growth adjustment. In turn, any decline in the value of US dollar assets has the potential to put pressure on official balance sheets in Asian countries, possibly transmitting financial difficulties.
Figure 1.15 – US current account deficit
Source: Datastream
Oil prices are another source of uncertainty in global economic forecasts. Based on futures data, spot prices are expected to decline from current levels of about US$50 per barrel over the next five years, but to remain considerably higher than the long-term average of US$20. Should oil prices not decline as expected, the potential would increase for more widespread inflation or for oil-intensive industries to cut output in order to contain costs.
Both the global imbalances and oil price uncertainty raise the prospect of problems for monetary policy makers. In the former case, high current account surpluses in Asia are increasing liquidity in the region and making it more difficult to contain domestic demand. As a result, price movements in Asia have typically moved from deflation to inflation. Keeping this inflation under control without exchange rate adjustment will be difficult and there is a possibility that inflation will spread, through higher commodity prices, to other countries.
Finally, forecasts of GDP growth in the economy of New Zealand’s main export destination, Australia, show a quick return to annual growth rates of about 3½% following the recent quarterly slowing. Certainly, growth rates in excess of 3% per year have been typical in Australia, at least for non-farm GDP, for the past decade. But some commentators have raised the possibility that recent official interest rate increases at a time of apparently slowing domestic demand growth could prolong the period of slow GDP growth.
Terms of trade are forecast to decline from recent high levels
We forecast the terms of trade (measured as the ratio of export to import prices) to decline from their recent record levels as a result of adverse developments in both export and import prices. The terms of trade continued to increase in the second half of 2004 on the back of strong export prices, offset to some degree by higher oil prices. Export commodity prices are forecast to decline in the second half of 2005 as positive supply factors are reversed and demand eases with slower trading partner growth. Import prices, on the other hand, are forecast to increase in world price terms until the September quarter 2005, largely because of further projected increases in oil prices in the second and third quarters of 2005. Thereafter, oil prices are assumed to decline, but to remain approximately one third higher than in the December Update.
Figure 1.16 – Terms of trade
Sources: Statistics New Zealand, The Treasury
Inflation pressures are expected to be moderate but persistent
We expect annual CPI inflation to remain within the Reserve Bank’s target zone of 1% to 3% “on average over the medium term” in the next year despite the current high capacity utilisation and economic activity only just coming back to its potential level. Aggregate inflation has been suppressed by low tradables inflation (as a result of the appreciation of the exchange rate) and contributions from temporary factors such as declines in international airfares. Non-tradables inflation has been boosted by high rates of growth in construction costs, price increases in transportation (largely as a result of oil price increases) and rising costs of household operations (chiefly energy costs). We expect the first two of these to ease over the forecast period, but there will be a degree of persistence as the economy slows only gradually. Tradables inflation will increase as the fall in the exchange rate translates into increasing import prices.
Figure 1.17 – Consumer price inflation
Sources: Statistics New Zealand, The Treasury
Short-term interest rates are expected to remain around current levels of 7.0% until the first quarter of 2006 in order to lean against current inflation pressures. Interest rates are then forecast to decline towards their assumed neutral level of around 5.8% by the end of the period in line with forecast inflation.
Nominal GDP is expected to be higher in the near term
We expect nominal GDP to increase by more than forecast in the December Update in the year to March 2006 because of the high terms of trade in the current period and slightly higher inflation, reflecting the strength of the economy. In income terms, much of the additional nominal GDP appears as operating surplus, or profits. Corporates are currently performing well and profit growth has been strong, boosting corporate tax revenue. However, as the economy slows we expect profit growth to slow markedly as cost pressures remain (particularly in the labour market) and competition limits price increases. Nominal GDP growth is forecast to decline from an estimated 8.2% in the March 2005 year to 4.3% in the March 2006 year and 3.0% in the March 2007 year, but then to recover to 5.0% growth in the March 2009 year.
The current account deficit increases further
We expect the current account deficit to continue to increase, peaking at 7.0% of nominal GDP in late 2006 – early 2007. After that, it will decline gradually to 6.1% of GDP in March quarter 2009. The increase in the deficit is initially driven by an increase in the deficit on goods as a result of the continuing momentum in the domestic economy maintaining import growth, while export growth slows as a result of the high exchange rate and slower trading partner growth.
Figure 1.18 – Current account deficit
Sources: Statistics New Zealand, The Treasury
Subsequently, import prices are expected to increase more than export prices as the terms of trade deteriorate, further contributing to the deficit on goods. The balance on investment income remains negative throughout the forecast period, as the profits that accrue to foreign investors in New Zealand continue to exceed returns from New Zealand’s overseas investments, but this component of the current account deficit decreases in the forecast period as business profitability declines. (See the Current Account Adjustment box on the following pages for further discussion.)
Current Account Adjustment
International experience
The widening of a current account deficit may be associated with either cyclical – and therefore temporary – changes in the economy or changes in the underlying, fundamental determinants of the current account balance. Examples of the former include changes in demand relative to supply in response to interest rate and exchange rate movements. Examples of the latter include improvements in an economy’s growth potential, and thus its attractiveness as an investment destination, and improvements in global financial intermediation that facilitate investment across borders.
When cyclical factors drive the widening deficit, at some point the deficit will be unwound; in contrast, where the drivers are structural, higher deficits may persist for much longer periods. Recent international research confirms the importance of different cyclical drivers in determining the economic outcomes associated with a narrowing of the current account balance.
Output growth is an important determinant of cyclical movements in the current account. As an economy booms, domestic demand may exceed domestic output growth. This will be reflected in a rise in domestic investment relative to national saving, that is, an increased reliance on foreign saving, and an increase in imports and thereby a deterioration in the current account deficit. If the boom leads to a rise in inflation, monetary policy will tighten to slow the growth in domestic demand and to counter the rise in inflation. The combination of a slowing economy and the expected easing in monetary policy will tend to reduce the attractiveness of the domestic economy as an investment destination and to depreciate the exchange rate, which helps restore the trade balance, and thereby narrows the deficit.
The exchange rate is another important determinant of fluctuations in the current account deficit. An exchange rate appreciation that is not supported by underlying economic conditions will tend to slow overall economic growth through a reduction in export growth and a rise in imports, which also causes the trade balance and the current account balance to deteriorate. Monetary policy will respond to weaker price pressures through reduced interest rates and (as above) the exchange rate will tend to depreciate and the current account balance will improve. The expected tightening of monetary policy limits the extent of depreciation and helps restrain the growth in demand, but in contrast to the previous scenario, the growth rate improves.
New Zealand experience
New Zealand’s experience in two recent episodes appears to confirm the importance of the drivers of the deficit to the outcomes associated with adjustment. (In each of the accompanying charts, period 0 corresponds to the peak in the current account deficit in March 1986 and March 2000 respectively.)
Figure 1.19 maps the widening and subsequent narrowing of the deficit from its peaks in March 1986 and March 2000 respectively.
Figure 1.19 – Current account deficit reductions

Source: The Treasury
Figure 1.20 illustrates the markedly different growth experiences associated with each episode. In 1986, real GDP growth was weak following the peak in the current account deficit, whereas in 2000 growth was strong.
Figure 1.20 – Real GDP growth
Sources: Statistics New Zealand, The Treasury
Figure 1.21 shows how the real exchange rate depreciated in the lead-up to, and after, the 2000 peak. In contrast the real exchange rate appreciated after 1986, a reflection of New Zealand’s high inflation rate and other structural rigidities at that time.
Figure 1.21 – Real exchange rate
Sources: Statistics New Zealand, The Treasury
Figure 1.22 uses the output gap, or the difference between current output and the hypothetical potential output, as a measure of general excess demand in the economy. In contrast to 1986, when the economy was characterised by excess demand, there was a lack of demand in the period around the 2000 peak, which provided room for a period of non-inflationary growth.
Figure 1.22 – Output gap
Sources: Statistics New Zealand, The Treasury
Future prospects
Today’s growing current account deficit may reflect some fundamental changes in New Zealand’s growth prospects and in international financial flows, but it also reflects some temporary and cyclical phenomena. These include a degree of excess demand in the economy and an exchange rate above that expected to prevail over the medium term.
While we expect these cyclical factors to unwind in coming years, the current account deficit is projected to remain elevated over the forecast horizon. This reflects the assumption that the exchange rate will decline only gradually, limiting the extent of growth in the export and import-competing sectors, and a view that New Zealand’s sound macroeconomic policy-setting will continue to underpin investor confidence.
Clearly, a different path is possible. A more rapid exchange rate depreciation would likely see the deficit return toward historical levels (around 4½% of GDP) more quickly. Experience both in New Zealand and elsewhere confirms the importance of real exchange rate adjustment and the maintenance of sustainable growth rates to the smooth adjustment of the current account. How benign the adjustment path turns out to be depends on the mix of economic conditions at the time.
Fiscal Forecasts – Finalisation Dates and Key Assumptions
Finalisation Dates
Economic outlook (refer Chapter 1) | | 18 April | |
Tax revenue forecasts | | 29 April | |
Fiscal forecasts | | 9 May | |
Government decisions and circumstances | | 9 May | |
Actual asset revaluations | | 31 March | |
Foreign exchange rates | | 28 February | |
Specific fiscal risks (refer Chapter 4) | | 9 May | |
Contingent liabilities and commitments (refer Chapter 4) | | 31 March | |
Key assumptions
The fiscal forecasts have been prepared in accordance with the Public Finance Act 1989. They are based on the Crown’s accounting policies and assumptions (refer page 120 of the GAAP tables). As with all assumptions, there is a degree of uncertainty surrounding them. This uncertainty increases as the forecast horizon extends. A summary of the key economic assumptions that are particularly relevant to the fiscal forecasts is provided below (on a June-year-end basis to align with the Crown’s balance date of 30 June):
| | 2004/05 | | 2005/06 | | 2006/07 | | 2007/08 | | 2008/09 | |
June years | | BEFU 04 | | BEFU | | BEFU | | BEFU | | BEFU | | BEFU | |
Real GDP (P) (ann avg % chg) | | 2.4 | | 3.4 | | 2.2 | | 2.8 | | 3.4 | | 3.0 | |
Nominal GDP (E) ($m) | | 144,441 | | 150,714 | | 156,065 | | 161,582 | | 169,470 | | 178,172 | |
CPI (annual % change) | | 2.5 | | 2.8 | | 2.6 | | 2.7 | | 2.3 | | 2.0 | |
Govt 10-year bonds (qty avg %) | | 6.3 | | 6.4 | | 6.4 | | 6.3 | | 6.0 | | 6.0 | |
90-day bill rate (qty avg %) | | 5.8 | | 7.0 | | 6.5 | | 6.0 | | 5.8 | | 5.8 | |
Unemployment rate ((HLFS) basis ann avg %) | | 4.7 | | 3.5 | | 3.7 | | 4.1 | | 4.3 | | 4.5 | |
Full-time equivalent employment (ann avg %) | | 1.0 | | 3.5 | | 0.9 | | 0.7 | | 1.1 | | 1.2 | |
Current account (% of GDP) | | -5.9 | | -6.8 | | -6.7 | | -6.9 | | -6.4 | | -6.0 | |
Source: The Treasury
New Zealand Superannuation (NZS) Fund
The contribution to the NZS Fund for the year ending 30 June 2006 is $2.337 billion. The contribution to the NZS Fund is calculated over a 40-year rolling horizon to ensure that superannuation entitlements over the next 40 years can be met if the contribution rate were to be held constant at that level. The Government is making the required minimum annual contribution for 2004/05 as calculated by the formula set out in the NZS Act.
$ billion (June year end) | | 2003 | | 2004 | | 2005 | | 2006 | | 2007 | | 2008 | | 2009 | |
Required contribution | | N/A | | 1.879 | | 2.107 | | 2.337 | | 2.375 | | 2.533 | | 2.744 | |
Actual/Budgeted contribution | | 1.200 | | 1.879 | | 2.107 | | 2.337 | | 2.375 | | 2.533 | | 2.744 | |
Source: The Treasury
The underlying assumptions in calculating the contributions are the nominal GDP series to 2046, the NZS expense series to 2046 and the expected long-term, net after-tax annual return of the NZS Fund (6.1%) (6.8% December Update). The forecast rate of return is based on the Treasury’s assumptions for the rate of return on financial portfolios of Crown financial institutions. The GDP and NZS expense series were projected using the assumptions stated on page 33 of the 2005 Fiscal Strategy Report.
The Treasury website contains further information on the NZS Fund, as well as a copy of the NZS Fund model.
2
Fiscal Outlook
The fiscal position remains strong with the Government continuing to make progress towards its long-term objectives.
As stated in the Fiscal Strategy Report (FSR) “the Government’s fiscal strategy is to strengthen public finances to prepare for future fiscal costs associated with an ageing population”.
The Government has focused on two complementary elements to reach its objective, being:
• the accumulation of financial assets through contributions to the New Zealand Superannuation (NZS) Fund
• managing debt at prudent levels with gross sovereign-issued debt as a percentage of GDP slowly reducing over time.
The forecast fiscal outlook for the Budget Update shows:
• revenue sufficient to meet operating expenses with the residual (operating balance/OBERAC) forecast to be on average around 3.6% of GDP over the forecast period
• net worth increasing by around $27.7 billion over the forecast period, largely resulting from the accumulation of assets
• the cash equivalent of the OBERAC being applied to the Government’s investment strategy (such as contributions to the NZS Fund and purchasing physical assets). Over the forecast period the cash generated is not sufficient to fund all of the Government’s investing activity, leaving an expected cash shortfall
• gross sovereign-issued debt as a percentage of GDP slowly reducing over the forecast period, while in nominal terms gross debt rises near the end of the forecast period.
Fiscal Indicators
There are a number of indicators that are important in understanding the state of the Government’s fiscal position. No single indicator provides an all-purpose measure of the financial performance of the Crown and its impact on the economy. For example:
• the total Crown operating balance reflects the difference between current revenues (tax revenue, investment income etc) and current expenses (salaries, benefit payments etc). The operating balance shows whether the Government has generated enough revenue to cover expenses
• the total Crown OBERAC reflects the difference between current revenues and current expenses adjusted for valuation movements and accounting policy changes. The OBERAC provides a measure of the Government’s underlying stewardship
• the total Crown net worth reflects the difference between total assets and total liabilities. The change in net worth in any given forecast year is primarily driven by the operating balance
• the cash available/(shortfall to be funded) reflects the net effect of the Government’s core Crown operating (cash equivalent of the OBERAC) and investing activities (such as contributions to the NZS Fund and purchases of physical assets). It shows whether the cash generated is sufficient to meet all government spending (both operating and investing)
• gross sovereign-issued debt reflects the debt burden of the core Crown (excluding the activity of the NZS Fund and GSF). The movement over the forecast period is primarily driven by the cash available/(shortfall to be funded)
• net core Crown debt reflects borrowings (financial liabilities) less cash and bank balances, marketable securities and deposits, and advances (financial assets). Net debt excludes the financial assets of the NZS Fund and GSF as these assets are restricted in nature.
Table 2.1 – Summary fiscal indicators(6)
| | Year ended 30 June | |
($ million) | | 2004
Actual | | 2005
Forecast | | 2006
Forecast | | 2007
Forecast | | 2008
Forecast | | 2009
Forecast | |
Total revenue | | 60,387 | | 65,265 | | 68,770 | | 71,238 | | 73,856 | | 78,156 | |
% of GDP | | 43.0 | | 43.3 | | 44.1 | | 44.1 | | 43.6 | | 43.9 | |
Total expenses | | 53,057 | | 59,513 | | 62,244 | | 66,047 | | 70,101 | | 73,020 | |
% of GDP | | 37.8 | | 39.5 | | 39.9 | | 40.9 | | 41.4 | | 41.0 | |
Operating balance | | 7,424 | | 5,891 | | 6,665 | | 5,330 | | 3,894 | | 5,275 | |
% of GDP | | 5.3 | | 3.9 | | 4.3 | | 3.3 | | 2.3 | | 3.0 | |
OBERAC | | 6,629 | | 7,445 | | 6,665 | | 5,330 | | 3,894 | | 5,275 | |
% of GDP | | 4.7 | | 4.9 | | 4.3 | | 3.3 | | 2.3 | | 3.0 | |
Net worth | | 35,463 | | 41,972 | | 48,637 | | 53,967 | | 57,861 | | 63,136 | |
% of GDP | | 25.2 | | 27.8 | | 31.2 | | 33.4 | | 34.1 | | 35.4 | |
Cash available/(shortfall to be funded) | | 520 | | 2,413 | | 30 | | (1,606 | ) | (2,776 | ) | (1,391 | ) |
% of GDP | | 0.4 | | 1.6 | | 0.0 | | (1.0 | ) | (1.6 | ) | (0.8 | ) |
Gross sovereign-issued debt | | 35,527 | | 34,111 | | 33,284 | | 32,583 | | 34,629 | | 35,925 | |
% of GDP | | 25.3 | | 22.6 | | 21.3 | | 20.2 | | 20.4 | | 20.2 | |
Net core Crown debt | | 15,204 | | 11,533 | | 10,257 | | 10,640 | | 12,527 | | 13,439 | |
% of GDP | | 10.8 | | 7.7 | | 6.6 | | 6.6 | | 7.4 | | 7.5 | |
Source: The Treasury
(6) | Detailed tables of the key indicators for the Budget Update and December Update are located on pages 80 and 81. |
Revenues are forecast to exceed operating expenses…
In each of the forecast years the revenue generated is expected to be more than sufficient to meet the Government’s operating expenses (salaries, benefit payments, depreciation costs etc). This translates into an operating balance of $5.9 billion in 2004/05 reducing to $5.3 billion by 2008/09.
Figure 2.1 – Core Crown revenue and expense growth (excluding GSF valuation)

Source: The Treasury
Figure 2.2 – Final forecast year impact of net Budget packages

Source: The Treasury
In recent years revenue growth has exceeded expense growth, largely due to strong economic growth. This trend is expected to reverse over the initial stage of the forecast period, before both expense and revenue growth converge towards the end of the forecast period. This reflects:
• the impact of the 2004 and 2005 Budgets. The allowance for new initiatives in future Budgets is expected to be smaller than the previous two Budgets, so forecast expense growth decreases from 2006/07 onwards
• the impact of the forecast economic cycle on tax revenue. Tax revenue growth decreases due to an expected slowdown in economic growth in the early part of the forecasts, before rebounding by 2008/09.
This translates into an OBERAC that is forecast to fall from $7.4 billion (4.9% of GDP) in the current year to $3.9 billion (2.3% of GDP) by 2007/08(7), before rising to $5.3 billion (3% of GDP) by 2008/09.
… as a result the Government is expected to strengthen its fiscal position…
Net worth is forecast at $42 billion (27.8% of GDP) in the current year and is expected to rise to $63.1 billion (35.4% of GDP) by 2008/09. The forecast increase in net worth is driven by the operating surpluses the Government is expected to run over the forecast horizon.
Figure 2.3 – Core Crown investments on a year-by-year basis
Source: The Treasury
… by accumulating assets…
In line with the Government’s fiscal objectives the OBERAC has been applied to fund the Government’s investments. Over the forecast period total assets are expected to increase by around $35.8 billion.
The OBERAC cannot be fully used by the Government to help finance its capital programme. This is because some components of the OBERAC are non-cash (ie, depreciation) or retained by entities within the Crown (ie, SOE/Crown entity surpluses and NZS Fund returns) for the purpose of achieving their long-term objectives. Adjusting for these items gives the core Crown operating cash flows. Figure 2.3 shows how these cash flows are applied across the forecast years. Table 2.2 shows the cumulated balance sheet impact.
(7) | The decrease in 2007/08 is due to the change in provisional tax dates as part of the Business package having a one-off impact of $760 million. |
Table 2.2 – Impact of Crown operating surpluses on the balance sheet from 2004/05 to 2008/09 inclusive
Source: The Treasury
As outlined in Table 2.2, the accumulated operating balance is expected to be $27.1 billion over the forecast period. Adjusting for non-cash items ($8.3 billion) and returns retained by entities within the Crown ($10 billion) gives a cash flow from operations which generates around $25.4 billion over the forecast horizon.
Figure 2.4 – Gross sovereign-issued debt
Source: The Treasury
This will be invested primarily in NZS Fund contributions of $12.1 billion, advances of $4 billion (mainly student loans and refinancing existing private sector debt of the health and housing sectors), purchases of physical assets of $9.1 billion (for example, schools and defence equipment), injections into Crown entities for hospitals and housing of $1.6 billion and the purchase of foreign exchange reserves of $1.9 billion.
There is a residual financing requirement of around $3.3 billion, which will be partially met by reducing the holdings of marketable securities and deposits which have accumulated from 2003/04 and 2004/05, and by raising some debt.
… while gross debt as a percentage of GDP slowly reduces over the forecast period
As a percentage of GDP, gross debt is expected to fall from 25.3% in 2003/04 to 20.2% by 2008/09. In nominal terms, gross debt is also forecast to fall to $32.6 billion by 2006/07 and then rise to $35.9 billion by the end of the forecast horizon.
The initial decrease in debt in nominal terms reflects residual assets from the strong results in 2003/04 and 2004/05. Gross debt is then expected to slowly rise, reflecting the fact that capital spending will be greater than the funding available due to the OBERAC as shown in Table 2.2.
The increased asset position expected in 2004/05 has led to a change in the Government’s 2005/06 bond programme which has been reduced to $2.2 billion, compared with $2.5 billion at the December Update. The domestic bond programme is set at $2.8 billion per annum for the remainder of the forecast period.
Net debt is also expected to fall before flattening by the end of the forecast horizon
Net debt(8) in nominal terms and as a percentage of GDP is forecast to fall in the current year, reflecting the strong asset position achieved in 2004/05. Net debt is expected to remain relatively flat as a percentage of GDP between 2005/06 and 2008/09. The difference in the trend of gross debt arises because some of the expected borrowing will be used to fund financial assets including student loans and reserves.
Figure 2.5 – Net debt
Source: The Treasury
Net core Crown debt with the financial assets of the NZS Fund is forecast to be below zero by 2006/07.
(8) | Net debt excludes the assets of the NZS Fund and GSF. |
Table 2.3 – Revenue and expenses comparison with December Update
| | Year ended 30 June | |
(% of GDP) | | 2004
Actual | | 2005
Forecast | | 2006
Forecast | | 2007
Forecast | | 2008
Forecast | | 2009
Forecast | |
Total Revenue | | | | | | | | | | | | | |
Budget Update | | 43.0 | | 43.3 | | 44.1 | | 44.1 | | 43.6 | | 43.9 | |
December Update | | | | 43.0 | | 43.7 | | 43.9 | | 43.9 | | 44.0 | |
| | | | | | | | | | | | | |
Total Expenses | | | | | | | | | | | | | |
Budget Update | | 37.8 | | 39.5 | | 39.9 | | 40.9 | | 41.4 | | 41.0 | |
December Update | | | | 39.3 | | 39.8 | | 40.7 | | 41.1 | | 41.0 | |
| | | | | | | | | | | | | |
Core Crown Revenue | | | | | | | | | | | | | |
Budget Update | | 33.4 | | 33.9 | | 34.2 | | 34.0 | | 33.7 | | 34.1 | |
December Update | | | | 33.6 | | 33.9 | | 34.0 | | 34.1 | | 34.3 | |
| | | | | | | | | | | | | |
Core Crown Expenses | | | | | | | | | | | | | |
Budget Update | | 29.6 | | 30.1 | | 30.9 | | 31.8 | | 32.3 | | 32.1 | |
December Update | | | | 30.4 | | 30.9 | | 31.7 | | 32.2 | | 32.3 | |
| | | | | | | | | | | | | |
SOE Revenue | | | | | | | | | | | | | |
Budget Update | | 6.4 | | 6.4 | | 6.9 | | 7.1 | | 6.9 | | 6.9 | |
December Update | | | | 6.6 | | 6.9 | | 7.0 | | 6.9 | | 6.8 | |
| | | | | | | | | | | | | |
SOE Expenses | | | | | | | | | | | | | |
Budget Update | | 5.9 | | 5.8 | | 6.4 | | 6.5 | | 6.4 | | 6.3 | |
December Update | | | | 6.1 | | 6.3 | | 6.5 | | 6.4 | | 6.3 | |
| | | | | | | | | | | | | |
Crown Entities’ Revenue | | | | | | | | | | | | | |
Budget Update | | 15.1 | | 14.6 | | 14.9 | | 14.9 | | 14.5 | | 14.0 | |
December Update | | | | 14.3 | | 14.5 | | 14.4 | | 14.0 | | 13.5 | |
| | | | | | | | | | | | | |
Crown Entities’ Expenses | | | | | | | | | | | | | |
Budget Update | | 14.0 | | 15.0 | | 14.3 | | 14.3 | | 13.9 | | 13.4 | |
December Update | | | | 14.1 | | 14.0 | | 13.9 | | 13.5 | | 12.9 | |
Source: The Treasury
Over the forecast period, total revenue to GDP is expected to increase initially before dropping in 2007/08 due to a tax policy decision resulting in a change to provisional tax dates (page 67) before returning to previous levels by 2008/09. Total expenses to GDP are also forecast to rise initially before flattening by 2008/09.
The trend in total revenue and expenses over the forecast horizon will largely be driven by activity in the core Crown segment of reported government activity.
The following section discusses revenue and expenses of the Crown by segment of reported government activity (ie, core Crown, SOEs and Crown entities).
Tax revenue is the major source of core Crown revenue.
Table 2.4 – Tax revenue indicators
Tax Revenue | | 2004
Actual | | 200
Forecast | | 2006
Forecast | | 2007
Forecast | | 2008
Forecast | | 2009
Forecast | |
($ billion) | | | | | | | | | | | | | |
Total Crown | | 42.5 | | 46.0 | | 48.1 | | 49.4 | | 51.1 | | 54.3 | |
Core Crown | | 43.0 | | 46.5 | | 48.6 | | 50.0 | | 51.7 | | 54.9 | |
| | | | | | | | | | | | | |
(% of GDP) | | | | | | | | | | | | | |
Total Crown | | 30.3 | | 30.5 | | 30.8 | | 30.6 | | 30.1 | | 30.5 | |
Core Crown | | 30.6 | | 30.8 | | 31.2 | | 30.9 | | 30.5 | | 30.8 | |
Source: The Treasury
Tax revenue will display some cyclicality relative to GDP throughout the forecast period, but by 2008/09 tax revenue as a percentage of GDP is expected to be back to the same level as in 2004/05. However, during the forecast period, the various tax types follow quite different paths.
Figure 2.6 – Tax revenue forecasts
Source: The Treasury
The small lift in the tax-to-GDP ratio in 2004/05 comes mainly through growth in corporate taxes that is not closely related to components of nominal GDP, eg, investment funds returning to tax-paying positions. Because of such effects, company tax not only is pro-cyclical, but tends to have larger growth swings than GDP. This is the main reason behind the profile of tax revenue in Figure 2.6. A change in provisional tax dates is also expected to contribute to the decline in 2007/08.
Source deductions as a percentage of GDP increases in 2005/06 and 2006/07, mainly due to the progressive nature of the personal income tax scale, but decline in 2007/08 and 2008/09. The latter reflects the decision to index personal tax rate thresholds every three years in line with the mid-point of the Reserve Bank’s inflation target band from 1 April 2008.
Countering the upward influences of corporate tax and source deductions, net GST is forecast to slightly reduce tax revenue relative to GDP. Although total domestic consumption accounts for an ever-increasing portion of GDP throughout the forecast period, the increase is driven by the public component of consumption. The private
component of consumption will grow more slowly than GDP. Because most GST generated from public consumption, or GST that the Crown pays to itself, is eliminated from total tax under line-by-line consolidation of the Crown accounts, net GST is expected to reduce its share of GDP throughout the forecast period.
The pro-cyclical nature of company tax presents a significant risk to the tax forecasts. It is difficult to estimate the magnitude of the response of corporate tax to the business cycle. This can mean that there may be upside risks to the tax forecasts when profits are growing strongly eg, in 2004/05, and downside risks when profit growth is weak eg, in 2006/07 or 2007/08.
Effects of Tax Policy Changes on the Tax Forecasts
Table 2.5 – Material changes in tax revenue forecasts owing to changes in tax policy since December Update
($ million) | | 2005
Forecast | | 2006
Forecast | | 2007
Forecast | | 2008
Forecast | | 2009
Forecast | |
Material policy changes | | | | | | | | | | | |
Carbon tax | | — | | — | | 90 | | 362 | | 359 | |
Depreciation | | — | | (219 | ) | (276 | ) | (260 | ) | (222 | ) |
Financial intermediaries | | — | | — | | — | | (120 | ) | (100 | ) |
Fringe benefit tax | | — | | (7 | ) | (28 | ) | (28 | ) | (28 | ) |
Provisional tax dates | | — | | — | | — | | (600 | ) | — | |
GST-based provisional tax | | — | | — | | — | | (160 | ) | — | |
Triennial tax threshold adjustment | | — | | — | | — | | (68 | ) | (360 | ) |
International recruitment | | — | | — | | (12 | ) | (12 | ) | (12 | ) |
GST base maintenance | | — | | 15 | | 15 | | 15 | | 15 | |
Total Changes | | — | | (211 | ) | (211 | ) | (871 | ) | (348 | ) |
Source: The Treasury and Inland Revenue
The details of each policy change are as follows:
Carbon tax
A carbon tax of $15/tonne of CO2-equivalent comes into force on 1 April 2007. The figures in Table 2.5 include GST and are net of rebates resulting from Negotiated Greenhouse Agreements (NGAs).
Depreciation
Includes adjustment of certain tax depreciation rates and an increase to the low-value asset write-off threshold.
Financial intermediaries
Removes the overtaxation of portfolio investment through financial intermediaries relative to direct investments.
Fringe benefit tax
A range of changes to the fringe benefit tax rules, including lowering the valuation rate for motor vehicles and increasing the exemption thresholds for minor fringe benefits.
Provisional tax dates
Aligning the payment dates for provisional tax and GST will result in payment deferral. For some taxpayers, the deferral pushes a provisional tax payment out of 2007/08 and into the following fiscal year.
GST-based provisional tax
Small businesses will be able to base their provisional tax calculation on GST turnover. This is expected to shift $160 million from provisional tax to terminal tax from 2007/08 onwards.
Triennial tax threshold adjustment
From 1 April 2008, personal tax rate thresholds are to be indexed every three years in line with the mid-point of the Reserve Bank’s inflation target band.
International recruitment
A temporary tax exemption on foreign income will be made available to certain people who come to work in New Zealand.
GST base maintenance
Changes will ensure that GST is applied at the standard rate on imports of goods that are consumed in New Zealand but are located outside New Zealand at the time of supply.
Inland Revenue’s tax forecasts
In line with established practice, Inland Revenue has prepared an independent set of tax forecasts, based in the short term on more detailed analysis of taxpayer information, and in the long term on the same underlying macroeconomic trends that underpin the Treasury’s tax forecasts.
Inland Revenue’s forecasts are quite similar to the Treasury’s for 2004/05. However, for 2005/06, 2006/07 and 2007/08, Inland Revenue’s forecasts are up to $300 million higher than the Treasury’s in each year, with differences spread across several major tax types. These differences are similar in magnitude to differences between the forecasts in previous forecasting rounds. Detailed comparisons of Treasury and Inland Revenue forecasts can be found at www.treasury.govt.nz/forecasts/befu/2005.
Table 2.6 – Expenses indicators
Expenses | | 2004
Actual | | 2005
Forecast | | 2006
Forecast | | 2007
Forecast | | 2008
Forecast | | 2009
Forecast | |
($ billion) | | | | | | | | | | | | | |
Core Crown | | 41.6 | | 45.3 | | 48.2 | | 51.3 | | 54.8 | | 57.2 | |
Core Crown (excluding GSF valuation) | | 41.9 | | 44.8 | | 48.2 | | 51.3 | | 54.8 | | 57.2 | |
| | | | | | | | | | | | | |
(% of GDP) | | | | | | | | | | | | | |
Core Crown | | 29.6 | | 30.1 | | 30.9 | | 31.8 | | 32.3 | | 32.1 | |
Core Crown (excluding GSF valuation) | | 29.8 | | 29.7 | | 30.9 | | 31.8 | | 32.3 | | 32.1 | |
Source: The Treasury
Core Crown operating expenses (excluding valuation items) are expected to rise by around 2% of GDP from 29.7% in 2004/05 to 32.1% of GDP by 2008/09. This represents the continuing impact of the 2004 Budget (which has a larger impact on expenses going forward, reflecting the implementation phase of the Working for Families initiative), the 2005 Budget and spending allocated for future Budgets.
Figure 2.7 – Core Crown expenses (excluding valuations)
Source: The Treasury
As indicated in the FSR, the core Crown spending areas of health and education have been allocated a significant portion of the 2005 Budget. In part this reflects the current spending pressures within these sectors.
Health expenses as a percentage of GDP are forecast to increase from 5.7% to 6.2% between 2000/01 and 2005/06, while education expenses as a percentage of GDP are forecast to increase from 5.2% to 5.6% over the same period. By contrast, social security and welfare expenses are expected to decrease as a percentage of GDP due to minimal growth in beneficiary numbers.
Finance costs have also decreased as a percentage of GDP, due to a decrease in the level of borrowings and changes in interest rates between 2000/01 and 2005/06.
Figure 2.8 – Core Crown functional expenses (excluding valuations)
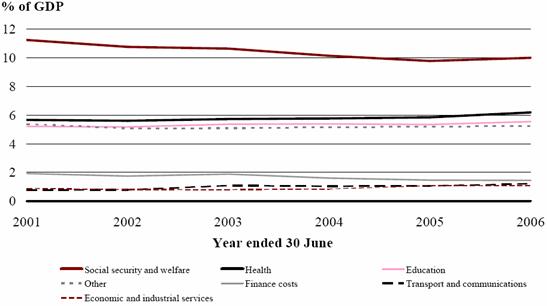
Source: The Treasury
Health spending as a proportion of core Crown expenses are forecast to increase from 18.2% in 2000/01 to 20% by 2005/06. Education spending as a proportion of core Crown spending is also expected to increase from 16.8% in 2000/01 to 18% by 2005/06.
Figure 2.9 – Core Crown functional expenses as a percentage of total expenses (excluding valuations)
Source: The Treasury
In nominal terms, core Crown expenses are expected to increase by around $11.9 billion between 2004/05 and 2008/09. Removing the GSF liability movements, expenses are forecast to increase by $12.4 billion over the same period. The major drivers of these expense increases are indexation of benefits, the 2005 Budget package and forecast new spending for future Budgets.
Forecast new spending
A detailed breakdown of the 2005 Budget package is provided on page 71. In summary, the 2005 Budget commits new operating resources of around $2 billion (GST exclusive) for 2005/06, rising to $2.7 billion (GST exclusive) in 2008/09. This is higher than indicated
in the 2005 Budget Policy Statement (BPS) although the BPS signalled there may be scope for additional spending to advance initiatives around savings and business(9).
Figure 2.10 – Net Allowance for new operating initiatives (GST exclusive)
Source: The Treasury
Figure 2.10 represents the cumulative operating impact of the 2005 Budget through to Budget 2008. It shows:
• the 2005 Budget operating impact is $2 billion rising to $2.7 billion(10). It has a rising profile, as some initiatives are expected to have increasing costs due to implementation phasing
• the net operating allowance of $1.9 billion (GST exclusive) in Budget 2006 rising by 2% (the mid-point of the CPI inflation target range) in Budgets 2007 and 2008. Future Budgets have been partially allocated, such as the Health Funding, Defence, Official Development Assistance and some Education packages(11).
(9) | The BPS signalled a net allowance for new operating initiatives in the 2005 Budget of around $2.1 billion (GST inclusive) rising to $2.4 billion (GST inclusive) by 2008/09. This translates to $1.8 billion and $2.1 billion GST exclusive. |
| |
(10) | In 2007/08 the change in provisional tax dates as part of the Business package has a one-off impact of $760 million. |
| |
(11) | For further details refer page 99 of the Specific Fiscal Risks chapter. |
2005 Budget Package
Operating
The 2005 Budget allocates new operating initiatives of $2 billion (GST exclusive) rising to $2.7 billion (GST exclusive). The majority of new spending has been allocated to health, education, justice, defence, social development and savings (ie, retirement and home ownership) initiatives. In addition, the 2005 Budget includes a significant business package through the tax system and introduces indexation of tax thresholds. The table below provides a summary of the operating impact of the 2005 Budget.
Table 2.7 – Budget 2005 Operating spending
($ million) GST exclusive | | 2005
Forecast | | 2006
Forecast | | 2007
Forecast | | 2008
Forecast | | 2009
Forecast | | Total | |
Encouraging Savings | | — | | 15 | | 106 | | 301 | | 167 | | 589 | |
Supporting Business and Economic Growth | | 7 | | 335 | | 348 | | 1,018 | | 205 | | 1,913 | |
Indexing Personal Income Tax Thresholds | | — | | — | | — | | 68 | | 360 | | 428 | |
Advancing Social Policies | | 127 | | 1,326 | | 1,643 | | 1,688 | | 1,683 | | 6,467 | |
Making New Zealand Safe | | 73 | | 253 | | 286 | | 341 | | 360 | | 1,314 | |
Protecting New Zealand’s Environment and Heritage | | 16 | | 77 | | 77 | | 74 | | 69 | | 313 | |
Other | | 36 | | 42 | | 34 | | 25 | | 24 | | 161 | |
Between-budget contingency | | 31 | | 271 | | 283 | | 271 | | 262 | | 1,118 | |
Thin Capitalisation changes | | — | | (240 | ) | (360 | ) | (360 | ) | (360 | ) | (1,320 | ) |
Forecast movements and unspent 2004 Budget contingencies | | (39 | ) | (85 | ) | (93 | ) | (92 | ) | (81 | ) | (389 | ) |
Total Budget 2005 Operating | | 251 | | 1,994 | | 2,324 | | 3,334 | | 2,691 | | 10,594 | |
Source: The Treasury
Capital
The 2005 Budget also allocates $1.9 billion in capital spending. This includes further capital funding to the defence, housing and transport sectors. The table below provides a summary of capital decisions of the 2005 Budget.
Table 2.8 – Budget 2005 Capital spending
($ million) GST N/A | | 2005
Forecast | | 2006
Forecast | | 2007
Forecast | | 2008
Forecast | | 2009
Forecast | | Total | |
Encouraging Savings | | — | | 13 | | 15 | | — | | — | | 28 | |
Supporting Business and Economic Growth | | 79 | | 30 | | 118 | | 241 | | 194 | | 661 | |
Advancing Social Policies | | 20 | | 35 | | 101 | | 116 | | (10 | ) | 261 | |
Making New Zealand Safe | | 56 | | 617 | | 108 | | (9 | ) | 10 | | 782 | |
Protecting New Zealand’s Environment and Heritage | | (22 | ) | 46 | | 12 | | 1 | | 1 | | 38 | |
Other | | 2 | | 26 | | 13 | | 3 | | 2 | | 45 | |
Between-budget contingency | | — | | 100 | | — | | — | | — | | 100 | |
Total Budget 2005 Capital | | 134 | | 866 | | 366 | | 352 | | 195 | | 1,914 | |
Source: The Treasury
SOE revenue and expenses to GDP follow a similar trend over the forecast horizon.
The initial increase in both revenue and expenses is largely driven by the electricity sector, reflecting forecasts based on the initial use of short-term assumptions around electricity spot prices, before moving to a medium-term assumptions beyond the current year.
Over the rest of the forecast period, both revenue and expenses are expected to remain relatively flat, reflecting the fact that growth in SOEs is consistent with overall growth in the economy.
Figure 2.11 – SOE revenue and expenses to GDP

Source: The Treasury
SOEs are forecast to run total operating surpluses of $4.6 billion over the forecast period. Around $1.8 billion of the operating surpluses will be returned as dividends. The remainder of the operating surpluses will be retained by individual entities for investment according to individual asset strategies.
Both revenue and expenses to GDP are expected to remain flat initially, before decreasing from 2007/08.
Figure 2.12 – Crown entities’ revenue and expenses to GDP
Source: The Treasury
The primary source of revenue for Crown entities is funding from core Crown departments. Since spending for future Budgets has yet to be allocated and therefore passed on to delivery agents (such as district health boards and schools) this leads to revenue and expenses to GDP falling near the end of the forecast period. Future allocations to delivery agents would lead to revenue and expenses rising back to similar levels.
Crown entities are also forecast to generate operating surpluses over the forecast period, which total around $4 billion. There are only a few Crown entities expected to generate significant operating surpluses. These entities will retain their surpluses for long-term purposes. For example, the Accident Compensation Corporation (ACC) will retain its surplus in order to build up its asset portfolio to help meet its outstanding claims liability, while the Earthquake Commission (EQC) will use its operating surplus to build up assets to cover claims in the event of any future natural disasters.
Table 2.9 – Net worth comparison with December Update
| | Year ended 30 June | |
Net Worth
($ billion) | | 2004
Actual | | 2005
Forecast | | 2006
Forecast | | 2007
Forecast | | 2008
Forecast | | 2009
Forecast | |
Total Crown Net Worth | | | | | | | | | | | | | |
Budget Update | | 35.5 | | 42.0 | | 48.6 | | 54.0 | | 57.9 | | 63.1 | |
December Update | | | | 41.1 | | 47.3 | | 52.6 | | 57.6 | | 63.0 | |
| | | | | | | | | | | | | |
Core Crown Net Worth | | | | | | | | | | | | | |
Budget Update | | 19.5 | | 25.3 | | 30.3 | | 34.0 | | 36.3 | | 39.9 | |
December Update | | | | 24.3 | | 29.0 | | 32.8 | | 36.1 | | 39.8 | |
| | | | | | | | | | | | | |
SOE Net Worth | | | | | | | | | | | | | |
Budget Update | | 7.0 | | 8.5 | | 9.1 | | 9.7 | | 10.2 | | 10.8 | |
December Update | | | | 7.7 | | 8.4 | | 9.0 | | 9.6 | | 10.2 | |
| | | | | | | | | | | | | |
Crown Entities’ Net Worth | | | | | | | | | | | | | |
Budget Update | | 31.7 | | 31.4 | | 32.9 | | 34.2 | | 35.5 | | 36.7 | |
December Update | | | | 32.5 | | 33.6 | | 34.9 | | 36.0 | | 37.2 | |
Source: The Treasury
Net worth is forecast to increase from $35.5 billion in 2003/04 to $63.1 billion by 2008/09. The growth in net worth reflects the Government’s strategy to run operating surpluses to strengthen its fiscal position. This strategy is evident across the whole of the Crown. The following section discusses the net worth of the Crown by segments of reported government activity.
Core Crown
Table 2.10 – Components of core Crown net worth
| | Year ended 30 June | |
($ billion) | | 2004
Actual | | 2005
Forecast | | 2006
Forecast | | 2007
Forecast | | 2008
Forecast | | 2009
Forecast | |
Total assets | | 77.7 | | 82.8 | | 87.6 | | 90.4 | | 94.5 | | 98.9 | |
Total liabilities | | 58.2 | | 57.5 | | 57.3 | | 56.3 | | 58.2 | | 59.0 | |
| | | | | | | | | | | | | |
Net worth | | 19.5 | | 25.3 | | 30.3 | | 34.0 | | 36.3 | | 39.9 | |
Source: The Treasury
Over the forecast horizon, core Crown assets are expected to increase from $77.7 billion to $98.9 billion, largely reflecting the application of the OBERAC to the build-up of assets rather than for debt repayment. As Figure 2.13 illustrates, the majority of growth occurs within financial assets, which increase by around $16.6 billion, while investments in Crown entities (primarily to fund hospitals and housing) and physical assets also increase slightly.
Figure 2.13 – Core Crown asset growth
Source: The Treasury
Within the financial asset portfolio of the core Crown:
• the NZS Fund is expected to increase by around $14.1 billion over the forecast period. These funds are being set aside to assist in meeting pressures on future NZS payments associated with an ageing population
• advances are forecast to increase by around $4.1 billion, primarily due to student loans which are provided to help students to access tertiary education
• the Reserve Bank’s and New Zealand Debt Management Office’s (NZDMO’s) financial asset portfolio is expected to decrease over time largely due to the unwinding of the past build-up of financial assets to assist in funding some of the Government’s operating and investment programme partially offset by foreign reserves build-up
• GSF holdings are forecast to remain relatively flat at around $3.3 billion over the forecast period. The assets held by the GSF have been built up from employee contributions over time and are used to partially offset the GSF unfunded liability, which is forecast to be $13.8 billion by 2008/09.
By 2008/09 the make-up of the financial asset portfolio is expected to have changed significantly, primarily driven by the increase in the holdings of the NZS Fund.
Figure 2.14 – Core Crown financial assets by portfolio

Source: The Treasury
Investments in Crown entities are forecast to increase by around $1.5 billion to allow for maintenance and improvement to the asset base, especially within the health and housing sectors.
Physical assets are expected to increase slightly over the forecast horizon, illustrating the maintenance and expansion of the core Crown’s physical asset base. Figure 2.15 provides a breakdown of the physical assets held by the core Crown, by major asset classes.
Figure 2.15 – Core Crown physical assets by asset class
Source: The Treasury
The level of liabilities is expected to remain relatively stable over the forecast period at just under $60 billion. The major component of core Crown liabilities is gross debt, which as previously mentioned is forecast to decrease as a percentage of GDP over the forecast period.
SOEs
Table 2.11 – Components of SOE net worth
| | Year ended 30 June | |
($ billion) | | 2004
Actual | | 2005
Forecast | | 2006
Forecast | | 2007
Forecast | | 2008
Forecast | | 2009
Forecast | |
Total assets | | 15.3 | | 17.9 | | 20.4 | | 22.1 | | 22.9 | | 23.9 | |
Total liabilities | | 8.3 | | 9.4 | | 11.3 | | 12.4 | | 12.7 | | 13.1 | |
| | | | | | | | | | | | | |
Net worth | | 7.0 | | 8.5 | | 9.1 | | 9.7 | | 10.2 | | 10.8 | |
Source: The Treasury
SOE assets are forecast to increase by around $8.6 billion by 2008/09.
Similar to the core Crown, the expansion in assets will be driven by the use of retained surpluses. In addition, a portion of this growth has been funded by raising debt (which is net worth neutral). The majority of the growth will come from:
• physical assets, which are forecast to increase by around $5.8 billion, reflecting the expansion of assets in line with individual entities’ asset strategies. Figure 2.17 provides a breakdown of physical assets held by SOEs
• financial assets are forecast to increase by $2.4 billion, showing the expected growth in Kiwi Bank. This growth is net worth neutral, as borrowings also increase by a similar level.
Figure 2.16 – SOE asset growth
Source: The Treasury
Figure 2.17 – State-owned enterprises’ physical assets
Source: The Treasury
Crown Entities
Table 2.12 – Components of Crown entities’ net worth
| | Year ended 30 June | |
($ billion) | | 2004
Actual | | 2005
Forecast | | 2006
Forecast | | 2007
Forecast | | 2008
Forecast | | 2009
Forecast | |
Total assets | | 49.0 | | 51.0 | | 53.2 | | 55.3 | | 57.6 | | 59.6 | |
Total liabilities | | 17.3 | | 19.6 | | 20.3 | | 21.1 | | 22.1 | | 22.9 | |
| | | | | | | | | | | | | |
Net worth | | 31.7 | | 31.4 | | 32.9 | | 34.2 | | 35.5 | | 36.7 | |
Source: The Treasury
Crown entities’ assets are forecast to increase by around $10.6 billion by the end of the forecast horizon. The growth in assets is largely driven by physical assets and financial assets.
Figure 2.18 – Crown entity asset growth
Source: The Treasury
Physical assets are forecast to increase by around $3.9 billion. This growth is largely in the health, housing and transport sectors. These sectors make up the majority of the physical assets held by Crown entities. The primary source of funding for the asset expansion in these sectors will come from core Crown departments.
Figure 2.19 – Crown entities’ physical assets broken down by major sectors
Source: The Treasury
Financial assets are forecast to increase by around $6 billion due to growth in the ACC and EQC investment portfolios, resulting from the investment of these entities’ expected retained surpluses. These portfolios are expected to grow over time, reflecting the fact that:
• ACC is building an asset portfolio to match the outstanding claims liability associated with past claims, which is expected to be $11.2 billion in the current year, rising to around $13.6 billion by 2008/09. ACC’s aim is to have the residual claims fully funded by 2014
• EQC is New Zealand’s primary provider of seismic disaster insurance to residential property. To help meet future claims in case of a natural disaster, EQC is building up its financial asset portfolio.
Figure 2.20 – Crown entities’ financial assets broken down by major portfolios
Source: The Treasury
OBERAC and operating balance
Compared with the December Update:
• the OBERAC is forecast to be higher in the current year, largely due to increased tax revenue and delays in spending (of which some have been transferred into 2005/06)
• the OBERAC is forecast to be similar over the rest of the forecast period apart for in 2007/08, where it is forecast to be lower than at the December Update. This is largely due to the impact on tax revenue of aligning provisional and GST due dates.
Figure 2.21 – OBERAC comparison

Source: The Treasury
The difference between the OBERAC and the operating balance of around $1.6 billion for the year ended 30 June 2005 is largely due to the removal of the net GSF valuation movement ($426 million) and ACC valuation ($1,202 million).
Table 2.13 – OBERAC reconciliation (explains changes to the OBERAC since the December Update)
($ million) | | 2005
Forecast | | 2006
Forecast | | 2007
Forecast | | 2008
Forecast | | 2009
Forecast | |
OBERAC 2004 December Update | | 6,467 | | 6,201 | | 5,334 | | 4,923 | | 5,428 | |
Changes (revenue) | | | | | | | | | | | |
Tax revenue (forecasting) | | 307 | | 679 | | 316 | | 241 | | 142 | |
Tax revenue (policy) | | — | | (211 | ) | (211 | ) | (871 | ) | (348 | ) |
Other sovereign revenue | | 17 | | 57 | | 66 | | 89 | | 110 | |
Investment income | | (36 | ) | (84 | ) | (171 | ) | (232 | ) | (247 | ) |
Other revenue | | 53 | | 38 | | 14 | | 16 | | 20 | |
Other changes to SOEs and Crown entities (excluding ACC valuation change) | | 95 | | 138 | | 80 | | (13 | ) | (43 | ) |
Total revenue changes | | 436 | | 617 | | 94 | | (770 | ) | (366 | ) |
| | | | | | | | | | | |
Changes (core Crown expenses excluding GSF 2004/05 valuation) | | | | | | | | | | | |
Changes to future new operating spending | | 430 | | 1,218 | | 1,460 | | 1,818 | | 2,129 | |
Welfare benefit forecast changes | | 68 | | 131 | | 178 | | 228 | | 279 | |
Social security and welfare (excluding welfare forecast changes) | | (113 | ) | (79 | ) | (83 | ) | (167 | ) | (175 | ) |
Education | | 164 | | (136 | ) | (237 | ) | (225 | ) | (226 | ) |
Health | | 4 | | (336 | ) | (324 | ) | (375 | ) | (417 | ) |
Other core Crown functional expenses | | (41 | ) | (991 | ) | (1,259 | ) | (1,685 | ) | (1,582 | ) |
Finance costs | | 30 | | 40 | | 167 | | 147 | | 205 | |
Total core Crown expenses changes | | 542 | | (153 | ) | (98 | ) | (259 | ) | 213 | |
| | | | | | | | | | | |
Total Changes | | 978 | | 464 | | (4 | ) | (1,029 | ) | (153 | ) |
OBERAC 2005 Budget Update | | 7,445 | | 6,665 | | 5,330 | | 3,894 | | 5,275 | |
Source: The Treasury
The change in tax revenue since the December Update comprises a mixture of forecast and policy changes:
• forecasting changes have increased tax revenue between $100 million and $700 million over the forecast period. The majority of this increase comes through the corporate tax forecasts, which are currently running about 4% above the December Update. It is expected that much of this strength will persist through the forecast period, tempered somewhat by corporate profit growth being slightly lower than expected at the December Update
• policy changes since the December Update are outlined in Table 2.5.
The initial decrease in core Crown expenses reflects expense delays. Over the rest of the forecast period, expenses are broadly consistent with the December Update. Expense changes include:
• lower welfare forecast changes over the forecast period, primarily due to lower benefit recipient levels. This is especially the case with unemployment levels, which are lower than the December Update, reflecting stronger than forecast employment growth. In addition, the level of recipients of a number of other benefit types (eg, Domestic Purposes Benefit and Accommodation Supplement) is forecast to be lower than the December Update, reflecting demographic changes due to population projections
• changes in other core Crown functional expenses (education, health and other core Crown functional expenses in Table 2.13), which mainly represent the allocation of new spending in the 2005 Budget package. At the time of the December Update, this new spending was disclosed as an allowance for future operating spending (which has decreased as illustrated by Table 2.13).
Debt indicators
Gross sovereign-issued debt by the end of the forecast period is expected to be higher from that forecast in the December Update. This is mainly due to the higher starting position of borrowings held by the Reserve Bank based on a March position (net debt neutral as the value of financial assets have a corresponding increase).
Figure 2.22 – Gross sovereign-issued debt comparison

Source: The Treasury
The increased asset position from 2004/05 has been utilised over the rest of the forecast period to absorb additional spending from that expected in the December Update. This means over the forecast period on an accumulative basis there is minimal change to the bond programme since the December Update.
Net debt by the end of the forecast period is similar to what was forecast in the December Update. The reason that the net debt trend doesn’t follow the same trend as gross debt is that the higher starting position of borrowings is net debt neutral.
Table 2.14 – 2005 Budget Update fiscal indicators
| | Year ended 30 June | |
Fiscal Indicators
($ million) | | 2004
Actual | | 2005
Forecast | | 2006
Forecast | | 2007
Forecast | | 2008
Forecast | | 2009
Forecast | |
Revenue | | | | | | | | | | | | | |
Total revenue | | 60,387 | | 65,265 | | 68,770 | | 71,238 | | 73,856 | | 78,156 | |
Core Crown revenue | | 46,932 | | 51,145 | | 53,297 | | 55,008 | | 57,056 | | 60,792 | |
Tax revenue | | 42,532 | | 45,976 | | 48,102 | | 49,445 | | 51,091 | | 54,343 | |
| | | | | | | | | | | | | |
Expenses | | | | | | | | | | | | | |
Total expenses | | 53,057 | | 59,513 | | 62,244 | | 66,047 | | 70,101 | | 73,020 | |
Core Crown expenses | | 41,608 | | 45,327 | | 48,245 | | 51,323 | | 54,780 | | 57,210 | |
| | | | | | | | | | | | | |
Operating balance - Core Crown | | 5,324 | | 5,818 | | 5,052 | | 3,685 | | 2,276 | | 3,582 | |
Operating balance - Crown entities | | 1,709 | | (420 | ) | 1,064 | | 1,089 | | 1,092 | | 1,166 | |
Operating balance - SOEs | | 672 | | 931 | | 873 | | 915 | | 933 | | 997 | |
Dividend elimination | | (281 | ) | (438 | ) | (324 | ) | (359 | ) | (407 | ) | (470 | ) |
Operating balance | | 7,424 | | 5,891 | | 6,665 | | 5,330 | | 3,894 | | 5,275 | |
| | | | | | | | | | | | | |
OBERAC | | 6,629 | | 7,445 | | 6,665 | | 5,330 | | 3,894 | | 5,275 | |
OBERAC (excluding net NZS Fund asset returns) | | 6,436 | | 7,034 | | 6,198 | | 4,691 | | 3,066 | | 4,233 | |
| | | | | | | | | | | | | |
Cash available/(shortfall to be funded) | | 520 | | 2,413 | | 30 | | (1,606 | ) | (2,776 | ) | (1,391 | ) |
| | | | | | | | | | | | | |
Debt Indicators | | | | | | | | | | | | | |
Gross sovereign-issued debt | | 35,527 | | 34,111 | | 33,284 | | 32,583 | | 34,629 | | 35,925 | |
Total gross Crown debt | | 36,825 | | 35,695 | | 36,155 | | 35,395 | | 37,002 | | 37,836 | |
Net core Crown debt | | 15,204 | | 11,533 | | 10,257 | | 10,640 | | 12,527 | | 13,439 | |
Net core Crown debt with NZS Fund assets | | 11,248 | | 5,059 | | 979 | | (1,652 | ) | (3,126 | ) | (6,000 | ) |
Net worth | | 35,463 | | 41,972 | | 48,637 | | 53,967 | | 57,861 | | 63,136 | |
Domestic bond programme | | 2,212 | | 2,150 | | 2,200 | | 2,800 | | 2,800 | | 2,800 | |
| | | | | | | | | | | | | |
Nominal GDP | | 140,512 | | 150,714 | | 156,065 | | 161,582 | | 169,470 | | 178,172 | |
| | | | | | | | | | | | | |
Fiscal Indicators as a % of GDP | | | | | | | | | | | | | |
Revenue | | | | | | | | | | | | | |
Total Crown revenue | | 43.0 | | 43.3 | | 44.1 | | 44.1 | | 43.6 | | 43.9 | |
Core Crown revenue | | 33.4 | | 33.9 | | 34.2 | | 34.0 | | 33.7 | | 34.1 | |
Tax revenue | | 30.3 | | 30.5 | | 30.8 | | 30.6 | | 30.1 | | 30.5 | |
| | | | | | | | | | | | | |
Expenses | | | | | | | | | | | | | |
Total Crown expenses | | 37.8 | | 39.5 | | 39.9 | | 40.9 | | 41.4 | | 41.0 | |
Core Crown expenses | | 29.6 | | 30.1 | | 30.9 | | 31.8 | | 32.3 | | 32.1 | |
| | | | | | | | | | | | | |
Operating balance | | 5.3 | | 3.9 | | 4.3 | | 3.3 | | 2.3 | | 3.0 | |
OBERAC | | 4.7 | | 4.9 | | 4.3 | | 3.3 | | 2.3 | | 3.0 | |
OBERAC (excluding net NZS Fund asset returns) | | 4.6 | | 4.7 | | 4.0 | | 2.9 | | 1.8 | | 2.4 | |
| | | | | | | | | | | | | |
Debt Indicators | | | | | | | | | | | | | |
Gross sovereign-issued debt | | 25.3 | | 22.6 | | 21.3 | | 20.2 | | 20.4 | | 20.2 | |
Total gross Crown debt | | 26.2 | | 23.7 | | 23.2 | | 21.9 | | 21.8 | | 21.2 | |
| | | | | | | | | | | | | |
Net core Crown debt | | 10.8 | | 7.7 | | 6.6 | | 6.6 | | 7.4 | | 7.5 | |
Net core Crown debt with NZS Fund assets | | 8.0 | | 3.4 | | 0.6 | | (1.0 | ) | (1.8 | ) | (3.4 | ) |
| | | | | | | | | | | | | |
Net worth | | 25.2 | | 27.8 | | 31.2 | | 33.4 | | 34.1 | | 35.4 | |
| | | | | | | | | | | | | |
New Zealand Superannuation Fund | | | | | | | | | | | | | |
Fund asset returns (after tax) | | 193 | | 411 | | 467 | | 639 | | 828 | | 1,042 | |
Fund contributions | | 1,879 | | 2,107 | | 2,337 | | 2,375 | | 2,533 | | 2,744 | |
Fund assets (year end) | | 3,956 | | 6,474 | | 9,278 | | 12,292 | | 15,653 | | 19,439 | |
% of GDP | | 2.8 | | 4.3 | | 5.9 | | 7.6 | | 9.2 | | 10.9 | |
Source: The Treasury
Table 2.15 – 2004 December Update fiscal indicators
| | Year ended 30 June | |
Fiscal Indicators
($ million) | | 2004
Actual | | 2005
Forecast | | 2006
Forecast | | 2007
Forecast | | 2008
Forecast | | 2009
Forecast | |
Revenue | | | | | | | | | | | | | |
Total revenue | | 60,387 | | 64,643 | | 68,071 | | 71,020 | | 74,406 | | 78,305 | |
Core Crown revenue | | 46,932 | | 50,581 | | 52,818 | | 54,983 | | 57,812 | | 61,116 | |
Tax revenue | | 42,532 | | 45,669 | | 47,634 | | 49,340 | | 51,721 | | 54,549 | |
| | | | | | | | | | | | | |
Expenses | | | | | | | | | | | | | |
Total expenses | | 53,057 | | 59,155 | | 62,009 | | 65,825 | | 69,622 | | 73,016 | |
Core Crown expenses | | 41,608 | | 45,751 | | 48,092 | | 51,225 | | 54,521 | | 57,423 | |
| | | | | | | | | | | | | |
Operating balance - Core Crown | | 5,324 | | 4,830 | | 4,726 | | 3,758 | | 3,291 | | 3,693 | |
Operating balance - Crown entities | | 1,709 | | 448 | | 897 | | 1,021 | | 1,070 | | 1,177 | |
Operating balance - SOEs | | 672 | | 785 | | 900 | | 929 | | 955 | | 1,014 | |
Dividend elimination | | (281 | ) | (436 | ) | (322 | ) | (374 | ) | (393 | ) | (456 | ) |
Total operating balance | | 7,424 | | 5,627 | | 6,201 | | 5,334 | | 4,923 | | 5,428 | |
| | | | | | | | | | | | | |
OBERAC | | 6,629 | | 6,467 | | 6,201 | | 5,334 | | 4,923 | | 5,428 | |
OBERAC (excluding net NZS Fund asset returns) | | 6,436 | | 6,184 | | 5,699 | | 4,648 | | 4,035 | | 4,317 | |
| | | | | | | | | | | | | |
Cash available/(shortfall to be funded) | | 520 | | 1,436 | | (705 | ) | (1,555 | ) | (1,415 | ) | (972 | ) |
| | | | | | | | | | | | | |
Debt Indicators | | | | | | | | | | | | | |
Gross sovereign-issued debt | | 35,527 | | 33,846 | | 33,409 | | 32,905 | | 34,056 | | 34,931 | |
Total gross Crown debt | | 36,825 | | 36,093 | | 36,648 | | 36,241 | | 36,857 | | 36,780 | |
Net core Crown debt | | 15,204 | | 13,065 | | 12,461 | | 12,612 | | 12,873 | | 13,215 | |
| | | | | | | | | | | | | |
Net core Crown debt with NZS Fund assets | | 11,248 | | 6,719 | | 3,406 | | 658 | | (2,312 | ) | (5,609 | ) |
| | | | | | | | | | | | | |
Net worth | | 35,463 | | 41,109 | | 47,310 | | 52,644 | | 57,567 | | 62,995 | |
| | | | | | | | | | | | | |
Domestic bond programme | | 2,212 | | 2,052 | | 2,473 | | 2,754 | | 1,750 | | 3,367 | |
| | | | | | | | | | | | | |
Nominal GDP | | 140,336 | | 150,400 | | 155,871 | | 161,625 | | 169,487 | | 178,029 | |
| | | | | | | | | | | | | |
Fiscal Indicators as a % of GDP | | | | | | | | | | | | | |
Revenue | | | | | | | | | | | | | |
Total Crown revenue | | 43.0 | | 43.0 | | 43.7 | | 43.9 | | 43.9 | | 44.0 | |
Core Crown revenue | | 33.4 | | 33.6 | | 33.9 | | 34.0 | | 34.1 | | 34.3 | |
Tax revenue | | 30.3 | | 30.4 | | 30.6 | | 30.5 | | 30.5 | | 30.6 | |
| | | | | | | | | | | | | |
Expenses | | | | | | | | | | | | | |
Total Crown expenses | | 37.8 | | 39.3 | | 39.8 | | 40.7 | | 41.1 | | 41.0 | |
Core Crown expenses | | 29.6 | | 30.4 | | 30.9 | | 31.7 | | 32.2 | | 32.3 | |
| | | | | | | | | | | | | |
Operating balance | | 5.3 | | 3.7 | | 4.0 | | 3.3 | | 2.9 | | 3.0 | |
OBERAC | | 4.7 | | 4.3 | | 4.0 | | 3.3 | | 2.9 | | 3.0 | |
OBERAC (excluding net NZS Fund asset returns) | | 4.6 | | 4.1 | | 3.7 | | 2.9 | | 2.4 | | 2.4 | |
| | | | | | | | | | | | | |
Debt Indicators | | | | | | | | | | | | | |
Gross sovereign-issued debt | | 25.3 | | 22.5 | | 21.4 | | 20.4 | | 20.1 | | 19.6 | |
Total gross Crown debt | | 26.2 | | 24.0 | | 23.5 | | 22.4 | | 21.7 | | 20.7 | |
| | | | | | | | | | | | | |
Net core Crown debt | | 10.8 | | 8.7 | | 8.0 | | 7.8 | | 7.6 | | 7.4 | |
Net core Crown debt with NZS Fund assets | | 8.0 | | 4.5 | | 2.2 | | 0.4 | | (1.4 | ) | (3.2 | ) |
| | | | | | | | | | | | | |
Net worth | | 25.3 | | 27.3 | | 30.4 | | 32.6 | | 34.0 | | 35.4 | |
| | | | | | | | | | | | | |
New Zealand Superannuation Fund | | | | | | | | | | | | | |
Fund asset returns (after tax) | | 193 | | 283 | | 502 | | 686 | | 888 | | 1,111 | |
Fund contributions | | 1,879 | | 2,107 | | 2,207 | | 2,213 | | 2,343 | | 2,528 | |
Fund assets (year end) | | 3,956 | | 6,346 | | 9,055 | | 11,954 | | 15,185 | | 18,824 | |
% of GDP | | 2.8 | | 4.2 | | 5.8 | | 7.4 | | 9.0 | | 10.6 | |
Source: The Treasury
Why does the Government run an operating surplus? Why is it not “available” for more spending or tax cuts?
The answer to these questions is the Government’s fiscal strategy. The Public Finance Act requires the Government to act in accordance with the principles of responsible fiscal management.
As outlined earlier in the chapter the Government’s fiscal strategy is to strengthen public finances to prepare for future costs associated with an ageing population.
To progress towards the Government’s fiscal strategy the Government needs to run operating surpluses to help to save for future demographic changes (such as contributions to the NZS Fund) and to assist in the financing of the Government’s capital programme.
The cash generated from the operating balance is not always sufficient to meet all the Government’s operating and investing decisions. So the Government still needs to borrow some money in many years to fund the shortfall between the forecast operating surplus and the capital programme (which is often larger than the surplus).
The following graph shows how the operating surplus (or OBERAC) is used in each year over the forecast horizon, and therefore why nominal debt has to increase even when there is a “surplus”.
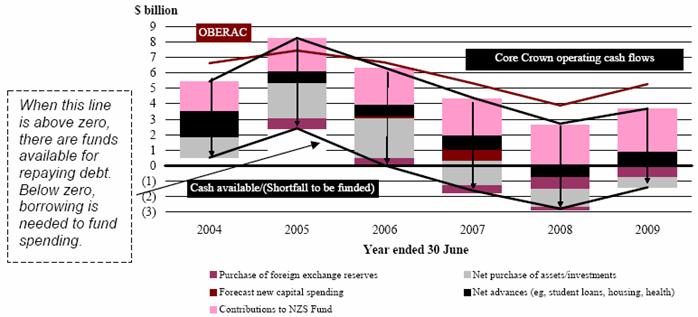
Source: The Treasury
The following table explains how the operating surplus/OBERAC is calculated for the 2004/05 and the 2005/06 financial years and then how it is applied. Any extra spending or reduced tax revenue would add to the bottom-line cash shortfall (and add to the need to borrow).
$ million | | 2004/05 | | 2005/06 | | Description of Items |
| | 51,145 | | 53,297 | | Core Crown revenues – these are the revenues the Government collects. They are mainly taxes. |
| | | | | | |
| | (45,327 | ) | (48,245 | ) | Core Crown expenses – these represent most of the Government’s spending, BUT not all of it. They are the day-to-day spending (salaries, benefit payments, etc) that does not create government assets. |
| | | | | | |
| | 73 | | 1,613 | | Net surplus of SOEs and Crown entities – this is the net surplus (after dividends) that SOEs and Crown entities make. |
| | | | | | |
Operating balance | | 5,891 | | 6,665 | | Operating balance – the residual of revenues less expenses plus surpluses from SOEs and Crown entities. It is the Government’s operating profit or loss. |
| | | | | | |
| | 1,554 | | — | | OBERAC adjustments – removal of revaluation movements. |
OBERAC | | 7,445 | | 6,665 | | OBERAC – the residual from revenues and expenses less removal of large valuation movements (the OBERAC and operating balance are the same in forecast years). |
| | | | | | |
Less | | 806 | | (341 | ) | Retained items and non-cash items – items such as the net surplus of SOEs/Crown entities and the net investment returns of the NZS Fund are retained by these entities. The surpluses generated (unless withdrawn from the entities) cannot be used for other purposes so do not aid in funding other government spending. Depreciation expense is also removed as it is non-cash (it is captured in the actual purchase of assets below). Additionally, the actual working capital movements, such as payment of creditors, impact on the level of net cash flows from operations. |
| | | | | | |
Equals surplus cash flows | | 8,251 | | 6,324 | | Cash from operations – these are the cash flows from core Crown operations (excluding the NZS Fund). This is the cash equivalent of the operating surplus and is available to assist in funding capital spending. |
| | | | | | |
Less capital spending | | (2,107 | ) | (2,337 | ) | Contributions to the NZS Fund – the Government’s annual contribution to the NZS Fund to build up assets to contribute to future NZS payments. |
| | | | | | |
| | (1,693 | ) | (2,128 | ) | Purchase of assets – departments buy assets including computer equipment, new buildings and defence equipment. |
| | | | | | |
| | (742 | ) | (781 | ) | Loans to others (advances) – these are mainly student loans (the Government is committed to help students access tertiary education by funding student loans). |
| | | | | | |
| | (596 | ) | (448 | ) | Net capital injections – investments in Crown entities to enable them to build hospitals and housing. |
| | | | | | |
| | (700 | ) | (500 | ) | Reserve Bank reserves – purchase of extra reserves to assist the Reserve Bank to maintain financial stability. |
| | | | | | |
| | — | | (100 | ) | Capital forecast – an amount set aside for further capital activity. The Government has not yet decided on the specific initiatives. |
| | | | | | |
What is left | | 2,413 | | 30 | | Cash available/(shortfall) – this amount needs to be funded if it is a shortfall. Funding is provided by selling surplus financial assets (because of surplus cash from prior years) or borrowing more. |
Risks to fiscal forecasts
The fiscal forecasts were finalised on 9 May 2005 in accordance with the forecast accounting policies. There are certain risks around the forecast results. To assist in evaluating such risks the following chapters should be read in conjunction with the fiscal forecasts:
• Risks and Scenarios (Chapter 3) – The fiscal forecasts are based on the economic forecasts presented in Chapter 1 and any variation from the economic forecast will affect the fiscal forecasts, in particular tax revenue and benefit expenses. The Risks and Scenarios chapter discusses the effect on the forecasts under different circumstances.
• Specific Fiscal Risks (Chapter 4) – The fiscal forecasts incorporate government decisions up to 9 May 2005. The Specific Fiscal Risks chapter covers specific policy decisions that are under active consideration by the Government at the time of the finalisation of the forecasts.
In addition to the specific fiscal risks and the link to the economic forecasts, there are a number of forecasting issues explained below that may arise in future.
Tax forecasting risks
The tax forecasts prepared for this Budget Update are based on current tax policy and on the macroeconomic central forecast. Sensitivities of tax revenue to changes in economic conditions are presented in the Risks and Scenarios chapter on page 96.
SOEs and Crown entities’ forecasts
The forecasts for large SOEs and Crown entities were provided in March 2005 based on their best assessments at that time.
Revaluation of property, plant and equipment
Crown accounting policy is to revalue certain classes of property, plant and equipment on a regular basis. In certain circumstances the valuation will be affected by foreign exchange rates, so any appreciation in the New Zealand dollar (from 30 June 2004) will adversely affect the current physical asset values included in the fiscal forecasts. In addition from the current year the accounting policy for the valuation of electricity generation assets has changed, the impact of this change is outlined in the GAAP tables on page 120.
Discount rates
The GSF and ACC liabilities included in these forecasts have been valued as at 28 February and 31 March respectively. The liabilities are to be next valued at 30 June 2005 for inclusion in the year-end financial statements. Any change in discount rates will affect the presented fiscal forecast. For example, if the discount rate rises, the value of the liabilities will decrease.
International financial reporting standards
The New Zealand Accounting Standards Review Board announced in December 2002 that International Financial Reporting Standards (IFRSs) will apply to financial reporting by both public and private sector entities from 1 January 2007, but with entities having the option to adopt from 1 January 2005.
The Crown plans to adopt the New Zealand IFRSs in the 2007 Budget.
Tertiary education institutes’ (TEIs’) accounting treatment
The forecast information presented in the 2005 Budget Update combined TEIs on an equity accounting basis. As noted in previous publications the combination treatment of TEIs remains unresolved.
The combination method adopted in these forecasts is to equity account for the TEIs’ net surpluses and net investment and not the TEI revenues, expenses, assets and liabilities on a line-by-line method. This is consistent with the treatment adopted in the 2004 Crown financial statements.
The key indicators are unchanged as a result of the combination approach for TEIs (refer page 56 of the 30 June 2004 Crown financial statements).
Foreshore and seabed recognition
The Foreshore and Seabed Act 2004 vests in the Crown the full legal and beneficial ownership of the public foreshore and seabed. Whether the public foreshore and seabed, or parts thereof, meet the requirements for asset recognition for the purposes of reporting in the Crown financial statements and fiscal forecasts is currently being considered. Any recognition of the public foreshore and seabed for reporting purposes would increase the value of physical assets and net worth included in the fiscal forecasts but is excluded from the calculation of the OBERAC.
3
Risks and Scenarios
• The Budget Update forecasts reflect a number of judgements about how different factors that may affect the economy will evolve. If actual events evolve differently from these judgements, the economy could take an alternative path to our central forecast with consequent impacts on the fiscal outlook.
Figure 3.1 — Real GDP

Source: The Treasury
• The central forecast presented in the Economic Outlook chapter shows an economy that is expected to slow over the course of the March 2006 year. The speed and magnitude of the slowdown are dependent on how different factors evolve. The aim of this chapter is to discuss risks around this outlook and investigate what is likely to happen to economic and fiscal outcomes if several of the factors evolve differently.
• Although we believe the central forecast presented in the Economic Outlook Chapter is the most likely outcome, we consider that the magnitudes and probabilities of the upside and downside risks are asymmetric. The two scenarios presented in the second part of this chapter are just two of a number of possible outcomes and therefore do not fully illustrate this asymmetry of the risks.
• As New Zealand is a small, open economy with a large export sector, the future exchange rate path is one of the key judgements associated with the forecast. The scenario of a faster depreciation in the exchange rate examines the direct impact this
has on the external sector and consequent flow through to the domestic sector. This scenario results in higher real and nominal GDP for most of the forecast period.
• The performance of the global economy is an important driver of New Zealand’s external sector, influencing both volume and price growth of our exports. The future path of our trading partners’ growth and its effect on exports has been a key judgement in forming the central forecast. The second scenario is based on a weaker-than-expected world economy and its subsequent influence on New Zealand’s export growth. The scenario shows the weaker export sector performance having a detrimental impact on both real and nominal GDP for the length of the forecast period.
The central forecast reflects the balancing of the upside and downside risks facing the economy to arrive at our best assessment of the way the economy is likely to develop. This requires a number of key judgements to be made about how the various forces affecting the economy will evolve. Some of these judgements are about cyclical drivers of activity and some are about the structural characteristics of the economy. If actual events differ from these judgements, the economy may deviate from our central forecast.
Although we believe the central forecast to be the most likely outcome, it is our judgement that the magnitudes and probabilities of the upside and downside risks are asymmetric. Some of the downside risks, while of low probability, would have a greater impact on the economy than the upside risks, if they were to eventuate. The scenarios presented in the second part of this chapter are just two of a number of possible scenarios and do not necessarily represent the possible degree of asymmetry of risks.
A number of the potential risks are domestically orientated
As with previous forecasts, there is a judgement that the continued accumulation of debt by households will impinge on future private consumption growth by acting as a constraint on spending. The ratio of debt to household income is currently at record high levels. Despite slowing consumption growth, this ratio is expected to increase further over the forecast period. There is some uncertainty surrounding the extent to which the debt constraint will act as a brake on spending (if at all) as well as the effect of higher debt servicing costs.
If households’ spending decisions are less influenced by their growing debt levels than is incorporated in the central forecast, there is likely to be upside risk to private consumption and residential investment. Conversely, if a sizeable attempt by households at debt consolidation occurred, this would pose downside risk to the central forecast. On that note, there are uncertainties surrounding the housing market. Although a slowdown was evident over the 2004 calendar year, and further slowing is built into the central forecasts, a small, albeit gradual, recovery in building consents occurred at the end of 2004 and the beginning of 2005. There is uncertainty as to whether this recovery will continue and flow through to stronger residential investment.
As mentioned in the Economic Outlook chapter, the strong labour market performance has been a key feature of this economic expansion. For the 12 months to December 2004, employment grew 4.4%. Meeting this boost in demand has been an increase in the participation rate and a decrease in the unemployment rate to record levels (since 1986). There is a risk to the central forecast that this strong employment growth continues for
longer than expected. If employment growth were to continue – amplifying difficulties in finding labour – wage pressures may be stronger than expected. This would have flow-on impacts for household spending through higher incomes and increased confidence and potentially increased inflationary pressure, or alternatively it would provide more room for debt consolidation.
New Zealand’s significant current account deficit is one factor that could have a large impact on the economy. Over the forecast period, the current account deficit is expected to increase before diminishing slightly in the last few periods of the central forecast despite remaining over 6% of GDP. While strong domestic demand for imports has been one of the drivers of the recent growth in the deficit, it has also been strongly influenced by the expansion in the deficit on investment income.
The current account deficit is forecast to remain at around 6% towards the end of the forecast, a larger deficit than has been sustained in the past. There is a small probability of a considerable adjustment occurring, including a significant and rapid exchange rate depreciation. An example of this situation is described in more detail later in the chapter.
Given New Zealand’s dependence on the primary sector, the climate always remains an important determinant and therefore risk to the forecasts. The National Institute of Water and Atmosphere Research in its latest release, mentions that rainfall should be near normal over the majority of the country in the coming months except for the northern part of the North Island where it may be slightly above normal.
The international backdrop remains important
The development of the world economy is a major driver of activity for New Zealand through the impact on both the prices and volumes of exports and imports, and through interest rates and confidence. The Economic Outlook chapter summarised the Consensus forecasts for trading partner growth that underpin the central forecast and also discussed a number of points of weakness with the global economic outlook.
One of these was the sizeable US current account and fiscal deficits and the effect they may have on the global economy. There are uncertainties that relate to how and when the current account deficit will adjust through a response in the US dollar. If the US dollar were to weaken further, the New Zealand dollar might appreciate with a subsequent impact on New Zealand’s economic outlook. There would be a greater negative impact on export volumes and on the receipts of exporters than built into the central forecast.
Also mentioned was the concern around the performance of the Australian economy. Along with New Zealand, Australia is forecast to enter a period of slowing growth but there is uncertainty surrounding the depth of this slowdown. If it were worse than expected, this would pose downside risk to the central forecast in terms of weaker export growth.
The terms of trade are currently at a high level, with record high commodity prices recently recorded for some products such as dairy, beef and lamb. The level of the terms of trade has been one of the key drivers of the growth seen over the past couple of years. With some of the agricultural commodities experiencing these price levels due to temporary supply issues and strong world demand, export prices are forecast to fall over the first half of the forecast period as supply returns to normal and world growth weakens. Built into the central forecast is some ongoing strength in export prices, particularly dairy and meat prices, as these supply issues take longer to “correct” themselves. These supply issues include the weak Australian production as it recovers from drought, lower lamb production
in the UK after the foot and mouth outbreak, and the effect the BSE scare has had on Canadian and US beef exports.
If some of these supply conditions continue, world prices of these commodities may well hold up for longer, resulting in higher than expected incomes for agricultural producers. On the other hand, if supply were to return to normal faster than expected, for example if US beef were accepted back into Asia earlier than thought, or if world growth were to slow faster than thought, it would pose some downside risk to the central forecast.
Another factor that poses risk to the global outlook and the terms of trade is the recent volatility in oil prices. Over the 2004 calendar year, oil prices increased 33% (US$/barrel – Brent spot rate) and at the time of going to print, had increased another 27%. In real terms, the 2005 levels are the highest since the Gulf war in 1991. If prices were to continue to increase significantly, world growth would most likely be negatively affected. Conversely, if they were to fall from the current high levels, New Zealand’s terms of trade would most likely stay higher than forecast over the entire period.
To date, manufactured export volumes have shown little sign of a substantial impact from the exchange rate. It is uncertain whether this is due to the various hedging strategies that exist or just continued strong demand for New Zealand’s products overseas. It is likely to be a combination of both these factors. A key judgement in the central forecast is that the high exchange rate will start to influence both the demand and income received for our exports and subsequently lead to slower growth. There is also the possibility the exchange rate continues to have a minimal influence on export volumes, leading to higher export receipts and a smaller current account deficit.
The following scenarios present two possible growth paths for the economy when some of the key judgements underlying the central forecast are altered. In the first scenario labelled “rapid exchange rate depreciation”, stronger export growth is offset slightly by weaker private consumption growth and leads to an increase in real GDP growth in the short term. The second scenario, labelled “weaker export demand”, shows the impact on GDP growth if world growth were to evolve below expectations with a detrimental impact on export volumes. The scenarios are two of a large number of possible examples, and do not represent upper or lower bounds for the central forecast, with more extreme paths possible.
Table 3.1 – Alternative scenarios: summary
| | 2004
Actual | | 2005
Forecast | | 2006
Forecast | | 2007
Forecast | | 2008
Forecast | | 2009
Forecast | |
Production GDP (annual average % change, year ending 31 March) | | | | | | | | | | | | | |
Central forecast | | 3.6 | | 4.2 | | 2.3 | | 2.5 | | 3.5 | | 3.0 | |
Rapid exchange rate depreciation | | 3.6 | | 4.2 | | 2.6 | | 3.1 | | 2.9 | | 2.7 | |
Weaker export demand | | 3.6 | | 4.2 | | 1.7 | | 1.9 | | 3.9 | | 3.6 | |
Nominal Expenditure GDP (annual average % change, year ending 31 March) | | | | | | | | | | | | | |
Central forecast | | 6.3 | | 8.2 | | 4.3 | | 3.0 | | 4.8 | | 5.0 | |
Rapid exchange rate depreciation | | 6.3 | | 8.2 | | 4.6 | | 3.8 | | 4.7 | | 4.9 | |
Weaker export demand | | 6.3 | | 8.2 | | 3.7 | | 2.0 | | 4.3 | | 4.9 | |
OBERAC ($ billion, year ending June) | | | | | | | | | | | | | |
Central forecast | | 6.6 | | 7.4 | | 6.7 | | 5.3 | | 3.9 | | 5.3 | |
Rapid exchange rate depreciation | | 6.6 | | 7.5 | | 7.1 | | 5.8 | | 4.1 | | 5.5 | |
Weaker export demand | | 6.6 | | 7.5 | | 6.2 | | 4.7 | | 3.2 | | 4.7 | |
Sources: Statistics New Zealand, the Treasury
Rapid exchange rate depreciation
The central forecast assumes the exchange rate (TWI) remains at its current level before decreasing to a level consistent with the long-term average. The high level of the exchange rate in the central forecasts leads to weaker export growth, especially for manufacturing and services exports. However, this scenario looks at the situation where the exchange rate depreciates faster than in the central forecast and the resulting impact on the external sector as well as domestic demand. As an illustrative point, historically, when there are swings in the exchange rate, they can occur reasonably quickly.
Figure 3.2 – Trade weighted index
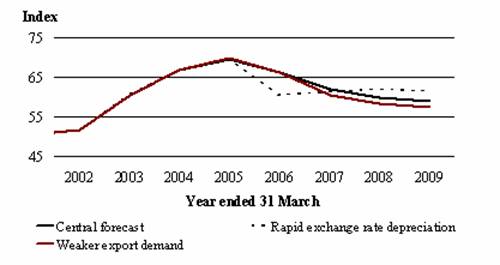
Source: The Treasury
Table 3.2 – Rapid exchange rate depreciation
(Annual average % change, year
ending 31 March) | | 2004
Actual | | 2005
Forecast | | 2006
Forecast | | 2007
Forecast | | 2008
Forecast | | 2009
Forecast | |
Private consumption | | 5.6 | | 5.3 | | 2.7 | | 1.7 | | 3.4 | | 3.1 | |
Residential investment | | 15.9 | | 0.7 | | -8.6 | | -5.7 | | -4.1 | | -2.3 | |
Business investment | | 14.3 | | 12.9 | | 4.6 | | 0.8 | | -0.6 | | 2.6 | |
Gross national expenditure | | 7.0 | | 7.1 | | 2.4 | | 1.6 | | 2.5 | | 3.0 | |
| | | | | | | | | | | | | |
Exports of goods and services | | 1.0 | | 4.5 | | 3.6 | | 5.1 | | 4.3 | | 3.2 | |
Imports of goods and services | | 11.9 | | 12.8 | | 3.5 | | 0.7 | | 3.3 | | 4.0 | |
| | | | | | | | | | | | | |
GDP (production measure) | | 3.6 | | 4.2 | | 2.6 | | 3.1 | | 2.9 | | 2.7 | |
| | | | | | | | | | | | | |
Employment growth | | 2.9 | | 3.6 | | 1.7 | | 1.5 | | 0.3 | | 0.0 | |
Unemployment rate(1) | | 4.3 | | 3.4 | | 3.2 | | 3.6 | | 4.7 | | 5.3 | |
90-day bank bill rate(2) | | 5.5 | | 6.9 | | 7.5 | | 6.9 | | 5.9 | | 5.3 | |
TWI(2) | | 66.9 | | 69.6 | | 60.4 | | 61.3 | | 61.9 | | 61.4 | |
CPI(3) | | 1.5 | | 2.8 | | 2.9 | | 3.2 | | 2.9 | | 2.2 | |
Current account balance (% GDP) | | -4.6 | | -6.6 | | -6.4 | | -5.7 | | -5.6 | | -5.6 | |
Nominal GDP (expenditure measure) | | 6.3 | | 8.2 | | 4.6 | | 3.8 | | 4.7 | | 4.9 | |
Sources: Statistics New Zealand, Reserve Bank of New Zealand, The Treasury
NOTES: | | (1) | | Percentage of labour force, March quarter, seasonally adjusted. |
| | | | |
| | (2) | | Average for March quarter. |
| | | | |
| | (3) | | Annual percentage change, March quarter. |
The New Zealand dollar is at an historically high level, reflecting in large part the high terms of trade. However, the present size of the current account deficit poses a risk that the exchange rate could fall more quickly than expected.
The depreciation in the exchange rate over the 2006 March year leads to stronger export growth for the majority of the forecast period relative to the central forecast as these products become more competitive overseas. Export growth reaches 5.1% in the March 2007 year before decreasing over the final two years as the exchange rate appreciates. With the depreciation of the exchange rate leading to stronger export volume growth and weaker imports, GDP growth is 2.6% for the year ended March 2006 (stronger than the central forecast, but still slowing). Growth continues to be higher than the central forecast for the 2007 March year before falling in the final two years of the forecast period relative to the central forecast.
Following on from the increase in export growth, both business investment and employment demand increase over the March 2006 and 2007 years relative to the central forecast. This has an impact on the unemployment rate, which decreases to 3.2% in the 2006 March year. With strong employment demand leading to tighter capacity constraints, and the exchange rate depreciation resulting in relatively higher import prices, increased inflationary pressures lead to a further tightening of monetary policy, with interest rates around 70 basis points higher than the central forecast by the end of March 2006. This interest rate hike has a lagged effect on both residential and business
investment as it becomes more expensive to borrow and also leads to the exchange rate appreciating in the 2007 and 2008 March years.
Although employment growth is higher than the central forecast, private consumption growth is lower for the 2006 and 2007 March years. This can mostly be attributed to higher interest rates over that period increasing debt servicing costs, plus the higher cost of imports. The stronger labour market has a lagged impact on private consumption and import growth, which both increase in the 2007 and 2008 March years relative to the central forecast.
The residual effect of this higher export growth and weaker import growth is that the current account deficit is smaller for the entire forecast period relative to the central forecast.
In this scenario, the level of real GDP at the end of the forecast period returns to the level in the central forecast. The price level shock is permanent, so nominal GDP is around $1.6 billion higher at the end of the forecast period. This results in a higher OBERAC.
Weaker export demand
This scenario illustrates a period where world growth slows more than expected. In this scenario, both real and nominal GDP are significantly lower than the central forecast.
Structural imbalances or higher oil prices could see a world economic outlook that is weaker than expected in the central forecast. The US is currently operating with significant fiscal and current account deficits. If a situation evolved where the deficits became unsustainable, there is a possibility of a disorderly adjustment occurring and a situation of weaker-than-expected growth. The situation in Australia, New Zealand’s major trading partner, also has the potential to lead to a weaker growth outlook. With the Australian economy likely to enter a period of slowing growth, if it were to be worse than expected this potentially would result in a period of weaker growth for the New Zealand economy.
The primary impact of a weaker world growth outlook is falling demand for New Zealand exports in the March 2006 and 2007 years. This leads to a drop in employment demand and a flow-on increase in the unemployment rate relative to the central forecast. The weaker labour market lowers incomes in general and consequently private consumption growth is lower over the entire forecast period. This reduces real GDP growth for the March 2006 year to 1.7%.
Figure 3.3 – Total exports
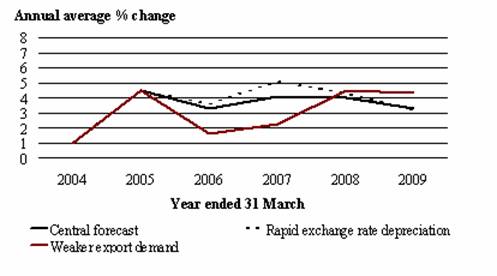
Source: The Treasury
Diminished demand results in lower inflationary pressures enabling monetary policy to ease relative to the central forecast. This leads to increases in both residential and business investment from the March 2007 year. Although investment is stronger, imports remain below the central forecast due to weak private consumption and higher prices due to the exchange rate depreciation.
With the reduced demand for New Zealand exports, the exchange rate is lower across the whole forecast period relative to the central forecast. This in turn provides some relief to exporters in the final two years of the forecast, although it is not enough to bring the current account deficit to a level above the central forecast. More specifically, the current account deficit continues to increase, reaching 7.8% of GDP in the year ended March 2007 before decreasing to 6.2% of GDP at the end of the forecast period.
Table 3.3 – Weaker export demand
(Annual average % change,
year ending 31 March) | | 2004
Actual | | 2005
Forecast | | 2006
Forecast | | 2007
Forecast | | 2008
Forecast | | 2009
Forecast | |
Private consumption | | 5.6 | | 5.3 | | 2.8 | | 2.0 | | 2.6 | | 2.1 | |
Residential investment | | 15.9 | | 0.7 | | -8.7 | | -4.0 | | 2.3 | | 2.8 | |
Business investment | | 14.3 | | 12.9 | | 4.2 | | 0.4 | | 2.7 | | 5.3 | |
Gross national expenditure | | 7.0 | | 7.1 | | 2.4 | | 1.8 | | 2.8 | | 2.9 | |
| | | | | | | | | | | | | |
Exports of goods and services | | 1.0 | | 4.5 | | 1.6 | | 2.3 | | 4.5 | | 4.3 | |
Imports of goods and services | | 11.9 | | 12.8 | | 4.0 | | 1.9 | | 1.8 | | 2.2 | |
| | | | | | | | | | | | | |
GDP (production measure) | | 3.6 | | 4.2 | | 1.7 | | 1.9 | | 3.9 | | 3.6 | |
| | | | | | | | | | | | | |
Employment growth | | 2.9 | | 3.6 | | 1.4 | | 0.0 | | 0.8 | | 1.1 | |
Unemployment rate(1) | | 4.3 | | 3.4 | | 4.0 | | 4.8 | | 4.8 | | 5.0 | |
90-day bank bill rate(2) | | 5.5 | | 6.9 | | 6.3 | | 4.9 | | 5.1 | | 5.5 | |
TWI(2) | | 66.9 | | 69.6 | | 66.1 | | 60.6 | | 58.2 | | 57.3 | |
CPI(3) | | 1.5 | | 2.8 | | 2.7 | | 1.9 | | 1.7 | | 1.6 | |
Current account balance (% GDP) | | -4.6 | | -6.6 | | -7.1 | | -7.8 | | -7.1 | | -6.2 | |
Nominal GDP (expenditure measure) | | 6.3 | | 8.2 | | 3.7 | | 2.0 | | 4.3 | | 4.9 | |
Sources: Statistics New Zealand, Reserve Bank of New Zealand, the Treasury
NOTES: | | (1) | | Percentage of labour force, March quarter, seasonally adjusted. |
| | | | |
| | (2) | | Average for March quarter. |
| | | | |
| | (3) | | Annual percentage change, March quarter. |
At the end of the forecast period, the gap between the level of real GDP for this scenario and the central forecast has almost closed, with the scenario around $350 million lower than the central forecast. The effect of the price level shock accumulates so that by the end of the forecast period, nominal GDP is approximately $3.8 billion lower than in the central forecast. This decreases the size of the OBERAC.
The fiscal position is strongly influenced by the economy. The major economic determinants, and how they impact on the fiscal position, are listed below. While each effect is expressed in terms of an increase, the opposite impact applies for a decrease.
• Nominal GDP – stronger GDP levels are reflected in a higher tax take, which increases the operating balance and lowers the Government’s debt.
• Interest rates – higher interest rates lead to increased debt financing costs. While interest-based revenue increases too, the negative effect of higher finance costs on the operating balance dominates, meaning debt increases.
• The level of unemployment – higher levels of unemployment translate to increased spending, because the numbers of unemployment beneficiaries rise. This decreases the operating balance and raises debt levels.
• CPI inflation – as most benefits are indexed to CPI movements, higher inflation results in increased benefit costs. This reduces the operating balance and increases debt.
Table 3.4 – Alternative scenarios: OBERAC and gross debt
Year ending 30 June | | 2004
Actual | | 2005
Forecast | | 2006
Forecast | | 2007
Forecast | | 2008
Forecast | | 2009
Forecast | |
OBERAC ($ billion) | | | | | | | | | | | | | |
Central forecast | | 6.6 | | 7.4 | | 6.7 | | 5.3 | | 3.9 | | 5.3 | |
Rapid exchange rate depreciation | | 6.6 | | 7.5 | | 7.1 | | 5.8 | | 4.1 | | 5.5 | |
Weaker export demand | | 6.6 | | 7.5 | | 6.2 | | 4.7 | | 3.2 | | 4.7 | |
| | | | | | | | | | | | | |
Gross sovereign-issued debt
($ billion) | | | | | | | | | | | | | |
Central forecast | | 35.5 | | 34.1 | | 33.3 | | 32.6 | | 34.6 | | 35.9 | |
Rapid exchange rate depreciation | | 35.5 | | 34.0 | | 32.7 | | 31.6 | | 33.4 | | 34.5 | |
Weaker export demand | | 35.5 | | 34.0 | | 33.7 | | 33.6 | | 36.4 | | 38.3 | |
| | | | | | | | | | | | | |
OBERAC (% GDP) | | | | | | | | | | | | | |
Central forecast | | 4.7 | | 4.9 | | 4.3 | | 3.3 | | 2.3 | | 3.0 | |
Rapid exchange rate depreciation | | 4.7 | | 5.0 | | 4.6 | | 3.6 | | 2.4 | | 3.1 | |
Weaker export demand | | 4.7 | | 5.0 | | 4.0 | | 3.0 | | 1.9 | | 2.7 | |
| | | | | | | | | | | | | |
Gross sovereign-issued debt (% GDP) | | | | | | | | | | | | | |
Central forecast | | 25.3 | | 22.6 | | 21.3 | | 20.2 | | 20.4 | | 20.2 | |
Rapid exchange rate depreciation | | 25.3 | | 22.6 | | 20.9 | | 19.3 | | 19.5 | | 19.2 | |
Weaker export demand | | 25.3 | | 22.6 | | 21.8 | | 21.1 | | 21.9 | | 21.9 | |
Sources: Statistics New Zealand, the Treasury
The “weaker export demand” scenario entails an economic downturn, relative to the central forecast, of greater magnitude than the economic gains seen in the “rapid exchange rate depreciation” scenario. As a consequence, the impacts on the key fiscal indicators are more marked under the “lower GDP” scenario.
Figure 3.4 – OBERAC
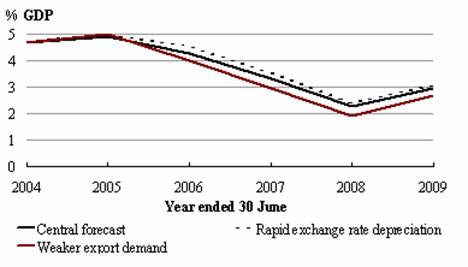
Source: The Treasury
In the “weaker export demand” scenario the OBERAC falls below the central forecast value by 2005/06 and the gap remains across the forecast period. Weaker GDP growth causes decreased tax revenue. While expenses also reduce over the forecast, mainly because lower inflation leads to a lesser degree of benefit indexation, it is not enough to offset the impact of decreased tax.
The opposite story applies for the “rapid exchange rate depreciation” scenario, although the magnitude of variation from the central forecast is not as great. Higher tax revenue than under the central forecast track occurs as a result of stronger GDP growth. Offsetting this to a growing degree across the forecast period are increased expenses, which occur largely in benefits via stronger inflation lifting the indexing of rates. As the inflationary gap with the central forecast opens up much more in the final three years of the forecast, the difference in the OBERAC between this scenario and the central one is considerably mitigated towards the end of the forecast period.
Figure 3.5 – Gross sovereign-issued debt
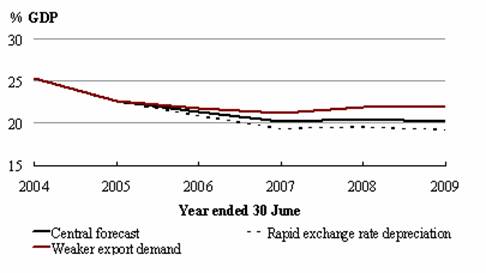
Source: The Treasury
Lower operating balances across the forecast track, under the “weaker export demand” scenario, cause higher borrowing in every year. The interest rate applied to debt is low enough, compared with the central scenario, to actually reduce debt financing costs across most of the forecast period. However, this only has a minor offsetting effect on the much greater negative impact on gross sovereign-issued debt (GSID) of lower operating balances.
For the “rapid exchange rate depreciation” scenario, higher operating balances across most of the forecast lead to reduced borrowing requirements in these years. Higher interest rates more or less negate the impact of a lower debt stock on debt financing
costs. As the increases in the OBERAC from the central forecast were not as large as the decreases were in the “weaker export demand” scenario, the decreases in GSID are also of a smaller magnitude than the rises seen in the other scenario.
The scenario above indicates the sensitivity of fiscal aggregates to changes in economic conditions. Table 3.5 provides some “rules of thumb” on the sensitivities of the fiscal position to changes in specific variables.
Table 3.5 – Fiscal sensitivity analysis
($ million) June years | | 2004/05
Forecast
Actual | | 2005/06
Forecast | | 2006/07
Forecast | | 2007/08
Forecast | | 2008/09
Forecast | |
1% Lower Nominal GDP Growth per Annum | | | | | | | | | | | |
Revenue | | (430 | ) | (905 | ) | (1,410 | ) | (1,965 | ) | (2,555 | ) |
Expenses (mainly debt servicing) | | 15 | | 55 | | 130 | | 225 | | 360 | |
Impact on the Operating Balance | | (445 | ) | (960 | ) | (1,540 | ) | (2,190 | ) | (2,915 | ) |
| | | | | | | | | | | |
Revenue Impact of a 1% Decrease in the Growth Rates of: | | | | | | | | | | | |
Wages and salaries | | | | (200 | ) | (420 | ) | (660 | ) | (910 | ) |
Taxable business profits | | | | (105 | ) | (235 | ) | (360 | ) | (520 | ) |
| | | | | | | | | | | |
One Percentage Point Lower Interest Rates | | | | | | | | | | | |
Interest income | | (5 | ) | (22 | ) | (33 | ) | (42 | ) | (49 | ) |
Expenses | | (25 | ) | (127 | ) | (173 | ) | (211 | ) | (227 | ) |
Impact on the Operating Balance | | 20 | | 105 | | 140 | | 169 | | 178 | |
| | | | | | | | | | | |
One Percentage Point Lower Real Interest Rates | | | | | | | | | | | |
ACC liability (SOE and Crown entity surpluses) | | (700 | ) | | | | | | | | |
GSF liability (expenses) | | (1,900 | ) | | | | | | | | |
Impact on the Operating Balance | | (2,600 | ) | | | | | | | | |
The forecasts of capital contributions for 2005/06 to 2008/09 are sensitive to the expected net after-tax annual return of the NZS Fund, which in turn depends on the expected gross rate of return assumed on the Fund’s assets:
Table 3.6 – New Zealand Superannuation Fund contributions sensitivity analysis
| | Marginal
Change | | Effect on Net
Return After Tax | | Effect on Capital Contribution ($ billion) | |
Variable | | (%age points) | | (%age points) | | 2005/06 | | 2006/07 | | 2007/08 | | 2008/09 | |
Expected gross rate of return | | -1 | % | -0.71 | % | +0.185 | | +0.200 | | +0.215 | | +0.230 | |
A +1% change in the gross rate of return would have symmetrical, negative effects on the required capital contribution track across these years.
4
Specific Fiscal Risks
This chapter describes the specific fiscal risks to the Crown, including contingent liabilities. PFA requires disclosure of all government decisions and other circumstances that may have a material effect on the fiscal and economic outlook.
Criteria for Disclosure of Specific Fiscal Risks
To ensure a practicable and consistent disclosure approach, fiscal risks are disclosed based on the following criteria, consistent with the principles of the PFA:
• Reasonable certainty criterion – risks have not been included in the fiscal forecasts because they reflect Government decisions or legislative commitments with uncertain fiscal consequences or timing.
• Materiality criterion – risks have an impact on the fiscal forecasts (operating balance, net worth or gross debt) of $10 million or more in any one forecast year.
• Active consideration criterion – risks are being actively considered by the Minister of Finance and responsible Ministers (ie, are the subject of written reports) or are decisions that have been deferred until a later date.
Exclusions from Disclosure
The PFA requires that all specific fiscal risks be disclosed, except where it is determined by the Minister of Finance that disclosing a risk is likely to:
• prejudice the substantial economic interests of New Zealand, or
• prejudice the security or defence of New Zealand or international relations of the Government, or
• compromise the Crown in a material way in negotiation, litigation or commercial activity, or
• result in a material loss of value to the Crown.
Specific fiscal risks do not include:
• normal forecasting risks, such as uncertainty around welfare benefits, SOE/Crown entity surpluses, the impact of regular revaluations of physical assets, finance costs, or fluctuations in external markets
• possible changes to the interpretation of accounting policies, such as the changes to revenue recognition rules and recognition of liabilities
• discussion documents containing proposals that the Minister of Finance and responsible Ministers will not actively consider until the consultation process has been completed.
In addition, the Minister of Finance has to determine that there is no reasonable or prudent way the Government can avoid this prejudice, compromise or material loss by making a decision on the fiscal risk before the finalisation of the forecasts, or by disclosing the fiscal risk without reference to its fiscal implications.
Contingent liabilities are also included according to materiality. Contingent liabilities below $10 million are included in the “other quantifiable contingent liabilities” total. Comparatives have been adjusted where appropriate to align with the disclosure of new “material” contingent liabilities. The total amount of contingent liabilities remains unchanged.
Information Relating to All Disclosed Risks
• The risks disclosed may not eventuate into Government policy and the final cost or saving may differ from the amount disclosed if the policy is developed.
• All risks, should they eventuate, would impact on the Government’s forecast operating and/or capital spending amounts. These are forecast spending amounts already incorporated into the forecasts to accommodate policy initiatives on which decisions have yet to be made. Most risks outlined in this chapter, if they eventuate, would be covered by these amounts and therefore have no impact on the forecasts. The risks have been disclosed to indicate the pressure the risks place upon the forecast spending amounts.
• If the total of all risks considered exceeds the forecast new operating spending amounts in the forecasts, this would impact on the operating balance.
• There are a number of other pressures on the fiscal position that have not been included as risks. These pressures comprise proposals largely generated within individual departments and not yet considered by the Minister of Finance and responsible Ministers. Such items are expected to be managed within forecast spending amounts noted above.
• All quantified risks are stated GST exclusive, in accordance with the amendments to the PFA. This differs from the December Update, where risks were GST inclusive.
As part of its Budget strategy, the Government has put in place some longer-term funding paths for particular sectors. This aids long-term planning and demonstrates the Government’s commitment to specific policies.
Charges against future Budgets do not meet the definition of a “risk” under the PFA, as these items are incorporated in the fiscal forecasts. This section is provided to increase transparency about the provisions for future Budgets.
Defence Sustainability Initiative
The Defence Sustainability Initiative (DSI) is designed to provide the New Zealand Defence Force (NZDF) with the funding required to address issues identified by the Defence Capability and Resourcing Review, including capability, and maintaining equipment and reserves. Budget 2005 includes $60 million per annum as the first tranche of the 10-year plan. The following table shows the additional tranches as charged against future Budgets.
Budget to be
Charged ($m) | | 06/07 | | 07/08 | | 08/09 | | 09/10 | | 10/11 | | 11/12 | | 12/13 | | 13/14 | | 14/15 | |
Budget 2006 | | 79.5 | | 72.8 | | 72.8 | | 72.8 | | 72.8 | | 72.8 | | 72.8 | | 72.8 | | 72.8 | |
Budget 2007 | | | | 58.0 | | 58.0 | | 58.0 | | 58.0 | | 58.0 | | 58.0 | | 58.0 | | 58.0 | |
Budget 2008 | | | | | | 69.1 | | 69.1 | | 69.1 | | 69.1 | | 69.1 | | 69.1 | | 69.1 | |
Budget 2009 | | | | | | | | 85.7 | | 85.7 | | 85.7 | | 85.7 | | 85.7 | | 85.7 | |
Budget 2010 | | | | | | | | | | 108.1 | | 108.1 | | 108.1 | | 108.1 | | 108.1 | |
Budget 2011 | | | | | | | | | | | | 66.9 | | 66.9 | | 66.9 | | 66.9 | |
Budget 2012 | | | | | | | | | | | | | | 14.2 | | 14.2 | | 14.2 | |
Budget 2013 | | | | | | | | | | | | | | | | 58.6 | | 54.2 | |
Budget 2014 | | | | | | | | | | | | | | | | | | 0 | |
Health Funding Package
In Budget 2005, the health sector has received $475 million per annum as the third tranche of the Health Funding Package (HFP). A fourth tranche of $489 million per annum is charged against Budget 2006.
Budget to be Charged
($million) | | 2006/07 | | 2007/08 | | 2008/09 | | 2009/10 and
Outyears | |
Budget 2006 | | 489 | | 489 | | 489 | | 489 | |
Official Development Assistance
The Government has committed to an Official Development Assistance to Gross National Income ratio (ODA:GNI ratio) of 0.27% for the fiscal years 2005/06 and 2006/07 and increasing this to 0.28% in 2007/08. Budget 2005 includes funding for 2005/06 levels only. The 0.27% in 2006/07 is expected to cost an additional $19 million per annum to be charged against Budget 2006, and the 0.28% in 2007/08 is expected to cost $38 million to be charged against Budget 2007.
Budget to be Charged
($million) | | 2006/07 | | 2007/08 | | 2008/09 | | 2009/10 and
Outyears | |
Budget 2006 | | 19 | | 19 | | 19 | | 19 | |
Budget 2007 | | | | 38 | | 38 | | 38 | |
Tertiary Student Component Funding Rate Changes (The rolling funding triennium and fee and course cost maxima)
The Government has a policy of increasing Student Component funding rates for tertiary education by the rate of forecast CPI inflation on a rolling triennium. Funding is appropriated for future years at the rate of the CPI forecast plus 1%, and in the Budget preceding the relevant academic year funding rates are confirmed using a more up-to-date CPI forecast. The differential between the CPI increase and the appropriation is retained within the Vote for application elsewhere in the Student Component.
Budget to be Charged
($million) | | 2006/07 | | 2007/08 | | 2008/09 | | 2009/10 and
Outyears | |
Budget 2006 | | 29.1 | | 59.2 | | 59.2 | | 59.2 | |
Budget 2007 | | | | 28.5 | | 57.0 | | 57.0 | |
Time-Limited Funding
Time-limited funding does not meet the definition of a “risk” under the PFA, but is further information that is prepared to increase transparency about initiatives with funding profiles that cease or decrease during the forecast period.
The following table outlines those areas where initiatives have time-limited funding that decreases or ceases at some point and may potentially be extended, using a $5 million materiality threshold. They are often related to pilot programmes.
Vote | | Description of Initiative | | Operating Impact ($million) |
Biosecurity – Agriculture and Forestry | | Painted Apple Moth eradication programme | | 6 in 2004/05 |
| | | | |
Communications | | Digital Strategy – Information and Communications Technology capability, skills and development | | 18 from 2005/06 to 2008/09 (MYA) |
| | | | |
Communications | | Digital Strategy – high-speed connectivity for growth | | 20 from 2005/06 to 2008/09 (MYA) |
| | | | |
Economic, Industry and Regional Development | | Regional partnerships and facilitation for sustainable economic growth | | 57 from 2004/05 to 2006/07 (MYA) |
| | | | |
Education | | Microsoft software licensing | | 7 in 2004/05, 8 in 2005/06 and 4 in 2006/07 |
| | | | |
Energy | | Electricity efficiency programme | | 1 in 2004/05, 8 in 2005/06 and 10 in 2006/07 |
| | | | |
Finance | | Upgrade of rail network | | 200 from 2004/05 to 2007/08 (MYA) |
| | | | |
Health | | Meningococcal vaccine programme | | 106 in 2004/05, 31 in 2005/06 and 11 in 2006/07 |
| | | | |
Housing | | Rural housing programme | | 8 in each of 2005/06, 2006/07 and 2007/08 |
| | | | |
Internal Affairs | | Significant Community-Based Projects Fund | | 40 from 2005/06 to 2008/09 (MYA) |
| | | | |
Police | | Regional assistance mission Solomon Islands and Solomon Island executive support | | 7 in each of 2005/06 and 2006/07 |
| | | | |
Tourism | | Tourism promotional budget targeting high-yield tourists | | 9 in 2005/06 |
The following table shows the impact on the operating balance if funding were to be appropriated to maintain funding levels for these initiatives (ie, extend the initiatives beyond their current scheduled completion dates). These amounts would need to be managed within the forecast operating spending.
Operating Impact
($million) | | 2005/06 | | 2006/07 | | 2007/08 | | 2008/09 | | 2009/10 and
Outyears | |
Funding to extend initiatives | | 6 | | 15 | | 70 | | 104 | | 119 | |
Quantified Risks
The risks outlined in these tables would, if they eventuated, impact on the Government’s forecast new operating and/or capital spending amounts.
The Minister of Finance has yet to consider fully the quantum of these risks.
Quantified Risks as at
9 May 2005 | | Operating
Balance | | Gross Debt | | Value of Risk
($million) | | Funding Received
in Budget 2005
($million) |
New Risks | | | | | | | | |
| | | | | | | | |
ACC – Public Health Acute | | Decrease | | Increase | | 16 from 2005/06 | | — |
| | | | | | | | |
Culture and Heritage – Rugby World Cup 2011 | | Decrease | | Increase | | 20 to 70 from 2005/06 to 2011/12 | | — |
| | | | | | | | |
Economic Development – Improving Access to Finance | | Decrease | | Increase | | Up to 2 operating and 40 capital over 5 years | | — |
| | | | | | | | |
Health – Health Emergency Preparedness Capability | | Decrease | | Increase | | 3 in 2005/06, 11 in 2006/07, 10 in 2007/08, and 9 from 2008/09 | | — |
| | | | | | | | |
Transport – Harbour Link | | — | | Increase | | 35 in 2005/06 | | — |
| | | | | | | | |
Changed Risks | | | | | | | | |
| | | | | | | | |
Child, Youth and Family Services – Residential Services Strategy 2003 | | Decrease | | Increase | | Operating of 8 in 2005/06 rising to 16.1 from 2009/10, and capital of 30 from 2005/06 to 2007/08 | | — |
| | | | | | | | |
Corrections – Capital Projects | | Decrease | | Increase | | 92 operating and 118 capital in the forecast period | | 206 capital and 224 operating over the forecast period |
| | | | | | | | |
Culture and Heritage – Public Broadcasting Programme of Action | | Decrease | | Increase | | 33.5 per annum | | 10.5m per annum |
| | | | | | | | |
Education – School Property | | — | | Increase | | 136 capital in each of 2006/07, 2007/08 and 2008/09, and operating of 6 in 2006/07, 13 in 2007/08 and 20 from 2008/09. | | 77.5 capital in 2005/06, and operating of 3 in 2005/06 and 10 from 2006/07 |
| | | | | | | | |
Health – District Health Board deficits | | Decrease | | Increase | | Up to 100 in 2005/06 | | — |
| | | | | | | | |
Housing – Housing New Zealand Corporation’s Long-Term Capital Requirements | | — | | Increase | | 1,600 over 10 years | | 25 in 2005/06, 65 in 2006/07, 20 in 2007/08 and 21 in 2008/09 |
| | | | | | | | |
Internal Affairs – 2004 Storms Response and Infrastructure Costs | | Decrease | | Increase | | 5 to 20 in 2005/06 | | No new funding in 2005 Budget, but 13 across 2003/04 and 2004/05 |
Quantified Risks as at
9 May 2005 | | Operating
Balance | | Gross Debt | | Value of Risk
($million) | | Funding Received
in Budget 2005
($million) |
Changed Risks — cont’d | | | | | | | | |
| | | | | | | | |
Justice – New Supreme Court – Cost Escalation | | — | | Increase | | 15 to 20 | | — |
| | | | | | | | |
New Zealand Defence Force – Defence – Capital Injections | | — | | Increase | | 589 from 2006/07 to 2010/11 | | 410 capital in 2005/06 |
| | | | | | | | |
New Zealand Defence Force – Environmental Clean-up of Devonport Seabed Contamination | | Decrease | | Increase | | 13 over 2005/06 and 2006/07 | | — |
| | | | | | | | |
Revenue – Further work on Business Taxation • Fringe Benefit Tax Review
• Subsidies for Payroll-Related Tax Compliance Costs
• Tax and Depreciation
• Taxation of Offshore Portfolio Investment and Intermediaries, including Superannuation | | Decrease | | Increase | | 24 to 64 per annum
2 to 12 in 2005/06 and 7 to 45 from 2006/07
— 33 in 2006/07 and 130 from 2007/08 | | Elements of the Business Package relate to these items. The Business Package has a net cost of 229 in 2005/06, 229 in 2006/07, 105 in 2007/08 and 57 in 2008/09 |
| | | | | | | | |
Unchanged Risks | | | | | | | | |
| | | | | | | | |
Immigration – Immigration Policy | | — | | Increase | | 80 to 160 per annum | | — |
| | | | | | | | |
United Nations Convention on the Rights of the Child | | Decrease | | Increase | | 20 per annum | | — |
Unquantified Risks
The risks outlined in these tables would, if they eventuated, impact on the Government’s forecast new operating and/or capital spending amounts.
Unquantified Risks as at 9 May
2005 | | Operating
Balance | | Gross Debt | | Funding Received in Budget 2005
($million) |
New Risks | | | | | | |
| | | | | | |
Child, Youth and Family Services – Sustainable Service Delivery and Funding | | Unclear | | Unclear | | — |
| | | | | | |
Education – Reviews of Tertiary Education Expenditure | | Unclear | | Unclear | | — |
| | | | | | |
Tertiary Education Savings Scheme | | Decrease | | Increase | | — |
| | | | | | |
Transport – Regional Transport Initiatives | | — | | Increase | | — |
| | | | | | |
Transport – Wellington Transport Package | | — | | Increase | | 225 over 10 years |
| | | | | | |
Changed Risks | | | | | | |
| | | | | | |
Education – Student Support | | Decrease | | Increase | | 10 in 2005/06, 14 in 2006/07, 16 in 2007/08, 17 in 2008/09 and outyears |
| | | | | | |
Finance – Crown Overseas Properties | | — | | Increase | | — |
| | | | | | |
Fisheries – Maori Interest in Marine Farming | | — | | Increase | | — |
| | | | | | |
Housing – State Housing Project at Hobsonville | | — | | Increase | | 54 in 2005/06 |
| | | | | | |
Pay and Employment Equity Taskforce | | Decrease | | Increase | | — |
| | | | | | |
Social Development – Early Intervention | | Decrease | | Increase | | 37 in Budget 2005 with plans for more uncosted spending in Budget 2006 |
| | | | | | |
Unchanged Risks | | | | | | |
| | | | | | |
Education – Wananga Capital Injection | | — | | Increase | | — |
| | | | | | |
New Zealand Defence Force – Sale of Skyhawks and Aermacchi Trainers | | — | | Unclear | | — |
| | | | | | |
Social Development – Extending Opportunities to Work | | Decrease | | Increase | | — |
| | | | | | |
Social Development – Information Technology Systems | | — | | Increase | | — |
| | | | | | |
State Services Commission – State Sector Retirement Savings Scheme | | Decrease | | Increase | | 1.6 over 2004/05 to 2008/09 for operation of the scheme |
Risks removed since the December Update
The following risks have been removed since the December Update.
Expired Risks | | Reason | | Funding Received ($million) |
Agriculture and Forestry – Lower North Island Storm: On-farm Relief Measures | | In forecasts | | 16 over 2004/05 and 2005/06 |
| | | | |
Education – Tertiary Education Funding Category Review | | In forecasts | | 1 in 2005/06, 5 in 2006/07, -2 in 2007/08 and -13 in 2008/09 |
| | | | |
Environment – Climate Change | | In forecasts and recognised as a contingent liability | | Carbon charge revenue is forecast at 90 in 2006/07, 362 in 2007/08 and 359 in 2008/09 |
| | | | |
Foreign Affairs and Trade – Official Development Assistance | | In forecasts | | 15 in 2005/06 and 63 from 2006/07 |
| | | | |
Health – Disability Support and Aged Care Services | | In forecasts | | 49 in 2005/06 and 83 from 2006/07 |
| | | | |
Health – High and Complex Intellectual Disability Services | | In forecasts | | 27 from 2004/05 |
| | | | |
Health – Orthopaedics | | In forecasts | | 4 in 2005/06, 16 in 2006/07 and 27 from 2007/08 |
| | | | |
Health – Wage Bargaining | | In forecasts | | 34 in 2004/05, 102 in 2005/06, and 149 from 2006/07 |
| | | | |
Holidays Act | | In forecasts | | 53 from 2004/05 |
| | | | |
Internal Affairs – Review of Rates Rebate Scheme | | In forecasts | | 50 from 2006/07 |
| | | | |
Lands and Conservation – Achievement of the Government’s Objectives for the South Island High Country | | In forecasts | | 40 in 2005/06 to 2007/08 and then 11 per annum in outyears |
| | | | |
New Zealand Defence Force – Defence Capability and Resourcing Review | | In forecasts | | 60 in 2005/06, 60 in 2006/07 and 67 from 2007/08 |
| | | | |
New Zealand Defence Force – Overseas Deployments | | In forecasts | | 1 in 2004/05, 17 in 2005/06 and 5 in 2006/07 |
| | | | |
New Zealand Defence Force – Stand-alone Security Response Organisation | | Included in DFP and Long-Term Development Plan | | — |
| | | | |
Research, Science and Technology – Health Research Package | | In forecasts | | 13 in 2005/06, 19 in 2006/07 and 20 from 2007/08 |
| | | | |
Revenue – Amortisable Research and Development Expenditure | | In forecasts | | Included in the Business Package, which has a net cost of 229 in 2005/06, 229 in 2006/07, 105 in 2007/08 and 57 in 2008/09 |
| | | |
Revenue – Exemption for Overseas Earnings | | In forecasts | |
| | | |
Revenue – Tax Simplification for Small and Medium Enterprise | | In forecasts | |
| | | | |
Savings and Home Ownership | | In forecasts | | Operating of 10 in 2005/06, 99 in 2006/07, 291 in 2007/08, 154 in 2008/09 and 200 in outyears. Capital of 13 in 2005/06 and 15 in 2006/07 |
| | | | |
Transport – Toll Road Funding | | In forecasts | | 100 in 2007/08 and 58 in 2008/09 |
ACC – Public Health Acute (new, quantified risk)
ACC funding for the provision of public health acute services for 2005/06 is currently being considered. The amount of additional funding to be paid by ACC has not yet been determined, but would decrease the operating balance by up to $16 million in 2005/06 and outyears.
The Minister of Finance has yet to consider fully the quantum of this risk.
Source: Department of Labour
Child, Youth and Family Services – Residential Services Strategy 2003 (changed, quantified risk)
The Department of Child, Youth and Family Services has undertaken a comprehensive review of existing residential services and practices, including consideration of desired outcomes, a review of international good practice, and formal forecasting of demand. From this, the Department has developed a strategy for future residential services provision – the Residential Services Strategy 2003. The 2003 Strategy builds on the considerable investment in facilities made in implementing the 1996 Residential Services Strategy.
The Government has agreed in principle to fund the 2003 Strategy subject to fully developed and costed proposals. Some initiatives have already been agreed, and the remaining operating cost risk is $8.4 million in 2005/06 rising to $16.1 million in 2009/10 and outyears, which would decrease the operating balance. The remaining capital risk is $29.5 million, which would increase gross debt. The current proposed phasing of this is $4.4 million in 2005/06, $7.4 million in 2006/07 and $17.7 million in 2007/08.
The Minister of Finance has yet to consider fully the quantum of this risk.
Source: Department of Child, Youth and Family Services
Child, Youth and Family Services – Sustainable Service Delivery and Funding (new, unquantified risk)
The Government is reviewing the Department of Child, Youth and Family Services’ funding requirements in order to identify options for sustainable levels of funding and service delivery in the medium term. Options may be submitted for consideration in Budget 2006. The risk is unquantified as it is unclear what change in departmental funding is required. Any change in funding to reflect a new baseline and/or meet necessary capital injections would impact on the operating balance and/or gross debt.
Corrections – Capital Projects (changed, quantified risk)
In Budget 2005, $206 million capital and $220 million operating was appropriated for Corrections capital projects. The Department of Corrections has estimated that a further total of $118 million capital and $92 million operating funding would be required over the forecasting period (with an ongoing operating cost of $41 million from 2009/10) to meet future prison inmate forecasts.
The actual amounts depend on the specification and timing of the individual projects and the contracted prices. These estimates include consideration of funding for the Otago Men’s Corrections Facility and Mt Eden Prison.
Capital injections would increase gross debt while operating funding would decrease the operating balance.
The Minister of Finance has yet to consider fully the quantum of these risks.
Source: Department of Corrections
Culture and Heritage – Public Broadcasting Programme of Action (changed, quantified risk)
On 3 February 2005, the Government released a Public Broadcasting Programme of Action. The Programme contains a set of priorities to guide public broadcasting policy over the next six years, and a series of proposals to give effect to these priorities. The Programme as a whole (if fully implemented) would have total ongoing operating costs rising to around $44 million in 2009/10. Broadcasting initiatives of $10.5 million per annum have been included in Budget 2005, leaving a remainder of around $33.5 million. Other individual elements of the Programme of Action will be considered in future Budgets over the next six years. These would decrease the operating balance.
The Minister of Finance has yet to consider fully the quantum of this risk.
Source: Ministry for Culture and Heritage
Culture and Heritage – Rugby World Cup 2011 (new, quantified risk)
In May 2005, the New Zealand Rugby Union (NZRU) is likely to submit a bid to the International Rugby Board (IRB) to host the Rugby World Cup 2011 in New Zealand. The Government has agreed to provide the following direct financial support if the bid is successful: a $20 million cash contribution, and an uncapped underwrite for the tournament on a 67:33 loss sharing basis (Government:NZRU). If the bid is successful, the operating balance could decrease by approximately $20-70 million between 2005/06 and 2011/12.
The Minister of Finance has yet to fully consider the quantum of this risk.
Source: Ministry for Culture and Heritage
Economic Development – Improving Access to Finance (new, quantified risk)
The Government is considering options to improve firms’ access to finance, including a new equity co-investment scheme. The amount of funding required would depend on the option chosen, if any. An equity co-investment scheme could require up to $2 million operating and $40 million capital spread over five or six years. This would decrease the operating balance and increase gross debt.
The Minister of Finance has yet to fully consider the quantum of this risk.
Source: Ministry of Economic Development.
Education – Review of Tertiary Education Expenditure (new, unquantified risk)
The Government is currently reviewing tertiary education spending with particular focus on sub-degree level tertiary spending where there has been large growth in participation and expenditure. Decisions are expected later in 2005 and may lead to changes in expenditure in 2006. The precise impact on the operating balance, if any, is unclear as it would depend on the outcome of the review.
Education – School Property (changed, quantified risk)
The Government has provided capital of $77.5 million in 2005/06 for school accommodation. Additional capital injections for school accommodation are likely to be required in future years to meet roll growth. Additional capital injections could be up to $136 million in each of the next three years with a corresponding increase in gross debt.
In addition to capital injections, consequential operating costs of $6 million in 2006/07, $13 million in 2007/08 and $20 million in 2008/09 are likely to be incurred, which would decrease the operating balance.
The Minister of Finance has yet to consider fully the quantum of this risk.
Source: Ministry of Education
Education – Student Support (changed, unquantified risk)
The Government is considering a range of initiatives relating to student support. The initiatives under consideration include changes to student loan collection policy, student allowance payment rates, and any implications of the new universal benefit payment for student allowances. Depending on the initiatives selected this would decrease the operating balance.
Education – Wananga Capital Injection (unchanged, unquantified risk)
Ministers are currently negotiating with a Wananga (Maori tertiary education institution) over settlement of its Waitangi Tribunal claim. The Waitangi Tribunal has recommended that the Wananga be compensated for capital expenditure that has been incurred on facilities to date, be provided funding to bring its facilities up to a standard comparable with other tertiary institutions and to meet additional capital requirements.
Any capital injection would increase gross debt. The fiscal risk is unquantified as disclosure could compromise the Crown in negotiations with the Wananga.
Finance – Crown Overseas Properties (changed, unquantified risk)
The Government is considering options relating to the continued use of certain Crown overseas properties.
The risk is unquantified as disclosure could compromise any negotiations the Crown may enter, but any additional operating funding would decrease the operating balance, and/or any additional capital funding would increase debt.
Fisheries – Maori Interest in Marine Farming (changed, unquantified risk)
The Maori Commercial Aquaculture Claims Settlement Act 2004 addresses Maori claims in commercial marine farming space from 21 September 1992 to 31 December 2004 (“pre-commencement space”) by providing iwi with 20% equivalent space. This obligation is to be met through three possible options: the provision of additional new space, or Crown purchase of existing farms from 2008, or provision of the financial equivalent of space from 2013.
Under the Act, any Maori claim relating to new aquaculture space after 31 December 2004 will be met by the provision of 20% of the new space.
To the extent that financial compensation or Crown purchase of existing farms is necessary to address Maori interests (as opposed to using new space), this would decrease the operating balance. The risk is unquantified as the amount or timing of any funding is unclear, and in addition, disclosure could compromise the Crown in negotiations with either commercial marine farm owners or iwi.
Health – District Health Board Deficits (changed, quantified risk)
Initial draft District Annual Plans from District Health Boards (DHBs) for 2005/06 indicate deficits in the order of $100 million in 2005/06, primarily in Auckland, with smaller deficits in West Coast and Whanganui. A similar level of deficits is forecast for 2006/07. The Government has not accepted the size of these forecast deficits and is actively discussing actions and cost-containment measures with these DHBs.
The impact on the operating balance, if any, is unclear. Any deficits above that able to be funded from Vote Health would decrease the operating balance and/or increase gross debt. Specific potential pressures for DHBs include wage bargaining and funding for health of older people services.
This risk has changed since the 2004 DEFU to take into account the new financial forecasts submitted by DHBs.
The Minister of Finance has yet to consider fully the quantum of this risk.
Source: District Health Boards
Health – Health Emergency Preparedness Capability (new, quantified risk)
The Government is considering funding to address the capability and capacity of the health sector to respond to accidental or deliberate mass casualty emergencies, or a pandemic. This could cost up to $3 million in 2005/06, $11 million in 2006/07, $10 million in 2007/08 and $9 million in 2008/09 and outyears, which would decrease the operating balance.
The Minister of Finance has yet to consider fully the quantum of this risk.
Source: Ministry of Health
Housing – HNZC’s Long-Term Capital Requirements (changed, quantified risk)
The Government is currently considering Housing New Zealand Corporation’s (HNZC) long-term capital requirements in light of the demand for social housing and the need to reconfigure and modernise its housing stock. While some decisions were made in the 2005 Budget regarding the acquisition of new stock, the Government is likely to review acquisition targets and has still to consider options around modernisation programmes directed at existing stock. Decisions are likely in Budget 2006.
The Government is further examining the range of options and associated costs, with initial estimates of up to $1.6 billion of capital costs over a 10- to 15-year horizon. Any new capital contributions would increase gross debt and would likely lead to an increase in the Income-Related Rent subsidy with a subsequent decrease in the operating balance.
Housing – State Housing Project at Hobsonville (changed, unquantified risk)
In Budget 2005, HNZC has received funding of $54.3 million to acquire, under the Housing Act 1955, NZDF land at Hobsonville deemed surplus to defence requirements but suitable for state housing purposes. The Government may consider development options that would lead to the Crown giving additional capital to HNZC, which would increase gross debt.
Immigration – Immigration Policy (unchanged, quantified risk)
The Government has amended immigration investor policy. Migrants in the investor category will be required to invest $2 million with the Government for five years. These bonds will be used to finance infrastructure. Migrants will receive a return on their investment based on inflation, and may withdraw up to half of the total investment after two years if they have a specific business proposal in New Zealand. The policy is to be implemented by 30 June 2005. Uptake of the new policy is unclear at this stage, and so has not been included in forecasts. The increase in gross debt, based on a flow of 40 to 80 people, is currently estimated to be between $80 million and $160 million per year.
The Minister of Finance has yet to consider fully the quantum of this risk.
Source: Department of Labour
Internal Affairs – 2004 Storms Response and Infrastructure Costs (changed, quantified risk)
The lower North Island and the Bay of Plenty were hit by severe storms during 2004. The Government reimburses some local authority costs under the National Civil Defence Plan. Several local authorities have made submissions for reimbursement, and further submissions are expected. The Government is working with local authorities to review the information provided and consider how to respond. The Government has already provided around $13 million. Remaining costs could be between $5 million and $20 million and would reduce the operating balance.
Source: Department of Internal Affairs
Justice – New Supreme Court – Cost Escalation (changed, quantified risk)
In order to meet revised functional requirements, the Government is considering altering the 2003 design for accommodating the new Supreme Court. This could increase construction costs. The original scheme was approved by Cabinet at a cost of $19 million; the additional capital cost could range from $15 million to $20 million, depending on the revised design option selected. This would increase gross debt.
The Minister of Finance has yet to consider fully the quantum of this risk.
Source: Ministry of Justice
New Zealand Defence Force – Defence – Capital Injections (changed, quantified risk)
Implementing the Government’s decisions on the future structure of the NZDF will involve a series of capital acquisitions across all three armed services and for HQNZDF to achieve the required capability upgrades. The Government has agreed to a capital injection of up to $1.244 billion over 2001/02 to 2010/11. This has increased from the $1 billion signalled in DEFU to provide $35 million for additional Light Armoured Vehicle capability and $209 million to extend the capital programme to address issues raised in the Defence Capability and Resourcing Review, including aligning some major weapons platforms with the Government’s intentions.
Of the Long-Term Development Plan funding, $655 million has been agreed, leaving $589 million remaining. The actual expenditure profile will depend on the specification and timing of the individual projects, the contracted prices, and the prevailing exchange rate at the time of purchase.
Any capital injections would increase gross debt.
The Minister of Finance has yet to consider fully the quantum of this risk.
Source: New Zealand Defence Force
New Zealand Defence Force – Environmental Clean-up of Devonport Seabed Contamination (changed, quantified risk)
The Government has identified historic contamination in the seabed adjacent to the Calliope Dock at the Devonport Naval Base. Investigatory work on the contamination is underway, and it is anticipated that by mid-2005 better information will be available to determine the scope of the issue. Costs are estimated to be $13.1 million over 2005/06 and 2006/07.
The Minister of Finance has yet to consider fully the quantum of this risk.
Source: New Zealand Defence Force
New Zealand Defence Force – Sale of Skyhawks and Aermacchi trainers (unchanged, unquantified risk)
As a result of the Government’s decisions on the future structure of the NZDF, NZDF is in the process of selling the Skyhawks and Aermacchi trainers. Proceeds from the sale would improve the operating balance.
This risk is unquantified as disclosure could compromise the Crown in the sale process.
Pay and Employment Equity Taskforce (changed, unquantified risk)
The Government has established the Pay and Employment Equity Unit in the Department of Labour to oversee the implementation of a five-year plan of action to establish pay and employment equity in the public service, public health and public education sectors. Until pay and employment equity audits and pay investigations have been undertaken in these sectors it is unclear what, if any, the fiscal implications of this process would be. However, any resulting increases in operating funding would decrease the operating balance.
Revenue – Further Work on Business Taxation
The Budget 2005 Business Package includes the following initiatives, some of which appeared as specific fiscal risks in the December Update:
Budget Initiatives ($million) | | 2005/06 | | 2006/07 | | 2007/08 | | 2008/09 | |
Financial Intermediaries | | — | | — | | 120 | | 100 | |
(involves alignment of the taxation of investment income from direct and indirect investments and modification to the taxation of offshore investment income) | | | | | | | | | |
| | | | | | | | | |
Depreciation | | 219 | | 276 | | 260 | | 222 | |
(includes adjustment of certain tax depreciation rates and an increase in the low-value asset write-off threshold) | | | | | | | | | |
| | | | | | | | | |
Fringe benefit tax | | 7 | | 28 | | 28 | | 28 | |
(includes lowering the fringe benefit valuation rate on motor vehicles and increasing the exemption thresholds for minor fringe benefits) | | | | | | | | | |
| | | | | | | | | |
Tax simplification | | — | | — | | 46 | (1) | 53 | |
(involves aligning the payment dates for GST and provisional tax and allowing the payment of provisional tax on the basis of GST turnover) | | | | | | | | | |
| | | | | | | | | |
International recruitment | | — | | 12 | | 12 | | 12 | |
(a temporary tax exemption on foreign income will be made available to certain people who come to work here) | | | | | | | | | |
| | | | | | | | | |
Implementation costs | | 3 | | 4 | | 1 | | 1 | |
Subtotal | | 229 | | 320 | | 467 | | 416 | |
| | | | | | | | | |
Less: Carbon tax revenue | | — | | 80 | | 322 | | 319 | |
| | | | | | | | | |
Net Cost | | 229 | | 239 | | 145 | | 97 | |
(1) There is also an impact on the operating balance occurring as a result of the deferral of the receipt of provisional tax payments by approximately two months. This deferral shifts $760 million of tax revenue out of 2007/08.
Further work is still underway on the following four items in relation to taxation of business:
Revenue – Fringe Benefit Tax review (changed, quantified risk)
The Budget 2005 Business Package includes changes to fringe benefit tax policies. The Government is considering further work on changes to the fringe benefit tax rules focusing on eliminating certain anomalies in relation to motor vehicles.
The reduction in the operating balance would depend on which proposals are finally approved and the details of the legislation. However, the estimated net fiscal cost is likely to be within the range of $24 million to $64 million per annum.
The Minister of Finance has yet to consider fully the quantum of this risk.
Source: Inland Revenue
Revenue – Subsidies for Payroll-Related Tax Compliance Costs (new, quantified risk)
As part of the tax simplification programme the Government plans to implement a legislative framework to subsidise the use of payroll agents to meet small employers’ PAYE obligations. The structure and amount of the subsidy are contingent on successful negotiation with payroll agents and the reduction in the operating balance will depend on the final structure of the subsidy adopted. However, the estimated cost of the subsidy is likely to be within the range of $7 million to $45 million per annum. On the basis that the subsidy can be negotiated, a target date of 1 April 2006 has been set for implementation.
The Minister of Finance has yet to consider fully the quantum of this risk.
Source: Inland Revenue
Revenue – Tax and Depreciation (changed, unquantified risk)
The Budget 2005 Business Package includes changes to depreciation policies. The Government is considering further issues related to depreciation, including the treatment of long-lived assets and potential changes to the tax treatment of rental housing in particular. However, the impact on the operating balance remains unclear as it would depend on the options chosen.
Revenue – Taxation of Offshore Portfolio Investment and Intermediaries Including Superannuation (changed, quantified risk)
The Budget 2005 Business Package includes changes to the taxation of domestic intermediaries and further work is underway. This includes consideration of the taxation of both onshore and offshore investments in equity by New Zealand residents. A target date of April 2007 has been set for implementation of changes, some of which have been included in the Budget 2005 Business Package. Further proposals are being considered and could cost an additional $130 million, which would decrease the operating balance.
Social Development – Early Intervention (changed, unquantified risk)
Budget 2005 includes an initial investment of $37.6 million over four years in early intervention services for children and families. Ministers are considering proposals for further development of the early intervention programme, including enhancements and expansion of the existing initiatives. New programmes may also be considered to respond better to the needs of children and their families.
Further proposals are still being developed, but any additional funding would decrease the operating balance.
Social Development – Extending Opportunities to Work (unchanged, unquantified risk)
Following on from Working for Families, the Government is considering options for simplifying the benefit system and reforming labour market assistance and service delivery in order to better support beneficiaries’ entry to employment. Decisions are likely to be made as part of Budget 2006. The impact on the operating balance is unclear, as proposals are still being developed.
Social Development – Information Technology Systems (unchanged, unquantified risk)
The Government is considering the future development and/or replacement of its income benefit payment systems (SWIFTT and TRACE) and case management system. An Information Technology Strategy has been developed taking into account the Ministry’s Statement of Intent and work on the future needs of the Ministry. Decisions will be made on development and/or replacement when appropriate concept and product evaluations have been completed.
The Ministry is seeking to fund any development and/or replacement from existing capital. To the extent the risk is not funded from the Department’s balance sheet and existing baselines, the proposal would increase debt and reduce the operating balance.
State Services Commission – State Sector Retirement Savings Scheme (unchanged, unquantified risk)
The Government is considering options for extending the employer subsidy for members of the State Sector Retirement Savings Scheme beyond 3% (3% is the level of employer subsidy from 2005/06), and is also considering options for extending the scheme to the wider state sector.
The decrease in the operating balance would vary depending on the options chosen.
Tertiary Education Savings Scheme (new, quantified risk)
The Government is considering options for a Tertiary Education Savings Scheme. If the scheme does proceed the Government may include an upfront contribution as an incentive to encourage participation.
The decrease in the operating balance would vary depending on the options chosen.
Transport – Harbour Link (new, quantified risk)
The Government is considering a proposal of debt funding for the construction of a toll bridge over Tauranga harbour. The level of funding sought is approximately $35 million in 2005/06. The capital cost of this would increase gross debt and any interest costs would decrease the operating balance.
The Minister of Finance has yet to consider fully the quantum of this risk.
Source: Ministry of Transport
Transport – Regional Transport Initiatives (new, unquantified risk)
The Government is considering possible involvement in regional transport initiatives working in participation with Local Government to make significant and timely improvements to regional land transport outcomes. A decision on a regional transport initiative for the Bay of Plenty is expected around June 2005.
Transport – Wellington Transport Package (new, unquantified risk)
The Government has agreed to funding of $225 million over 10 years as part of the Wellington Transport Package. However, the Government has yet to consider the Western Corridor Transportation Study which is due to report at the end of May 2005. Costs for the Western Corridor could vary depending on the options chosen and may increase gross debt and/or decrease the operating balance.
United Nations Convention on the Rights of the Child (unchanged, quantified risk)
If unconditionally adopted, the United Nations Convention on the Rights of the Child would require New Zealand to confer the rights of the Convention on all children.
To date, New Zealand has reserved its right to distinguish between persons according to the nature of their authority to be in New Zealand. The Government established a review to consider whether this reservation can be removed. This could involve making changes to eligibility for some health, education and social services, which would decrease the operating balance by approximately $20 million per annum. The review is due to report back in early 2005.
The Minister of Finance has yet to consider fully the quantum of this risk.
Source: The Treasury
Contingent liabilities are costs that the Crown will have to face if a particular event occurs. Typically, contingent liabilities consist of guarantees and indemnities, legal disputes and claims, and uncalled capital. The contingent liabilities facing the Crown are a mixture of operating and balance sheet risks, and they can vary greatly in magnitude and likelihood of realisation. In general, if a contingent liability were realised it would reduce the operating balance and net worth, and increase net Crown debt. However, in the case of contingencies for uncalled capital, the negative impact would be restricted to net Crown debt.
Where contingent liabilities have arisen as a consequence of legal action being taken against the Crown, the amount shown is the amount claimed and thus the maximum potential cost. It does not represent either an admission that the claim is valid or an estimation of the possible amount of any award against the Crown.
Contingent liabilities have been stated as at 31 March 2005, being the last set of published contingent liabilities.
Details of each of the following contingent liabilities can be accessed from the Treasury website at www.treasury.govt.nz/forecasts/befu/2005.
Quantifiable Contingent Liabilities
| | Status(12) | | ($ million) | |
Guarantees and indemnities | | | | | |
Cook Islands – Asian Development Bank loans | | Changed | | 18 | |
Indemnification of receivers and managers – Terralink Limited | | Unchanged | | 10 | |
Ministry of Justice – Treaty settlement, tax liabilities | | Unchanged | | 76 | |
Mighty River Power Limited – guaranteed payment obligations | | Changed | | 17 | |
Solid Energy New Zealand Limited | | Changed | | — | |
Ministry of Transport – funding guarantee | | Unchanged | | 10 | |
New Zealand Railways Corporation | | Unchanged | | 10 | |
Post Office Bank – guaranteed deposits | | Unchanged | | 11 | |
Guarantees and indemnities of SOEs and Crown entities | | Changed | | 5 | |
Other guarantees and indemnities | | Changed | | 9 | |
| | | | 166 | |
Uncalled capital | | | | | |
Asian Development Bank | | Changed | | 1,046 | |
European Bank for Reconstruction and Development | | Unchanged | | 13 | |
International Bank for Reconstruction and Development | | Changed | | 1,159 | |
| | | | 2,218 | |
Legal proceedings and disputes | | | | | |
Air New Zealand Limited – legal claim | | Unchanged | | 107 | |
Health – legal claims | | Unchanged | | 104 | |
Tax in dispute | | Changed | | 408 | |
Transpower New Zealand Limited | | Unchanged | | 20 | |
Other legal claims against SOEs and Crown entities | | Changed | | 5 | |
Other legal claims | | Changed | | 83 | |
| | | | 727 | |
Other quantifiable contingent liabilities | | | | | |
International finance organisations | | Changed | | 1,252 | |
Reserve Bank – demonetised currency | | Unchanged | | 23 | |
Social Development – claim for judicial review | | Changed | | 52 | |
Transpower New Zealand Limited | | Unchanged | | 86 | |
Other quantifiable contingent liabilities of SOEs and Crown entities | | Changed | | 27 | |
Other quantifiable contingent liabilities | | Changed | | 18 | |
| | | | 1,458 | |
Total quantifiable contingent liabilities | | | | 4,569 | |
(12) Relative to reporting in the 31 December 2004 Crown Financial Statements.
Unquantifiable Contingent Liabilities
Institutional guarantees | | Status | |
Asure New Zealand Limited | | Unchanged | |
At Work Insurance Limited | | Unchanged | |
Auckland rail lease | | Unchanged | |
Bona Vacantia property | | Unchanged | |
Crown research institutes | | Unchanged | |
District Court Judges, Justices of the Peace, Coroners and Disputes Tribunal | | Unchanged | |
District health boards – director indemnity (DHBs) | | Unchanged | |
Earthquake Commission | | Unchanged | |
Electricity Corporation of New Zealand Limited | | Unchanged | |
Fisheries – indemnity provided for delivery of registry services | | Unchanged | |
Fletcher Challenge Limited | | Unchanged | |
Genesis Power Limited | | Unchanged | |
Housing New Zealand Corporation | | Unchanged | |
Indemnities against acts of war and terrorism | | Unchanged | |
Maui Partners | | Unchanged | |
National Provident Fund | | Unchanged | |
New Zealand Railways Corporation | | Unchanged | |
Persons exercising investigating powers | | Unchanged | |
Ports of Auckland | | Unchanged | |
Public Trust | | Unchanged | |
Purchasers of Crown operations | | Unchanged | |
Reserve Bank of New Zealand | | Unchanged | |
State Insurance and Rural Bank – tax liabilities | | Unchanged | |
Synfuels-Waitara Outfall Indemnity | | Unchanged | |
Tainui Corporation | | Unchanged | |
Toll NZ Limited – purchase of rail network assets | | Unchanged | |
Works Civil Construction | | Unchanged | |
Works Consultancy Services | | Unchanged | |
| | | |
Other unquantifiable contingent liabilities | | | |
Abuse claims | | New | |
Accident Compensation Corporation (ACC) litigations | | Unchanged | |
Building Industry Authority litigation | | Unchanged | |
Environmental liabilities | | Unchanged | |
Genesis Power Limited | | Unchanged | |
Kyoto Protocol | | Changed | |
Sale of Crown assets | | Unchanged | |
Treaty of Waitangi claims | | Unchanged | |
Treaty of Waitangi claims – settlement relativity payments | | Unchanged | |
Generally Accepted Accounting Practice (GAAP) Series Tables
These forecasts have been prepared in accordance with the Public Finance Act 1989.
They are based on the accounting policies and assumptions that follow. As with all such assumptions, there is a degree of uncertainty surrounding them. This uncertainty increases as the forecast horizon extends.
The forecasts have been prepared in accordance with the Statement of Responsibility and reflect the judgements and information known at the time they were prepared. They reflect all Government decisions and circumstances communicated to 9 May 2005.
Finalisation dates and key assumptions that underpin the preparation of the GAAP tables are outlined at the start of the Fiscal Outlook chapter on page 59.
10 year trend information
Ten year summary - as at 30 June
Summary indicators
(% of GDP) | | 2000
Actual | | 2001
Actual | | 2002
Actual | | 2003
Actual | | 2004
Actual | | 2005
Forecast | | 2006
Forecast | | 2007
Forecast | | 2008
Forecast | | 2009
Forecast | |
| | | | | | | | | | | | | | | | | | | | | |
Revenue | | | | | | | | | | | | | | | | | | | | | |
Core Crown | | 31.7 | % | 32.4 | % | 31.8 | % | 33.4 | % | 33.4 | % | 33.9 | % | 34.2 | % | 34.0 | % | 33.7 | % | 34.1 | % |
Tax Revenue | | 29.1 | % | 29.6 | % | 28.9 | % | 30.4 | % | 30.3 | % | 30.5 | % | 30.8 | % | 30.6 | % | 30.1 | % | 30.5 | % |
Total Crown | | 37.8 | % | 38.7 | % | 39.9 | % | 43.6 | % | 43.0 | % | 43.3 | % | 44.1 | % | 44.1 | % | 43.6 | % | 43.9 | % |
| | | | | | | | | | | | | | | | | | | | | |
Expenses | | | | | | | | | | | | | | | | | | | | | |
Core Crown | | 31.4 | % | 31.2 | % | 30.3 | % | 31.9 | % | 29.6 | % | 30.1 | % | 30.9 | % | 31.8 | % | 32.3 | % | 32.1 | % |
Total Crown | | 36.5 | % | 37.6 | % | 38.0 | % | 42.3 | % | 37.8 | % | 39.5 | % | 39.9 | % | 40.9 | % | 41.4 | % | 41.0 | % |
| | | | | | | | | | | | | | | | | | | | | |
Operating balance | | 1.4 | % | 1.2 | % | 1.9 | % | 1.5 | % | 5.3 | % | 3.9 | % | 4.3 | % | 3.3 | % | 2.3 | % | 3.0 | % |
| | | | | | | | | | | | | | | | | | | | | |
OBERAC | | 0.8 | % | 1.8 | % | 2.2 | % | 4.3 | % | 4.7 | % | 4.9 | % | 4.3 | % | 3.3 | % | 2.3 | % | 3.0 | % |
| | | | | | | | | | | | | | | | | | | | | |
Gross sovereign-issued debt | | 32.8 | % | 31.3 | % | 28.9 | % | 27.6 | % | 25.3 | % | 22.6 | % | 21.3 | % | 20.2 | % | 20.4 | % | 20.2 | % |
| | | | | | | | | | | | | | | | | | | | | |
Net Crown debt | | 19.5 | % | 17.0 | % | 15.4 | % | 13.4 | % | 10.8 | % | 7.7 | % | 6.6 | % | 6.6 | % | 7.4 | % | 7.5 | % |
| | | | | | | | | | | | | | | | | | | | | |
NZS Fund Balance | | 0.0 | % | 0.0 | % | 0.5 | % | 1.4 | % | 2.8 | % | 4.3 | % | 5.9 | % | 7.6 | % | 9.2 | % | 10.9 | % |
General Accounting Policies and Forecast Assumptions
General accounting policies
Accounting policy
These Forecast Financial Statements comply with generally accepted accounting practice. The measurement base applied is historical cost adjusted for revaluations of property, plant and equipment (where appropriate), commercial forests and marketable securities and deposits and equity investments held for trading purposes.
Revaluations are made to reflect the forecast service potential or economic benefit obtained through control of the assets. The accrual basis of accounting has been used.
Forecast assumptions
For forecast purposes, no revaluations of property, plant and equipment are projected beyond the current year.
Specific Accounting Policies and Forecast Assumptions
Forecast periods
The reporting periods covered by these Forecast Financial Statements are the years ending 30 June 2005, 30 June 2006, 30 June 2007, 30 June 2008 and 30 June 2009.
Certain state-owned enterprises and Crown entities have different reporting periods from the Crown.
The forecasts for 30 June 2005 have generally been prepared using actual data to 28 February 2005 or 31 March 2005 (in some instances). Transactions for the remainder of the year are forecast in accordance with the Crown’s accounting policies and forecast assumptions.
Changes in accounting policies
Electricity generation assets have been previously recorded at cost less accumulated depreciation. From the current year this class of assets will now be recorded at fair value. The change in this policy is likely to increase the value of assets and net worth (via the revaluation reserve). All other policies have been applied on a consistent basis during the forecast period.
Changes in forecast assumptions
Changes to the forecast assumptions used for the forecasts published in the 2005 Budget Economic and Fiscal Update are outlined on page 59.
Detailed accounting policies and forecast assumptions
The specific accounting and forecasting policies are reproduced in full on Treasury’s website at www.treasury.govt.nz/forecasts/befu/2005.
These Forecast Financial Statements are for the Crown reporting entity as specified in Part III of the Public Finance Act 1989. This comprises Ministers of the Crown and the following entities:
Departments |
|
Agriculture and Forestry |
Archives New Zealand |
Building and Housing |
Child, Youth and Family Services |
Conservation |
Corrections |
Crown Law |
Culture and Heritage |
Customs |
Defence |
Economic Development |
Education |
Education Review Office |
Environment |
Fisheries |
Foreign Affairs and Trade |
Government Communications Security Bureau |
Health |
Inland Revenue |
Internal Affairs |
Justice |
Labour |
Land Information New Zealand |
Maori Development |
National Library |
New Zealand Defence Force |
Office of the Clerk |
Pacific Island Affairs |
Parliamentary Counsel Office |
Parliamentary Service |
Police |
Prime Minister and Cabinet |
Research, Science and Technology |
Security Intelligence Service |
Serious Fraud Office |
Social Development |
State Services Commission |
Statistics |
Transport |
Treasury |
Women’s Affairs |
|
State-owned enterprises |
|
Agriquality Limited |
Airways Corporation of New Zealand Limited |
Animal Control Products Limited |
Asure New Zealand Limited |
Electricity Corporation of New Zealand Limited |
Genesis Power Limited |
Landcorp Farming Limited |
Learning Media Limited |
Meridian Energy Limited |
Meteorological Service of New Zealand Limited |
Mighty River Power Limited |
New Zealand Post Limited |
New Zealand Railways Corporation |
Quotable Value Limited |
Solid Energy New Zealand Limited |
Terralink Limited (in liquidation) |
Timberlands West Coast Limited |
Transmission Holdings Limited |
Transpower New Zealand Limited |
|
Others |
|
Government Superannuation Fund |
New Zealand Superannuation Fund |
Reserve Bank of New Zealand |
Air New Zealand Limited (included for disclosure purposes as if it were a SOE) |
Crown entities
Accident Compensation Corporation
Accounting Standards Review Board
Alcohol Advisory Council of New Zealand
Arts Council of New Zealand Toi Aotearoa
Broadcasting Commission
Broadcasting Standards Authority
Career Services
Children’s Commissioner
Civil Aviation Authority of New Zealand
Commerce Commission
Crown research institutes (9)
District health boards (21)
Earthquake Commission
Electoral Commission
Electricity Commission
Energy Efficiency and Conservation Authority
Environmental Risk Management Authority
Families Commission
Foundation for Research, Science and Technology
Government Superannuation Fund Authority
Guardians of New Zealand Superannuation
Health and Disability Commissioner
Health Research Council of New Zealand
Health Sponsorship Council
Housing New Zealand Corporation
Human Rights Commission
Land Transport New Zealand
Law Commission
Legal Services Agency
Maritime Safety Authority of New Zealand
Mental Health Commission
Museum of New Zealand Te Papa Tongarewa
New Zealand Antarctic Institute
New Zealand Artificial Limb Board
New Zealand Blood Service
New Zealand Film Commission
New Zealand Fire Service Commission
New Zealand Historic Places Trust (Pouhere Toanga)
New Zealand Lotteries Commission
New Zealand Qualifications Authority
New Zealand Sports Drug Agency
New Zealand Symphony Orchestra
New Zealand Teacher’s Council
New Zealand Tourism Board
New Zealand Trade and Enterprise
New Zealand Venture Investment Fund Limited
Office of Film and Literature Classification
Pharmaceutical Management Agency
Police Complaints Authority
Privacy Commissioner
Public Trust
Radio New Zealand Limited
Residual Health Management Unit
Retirement Commissioner
School boards of trustees (2,472)
Securities Commission
Social Workers Registration Board
Sport and Recreation New Zealand
Standards Council
Takeovers Panel
Te Reo Whakapuaki Irirangi (Te Mangai Paho)
Te Taura Whiri I Te Reo Maori (Maori Language Commission)
Television New Zealand Limited
Tertiary Education Commission
Tertiary education institutions (33)
Testing Laboratory Registration Council
Transit New Zealand
Transport Accident Investigation Commission
Organisations named or described in Schedule 4 to the Public Finance Act 1989
Agriculture and Marketing Research and Development Trust
Asia New Zealand Foundation
Fish and game councils (12)
Leadership Development Centre Trust
New Zealand Fish and Game Council
New Zealand Game Bird Habitat Trust Board
New Zealand Government Property Corporation
New Zealand Lottery Grants Board
Ngai Tahu Ancillary Claims Trust
Pacific Co-operation Foundation
Pacific Islands Business Development Trust
Reserves boards (26)
Road Safety Trust
Forecast Statement of Financial Performance
for the years ending 30 June
($ million) | | Note | | 2004
Actual | | 2005
Previous
Budget | | 2005
Forecast | | 2006
Forecast | | 2007
Forecast | | 2008
Forecast | | 2009
Forecast | |
Revenue | | | | | | | | | | | | | | | | | |
Taxation revenue | | 1 | | 42,532 | | 44,193 | | 45,980 | | 48,102 | | 49,442 | | 51,084 | | 54,338 | |
Levies, fees, fines and penalties | | 1 | | 2,986 | | 3,074 | | 3,079 | | 3,206 | | 3,311 | | 3,416 | | 3,517 | |
Total Revenue Levied through the Crown’s Sovereign Power | | 1 | | 45,518 | | 47,267 | | 49,059 | | 51,308 | | 52,753 | | 54,500 | | 57,855 | |
Sales of goods and services | | 2 | | 10,200 | | 10,716 | | 10,802 | | 11,850 | | 12,558 | | 12,984 | | 13,506 | |
Investment income | | 3 | | 2,653 | | 2,517 | | 3,127 | | 3,322 | | 3,661 | | 4,083 | | 4,517 | |
Other revenue | | 4 | | 2,016 | | 2,025 | | 2,277 | | 2,290 | | 2,266 | | 2,289 | | 2,278 | |
Total Revenue Earned through the Crown’s Operations | | | | 14,869 | | 15,258 | | 16,206 | | 17,462 | | 18,485 | | 19,356 | | 20,301 | |
Total Crown Revenue | | | | 60,387 | | 62,525 | | 65,265 | | 68,770 | | 71,238 | | 73,856 | | 78,156 | |
Expenses | | | | | | | | | | | | | | | | | |
By input type | | | | | | | | | | | | | | | | | |
Subsidies and transfer payments | | 5 | | 15,466 | | 16,249 | | 15,947 | | 17,002 | | 18,084 | | 19,099 | | 19,799 | |
Personnel expenses | | 6 | | 12,501 | | 13,027 | | 13,505 | | 14,483 | | 14,855 | | 15,123 | | 15,231 | |
Operating expenses | | 7 | | 22,662 | | 24,311 | | 24,967 | | 27,123 | | 28,414 | | 29,352 | | 29,743 | |
New operating spending up to Budget 2006 | | 8 | | — | | 441 | | 31 | | 271 | | 283 | | 271 | | 262 | |
Forecast new operating spending | | 8 | | — | | — | | — | | — | | 1,249 | | 3,006 | | 4,851 | |
Finance costs | | | | 2,602 | | 2,436 | | 2,659 | | 2,792 | | 2,624 | | 2,739 | | 2,658 | |
Net foreign-exchange (gains)/losses | | | | (29 | ) | — | | 36 | | — | | — | | — | | — | |
Movement in total GSF liability | | 15 | | (315 | ) | (57 | ) | 561 | | (24 | ) | (58 | ) | (93 | ) | (125 | ) |
Movement in total ACC liability | | 16 | | 170 | | 598 | | 1,807 | | 597 | | 596 | | 604 | | 601 | |
Total Crown expenses | | | | 53,057 | | 57,005 | | 59,513 | | 62,244 | | 66,047 | | 70,101 | | 73,020 | |
| | | | | | | | | | | | | | | | | |
Revenues less Expenses | | | | 7,330 | | 5,520 | | 5,752 | | 6,526 | | 5,191 | | 3,755 | | 5,136 | |
Net surplus of TEIs | | | | 139 | | 151 | | 139 | | 139 | | 139 | | 139 | | 139 | |
Operating balance (including minority interest) | | | | 7,469 | | 5,671 | | 5,891 | | 6,665 | | 5,330 | | 3,894 | | 5,275 | |
| | | | | | | | | | | | | | | | | |
Minority interest | | | | (45 | ) | — | | — | | — | | — | | — | | — | |
Operating Balance | | | | 7,424 | | 5,671 | | 5,891 | | 6,665 | | 5,330 | | 3,894 | | 5,275 | |
The revenues and expenses are GST exclusive.
The accompanying Notes and Accounting policies are an integral part of these Statements.
Below is an analysis of total Crown expenses and core Crown expenses by functional classification. This information reconciles to segmental information within the Statement of Segments.
($ million) | | 2004
Actual | | 2005
Previous
Budget | | 2005
Forecast | | 2006
Forecast | | 2007
Forecast | | 2008
Forecast | | 2009
Forecast | |
Total Crown expenses by functional classification | | | | | | | | | | | | | | | |
Social security and welfare | | 16,038 | | 17,180 | | 18,430 | | 18,173 | | 19,308 | | 20,405 | | 21,136 | |
GSF pension expenses | | 660 | | 985 | | 1,581 | | 1,019 | | 1,019 | | 1,011 | | 1,000 | |
Health | | 7,623 | | 8,486 | | 8,552 | | 9,330 | | 9,825 | | 9,893 | | 9,946 | |
Education | | 8,349 | | 8,706 | | 8,703 | | 9,163 | | 9,737 | | 10,008 | | 10,013 | |
Core government services | | 1,670 | | 1,746 | | 1,843 | | 2,009 | | 2,026 | | 2,072 | | 2,102 | |
Law and order | | 2,022 | | 2,133 | | 2,188 | | 2,364 | | 2,432 | | 2,449 | | 2,456 | |
Defence | | 1,259 | | 1,225 | | 1,271 | | 1,290 | | 1,380 | | 1,445 | | 1,524 | |
Transport and communications | | 5,443 | | 5,560 | | 5,794 | | 6,520 | | 6,554 | | 6,812 | | 7,005 | |
Economic and industrial services | | 4,070 | | 4,559 | | 4,759 | | 5,411 | | 5,617 | | 5,917 | | 5,930 | |
Primary services | | 1,074 | | 1,128 | | 1,149 | | 1,236 | | 1,231 | | 1,244 | | 1,260 | |
Heritage, culture and recreation | | 1,609 | | 1,667 | | 1,787 | | 1,810 | | 1,845 | | 1,896 | | 1,946 | |
Housing and community development | | 615 | | 630 | | 706 | | 739 | | 800 | | 816 | | 814 | |
Other | | 52 | | 123 | | 24 | | 117 | | 117 | | 117 | | 117 | |
Finance costs | | 2,602 | | 2,436 | | 2,659 | | 2,792 | | 2,624 | | 2,739 | | 2,658 | |
Net foreign-exchange (gains)/losses | | (29 | ) | — | | 36 | | — | | — | | — | | — | |
New operating spending up to Budget 2006 | | — | | 441 | | 31 | | 271 | | 283 | | 271 | | 262 | |
Forecast new operating spending | | — | | — | | — | | — | | 1,249 | | 3,006 | | 4,851 | |
Total Crown Expenses | | 53,057 | | 57,005 | | 59,513 | | 62,244 | | 66,047 | | 70,101 | | 73,020 | |
| | | | | | | | | | | | | | | |
Core Crown expenses by functional classification | | | | | | | | | | | | | | | |
Social security and welfare | | 14,252 | | 14,787 | | 14,736 | | 15,611 | | 16,558 | | 17,517 | | 18,108 | |
GSF pension expenses | | 660 | | 985 | | 1,581 | | 1,019 | | 1,019 | | 1,011 | | 1,000 | |
Health | | 8,111 | | 8,827 | | 8,815 | | 9,666 | | 10,152 | | 10,229 | | 10,284 | |
Education | | 7,585 | | 7,969 | | 8,068 | | 8,681 | | 8,994 | | 9,183 | | 9,256 | |
Core government services | | 1,741 | | 1,818 | | 1,962 | | 2,098 | | 2,064 | | 2,107 | | 2,107 | |
Law and order | | 1,843 | | 1,960 | | 2,019 | | 2,177 | | 2,229 | | 2,253 | | 2,260 | |
Defence | | 1,311 | | 1,275 | | 1,321 | | 1,341 | | 1,431 | | 1,501 | | 1,578 | |
Transport and communications | | 1,461 | | 1,498 | | 1,596 | | 1,895 | | 2,027 | | 2,237 | | 2,249 | |
Economic and industrial services | | 1,192 | | 1,392 | | 1,629 | | 1,679 | | 1,730 | | 1,870 | | 1,734 | |
Primary services | | 368 | | 409 | | 409 | | 445 | | 418 | | 420 | | 419 | |
Heritage, culture and recreation | | 634 | | 723 | | 756 | | 786 | | 758 | | 755 | | 758 | |
Housing and community development | | 139 | | 155 | | 169 | | 214 | | 259 | | 259 | | 249 | |
Other | | 52 | | 123 | | 24 | | 117 | | 117 | | 117 | | 117 | |
Finance costs | | 2,252 | | 2,112 | | 2,190 | | 2,245 | | 2,035 | | 2,044 | | 1,978 | |
Net foreign-exchange (gains)/losses | | 7 | | — | | 21 | | — | | — | | — | | — | |
New operating spending up to Budget 2006 | | — | | 441 | | 31 | | 271 | | 283 | | 271 | | 262 | |
Forecast new operating spending | | — | | — | | — | | — | | 1,249 | | 3,006 | | 4,851 | |
Total Core Crown Expenses | | 41,608 | | 44,474 | | 45,327 | | 48,245 | | 51,323 | | 54,780 | | 57,210 | |
The accompanying Notes and Accounting policies are an integral part of these Statements.
Forecast Statement of Cash Flows
for the year ending 30 June
($ million) | | 2004
Actual | | 2005
Previous
Budget | | 2005
Forecast | | 2006
Forecast | | 2007
Forecast | | 2008
Forecast | | 2009
Forecast | |
Cash Flows from Operations | | | | | | | | | | | | | | | |
Cash was Provided from | | | | | | | | | | | | | | | |
Total tax receipts (refer Note 1) | | 42,308 | | 43,992 | | 46,116 | | 48,106 | | 49,459 | | 51,113 | | 54,376 | |
Total other sovereign receipts (refer Note 1) | | 2,852 | | 2,851 | | 2,906 | | 2,995 | | 3,115 | | 3,197 | | 3,271 | |
Interest | | 1,366 | | 933 | | 1,274 | | 1,346 | | 1,411 | | 1,524 | | 1,619 | |
Dividends | | 56 | | 64 | | 66 | | 73 | | 80 | | 89 | | 96 | |
Sales of goods and services | | 10,478 | | 10,453 | | 11,095 | | 12,118 | | 12,787 | | 13,237 | | 13,740 | |
Other operating receipts | | 1,958 | | 1,969 | | 1,938 | | 2,194 | | 2,188 | | 2,241 | | 2,226 | |
Total Cash Provided from Operations | | 59,018 | | 60,262 | | 63,395 | | 66,832 | | 69,040 | | 71,401 | | 75,328 | |
| | | | | | | | | | | | | | | |
Cash was Disbursed to | | | | | | | | | | | | | | | |
Subsidies and transfer payments | | 15,370 | | 16,244 | | 16,052 | | 17,236 | | 18,369 | | 19,416 | | 20,118 | |
Personnel and operating payments | | 32,398 | | 34,314 | | 34,005 | | 37,911 | | 39,385 | | 40,712 | | 41,085 | |
Finance costs | | 2,256 | | 2,175 | | 2,402 | | 2,471 | | 2,332 | | 2,370 | | 2,425 | |
Forecast new operating spending | | — | | 441 | | 31 | | 271 | | 1,532 | | 3,277 | | 5,113 | |
Total Cash Disbursed to Operations | | 50,024 | | 53,174 | | 52,490 | | 57,889 | | 61,618 | | 65,775 | | 68,741 | |
Net Cash Flows from Operations | | 8,994 | | 7,088 | | 10,905 | | 8,943 | | 7,422 | | 5,626 | | 6,587 | |
| | | | | | | | | | | | | | | |
Cash Flows from Investing Activities | | | | | | | | | | | | | | | |
Cash was Provided from | | | | | | | | | | | | | | | |
Sale of physical assets | | 226 | | — | | 316 | | — | | — | | — | | — | |
Total Cash Provided | | 226 | | — | | 316 | | — | | — | | — | | — | |
| | | | | | | | | | | | | | | |
Cash was Disbursed to | | | | | | | | | | | | | | | |
Purchase of physical assets | | 3,761 | | 4,567 | | 5,128 | | 6,553 | | 4,701 | | 3,705 | | 4,060 | |
Net increase in advances | | 976 | | 1,376 | | 1,525 | | 1,943 | | 1,423 | | 1,446 | | 690 | |
Net purchase/(sale) of marketable securities,deposits and other equity investments | | 2,556 | | 767 | | 5,819 | | 2,086 | | 387 | | 1,433 | | 2,135 | |
Forecast new capital spending | | — | | 228 | | — | | 100 | | 646 | | 750 | | 750 | |
Total Cash Disbursed | | 7,293 | | 6,938 | | 12,472 | | 10,682 | | 7,157 | | 7,334 | | 7,635 | |
| | | | | | | | | | | | | | | |
Net Cash Flows from Investing Activities | | (7,067 | ) | (6,938 | ) | (12,156 | ) | (10,682 | ) | (7,157 | ) | (7,334 | ) | (7,635 | ) |
| | | | | | | | | | | | | | | |
Net Cash Flows from Operating and Investing Activities | | 1,927 | | 150 | | (1,251 | ) | (1,739 | ) | 265 | | (1,708 | ) | (1,048 | ) |
| | | | | | | | | | | | | | | |
Cash Flows from Financing Activities | | | | | | | | | | | | | | | |
Cash was Provided from | | | | | | | | | | | | | | | |
Issue of circulating currency | | 114 | | — | | 205 | | — | | — | | — | | — | |
Net (repayment)/issue of Government stock(1) | | (1,120 | ) | (746 | ) | (831 | ) | (647 | ) | (341 | ) | 2,356 | | (187 | ) |
Total Cash Provided | | (1,006 | ) | (746 | ) | (626 | ) | (647 | ) | (341 | ) | 2,356 | | (187 | ) |
| | | | | | | | | | | | | | | |
Cash was Disbursed to | | | | | | | | | | | | | | | |
Net (issue)/repayment of foreign-currency borrowing | | (129 | ) | (245 | ) | (1,699 | ) | (1,518 | ) | 330 | | (381 | ) | (1,725 | ) |
Net repayment/(issue) of other New Zealand-dollar borrowing | | 241 | | (131 | ) | 472 | | (497 | ) | (571 | ) | 600 | | 189 | |
Total Cash Disbursed | | 112 | | (376 | ) | (1,227 | ) | (2,015 | ) | (241 | ) | 219 | | (1,536 | ) |
Net Cash Flows from Financing Activities | | (1,118 | ) | (370 | ) | 601 | | 1,368 | | (100 | ) | 2,137 | | 1,349 | |
| | | | | | | | | | | | | | | |
Net Movement in Cash | | 809 | | (220 | ) | (650 | ) | (371 | ) | 165 | | 429 | | 301 | |
| | | | | | | | | | | | | | | |
Opening Cash Balance | | 2,732 | | 2,341 | | 3,450 | | 2,817 | | 2,446 | | 2,611 | | 3,040 | |
Foreign-exchange (losses)/gains on opening cash | | (91 | ) | — | | 19 | | — | | — | | — | | — | |
Closing Cash Balance | | 3,450 | | 2,121 | | 2,819 | | 2,446 | | 2,611 | | 3,040 | | 3,341 | |
(1) Net issues of Government stock include movements within government stock holdings of entities such as NZS Fund, GSF, ACC and EQC. The Bonds Reconciliation at the end of these forecasts outlines NZDMO issues of Government stock.
The accompanying Notes and Accounting policies are an integral part of these Statements.
($ million) | | 2004
Actual | | 2005
Previous
Budget | | 2005
Forecast | | 2006
Forecast | | 2007
Forecast | | 2008
Forecast | | 2009
Forecast | |
| | | | | | | | | | | | | | | |
Reconciliation Between the Forecast Net Cash Flows from Operations and the Operating Balance | | | | | | | | | | | | | | | |
Net Cash Flows from Operations | | 8,994 | | 7,088 | | 10,905 | | 8,943 | | 7,422 | | 5,626 | | 6,587 | |
Items included in the operating balance but not in net cash flows from operations | | | | | | | | | | | | | | | |
Valuation Changes | | | | | | | | | | | | | | | |
(Increase)/decrease in pension liabilities | | 315 | | 57 | | (561 | ) | 24 | | 58 | | 93 | | 125 | |
(Increase)/decrease in ACC liability | | (170 | ) | (598 | ) | (1,807 | ) | (597 | ) | (596 | ) | (604 | ) | (601 | ) |
Decrease/(increase) in NPF guarantee | | (9 | ) | — | | — | | — | | — | | — | | — | |
Unrealised net foreign-exchange (losses)/gains | | (225 | ) | — | | 5 | | — | | — | | — | | — | |
Non-cash movements in investments | | 648 | | 425 | | 684 | | 500 | | 517 | | 535 | | 568 | |
Unrealised losses arising from changes in the value of commercial forests | | (40 | ) | — | | — | | — | | — | | — | | — | |
Total Valuation Changes | | 519 | | (116 | ) | (1,679 | ) | (73 | ) | (21 | ) | 24 | | 92 | |
Physical Asset Movements | | | | | | | | | | | | | | | |
Depreciation | | (2,347 | ) | (2,535 | ) | (2,560 | ) | (2,744 | ) | (2,942 | ) | (3,126 | ) | (3,174 | ) |
(Loss)/gain on sale of assets | | 15 | | — | | — | | — | | — | | — | | — | |
Total Physical Asset Movements | | (2,332 | ) | (2,535 | ) | (2,560 | ) | (2,744 | ) | (2,942 | ) | (3,126 | ) | (3,174 | ) |
Other Non-cash Items | | | | | | | | | | | | | | | |
Student Loans | | (80 | ) | (5 | ) | (75 | ) | (45 | ) | (39 | ) | (27 | ) | (22 | ) |
Amortisation of goodwill | | (78 | ) | (47 | ) | (96 | ) | (94 | ) | (92 | ) | (92 | ) | (90 | ) |
Accrued income from NZS Fund | | 193 | | 331 | | 411 | | 467 | | 639 | | 828 | | 1,042 | |
Other | | (54 | ) | 78 | | 139 | | 139 | | 139 | | 139 | | 139 | |
Total Other Non-cash Items | | (19 | ) | 357 | | 379 | | 467 | | 647 | | 848 | | 1,069 | |
Movements in Working Capital | | | | | | | | | | | | | | | |
Increase/(decrease) in taxes receivable | | 468 | | 106 | | (176 | ) | (82 | ) | (70 | ) | (81 | ) | (85 | ) |
Increase/(decrease) in other receivables | | (24 | ) | 293 | | (273 | ) | 149 | | 230 | | 236 | | 261 | |
Increase/(decrease) in inventories | | 48 | | 70 | | 51 | | 82 | | 26 | | 31 | | 49 | |
Decrease/(increase) in payables | | (230 | ) | 408 | | (756 | ) | (77 | ) | 38 | | 336 | | 476 | |
Total Movements in Working Capital | | 262 | | 877 | | (1,154 | ) | 72 | | 224 | | 522 | | 701 | |
Operating Balance | | 7,424 | | 5,671 | | 5,891 | | 6,665 | | 5,330 | | 3,894 | | 5,275 | |
The accompanying Notes and Accounting policies are an integral part of these Statements.
Forecast Statement of Movement in Equity
for the year ending 30 June
($ million) | | 2004
Actual | | 2005
Previous
Budget | | 2005
Forecast | | 2006
Forecast | | 2007
Forecast | | 2008
Forecast | | 2009
Forecast | |
Opening Net Worth | | 23,781 | | 29,732 | | 35,463 | | 41,972 | | 48,637 | | 53,967 | | 57,861 | |
Operating balance for the year | | 7,424 | | 5,671 | | 5,891 | | 6,665 | | 5,330 | | 3,894 | | 5,275 | |
Net revaluations | | 4,258 | | — | | 618 | | — | | — | | — | | — | |
Total Recognised Revenues and Expenses | | 11,682 | | 5,671 | | 6,509 | | 6,665 | | 5,330 | | 3,894 | | 5,275 | |
Closing Net Worth | | 35,463 | | 35,403 | | 41,972 | | 48,637 | | 53,967 | | 57,861 | | 63,136 | |
The accompanying Notes and Accounting policies are an integral part of these Statements.
Forecast Statement of Financial Position
as at 30 June
($ million) | | Note | | 2004
Actual | | 2005
Previous
Budget | | 2005
Forecast | | 2006
Forecast | | 2007
Forecast | | 2008
Forecast | | 2009
Forecast | |
Assets | | | | | | | | | | | | | | | | | |
Cash and bank balances | | 9 | | 3,450 | | 2,121 | | 2,819 | | 2,446 | | 2,611 | | 3,040 | | 3,341 | |
Marketable securities, deposits & equity investments | | 9 | | 24,636 | | 23,296 | | 29,950 | | 32,730 | | 34,031 | | 37,027 | | 40,854 | |
Advances | | 10 | | 7,445 | | 8,921 | | 9,086 | | 10,453 | | 11,657 | | 12,293 | | 12,926 | |
Receivables | | 11 | | 10,587 | | 9,952 | | 10,138 | | 10,205 | | 10,365 | | 10,520 | | 10,696 | |
Inventories | | | | 888 | | 958 | | 939 | | 1,021 | | 1,047 | | 1,078 | | 1,127 | |
Other investments | | 12 | | 259 | | 253 | | 234 | | 234 | | 234 | | 234 | | 234 | |
Property, plant and equipment | | 13 | | 57,940 | | 56,194 | | 60,794 | | 65,092 | | 67,128 | | 68,311 | | 69,264 | |
TEI investment | | | | 4,367 | | 4,610 | | 4,518 | | 4,657 | | 4,796 | | 4,935 | | 5,074 | |
Commercial forests | | | | 251 | | 291 | | 251 | | 251 | | 251 | | 251 | | 251 | |
Intangible assets (including goodwill) | | | | 849 | | 1,010 | | 718 | | 633 | | 554 | | 481 | | 411 | |
Forecast new capital spending | | | | — | | 228 | | — | | 100 | | 746 | | 1,496 | | 2,246 | |
Total Assets | | | | 110,672 | | 107,834 | | 119,447 | | 127,822 | | 133,420 | | 139,666 | | 146,424 | |
Liabilities | | | | | | | | | | | | | | | | | |
Payables and provisions | | 14 | | 12,486 | | 10,127 | | 13,309 | | 13,986 | | 14,476 | | 14,710 | | 14,883 | |
Currency issued | | | | 3,009 | | 3,072 | | 3,214 | | 3,214 | | 3,214 | | 3,214 | | 3,214 | |
Borrowings - sovereign guaranteed | | | | 29,958 | | 26,620 | | 27,712 | | 26,179 | | 24,724 | | 25,965 | | 26,402 | |
Borrowings - non-sovereign guaranteed | | | | 6,867 | | 8,237 | | 7,983 | | 9,976 | | 10,671 | | 11,037 | | 11,434 | |
Provision for GSF pension liability | | 15 | | 13,542 | | 14,014 | | 14,103 | | 14,079 | | 14,021 | | 13,928 | | 13,803 | |
Provision for ACC outstanding claims liability | | 16 | | 9,347 | | 10,361 | | 11,154 | | 11,751 | | 12,347 | | 12,951 | | 13,552 | |
Total Liabilities | | | | 75,209 | | 72,431 | | 77,475 | | 79,185 | | 79,453 | | 81,805 | | 83,288 | |
Total Assets less Total Liabilities | | | | 35,463 | | 35,403 | | 41,972 | | 48,637 | | 53,967 | | 57,861 | | 63,136 | |
Net Worth | | | | | | | | | | | | | | | | | |
Taxpayer funds | | | | 15,486 | | 19,721 | | 21,514 | | 28,179 | | 33,509 | | 37,403 | | 42,678 | |
Revaluation reserve | | 17 | | 19,838 | | 15,682 | | 20,458 | | 20,458 | | 20,458 | | 20,458 | | 20,458 | |
Minority Interest | | | | 139 | | — | | — | | — | | — | | — | | — | |
Net Worth | | | | 35,463 | | 35,403 | | 41,972 | | 48,637 | | 53,967 | | 57,861 | | 63,136 | |
The accompanying Notes and Accounting policies are an integral part of these Statements.
New Zealand Superannuation Fund
Within MSDs & equity investments is the NZS Fund (except for cross holdings of investments with other parts of the Crown, for example the NZS Fund will hold NZ Government Stock). The following information includes all investments and income, including cross-holdings of NZ Government Stock and accrued interest on such stock.
($ million) | | 2004
Actual | | 2005
Previous
Budget | | 2005
Forecast | | 2006
Forecast | | 2007
Forecast | | 2008
Forecast | | 2009
Forecast | |
Opening balance | | 1,884 | | 3,885 | | 3,956 | | 6,474 | | 9,278 | | 12,292 | | 15,653 | |
Gross contribution | | 1,879 | | 2,107 | | 2,107 | | 2,337 | | 2,375 | | 2,533 | | 2,744 | |
Income after tax | | 193 | | 331 | | 411 | | 467 | | 639 | | 828 | | 1,042 | |
NZS Fund balance | | 3,956 | | 6,323 | | 6,474 | | 9,278 | | 12,292 | | 15,653 | | 19,439 | |
Gross and Net Debt Information
Definitions of debt:
Total Crown gross debt is the total borrowings (both sovereign-guaranteed and non-sovereign guaranteed) of the total Crown. This equates to the amount in the total Crown balance sheet and represents the complete picture of whole-of-Crown debt obligations to external parties.
The balance sheet splits total Crown debt into sovereign-guaranteed and non-sovereign-guaranteed debt. This split reflects the fact that debt held by SOEs and Crown entities is not explicitly guaranteed by the Crown. Any such debt that may be guaranteed is included in the sovereign-guaranteed total. No debt of SOEs and Crown entities is currently guaranteed by the Crown.
Gross sovereign-issued debt is debt issued by the sovereign (i.e., core Crown) and includes Government stock held by the NZS Fund, GSF, ACC or EQC for example. In other words, the gross sovereign-issued debt does not eliminate any internal cross-holdings. The Government’s debt objective uses this measure of debt.
Total Crown (refer to the Forecast Statement of Segments) | | | | | | | | | | | | | | | |
Total Crown gross debt | | 36,825 | | 34,857 | | 35,695 | | 36,155 | | 35,395 | | 37,002 | | 37,836 | |
| | | | | | | | | | | | | | | |
Core Crown sovereign guaranteed borrowings | | 34,719 | | 31,693 | | 33,115 | | 32,000 | | 30,991 | | 32,695 | | 33,607 | |
excl cross holdings of NZS Fund and GSF | | (808 | ) | (970 | ) | (996 | ) | (1,284 | ) | (1,592 | ) | (1,934 | ) | (2,318 | ) |
Gross sovereign-issued debt | | 35,527 | | 32,663 | | 34,111 | | 33,284 | | 32,583 | | 34,629 | | 35,925 | |
| | | | | | | | | | | | | | | |
Core Crown | | | | | | | | | | | | | | | |
Gross sovereign issued debt | | 35,527 | | 32,663 | | 34,111 | | 33,284 | | 32,583 | | 34,629 | | 35,925 | |
Financial assets | | (26,752 | ) | (26,051 | ) | (31,525 | ) | (34,564 | ) | (36,253 | ) | (39,488 | ) | (43,320 | ) |
| | 8,775 | | 6,612 | | 2,586 | | (1,280 | ) | (3,670 | ) | (4,859 | ) | (7,395 | ) |
| | | | | | | | | | | | | | | |
NZS Fund and GSF financial assets | | 6,429 | | 8,724 | | 8,947 | | 11,537 | | 14,310 | | 17,386 | | 20,834 | |
Net Core Crown Debt | | 15,204 | | 15,336 | | 11,533 | | 10,257 | | 10,640 | | 12,527 | | 13,439 | |
The accompanying Notes and Accounting policies are an integral part of these Statements.
Forecast Statement of Borrowings
for the years ending 30 June
($ million) | | 2004
Actual | | 2005
Previous
Budget | | 2005
Forecast | | 2006
Forecast | | 2007
Forecast | | 2008
Forecast | | 2009
Forecast | |
Sovereign Guaranteed Debt | | | | | | | | | | | | | | | |
New Zealand-Dollar Debt | | | | | | | | | | | | | | | |
Government stock | | 17,351 | | 16,283 | | 15,903 | | 14,858 | | 14,106 | | 16,033 | | 15,399 | |
Treasury bills | | 5,525 | | 5,393 | | 4,750 | | 4,364 | | 4,272 | | 4,028 | | 5,387 | |
Loans and foreign-exchange contracts | | (1,098 | ) | (500 | ) | 2,403 | | 1,427 | | 376 | | (131 | ) | (378 | ) |
Retail stock and other | | 654 | | 516 | | 638 | | 674 | | 614 | | 574 | | 533 | |
Total New Zealand-Dollar Debt | | 22,432 | | 21,692 | | 23,694 | | 21,323 | | 19,368 | | 20,504 | | 20,941 | |
| | | | | | | | | | | | | | | |
Foreign-Currency Debt | | | | | | | | | | | | | | | |
United States dollars | | 3,079 | | 1,998 | | (816 | ) | 84 | | 584 | | 785 | | 785 | |
Japanese yen | | 1,015 | | 729 | | 382 | | 382 | | 382 | | 382 | | 382 | |
European and other currencies | | 3,432 | | 2,201 | | 4,452 | | 4,390 | | 4,390 | | 4,294 | | 4,294 | |
Total Foreign-Currency Debt | | 7,526 | | 4,928 | | 4,018 | | 4,856 | | 5,356 | | 5,461 | | 5,461 | |
Total Sovereign Guaranteed Debt | | 29,958 | | 26,620 | | 27,712 | | 26,179 | | 24,724 | | 25,965 | | 26,402 | |
| | | | | | | | | | | | | | | |
Non-Sovereign Guaranteed Debt | | | | | | | | | | | | | | | |
New Zealand | | 4,283 | | 7,247 | | 5,945 | | 7,259 | | 7,753 | | 8,182 | | 8,824 | |
United States dollars | | 1,679 | | 867 | | 1,542 | | 2,221 | | 2,421 | | 2,364 | | 2,254 | |
Japanese yen | | 351 | | — | | — | | — | | — | | — | | — | |
European and other currencies | | 554 | | 123 | | 496 | | 496 | | 497 | | 491 | | 356 | |
Total Non-Sovereign Guaranteed Debt | | 6,867 | | 8,237 | | 7,983 | | 9,976 | | 10,671 | | 11,037 | | 11,434 | |
Total Borrowings (Gross Debt) | | 36,825 | | 34,857 | | 35,695 | | 36,155 | | 35,395 | | 37,002 | | 37,836 | |
| | | | | | | | | | | | | | | |
Less | | | | | | | | | | | | | | | |
Financial Assets (including restricted assets) | | | | | | | | | | | | | | | |
Marketable Securities, Deposits and Equity Investments | | | | | | | | | | | | | | | |
New Zealand dollars | | 7,089 | | 7,055 | | 12,443 | | 11,774 | | 9,722 | | 9,497 | | 9,902 | |
United States dollars | | 4,069 | | 3,789 | | 2,422 | | 3,633 | | 4,467 | | 5,032 | | 5,441 | |
Japanese yen | | 1,206 | | 763 | | 417 | | 417 | | 417 | | 417 | | 417 | |
European and other currencies | | 2,814 | | 765 | | 3,270 | | 3,202 | | 3,196 | | 3,093 | | 3,084 | |
Reserve Position at IMF | | 1,012 | | 857 | | 654 | | 662 | | 671 | | 681 | | 693 | |
NZ equity investments | | 1,968 | | 2,036 | | 2,350 | | 2,698 | | 3,090 | | 3,494 | | 3,903 | |
Foreign equity investments | | 6,478 | | 8,031 | | 8,394 | | 10,344 | | 12,468 | | 14,813 | | 17,414 | |
Total | | 24,636 | | 23,296 | | 29,950 | | 32,730 | | 34,031 | | 37,027 | | 40,854 | |
| | | | | | | | | | | | | | | |
Advances and Cash | | | | | | | | | | | | | | | |
Student loans | | 5,995 | | 6,864 | | 6,594 | | 7,195 | | 7,802 | | 8,422 | | 9,046 | |
Other advances | | 1,450 | | 2,057 | | 2,492 | | 3,258 | | 3,855 | | 3,871 | | 3,880 | |
Cash | | 3,450 | | 2,121 | | 2,819 | | 2,446 | | 2,611 | | 3,040 | | 3,341 | |
Total | | 10,895 | | 11,042 | | 11,905 | | 12,899 | | 14,268 | | 15,333 | | 16,267 | |
| | | | | | | | | | | | | | | |
Total Financial Assets | | 35,531 | | 34,338 | | 41,855 | | 45,629 | | 48,299 | | 52,360 | | 57,121 | |
| | | | | | | | | | | | | | | |
Borrowings less Financial Assets | | 1,294 | | 519 | | (6,160 | ) | (9,474 | ) | (12,904 | ) | (15,358 | ) | (19,285 | ) |
| | | | | | | | | | | | | | | |
Net New Zealand-dollar debt | | 6,862 | | 6,560 | | 2,988 | | 1,252 | | 82 | | 402 | | (266 | ) |
Net foreign-currency debt | | (5,568 | ) | (6,041 | ) | (9,148 | ) | (10,726 | ) | (12,986 | ) | (15,760 | ) | (19,019 | ) |
Borrowings less Financial Assets | | 1,294 | | 519 | | (6,160 | ) | (9,474 | ) | (12,904 | ) | (15,358 | ) | (19,285 | ) |
The accompanying Notes and Accounting policies are an integral part of these Statements.
Statement of Actual Commitments
as at 31 March
($ million) | | As at
31 March
2005 | | As at
30 June
2004 | |
Capital Commitments | | | | | |
Specialist military equipment | | 887 | | 86 | |
Land and buildings | | 1,813 | | 1,611 | |
Other property, plant and equipment | | 870 | | 1,012 | |
Other capital commitments | | 104 | | 400 | |
Investments | | 60 | | 60 | |
Total Capital Commitments | | 3,734 | | 3,169 | |
| | | | | |
Operating Commitments | | | | | |
Non-cancellable accommodation leases | | 1,458 | | 1,492 | |
Other non-cancellable leases | | 2,337 | | 2,330 | |
Non-cancellable contracts for the supply of goods and services | | 5,755 | | 2,253 | |
Other operating commitments | | 2,541 | | 3,567 | |
TEIs | | 325 | | 325 | |
Total Operating Commitments | | 12,416 | | 9,967 | |
| | | | | |
Total Commitments | | 16,150 | | 13,136 | |
| | | | | |
Total Commitment by Institutional Segment | | | | | |
Core Crown | | 7,338 | | 3,530 | |
Crown entities | | 6,634 | | 7,413 | |
State-owned enterprises | | 2,178 | | 2,193 | |
Total Commitments | | 16,150 | | 13,136 | |
The accompanying Notes and Accounting policies are an integral part of these Statements.
Statement of Actual Contingent Liabilities
as at 31 March
($ million) | | As at
31 March
2005 | | As at
30 June
2004 | |
| | | | | |
Guarantees and indemnities | | 166 | | 292 | |
Uncalled capital | | 2,218 | | 2,528 | |
Legal proceedings and disputes | | 727 | | 794 | |
Other quantifiable contingent liabilities | | 1,458 | | 1,371 | |
Total Quantifiable Contingent Liabilities | | 4,569 | | 4,985 | |
| | | | | |
Total Quantifiable Contingent Liabilities by Institutional Segment | | | | | |
Core Crown | | 4,298 | | 4,734 | |
Crown Entities | | 11 | | 53 | |
State-owned enterprises | | 260 | | 198 | |
Total Quantifiable Contingent Liabilities | | 4,569 | | 4,985 | |
| | | | | |
Quantifiable Contingent Assets | | | | | |
Core Crown - Education and Transport | | 121 | | 157 | |
Total Quantifiable Contingent Assets | | 121 | | 157 | |
The accompanying Notes and Accounting policies are an integral part of these Statements.
A detailed Statement of Contingent Liabilities and Assets (quantified and unquantified) is outlined on pages 116 to 118 of the Specific Fiscal Risk chapter.
The Statement of Specific Risks (quantified and unquantified) is outlined on pages 106 to 115 of the Specific Fiscal Risk chapter.
Forecast Statement of Segments
Statement of Financial Performance (institutional form)
for the year ended 30 June 2004
| | Core Crown | | Crown entities | | State-owned
enterprises | | Inter-segment eliminations | | Total Crown | |
($ million) | | 2004 | | 2004 | | 2004 | | 2004 | | 2004 | |
| | $m | | $m | | $m | | $m | | $m | |
Revenue | | | | | | | | | | | |
Taxation revenue | | 43,008 | | — | | — | | (476 | ) | 42,532 | |
Other sovereign levied income | | 611 | | 2,415 | | — | | (40 | ) | 2,986 | |
Sales of goods and services | | 736 | | 1,700 | | 8,209 | | (445 | ) | 10,200 | |
Investment income | | 1,999 | | 984 | | 132 | | (462 | ) | 2,653 | |
Other revenues | | 578 | | 16,073 | | 616 | | (15,251 | ) | 2,016 | |
Total revenue | | 46,932 | | 21,172 | | 8,957 | | (16,674 | ) | 60,387 | |
Expenses by input type | | | | | | | | | | | |
Subsidies and transfer payments | | 14,058 | | 1,408 | | — | | — | | 15,466 | |
Personnel expenses | | 4,315 | | 6,566 | | 1,624 | | (4 | ) | 12,501 | |
Operating expenses | | 21,291 | | 11,200 | | 6,377 | | (16,206 | ) | 22,662 | |
Finance costs | | 2,252 | | 235 | | 298 | | (183 | ) | 2,602 | |
FX losses/(gains) | | 7 | | 23 | | (59 | ) | — | | (29 | ) |
GSF and ACC liability revaluation movements | | (315 | ) | 170 | | — | | — | | (145 | ) |
Total expenses | | 41,608 | | 19,602 | | 8,240 | | (16,393 | ) | 53,057 | |
Expenses by functional classification | | | | | | | | | | | |
Social security and welfare | | 14,252 | | 2,199 | | — | | (413 | ) | 16,038 | |
Health | | 8,111 | | 6,613 | | — | | (7,101 | ) | 7,623 | |
Education | | 7,585 | | 6,175 | | — | | (5,411 | ) | 8,349 | |
Other functional classifications | | 9,401 | | 4,357 | | 8,001 | | (3,285 | ) | 18,474 | |
Forecast new operating spending | | — | | — | | — | | — | | — | |
Finance costs and FX losses/(gains) | | 2,259 | | 258 | | 239 | | (183 | ) | 2,573 | |
Total expenses | | 41,608 | | 19,602 | | 8,240 | | (16,393 | ) | 53,057 | |
TEI’s and Minority Interest | | | | 139 | | (45 | ) | — | | 94 | |
| | | | | | | | | | | |
Operating balance | | 5,324 | | 1,709 | | 672 | | (281 | ) | 7,424 | |
Statement of Financial Position (institutional form)
as at 30 June 2004
| | Core Crown | | Crown entities | | State-owned
enterprises | | Inter-segment eliminations | | Total Crown | |
($ million) | | 2004 | | 2004 | | 2004 | | 2004 | | 2004 | |
| | $m | | $m | | $m | | $m | | $m | |
Assets | | | | | | | | | | | |
Financial assets | | 26,752 | | 13,117 | | 2,750 | | (7,088 | ) | 35,531 | |
Physical assets | | 18,675 | | 28,884 | | 10,381 | | — | | 57,940 | |
Investment in SOEs and CEs (including TEIs) | | 23,162 | | 4,367 | | — | | (23,162 | ) | 4,367 | |
Other assets | | 9,088 | | 2,589 | | 2,147 | | (990 | ) | 12,834 | |
Total assets | | 77,677 | | 48,957 | | 15,278 | | (31,240 | ) | 110,672 | |
Liabilities | | | | | | | | | | | |
Borrowings | | 34,719 | | 3,757 | | 5,437 | | (7,088 | ) | 36,825 | |
Other liabilities | | 23,489 | | 13,539 | | 2,830 | | (1,474 | ) | 38,384 | |
Total liabilities | | 58,208 | | 17,296 | | 8,267 | | (8,562 | ) | 75,209 | |
Net worth | | 19,469 | | 31,661 | | 7,011 | | (22,678 | ) | 35,463 | |
| | | | | | | | | | | |
Taxpayer funds | | 13,626 | | 19,126 | | 5,412 | | (22,678 | ) | 15,486 | |
Revaluation reserves | | 5,843 | | 12,535 | | 1,460 | | — | | 19,838 | |
Minority Interest | | — | | — | | 139 | | — | | 139 | |
Net worth | | 19,469 | | 31,661 | | 7,011 | | (22,678 | ) | 35,463 | |
Analysis of financial assets and borrowings | | | | | | | | | | | |
Advances and cash | | 8,919 | | 1,794 | | 2,305 | | (2,123 | ) | 10,895 | |
MSDs and equity investments | | 17,833 | | 11,323 | | 445 | | (4,965 | ) | 24,636 | |
Total financial assets | | 26,752 | | 13,117 | | 2,750 | | (7,088 | ) | 35,531 | |
Borrowings - Sovereign guaranteed | | 34,719 | | — | | — | | (4,761 | ) | 29,958 | |
Borrowings - Non-sovereign guaranteed | | — | | 3,757 | | 5,437 | | (2,327 | ) | 6,867 | |
Total borrowings | | 34,719 | | 3,757 | | 5,437 | | (7,088 | ) | 36,825 | |
Borrowings less financial assets | | 7,967 | | (9,360 | ) | 2,687 | | — | | 1,294 | |
Net Crown debt | | 15,204 | | Net Crown debt and gross sovereign-issued debt differ from | |
Gross sovereign-issued debt | | 35,527 | | the analysis above due to elimination of cross-holdings of Govt stock and adding back the NZS Fund and GSF assets. | |
Forecast Statement of Financial Performance (institutional form)
for the year ended 30 June 2005
| | Core Crown | | Crown entities | | State-owned enterprises | | Inter-segment eliminations | | Total Crown | |
($ million) | | 2005 | | 2005 | | 2005 | | 2005 | | 2005 | |
| | $m | | $m | | $m | | $m | | $m | |
Revenue | | | | | | | | | | | |
Taxation revenue | | 46,455 | | — | | — | | (475 | ) | 45,980 | |
Other sovereign levied income | | 650 | | 2,476 | | — | | (47 | ) | 3,079 | |
Sales of goods and services | | 746 | | 1,694 | | 8,796 | | (434 | ) | 10,802 | |
Investment income | | 2,526 | | 1,020 | | 182 | | (601 | ) | 3,127 | |
Other revenues | | 768 | | 16,881 | | 688 | | (16,060 | ) | 2,277 | |
Total revenue | | 51,145 | | 22,071 | | 9,666 | | (17,617 | ) | 65,265 | |
Expenses by input type | | | | | | | | | | | |
Subsidies and transfer payments | | 14,418 | | 1,529 | | — | | — | | 15,947 | |
Personnel expenses | | 4,757 | | 6,999 | | 1,755 | | (6 | ) | 13,505 | |
Operating expenses | | 23,380 | | 11,967 | | 6,670 | | (17,019 | ) | 24,998 | |
Finance costs | | 2,190 | | 258 | | 365 | | (154 | ) | 2,659 | |
FX losses/(gains) | | 21 | | 70 | | (55 | ) | — | | 36 | |
GSF and ACC liability revaluation movements | | 561 | | 1,807 | | — | | — | | 2,368 | |
Total expenses | | 45,327 | | 22,630 | | 8,735 | | (17,179 | ) | 59,513 | |
Expenses by functional classification | | | | | | | | | | | |
Social security and welfare | | 14,736 | | 4,127 | | — | | (433 | ) | 18,430 | |
Health | | 8,815 | | 7,201 | | — | | (7,464 | ) | 8,552 | |
Education | | 8,068 | | 6,173 | | — | | (5,538 | ) | 8,703 | |
Other functional classifications | | 11,466 | | 4,801 | | 8,425 | | (3,590 | ) | 21,102 | |
Forecast new operating spending | | 31 | | — | | — | | — | | 31 | |
Finance costs and FX losses/(gains) | | 2,211 | | 328 | | 310 | | (154 | ) | 2,695 | |
Total expenses | | 45,327 | | 22,630 | | 8,735 | | (17,179 | ) | 59,513 | |
Net surplus TEIs | | — | | 139 | | — | | — | | 139 | |
Operating balance | | 5,818 | | (420 | ) | 931 | | (438 | ) | 5,891 | |
Forecast Statement of Financial Position (institutional form)
as at 30 June 2005
| | Core Crown | | Crown entities | | State-owned
enterprises | | Inter-segment eliminations | | Total Crown | |
($ million) | | 2005 | | 2005 | | 2005 | | 2005 | | 2005 | |
| | $m | | $m | | $m | | $m | | $m | |
Assets | | | | | | | | | | | |
Financial assets | | 31,525 | | 14,521 | | 3,523 | | (7,714 | ) | 41,855 | |
Physical assets | | 19,190 | | 29,596 | | 12,008 | | — | | 60,794 | |
Investment in SOEs and CEs (including TEIs) | | 23,711 | | 4,518 | | — | | (23,711 | ) | 4,518 | |
Other assets | | 8,372 | | 2,339 | | 2,390 | | (821 | ) | 12,280 | |
Total assets | | 82,798 | | 50,974 | | 17,921 | | (32,246 | ) | 119,447 | |
Liabilities | | | | | | | | | | | |
Borrowings | | 33,115 | | 3,744 | | 6,550 | | (7,714 | ) | 35,695 | |
Other liabilities | | 24,394 | | 15,854 | | 2,883 | | (1,351 | ) | 41,780 | |
Total liabilities | | 57,509 | | 19,598 | | 9,433 | | (9,065 | ) | 77,475 | |
Net worth | | 25,289 | | 31,376 | | 8,488 | | (23,181 | ) | 41,972 | |
Taxpayer funds | | 19,446 | | 18,840 | | 6,409 | | (23,181 | ) | 21,514 | |
Revaluation reserves | | 5,843 | | 12,536 | | 2,079 | | — | | 20,458 | |
Net worth | | 25,289 | | 31,376 | | 8,488 | | (23,181 | ) | 41,972 | |
Analysis of financial assets and borrowings | | | | | | | | | | | |
Advances and cash | | 9,152 | | 1,824 | | 3,131 | | (2,202 | ) | 11,905 | |
MSDs and equity investments | | 22,373 | | 12,697 | | 392 | | (5,512 | ) | 29,950 | |
Total financial assets | | 31,525 | | 14,521 | | 3,523 | | (7,714 | ) | 41,855 | |
Borrowings - Sovereign guaranteed | | 33,115 | | — | | — | | (5,403 | ) | 27,712 | |
Borrowings - Non-sovereign guaranteed | | — | | 3,744 | | 6,550 | | (2,311 | ) | 7,983 | |
Total borrowings | | 33,115 | | 3,744 | | 6,550 | | (7,714 | ) | 35,695 | |
Borrowings less financial assets | | 1,590 | | (10,777 | ) | 3,027 | | — | | (6,160 | ) |
Net Crown debt | | 11,533 | | Net Crown debt and gross sovereign-issued debt differ from | |
Gross sovereign-issued debt | | 34,111 | | the analysis above due to elimination of cross-holdings of Govt stock and adding back the NZS Fund and GSF assets. | |
Forecast Statement of Financial Performance (institutional form)
for the year ended 30 June 2006
| | Core Crown | | Crown entities | | State-owned enterprises | | Inter-segment eliminations | | Total Crown | |
($ million) | | 2006 | | 2006 | | 2006 | | 2006 | | 2006 | |
| | $m | | $m | | $m | | $m | | $m | |
Revenue | | | | | | | | | | | |
Taxation revenue | | 48,627 | | — | | — | | (525 | ) | 48,102 | |
Other sovereign levied income | | 712 | | 2,542 | | — | | (48 | ) | 3,206 | |
Sales of goods and services | | 729 | | 1,712 | | 9,827 | | (418 | ) | 11,850 | |
Investment income | | 2,599 | | 960 | | 223 | | (460 | ) | 3,322 | |
Other revenues | | 630 | | 18,080 | | 761 | | (17,181 | ) | 2,290 | |
Total revenue | | 53,297 | | 23,294 | | 10,811 | | (18,632 | ) | 68,770 | |
Expenses by input type | | | | | | | | | | | |
Subsidies and transfer payments | | 15,315 | | 1,687 | | — | | — | | 17,002 | |
Personnel expenses | | 5,097 | | 7,503 | | 1,890 | | (7 | ) | 14,483 | |
Operating expenses | | 25,612 | | 12,309 | | 7,638 | | (18,165 | ) | 27,394 | |
Finance costs | | 2,245 | | 273 | | 410 | | (136 | ) | 2,792 | |
FX losses/(gains) | | — | | — | | — | | — | | — | |
GSF and ACC liability revaluation movements | | (24 | ) | 597 | | — | | — | | 573 | |
Total expenses | | 48,245 | | 22,369 | | 9,938 | | (18,308 | ) | 62,244 | |
Expenses by functional classification | | | | | | | | | | | |
Social security and welfare | | 15,611 | | 3,001 | | — | | (439 | ) | 18,173 | |
Health | | 9,666 | | 7,356 | | — | | (7,692 | ) | 9,330 | |
Education | | 8,681 | | 6,554 | | — | | (6,072 | ) | 9,163 | |
Other functional classifications | | 11,771 | | 5,185 | | 9,528 | | (3,969 | ) | 22,515 | |
Forecast new operating spending | | 271 | | — | | — | | — | | 271 | |
Finance costs and FX losses/(gains) | | 2,245 | | 273 | | 410 | | (136 | ) | 2,792 | |
Total expenses | | 48,245 | | 22,369 | | 9,938 | | (18,308 | ) | 62,244 | |
Net surplus TEIs | | — | | 139 | | — | | — | | 139 | |
Operating balance | | 5,052 | | 1,064 | | 873 | | (324 | ) | 6,665 | |
Forecast Statement of Financial Position (institutional form)
as at 30 June 2006
| | Core Crown | | Crown entities | | State-owned enterprises | | Inter-segment eliminations | | Total Crown | |
($ million) | | 2006 | | 2006 | | 2006 | | 2006 | | 2006 | |
| | $m | | $m | | $m | | $m | | $m | |
Assets | | | | | | | | | | | |
Financial assets | | 34,564 | | 15,394 | | 4,032 | | (8,361 | ) | 45,629 | |
Physical assets | | 20,425 | | 30,708 | | 13,959 | | — | | 65,092 | |
Investment in SOEs and CEs (including TEIs) | | 24,143 | | 4,657 | | — | | (24,143 | ) | 4,657 | |
Other assets | | 8,470 | | 2,406 | | 2,390 | | (822 | ) | 12,444 | |
Total assets | | 87,602 | | 53,165 | | 20,381 | | (33,326 | ) | 127,822 | |
Liabilities | | | | | | | | | | | |
Borrowings | | 32,000 | | 4,031 | | 8,485 | | (8,361 | ) | 36,155 | |
Other liabilities | | 25,260 | | 16,219 | | 2,825 | | (1,274 | ) | 43,030 | |
Total liabilities | | 57,260 | | 20,250 | | 11,310 | | (9,635 | ) | 79,185 | |
Net worth | | 30,342 | | 32,915 | | 9,071 | | (23,691 | ) | 48,637 | |
Taxpayer Funds | | 24,499 | | 20,377 | | 6,994 | | (23,691 | ) | 28,179 | |
Revaluation reserves | | 5,843 | | 12,538 | | 2,077 | | — | | 20,458 | |
Net worth | | 30,342 | | 32,915 | | 9,071 | | (23,691 | ) | 48,637 | |
Analysis of financial assets and borrowings | | | | | | | | | | | |
Advances and cash | | 9,947 | | 1,735 | | 3,638 | | (2,421 | ) | 12,899 | |
MSDs and equity investments | | 24,617 | | 13,659 | | 394 | | (5,940 | ) | 32,730 | |
Total financial assets | | 34,564 | | 15,394 | | 4,032 | | (8,361 | ) | 45,629 | |
Borrowings - Sovereign guaranteed | | 32,000 | | — | | — | | (5,821 | ) | 26,179 | |
Borrowings - Non-sovereign guaranteed | | — | | 4,031 | | 8,485 | | (2,540 | ) | 9,976 | |
Total borrowings | | 32,000 | | 4,031 | | 8,485 | | (8,361 | ) | 36,155 | |
Borrowings less financial assets | | (2,564 | ) | (11,363 | ) | 4,453 | | — | | (9,474 | ) |
Net Crown debt | | 10,257 | | Net Crown debt and gross sovereign-issued debt differ from | |
Gross sovereign-issued debt | | 33,284 | | the analysis above due to elimination of cross-holdings of Govt stock and adding back the NZS Fund and GSF assets. | |
Forecast Statement of Financial Performance (institutional form)
for the year ended 30 June 2007
| | Core Crown | | Crown entities | | State-owned enterprises | | Inter-segment eliminations | | Total Crown | |
($ million) | | 2007 | | 2007 | | 2007 | | 2007 | | 2007 | |
| | $m | | $m | | $m | | $m | | $m | |
Revenue | | | | | | | | | | | |
Taxation revenue | | 49,994 | | — | | — | | (552 | ) | 49,442 | |
Other sovereign levied income | | 737 | | 2,623 | | — | | (49 | ) | 3,311 | |
Sales of goods and services | | 722 | | 1,788 | | 10,462 | | (414 | ) | 12,558 | |
Investment income | | 2,938 | | 1,020 | | 236 | | (533 | ) | 3,661 | |
Other revenues | | 617 | | 18,631 | | 703 | | (17,685 | ) | 2,266 | |
Total revenue | | 55,008 | | 24,062 | | 11,401 | | (19,233 | ) | 71,238 | |
Expenses by input type | | | | | | | | | | | |
Subsidies and transfer payments | | 16,253 | | 1,831 | | — | | — | | 18,084 | |
Personnel expenses | | 5,105 | | 7,804 | | 1,953 | | (7 | ) | 14,855 | |
Operating expenses | | 27,988 | | 12,605 | | 8,014 | | (18,661 | ) | 29,946 | |
Finance costs | | 2,035 | | 276 | | 519 | | (206 | ) | 2,624 | |
FX losses/(gains) | | — | | — | | — | | — | | — | |
GSF and ACC liability revaluation movements | | (58 | ) | 596 | | — | | — | | 538 | |
Total expenses | | 51,323 | | 23,112 | | 10,486 | | (18,874 | ) | 66,047 | |
Expenses by functional classification | | | | | | | | | | | |
Social security and welfare | | 16,558 | | 3,202 | | — | | (452 | ) | 19,308 | |
Health | | 10,152 | | 7,527 | | — | | (7,854 | ) | 9,825 | |
Education | | 8,994 | | 6,848 | | — | | (6,105 | ) | 9,737 | |
Other functional classifications | | 12,052 | | 5,259 | | 9,967 | | (4,257 | ) | 23,021 | |
Forecast new operating spending | | 1,532 | | — | | — | | — | | 1,532 | |
Finance costs and FX losses/(gains) | | 2,035 | | 276 | | 519 | | (206 | ) | 2,624 | |
Total expenses | | 51,323 | | 23,112 | | 10,486 | | (18,874 | ) | 66,047 | |
Net surplus TEIs | | — | | 139 | | — | | — | | 139 | |
Operating balance | | 3,685 | | 1,089 | | 915 | | (359 | ) | 5,330 | |
Forecast Statement of Financial Position (institutional form)
as at 3-0 June 2007
| | Core Crown | | Crown entities | | State-owned enterprises | | Inter-segment eliminations | | Total Crown | |
($ million) | | 2007 | | 2007 | | 2007 | | 2007 | | 2007 | |
| | $m | | $m | | $m | | $m | | $m | |
Assets | | | | | | | | | | | |
Financial assets | | 36,253 | | 16,589 | | 4,642 | | (9,185 | ) | 48,299 | |
Physical assets | | 20,627 | | 31,485 | | 15,016 | | — | | 67,128 | |
Investment in SOEs and CEs (including TEIs) | | 24,375 | | 4,796 | | — | | (24,375 | ) | 4,796 | |
Other assets | | 9,121 | | 2,460 | | 2,433 | | (817 | ) | 13,197 | |
Total assets | | 90,376 | | 55,330 | | 22,091 | | (34,377 | ) | 133,420 | |
Liabilities | | | | | | | | | | | |
Borrowings | | 30,991 | | 4,151 | | 9,438 | | (9,185 | ) | 35,395 | |
Other liabilities | | 25,358 | | 16,962 | | 3,003 | | (1,265 | ) | 44,058 | |
Total liabilities | | 56,349 | | 21,113 | | 12,441 | | (10,450 | ) | 79,453 | |
Net worth | | 34,027 | | 34,217 | | 9,650 | | (23,927 | ) | 53,967 | |
| | | | | | | | | | | |
Taxpayer Funds | | 28,184 | | 21,679 | | 7,573 | | (23,927 | ) | 33,509 | |
Revaluation reserves | | 5,843 | | 12,538 | | 2,077 | | — | | 20,458 | |
Net worth | | 34,027 | | 34,217 | | 9,650 | | (23,927 | ) | 53,967 | |
| | | | | | | | | | | |
Analysis of financial assets and borrowings | | | | | | | | | | | |
Advances and cash | | 11,011 | | 1,833 | | 4,214 | | (2,790 | ) | 14,268 | |
MSDs and equity investments | | 25,242 | | 14,756 | | 428 | | (6,395 | ) | 34,031 | |
Total financial assets | | 36,253 | | 16,589 | | 4,642 | | (9,185 | ) | 48,299 | |
Borrowings - Sovereign guaranteed | | 30,991 | | — | | — | | (6,267 | ) | 24,724 | |
Borrowings - Non-sovereign guaranteed | | — | | 4,151 | | 9,438 | | (2,918 | ) | 10,671 | |
Total borrowings | | 30,991 | | 4,151 | | 9,438 | | (9,185 | ) | 35,395 | |
Borrowings less financial assets | | (5,262 | ) | (12,438 | ) | 4,796 | | — | | (12,904 | ) |
Net Crown debt | | 10,640 | | Net Crown debt and gross sovereign-issued debt differ from | |
Gross sovereign-issued debt | | 32,583 | | the analysis above due to elimination of cross-holdings of Govt stock and adding back the NZS Fund and GSF assets. | |
Forecast Statement of Financial Performance (institutional form)
for the year ended 30 June 2008
| | Core Crown | | Crown entities | | State-owned enterprises | | Inter-segment eliminations | | Total Crown | |
($ million) | | 2008 | | 2008 | | 2008 | | 2008 | | 2008 | |
| | $m | | $m | | $m | | $m | | $m | |
Revenue | | | | | | | | | | | |
Taxation revenue | | 51,645 | | — | | — | | (561 | ) | 51,084 | |
Other sovereign levied income | | 773 | | 2,691 | | — | | (48 | ) | 3,416 | |
Sales of goods and services | | 737 | | 1,848 | | 10,824 | | (425 | ) | 12,984 | |
Investment income | | 3,309 | | 1,104 | | 234 | | (564 | ) | 4,083 | |
Other revenues | | 592 | | 18,912 | | 703 | | (17,918 | ) | 2,289 | |
Total revenue | | 57,056 | | 24,555 | | 11,761 | | (19,516 | ) | 73,856 | |
Expenses by input type | | | | | | | | | | | |
Subsidies and transfer payments | | 17,166 | | 1,933 | | — | | — | | 19,099 | |
Personnel expenses | | 5,149 | | 7,957 | | 2,023 | | (6 | ) | 15,123 | |
Operating expenses | | 30,514 | | 12,817 | | 8,246 | | (18,948 | ) | 32,629 | |
Finance costs | | 2,044 | | 291 | | 559 | | (155 | ) | 2,739 | |
FX losses/(gains) | | — | | — | | — | | — | | — | |
GSF and ACC liability revaluation movements | | (93 | ) | 604 | | — | | — | | 511 | |
Total expenses | | 54,780 | | 23,602 | | 10,828 | | (19,109 | ) | 70,101 | |
Expenses by functional classification | | | | | | | | | | | |
Social security and welfare | | 17,517 | | 3,351 | | — | | (463 | ) | 20,405 | |
Health | | 10,229 | | 7,532 | | — | | (7,868 | ) | 9,893 | |
Education | | 9,183 | | 6,979 | | — | | (6,154 | ) | 10,008 | |
Other functional classifications | | 12,530 | | 5,449 | | 10,269 | | (4,469 | ) | 23,779 | |
Forecast new operating spending | | 3,277 | | — | | — | | — | | 3,277 | |
Finance costs and FX losses/(gains) | | 2,044 | | 291 | | 559 | | (155 | ) | 2,739 | |
Total expenses | | 54,780 | | 23,602 | | 10,828 | | (19,109 | ) | 70,101 | |
Net surplus TEIs | | — | | 139 | | — | | — | | 139 | |
Operating balance | | 2,276 | | 1,092 | | 933 | | (407 | ) | 3,894 | |
Forecast Statement of Financial Position (institutional form)
as at 30 June 2008
| | Core Crown | | Crown entities | | State-owned enterprises | | Inter-segment eliminations | | Total Crown | |
($ million) | | 2008 | | 2008 | | 2008 | | 2008 | | 2008 | |
| | $m | | $m | | $m | | $m | | $m | |
Assets | | | | | | | | | | | |
Financial assets | | 39,488 | | 17,908 | | 4,911 | | (9,947 | ) | 52,360 | |
Physical assets | | 20,543 | | 32,233 | | 15,535 | | — | | 68,311 | |
Investment in SOEs and CEs (including TEIs) | | 24,578 | | 4,935 | | — | | (24,578 | ) | 4,935 | |
Other assets | | 9,867 | | 2,534 | | 2,480 | | (821 | ) | 14,060 | |
Total assets | | 94,476 | | 57,610 | | 22,926 | | (35,346 | ) | 139,666 | |
Liabilities | | | | | | | | | | | |
Borrowings | | 32,695 | | 4,652 | | 9,602 | | (9,947 | ) | 37,002 | |
Other liabilities | | 25,480 | | 17,496 | | 3,111 | | (1,284 | ) | 44,803 | |
Total liabilities | | 58,175 | | 22,148 | | 12,713 | | (11,231 | ) | 81,805 | |
Net worth | | 36,301 | | 35,462 | | 10,213 | | (24,115 | ) | 57,861 | |
| | | | | | | | | | | |
Taxpayer Funds | | 30,458 | | 22,924 | | 8,136 | | (24,115 | ) | 37,403 | |
Revaluation reserves | | 5,843 | | 12,538 | | 2,077 | | — | | 20,458 | |
Net worth | | 36,301 | | 35,462 | | 10,213 | | (24,115 | ) | 57,861 | |
| | | | | | | | | | | |
Analysis of financial assets and borrowings | | | | | | | | | | | |
Advances and cash | | 11,961 | | 1,965 | | 4,484 | | (3,077 | ) | 15,333 | |
MSDs and equity investments | | 27,527 | | 15,943 | | 427 | | (6,870 | ) | 37,027 | |
Total financial assets | | 39,488 | | 17,908 | | 4,911 | | (9,947 | ) | 52,360 | |
Borrowings - Sovereign guaranteed | | 32,695 | | — | | — | | (6,730 | ) | 25,965 | |
Borrowings - Non-sovereign guaranteed | | — | | 4,652 | | 9,602 | | (3,217 | ) | 11,037 | |
Total borrowings | | 32,695 | | 4,652 | | 9,602 | | (9,947 | ) | 37,002 | |
Borrowings less financial assets | | (6,793 | ) | (13,256 | ) | 4,691 | | — | | (15,358 | ) |
Net Crown debt | | 12,527 | | Net Crown debt and gross sovereign-issued debt differ from | |
Gross sovereign-issued debt | | 34,629 | | the analysis above due to elimination of cross-holdings of Govt stock and adding back the NZS Fund and GSF assets. | |
Forecast Statement of Financial Performance (institutional form)
for the year ended 30 June 2009
| | Core Crown | | Crown entities | | State-owned enterprises | | Inter-segment eliminations | | Total Crown | |
($ million) | | 2009 | | 2009 | | 2009 | | 2009 | | 2009 | |
| | $m | | $m | | $m | | $m | | $m | |
Revenue | | | | | | | | | | | |
Taxation revenue | | 54,930 | | — | | — | | (592 | ) | 54,338 | |
Other sovereign levied income | | 806 | | 2,759 | | — | | (48 | ) | 3,517 | |
Sales of goods and services | | 731 | | 1,907 | | 11,287 | | (419 | ) | 13,506 | |
Investment income | | 3,742 | | 1,179 | | 247 | | (651 | ) | 4,517 | |
Other revenues | | 583 | | 19,042 | | 671 | | (18,018 | ) | 2,278 | |
Total revenue | | 60,792 | | 24,887 | | 12,205 | | (19,728 | ) | 78,156 | |
| | | | | | | | | | | |
Expenses by input type | | | | | | | | | | | |
Subsidies and transfer payments | | 17,746 | | 2,053 | | — | | — | | 19,799 | |
Personnel expenses | | 5,251 | | 7,914 | | 2,072 | | (6 | ) | 15,231 | |
Operating expenses | | 32,360 | | 12,995 | | 8,575 | | (19,074 | ) | 34,856 | |
Finance costs | | 1,978 | | 297 | | 561 | | (178 | ) | 2,658 | |
FX losses/(gains) | | — | | — | | — | | — | | — | |
GSF and ACC liability revaluation movements | | (125 | ) | 601 | | — | | — | | 476 | |
Total expenses | | 57,210 | | 23,860 | | 11,208 | | (19,258 | ) | 73,020 | |
| | | | | | | | | | | |
Expenses by functional classification | | | | | | | | | | | |
Social security and welfare | | 18,108 | | 3,503 | | — | | (475 | ) | 21,136 | |
Health | | 10,284 | | 7,540 | | — | | (7,878 | ) | 9,946 | |
Education | | 9,256 | | 6,991 | | — | | (6,234 | ) | 10,013 | |
Other functional classifications | | 12,471 | | 5,529 | | 10,647 | | (4,493 | ) | 24,154 | |
Forecast new operating spending | | 5,113 | | — | | — | | — | | 5,113 | |
Finance costs and FX losses/(gains) | | 1,978 | | 297 | | 561 | | (178 | ) | 2,658 | |
Total expenses | | 57,210 | | 23,860 | | 11,208 | | (19,258 | ) | 73,020 | |
Net surplus TEIs | | | | 139 | | — | | — | | 139 | |
Operating balance | | 3,582 | | 1,166 | | 997 | | (470 | ) | 5,275 | |
Forecast Statement of Financial Position (institutional form)
as at 30 June 2009
| | Core Crown | | Crown entities | | State-owned enterprises | | Inter-segment eliminations | | Total Crown | |
($ million) | | 2009 | | 2009 | | 2009 | | 2009 | | 2009 | |
| | $m | | $m | | $m | | $m | | $m | |
Assets | | | | | | | | | | | |
Financial assets | | 43,320 | | 19,129 | | 5,183 | | (10,511 | ) | 57,121 | |
Physical assets | | 20,271 | | 32,803 | | 16,190 | | — | | 69,264 | |
Investment in SOEs and CEs (including TEIs) | | 24,612 | | 5,074 | | — | | (24,612 | ) | 5,074 | |
Other assets | | 10,675 | | 2,591 | | 2,522 | | (823 | ) | 14,965 | |
Total assets | | 98,878 | | 59,597 | | 23,895 | | (35,946 | ) | 146,424 | |
Liabilities | | | | | | | | | | | |
Borrowings | | 33,607 | | 4,951 | | 9,789 | | (10,511 | ) | 37,836 | |
Other liabilities | | 25,387 | | 17,974 | | 3,334 | | (1,243 | ) | 45,452 | |
Total liabilities | | 58,994 | | 22,925 | | 13,123 | | (11,754 | ) | 83,288 | |
Net worth | | 39,884 | | 36,672 | | 10,772 | | (24,192 | ) | 63,136 | |
| | | | | | | | | | | |
Taxpayer Funds | | 34,041 | | 24,134 | | 8,695 | | (24,192 | ) | 42,678 | |
Revaluation reserves | | 5,843 | | 12,538 | | 2,077 | | — | | 20,458 | |
Net worth | | 39,884 | | 36,672 | | 10,772 | | (24,192 | ) | 63,136 | |
| | | | | | | | | | | |
Analysis of financial assets and borrowings | | | | | | | | | | | |
Advances and cash | | 12,700 | | 1,966 | | 4,759 | | (3,158 | ) | 16,267 | |
MSDs and equity investments | | 30,620 | | 17,163 | | 424 | | (7,353 | ) | 40,854 | |
Total financial assets | | 43,320 | | 19,129 | | 5,183 | | (10,511 | ) | 57,121 | |
Borrowings - Sovereign guaranteed | | 33,607 | | — | | — | | (7,205 | ) | 26,402 | |
Borrowings - Non-sovereign guaranteed | | — | | 4,951 | | 9,789 | | (3,306 | ) | 11,434 | |
Total borrowings | | 33,607 | | 4,951 | | 9,789 | | (10,511 | ) | 37,836 | |
Borrowings less financial assets | | (9,713 | ) | (14,178 | ) | 4,606 | | — | | (19,285 | ) |
Net Crown debt | | 13,439 | | Net Crown debt and gross sovereign-issued debt differ from | |
Gross sovereign-issued debt | | 35,925 | | the analysis above due to elimination of cross-holdings of Govt stock and adding back the NZS Fund and GSF assets. | |
Notes to the Forecast Financial Statements
NOTE 1: Revenue Collected Through the Crown’s Sovereign Power
($ million) | | 2004
Actual | | 2005
Previous
Budget | | 2005
Forecast | | 2006
Forecast | | 2007
Forecast | | 2008
Forecast | | 2009
Forecast | |
| | | | | | | | | | | | | | | |
Income Tax Revenue (accrual) | | | | | | | | | | | | | | | |
Individuals | | | | | | | | | | | | | | | |
Source deductions | | 16,908 | | 17,701 | | 18,189 | | 19,240 | | 20,157 | | 21,139 | | 22,030 | |
Other persons | | 4,027 | | 3,995 | | 3,982 | | 4,051 | | 4,282 | | 4,332 | | 4,671 | |
Refunds | | (860 | ) | (876 | ) | (894 | ) | (874 | ) | (897 | ) | (897 | ) | (897 | ) |
Fringe benefit tax | | 410 | | 432 | | 444 | | 456 | | 434 | | 458 | | 473 | |
Total Individuals | | 20,485 | | 21,252 | | 21,721 | | 22,873 | | 23,976 | | 25,032 | | 26,277 | |
Corporate Tax | | | | | | | | | | | | | | | |
Gross companies tax | | 6,099 | | 6,416 | | 7,223 | | 7,798 | | 7,532 | | 7,088 | | 8,098 | |
Refunds | | (180 | ) | (187 | ) | (150 | ) | (162 | ) | (200 | ) | (200 | ) | (200 | ) |
Non-resident withholding tax | | 800 | | 803 | | 924 | | 793 | | 774 | | 795 | | 830 | |
Foreign-source dividend withholding payments | | 139 | | 130 | | 167 | | 176 | | 181 | | 186 | | 191 | |
Total Corporate Tax | | 6,858 | | 7,162 | | 8,164 | | 8,605 | | 8,287 | | 7,869 | | 8,919 | |
Other Income Tax | | | | | | | | | | | | | | | |
Resident withholding tax on interest income | | 1,188 | | 1,282 | | 1,420 | | 1,459 | | 1,384 | | 1,410 | | 1,525 | |
Resident withholding tax on dividend income | | 49 | | 58 | | 65 | | 63 | | 63 | | 64 | | 66 | |
Estate and gift duties | | 2 | | 2 | | 3 | | 2 | | 2 | | 2 | | 2 | |
Total Other Income Tax | | 1,239 | | 1,342 | | 1,488 | | 1,524 | | 1,449 | | 1,476 | | 1,593 | |
Total Income Tax | | 28,582 | | 29,756 | | 31,373 | | 33,002 | | 33,712 | | 34,377 | | 36,789 | |
Goods and Services Tax | | | | | | | | | | | | | | | |
Gross goods and services tax | | 16,603 | | 17,156 | | 17,264 | | 17,479 | | 18,149 | | 19,064 | | 20,154 | |
Refunds | | (6,885 | ) | (7,120 | ) | (7,050 | ) | (7,115 | ) | (7,406 | ) | (7,757 | ) | (8,111 | ) |
Total Goods and Services Tax | | 9,718 | | 10,036 | | 10,214 | | 10,364 | | 10,743 | | 11,307 | | 12,043 | |
Other Taxation | | | | | | | | | | | | | | | |
Petroleum fuels excise | | 947 | | 802 | | 815 | | 902 | | 926 | | 949 | | 982 | |
Tobacco excise | | 819 | | 831 | | 800 | | 850 | | 874 | | 897 | | 918 | |
Customs duty | | 720 | | 958 | | 929 | | 1,048 | | 1,091 | | 1,113 | | 1,083 | |
Road user charges | | 667 | | 686 | | 727 | | 796 | | 841 | | 888 | | 939 | |
Alcohol excise | | 476 | | 482 | | 484 | | 505 | | 524 | | 544 | | 563 | |
Gaming duties | | 261 | | 299 | | 288 | | 288 | | 296 | | 303 | | 309 | |
Motor vehicle fees | | 211 | | 211 | | 216 | | 219 | | 224 | | 230 | | 239 | |
Carbon charge | | — | | — | | — | | — | | 88 | | 356 | | 353 | |
Energy resources levies | | 75 | | 77 | | 75 | | 72 | | 67 | | 64 | | 64 | |
Approved issuer levy (AIL) and cheque duty | | 56 | | 55 | | 59 | | 56 | | 56 | | 56 | | 56 | |
Total Other Indirect Taxation | | 4,232 | | 4,401 | | 4,393 | | 4,736 | | 4,987 | | 5,400 | | 5,506 | |
Total Indirect Taxation | | 13,950 | | 14,437 | | 14,607 | | 15,100 | | 15,730 | | 16,707 | | 17,549 | |
Total Tax Revenue Collected | | 42,532 | | 44,193 | | 45,980 | | 48,102 | | 49,442 | | 51,084 | | 54,338 | |
Other Sovereign Revenues (accrual) | | | | | | | | | | | | | | | |
ACC levies | | 1,989 | | 2,000 | | 2,034 | | 2,097 | | 2,174 | | 2,241 | | 2,306 | |
Fire Service levies | | 233 | | 231 | | 241 | | 242 | | 244 | | 244 | | 246 | |
EQC levies | | 78 | | 80 | | 80 | | 82 | | 84 | | 85 | | 87 | |
Other levies | | 686 | | 763 | | 724 | | 785 | | 809 | | 846 | | 878 | |
Total Other Sovereign Revenues | | 2,986 | | 3,074 | | 3,079 | | 3,206 | | 3,311 | | 3,416 | | 3,517 | |
Total Sovereign Revenue | | 45,518 | | 47,267 | | 49,059 | | 51,308 | | 52,753 | | 54,500 | | 57,855 | |
NOTE 1: Receipts Collected Through the Crown’s Sovereign Power
($ million) | | 2004
Actual | | 2005
Previous
Budget | | 2005
Forecast | | 2006
Forecast | | 2007
Forecast | | 2008
Forecast | | 2009
Forecast | |
| | | | | | | | | | | | | | | |
Income Tax Receipts (cash) | | | | | | | | | | | | | | | |
Individuals | | | | | | | | | | | | | | | |
Source deductions | | 17,012 | | 17,702 | | 18,189 | | 19,240 | | 20,157 | | 21,139 | | 22,030 | |
Other persons | | 4,352 | | 4,414 | | 4,561 | | 4,611 | | 4,936 | | 5,003 | | 5,342 | |
Refunds | | (1,406 | ) | (1,300 | ) | (1,369 | ) | (1,410 | ) | (1,538 | ) | (1,568 | ) | (1,568 | ) |
Fringe benefit tax | | 410 | | 428 | | 432 | | 452 | | 432 | | 451 | | 470 | |
Total Individuals | | 20,368 | | 21,244 | | 21,813 | | 22,893 | | 23,987 | | 25,025 | | 26,274 | |
Corporate Tax | | | | | | | | | | | | | | | |
Gross companies tax | | 7,169 | | 7,135 | | 7,940 | | 8,444 | | 8,162 | | 7,732 | | 8,763 | |
Refunds | | (1,088 | ) | (1,091 | ) | (751 | ) | (812 | ) | (792 | ) | (807 | ) | (821 | ) |
Non-resident withholding tax | | 776 | | 794 | | 913 | | 779 | | 774 | | 795 | | 830 | |
Foreign-source dividend withholding payments | | 128 | | 130 | | 180 | | 175 | | 181 | | 186 | | 191 | |
Total Corporate Tax | | 6,985 | | 6,968 | | 8,282 | | 8,586 | | 8,325 | | 7,906 | | 8,963 | |
Other Income Tax | | | | | | | | | | | | | | | |
Resident withholding tax on interest income | | 1,217 | | 1,282 | | 1,418 | | 1,459 | | 1,384 | | 1,410 | | 1,525 | |
Resident withholding tax on dividend income | | 53 | | 58 | | 65 | | 63 | | 63 | | 64 | | 66 | |
Estate and gift duties | | 2 | | 2 | | 2 | | 2 | | 2 | | 2 | | 2 | |
Total Other Income Tax | | 1,272 | | 1,342 | | 1,485 | | 1,524 | | 1,449 | | 1,476 | | 1,593 | |
Total Income Tax | | 28,625 | | 29,554 | | 31,580 | | 33,003 | | 33,761 | | 34,407 | | 36,830 | |
Goods and Services Tax | | | | | | | | | | | | | | | |
Gross goods and services tax | | 15,768 | | 16,906 | | 16,591 | | 16,928 | | 17,598 | | 18,513 | | 19,603 | |
Refunds | | (6,313 | ) | (6,870 | ) | (6,483 | ) | (6,563 | ) | (6,854 | ) | (7,205 | ) | (7,559 | ) |
Total Goods and Services Tax | | 9,455 | | 10,036 | | 10,108 | | 10,365 | | 10,744 | | 11,308 | | 12,044 | |
Other Taxation | | | | | | | | | | | | | | | |
Petroleum fuels excise | | 944 | | 802 | | 815 | | 902 | | 926 | | 949 | | 982 | |
Tobacco excise | | 800 | | 831 | | 810 | | 850 | | 874 | | 897 | | 918 | |
Customs duty | | 726 | | 958 | | 959 | | 1,048 | | 1,091 | | 1,113 | | 1,083 | |
Road user charges | | 668 | | 686 | | 723 | | 792 | | 836 | | 884 | | 934 | |
Alcohol excise | | 476 | | 482 | | 484 | | 505 | | 524 | | 544 | | 563 | |
Gaming duties | | 260 | | 299 | | 285 | | 289 | | 297 | | 304 | | 310 | |
Motor vehicle fees | | 223 | | 211 | | 216 | | 224 | | 224 | | 230 | | 239 | |
Carbon charge | | — | | — | | — | | — | | 58 | | 356 | | 353 | |
Energy resources levies | | 75 | | 78 | | 77 | | 72 | | 68 | | 65 | | 64 | |
Approved issuer levy (AIL) and cheque duty | | 56 | | 55 | | 59 | | 56 | | 56 | | 56 | | 56 | |
Total Other Indirect Taxation | | 4,228 | | 4,402 | | 4,428 | | 4,738 | | 4,954 | | 5,398 | | 5,502 | |
Total Indirect Taxation | | 13,683 | | 14,438 | | 14,536 | | 15,103 | | 15,698 | | 16,706 | | 17,546 | |
Total Tax Receipts Collected | | 42,308 | | 43,992 | | 46,116 | | 48,106 | | 49,459 | | 51,113 | | 54,376 | |
Other Sovereign Receipts (cash) | | | | | | | | | | | | | | | |
ACC levies | | 2,008 | | 1,936 | | 1,980 | | 2,063 | | 2,146 | | 2,213 | | 2,267 | |
Fire Service levies | | 233 | | 232 | | 241 | | 242 | | 244 | | 245 | | 246 | |
EQC levies | | 79 | | 81 | | 81 | | 82 | | 82 | | 83 | | 83 | |
Other levies | | 532 | | 602 | | 604 | | 608 | | 643 | | 656 | | 675 | |
Total Other Sovereign Receipts | | 2,852 | | 2,851 | | 2,906 | | 2,995 | | 3,115 | | 3,197 | | 3,271 | |
Total Sovereign Receipts | | 45,160 | | 46,843 | | 49,022 | | 51,101 | | 52,574 | | 54,310 | | 57,647 | |
NOTE 2: Sale of Goods and Services
The Statement of Segments shows the sale of goods and services as a total for each area of the Crown Estate (ie, total sales for core Crown, Crown entities and SOEs). The total for Crown entities includes such items as lottery sales, housing rental, CRI sales and so on. The total sales of SOEs represents the majority of their income from electricity generation and distribution services, postal services, advertising, air travel sales and so on.
NOTE 3: Investment Income
($ million) | | 2004
Actual | | 2005
Previous
Budget | | 2005
Forecast | | 2006
Forecast | | 2007
Forecast | | 2008
Forecast | | 2009
Forecast | |
| | | | | | | | | | | | | | | |
NZS Fund investment income | | 206 | | 446 | | 507 | | 580 | | 796 | | 1,033 | | 1,300 | |
Other investment income | | 2,000 | | 1,568 | | 2,115 | | 2,195 | | 2,266 | | 2,397 | | 2,509 | |
Student loans | | 447 | | 503 | | 505 | | 547 | | 599 | | 653 | | 708 | |
Total Investment Income | | 2,653 | | 2,517 | | 3,127 | | 3,322 | | 3,661 | | 4,083 | | 4,517 | |
NOTE 4: Other Revenue | | | | | | | | | | | | | | | |
| | | | | | | | | | | | | | | |
Unrealised (losses)/gains arising from changes in the value of commercial forests | | (40 | ) | — | | — | | — | | — | | — | | — | |
GSF contributions | | 110 | | 100 | | 95 | | 84 | | 74 | | 64 | | 55 | |
Petroleum royalties | | 18 | | 29 | | 48 | | 43 | | 37 | | 32 | | 32 | |
Cost recovery income from Fisheries | | 22 | | 31 | | 27 | | 30 | | 30 | | 30 | | 30 | |
Other | | 1,906 | | 1,865 | | 2,107 | | 2,133 | | 2,125 | | 2,163 | | 2,161 | |
Total Other Revenue | | 2,016 | | 2,025 | | 2,277 | | 2,290 | | 2,266 | | 2,289 | | 2,278 | |
| | | | | | | | | | | | | | | |
NOTE 5: Subsidies and Transfer Payments | | | | | | | | | | | | | | | |
| | | | | | | | | | | | | | | |
Social assistance grants | | | | | | | | | | | | | | | |
New Zealand Superannuation | | 5,889 | | 6,086 | | 6,082 | | 6,392 | | 6,763 | | 7,131 | | 7,491 | |
ACC payments | | 1,407 | | 1,544 | | 1,530 | | 1,687 | | 1,830 | | 1,933 | | 2,053 | |
Unemployment Benefit | | 1,084 | | 939 | | 831 | | 800 | | 903 | | 960 | | 968 | |
Domestic Purposes Benefit | | 1,569 | | 1,577 | | 1,549 | | 1,501 | | 1,507 | | 1,541 | | 1,566 | |
Family Support | | 833 | | 932 | | 915 | | 1,312 | | 1,469 | | 1,683 | | 1,688 | |
Student allowances | | 380 | | 413 | | 369 | | 398 | | 412 | | 424 | | 434 | |
Other social assistance grants | | 3,931 | | 4,339 | | 4,190 | | 4,430 | | 4,702 | | 4,891 | | 5,063 | |
Subsidies | | 110 | | 135 | | 134 | | 125 | | 128 | | 128 | | 128 | |
Other transfer payments | | | | | | | | | | | | | | | |
Official development assistance | | 238 | | 259 | | 311 | | 320 | | 333 | | 371 | | 371 | |
Other | | 25 | | 25 | | 36 | | 37 | | 37 | | 37 | | 37 | |
Total Subsidies and Transfer Payments | | 15,466 | | 16,249 | | 15,947 | | 17,002 | | 18,084 | | 19,099 | | 19,799 | |
NOTE 6: Personnel Expenses
The Statement of Institutional Segments shows the personnel expenses as a total for each area of the total Crown (ie, total personnel expenses for core Crown, Crown entities and SOEs).
($ million) | | 2004
Actual | | 2005
Previous
Budget | | 2005
Forecast | | 2006
Forecast | | 2007
Forecast | | 2008
Forecast | | 2009
Forecast | |
GSF pension costs (excluding liability movement) | | 975 | | 1,042 | | 1,020 | | 1,043 | | 1,077 | | 1,104 | | 1,125 | |
Other pension expenses | | 90 | | 90 | | 105 | | 123 | | 124 | | 126 | | 127 | |
Other personnel expenses | | 11,436 | | 11,895 | | 12,380 | | 13,317 | | 13,654 | | 13,893 | | 13,979 | |
Total Personnel Expenses | | 12,501 | | 13,027 | | 13,505 | | 14,483 | | 14,855 | | 15,123 | | 15,231 | |
NOTE 7: Operating Expenses
Operating expenses relate to those expenses incurred in the course of undertaking the functions and activities of every entity included in the Crown financial statements, excluding those separately identified in the Statement of Financial Performance and other notes. Items disclosed separately are those required by accounting standards (and are expanded on further in the annual Crown financial statements). These include depreciation, rental costs and goodwill amortised.
Other operating costs is the large residual. Most of it represents the payment made for services provided by third parties (roading maintenance for example) or for raw materials (fuel, medicines or inventory for example). It also includes other day-to-day operating costs.
Depreciation expense (by class of asset): | | | | | | | | | | | | | | | |
Buildings | | 749 | | 803 | | 805 | | 857 | | 863 | | 877 | | 877 | |
Electricity distribution network | | 103 | | 113 | | 116 | | 111 | | 101 | | 104 | | 118 | |
Electricity generation assets | | 146 | | 183 | | 181 | | 212 | | 236 | | 257 | | 258 | |
Specialist military equipment (SME) | | 180 | | 188 | | 181 | | 191 | | 213 | | 247 | | 271 | |
State highways | | 219 | | 237 | | 233 | | 265 | | 297 | | 325 | | 356 | |
Aircraft (ex SME) | | 91 | | 120 | | 184 | | 187 | | 239 | | 271 | | 234 | |
Other plant and equipment | | 789 | | 799 | | 796 | | 856 | | 921 | | 965 | | 978 | |
Other assets | | 70 | | 92 | | 64 | | 65 | | 72 | | 80 | | 82 | |
Total depreciation costs | | 2,347 | | 2,535 | | 2,560 | | 2,744 | | 2,942 | | 3,126 | | 3,174 | |
Other operating items: | | | | | | | | | | | | | | | |
Rental and leasing costs | | 775 | | 679 | | 714 | | 754 | | 785 | | 818 | | 830 | |
Change in provision for doubtful debts | | 459 | | 74 | | 606 | | 512 | | 538 | | 616 | | 633 | |
Write off of bad debts | | 84 | | 198 | | 64 | | 63 | | 63 | | 70 | | 73 | |
Goodwill amortised | | 78 | | 47 | | 96 | | 94 | | 92 | | 92 | | 90 | |
Grants paid | | 309 | | 310 | | 348 | | 350 | | 367 | | 378 | | 379 | |
Lottery prize payments | | 347 | | 314 | | 337 | | 337 | | 362 | | 375 | | 390 | |
Loss/(gain) on sale of assets | | (15 | ) | — | | — | | — | | — | | — | | — | |
Other operating expenses | | 18,278 | | 20,154 | | 20,242 | | 22,269 | | 23,265 | | 23,877 | | 24,174 | |
Total operating expenses | | 22,662 | | 24,311 | | 24,967 | | 27,123 | | 28,414 | | 29,352 | | 29,743 | |
NOTE 8: Forecast New Operating Spending | | | | | | | | | | | | | | | |
| | | | | | | | | | | | | | | |
New operating spending up to Budget 2006 | | — | | 441 | | 31 | | 271 | | 283 | | 271 | | 262 | |
Forecast new operating spending | | — | | — | | — | | — | | 1,249 | | 3,006 | | 4,851 | |
Total Forecast for Future New Spending | | — | | 441 | | 31 | | 271 | | 1,532 | | 3,277 | | 5,113 | |
The forecast new operating spending represents an amount that indicates in broad terms the potential spending increases that could be introduced in each future budget round. The forecasts include $1.9 billion for Budget 2006, Budget 2007 and Budget 2008. The remaining amounts are lower as some spending has already been allocated (e.g. as part of Health sector funding packages, the Defence funding package, Official Development Assistance and some Education funding), leaving indicative totals of around $1.2 billion for Budget 2006 and $1.8 billion for Budget 2007. Refer to page 99 for all charges against future budgets.
NOTE 9: Cash and Marketable Securities, Deposits & Equity Investments
($ million) | | 2004
Actual | | 2005
Previous
Budget | | 2005
Forecast | | 2006
Forecast | | 2007
Forecast | | 2008
Forecast | | 2009
Forecast | |
By category: | | | | | | | | | | | | | | | |
Total Cash | | 3,450 | | 2,121 | | 2,819 | | 2,446 | | 2,611 | | 3,040 | | 3,341 | |
Marketable securities and deposits | | 15,178 | | 12,372 | | 18,552 | | 19,026 | | 17,802 | | 18,039 | | 18,844 | |
Equity investments (e.g. shares) | | 8,446 | | 10,067 | | 10,744 | | 13,042 | | 15,558 | | 18,307 | | 21,317 | |
Reserve position at the International Monetary Fund | | 1,012 | | 857 | | 654 | | 662 | | 671 | | 681 | | 693 | |
Total MSDs and Equity Investments | | 24,636 | | 23,296 | | 29,950 | | 32,730 | | 34,031 | | 37,027 | | 40,854 | |
Total Cash and MSDs & Equity Investments | | 28,086 | | 25,417 | | 32,769 | | 35,176 | | 36,642 | | 40,067 | | 44,195 | |
| | | | | | | | | | | | | | | |
By portfolio management: | | | | | | | | | | | | | | | |
Reserve Bank and DMO managed funds | | 11,313 | | 7,802 | | 13,342 | | 12,997 | | 10,850 | | 10,059 | | 9,704 | |
New Zealand Superannuation Fund | | 3,410 | | 5,692 | | 5,827 | | 8,350 | | 11,062 | | 14,088 | | 17,495 | |
Government Superannuation Fund | | 3,019 | | 3,032 | | 3,120 | | 3,187 | | 3,248 | | 3,298 | | 3,339 | |
ACC portfolio | | 4,276 | | 4,277 | | 5,287 | | 5,757 | | 6,263 | | 6,778 | | 7,282 | |
EQC portfolio | | 1,589 | | 1,559 | | 1,553 | | 1,649 | | 1,787 | | 1,937 | | 2,101 | |
Other holdings | | 1,029 | | 934 | | 821 | | 790 | | 821 | | 867 | | 933 | |
Total MSDs and Equity Investments | | 24,636 | | 23,296 | | 29,950 | | 32,730 | | 34,031 | | 37,027 | | 40,854 | |
The asset values above are net of any cross-holdings. For example the asset portfolios of the NZS Fund, GSF, EQC and ACC currently all hold amounts of NZ Government Stock. For financial reporting purposes these amounts are eliminated within the consolidated financial statements. The total portfolios are shown below, along with commentary on the restricted nature of some of the assets (for example the GSF assets are only available for the payment of GSF benefits – because of the restricted nature of these assets they are excluded from the definition of net debt).
Nature of financial assets – some are restricted in their purpose
Within the financial assets above, several portfolios are restricted in their nature in that they are only available to meet very specified purposes and are not available (by statute or other reasons) for general use by the Crown. It is for this reason that such assets are excluded from the definition of net debt – one of the Crown’s key fiscal policy indicators.
New Zealand Superannuation Fund
The assets of the NZS Fund is the Government’s means of building up assets to partially pre-fund future NZS expenses and may only be used for NZ Superannuation. The Government’s contributions to the NZS Fund are calculated over a 40-year rolling horizon to ensure Superannuation entitlements over the next 40 years can be met.
Government Superannuation Fund
The GSF Authority administers the financial assets of the GSF totalling around $3.4 billion (30 June 2004). These assets result from contributions by employees built up through time and can only be applied to the ongoing payment of GSF benefits (as provided by the GSF Act). Also refer Note 15 Outstanding Liability associated with GSF benefits.
EQC – Natural Disaster Fund (NDF)
The EQC is New Zealand’s primary provider of seismic disaster insurance to residential property owners. EQC administers the NDF, comprising capital and reserves. EQC draws on the NDF money to pay out claims for damage caused by natural disasters.
ACC portfolio
The ACC manages the ACC scheme. At present there is a substantial outstanding claims liability associated with past claims in excess of $9.3 billion (30 June 2004) and it is expected to increase. To manage the payment of these claims in the future, ACC is building up a matching portfolio of assets. The target is to have the residual claims fully funded by 2014. Also refer Note 16 Outstanding Claims Liability.
Individual portfolio information (including cross holdings of NZ Government Stock)
NZS Fund | | 3,956 | | 6,323 | | 6,474 | | 9,278 | | 12,292 | | 15,653 | | 19,439 | |
GSF financial assets | | 3,375 | | 3,400 | | 3,510 | | 3,587 | | 3,655 | | 3,711 | | 3,759 | |
ACC portfolio | | 6,176 | | 6,186 | | 7,635 | | 8,314 | | 9,045 | | 9,788 | | 10,517 | |
EQC portfolio | | 4,367 | | 4,602 | | 4,533 | | 4,837 | | 5,196 | | 5,582 | | 5,996 | |
NOTE 10: Advances
($ million) | | 2004
Actual | | 2005
Previous
Budget | | 2005
Forecast | | 2006
Forecast | | 2007
Forecast | | 2008
Forecast | | 2009
Forecast | |
Student loans (see analysis below) | | 5,995 | | 6,864 | | 6,594 | | 7,195 | | 7,802 | | 8,422 | | 9,046 | |
Kiwibank deposits | | 1,038 | | 1,581 | | 1,851 | | 2,615 | | 3,189 | | 3,189 | | 3,189 | |
Residential care loans | | 72 | | 73 | | 83 | | 88 | | 93 | | 98 | | 103 | |
Maori development rural lending | | 48 | | 48 | | 48 | | 48 | | 48 | | 48 | | 48 | |
Other | | 292 | | 355 | | 510 | | 507 | | 525 | | 536 | | 540 | |
Total Advances | | 7,445 | | 8,921 | | 9,086 | | 10,453 | | 11,657 | | 12,293 | | 12,926 | |
| | | | | | | | | | | | | | | |
Analysis of Student Loans | | | | | | | | | | | | | | | |
Outstanding balance | | | | | | | | | | | | | | | |
Total loans outstanding (including interest) | | 6,821 | | 7,775 | | 7,495 | | 8,178 | | 8,869 | | 9,573 | | 10,283 | |
Total provisions (capital and interest) | | (826 | ) | (911 | ) | (901 | ) | (983 | ) | (1,067 | ) | (1,151 | ) | (1,237 | ) |
Total Student Loans | | 5,995 | | 6,864 | | 6,594 | | 7,195 | | 7,802 | | 8,422 | | 9,046 | |
| | | | | | | | | | | | | | | |
Movement during the year | | | | | | | | | | | | | | | |
Opening balance | | 5,370 | | 6,095 | | 5,995 | | 6,594 | | 7,195 | | 7,802 | | 8,422 | |
Amount advanced in current year | | 999 | | 1,100 | | 979 | | 1,040 | | 1,087 | | 1,137 | | 1,189 | |
Interest accrued on outstanding loan balances | | 447 | | 503 | | 505 | | 547 | | 599 | | 653 | | 708 | |
Repayment of base capital | | (294 | ) | (334 | ) | (313 | ) | (402 | ) | (449 | ) | (498 | ) | (551 | ) |
Repayment of accrued interest | | (216 | ) | (204 | ) | (253 | ) | (253 | ) | (286 | ) | (321 | ) | (358 | ) |
Interest written off and movement in provision for interest write-offs and doubtful debts | | (319 | ) | (304 | ) | (327 | ) | (339 | ) | (352 | ) | (359 | ) | (372 | ) |
Other movements | | 8 | | 8 | | 8 | | 8 | | 8 | | 8 | | 8 | |
Closing Balance | | 5,995 | | 6,864 | | 6,594 | | 7,195 | | 7,802 | | 8,422 | | 9,046 | |
NOTE 11: Receivables | | | | | | | | | | | | | | | |
| | | | | | | | | | | | | | | |
Taxes receivable | | 5,843 | | 5,577 | | 5,667 | | 5,585 | | 5,515 | | 5,434 | | 5,349 | |
Accounts receivable | | 4,294 | | 3,996 | | 4,114 | | 4,305 | | 4,577 | | 4,833 | | 5,100 | |
Receivable from the sale and purchase of Maui gas | | 156 | | 114 | | 116 | | 70 | | 31 | | 11 | | 5 | |
Prepayments | | 294 | | 265 | | 241 | | 245 | | 242 | | 242 | | 242 | |
Total Receivables | | 10,587 | | 9,952 | | 10,138 | | 10,205 | | 10,365 | | 10,520 | | 10,696 | |
NOTE 12: Other Investments | | | | | | | | | | | | | | | |
| | | | | | | | | | | | | | | |
International Bank for Reconstruction and Development | | 82 | | 79 | | 72 | | 72 | | 72 | | 72 | | 72 | |
Asian Development Bank | | 89 | | 81 | | 78 | | 78 | | 78 | | 78 | | 78 | |
Other | | 88 | | 93 | | 84 | | 84 | | 84 | | 84 | | 84 | |
Total Other Investments | | 259 | | 253 | | 234 | | 234 | | 234 | | 234 | | 234 | |
NOTE 13: Property, Plant and Equipment
($ million) | | 2004
Actual | | 2005
Previous
Budget | | 2005
Forecast | | 2006
Forecast | | 2007
Forecast | | 2008
Forecast | | 2009
Forecast | |
By Type | | | | | | | | | | | | | | | |
Gross Carrying Value | | | | | | | | | | | | | | | |
Land (valuation) | | 9,509 | | 6,891 | | 9,684 | | 9,962 | | 10,079 | | 10,233 | | 10,372 | |
Properties intended for sale (valuation) | | 464 | | 478 | | 491 | | 476 | | 491 | | 507 | | 515 | |
Buildings (valuation) | | 18,138 | | 18,731 | | 19,242 | | 21,204 | | 22,444 | | 23,456 | | 24,554 | |
Electricity distribution network (valuation) | | 2,409 | | 2,466 | | 2,136 | | 2,231 | | 2,479 | | 2,756 | | 3,055 | |
Electricity generation assets (valuation) | | 4,915 | | 6,259 | | 6,274 | | 7,032 | | 7,723 | | 8,344 | | 9,086 | |
Aircraft (ex SME) (valuation) | | 1,149 | | 1,367 | | 1,594 | | 2,880 | | 3,415 | | 3,567 | | 3,703 | |
State highways (valuation) | | 13,082 | | 13,445 | | 13,612 | | 14,258 | | 14,892 | | 15,535 | | 16,264 | |
Specialist military equipment (valuation) | | 2,780 | | 3,038 | | 3,082 | | 3,710 | | 3,970 | | 4,094 | | 4,089 | |
Other plant and equipment (cost) | | 8,402 | | 9,805 | | 8,836 | | 9,813 | | 10,578 | | 11,260 | | 11,982 | |
Other assets (valuation) | | 5,262 | | 5,345 | | 5,181 | | 5,316 | | 5,514 | | 5,665 | | 5,688 | |
Total Gross Carrying Value | | 66,110 | | 67,825 | | 70,132 | | 76,882 | | 81,585 | | 85,417 | | 89,308 | |
Accumulated Depreciation | | | | | | | | | | | | | | | |
Buildings | | 1,356 | | 2,822 | | 2,094 | | 2,917 | | 3,746 | | 4,403 | | 5,254 | |
Electricity distribution network | | 451 | | 386 | | 213 | | 313 | | 402 | | 494 | | 598 | |
Electricity generation assets | | 416 | | 791 | | 564 | | 767 | | 995 | | 1,243 | | 1,493 | |
Aircraft (ex SME) | | — | | 98 | | 184 | | 371 | | 610 | | 881 | | 1,115 | |
State highways | | — | | 447 | | 234 | | 499 | | 795 | | 1,120 | | 1,477 | |
Specialist military equipment | | 482 | | 671 | | 647 | | 838 | | 1,052 | | 1,299 | | 1,570 | |
Other plant and equipment | | 5,141 | | 5,931 | | 5,104 | | 5,776 | | 6,530 | | 7,319 | | 8,169 | |
Other assets | | 324 | | 485 | | 298 | | 309 | | 327 | | 347 | | 368 | |
Total Accumulated Depreciation | | 8,170 | | 11,631 | | 9,338 | | 11,790 | | 14,457 | | 17,106 | | 20,044 | |
Net Carrying Value | | | | | | | | | | | | | | | |
Land (valuation) | | 9,509 | | 6,891 | | 9,684 | | 9,962 | | 10,079 | | 10,233 | | 10,372 | |
Properties intended for sale (valuation) | | 464 | | 478 | | 491 | | 476 | | 491 | | 507 | | 515 | |
Buildings (valuation) | | 16,782 | | 15,909 | | 17,148 | | 18,287 | | 18,698 | | 19,053 | | 19,300 | |
Electricity distribution network (valuation) | | 1,958 | | 2,080 | | 1,923 | | 1,918 | | 2,077 | | 2,262 | | 2,457 | |
Electricity generation assets (valuation) | | 4,499 | | 5,468 | | 5,710 | | 6,265 | | 6,728 | | 7,101 | | 7,593 | |
Aircraft (ex SME) (valuation) | | 1,149 | | 1,269 | | 1,410 | | 2,509 | | 2,805 | | 2,686 | | 2,588 | |
State highways (valuation) | | 13,082 | | 12,998 | | 13,378 | | 13,759 | | 14,097 | | 14,415 | | 14,787 | |
Specialist military equipment (valuation) | | 2,298 | | 2,367 | | 2,435 | | 2,872 | | 2,918 | | 2,795 | | 2,519 | |
Other plant and equipment (cost) | | 3,261 | | 3,874 | | 3,732 | | 4,037 | | 4,048 | | 3,941 | | 3,813 | |
Other assets (valuation) | | 4,938 | | 4,860 | | 4,883 | | 5,007 | | 5,187 | | 5,318 | | 5,320 | |
Total Net Carrying Value | | 57,940 | | 56,194 | | 60,794 | | 65,092 | | 67,128 | | 68,311 | | 69,264 | |
By Holding | | | | | | | | | | | | | | | |
Freehold assets | | 57,357 | | 55,810 | | 60,429 | | 64,751 | | 66,810 | | 67,993 | | 68,946 | |
Leasehold assets | | 583 | | 384 | | 365 | | 341 | | 318 | | 318 | | 318 | |
Net carrying value | | 57,940 | | 56,194 | | 60,794 | | 65,092 | | 67,128 | | 68,311 | | 69,264 | |
NOTE 14: Payables and Provisions | | | | | | | | | | | | | |
Accounts payable and accruals | | 7,493 | | 5,425 | | 8,289 | | 8,957 | | 9,427 | | 9,661 | | 9,823 | |
Taxes repayable | | 2,355 | | 2,134 | | 2,326 | | 2,326 | | 2,326 | | 2,326 | | 2,326 | |
Provisions | | 485 | | 507 | | 541 | | 541 | | 552 | | 553 | | 575 | |
National Provident Fund guarantee | | 891 | | 882 | | 891 | | 891 | | 891 | | 891 | | 891 | |
Provisions for employee entitlements | | 1,262 | | 1,179 | | 1,262 | | 1,271 | | 1,280 | | 1,279 | | 1,268 | |
Total Payables and Provisions | | 12,486 | | 10,127 | | 13,309 | | 13,986 | | 14,476 | | 14,710 | | 14,883 | |
NOTE 15: GSF Liability
The Government Superannuation Fund (GSF) liability has been calculated by the Government Actuary as at 28 February 2005 (the valuation date) for inclusion within the 2005 Budget Economic and Fiscal Update (BEFU). The liability arises from closed schemes for past and present public sector employees (set out in the GSF Act 1956). A projected Aggregate Funding method, based on 28 February 2005 membership data, was used for the valuation. This method requires the benefits payable from the GSF in respect of past service to be calculated and then discounted back to the valuation date.
The GSF liabilities included in the 2005 BEFU were calculated using discount rates derived from the market yield curve as at the 28 February 2005. This resulted in a long-term after-tax discount rate of 4.0% (4.4% as at 30 June 2004). The other principal long-term financial assumptions used in the calculation remained unchanged from 30 June 2004, which were an inflation rate of 2.0% and an annual salary increases rate, before any promotional effects, of 3.0%.
The 2004/05 movement in the net unfunded liability is $426 million (reflecting an increase in the gross liability of $561 million and an increase in the net assets of $135 million). There are essentially three components driving this change, being changes to the economic assumptions applied since 30 June 2004, actual GSF experience to 28 February 2005 and the expected net movement in contributions, investment income and benefit payments. The change in underlying economic assumptions accounted for approximately $383 million of the increase in the net unfunded liability, due largely to the change in discount rate ($471 million) offset by a change in demographic assumptions ($88 million). The net unfunded liability decreased by $64 million due to actual GSF experience to 28 February 2005. Finally the net liability is expected to increase $107 million due to movements in expected contributions, investment income and benefit payments. The changes from 2005/06 onwards reflect the expected net movement in investment income, contributions and benefit payments only.
Compared to the valuation included in the 2004 December Economic and Fiscal Update, the unfunded liability has increased by $17 million. This reflects an increase in the gross liability (mainly due to the change in long-term discount rate from 4.1% to 4.0%) offset by increased investment returns between the valuation dates.
Presentation approach
The projected gross liability is included within total liabilities. The GSF has available to it a portfolio of assets that partially offset the gross liability. The assets (less cross holdings of NZ Government stock) are included in the asset portion of the Crown’s overall balance sheet. The component parts are shown in the reconciliation below.
($ million) | | 2004
Actual | | 2005
Previous
Budget | | 2005
Forecast | | 2006
Forecast | | 2007
Forecast | | 2008
Forecast | | 2009
Forecast | |
GSF liability and asset information | | | | | | | | | | | | | | | |
Gross GSF liability | | | | | | | | | | | | | | | |
Opening gross liability | | 13,857 | | 14,071 | | 13,542 | | 14,103 | | 14,079 | | 14,021 | | 13,928 | |
Net projected change | | (315 | ) | (57 | ) | 561 | | (24 | ) | (58 | ) | (93 | ) | (125 | ) |
Closing gross liability | | 13,542 | | 14,014 | | 14,103 | | 14,079 | | 14,021 | | 13,928 | | 13,803 | |
| | | | | | | | | | | | | | | |
Less net assets available to the GSF scheme | | | | | | | | | | | | | | | |
Opening asset value | | 3,182 | | 3,313 | | 3,375 | | 3,510 | | 3,587 | | 3,655 | | 3,711 | |
Net projected change (investment income & contributions less membership payments) | | 193 | | 87 | | 135 | | 77 | | 68 | | 56 | | 48 | |
Closing net asset values | | 3,375 | | 3,400 | | 3,510 | | 3,587 | | 3,655 | | 3,711 | | 3,759 | |
| | | | | | | | | | | | | | | |
Net unfunded liability of the GSF schemes | | | | | | | | | | | | | | | |
Opening unfunded liability | | 10,675 | | 10,758 | | 10,167 | | 10,593 | | 10,492 | | 10,366 | | 10,217 | |
Net projected change | | (508 | ) | (144 | ) | 426 | | (101 | ) | (126 | ) | (149 | ) | (173 | ) |
Net unfunded liability | | 10,167 | | 10,614 | | 10,593 | | 10,492 | | 10,366 | | 10,217 | | 10,044 | |
NOTE 16: ACC Claims Liability
Calculation information
PricewaterhouseCoopers Actuarial Pty Ltd have prepared the independent actuarial estimate of the ACC outstanding claims liability as at 31 March 2005. This estimate includes the expected future payments relating to accidents that occurred prior to balance date (whether or not the associated claims have been reported to, or accepted by, ACC) and also the expected administrative expenses of managing these claims.
The key economic variables that impact on changes to the valuation are the long-term Labour Cost Index (LCI) of 2.5% (unchanged from 30 June 2004) and the discount rate of 6.2% (6.5% at 30 June 2004). Other key variables in each valuation is the assumed rate at which long-term claimants will leave the scheme over the period. This assessment is largely based on scheme history.
Explanation of change
The total change in the gross ACC liability compared to the expected movement for 2004/05 from the 30 June 2004 estimate is an increase of $1,202 million. Changes in economic assumptions (mainly the reduction in discount rate from 6.5% to 6.2%) accounted for $299 million of the increase and the remainder reflects the impact of scheme experience and the interpretation of prior experience.
Compared to the valuation included in the 2004 December Economic and Fiscal Update, the liability valuation has changed by $906 million which is also driven by the impact of scheme experience and the interpretation of prior experience.
Presentation approach
The projected gross liability is included within total liabilities. The ACC has available to it a portfolio of assets that partially offset the gross liability. The assets (less cross holdings of NZ Government stock) are included in the asset portion of the Crowns’ overall balance sheet.
($ million) | | 2004
Actual | | 2005
Previous
Budget | | 2005
Forecast | | 2006
Forecast | | 2007
Forecast | | 2008
Forecast | | 2009
Forecast | |
ACC liability and asset information | | | | | | | | | | | | | | | |
Gross ACC liability | | | | | | | | | | | | | | | |
Opening gross liability | | 9,155 | | 9,763 | | 9,347 | | 11,154 | | 11,751 | | 12,347 | | 12,951 | |
Net projected change | | 192 | | 598 | | 1,807 | | 597 | | 596 | | 604 | | 601 | |
Closing gross liability | | 9,347 | | 10,361 | | 11,154 | | 11,751 | | 12,347 | | 12,951 | | 13,552 | |
| | | | | | | | | | | | | | | |
Less net assets available to ACC | | | | | | | | | | | | | | | |
Opening net asset value | | 4,901 | | 5,943 | | 5,969 | | 6,902 | | 7,725 | | 8,488 | | 9,251 | |
Net projected change | | 1,068 | | 716 | | 933 | | 823 | | 763 | | 763 | | 739 | |
Closing net asset values | | 5,969 | | 6,659 | | 6,902 | | 7,725 | | 8,488 | | 9,251 | | 9,990 | |
| | | | | | | | | | | | | | | |
Net ACC reserves (net liability) | | | | | | | | | | | | | | | |
Opening reserves position | | (4,254 | ) | (3,820 | ) | (3,378 | ) | (4,252 | ) | (4,026 | ) | (3,859 | ) | (3,700 | ) |
Net projected change | | 876 | | 118 | | (874 | ) | 226 | | 167 | | 159 | | 138 | |
Closing reserves position (net liability) | | (3,378 | ) | (3,702 | ) | (4,252 | ) | (4,026 | ) | (3,859 | ) | (3,700 | ) | (3,562 | ) |
NOTE 17: Revaluation reserves | | | | | | | | | | | | | | | |
| | | | | | | | | | | | | | | |
Asset Revaluation Reserves | | | | | | | | | | | | | | | |
Opening Balance | | 15,624 | | 15,682 | | 19,838 | | 20,458 | | 20,458 | | 20,458 | | 20,458 | |
Net revaluations | | | | | | | | | | | | | | | |
Land and buildings | | 3,855 | | — | | 18 | | — | | — | | — | | — | |
State highways | | 308 | | — | | — | | — | | — | | — | | — | |
Electricity generatioon assets | | — | | — | | 600 | | — | | — | | — | | — | |
Other assets | | 50 | | — | | — | | — | | — | | — | | — | |
Total Net Revaluations | | 4,213 | | — | | 618 | | — | | — | | — | | — | |
Transfer to taxpayer funds | | 1 | | — | | 2 | | — | | — | | — | | — | |
Closing Balance | | 19,838 | | 15,682 | | 20,458 | | 20,458 | | 20,458 | | 20,458 | | 20,458 | |
NOTE 18: Core Crown
Reconciliation of Core Crown Forecast Net Cash Flows from Operations
with Forecast Net Cash Proceeds from Domestic Bonds
(flows of the NZS Fund and GSF are excluded)
($ million) | | 2004
Actual | | 2005
Previous
Budget | | 2005
Forecast | | 2006
Forecast | | 2007
Forecast | | 2008
Forecast | | 2009
Forecast | |
Core Crown Cash Flows from Operations | | | | | | | | | | | | | | | |
Total tax receipts | | 42,777 | | 44,720 | | 46,815 | | 48,911 | | 50,317 | | 52,057 | | 55,427 | |
Total other sovereign receipts | | 428 | | 488 | | 500 | | 503 | | 539 | | 553 | | 571 | |
Interest, profits and dividends | | 1,129 | | 848 | | 1,234 | | 1,059 | | 1,150 | | 1,249 | | 1,376 | |
Sale of goods & services and other receipts | | 534 | | 668 | | 1,400 | | 1,239 | | 1,230 | | 1,219 | | 1,213 | |
Subsidies and transfer payments | | (14,250 | ) | (14,701 | ) | (14,522 | ) | (15,548 | ) | (16,539 | ) | (17,483 | ) | (18,066 | ) |
Personnel and operating expenses | | (23,198 | ) | (24,729 | ) | (25,132 | ) | (27,577 | ) | (29,016 | ) | (29,827 | ) | (29,924 | ) |
Finance costs | | (1,977 | ) | (1,892 | ) | (2,013 | ) | (1,992 | ) | (1,763 | ) | (1,763 | ) | (1,803 | ) |
Forecast new operating spending | | — | | (441 | ) | (31 | ) | (271 | ) | (1,532 | ) | (3,277 | ) | (5,113 | ) |
Net Cash Flows from Core Crown Operations | | 5,443 | | 4,961 | | 8,251 | | 6,324 | | 4,386 | | 2,728 | | 3,681 | |
| | | | | | | | | | | | | | | |
Net purchase of physical assets | | (1,299 | ) | (1,277 | ) | (1,693 | ) | (2,128 | ) | (1,247 | ) | (951 | ) | (814 | ) |
Net increase in advances | | (1,725 | ) | (857 | ) | (742 | ) | (781 | ) | (933 | ) | (877 | ) | (680 | ) |
Net purchase of investments | | (20 | ) | (800 | ) | (596 | ) | (448 | ) | (291 | ) | (193 | ) | (84 | ) |
Contribution to the NZS Fund | | (1,879 | ) | (2,107 | ) | (2,107 | ) | (2,337 | ) | (2,375 | ) | (2,533 | ) | (2,744 | ) |
Purchase of Reserve Bank reserves | | — | | (500 | ) | (700 | ) | (500 | ) | (500 | ) | (200 | ) | — | |
Forecast new capital spending | | — | | (228 | ) | — | | (100 | ) | (646 | ) | (750 | ) | (750 | ) |
Available to Repay Debt/(Required to be Financed) | | 520 | | (808 | ) | 2,413 | | 30 | | (1,606 | ) | (2,776 | ) | (1,391 | ) |
| | | | | | | | | | | | | | | |
Financed by: | | | | | | | | | | | | | | | |
Other net sale/(purchase) of marketable securities and deposits | | 541 | | 2,450 | | (2,401 | ) | 332 | | 2,167 | | 690 | | 38 | |
Total Operating and Investing Activities | | 1,061 | | 1,642 | | 12 | | 362 | | 561 | | (2,086 | ) | (1,353 | ) |
| | | | | | | | | | | | | | | |
Used in: | | | | | | | | | | | | | | | |
Net (repayment)/issue of other New Zealand-dollar borrowing | | 2 | | (1,349 | ) | (1,492 | ) | (1,000 | ) | (996 | ) | (783 | ) | 1,080 | |
Decrease/(increase) in cash | | (250 | ) | (3 | ) | 176 | | 174 | | (88 | ) | (36 | ) | (27 | ) |
Issue of circulating currency | | 114 | | — | | 205 | | — | | — | | — | | — | |
Net issue/(repayment) of foreign-currency borrowing | | (216 | ) | 211 | | 1,650 | | 838 | | 500 | | 105 | | — | |
| | (350 | ) | (1,141 | ) | 539 | | 12 | | (584 | ) | (714 | ) | 1,053 | |
| | | | | | | | | | | | | | | |
Net Cash Inflow/(Outflow) to be Offset by Domestic Bonds | | 711 | | 501 | | 551 | | 374 | | (23 | ) | (2,800 | ) | (300 | ) |
| | | | | | | | | | | | | | | |
Gross Cash Proceeds from Domestic Bonds | | | | | | | | | | | | | | | |
Domestic bonds (market) | | 2,212 | | 2,311 | | 2,150 | | 2,200 | | 2,800 | | 2,800 | | 2,800 | |
Domestic bonds (non-market) | | 478 | | 248 | | 434 | | 375 | | 376 | | — | | 75 | |
Total Gross Cash Proceeds from Domestic Bonds | | 2,690 | | 2,559 | | 2,584 | | 2,575 | | 3,176 | | 2,800 | | 2,875 | |
| | | | | | | | | | | | | | | |
Repayment of domestic bonds (market) | | (3,044 | ) | (2,797 | ) | (2,797 | ) | (2,574 | ) | (2,777 | ) | — | | (2,500 | ) |
Repayment of domestic bonds (non-market) | | (357 | ) | (263 | ) | (338 | ) | (375 | ) | (376 | ) | — | | (75 | ) |
Net Cash (Repayments of)/Proceeds from Domestic Bonds | | (711 | ) | (501 | ) | (551 | ) | (374 | ) | 23 | | 2,800 | | 300 | |
ACC unfunded liability
The future cost of past ACC claims, less the asset reserves held to meet these claims. The ACC outstanding claims liability is the gross liability of the future cost of past ACC claims.
Baselines
The level of funding approved for any given spending area (eg, Education). All amounts within baselines are included in the forecasts.
Contingent liability
Contingent liabilities are costs, which the Crown will have to face if a particular event occurs. Typically, contingent liabilities consist of guarantees and indemnities, legal disputes and claims, and uncalled capital.
Core Crown
The core Crown represents the revenues, expenses, assets and liabilities of departments, the Reserve Bank, GSF and the NZS Fund.
Corporate tax
The sum of net company tax, non-resident withholding tax (NRWT) and foreign dividend withholding payments (FDWP).
Current account (Balance of Payments)
A measure of the flows of income between New Zealand and the rest of the world. A net inflow to New Zealand is a current account surplus, while a net outflow is a deficit. The current account balance is commonly expressed as a percentage of GDP.
Customs duty
Duty levied on the imports of certain goods.
Cyclically adjusted or structural fiscal balance
An estimate of a fiscal balance (eg, OBERAC) adjusted for short-term fluctuations of actual GDP around the productive potential of the economy. The estimate provides a picture of the underlying trend fiscal position and an indication of the effects of policy decisions. Because it is based on a number of assumptions and is sensitive to new information, the estimate is subject to some uncertainty. Trends in the cyclically adjusted balance are, however, more reliable.
Demographic changes
Changes to the structure of the population, for example the age, sex or ethnic make-up of the population.
Domestic bond programme
The amount of new government stock (taking into account the repayment of maturing government stock) expected to be issued over the financial year to fund the Government’s cash flow requirements.
Excise duties
Tax levied on the domestic production of alcohol, tobacco and light petroleum products (CNG, LPG and petrol).
Financial assets
Either cash or shares (equity) or a right to receive a financial instrument, which can be converted to cash (see net Crown debt).
Fiscal objectives (long-term)
The Government’s long-term goals for operating expenses, operating revenue, the operating balance, debt and net worth, as required by the Public Finance Act 1989. The objectives must be consistent with the principles of responsible fiscal management outlined in the Act.
Forecast new capital spending
An amount provided in the forecasts to represent the balance sheet impact of capital initiatives expected to be introduced over the forecast period.
Forecast new operating spending
An amount included in the forecasts to provide for the operating balance impact of policy initiatives and changes to demographics and other forecasting changes expected to occur over the forecast period.
Fringe benefit tax (FBT)
Tax levied on non-cash benefits provided to employees as part of remuneration packages.
Gross Crown debt
Total borrowings (financial liabilities).
Gross domestic product (GDP)
A measure of the value of all goods and services produced in New Zealand; changes in GDP measure growth in economic activity or output. GDP can be measured as the actual dollar value of goods and services measured at today’s prices (nominal GDP), or excluding the effects of price changes over time (real GDP).
Gross domestic product (expenditure)
This is the sum of total final expenditures on goods and services in the economy.
Gross national expenditure (GNE)
Measures total expenditure on goods and services by New Zealand residents.
Gross Sovereign-Issued Debt (GSID)
Gross sovereign-issued debt is debt issued by the sovereign (ie, core Crown) and includes Government stock held by the NZS Fund, GSF, ACC or EQC for example. The Government’s debt objective uses this measure of debt.
Labour productivity
Measures output per input of labour (where labour inputs might be measured as hours worked or people).
Line-by-line consolidation
This is a term used to refer to the general approach to the presentation of the Crown financial statements. It means that the revenues, expenses, assets and liabilities of all departments, the Reserve Bank, SOEs and Crown entities are included in the Crown financial statements.
Marketable securities and deposits
Assets held with financial institutions. These assets are held for both cash flow and investment purposes, and include any funds the Government has invested in the International Monetary Fund.
Monetary conditions
The combination of interest rates and the exchange rate.
Monetary policy
Action taken by the Reserve Bank to affect interest rates and the exchange rate in order to control inflation. Tightening monetary policy refers to actions taken by the Reserve Bank to raise interest rates (which can influence the exchange rate) in order to moderate demand pressures to reduce inflationary pressures.
Net Crown debt
Borrowings (financial liabilities) less cash and bank balances, marketable securities and deposits, and advances (financial assets). Net debt excludes the assets of the NZS Fund and GSF. Net Crown debt is a measure of the Core Crown.
Net worth
Assets less liabilities (also referred to as Crown balance).
Operating allowance
The amount included in the Fiscal Strategy Report projections for new spending and cost pressures. The allowance is a projection assumption.
Operating balance
The operating balance is the residual of revenues less expenses plus surpluses from state-owned enterprises and Crown entities. It is the Government’s operating profit or loss.
Operating balance excluding revaluation and accounting policy changes (OBERAC)
The OBERAC is the operating balance adjusted for revaluation movements and accounting policy changes. It provides a measure of underlying stewardship.
Participation rate
Measures the percentage of the working age population in work or actively looking for work.
Projections
Projections of the key fiscal indicators beyond the five-year forecast period. The projections are based on long-run economic and fiscal assumptions. For example, the projections assume no economic cycle and constant long-run interest, inflation and unemployment rates.
Provisional tax
A thrice-yearly payment of tax on income that has not been taxed, or been under-taxed, at source (relates only to company tax and other persons’ tax).
Short-term fiscal intentions
Under the Public Finance Act 1989, the Government must indicate explicitly its intentions for operating expenses, operating revenues, the operating balance, debt and net worth over the next three years.
Source deductions
Tax withheld on wages, salaries, social welfare benefits, bonuses, lump-sum payments and superannuation fund contributions. About 80% of source deductions come from PAYE on wages and salaries. Source deductions is the biggest single tax type.
Specific fiscal risks
These are a category of Government decisions or circumstances which may have a material impact on the fiscal position (excluding contingent liabilities). They are not included in the main forecasts because their fiscal impact cannot be reasonably quantified, the likelihood of realisation is uncertain and/or the timing is uncertain.
Stock change
The change in the value of stocks (raw materials, work in progress, and finished goods) during a given period.
System of National Accounts (SNA)
SNA is a comprehensive, consistent and flexible set of macroeconomic accounts to meet the needs of government and private sector analysts, policy-makers, and decision-takers. See www.imf.org for further information.
Tax revenue
The accrual, rather than the cash (“tax receipts”) measure of taxation. It is a measure of tax due, regardless of whether or not it has actually been paid.
Thin capitalisation
A tax rule applicable to a non-resident-owned business that limits tax deductions for interest payments based on its level of debt relative to its assets.
Trade weighted index (TWI)
A measure of movements in the New Zealand dollar against the currencies of our major trading partners. The currencies comprise the US dollar, the Australian dollar, the Japanese yen, the euro and the UK pound.
Unit labour costs
The wages and other costs associated with employment per unit of output.
Year ended
Graphs and tables use different expressions of the timeframe. For example, 2004/05 or 2005 will generally mean “year ended 30 June” unless otherwise stated.