Exhibit 99.(e)(3)
Fiscal Strategy Report
Summary
This Government is committed to improving the lives and living standards of New Zealanders in a way which is sustainable in the long term.
Fiscal policy is a key tool in meeting this objective – working through three inter-connected channels. First, this Government is committed to maintaining a fiscal position which is sustainable in the long term, thereby creating a sound platform for households and firms to make good saving and investment decisions. Second, our broader goals relating to economic management mean account is taken of Government’s impact on the broader economy, such as the effects of changes in spending and taxes on demand and hence inflation. Finally, through the composition of Government spending and taxes, fiscal policy directly contributes to progressing our economic and social objectives, such as building a productive and innovative economy over the long term.
Our focus on sustainability over recent years has resulted in a significant strengthening of the fiscal position, through lowering debt-to-gross domestic product (GDP) and building up financial assets in order to be in a good position to meet future spending pressures associated with population ageing. The emphasis on sustainability has been reinforced by changes made to The Public Finance Act, requiring the Treasury to publish every four years a statement on the Long-Term Fiscal Position. The first such statement was published in June 2006. A key message from the statement is that prudent fiscal management will be required over a sustained period to ensure that fiscal policy remains sustainable in the long term and that future governments have a full set of options open to them to meet future fiscal challenges.
The Government’s fiscal position is very strong. We continue to run operating surpluses of a size sufficient to make contributions to the New Zealand Superannuation Fund (NZS Fund). Debt remains at levels we consider prudent, and net financial assets are positive and increasing over the next 10 years.
Since the 2007 Budget Policy Statement (BPS) there have been a number of changes in the economic environment and in the fiscal outlook. Economic growth has re-accelerated sooner than expected. As a result, the imbalances that have built up in the economy over recent years – persistent non-tradables inflation, a large current account deficit and the very high NZ dollar - are likely to persist for some time. Higher than expected nominal
gross domestic product (GDP) growth has seen actual and forecast tax revenue revised upward this year and next. These, plus the fact that recent operating surpluses have exceeded that necessary to meet our long term fiscal objectives, underpin our short term intentions.
In designing Budget 2007 we have had both the short term and the long term in mind. The overarching theme of saving and investing is intended to minimise the impact of Government on some of the imbalances which have built up in the economy, and to support sustainable economic growth over the longer term by building a productive and innovative economy in which New Zealanders own a share.
The theme of saving and investing is progressed through the enhancement of KiwiSaver and policies in the priority areas we signalled in the 2007 BPS. These areas are supporting families young and old, building a strong national identity and economic transformation. The Business Tax Reform, previously announced, is designed to improve investment and innovation by delivering significant tax reductions to business from 1 April 2008. Since the 2007 BPS we have also taken decisions to increase transport investment in order to ease infrastructure constraints.
Over time the enhancement of KiwiSaver is intended to promote a stronger saving culture in New Zealand, improve the adequacy of retirement incomes and contribute to a more equitable distribution of wealth. The enhancements to KiwiSaver have been designed in such a way as to minimise the short term impact on domestic demand and inflation. We also consider that higher levels of savings are an important element of developing deeper capital markets and will reduce New Zealand’s reliance on foreign savings over time.
Overall, we expect the combination of higher revenue and policy initiatives with a large savings component will result in Budgets 2007 and 2008 having, on average, roughly the same impact on short-run demand as was forecast in the Half Year Economic and Fiscal Update (Half Year Update).
We continue to meet our long term fiscal objectives, which remain unchanged from the 2006 FSR. However, maintaining a sustainable fiscal position over the long term will require careful fiscal management. Given the significant policy agenda being advanced in this Budget and Budget 2008, we have decided not to pursue the previously announced policy of indexing personal tax thresholds to inflation and have revised downwards our assumptions of tax reductions in the longer term projection period. Moreover, based on current forecasts and fiscal objectives, there is little room for further significant initiatives over the next few Budgets.
The Government’s Fiscal Strategy
This report sets out the Government’s fiscal strategy (summarised in Figure 1 below). The Government’s fiscal strategy aims to deliver a fiscal position that is sustainable in the long term, contributes to economic stability and advances our key policy priorities. It also shows how we intend to deliver on the following principles of responsible fiscal management, as specified in The Public Finance Act:
· maintaining debt at a prudent level by ensuring that, on average, over a reasonable period of time, total operating expenses do not exceed total operating revenue
· achieving and maintaining net worth at levels which provide a buffer against factors which may adversely impact on net worth in the future
· managing prudently the fiscal risks facing the Government, and
· pursuing policies which are consistent with a reasonable degree of predictability about the level and stability of taxes for future years.
Figure 1 – Fiscal strategy at a glance
Source: The Treasury
This Government is committed to sustainable fiscal policy
The Treasury published the first statement on the Long-Term Fiscal Position last year. The statement highlighted that the Government currently has a strong fiscal position, but that over the next 40 years future governments will need to make policy changes to ensure that debt does not increase to unsustainable levels.
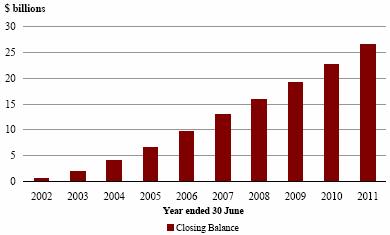
Figure 2 – NZS Fund assets are growing
Source: The Treasury
The Government has been preparing for these long term fiscal challenges for some time. We have been following a fiscal strategy of strengthening the fiscal position. This has involved running operating surpluses sufficient to build up assets in the NZS Fund and reduce debt to prudent levels, while keeping tax-to-GDP and expenses-to-GDP at around current levels.
We are continuing to make progress in pursuing this strategy. Indeed progress has been faster than we originally envisaged. Operating surpluses have come in ahead of expectations on the back of higher than expected economic and revenue growth and the prudent approach we have taken to economic management given macroeconomic imbalances.
Last year we signalled that a prudent level of debt had been achieved and shifted the emphasis to maintaining debt at around 20% of GDP. The fiscal forecasts show we are doing this. We are continuing to strengthen the fiscal position through contributions to the NZS Fund, with Fund assets expected to reach $12.9 billion by June 2007.
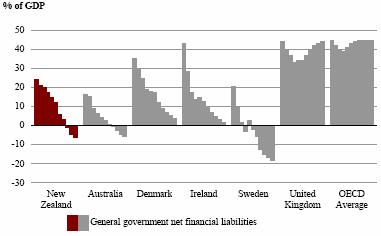
Figure 3 – New Zealand’s fiscal position is strong
Source: International data are sourced from the OECD Economic Outlook 80. New Zealand data are sourced from the Budget Update.
New Zealand’s fiscal position is strong by New Zealand and international standards. New Zealand is amongst a small group of OECD countries whose governments are in a net financial asset position (Figure 3).
Short-Term Economic and Fiscal Outlook
Strong, sustained growth has created short term challenges
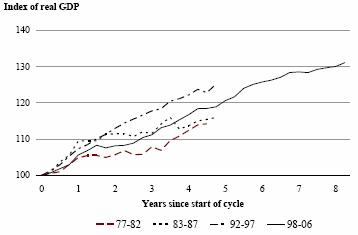
New Zealand is experiencing its longest period of economic growth for three decades (Figure 4).
Figure 4 – The longest economic cycle in three decades
Source: The Treasury
Although growth slowed a little over 2005 and 2006, the long period of strong growth preceding this saw the emergence of macroeconomic imbalances - in particular, persistent non-tradables inflation pressures, a large current account deficit and a very high NZ dollar. In April 2007 the dollar reached a post float high against the US dollar of 74.9 cents.
More recently we have seen economic activity re-accelerate. Since the Half Year Update, Treasury has revised upwards the forecast for GDP growth for the year to March 2008 from 2.3% to 2.6% for real GDP growth and 4.3% to 5.6% for nominal GDP growth.
This rebound in growth has largely been the result of a resurgence in domestic demand growth, with both private consumption growth and housing and business investment showing renewed strength.
Figure 5 – Domestic demand growth is reaccelerating
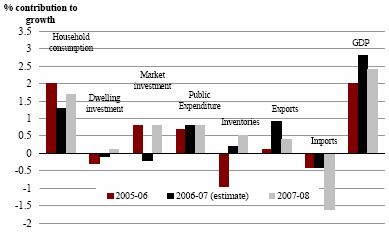
Source: The Treasury
The higher level of economic activity has resulted in an increase in forecast revenue compared with the Half Year Update of $1 billion in 2007/08, $800 million in 2008/09, $470 million in 2009/10 and $600 million in 2010/11. This has allowed us to advance some initiatives in addition to those signalled at the time of the 2007 BPS whilst still meeting our long term objectives.
However, the higher than expected growth also sees some of the macroeconomic imbalances persist. For the year ended March 2008, inflation is expected to be 2.7% and the current account deficit is expected to remain large at 7.4% of GDP.
Budget 2007 takes account of the economic situation
In setting fiscal policy we have been mindful of the economic backdrop.
Since 1999, fiscal policy has withdrawn resources from the economy in net terms, acting to restrain short-run demand and support monetary policy. This is evidenced by sustained operating and cash surpluses.
The OBERAC(3) in 2005/06 was particularly large at 5.5% of GDP, owing in part to the economy performing more strongly than predicted.
(3) Operating balance excluding revaluations and accounting changes.
Figure 6 – Operating Surpluses have been large but are forecast to decline
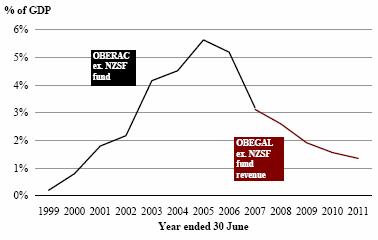
Source: The Treasury
Forecasts going forward show operating surpluses will continue, albeit at a lower level than in the recent past. For example, the operating balance excluding gains and losses (OBEGAL) and excluding NZS Fund revenue is forecast to be 2.8% in 2007/08 and 2.2% in 2008/09 compared with an estimated 3.4% in 2006/07. These forecast operating surpluses are more consistent with our desired path for strengthening the fiscal position, than those we have recorded over recent years.
The transition to lower surpluses means that fiscal policy will not be as much of a constraining influence on the economy as it has over the recent past. This is illustrated by measures such as the Treasury’s “fiscal impulse” indicator (Figure 7). However, just as there is no single indicator to assess the government’s finances there is no single indicator of the government’s impact on the economy. The impulse provides a summary picture of the impact of a change in fiscal policy on demand in the economy.
The fiscal impulse indicator is derived from the change in the fiscal balance. The fiscal balance is a cash-based measure of the operating balance, adjusted for cyclical impacts on taxes and spending and excluding large items that are judged to have less impact on aggregate demand (generally, imported defence spending and NZS Fund contributions).(4) As such it makes only limited adjustment for the composition of fiscal policy.
(4) Because of these adjustments and its focus on economic impact, the fiscal balance and its corresponding fiscal impulse have no direct counterpart in the fiscal accounts.
Figure 7 – The Government is continuing to run a firm fiscal policy stance
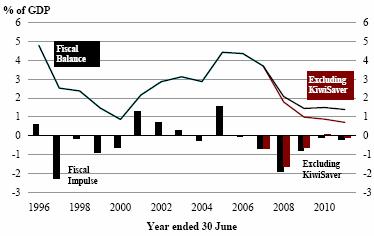
Source: The Treasury
Given the evolution of macroeconomic developments since the 2006 Half Year Update we have been mindful not to increase the impulse resulting from Government activity above that which was signalled at Half Year Update.
As noted above, one of the design parameters of the enhancement of KiwiSaver was not to exacerbate current inflation pressures. For this reason it is reasonable to consider the case where KiwiSaver is removed from calculations of the fiscal balance and the fiscal impulse. This shows the average impulse over the 2006/07 to 2008/09 period to be roughly the same as that estimated at the time of the Half Year Update. This is also the case just looking at the average fiscal impulse over 2007/08 and 2008/09.
We continue to advance our policy priorities
Targeting saving and investing overlays the themes signalled in the 2007 BPS – economic transformation, families young and old, and national identity.
Business Tax Reform is an important element of our strategy for economic transformation. Ultimately, economic transformation is about creating a sustainable economy, built on innovation and quality, and producing the kinds of products for which the rest of the world will pay a premium. Business Tax Reform is intended to encourage business to invest in innovation, new technology, skilled staff and new markets.
The reform includes a reduction in the corporate tax rate from 33% to 30% in order to better reward success, tax credits for research and development in order to promote innovation, and changes to the international tax rules to remove barriers to becoming internationally active. These measures support firm productivity by ensuring New Zealand firms remain competitive on the international stage and by encouraging investment and innovation.
We signalled at the time of the 2007 BPS that we had sufficient fiscal headroom to increase the Budget 2008 operating allowance by $1 billion to accommodate the Business Tax Reform, and that we hoped more headroom would eventuate to further our other priorities. Since the BPS we have a better picture of the full cost of the Business Tax Reform and related measures, and have made the decision to increase the allowance for these measures in Budget 2008 by an additional $130 million.
Budget 2007 also announces, for the first time, a significant enhancement of KiwiSaver. In addition to the $1,000 kick-start, fee subsidy and the first-home buyers subsidy, the Government will now match both individual and employer contributions at 100%, for up to $20 per week. Matching employer contributions will be made compulsory, but will be phased in over four years.
These enhancements build on the original KiwiSaver model to promote a stronger saving culture in New Zealand. They further the Government’s aims for families young and old by improving the adequacy of retirement incomes, encouraging greater diversification in asset holdings and contributing to a more equitable distribution of wealth. Although this Government considers that the design of New Zealand Superannuation is sound, KiwiSaver will increase living standards in retirement by encouraging individuals to increase their own savings. Over the longer term, these enhancements are also intended to assist economic transformation by making New Zealand a more attractive place to work, furthering capital market development and reducing New Zealand’s reliance on foreign saving to finance investment.
Budget 2007 also sees a significant increase in infrastructure investment compared to that signalled in the 2007 BPS. Capital spending in Budget 2007 has been increased to $1.8 billion, an increase of $856 million from the 2007 BPS. The higher level of spending has allowed greater investment in rail infrastructure, among other things. Because we consider infrastructure investment will continue to be a priority over coming years, we have increased our capital allowance from the $750 signalled in the 2006 FSR to $900 million for future Budgets.
Our intentions remain consistent with our fiscal strategy
This significant set of policies is able to be accommodated within our fiscal strategy - a testament to our prudent fiscal management since 1999. That said, the size of Budgets 2007 and 2008 implies that there is little room for further significant initiatives over the next few Budgets given current revenue forecasts, and careful fiscal management will be required going forward. Because of this, we have decided not to pursue the policy, announced in Budget 2005, of indexing tax thresholds to inflation every three years from 2008.
The forecast operating balance remains at a level sufficient to meet legislated contributions to the NZS Fund. Gross debt remains at a level which we consider prudent. As discussed in the box below, for the purposes of assessing consistency with our fiscal objectives, we focus on the level of gross debt excluding impacts outside the control of fiscal policy.
In practice this means stripping out the impact of the change to the Reserve Bank’s liquidity management regime. On this measure, gross-sovereign issued debt is below 20% over the forecast period (see Figure 10 below).
Figure 8 – Increasing net financial assets
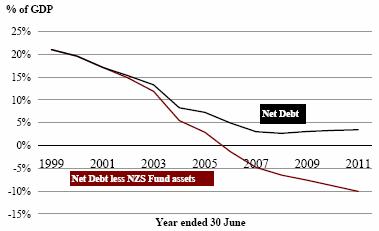
Source: The Treasury
The combination of low debt and the build-up of financial assets results in an increasing net financial asset position – that is, financial assets exceed financial liabilities (see Figure 8). Core Crown net debt including NZS Fund assets is projected to decrease from -3.8% of GDP in 2006/07 to -15% of GDP in 2016/17.
Figure 9 – Residual cash is forecast to shift from surplus to deficit
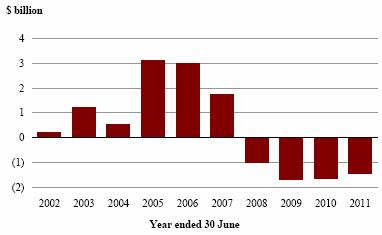
Source: The Treasury
The Budget Economic and Fiscal Update (Budget Update) shows that, although we will continue to run operating surpluses, we will be running cash deficits from 2008/09 onwards (Figure 9). Cash deficits arise as some of the operating balance is retained by the entity which generated the revenue (such as State-Owned Enterprises (SOEs) and the NZS Fund) and because capital expenditure and investments, such as in the NZS Fund, are funded out of the operating balance and borrowing. Nonetheless, the cash deficits are such that we still meet our fiscal objectives.
Gross Sovereign Issued Debt and Reserve Bank Settlement Cash
Settlement cash is the amount of cash the Reserve Bank leaves in the banking system at the end of each working day. Settlement cash activity is financed from commercial banks and not by Government funding.
Over 2006 the Reserve Bank of New Zealand raised the settlement cash level from approximately $20 million to around $8 billion at the end of the year. It has since eased back to around $7.5 billion. The change in the settlement cash level was a result of a review of the liquidity management arrangements available to banks.
Since the Reserve Bank is part of the Core Crown, the increase in settlement cash flowed through directly to Gross Sovereign-Issued Debt (GSID), matched by a corresponding increase in financial assets. The impact on GSID has been partially reduced by the Reserve Bank deciding to fund some of the previously announced increase in reserves from this settlement cash. This has resulted in a reduction of the funding it requires from the Debt Management Office of $1.6 billion.
Given the increase in settlement cash is net debt neutral and the increase in gross debt does not arise out of any change in cash requirements of the Government, we consider that fiscal policy should “look through” this change. In practice this means that fiscal policy should not seek to offset the increase in gross debt by reducing spending or raising taxes elsewhere. Similarly, for the purposes of assessing progress toward or consistency with the Government’s long-term fiscal objectives, we consider that the appropriate indicator to use is gross sovereign-issued debt excluding the impact of settlement cash. Figure 10 shows the impact of reducing gross sovereign-issued debt by $5.9 billion ($7.5 billion less $1.6 billion). On this measure GSID is 19% of GDP in 2010/11 and just below 20% of GDP in 2017/18.
Figure 10 – GSID including and excluding settlement cash
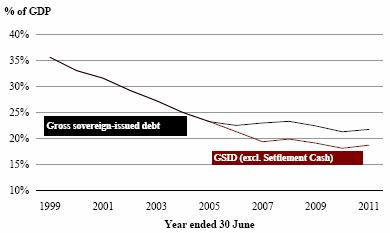
Source: The Treasury
This adjustment is only an approximation. The actual effect on gross sovereign-issued debt will vary over time as the level of settlement cash moves. Because of this we may want to reconsider the debt indicator we use to anchor fiscal policy and/or the target level.
As discussed in the 2007 Budget Update, the result of the move to International Financial Reporting Standards is an increase in gross debt of around $0.7 billion. Although we do not consider that fiscal policy decisions should be driven by technical accounting changes, this change is of a magnitude small enough to ignore.
The Long-Term Fiscal Challenge
The fiscal position faces pressures in the long term
The Public Finance Act requires that the Treasury publishes a statement on the Long-Term Fiscal Position at least every four years. This statement sets out the major factors affecting the fiscal position over the next 40 years. The first statement on the Long-Term Fiscal Position was published last year.
A key message from the statement is that, in common with many other OECD countries, New Zealand is experiencing a shift in the structure of its population. The developed world (and, increasingly, the developing world) is in transition towards a population with a greater proportion of elderly and a falling share of those of traditional working age. This transition is not a demographic “bulge” that will reverse, but marks a permanent shift as a result of declining rates of childbearing and increased lifespan. The combined effect of these factors has been a steady increase in the median age of the population (see Figure 11). At the same time as the structure of the population is changing, technological advances are allowing advances in health care which will see improvements in quality of life.
Figure 11 – The population is ageing
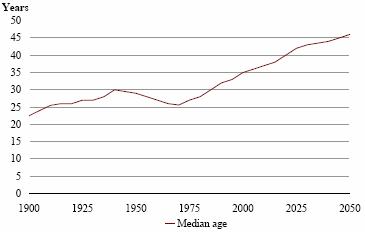
Source: The Treasury, New Zealand’s Long-Term Fiscal Position
These changes create challenges for both governments and for individuals. The challenge for governments will be to maintain a fiscal position which is sustainable over the very long term in the face of rising expenditure pressures that will arise out of this shift.
Increasing economic prosperity will give future governments more choices about how they meet this challenge. The Government’s policies aimed at improving productivity growth, such as the Business Tax Reform, will therefore help to keep us on a sustainable fiscal track. However, as some major expenditure classes are linked to economic growth, economic growth alone will not ensure a sustainable fiscal position.
We have made significant progress in meeting the long-term challenge
The statement highlighted two key long-term fiscal challenges facing Government: superannuation and health.
Figure 12 – Some major spending items will increase in size over time
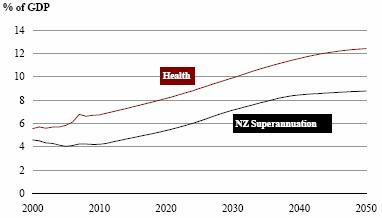
Source: The Treasury, New Zealand’s Long Term Fiscal Position
The cost of New Zealand Superannuation (NZS) in relation to GDP will increase with the greater number of elderly. Ageing, technological improvements and increases in the range of health services are likely to drive up the costs of providing health services in the future.
This Government has been cognisant of these long-term challenges for some time, and has made significant progress in ensuring that fiscal pressures in the future remain manageable. In particular, since 1999 the Government has put considerable effort into strengthening the balance sheet.
This Government considers that the design of NZS is sound, providing a universal pension that effectively eliminates poverty amongst the elderly and does not discourage participation in the labour market. In order to meet some of the future costs of ageing, the Government established the NZS Fund in 2001. The Fund is projected to accumulate assets until 2027, at which time it will be valued at $121 billion and withdrawals can begin in order to fund some of the expected cost of New Zealand Superannuation. Using current income to make contributions to the NZS Fund allows the Government to spread the costs of New Zealand Superannuation across time, and hence maintain a more stable path for debt and taxes over the long term. This provides more certainty to households and firm to make saving and investment decisions.
In addition to increasing Government savings, this Government is also putting significant resources into encouraging private savings through KiwiSaver. One of our objectives is to assist more New Zealanders to enjoy a standard of living in retirement similar to that which they enjoyed pre-retirement.
…however, challenges remain
In common with other OECD countries, a significant challenge going forward will be managing the growth of health expenditure. This is discussed in the following box.
Health in the Long Term: Ways to Manage Expenditure Growth
Challenges remain in managing health expenditure growth
This Government is committed to a comprehensive, tax-funded public health system which is available to all New Zealanders.
We have choices about how we achieve this in the long term. What is clear, though, is that the trend of health expenditure growth out pacing economic growth can not continue without affecting future governments’ ability to either fund other services or to maintain prudent levels of debt.
Figure 13 – Government Expenditure on health doubled as a proportion of GDP from 1950 to 2005
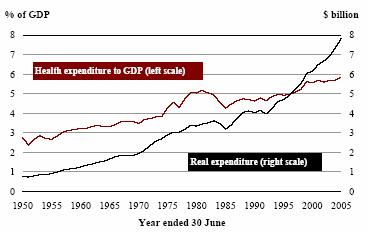
Source: The Treasury
In part, health expenditure growth reflects changes in demographics (including a greater proportion of older New Zealanders with higher health costs). However, the larger drivers of growth are non-demographic – decisions about the cost and coverage of the health system, and demand for new, more complex technology for example. We have choices about how we respond to these drivers.
… which means we need to get the most from existing spending …
An important way of reducing the growth in health spending, while meeting demand pressures, is to get more from existing spending. This means pursuing measures such as improving productivity, ensuring services are effective and prioritising those services that evidence suggests are most effective in improving health outcomes.
… and debate the options for funding over the long-term
There is no “right” amount to spend on health care – different countries spend what they can afford. In New Zealand, it is clear that if health expenditure continues to grow at rates comparable to recent history, it will put pressure on the fiscal position in the long term. This means we should start to debate possible ways forward before that pressure starts to bite.
Long-Term Fiscal Outlook
Our long-term fiscal objectives remain the same as in the 2006 FSR (see Annex 1). The following fiscal projections illustrate likely future progress toward achieving these objectives. The projections are based on the forecasts in the 2007 Budget Update. The fiscal projections carry forward the operating and capital allowances of around $2.1 billion and $0.9 billion respectively, and increase them at the rate of 2% per year. Actual outcomes will likely depart form those projected here, particularly given the time horizon of the projections.
We continue to make progress towards building Government savings…
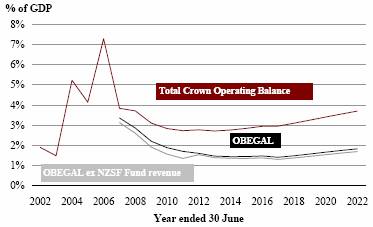
Projections show the operating surplus stabilising at around 2.8% before drifting upwards, reflecting growing returns from the NZS Fund. The OBEGAL excluding returns from the NZS Fund remains at a level sufficient to meet the requirements for contributions to the NZS Fund over the next 15 years (Figure 14). The required contribution to the NZS Fund, declines from around 1.3% to 0.6% of GDP over the next 15 years.
Figure 14 –The OBEGAL excluding NZS Fund revenue remains at a level sufficient to fund NZS Fund contributions
Source: The Treasury
In the last three FSRs we have assumed a broadly constant ratio of tax to GDP over the projection period. Given the size of the enhancement to KiwiSaver and the Business Tax Reform and in order to remain consistent with our fiscal strategy, we have changed the approach used to project forward tax revenue beyond 2011/12, in effect reducing the extent of tax reductions assumed. Rather than assume tax reductions will be made of a magnitude equivalent to full indexation of personal tax thresholds, the projections build in an adjustment to tax equivalent to inflation indexation only. This policy choice gives us room to pursue the policy of inflation indexation of personal tax thresholds from 2011/12, should we wish.
This change in assumption has implications for the NZS Fund. In particular, superannuation projections in the 2006 FSR assumed tax thresholds would be periodically adjusted to keep the average tax rate on New Zealand Superannuation constant. However, as projections now assume that tax reductions will be of a magnitude sufficient to compensate for inflation only, this sees a reduction in the net cost of superannuation to the Government. This has the effect of reducing the required capital contribution to the NZS Fund by $88 million in 2007/08.
…and increasing Net Worth
We continue to meet our objective of increasing net worth over the longer term. Total Crown net worth is projected to increase from around 54.4% of GDP to 64.6% of GDP between now and 2022. Core Crown net worth is expected to more than double in absolute terms between now and 2022, from $49 billion to $126 billion. These projections do not assume any valuations changes.
Debt remains at a prudent level
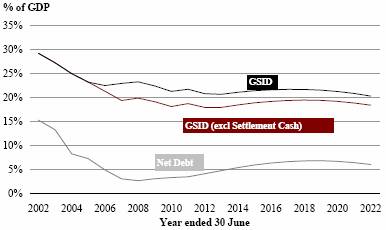
Projections of gross debt are consistent with our unchanged objective of maintaining gross-sovereign issued debt at a prudent level of around 20% over the next 10 years. Headline gross sovereign-issued debt currently sits above 20% over the projection period. However, as discussed earlier, it is appropriate to look through the impact of fluctuations in debt which arise from factors external to fiscal policy, such as an increase in Reserve Bank settlement cash. Gross sovereign-issued debt, excluding the impact of Reserve Bank settlement cash, remains below 20% over the next 10 years.
Figure 15 – Debt remains at a prudent level
Source: The Treasury
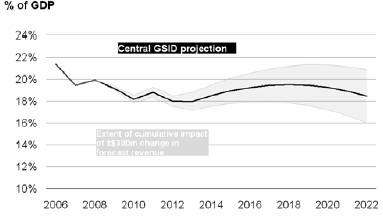
Projections of gross debt are inherently uncertain and small changes in the present can have large impacts on projections ten years in the future. For example, figure 16 shows a change in the operating balance from 2008/09 onwards of $300 million will change gross sovereign-issued debt by around 1.5% by 2016/17. The change in tax revenue forecast between Half Year Update and Budget Update for the 2007/08 year is equal to $1 billion.
Figure 16 – Small changes in forecasts can significantly change the future fiscal position
Source: The Treasury
Gross sovereign-issued debt is forecast to decline as a percentage of GDP between now and 2012/13 despite the fact that we are running cash deficits from 2008/09. This is in part because financial assets, accumulated over recent years, will be used to fund some of the cash deficits. This sees net debt rise more steeply than gross debt in the projection period.
Tax and expenditure remain around current levels
The Government’s long-term revenue and expense objectives are set so as to be consistent with achieving the operating balance objective.
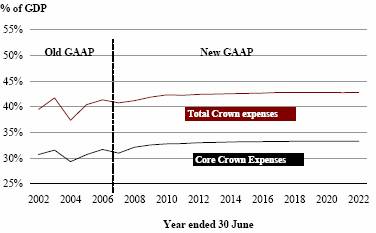
Core Crown expenses as a percentage of GDP are expected to average approximately 33% over the next 15 years (Figure 17).
Figure 17 – Expenses remains around current levels
Source: The Treasury
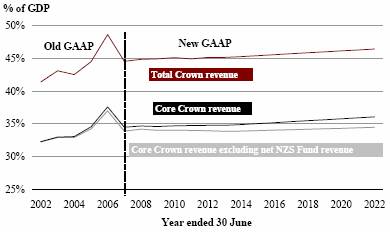
Total Crown revenue as a percentage of GDP is expected to rise slightly over the next 15 years (Figure 18). This reflects growth in returns from the NZS Fund and the assumption to only give tax reductions of a magnitude equivalent to inflation indexation of tax thresholds. Excluding NZS Fund returns and returns from SOEs and other Crown entities, core Crown revenue is expected to remain in the 34% to 36% band over the next 15 years.
Figure 18 – Slight rise in revenue
Source: The Treasury
Conclusion
The Government has built a reputation for prudent fiscal management. Budgets 2007 and 2008 advance significant policy programmes focused on both the short and long term, while at the same time being fiscally responsible over the longer term. Our fiscal strategy, focused on building a strong fiscal position and productive economy, puts future governments in a better position to manage cost pressures which they may face.
Hon Dr Michael Cullen
Minister of Finance
10 May 2007
Annex 1
Long-Term Objectives
We retain the same long term objectives as specified in the 2006 FSR. We have updated how we intend to go about meeting these objectives to reflect the adoption of International Financial Reporting Standards and our intention to “look through” the increase in gross sovereign-issued debt which is due to the Reserve Bank’s changed liquidity management regime.
Table A1 – Long-term fiscal objectives
Long-term fiscal objectives | | To achieve the objectives, the Government’s high-level
focus is on: |
Operating balance Operating surpluses on average over the economic cycle sufficient to meet the requirements for contributions to the NZS Fund and ensure consistency with the debt objective. Revenue Ensure sufficient revenue to meet the operating balance objective. Expenses Ensure expenses are consistent with the operating balance objective. | | · Operating surpluses during the build-up phase of the NZS Fund.Our focus is on maintaining the OBEGAL excluding NZS Fund revenue at a level sufficient, on average, to meet the requirements for contributions to the NZS Fund. · Our focus in meeting this objective is on core Crown revenues and expenses, maintaining tax to GDP and core Crown expenses to GDP around current levels. · As set out in our revenue strategy, we will ensure tax policy decisions are consistent with the overall fiscal strategy including the Government’s long-term revenue objective. · SOEs and Crown entities contributing to surpluses, consistent with their legislation and Government policy. |
| | |
Debt Manage total debt at prudent levels. Gross sovereign-issued debt broadly stable at around 20% of GDP over the next 10 years. | | · Gross sovereign-issued debt to GDP will be broadly stable over the period ahead of the major demographic changes associated with population ageing. · The Government is effectively targeting a level of gross sovereign-issued debt excluding the increase in debt on the Reserve Bank balance sheet as a result of the change in the liquidity management regime. · Core Crown net debt, with NZS Fund assets, is expected to fall towards -15% of GDP by 2017 (ie, a net financial asset position). · SOEs will have debt structures that reflect best commercial practice. Changes in the level of debt will reflect specific circumstances. |
| | |
Net worth Increase net worth consistent with the operating balance objective. | | · Increasing net worth consistent with the operating balance objective will see core Crown net worth a little below 36% of GDP by 2017. · The NZS Fund is expected to be above 21% of GDP by 2017. · Consistent with the net worth objective, there will also be a focus on quality investment. |
Annex 2
Short-Term Fiscal Intentions
2007 Fiscal Strategy Report | | 2007 Budget Policy Statement |
Operating balance Based on operating amounts for the 2007 Budget, and indicative amounts for the 2008 and 2009 Budgets, the OBEGAL excluding NZS Fund revenue is forecast to be 3.4% of GDP in 2007/08, decreasing to 1.7% of GDP by 2010/11. This remains consistent with the long-term objective for the operating balance. | | Operating balance Based on operating amounts for the 2007 Budget, and indicative amounts for the 2008 and 2009 Budgets, the operating surplus on an OBERAC basis and excluding net returns on the NZS Fund is forecast to be around 3.1% of GDP over the next three years, remaining consistent with the long-term objective for the operating balance. |
| | |
Debt Total debt (including Reserve Bank settlement cash) is forecast to be 25.3% of GDP in 2010/11. Gross sovereign-issued debt including net settlement cash is forecast to be 21.8% of GDP in 2010/11. Excluding net settlement cash, gross sovereign-issued debt is forecast to be 18.8% of GDP in 2010/11. The Government will set forecast new operating and capital spending amounts over the next three years that are consistent with the long-term objective for debt. | | Debt Total debt is forecast to be 25.0% of GDP in 2010/11. Gross sovereign-issued debt is forecast to be 20.7% of GDP in 2010/11. The Government will set forecast new operating and capital spending amounts over the next three years that are consistent with the long-term objective for debt. |
| | |
Expenses Total Crown expenses are forecast to be 42.5% of GDP in 2010/11. Core Crown expenses are forecast to average 32.7% over the forecast period and be 33.1% of GDP in 2010/11. This assumes new operating expense amounts of $1.97 billion for the 2007 Budget, $2.0 billion for the 2008 Budget and $2.0 billion for the 2009 Budget (GST exclusive). | | Expenses Total Crown expenses are forecast to be 40.7% of GDP in 2010/11. Core Crown expenses are forecast to average 32.5% over the forecast period and be 32.0% of GDP in 2010/11. This assumes new operating expense amounts of $1.9 billion for the 2007 Budget, $2.0 billion for the 2008 Budget and $2.0 billion for 2009 Budget (GST exclusive). |
| | |
Revenues Total Crown revenues are forecast to be 44.3% of GDP in 2010/11. Within this, core Crown revenues are forecast to be 34.1% of GDP in 2010/11. This assumes new revenue initiatives in the 2008 Budget resulting in a $1.13 billion reduction in revenue from 2008/09. The Government will set revenue plans over the next three years that ensure progress is made towards the long-term revenue objective. | | Revenues Total Crown revenues are forecast to be 43.7% of GDP in 2010/11. Within this, core Crown revenues are forecast to be 34.3% of GDP in 2010/11. This assumes new revenue initiatives in the 2008 Budget resulting in a $1.0 billion reduction in revenue from 2008/09. The Government will set revenue plans over the next three years that ensure progress is made towards the long-term revenue objective. |
| | |
Net worth Total Crown net worth is forecast to be 54.4% of GDP in 2006/07, rising to 57.3% of GDP in 2010/11. Excluding NZS Fund assets total Crown net worth is forecast to be 43.5% of GDP in 2010/11. Core Crown net worth is forecast to be 33% of GDP in 2010/11. | | Net worth Net worth is forecast to be 47.8% of GDP in 2006/07, 49.1% in 2007/08, 49.5% in 2008/09, 50.2% in 2009/10 and 50.9% of GDP in 2010/11. Excluding NZS Fund assets it is forecast to be 37.5% of GDP in 2010/11. |
Annex 3
Projection Assumptions
From 2006/07 to 2010/11, the fiscal projections incorporate the economic and fiscal forecasts detailed in the 2007 Budget Update. Beyond 2010/11, the fiscal projections are based on long-run technical and policy assumptions and are not forecasts. The following assumptions apply beyond 2010/11:
· nominal GDP grows with assumed labour productivity growth (average annual rate of 1.5%), projected changes in the labour force and inflation (average annual rate of 2%), and
· demographic and labour force trends are based on Statistics New Zealand (SNZ) population projections with medium fertility, medium mortality and long-term net migration of 10,000 a year. These projections are based on SNZ 2006 (2005 base) National Population Projections, updated with the Treasury’s short-term migration and population estimates to ensure consistency with the Budget Update forecasts.
The projections beyond 2010/11 are the result of assumptions about the long-run economic drivers of growth. For example, a stronger labour productivity growth assumption will, keeping other factors constant, lead to a higher projection of real GDP growth.
Table A3.1 – Summary of economic assumptions*
| | 2007 | | 2008 | | 2009 | | 2010 | | 2011 | | 2012 | | 2013 | | 2014 | | 2015 | | ….. | | 2020 | |
June Year(5) | | Forecasts | | | | Projections | |
Labour force | | 0.9 | | 1.7 | | 1.4 | | 0.9 | | 1.2 | | 0.9 | | 0.9 | | 0.8 | | 0.8 | | | | 0.6 | |
Unemployment rate** | | 3.8 | | 3.9 | | 4.4 | | 4.5 | | 4.3 | | 4.3 | | 4.3 | | 4.3 | | 4.3 | | | | 4.3 | |
Employment | | .8 | | 1.6 | | 0.9 | | 0.8 | | 1.4 | | 0.9 | | 0.9 | | 0.8 | | 0.8 | | | | 0.6 | |
Labour productivity growth*** | | 1.1 | | 1.0 | | 1.1 | | 2.2 | | 1.8 | | 1.5 | | 1.5 | | 1.5 | | 1.5 | | | | 1.5 | |
Real GDP | | 2.1 | | 2.3 | | 1.8 | | 3.0 | | 3.2 | | 2.4 | | 2.4 | | 2.3 | | 2.4 | | | | 2.1 | |
Consumer price index (annual % change) | | 1.8 | | 2.6 | | 2.3 | | 2.3 | | 2.1 | | 2.0 | | 2.0 | | 2.0 | | 2.0 | | | | 2.0 | |
Government 10-year bonds (quarterly % rate) | | 5.9 | | 6.1 | | 6.1 | | 6.0 | | 6.0 | | 6.0 | | 6.0 | | 6.0 | | 6.0 | | | | 6.0 | |
Nominal average hourly wage | | 4.8 | | 3.9 | | 4.1 | | 3.9 | | 3.5 | | 3.5 | | 3.5 | | 3.5 | | 3.5 | | | | 3.5 | |
* Annual average % change unless otherwise stated.
** Level of unemployment.
*** Full-time equivalent employed measure.
Sources: The Treasury, Statistics New Zealand
(5) Note that the economic forecasts in the Budget Update are based on a March year.
Table A3.2 – Summary of fiscal assumptions
Tax revenue | | Linked to growth in nominal GDP, with a constant tax-to-GDP ratio assumed for all components except for PAYE. PAYE is grown by multiplying the real wage component of growth by an elasticity of 1.3. |
NZS | | Demographically adjusted and linked to nominal wages after reaching 65% wage floor. Assumes the average tax rate on NZS increases due to the portion of fiscal drag which arises due to increases in labour productivity. |
Other benefits | | Demographically adjusted and linked to inflation. |
Health and education | | Demographically adjusted. |
Finance costs | | A function of debt levels and interest rates. |
Other | | Not demographically adjusted. |
Operating allowance | | $1.88 billion (equivalent to $2.09 billion adjusted for demographic growth) in 2010/11, increasing at the rate of 2% per annum. |
Capital allowance | | $900 million in 2010/11, increasing at the rate of 2% per annum. |
Surplus DMO cash balance | | $3.8 billion (see text below) |
NZS Fund | | Contributions to the Fund are assumed to be consistent with the New Zealand Superannuation Fund Act 2001(6). |
Source: The Treasury
The fiscal projections differ from the 2006 FSR because of changes to both the economic outlook and fiscal forecasts and due to changes in decisions regarding likely policy in the projection period. The 2007 projections incorporate the latest GSF and Student Loan expenditure projections. In addition, ACC and Health demographic cost weights have been updated. The capital allowance has increased by $150 million to $900 million and the operating allowance is now $1.88 billion (equivalent to $2.09 billion adjusted for demographic growth). Changes to tax revenue projections are discussed below.
FSR 2007 projections assume that financial assets built up as a result of cash surpluses, and held by the Debt Management Office, are run down in the projection period before new debt is taken on. These assets amount to $3.8 billion in 2011. Projections indicate the financial assets will be exhausted by 2014.
Expenses
For the FSR projections, expenses are modelled using a hybrid of the “top-down” and “bottom-up” approach. The “top-down” approach uses an operating allowance to model new expenditure. This modelling approach provides a sense of the aggregate expenditure control inherent in a particular fiscal strategy. However, in areas where there is a clear expenditure driver individual expenditure classes are grown at an assumed rate (the “bottom up approach”). For example, New Zealand Superannuation is grown to capture demographics and wage adjustments and “other benefits” are grown to reflect demographic growth and benefit indexation.
An alternative approach is to model expenses on a purely “bottom-up” basis, modelling each expenditure class at an assumed rate to capture demographics, inflation and a real
(6) The Budget Update provides details on contributions over the next four years. Further details can be found in “Financing New Zealand Superannuation”, a Treasury Working Paper 01/20, available at www.treasury.govt.nz/workingpapers/2001/01-20.asp.
growth factor (typically in per capita or per recipient terms). There is no operating allowance in the bottom-up approach. This approach is often used in very long term fiscal modelling and analysis such as the Treasury’s statement on the Long-term Fiscal Position.
For more information on the LTFM please refer to www.treasury.govt.nz/ltfm/.
Tax Revenue
FSRs between 2004 and 2006 assumed that tax revenue grew at the same rate as nominal GDP growth in the projection period. All components of tax revenue, including projected source deductions tax (such as PAYE on salaries and wages) were grown with nominal GDP. In effect this assumed that governments would make periodic reductions to tax rates and/or increases to the tax bracket thresholds to compensate for “fiscal drag”. Fiscal drag applies in the main to the personal income tax base. It refers to the situation where, in a tiered tax regime, anyone whose annual income is above the lowest tax threshold will pay proportionately more tax on every extra dollar earned. Two factors are largely responsible for this:
· the movement of individuals into higher tax brackets over time
· the fact that anyone whose annual taxable income is above the lowest tax bracket pays proportionally more tax on every extra dollar they earn.
For FSR 2007, we assume that the source deductions tax base grows due to fiscal drag in the projection period. However, we assume that around 60% of the growth in the tax base attributed to fiscal drag is returned to tax payers. This change reflects the likelihood that smaller tax reductions will be made in the projection period than were previously assumed. This is modelled by multiplying the real wage component of the growth in source deductions by an elasticity of 1.3, with no adjustment to the inflation part of wage growth. We do not attempt to model fiscal drag in projecting “other persons” tax, which is paid by the self-employed, investors etc, as we have little evidence to suggest the elasticity on income growth is significantly different from one.
Between 2000 and 2003, when fiscal drag was last applied in the tax projections used in the FSR, the elasticity was 1.25 and was applied to nominal GDP growth on individual tax revenue. The change in the value, and the restriction of its application to the wage components of source deductions growth, stem from the use of new estimation methods which are consistent with methods used in the forecast period.
This change in assumptions has implications for the NZS Fund. Expenditure on NZ Superannuation is linked to growth in after tax wages. Under partial fiscal drag, after tax wages grow more slowly than gross wages and NZS expenditure is reduced. This has the result of reducing the required capital contribution to the NZS Fund. The required capital contribution to the NZS Fund is reduced by $88 million in 2007/08.
Annex 4
Revenue Strategy
The government will ensure tax policy decisions are consistent with the overall fiscal strategy including the government’s long-term revenue objective. The government intends to implement its fiscal strategy with tax to GDP around current levels.
The government’s wider policy objectives for the next three years include encouraging productivity, growth and savings. The quality and design of tax policy has an important role to play in support of these objectives.
The government is also committed to a fair distribution of the tax burden and a robust tax system where people pay their intended rates of tax.
The government will continue to promote sound administration of the tax system and clear and effective tax rules that minimise administration and compliance costs.
The government will give consideration to the composition of taxation to meet the government’s equity and spending objectives at lowest economic cost.
The government will consider the use of tax exemptions and concessions only in the context of the full range of policy options and only if the benefits can be shown to outweigh the costs for New Zealand.
The Government, through its confidence and supply agreements with United Future and New Zealand First, is committed to:
· the Business Tax review (both agreements)
· a new tax rebate regime for charities (United Future)
· a discussion document on income splitting (United Future)
· a new taxation regime for the racing sector (New Zealand First).