Exhibit 99.(e)(4)
Economic and Fiscal Update
Statement of Responsibility
On the basis of the economic and fiscal information available to it, the Treasury has used its best professional judgement in supplying the Minister of Finance with this Economic and Fiscal Update. The Update incorporates the fiscal and economic implications both of Government decisions and circumstances as at 9 May 2007 that were communicated to me, and of other economic and fiscal information available to the Treasury in accordance with the provisions of the Public Finance Act 1989.
John Whitehead
Secretary to the Treasury
9 May 2007
This Economic and Fiscal Update has been prepared in accordance with the Public Finance Act 1989. I accept overall responsibility for the integrity of the disclosures contained in this Update, and the consistency and completeness of the Update information in accordance with the requirements of the Public Finance Act 1989.
To enable the Treasury to prepare this Update, I have ensured that the Secretary to the Treasury has been advised of all Government decisions and other circumstances as at 9 May 2007 of which I was aware and that had material economic or fiscal implications.
Hon Dr Michael Cullen
Minister of Finance
9 May 2007
1
Economic and Tax Outlook
Summary
Real Gross Domestic Product (GDP) growth has re-accelerated after a short period of below-trend growth
· The economy expanded by 0.8% in the last quarter of 2006, a pace estimated to have been matched in the first quarter of this year.
Figure 1.1 – Growth in real production GDP
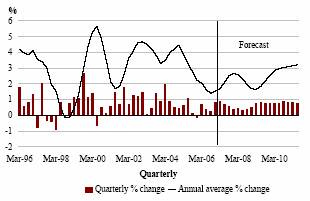
Sources: Statistics New Zealand, The Treasury
· Quarterly real GDP growth is expected to be maintained at or just below potential (around ¾%) before easing in late 2007. The pace and duration of the current rebound is the main uncertainty of these forecasts.
· The central forecasts see annual average real GDP growth of 2.6% over the year to March 2008, up from 1.7% in the March 2007 year. Key risks and two alternative scenarios are explored in the Risks and Scenarios chapter.
The upswing is being driven by a rebound in domestic demand
· Household consumption and investment spending have rebounded. The recent momentum is expected to be sustained for the next few quarters on the back of ongoing strong labour income growth. Additional support has come from somewhat lower oil prices, the recent pick-up in house price growth and immigration flows, the final stage of Working for Families and the high exchange rate keeping prices for imported goods and services low.
· Business investment has rebounded sharply, while government consumption and non-market investment are forecast to contribute around a total of 0.2 percentage points to quarterly growth.
The brief period of slower growth was not enough to lower inflation pressures which remain elevated and the exchange rate is near post-float highs
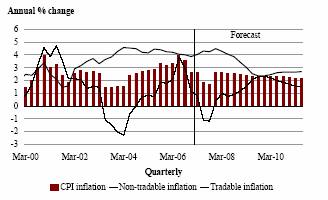
· Despite an expected temporary easing in annual Consumers Price Index (CPI) inflation to 1.7% in September 2007, associated with volatile petrol prices and the high exchange rate, the domestic, non-tradables bias of growth means strong medium-term inflation pressures are forecast to persist. CPI inflation is expected to return to near the top of the 1% to 3% target range by March 2008.
Figure 1.2 – Output gap and annual non-tradables inflation
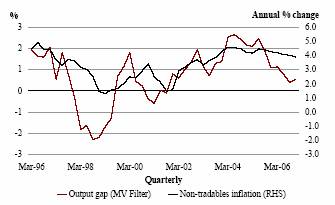
Sources: Statistics New Zealand
· Recent increases in the prices of some major export commodities have boosted the terms of trade, which is forecast to contribute to a fall in the current account deficit over 2007. Nevertheless the current account deficit is expected to remain above its long-run average.
· In response to more persistent inflation pressures, short-term interest rates are expected to be higher for longer than forecast in the Half Year Update.
The upswing in growth is not expected to be sustained, allowing inflation to ease eventually
· Effective mortgage interest rates are expected to increase to an even greater extent, reflecting the rise in swap rates and the recent increase in bank margins on fixed rate loans. This contributes to an eventual decline in household spending growth.
· Real GDP growth is expected to slow to 1.6% in the March 2009 year. The unemployment rate is forecast to rise to around 4½% in mid-2009 from 3.7% at the end of 2006.
· The slower period of growth during the March 2009 year is forecast to lead to an easing of non-tradables inflation. CPI inflation is forecast to decline to 2.4% in March 2009, despite solid tradables inflation owing to a forecast depreciation of the exchange rate.
Eventually growth returns to trend and the pattern of growth becomes more balanced as interest rates and the exchange rate fall
· Export volume growth is expected to increase in the later forecast years as growth in services and manufactured exports accelerates following the forecast exchange rate depreciation from 2008. A lower exchange rate also acts to reduce import growth. The current account deficit is forecast to fall to around 6% of GDP.
· Despite lower interest rates, weak household spending growth is forecast to continue for a sustained period as people respond to higher debt servicing costs, falling house prices and net wealth, and slower income growth. Somewhat higher unemployment will also make households less sure about job security.
· Real GDP growth of around 3% is forecast for the March 2010 and 2011 years – around potential.
The more cyclical outlook for growth and inflation will be mirrored in tax revenue growth
· A higher level of inflation, a lift in the terms of trade and near term strength in domestic demand all contribute to a higher level of nominal GDP than forecast in the Half Year Update until the middle of 2009.
· Forecasts of tax revenue growth have been revised up for the 2007 and 2008 fiscal years, mainly on the back of higher growth in source deductions (PAYE), GST and Resident Withholding Tax (RWT).
· In the 2009 June year, the Business Tax Reform (BTR) announced in the Budget sees corporate tax revenue decline and overall tax grow at a pace below nominal GDP growth.
· Notwithstanding the tax policy changes which reduce the tax take, the ratio of tax revenue is forecast to end the forecast period little changed from what it was in the year to June 2006, and higher than forecast in the Half Year Update. This reflects the removal of the judgement concerning corporate tax losses built into recent forecasts, and labour receiving a greater share of nominal GDP.
The discussion of the forecasts that follows is separated into four parts:
· the slowdown during the 2005 and 2006 calendar years
· the current re-acceleration in growth
· a forecast slowdown in the March 2009 year, and
· a return to trend growth in the years to March 2010 and 2011.
Table 1.1 – Economic outlook: central forecast(1)
Economic outlook: central forecast
(Annual average % change,
year to 31 March) | | 2006
Actual | | 2007
Estimate | | 2008
Forecast | | 2009
Forecast | | 2010
Forecast | | 2011
Forecast | |
| | | | | | | | | | | | | |
Private consumption | | 4.3 | | 1.7 | | 3.2 | | 1.6 | | 1.6 | | 1.6 | |
Public consumption(2) | | 4.7 | | 4.4 | | 4.1 | | 3.9 | | 4.0 | | 3.5 | |
Total consumption | | 4.4 | | 2.3 | | 3.4 | | 2.1 | | 2.1 | | 2.1 | |
Residential investment | | -4.7 | | -2.3 | | 3.4 | | -1.9 | | -0.5 | | 0.9 | |
Central government investment | | 6.4 | | -3.4 | | 4.1 | | -0.5 | | -1.7 | | -0.3 | |
Other investment | | 7.5 | | -4.6 | | 5.8 | | 0.2 | | 1.4 | | 4.2 | |
Total investment | | 4.1 | | -4.0 | | 4.9 | | -0.3 | | 0.8 | | 3.3 | |
Stock change(3) | | -0.5 | | -0.4 | | 0.8 | | -0.1 | | -0.2 | | -0.1 | |
Gross national expenditure | | 3.9 | | 0.6 | | 4.4 | | 1.4 | | 1.6 | | 2.3 | |
Exports | | -0.3 | | 3.1 | | 0.4 | | 3.5 | | 4.1 | | 4.1 | |
Imports | | 4.1 | | -1.2 | | 4.8 | | 2.2 | | 0.4 | | 1.6 | |
GDP (production measure) | | 2.0 | | 1.7 | | 2.6 | | 1.6 | | 2.8 | | 3.1 | |
- annual % change | | 1.8 | | 2.3 | | 2.1 | | 1.9 | | 3.0 | | 3.3 | |
| | | | | | | | | | | | | |
Real GDP per capita | | 1.1 | | 0.6 | | 1.5 | | 0.7 | | 1.9 | | 2.3 | |
Nominal GDP (expenditure basis) | | 4.6 | | 4.4 | | 5.6 | | 3.5 | | 4.2 | | 4.8 | |
GDP deflator | | 2.1 | | 2.3 | | 2.6 | | 1.9 | | 1.4 | | 1.7 | |
| | | | | | | | | | | | | |
Employment(4) | | 2.7 | | 1.8 | | 0.8 | | 1.0 | | 0.5 | | 1.3 | |
Unemployment(5) | | 3.9 | | 3.8 | | 3.9 | | 4.5 | | 4.4 | | 4.3 | |
| | | | | | | | | | | | | |
Wages(6) | | 4.7 | | 4.8 | | 4.1 | | 4.0 | | 4.0 | | 3.6 | |
CPI inflation(7) | | 3.3 | | 2.6 | | 2.7 | | 2.4 | | 2.4 | | 2.2 | |
Export prices(8) | | 1.0 | | 8.8 | | -2.6 | | 4.2 | | 9.1 | | 5.5 | |
Import prices(8) | | 1.8 | | 7.3 | | -6.0 | | 4.1 | | 9.8 | | 5.7 | |
| | | | | | | | | | | | | |
Current account balance | | | | | | | | | | | | | |
- $ million | | -14922.0 | | -13933.2 | | -12676.9 | | -12593.1 | | -12844.5 | | -12100.9 | |
- % of GDP | | -9.6 | | -8.6 | | -7.4 | | -7.1 | | -6.9 | | -6.2 | |
| | | | | | | | | | | | | |
TWI(9) | | 68.3 | | 68.8 | | 69.0 | | 62.3 | | 56.9 | | 54.5 | |
90-day bank bill rate(9) | | 7.6 | | 7.8 | | 8.0 | | 6.7 | | 6.3 | | 6.2 | |
10-year bond rate(9) | | 5.7 | | 5.8 | | 6.1 | | 6.1 | | 6.1 | | 6.0 | |
Sources: Statistics New Zealand, Reserve Bank of New Zealand, The Treasury
NOTES: | (1) | Forecasts finalised on 16 April 2007. |
| (2) | The forecast profile for public consumption is influenced by government defence spending. |
| (3) | Contribution to GDP growth. |
| (4) | Household Labour Force Survey, full-time equivalent employment. |
| (5) | Household Labour Force Survey, percentage of the labour force, March quarter, seasonally adjusted. |
| (6) | Quarterly Employment Survey, average hourly ordinary time earnings. |
| (7) | Annual percentage change. |
| (8) | Overseas Trade Index basis, annual average percentage change, March quarter. |
| (9) | Average for the March quarter. |
Assumptions Underlying the Central Forecast
Global economic activity – global economic growth, inflation and interest rate forecasts are taken from the March 2007 Consensus Forecasts and Asia Pacific Consensus Forecasts. The general outlook remains positive and for steady growth of around 3.6% for our top 14 trading partners over the period. The outlook for the United States economy in 2007 has weakened recently, with growth expected to be only 2.4% in 2007, but stronger growth is now expected in Japan and the Euro Zone in the near term. Growth in Australia is expected to be 3.0% in 2007; and 2.6% in the UK.
Oil prices – prices for West Texas Intermediate (WTI) in the December quarter of 2006 matched the assumption in the Half Year Update, but lower prices in early January contributed to March quarter prices averaging US$58/barrel – around US$4 below the Half Year Update assumption. Futures pricing at the time these forecasts were finalised suggested that prices will increase to US$68/barrel in June 2008 and not fall below this point until the start of 2010. Prices end the forecast period at around US$67/barrel, about US$2/barrel higher than in the Half Year Update.
Net migration – net migrant inflows of around 13,000 are expected in the year to March 2007. Net migration levels are then assumed to fall by around 1,000 a year over the next three years so that net migration totals 12,000 in the year to March 2008, 11,000 in the year to March 2009 and 10,000 in the years to March 2010 and 2011.
Monetary conditions – the NZ dollar exchange rate as measured by the Trade Weighted Index (TWI) is assumed to average 70.0 over the June quarter of 2007 and 69.0 during the next three quarters through to March 2008, before easing to 62.3 in March 2009, 56.9 in March 2010 and 54.5 in March 2011.
Climate – agricultural growing conditions and the level of hydro electricity storage lakes are assumed to be normal over the forecast period.
Growth Eased in 2005 and 2006
New Zealand’s rate of economic growth slowed in 2005 and 2006 …
Figure 1.3 – Real GDP and final domestic demand
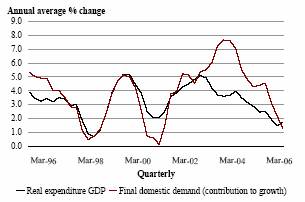
Sources: Statistics New Zealand
During 2005 and most of 2006 New Zealand’s annual average rate of growth slowed, with real expenditure GDP growth falling from 4.0% at the end of 2004 to 1.5% in September 2006. This followed a period of strong growth between 2002 and 2004, in which real expenditure GDP growth peaked at 5.1% in June 2003. The slowing in domestic demand growth was particularly marked – the contribution to GDP growth from final domestic demand has declined sharply from over seven percentage points during 2004 to just over one percentage point in the year to December 2006.
… as a range of negative forces came together
Reversals in some of the same factors which contributed to the period of strong growth from 2002 to 2004 were behind the slowdown in the 2005 and 2006 calendar years. Declining migration, slowing house price growth and tighter monetary conditions in the latter period led to slower household and business spending, overcoming the effects of the generally high terms of trade, strong labour market and an increase in government consumption and investment spending, which all acted to support growth.
Net migration gains have eased from their peak, contributing to slower growth
Figure 1.4 – Net migration and residential investment
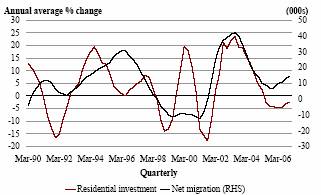
Sources: Statistics New Zealand
Annual net migration inflows eased from their peak of 42,500 in mid-2003 to a trough of 6,000 in late 2005 as a result of lower student arrivals, a strengthening NZ dollar and slowing economic growth. An easing in net migration meant less additional demand for housing, with both slower growth in prices for existing houses and a decline in new housing construction. The latter directly reduced domestic demand growth, while slower house price growth acted to slow the rise in households’ wealth and hence their willingness to consume at the same pace as previously.
Annual average growth in private consumption slowed from 6.0% in 2004 to 2.0% in 2006, while growth in residential investment declined – from a peak of nearly 25% in mid-2003 to falls during most of the past two years.
Higher interest rates have slowed growth in domestic demand, but with a lag …
Figure 1.5 – Short-term interest rates and the effective mortgage rate
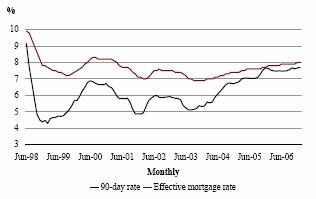
Sources: Reserve Bank of New Zealand
Ninety-day interest rates increased from around 5% in mid-2003 to around 7.5% at the end of 2005. However, the full effect of higher short-term rates was not reflected in effective mortgage rates which increased by less than one percentage point over the same period as a result of access to lower-cost funding from offshore and competition amongst lenders that encouraged borrowers to shift to lower longer-term fixed rates. Despite this, debt servicing costs increased steadily, acting as a drag on household disposable income.
Higher interest rates also increased firms’ financing costs and reduced the attractiveness of additional capital investment. Combined with slower growth in sales, this contributed to growth in business investment declining from a peak of over 15% in mid 2004 to an absolute decline at the end of 2006. Overall, annual average growth in gross national expenditure slowed from 4.0% in 2005 to 0.4% in 2006.
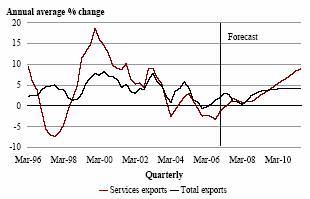
… and the high exchange rate has slowed growth in exports
Increasing terms of trade and large positive interest rate differentials saw the NZ dollar appreciate from below 50 on the TWI in late 2000 to an average of 70.4 in 2005. This has contributed to slower growth in export volumes, particularly for services. Annual export growth declined from an average of 4.4% in the period from 2002 to 2004 to negative in late 2005 to early 2006.
Figure 1.6 – Services exports and TWI
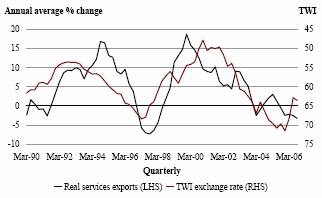
Sources: Statistics New Zealand, Reserve Bank of New Zealand
The terms of trade have generally boosted activity …
New Zealand’s terms of trade have trended up since 2002 as strong growth in the world economy was accompanied by increased demand for New Zealand’s export products and various disruptions affected competing agricultural producers. The continuing strength in the terms of trade supported export returns, providing a partial offset to the appreciation of the NZ dollar. The higher exchange rate also increased households’ real incomes as it lifted their purchasing power relative to the rest of the world. This provided some support to private consumption growth. However, increases in oil prices since early 2004 detracted from household disposable income and growth in private consumption during the 2005 and 2006 calendar years.
… and the labour market and government spending have also provided support
The labour market remained buoyant, even with the slowdown in growth. Employment growth was robust, participation reached a record high in mid-2006 and the unemployment rate was below 4% from the second half of 2004. Labour income growth was strong, supporting private consumption and residential investment.
Government transfers, and public consumption (averaging 4.6% growth since the start of 2004) and investment spending also supported growth in domestic demand, both directly and via household spending. However, with receipts growing at an even faster pace, the government in aggregate was withdrawing resources from the economy.
Growth in tax receipts has slowed in line with the easing in activity
Figure 1.7 – Tax component growth

Source: The Treasury
With the slowing in economic growth, growth in tax receipts has eased in the past two years. The largest contributor to this easing was corporate tax, the growth of which declined from a peak of 26% in 2005 to around zero in the year to March 2007, reflecting the trend in corporate profits through that period. The growth rates of the two largest tax types, source deductions and GST, have slowed only marginally since 2005, supported by the recent strength in labour incomes and private consumption mentioned above. Overall, growth in total tax receipts was just under 5% in the year to March 2007, after being up around 10% in 2005.
Resource pressures remain intense and macroeconomic imbalances remain
Despite the period of slower growth, the economy still appeared to be operating at or above capacity. Indicators of firm capacity utilisation remain at a high level, the unemployment rate is near its recent low and firms continue to record difficulty in finding labour at prevailing wages. Annual non-tradables inflation remained above 4% for the three years since December 2003.
The domestic demand-dominated nature of growth led to a widening of the current account deficit from 3.2% of GDP at the start of 2002 to a peak of 9.7% in June 2006. While the deficit reduced slightly in the second half of 2006 as growth in domestic demand – and imports – began to ease and profitability of local firms levelled off, at 9.0% of GDP the deficit remained high at the end of 2006.
Growth Rebounded in Late 2006 and Early 2007
A rebound in some drivers of growth …
Many of the forces which led to the slower growth in the economy in 2005 and 2006, particularly in domestic demand, rebounded towards the end of 2006. Net migration inflows increased, house price growth re-accelerated, petrol prices fell and world prices for some key export commodities increased further. In addition, the labour market and government expenditure have provided continuing support and in aggregate these are outweighing the impact of tighter monetary conditions.
… has seen economic growth re-accelerate and led to a reappraisal of the near term outlook
Real production GDP increased 0.8% in the December 2006 quarter – stronger than the 0.4% increase forecast in the Half Year Update. The expenditure measure of GDP, at 1.2%, increased to an even greater extent, with 3.3% gross national expenditure (GNE) growth. Partial activity indicators point to the pace of growth being maintained in the first quarter of 2007. GNE growth of 4.4% is now forecast for the year to March 2008, compared with 1.7% forecast in the Half Year Update.
Net migration increased in late 2006 …
Figure 1.8 – Consumption and house prices
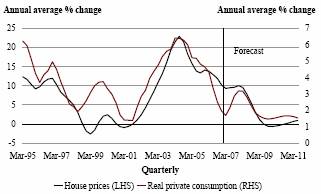
Sources: Quotable Value New Zealand, Statistics New Zealand, The Treasury
The increase in net migration inflows from their trough of 6,000 in late 2005 to 15,000 in late 2006 contributed to the resurgence in house price growth and private consumption recorded in late 2006 and early 2007. Private consumption expenditure grew 1.1% in the final quarter of 2006, more than in the first three quarters of the year as a whole. Consumption growth is expected to remain solid over the next couple of quarters, lifting annual average growth from 1.7% in March 2007 to 3.2% in March 2008. House price growth has picked up recently and further solid increases are expected until mid-2007, supporting private consumption and encouraging residential investment growth.
… the terms of trade continue to reach new cyclical highs …
The terms of trade increased sharply in the December quarter of 2006, and are expected to increase further during 2007. International dairy spot prices increased 45% in the six months to March 2007, as a result of the drought in Australia and increases in stockfeed prices in the United States, and are likely to remain high through 2007. World oil prices fell 15% in the December quarter of 2006 from their average of around US$70/barrel in mid-2006, and eased a further 3% in March 2007. These developments will support private consumption growth in the near term as lower petrol prices translate into increased household disposable incomes.
… and the labour market remains buoyant
Labour income growth remained buoyant in the second half of 2006, despite a slight fall in employment. Solid labour income growth is expected over much of 2007 as wage growth
remains around recent levels and employment levels remain high. These are forecast to support private consumption growth and residential investment in the near term. The increase in Working for Families payments that took effect on 1 April 2007 will work in the same direction by increasing household incomes.
Domestic demand expected to remain solid in 2007, despite higher interest rates …
Ninety-day interest rates increased to around 8.0% in April 2007 as the Reserve Bank increased the official cash rate to 7.75% on 26 April. In addition, local banks have raised their retail mortgage rates for two-year and five-year fixed-rate loans to increase their margins. Interest rates are now expected to be higher for longer than in the Half Year Update, because of the stronger domestic demand and increased inflation pressures that are expected to arise as a result. The increase in interest rates, and the impact of past rate rises progressively being reflected in effective mortgage rates, are expected eventually to dampen consumption and investment demand. However, over the near term other factors (discussed above) are forecast to dominate, resulting in some continued momentum in domestic demand growth in 2007. How long this lasts is a key judgement which is explored in the Risks and Scenarios chapter.
Figure 1.9 – 90-day interest rates
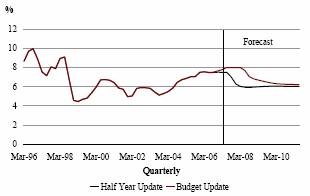
Sources: Reserve Bank of New Zealand, The Treasury
… but the high NZ dollar will limit export growth and increase import growth
Figure 1.10 – TWI exchange rate
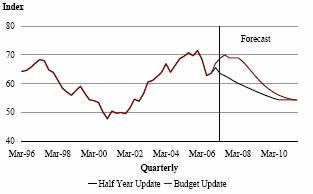
Sources: Reserve Bank of New Zealand, The Treasury
The NZ dollar reached a new post-float high of just under US$0.75 in April 2007. At its current level above 70.0 on the TWI, the NZ dollar is well above its estimated equilibrium value and adversely affecting returns to many exporters. Together with robust domestic demand growth, the high dollar is expected to see import growth remain strong. The dollar is assumed to average around 69.0 on the TWI through to March 2008, higher than in the Half Year Update. Export volume growth is expected to decline to 0.4% on an annual average basis in March 2008, while import volume growth is expected to peak at 5.6% in the 2007 calendar year.
Businesses are positive about their own prospects …
Business investment growth increased in the second half of 2006. This likely reflected the renewed strength in domestic spending, the high exchange rate reducing the cost of imported investment goods, as well as difficulties in finding labour and increasing labour costs. Businesses remained positive about the outlook for their own activity in early 2007 and investment and employment intentions were positive. Business investment is estimated to have remained strong in the first quarter of 2007 and the annual average rate of growth is expected to reach 5.8% in March 2008.
… and growth in domestic demand is forecast to remain strong over most of 2007
Production GDP is estimated to have increased by 0.9% in the March 2007 quarter, taking annual average growth to 1.7%, off its low of 1.4% recorded in September 2006. Quarterly growth rates are expected to ease over the next two quarters, but annual average growth will reach 2.9% in September 2007. Growth in GNE is estimated to be stronger at 1.4% in the March quarter and forecast to be 1.0% in each of the next two quarters, taking annual average growth to 4.7% in 2007 as a whole.
Non-tradables inflation will remain high for some time
The resurgence in domestic demand in the last quarter of 2006 and the first quarter of 2007 led to higher inflation in non-tradable goods and services in the March 2007 quarter, with a quarterly increase of 1.2% and an annual increase of 4.1%. Consumer price inflation is expected to fall below 2.0% in June and September 2007 but to increase again to 2.6% in December 2007, with past changes in petrol prices responsible for the volatility.
With the recent resurgence in domestic demand, inflation is expected to be higher throughout the forecast period than forecast in the Half Year Update.
Growth Forecast to Slow and Imbalances Expected to Subside During 2008 and 2009
The impetus to growth from a number of current drivers is expected to weaken
The aggregate effects of the above forces that are currently boosting growth are expected to wane as 2007 progresses. From late 2007 and through most of 2008, we expect the influence of the high exchange rate and higher interest rates to become the more dominant driver of the economy.
The central forecast assumes that the TWI will average around 69.0 through to March 2008, with most of the factors currently supporting the NZ dollar expected to remain in place. This level is below 71.7, the rate prevailing at the time the forecasts were finalised.
Export revenue growth is likely to continue to be restricted by the high level of the exchange rate and a forecast decline in the terms of trade …
Figure 1.11 – SNA total terms of trade
Sources: Statistics New Zealand, The Treasury
Export revenues are forecast to be flat through most of 2008. This reflects the impact of the level of the exchange rate, as well as a forecast decline in the terms of trade during the 2008 calendar year. We expect that the factors currently pushing the world prices of some exports, particularly dairy, to record high levels will not be sustained throughout the forecast period. Supply conditions in other parts of the world are expected to return closer to normal levels, while demand is expected to ease somewhat, given the current high prices.
The assumed depreciation of the exchange rate during 2008 is consistent with the forecast decline in the terms of trade and a narrowing of interest rate differentials.
… while volumes, particularly of services exports, are forecast to remain under pressure during 2008 …
Our estimates suggest that exchange rate sensitive components of export volumes, particularly services, forestry and manufacturing, are affected by the exchange rate with a lag of around three to four quarters. The high level of the exchange rate has limited export volume growth in recent times, and with the depreciation in the exchange rate in the central
forecast not expected to occur until the middle of 2008, a sizeable increase in export volumes is not expected until the latter part of 2008 and then more strongly in 2009.
Figure 1.12 – Export volumes
Sources: Statistics New Zealand, The Treasury
How long the exchange rate remains at elevated levels is a key judgement in the central forecast
New Zealand’s historical experience shows that the exchange rate can move through large cycles. If the level of the exchange rate reached during April 2007 is maintained for only a short period of time, followed by a depreciation, the effect on export volumes will not be as large as in the central forecast. The Risks and Scenarios chapter highlights a scenario where the exchange rate depreciates quickly.
Increases in effective interest rates during 2007 are expected to lead to an easing in domestic demand …
Most home loans in New Zealand are for fixed durations, albeit of a relatively short nature. As a result it takes time for increases in the Official Cash Rate (OCR) to flow into the actual interest costs faced by households, and therefore some time to affect their behaviour. Although people have moved onto longer-term loans, they will eventually feel the effect of past rate rises.
Figure 1.13 – Final domestic demand – percentage point contribution to growth
Sources: Statistics New Zealand, The Treasury
In such an environment we expect households to be more cautious about increasing their expenditure through the accumulation of debt than in the recent past and this is forecast to reduce private consumption growth. The level of household debt is forecast to increase, but the rate of increase is forecast to be slower than in the recent past. Households are also likely to be more reluctant to undertake substantial new investments in housing. Residential investment is forecast to fall by around 5% in the year to March 2009.
Further discussion of some of the factors affecting household decisions is provided in the box titled “Drivers of Private Consumption”.
… and an end to house price increases
Higher interest rates, as well as declining GDP growth rates, are forecast to lead to an easing in demand for houses. A small fall in house prices is forecast between March 2008 and March 2009. The end of large house price increases will see households’ net wealth position retrace some of the increases made over recent years, removing one of the key drivers of the recent strength in private spending.
Fiscal policy is expected to make a smaller contribution to domestic demand
Additions to government spending are forecast to be smaller during the 2009 March year than in the preceding years, with the additional impetus from Working for Families easing and slower growth in public consumption and non-market investment. The impact of government assistance through the Working for Families package is touched on in the “Drivers of Private Consumption” box.
While the contribution to domestic demand from government spending is expected to be smaller during the 2009 March year onwards, compared with the two to three preceding years, the combined influence of public consumption and non-market investment is forecast to provide a relatively steady contribution of just under ¾ percentage points to annual average growth.
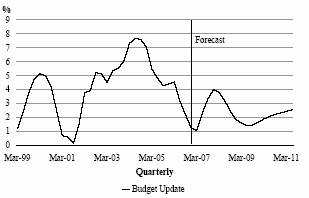
Low export growth and slowing domestic demand add up to a period of weak GDP growth …
A period of below-trend GDP growth is forecast during the 2008 calendar year, with quarterly growth rates of 1¤4 -1¤2% expected throughout the year. As a result, annual average GDP growth is forecast to fall to 1.6% in the 2009 March year.
… and a softer labour market outlook
Figure 1.14 – Compensation of employees
Sources: Statistics New Zealand, The Treasury
The outlook for profit growth in the March 2009 year is weak. Slowing economic activity is forecast to be followed by an easing in employment growth, a lift in unemployment and easing in wage inflation. Slowing domestic demand is likely to adversely affect the profitability of firms and – as margins and profits come under pressure – it is likely that weak employment growth will see the unemployment rate rise. The unemployment rate is forecast to increase to 4.6% during the middle of the 2009 calendar year. A weaker labour market is also expected to lower the rate of income growth, with the annual average growth rate of compensation of employees expected to decline to 4.8% in March 2009, after generally being in the 6.5% to 7.5% range throughout the period June 2001 to December 2006. This leads to a fall in the rate of growth of tax revenue from source deductions.
The reaction of households to the gradual removal of a number of the drivers of the recent re-acceleration in activity is an important judgement
To date, household spending has proved resilient in the face of higher interest rates. This in part reflects the partially offsetting effects coming from steady labour income growth, low unemployment and the effect on import prices of exchange rate appreciation. While the central forecast incorporates a sustained period of weak growth, there is still a risk that domestic demand maintains momentum for a longer period of time. The Risks and Scenarios chapter describes the possible result of this outcome.
The forecast easing in domestic demand and the eventual depreciation of the exchange rate are forecast to lead to a slow unwinding of imbalances …
A positive output gap (where GDP exceeds the economy’s capacity to produce goods and services without generating high rates of inflation) has opened up in recent years. This generated pressure on available resources in the economy and led to the prolonged period of high non-tradables inflation recorded since 2004. Looking forward, sub-trend quarterly growth is expected to eventually generate a negative output gap, removing non-tradables inflation pressure from the economy.
… with CPI inflation forecast to ease, allowing room for cuts in interest rates
Figure 1.15 – Inflation
Sources: Statistics New Zealand, The Treasury
The easing of pressure on resources as the economy slows is expected to lead to slowing rates of non-tradables inflation. However, the assumed depreciation of the exchange rate during 2008 adds to tradables inflation and means that total CPI inflation is forecast to remain at 2.4% in 2009 and 2010.
The easing of non-tradables inflation is closely linked to productivity growth. The central forecasts incorporate productivity growth lifting to an average of around 1.5% over the forecast period, following lower productivity growth over recent times. A period of weaker productivity growth during the forecast period would be associated with lower potential GDP, and consequently a combination of lower actual GDP growth and/or higher inflation.
With inflationary pressures dissipating during 2008 and GDP growth rates easing, interest rates are forecast to begin to fall during 2008, after remaining at high levels throughout 2007.
Drivers of Private Consumption
A key area of judgement in our forecasts is the domestic demand outlook – particularly with respect to private consumption. Private consumption growth is forecast to rebound during 2007 after a period of weak growth during 2005 and 2006, before moderating again in the March 2009 year and remaining low thereafter. Some of the factors driving this are discussed in this box.
Increasing interest payments, rising debt levels and high petrol prices all contributed to slower consumption growth during 2005 and 2006. Table 1.2 provides some aggregate estimates of the net additions or subtractions to aggregate household cash flows/balance sheets from these different sources over recent years, as well as forecasts for the 2008 and 2009 years.
Factors contributing to the current rebound in private consumption spending include:
· ongoing labour income growth (increasing $4 billion in the year to June 2007)
· the increase in Working for Families payments (around $900 million in the year to June 2007)
· the drop in petrol prices ($400 million in the year to June 2007), and
· house price growth is estimated to have added $38 billion to household wealth over the year to June 2007).
On the downside, increased debt is estimated to subtract around $11 billion from household net worth in the year to June 2007, while interest payments increase by around $1.1 billion.
Table 1.2 – Aggregate incremental impacts on households of selected drivers
June years
($ billion) | | Past
2006 | | Current
2007 | | Forecast
2008 | | Forecast
2009 | |
Nominal private consumption | | 5.2 | | 4.6 | | 4.8 | | 3.8 | |
| | | | | | | | | |
Changes in income and expenses(1) | | | | | | | | | |
Petrol prices | | -0.9 | | 0.4 | | -0.3 | | 0.0 | |
Interest payments | | -1.3 | | -1.1 | | -1.2 | | -0.3 | |
Labour income | | 4.7 | | 4.0 | | 3.6 | | 3.6 | |
Tax on labour income | | -1.5 | | -1.4 | | -1.3 | | -1.4 | |
Total transfers of which… | | 0.9 | | 1.3 | | 0.8 | | 0.5 | |
Working for Families | | 0.5 | | 0.9 | | 0.3 | | 0.0 | |
| | | | | | | | | |
Balance sheet | | | | | | | | | |
Debt impact on net worth | | -11.2 | | -9.5 | | -10.6 | | -10.2 | |
Housing assets(2) | | 51 | | 38 | | 30 | | 10 | |
(1) A negative refers to an increase in an expense or decrease in income.
(2) The effect of changes in house prices (this figure does not include the effect on assets of additional residential investment).
Sources: The Treasury, Spicers, Statistics New Zealand
Interest payments are expected to increase by a total of $3.9 billion across the period from 2006 to 2009 as a result of high interest rates and an increased level of debt. The fall in the NZ dollar is expected to lead to higher petrol prices and higher prices for other imports. The cumulative impact of these factors, as well as a smaller boost to incomes from the labour market and Working for Families, is expected to moderate private consumption growth by June 2009.
Changes in household wealth are also expected to affect the household decisions. Rising debt levels are forecast to curb consumption growth by causing households to become more precautionary and less willing to take on an increasing amount of debt. A slowdown in the growth in value of housing assets from $30 billion in the 2008 June year to $10 billion by June 2009 is also forecast to reinforce the slowdown.
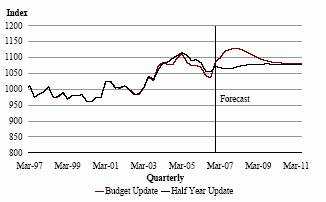
Nominal GDP growth rates also fall but the level of nominal GDP remains higher than the Half Year Update until late 2009 …
Figure 1.16 – Change in nominal GDP
Sources: Statistics New Zealand, The Treasury
Slow growth in real GDP, falls in the terms of trade and a fall in inflation all contribute to nominal GDP growth falling from 5.6% in March 2008 to 3.5% in March 2009. Nevertheless, a higher rate of inflation than in the Half Year Update throughout the forecast period together with a sustained higher terms of trade throughout 2008, combine to take nominal GDP to a substantially higher level than forecast in the Half Year Update in the March 2008 and 2009 years.
… boosting tax revenue
Tax revenue is forecast to be higher than in the Half Year Update throughout the forecast period. This reflects the higher level of nominal GDP in 2008 and 2009, as well as a reassessment of the effective tax rate on source deductions and company tax. The ratio of source deductions to labour income is forecast to stay at approximately the same rate as in recent years – a slightly higher rate than forecast in the Half Year Update.
However, company tax changes see a fall in company tax revenue in 2008 …
In the year to June 2008, total tax revenue is forecast to grow by 4.3%, slightly below nominal GDP growth of 5.0%. For 2008, source deductions grow at just over 6%, somewhat higher than compensation of employees growth at just under 5%. Fiscal drag is forecast to add to tax revenue relative to GDP over the forecast period, given that the personal income tax threshold indexation announced in Budget 2005 is not proceeding. Solid consumption growth contributes to GST growth of 6.4%.
Figure 1.17 – Corporate tax growth
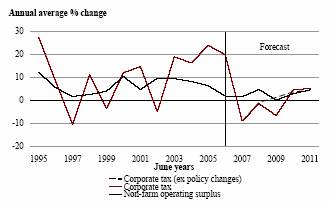
Sources: Statistics New Zealand, The Treasury
Running against this trend, corporate tax revenue is forecast to decline by 1.5% in the year to June 2008, despite forecast profit growth of 4.7%. In 2008, several tax measures are scheduled to take effect, including a cut in the company tax rate from 33% to 30% as part of the Business Tax Reform, the portfolio investment entity (PIE) regime and the fair dividend rate (FDR) method for calculating returns on overseas equity investments – all of which are expected to reduce the company tax take.
Without the policy changes, including the Business Tax Reform, the forecast growth in corporate tax for 2008 would have been higher than the Half Year Update forecast. This is because the prominent tax loss build-up that has been a feature of the corporate tax forecasts for the past two years has been moderated, as there is now convincing evidence that the build-up in tax losses through the 2007 tax year was not as large as previously expected. The size of the tax losses is now a downside risk to the corporate tax forecasts, especially since total profits are forecast to decline in 2009.
… tax growth slows further in 2009, reflecting the weaker economy and the full effect of company tax changes
Figure 1.18 – Total tax and nominal GDP growth
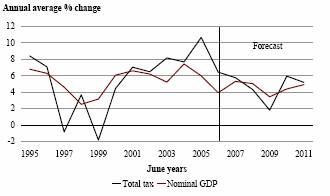
Sources: Statistics New Zealand, The Treasury
In the year to June 2009, tax revenue is forecast to grow at just under 2%. With continued growth in compensation of employees of around 5%, source deductions revenue is forecast to increase by around 6%. However, 2009 is the first year in which the changes to company tax take full effect. This is expected to reduce company tax by over $800
million in that year, resulting in corporate tax declining by 6.5% despite relatively flat profits.
Real GDP Growth Forecast to Return to Trend by 2010 and 2011
A reorientation of growth towards exports intensifies over the March 2010 year following depreciation of the exchange rate …
Export growth is expected to accelerate during the March 2010 year as services exports in particular show strong growth on the back of the lagged effect of the depreciation of the exchange rate. Import growth is expected to slow further in 2010 owing to continued weak domestic demand growth and the impact of the exchange rate on import prices, before exhibiting a modest increase to 1.6% in the year to March 2011 as market investment growth increases. This means that exports make a strong contribution to growth and also contribute, together with the decline in import volume growth, to the annual current account deficit being forecast to decline to a little over 6% of GDP by the end of the forecast period.
Figure 1.19 – Current account
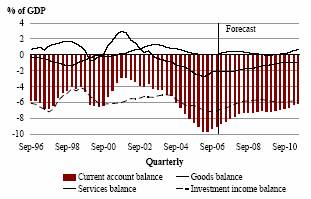
Source: Statistics New Zealand, The Treasury
The lower exchange rate also boosts the competitiveness of New Zealand exports, with export volume growth increasing 3.5% in the year to March 2009. The exchange rate impact on services exports is expected to show up progressively over the March 2010 year when services export volumes grow 5.4% taking total export growth to 4.1%.
Market investment is forecast to gradually pick up in 2010 owing the improved performance of exports, lower interest rates and some increases flowing from the Business Tax Reform.
… contributing to a smaller current account deficit
A high level of the terms of trade during 2008 is forecast to lift the goods balance in the current account, while the eventual reorientation of growth towards exports also drives a closing of the current account deficit. The investment income balance is expected to remain in deficit. However, the investment income deficit is forecast to become smaller as the weak outlook for growth in 2009 hits firms’ profits, while the return on New Zealand investments abroad is expected to rise slightly.
Economy-wide labour productivity is forecast to increase relative to the past couple of years, contributing to trend growth of around 3%
Table 1.3 – Productivity growth
March Years | | GDP
Growth | | Labour
Productivity
Growth | | Labour
Input
Growth | |
| | | | | | | |
Average 1997-2006 | | 3.0 | | 1.2 | | 1.8 | |
| | | | | | | |
2005 | | 3.9 | | 0.5 | | 3.4 | |
2006 | | 2.0 | | -0.1 | | 2.2 | |
2007 | | 1.7 | | 0.8 | | 0.8 | |
2008 | | 2.6 | | 1.8 | | 0.8 | |
2009 | | 1.6 | | 0.9 | | 0.8 | |
2010 | | 2.8 | | 2.2 | | 0.6 | |
2011 | | 3.1 | | 1.7 | | 1.4 | |
| | | | | | | |
Average 2007-2011 | | 2.4 | | 1.5 | | 0.9 | |
Sources: Statistics New Zealand, The Treasury
Economy-wide labour productivity growth, as measured by economy-wide GDP per hour worked, has been low recently, falling 0.1% in the year to March 2006 before increasing to 0.7% in the year to December 2006. The GDP forecasts discussed in this chapter incorporate labour productivity growth that is generally higher than the rates that have prevailed over the past three years. We believe that the recent weak productivity growth has included a large cyclical component.
The following factors suggest that productivity growth is likely to lift over the forecast period:
· Despite slowing growth, labour market conditions have remained tight with firms still facing difficulties in finding labour. In such an environment firms are reluctant to reduce employment unless it is absolutely necessary. This is likely to have contributed to the lower labour productivity experienced recently, but potentially enables increases in production in the future without the need for a commensurate increase in labour input.
· Productivity growth may also be higher over the forecast period as returns from recent growth in business investment are realised.
· In recent years a number of new workers have been drawn into employment. It is likely that these new workers have been less productive than experienced workers. However, as these workers spend time in employment, developing on-the-job skills and experience, it is likely that their productivity will increase.
· The reorientation of growth towards the export sector, where firms tends to have a higher level of productivity, should boost average productivity.
Annual growth in tax revenue is expected to be around 5%
Tax revenue is forecast to grow by around 5% in each of the 2010 and 2011 June years. The two largest tax types, source deductions and GST, are responsible for the vast bulk of this growth, growing by around 6% and 4% respectively. With changes such as the
Business Tax Reform bedded down by 2010, growth in corporate tax is forecast to resume, growing by 4.5% to 5% in each of 2010 and 2011.
Impact of KiwiSaver Enhancements and the Business Tax Reform
The 2007 Budget Update incorporates a number of policy changes. The KiwiSaver enhancements and Business Tax Reform have both been incorporated into the economic forecasts.
The reduction in the corporate tax rate to 30% will increase the return on investment. In the forecasts this has the effect of making a larger number of investment projects profitable, and adds to the growth rate of market investment. The forecasts incorporate around $300 million of additional real investment as a result. The lift in investment is not expected to be immediate and is spread from 2009 until the end of the forecast period. Around 50% of investment is sourced from imports, so the lift in investment sees import volumes increase by around $150 million.
The main effects of the KiwiSaver enhancements are likely to be on household saving. However, there may be some impact on private consumption as some individuals may be able to switch from their current saving vehicle to saving through KiwiSaver and reduce their saving by the size of the tax credit, but still accumulate the same level of funds. The exact size of this impact is uncertain. Our estimate is that enhancements to KiwiSaver will lift nominal private consumption by around 10% of the cost of the enhancements (in turn, household saving increases by 90% of the cost), but the effect could be between -10% and 25%.
There may also be some effects on firms. The cost of the compulsory matching of employee contributions could affect firm profitability, particularly as the contributions increase beyond the level of the tax credit provided to employers. As a result, it is likely that employers will seek to recoup this additional cost through lowering future wage growth or through increasing prices. These possible effects have not been incorporated in the forecasts, in part because they will be heavily influenced by the state of the economy at the time, but also because the main effects are likely to occur towards the end of the forecast period.
The estimate that the programme will lead to a 10% increase in consumption is the key determinant of the effects of the enhancements to KiwiSaver on the rest of the economy. With the spillover from the KiwiSaver enhancements into private consumption spending expected to be small, the programme as a whole has only a limited effect on real economic activity. Nominal consumption is expected to rise by around $30 million in the March 2008 year, with the impact rising to around $120 million by March 2011 (the end of the forecast period). This sees domestic demand lift, rising by approximately $300 million in total across the forecast period and this is forecast to lead to slightly higher inflation and interest rates.
The programme is expected to lead to an increase in annual pension fund contributions of $1.3 billion by the end of the forecast period. The table below summarises the effect of KiwiSaver on a number of economic variables:
(June years) | | 2008 | | 2009 | | 2010 | | 2011 | |
Fiscal cost of enhancements ($ millions)(7) | | $ | 303 | | $ | 693 | | $ | 1,006 | | $ | 1,214 | |
Household saving effect ($ millions) | | $ | +273 | | $ | +624 | | $ | +905 | | $ | +1,093 | |
Real GDP | | $ | +20 | | $ | +42 | | $ | +53 | | $ | +68 | |
Inflation | | 0 | | +0.02 | | +0.03 | | +0.02 | |
Interest rates (percentage points) | | 0 | | +0.05 | | +0.05 | | +0.01 | |
(7) Note that this includes the full cost of the fee subsidy for all KiwiSaver members ($40) as the size of the subsidy has only recently been determined.
Fiscal Forecasts – Finalisation Dates and Key Assumptions
Finalisation Dates
Economic outlook (refer Chapter 1) | | 16 April |
Tax revenue forecasts | | 20 April |
Fiscal forecasts | | 9 May |
Government decisions and circumstances | | 9 May |
Actual asset revaluations | | 28 February |
Foreign exchange rates | | 28 February |
Specific fiscal risks (refer Chapter 4) | | 9 May |
Contingent liabilities and commitments (refer Chapter 4) | | 31 March |
Key Assumptions
The fiscal forecasts have been prepared in accordance with the Public Finance Act 1989. They are based on the Crown’s accounting policies and assumptions (refer page 158 of the GAAP Series Tables). As with all assumptions, there is a degree of uncertainty surrounding them. This uncertainty increases as the forecast horizon extends. A summary of the key economic assumptions that are particularly relevant to the fiscal forecasts is provided below (on a June-year-end basis to align with the Crown’s balance date of 30 June):
| | 2006/07 | | 2007/08 | | 2008/09 | | 2009/10 | | 2010/11 | |
June years | | HYEFU | | BEFU | | BEFU | | BEFU | | BEFU | | BEFU | |
Real GDP (P) (ann avg % chg) | | 2.0 | | 2.1 | | 2.3 | | 1.8 | | 3.0 | | 3.2 | |
Nominal GDP (E) ($m) | | 162,667 | | 164,868 | | 173,187 | | 179,132 | | 186,985 | | 196,177 | |
CPI (annual avg % change) | | 2.7 | | 2.7 | | 2.4 | | 2.4 | | 2.3 | | 2.1 | |
Govt 10-year bonds (ann avg %) | | 5.9 | | 5.8 | | 6.1 | | 6.1 | | 6.1 | | 6.0 | |
90-day bill rate (ann avg %) | | 7.5 | | 7.7 | | 7.9 | | 6.8 | | 6.4 | | 6.2 | |
Unemployment rate ((HLFS) basis ann avg %) | | 4.0 | | 3.8 | | 3.9 | | 4.4 | | 4.5 | | 4.3 | |
Full-time equivalent employment (ann avg % change) | | 0.9 | | 0.8 | | 1.6 | | 0.9 | | 0.8 | | 1.4 | |
Current account (% of GDP) | | -9.3 | | -8.3 | | -7.2 | | -6.9 | | -6.8 | | -6.1 | |
Source: The Treasury
New Zealand Superannuation (NZS) Fund
The contribution to the NZS Fund for the year ending 30 June 2007 is $2.049 billion. The contribution to the NZS Fund is calculated over a 40-year rolling horizon to ensure that superannuation entitlements over the next 40 years can be met if the contribution rate were to be held constant at that level. The Government is making the required minimum annual contribution for 2006/07 and 2007/08 as calculated by the formula set out in the NZS Act.
$billion (June year end) | | 2005 | | 2006 | | 2007 | | 2008 | | 2009 | | 2010 | | 2011 | |
Required contribution | | 2.107 | | 2.337 | | 2.049 | | 2.103 | | 2.194 | | 2.312 | | 2.458 | |
Actual/Budgeted contribution | | 2.107 | | 2.337 | | 2.049 | | 2.103 | | 2.194 | | 2.312 | | 2.458 | |
Source: The Treasury
The underlying assumptions in calculating the contributions for 2007 are the nominal gross domestic product (GDP) series to 2047, the NZS expense series to 2047 and the expected long-term, net after-tax annual return of the NZS Fund (6.1%) (6.1% Half Year Update). The forecast rate of return is based on the Treasury’s assumptions for the rate of return on financial portfolios of Crown financial institutions. The Treasury website contains further information on the NZS Fund, as well as a copy of the NZS Fund model.
2
Fiscal Outlook
Summary of the Budget Update
Economic growth has accelerated again after a period of weak growth in 2005 and 2006. Growth over 2007/08 is expected to be stronger than forecast at the time of the 2006 Half Year Economic and Fiscal Update (Half Year Update).
This rebound in growth has largely been the result of resurgence in domestic demand, with both private consumption and housing and business investment showing renewed strength.
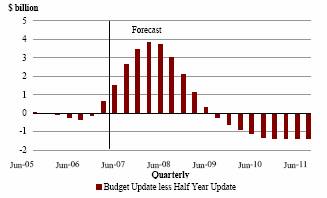
This growth, together with higher terms of trade and persistent domestic price pressures has resulted in higher GDP, flowing directly into higher tax forecasts of around $3.3 billion over the forecast horizon.
Offsetting some of the forecast growth in tax are tax policy initiatives of around $1.4 billion which form part of Budgets 2007 and 2008. In addition, new expense initiatives are above what was signalled in the 2007 Budget Policy Statement (BPS) by around $1.2 billion by 2010/11. The main driver of this increase in expenses is the enhancements to the KiwiSaver initiative previously announced in Budget 2005. These factors result in a fiscal outlook for the Budget Update that shows:
· Slower core Crown revenue growth relative to recent years, with revenue remaining stable at around 34% of GDP over the forecast period, and expenditure rising to around 33% of GDP by 2010/11.
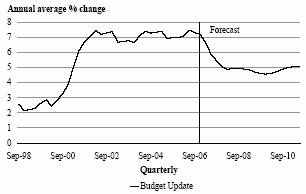
· After peaking last year at 7.3% of GDP the operating balance returns to just under 4% of GDP in 2006/07 and declines over the rest of the forecast period. The operating balance before gains and losses (OBEGAL) and excluding NZS Fund revenue follows a similar trend.
· After taking account of the Government’s capital programme, including contributions to the NZS Fund, the core Crown is forecast to record cash deficits from 2007/08.
· Gross sovereign-issued debt rising in nominal terms, but falling slowly to 21.8% of GDP by the end of the forecast period.
· Net core Crown debt rising over the forecast period, but at 3.5% of GDP in 2010/11 it is lower than the levels forecast at the Half Year Update.
· The NZS Fund is forecast to be $27 billion (13.8% of GDP) by the 2010/11.
Table 2.1 – Summary fiscal indicators(8)
| | Year ended 30
June | | | | | | | | | | | |
| | OLD GAAP | | NEW GAAP | |
($million) | | 2006
Actual | | 2007
Forecast | | 2007
Forecast | | 2008
Forecast | | 2009
Forecast | | 2010
Forecast | | 2011
Forecast | |
| | | | | | | | | | | | | | | |
Core Crown revenue excluding NZS Fund revenue | | | | | | 57,123 | | 59,304 | | 61,077 | | 63,733 | | 66,906 | |
Core Crown revenue | | 59,170 | | 59,502 | | 57,006 | | 59,402 | | 61,172 | | 63,825 | | 66,993 | |
Core Crown expenses | | 49,900 | | 53,775 | | 52,783 | | 56,096 | | 58,819 | | 61,677 | | 64,898 | |
OBEGAL(7) excluding NZS Fund revenue | | | | | | 5,654 | | 4,860 | | 3,862 | | 3,438 | | 3,260 | |
OBERAC | | 8,648 | | 7,380 | | | | | | | | | | | |
Operating balance | | 11,473 | | 6,568 | | 6,327 | | 6,431 | | 5,569 | | 5,310 | | 5,366 | |
Residual cash | | 2,985 | | 1,720 | | 1,720 | | (976 | ) | (1,687 | ) | (1,649 | ) | (1,426 | ) |
Gross sovereign-issued debt | | 35,461 | | 37,217 | | 37,935 | | 40,400 | | 40,231 | | 39,894 | | 42,737 | |
Net core Crown debt (incl NZS Fund) | | (5,138 | ) | (7,962 | ) | (7,534 | ) | (10,784 | ) | (13,145 | ) | (16,008 | ) | (19,287 | ) |
% of GDP | | | | | | | | | | | | | | | |
Core Crown revenue excluding NZS Fund revenue | | | | | | 34.6 | | 34.2 | | 34.1 | | 34.1 | | 34.1 | |
Core Crown revenue | | 37.8 | | 36.1 | | 34.6 | | 34.3 | | 34.1 | | 34.1 | | 34.1 | |
Core Crown expenses | | 31.9 | | 32.6 | | 32.0 | | 32.4 | | 32.8 | | 33.0 | | 33.1 | |
OBEGAL excluding NZS Fund revenue | | | | | | 3.4 | | 2.8 | | 2.2 | | 1.8 | | 1.7 | |
OBERAC | | 5.5 | | 4.5 | | | | | | | | | | | |
Operating balance | | 7.3 | | 4.0 | | 3.8 | | 3.7 | | 3.1 | | 2.8 | | 2.7 | |
Residual cash | | 1.9 | | 1.0 | | 1.0 | | (0.6 | ) | (0.9 | ) | (0.9 | ) | (0.7 | ) |
Gross sovereign-issued debt | | 22.6 | | 22.6 | | 23.0 | | 23.3 | | 22.5 | | 21.3 | | 21.8 | |
Net core Crown debt (incl NZS Fund) | | (3.3 | ) | (4.8 | ) | (4.6 | ) | (6.2 | ) | (7.3 | ) | (8.6 | ) | (9.8 | ) |
Source: The Treasury
Old GAAP and New GAAP
The forecasts in Budget 2007 have been prepared under a new set of accounting standards – New Zealand equivalents to International Financial Reporting Standards (NZ IFRS). These new standards will be part of Generally Accepted Accounting Practice (GAAP) for financial statements relating to periods commencing after 1 January 2007.
To help navigate the transition from current reporting standards (Old GAAP) to NZ IFRS (New GAAP) this chapter uses:
· Old GAAP numbers only for actual results to June 2006
· New GAAP numbers only for forecasts beyond 2007, and
· Both Old GAAP and New GAAP numbers for forecasts to June 2007.
Information on the impact of NZ IFRS adoption on the financial statements is provided on page 90, and on fiscal indicators on page 91.
(8) Detailed tables of the key indicators for the Budget Update and Half Year Update are located on pages 105-106. With the adoption of New GAAP there is a series break in the graphs and tables presented in the fiscal chapter. For some indicators there is not a comparable trend series.
(9) Operating balance before gains and losses (OBEGAL) less NZS Fund revenue represents the residual of operating revenue and expenses minus the portion of operating revenue earned by the NZS Fund. The indicator does not take into account any gains and losses which are now reported in a separate section of the Statement of Financial Performance (refer page 161).
Table 2.2 – Reconciliation of residual cash
| | | | Year ended 30 June | |
$million | | 2007
Forecast | | 2008
Forecast | | 2009
Forecast | | 2010
Forecast | | 2011
Forecast | |
| | Core Crown revenue | | 57,006 | | 59,402 | | 61,172 | | 63,825 | | 66,993 | |
Less | | Core Crown expenses | | 52,783 | | 56,096 | | 58,819 | | 61,677 | | 64,898 | |
Plus | | Core Crown gains and losses and other items | | 1,578 | | 1,157 | | 1,314 | | 1,482 | | 1,686 | |
Plus | | Net surpluses/(deficits) of SOEs and CEs | | 526 | | 1,968 | | 1,902 | | 1,680 | | 1,585 | |
Equals | | Operating balance | | 6,327 | | 6,431 | | 5,569 | | 5,310 | | 5,366 | |
Less | | Net gains and losses and other items | | 790 | | 1,473 | | 1,612 | | 1,780 | | 2,019 | |
Equals | | Operating balance before gains and losses (OBEGAL) | | 5,537 | | 4,958 | | 3,957 | | 3,530 | | 3,348 | |
Less | | NZS Fund revenue after-tax(8) | | -117 | | 98 | | 95 | | 92 | | 87 | |
Equals | | OBEGAL less NZS Fund revenue | | 5,654 | | 4,860 | | 3,862 | | 3,438 | | 3,260 | |
Less | | Net retained surpluses of SOEs and CEs | | 1,314 | | 1,652 | | 1,604 | | 1,382 | | 1,252 | |
| | Non-cash items and working capital movements | | 3,592 | | (1,830 | ) | (1,065 | ) | (1,495 | ) | (1,764 | ) |
Equals | | Net core Crown cashflow from operations | | 7,932 | | 5,038 | | 3,323 | | 3,551 | | 3,772 | |
Less | | Contribution to NZS Fund | | 2,049 | | 2,103 | | 2,194 | | 2,312 | | 2,458 | |
Equals | | Net core Crown cashflow from operations after contributions to NZS Fund | | 5,883 | | 2,935 | | 1,129 | | 1,239 | | 1,314 | |
Less | | Purchase of physical assets | | 2,141 | | 1,803 | | 1,201 | | 1,179 | | 1,034 | |
| | Advances and capital injections | | 2,022 | | 1,924 | | 1,047 | | 903 | | 802 | |
| | Capital allowance for future Budgets | | — | | 184 | | 567 | | 806 | | 903 | |
Equals | | Residual cash | | 1,720 | | (976 | ) | (1,687 | ) | (1,649 | ) | (1,426 | ) |
Source: The Treasury
The New Zealand Superannuation Fund
The NZS Fund is an important component of the Government’s fiscal strategy. The NZS Fund’s assets provide the means for the Government to partially pre-fund future New Zealand superannuation expenses and may only be used for New Zealand superannuation.
The NZS Fund’s assets are to be built up through a combination of investment returns earned on the Fund’s portfolio and Government contributions. The Government’s contributions to the NZS Fund are calculated over a 40-year rolling horizon to ensure that superannuation entitlements over the next 40 years can be met.
The Fund’s net assets are forecast to grow over the forecast period to $27 billion, an increase of $17.1 billion. Over $8 billion of this increase is expected to come from the NZS Fund’s investment performance, with the remaining increase from Government contributions.
(10) NZS Fund returns are the sum of its revenue (ie, interest and dividends), gains and losses (which comprise the bulk of its returns) and tax expenses. As OBEGAL does not include gains and losses, the remaining returns to deduct from OBEGAL are NZS Fund revenue less taxes.
| | Year ended 30 June | | | | | | | | | | | |
| | OLD GAAP | | NEW GAAP | |
($million) | | 2006
Actual | | 2007
Forecast | | 2007
Forecast | | 2008
Forecast | | 2009
Forecast | | 2010
Forecast | | 2011
Forecast | |
Opening net worth | | 6,555 | | 9,861 | | 9,855 | | 12,910 | | 15,977 | | 19,321 | | 22,984 | |
Gross contribution from the Crown | | 2,337 | | 2,049 | | 2,049 | | 2,103 | | 2,194 | | 2,312 | | 2,458 | |
NZS Fund revenue | | 1,190 | | 1,505 | | 382 | | 447 | | 519 | | 599 | | 685 | |
NZS Fund gains and losses | | | | | | 1,123 | | 866 | | 1,055 | | 1,259 | | 1,486 | |
Tax | | (221 | ) | (497 | ) | (499 | ) | (349 | ) | (424 | ) | (507 | ) | (598 | ) |
Closing net worth | | 9,861 | | 12,918 | | 12,910 | | 15,977 | | 19,321 | | 22,984 | | 27,015 | |
Updated Fiscal Indicators
The fiscal indicators have been updated as a consequence of:
· the increasing size of the NZS Fund and its importance to the Government’s fiscal strategy. A new indicator, “NZS Fund returns” has been added, and
· the change in accounting standards to New GAAP (page 90 discusses these changes further).
Previous Fiscal Indicator | | Updated Fiscal Indicator |
| | NZS Fund returns |
Core Crown revenue | | Core Crown revenue ex NZS Fund revenue |
OBERAC | | Operating balance before gains and losses |
OBERAC excluding NZS Fund returns | | Operating balance before gains and losses ex NZS Fund revenue |
Core Crown expenses
Residual cash
Gross sovereign-issued debt
Net core Crown debt
Net core Crown debt (inc NZS Fund) | | Core Crown expenses
Residual cash
Gross sovereign-issued debt
Net core Crown debt
Net core Crown debt (inc NZS Fund) |
The noticeable change from adopting New GAAP is OBERAC (operating balance excluding revaluations and accounting changes) being superseded by the “Operating balance before gains and losses”. Unlike the OBERAC the OBEGAL is visible on the Statement of Financial Performance.
A less obvious change is in the composition of the indicators. The core Crown revenue (now excluding NZS Fund revenue) and core Crown expenses indicators will no longer include gains or losses, as gains and losses (refer page 91) will be reported in a separate section of the Statement of Financial Performance.
Key Trends
Revenue grows in line with the economy …
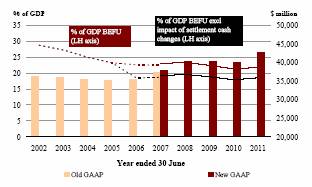
Figure 2.1 – Core Crown revenue excluding NZS Fund revenue and expenses

Source: The Treasury
Tax revenue as a percentage of GDP remains relatively flat over the forecast period. However there are a number of offsetting factors influencing this trend. In particular:
· the Business Tax Reform will resulted in a structural reduction in the tax revenue to GDP ratio. The most significant tax type affected is company income tax as a result of lowering the company tax rate from 33% to 30%, and
· the impact of fiscal drag, whereby income growth over time moves people into higher tax brackets. This is more prominent with the removal of personal income tax threshold indexation.
The 2005/06 core Crown revenue includes the one-off non-cash adjustment of $1.8 billion booked at 30 June 2006 (1.1% of GDP), reflecting the change in accounting treatment for the recognition of provisional tax.
… while Budget initiatives increase expenses …
The Government has made significant policy decisions in recent Budgets. Core Crown expenses are expected to increase by around $1 billion between 2006/07 and 2007/08 as a result of past Budget initiatives such as Working for Families and KiwiSaver. In addition, the 2007 Budget includes new initiatives of $2.5 billion in 2007/08 rising to $3.1 billion by 2010/11. The enhancements to the KiwiSaver initiative is a key feature of Budget 2007 and is the main driver of the rising profile. In the short term this results in a rising trend in core Crown expenses to GDP. By 2008/09 this trend flattens out, as the allocations for future Budgets are broadly consistent with the forecast growth in the economy.
… resulting in declining operating balances …
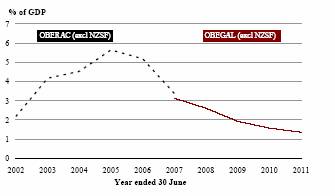
Figure 2.2 – Operating balance
Source: The Treasury
The operating balance as a percentage of GDP is expected to decline from 7.3% in 2005/06 to 3.8% in 2006/07. The main reasons for the decrease are:
· the 2005/06 outturn included a number of one-off positive revaluations (eg, investment gains) and accounting changes (eg, provisional tax revenue recognition), and
· the forecast for 2006/07 includes some one-off expenses such as the write down of tax and fines receivables and an increase in the ACC insurance liability.
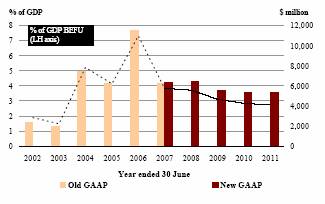
Figure 2.3 – Operating balance before gains and losses (OBEGAL) and excluding NZS Fund revenue
Source: The Treasury
Beyond 2006/07 the operating balance continues to decrease, but at a much lesser rate.
The operating balance before gains and losses (OBEGAL) and excluding NZS Fund revenue provides a better picture of the underlying movement in the fiscal position. The balance also declines over the forecast period, falling from 3.4% to 1.7% of GDP
Some components of the operating surpluses expected over the forecast period have been partitioned by the Government and are not available to fund new policy initiatives. This includes:
· entities retaining their surpluses for the purpose of achieving their long-term objectives (ACC, EQC and NZS Fund), and
· entities retaining their surpluses to accumulate assets (State-Owned Enterprises (SOEs) and some Crown entities).
Figure 2.4 – Accumulated operating balance breakdown for the period 2006/07 to 2010/11
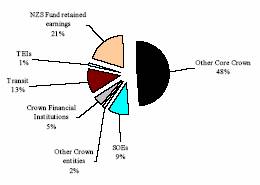
Source: The Treasury
This leaves around 48% of the accumulated operating balance available to finance the Government’s investing activities, such as contributions to the NZS Fund and its general capital programme.
… and a move from cash surplus to deficit …
This will be invested primarily in NZS Fund contributions of $11.1 billion, purchases of physical assets of $9.6 billion (eg, schools and defence equipment), advances of $4.4 billion (mainly student loans and refinancing existing private sector debt of the health and housing sectors), injections into Crown entities for hospitals and housing of $1.8 billion, and the purchase of foreign exchange reserves of $0.7 billion.
Figure 2.5 – Core Crown cash position on a year-by-year basis
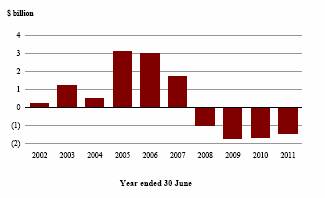
Source: The Treasury
There is a residual financing requirement over the forecast period of around $4 billion.
Table 2.3 – Impact of Crown operating surpluses on the balance sheet from 2006/07 to 2010/11 inclusive
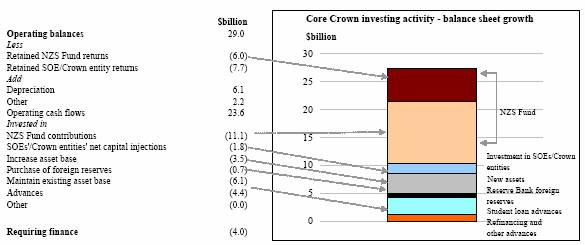
Source: The Treasury
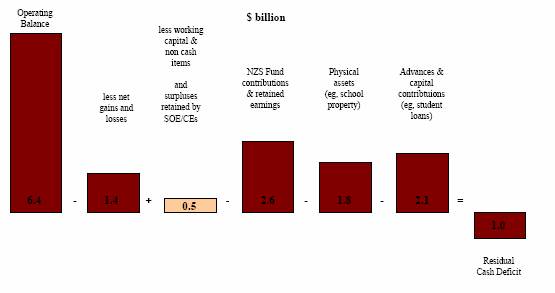
Application of the Operating Balance
The following graph explains how the operating balance translates into cash available and then how it has been applied for the 2007/08 financial year.
… which is met by borrowings …
The Government’s intended bond programme has been set at around $2.5 billion per annum, amounting to $12.5 billion of new borrowings over the forecast period. $8.6 billion of the new borrowing replaces maturing debt. The balance of new debt issued of $3.9 billion is used to meet the cash shortfall.
Figure 2.6 – Gross sovereign-issued debt
Source: The Treasury
In addition to the cash shortfall, gross debt is affected by:
· the Reserve Bank increasing settlement cash levels in 2006/07, this has had a net impact on borrowings of $3.2 billion (as noted in the Half Year Update), and
· the impact of the transition to New GAAP, this has increased gross debt by $0.7 billion.
Gross debt increases by around $7.3 billion from 2005/06 to 2010/11. As a percentage of GDP, gross debt is expected to fall from 22.6% in 2005/06 to 21.8% by 2010/11. Excluding the impact of the increase in settlement cash levels, over the same period GSID falls to 18.8% by 2010/11.
… while financial assets increase …
Figure 2.7 – Net debt (% of GDP and $million) and % of GDP including assets of NZS Fund

Source: The Treasury
With borrowings meeting the cash shortfall, financial assets grow by the full extent of the build-up in assets resulting from:
· contributions made to the NZS Fund and the returns earned by the Fund, and
· advance activity, such as student loans.
… resulting in an increasing net financial assets (including NZS Fund) track
Including the NZS Fund the Crown is in a net financial asset position. Net financial assets are expected to continue to increase over the forecast period. Excluding the NZS Fund assets, net core Crown debt decreases in nominal terms by around $0.9 billion over the forecast period. This trend is contrary to what happens to gross debt reflecting the fact that some of the borrowings required to meet the cash shortfall are used to invest in financial assets (eg, student loans), so do not impact on net debt.
New Zealand International Financial Reporting Standards (NZ IFRS)
The fiscal forecasts in Budget 2007 are prepared on an NZ IFRS basis.
From 1 July 2007 the financial statements of the Government must be prepared in accordance with NZ IFRS. Hence, forecasts in Budget 2007 are prepared on an NZ IFRS basis to provide comparability with reporting actual results.
While there are relatively minor changes to the bottom line ….
Although the current New Zealand reporting standards (Old GAAP) are relatively well aligned with NZ IFRS (New GAAP), there have been some impacts on the bottom line as a result of adopting New GAAP. Using the forecast year-end position for 2006/07, changing to new GAAP results in the following impacts on fiscal indicators:
| | Old
GAAP | | Change | | New
GAAP | |
Net worth | | $ | 88.5b | | 1.2b | | $ | 89.7b | |
Operating balance | | $ | 6.6b | | 0.3b | | $ | 6.3b | |
Residual cash | | $ | 1.7b | | No change | | $ | 1.7b | |
These fiscal indicators have changed by less than 1% of GDP (refer to page 105 for fiscal indicator changes).
… but there are changes to some values …
The two main contributors to the change in net worth of $1.2 billion are:
1. The net liability of the Government Superannuation Fund (GSF) is reduced by $3.2 billion. Under New GAAP the pension liability is reported on the basis that the Government meets its obligation on a pay-as-needed basis. Under Old GAAP the liability is reported based on the amount to be invested today to fully fund future pensions. The difference between the two is the treatment of investment taxes.
Note that, from a presentational point of view the assets of the GSF are now netted off against the liability.
The pension obligations to GSF members are underwritten by the Government and there are no implications for GSF members’ payments as a result of this reporting change.
2. The ACC liability has increased by $1.9 billion owing to adding an additional risk premium and liability adequacy test under New GAAP. The actuarially calculated liability under Old GAAP represents a mid-point estimate – that is, equal chance of actual payouts being greater than or less than the estimate. To that extent, it represents the most likely outcome. Introducing an additional risk premium and liability adequacy test under new GAAP does not change the relative risk of ACC’s activities; rather, it simply changes how
this risk is reported. There are no implications for ACC levies as a result of this change in reporting.
… and to the presentation of financial information …
Under New GAAP there is:
• more detail (eg, derivatives are shown separately on the face of the Statement of Financial Position)
• reclassifications (eg, GSF assets are netted against the GSF liability), and
• format changes, notably to the face of the Statement of Financial Performance.
The key change to the Statement of Financial Performance is reporting gains/losses in a separate section from revenue and expenses. This section will typically, but not exclusively, capture changes from market movements or actuarial assumptions such as gains on share portfolios and actuarial changes in the GSF liability. Separately reporting gains and losses will:
• help users identify their effect on reported results and forecasts
• reduce the “noise” from changes in fair value of items (eg, share investments can provide income (gains) in one month and expenses (losses) the next), and
• better align accounting practice with other reporting frameworks, such as Government Financial Statistics.
A more detailed list of changes is provided in Chapter 7 NZ IFRS Transition on page 191.
… resulting in continued high-quality reporting
The Accounting Standards Review Board, by deciding that all reporting entities in New Zealand must comply with New GAAP after 1 January 2007, believed that by adopting global financial reporting standards it will improve:
• the comparability of financial reporting for New Zealand’s corporate sector, thereby enhancing domestic capital market transparency and accountability, and
• the quality of financial reporting (New GAAP is more comprehensive, more widely accepted and robustly tested).
The New Zealand Government has been required to comply with generally accepted accounting practice (GAAP) since the Public Finance of 1989, and therefore must now adopt New GAAP. Common financial reporting across all sectors in New Zealand provides consistency and transparency to users of financial reports.
As the Government progresses towards full implementation of New GAAP and the audit of June 2008 Financial Statements, the potential areas of impact from adoption of New GAAP will include any change in accounting standards during that time. However, based on the current work programme of the international standard setters, such changes are expected to be minimal on the reported results at June 2008.
Further details on the adoption and expected impact of New GAAP on the Financial Statements of Government, including New GAAP accounting policies for the Government reporting entity, are available at www.treasury.govt.nz/budget2007/.
Revenue and Expenses
Table 2.4 – Revenue and expenses’ comparison with Half Year Update
| | Year ended 30 June | |
| | OLD GAAP | | NEW GAAP | |
(% of GDP) | | 2006
Actual | | 2007
Forecast | | 2007
Forecast | | 2008
Forecast | | 2009
Forecast | | 2010
Forecast | | 2011
Forecast | |
Total revenue | | | | | | | | | | | | | | | |
Budget Update | | 48.8 | | 46.2 | | 44.5 | | 44.4 | | 44.4 | | 44.5 | | 44.3 | |
Half Year Update | | | | | | 46.1 | | 44.9 | | 44.0 | | 43.9 | | 43.7 | |
Total expenses | | | | | | | | | | | | | | | |
Budget Update | | 41.5 | | 42.3 | | 41.2 | | 41.5 | | 42.2 | | 42.6 | | 42.5 | |
Half Year Update | | | | | | 42.3 | | 41.4 | | 41.1 | | 40.8 | | 40.7 | |
Core Crown revenue | | | | | | | | | | | | | | | |
Budget Update | | 37.7 | | 36.1 | | 34.6 | | 34.3 | | 34.1 | | 34.1 | | 34.1 | |
Half Year Update | | | | | | 36.3 | | 35.1 | | 34.2 | | 34.3 | | 34.3 | |
Core Crown expenses | | | | | | | | | | | | | | | |
Budget Update | | 31.8 | | 32.6 | | 32.0 | | 32.4 | | 32.8 | | 33.0 | | 33.1 | |
Half Year Update | | | | | | 33.2 | | 32.6 | | 32.3 | | 32.1 | | 32.0 | |
SOE revenue | | | | | | | | | | | | | | | |
Budget Update | | 8.1 | | 8.1 | | 7.4 | | 7.5 | | 7.6 | | 7.5 | | 7.2 | |
Half Year Update | | | | | | 7.3 | | 7.2 | | 7.2 | | 7.1 | | 6.9 | |
SOE expenses | | | | | | | | | | | | | | | |
Budget Update | | 6.9 | | 6.9 | | 6.8 | | 6.9 | | 6.9 | | 6.9 | | 6.7 | |
Half Year Update | | | | | | 6.8 | | 6.6 | | 6.6 | | 6.5 | | 6.4 | |
Crown entities’ revenue | | | | | | | | | | | | | | | |
Budget Update | | 16.1 | | 16.1 | | 15.9 | | 15.9 | | 15.6 | | 15.2 | | 14.6 | |
Half Year Update | | | | | | 16.0 | | 15.7 | | 15.2 | | 14.5 | | 14.0 | |
Crown entities’ expenses | | | | | | | | | | | | | | | |
Budget Update | | 15.2 | | 15.2 | | 15.4 | | 15.5 | | 15.3 | | 14.9 | | 14.4 | |
Half Year Update | | | | | | 15.4 | | 15.1 | | 14.6 | | 14.1 | | 13.5 | |
Source: The Treasury
Total revenue to GDP is forecast to remain relatively stable between 44.3% and 44.5% through the forecast period. There is a level shift downwards in revenue owing to the transition to New GAAP, as a result of transactions that were previously included in revenue being reclassified to gains and losses (refer page 91). Total expenses to GDP are forecast to increase from 41.2% to 42.5% by the end of the forecast period.
The trend in total revenue and expenses over the forecast horizon will largely be driven by activity in the core Crown segment of reported Government activity. The following section discusses the core Crown activity in more detail.
Core Crown – Revenue
Table 2.5 – Core Crown revenue
| | Year ended 30 June | |
| | OLD GAAP | | NEW GAAP | |
Core Crown Revenue | | 2006
Actual | | 2007
Forecast | | 2007
Forecast | | 2008
Forecast | | 2009
Forecast | | 2010
Forecast | | 2011
Forecast | |
($ billion) | | | | | | | | | | | | | | | |
Tax revenue | | 52.4 | | 52.1 | | 52.2 | | 54.7 | | 56.3 | | 58.9 | | 62.0 | |
Investment revenue | | 4.5 | | 5.1 | | 2.7 | | 2.6 | | 2.8 | | 2.8 | | 2.9 | |
Other core Crown revenue | | 2.3 | | 2.3 | | 2.1 | | 2.1 | | 2.1 | | 2.1 | | 2.1 | |
Total core Crown revenue | | 59.2 | | 59.5 | | 57.0 | | 59.4 | | 61.2 | | 63.8 | | 67.0 | |
(% of GDP) | | | | | | | | | | | | | | | |
Tax revenue | | 33.4 | | 31.6 | | 31.7 | | 31.6 | | 31.4 | | 31.5 | | 31.6 | |
Investment revenue | | 2.9 | | 3.1 | | 1.6 | | 1.5 | | 1.6 | | 1.5 | | 1.5 | |
Other core Crown revenue | | 1.5 | | 1.4 | | 1.3 | | 1.2 | | 1.2 | | 1.1 | | 1.1 | |
Total core Crown revenue | | 37.8 | | 36.1 | | 34.6 | | 34.3 | | 34.1 | | 34.1 | | 34.1 | |
Source: The Treasury
Table 2.6 – Tax revenue indicators compared with the Half Year Update
| | Year ended 30 June | |
| | OLD GAAP | | NEW GAAP | |
Tax revenue | | 2006
Actual | | 2007
Forecast | | 2007
Forecast | | 2008
Forecast | | 2009
Forecast | | 2010
Forecast | | 2011
Forecast | |
(% of GDP) | | | | | | | | | | | | | | | |
Tax revenue - Budget Update | | 33.4 | | 31.6 | | 31.7 | | 31.6 | | 31.4 | | 31.5 | | 31.6 | |
Tax revenue - Half Year Update | | | | | | 32.1 | | 31.6 | | 31.3 | | 31.3 | | 31.3 | |
Source: The Treasury
Tax revenue is the major source of core Crown revenue.
A discussion of trends in total tax and the major tax types is included in the Economic and Tax Outlook chapter. The main points are:
· an increase in the level of the nominal GDP forecast has led to an increase in the forecast of total tax revenue of about $1 billion in 2008
· a shift in the balance of income in the macroeconomic forecast from profits to labour has increased the overall tax-to-GDP rate relative to the Half Year Update, thereby increasing the tax revenue forecasts from 2009 onwards, and
· the Business Tax Reform and other policy changes since the Half Year Update collectively reduce total tax revenue by as much as $500 million each year from 2009 onwards.
Inland Revenue Department’s (IRD) tax forecasts
In line with established practice, the IRD has prepared an independent set of tax forecasts, based in the short term on analysis of taxpayer information, and in the longer term on the same broad macroeconomic trends that underpin the Treasury’s tax forecasts.
The Treasury’s forecasts are the Crown’s official forecasts. Unless otherwise stated, all forecasts in this document are Treasury forecasts. IRD tax forecasts are provided here for comparative purposes.
Table 2.7 – The Treasury and IRD tax revenue forecasts
| | 2006/07 | | 2007/08 | | 2008/09 | | 2009/10 | | 2010/11 | |
$million | | Forecast | | Forecast | | Forecast | | Forecast | | Forecast | |
Source deductions | | | | | | | | | | | |
Treasury | | 21,012 | | 22,334 | | 23,695 | | 25,094 | | 26,619 | |
Inland Revenue | | 20,943 | | 22,265 | | 23,545 | | 24,970 | | 26,494 | |
Difference | | 69 | | 69 | | 150 | | 124 | | 125 | |
Corporate taxes | | | | | | | | | | | |
Treasury | | 9,120 | | 9,166 | | 8,411 | | 8,860 | | 9,321 | |
Inland Revenue | | 9,243 | | 9,254 | | 8,385 | | 8,558 | | 8,902 | |
Difference | | (123 | ) | (88 | ) | 26 | | 302 | | 419 | |
Goods and services tax | | | | | | | | | | | |
Treasury | | 10,722 | | 11,495 | | 11,993 | | 12,333 | | 12,896 | |
Inland Revenue | | 10,771 | | 11,315 | | 11,819 | | 12,161 | | 12,734 | |
Difference | | (49 | ) | 180 | | 174 | | 172 | | 162 | |
RWT (interest) | | | | | | | | | | | |
Treasury | | 2,156 | | 2,340 | | 2,441 | | 2,362 | | 2,376 | |
Inland Revenue | | 2,200 | | 2,491 | | 2,566 | | 2,523 | | 2,627 | |
Difference | | (44 | ) | (151 | ) | (125 | ) | (161 | ) | (251 | ) |
Other taxes | | | | | | | | | | | |
Treasury | | 8,647 | | 8,838 | | 9,151 | | 9,621 | | 10,140 | |
Inland Revenue | | 8,568 | | 8,728 | | 8,992 | | 9,421 | | 9,968 | |
Difference | | 79 | | 110 | | 159 | | 200 | | 172 | |
Total tax | | | | | | | | | | | |
Treasury | | 51,658 | | 54,173 | | 55,691 | | 58,269 | | 61,351 | |
Inland Revenue | | 51,725 | | 54,053 | | 55,307 | | 57,633 | | 60,725 | |
Difference | | (67 | ) | 120 | | 384 | | 636 | | 626 | |
Total tax (% of GDP) | | | | | | | | | | | |
Treasury | | 31.3 | % | 31.3 | % | 31.1 | % | 31.2 | % | 31.3 | % |
Inland Revenue | | 31.4 | % | 31.2 | % | 30.9 | % | 30.8 | % | 31.0 | % |
Difference | | -0.1 | % | 0.1 | % | 0.2 | % | 0.4 | % | 0.3 | % |
Sources: IRD, The Treasury
The differences between the Treasury and IRD tax forecasts are much smaller than has been the case in the last few updates.
The main points of difference in this Budget Update are:
· Based on analysis of recent outturns, the Treasury has forecast source deductions about 0.5% higher than IRD in 2006/07, and this difference persists through all forecast years.
· The two departments use different approaches for forecasting taxable corporate profits, which causes a gap to open up between the Treasury and IRD corporate tax forecasts in 2009/10 and 2010/11. However, the gap between the two corporate tax forecasts has narrowed substantially since the Half Year Update, as the Treasury’s corporate tax forecast no longer contains a prominent tax loss cycle. Further detail on the Treasury’s corporate tax forecast is provided in the Economic and Tax Outlook chapter.
· The Treasury’s GST forecast is higher than Inland Revenue’s GST forecast from 2008/09 onwards as the two departments have different interpretations of the effects of
the principal drivers of GST namely private consumption, public consumption and residential investment.
· The RWT on interest forecasts diverge due to the different growth drivers that each department uses. Both departments use forecasts of interest rates and a trend growth estimate for the deposit base, but the Treasury also includes cyclical components from selected wealth and income indicators.
Detailed comparisons of the Treasury and Inland Revenue tax forecasts can be found at www.treasury.govt.nz/forecasts/befu/2007/.
Gains and Losses
The adoption of New GAAP will result in more fair value changes (gains and losses) being reported in the Statement of Financial Performance. In some cases (eg, with gains on the sale of property), these gains must be reported separately from other revenue.
Given the impact of this change, gains and losses will be reported in a separate section of the Statement of Financial Performance. This will enable users to better identify and assess:
· the cause of variances between actual results and forecasts, as variances from gains/losses (which are typically not forecasted) will be readily evident, and will not obscure comparisons between forecast and actual revenues and expenses
· the impact and volatility of gains and losses on results, and
· the relationship between gains and losses (eg, gains and losses in derivatives often have a close relationship with gains or losses in other financial instruments).
It should also reduce the “noise” that could arise from changes in fair value of items such as share investments being income (gains) one month and an expense (losses) the next.
The most significant gains and losses arise from financial assets and financial liabilities that are measured at fair value, and where changes in fair value must be reported in the Statement of Financial Performance. The financial assets held by the NZS Fund fall into this category. Such gains or losses will exclude interest revenue, dividend revenue and interest expense – these items will continue to be reported with revenues and expenses as appropriate. Actuarial gains and losses on items such as the GSF liability and changes in other provisions arising from market movements (eg, exchange rates) will also be separately identified in this new section.
Core Crown – Expenses
Table 2.8 – Expenses indicators
| | Year ended 30 June | |
| | OLD GAAP | | NEW GAAP | |
| | 2006
Actual | | 2007
Forecast | | 2007
Forecast | | 2008
Forecast | | 2009
Forecast | | 2010
Forecast | | 2011
Forecast | |
Expenses |
($billion) | | | | | | | | | | | | | | | |
Core Crown | | 49.9 | | 53.8 | | 52.8 | | 56.1 | | 58.8 | | 61.7 | | 64.9 | |
Core Crown (excluding GSF valuation) | | 49.6 | | 53.2 | | | | | | | | | | | |
Total Crown | | 65.1 | | 69.7 | | 67.9 | | 71.9 | | 75.6 | | 79.6 | | 83.5 | |
(% of GDP) | | | | | | | | | | | | | | | |
Core Crown | | 31.8 | | 32.6 | | 32.0 | | 32.4 | | 32.8 | | 33.0 | | 33.1 | |
Core Crown (excluding GSF valuation) | | 31.6 | | 32.3 | | | | | | | | | | | |
Total Crown | | 41.5 | | 42.3 | | 41.2 | | 41.5 | | 42.2 | | 42.6 | | 42.5 | |
Source: The Treasury
Core Crown expenses are forecast to increase by around 1% of GDP between 2006/07 and 2010/11.
Figure 2.8 – Core expenses ($ and % of GDP)
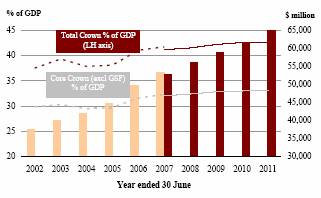
Source: The Treasury
The growth in expenses has largely arisen from expense initiatives announced in recent Budgets. A number of the policy decisions made in previous Budgets have rising spending profiles to allow sufficient time for full implementation. Around $1 billion of the increase in spending between 2006/07 and 2007/08 relates to previous Budget announcements like Working for Families and KiwiSaver.
Budget 2007 also influences expense growth. It includes an additional $2.2 billion of spending rising to $3.3 billion(11) of spending. The main expense elements of Budget 2007 include:
· an enhancement to the KiwiSaver initiative that was introduced in Budget 2005, initially costing $0.3 billion in 2007/08 rising to $1.1 billion by the end of the forecast period. This equates to 0.6% of GDP in 2010/11, and
(11) The Budget 2007 package is $2.5 billion rising to $3.1 billion. The package includes a mixture of revenue and expense initiatives. Note that for accounting purposes, some policy initiatives implemented through the tax system such as Working for Families, KiwiSaver and the R & D tax credit are counted as expenses.
· an additional $0.8 billion per annum on health-related spending.
The Executive Summary provides a detailed breakdown on the new initiatives for operating (expenses and revenue) and capital.
In nominal terms, expenses are forecast to increase by $12.1 billion between 2006/07 and 2010/11. The major drivers of this increase are:
· the Budget 2007 package and recent Budget packages ($4.3 billion)
· forecast new operating initiatives for future Budgets ($6.1 billion), and
· indexation of benefits, primarily New Zealand Superannuation ($1.5 billion).
Forecast new operating and capital initiatives
The fiscal forecasts include indicative amounts for new operating and capital initiatives.
The allowance for Budget 2008 is forecast to be $3.1 billion. Around $1.1 billion of this has already been earmarked for Business Tax Reform. The remaining $2 billion is assumed for forecasting purposes to be used for increased expenditure.
New initiatives for the 2009 and 2010 Budgets remain at around $2 billion and $2.1 billion. It is also assumed for forecasting purposes all of the forecast new operating initiatives in these Budgets are allocated to increased expenditure, although in practice some portion could be used to finance revenue reductions.
Figure 2.9 – Net amounts for new operating initiatives (GST exclusive)
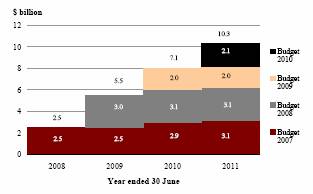
Source: The Treasury
Capital initiatives
As part of the 2007 Budget, the Government has allocated $1.6 billion of new capital over the next four years. Amounts for the 2008, 2009 and 2010 Budgets have been set at $0.9 billion phased in over four years, some of which falls outside the forecast horizon. On a year-by-year basis, capital spending is forecast to be on average $2.0 billion per annum over the next five years.
Table 2.9 – Capital spending
| | Year ended 30 June | |
($million) | | 2007
Forecast | | 2008
Forecast | | 2009
Forecast | | 2010
Forecast | | 2011
Forecast | | Total | |
New capital spending up to Budget 2008 | | — | | 164 | | 67 | | 56 | | 23 | | 310 | |
Budget 2008 | | — | | 20 | | 480 | | 250 | | 150 | | 900 | |
Budget 2009 | | — | | — | | 20 | | 480 | | 250 | | 750 | |
Budget 2010 | | — | | — | | — | | 20 | | 480 | | 500 | |
| | — | | 184 | | 567 | | 806 | | 903 | | 2,460 | |
Purchase of physical assets | | 2,141 | | 1,803 | | 1,201 | | 1,179 | | 1,034 | | 7,359 | |
| | | | | | | | | | | | | |
| | 2,141 | | 1,987 | | 1,768 | | 1,985 | | 1,937 | | 9,819 | |
Top-down Adjustment to Spending
The core Crown operating and capital spending for 2006/07 in the forecast incorporates a downward adjustment of $700 million to take into account the timing delays in departmental spending. The adjustment is made on both a cash and accrual basis, and is split between operating ($500 million) and capital ($200 million).
The level of the adjustment has been based on analysis of previous expenditure delays and a review of the actual outturn to 31 March 2007.
No adjustment is made to subsequent years for possible under spending.
Net Worth
Table 2.10 – Net worth comparison with Half Year Update
| | Year ended 30 June | |
| | OLD GAAP | | NEW GAAP | |
Net worth | | 2006
Actual | | 2007
Forecast | | 2007
Forecast | | 2008
Forecast | | 2009
Forecast | | 2010
Forecast | | 2011
Forecast | |
($billion) | | | | | | | | | | | | | | | |
Total Crown net worth | | 71.4 | | 88.5 | | 89.7 | | 96.1 | | 101.6 | | 107.0 | | 112.4 | |
Core Crown net worth | | 40.1 | | 45.9 | | 49.1 | | 53.6 | | 57.2 | | 60.9 | | 64.7 | |
SOE net worth | | 13.1 | | 24.0 | | 22.1 | | 23.0 | | 23.7 | | 24.4 | | 25.1 | |
Crown entities’ net worth | | 41.8 | | 42.6 | | 39.7 | | 41.4 | | 42.8 | | 43.8 | | 44.9 | |
Source: The Treasury
In line with the Government’s fiscal strategy, net worth is forecast to increase from $89.7 billion in 2006/07 to $112.4 billion by 2010/11. This strategy is evident across the whole of the Crown. The following section focuses on the net worth of the core Crown segment of reported Government activity.
Core Crown
Table 2.11 – Components of core Crown net worth
| | Year ended 30
June | | | |
| | OLD GAAP | | NEW GAAP | |
($ billion) | | 2006
Actual | | 2007
Forecast | | 2007
Forecast | | 2008
Forecast | | 2009
Forecast | | 2010
Forecast | | 2011
Forecast | |
Total assets | | 102.3 | | 109.7 | | 105.5 | | 112.2 | | 115.4 | | 118.2 | | 124.3 | |
Total liabilities | | 62.2 | | 63.8 | | 56.4 | | 58.6 | | 58.2 | | 57.3 | | 59.6 | |
Net worth | | 40.1 | | 45.9 | | 49.1 | | 53.6 | | 57.2 | | 60.9 | | 64.7 | |
Source: The Treasury
Over the forecast period, core Crown assets are expected to increase from $105.5 billion from 2006/07 to $124.3 billion, largely reflecting the application of the operating balance and additional borrowing to build up assets.
As Figure 2.10 illustrates, the majority of growth occurs within financial assets, which increase by around $14.9 billion, while investments in Crown entities (primarily to fund hospitals and housing capital projects), and physical assets also increase slightly.
Figure 2.10 – Core Crown asset growth
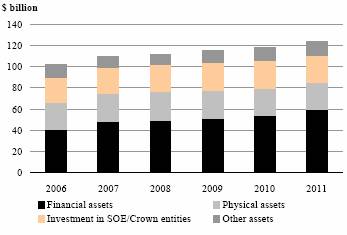
Source: The Treasury
Within the financial asset portfolio of the core Crown:
· the NZS Fund is expected to increase by around $12.2 billion from 2006/07 to 2010/11. These funds are being set aside to assist in meeting future fiscal pressures associated with an ageing population
· advances are forecast to increase by around $2.4 billion, primarily due to student loans, and
· the financial asset portfolios of the Reserve Bank and New Zealand Debt Management Office stay relatively flat over the forecast period.
By 2010/11 the make-up of the financial asset portfolio is expected to have changed significantly, primarily driven by the increase in the holdings of the NZS Fund.
Figure 2.11 – Core Crown financial assets by portfolio
Source: The Treasury
The level of core Crown liabilities is expected to increase by around $3.2 billion from 2006/07 to 2010/11. The major component of core Crown liabilities is gross sovereign-issued debt, which, as previously mentioned, is forecast to increase nominally but decrease as a percentage of GDP over the forecast period.
State-Owned Enterprises and Crown Entities – Net Surpluses
State-owned enterprises (SOEs) and Crown entities (CEs) are forecast to run total operating surpluses of $10 billion over the forecast period. Around $2.4 billion of the operating surpluses will be returned as dividends, and will be available to fund spending elsewhere in the Crown.
Figure 2.12 – SOE and Crown entities operating balance
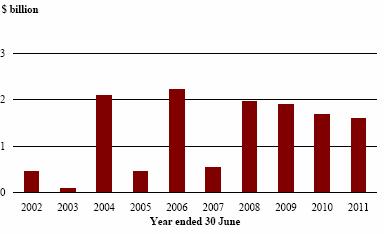
Source: The Treasury
In 2006/07 SOE/Crown entities net surpluses are forecast to be $0.5 billion, which is lower than what is expected for the rest of the forecast period. The lower 2006/07 result is primarily due to an increase in the ACC unfunded liability of around $2 billion. This increase was mainly a result of changes in economic assumptions and higher rehabilitation costs (eg, more claims).
From 2007/08 onwards, SOE/Crown entities net surpluses are on average $1.8 billion.
SOE/Crown entities net surpluses after payment of dividends total $7.6 billion. This residual is maintained within the entities that have generated the net surpluses. In broad terms, the majority of the accumulated net surpluses are forecast to build up assets.
Financial assets across SOE/CEs are forecast to increase by around $7.1 billion. The majority of the increase is within the Crown Financial Institutions (including ACC and EQC), which are accumulating financial assets for the purpose of meeting future obligations.
Comparison with Half Year Update
Operating balance
Figure 2.13 – Operating balance comparison
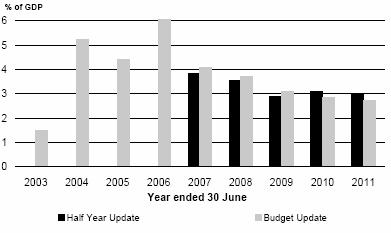
Source: The Treasury
Compared to the Half Year Update the operating balance is expected to be similar in 2006/07. However, there are a number of counteracting factors:
· an increase in tax revenue primarily in corporate tax due to some one-off tax receipts
· delays in spending (of which some has been transferred into 2007/08), and
· non-cash write-offs of tax and fines receivables have resulted in a $1.2 billion increase in expenses.
Beyond the current year the operating balance is initially higher than the Half Year Update, however this trend reverses from 2009/10 (refer Table 2.12). Key drivers of this trend are:
· increases to forecast nominal GDP have led to an increase in forecast tax revenue of about $1 billion in 2007/08 and 2008/09. The upward revision to tax forecasts in the last two years is much smaller
· an increase in SOE/Crown entities surpluses of around $0.2 billion per annum (spread across a numbers of entities)
· an increase in investment income primarily owing to a higher overall financial asset position
· a reduction in benefit expenses forecast of approximately $0.1 billion per annum. Most of the reduction occurs in unemployment benefits as a result of expected improvements in labour market conditions, and
· expenses are forecast to be higher than the Half Year Update, reflecting a higher Budget 2007 package than previously signalled in the 2007 Budget Policy Statement.
Table 2.12 – Operating balance reconciliation (explains changes to the operating balance since the Half Year Update)
| | NEW GAAP | |
($ million) | | 2007
Forecast | | 2008
Forecast | | 2009
Forecast | | 2010
Forecast | | 2011
Forecast | |
Operating balance 2006 Half Year Update | | 6,260 | | 6,071 | | 5,197 | | 5,826 | | 5,979 | |
Changes (revenue) | | | | | | | | | | | |
Tax revenue (forecasting) | | 461 | | 967 | | 766 | | 570 | | 580 | |
Tax revenue (policy) | | — | | (22 | ) | (516 | ) | (489 | ) | (330 | ) |
New revenue allocation | | — | | — | | 1,000 | | 1,000 | | 1,000 | |
Investment income | | 263 | | 125 | | 123 | | 113 | | 105 | |
Total revenue changes | | 724 | | 1,070 | | 1,373 | | 1,194 | | 1,355 | |
Other changes | | | | | | | | | | | |
Welfare Benefit forecast changes | | 39 | | 141 | | 207 | | 175 | | 127 | |
Other forecasting changes | | 36 | | (143 | ) | (85 | ) | (127 | ) | (130 | ) |
Expense transfers | | 367 | | (211 | ) | (56 | ) | (70 | ) | (119 | ) |
Top down expense adjustment | | 500 | | — | | — | | — | | — | |
Increase in Budget 2007 and 2008 allowance | | 153 | | (667 | ) | (1,065 | ) | (1,547 | ) | (1,834 | ) |
Long term receivables write-off | | (1,199 | ) | — | | — | | — | | — | |
ACC insurance expenses | | (1,019 | ) | (254 | ) | (281 | ) | (353 | ) | (379 | ) |
Other SOE/CE movements | | 585 | | 490 | | 404 | | 397 | | 400 | |
Transition to IFRS | | (243 | ) | — | | — | | — | | — | |
Other movements | | 124 | | (66 | ) | (125 | ) | (185 | ) | (33 | ) |
Total other changes | | (657 | ) | (710 | ) | (1,001 | ) | (1,710 | ) | (1,968 | ) |
Total changes | | 67 | | 360 | | 372 | | (516 | ) | (613 | ) |
Operating balance 2007 Budget Update | | 6,327 | | 6,431 | | 5,569 | | 5,310 | | 5,366 | |
Source: The Treasury
Effect of Policy Changes on Tax Forecasts since the Half Year Update
$ million | | 2006/07
Forecast | | 2007/08
Forecast | | 2008/09
Forecast | | 2009/10
Forecast | | 2010/11
Forecast | |
Material policy changes | | | | | | | | | | | |
Reduction in company tax rate | | — | | (60 | ) | (790 | ) | (735 | ) | (680 | ) |
Reduction in tax rate for savings vehicles | | — | | (5 | ) | (50 | ) | (60 | ) | (65 | ) |
International tax review - CFC changes | | — | | — | | (13 | ) | (50 | ) | (50 | ) |
Inclusion of life insurance in the PIE rules | | — | | (25 | ) | (25 | ) | (25 | ) | (25 | ) |
Charitable donations threshold | | — | | — | | (15 | ) | (25 | ) | (25 | ) |
SSCWT exemption extension | | — | | (17 | ) | (18 | ) | (19 | ) | (20 | ) |
Indexation of personal income tax thresholds | | — | | 85 | | 395 | | 425 | | 535 | |
Total | | — | | (22 | ) | (516 | ) | (489 | ) | (330 | ) |
Sources: The Treasury, Inland Revenue
Reduction in company tax rate
With effect from the 2009 income year, the company income tax rate will decrease from 33% to 30%.
Reduction in tax rate for savings vehicles
In line with the reduction in the company income tax rate, the tax rate for widely-held savings vehicles, eg, superannuation funds and unit trusts, will also decrease from 33% to 30% and the maximum Portfolio Investment Entity (PIE) tax rate will be set at 30%.
International tax review – CFC changes
From 1 April 2009, active income of controlled foreign companies will be exempt from New Zealand income tax.
Inclusion of life insurance in the PIE rules
With effect from 1 October 2007, all life insurance savings products will be able to use the fair dividend rate method under the PIE regime. Unit-linked life products are to be allowed to obtain certain benefits of the PIE regime.
Charitable donations threshold
With effect from the 2009 income year, there will be no limit to the level of rebate that may be claimed in respect of charitable donations made by individuals and companies.
SSCWT exemption extension
The specified superannuation contribution withholding tax exemption for KiwiSaver has been extended to other superannuation schemes that have similar lock-in rules to KiwiSaver.
Indexation of personal income tax thresholds
The triennial indexation of personal income tax thresholds announced in the 2005 Budget will now not be proceeding.
Residual cash
Over the forecast period residual cash is similar to the Half Year Update. In the short term the cash position is stronger owing to the increase in tax revenue. The cash position weakens and similar to the Half Year Update moves into a cash deficit as the full impact of the forecast increases in the Budget 2007 operating and capital allowance kick in.
Debt indicators
Figure 2.14 – Gross sovereign-issued debt comparison
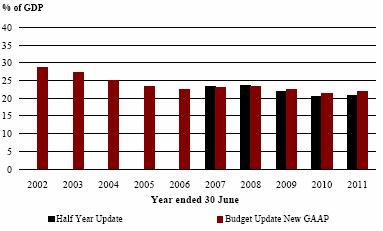
Source: The Treasury
With the cash position ending up in a similar position to the Half Year Update there has been minimal change in the forecasts for the debt indicators.
By 2010/11, gross sovereign-issued debt is around 1% higher than at the Half Year Update. Net core Crown debt is 0.3% lower than forecast at the time of the Half Year Update.
Table 2.13 – 2007 Budget Update fiscal indicators
| | Year ended 30 June | |
| | OLD GAAP | | NEW GAAP | |
Fiscal indicators | | 2006
Actual | | 2007
Forecast | | 2007
Forecast | | 2008
Forecast | | 2009
Forecast | | 2010
Forecast | | 2011
Forecast | |
($ million) | | | | | | | | | | | | | | | |
| | | | | | | | | | | | | | | |
Revenue | | | | | | | | | | | | | | | |
Total revenue | | 76,581 | | 76,203 | | 73,390 | | 76,872 | | 79,576 | | 83,178 | | 86,819 | |
Core Crown revenue | | 59,170 | | 59,501 | | 57,006 | | 59,402 | | 61,172 | | 63,825 | | 66,993 | |
Tax revenue | | 51,973 | | 51,539 | | 51,658 | | 54,173 | | 55,691 | | 58,269 | | 61,351 | |
| | | | | | | | | | | | | | | |
Expenses | | | | | | | | | | | | | | | |
Total expenses | | 65,084 | | 69,687 | | 67,853 | | 71,914 | | 75,619 | | 79,648 | | 83,472 | |
Core Crown expenses | | 49,900 | | 53,775 | | 52,783 | | 56,096 | | 58,819 | | 61,677 | | 64,898 | |
| | | | | | | | | | | | | | | |
Operating balance - Core Crown | | 9,270 | | 5,717 | | 5,801 | | 4,463 | | 3,667 | | 3,630 | | 3,781 | |
Operating balance - Crown entities | | 1,593 | | 469 | | 225 | | 1,241 | | 1,169 | | 974 | | 960 | |
Operating balance - SOEs | | 1,799 | | 1,065 | | 1,034 | | 1,068 | | 1,141 | | 1,155 | | 1,065 | |
Dividend elimination | | (1,189 | ) | (683 | ) | (733 | ) | (341 | ) | (408 | ) | (449 | ) | (440 | ) |
Total operating balance | | 11,473 | | 6,568 | | 6,327 | | 6,431 | | 5,569 | | 5,310 | | 5,366 | |
| | | | | | | | | | | | | | | |
OBEGAL | | | | | | 5,537 | | 4,958 | | 3,957 | | 3,530 | | 3,347 | |
OBEGAL excluding NZS Fund revenue | | | | | | 5,654 | | 4,860 | | 3,862 | | 3,438 | | 3,260 | |
| | | | | | | | | | | | | | | |
Cash available/(shortfall to be funded) | | 2,985 | | 1,720 | | 1,720 | | (976 | ) | (1,687 | ) | (1,649 | ) | (1,426 | ) |
| | | | | | | | | | | | | | | |
Debt indicators | | | | | | | | | | | | | | | |
Gross sovereign-issued debt | | 35,461 | | 37,217 | | 37,935 | | 40,400 | | 40,231 | | 39,894 | | 42,737 | |
Total gross Crown debt | | 39,427 | | 42,367 | | 43,556 | | 46,364 | | 47,050 | | 46,522 | | 49,691 | |
Net core Crown debt | | 7,745 | | 4,611 | | 5,039 | | 4,655 | | 5,529 | | 6,217 | | 6,860 | |
| | | | | | | | | | | | | | | |
Net core Crown debt with NZS Fund assets | | (5,138 | ) | (7,962 | ) | (7,534 | ) | (10,784 | ) | (13,145 | ) | (16,008 | ) | (19,287 | ) |
| | | | | | | | | | | | | | | |
Net worth | | 71,400 | | 88,456 | | 89,696 | | 96,061 | | 101,645 | | 107,024 | | 112,421 | |
| | | | | | | | | | | | | | | |
Domestic bond programme | | 2,375 | | 2,511 | | 2,511 | | 2,520 | | 2,500 | | 2,483 | | 2,515 | |
| | | | | | | | | | | | | | | |
Nominal GDP | | 156,562 | | 164,868 | | 164,868 | | 173,187 | | 179,132 | | 186,985 | | 196,177 | |
| | | | | | | | | | | | | | | |
Fiscal indicators as a % of GDP | | | | | | | | | | | | | | | |
Revenue | | | | | | | | | | | | | | | |
Total Crown revenue | | 48.9 | | 46.2 | | 44.5 | | 44.4 | | 44.4 | | 44.5 | | 44.3 | |
Core Crown revenue | | 37.8 | | 36.1 | | 34.6 | | 34.3 | | 34.1 | | 34.1 | | 34.1 | |
Tax revenue | | 33.2 | | 31.3 | | 31.3 | | 31.3 | | 31.1 | | 31.2 | | 31.3 | |
| | | | | | | | | | | | | | | |
Expenses | | | | | | | | | | | | | | | |
Total Crown expenses | | 41.6 | | 42.3 | | 41.2 | | 41.5 | | 42.2 | | 42.6 | | 42.5 | |
Core Crown expenses | | 31.9 | | 32.6 | | 32.0 | | 32.4 | | 32.8 | | 33.0 | | 33.1 | |
| | | | | | | | | | | | | | | |
Operating balance | | 7.3 | | 4.0 | | 3.8 | | 3.7 | | 3.1 | | 2.8 | | 2.7 | |
OBEGAL | | | | | | 3.4 | | 2.9 | | 2.2 | | 1.9 | | 1.7 | |
OBEGAL excluding NZS Fund revenue | | | | | | 3.4 | | 2.8 | | 2.2 | | 1.8 | | 1.7 | |
| | | | | | | | | | | | | | | |
Debt indicators | | | | | | | | | | | | | | | |
Gross sovereign-issued debt | | 22.6 | | 22.6 | | 23.0 | | 23.3 | | 22.5 | | 21.3 | | 21.8 | |
Total gross Crown debt | | 25.2 | | 25.7 | | 26.4 | | 26.8 | | 26.3 | | 24.9 | | 25.3 | |
| | | | | | | | | | | | | | | |
Net core Crown debt | | 4.9 | | 2.8 | | 3.1 | | 2.7 | | 3.1 | | 3.3 | | 3.5 | |
Net core Crown debt with NZS Fund assets | | (3.3 | ) | (4.8 | ) | (4.6 | ) | (6.2 | ) | (7.3 | ) | (8.6 | ) | (9.8 | ) |
| | | | | | | | | | | | | | | |
Net worth | | 45.6 | | 53.7 | | 54.4 | | 55.5 | | 56.7 | | 57.2 | | 57.3 | |
| | | | | | | | | | | | | | | |
New Zealand Superannuation Fund | | | | | | | | | | | | | | | |
Fund asset returns (after tax) | | 969 | | 1,006 | | 1,006 | | 965 | | 1,150 | | 1,351 | | 1,573 | |
Fund contributions | | 2,337 | | 2,049 | | 2,049 | | 2,103 | | 2,194 | | 2,312 | | 2,458 | |
Fund assets (year end) | | 9,861 | | 12,918 | | 12,910 | | 15,977 | | 19,321 | | 22,984 | | 27,015 | |
% of GDP | | 6.3 | | 7.8 | | 7.8 | | 9.2 | | 10.8 | | 12.3 | | 13.8 | |
Source: The Treasury
Table 2.14 – 2006 Half Year Update fiscal indicators
| | Year ended 30 June | |
Fiscal indicators | | 2006
Actual | | 2007
Forecast | | 2008
Forecast | | 2009
Forecast | | 2010
Forecast | | 2011
Forecast | |
($ million) | | | | | | | | | | | | | |
| | | | | | | | | | | | | |
Revenue | | | | | | | | | | | | | |
Total revenue | | 76,581 | | 74,977 | | 76,688 | | 79,051 | | 82,818 | | 86,489 | |
Core Crown revenue | | 59,170 | | 59,020 | | 59,917 | | 61,577 | | 64,746 | | 67,895 | |
Tax revenue | | 51,973 | | 51,708 | | 53,344 | | 55,596 | | 58,512 | | 61,225 | |
| | | | | | | | | | | | | |
Expenses | | | | | | | | | | | | | |
Total Crown expenses | | 65,084 | | 68,790 | | 70,688 | | 73,926 | | 77,064 | | 80,583 | |
Core Crown expenses | | 49,900 | | 53,963 | | 55,577 | | 58,159 | | 60,554 | | 63,479 | |
| | | | | | | | | | | | | |
Operating balance - Core Crown | | 9,270 | | 5,057 | | 4,340 | | 3,418 | | 4,192 | | 4,416 | |
Operating balance - Crown entities | | 1,593 | | 1,013 | | 1,079 | | 1,124 | | 963 | | 950 | |
Operating balance - SOEs | | 1,799 | | 776 | | 993 | | 1,055 | | 1,091 | | 1,062 | |
Dividend elimination | | (1,189 | ) | (586 | ) | (341 | ) | (400 | ) | (420 | ) | (449 | ) |
Operating balance | | 11,473 | | 6,260 | | 6,071 | | 5,197 | | 5,826 | | 5,979 | |
| | | | | | | | | | | | | |
OBERAC | | 8,648 | | 6,656 | | 6,071 | | 5,197 | | 5,826 | | 5,979 | |
OBERAC (excluding net NZS Fund asset returns) | | 8,068 | | 5,981 | | 5,231 | | 4,170 | | 4,588 | | 4,511 | |
| | | | | | | | | | | | | |
Cash available/(shortfall to be funded) | | 2,985 | | 107 | | (691 | ) | (1,821 | ) | (978 | ) | (294 | ) |
| | | | | | | | | | | | | |
Debt indicators | | | | | | | | | | | | | |
Gross sovereign-issued debt | | 35,461 | | 37,867 | | 40,153 | | 39,192 | | 38,615 | | 41,082 | |
Total gross Crown debt | | 39,427 | | 43,750 | | 46,869 | | 47,290 | | 46,901 | | 49,531 | |
Net core Crown debt | | 7,745 | | 6,382 | | 5,923 | | 7,187 | | 7,697 | | 7,525 | |
| | | | | | | | | | | | | |
Net core Crown debt with NZS Fund assets | | (2,116 | ) | (6,271 | ) | (9,703 | ) | (11,792 | ) | (14,979 | ) | (19,195 | ) |
| | | | | | | | | | | | | |
Net worth | | 71,403 | | 77,718 | | 83,789 | | 88,986 | | 94,812 | | 100,791 | |
| | | | | | | | | | | | | |
Domestic bond programme | | 2,375 | | 2,456 | | 2,517 | | 2,476 | | 2,472 | | 2,465 | |
| | | | | | | | | | | | | |
Nominal GDP | | 156,562 | | 162,667 | | 170,633 | | 179,817 | | 188,764 | | 198,068 | |
| | | | | | | | | | | | | |
Fiscal indicators as a % of GDP | | | | | | | | | | | | | |
Revenue | | | | | | | | | | | | | |
Total Crown revenue | | 48.9 | | 46.1 | | 44.9 | | 44.0 | | 43.9 | | 43.7 | |
Core Crown revenue | | 37.8 | | 36.3 | | 35.1 | | 34.2 | | 34.3 | | 34.3 | |
Tax revenue | | 33.2 | | 31.8 | | 31.3 | | 30.9 | | 31.0 | | 30.9 | |
| | | | | | | | | | | | | |
Expenses | | | | | | | | | | | | | |
Total Crown expenses | | 41.6 | | 42.3 | | 41.4 | | 41.1 | | 40.8 | | 40.7 | |
Core Crown expenses | | 31.9 | | 33.2 | | 32.6 | | 32.3 | | 32.1 | | 32.0 | |
| | | | | | | | | | | | | |
Operating balance | | 7.3 | | 3.8 | | 3.6 | | 2.9 | | 3.1 | | 3.0 | |
OBERAC | | 5.5 | | 4.1 | | 3.6 | | 2.9 | | 3.1 | | 3.0 | |
OBERAC (excluding net NZS Fund asset returns) | | 5.2 | | 3.7 | | 3.1 | | 2.3 | | 2.4 | | 2.3 | |
| | | | | | | | | | | | | |
Debt indicators | | | | | | | | | | | | | |
Gross sovereign-issued debt | | 22.6 | | 23.3 | | 23.5 | | 21.8 | | 20.5 | | 20.7 | |
Total gross Crown debt | | 25.2 | | 26.9 | | 27.5 | | 26.3 | | 24.8 | | 25.0 | |
| | | | | | | | | | | | | |
Net core Crown debt | | 4.9 | | 3.9 | | 3.5 | | 4.0 | | 4.1 | | 3.8 | |
Net core Crown debt with NZS Fund assets | | (1.4 | ) | (3.9 | ) | (5.7 | ) | (6.6 | ) | (7.9 | ) | (9.7 | ) |
| | | | | | | | | | | | | |
Net worth | | 45.6 | | 47.8 | | 49.1 | | 49.5 | | 50.2 | | 50.9 | |
| | | | | | | | | | | | | |
New Zealand Superannuation Fund | | | | | | | | | | | | | |
Fund asset returns (after tax) | | 969 | | 743 | | 840 | | 1,027 | | 1,238 | | 1,468 | |
Fund contributions | | 2,337 | | 2,049 | | 2,133 | | 2,326 | | 2,459 | | 2,576 | |
Fund assets (year end) | | 9,861 | | 12,653 | | 15,626 | | 18,979 | | 22,676 | | 26,720 | |
% of GDP | | 6.3 | | 7.8 | | 9.2 | | 10.6 | | 12.0 | | 13.5 | |
Source: The Treasury
Risks to fiscal forecasts
The fiscal forecasts were finalised on 9 May 2007 in accordance with the forecast accounting policies. There are certain risks associated with the forecast results. To assist in evaluating such risks, the following chapters should be read in conjunction with the fiscal forecasts:
· Risks and Scenarios (Chapter 3) – The fiscal forecasts are based on the economic forecasts presented in Chapter 1 and any variation from the economic forecast will affect the fiscal forecasts in particular, tax revenue and benefit expenses. The Risks and Scenarios chapter discusses the effect on the forecasts under different circumstances.
· Specific Fiscal Risks (Chapter 4) – The fiscal forecasts incorporate Government decisions up to 9 May 2006. The Specific Fiscal Risks chapter covers specific policy decisions that are under active consideration by the Government at the time of the finalisation of the forecasts.
In addition to the specific fiscal risks and the link to the economic forecasts, there are a number of forecasting issues explained below that may arise in future.
Tax forecasting risks
The tax forecasts prepared for this Budget Update are based on current tax policy and on the macroeconomic central forecast. Sensitivities of tax revenue to changes in economic conditions are also presented in the Risks and Scenarios chapter on page 115.
KiwiSaver risks
IRD baselines incorporate an assumed take-up profile for the KiwiSaver regime. Actual take-up could be higher or lower than assumed, or faster or slower than assumed, representing an unquantified risk to the operating balance. This would decrease or increase the operating balance.
SOEs’ and Crown entities’ forecasts
The forecasts for large SOEs and CEs were provided in March 2007 based on their best assessments at that time.
Revaluation of property, plant and equipment
Crown accounting policy is to revalue certain classes of property, plant and equipment on a regular basis. In certain circumstances the valuation will be affected by foreign exchange rates, so any appreciation in the NZ dollar (from 30 June 2007) will adversely affect the current physical asset values included in the fiscal forecasts.
Discount rates
The GSF and ACC liabilities included in these forecasts have been valued as at 28 February and 31 March respectively. The liabilities will next be valued as at 30 June 2007. Any change in discount rates will affect the present fiscal forecast. For example, if the discount rate rises, the value of the liabilities will decrease.
Tertiary education institutes’ accounting treatment
The forecast information presented in the 2007 Budget Update combined Tertiary Education Institutes (TEIs) on an equity accounting basis. This treatment has been under consideration by accounting standard setters. The Financial Reporting Standards Board has recently advised that the question of whether to consolidate autonomous and independent entities will be considered by delivering its deliberations of the International Accounting Standards Board (IASB) project on consolidation. The IASB plans to publish a discussion paper in 2007.
The combination method adopted in these forecasts is to equity account for the TEIs’ net surpluses and net investment (ie, TEI revenues, expenses, assets and liabilities are not included on a line-by-line basis). This is consistent with the treatment adopted in the 2006 Financial Statements of the Government.
The key indicators are unchanged as a result of the combination approach for TEIs (refer page 60 of the 30 June 2006 Financial Statements of the Government).
Indicators of the
Government’s Fiscal Performance
This section aims to help readers better understand the Government’s fiscal position.
Each indicator in this fact sheet gives valid insights into the government’s historical, current and forecast fiscal position, but no one indicator gives a complete picture. Individual indicators do, however, come into greater or lesser focus as circumstances change.
When, for example, the New Zealand Government’s net worth was low and net and gross debt levels were high, much of the focus of government and public commentary at that time was on eliminating annual operating deficits and on the need to attain, and later to lock in, annual operating surpluses.
However, as net worth has risen, and gross and net debt levels have fallen, the Government in more recent years has increasingly focused on how to maintain debt levels around current levels and, accordingly, has given more focus to the Government’s annual cash balance.
Most of the indicators in this section may be useful regardless of the particular fiscal strategy being followed. In a few cases (such as the formulation of OBEGAL excluding NZS Fund revenue), the indicator is used to throw light on the impact of a particular strategy (in this case the build-up of financial assets in the NZS Fund).
Accounting Equations
Flow indicators (a worked example of how these flows interact is provided in the Fiscal Outlook chapter, see Table 2.2)
• Core Crown revenues – core crown expenses + net surplus of SOEs (ie, after dividends) and Crown entities + net gains and losses = Operating balance.
• Operating balance – net gains and losses = Operating balance before gains and losses (OBEGAL).
• OBEGAL – retained items (eg, net surplus of SOEs/CEs and revenues of the NZS Fund) – non-cash items (eg, depreciation) = Net core Crown cashflow from operations.
• Net core Crown cashflow from operations – net investing activities (eg, contributions to NZS Fund, purchases of assets, loans to others) = Residual cash.
Stock indicators
• Gross sovereign-issued debt (GSID) = debt issued by the core Crown.
• Core Crown net debt = gross sovereign-issued debt – core Crown’s financial assets.
• Net worth (NW) = Crown’s total assets – Crown’s total liabilities. (Operating balance (OB) in any year largely drives the change in Net worth.)
Ratio of Core Crown Revenue (excluding NZS Fund revenue) to GDP
Ratio of core Crown revenue (excluding NZS Fund revenue) to GDP = the amount of revenue the core Crown receives as a percentage of GDP. Core Crown revenue mostly consists of tax revenue collected by the Government, but also includes investment income, sales of goods and services, and other receipts. Tax revenue is an accrual measure of taxation (ie, it is a measure of tax due, regardless of whether or not it has actually been paid).
The revenue collected is used to meet the Government’s spending needs. It is important to look at this alongside expenses, operating balance and gross debt indicators for insights into the sustainability of current policy settings.
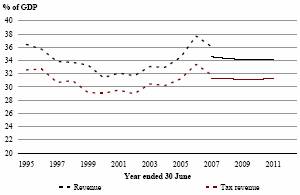
Core Crown revenue (excluding NZS Fund revenue) to GDP is expected to be broadly stable at around 34% over the forecast period, while core Crown tax to GDP is expected to be remain relatively flat over the forecast period.
Ratio of Core Crown Expenses to GDP
Ratio of core Crown expenses to GDP = the day-to-day spending (on salaries, welfare benefit payments, running hospitals and schools, finance costs and maintaining national defence etc) that do not build physical assets for the Government. This is an accrual measure of expenses and includes items such as depreciation on physical assets.
This shows the day-to-day spending of the core Crown – ie, it excludes spending by SOEs and Crown entities – and highlights the size of Government in the economy and potential scope for crowding out the private sector.
The forecasts of operating expenses assume that the entire forecast operating allowance is allocated to spending.
By reducing gross debt, the Government has also reduced finance costs. However, in the years ahead, finance costs are likely to be fairly flat with gross debt forecast to be broadly stable.
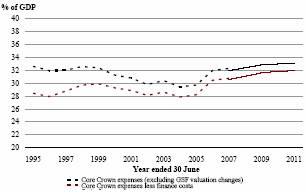
In the short-term core Crown expenses to GDP rise slightly before the trend stabilises as allocations for future Budgets are broadly consistent with forecast growth in the economy.
Operating Balance
Operating balance = revenues less expenses, plus net gains and losses.
The operating balance shows whether the government sector has generated enough revenues to cover its expenses in any given year.
This measure can be volatile from year to year owing to events outside of the Government’s direct control (such as changes in interest rates and revaluations etc); therefore, it is generally not used as a measure of the Government’s short-term fiscal stewardship.
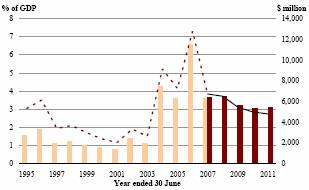
The Government has been running operating surpluses since the early 1990s. The operating balance was just over 7% of GDP in 2006 and is expected to remain above 2% of GDP over the forecast period.
OBEGAL
OBEGAL = the operating balance before net gains and losses.
OBEGAL excluding NZS Fund revenue = OBEGAL less interest and dividend revenue earned by the NZS Fund.
By excluding net gains and losses the OBEGAL gives a more direct indication of the underlying stewardship of the Government.
The current Government wishes to retain the NZS Fund investment returns in the Fund. Therefore, to ensure the Government is meeting its fiscal objectives, the Government has stated that it will be focusing on the OBEGAL excluding NZS Fund revenue.
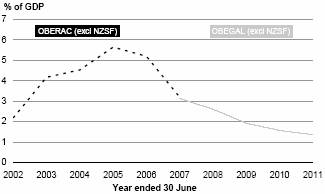
Residual Cash and Domestic Bond Programme
Residual cash = the level of money the Government has available to repay debt or, alternatively, needs to borrow in any given year. Residual cash is alternatively termed “Cash available/(shortfall to be funded)”.
Domestic bond programme = the amount of new government stock expected to be issued over the financial year.
The cash available measure includes capital investment and NZS Fund contributions; therefore, it is the flow contributing to changes in debt. This balance cannot be looked at independently from gross sovereign-issued debt.
The domestic bond programme raises term debt for the Government, the proceeds of which contribute to funding operating and investing activity, and the repayment of maturing debt. The programme tends to be different from the cash available figure in any given year as financing activity, such as the repayment of debt, needs to be considered.
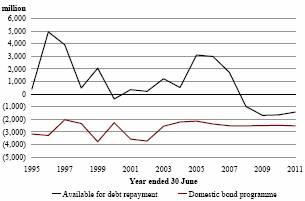
The Government is currently moving from a period of having cash available to repay debt, to a need, in subsequent years, to generate cash through borrowing and reductions in marketable securities.
Crown Gross Debt
Total Crown gross debt = the total borrowings (both sovereign-guaranteed and non-sovereign guaranteed) of the total Crown.
Gross sovereign-issued debt = debt issued by the sovereign (ie, core Crown) and includes Government stock held by the NZS Fund, GSF, ACC or EQC for example.
Total gross debt and GSID are often expressed as a percentage of GDP to put the level of debt into perspective, in terms of a country’s ability to generate growth to repay the debt and/or income to service this debt.
Total gross debt represents the complete picture of whole-of-government obligations to external parties. However, debt issued by SOEs and Crown entities is not explicitly guaranteed by the Crown. The debt that is issued by the sovereign and guaranteed by the sovereign is in GSID. The Government’s long-term debt objective is formulated in terms of GSID.
A high ratio of debt to GDP can have an adverse impact on credit ratings and perceived sustainability of current policy settings. So as a general rule, a relatively low ratio is considered to be prudent. A low ratio of debt to GDP can also provide the Government with more flexibility in their accounts to respond to adverse shocks through increasing debt.
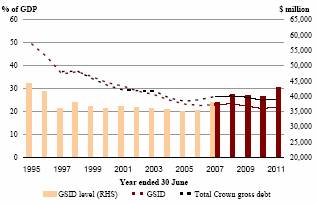
GSID has been steadily declining since the early 1990s and is expected to remain broadly stable around 20% of GDP in the forecast period.
Core Crown Financial Assets
Core Crown financial assets = the financial assets of the core Crown. These are either cash or shares (equity) or a right to receive a financial instrument, which can be converted to cash. The assets of the NZS Fund are becoming the dominant feature of the Crown’s financial assets. The NZS Fund is the Government’s means of building up assets to partially pre-fund future New Zealand Superannuation expenses. The Government’s contributions to the NZS Fund are calculated over a 40-year rolling horizon to ensure superannuation entitlements over the next 40 years can be met.
Established under the New Zealand Superannuation and Retirement Income Act 2001, the NZS Fund was created to partially provide for the future cost of New Zealand Superannuation, which is expected to almost double in cost due to population ageing.
The Government plans to allocate around $2 billion a year to the NZS Fund over the next 20 years. The NZS Fund’s mandate is to invest money in a way that maximises its returns, without undue risks.
As the cost of providing New Zealand Superannuation increases, future governments will draw on the NZS Fund to help smooth the impact of the cost of New Zealand Superannuation on their finances.

For the year ended June 2006, NZS Fund assets totalled $9.86 billion or around 6% of GDP. The NZS Fund is expected to grow to around $27 billion or 14% of GDP by the end of the forecast period.
Core Crown Net Debt
Core Crown net debt = borrowings (financial liabilities) less cash and bank balances, marketable securities and deposits, and advances (financial assets). Net debt excludes the assets of the NZS Fund and GSF.
By including financial assets, net debt can provide additional information about the sustainability of the Government’s accounts. Many international agencies believe the quantity of off setting financial assets is important when determining the credit-worthiness of a country. That is, if a country has a high ratio of financial assets to GDP, they are better able to justify a high ratio of debt to GDP.
However, as some financial assets are not very liquefiable (or easily converted into cash), it is important to view net debt alongside GSID.
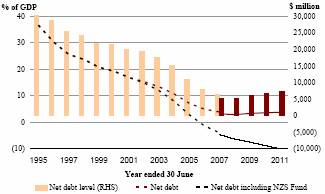
After declining steadily since the early 1990s, net debt is projected to consolidate in the years ahead at around 3% of GDP, rising slightly towards the end of the forecast period. If the assets of the NZS Fund are included, the Government’s net debt position is in a net financial asset position.
Net Worth
Net worth = assets less liabilities (also referred to as the Crown balance). The change in net worth in any given forecast year is largely driven by the operating balance.
Total Crown net worth is one indicator of the degree to which current government activities are sustainable. This indicator should be considered alongside the Crown’s debt position, as relatively high debt to GDP ratios may still be considered sustainable if the Crown has relatively high ratios of saleable or commercial assets to GDP.
Building up net worth is also consistent with preparing for population ageing.
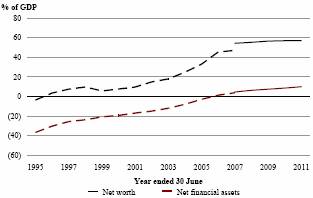
Net worth is projected to continue to rise, moving from around 45% in 2006 to around 57% at the end of the forecast period.
3
Risks and Scenarios
Summary
· The central forecast presented in the Economic and Tax Outlook chapter is for the current recovery in domestic demand to be sustained through most of 2007. Tight monetary conditions are expected to slow its quarterly growth from late 2007 and the high exchange rate will constrain export growth, leading to low growth overall in the March 2009 year, before it recovers in the final two years of the forecasts. However, the course taken by the economy depends on a number of different factors.
Figure 3.1 – Real GDP
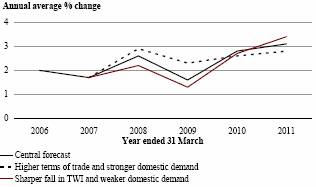
Source: Statistics New Zealand, The Treasury
· A key judgement is the strength of domestic demand in the near term, particularly private consumption. There is also uncertainty about the path of the exchange rate and the strength of the world economy. The investment and employment responses of firms to increasing costs and weak profit growth are also key judgements, as are the underlying assumptions concerning population growth, labour market participation and productivity growth.
· Although we believe the central forecast presented in the Economic and Tax Outlook chapter is the most likely outcome, two scenarios that illustrate different paths for the economy are presented in this chapter. These scenarios are only two of a number of possible outcomes and therefore do not fully illustrate the range of possibilities, but they represent key risks.
· The first scenario illustrates the impact of higher terms of trade and stronger domestic demand in the short term. Gross domestic product (GDP) is higher in both real and nominal terms, but inflation pressures abate more slowly and the current account deficit reduces less. The second scenario assumes that the exchange rate falls sooner and that domestic demand is weaker than in the central forecast, leading to lower growth in GDP and an increase in tradables inflation. Subsequently, inflation is weaker, interest rates are lowered and the current account adjusts sooner than in the central forecast.
Introduction
The central forecast presented in the Economic and Tax Outlook chapter incorporates a number of key judgements about how various forces affecting the economy will evolve. These judgements reflect the balancing of both positive and negative risks facing the economy to arrive at our best assessment of how it is likely to develop. Some of these judgements are related to the cyclical drivers of activity and some relate to the structural characteristics of the economy. If events turn out differently from our assessment, the path taken by the economy is also likely to deviate from the central forecast.
The first part of this chapter, Economic Risks, outlines some of the risks associated with the economic outlook. There are both positive and negative risks – some domestically and some internationally oriented. The second part of this chapter, Economic Scenarios, presents in more detail two scenarios that could occur if events were to unfold differently. The third part of this chapter, Fiscal Scenarios, considers the implications of the two economic scenarios on the fiscal position.
Economic Risks
There is uncertainty about the strength of domestic demand in the near term …
Figure 3.2 – Real gross national expenditure
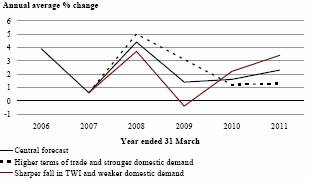
Source: Statistics New Zealand, The Treasury
Domestic demand was the major driver of growth in the New Zealand economy from 2002 to 2004, but its contribution to GDP growth has decreased in the past two years. However, growth in domestic demand – particularly private consumption – picked up in the final quarter of 2006, but the outlook depends on the reasons for the resurgence. Petrol prices fell nearly 15% in the final quarter of 2006 as oil prices fell and the NZ dollar
strengthened, increasing disposable income and giving private consumption growth a boost. Although the level of consumption might be maintained, further falls in fuel prices would be required to lift growth in consumption again.
Another uncertainty is the impact of past interest rate increases on domestic demand. From late 2003 until recently, the effective mortgage interest rate has not increased by as much as the Official Cash Rate and 90-day rates. However, longer term rates have increased recently, affecting new borrowers, and the effective mortgage rate will continue to increase as borrowers re-finance at higher rates. It is uncertain when the effect of these changes will be felt and what impact they will have on domestic demand.
… and the sustainability of the recent increase in the terms of trade
The impact of the recent increase in the terms of trade (largely as a result of increases in dairy prices) is a further uncertainty. International dairy prices have increased by nearly 50% since late 2006, but it is not certain how sustainable these increases are and what effect they will have on the exchange rate, real incomes and consumption.
The future rate of growth in house prices is another uncertainty for domestic demand. In the past six years house prices have approximately doubled, boosting household wealth and supporting private consumption growth and encouraging further residential investment. There has also been an increase in household liabilities, leaving the household sector exposed to a slowdown in house price growth as well as increases in debt servicing costs.
There are both positive and negative risks associated with the strength of domestic demand, but the greater risk is that it will continue to be stronger or continue for longer than in the central forecast. A scenario is developed below which illustrates this risk, combined with a stronger terms of trade, and shows the consequent developments in the economy and the implications for tax revenue.
The exchange rate is an important influence on the economy …
In the central forecast we have assumed that the exchange rate will remain around its current level until early 2008 when it will begin to fall in response to lower interest rates and slower economic growth. However, the exchange rate is always a major uncertainty in economic forecasts and recent volatility has shown that sentiment can change quickly.
There are a number of factors which help to explain the recent strength in the NZ dollar and which are likely to continue to influence it in the forecast period. The large positive interest rate differential between New Zealand and some other countries (particularly Japan, but also the United States) has encouraged offshore investment in New Zealand. Recent increases in commodity prices have also sustained the NZ dollar. The rebound in domestic demand in the final quarter of 2006 and first quarter of 2007 is an additional factor supporting the NZ dollar currently.
… but its future path is uncertain
Figure 3.3 – TWI exchange rate
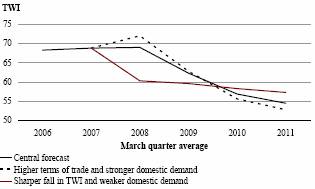
Source: Reserve Bank of New Zealand, The Treasury
The NZ dollar could appreciate further, especially against the US dollar if growth slows in the United States, or could remain strong for longer than assumed in our central case if export commodity prices remain strong or domestic demand remains robust. Such an outcome would further postpone the export recovery and narrowing of the current account deficit, and likely bring stronger domestic demand and higher non-tradables inflation.
It is also possible that the NZ dollar could fall sooner than assumed in our central forecast, most likely because of international developments. A scenario which explores the implications of a sharp fall in the currency sooner than in the central forecasts, in conjunction with weaker domestic demand, is developed below. Its effect on other parts of the economy and tax revenue is also explored.
The pace of growth in the world economy is a potential risk …
The world economy is currently in the mature phase of an expansion which began in 2002 with the recovery from the bursting of the “tech bubble” in the United States. Our central forecast assumes that trading partner growth will average 3.6% per annum over the forecast period, similar to its average for the past three years. However, there are risks to this outlook, mostly on the downside.
Interest rates are being tightened in most developed economies as inflation pressures emerge. Consequently there is a risk that growth might be weaker than assumed in our central forecast if, for example, inflation pressures become greater and further monetary tightening is required in the major developed economies. In addition, the housing market in the United States has slowed over the past year and problems have emerged in the sub-prime mortgage sector.
If these financial difficulties spill over to other sectors, perhaps combined with further monetary tightening, growth could slow dramatically. Although the performance of the Asian economies, particularly China, may not be as dependent upon the US economy as previously, there are doubts about the sustainability of the growth in the Asian region as inflation pressures develop there too.
… as are other international developments
Changes in international commodity markets can have a major impact on the New Zealand economy. The recent emphasis on bio-fuels in the United States has placed upward pressure on stockfeed prices with flow-on effects on dairy prices. To the extent that these price increases are sustained, they point to higher terms of trade for New Zealand and a higher equilibrium exchange rate with consequent benefits for real incomes.
International events can also affect the prospects for the New Zealand economy. Recent fluctuations in oil prices have shown the continued influence of political events, as well as the usual supply and demand factors. Changes in oil prices are directly reflected in local fuel prices and affect household disposable income and private consumption, as well as inflation. Increased costs also affect firm profitability and investment and hiring decisions.
Employment and investment decisions by firms are a key factor …
The response of firms to higher costs (including labour costs) and steady or lower profits will also be a key factor in the forecast period. In the central forecast we have assumed that employment growth will ease. However, continuing tight labour market conditions and a pick-up in domestic demand may lead firms to seek to expand employment further.
If employment levels or labour incomes were higher than in the central scenario, private consumption and residential investment would also be stronger. If firms are unable to find the labour they are seeking, they may increase their investment in plant and equipment even more than already assumed in order to increase productivity and output.
Similarly, the response of firms to the Business Tax Reform in this budget is an uncertainty. The impact of the changes on business costs is a key dimension likely to affect employment and investment decisions.
… and so are the responses of households to labour market conditions
The response of households to labour market conditions is also important. The fall in participation from its peak in the second half of 2006 may be related to weaker employment growth at that time, but may also reflect the effect of income support policies which impose high effective marginal tax rates. Lower labour force participation, for a constant employment level, would bring lower unemployment and a tighter labour market and may lead to faster wage growth than assumed in the central forecasts. While this might support total labour income – and private consumption – in the short term, it would adversely affect firm profitability. Lower participation also implies a lower potential growth rate for the economy as a whole and greater inflation pressure for a given rate of growth above that trend.
Underlying assumptions concerning productivity are an uncertainty …
The central forecast assumes that labour productivity growth will recover in the forecast period. Productivity growth has been weak recently as output growth has fallen without a commensurate change in labour input, typical of the mature phase of the economic cycle. In addition, unemployment has been below 4% since September 2004 and so the productivity of the latest workers hired may be lower than the existing workforce,
detracting from aggregate productivity. Some firms may also be holding onto existing labour despite a fall in output, adversely affecting measured productivity.
However, we consider that labour productivity growth is likely to strengthen in the forecast period as a result of a reversal of these cyclical factors, as well as the beneficial effects of recent business investment. If these assumptions are not correct and productivity growth turns out to be lower than assumed, the potential growth rate of the economy will be lower and inflation pressures will be higher for a given level of output.
… as are assumptions concerning population growth
Another key assumption in our central forecast is the rate of population growth, with the net gain from external migration the main uncertainty. In the central forecasts we have assumed that net migration will decline gradually to its long-run average of 10,000 per annum by March 2010. There is a risk that migration will be lower in the short term as increasing departures of New Zealanders lowered the net gain to only 6,400 on an annualised basis for the March 2007 quarter. Lower net migration gains would affect both the potential growth rate (through its effect on labour supply) and short-term demand via consumption and residential investment.
There are also risks associated with some other types of events
There are also a number of non-economic risks which might impact on the development of the economy. Climatic events can affect agricultural production levels, both in New Zealand and in competing supplier countries with adverse or beneficial effects on returns to New Zealand producers. Similarly, agricultural diseases can have adverse or beneficial consequences for New Zealand producers, depending on how they affect them. Market perceptions arising from concerns about long-term climate change and environmental concerns may also affect the demand for New Zealand products.
Economic Scenarios
The following scenarios show how the growth path of the economy might evolve if some of the key judgements underlying the central forecast are altered. The scenarios are two of a large number of possible examples, and do not represent upper or lower bounds for the central forecast, with more extreme paths possible. They represent what are assessed to be two key risks to the central forecast and serve to illustrate the impact which relatively small changes in the assumptions underlying the forecasts have on some key variables, especially the fiscal aggregates.
In the first scenario, entitled “Higher terms of trade and stronger domestic demand”, a stronger terms of trade (in the form of higher export prices) in the near term, accompanied by stronger consumption and residential and market investment, raises real GDP growth in the near term but also increases inflationary pressures and postpones the current account adjustment.
The second scenario is entitled “A sharper fall in the TWI and weaker domestic demand”. The NZ dollar falls sooner than in the central forecast and domestic demand is weaker, leading to lower growth in GDP initially and an increase in tradables inflation. Subsequently, inflation is weaker, interest rates are lowered and the current account deficit adjusts sooner than in the central forecast.
Table 3.1 – Alternative scenarios: summary
| | 2006 | | 2007 | | 2008 | | 2009 | | 2010 | | 2011 | |
| | Actual | | Estimate | | Forecast | | Forecast | | Forecast | | Forecast | |
Production GDP (annual average % change, year ending 31 March) | | | | | | | | | | | | | |
Central forecast | | 2.0 | | 1.7 | | 2.6 | | 1.6 | | 2.8 | | 3.1 | |
Higher terms of trade and stronger domestic demand | | 2.0 | | 1.7 | | 2.9 | | 2.3 | | 2.6 | | 2.8 | |
Sharper fall in TWI and weaker domestic demand | | 2.0 | | 1.7 | | 2.2 | | 1.3 | | 2.7 | | 3.4 | |
Nominal expenditure GDP (annual average % change, year ending 31 March) | | | | | | | | | | | | | |
Central forecast | | 4.6 | | 4.4 | | 5.6 | | 3.5 | | 4.2 | | 4.8 | |
Higher terms of trade and stronger domestic demand | | 4.6 | | 4.4 | | 6.4 | | 4.6 | | 4.2 | | 5.0 | |
Sharper fall in TWI and weaker domestic demand | | 4.6 | | 4.4 | | 4.8 | | 3.4 | | 3.9 | | 4.5 | |
OBEGAL ($billion, year ending 30 June)(1) | | | | | | | | | | | | | |
Central forecast | | 8.6 | | 5.5 | | 5.0 | | 4.0 | | 3.5 | | 3.3 | |
Higher terms of trade and stronger domestic demand | | 8.6 | | 5.6 | | 5.6 | | 5.0 | | 4.4 | | 4.1 | |
Sharper fall in TWI and weaker domestic demand | | 8.6 | | 5.5 | | 4.4 | | 3.4 | | 3.0 | | 2.7 | |
Sources: Statistics New Zealand, The Treasury
NOTE: (1) Operating balance before gains and losses. See Chapter 2 above for an explanation. The figures for 2006 are the OBERAC.
Higher terms of trade and stronger domestic demand
In the central forecast, the terms of trade (on an overseas trade index basis) are forecast to increase 3.6% in annual average terms in the March 2008 year. Most of this increase is an upward revision from the Half Year Update forecasts; in this scenario, the terms of trade are assumed to increase by a further 2% in the March 2008 year. The reason for this could be a more sustained increase in international dairy prices or a greater flow-through from the recent increases to the price received by New Zealand producers. As a result of the increased export prices, the exchange rate is assumed to be 3% higher in the March 2008 quarter. It is also assumed that there is greater confidence as a result of the higher terms of trade and more momentum in the economy than in the central scenario.
Table 3.2 – Higher terms of trade and stronger domestic demand scenario
(Annual average % change, | | 2006 | | 2007 | | 2008 | | 2009 | | 2010 | | 2011 | |
year ending 31 March) | | Actual | | Estimate | | Forecast | | Forecast | | Forecast | | Forecast | |
Private consumption | | 4.3 | | 1.7 | | 3.6 | | 2.8 | | 1.2 | | 1.0 | |
Residential investment | | -4.7 | | -2.3 | | 5.8 | | -1.3 | | -5.1 | | -0.0 | |
Market investment | | 7.5 | | -4.6 | | 6.6 | | 5.5 | | 1.3 | | 0.8 | |
Gross national expenditure | | 3.9 | | 0.6 | | 5.0 | | 3.1 | | 1.2 | | 1.3 | |
Exports of goods and services | | -0.3 | | 3.1 | | 0.4 | | 3.4 | | 3.8 | | 4.2 | |
Imports of goods and services | | 4.1 | | -1.2 | | 5.5 | | 5.2 | | -0.3 | | -0.2 | |
GDP (production measure) | | 2.0 | | 1.7 | | 2.9 | | 2.3 | | 2.6 | | 2.8 | |
Employment growth | | 2.6 | | 1.6 | | 1.1 | | 1.7 | | 1.2 | | 1.3 | |
Unemployment rate(1) | | 3.9 | | 3.8 | | 3.9 | | 4.1 | | 4.0 | | 4.0 | |
90-day bank bill rate(2) | | 7.6 | | 7.8 | | 8.5 | | 8.3 | | 7.2 | | 6.9 | |
TWI(2) | | 68.3 | | 68.8 | | 72.0 | | 62.8 | | 55.6 | | 52.8 | |
CPI(3) | | 3.3 | | 2.6 | | 2.7 | | 3.1 | | 3.3 | | 2.7 | |
Current account balance (% GDP) | | -9.6 | | -8.6 | | -7.2 | | -8.1 | | -8.7 | | -7.3 | |
Nominal GDP (expenditure measure) | | 4.6 | | 4.4 | | 6.4 | | 4.6 | | 4.2 | | 5.0 | |
Sources: Statistics New Zealand, Reserve Bank of New Zealand, The Treasury
NOTES: | (1) | Percentage of labour force, March quarter, seasonally adjusted. |
| (2) | Average for March quarter. |
| (3) | Annual percentage change, March quarter. |
In this scenario, private consumption growth is assumed to be stronger in the March 2008 and 2009 years than in the central forecast, as households respond to their higher real incomes and increased confidence; higher real incomes also lead to stronger residential investment in the first two years of the scenario. With stronger demand from households, firms increase their investment relative to the central forecast in the same period.
As a result of the stronger domestic demand, employment growth is approximately half a percentage point higher in the March 2009 and 2010 years and the unemployment rate approximately half a percentage point lower. Wage growth is higher than in the central forecasts and the greater strength in the labour market reinforces the stronger domestic demand.
Export volume growth in this scenario is assumed to be slightly lower than in the central forecast because of the effect of the higher exchange rate inhibiting growth in non-commodity and services export volumes. Import volume growth responds rapidly to the increased private consumption and business investment to be slightly higher in the March 2008 year and 3.0% higher in the March 2009 year. GDP growth is higher in the first two years of the forecast period.
The stronger domestic demand leads to higher inflation and more persistent inflation pressures. Consumer price inflation is 0.7% higher in March 2009 and 1.0% higher in the following year. Increased inflation pressure results in tighter monetary policy and 90-day interest rates are half a percentage point higher in the March 2008 quarter and do not fall as rapidly in the following year, remaining at 8.3% in March 2009, 1.6% points higher than in the central scenario. Even with this monetary tightening, inflation remains half a percentage point higher in the final year of the forecasts.
The monetary tightening, however, brings about a slowing in domestic demand. Private consumption, residential investment and market investment all grow more slowly in this scenario in the final two years of the forecast than in the central forecast. Import growth is also lower in this period, but so is real GDP growth. Nominal GDP growth receives a boost of approximately 1% in each of the first two years of the projection period as the higher real GDP is boosted by higher inflation, but is practically unchanged from the central forecast in the last two years as lower real GDP growth offsets the higher inflation.
The stronger domestic demand, especially increased demand for imports, leads to a slower adjustment in the current account deficit. Net investment income outflows also increase as firm profitability increases with the stronger domestic demand. The deficit increases in the March 2009 and 2010 years, reaching 8.7% of nominal GDP in March 2010, 1.8% points higher than in the central forecast. It declines slightly in the following year as GDP growth falls below the central forecasts, but remains at least one percentage point higher at 7.3% of GDP. A continuation of current account deficits at such a level is unsustainable, suggesting that further adjustment will be necessary in the future.
Figure 3.4 – Current account
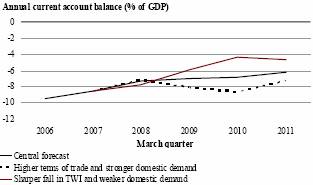
Source: Statistics New Zealand, The Treasury
Because of the stronger growth in nominal GDP in the early part of the forecast period, the level of nominal GDP is higher throughout the whole forecast period. The cumulative increase over the period to March 2010 is $11.6 billion, with an increase in the final year of $3.7 billion. This higher level of nominal GDP leads to higher tax revenues throughout the period.
A sharper fall in the TWI and weaker domestic demand
The second scenario illustrates a situation in which the NZ dollar falls sooner than assumed in the central forecast (possibly as a result of a change in investor sentiment towards New Zealand as a result of other international developments) and – in conjunction with an assumption of greater impact from recent increases in interest rates – there is weaker domestic demand.
Table 3.3 – Sharper fall in TWI and weaker domestic demand
(Annual average % change, | | 2006 | | 2007 | | 2008 | | 2009 | | 2010 | | 2011 | |
year ending 31 March) | | Actual | | Estimate | | Forecast | | Forecast | | Forecast | | Forecast | |
Private consumption | | 4.3 | | 1.7 | | 2.6 | | 0.5 | | 1.3 | | 2.0 | |
Residential investment | | -4.7 | | -2.3 | | 0.9 | | -7.6 | | 0.8 | | 9.0 | |
Market investment | | 7.5 | | -4.6 | | 4.7 | | -4.7 | | 5.0 | | 7.4 | |
Gross national expenditure | | 3.9 | | 0.6 | | 3.7 | | -0.4 | | 2.2 | | 3.4 | |
Exports of goods and services | | -0.3 | | 3.1 | | 0.4 | | 3.7 | | 4.4 | | 4.2 | |
Imports of goods and services | | 4.1 | | -1.2 | | 4.0 | | -2.2 | | 2.8 | | 4.3 | |
GDP (production measure) | | 2.0 | | 1.7 | | 2.2 | | 1.3 | | 2.7 | | 3.4 | |
| | | | | | | | | | | | | |
Employment growth | | 2.6 | | 1.6 | | 0.9 | | 1.2 | | 0.2 | | 0.8 | |
Unemployment rate(1) | | 3.9 | | 3.8 | | 4.0 | | 4.6 | | 4.9 | | 4.8 | |
90-day bank bill rate(2) | | 7.6 | | 7.8 | | 8.0 | | 6.2 | | 5.2 | | 5.5 | |
TWI(2) | | 68.3 | | 68.8 | | 60.3 | | 59.6 | | 58.3 | | 57.3 | |
CPI(3) | | 3.3 | | 2.6 | | 3.0 | | 2.2 | | 1.2 | | 1.5 | |
Current account balance (% GDP) | | -9.6 | | -8.6 | | -7.8 | | -5.9 | | -4.3 | | -4.6 | |
Nominal GDP (expenditure measure) | | 4.6 | | 4.4 | | 4.8 | | 3.4 | | 3.9 | | 4.5 | |
Sources: Statistics New Zealand, Reserve Bank of New Zealand, The Treasury
NOTES: | (1) | Percentage of labour force, March quarter, seasonally adjusted. |
| (2) | Average for March quarter. |
| (3) | Annual percentage change, March quarter. |
In this scenario, the Trade Weighted Index (TWI) falls to 60.3 in March 2008, nearly 13% lower than in the central forecast, and below 60.0 in the following March, approximately 4% lower than in the central case. Thereafter, the decline in the exchange rate levels off and it is slightly above the central track at the end of the forecast period. The earlier fall in the NZ dollar, combined with weaker domestic demand, helps achieve a faster re-balancing of the economy and so the exchange rate does not fall as much at the end of the period.
Private consumption growth is half a percent lower than the central forecasts in the year to March 2008 and 1.2% lower in the following year as recent interest rate increases have more effect. Residential investment growth is lower initially in this scenario, falling by 7.6% in the March 2009 year. Market investment is also lower than in the central forecast, declining by nearly 5% in the March 2009 year as a result of the weaker domestic demand.
The weaker domestic demand is accompanied by slower growth in imports in the first two years of the scenario. Import volume growth in the March 2008 year is slightly lower at 4.0% and declines 2.2% in the following year. In the final two years of the forecast, import growth is higher than in the central forecasts as domestic demand strengthens again.
The response of export volumes to the lower exchange rate is muted, partly because the lower exchange rate is more likely to affect primary product prices than volumes and partly because the extended period of the high exchange rate has limited the ability of the manufacturing export sector to increase output in response to increased competitiveness. Growth in real GDP is lower in the first three years than in the central forecasts.
Employment growth is lower throughout the forecast period, as firms utilise a lower level of labour input in response to weaker demand. The unemployment rate is higher as a result, rising to 4.0% in March 2008 and averaging just below 5.0% in the final two years of the projections. Wage growth is weaker throughout the period, compounding the weaker private consumption and residential investment growth.
Initially, consumer price inflation is higher than in the central forecasts because of the pass-through from the sharp fall in the exchange rate, but thereafter it falls below the rate in the central case as domestic demand eases and non-tradables inflation declines. Inflation increases to 3.0% in March 2008, but falls away quickly to 2.2% in the following year and 1.2% the year after that. Once lower inflation becomes established, monetary policy is loosened and 90-day rates fall nearly two percentage points to 6.2% in March 2009 and 5.2% the following March, well below the 6.3% in the central forecast.
Figure 3.5 – CPI inflation
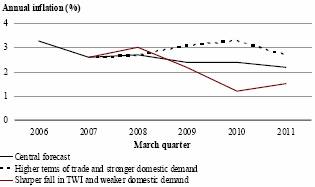
Source: Statistics New Zealand, The Treasury
The lower interest rates stimulate domestic demand in the final two years of the scenario. Residential investment begins to recover in the 2010 March year from its decline in the previous year and records solid growth of 9.0% in the final year. Private consumption growth takes slightly longer to respond, but is also above the central forecast in the final year. Market investment responds to both the lower interest rates and the stronger consumption and residential investment, and real gross national expenditure growth is higher than in the central case in the final two years of the forecast period. Import volume growth also recovers.
The current account deficit increases initially in this scenario as the price effects of the fall in the exchange rate are felt before import volumes respond, but then it narrows more quickly, reaching 4.6% of nominal GDP at the end of the period (compared with 6.2% in the central forecasts).
Because of the lower rate of growth in real GDP initially and the lower consumer price inflation after the initial period, both the rate of growth and the level of nominal GDP are lower throughout the forecast period by a cumulative total of approximately $7.2 billion. This brings a corresponding reduction in tax revenues.
Fiscal Scenarios
The fiscal position is strongly influenced by the economy. The major economic determinants, and how they impact on the fiscal position, are listed below. While each effect is expressed in terms of an increase in the determinant, the opposite impact applies for a decrease.
· Nominal GDP – higher GDP levels are reflected in higher tax revenue, which increases the operating balance and lowers the Government’s net debt.
· Interest rates – higher interest rates lead to increased debt-financing costs but also to higher interest-based revenue.
· The level of unemployment – higher levels of unemployment translate to an increase in spending, because the number of unemployment beneficiaries rises. This decreases the operating balance and raises net debt levels.
· CPI inflation – as most benefits are indexed to CPI movements, higher inflation results in increased benefit costs. This reduces the operating balance and increases net debt.
Table 3.4 – Alternative scenarios: impact on OBEGAL and debt
| | 2006 | | 2007 | | 2008 | | 2009 | | 2010 | | 2011 | |
Year ending 30 June | | Actual | | Forecast | | Forecast | | Forecast | | Forecast | | Forecast | |
OBEGAL ($billion)(1) | | | | | | | | | | | | | |
Central forecast | | 8.6 | | 5.5 | | 5.0 | | 4.0 | | 3.5 | | 3.3 | |
Higher terms of trade | | 8.6 | | 5.6 | | 5.6 | | 5.0 | | 4.4 | | 4.1 | |
Sharper fall in TWI | | 8.6 | | 5.5 | | 4.4 | | 3.4 | | 3.0 | | 2.7 | |
| | | | | | | | | | | | | |
Gross sovereign-issued debt ($billion)(2) | | | | | | | | | | | | | |
Central forecast | | 33.5 | | 32.0 | | 34.5 | | 34.3 | | 34.0 | | 36.8 | |
Higher terms of trade | | 33.5 | | 32.0 | | 33.8 | | 32.7 | | 31.5 | | 33.5 | |
Sharper fall in TWI | | 33.5 | | 32.0 | | 35.0 | | 35.4 | | 35.5 | | 39.0 | |
| | | | | | | | | | | | | |
OBEGAL (% GDP)(1) | | | | | | | | | | | | | |
Central forecast | | 7.3 | | 3.4 | | 2.9 | | 2.2 | | 1.9 | | 1.7 | |
Higher terms of trade | | 7.3 | | 3.4 | | 3.2 | | 2.7 | | 2.3 | | 2.1 | |
Sharper fall in TWI | | 7.3 | | 3.4 | | 2.6 | | 1.9 | | 1.6 | | 1.4 | |
| | | | | | | | | | | | | |
Gross sovereign-issued debt (% GDP)(2) | | | | | | | | | | | | | |
Central forecast | | 21.4 | | 19.4 | | 19.9 | | 19.2 | | 18.2 | | 18.8 | |
Higher terms of trade | | 21.4 | | 19.4 | | 19.3 | | 17.9 | | 16.5 | | 16.8 | |
Sharper fall in TWI | | 21.4 | | 19.4 | | 20.4 | | 19.9 | | 19.2 | | 20.2 | |
| | | | | | | | | | | | | |
Core Crown net debt (% GDP) | | | | | | | | | | | | | |
Central forecast | | 5.0 | | 3.1 | | 2.7 | | 3.1 | | 3.3 | | 3.5 | |
Higher terms of trade | | 5.0 | | 3.0 | | 2.3 | | 2.1 | | 1.9 | | 1.8 | |
Sharper fall in TWI | | 5.0 | | 3.0 | | 3.0 | | 3.7 | | 4.2 | | 4.7 | |
Sources: Statistics New Zealand, The Treasury
NOTES: | (1) | Operating balance before gains and losses. The figures for 2006 are the OBERAC. |
| (2) | This chapter assumes that changes in the OBEGAL translate into changes in gross sovereign-issued debt. As discussed in the Fiscal Strategy Report, for the purpose of assessing progress towards the fiscal objectives in the forecast period the measure of gross sovereign-issued debt excludes the $5.9 billion increase in the level of Reserve Bank settlement cash. For 2006, $2.0 billion is excluded from gross sovereign-issued debt for consistency. |
Higher terms of trade and stronger domestic demand
The first scenario sees higher terms of trade and continuing high levels of domestic consumption and investment. This leads to lower unemployment, higher wage growth and higher inflation. Initially, the higher terms of trade and stronger domestic demand lead to higher nominal GDP. However, by 2010 both nominal and real GDP growth are lower than in the central forecast, as private consumption and residential investment respond to higher interest rates. The higher level of nominal GDP leads to a cumulative increase in tax revenue of $3.9 billion by 2011 relative to the central forecast.
Figure 3.6 – OBEGAL (OBERAC for 2006)
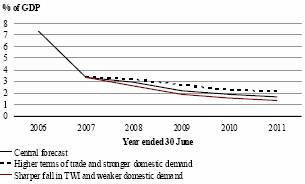
Source: The Treasury
A reduction in the number of unemployment beneficiaries is offset by higher inflation-indexed benefit costs. The combination of lower debt and higher interest rates results in an overall reduction in net finance costs. Overall, expenses are higher over the period, but by less than the increase in tax revenue. As a result, the OBEGAL as a percentage of GDP is 0.4% higher compared with the central forecast at the end of the period and gross sovereign-issued debt is $3.3 billion lower by 2011.
Sharper fall in the TWI and weaker domestic demand
The second scenario is characterised by a 13% fall in the TWI in the year to March 2008 compared with the central forecast, as well as weaker private consumption in 2008 and 2009. Lower inflation over the forecast period leads to lower interest rates and reduced debt financing costs. Weaker demand results in an increase in the unemployment rate relative to the central forecast and slightly lower nominal GDP reduces tax revenue by a cumulative $2.5 billion by 2011 compared to the central forecast.
Figure 3.7 – Gross sovereign-issued debt
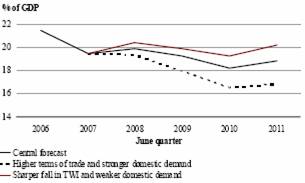
Source: The Treasury
Expenses are lower overall as the increase in the number of unemployed is offset by the lower cost of inflation-indexed benefits. The OBEGAL is lower over the forecast period and is 0.3% of GDP lower in the final year of the forecast. As a result, gross sovereign-issued debt is 1.4% of GDP higher at the end of the forecast period.
Fiscal Sensitivities
The scenarios above indicate the sensitivity of fiscal aggregates to changes in economic conditions. Table 3.5 provides some “rules of thumb” on the sensitivities of the fiscal position to changes in specific variables.
Table 3.5 – Fiscal sensitivity analysis
| | 2007 | | 2008 | | 2009 | | 2010 | | 2011 | |
($million) Year ending 30 June | | Forecast | | Forecast | | Forecast | | Forecast | | Forecast | |
1% lower nominal GDP growth per annum | | | | | | | | | | | |
Revenue | | (497 | ) | (1,033 | ) | (1,589 | ) | (2,208 | ) | (2,883 | ) |
Addition to financing costs | | 15 | | 62 | | 141 | | 255 | | 407 | |
Impact on the operating balance | | (512 | ) | (1,094 | ) | (1,730 | ) | (2,463 | ) | (3,290 | ) |
Revenue impact of a 1% decrease in the growth rates of: | | | | | | | | | | | |
Wages and salaries | | (230 | ) | (490 | ) | (775 | ) | (1,090 | ) | (1,435 | ) |
Taxable business profits | | (135 | ) | (280 | ) | (410 | ) | (560 | ) | (735 | ) |
One percentage point lower interest rates | | | | | | | | | | | |
Interest income | | (117 | ) | (168 | ) | (187 | ) | (137 | ) | (77 | ) |
Expenses | | (70 | ) | (160 | ) | (174 | ) | (179 | ) | (209 | ) |
Impact on the operating balance | | (47 | ) | (8 | ) | (13 | ) | 42 | | 132 | |
The forecasts of capital contributions to the New Zealand Superannuation (NZS) Fund are sensitive to the rate of return assumed on the Fund’s assets:
Table 3.6 – NZS Fund contributions sensitivity analysis
| | | | | | Effect on Capital Contribution | |
| | Marginal | | Effect on Net | | ($million) | |
Variable | | Change | | Return After Tax | | 2007/08 | | 2008/09 | | 2009/10 | | 2010/11 | |
| | (% age points) | | (% age points) | | | | | | | | | |
Expected gross rate of return | | -1 | % | -0.71 | % | 203 | | 216 | | 231 | | 249 | |
4
Specific Fiscal Risks
Introduction
This chapter describes the specific fiscal risks to the Crown, including contingent liabilities. The Public Finance Act 1989 (PFA) requires disclosure of all Government decisions and other circumstances that may put pressure on the forecast spending amounts, and/or have a material effect on the fiscal and economic outlook.
Criteria for Disclosure of Specific Fiscal Risks
To ensure a practicable and consistent disclosure approach, fiscal risks are disclosed based on the following criteria, consistent with the principles of the PFA:
· Reasonable certainty criterion – risks have not been included in the fiscal forecasts because they reflect Government decisions or legislative commitments with uncertain fiscal consequences or timing.
· Materiality criterion – risks have an impact on the fiscal forecasts (operating balance, net worth or gross debt) of $10 million or more in any one forecast year.
· Active consideration criterion – risks are being actively considered by the Minister of Finance and responsible Ministers (eg, are the subject of written reports) or are decisions that have been deferred until a later date.
Exclusions from Disclosure
The PFA requires that all specific fiscal risks be disclosed, except where it is determined by the Minister of Finance that disclosing a risk is likely to:
· prejudice the substantial economic interests of New Zealand
· prejudice the security or defence of New Zealand or international relations of the Government
· compromise the Crown in a material way in negotiation, litigation or commercial activity, or
· result in a material loss of value to the Crown.
Specific fiscal risks do not include:
· normal forecasting risks, such as uncertainty around welfare benefits, State-Owned Enterprise/Crown entity surpluses, the impact of regular revaluations of physical assets, finance costs or fluctuations in external markets
· possible changes to the interpretation of accounting policies, such as the changes to revenue recognition rules and recognition of liabilities, or
· discussion documents containing proposals that the Minister of Finance and responsible Ministers will not actively consider until the consultation process has been completed.
In addition, the Minister of Finance has to determine that there is no reasonable or prudent way the Government can avoid this prejudice, compromise or material loss by making a decision on the fiscal risk before the finalisation of the forecasts, or by disclosing the fiscal risk without reference to its fiscal implications.
Contingent liabilities are also included according to materiality. Contingent liabilities below $10 million are included in the “other quantifiable contingent liabilities” total. Comparatives have been adjusted where appropriate to align with the disclosure of new “material” contingent liabilities. The total amount of prior years’ contingent liabilities remains unchanged.
Information Relating to All Disclosed Risks
· The risks disclosed may not eventuate into Government policy and the final cost or saving may differ from the amount disclosed if the policy is developed.
· All risks, should they eventuate, would impact on the Government’s forecast operating and/or capital spending amounts. There are new spending amounts already incorporated into the forecasts to accommodate policy initiatives on which decisions have yet to be made. Most risks outlined in this chapter, if they eventuate, would be covered by these amounts and therefore have no impact on the overall level of the forecasts. The risks have been disclosed to indicate the pressure the risks place upon the forecast spending amounts.
· If the total of all risks considered exceeds the forecast new operating spending amounts in the forecasts, this would impact on the operating balance.
· There are a number of other pressures on the fiscal position that have not been included as risks. These pressures comprise proposals largely generated within individual departments and not yet considered by the Minister of Finance and responsible Ministers. Such items are expected to be managed within forecast spending amounts noted above.
Charges against Future Budgets
As part of its Budget strategy, the Government has put in place some longer-term funding paths for particular sectors. This aids long-term planning and demonstrates the Government’s commitment to specific policies.
Charges against future Budgets do not meet the definition of a ‘risk’ under the PFA, as these items are incorporated in the fiscal forecasts. This section is provided to increase transparency about the provisions for future Budgets.
Business Tax Reform
In Budget 2007 the Government announced the Business Tax Review, a package of reforms to business taxation. This included:
· reducing the company tax rate from 33% to 30%
· reducing the maximum tax rate that applies to widely-held savings vehicles and the top portfolio investment entity cap in line with the reduced company tax rate, and
· introducing a tax credit for research and development.
The package exceeds the $1 billion per annum allowance set aside in Budget 2008 for the Business Tax Review by $129.5 million in outyears. This extra cost is being met by increasing the Budget 2008 allowance.
Charge against Budget 2008 | | 2008/09 | | 2009/10 | | 2010/11 | | 2011/12 and
Outyears | |
($million) | | | | | | | | | |
Operating | | 1,056.3 | | 1,135.4 | | 1,129.5 | | 1,129.5 | |
Capital | | 3.2 | | — | | — | | — | |
Defence Funding Package
The Defence Funding Package (DFP) is designed to provide the New Zealand Defence Force (NZDF) with the funding required to address issues identified by the Defence Capability and Resourcing Review, including capability, and maintaining equipment and reserves. Budget 2007 included $58 million per annum as the second tranche of the 10-year plan. The following table shows the additional tranches to be charged against future Budgets.
Budget to be Charged | | 2008/09 | | 2009/10 | | 2010/11 | | 2011/12 | | 2012/13 | | 2013/14 | | 2014/15 | |
($million) | | | | | | | | | | | | | | | |
Budget 2008 | | 69.1 | | 69.1 | | 69.1 | | 69.1 | | 69.1 | | 69.1 | | 69.1 | |
Budget 2009 | | | | 85.7 | | 85.7 | | 85.7 | | 85.7 | | 85.7 | | 85.7 | |
Budget 2010 | | | | | | 108.1 | | 108.1 | | 108.1 | | 108.1 | | 108.1 | |
Budget 2011 | | | | | | | | 66.9 | | 66.9 | | 66.9 | | 66.9 | |
Budget 2012 | | | | | | | | | | 14.2 | | 14.2 | | 14.2 | |
Budget 2013 | | | | | | | | | | | | 58.6 | | 54.2 | |
Budget 2014 | | | | | | | | | | | | | | 0 | |
Health – Pre-commitment
The Government has agreed that the indicative Health allocation of $750 million for Budget 2008 may be pre-committed by $53 million per annum in 2011/12 and outyears. This is to allow for Budget 2007 initiatives that may be further developed in 2007/08 and have a rising profile.
Budget to be Charged | | 2008/09 | | 2009/10 | | 2010/11 | | 2011/12 and
Outyears | |
($million) | | | | | | | | | |
Budget 2008 | | 34 | | 48 | | 53 | | 53 | |
Transport Capital Decisions
The Government has made several long-term capital commitments relating to Transport. This table notes the implications for the capital allowances beyond the forecast period.
Transport Project | | 2011/12 | | 2012/13 | | 2013/14 | | 2014/15 | | 2015/16 | | 2016/17 | |
($million) | | | | | | | | | | | | | |
Auckland | | 25 | | — | | — | | — | | — | | — | |
Wellington | | 20 | | 20 | | 20 | | 20 | | — | | — | |
Western Corridor | | 125 | | 200 | | 195 | | 10 | | 5 | | — | |
Bay of Plenty | | 25 | | 15 | | 10 | | 10 | | — | | — | |
Waikato | | 22 | | 22 | | 22 | | 22 | | 22 | | 22 | |
Time-limited Funding
Time-limited funding does not meet the definition of a ‘risk’ under the PFA, but is further information that is prepared to increase transparency about initiatives with funding profiles that cease or decrease during the forecast period.
The following table outlines those areas where initiatives have time-limited funding that decreases or ceases at some point and may potentially be extended, using a $5 million materiality threshold. Time-limited funding often relates to pilot programmes, and in some cases Multi-Year Appropriations (MYAs) if they are likely to require further funding in the future.
Vote | | Description of Initiative | | Operating Impact ($million) |
Community and Voluntary Sector | | Digital Strategy – Community Partnerships Fund | | 17 from 2005/06 to 2008/09 (MYA) |
Communications | | Digital Strategy – High-speed Connectivity for Growth | | 20 from 2005/06 to 2008/09 (MYA) |
Internal Affairs | | Significant Community-based Projects Fund | | 40 from 2005/06 to 2008/09 (MYA) |
Sport & Recreation | | Children’s and Young People’s Lifestyles | | 8 in 2006/07, 10 in 2007/08, 6 in each of 2008/09 and 2009/10 |
The following table shows the impact on the operating balance if funding were to be appropriated to maintain funding levels for these initiatives (ie, extend the initiatives beyond their current scheduled completion dates). These amounts would need to be managed within the forecast operating spending.
Operating Impact ($million) | | 2007/08 | | 2008/09 | | 2009/10 | | 2010/11 | | 2011/12 and
Outyears | |
Funding to Extend Initiatives | | 10 | | 10 | | 21 | | 27 | | 27 | |
Quantified Risks
The risks outlined in these tables would, if they eventuated, impact on the Government’s forecast new operating and/or capital spending amounts.
The Minister of Finance has yet to fully consider the quantum of these risks.
Quantified Risks as at
2 May 2007 | | Operating
Balance | | Gross
Debt | | Value of Risk | | Funding in Budget
2007 | |
| | | | | | ($ million) | | ($million) | |
New Risks | | | | | | | | | |
Foreign Affairs and Trade – Additional Baseline Funding | | Decrease | | Increase | | 440 from 2007/08 to 2010/11 | | | |
Health – National Systems Development Programme Tranche 2 | | Decrease | | Increase | | 80 operating from 2007/08 to 2010/11 and 50 capital | | | |
Justice Sector and Other Agencies – Effective Interventions | | Decrease | | — | | 150 per annum | | | |
Justice Sector Agencies – Potential Flow-on Impact of Extra Police | | Decrease | | Increase | | 119 operating from 2007/08 to 2010/11 and 19 capital | | | |
Police – International Deployment Capability | | Decrease | | — | | 30 per annum | | — | |
Revenue – Taxation of Redundancy Payments | | Decrease | | — | | 19 per annum | | — | |
Education – School Staffing Review | | Decrease | | Increase | | 15 per annum operating and 7 capital | | — | |
| | | | | | | | | |
Changed Risks | | | | | | | | | |
Corrections – Capital Projects | | Decrease | | Increase | | 1,200 capital through to 2014 and operating implications of 123 through 2010/11, 89 operating ongoing | | | |
Culture and Heritage – Broadcasting Initiatives | | Decrease | | — | | 24 per annum | | 3 per annum | |
Education – School Property | | Decrease | | Increase | | 260 capital in each of the next 4 years and operating of 14 per annum | | 203 capital and 11 operating ongoing | |
Education (Tertiary) – Vocational Training | | Decrease | | — | | 2.5 in 2008/09, 7.5 in 2009/10, 15 in 2010/11, and 20 in 2011/12 and outyears | | 71 from 2007/08 to 2010/11 | |
Finance – National Rail Network – Obligations of Rail Agreement | | — | | Increase | | 60 to 70 per annum capital from 2007/08 | | 56 capital in 2007/08 to 2010/11 | |
Finance – National Rail Network – Reconfiguration of Land | | — | | Increase | | 31 capital beyond 2007/08, unclear thereafter | | 48 capital in 2007/08 | |
Health – Indicative Funding for Budgets 2008, 2009, and 2010 | | Decrease | | — | | 716 in 2008/09, 1,502 from 2009/10, and 2,347 per annum from 2008/09 | | — | |
Quantified Risks as at
2 May 2007 | | Operating
Balance | | Gross
Debt | | Value of Risk | | Funding in Budget
2007 | |
| | | | | | ($ million) | | ($million) | |
New Zealand Defence Force – Defence – Capital Injections | | ��� | | Increase | | 213 capital from 2008/09 to 2010/11 | | 44 capital | |
Police – Increases to Police Staff | | Decrease | | Increase | | Operating of 63 in 2007/08, 105 in 2008/09, 116 in 2009/10 and 117 per annum from 2010/11 and capital of 122 from 2007/08 to 2010/11 | | 32 per annum operating and 49 capital from 2006/07 to 2010/11 | |
Research, Science and Technology – Multi-year Funding Profile | | Decrease | | — | | 30 in 2008/09 and 60 per annum from 2009/10 | | 55.5 over three years from 2007/08 | |
| | | | | | | | | |
Unchanged Risks | | | | | | | | | |
Economic Development – Venture Investment Fund | | — | | Increase | | 40 capital in 2009/10 and 2010/11 | | — | |
Education – Early Childhood Education Ratio Changes | | Decrease | | — | | 90 per annum | | — | |
Education (Tertiary) – Centres of Research Excellence | | Decrease | | Increase | | 20 capital in 2007/08 and 10 per annum operating | | — | |
New Zealand Defence Force – Sale of Skyhawks and Aermacchi Trainers | | — | | Decrease | | US$110 capital | | — | |
Unquantified Risks
The risks outlined in these tables would, if they eventuated, impact on the Government’s forecast new operating and/or capital spending amounts.
Unquantified Risks as at
2 May 2007 | | Operating
Balance | | Gross Debt | | Funding Received in Budget
2007 |
| | | | | | ($million) |
New Risks | | | | | | |
Corrections – Collective Employment Contract Negotiations | | Decrease | | — | | — |
Economic Development – Shanghai Expo 2010: New Zealand Participation | | — | | Increase | | — |
Health – Strengthening Child and Adolescent Oral Health Services | | Decrease | | — | | — |
Housing – Shared Equity Home Ownership | | — | | Increase | | — |
Housing – Wellington City Council Social Housing Assistance | | Decrease | | — | | — |
Police – Wage Negotiations | | Decrease | | — | | — |
Revenue – Reducing Compliance Costs for Small and Medium-sized Enterprises | | Unclear | | — | | — |
Unquantified Risks as at
2 May 2007 | | Operating
Balance | | Gross Debt | | Funding Received in Budget
2007 |
| | | | | | ($million) |
Revenue – International Tax Review | | Decrease | | — | | — |
Revenue – Management of Inland Revenue Lease Portfolio in Auckland and Wellington | | Decrease | | — | | — |
Revenue – Renegotiation of Double Tax Agreements | | Decrease | | — | | — |
Revenue – Tax Treatment for Relocation Expenses | | Unclear | | — | | — |
Social Development – New Zealand Superannuation and Veteran’s Pension | | Unclear | | — | | 274 from 2006/07 to 2010/11 |
Transport – Cost Guarantee for the State Highway Programme | | — | | Increase | | — |
Transport – Regional Transport Projects | | — | | Increase | | — |
Transport – Investment in Transport Infrastructure | | Decrease | | Increase | | — |
Changed Risks | | | | | | |
Economic Development – Increasing Stadium Capacity for the Rugby World Cup | | — | | Increase | | — |
Economic Development – Radio Spectrum Rights | | Increase | | — | | — |
Education (Tertiary) – Vocational Training | | Decrease | | — | | 71 from 2007/08 to 2010/11 |
Education – Year One Class Sizes | | Decrease | | Increase | | — |
Environment – Climate Change Policies | | Unclear | | Increase | | 14 from 2007/08 to 2010/11 |
Health – District Health Board Deficits | | Decrease | | Increase | | — |
Housing – State Housing Project at Hobsonville | | — | | Increase | | — |
Immigration – New Immigration Service Delivery Strategy | | Decrease | | Increase | | — |
National Library – National Library Building Extension | | — | | Increase | | — |
Revenue – Life Insurance | | Unclear | | — | | 25 per annum (reduced revenue) |
| | | | | | |
Revenue – Tax Incentives for Giving to Charities and Other Non-Profit Organisations | | Unclear | | — | | 15 in 2008/09, 25 per annum from 2009/10 (reduced revenue) |
Social Development – New Zealand Superannuation and Veteran’s Pension – Rate Adjustment | | Decrease | | | | |
Transport – Extending the State Highway Construction and Revenue Guarantee | | — | | Increase | | — |
Unquantified Risks as at
2 May 2007 | | Operating
Balance | | Gross Debt | | Funding Received in Budget
2007 |
| | | | | | ($million) |
Unchanged Risks | | | | | | |
Conservation – Lease of Taupo Property Rights from Tuwharetoa | | Decrease | | — | | — |
Education – Schools ICT Network Infrastructure Upgrade | | Decrease | | Increase | | — |
Education (Tertiary) – Wananga Capital Injections | | — | | Increase | | — |
Education (Tertiary) – Tertiary Education Institutions – Capital Injections | | — | | Increase | | — |
Education (Tertiary) – Tertiary Student Support Changes | | Decrease | | Increase | | Operating expenditure of 29 from 2007/08 through to 2010/11; capital savings of 16 through 2007/08 to 2010/11 |
Finance – Crown Overseas Properties | | — | | Increase | | — |
Finance – Development of Rail Land | | Decrease | | Increase | | — |
Finance – National Rail Access Agreement Amendments | | Unclear | | Unclear | | — |
Finance – SOE Long-term Hold Reviews | | — | | Decrease | | — |
Fisheries – Civilian Maritime Aerial Surveillance | | Decrease | | Increase | | — |
Fisheries – Māori Interest in Marine Farming | | Decrease | | — | | — |
Justice – Strengthening the National Court Infrastructure | | Decrease | | Increase | | — |
Revenue – Rebuild of the Student Loan IT System | | Decrease | | Increase | | — |
Revenue – Working for Families Tax Credits Indexation and Review of Rates | | Decrease | | — | | — |
Social Development / Housing – Accommodation Supplement Review | | Decrease | | Increase | | — |
Social Development – Working New Zealand: Work-focused Support | | Decrease | | — | | — |
Social Development – New Zealand Superannuation – International Portability Issues | | Unclear | | — | | — |
Risks Removed Since the 2006 Half Year Update
The following risks have been removed since the 2006 Half Year Economic and Fiscal Update:
Expired Risks | | Reason | | Funding Received |
| | | | ($million) |
Economic Development – Radio Spectrum Rights | | This is now a risk in Vote Communications and is incorporated in that Vote below. | | — |
Education (Tertiary) – Tertiary Education Expenditure Review | | Review process now complete | | — |
Education (Tertiary) – Partnerships for Excellence | | Ministers decided to reprioritise the contingency set aside for another Partnerships round | | — |
Justice – New Supreme Court – Cost Escalation | | This initiative has now been funded | | 45 capital; 4 per annum operating |
Revenue – Extending the Specified Superannuation Contribution | | This initiative has now been funded | | 17 in 2007/08, 18 in 2008/09, 19 in 2009/10, and 20 in 2010/11 and outyears |
Revenue – International Financial Reporting Standards | | There are no material fiscal impacts | | — |
Revenue – Business Tax Review | | This is being funded through Budgets 2007 and 2008 | | — |
Revenue – Taxation of Partnerships Review | | There are no material fiscal impacts | | — |
State Services Commission – State Sector Retirement Savings Scheme | | Superseded by decisions taken regarding KiwiSaver | | — |
Social Development – Child, Youth, and Family Services – Reviewing Levels of Funding and Service Delivery | | Any risk will be managed within baselines | | — |
Statement of Fiscal Risks
Conservation - - Lease of Taupo Property Rights from Tuwharetoa (unchanged, unquantified risk)
On 18 May 2005, the Government agreed to enter into negotiations with Tuwharetoa Māori Trust Board following legal clarification of property rights relating to Lake Taupo. The Crown is considering leasing certain property rights from the Tuwharetoa Māori Trust Board in order to resolve current disputes. Negotiations are ongoing and the outcome is not yet known. This would decrease the operating balance.
This risk is unquantified as disclosure could compromise the Crown in negotiations.
Corrections - - Capital Projects (changed, quantified risk)
The Government is considering the asset management of current Corrections facilities, and requirements for increased capacity to meet the continued forecast prisoner growth in the foreseeable future, including the replacement of Mt Eden Prison. Estimated costs of upgrade and expansion are $1.2 billion capital through to 2014, with operating implications of $123 million over the forecast period, and ongoing operating implications of $89 million from 2013/14. These estimates are based on the 2006 Justice Sector Prisoner Forecast which includes the impact of 1,000 Police and Effective Intervention decisions to date, and in response to the 2006 Capital Asset Management Review. Capital injections would increase gross debt while operating funding would decrease the operating balance.
The Minister of Finance has yet to fully consider the quantum of this risk.
Source: Department of Corrections
Corrections - - Collective Employment Contract Negotiations (new, unquantified risk)
The Government will be entering into negotiations with the Public Service Association and the Corrections Association of New Zealand to settle six new collective employment agreements. Any additional funding would decrease the operating balance. This risk is unquantified as disclosure may compromise the Crown in negotiations.
Culture and Heritage - Broadcasting initiatives (changed, quantified risk)
On 3 February 2005, the Government released a Public Broadcasting Programme of Action. The Programme contains a set of priorities to guide public broadcasting policy over the six-year period to 2009/10, and a series of proposals to give effect to these priorities. The Programme as a whole (if fully implemented) would have total ongoing operating costs rising to around $44 million in 2009/10. Broadcasting initiatives totalling $11 million, $6 million and $3 million per annum have been included in Budgets 2005, 2006 and 2007, respectively. The Government may consider individual proposals relating to the Programme for the remaining $24 million per annum over the next three Budgets. If funded, these would decrease the operating balance.
The Minister of Finance has yet to fully consider the quantum of this risk.
Source: Ministry for Culture and Heritage
Economic Development - Venture Investment Fund (unchanged, quantified risk)
In Budget 2006, the Government agreed to additional investment commitments in the Venture Investment Fund of $60 million from 2006/07 to 2008/09. The Government is also considering further commitments of $40 million over two years (2009/10 and 2010/11) in Budget 2009. This depends on the results of the evaluation of the Venture Investment Fund scheduled for completion by 31 March 2009. This would increase gross debt.
The Minister of Finance has yet to fully consider the quantum of this risk.
Source: Ministry of Economic Development
Economic Development - Increasing Stadium Capacity for the Rugby World Cup (changed, unquantified risk)
Eden Park in Auckland requires redevelopment in order to increase stadium capacity ahead of the Rugby World Cup in 2011. The latest proposal is estimated to cost $170 to $190 million. The Government is considering meeting a portion of the redevelopment costs, which would increase gross debt.
Economic Development - Radio Spectrum Rights (unchanged, unquantified risk)
The Government sets the processes for the renewal or auction of property rights to radio spectrum in consultation with industry. Any revenue from sale of rights would increase the operating balance by the full amount of the new sales. Offers for rights of renewal to existing owners of spectrum rights are set approximately five years in advance of rights expiring from 2010 onwards. Owners of spectrum rights will have a choice about whether to renew them after 2010, so expected revenue from sale of renewal rights is not reflected in current forecasts of revenue.
Economic Development - Shanghai Expo 2010: New Zealand Participation (new, unquantified risk)
The Government has announced New Zealand’s participation in the Shanghai Expo 2010 and officials are in the process of developing a detailed proposal for the design and construction of a pavilion to be used at the agreed site for New Zealand at the Expo. The Government is considering meeting part of the overall cost of New Zealand’s participation. However, the amount that the Government contributes will depend on the level of industry contribution obtained and the development of a more definitive budget for New Zealand’s participation at the Expo. Any contribution from the Government would increase gross debt.
Education - - Early Childhood Education Ratio Changes (unchanged, quantified risk)
The Government has committed to improving adult to child ratios as part of the Early Childhood Education Strategic Plan, and consulted on options for new ratios in 2004 and 2005. In October 2006, Cabinet agreed to initial changes to ratios to implement part of one option consulted on, to take place from July 2009 and 2010. The Government has also communicated that further changes are being considered, through a Ministry of Education newsletter. The current funding is thought to be insufficient for further changes so additional funding of approximately $90 million per annum will be considered as part of the budget process. Any increased funding would reduce the operating balance.
The Minister of Finance has yet to fully consider the quantum of this risk.
Source: Ministry of Education
Education (Tertiary) - Centres of Research Excellence (unchanged, quantified risk)
The Government is considering providing additional capital funding of up to $20 million and operating funding of $10 million per annum to establish up to two new Centres of Research Excellence and provide further funding to existing centres. This would decrease the operating balance and increase gross debt.
The Minister of Finance has yet to fully consider the quantum of this risk.
Source: Tertiary Education Commission
Education (Tertiary) - Vocational Training (changed, quantified risk)
The Government is considering a number of policies regarding the expansion of vocational training. One of these is to have 250,000 people participating in industry training. The total number of people participating in industry training in 2005 was around 160,000. The cost of funding the additional 90,000 places required to meet the target would decrease the operating balance.
In Budget 2007, the Government provided around $4.5 million a year from 1 January 2008 for a tertiary education organisation component for ITO funding. The Government is also allocating an additional $53 million over four years for industry training volume growth to enhance the skills of the workforce as part of the Business Tax Review. This additional funding would support industry training participation of approximately 220,000 trainees in 2011. To achieve a participation of 250,000 trainees in 2011, the Industry Training Fund baseline would need to increase by approximately $2.5 million in 2008/09, $7.5 million in 2009/10, $15 million in 2010/11 and $20 million in 2011/12 and outyears.
Education - Schools ICT Network Infrastructure Upgrade (unchanged, unquantified risk)
Budget 2006 provided $4 million in capital and $0.6 million in associated operating funding for a partial roll-out of the Schools ICT Network Infrastructure Upgrade, as part of the School Property Business Case 2006/07. The roll-out is intended to assist schools to meet the costs of upgrading their computer networks to meet the new IT infrastructure standards. The Government will consider further roll-out in future budgets. This would decrease the operating balance and increase gross debt.
This risk is unquantified as disclosure could compromise the Crown in negotiations.
Education (Tertiary) - Wananga Capital Injections (unchanged, unquantified risk)
The Government is currently negotiating with Te Wananga o Raukawa over settlement of its Waitangi Tribunal claim. The Waitangi Tribunal has recommended that the Wananga be compensated for capital expenditure it has incurred on facilities to date, and be provided with funding to bring its facilities up to a standard comparable with other tertiary institutions, and meet additional capital requirements. Negotiations are also taking place
with Te Whare Wananga o Awanuiarangi in relation to an outstanding item from an original settlement.
This risk is unquantified as disclosure could compromise the Crown in negotiations with the Wananga, but any capital injections would increase gross debt.
Education - - School Staffing Review (new, quantified risk)
The Government is considering this initiative, based on the recommendations of the School Staffing Review Group. Most of the recommendations have been implemented in previous budgets. The cost of implementing the remaining component would cost up to $15 million per annum in operating funding and around $7 million in capital funding. The Government will consider implementation of the remaining component in future budgets.
This proposal would increase gross debt and decrease the operating balance.
The Minister of Finance has yet to fully consider the quantum of this risk.
Source: Ministry of Education
Education - - Year One Class Sizes (changed, unquantified risk)
The Government will consider providing more teachers to further reduce Year 1 class sizes in future budgets. Any future increase in teachers for this purpose would decrease the operating balance and increase gross debt, but the precise costs have yet to be quantified as the phasing has yet to be determined.
Education - - School Property (changed, quantified risk)
Additional capital injections for school accommodation will be required in future years to meet roll growth and to establish new schools, and could cost up to $260 million in each of the next four years with a corresponding increase in debt. In addition to capital injections, consequential operating costs building up by approximately $14 million per annum are likely to be incurred, which would decrease the operating balance.
The Minister of Finance has yet to fully consider the quantum of this risk.
Source: Ministry of Education
Education (Tertiary) - Tertiary Education Institutions – Capital Injections (unchanged, unquantified risk)
The Government may consider making loans or capital injections to tertiary education institutions where ongoing educational provision or financial viability are at risk.
The Government may also consider making capital injections to tertiary education institutions when a strategic investment to support the development of their infrastructure is warranted.
The provision of capital injections would increase gross debt, but the precise impact is unclear as it would depend on progress made by institutions in managing their pressures, and decisions taken by Government.
Capital injections were appropriated for a number of Tertiary Education Institutes in 2006/07 to address immediate viability or long-term sustainability issues, including $14.5 million to merge the remaining two Colleges of Education with their universities, $7 million in additional loans to WITT to manage its cash flow pressures until the end of 2007, and $10 million to UCOL (of which $7.2 million may be converted to equity). Some existing Crown loans were also restructured to be converted to equity, including $12.8 million for WelTec and $20 million for Te Wananga o Aotearoa to address a Treaty of Waitangi settlement.
Education (Tertiary) - Tertiary Student Support Changes (unchanged, unquantified risk)
The Government is considering increasing eligibility for student allowances over the parliamentary term. The impact of these changes is likely to reduce the operating balance and increase gross debt, but the quantum is unclear as it would depend upon the options chosen.
Budget 2006 provided operating funding of $10.6 million and capital savings of $85.4 million over four years to increase the number of bonded merit scholarships to 1,000, increase the student allowances parental income thresholds, add PhDs and professional doctorates to the list of recognised long programmes and align student support with funded qualifications.
Budget 2007 provided around $29 million in operating funding and around $16 million in capital savings over the forecast period to inflation adjust the student allowance personal income threshold, increase the student allowance parental income threshold, expand the Step Up scholarship programme, and strengthen the Ngariumu VC and 28th Māori Battalion Memorial Scholarships.
Further proposals to increase eligibility for student allowances are likely to be considered in future budgets.
Environment - - Climate Change Policies (changed, unquantified risk)
Work on climate change policies is currently underway. The impact on the operating balance and debt is unclear, as it will depend on the outcomes of the various work streams underway.
The forecasts make provision for New Zealand’s liability under the Kyoto Protocol, currently estimated at 41.2 million tonnes of carbon dioxide equivalent. The Government has not, at this point, taken a decision on whether to finance part of this liability through purchase of Kyoto-compliant emission units on the international market. However, should a purchasing policy be pursued, the commensurate funding required would increase gross debt while having a neutral effect on net worth.
Finance - - Crown Overseas Properties (unchanged, unquantified risk)
The Government is considering options relating to the continued use of certain Crown overseas properties.
The risk is unquantified as disclosure could compromise any negotiations the Crown may enter, but any additional operating funding would decrease the operating balance, and/or any additional capital funding would increase gross debt.
Finance - - Development of Rail Land (unchanged, unquantified risk)
The Government is considering options for the development of rail land.
The risk is currently unquantified as disclosure could damage the Government’s financial interests, but any additional operating funding would decrease the operating balance, and/or any additional capital funding would increase gross debt.
Finance - National Rail Access Agreement Amendments (unchanged, unquantified risk)
The Government is considering options for amending the National Rail Access Agreement between Toll and ONTRACK. Any impact on the operating balance or gross debt would depend on the option chosen.
This risk is unquantified as disclosure could compromise the Crown in negotiations.
Finance - National Rail Network - Obligations of Rail Agreement (changed, quantified risk)
The Government has committed $306 million between 2004/05 and 2007/08 to upgrade and renew the national rail network (including $56 million agreed in Budget 2007). Additional funding for as yet un-scoped projects may be required in 2007/08. Beyond this, expenditure of around $60 to $70 million per annum may also be required from 2008/09 for renewals, with additional funding on top of this for upgrades, but the exact amount will depend on decisions yet to be made. Under the National Rail Access Agreement, additional funding of this nature would generally be recovered through track access fees. Any additional funding would increase gross debt.
The Minister of Finance has yet to fully consider the quantum of this risk.
Source: The Treasury
Finance - - National Rail Network – Reconfiguration of Land (changed, quantified risk)
The Agreement for Sale and Purchase of Rail Network and Associated Assets between the Crown and Toll provides for Toll to reconfigure its operations to enable the release of land it occupies to the Crown (ONTRACK) for other uses. ONTRACK requires funding from the Crown for the reconfiguration costs and the settlement of the land value with Toll. Funding of approximately $48 million to ONTRACK for land release in 2007/08 was agreed in Budget 2007. Further funding of around $31 million may be required in 2008/09, with unquantified amounts in years beyond that. The exact amounts of funding will depend on decisions yet to be made, but any additional funding would increase gross debt.
The Minister of Finance has yet to fully consider the quantum of this risk.
Source: The Treasury
Finance - - State-Owned Enterprise Long-term Hold Reviews (unchanged, unquantified risk)
To implement its long-term hold ownership policy, the Government is conducting reviews of each State-Owned Enterprise (SOE). These reviews are examining the strategic direction for each SOE and therefore the appropriate capital structure to support the individual SOE’s strategy. One possible outcome of current reviews is that some capital could be returned to the Crown. This may be in the form of a special dividend, which would decrease gross debt.
Fisheries - - Māori Interest in Marine Farming (unchanged, unquantified risk)
The Māori Commercial Aquaculture Claims Settlement Act 2004 addresses Māori claims in commercial marine farming space from 21 September 1992 to 31 December 2004 (pre-commencement space) by providing Iwi with 20% equivalent space. This obligation is to be met through three possible options: the provision of additional new space; Crown purchase of existing farms from 2008; or provision of the financial equivalent of space from 2013.
Under the Act, any Māori claim relating to new aquaculture space after 31 December 2004 will be met by the provision of 20% of the new space.
To the extent that financial compensation or Crown purchase of existing farms is necessary to address Māori interests in pre-commencement space (as opposed to using new space), this would decrease the operating balance. This risk is unquantified as the amount or timing of any funding is unclear. In addition, disclosure could compromise the Crown in negotiations with either commercial marine farm owners or Iwi.
Fisheries - - Civilian Maritime Aerial Surveillance (unchanged, unquantified risk)
The Government is considering options to provide increased maritime aerial surveillance for civilian agencies in the short to medium range. Options include delivery of a range of different surveillance capabilities by either military or commercial providers. The amount of funding required would depend on the option chosen, if any. Any capital injections required would increase gross debt, while operating funding would decrease the operating balance.
The risk is unquantified as the amount or timing of any funding is unclear.
Foreign Affairs and Trade - Additional Baseline Funding (new, quantified risk)
The Government is considering funding an additional $440 million of operating funding and associated capital funding related to the ‘Response to Foreign and Trade Policy Changes’ bid, including the opening of new posts. The additional operating funding would decrease the operating balance and associated capital funding would increase gross debt.
The Minister of Finance has yet to fully consider the quantum of this risk.
Source: Ministry of Foreign Affairs and Trade
Health - National Systems Development Programme Tranche 2 (new, quantified risk)
The Ministry of Health is developing and implementing the National Systems Development Programme (NSDP). NSDP is a four-year information technology project for the central health payment systems and national data collections. The project has been divided into two tranches with a decision on whether to proceed with Tranche 2 expected in July 2008. It is anticipated that implementation of Tranche 2 will require additional capital funding of around $50 million and operating funding of $80 million over four years from 2008/09 to 2011/12. This would decrease the operating balance and increase gross debt.
The Minister of Finance has yet to fully consider the quantum of this risk.
Source: Ministry of Health
Health - Indicative Funding for Budgets 2008, 2009 and 2010 (changed, quantified risk)
The Government is considering indicative operating allocations of $750 million, $800 million and $850 million for Budgets 2008, 2009 and 2010 respectively. These amounts indicate the likely level of increased funding to be provided to Vote Health in future budgets and to assist the Minister of Health to plan spending priorities over the period. The final allocations will depend on economic and fiscal conditions at the time of each budget. Finalising the amounts and details of how these allocations will be spent will be subject to normal budget processes.
The Government has also agreed that the indicative allocation for Budget 2008 above may be pre-committed up to $53 million per annum in 2010/11 and outyears. This was shown in the Charges against Future Budgets section of this chapter. The operating balance would be decreased by the totals as follows:
Budget to be Charged | | 2008/09 | | 2009/10 | | 2010/11 | | 2011/12 and
Outyears | |
($million) | | | | | | | | | |
Budget 2008 | | 716 | | 702 | | 697 | | 697 | |
Budget 2009 | | — | | 800 | | 800 | | 800 | |
Budget 2010 | | — | | — | | 850 | | 850 | |
The Minister of Finance has yet to fully consider the quantum of this risk.
Source: Ministry of Health
Health - Strengthening Child and Adolescent Oral Health Services (new, unquantified risk)
The Government has agreed to provide capital funding to District Health Boards for new infrastructure for strengthening child and adolescent oral health services. This capital investment is likely to result in additional operating expenditure, which may be sought from funding to be agreed in Budget 2008.
Health - District Health Board Deficits (changed, unquantified risk)
Draft District Annual Plans from Whanganui, West Coast, Southland and Waitemata District Health Boards (DHBs) indicate projected operating deficits in 2007/08. The Government does not view DHB deficits as acceptable and cost containment strategies are in place.
Any deficits would potentially decrease the operating balance and/or increase gross debt. Specific potential pressures for DHBs include wage bargaining and financing costs of capital projects.
This risk has changed since the 2006 Half Year Economic and Fiscal Update to take into account the new projections of DHB deficits.
Housing - Hobsonville: Additional Land Purchase (changed, unquantified risk)
The Minister of Finance and Minister of Housing have approved the business case for the development of land at Hobsonville. For the development to be completed a further section of land needs to be acquired from the Waitakere City Council and the New Zealand Defence Force. This initiative is for a loan on commercial terms from the New Zealand Debt Management Office which will have market interest and be repaid as the lots of land are sold off. This would increase gross debt.
Housing - Shared Equity Home Ownership (new, unquantified risk)
The Government has announced it will look into possibilities for assisting home ownership in areas that appear unaffordable. It has been investigating the possibility of a shared equity scheme and has announced it is likely to make a decision in 2008. It is currently proposed that the Government would take a 10% to 30% stake in a property and would receive an equivalent portion of the sale proceeds when the owners move. This initiative is for a pilot study of 500 loans over two years to assess the impact of a shared equity scheme on potential home buyers and the housing market as a whole. This would increase gross debt.
Housing - Wellington City Council Social Housing Assistance (new, quantified risk)
The Government is currently in negotiations with the Wellington City Council to provide financial assistance for improving the quality of its social housing portfolio. High-level parameters were agreed by Cabinet, including a funding limit of $220 million over a 10 to 15-year development period, and the details of the assistance are now being worked through by Council and government officials. This would decrease the operating balance.
The Minister of Finance has yet to fully consider the quantum of this risk.
Source: Department of Building and Housing
Immigration - New Immigration Service Delivery Strategy (changed, unquantified risk)
The Government is in the process of developing options for a new immigration service delivery strategy that would allow better management of the risk surrounding immigration decision-making and delivering immigration services. Options are still being developed, and
are likely to be considered later in 2007. A portion of the additional funding is expected to be funded by third party revenue and the rest would reduce the operating balance and increase gross debt.
Justice - Strengthening the National Court Infrastructure (unchanged, unquantified risk)
The Government is considering options to ensure that Christchurch’s court facilities are able to adequately deliver court and associated justice services to the region. This risk is unquantified as disclosure could compromise any commercial property negotiations the Crown may enter into. Any additional operating funding would decrease the operating balance and any additional capital would increase gross debt.
Justice Sector and Other Agencies - Effective Interventions (new, quantified risk)
As part of a comprehensive approach to reducing crime and the pressures on the prison population, the Government is considering measures to address the precursors of crime, and measures to reduce re-offending. The measures focus on early interventions for vulnerable children, youth offending, restorative justice, preventing crime in local communities, reintegrating offenders, and drug and alcohol treatment for offenders.
Funding of $37 million per annum was approved in 2006. Further operating funding to implement the approach could be up to $150 million per annum, depending on the specific options chosen. This would decrease the operating balance.
The Minister of Finance has yet to fully consider the quantum of this risk.
Source: Ministry of Justice
Justice Sector Agencies - Potential Flow-on Impact of Extra Police (new, quantified risk)
The addition of 1,000 Police will result in additional activity in other justice sector agencies (eg, the Ministry of Justice and the Department of Corrections). Excluding the costs associated with additional prison beds, the Government estimates additional operating costs of $119 million over the forecast period with an ongoing cost of $34 million per annum, and capital cost of $19 million over the forecast period. This would decrease the operating balance and increase gross debt.
The Minister of Finance has yet to fully consider the quantum of this risk.
Source: Ministry of Justice
National Library - National Library Building Extension (changed, unquantified risk)
The Government is considering funding an extension to the National Library building, subject to a fully developed and costed proposal.
This risk remains unquantified as disclosure could compromise the Crown in negotiations, but any additional funding would increase gross debt.
New Zealand Defence Force - Capital Injections (changed, quantified risk)
Implementing the Government’s decisions on the future structure of the NZDF will involve a series of capital acquisitions across all three armed services and for HQNZDF to achieve the required capability upgrades. The Government has agreed to a capital injection of up to $1.244 billion over the 10-year period from 2002 to 2012.
Of the $1.244 billion, $1.031 billion has been agreed with the remaining $213 million likely to be required within the forecast period. The actual expenditure profile will depend on the specification and timing of the individual projects, the contracted prices, and the prevailing exchange rate at the time of purchase.
Any further capital injections would increase gross debt.
The Minister of Finance has yet to fully consider the quantum of this risk.
Source: New Zealand Defence Force
New Zealand Defence Force - Sale of Skyhawks and Aermacchi Trainers (unchanged, quantified risk)
As a result of the Government’s decisions on the future structure of the NZDF, NZDF has signed an agreement with Tactical Air Services Inc for the sale of the Skyhawks and Aermacchi trainers for US$110 million. A formal contract has yet to be signed, but proceeds from the sale would decrease gross debt and increase the operating balance.
The Minister of Finance has yet to fully consider the quantum of this risk.
Source: New Zealand Defence Force
Police - Wage Negotiations (new, unquantified risk)
The Police collective employment agreements expire on 30 June 2008. The Government will be entering into negotiations with police service organisations to settle new collective employment agreements prior to the expiration date of the current agreements. Any additional funding would decrease the operating balance. This risk is unquantified as disclosure may compromise the Crown in negotiations.
Police - International Deployment Capability (new, quantified risk)
The Government is considering options to ensure that the New Zealand Police has sufficient capability to manage requests for assistance overseas. The funding required depends on the quantity of personnel and the funding structure associated with the option chosen, but could be in the order of $30 million operating per annum. Any additional operating funding would decrease the operating balance.
The Minister of Finance has yet to fully consider the quantum of this risk.
Source: New Zealand Police
Police - Increases to Police Staff (changed, quantified risk)
The Government has committed to funding an additional 1,000 sworn Police and 250 non-sworn Police staff over Budgets 2006 to 2008. The Government will consider further increases in future Budgets with a view to achieving police officer ratios comparable with those of Australia by 2010. Budget 2007 included $49 million per annum operating in outyears; and $10 million capital over the forecast period to provide for the second tranche of additional police (including 90 non-sworn staff and some associated infrastructure costs). The Government intends to roll out the third tranche in Budget 2008. The indicative operating costs are $45 million in 2009/10 and out years. Indicative additional capital costs associated with the second and third tranches are $97 million. Additional capital injections would increase gross debt and additional operating funding would decrease the operating balance.
The Minister of Finance has yet to fully consider the quantum of this risk.
Source: New Zealand Police
Research, Science and Technology - Multi-year Funding Profile (changed, quantified risk)
As part of Budget 2006, the Government signalled its broad intention to move towards a medium-term focus for investment in research, science and technology by indicating increases in the order of $30 million per annum in Budgets 2008 and 2009, subject to the context of each Budget and the Government’s overall fiscal strategy. In Budget 2007, there is $55.5 million of new investment in research, science and technology over the three years from 2007/08 to 2009/10. These increases would decrease the operating balance.
The Minister of Finance has yet to fully consider the quantum of this risk.
Source: Ministry of Research, Science and Technology
Revenue - Rebuild of the Student Loan IT System (unchanged, unquantified risk)
The Government is considering options for redesigning the student loans IT system. The redesign will enable greater efficiency and enhanced student services while delivering increased integrity of the system, produce greater information to inform policy decisions and increased flexibility for future policy changes. This risk is unquantified as disclosure could compromise the Crown in negotiations. This would decrease the operating balance and/or increase gross debt.
Revenue - Working for Families Tax Credits Indexation and Review of Rates (unchanged, unquantified risk)
The Working for Families package included a commitment to index Working for Families Tax Credit rates and abatement thresholds, once inflation beyond 1 April 2007 cumulatively exceeds 5%. Legislation also requires a review of the amounts of the In-Work Tax Credit and Parental Tax Credits to be undertaken no later than June 2008. This policy cannot be costed with sufficient accuracy until the reviews are completed, but the indexation changes would reduce the operating balance.
Revenue - Reducing Compliance Costs for Small- and Medium-sized Enterprises (new, unquantified risk)
The Government is considering measures to simplify the tax rules for small- and medium-sized enterprises, with a view to issuing a discussion document later in 2007. The potential impact on the operating balance is unknown at this stage, as it would depend on the nature and scope of any measures that are subsequently pursued.
Revenue - Taxation of Redundancy Payments (new, quantified risk)
The Government will be considering changes to the taxation of redundancy payments. The reduction in the operating balance would depend on what proposals are finally approved, the details of the legislation, and the date of application. However, the estimated fiscal costs of the options considered thus far range from $10 to $19 million per annum. This would decrease the operating balance.
The Minister of Finance is yet to fully consider the quantum of this risk.
Source: Inland Revenue Department
Revenue - International Tax Review (new, unquantified risk)
In Budget 2007 the Government announced the major features of the international tax reform package, which would introduce a tax exemption for the active income of Controlled Foreign Companies. These announcements followed the release of a Government discussion document in December 2006. The cost of the reform package is uncertain as many detailed design decisions have yet to be made but it would reduce the operating balance.
Revenue - Management of Inland Revenue Lease Portfolio in Auckland and Wellington (new, unquantified risk)
Inland Revenue is currently exploring options to consolidate its lease portfolio in both Wellington and Auckland. As a large tenant in each market, consolidation provides an opportunity to realise organisational efficiencies. Inland Revenue has identified a number of options following a formal request for proposals however the Government has not yet considered these. This risk is unquantified as disclosure could compromise the Crown in negotiations. This would decrease the operating balance.
Revenue - Renegotiation of Double Tax Agreements (new, unquantified risk)
A Government discussion document released in December 2006 considered the case for negotiating lower rates of Non-Resident Withholding Tax (NRWT) in New Zealand’s Double Tax Agreements (DTAs). Subsequently, it has been announced that the renegotiation of the New Zealand and Australia DTA is expected to commence shortly. Although any effect on the operating balance will depend on the outcome of bilateral treaty negotiations, to the extent that lower rates are agreed, this will likely have the effect of decreasing the operating balance.
Revenue - Tax Treatment for Relocation Expenses (new, unquantified risk)
The Government is currently reviewing the tax treatment of employees’ relocation expenses. The potential impact on the operating balance is unclear.
Revenue - Life Insurance (changed, unquantified risk)
The Government is considering changes to the tax rules in respect of life insurance, including ensuring consistency of the taxation of life insurers’ savings products with similar products of other savings vehicles. The Government has agreed and funded the first phase of the proposals, which relate to partially extending the Portfolio Investment Entity (PIE) tax rules to the unit-linked savings products of life insurers, and correcting an anomaly in the fair dividend rate rules as they apply to life insurers. The estimated reduction in the operating balance in respect of this first phase is $25 million per annum. The second phase of reform of the life insurance tax rules, relating to risk insurance and further integration of life products into the PIE rules, is still under development. Accordingly, the impact on the operating balance of this second phase cannot yet be quantified.
Revenue - Tax Incentives for Giving to Charities and Other Not-for-profit Organisations (changed, unquantified risk)
Under the Confidence and Supply Agreement with United Future the Government is considering further issues related to encouraging giving, including pre-tax giving, a gift aid scheme, and deductibility of non-monetary donations. Budget 2007 includes increases to tax relief received by individuals, companies, and Māori authorities for charitable donations made. The Government is also considering the tax treatment of reimbursements and honoraria paid to volunteers. The impact on the operating balance is unclear and would depend upon the proposals that are finally developed and approved.
Social Development - New Zealand Superannuation and Veteran’s Pension – Rate Adjustment (changed, unquantified risk)
The Government has ensured that the net married couple rate of New Zealand Superannuation (NZS) applying for the tax year from 1 April 2007 is equivalent to 66% of the net average ordinary time weekly wage (known as the 66% wage floor). This also applies to the Veteran’s Pension, which is set at the same rates as NZS. The Government will review each year the level to be set for the following tax year. Under the 2007 Budget Update forecasts CPI-indexation of NZS rates is predicted to be enough to maintain the 66% wage floor next year. However, because the rates of NZS applied on 1 April 2008 will depend on the actual CPI and wage statistics that occur, there is a risk that maintaining the 66% wage floor at that time will exceed the cost of CPI-indexing. This would decrease the operating balance.
Social Development - New Zealand Superannuation – International Portability (unchanged, unquantified risk)
The Government is considering the results of a review of arrangements for the payment of New Zealand Superannuation (NZS) to New Zealanders residing overseas and the treatment of overseas pensions paid to recipients of New Zealand pensions and welfare
benefits. The impact on the operating balance is unclear, as proposals are still being developed. Any additional funding would decrease the operating balance.
Social Development - Working New Zealand: Work-focused Support (unchanged, unquantified risk)
Working New Zealand: Work-focused Support is a package of policy and operational changes aimed at simplifying the benefit system and enhancing the opportunities for beneficiaries to participate in the labour market. The first stage, already underway, focuses on getting services and support in place to help people move into work and stay employed. The Government is considering further options and costs to simplify the benefit system. The next stages will be submitted for consideration in future Budgets. The remaining proposals are still being developed, but any additional funding would decrease the operating balance.
Social Development / Housing - Accommodation Supplement Review (unchanged, unquantified risk)
The Government is reviewing the Accommodation Supplement to assess how well it is performing as an income support and housing assistance policy. If the review identifies a need to adjust the Accommodation Supplement, the Government will consider policy options in future Budgets. While the amounts are unclear and would depend on the policy options chosen, any additional operating funding would decrease the operating balance.
Transport - Extending the State Highway Construction and Revenue Guarantee (unchanged, unquantified risk)
The Government has agreed to extend the revenue guarantee for the National Land Transport Programme and the State Highway Plan guarantee from five years to six. The Crown is still considering how and when to add a sixth year to the current five-year State Highway Plan guarantee and National Land Transport Programme revenue guarantee.
Transport - Cost guarantee for the State Highway Programme (new, unquantified risk)
In Budget 2006 the Government agreed to provide a cost guarantee for a five-year State Highway Construction Programme. In Budget 2007 funding is being provided to cover estimated cost escalation in the State Highway Construction Programme between 2006/07 and 2007/08. Decisions on funding for 2008/09 and beyond have been deferred until Budget 2008, pending an update of the State Highway Construction Programme (including extension to a six-year guarantee period) which is scheduled to be undertaken in 2007/08.
Transport - Regional Transport Projects (new, unquantified risk)
The Government is considering providing funding for a number of regional transport projects in Auckland and Wellington. It is envisaged that these projects will be debt funded and repaid via a regional fuel tax in those regions. This would increase gross debt.
Transport - Investment in Transport Infrastructure (new, unquantified risk)
The Government has commissioned a review looking at the ‘Next Steps in the Transport Sector’. One of the objectives of this review is to look at ways to better link demand and expenditure. Officials have been asked to consider a range of options, including changes to Fuel Excise Duty as a possible option to achieve this. This would decrease the operating balance and increase gross debt.
Contingent Liabilities
Contingent liabilities are costs that the Crown will have to face if a particular event occurs. Typically, contingent liabilities consist of guarantees and indemnities, legal disputes and claims, and uncalled capital. The contingent liabilities facing the Crown are a mixture of operating and balance sheet risks, and they can vary greatly in magnitude and likelihood of realisation. In general, if a contingent liability were realised it would reduce the operating balance and net worth, and increase Crown debt. However, in the case of contingencies for uncalled capital, the negative impact would be restricted to Crown debt.
Where contingent liabilities have arisen as a consequence of legal action being taken against the Crown, the amount shown is the amount claimed and thus the maximum potential cost. It does not represent either an admission that the claim is valid or an estimation of the possible amount of any award against the Crown.
Only contingent liabilities involving amounts of over $10 million are separately disclosed. Contingent liabilities below $10 million are included in the “other quantifiable contingent liabilities” total. Comparatives have been adjusted where appropriate to align with the disclosure of new “material” contingent liabilities. The total amount of prior years’ contingent liabilities remains unchanged.
Contingent liabilities have been stated as at 31 March 2007, being the latest set of published contingent liabilities.
Details of each of the following contingent liabilities can be accessed from the Treasury website at www.treasury.govt.nz/forecasts/befu/2007/.
Quantifiable Contingent Liabilities
| | Status(12) | | ($ million) | |
Guarantees and indemnities | | | | | |
Cook Islands – Asian Development Bank loans | | Changed | | 13 | |
Indemnification of receivers and managers – Terralink Limited | | Unchanged | | 10 | |
Indemnification of touring exhibitions | | Unchanged | | 349 | |
Ministry of Justice – Treaty settlement, tax liabilities | | Unchanged | | 105 | |
Ministry of Transport – funding guarantee | | Unchanged | | 10 | |
Post Office Bank – guaranteed deposits | | Unchanged | | 10 | |
Guarantees and indemnities of SOEs and Crown entities | | Unchanged | | 19 | |
Other guarantees and indemnities | | Changed | | 5 | |
| | | | 521 | |
Uncalled capital | | | | | |
Asian Development Bank | | Changed | | 1,039 | |
European Bank for Reconstruction and Development | | Unchanged | | 13 | |
International Bank for Reconstruction and Development | | Changed | | 1,151 | |
| | | | 2,203 | |
Legal proceedings and disputes | | | | | |
Health – legal claims | | Unchanged | | 90 | |
Tax in dispute | | Changed | | 715 | |
Other legal claims against SOEs and Crown entities | | Unchanged | | 25 | |
Other legal claims | | Unchanged | | 101 | |
| | | | 931 | |
Other quantifiable contingent liabilities | | | | | |
International finance organisations | | Changed | | 1,749 | |
Reserve Bank – demonetised currency | | Unchanged | | 22 | |
Social Development – claim for judicial review | | Changed | | 93 | |
Transpower New Zealand Limited | | Unchanged | | 98 | |
Other quantifiable contingent liabilities of SOEs and Crown entities | | Unchanged | | 37 | |
Other quantifiable contingent liabilities | | Changed | | 20 | |
| | | | 2,019 | |
Total quantifiable contingent liabilities | | | | 5,674 | |
(12) Relative to reporting in the 31 December 2006 Financial Statements of the Government of New Zealand.
Unquantifiable Contingent Liabilities
| | Status |
Guarantees and indemnities | | |
Asure New Zealand Limited | | Unchanged |
At Work Insurance Limited | | Unchanged |
Auckland Rail lease | | Unchanged |
Bona Vacantia property | | Unchanged |
Building Industry Authority | | Unchanged |
Contact Energy Limited | | Unchanged |
Crown Research Institutes (CRIs) | | Unchanged |
District Court Judges, Justices of the Peace, Coroners and Disputes Tribunal | | Changed |
District Health Boards – director indemnity – (DHBs) | | Unchanged |
Earthquake Commission (EQC) | | Unchanged |
Electricity Corporation of New Zealand Limited (ECNZ) | | Unchanged |
Ministry of Fisheries – indemnity provided for delivery of registry services | | Unchanged |
Genesis Power Ltd (Genesis Energy) | | Unchanged |
Geothermal carbon tax indemnity | | Unchanged |
Housing New Zealand Corporation (HNZC) | | Unchanged |
Indemnities against acts of war and terrorism | | Unchanged |
Maui Partners | | Unchanged |
National Provident Fund | | Unchanged |
New Zealand Railways Corporation | | Unchanged |
Persons exercising investigating powers | | Unchanged |
Ports of Auckland | | Unchanged |
Public Trust | | Unchanged |
Purchasers of Crown operations | | Unchanged |
State Insurance and Rural Bank – tax liabilities | | Unchanged |
Synfuels-Waitara Outfall Indemnity | | Unchanged |
Tainui Corporation | | Unchanged |
Toll NZ Ltd – purchase of rail network assets | | Unchanged |
Works Civil Construction | | Unchanged |
Works Consultancy Services | | Unchanged |
| | |
Other unquantifiable contingent liabilities | | |
Abuse claims | | Unchanged |
Accident Compensation Corporation (ACC) litigations | | Unchanged |
Environmental liabilities | | Unchanged |
Rugby World Cup 2011 | | Unchanged |
Sale of Crown assets | | Unchanged |
Treaty of Waitangi claims | | Unchanged |
Treaty of Waitangi claims – settlement relativity payments | | Unchanged |
| | |
Other contingencies | | |
Foreshore and seabed | | Unchanged |
5
Generally Accepted Accounting
Practice (GAAP) Series Tables
Forecast Financial Statements
These forecasts have been prepared in accordance with the Public Finance Act 1989.
They are based on the accounting policies and assumptions that follow. As with all such assumptions, there is a degree of uncertainty surrounding them. This uncertainty increases as the forecast horizon extends.
The forecasts have been prepared in accordance with the Statement of Responsibility and reflect the judgements and information known at the time they were prepared. They reflect all Government decisions and circumstances communicated to 9 May 2007.
Finalisation dates and key assumptions that underpin the preparation of the GAAP tables are outlined at the start of the Fiscal Outlook chapter on page 80.
Statement of Accounting Policies and
Forecast Assumptions
Significant Accounting Policies
These Forecast Financial Statements have been prepared in accordance with the accounting policies expected to be used in the comparable audited actual Financial Statements of the Government.
These Forecast Financial Statements comply with generally accepted accounting practice (GAAP) as required by the Public Finance Act 1989.
Forecasts for the year ending 30 June 2008 and beyond have been prepared in accordance with New Zealand equivalents to International Financial Reporting Standards (NZ IFRS), as appropriate for public benefit entities. These are the standards to be adopted by the Crown from 1 July 2007. These forecasts are identified as “New GAAP” in the financial statements that follow. Historical information prepared under current accounting standards has not been restated and is identified as “Old GAAP”.
Forecasts for the year ending 30 June 2007 have been prepared under both “New GAAP” and “Old GAAP” and are provided in these following statements to help communicate the transition to NZ IFRS.
All forecasts use the accrual basis of accounting. Forecasts have been prepared for the consolidated financial statements of the government reporting entity, including all entities controlled by the Government (as defined by applicable financial reporting standards).
Changes in accounting policies
From 1 July 2007 the financial statements of the Government will adopt NZ IFRS as appropriate for public benefit entities. As a consequence, there have been a number of changes accounting policies to reflect the requirements of these new standards.
Chapter 7 NZ IFRS Transition on page 191 reconciles forecasts for the year ending 30 June 2007 prepared under “Old GAAP” and “New GAAP”.
Forecast Policies
These Forecast Financial Statements have been prepared on the basis of Treasury’s best professional judgment. Key assumptions used are set out on page 80.
For the purposes of the Forecast Financial Statements, no revaluations of property, plant and equipment are projected beyond the current year.
Detailed accounting and forecasting policies
Detailed accounting and forecasting policies are reproduced in full on Treasury’s website at www.treasury.govt.nz/budget2007/.
Government Reporting Entity as at 9 May 2007
These forecast financial statements are for the Government reporting entity as specified in section 26Q(4) of the Public Finance Act 1989. This comprises Ministers of the Crown and the following entities:
Departments
Agriculture and Forestry
Archives New Zealand
Building and Housing
Conservation
Corrections
Crown Law
Culture and Heritage
Customs
Defence
Economic Development
Education
Education Review Office
Environment
Fisheries
Foreign Affairs and Trade
Government Communications Security Bureau
Health
Inland Revenue
Internal Affairs
Justice
Labour
Land Information New Zealand
Māori Development
National Library
New Zealand Defence Force
Office of the Clerk
Pacific Island Affairs
Parliamentary Counsel Office
Parliamentary Service
Police
Prime Minister and Cabinet
Research, Science and Technology
Security Intelligence Service
Serious Fraud Office
Social Development
State Services Commission
Statistics
Transport
Treasury
Women’s Affairs
State-owned enterprises
Agriquality Limited
Airways Corporation of New Zealand Limited
Animal Control Products Limited
Asure New Zealand Limited
Electricity Corporation of New Zealand Limited
Genesis Power Limited
Kordia Group Limited
Landcorp Farming Limited
Learning Media Limited
Meridian Energy Limited
Meteorological Service of New Zealand Limited
Mighty River Power Limited
New Zealand Post Limited
New Zealand Railways Corporation
Quotable Value Limited
Solid Energy New Zealand Limited
Terralink Limited (in liquidation)
Timberlands West Coast Limited
Transpower New Zealand Limited
Air New Zealand Limited (included for disclosure purposes as if it were a SOE)
Others
Government Superannuation Fund
New Zealand Superannuation Fund
Reserve Bank of New Zealand
Offices of Parliament
Office of the Controller and Auditor-General
Office of the Ombudsmen
Parliamentary Commissioner for the Environment
Crown entities
Accident Compensation Corporation
Accounting Standards Review Board
Alcohol Advisory Council of New Zealand
Arts Council of New Zealand Toi Aotearoa
Broadcasting Commission
Broadcasting Standards Authority
Career Services
Charities Commission
Children’s Commissioner
Civil Aviation Authority of New Zealand
Commerce Commission
Crown Health Financing Agency
Crown research institutes (9)
District health boards (21)
Earthquake Commission
Electoral Commission
Electricity Commission
Energy Efficiency and Conservation Authority
Environmental Risk Management Authority
Families Commission
Foundation for Research, Science and Technology
Government Superannuation Fund Authority
Guardians of New Zealand Superannuation
Health and Disability Commissioner
Health Research Council of New Zealand
Health Sponsorship Council
Housing New Zealand Corporation
Human Rights Commission
Land Transport New Zealand
Law Commission
Legal Services Agency
Maritime New Zealand
Mental Health Commission
Museum of New Zealand Te Papa Tongarewa Board
New Zealand Antarctic Institute
New Zealand Artificial Limb Board
New Zealand Blood Service
New Zealand Film Commission
New Zealand Fire Service Commission
New Zealand Historic Places Trust (Pouhere Taonga)
New Zealand Lotteries Commission
New Zealand Qualifications Authority
New Zealand Sports Drug Agency
New Zealand Symphony Orchestra
New Zealand Teachers Council
New Zealand Tourism Board
New Zealand Trade and Enterprise
New Zealand Venture Investment Fund Limited
Office of Film and Literature Classification
Pharmaceutical Management Agency
Police Complaints Authority
Privacy Commissioner
Public Trust
Radio New Zealand Limited
Retirement Commissioner
School boards of trustees (2,465)
Securities Commission
Social Workers Registration Board
Sport and Recreation New Zealand
Standards Council
Takeovers Panel
Te Reo Whakapuaki Irirangi (Te Māngai Pāho)
Te Taura Whiri i te Reo Māori (Māori Language Commission)
Television New Zealand Limited
Tertiary Education Commission
Tertiary education institutions (TEIs) (31)
Testing Laboratory Registration Council
Transit New Zealand
Transport Accident Investigation Commission
Crown entity subsidiaries are consolidated by their parents and not listed separately in this table
Organisations named or described in Schedule 4 to the Public Finance Act 1989
Agriculture and Marketing Research and Development Trust
Asia New Zealand Foundation
Fish and game councils (12)
Leadership Development Centre Trust
New Zealand Fish and Game Council
New Zealand Game Bird Habitat Trust Board
New Zealand Government Property Corporation
New Zealand Lottery Grants Board
Ngāi Tahu Ancillary Claims Trust
Pacific Co-operation Foundation
Pacific Islands Business Development Trust
Research and Education Advanced Network New Zealand Limited
Reserves boards (24)
Road Safety Trust
Forecast Statement of Financial Performance
for the years ending 30 June
($ million) | | Note | | Old
GAAP
2006
Actual | | Old
GAAP
2007
Previous
Budget | | Old
GAAP
2007
Forecast | | New
GAAP
2007
Forecast | | New
GAAP
2008
Forecast | | New
GAAP
2009
Forecast | | New
GAAP
2010
Forecast | | New
GAAP
2011
Forecast | |
| | | | | | | | | | | | | | | | | | | |
Revenue | | | | | | | | | | | | | | | | | | | |
Taxation revenue | | 1a | | 51,973 | | 50,669 | | 51,539 | | 51,658 | | 54,173 | | 55,691 | | 58,269 | | 61,351 | |
Other sovereign revenue | | 1a | | 3,411 | | 3,179 | | 3,508 | | 3,691 | | 3,693 | | 3,757 | | 3,846 | | 3,931 | |
Total Revenue Levied through the Crown’s Sovereign Power | | | | 55,384 | | 53,848 | | 55,047 | | 55,349 | | 57,866 | | 59,448 | | 62,115 | | 65,282 | |
| | | | | | | | | | | | | | | | | | | |
Sales of goods and services | | 2 | | 13,337 | | 12,715 | | 13,111 | | 12,563 | | 13,253 | | 13,870 | | 14,431 | | 14,790 | |
Interest revenue and dividends | | 3 | | 5,828 | | 3,687 | | 5,807 | | 3,072 | | 3,366 | | 3,585 | | 3,636 | | 3,756 | |
Other revenue | | 4 | | 2,032 | | 2,361 | | 2,238 | | 2,406 | | 2,387 | | 2,673 | | 2,996 | | 2,991 | |
Total Revenue Earned through the Crown’s Operations | | | | 21,197 | | 18,763 | | 21,156 | | 18,041 | | 19,006 | | 20,128 | | 21,063 | | 21,537 | |
| | | | | | | | | | | | | | | | | | | |
Total Revenue (excluding gains) | | | | 76,581 | | 72,611 | | 76,203 | | 73,390 | | 76,872 | | 79,576 | | 83,178 | | 86,819 | |
| | | | | | | | | | | | | | | | | | | |
Expenses | | | | | | | | | | | | | | | | | | | |
Social assistance and official development assistance | | 5 | | 16,688 | | 18,257 | | 18,275 | | 18,300 | | 19,908 | | 20,975 | | 22,095 | | 23,190 | |
Personnel expenses | | 6 | | 15,395 | | 15,118 | | 15,673 | | 15,084 | | 15,657 | | 15,787 | | 15,950 | | 16,006 | |
Depreciation and amortisation | | 7 | | 2,708 | | 2,918 | | 3,099 | | 3,023 | | 3,296 | | 3,417 | | 3,579 | | 3,696 | |
Other operating expenses | | 8 | | 26,731 | | 26,835 | | 28,254 | | 28,132 | | 28,997 | | 29,471 | | 30,030 | | 30,408 | |
Interest expenses | | 9 | | 2,241 | | 2,854 | | 3,063 | | 2,780 | | 2,748 | | 2,705 | | 2,643 | | 2,766 | |
Insurance expenses | | | | 1,321 | | 674 | | 1,743 | | 954 | | 994 | | 1,027 | | 1,115 | | 1,160 | |
New operating spending up to Budget 2008 | | 10 | | — | | — | | 80 | | 80 | | 314 | | 329 | | 398 | | 460 | |
Forecast for future new spending | | 10 | | — | | 320 | | — | | — | | — | | 1,908 | | 3,838 | | 5,786 | |
Top-down expense adjustment | | 10 | | — | | — | | (500 | ) | (500 | ) | — | | — | | — | | — | |
| | | | | | | | | | | | | | | | | | | |
Total Expenses (excluding losses) | | | | 65,084 | | 66,976 | | 69,687 | | 67,853 | | 71,914 | | 75,619 | | 79,648 | | 83,472 | |
| | | | | | | | | | | | | | | | | | | |
Operating Balance before gains/(losses) | | | | 11,497 | | 5,635 | | 6,516 | | 5,537 | | 4,958 | | 3,957 | | 3,530 | | 3,347 | |
| | | | | | | | | | | | | | | | | | | |
Net gains/(losses) on financial instruments | | | | — | | — | | — | | 1,644 | | 1,377 | | 1,516 | | 1,684 | | 1,922 | |
Net gains/(losses) on non-financial instruments | | 11 | | — | | — | | — | | (947 | ) | — | | — | | — | | — | |
Total Gains/(Losses) | | | | — | | — | | — | | 697 | | 1,377 | | 1,516 | | 1,684 | | 1,922 | |
| | | | | | | | | | | | | | | | | | | |
Net surplus/(deficit) from associates and joint ventures | | | | 54 | | 133 | | 52 | | 96 | | 96 | | 96 | | 96 | | 97 | |
| | | | | | | | | | | | | | | | | | | |
Operating Balance from continuing activities | | | | 11,551 | | 5,768 | | 6,568 | | 6,330 | | 6,431 | | 5,569 | | 5,310 | | 5,366 | |
| | | | | | | | | | | | | | | | | | | |
Gain/(loss) from discontinued operations | | | | — | | — | | — | | (3 | ) | — | | — | | — | | — | |
| | | | | | | | | | | | | | | | | | | |
Operating Balance (including minority interest) | | | | 11,551 | | 5,768 | | 6,568 | | 6,327 | | 6,431 | | 5,569 | | 5,310 | | 5,366 | |
| | | | | | | | | | | | | | | | | | | |
Attributable to minority interest in Air NZ | | | | (78 | ) | — | | — | | — | | — | | — | | — | | — | |
| | | | | | | | | | | | | | | | | | | |
Operating Balance | | | | 11,473 | | 5,768 | | 6,568 | | 6,327 | | 6,431 | | 5,569 | | 5,310 | | 5,366 | |
The revenues and expenses are GST exclusive.
The accompanying Notes and Accounting policies are an integral part of these Statements.
($ million) | | Old
GAAP
2006
Actual | | Old
GAAP
2007
Previous
Budget | | Old
GAAP
2007
Forecast | | New
GAAP
2007
Forecast | | New
GAAP
2008
Forecast | | New
GAAP
2009
Forecast | | New
GAAP
2010
Forecast | | New
GAAP
2011
Forecast | |
| | | | | | | | | | | | | | | | | |
Total Crown expenses by functional classification | | | | | | | | | | | | | | | | | |
Social security and welfare | | 18,969 | | 19,706 | | 21,468 | | 20,142 | | 21,271 | | 22,025 | | 22,888 | | 23,768 | |
GSF pension expenses | | 1,671 | | 1,051 | | 1,471 | | 645 | | 629 | | 587 | | 549 | | 525 | |
Health | | 9,262 | | 10,305 | | 10,037 | | 10,658 | | 11,699 | | 11,987 | | 12,290 | | 12,287 | |
Education | | 10,430 | | 9,892 | | 9,636 | | 10,204 | | 10,321 | | 10,460 | | 10,561 | | 10,671 | |
Core government services | | 2,046 | | 2,031 | | 2,810 | | 2,982 | | 2,132 | | 2,158 | | 2,236 | | 2,501 | |
Law and order | | 2,420 | | 2,604 | | 2,872 | | 2,800 | | 3,076 | | 3,055 | | 3,088 | | 3,084 | |
Defence | | 1,339 | | 1,405 | | 1,456 | | 1,489 | | 1,597 | | 1,641 | | 1,729 | | 1,838 | |
Transport and communications | | 5,986 | | 6,853 | | 7,240 | | 7,150 | | 7,671 | | 7,759 | | 7,841 | | 7,782 | |
Economic and industrial services | | 6,334 | | 5,896 | | 5,684 | | 4,994 | | 5,879 | | 6,468 | | 7,022 | | 7,375 | |
Primary services | | 1,219 | | 1,198 | | 1,365 | | 1,316 | | 1,319 | | 1,314 | | 1,314 | | 1,316 | |
Heritage, culture and recreation | | 2,361 | | 1,900 | | 1,995 | | 2,091 | | 2,218 | | 2,174 | | 2,207 | | 2,240 | |
Housing and community development | | 758 | | 851 | | 913 | | 908 | | 961 | | 972 | | 977 | | 958 | |
Other | | 48 | | 110 | | 98 | | 113 | | 79 | | 77 | | 66 | | 73 | |
Finance costs | | 2,652 | | 2,854 | | 3,023 | | 2,781 | | 2,748 | | 2,705 | | 2,644 | | 2,808 | |
Net foreign-exchange (gains)/losses | | (411 | ) | — | | 39 | | — | | — | | — | | — | | — | |
New operating spending up to Budget 2008 | | — | | — | | 80 | | 80 | | 314 | | 329 | | 398 | | 460 | |
Forecast for future new spending | | — | | 320 | | — | | — | | — | | 1,908 | | 3,838 | | 5,786 | |
Top-down expense adjustment | | — | | — | | (500 | ) | (500 | ) | — | | — | | — | | — | |
| | | | | | | | | | | | | | | | | |
Total Crown Expenses | | 65,084 | | 66,976 | | 69,687 | | 67,853 | | 71,914 | | 75,619 | | 79,648 | | 83,472 | |
| | | | | | | | | | | | | | | | | |
Total Crown other gains and losses by functional classification | | | | | | | | | | | | | | | | | |
Social security and welfare | | — | | — | | — | | (724 | ) | 282 | | 271 | | 262 | | 279 | |
GSF pension expenses | | — | | — | | — | | (30 | ) | — | | — | | — | | — | |
Education | | — | | — | | — | | (5 | ) | 5 | | 5 | | 5 | | 5 | |
Core government services | | — | | — | | — | | 1,176 | | 754 | | 917 | | 1,088 | | 1,286 | |
Transport and communications | | — | | — | | — | | 55 | | 64 | | 61 | | 75 | | 58 | |
Economic and industrial services | | — | | — | | — | | (86 | ) | 151 | | 169 | | 184 | | 203 | |
Primary services | | — | | — | | — | | 63 | | (26 | ) | (27 | ) | (26 | ) | (26 | ) |
Heritage, culture and recreation | | — | | — | | — | | 92 | | — | | — | | — | | — | |
Housing and community development | | — | | — | | — | | (16 | ) | 20 | | 18 | | 14 | | 14 | |
Finance costs | | — | | — | | — | | 172 | | 127 | | 102 | | 82 | | 103 | |
| | | | | | | | | | | | | | | | | |
Total Crown Other Gains and Losses | | — | | — | | — | | 697 | | 1,377 | | 1,516 | | 1,684 | | 1,922 | |
| | | | | | | | | | | | | | | | | |
Core Crown expenses by functional classification | | | | | | | | | | | | | | | | | |
Social security and welfare | | 15,598 | | 16,956 | | 17,325 | | 16,891 | | 17,698 | | 18,172 | | 18,788 | | 19,437 | |
GSF pension expenses | | 1,671 | | 1,051 | | 1,471 | | 645 | | 629 | | 587 | | 549 | | 525 | |
Health | | 9,547 | | 10,732 | | 10,492 | | 10,486 | | 11,613 | | 11,634 | | 11,665 | | 11,662 | |
Education | | 9,914 | | 9,068 | | 9,125 | | 9,622 | | 9,719 | | 9,835 | | 9,912 | | 9,998 | |
Core government services | | 2,169 | | 2,301 | | 3,083 | | 3,237 | | 2,479 | | 2,506 | | 2,556 | | 2,672 | |
Law and order | | 2,235 | | 2,393 | | 2,658 | | 2,581 | | 2,836 | | 2,818 | | 2,836 | | 2,829 | |
Defence | | 1,383 | | 1,457 | | 1,508 | | 1,533 | | 1,641 | | 1,686 | | 1,773 | | 1,883 | |
Transport and communications | | 1,818 | | 2,524 | | 2,549 | | 2,505 | | 2,792 | | 2,796 | | 2,566 | | 2,476 | |
Economic and industrial services | | 1,592 | | 1,721 | | 1,605 | | 1,681 | | 2,276 | | 2,651 | | 3,001 | | 3,239 | |
Primary services | | 467 | | 441 | | 584 | | 477 | | 494 | | 484 | | 477 | | 472 | |
Heritage, culture and recreation | | 1,194 | | 812 | | 778 | | 884 | | 977 | | 867 | | 870 | | 868 | |
Housing and community development | | 202 | | 278 | | 277 | | 279 | | 304 | | 286 | | 270 | | 268 | |
Other | | 49 | | 110 | | 97 | | 112 | | 80 | | 80 | | 80 | | 80 | |
Finance costs | | 2,356 | | 2,090 | | 2,553 | | 2,270 | | 2,244 | | 2,180 | | 2,098 | | 2,243 | |
Net foreign-exchange (gains)/losses | | (295 | ) | — | | 90 | | — | | — | | — | | — | | — | |
New operating spending up to Budget 2008 | | — | | — | | 80 | | 80 | | 314 | | 329 | | 398 | | 460 | |
Forecast for future new spending | | — | | 320 | | — | | — | | — | | 1,908 | | 3,838 | | 5,786 | |
Top-down expense adjustment | | — | | — | | (500 | ) | (500 | ) | — | | — | | — | | — | |
| | | | | | | | | | | | | | | | | |
Total Core Crown Expenses | | 49,900 | | 52,254 | | 53,775 | | 52,783 | | 56,096 | | 58,819 | | 61,677 | | 64,898 | |
| | | | | | | | | | | | | | | | | |
Total Core Crown other gains and losses by functional classification | | | | | | | | | | | | | | | | | |
Social security and welfare | | — | | — | | — | | — | | — | | — | | — | | — | |
GSF pension expenses | | — | | — | | — | | (30 | ) | — | | — | | — | | — | |
Core government services | | — | | — | | — | | 1,176 | | 756 | | 920 | | 1,092 | | 1,288 | |
Heritage, culture and recreation | | — | | — | | — | | 96 | | — | | — | | — | | — | |
Finance costs | | — | | — | | — | | 336 | | 399 | | 392 | | 388 | | 396 | |
| | | | | | | | | | | | | | | | | |
Total Core Crown Other Gains and Losses | | — | | — | | — | | 1,578 | | 1,155 | | 1,312 | | 1,480 | | 1,684 | |
The accompanying Notes and Accounting policies are an integral part of these Statements.
Forecast Statement of Cash Flows
for the years ending 30 June
($ million) | | Note | | Old
GAAP
2006
Actual | | Old
GAAP
2007
Previous
Budget | | Old
GAAP
2007
Forecast | | New
GAAP
2007
Forecast | | New
GAAP
2008
Forecast | | New
GAAP
2009
Forecast | | New
GAAP
2010
Forecast | | New
GAAP
2011
Forecast | |
| | | | | | | | | | | | | | | | | | | |
Cash flows from operations | | | | | | | | | | | | | | | | | | | |
Cash was provided from | | | | | | | | | | | | | | | | | | | |
Total tax receipts | | 1b | | 49,706 | | 50,738 | | 51,823 | | 52,009 | | 54,266 | | 55,048 | | 58,099 | | 61,252 | |
Other sovereign receipts | | 1b | | 3,246 | | 3,047 | | 3,387 | | 3,455 | | 3,472 | | 3,607 | | 3,728 | | 3,825 | |
Sales of goods and services | | | | 13,457 | | 13,089 | | 13,357 | | 12,795 | | 13,394 | | 13,935 | | 14,501 | | 14,832 | |
Interest | | | | 1,622 | | 1,422 | | 2,148 | | 2,071 | | 2,256 | | 2,395 | | 2,305 | | 2,293 | |
Dividends | | | | 117 | | 90 | | 133 | | 426 | | 504 | | 586 | | 676 | | 772 | |
Other operating receipts | | | | 1,919 | | 2,393 | | 2,091 | | 2,352 | | 2,302 | | 2,609 | | 2,880 | | 2,908 | |
Total cash provided from operations | | | | 70,067 | | 70,779 | | 72,939 | | 73,108 | | 76,194 | | 78,180 | | 82,189 | | 85,882 | |
| | | | | | | | | | | | | | | | | | | |
Cash was disbursed to | | | | | | | | | | | | | | | | | | | |
Social assistance and official development assistance | | | | 16,944 | | 18,665 | | 18,592 | | 18,277 | | 19,529 | | 20,130 | | 20,960 | | 21,870 | |
Personnel and operating payments | | | | 38,964 | | 41,670 | | 41,189 | | 41,015 | | 44,025 | | 45,030 | | 46,107 | | 46,543 | |
Interest expenses | | | | 2,047 | | 2,441 | | 2,428 | | 2,487 | | 2,530 | | 2,610 | | 2,622 | | 2,667 | |
Forecast for future new spending | | 10 | | — | | 320 | | 80 | | 80 | | 314 | | 2,306 | | 4,391 | | 6,508 | |
Top-down cash adjustment | | 10 | | — | | — | | (500 | ) | (500 | ) | — | | — | | — | | — | |
Total cash disbursed to operations | | | | 57,955 | | 63,096 | | 61,789 | | 61,359 | | 66,398 | | 70,076 | | 74,080 | | 77,588 | |
| | | | | | | | | | | | | | | | | | | |
Net cash flows from operations | | | | 12,112 | | 7,683 | | 11,150 | | 11,749 | | 9,796 | | 8,104 | | 8,109 | | 8,294 | |
| | | | | | | | | | | | | | | | | | | |
Cash flows from investing activities | | | | | | | | | | | | | | | | | | | |
Net sale/(purchase) of share investments and other securities | | | | (5,859 | ) | 527 | | (9,656 | ) | (8,607 | ) | (4,491 | ) | (1,155 | ) | (983 | ) | (4,289 | ) |
Net sale/(purchase) of physical assets | | | | (4,044 | ) | (6,713 | ) | (6,536 | ) | (6,607 | ) | (6,661 | ) | (5,363 | ) | (5,675 | ) | (6,024 | ) |
Net sale/(purchase) of intangible assets | | | | — | | — | | — | | (139 | ) | (144 | ) | (101 | ) | (84 | ) | (75 | ) |
Net repayment/(issue) of advances | | | | (1,637 | ) | (1,808 | ) | (2,409 | ) | (2,010 | ) | (1,628 | ) | (1,449 | ) | (59 | ) | 18 | |
Net disposal/(acquisition) of investment in associates | | | | — | | — | | — | | (384 | ) | (95 | ) | (68 | ) | (7 | ) | (2 | ) |
Forecast for future new capital spending | | 10 | | — | | (256 | ) | — | | — | | (184 | ) | (567 | ) | (806 | ) | (903 | ) |
Top-down capital adjustment | | 10 | | — | | — | | 200 | | 200 | | — | | — | | — | | — | |
Net cash flows from investing activities | | | | (11,540 | ) | (8,250 | ) | (18,401 | ) | (17,547 | ) | (13,203 | ) | (8,703 | ) | (7,614 | ) | (11,275 | ) |
| | | | | | | | | | | | | | | | | | | |
Net Cash Flows from Operating and Investing Activities | | | | 572 | | (567 | ) | (7,251 | ) | (5,798 | ) | (3,407 | ) | (599 | ) | 495 | | (2,981 | ) |
| | | | | | | | | | | | | | | | | | | |
Cash flows from financing activities | | | | | | | | | | | | | | | | | | | |
Issues of circulating currency | | | | 165 | | — | | 273 | | 273 | | 178 | | 186 | | 196 | | 206 | |
Net issue/(repayment) of Government stock(1) | | | | 151 | | (656 | ) | (128 | ) | (366 | ) | 2,223 | | (714 | ) | (956 | ) | 2,159 | |
Net issue/(repayment) of other New Zealand dollar borrowing | | | | 1,856 | | 394 | | 6,692 | | 5,509 | | 2,225 | | 1,865 | | 474 | | 215 | |
Net issue/(repayment) of foreign currency borrowing | | | | (2,300 | ) | 412 | | (272 | ) | (204 | ) | (1,130 | ) | (499 | ) | (325 | ) | 354 | |
Net cash flows from financing activities | | | | (128 | ) | 150 | | 6,565 | | 5,212 | | 3,496 | | 838 | | (611 | ) | 2,934 | |
| | | | | | | | | | | | | | | | | | | |
Net (decrease)/increase in cash and cash equivalents | | | | 444 | | (417 | ) | (686 | ) | (586 | ) | 89 | | 239 | | (116 | ) | (47 | ) |
Opening cash and cash equivalents | | | | 3,710 | | 3,319 | | 4,168 | | 3,676 | | 3,107 | | 3,196 | | 3,435 | | 3,319 | |
Foreign exchange gains/(losses) on opening cash | | | | 14 | | — | | (4 | ) | 17 | | — | | — | | — | | — | |
Closing cash and cash equivalents | | | | 4,168 | | 2,902 | | 3,478 | | 3,107 | | 3,196 | | 3,435 | | 3,319 | | 3,272 | |
(1) Net issues of Government stock include movements within government stock holdings of entities such as NZS Fund, GSF, ACC and EQC. The Bonds Reconciliation (Note 20) at the end of these forecasts outlines NZDMO issues of Government stock.
The accompanying Notes and Accounting policies are an integral part of these Statements.
($ million) | | Old
GAAP
2006
Actual | | Old
GAAP
2007
Previous
Budget | | Old
GAAP
2007
Forecast | | New
GAAP
2007
Forecast | | New
GAAP
2008
Forecast | | New
GAAP
2009
Forecast | | New
GAAP
2010
Forecast | | New
GAAP
2011
Forecast | |
| | | | | | | | | | | | | | | | | |
Reconciliation Between the Forecast Net Cash Flows from Operations and the Operating Balance | | | | | | | | | | | | | | | | | |
| | | | | | | | | | | | | | | | | |
Net Cash Flows from Operations | | 12,112 | | 7,683 | | 11,150 | | 11,749 | | 9,796 | | 8,104 | | 8,109 | | 8,294 | |
| | | | | | | | | | | | | | | | | |
Items included in the operating balance but not in net cash flows from operations | | | | | | | | | | | | | | | | | |
| | | | | | | | | | | | | | | | | |
Unrealised gains/(losses) | | | | | | | | | | | | | | | | | |
Unrealised gains/(losses) on other financial instruments | | 1,759 | | 544 | | 631 | | 521 | | 511 | | 461 | | 425 | | 437 | |
Unrealised gains/(losses) NZ Superannuation Fund | | 968 | | 675 | | 1,008 | | 1,123 | | 866 | | 1,055 | | 1,259 | | 1,486 | |
Unrealised (increase)/decrease on other non-financial instruments | | — | | — | | — | | (947 | ) | — | | — | | — | | — | |
Total unrealised gains/(losses) | | 2,727 | | 1,219 | | 1,639 | | 697 | | 1,377 | | 1,516 | | 1,684 | | 1,923 | |
| | | | | | | | | | | | | | | | | |
Movements in Working Capital | | | | | | | | | | | | | | | | | |
Increase/(decrease) in receivables | | 3,591 | | 329 | | (2,082 | ) | (1,322 | ) | 218 | | 714 | | 131 | | 22 | |
Increase/(decrease) in inventories | | (39 | ) | 161 | | 193 | | 198 | | 41 | | 64 | | 25 | | 10 | |
Increase/(decrease) in prepayments | | — | | — | | — | | (10 | ) | (2 | ) | — | | — | | (1 | ) |
Decrease/(increase) in deferred revenue | | — | | — | | — | | (11 | ) | — | | (5 | ) | (5 | ) | (2 | ) |
Decrease/(increase) in payables | | (1,598 | ) | 74 | | 1,409 | | 880 | | (569 | ) | (429 | ) | (146 | ) | (201 | ) |
Total Movements in Working Capital | | 1,954 | | 564 | | (480 | ) | (265 | ) | (312 | ) | 344 | | 5 | | (172 | ) |
| | | | | | | | | | | | | | | | | |
Other Non-cash Items in Operating Balance | | | | | | | | | | | | | | | | | |
Depreciation and amortisation | | (2,708 | ) | (2,918 | ) | (3,099 | ) | (3,023 | ) | (3,296 | ) | (3,417 | ) | (3,579 | ) | (3,696 | ) |
(Loss)/gain on sale of assets | | 811 | | — | | — | | — | | — | | — | | — | | — | |
Write-down on initial recognition of loans | | (1,671 | ) | (167 | ) | (817 | ) | (588 | ) | (518 | ) | (525 | ) | (547 | ) | (568 | ) |
Impairment on financial assets (excl receivables) | | — | | — | | — | | (418 | ) | (38 | ) | (40 | ) | (42 | ) | (45 | ) |
Net interest revenue | | — | | — | | — | | 282 | | 389 | | 509 | | 634 | | 592 | |
Decrease/(increase) in defined benefit retirement plan liabilities | | (279 | ) | 17 | | — | | (44 | ) | (51 | ) | 12 | | 71 | | 106 | |
Decrease/(increase) in insurance liabilities | | (1,321 | ) | (674 | ) | (1,743 | ) | (2,159 | ) | (1,013 | ) | (1,030 | ) | (1,121 | ) | (1,166 | ) |
Other | | (152 | ) | 44 | | (82 | ) | 96 | | 97 | | 96 | | 96 | | 98 | |
Total Other Non-cash Items in Operating Balance | | (5,320 | ) | (3,698 | ) | (5,741 | ) | (5,854 | ) | (4,430 | ) | (4,395 | ) | (4,488 | ) | (4,679 | ) |
| | | | | | | | | | | | | | | | | |
Operating Balance | | 11,473 | | 5,768 | | 6,568 | | 6,327 | | 6,431 | | 5,569 | | 5,310 | | 5,366 | |
The accompanying Notes and Accounting policies are an integral part of these Statements.
Forecast Statement of Recognised Income and Expense
for the years ending 30 June
| | Old | | Old
GAAP | | Old | | New | | New | | New | | New | | New | |
($ million) | | GAAP
2006
Actual | | 2007
Previous
Budget | | GAAP
2007
Forecast | | GAAP
2007
Forecast | | GAAP
2008
Forecast | | GAAP
2009
Forecast | | GAAP
2010
Forecast | | GAAP
2011
Forecast | |
| | | | | | | | | | | | | | | | | |
Revaluation of physical assets | | 9,869 | | — | | 10,489 | | 93 | | — | | — | | — | | — | |
Effective portion of changes in fair value of cash flow hedges | | — | | — | | — | | 91 | | 39 | | 21 | | 10 | | (3 | ) |
Net change in fair value of cash flow hedges transferred to operating statement | | — | | — | | — | | (128 | ) | 74 | | (4 | ) | (5 | ) | (3 | ) |
Foreign currency translation differences for foreign operations | | — | | — | | — | | 14 | | — | | — | | — | | — | |
Total income/(expense) recognised directly in Net Worth | | 9,869 | | — | | 10,489 | | 70 | | 113 | | 17 | | 5 | | (6 | ) |
| | | | | | | | | | | | | | | | | |
Operating balance | | 11,473 | | 5,768 | | 6,568 | | 6,327 | | 6,431 | | 5,569 | | 5,310 | | 5,366 | |
Total recognised income and expense for the year | | 21,342 | | 5,768 | | 17,057 | | 6,397 | | 6,544 | | 5,586 | | 5,315 | | 5,360 | |
| | | | | | | | | | | | | | | | | |
Attributable to: | | | | | | | | | | | | | | | | | |
- minority interest in Air NZ | | 78 | | — | | — | | — | | — | | — | | — | | — | |
- the Crown | | 21,264 | | 5,768 | | 17,057 | | 6,397 | | 6,543 | | 5,587 | | 5,315 | | 5,359 | |
Total recognised income and expense for the year | | 21,342 | | 5,768 | | 17,057 | | 6,397 | | 6,543 | | 5,587 | | 5,315 | | 5,359 | |
The accompanying Notes and Accounting policies are an integral part of these Statements.
Forecast Statement of Financial Position
as at 30 June
| | | | Old | | Old
GAAP | | Old | | New | | New | | New | | New | | New | |
($ million) | | Note | | GAAP
2006
Actual | | 2007
Previous
Budget | | GAAP
2007
Forecast | | GAAP
2007
Forecast | | GAAP
2008
Forecast | | GAAP
2009
Forecast | | GAAP
2010
Forecast | | GAAP
2011
Forecast | |
| | | | | | | | | | | | | | | | | | | |
Assets | | | | | | | | | | | | | | | | | | | |
Cash and cash equivalents | | 12 | | 4,168 | | 2,902 | | 3,478 | | 3,107 | | 3,196 | | 3,435 | | 3,319 | | 3,272 | |
Receivables | | 13 | | 14,053 | | 10,345 | | 11,972 | | 12,329 | | 12,547 | | 13,262 | | 13,390 | | 13,413 | |
Marketable securities and derivatives in gain | | 12 | | 27,668 | | 25,250 | | 35,300 | | 30,730 | | 32,885 | | 32,203 | | 31,468 | | 34,008 | |
Share investments | | 12 | | 15,834 | | 17,994 | | 16,783 | | 14,121 | | 17,273 | | 20,179 | | 23,330 | | 26,722 | |
Advances | | 14 | | 9,099 | | 10,296 | | 10,416 | | 13,839 | | 15,087 | | 16,798 | | 17,362 | | 17,920 | |
Inventory | | | | 907 | | 1,182 | | 1,101 | | 941 | | 982 | | 1,046 | | 1,071 | | 1,080 | |
Prepayments and other assets | | | | 1,463 | | 874 | | 1,241 | | 1,182 | | 1,205 | | 1,209 | | 1,218 | | 1,224 | |
Property, plant and equipment | | 15 | | 78,974 | | 73,409 | | 92,842 | | 92,670 | | 95,950 | | 97,667 | | 99,675 | | 101,846 | |
Equity accounted investments (including TEIs) | | | | 5,475 | | 5,301 | | 5,586 | | 6,482 | | 6,647 | | 6,812 | | 6,914 | | 7,003 | |
Intangible assets and Goodwill | | | | 630 | | 398 | | 594 | | 1,569 | | 1,555 | | 1,529 | | 1,456 | | 1,392 | |
Forecast for new capital spending | | | | — | | 256 | | — | | — | | 184 | | 751 | | 1,557 | | 2,460 | |
Top-down capital adjustment | | | | — | | — | | (200 | ) | (200 | ) | (200 | ) | (200 | ) | (200 | ) | (200 | ) |
| | | | | | | | | | | | | | | | | | | |
Total Assets | | | | 158,271 | | 148,207 | | 179,113 | | 176,770 | | 187,311 | | 194,691 | | 200,560 | | 210,140 | |
| | | | | | | | | | | | | | | | | | | |
Liabilities | | | | | | | | | | | | | | | | | | | |
Issued currency | | | | 3,362 | | 3,408 | | 3,551 | | 3,552 | | 3,730 | | 3,914 | | 4,110 | | 4,316 | |
Payables | | 16 | | 12,469 | | 10,122 | | 11,121 | | 8,912 | | 9,036 | | 9,002 | | 8,737 | | 8,491 | |
Deferred revenue | | | | — | | — | | — | | 845 | | 845 | | 850 | | 855 | | 857 | |
Settlement deposits with the Reserve Bank | | | | 1,964 | | 2,071 | | 7,523 | | 7,523 | | 7,523 | | 7,523 | | 7,523 | | 7,523 | |
Other borrowings | | | | 37,463 | | 36,317 | | 34,844 | | 36,033 | | 38,841 | | 39,527 | | 38,999 | | 42,168 | |
Insurance liabilities | | 18 | | 12,715 | | 13,255 | | 14,457 | | 17,998 | | 19,011 | | 20,042 | | 21,162 | | 22,328 | |
Defined benefit retirement plan liabilities | | 19 | | 15,231 | | 15,344 | | 15,554 | | 8,363 | | 8,414 | | 8,402 | | 8,331 | | 8,224 | |
Provisions | | 17 | | 3,664 | | 3,437 | | 3,607 | | 3,848 | | 3,850 | | 3,786 | | 3,819 | | 3,812 | |
| | | | | | | | | | | | | | | | | | | |
Total Liabilities | | | | 86,868 | | 83,954 | | 90,657 | | 87,074 | | 91,250 | | 93,046 | | 93,536 | | 97,719 | |
| | | | | | | | | | | | | | | | | | | |
Total Assets less Total Liabilities | | | | 71,403 | | 64,253 | | 88,456 | | 89,696 | | 96,061 | | 101,645 | | 107,024 | | 112,421 | |
| | | | | | | | | | | | | | | | | | | |
Net Worth | | | | | | | | | | | | | | | | | | | |
Taxpayer funds | | | | 33,477 | | 36,049 | | 40,018 | | 41,852 | | 48,239 | | 53,844 | | 59,236 | | 64,630 | |
Revaluation reserve | | | | 37,633 | | 27,989 | | 48,145 | | 47,459 | | 47,402 | | 47,406 | | 47,409 | | 47,412 | |
Cashflow hedge reserve | | | | — | | — | | — | | 62 | | 97 | | 72 | | 56 | | 56 | |
Available for sale financial asset reserve | | | | — | | — | | — | | 13 | | 13 | | 13 | | 13 | | 13 | |
Foreign exchange translation reserve | | | | — | | — | | — | | 17 | | 17 | | 17 | | 17 | | 17 | |
Total Net Worth attributable to the Crown | | | | 71,110 | | 64,038 | | 88,163 | | 89,403 | | 95,768 | | 101,352 | | 106,731 | | 112,128 | |
Net Worth attributable to minority interest in Air NZ | | | | 293 | | 215 | | 293 | | 293 | | 293 | | 293 | | 293 | | 293 | |
Total Net Worth | | | | 71,403 | | 64,253 | | 88,456 | | 89,696 | | 96,061 | | 101,645 | | 107,024 | | 112,421 | |
The accompanying Notes and Accounting policies are an integral part of these Statements.
Components of the Fiscal Indicators
Indicators for measuring progress against the Government’s fiscal objectives encompass activities at the Total Crown level and Core Crown level. This note details the components of each indicator. The Government’s Fiscal Strategy Report details the Government’s fiscal strategy and the connections between this strategy and the fiscal objectives and indicators.
| | Old | | Old
GAAP | | Old | | New | | New | | New | | New | | New | |
($ million) | | GAAP
2006
Actual | | 2007
Previous
Budget | | GAAP
2007
Forecast | | GAAP
2007
Forecast | | GAAP
2008
Forecast | | GAAP
2009
Forecast | | GAAP
2010
Forecast | | GAAP
2011
Forecast | |
New Zealand Superannuation Fund | | | | | | | | | | | | | | | | | |
| | | | | | | | | | | | | | | | | |
The New Zealand Superannuation Fund (NZSF) is part of the Core Crown segment. It is also an important component of the Government’s fiscal strategy in its own right, which is reflected in the design of the fiscal indicators. The following NZSF information is not adjusted for transactions with other parts of the core Crown (i.e. is uneliminated data), such as cross-holdings with the New Zealand Debt Management Office. | |
Results before elimination | | | | | | | | | | | | | | | | | |
Opening net worth | | 6,555 | | 10,015 | | 9,861 | | 9,855 | | 12,910 | | 15,977 | | 19,321 | | 22,984 | |
Gross contribution from the Crown | | 2,337 | | 2,049 | | 2,049 | | 2,049 | | 2,103 | | 2,194 | | 2,312 | | 2,458 | |
Revenue (including interest and dividends) | | 1,190 | | 951 | | 1,505 | | 382 | | 447 | | 519 | | 599 | | 685 | |
Other gains and losses | | — | | — | | — | | 1,123 | | 866 | | 1,055 | | 1,259 | | 1,486 | |
Tax | | (221 | ) | (276 | ) | (497 | ) | (499 | ) | (349 | ) | (424 | ) | (507 | ) | (598 | ) |
Closing net worth | | 9,861 | | 12,739 | | 12,918 | | 12,910 | | 15,977 | | 19,321 | | 22,984 | | 27,015 | |
| | | | | | | | | | | | | | | | | |
NZ Superannuation Fund returns
(New Zealand Superannuation Fund returns represent the sum of its revenue, expenses and other gains/losses) | | 1,190 | | 951 | | 1,505 | | 1,505 | | 1,313 | | 1,574 | | 1,858 | | 2,171 | |
Core Crown Revenue excluding New Zealand Superannuation Fund revenue | |
| |
Core Crown revenue encompasses interest and dividends earned by the New Zealand Superannuation Fund (after eliminating any interest and dividend earned from cross holdings). After-tax revenue is retained by the NZSF and is therefore excluded from the core Crown revenue indicator. | |
Core Crown revenue | | | | | | | | 57,006 | | 59,402 | | 61,172 | | 63,825 | | 66,993 | |
NZSF after-tax revenue | | | | | | | | (117 | ) | 98 | | 95 | | 92 | | 87 | |
Core Crown revenue excluding NZSF revenue | | | | | | | | 57,123 | | 59,304 | | 61,077 | | 63,733 | | 66,906 | |
| | | | | | | | | | | | | | | | | |
Operating Balance before Gains and Losses excluding NZS Fund revenue | | | | | | | |
| | | | | | | | | | | | | | | | | |
Operating Balance before gains and losses | | | | | | | | 5,537 | | 4,958 | | 3,957 | | 3,530 | | 3,347 | |
NZSF after-tax revenue | | | | | | | | (117 | ) | 98 | | 95 | | 92 | | 87 | |
Operating Balance before gains and losses excluding NZS Fund revenue | | | | | | | | 5,654 | | 4,860 | | 3,862 | | 3,438 | | 3,260 | |
Definitions of debt: | | | | | | | | | | | | | | | | | |
| | | | | | | | | | | | | | | | | |
Total Crown gross debt is the total borrowings (both sovereign-guaranteed and non-sovereign guaranteed and including derivatives in loss) of the total Crown.This is the amount in the total Crown Statement of Financial Position for Reserve Bank settlement deposits plus other borrowings. It represents the complete picture of whole-of-Crown debt obligations to external parties, excluding payables. | |
Gross sovereign-issued debt is debt issued by the sovereign (i.e., Core Crown) and includes Government stock held by the NZS Fund, ACC or EQC for example. In other words, the gross sovereign-issued debt indicator does not eliminate any internal cross-holdings. The Government’s debt objective uses this measure of debt.
Net Core Crown debt deducts financial assets of the Core Crown (comprising cash equivalents, marketable securities, derivatives in gain, advances and some share investments) from gross sovereign-issued debt.Share investments in supranational organisations, such as the International Bank for Reconstruction and Development & Bank for International Settlements, are excluded from the net Core Crown debt measure.
Total Crown gross debt | | 39,427 | | 38,388 | | 42,367 | | 43,556 | | 46,364 | | 47,050 | | 46,522 | | 49,691 | |
| | | | | | | | | | | | | | | | | |
Core Crown borrowings | | 34,477 | | 33,356 | | 35,876 | | 36,771 | | 38,876 | | 38,371 | | 37,665 | | 40,098 | |
Add back NZS Fund holdings of sovereign issued debt and NZS Fund borrowings(2) | | 984 | | 1,657 | | 1,341 | | 1,164 | | 1,524 | | 1,860 | | 2,229 | | 2,639 | |
Gross sovereign-issued debt | | 35,461 | | 35,013 | | 37,217 | | 37,935 | | 40,400 | | 40,231 | | 39,894 | | 42,737 | |
| | | | | | | | | | | | | | | | | |
Gross sovereign-issued debt | | 35,461 | | 35,013 | | 37,217 | | 37,935 | | 40,400 | | 40,231 | | 39,894 | | 42,737 | |
Less Core Crown financial assets (excluding receivables and equity in supranational organisations) | | (40,599 | ) | (41,028 | ) | (45,179 | ) | (45,469 | ) | (51,184 | ) | (53,375 | ) | (55,903 | ) | (62,024 | ) |
Net Core Crown Debt (including NZS Fund) | | (5,138 | ) | (6,015 | ) | (7,962 | ) | (7,534 | ) | (10,784 | ) | (13,144 | ) | (16,009 | ) | (19,287 | ) |
Add back NZS Fund financial assets | | 12,883 | | 15,224 | | 12,573 | | 12,573 | | 15,439 | | 18,673 | | 22,226 | | 26,147 | |
Net Core Crown Debt | | 7,745 | | 9,209 | | 4,611 | | 5,039 | | 4,655 | | 5,529 | | 6,217 | | 6,860 | |
(2) GSF holdings of sovereign issued debt are also added back under Old GAAP
The accompanying Notes and Accounting policies are an integral part of these Statements.
Forecast Statement of Borrowings
for the years ending 30 June
Borrowings comprise financial liabilities excluding issued currency and payables. Borrowings are split into sovereign-guaranteed and non-sovereign-guaranteed borrowings. This split reflects the fact that debt held by State-owned enterprises (SOEs) and Crown entities is not explicitly guaranteed by the Crown. Any such debt that may be guaranteed would be included in the sovereign-guaranteed total, however, no debt of SOEs and Crown entities is currently guaranteed by the Crown. The Forecast Statement of Segments identifies borrowings by institutional segment.
| | | | Old | | | | | | | | | | | | | |
| | Old | | GAAP | | Old | | New | | New | | New | | New | | New | |
| | GAAP | | 2007 | | GAAP | | GAAP | | GAAP | | GAAP | | GAAP | | GAAP | |
| | 2006 | | Previous | | 2007 | | 2007 | | 2008 | | 2009 | | 2010 | | 2011 | |
($million) | | Actual | | Budget | | Forecast | | Forecast | | Forecast | | Forecast | | Forecast | | Forecast | |
| | | | | | | | | | | | | | | | | |
Borrowings: | | | | | | | | | | | | | | | | | |
Government stock | | 17,002 | | 15,982 | | 16,337 | | 15,515 | | 17,732 | | 16,884 | | 15,793 | | 17,943 | |
Treasury bills | | 4,860 | | 5,259 | | 2,577 | | 2,576 | | 2,786 | | 2,602 | | 2,614 | | 2,626 | |
Government retail stock | | 532 | | 482 | | 472 | | 363 | | 358 | | 358 | | 358 | | 358 | |
Settlement deposits with the Reserve Bank | | 1,964 | | 2,071 | | 7,523 | | 7,523 | | 7,523 | | 7,523 | | 7,523 | | 7,523 | |
Derivatives in loss | | | | | | | | 604 | | 300 | | 186 | | 174 | | 154 | |
Finance lease liabilities | | | | | | | | 966 | | 958 | | 949 | | 941 | | 937 | |
Other borrowings | | 15,069 | | 14,594 | | 15,458 | | 16,009 | | 16,707 | | 18,548 | | 19,119 | | 20,150 | |
Total borrowings | | 39,427 | | 38,388 | | 42,367 | | 43,556 | | 46,364 | | 47,050 | | 46,522 | | 49,691 | |
| | | | | | | | | | | | | | | | | |
Borrowings - sovereign guaranteed | | 29,879 | | 28,560 | | 30,819 | | 31,285 | | 33,167 | | 32,309 | | 31,247 | | 33,309 | |
Borrowings - non- sovereign guaranteed | | 9,548 | | 9,828 | | 11,548 | | 12,271 | | 13,197 | | 14,741 | | 15,275 | | 16,382 | |
The accompanying Notes and Accounting policies are an integral part of these Statements.
Statement of Actual Commitments
as at 31 March
($ million) | | As at
31 March
2007 | | As at
30 June
2006 | |
| | | | | |
Capital Commitments | | | | | |
Specialist military equipment | | 1,084 | | 535 | |
Land and buildings | | 788 | | 945 | |
Other property, plant and equipment | | 2,506 | | 2,530 | |
Other capital commitments | | 454 | | 818 | |
TEIs | | — | | 124 | |
Total Capital Commitments | | 4,832 | | 4,952 | |
| | | | | |
Operating Commitments | | | | | |
Non-cancellable accommodation leases | | 1,850 | | 1,940 | |
Other non-cancellable leases | | 2,493 | | 2,466 | |
Non-cancellable contracts for the supply of goods and services | | 1,841 | | 1,908 | |
Other operating commitments | | 6,543 | | 6,462 | |
TEIs | | — | | 303 | |
Total Operating Commitments | | 12,727 | | 13,079 | |
| | | | | |
Total Commitments | | 17,559 | | 18,031 | |
| | | | | |
Total Commitments by Institutional Segment | | | | | |
Core Crown | | 5,055 | | 4,824 | |
Crown entities | | 9,033 | | 9,627 | |
State-owned enterprises | | 3,471 | | 3,580 | |
Total Commitments | | 17,559 | | 18,031 | |
The accompanying Notes and Accounting policies are an integral part of these Statements.
Statement of Actual Contingent Liabilities
as at 31 March
($ million) | | As at
31 March
2007 | | As at
30 June
2006 | |
| | | | | |
Quantifiable Contingent Liabilities | | | | | |
Guarantees and Indemnities | | 521 | | 405 | |
Uncalled Capital | | 2,203 | | 2,592 | |
Legal Proceedings and Disputes | | 931 | | 1,032 | |
Other Contingent Liabilities | | 2,019 | | 2,073 | |
Total Quantifiable Contingent Liabilities | | 5,674 | | 6,102 | |
| | | | | |
Total Quantifiable Contingent Liabilities by Institutional Segment | | | | | |
Core Crown | | 5,495 | | 5,921 | |
Crown entities | | 61 | | 63 | |
State-owned enterprises | | 118 | | 118 | |
Total Quantifiable Contingent Liabilities | | 5,674 | | 6,102 | |
| | | | | |
Quantifiable Contingent Assets | | | | | |
Core Crown - Education and Transport | | 103 | | 106 | |
Total Quantifiable Contingent Assets | | 103 | | 106 | |
The accompanying Notes and Accounting policies are an integral part of these Statements.
A detailed Statement of Contingent Liabilities and Assets (quantified and unquantified) is outlined on pages 154 to 156 of the Specific Fiscal Risk chapter.
The Statement of Specific Risks (quantified and unquantified) is outlined on pages 138 to 153 of the Specific Fiscal Risk chapter.
Forecast Statement of Segments
Statement of Financial Performance (institutional form)
for the year ended 30 June 2006
| | Core
Crown | | Crown
entities | | State-
owned
enterprises | | Inter-
segment
eliminations | | Total
Crown | |
($ million) | | Old GAAP
2006
Actual | | Old GAAP
2006
Actual | | Old GAAP
2006
Actual | | Old GAAP
2006
Actual | | Old GAAP
2006
Actual | |
| | | | | | | | | | | |
Revenue | | | | | | | | | | | |
Taxation revenue | | 52,444 | | — | | — | | (471 | ) | 51,973 | |
Other sovereign revenue | | 663 | | 2,811 | | — | | (63 | ) | 3,411 | |
Sales of goods and services | | 884 | | 1,865 | | 11,206 | | (618 | ) | 13,337 | |
Investment revenue | | 4,496 | | 1,962 | | 1,008 | | (1,638 | ) | 5,828 | |
Other revenue | | 683 | | 18,677 | | 537 | | (17,865 | ) | 2,032 | |
Total Revenue (excluding gains) | | 59,170 | | 25,315 | | 12,751 | | (20,655 | ) | 76,581 | |
| | | | | | | | | | | |
Expenses | | | | | | | | | | | |
Social assistance and official development assistance | | 15,081 | | 1,708 | | — | | (101 | ) | 16,688 | |
Personnel expenses | | 5,935 | | 7,591 | | 1,876 | | (7 | ) | 15,395 | |
Other operating expenses | | 26,823 | | 14,288 | | 8,558 | | (18,909 | ) | 30,760 | |
Interest expenses | | 2,061 | | 189 | | 440 | | (449 | ) | 2,241 | |
Total Expenses (excluding losses) | | 49,900 | | 23,776 | | 10,874 | | (19,466 | ) | 65,084 | |
Operating Balance before gains/(losses) | | 9,270 | | 1,539 | | 1,877 | | (1,189 | ) | 11,497 | |
| | | | | | | | | | | |
Total gains/(losses) | | — | | — | | — | | — | | — | |
Net surplus/(deficit) from associates and joint ventures | | — | | 54 | | — | | — | | 54 | |
Gain/(loss) from discontinued operations | | — | | — | | — | | — | | — | |
Attributable to minority interest in Air NZ | | — | | — | | (78 | ) | — | | (78 | ) |
Operating Balance | | 9,270 | | 1,593 | | 1,799 | | (1,189 | ) | 11,473 | |
| | | | | | | | | | | |
Expenses by functional classification | | | | | | | | | | | |
Social security and welfare | | 15,598 | | 3,740 | | — | | (369 | ) | 18,969 | |
Health | | 9,547 | | 8,227 | | — | | (8,512 | ) | 9,262 | |
Education | | 9,914 | | 6,539 | | 22 | | (6,045 | ) | 10,430 | |
Transport and communications | | 1,818 | | 1,482 | | 4,456 | | (1,770 | ) | 5,986 | |
Other | | 10,962 | | 3,599 | | 5,956 | | (2,321 | ) | 18,196 | |
Interest expenses | | 2,061 | | 189 | | 440 | | (449 | ) | 2,241 | |
Forecast for future new spending | | — | | — | | — | | — | | — | |
Total Expenses | | 49,900 | | 23,776 | | 10,874 | | (19,466 | ) | 65,084 | |
| | | | | | | | | | | |
Other gains and losses by functional classification | | | | | | | | | | | |
Social security and welfare | | — | | — | | — | | — | | — | |
Education | | — | | — | | — | | — | | — | |
Core government services | | — | | — | | — | | — | | — | |
Other | | — | | — | | — | | — | | — | |
Interest expenses | | — | | — | | — | | — | | — | |
Total Other Gains and Losses | | — | | — | | — | | — | | — | |
Statement of Financial Position (institutional form)
as at 30 June 2006
| | Core
Crown | | Crown
entities | | State-
owned
enterprises | | Inter-
segment
eliminations | | Total
Crown | |
($ million) | | Old GAAP
2006
Actual | | Old GAAP
2006
Actual | | Old GAAP
2006
Actual | | Old GAAP
2006
Actual | | Old GAAP
2006
Actual | |
| | | | | | | | | | | |
Assets | | | | | | | | | | | |
Cash and cash equivalents | | 677 | | 1,975 | | 1,515 | | 1 | | 4,168 | |
Receivables | | 10,584 | | 2,132 | | 1,576 | | (238 | ) | 14,054 | |
Other financial assets | | 40,244 | | 15,578 | | 3,852 | | (7,075 | ) | 52,599 | |
Property, plant and equipment | | 24,818 | | 37,965 | | 16,191 | | (1 | ) | 78,973 | |
Equity accounted investments | | — | | — | | — | | — | | — | |
Investment in SOEs, CEs and TEIs | | 24,169 | | 5,475 | | — | | (24,169 | ) | 5,475 | |
Intangible assets and goodwill | | 260 | | 134 | | 236 | | — | | 630 | |
Other assets | | 1,532 | | 190 | | 650 | | — | | 2,372 | |
Forecast for new capital spending | | — | | — | | — | | — | | — | |
Total Assets | | 102,284 | | 63,449 | | 24,020 | | (31,482 | ) | 158,271 | |
| | | | | | | | | | | |
Liabilities | | | | | | | | | | | |
Borrowings | | 34,477 | | 4,124 | | 7,899 | | (7,073 | ) | 39,427 | |
Other liabilities | | 27,730 | | 17,503 | | 3,006 | | (798 | ) | 47,441 | |
Total Liabilities | | 62,207 | | 21,627 | | 10,905 | | (7,871 | ) | 86,868 | |
| | | | | | | | | | | |
Net Worth | | 40,077 | | 41,822 | | 13,115 | | (23,611 | ) | 71,403 | |
| | | | | | | | | | | |
Taxpayer funds | | 28,929 | | 21,086 | | 7,072 | | (23,611 | ) | 33,476 | |
Reserves | | 11,148 | | 20,736 | | 5,750 | | — | | 37,634 | |
Net Worth attributable to minority interest in Air NZ | | — | | — | | 293 | | — | | 293 | |
Net Worth | | 40,077 | | 41,822 | | 13,115 | | (23,611 | ) | 71,403 | |
The accompanying Notes and Accounting policies are an integral part of these Statements.
Statement of Financial Performance (institutional form)
for the year ended 30 June 2007
| | Core
Crown | | Crown
entities | | State-
owned
enterprises | | Inter-
segment
eliminations | | Total
Crown | |
($ million) | | Old GAAP
2007
Forecast | | Old GAAP
2007
Forecast | | Old GAAP
2007
Forecast | | Old GAAP
2007
Forecast | | Old GAAP
2007
Forecast | |
| | | | | | | | | | | |
Revenue | | | | | | | | | | | |
Taxation revenue | | 52,114 | | — | | — | | (575 | ) | 51,539 | |
Other sovereign revenue | | 604 | | 2,946 | | — | | (42 | ) | 3,508 | |
Sales of goods and services | | 955 | | 1,845 | | 10,921 | | (610 | ) | 13,111 | |
Investment revenue | | 5,104 | | 1,372 | | 513 | | (1,182 | ) | 5,807 | |
Other revenue | | 725 | | 20,587 | | 770 | | (19,844 | ) | 2,238 | |
Total Revenue (excluding gains) | | 59,502 | | 26,750 | | 12,204 | | (22,253 | ) | 76,203 | |
| | | | | | | | | | | |
Expenses | | | | | | | | | | | |
Social assistance and official development assistance | | 16,423 | | 1,959 | | — | | (107 | ) | 18,275 | |
Personnel expenses | | 5,818 | | 7,897 | | 1,964 | | (6 | ) | 15,673 | |
Other operating expenses | | 28,891 | | 16,136 | | 8,638 | | (20,989 | ) | 32,676 | |
Interest expenses | | 2,643 | | 351 | | 537 | | (468 | ) | 3,063 | |
Total Expenses (excluding losses) | | 53,775 | | 26,343 | | 11,139 | | (21,570 | ) | 69,687 | |
Operating Balance before gains/(losses) | | 5,727 | | 407 | | 1,065 | | (683 | ) | 6,516 | |
| | | | | | | | | | | |
Total gains/(losses) | | — | | — | | — | | — | | — | |
Net surplus/(deficit) from associates and joint ventures | | (10 | ) | 62 | | — | | — | | 52 | |
Gain/(loss) from discontinued operations | | — | | — | | — | | — | | — | |
Operating Balance | | 5,717 | | 469 | | 1,065 | | (683 | ) | 6,568 | |
| | | | | | | | | | | |
Expenses by functional classification | | | | | | | | | | | |
Social security and welfare | | 17,325 | | 4,525 | | — | | (382 | ) | 21,468 | |
Health | | 10,492 | | 8,812 | | — | | (9,267 | ) | 10,037 | |
Education | | 9,125 | | 6,889 | | 23 | | (6,400 | ) | 9,637 | |
Transport and communications | | 2,549 | | 1,786 | | 5,315 | | (2,410 | ) | 7,240 | |
Other | | 11,561 | | 3,980 | | 5,264 | | (2,643 | ) | 18,162 | |
Interest expenses | | 2,643 | | 351 | | 537 | | (468 | ) | 3,063 | |
Forecast for future new spending | | 80 | | — | | — | | — | | 80 | |
Total Expenses | | 53,775 | | 26,343 | | 11,139 | | (21,570 | ) | 69,687 | |
| | | | | | | | | | | |
Other gains and losses by functional classification | | | | | | | | | | | |
Social security and welfare | | — | | — | | — | | — | | — | |
Education | | — | | — | | — | | — | | — | |
Core government services | | — | | — | | — | | — | | — | |
Other | | — | | — | | — | | — | | — | |
Interest expenses | | — | | — | | — | | — | | — | |
Total Other Gains and Losses | | — | | — | | — | | — | | — | |
Statement of Financial Position (institutional form)
as at 30 June 2007
| | Core
Crown | | Crown
entities | | State-
owned
enterprises | | Inter-
segment
eliminations | | Total
Crown | |
($ million) | | Old GAAP
2007
Forecast | | Old GAAP
2007
Forecast | | Old GAAP
2007
Forecast | | Old GAAP
2007
Forecast | | Old GAAP
2007
Forecast | |
| | | | | | | | | | | |
Assets | | | | | | | | | | | |
Cash and cash equivalents | | 359 | | 2,027 | | 1,504 | | (412 | ) | 3,478 | |
Receivables | | 9,106 | | 1,983 | | 1,573 | | (690 | ) | 11,972 | |
Other financial assets | | 48,122 | | 16,820 | | 5,524 | | (7,967 | ) | 62,499 | |
Property, plant and equipment | | 25,882 | | 38,950 | | 28,010 | | — | | 92,842 | |
Equity accounted investments | | — | | — | | — | | — | | — | |
Investment in SOEs, CEs and TEIs | | 24,776 | | 5,586 | | — | | (24,776 | ) | 5,586 | |
Intangible assets and goodwill | | 220 | | 134 | | 240 | | — | | 594 | |
Other assets | | 1,239 | | 211 | | 692 | | — | | 2,142 | |
Forecast for new capital spending | | — | | — | | — | | — | | — | |
Total Assets | | 109,704 | | 65,711 | | 37,543 | | (33,845 | ) | 179,113 | |
| | | | | | | | | | | |
Liabilities | | | | | | | | | | | |
Borrowings | | 35,876 | | 4,394 | | 10,482 | | (8,385 | ) | 42,367 | |
Other liabilities | | 27,954 | | 18,675 | | 3,032 | | (1,371 | ) | 48,290 | |
Total Liabilities | | 63,830 | | 23,069 | | 13,514 | | (9,756 | ) | 90,657 | |
| | | | | | | | | | | |
Net Worth | | 45,874 | | 42,642 | | 24,029 | | (24,089 | ) | 88,456 | |
| | | | | | | | | | | |
Taxpayer funds | | 34,678 | | 21,883 | | 7,546 | | (24,089 | ) | 40,018 | |
Reserves | | 11,196 | | 20,759 | | 16,190 | | — | | 48,145 | |
Net Worth attributable to minority interest in Air NZ | | — | | — | | 293 | | — | | 293 | |
Net Worth | | 45,874 | | 42,642 | | 24,029 | | (24,089 | ) | 88,456 | |
The accompanying Notes and Accounting policies are an integral part of these Statements.
Statement of Financial Performance (institutional form)
for the year ended 30 June 2007
| | Core
Crown | | Crown
entities | | State-
owned
enterprises | | Inter-
segment
eliminations | | Total
Crown | |
($ million) | | New GAAP
2007
Forecast | | New GAAP
2007
Forecast | | New GAAP
2007
Forecast | | New GAAP
2007
Forecast | | New GAAP
2007
Forecast | |
| | | | | | | | | | | |
Revenue | | | | | | | | | | | |
Taxation revenue | | 52,230 | | — | | — | | (572 | ) | 51,658 | |
Other sovereign revenue | | 620 | | 3,631 | | — | | (560 | ) | 3,691 | |
Sales of goods and services | | 1,067 | | 11,280 | | 10,850 | | (10,634 | ) | 12,563 | |
Investment revenue | | 2,686 | | 826 | | 458 | | (898 | ) | 3,072 | |
Other revenue | | 403 | | 10,556 | | 840 | | (9,393 | ) | 2,406 | |
Total Revenue (excluding gains) | | 57,006 | | 26,293 | | 12,148 | | (22,057 | ) | 73,390 | |
| | | | | | | | | | | |
Expenses | | | | | | | | | | | |
Social assistance and official development assistance | | 16,626 | | 1,781 | | — | | (107 | ) | 18,300 | |
Personnel expenses | | 5,202 | | 7,914 | | 1,968 | | — | | 15,084 | |
Other operating expenses | | 28,686 | | 15,465 | | 8,533 | | (20,995 | ) | 31,689 | |
Interest expenses | | 2,269 | | 272 | | 672 | | (433 | ) | 2,780 | |
Total Expenses (excluding losses) | | 52,783 | | 25,432 | | 11,173 | | (21,535 | ) | 67,853 | |
Operating Balance before gains/(losses) | | 4,223 | | 861 | | 975 | | (522 | ) | 5,537 | |
| | | | | | | | | | | |
Total gains/(losses) | | 1,578 | | (698 | ) | 28 | | (211 | ) | 697 | |
Net surplus/(deficit) from associates and joint ventures | | 3 | | 62 | | 31 | | — | | 96 | |
Gain/(loss) from discontinued operations | | (3 | ) | — | | — | | — | | (3 | ) |
Operating Balance | | 5,801 | | 225 | | 1,034 | | (733 | ) | 6,327 | |
| | | | | | | | | | | |
Expenses by functional classification | | | | | | | | | | | |
Social security and welfare | | 16,891 | | 3,649 | | — | | (398 | ) | 20,142 | |
Health | | 10,486 | | 8,830 | | — | | (8,658 | ) | 10,658 | |
Education | | 9,622 | | 6,872 | | 23 | | (6,313 | ) | 10,204 | |
Transport and communications | | 2,505 | | 1,760 | | 5,279 | | (2,394 | ) | 7,150 | |
Other | | 10,930 | | 4,049 | | 5,199 | | (3,339 | ) | 16,839 | |
Interest expenses | | 2,269 | | 272 | | 672 | | (433 | ) | 2,780 | |
Forecast for future new spending | | 80 | | — | | — | | — | | 80 | |
Total Expenses | | 52,783 | | 25,432 | | 11,173 | | (21,535 | ) | 67,853 | |
| | | | | | | | | | | |
Other gains and losses by functional classification | | | | | | | | | | | |
Social security and welfare | | — | | (696 | ) | — | | (28 | ) | (724 | ) |
Education | | — | | — | | — | | — | | — | |
Core government services | | 1,176 | | — | | — | | — | | 1,176 | |
Other | | 66 | | (2 | ) | 28 | | (19 | ) | 73 | |
Interest expenses | | 336 | | — | | — | | (164 | ) | 172 | |
Total Other Gains and Losses | | 1,578 | | (698 | ) | 28 | | (211 | ) | 697 | |
Statement of Financial Position (institutional form)
as at 30 June 2007
| | Core
Crown | | Crown
entities | | State-
owned
enterprises | | Inter-
segment
eliminations | | Total
Crown | |
($ million) | | New GAAP
2007
Forecast | | New GAAP
2007
Forecast | | New GAAP
2007
Forecast | | New GAAP
2007
Forecast | | New GAAP
2007
Forecast | |
| | | | | | | | | | | |
Assets | | | | | | | | | | | |
Cash and cash equivalents | | 277 | | 2,065 | | 1,185 | | (420 | ) | 3,107 | |
Receivables | | 8,194 | | 3,435 | | 1,465 | | (765 | ) | 12,329 | |
Other financial assets | | 44,229 | | 16,857 | | 5,886 | | (8,282 | ) | 58,690 | |
Property, plant and equipment | | 26,092 | | 38,911 | | 27,667 | | — | | 92,670 | |
Equity accounted investments | | 949 | | 20 | | 130 | | (519 | ) | 580 | |
Investment in SOEs, CEs and TEIs | | 24,079 | | 5,905 | | — | | (24,082 | ) | 5,902 | |
Intangible assets and goodwill | | 745 | | 385 | | 439 | | — | | 1,569 | |
Other assets | | 905 | | 254 | | 773 | | (9 | ) | 1,923 | |
Forecast for new capital spending | | — | | — | | — | | — | | — | |
Total Assets | | 105,470 | | 67,832 | | 37,545 | | (34,077 | ) | 176,770 | |
| | | | | | | | | | | |
Liabilities | | | | | | | | | | | |
Borrowings | | 36,771 | | 4,621 | | 10,845 | | (8,681 | ) | 43,556 | |
Other liabilities | | 19,596 | | 23,527 | | 4,596 | | (4,201 | ) | 43,518 | |
Total Liabilities | | 56,367 | | 28,148 | | 15,441 | | (12,882 | ) | 87,074 | |
| | | | | | | | | | | |
Net Worth | | 49,103 | | 39,684 | | 22,104 | | (21,195 | ) | 89,696 | |
| | | | | | | | | | | |
Taxpayer funds | | 38,053 | | 20,115 | | 7,424 | | (23,740 | ) | 41,852 | |
Reserves | | 11,050 | | 19,569 | | 14,387 | | 2,545 | | 47,551 | |
Net Worth attributable to minority interest in Air NZ | | — | | — | | 293 | | — | | 293 | |
Net Worth | | 49,103 | | 39,684 | | 22,104 | | (21,195 | ) | 89,696 | |
The accompanying Notes and Accounting policies are an integral part of these Statements.
Statement of Financial Performance (institutional form)
for the year ended 30 June 2008
| | Core
Crown | | Crown
entities | | State-
owned
enterprises | | Inter-
segment
eliminations | | Total
Crown | |
($ million) | | New GAAP
2008
Forecast | | New GAAP
2008
Forecast | | New GAAP
2008
Forecast | | New GAAP
2008
Forecast | | New GAAP
2008
Forecast | |
| | | | | | | | | | | |
Revenue | | | | | | | | | | | |
Taxation revenue | | 54,707 | | — | | — | | (534 | ) | 54,173 | |
Other sovereign revenue | | 613 | | 3,678 | | — | | (598 | ) | 3,693 | |
Sales of goods and services | | 1,057 | | 11,928 | | 11,510 | | (11,242 | ) | 13,253 | |
Investment revenue | | 2,587 | | 880 | | 481 | | (582 | ) | 3,366 | |
Other revenue | | 438 | | 11,018 | | 929 | | (9,998 | ) | 2,387 | |
Total Revenue (excluding gains) | | 59,402 | | 27,504 | | 12,920 | | (22,954 | ) | 76,872 | |
| | | | | | | | | | | |
Expenses | | | | | | | | | | | |
Social assistance and official development assistance | | 17,998 | | 2,016 | | — | | (106 | ) | 19,908 | |
Personnel expenses | | 5,434 | | 8,213 | | 2,011 | | (1 | ) | 15,657 | |
Other operating expenses | | 30,419 | | 16,277 | | 9,185 | | (22,280 | ) | 33,601 | |
Interest expenses | | 2,245 | | 306 | | 704 | | (507 | ) | 2,748 | |
Total Expenses (excluding losses) | | 56,096 | | 26,812 | | 11,900 | | (22,894 | ) | 71,914 | |
Operating Balance before gains/(losses) | | 3,306 | | 692 | | 1,020 | | (60 | ) | 4,958 | |
| | | | | | | | | | | |
Total gains/(losses) | | 1,155 | | 485 | | 18 | | (281 | ) | 1,377 | |
Net surplus/(deficit) from associates and joint ventures | | 2 | | 64 | | 30 | | — | | 96 | |
Gain/(loss) from discontinued operations | | — | | — | | — | | — | | — | |
Operating Balance | | 4,463 | | 1,241 | | 1,068 | | (341 | ) | 6,431 | |
| | | | | | | | | | | |
Expenses by functional classification | | | | | | | | | | | |
Social security and welfare | | 17,698 | | 3,997 | | — | | (424 | ) | 21,271 | |
Health | | 11,613 | | 9,315 | | — | | (9,229 | ) | 11,699 | |
Education | | 9,719 | | 7,166 | | 23 | | (6,587 | ) | 10,321 | |
Transport and communications | | 2,792 | | 1,877 | | 5,589 | | (2,587 | ) | 7,671 | |
Other | | 11,715 | | 4,151 | | 5,584 | | (3,560 | ) | 17,890 | |
Interest expenses | | 2,245 | | 306 | | 704 | | (507 | ) | 2,748 | |
Forecast for future new spending | | 314 | | — | | — | | — | | 314 | |
Total Expenses | | 56,096 | | 26,812 | | 11,900 | | (22,894 | ) | 71,914 | |
| | | | | | | | | | | |
Other gains and losses by functional classification | | | | | | | | | | | |
Social security and welfare | | — | | 320 | | — | | (38 | ) | 282 | |
Education | | — | | — | | — | | 5 | | 5 | |
Core government services | | 756 | | — | | — | | (2 | ) | 754 | |
Other | | — | | 165 | | 18 | | 26 | | 209 | |
Interest expenses | | 399 | | — | | — | | (272 | ) | 127 | |
Total Other Gains and Losses | | 1,155 | | 485 | | 18 | | (281 | ) | 1,377 | |
Statement of Financial Position (institutional form)
as at 30 June 2008
| | Core
Crown | | Crown
entities | | State-
owned
enterprises | | Inter-
segment
eliminations | | Total
Crown | |
($ million) | | New GAAP
2008
Forecast | | New GAAP
2008
Forecast | | New GAAP
2008
Forecast | | New GAAP
2008
Forecast | | New GAAP
2008
Forecast | |
| | | | | | | | | | | |
Assets | | | | | | | | | | | |
Cash and cash equivalents | | 274 | | 2,052 | | 1,291 | | (421 | ) | 3,196 | |
Receivables | | 8,285 | | 3,507 | | 1,647 | | (892 | ) | 12,547 | |
Other financial assets | | 49,668 | | 18,188 | | 6,573 | | (9,184 | ) | 65,245 | |
Property, plant and equipment | | 26,492 | | 40,327 | | 29,131 | | — | | 95,950 | |
Equity accounted investments | | 1,026 | | 25 | | 148 | | (596 | ) | 603 | |
Investment in SOEs, CEs and TEIs | | 24,571 | | 5,989 | | — | | (24,516 | ) | 6,044 | |
Intangible assets and goodwill | | 805 | | 371 | | 379 | | — | | 1,555 | |
Other assets | | 916 | | 252 | | 826 | | (7 | ) | 1,987 | |
Forecast for new capital spending | | 184 | | — | | — | | — | | 184 | |
Total Assets | | 112,221 | | 70,711 | | 39,995 | | (35,616 | ) | 187,311 | |
| | | | | | | | | | | |
Liabilities | | | | | | | | | | | |
Borrowings | | 38,876 | | 4,773 | | 12,155 | | (9,440 | ) | 46,364 | |
Other liabilities | | 19,770 | | 24,544 | | 4,882 | | (4,310 | ) | 44,886 | |
Total Liabilities | | 58,646 | | 29,317 | | 17,037 | | (13,750 | ) | 91,250 | |
| | | | | | | | | | | |
Net Worth | | 53,575 | | 41,394 | | 22,958 | | (21,866 | ) | 96,061 | |
| | | | | | | | | | | |
Taxpayer funds | | 42,525 | | 21,827 | | 8,258 | | (24,371 | ) | 48,239 | |
Reserves | | 11,050 | | 19,567 | | 14,407 | | 2,505 | | 47,529 | |
Net Worth attributable to minority interest in Air NZ | | — | | — | | 293 | | — | | 293 | |
Net Worth | | 53,575 | | 41,394 | | 22,958 | | (21,866 | ) | 96,061 | |
The accompanying Notes and Accounting policies are an integral part of these Statements.
Statement of Financial Performance (institutional form)
for the year ended 30 June 2009
| | Core
Crown | | Crown
entities | | State-
owned
enterprises | | Inter-
segment
eliminations | | Total
Crown | |
($ million) | | New GAAP
2009
Forecast | | New GAAP
2009
Forecast | | New GAAP
2009
Forecast | | New GAAP
2009
Forecast | | New GAAP
2009
Forecast | |
| | | | | | | | | | | |
Revenue | | | | | | | | | | | |
Taxation revenue | | 56,280 | | — | | — | | (589 | ) | 55,691 | |
Other sovereign revenue | | 603 | | 3,792 | | — | | (638 | ) | 3,757 | |
Sales of goods and services | | 1,063 | | 11,951 | | 12,097 | | (11,241 | ) | 13,870 | |
Investment revenue | | 2,787 | | 924 | | 522 | | (648 | ) | 3,585 | |
Other revenue | | 439 | | 11,330 | | 917 | | (10,013 | ) | 2,673 | |
Total Revenue (excluding gains) | | 61,172 | | 27,997 | | 13,536 | | (23,129 | ) | 79,576 | |
| | | | | | | | | | | |
Expenses | | | | | | | | | | | |
Social assistance and official development assistance | | 18,852 | | 2,235 | | — | | (112 | ) | 20,975 | |
Personnel expenses | | 5,459 | | 8,252 | | 2,076 | | — | | 15,787 | |
Other operating expenses | | 32,327 | | 16,585 | | 9,604 | | (22,364 | ) | 36,152 | |
Interest expenses | | 2,181 | | 309 | | 744 | | (529 | ) | 2,705 | |
Total Expenses (excluding losses) | | 58,819 | | 27,381 | | 12,424 | | (23,005 | ) | 75,619 | |
Operating Balance before gains/(losses) | | 2,353 | | 616 | | 1,112 | | (124 | ) | 3,957 | |
| | | | | | | | | | | |
Total gains/(losses) | | 1,312 | | 488 | | — | | (284 | ) | 1,516 | |
Net surplus/(deficit) from associates and joint ventures | | 2 | | 65 | | 29 | | — | | 96 | |
Gain/(loss) from discontinued operations | | — | | — | | — | | — | | — | |
Attributable to minority interest in Air NZ | | — | | — | | — | | — | | — | |
Operating Balance | | 3,667 | | 1,169 | | 1,141 | | (408 | ) | 5,569 | |
| | | | | | | | | | | |
Expenses by functional classification | | | | | | | | | | | |
Social security and welfare | | 18,172 | | 4,296 | | — | | (443 | ) | 22,025 | |
Health | | 11,634 | | 9,556 | | — | | (9,203 | ) | 11,987 | |
Education | | 9,835 | | 7,237 | | 23 | | (6,635 | ) | 10,460 | |
Transport and communications | | 2,796 | | 1,839 | | 5,774 | | (2,650 | ) | 7,759 | |
Other | | 11,964 | | 4,144 | | 5,883 | | (3,545 | ) | 18,446 | |
Interest expenses | | 2,181 | | 309 | | 744 | | (529 | ) | 2,705 | |
Forecast for future new spending | | 2,237 | | — | | — | | — | | 2,237 | |
Total Expenses | | 58,819 | | 27,381 | | 12,424 | | (23,005 | ) | 75,619 | |
| | | | | | | | | | | |
Other gains and losses by functional classification | | | | | | | | | | | |
Social security and welfare | | — | | 307 | | — | | (36 | ) | 271 | |
Education | | — | | — | | — | | 5 | | 5 | |
Core government services | | 920 | | — | | — | | (3 | ) | 917 | |
Other | | — | | 181 | | — | | 40 | | 221 | |
Interest expenses | | 392 | | — | | — | | (290 | ) | 102 | |
Total Other Gains and Losses | | 1,312 | | 488 | | — | | (284 | ) | 1,516 | |
Statement of Financial Position (institutional form)
as at 30 June 2009
| | Core
Crown | | Crown
entities | | State-
owned
enterprises | | Inter-
segment
eliminations | | Total
Crown | |
($ million) | | New GAAP
2009
Forecast | | New GAAP
2009
Forecast | | New GAAP
2009
Forecast | | New GAAP
2009
Forecast | | New GAAP
2009
Forecast | |
| | | | | | | | | | | |
Assets | | | | | | | | | | | |
Cash and cash equivalents | | 318 | | 1,998 | | 1,539 | | (420 | ) | 3,435 | |
Receivables | | 8,960 | | 3,566 | | 1,729 | | (993 | ) | 13,262 | |
Other financial assets | | 51,486 | | 19,429 | | 7,833 | | (9,568 | ) | 69,180 | |
Property, plant and equipment | | 26,263 | | 41,372 | | 30,032 | | — | | 97,667 | |
Equity accounted investments | | 1,096 | | 31 | | 171 | | (666 | ) | 632 | |
Investment in SOEs, CEs and TEIs | | 24,763 | | 6,063 | | — | | (24,646 | ) | 6,180 | |
Intangible assets and goodwill | | 805 | | 347 | | 376 | | 1 | | 1,529 | |
Other assets | | 961 | | 250 | | 849 | | (5 | ) | 2,055 | |
Forecast for new capital spending | | 751 | | — | | — | | — | | 751 | |
Total Assets | | 115,403 | | 73,056 | | 42,529 | | (36,297 | ) | 194,691 | |
| | | | | | | | | | | |
Liabilities | | | | | | | | | | | |
Borrowings | | 38,371 | | 4,851 | | 13,673 | | (9,845 | ) | 47,050 | |
Other liabilities | | 19,787 | | 25,454 | | 5,170 | | (4,415 | ) | 45,996 | |
Total Liabilities | | 58,158 | | 30,305 | | 18,843 | | (14,260 | ) | 93,046 | |
| | | | | | | | | | | |
Net Worth | | 57,245 | | 42,751 | | 23,686 | | (22,037 | ) | 101,645 | |
| | | | | | | | | | | |
Taxpayer funds | | 46,195 | | 23,182 | | 9,003 | | (24,536 | ) | 53,844 | |
Reserves | | 11,050 | | 19,569 | | 14,390 | | 2,499 | | 47,508 | |
Net Worth attributable to minority interest in Air NZ | | — | | — | | 293 | | — | | 293 | |
Net Worth | | 57,245 | | 42,751 | | 23,686 | | (22,037 | ) | 101,645 | |
The accompanying Notes and Accounting policies are an integral part of these Statements.
Statement of Financial Performance (institutional form)
for the year ended 30 June 2010
| | Core
Crown | | Crown
entities | | State-
owned
enterprises | | Inter-
segment
eliminations | | Total
Crown | |
($ million) | | New GAAP
2010
Forecast | | New GAAP
2010
Forecast | | New GAAP
2010
Forecast | | New GAAP
2010
Forecast | | New GAAP
2010
Forecast | |
| | | | | | | | | | | |
Revenue | | | | | | | | | | | |
Taxation revenue | | 58,877 | | — | | — | | (608 | ) | 58,269 | |
Other sovereign revenue | | 609 | | 3,909 | | — | | (672 | ) | 3,846 | |
Sales of goods and services | | 1,068 | | 12,017 | | 12,612 | | (11,266 | ) | 14,431 | |
Investment revenue | | 2,826 | | 968 | | 526 | | (684 | ) | 3,636 | |
Other revenue | | 445 | | 11,450 | | 889 | | (9,788 | ) | 2,996 | |
Total Revenue (excluding gains) | | 63,825 | | 28,344 | | 14,027 | | (23,018 | ) | 83,178 | |
| | | | | | | | | | | |
Expenses | | | | | | | | | | | |
Social assistance and official development assistance | | 19,837 | | 2,369 | | — | | (111 | ) | 22,095 | |
Personnel expenses | | 5,431 | | 8,401 | | 2,118 | | — | | 15,950 | |
Other operating expenses | | 34,310 | | 16,837 | | 10,007 | | (22,194 | ) | 38,960 | |
Interest expenses | | 2,099 | | 322 | | 774 | | (552 | ) | 2,643 | |
Total Expenses (excluding losses) | | 61,677 | | 27,929 | | 12,899 | | (22,857 | ) | 79,648 | |
Operating Balance before gains/(losses) | | 2,148 | | 415 | | 1,128 | | (161 | ) | 3,530 | |
| | | | | | | | | | | |
Total gains/(losses) | | 1,480 | | 494 | | (2 | ) | (288 | ) | 1,684 | |
Net surplus/(deficit) from associates and joint ventures | | 2 | | 65 | | 29 | | — | | 96 | |
Gain/(loss) from discontinued operations | | — | | — | | — | | — | | — | |
Attributable to minority interest in Air NZ | | — | | — | | — | | — | | — | |
Operating Balance | | 3,630 | | 974 | | 1,155 | | (449 | ) | 5,310 | |
| | | | | | | | | | | |
Expenses by functional classification | | | | | | | | | | | |
Social security and welfare | | 18,788 | | 4,555 | | — | | (455 | ) | 22,888 | |
Health | | 11,665 | | 9,824 | | — | | (9,199 | ) | 12,290 | |
Education | | 9,912 | | 7,284 | | 23 | | (6,658 | ) | 10,561 | |
Transport and communications | | 2,566 | | 1,744 | | 5,953 | | (2,422 | ) | 7,841 | |
Other | | 12,411 | | 4,200 | | 6,149 | | (3,571 | ) | 19,189 | |
Interest expenses | | 2,099 | | 322 | | 774 | | (552 | ) | 2,643 | |
Forecast for future new spending | | 4,236 | | — | | — | | — | | 4,236 | |
Total Expenses | | 61,677 | | 27,929 | | 12,899 | | (22,857 | ) | 79,648 | |
| | | | | | | | | | | |
Other gains and losses by functional classification | | | | | | | | | | | |
Social security and welfare | | — | | 296 | | — | | (34 | ) | 262 | |
Education | | — | | — | | — | | 5 | | 5 | |
Core government services | | 1,092 | | — | | — | | (4 | ) | 1,088 | |
Other | | — | | 198 | | (2 | ) | 51 | | 247 | |
Interest expenses | | 388 | | — | | — | | (306 | ) | 82 | |
Total Other Gains and Losses | | 1,480 | | 494 | | (2 | ) | (288 | ) | 1,684 | |
Statement of Financial Position (institutional form)
as at 30 June 2010
| | Core
Crown | | Crown
entities | | State-
owned
enterprises | | Inter-
segment
eliminations | | Total
Crown | |
($ million) | | New GAAP
2010
Forecast | | New GAAP
2010
Forecast | | New GAAP
2010
Forecast | | New GAAP
2010
Forecast | | New GAAP
2010
Forecast | |
| | | | | | | | | | | |
Assets | | | | | | | | | | | |
Cash and cash equivalents | | 347 | | 1,948 | | 1,443 | | (419 | ) | 3,319 | |
Receivables | | 8,914 | | 3,659 | | 1,782 | | (965 | ) | 13,390 | |
Other financial assets | | 53,621 | | 20,684 | | 7,814 | | (9,957 | ) | 72,162 | |
Property, plant and equipment | | 26,071 | | 42,225 | | 31,380 | | (1 | ) | 99,675 | |
Equity accounted investments | | 1,102 | | 36 | | 196 | | (672 | ) | 662 | |
Investment in SOEs, CEs and TEIs | | 24,896 | | 6,134 | | — | | (24,778 | ) | 6,252 | |
Intangible assets and goodwill | | 768 | | 321 | | 367 | | — | | 1,456 | |
Other assets | | 970 | | 250 | | 872 | | (5 | ) | 2,087 | |
Forecast for new capital spending | | 1,557 | | — | | — | | — | | 1,557 | |
Total Assets | | 118,246 | | 75,257 | | 43,854 | | (36,797 | ) | 200,560 | |
| | | | | | | | | | | |
Liabilities | | | | | | | | | | | |
Borrowings | | 37,665 | | 4,919 | | 14,185 | | (10,247 | ) | 46,522 | |
Other liabilities | | 19,652 | | 26,493 | | 5,252 | | (4,383 | ) | 47,014 | |
Total Liabilities | | 57,317 | | 31,412 | | 19,437 | | (14,630 | ) | 93,536 | |
| | | | | | | | | | | |
Net Worth | | 60,929 | | 43,845 | | 24,417 | | (22,167 | ) | 107,024 | |
| | | | | | | | | | | |
Taxpayer funds | | 49,879 | | 24,277 | | 9,746 | | (24,666 | ) | 59,236 | |
Reserves | | 11,050 | | 19,568 | | 14,378 | | 2,499 | | 47,495 | |
Net Worth attributable to minority interest in Air NZ | | — | | — | | 293 | | — | | 293 | |
Net Worth | | 60,929 | | 43,845 | | 24,417 | | (22,167 | ) | 107,024 | |
The accompanying Notes and Accounting policies are an integral part of these Statements.
Statement of Financial Performance (institutional form)
for the year ended 30 June 2011
| | Core
Crown | | Crown
entities | | State-
owned
enterprises | | Inter-
segment
eliminations | | Total
Crown | |
($ million) | | New GAAP
2011
Forecast | | New GAAP
2011
Forecast | | New GAAP
2011
Forecast | | New GAAP
2011
Forecast | | New GAAP
2011
Forecast | |
| | | | | | | | | | | |
Revenue | | | | | | | | | | | |
Taxation revenue | | 61,960 | | — | | — | | (609 | ) | 61,351 | |
Other sovereign revenue | | 614 | | 4,023 | | — | | (706 | ) | 3,931 | |
Sales of goods and services | | 1,082 | | 12,042 | | 12,936 | | (11,270 | ) | 14,790 | |
Investment revenue | | 2,936 | | 1,014 | | 524 | | (718 | ) | 3,756 | |
Other revenue | | 401 | | 11,518 | | 754 | | (9,682 | ) | 2,991 | |
Total Revenue (excluding gains) | | 66,993 | | 28,597 | | 14,214 | | (22,985 | ) | 86,819 | |
| | | | | | | | | | | |
Expenses | | | | | | | | | | | |
Social assistance and official development assistance | | 20,767 | | 2,537 | | — | | (114 | ) | 23,190 | |
Personnel expenses | | 5,456 | | 8,400 | | 2,151 | | (1 | ) | 16,006 | |
Other operating expenses | | 36,431 | | 16,975 | | 10,245 | | (22,141 | ) | 41,510 | |
Interest expenses | | 2,244 | | 326 | | 779 | | (583 | ) | 2,766 | |
Total Expenses (excluding losses) | | 64,898 | | 28,238 | | 13,175 | | (22,839 | ) | 83,472 | |
Operating Balance before gains/(losses) | | 2,095 | | 359 | | 1,039 | | (146 | ) | 3,347 | |
| | | | | | | | | | | |
Total gains/(losses) | | 1,684 | | 535 | | (2 | ) | (295 | ) | 1,922 | |
Net surplus/(deficit) from associates and joint ventures | | 2 | | 66 | | 28 | | 1 | | 97 | |
Gain/(loss) from discontinued operations | | — | | — | | — | | — | | — | |
Attributable to minority interest in Air NZ | | — | | — | | — | | — | | — | |
Operating Balance | | 3,781 | | 960 | | 1,065 | | (440 | ) | 5,366 | |
| | | | | | | | | | | |
Expenses by functional classification | | | | | | | | | | | |
Social security and welfare | | 19,437 | | 4,802 | | — | | (471 | ) | 23,768 | |
Health | | 11,662 | | 9,811 | | — | | (9,186 | ) | 12,287 | |
Education | | 9,998 | | 7,294 | | 23 | | (6,644 | ) | 10,671 | |
Transport and communications | | 2,476 | | 1,749 | | 6,034 | | (2,477 | ) | 7,782 | |
Other | | 12,835 | | 4,256 | | 6,339 | | (3,478 | ) | 19,952 | |
Interest expenses | | 2,244 | | 326 | | 779 | | (583 | ) | 2,766 | |
Forecast for future new spending | | 6,246 | | — | | — | | — | | 6,246 | |
Total Expenses | | 64,898 | | 28,238 | | 13,175 | | (22,839 | ) | 83,472 | |
| | | | | | | | | | | |
Other gains and losses by functional classification | | | | | | | | | | | |
Social security and welfare | | — | | 317 | | — | | (38 | ) | 279 | |
Education | | — | | — | | — | | 5 | | 5 | |
Core government services | | 1,288 | | — | | — | | (2 | ) | 1,286 | |
Other | | — | | 218 | | (2 | ) | 34 | | 250 | |
Interest expenses | | 396 | | — | | — | | (294 | ) | 102 | |
Total Other Gains and Losses | | 1,684 | | 535 | | (2 | ) | (295 | ) | 1,922 | |
Statement of Financial Position (institutional form)
as at 30 June 2011
| | Core
Crown | | Crown
entities | | State-
owned
enterprises | | Inter-
segment
eliminations | | Total
Crown | |
($ million) | | New GAAP
2011
Forecast | | New GAAP
2011
Forecast | | New GAAP
2011
Forecast | | New GAAP
2011
Forecast | | New GAAP
2011
Forecast | |
| | | | | | | | | | | |
Assets | | | | | | | | | | | |
Cash and cash equivalents | | 377 | | 1,915 | | 1,400 | | (420 | ) | 3,272 | |
Receivables | | 8,806 | | 3,746 | | 1,823 | | (962 | ) | 13,413 | |
Other financial assets | | 59,316 | | 21,940 | | 7,797 | | (10,403 | ) | 78,650 | |
Property, plant and equipment | | 25,604 | | 43,071 | | 33,171 | | — | | 101,846 | |
Equity accounted investments | | 1,102 | | 36 | | 218 | | (671 | ) | 685 | |
Investment in SOEs, CEs and TEIs | | 24,970 | | 6,200 | | — | | (24,852 | ) | 6,318 | |
Intangible assets and goodwill | | 740 | | 298 | | 355 | | (1 | ) | 1,392 | |
Other assets | | 969 | | 250 | | 888 | | (3 | ) | 2,104 | |
Forecast for new capital spending | | 2,460 | | — | | — | | — | | 2,460 | |
Total Assets | | 124,344 | | 77,456 | | 45,652 | | (37,312 | ) | 210,140 | |
| | | | | | | | | | | |
Liabilities | | | | | | | | | | | |
Borrowings | | 40,098 | | 5,039 | | 15,262 | | (10,712 | ) | 49,687 | |
Other liabilities | | 19,531 | | 27,562 | | 5,324 | | (4,385 | ) | 48,032 | |
Total Liabilities | | 59,629 | | 32,601 | | 20,586 | | (15,097 | ) | 97,719 | |
| | | | | | | | | | | |
Net Worth | | 64,715 | | 44,855 | | 25,066 | | (22,215 | ) | 112,421 | |
| | | | | | | | | | | |
Taxpayer funds | | 53,665 | | 25,287 | | 10,393 | | (24,715 | ) | 64,630 | |
Reserves | | 11,050 | | 19,568 | | 14,380 | | 2,500 | | 47,498 | |
Net Worth attributable to minority interest in Air NZ | | — | | — | | 293 | | — | | 293 | |
Net Worth | | 64,715 | | 44,855 | | 25,066 | | (22,215 | ) | 112,421 | |
The accompanying Notes and Accounting policies are an integral part of these Statements.
Notes to the Forecast Financial Statements
| | Old | | Old
GAAP | | Old | | New | | New | | New | | New | | New | |
($ million) | | GAAP
2006
Actual | | 2007
Previous
Budget | | GAAP
2007
Forecast | | GAAP
2007
Forecast | | GAAP
2008
Forecast | | GAAP
2009
Forecast | | GAAP
2010
Forecast | | GAAP
2011
Forecast | |
| | | | | | | | | | | | | | | | | |
NOTE 1a: Revenue Collected Through the Crown’s Sovereign Power | | | | | | | | | | | | | | | | | |
| | | | | | | | | | | | | | | | | |
Income Tax Revenue (accrual) | | | | | | | | | | | | | | | | | |
| | | | | | | | | | | | | | | | | |
Direct Income Tax | | | | | | | | | | | | | | | | | |
Individuals | | | | | | | | | | | | | | | | | |
Source deductions | | 19,936 | | 20,534 | | 21,012 | | 21,012 | | 22,334 | | 23,695 | | 25,094 | | 26,619 | |
Other persons | | 4,940 | | 4,393 | | 4,474 | | 4,474 | | 4,553 | | 4,774 | | 5,169 | | 5,529 | |
Refunds | | (953 | ) | (962 | ) | (1,085 | ) | (1,085 | ) | (1,102 | ) | (1,130 | ) | (1,205 | ) | (1,260 | ) |
Fringe benefit tax | | 450 | | 425 | | 455 | | 455 | | 474 | | 498 | | 519 | | 546 | |
Total individuals | | 24,373 | | 24,390 | | 24,856 | | 24,856 | | 26,259 | | 27,837 | | 29,577 | | 31,434 | |
| | | | | | | | | | | | | | | | | |
Corporate Tax | | | | | | | | | | | | | | | | | |
Gross companies tax | | 9,413 | | 7,966 | | 7,878 | | 7,995 | | 8,222 | | 7,469 | | 7,765 | | 8,190 | |
Refunds | | (270 | ) | (205 | ) | (252 | ) | (252 | ) | (255 | ) | (260 | ) | (260 | ) | (260 | ) |
Non-resident withholding tax | | 1,096 | | 874 | | 1,142 | | 1,142 | | 1,005 | | 1,002 | | 1,020 | | 1,009 | |
Foreign-source dividend withholding payments | | 160 | | 220 | | 146 | | 146 | | 102 | | 86 | | 86 | | 86 | |
Total corporate tax | | 10,399 | | 8,855 | | 8,914 | | 9,031 | | 9,074 | | 8,297 | | 8,611 | | 9,025 | |
| | | | | | | | | | | | | | | | | |
Other Income Tax | | | | | | | | | | | | | | | | | |
Resident withholding tax on interest income | | 1,879 | | 2,079 | | 2,156 | | 2,156 | | 2,340 | | 2,441 | | 2,362 | | 2,376 | |
Resident withholding tax on dividend income | | 74 | | 56 | | 89 | | 89 | | 92 | | 114 | | 249 | | 296 | |
Estate and gift duties | | 3 | | 2 | | 4 | | 4 | | 2 | | 2 | | 2 | | 2 | |
Total other income tax | | 1,956 | | 2,137 | | 2,249 | | 2,249 | | 2,434 | | 2,557 | | 2,613 | | 2,674 | |
Total direct income tax | | 36,728 | | 35,382 | | 36,019 | | 36,136 | | 37,767 | | 38,691 | | 40,801 | | 43,133 | |
| | | | | | | | | | | | | | | | | |
Indirect Tax | | | | | | | | | | | | | | | | | |
Goods and Services Tax | | | | | | | | | | | | | | | | | |
Gross goods and services tax | | 18,241 | | 18,542 | | 19,053 | | 19,054 | | 19,726 | | 20,704 | | 21,729 | | 22,844 | |
Refunds | | (7,664 | ) | (8,028 | ) | (8,332 | ) | (8,332 | ) | (8,231 | ) | (8,711 | ) | (9,396 | ) | (9,948 | ) |
Total goods and services tax | | 10,577 | | 10,514 | | 10,721 | | 10,722 | | 11,495 | | 11,993 | | 12,333 | | 12,896 | |
| | | | | | | | | | | | | | | | | |
Other Indirect Taxation | | | | | | | | | | | | | | | | | |
Petroleum fuels excise | | 852 | | 914 | | 881 | | 881 | | 903 | | 921 | | 938 | | 955 | |
Tobacco excise(3) | | 834 | | 145 | | 244 | | 244 | | 148 | | 150 | | 152 | | 154 | |
Customs duty | | 1,083 | | 1,773 | | 1,760 | | 1,760 | | 1,865 | | 1,849 | | 1,873 | | 1,921 | |
Road user charges | | 731 | | 793 | | 785 | | 785 | | 877 | | 933 | | 988 | | 1,043 | |
Alcohol excise | | 516 | | 537 | | 559 | | 559 | | 586 | | 614 | | 641 | | 670 | |
Gaming duties | | 275 | | 256 | | 230 | | 231 | | 215 | | 214 | | 212 | | 212 | |
Motor vehicle fees | | 221 | | 223 | | 220 | | 220 | | 219 | | 228 | | 233 | | 239 | |
Energy resources levies | | 73 | | 58 | | 49 | | 49 | | 34 | | 34 | | 34 | | 64 | |
Approved issuer levy (AIL) and cheque duty | | 83 | | 74 | | 71 | | 71 | | 64 | | 64 | | 64 | | 64 | |
Total other indirect taxation | | 4,668 | | 4,773 | | 4,799 | | 4,800 | | 4,911 | | 5,007 | | 5,135 | | 5,322 | |
Total indirect taxation | | 15,245 | | 15,287 | | 15,520 | | 15,522 | | 16,406 | | 17,000 | | 17,468 | | 18,218 | |
Total taxation revenue | | 51,973 | | 50,669 | | 51,539 | | 51,658 | | 54,173 | | 55,691 | | 58,269 | | 61,351 | |
| | | | | | | | | | | | | | | | | |
Other Sovereign Revenues (accrual) | | | | | | | | | | | | | | | | | |
ACC levies | | 2,326 | | 2,189 | | 2,454 | | 2,647 | | 2,654 | | 2,726 | | 2,807 | | 2,883 | |
Fire Service levies | | 254 | | 253 | | 259 | | 259 | | 261 | | 263 | | 265 | | 267 | |
EQC levies | | 82 | | 83 | | 84 | | 84 | | 86 | | 87 | | 89 | | 91 | |
Other levies | | 749 | | 654 | | 711 | | 701 | | 692 | | 681 | | 685 | | 690 | |
Total Other Sovereign Revenues | | 3,411 | | 3,179 | | 3,508 | | 3,691 | | 3,693 | | 3,757 | | 3,846 | | 3,931 | |
Total Sovereign Revenue | | 55,384 | | 53,848 | | 55,047 | | 55,349 | | 57,866 | | 59,448 | | 62,115 | | 65,282 | |
(3) From 2006/07 a larger portion of tobacco products will be supplied by imports. This will increase customs duty at the expense of tobacco excise duty.
| | Old
GAAP | | Old
GAAP
2007 | | Old
GAAP | | New
GAAP | | New
GAAP | | New
GAAP | | New
GAAP | | New
GAAP | |
($ million) | | 2006
Actual | | Previous
Budget | | 2007
Forecast | | 2007
Forecast | | 2008
Forecast | | 2009
Forecast | | 2010
Forecast | | 2011
Forecast | |
| | | | | | | | | | | | | | | | | |
NOTE 1b: Receipts Collected Through the Crown’s Sovereign Power | | | | | | | | | | | | | | | | | |
| | | | | | | | | | | | | | | | | |
Income Tax Receipts (cash) | | | | | | | | | | | | | | | | | |
| | | | | | | | | | | | | | | | | |
Direct Income Tax | | | | | | | | | | | | | | | | | |
Individuals | | | | | | | | | | | | | | | | | |
Source deductions | | 19,897 | | 20,534 | | 21,034 | | 21,034 | | 22,334 | | 23,695 | | 25,094 | | 26,619 | |
Other persons | | 4,883 | | 5,189 | | 5,296 | | 5,296 | | 5,430 | | 5,568 | | 6,105 | | 6,510 | |
Refunds | | (1,503 | ) | (1,780 | ) | (1,858 | ) | (1,858 | ) | (2,017 | ) | (2,065 | ) | (2,185 | ) | (2,287 | ) |
Fringe benefit tax | | 450 | | 421 | | 469 | | 469 | | 470 | | 493 | | 515 | | 541 | |
Total individuals | | 23,727 | | 24,364 | | 24,941 | | 24,941 | | 26,217 | | 27,691 | | 29,529 | | 31,383 | |
| | | | | | | | | | | | | | | | | |
Corporate Tax | | | | | | | | | | | | | | | | | |
Gross companies tax | | 8,512 | | 8,602 | | 8,865 | | 9,072 | | 9,184 | | 7,625 | | 8,269 | | 8,713 | |
Refunds | | (833 | ) | (746 | ) | (1,091 | ) | (1,091 | ) | (1,041 | ) | (889 | ) | (851 | ) | (843 | ) |
Non-resident withholding tax | | 1,093 | | 874 | | 1,092 | | 1,092 | | 981 | | 983 | | 995 | | 1,031 | |
Foreign-source dividend withholding payments | | 157 | | 220 | | 148 | | 148 | | 102 | | 86 | | 86 | | 86 | |
Total corporate tax | | 8,929 | | 8,950 | | 9,014 | | 9,221 | | 9,226 | | 7,805 | | 8,499 | | 8,987 | |
| | | | | | | | | | | | | | | | | |
Other Income Tax | | | | | | | | | | | | | | | | | |
Resident withholding tax on interest income | | 1,862 | | 2,078 | | 2,154 | | 2,154 | | 2,340 | | 2,441 | | 2,362 | | 2,376 | |
Resident withholding tax on dividend income | | 74 | | 56 | | 91 | | 91 | | 92 | | 114 | | 249 | | 296 | |
Estate and gift duties | | 2 | | 2 | | 4 | | 4 | | 2 | | 2 | | 2 | | 2 | |
Total other income tax | | 1,938 | | 2,136 | | 2,249 | | 2,249 | | 2,434 | | 2,557 | | 2,613 | | 2,674 | |
Total direct income tax | | 34,594 | | 35,450 | | 36,204 | | 36,411 | | 37,877 | | 38,053 | | 40,641 | | 43,044 | |
| | | | | | | | | | | | | | | | | |
Indirect Tax | | | | | | | | | | | | | | | | | |
Goods and Services Tax | | | | | | | | | | | | | | | | | |
Gross goods and services tax | | 17,705 | | 18,183 | | 18,415 | | 18,393 | | 19,354 | | 20,345 | | 21,365 | | 22,483 | |
Refunds | | (7,216 | ) | (7,669 | ) | (7,604 | ) | (7,604 | ) | (7,877 | ) | (8,357 | ) | (9,042 | ) | (9,594 | ) |
Total goods and services tax | | 10,489 | | 10,514 | | 10,811 | | 10,789 | | 11,477 | | 11,988 | | 12,323 | | 12,889 | |
| | | | | | | | | | | | | | | | | |
Other Indirect Taxation | | | | | | | | | | | | | | | | | |
Petroleum fuels excise | | 847 | | 914 | | 881 | | 881 | | 903 | | 921 | | 938 | | 955 | |
Tobacco excise(4) | | 842 | | 145 | | 244 | | 244 | | 148 | | 150 | | 152 | | 154 | |
Customs duty | | 1,074 | | 1,773 | | 1,760 | | 1,760 | | 1,865 | | 1,849 | | 1,873 | | 1,921 | |
Road user charges | | 721 | | 793 | | 785 | | 785 | | 877 | | 933 | | 988 | | 1,043 | |
Alcohol excise | | 514 | | 537 | | 559 | | 559 | | 586 | | 614 | | 641 | | 670 | |
Gaming duties | | 273 | | 257 | | 235 | | 236 | | 215 | | 214 | | 212 | | 212 | |
Motor vehicle fees | | 199 | | 223 | | 220 | | 220 | | 219 | | 228 | | 233 | | 239 | |
Energy resources levies | | 73 | | 58 | | 53 | | 53 | | 35 | | 34 | | 34 | | 61 | |
Approved issuer levy (AIL) and cheque duty | | 80 | | 74 | | 71 | | 71 | | 64 | | 64 | | 64 | | 64 | |
Total other indirect taxation | | 4,623 | | 4,774 | | 4,808 | | 4,809 | | 4,912 | | 5,007 | | 5,135 | | 5,319 | |
Total indirect taxation | | 15,112 | | 15,288 | | 15,619 | | 15,598 | | 16,389 | | 16,995 | | 17,458 | | 18,208 | |
Total taxation receipts | | 49,706 | | 50,738 | | 51,823 | | 52,009 | | 54,266 | | 55,048 | | 58,099 | | 61,252 | |
| | | | | | | | | | | | | | | | | |
Other Sovereign Receipts (cash) | | | | | | | | | | | | | | | | | |
ACC levies | | 2,256 | | 2,105 | | 2,401 | | 2,585 | | 2,561 | | 2,662 | | 2,764 | | 2,844 | |
Fire Service levies | | 254 | | 253 | | 262 | | 262 | | 263 | | 265 | | 267 | | 269 | |
EQC levies | | 83 | | 83 | | 85 | | 85 | | 86 | | 88 | | 90 | | 91 | |
Other levies | | 653 | | 606 | | 639 | | 523 | | 562 | | 592 | | 607 | | 621 | |
Total Other Sovereign Receipts | | 3,246 | | 3,047 | | 3,387 | | 3,455 | | 3,472 | | 3,607 | | 3,728 | | 3,825 | |
Total Sovereign Receipts | | 52,952 | | 53,785 | | 55,210 | | 55,464 | | 57,738 | | 58,655 | | 61,827 | | 65,077 | |
(4) From 2006/07 a larger portion of tobacco products will be supplied by imports. This will increase customs duty at the expense of tobacco excise duty.
| | Old
GAAP | | Old
GAAP
2007 | | Old
GAAP | | New
GAAP | | New
GAAP | | New
GAAP | | New
GAAP | | New
GAAP | |
| | 2006 | | Previous | | 2007 | | 2007 | | 2008 | | 2009 | | 2010 | | 2011 | |
($ million) | | Actual | | Budget | | Forecast | | Forecast | | Forecast | | Forecast | | Forecast | | Forecast | |
NOTE 2: Sale of Goods and Services
The Statement of Segments shows the sale of goods and services as a total for each institutional segment of the Crown (ie, total sales for Core Crown, Crown entities and SOEs). The total for Crown entities includes such items as lottery sales, housing rental, Crown Research Institute sales. The total sales of SOEs represents the majority of their income from electricity generation and distribution services, postal services, advertising, air travel sales.
Total revenue from sale and exchange of goods | | | | | | | | 7,151 | | 7,550 | | 7,899 | | 8,290 | | 8,538 | |
Total revenue from sale and exchange of services | | | | | | | | 5,412 | | 5,703 | | 5,971 | | 6,141 | | 6,252 | |
Total sale of goods and services | | 13,337 | | 12,715 | | 13,111 | | 12,563 | | 13,253 | | 13,870 | | 14,431 | | 14,790 | |
NOTE 3: Interest Revenue and Dividends
Interest revenue is calculated using the effective interest rate as stated in the note on accounting policies. One consequence of this requirement is that an interest rate is imputed on financial assets that do not earn interest (or have a below market interest rate), such as student loans.
Interest revenue from student loans | | 344 | | 87 | | 453 | | 362 | | 391 | | 423 | | 453 | | 483 | |
Interest revenue on other financial assets | | 5,367 | | 3,529 | | 5,207 | | 2,286 | | 2,474 | | 2,579 | | 2,510 | | 2,504 | |
Total interest revenue | | 5,711 | | 3,616 | | 5,660 | | 2,648 | | 2,865 | | 3,002 | | 2,963 | | 2,987 | |
Dividends | | 117 | | 71 | | 147 | | 424 | | 501 | | 583 | | 673 | | 769 | |
Total interest and dividend revenue | | 5,828 | | 3,687 | | 5,807 | | 3,072 | | 3,366 | | 3,585 | | 3,636 | | 3,756 | |
| | | | | | | | | | | | | | | | | |
NOTE 4: Other Revenue | | | | | | | | | | | | | | | | | |
Royalties | | 61 | | 55 | | 62 | | 66 | | 72 | | 75 | | 78 | | 35 | |
Other revenue | | 1,971 | | 2,306 | | 2,176 | | 2,340 | | 2,315 | | 2,598 | | 2,918 | | 2,956 | |
Total other revenue | | 2,032 | | 2,361 | | 2,238 | | 2,406 | | 2,387 | | 2,673 | | 2,996 | | 2,991 | |
| | Old
GAAP | | Old
GAAP
2007 | | Old
GAAP | | New
GAAP | | New
GAAP | | New
GAAP | | New
GAAP | | New
GAAP | |
($ million) | | 2006
Actual | | Previous
Budget | | 2007
Forecast | | 2007
Forecast | | 2008
Forecast | | 2009
Forecast | | 2010
Forecast | | 2011
Forecast | |
| | | | | | | | | | | | | | | | | |
NOTE 5: Social Assistance and Official Development Assistance | | | | | | | | | | | | | | | | | |
| | | | | | | | | | | | | | | | | |
New Zealand superannuation | | 6,414 | | 6,782 | | 6,807 | | 6,807 | | 7,292 | | 7,605 | | 7,998 | | 8,440 | |
Domestic purposes benefit | | 1,493 | | 1,504 | | 1,467 | | 1,467 | | 1,456 | | 1,454 | | 1,467 | | 1,491 | |
ACC payments | | 1,708 | | 1,845 | | 1,959 | | 1,781 | | 2,016 | | 2,235 | | 2,369 | | 2,537 | |
Unemployment benefit | | 712 | | 783 | | 615 | | 615 | | 497 | | 471 | | 484 | | 500 | |
Invalids benefit | | 1,073 | | 1,131 | | 1,136 | | 1,136 | | 1,201 | | 1,253 | | 1,305 | | 1,353 | |
Family support | | 1,285 | | 1,725 | | 1,779 | | 1,779 | | 1,964 | | 1,998 | | 1,995 | | 1,989 | |
Accommodation supplement | | 843 | | 883 | | 882 | | 882 | | 909 | | 928 | | 955 | | 986 | |
Sickness benefit | | 541 | | 575 | | 573 | | 573 | | 608 | | 642 | | 679 | | 714 | |
Student allowances | | 354 | | 364 | | 385 | | 385 | | 402 | | 407 | | 410 | | 411 | |
Disability allowances | | 261 | | 286 | | 270 | | 270 | | 279 | | 289 | | 301 | | 314 | |
Other social assistance benefits | | 1,674 | | 2,046 | | 2,028 | | 2,257 | | 2,883 | | 3,261 | | 3,634 | | 3,888 | |
Total social assistance | | 16,358 | | 17,924 | | 17,901 | | 17,952 | | 19,507 | | 20,543 | | 21,597 | | 22,623 | |
Official development assistance | | 330 | | 333 | | 374 | | 348 | | 401 | | 432 | | 498 | | 567 | |
Total social assistance and official development assistance | | 16,688 | | 18,257 | | 18,275 | | 18,300 | | 19,908 | | 20,975 | | 22,095 | | 23,190 | |
| | | | | | | | | | | | | | | | | |
NOTE 6: Personnel Expenses | | | | | | | | | | | | | | | | | |
| | | | | | | | | | | | | | | | | |
Wages and salaries | | | | | | | | 13,904 | | 14,495 | | 14,643 | | 14,809 | | 14,867 | |
Defined benefit retirement plan expenses (excluding actuarial gains/losses) | | | | | | | | 654 | | 637 | | 596 | | 558 | | 534 | |
Defined contribution retirement plan expenses | | | | | | | | 192 | | 214 | | 230 | | 248 | | 247 | |
Other personnel expenses | | | | | | | | 334 | | 311 | | 318 | | 335 | | 358 | |
Total personnel expenses | | 15,395 | | 15,118 | | 15,673 | | 15,084 | | 15,657 | | 15,787 | | 15,950 | | 16,006 | |
| | Old
GAAP | | Old
GAAP
2007 | | Old
GAAP | | New
GAAP | | New
GAAP | | New
GAAP | | New
GAAP | | New
GAAP | |
($ million) | | 2006
Actual | | Previous
Budget | | 2007
Forecast | | 2007
Forecast | | 2008
Forecast | | 2009
Forecast | | 2010
Forecast | | 2011
Forecast | |
| | | | | | | | | | | | | | | | | |
NOTE 7: Depreciation and Amortisation | | | | | | | | | | | | | | | | | |
| | | | | | | | | | | | | | | | | |
Depreciation expense (by class of asset): | | | | | | | | | | | | | | | | | |
Buildings | | 880 | | 900 | | 920 | | 929 | | 989 | | 1,017 | | 1,039 | | 1,044 | |
Electricity distribution network | | 109 | | 118 | | 97 | | 87 | | 87 | | 90 | | 93 | | 97 | |
Electricity generation assets | | 198 | | 216 | | 241 | | 248 | | 276 | | 324 | | 380 | | 388 | |
Aircraft (excluding SME) | | 102 | | 246 | | 223 | | 203 | | 215 | | 202 | | 189 | | 170 | |
State highways | | 252 | | 236 | | 242 | | 242 | | 255 | | 270 | | 286 | | 302 | |
Rail network | | — | | — | | 152 | | 152 | | 177 | | 184 | | 189 | | 194 | |
Specialist military equipment (SME) | | 187 | | 216 | | 239 | | 239 | | 286 | | 310 | | 335 | | 445 | |
Other plant and equipment | | 905 | | 913 | | 910 | | 685 | | 739 | | 772 | | 788 | | 795 | |
Other assets | | 75 | | 73 | | 75 | | 108 | | 115 | | 121 | | 123 | | 122 | |
Total depreciation costs | | 2,708 | | 2,918 | | 3,099 | | 2,893 | | 3,139 | | 3,290 | | 3,422 | | 3,557 | |
| | | | | | | | | | | | | | | | | |
Amortisation and impairment on intangible assets | | | | | | | | | | | | | | | | | |
Amortisation and impairment on intangible assets | | | | | | | | 130 | | 157 | | 127 | | 157 | | 139 | |
Total depreciation, amortisation and impairment on intangible assets | | 2,708 | | 2,918 | | 3,099 | | 3,023 | | 3,296 | | 3,417 | | 3,579 | | 3,696 | |
| | | | | | | | | | | | | | | | | |
NOTE 8: Other Operating Expenses | | | | | | | | | | | | | | | | | |
| | | | | | | | | | | | | | | | | |
Write-down on initial recognition of loans | | 328 | | 381 | | 496 | | 588 | | 518 | | 525 | | 547 | | 568 | |
Impairment on financial assets | | 1,925 | | 696 | | 2,132 | | 1,439 | | 133 | | 101 | | 103 | | 104 | |
Grants | | 1,578 | | 1,162 | | 1,771 | | 1,936 | | 2,085 | | 2,222 | | 2,259 | | 2,269 | |
Rental and leasing costs | | 820 | | 787 | | 843 | | 812 | | 823 | | 841 | | 853 | | 869 | |
Lottery prize payments | | 398 | | 371 | | 397 | | 397 | | 412 | | 429 | | 446 | | 464 | |
Inventory expensed during the period | | | | | | | | 211 | | 231 | | 230 | | 229 | | 239 | |
Other operating expenses | | 21,682 | | 23,438 | | 22,615 | | 22,749 | | 24,795 | | 25,123 | | 25,593 | | 25,895 | |
Total other operating expenses | | 26,731 | | 26,835 | | 28,254 | | 28,132 | | 28,997 | | 29,471 | | 30,030 | | 30,408 | |
| | | | | | | | | | | | | | | | | |
NOTE 9: Interest Expenses | | | | | | | | | | | | | | | | | |
| | | | | | | | | | | | | | | | | |
Interest on financial liabilities | | | | | | | | 2,382 | | 2,335 | | 2,232 | | 2,169 | | 2,299 | |
Interest unwind on provisions | | | | | | | | 398 | | 413 | | 473 | | 474 | | 467 | |
Total interest expenses | | 2,241 | | 2,854 | | 3,063 | | 2,780 | | 2,748 | | 2,705 | | 2,643 | | 2,766 | |
| | | | | | | | | | | | | | | | | |
NOTE 10: Forecast New Operating Spending and Top-down Expense Adjustment | | | | | | | | | | | | | | | | | |
| | | | | | | | | | | | | | | | | |
New operating spending up to Budget 2008 | | — | | — | | 80 | | 80 | | 314 | | 329 | | 398 | | 460 | |
Forecast for future new spending | | — | | 320 | | — | | — | | — | | 1,908 | | 3,838 | | 5,786 | |
Top-down expense adjustment | | — | | — | | (500 | ) | (500 | ) | — | | — | | — | | — | |
Total forecast new operating spending and top-down expense adjustment | | — | | 320 | | (420 | ) | (420 | ) | 314 | | 2,237 | | 4,236 | | 6,246 | |
New operating spending up to Budget 2008 represents expenses included in Budget 2007 that have yet to be allocated.
Forecast new operating spending indicates in broad terms the potential spending increases that could be introduced in each future budget round. As some of this spending has already been allocated to the Defence funding package, this line represents the remaining unallocated portion. Total potential spending increases included in the forecasts are $2 billion for Budget 2008, $2 billion for Budget 2009 and $2.1 billion for Budget 2010.Also included in the forecasts is a provision for potential new capital spending.
The top-down expense adjustment takes into account timing delays in departmental spending for 2006/07. This adjustment is made on both a cash and accrual basis, and is split between operating ($500 million) and capital ($200 million).
NOTE 11: Net Gains and Losses on Non-financial Instruments | | | | | | | | | | | | | | | | | |
| | | | | | | | | | | | | | | | | |
Actuarial gains/(losses) on Government Superannuation Fund liability | | | | | | | | (30 | ) | — | | — | | — | | — | |
Actuarial gains/(losses) on ACC liability | | | | | | | | (1,136 | ) | — | | — | | — | | — | |
Net gains/(losses) on other non-financial instruments | | | | | | | | 219 | | — | | — | | — | | — | |
Total net gains and losses on non-financial instruments | | | | | | | | (947 | ) | — | | — | | — | | — | |
| | Old
GAAP | | Old
GAAP
2007 | | Old
GAAP | | New
GAAP | | New
GAAP | | New
GAAP | | New
GAAP | | New
GAAP | |
($ million) | | 2006
Actual | | Previous
Budget | | 2007
Forecast | | 2007
Forecast | | 2008
Forecast | | 2009
Forecast | | 2010
Forecast | | 2011
Forecast | |
| | | | | | | | | | | | | | | | | |
NOTE 12: Financial assets | | | | | | | | | | | | | | | | | |
| | | | | | | | | | | | | | | | | |
Cash and cash equivalents | | 4,168 | | 2,902 | | 3,478 | | 3,107 | | 3,196 | | 3,435 | | 3,319 | | 3,272 | |
Tax receivables | | 8,720 | | 5,607 | | 7,318 | | 7,147 | | 7,078 | | 7,628 | | 7,658 | | 7,578 | |
Trade and other receivables | | 5,333 | | 4,738 | | 4,654 | | 5,182 | | 5,469 | | 5,634 | | 5,732 | | 5,835 | |
Student loans | | 5,569 | | 5,868 | | 5,761 | | 5,761 | | 6,252 | | 6,721 | | 7,193 | | 7,649 | |
Kiwibank mortgages | | 2,609 | | 3,425 | | 3,817 | | 3,823 | | 5,127 | | 6,274 | | 6,274 | | 6,274 | |
Long-term deposits | | | | | | | | 1,925 | | 2,037 | | 2,130 | | 2,221 | | 2,311 | |
Reserve position at the IMF | | 341 | | 275 | | 221 | | 221 | | 212 | | 204 | | 195 | | 185 | |
Other loans | | 580 | | 728 | | 617 | | 2,109 | | 1,459 | | 1,469 | | 1,479 | | 1,501 | |
Share investments | | 15,834 | | 17,994 | | 16,783 | | 14,121 | | 17,273 | | 20,179 | | 23,330 | | 26,722 | |
Derivatives in gain | | | | | | | | 832 | | 464 | | 293 | | 241 | | 189 | |
Other marketable securities | | 27,668 | | 25,250 | | 35,300 | | 29,898 | | 32,421 | | 31,910 | | 31,227 | | 33,819 | |
Total financial assets | | 70,822 | | 66,787 | | 77,949 | | 74,126 | | 80,988 | | 85,877 | | 88,869 | | 95,335 | |
Share investments include those in supranational organisations, such as the International Bank for Reconstruction and Development and the Bank for International Settlements.
The value of these investments included above is: | | 323 | | 286 | | 289 | | 299 | | 302 | | 303 | | 303 | | 303 | |
Financial assets by portfolio
The financial assets by portfolio analysis is net of any cross-holdings within a segment and across the segments. In previous forecasts, this net of cross-holdings portfolio information was provided for marketable securities and deposits only. As this portfolio information now encompasses cash and receivables, prior year comparisons are not available on a like-for-li
Reserve Bank and NZ DMO | | | | | | | | 23,921 | | 26,013 | | 24,527 | | 22,973 | | 24,634 | |
NZ Superannuation Fund | | | | | | | | 11,342 | | 13,903 | | 16,801 | | 19,985 | | 23,501 | |
Other Core Crown | | | | | | | | 13,897 | | 14,311 | | 15,356 | | 15,849 | | 16,180 | |
Total Core Crown | | | | | | | | 49,160 | | 54,227 | | 56,684 | | 58,807 | | 64,315 | |
| | | | | | | | | | | | | | | | | |
ACC portfolio | | | | | | | | 10,806 | | 11,695 | | 12,446 | | 13,174 | | 13,861 | |
EQC portfolio | | | | | | | | 1,997 | | 2,174 | | 2,381 | | 2,604 | | 2,847 | |
Other Crown entities | | | | | | | | 3,786 | | 3,670 | | 3,617 | | 3,611 | | 3,626 | |
Total Crown entities | | | | | | | | 16,589 | | 17,539 | | 18,444 | | 19,389 | | 20,334 | |
| | | | | | | | | | | | | | | | | |
State-owned enterprises | | | | | | | | 8,377 | | 9,222 | | 10,749 | | 10,673 | | 10,686 | |
| | | | | | | | | | | | | | | | | |
Total financial assets by portfolio | | 70,822 | | 66,787 | | 77,949 | | 74,126 | | 80,988 | | 85,877 | | 88,869 | | 95,335 | |
| | | | | | | | | | | | | | | | | |
Uneliminated financial asset portfolio information by entity | | | | | | | | | | | | | | | | | |
| | | | | | | | | | | | | | | | | |
NZ Superannuation Fund | | 9,726 | | 13,038 | | 12,639 | | 12,573 | | 15,439 | | 18,673 | | 22,226 | | 26,147 | |
| | | | | | | | | | | | | | | | | |
ACC portfolio | | 9,097 | | 9,459 | | 10,079 | | 10,039 | | 10,903 | | 11,671 | | 12,434 | | 13,152 | |
| | | | | | | | | | | | | | | | | |
EQC portfolio | | 5,243 | | 5,656 | | 5,454 | | 5,644 | | 6,031 | | 6,460 | | 6,919 | | 7,412 | |
| | | | | | | | | | | | | | | | | |
NOTE 13: Receivables | | | | | | | | | | | | | | | | | |
| | | | | | | | | | | | | | | | | |
Tax receivables | | 8,720 | | 5,607 | | 7,318 | | 7,147 | | 7,078 | | 7,628 | | 7,658 | | 7,578 | |
Trade and other receivables | | 5,333 | | 4,738 | | 4,654 | | 5,182 | | 5,469 | | 5,634 | | 5,732 | | 5,835 | |
Total receivables | | 14,053 | | 10,345 | | 11,972 | | 12,329 | | 12,547 | | 13,262 | | 13,390 | | 13,413 | |
| | | | | | | | | | | | | | | | | |
NOTE 14: Advances | | | | | | | | | | | | | | | | | |
| | | | | | | | | | | | | | | | | |
Student loans (see analysis below) | | 5,569 | | 5,868 | | 5,761 | | 5,761 | | 6,252 | | 6,721 | | 7,193 | | 7,649 | |
Kiwibank mortgages | | 2,609 | | 3,425 | | 3,817 | | 3,823 | | 5,127 | | 6,274 | | 6,274 | | 6,274 | |
Long-term deposits | | — | | — | | — | | 1,925 | | 2,037 | | 2,130 | | 2,221 | | 2,311 | |
Reserve position at the IMF | | 341 | | 275 | | 221 | | 221 | | 212 | | 204 | | 195 | | 185 | |
Other loans | | 580 | | 728 | | 617 | | 2,109 | | 1,459 | | 1,469 | | 1,479 | | 1,501 | |
Total advances | | 9,099 | | 10,296 | | 10,416 | | 13,839 | | 15,087 | | 16,798 | | 17,362 | | 17,920 | |
| | | | | | | | | | | | | | | | | |
Analysis of Student Loans | | | | | | | | | | | | | | | | | |
| | | | | | | | | | | | | | | | | |
Nominal student loan value | | 8,370 | | 8,784 | | 9,242 | | 9,242 | | 9,983 | | 10,705 | | 11,430 | | 12,140 | |
| | | | | | | | | | | | | | | | | |
Movement during the year | | | | | | | | | | | | | | | | | |
Opening balance | | 6,465 | | 5,472 | | 5,569 | | 5,569 | | 5,761 | | 6,252 | | 6,721 | | 7,193 | |
Initial fair value write down | | (1,415 | ) | — | | — | | — | | — | | — | | — | | — | |
Amount borrowed in current year | | 1,046 | | 1,157 | | 1,206 | | 1,206 | | 1,278 | | 1,334 | | 1,389 | | 1,444 | |
Fair value write down on new borrowings | | (328 | ) | (381 | ) | (496 | ) | (496 | ) | (526 | ) | (549 | ) | (572 | ) | (594 | ) |
Repayments made during the year | | (550 | ) | (634 | ) | (559 | ) | (559 | ) | (621 | ) | (705 | ) | (763 | ) | (839 | ) |
Interest unwind | | 358 | | 87 | | 362 | | 362 | | 391 | | 423 | | 453 | | 484 | |
Impairment | | (13 | ) | (15 | ) | (411 | ) | (411 | ) | (31 | ) | (34 | ) | (36 | ) | (39 | ) |
Other movements | | 6 | | 182 | | 90 | | 90 | | — | | — | | 1 | | — | |
Closing balance | | 5,569 | | 5,868 | | 5,761 | | 5,761 | | 6,252 | | 6,721 | | 7,193 | | 7,649 | |
| | Old
GAAP | | Old
GAAP
2007 | | Old
GAAP | | New
GAAP | | New
GAAP | | New
GAAP | | New
GAAP | | New
GAAP | |
($ million) | | 2006
Actual | | Previous
Budget | | 2007
Forecast | | 2007
Forecast | | 2008
Forecast | | 2009
Forecast | | 2010
Forecast | | 2011
Forecast | |
| | | | | | | | | | | | | | | | | |
NOTE 15: Property, Plant and Equipment | | | | | | | | | | | | | | | | | |
| | | | | | | | | | | | | | | | | |
By Class of Asset | | | | | | | | | | | | | | | | | |
| | | | | | | | | | | | | | | | | |
Gross Carrying Value | | | | | | | | | | | | | | | | | |
Land (valuation) | | 13,803 | | 11,801 | | 14,111 | | 18,882 | | 18,963 | | 19,113 | | 19,166 | | 19,180 | |
Buildings (valuation) | | 21,859 | | 22,487 | | 23,092 | | 22,987 | | 24,416 | | 25,105 | | 25,849 | | 26,252 | |
Electricity distribution network (valuation) | | 2,311 | | 2,668 | | 2,540 | | 2,439 | | 2,694 | | 3,139 | | 3,854 | | 4,656 | |
Electricity generation assets (valuation) | | 8,536 | | 8,428 | | 9,378 | | 9,541 | | 10,727 | | 11,636 | | 12,507 | | 13,362 | |
Aircraft (excluding SME) (valuation) | | 2,068 | | 2,566 | | 2,339 | | 2,328 | | 2,523 | | 2,651 | | 2,760 | | 3,565 | |
State highways (valuation) | | 17,948 | | 16,757 | | 19,339 | | 22,477 | | 23,516 | | 24,544 | | 25,519 | | 26,661 | |
Rail network (valuation) | | — | | — | | 10,786 | | 10,797 | | 11,149 | | 11,444 | | 11,641 | | 11,840 | |
Specialist military equipment (valuation) | | 3,422 | | 4,013 | | 4,092 | | 4,110 | | 4,508 | | 4,650 | | 4,937 | | 5,126 | |
Other plant and equipment (cost) | | 9,692 | | 10,211 | | 10,589 | | 8,301 | | 8,986 | | 9,497 | | 10,110 | | 10,432 | |
Specified cultural and heritage assets (valuation) | | | | | | | | 1,542 | | 1,569 | | 1,501 | | 1,498 | | 1,499 | |
Other assets | | 7,965 | | 7,250 | | 8,369 | | 2,746 | | 3,147 | | 3,340 | | 3,899 | | 4,054 | |
Total Gross Carrying Value | | 87,604 | | 86,181 | | 104,635 | | 106,150 | | 112,198 | | 116,620 | | 121,740 | | 126,627 | |
| | | | | | | | | | | | | | | | | |
Accumulated Depreciation | | | | | | | | | | | | | | | | | |
Buildings | | 1,307 | | 2,883 | | 2,135 | | 2,165 | | 3,067 | | 3,760 | | 4,711 | | 5,196 | |
Electricity distribution network | | 299 | | 421 | | 388 | | 388 | | 475 | | 565 | | 658 | | 755 | |
Electricity generation assets | | 111 | | 525 | | 347 | | 392 | | 670 | | 996 | | 1,378 | | 1,768 | |
Aircraft (excluding SME) | | — | | 444 | | 223 | | 223 | | 459 | | 681 | | 890 | | 1,080 | |
State highways | | — | | 689 | | 719 | | 3,846 | | 4,101 | | 4,371 | | 4,698 | | 5,152 | |
Rail network | | — | | — | | 155 | | 167 | | 345 | | 530 | | 721 | | 916 | |
Specialist military equipment | | 344 | | 1,017 | | 587 | | 594 | | 880 | | 1,190 | | 1,525 | | 1,970 | |
Other plant and equipment | | 6,008 | | 6,420 | | 6,626 | | 4,771 | | 5,228 | | 5,736 | | 6,261 | | 6,625 | |
Specified cultural and heritage assets | | | | | | | | — | | — | | — | | — | | — | |
Other assets | | 561 | | 373 | | 613 | | 934 | | 1,023 | | 1,124 | | 1,223 | | 1,319 | |
Total Accumulated Depreciation | | 8,630 | | 12,772 | | 11,793 | | 13,480 | | 16,248 | | 18,953 | | 22,065 | | 24,781 | |
| | | | | | | | | | | | | | | | | |
Net Carrying Value | | | | | | | | | | | | | | | | | |
Land (valuation) | | 13,803 | | 11,801 | | 14,111 | | 18,882 | | 18,963 | | 19,113 | | 19,166 | | 19,180 | |
Buildings (valuation) | | 20,552 | | 19,604 | | 20,957 | | 20,822 | | 21,349 | | 21,345 | | 21,138 | | 21,056 | |
Electricity distribution network (valuation) | | 2,012 | | 2,247 | | 2,152 | | 2,051 | | 2,219 | | 2,574 | | 3,196 | | 3,901 | |
Electricity generation assets (valuation) | | 8,425 | | 7,903 | | 9,031 | | 9,149 | | 10,057 | | 10,640 | | 11,129 | | 11,594 | |
Aircraft (excluding SME) (valuation) | | 2,068 | | 2,122 | | 2,116 | | 2,105 | | 2,064 | | 1,970 | | 1,870 | | 2,485 | |
State highways (valuation) | | 17,948 | | 16,068 | | 18,620 | | 18,631 | | 19,415 | | 20,173 | | 20,821 | | 21,509 | |
Rail network (valuation) | | — | | — | | 10,631 | | 10,630 | | 10,804 | | 10,914 | | 10,920 | | 10,924 | |
Specialist military equipment (valuation) | | 3,078 | | 2,996 | | 3,505 | | 3,516 | | 3,628 | | 3,460 | | 3,412 | | 3,156 | |
Other plant and equipment (cost) | | 3,684 | | 3,791 | | 3,963 | | 3,530 | | 3,758 | | 3,761 | | 3,849 | | 3,807 | |
Specified cultural and heritage assets (valuation) | | | | | | — | | 1,542 | | 1,569 | | 1,501 | | 1,498 | | 1,499 | |
Other assets | | 7,404 | | 6,877 | | 7,756 | | 1,812 | | 2,124 | | 2,216 | | 2,676 | | 2,735 | |
Total Net Carrying Value | | 78,974 | | 73,409 | | 92,842 | | 92,670 | | 95,950 | | 97,667 | | 99,675 | | 101,846 | |
| | | | | | | | | | | | | | | | | |
By Type | | | | | | | | | | | | | | | | | |
| | | | | | | | | | | | | | | | | |
Freehold assets | | 77,391 | | 72,385 | | 91,267 | | 91,531 | | 94,809 | | 96,482 | | 98,455 | | 100,547 | |
Leasehold assets | | 1,583 | | 1,024 | | 1,575 | | 1,139 | | 1,141 | | 1,185 | | 1,220 | | 1,299 | |
Total Net Carrying Value | | 78,974 | | 73,409 | | 92,842 | | 92,670 | | 95,950 | | 97,667 | | 99,675 | | 101,846 | |
| | | | | | | | | | | | | | | | | |
NOTE 16: Payables | | | | | | | | | | | | | | | | | |
| | | | | | | | | | | | | | | | | |
Taxes repayable | | 3,570 | | 2,742 | | 3,570 | | 3,490 | | 3,480 | | 3,350 | | 3,270 | | 3,230 | |
Accounts payable | | 8,899 | | 7,380 | | 7,551 | | 5,422 | | 5,556 | | 5,652 | | 5,467 | | 5,261 | |
Total payables | | 12,469 | | 10,122 | | 11,121 | | 8,912 | | 9,036 | | 9,002 | | 8,737 | | 8,491 | |
| | | | | | | | | | | | | | | | | |
NOTE 17: Provisions | | | | | | | | | | | | | | | | | |
| | | | | | | | | | | | | | | | | |
Provision for Kyoto | | 656 | | 582 | | 557 | | 557 | | 557 | | 557 | | 557 | | 557 | |
Provision for NPF guarantee | | 998 | | 944 | | 998 | | 805 | | 805 | | 805 | | 805 | | 805 | |
Provision for employee entitlements | | 1,533 | | 1,397 | | 1,544 | | 1,611 | | 1,621 | | 1,627 | | 1,635 | | 1,638 | |
Other provisions | | 477 | | 514 | | 508 | | 875 | | 867 | | 797 | | 822 | | 812 | |
Total provisions | | 3,664 | | 3,437 | | 3,607 | | 3,848 | | 3,850 | | 3,786 | | 3,819 | | 3,812 | |
| | Old
GAAP | | Old
GAAP
2007 | | Old
GAAP | | New
GAAP | | New
GAAP | | New
GAAP | | New
GAAP | | New
GAAP | |
($ million) | | 2006
Actual | | Previous
Budget | | 2007
Forecast | | 2007
Forecast | | 2008
Forecast | | 2009
Forecast | | 2010
Forecast | | 2011
Forecast | |
| | | | | | | | | | | | | | | | | |
NOTE 18: Insurance liabilities | | | | | | | | | | | | | | | | | |
| | | | | | | | | | | | | | | | | |
ACC liability | | 12,715 | | 13,255 | | 14,457 | | 17,924 | | 18,949 | | 19,978 | | 21,097 | | 22,261 | |
EQC liability | | | | | | | | 55 | | 42 | | 43 | | 44 | | 45 | |
Other insurance liabilities | | | | | | | | 19 | | 20 | | 21 | | 21 | | 22 | |
Insurance liabilities | | 12,715 | | 13,255 | | 14,457 | | 17,998 | | 19,011 | | 20,042 | | 21,162 | | 22,328 | |
ACC liability and asset information
Calculation Information
PricewaterhouseCoopers Actuarial Pty Ltd have prepared an independent actuarial estimate of the ACC outstanding claims liability as at 30 June 2007. This estimate includes the expected future payments relating to accidents that occurred prior to balance date (whether or not the associated claims have been reported to, or accepted by, ACC) and also the expected future administrative expenses of managing these claims.
The key economic variables that impact on changes to the valuation are the long-term Labour Cost Index (LCI), average weekly earnings and the discount rate of 5.70% (5.83% at 30 June 2006). Other key variables in each valuation are the forecast increases in claim costs over and above the economic variables above, and the assumed rate at which long-term claimants will leave the scheme over the period. This assessment is largely based on scheme history.
Explanation of change
Of the increase in the ACC projected claims liability from 30 June 2006 to that forecast to 30 June 2007, $3.0 billion relates to adopting a new accounting standard (NZ IFRS-4). This standard required a risk margin and an unexpired risk liability to be added ($1.6 billion) and inclusion of $1.4 billion of future levies (with an equivalent amount recognised as an asset).
The remaining $2.2 billion increase from 30 June 2006 arose from an increase of:
a. $2.0 billion due to a reassessment of the outstanding claims liability including the risk margin. The key reasons for this movement are associated with the changes in economic and other variables mentioned above, notably increases in claim costs and number of long term claimants arising from claims experience.
b. $0.1 billion in the unexpired risk liability, and
c. $0.1 billion in the unearned levy liability.
Presentation Approach
The projected outstanding claims liability is included within total liabilities. ACC has available to it a portfolio of assets that partially offset the claims liability. The assets (less cross holdings of NZ Government stock) are included in the asset portion of the Crown’s overall Statement of Financial Position.
Gross ACC liability | | | | | | | | | | | | | | | | | |
Opening gross liability | | 11,384 | | 12,581 | | 12,715 | | 12,715 | | 17,924 | | 18,949 | | 19,977 | | 21,097 | |
Adjustment on transition to NZ IFRS (as at 1 July 2006) | | | | | | | | 3,047 | | — | | — | | — | | — | |
Net projected change | | 1,321 | | 674 | | 1,742 | | 2,162 | | 1,025 | | 1,029 | | 1,120 | | 1,164 | |
Transfer from other insurer | | 10 | | — | | — | | — | | — | | — | | — | | — | |
Closing gross liability | | 12,715 | | 13,255 | | 14,457 | | 17,924 | | 18,949 | | 19,978 | | 21,097 | | 22,261 | |
| | | | | | | | | | | | | | | | | |
Less net assets available to ACC | | | | | | | | | | | | | | | | | |
Opening net asset value | | 7,217 | | 8,813 | | 8,880 | | 8,880 | | 11,724 | | 12,748 | | 13,607 | | 14,440 | |
Adjustment on transition to NZ IFRS (as at 1 July 2006) | | | | | | | | 1,417 | | — | | — | | — | | — | |
Net projected change | | 1,663 | | 802 | | 1,289 | | 1,427 | | 1,024 | | 859 | | 833 | | 787 | |
Closing net asset values | | 8,880 | | 9,615 | | 10,169 | | 11,724 | | 12,748 | | 13,607 | | 14,440 | | 15,227 | |
| | | | | | | | | | | | | | | | | |
Net ACC reserves (net liability) | | | | | | | | | | | | | | | | | |
Opening reserves position | | (4,167 | ) | (3,768 | ) | (3,835 | ) | (3,835 | ) | (6,200 | ) | (6,201 | ) | (6,370 | ) | (6,657 | ) |
Adjustment on transition to NZ IFRS (as at 1 July 2006) | | | | | | | | (1,630 | ) | — | | — | | — | | — | |
Net projected change | | 332 | | 128 | | (453 | ) | (735 | ) | (1 | ) | (170 | ) | (287 | ) | (377 | ) |
Closing reserves position (net liability) | | (3,835 | ) | (3,640 | ) | (4,288 | ) | (6,200 | ) | (6,201 | ) | (6,371 | ) | (6,657 | ) | (7,034 | ) |
| | Old | | Old
GAAP | | Old | | New | | New | | New | | New | | New | |
($ million) | | GAAP
2006
Actual | | 2007
Previous
Budget | | GAAP
2007
Forecast | | GAAP
2007
Forecast | | GAAP
2008
Forecast | | GAAP
2009
Forecast | | GAAP
2010
Forecast | | GAAP
2011
Forecast | |
| | | | | | | | | | | | | | | | | |
NOTE 19: Defined benefit retirement plan liabilities | | | | | | | | | | | | | | | | | |
| | | | | | | | | | | | | | | | | |
GSF net defined benefit retirement liability | | 15,231 | | 15,344 | | 15,554 | | 8,351 | | 8,402 | | 8,390 | | 8,319 | | 8,213 | |
Other net defined benefit retirement liability | | | | | | | | 12 | | 12 | | 12 | | 12 | | 11 | |
Total net defined benefit retirement plan liabilities | | 15,231 | | 15,344 | | 15,554 | | 8,363 | | 8,414 | | 8,402 | | 8,331 | | 8,224 | |
The net liability of the Government Superannuation Fund (GSF), as at 28 February 2007 (the valuation date), has been calculated by the Government Actuary for inclusion within the 2007 Budget Update. The GSF net liability arises from closed schemes for past and present public sector employees (set out in the GSF Act 1956). The Projected Unit Credit Method, based on 28 February 2007 membership data, was used for the valuation. This method requires the benefits payable from the GSF in respect of past service to be calculated and then discounted back to the valuation date.
The projected GSF net liability included in the 2007 Budget Update was calculated using discount rates derived from the market yield curve as at 28 February 2007. This resulted in a long-term before-tax discount rate ranging from 6.87% in 2008 to 5.42% in 2017 and beyond. The principal long-term financial assumptions used in the calculation were an inflation rate of 2.25% and an annual salary increases rate, before any promotional effects, of 3.0%.
The 2006/07 projected movement in the net liability (excluding the adjustment on transition to NZ IFRS at 1 July 2006) is $52 million, reflecting an increase in the GSF liability of $267 million offset by an increase in the GSF assets of $215 million. For details on the adjustment as a result of changing to NZ IFRS refer to page 195.
The increase in the projected GSF liability of $267 million includes an actuarial loss of $156 million at 28 February 2007, of which $137 million resulted from experience adjustments with the balance due to a change in discount rate assumptions on valuation date. The remainder of the increase in the GSF liability is the net of the current service cost, interest cost and benefits paid to members.
The increase in the projected GSF assets includes an actuarial gain of $126 million at 28 February 2007 mainly due to investment returns being better than the expected investment return of 5.75% after tax. (annualised). The balance of $89 million increase in GSF assets is due to the net of expected investments returns, contributions received by the GSF and benefits paid to members.
The changes in the projected GSF net liability from 2007/08 onwards reflects the net of the expected current service cost, interest cost, investment returns and contributions.
Change in the presentation of the GSF net liability in the Financial Statements of the Government
Under New GAAP (NZ IFRS) the net actuarial loss of $30 million in 2006/07 ($156 million actuarial loss in the GSF liability offset by $126 million actuarial gain in GSF assets) is reported in the gains and losses section of the statement of financial performance, while the pension expense of $645 million, (being the net of expected current service cost, interest unwind and expected investment returns), is reported in total personnel costs. Under Old GAAP the investment returns of the GSF are reported as investment revenue and the benefit payments to members (pension expense) are reported in expenses in the statement of financial position.
For further details on the presentational differences between Old GAAP and New GAAP refer to page 191.
The projected GSF net liability is presented within total liabilities of the Crown under New GAAP. Under Old GAAP the projected GSF liability is included within total liabilities of the Crown while the GSF portfolio of assets is included in the asset portion of the Crown’s overall Statement of Financial Position.
GSF net defined benefit retirement liability | | | | | | | | | | | | | | | | | |
GSF liability | | | | | | | | | | | | | | | | | |
Opening GSF liability | | 14,952 | | 15,361 | | 15,231 | | 15,231 | | 12,365 | | 12,523 | | 12,612 | | 12,638 | |
Adjustment on transition to NZ IFRS (as at 1 July 2006) | | | | | | | | (3,133 | ) | — | | — | | — | | — | |
Net projected change | | 279 | | (17 | ) | 323 | | 267 | | 158 | | 89 | | 26 | | (13 | ) |
Closing GSF liability | | 15,231 | | 15,344 | | 15,554 | | 12,365 | | 12,523 | | 12,612 | | 12,638 | | 12,625 | |
| | | | | | | | | | | | | | | | | |
Less net assets available to GSF | | | | | | | | | | | | | | | | | |
Opening net asset value | | 3,521 | | 3,768 | | 3,793 | | 3,793 | | 4,014 | | 4,121 | | 4,222 | | 4,319 | |
Adjustment on transition to NZ IFRS (as at 1 July 2006) | | | | | | | | 6 | | — | | — | | — | | — | |
Investment valuation changes | | 368 | | 186 | | 382 | | 382 | | 225 | | 230 | | 239 | | 241 | |
Contribution and other income less membership payments | | (96 | ) | (97 | ) | (167 | ) | (167 | ) | (118 | ) | (129 | ) | (142 | ) | (148 | ) |
Closing net asset value | | 3,793 | | 3,857 | | 4,008 | | 4,014 | | 4,121 | | 4,222 | | 4,319 | | 4,412 | |
| | | | | | | | | | | | | | | | | |
Net GSF liability | | | | | | | | | | | | | | | | | |
Opening unfunded liability | | 11,431 | | 11,593 | | 11,438 | | 11,438 | | 8,351 | | 8,402 | | 8,390 | | 8,319 | |
Adjustment on transition to NZ IFRS (as at 1 July 2006) | | | | | | | | (3,139 | ) | — | | — | | — | | — | |
Net projected change | | 7 | | (106 | ) | 108 | | 52 | | 51 | | (12 | ) | (71 | ) | (106 | ) |
Net liability | | 11,438 | | 11,487 | | 11,546 | | 8,351 | | 8,402 | | 8,390 | | 8,319 | | 8,213 | |
| | Old | | Old
GAAP | | Old | | New | | New | | New | | New | | New | |
($ million) | | GAAP
2006
Actual | | 2007
Previous
Budget | | GAAP
2007
Forecast | | GAAP
2007
Forecast | | GAAP
2008
Forecast | | GAAP
2009
Forecast | | GAAP
2010
Forecast | | GAAP
2011
Forecast | |
| | | | | | | | | | | | | | | | | |
Note 20: Reconciliation of Core Crown operating cash flows to residual Core Crown cash
(includes contribution to NZSF, excludes all other NZSF flows) | | | | | | | | | | | | | | | | | |
| | | | | | | | | | | | | | | | | |
Core Crown Cash Flows from Operations | | | | | | | | | | | | | | | | | |
Total tax receipts | | 50,507 | | 51,499 | | 52,868 | | 52,868 | | 55,121 | | 56,007 | | 59,251 | | 62,469 | |
Total other sovereign receipts | | 539 | | 503 | | 463 | | 463 | | 477 | | 510 | | 526 | | 539 | |
Interest, profits and dividends | | 1,893 | | 1,035 | | 2,147 | | 2,147 | | 1,857 | | 1,981 | | 1,891 | | 1,882 | |
Sale of goods & services and other receipts | | 1,449 | | 1,387 | | 1,606 | | 1,606 | | 1,472 | | 1,480 | | 1,462 | | 1,424 | |
Subsidies and transfer payments | | (15,357 | ) | (16,820 | ) | (16,624 | ) | (16,624 | ) | (18,789 | ) | (19,280 | ) | (20,178 | ) | (20,962 | ) |
Personnel and operating expenses | | (28,167 | ) | (30,815 | ) | (30,748 | ) | (30,748 | ) | (32,610 | ) | (32,832 | ) | (32,810 | ) | (32,808 | ) |
Finance costs | | (2,005 | ) | (1,781 | ) | (2,200 | ) | (2,200 | ) | (2,176 | ) | (2,237 | ) | (2,200 | ) | (2,264 | ) |
Forecast new operating spending | | — | | (320 | ) | (80 | ) | (80 | ) | (314 | ) | (2,306 | ) | (4,391 | ) | (6,508 | ) |
Top-down expense adjustment | | — | | — | | 500 | | 500 | | — | | — | | — | | — | |
Net Cash Flows from Core Crown Operations | | 8,859 | | 4,688 | | 7,932 | | 7,932 | | 5,038 | | 3,323 | | 3,551 | | 3,772 | |
| | | | | | | | | | | | | | | | | |
Net purchase of physical assets | | (1,826 | ) | (1,953 | ) | (2,141 | ) | (2,141 | ) | (1,803 | ) | (1,201 | ) | (1,179 | ) | (1,034 | ) |
Net increase in advances | | (822 | ) | (957 | ) | (1,266 | ) | (1,266 | ) | (1,088 | ) | (699 | ) | (674 | ) | (695 | ) |
Net purchase of investments | | (389 | ) | (441 | ) | (456 | ) | (456 | ) | (636 | ) | (349 | ) | (229 | ) | (108 | ) |
Contribution to NZS Fund | | (2,337 | ) | (2,049 | ) | (2,049 | ) | (2,049 | ) | (2,103 | ) | (2,194 | ) | (2,312 | ) | (2,458 | ) |
Purchase of Reserve Bank reserves | | (500 | ) | (500 | ) | (500 | ) | (500 | ) | (200 | ) | — | | — | | — | |
Forecast new capital spending | | — | | (256 | ) | — | | — | | (184 | ) | (567 | ) | (806 | ) | (903 | ) |
Top-down capital adjustment | | — | | — | | 200 | | 200 | | — | | — | | — | | — | |
| | | | | | | | | | | | | | | | | |
Residual cash | | 2,985 | | (1,468 | ) | 1,720 | | 1,720 | | (976 | ) | (1,687 | ) | (1,649 | ) | (1,426 | ) |
| | | | | | | | | | | | | | | | | |
Financed by: | | | | | | | | | | | | | | | | | |
Other net sale/(purchase) of marketable securities and deposits | | (2,039 | ) | 2,493 | | (5,728 | ) | (5,471 | ) | (1,649 | ) | 1,467 | | 1,727 | | (1,543 | ) |
Total Operating and Investing Activities | | 946 | | 1,025 | | (4,008 | ) | (3,751 | ) | (2,625 | ) | (220 | ) | 78 | | (2,969 | ) |
| | | | | | | | | | | | | | | | | |
Used in: | | | | | | | | | | | | | | | | | |
Net (repayment)/issue of other New Zealand-dollar borrowing | | 419 | | (1,132 | ) | 4,436 | | 3,977 | | 709 | | 580 | | 294 | | 89 | |
Decrease/(increase) in cash | | 105 | | (23 | ) | (76 | ) | 31 | | 3 | | (45 | ) | (30 | ) | (30 | ) |
Issue of circulating currency | | 165 | | — | | 273 | | 273 | | 178 | | 186 | | 196 | | 206 | |
Net issue/(repayment) of foreign-currency borrowing | | (1,801 | ) | 502 | | (497 | ) | (402 | ) | (993 | ) | (320 | ) | (152 | ) | (57 | ) |
| | (1,112 | ) | (653 | ) | 4,136 | | 3,879 | | (103 | ) | 401 | | 308 | | 208 | |
| | | | | | | | | | | | | | | | | |
Net Cash Inflow/(Outflow) to be Offset by Domestic Bonds | | (166 | ) | 372 | | 128 | | 128 | | (2,728 | ) | 181 | | 386 | | (2,761 | ) |
| | | | | | | | | | | | | | | | | |
Gross Cash Proceeds from Domestic Bonds | | | | | | | | | | | | | | | | | |
Domestic bonds (market) | | 2,375 | | 2,438 | | 2,511 | | 2,511 | | 2,520 | | 2,500 | | 2,483 | | 2,515 | |
Domestic bonds (non-market) | | 740 | | 406 | | 559 | | 559 | | 208 | | 647 | | 767 | | 246 | |
Total Gross Cash Proceeds from Domestic Bonds | | 3,115 | | 2,844 | | 3,070 | | 3,070 | | 2,728 | | 3,147 | | 3,250 | | 2,761 | |
| | | | | | | | | | | | | | | | | |
Repayment of domestic bonds (market) | | (2,574 | ) | (2,777 | ) | (2,777 | ) | (2,777 | ) | — | | (2,900 | ) | (3,102 | ) | — | |
Repayment of domestic bonds (non-market) | | (375 | ) | (439 | ) | (421 | ) | (421 | ) | — | | (428 | ) | (534 | ) | — | |
Net Cash (Repayments of)/Proceeds from Domestic Bonds | | 166 | | (372 | ) | (128 | ) | (128 | ) | 2,728 | | (181 | ) | (386 | ) | 2,761 | |
6
Core Crown Expense Tables
($ million) | | 2002
Actual | | 2003
Actual | | 2004
Actual | | 2005
Actual | | 2006
Actual | | 2007
Forecast | | 2008
Forecast | | 2009
Forecast | | 2010
Forecast | | 2011
Forecast | |
| | | | | | | | | | | | | | | | | | | | | |
Social security and welfare | | 13,485 | | 13,907 | | 14,252 | | 14,682 | | 15,598 | | 16,891 | | 17,698 | | 18,172 | | 18,788 | | 19,437 | |
GSF | | 1,409 | | 2,625 | | 660 | | 2,442 | | 1,671 | | 645 | | 629 | | 587 | | 549 | | 525 | |
Health | | 7,032 | | 7,501 | | 8,111 | | 8,813 | | 9,547 | | 10,486 | | 11,613 | | 11,634 | | 11,665 | | 11,662 | |
Education | | 6,473 | | 7,016 | | 7,585 | | 7,930 | | 9,914 | | 9,622 | | 9,719 | | 9,835 | | 9,912 | | 9,998 | |
Core government services | | 1,540 | | 1,780 | | 1,741 | | 2,217 | | 2,169 | | 3,237 | | 2,479 | | 2,506 | | 2,556 | | 2,672 | |
Law and order | | 1,733 | | 1,734 | | 1,843 | | 1,977 | | 2,235 | | 2,581 | | 2,836 | | 2,818 | | 2,836 | | 2,829 | |
Defence | | 1,162 | | 1,199 | | 1,311 | | 1,275 | | 1,383 | | 1,533 | | 1,641 | | 1,686 | | 1,773 | | 1,883 | |
Transport and communications | | 989 | | 1,408 | | 1,461 | | 1,635 | | 1,818 | | 2,505 | | 2,792 | | 2,796 | | 2,566 | | 2,476 | |
Economic and industrial services | | 1,013 | | 1,054 | | 1,192 | | 1,444 | | 1,592 | | 1,681 | | 2,276 | | 2,651 | | 3,001 | | 3,239 | |
Primary services | | 304 | | 355 | | 368 | | 394 | | 467 | | 477 | | 494 | | 484 | | 477 | | 472 | |
Heritage, culture and recreation | | 434 | | 515 | | 634 | | 991 | | 1,194 | | 884 | | 977 | | 867 | | 870 | | 868 | |
Housing and community | | 93 | | 102 | | 139 | | 163 | | 202 | | 279 | | 304 | | 286 | | 270 | | 268 | |
Other | | 110 | | 75 | | 52 | | 32 | | 49 | | 112 | | 80 | | 80 | | 80 | | 80 | |
Finance costs | | 2,118 | | 2,360 | | 2,252 | | 2,274 | | 2,356 | | 2,270 | | 2,244 | | 2,180 | | 2,098 | | 2,243 | |
Net foreign exchange (gains)/losses | | 75 | | 118 | | 7 | | (35 | ) | (295 | ) | — | | — | | — | | — | | — | |
New operating spending up to Budget 2008 | | — | | — | | — | | — | | — | | 80 | | 314 | | 329 | | 398 | | 460 | |
Forecast new operating spending | | — | | — | | — | | — | | — | | — | | — | | 1,908 | | 3,838 | | 5,786 | |
Top Down Expense adjustment | | — | | — | | — | | — | | — | | (500 | ) | — | | — | | — | | — | |
| | | | | | | | | | | | | | | | | | | | | |
Core Crown expenses | | 37,970 | | 41,749 | | 41,608 | | 46,234 | | 49,900 | | 53,283 | | 56,096 | | 58,819 | | 61,677 | | 64,898 | |
Source: The Treasury
Table 6.1 – Social security and welfare expenses
($ million) | | 2002
Actual | | 2003
Actual | | 2004
Actual | | 2005
Actual | | 2006
Actual | | 2007
Forecast | | 2008
Forecast | | 2009
Forecast | | 2010
Forecast | | 2011
Forecast | |
| | | | | | | | | | | | | | | | | | | | | |
Welfare benefits | | 12,614 | | 12,884 | | 13,181 | | 13,326 | | 14,246 | | 15,524 | | 16,291 | | 16,774 | | 17,372 | | 18,028 | |
Social rehabilitation & compensation | | 87 | | 146 | | 118 | | 152 | | 145 | | 163 | | 164 | | 171 | | 174 | | 179 | |
Departmental expenses | | 657 | | 666 | | 705 | | 781 | | 858 | | 986 | | 866 | | 859 | | 848 | | 835 | |
Other non-departmental expenses | | 127 | | 211 | | 248 | | 423 | | 349 | | 218 | | 377 | | 368 | | 394 | | 395 | |
| | | | | | | | | | | | | | | | | | | | | |
Social security and welfare expenses | | 13,485 | | 13,907 | | 14,252 | | 14,682 | | 15,598 | | 16,891 | | 17,698 | | 18,172 | | 18,788 | | 19,437 | |
Source: The Treasury
Table 6.2 – New Zealand superannuation and welfare benefit expenses
($ million) | | 2002
Actual | | 2003
Actual | | 2004
Actual | | 2005
Actual | | 2006
Actual | | 2007
Forecast | | 2008
Forecast | | 2009
Forecast | | 2010
Forecast | | 2011
Forecast | |
| | | | | | | | | | | | | | | | | | | | | |
New Zealand Superannuation | | 5,450 | | 5,642 | | 5,889 | | 6,083 | | 6,414 | | 6,807 | | 7,292 | | 7,605 | | 7,998 | | 8,440 | |
Domestic Purposes Benefit | | 1,501 | | 1,520 | | 1,569 | | 1,547 | | 1,493 | | 1,467 | | 1,456 | | 1,454 | | 1,467 | | 1,491 | |
Unemployment Benefit | | 1,369 | | 1,274 | | 1,084 | | 831 | | 712 | | 615 | | 497 | | 471 | | 484 | | 500 | |
Accommodation Supplement | | 720 | | 706 | | 702 | | 750 | | 843 | | 882 | | 909 | | 928 | | 955 | | 986 | |
Invalids Benefit | | 832 | | 914 | | 976 | | 1,026 | | 1,073 | | 1,136 | | 1,201 | | 1,253 | | 1,305 | | 1,353 | |
Sickness Benefit | | 375 | | 421 | | 470 | | 510 | | 541 | | 573 | | 608 | | 642 | | 679 | | 714 | |
Disability Allowance | | 224 | | 241 | | 257 | | 267 | | 261 | | 270 | | 279 | | 289 | | 301 | | 314 | |
Transitional Retirement Benefit | | 97 | | 47 | | 11 | | — | | — | | — | | — | | — | | — | | — | |
Income Related Rents | | 274 | | 296 | | 340 | | 370 | | 395 | | 434 | | 465 | | 495 | | 527 | | 559 | |
Family Tax Credit | | 848 | | 862 | | 833 | | 846 | | 1,285 | | 1,779 | | 1,964 | | 1,998 | | 1,995 | | 1,989 | |
Child Tax Credit | | 157 | | 143 | | 155 | | 141 | | 154 | | 44 | | 8 | | 4 | | 1 | | — | |
Special Benefit | | 49 | | 82 | | 140 | | 175 | | 162 | | 105 | | 67 | | 51 | | 44 | | 40 | |
In Work Tax Credit | | — | | — | | — | | — | | 70 | | 461 | | 560 | | 571 | | 572 | | 574 | |
Benefits paid in Australia | | 159 | | 121 | | 103 | | 91 | | 80 | | 71 | | 58 | | 51 | | 49 | | 41 | |
Paid Parental Leave | | — | | 56 | | 63 | | 76 | | 96 | | 121 | | 128 | | 131 | | 139 | | 146 | |
Other benefits | | 559 | | 559 | | 589 | | 613 | | 667 | | 759 | | 799 | | 831 | | 856 | | 881 | |
| | | | | | | | | | | | | | | | | | | | | |
Welfare benefit expenses | | 12,614 | | 12,884 | | 13,181 | | 13,326 | | 14,246 | | 15,524 | | 16,291 | | 16,774 | | 17,372 | | 18,028 | |
Source: The Treasury
Table 6.3 – Beneficiary numbers
(Thousands) | | 2002
Actual | | 2003
Actual | | 2004
Actual | | 2005
Actual | | 2006
Actual | | 2007
Forecast | | 2008
Forecast | | 2009
Forecast | | 2010
Forecast | | 2011
Forecast | |
| | | | | | | | | | | | | | | | | | | | | |
New Zealand Superannuation | | 448 | | 454 | | 461 | | 469 | | 482 | | 495 | | 506 | | 516 | | 529 | | 543 | |
Domestic Purposes Benefit | | 110 | | 110 | | 110 | | 109 | | 106 | | 100 | | 96 | | 94 | | 92 | | 92 | |
Unemployment Benefit | | 140 | | 126 | | 104 | | 78 | | 64 | | 53 | | 41 | | 38 | | 38 | | 38 | |
Accommodation Supplement | | 270 | | 261 | | 249 | | 243 | | 249 | | 252 | | 251 | | 255 | | 260 | | 266 | |
Invalids Benefit | | 62 | | 67 | | 70 | | 74 | | 76 | | 78 | | 81 | | 83 | | 86 | | 88 | |
Sickness Benefit | | 35 | | 38 | | 42 | | 45 | | 47 | | 48 | | 50 | | 52 | | 54 | | 55 | |
Source: The Treasury
Table 6.4 – GSF pension expenses
($ million) | | 2002
Actual | | 2003
Actual | | 2004
Actual | | 2005
Actual | | 2006
Actual | | 2007
Forecast | | 2008
Forecast | | 2009
Forecast | | 2010
Forecast | | 2011
Forecast | |
| | | | | | | | | | | | | | | | | | | | | |
Pension expenses | | 973 | | 978 | | 975 | | 1,032 | | 1,392 | | 675 | | 629 | | 587 | | 549 | | 525 | |
Revaluation of Unfunded Liability | | 436 | | 1,647 | | (315 | ) | 1,410 | | 279 | | (30 | ) | — | | — | | — | | — | |
| | | | | | | | | | | | | | | | | | | | | |
GSF pension expenses | | 1,409 | | 2,625 | | 660 | | 2,442 | | 1,671 | | 645 | | 629 | | 587 | | 549 | | 525 | |
Source: The Treasury
Table 6.5 – Health expenses
($ million) | | 2002
Actual | | 2003
Actual | | 2004
Actual | | 2005
Actual | | 2006
Actual | | 2007
Forecast | | 2008
Forecast | | 2009
Forecast | | 2010
Forecast | | 2011
Forecast | |
| | | | | | | | | | | | | | | | | | | | | |
Departmental outputs | | 136 | | 148 | | 161 | | 157 | | 174 | | 174 | | 193 | | 182 | | 181 | | 179 | |
Health service purchasing | | 6,307 | | 6,783 | | 7,452 | | 8,113 | | 8,805 | | 9,736 | | 10,820 | | 10,816 | | 10,813 | | 10,789 | |
Other non-departmental outputs | | 61 | | 59 | | 71 | | 160 | | 135 | | 102 | | 99 | | 100 | | 93 | | 86 | |
Health payments to ACC | | 484 | | 482 | | 409 | | 356 | | 372 | | 430 | | 465 | | 501 | | 543 | | 573 | |
Other expenses | | 44 | | 29 | | 18 | | 27 | | 61 | | 44 | | 36 | | 35 | | 35 | | 35 | |
| | | | | | | | | | | | | | | | | | | | | |
Health expenses | | 7,032 | | 7,501 | | 8,111 | | 8,813 | | 9,547 | | 10,486 | | 11,613 | | 11,634 | | 11,665 | | 11,662 | |
Source: The Treasury
Table 6.6 – Health service purchasing
($ million) | | 2002
Actual | | 2003
Actual | | 2004
Actual | | 2005
Actual | | 2006
Actual | | 2007
Forecast | | 2008
Forecast | | 2009
Forecast | | 2010
Forecast | | 2011
Forecast | |
| | | | | | | | | | | | | | | | | | | | | |
Payments to District Health Boards | | 4,936 | | 5,328 | | 6,441 | | 7,262 | | 7,814 | | 8,655 | | 9,564 | | 9,562 | | 9,550 | | 9,538 | |
National Disability Support Services | | 1,170 | | 1,260 | | 793 | | 620 | | 699 | | 754 | | 860 | | 851 | | 850 | | 848 | |
Public Health Service Purchasing | | 201 | | 195 | | 218 | | 231 | | 292 | | 327 | | 396 | | 403 | | 413 | | 403 | |
| | | | | | | | | | | | | | | | | | | | | |
Health service purchasing | | 6,307 | | 6,783 | | 7,452 | | 8,113 | | 8,805 | | 9,736 | | 10,820 | | 10,816 | | 10,813 | | 10,789 | |
Source: The Treasury
Table 6.7 – Education expenses
($ million) | | 2002
Actual | | 2003
Actual | | 2004
Actual | | 2005
Actual | | 2006
Actual | | 2007
Forecast | | 2008
Forecast | | 2009
Forecast | | 2010
Forecast | | 2011
Forecast | |
| | | | | | | | | | | | | | | | | | | | | |
Early childhood education | | 343 | | 373 | | 393 | | 444 | | 555 | | 619 | | 789 | | 818 | | 876 | | 930 | |
Primary and secondary schools | | 3,325 | | 3,449 | | 3,692 | | 3,934 | | 4,153 | | 4,345 | | 4,415 | | 4,428 | | 4,421 | | 4,412 | |
Tertiary funding | | 2,225 | | 2,470 | | 2,535 | | 2,496 | | 4,047 | | 3,353 | | 3,253 | | 3,312 | | 3,366 | | 3,412 | |
Departmental expenses | | 467 | | 621 | | 679 | | 737 | | 821 | | 867 | | 874 | | 864 | | 859 | | 857 | |
Other education expenses | | 113 | | 103 | | 286 | | 319 | | 338 | | 438 | | 388 | | 413 | | 390 | | 387 | |
| | | | | | | | | | | | | | | | | | | | | |
Education expenses | | 6,473 | | 7,016 | | 7,585 | | 7,930 | | 9,914 | | 9,622 | | 9,719 | | 9,835 | | 9,912 | | 9,998 | |
Source: The Treasury
Table 6.8 – Primary and secondary education expenses
| | 2002 | | 2003 | | 2004 | | 2005 | | 2006 | | 2007 | | 2008 | | 2009 | | 2010 | | 2011 | |
($ million) | | Actual | | Actual | | Actual | | Actual | | Actual | | Forecast | | Forecast | | Forecast | | Forecast | | Forecast | |
| | | | | | | | | | | | | | | | | | | | | |
Primary | | 1,706 | | 1,749 | | 1,884 | | 1,964 | | 2,062 | | 2,146 | | 2,182 | | 2,187 | | 2,212 | | 2,209 | |
Secondary | | 1,182 | | 1,269 | | 1,385 | | 1,524 | | 1,618 | | 1,693 | | 1,704 | | 1,725 | | 1,694 | | 1,687 | |
School transport | | 98 | | 103 | | 106 | | 109 | | 118 | | 126 | | 128 | | 130 | | 132 | | 133 | |
Special needs support | | 251 | | 227 | | 221 | | 231 | | 245 | | 261 | | 268 | | 268 | | 268 | | 267 | |
Professional Development | | 76 | | 86 | | 84 | | 95 | | 101 | | 108 | | 120 | | 104 | | 101 | | 102 | |
Schooling Improvement | | 12 | | 15 | | 12 | | 11 | | 9 | | 11 | | 13 | | 14 | | 14 | | 14 | |
| | | | | | | | | | | | | | | | | | | | | |
Primary and secondary education expenses | | 3,325 | | 3,449 | | 3,692 | | 3,934 | | 4,153 | | 4,345 | | 4,415 | | 4,428 | | 4,421 | | 4,412 | |
Places (year) | | 2002 | | 2003 | | 2004 | | 2005 | | 2006 | | 2007 | | 2008 | | 2009 | | 2010 | | 2011 | |
| | | | | | | | | | | | | | | | | | | | | |
Primary | | 465,000 | | 469,000 | | 464,000 | | 457,000 | | 457,951 | | 453,939 | | 451,490 | | 453,203 | | 454,115 | | 454,483 | |
Secondary | | 257,000 | | 265,000 | | 277,000 | | 284,000 | | 288,711 | | 290,180 | | 289,169 | | 286,712 | | 284,627 | | 284,006 | |
Sources: Ministry of Education, The Treasury
Table 6.9 – Tertiary education expenses
| | 2002 | | 2003 | | 2004 | | 2005 | | 2006 | | 2007 | | 2008 | | 2009 | | 2010 | | 2011 | |
($ million) | | Actual | | Actual | | Actual | | Actual | | Actual | | Forecast | | Forecast | | Forecast | | Forecast | | Forecast | |
| | | | | | | | | | | | | | | | | | | | | |
Tuition | | 1,515 | | 1,729 | | 1,770 | | 1,647 | | 1,865 | | 1,953 | | 2,106 | | 2,139 | | 2,171 | | 2,192 | |
Other tertiary funding | | 36 | | 62 | | 66 | | 68 | | 110 | | 153 | | 183 | | 181 | | 178 | | 180 | |
Tertiary student allowances | | 401 | | 388 | | 380 | | 359 | | 354 | | 385 | | 402 | | 407 | | 410 | | 411 | |
Initial fair value change in student loans | | — | | — | | — | | — | | 1,415 | | — | | — | | — | | — | | — | |
Student loans | | 273 | | 291 | | 319 | | 422 | | 303 | | 862 | | 562 | | 585 | | 607 | | 629 | |
| | | | | | | | | | | | | | | | | | | | | |
Tertiary education expenses | | 2,225 | | 2,470 | | 2,535 | | 2,496 | | 4,047 | | 3,353 | | 3,253 | | 3,312 | | 3,366 | | 3,412 | |
Places (year) | | 2002 | | 2003 | | 2004 | | 2005 | | 2006 | | 2007 | | 2008 | | 2009 | | 2010 | | 2011 | |
| | | | | | | | | | | | | | | | | | | | | |
EFT students | | 219,239 | | 245,152 | | 247,975 | | 240,734 | | 227,416 | | 233,062 | | 235,451 | | 239,543 | | 241,595 | | 243,249 | |
Sources: Ministry of Education, The Treasury
Table 6.10 – Core Government service expenses
| | 2002 | | 2003 | | 2004 | | 2005 | | 2006 | | 2007 | | 2008 | | 2009 | | 2010 | | 2011 | |
($ million) | | Actual | | Actual | | Actual | | Actual | | Actual | | Forecast | | Forecast | | Forecast | | Forecast | | Forecast | |
| | | | | | | | | | | | | | | | | | | | | |
Official development assistance | | 223 | | 230 | | 237 | | 297 | | 330 | | 348 | | 401 | | 432 | | 498 | | 567 | |
Indemnity and guarantee expenses | | — | | 197 | | 9 | | — | | — | | — | | — | | — | | — | | — | |
Departmental expenses | | 907 | | 1,025 | | 1,096 | | 1,570 | | 1,403 | | 2,496 | | 1,692 | | 1,686 | | 1,671 | | 1,720 | |
Science expenses | | 202 | | 250 | | 283 | | 170 | | 157 | | 164 | | 170 | | 172 | | 174 | | 173 | |
Other expenses | | 208 | | 78 | | 116 | | 180 | | 279 | | 229 | | 216 | | 216 | | 213 | | 212 | |
| | | | | | | | | | | | | | | | | | | | | |
Core Government service expenses | | 1,540 | | 1,780 | | 1,741 | | 2,217 | | 2,169 | | 3,237 | | 2,479 | | 2,506 | | 2,556 | | 2,672 | |
Source: The Treasury
Table 6.11 – Law and order expenses
| | 2002 | | 2003 | | 2004 | | 2005 | | 2006 | | 2007 | | 2008 | | 2009 | | 2010 | | 2011 | |
($ million) | | Actual | | Actual | | Actual | | Actual | | Actual | | Forecast | | Forecast | | Forecast | | Forecast | | Forecast | |
| | | | | | | | | | | | | | | | | | | | | |
Police | | 755 | | 800 | | 844 | | 896 | | 976 | | 1,075 | | 1,172 | | 1,181 | | 1,179 | | 1,178 | |
Ministry of Justice | | 15 | | 15 | | 178 | | 257 | | 299 | | 326 | | 369 | | 368 | | 361 | | 361 | |
Department of Corrections | | 412 | | 403 | | 439 | | 483 | | 572 | | 668 | | 773 | | 778 | | 785 | | 783 | |
Department for Courts | | 189 | | 211 | | 53 | | — | | — | | — | | — | | — | | — | | — | |
Other departments | | 71 | | 77 | | 81 | | 72 | | 76 | | 94 | | 87 | | 88 | | 88 | | 87 | |
| | | | | | | | | | | | | | | | | | | | | |
Department expenses | | 1,442 | | 1,506 | | 1,595 | | 1,708 | | 1,923 | | 2,163 | | 2,401 | | 2,415 | | 2,413 | | 2,409 | |
| | | | | | | | | | | | | | | | | | | | | |
Non-departmental outputs | | 178 | | 177 | | 178 | | 218 | | 262 | | 346 | | 311 | | 279 | | 299 | | 296 | |
Other expenses | | 113 | | 51 | | 70 | | 51 | | 50 | | 72 | | 124 | | 124 | | 124 | | 124 | |
| | | | | | | | | | | | | | | | | | | | | |
Law and order expenses | | 1,733 | | 1,734 | | 1,843 | | 1,977 | | 2,235 | | 2,581 | | 2,836 | | 2,818 | | 2,836 | | 2,829 | |
Source: The Treasury
Table 6.12 – Defence expenses
| | 2002 | | 2003 | | 2004 | | 2005 | | 2006 | | 2007 | | 2008 | | 2009 | | 2010 | | 2011 | |
($ million) | | Actual | | Actual | | Actual | | Actual | | Actual | | Forecast | | Forecast | | Forecast | | Forecast | | Forecast | |
| | | | | | | | | | | | | | | | | | | | | |
NZDF Core expenses | | 1,076 | | 1,095 | | 1,182 | | 1,203 | | 1,306 | | 1,451 | | 1,590 | | 1,635 | | 1,722 | | 1,832 | |
NZDF write-offs | | — | | 23 | | 72 | | — | | — | | — | | — | | — | | — | | — | |
NZDF East Timor deployment | | 20 | | 20 | | — | | — | | — | | — | | — | | — | | — | | — | |
MSD East Timor deployment | | 23 | | 13 | | 12 | | 10 | | 10 | | 10 | | — | | — | | — | | — | |
Other departments | | 43 | | 48 | | 45 | | 62 | | 67 | | 72 | | 51 | | 51 | | 51 | | 51 | |
| | | | | | | | | | | | | | | | | | | | | |
Defence expenses | | 1,162 | | 1,199 | | 1,311 | | 1,275 | | 1,383 | | 1,533 | | 1,641 | | 1,686 | | 1,773 | | 1,883 | |
Source: The Treasury
Table 6.13 – Transport and communication expenses
| | 2002 | | 2003 | | 2004 | | 2005 | | 2006 | | 2007 | | 2008 | | 2009 | | 2010 | | 2011 | |
($ million) | | Actual | | Actual | | Actual | | Actual | | Actual | | Forecast | | Forecast | | Forecast | | Forecast | | Forecast | |
| | | | | | | | | | | | | | | | | | | | | |
Land Transport NZ(1) | | 817 | | 1,131 | | 1,222 | | 1,346 | | 1,482 | | 2,054 | | 2,225 | | 2,242 | | 2,034 | | 2,103 | |
Departmental outputs | | 78 | | 80 | | 83 | | 97 | | 101 | | 121 | | 123 | | 121 | | 126 | | 123 | |
Other non-departmental expenses | | 49 | | 61 | | 84 | | 79 | | 109 | | 107 | | 123 | | 116 | | 124 | | 114 | |
Goodwill amortisation | | 23 | | 47 | | 47 | | 47 | | 47 | | — | | — | | — | | — | | — | |
Rail write-offs | | — | | 81 | | 19 | | — | | — | | — | | — | | — | | — | | — | |
Rail costs | | — | | — | | 3 | | 63 | | 77 | | 214 | | 313 | | 309 | | 280 | | 134 | |
Other expenses | | 22 | | 8 | | 3 | | 3 | | 2 | | 9 | | 8 | | 8 | | 2 | | 2 | |
| | | | | | | | | | | | | | | | | | | | | |
Transport and communication expenses | | 989 | | 1,408 | | 1,461 | | 1,635 | | 1,818 | | 2,505 | | 2,792 | | 2,796 | | 2,566 | | 2,476 | |
(1) Since 2004/05 funding has been provided to Land Transport NZ. Prior to this, funding was received by Transfund.
Source: The Treasury
Table 6.14 – Economic and industrial services expenses
| | 2002 | | 2003 | | 2004 | | 2005 | | 2006 | | 2007 | | 2008 | | 2009 | | 2010 | | 2011 | |
($ million) | | Actual | | Actual | | Actual | | Actual | | Actual | | Forecast | | Forecast | | Forecast | | Forecast | | Forecast | |
| | | | | | | | | | | | | | | | | | | | | |
Departmental outputs | | 414 | | 424 | | 478 | | 508 | | 549 | | 556 | | 577 | | 570 | | 564 | | 558 | |
Employment initiatives | | 209 | | 217 | | 222 | | 224 | | 202 | | 224 | | 223 | | 221 | | 217 | | 217 | |
Non-departmental outputs | | 282 | | 277 | | 444 | | 549 | | 751 | | 810 | | 832 | | 920 | | 968 | | 1,020 | |
Reserve Electricity Generation | | — | | — | | — | | — | | 26 | | 26 | | 55 | | 26 | | 26 | | 26 | |
Flood relief | | — | | — | | 15 | | 52 | | 8 | | — | | — | | — | | — | | — | |
Savings package | | — | | — | | — | | — | | — | | — | | 491 | | 808 | | 1,106 | | 1,302 | |
Other expenses | | 108 | | 136 | | 33 | | 111 | | 56 | | 65 | | 98 | | 106 | | 120 | | 116 | |
| | | | | | | | | | | | | | | | | | | | | |
Economic and industrial service expenses | | 1,013 | | 1,054 | | 1,192 | | 1,444 | | 1,592 | | 1,681 | | 2,276 | | 2,651 | | 3,001 | | 3,239 | |
Source: The Treasury
Table 6.15 – Employment initiatives
| | 2002 | | 2003 | | 2004 | | 2005 | | 2006 | | 2007 | | 2008 | | 2009 | | 2010 | | 2011 | |
($ million) | | Actual | | Actual | | Actual | | Actual | | Actual | | Forecast | | Forecast | | Forecast | | Forecast | | Forecast | |
| | | | | | | | | | | | | | | | | | | | | |
Training incentive allowance | | 36 | | 37 | | 42 | | 36 | | 32 | | 37 | | 44 | | 44 | | 44 | | 44 | |
Community employment projects | | 21 | | 21 | | 16 | | 6 | | — | | — | | — | | — | | — | | — | |
Subsidised work | | 92 | | 95 | | 100 | | 102 | | 84 | | 95 | | 85 | | 82 | | 78 | | 78 | |
Employment support for disabled | | 60 | | 61 | | 61 | | 74 | | 82 | | 88 | | 90 | | 91 | | 91 | | 91 | |
Other employment assistance schemes | | — | | 3 | | 3 | | 6 | | 4 | | 4 | | 4 | | 4 | | 4 | | 4 | |
| | | | | | | | | | | | | | | | | | | | | |
Employment initiatives | | 209 | | 217 | | 222 | | 224 | | 202 | | 224 | | 223 | | 221 | | 217 | | 217 | |
Source: The Treasury
Table 6.16 – Primary service expenses
| | 2002 | | 2003 | | 2004 | | 2005 | | 2006 | | 2007 | | 2008 | | 2009 | | 2010 | | 2011 | |
($ million) | | Actual | | Actual | | Actual | | Actual | | Actual | | Forecast | | Forecast | | Forecast | | Forecast | | Forecast | |
| | | | | | | | | | | | | | | | | | | | | |
Departmental expenses | | 220 | | 265 | | 269 | | 272 | | 350 | | 357 | | 358 | | 357 | | 352 | | 353 | |
Non-departmental outputs | | 75 | | 80 | | 81 | | 114 | | 97 | | 102 | | 115 | | 109 | | 108 | | 102 | |
Other expenses | | 9 | | 10 | | 18 | | 8 | | 20 | | 18 | | 21 | | 18 | | 17 | | 17 | |
| | | | | | | | | | | | | | | | | | | | | |
Primary service expenses | | 304 | | 355 | | 368 | | 394 | | 467 | | 477 | | 494 | | 484 | | 477 | | 472 | |
Source: The Treasury
Table 6.17 – Heritage, culture and recreation expenses
| | 2002 | | 2003 | | 2004 | | 2005 | | 2006 | | 2007 | | 2008 | | 2009 | | 2010 | | 2011 | |
($ million) | | Actual | | Actual | | Actual | | Actual | | Actual | | Forecast | | Forecast | | Forecast | | Forecast | | Forecast | |
| | | | | | | | | | | | | | | | | | | | | |
Community grants | | 6 | | 6 | | 3 | | 6 | | 7 | | 7 | | 7 | | 7 | | 7 | | 7 | |
Kyoto protocol | | — | | — | | — | | 310 | | 345 | | — | | — | | — | | — | | — | |
Departmental outputs | | 212 | | 253 | | 269 | | 292 | | 322 | | 395 | | 401 | | 398 | | 403 | | 410 | |
Non-departmental outputs | | 130 | | 212 | | 258 | | 317 | | 351 | | 400 | | 392 | | 391 | | 391 | | 381 | |
Other expenses | | 86 | | 44 | | 104 | | 66 | | 169 | | 82 | | 177 | | 71 | | 69 | | 70 | |
| | | | | | | | | | | | | | | | | | | | | |
Heritage, culture and recreation expenses | | 434 | | 515 | | 634 | | 991 | | 1,194 | | 884 | | 977 | | 867 | | 870 | | 868 | |
| | | | | | | | | | | | | | | | | | | | | |
Kyoto Protocol exchange rate change in gains & losses | | | | | | | | | | | | (96 | ) | | | | | | | | |
| | | | | | | | | | | | | | | | | | | | | |
Heritage expenses including gains and losses | | | | | | | | | | | | 788 | | 977 | | 867 | | 870 | | 868 | |
Source: The Treasury
Table 6.18 – Housing and community development expenses
| | 2002 | | 2003 | | 2004 | | 2005 | | 2006 | | 2007 | | 2008 | | 2009 | | 2010 | | 2011 | |
($ million) | | Actual | | Actual | | Actual | | Actual | | Actual | | Forecast | | Forecast | | Forecast | | Forecast | | Forecast | |
| | | | | | | | | | | | | | | | | | | | | |
Housing subsidies | | 22 | | 25 | | 27 | | 31 | | 23 | | 26 | | 29 | | 29 | | 28 | | 29 | |
Departmental outputs | | 51 | | 57 | | 77 | | 100 | | 117 | | 142 | | 151 | | 145 | | 136 | | 132 | |
Other non-departmental expenses | | 20 | | 20 | | 35 | | 32 | | 62 | | 111 | | 124 | | 112 | | 106 | | 107 | |
| | | | | | | | | | | | | | | | | | | | | |
Housing and community development expenses | | 93 | | 102 | | 139 | | 163 | | 202 | | 279 | | 304 | | 286 | | 270 | | 268 | |
Source: The Treasury
7
NZ IFRS Transition – Budget 2007
Introduction
The impact of the change to New Zealand equivalents to International Financial Reporting Standards (New GAAP) on Budget 2007 are outlined in the Fiscal Outlook chapter (pages 80-114). The aim of this section is to provide additional detail on those impacts.
Significant impacts are summarised into two main categories:
· changes to the format of the main financial statements to enable easier comparatives with New GAAP format, and
· measurement and reclassification adjustments owing to changes in accounting policy under New GAAP.
The following pages describe the impact of these key format and measurement changes in:
· the Statement of Financial Performance
· the Statement of Cash Flows, and
· the Statement of Financial Position.
Each statement begins with the current “old” format used in previous forecasts. Changes to this format are then detailed separately resulting in the second “Old GAAP 2007 Forecast” column which agrees to the forecast financial statements presented in the GAAP Series Tables chapter (pages 157-184). Subsequent columns detail the measurement and reclassification adjustments owing to changes in accounting policy. These changes all sum together to give the New GAAP 2007 financial statements also presented in the GAAP Series Tables chapter. Detailed explanations for the adjustments are given in the notes at the end of the chapter.
Further details on the adoption and expected impact of moving to New GAAP on the Financial Statements of Government, including NZ IFRS accounting policies for the Government reporting entity are available at www.treasury.govt.nz/nzifrs/.
Forecast Statement of Financial Performance
for the year ended 30 June 2007
Old format | | | | | | New format | |
($ million) | | Old
GAAP
2007
Forecast | | Format
changes
note
(i) | | Old
GAAP
2007
Forecast | | GSF
note
(ii) | | ACC
note
(iii) | | NZS
Fund
note
(iv) | | Financial
instruments
note
(v) | | Reclassifications
note
(ix) | | Other
note
(x) | | New
GAAP
2007
Forecast | | ($ million) | |
| | | | | | | | | | | | | | | | | | | | | | | |
Revenue | | | | | | | | | | | | | | | | | | | | | | Revenue | |
Taxation revenue | | 51,539 | | | | 51,539 | | 117 | | | | | | | | — | | 2 | | 51,658 | | Taxation revenue | |
Levies, fees, fines and penalties | | 3,508 | | | | 3,508 | | | | | | | | 16 | | 186 | | (19 | ) | 3,691 | | Other sovereign revenue | |
Total Revenue Levied through the Crown’s Sovereign Power | | 55,047 | | — | | 55,047 | | 117 | | — | | — | | 16 | | 186 | | (17 | ) | 55,349 | | Total Revenue Levied
through the Crown’s
Sovereign Power | |
| | | | | | | | | | | | | | | | | | | | | | | |
Sales of goods and services | | 13,111 | | | | 13,111 | | | | | | 18 | | (16 | ) | (536 | ) | (14 | ) | 12,563 | | Sales of goods and
services | |
Investment income | | 5,807 | | | | 5,807 | | (462 | ) | | | (1,051 | ) | (896 | ) | (423 | ) | 97 | | 3,072 | | Interest revenue and
dividends | |
Other revenue | | 2,238 | | | | 2,238 | | (86 | ) | | | 4 | | | | 300 | | (50 | ) | 2,406 | | Other revenue | |
Total Revenue Earned through the Crown’s Operations | | 21,156 | | — | | 21,156 | | (548 | ) | — | | (1,029 | ) | (912 | ) | (659 | ) | 33 | | 18,041 | | Total Revenue Earned
through the Crown’s
Operations | |
| | | | | | | | | | | | | | | | | | | | | | | |
Total Crown Revenue | | 76,203 | | — | | 76,203 | | (431 | ) | — | | (1,029 | ) | (896 | ) | (473 | ) | 16 | | 73,390 | | Total Revenue
(excluding gains) | |
| | | | | | | | | | | | | | | | | | | | | | | |
Expenses | | | | | | | | | | | | | | | | | | | | | | Expenses | |
By input type | | | | | | | | | | | | | | | | | | | | | | | |
Subsidies and transfer payments | | 18,430 | | (155 | ) | 18,275 | | | | | | | | | | 24 | | 1 | | 18,300 | | Social assistance and
official development
assistance | |
Personnel expenses | | 15,352 | | 321 | | 15,673 | | (199 | ) | | | | | | | (388 | ) | (2 | ) | 15,084 | | Personnel expenses | |
| | | | 3,099 | | 3,099 | | | | | | | | | | (76 | ) | — | | 3,023 | | Depreciation and
amortisation | |
Operating expenses | | 31,198 | | (2,944 | ) | 28,254 | | | | | | | | (6 | ) | (79 | ) | (37 | ) | 28,132 | | Other operating
expenses | |
Finance costs | | 3,023 | | 40 | | 3,063 | | 5 | | | | | | (583 | ) | 95 | | 200 | | 2,780 | | Interest expenses | |
Movement in total ACC liability | | 1,743 | | | | 1,743 | | | | 283 | | | | | | (1,072 | ) | — | | 954 | | Insurance expenses | |
Movement in total GSF liability | | 321 | | (321 | ) | — | | | | | | | | | | | | — | | — | | | |
New operating spending up to Budget 2008 | | 80 | | | | 80 | | | | | | | | | | | | — | | 80 | | New operating spending
up to Budget 2008 | |
Top-down expense adjustment | | (500 | ) | | | (500 | ) | | | | | | | | | | | — | | (500 | ) | Top-down expense
adjustment | |
Net foreign-exchange (gains)/losses | | 40 | | (40 | ) | — | | | | | | | | | | | | — | | — | | | |
| | | | | | | | | | | | | | | | | | | | | | | |
Total Crown expenses | | 69,687 | | — | | 69,687 | | (194 | ) | 283 | | — | | (589 | ) | (1,496 | ) | 162 | | 67,853 | | Total Expenses
(excluding losses) | |
| | | | | | | | | | | | | | | | | | | | | | | |
Revenue less Expenses | | 6,516 | | — | | 6,516 | | (237 | ) | (283 | ) | (1,029 | ) | (307 | ) | 1,023 | | (146 | ) | 5,537 | | Operating Balance
before gains (losses) | |
| | | | | | | | | | | | | | | | | | | | | | | |
| | | | | | — | | | | | | 1,029 | | 294 | | 314 | | 7 | | 1,644 | | Net gains/(losses) on
financial instruments | |
| | | | | | — | | 291 | | | | | | | | (1,337 | ) | 99 | | (947 | ) | Net gains/(losses) on
non-financial
instruments | |
| | | | | | | | | | | | | | | | | | | | | | | |
| | | | — | | — | | 291 | | — | | 1,029 | | 294 | | (1,023 | ) | 106 | | 697 | | Total Other Gains
(Losses) | |
| | | | | | | | | | | | | | | | | | | | | | | |
Net surplus of TEIs | | 52 | | | | 52 | | | | | | | | | | | | 44 | | 96 | | Net surplus/(deficit) from
associates and joint
ventures | |
| | 6,568 | | 0 | | 6,568 | | 54 | | (283 | ) | — | | (13 | ) | — | | 4 | | 6,330 | | Operating Balance
from continuing
activities | |
| | | | | | | | | | | | | | | | | | | | | | | |
| | | | | | — | | | | | | | | | | | | (3 | ) | (3 | ) | Gain/(loss) from
discontinued operations | |
| | | | | | | | | | | | | | | | | | | | | | | |
Operating balance (including minority interest) | | 6,568 | | — | | 6,568 | | 54 | | (283 | ) | — | | (13 | ) | — | | 1 | | 6,327 | | Operating Balance
(including minority
interest) | |
| | | | | | | | | | | | | | | | | | | | | | | |
Minority interest | | | | | | | | | | | | | | | | | | — | | — | | Attributable to minority
interest in Air NZ | |
| | | | | | | | | | | | | | | | | | | | | | | |
Operating Balance | | 6,568 | | — | | 6,568 | | 54 | | (283 | ) | — | | (13 | ) | — | | 1 | | 6,327 | | Operating Balance | |
Forecast Statement of Cash Flows
for the year ended 30 June 2007
Old format | | | | | | New format | |
($ million) | | Old
GAAP
2007
Forecast | | Format
changes
note
(i) | | Old
GAAP
2007
Forecast | | GSF
note
(ii) | | NZS
Fund
note
(iv) | | Financial
instruments
note
(iv) | | Reclassifications
note
(ix) | | Other
note
(x) | | New
GAAP
2007
Forecast | | ($ million) | |
| | | | | | | | | | | | | | | | | | | | | |
Cash flows from operations | | | | | | | | | | | | | | | | | | | | Cash flows from
operations | |
Cash was provided from | | | | | | | | | | | | | | | | | | | | Cash was provided
from | |
Total tax receipts | | 51,823 | | | | 51,823 | | 94 | | 112 | | | | | | (20 | ) | 52,009 | | Total tax receipts | |
Total other sovereign receipts | | 3,387 | | | | 3,387 | | | | | | | | 142 | | (74 | ) | 3,455 | | Other sovereign receipts | |
Sales of goods and services | | 13,357 | | | | 13,357 | | | | 19 | | | | (612 | ) | 31 | | 12,795 | | Sales of goods and
services | |
Interest | | 2,148 | | | | 2,148 | | (69 | ) | 152 | | (106 | ) | (54 | ) | — | | 2,071 | | Interest | |
Dividends | | 133 | | | | 133 | | | | 262 | | | | | | 31 | | 426 | | Dividends | |
Other operating receipts | | 2,091 | | | | 2,091 | | (90 | ) | | | | | 419 | | (68 | ) | 2,352 | | Other operating receipts | |
Total cash provided from operations | | 72,939 | | — | | 72,939 | | (65 | ) | 545 | | (106 | ) | (105 | ) | (100 | ) | 73,108 | | Total cash provided
from operations | |
| | | | | | | | | | | | | | | | | | | | | |
Cash was disbursed to | | | | | | | | | | | | | | | | | | | | Cash was disbursed to | |
Subsidies and transfer payments | | 18,592 | | | | 18,592 | | | | | | | | (20 | ) | (295 | ) | 18,277 | | Social assistance and
official development
assistance | |
Personnel and operating payments | | 41,189 | | | | 41,189 | | (282 | ) | 78 | | (191 | ) | (2 | ) | 223 | | 41,015 | | Personnel and operating
payments | |
Finance costs | | 2,428 | | | | 2,428 | | | | | | 79 | | (20 | ) | — | | 2,487 | | Finance costs | |
Forecast new operating spending | | 80 | | | | 80 | | | | | | | | | | — | | 80 | | Forecast for future new
spending | |
Top-down expense adjustment | | (500 | ) | | | (500 | ) | | | | | | | | | — | | (500 | ) | Top-down expense
adjustment | |
Total cash disbursed to operations | | 61,789 | | — | | 61,789 | | (282 | ) | 78 | | (112 | ) | (42 | ) | (72 | ) | 61,359 | | Total cash disbursed
to operations | |
| | | | | | | | | | | | | | | | | | | | | |
Net cash flows from operations | | 11,150 | | — | | 11,150 | | 217 | | 467 | | 6 | | (63 | ) | (28 | ) | 11,749 | | Net cash flows from
operations | |
| | | | | | | | | | | | | | | | | | | | | |
Cash flows from investing activities | | | | | | | | | | | | | | | | | | | | Cash flows from
investing activities | |
Cash was provided from | | | | | | | | | | | | | | | | | | | | | |
Sale of physical assets | | 246 | | (246 | ) | — | | | | | | | | | | — | | — | | | |
| | | | | | | | | | | | | | | | | | | | | |
Total cash provided | | 246 | | (246 | ) | — | | — | | — | | — | | — | | — | | — | | | |
| | | | | | | | | | | | | | | | | | | | | |
Cash was disbursed to | | | | | | | | | | | | | | | | | | | | | |
Net purchase/(sale) of marketable securities, deposits and other equity investments | | (9,656 | ) | | | (9,656 | ) | (181 | ) | (184 | ) | 1,322 | | 92 | | — | | (8,607 | ) | Net sale/(purchase) of
share investments and
other securities | |
Purchase of physical assets | | (6,782 | ) | 246 | | (6,536 | ) | | | | | | | | | (71 | ) | (6,607 | ) | Net sale/(purchase) of
physical assets | |
| | | | | | — | | | | | | | | | | (139 | ) | (139 | ) | Net sale/(purchase) of
intangible assets | |
Net increase in advances | | (2,409 | ) | | | (2,409 | ) | | | | | 249 | | 150 | | — | | (2,010 | ) | Net repayment/(issue) of
advances | |
| | | | | | — | | | | (283 | ) | | | (92 | ) | (9 | ) | (384 | ) | Net
disposal/(acquisition) of
investment in associates | |
Top-down capital adjustment | | 200 | | | | 200 | | | | | | | | | | — | | 200 | | Top-down capital
adjustment | |
| | | | | | | | | | | | | | | | | | | | | |
Net cash flows from investing activities | | (18,401 | ) | — | | (18,401 | ) | (181 | ) | (467 | ) | 1,571 | | 150 | | (219 | ) | (17,547 | ) | Net cash flows from
investing activities | |
| | | | | | | | | | | | | | | | | | | | | |
Net Cash Flows from Operating and Investing Activities | | (7,251 | ) | — | | (7,251 | ) | 36 | | — | | 1,577 | | 87 | | (247 | ) | (5,798 | ) | Net Cash Flows from
Operating and
Investing Activities | |
| | | | | | | | | | | | | | | | | | | | | |
Cash flows from financing activities | | | | | | | | | | | | | | | | | | | | Cash flows from
financing activities | |
Cash was provided from | | | | | | | | | | | | | | | | | | | | | |
Issues of circulating currency | | 272 | | 1 | | 273 | | | | | | | | | | — | | 273 | | Issues of circulating
currency | |
Net (repayment)/issue of Government stock | | (128 | ) | | | (128 | ) | | | | | (238 | ) | | | — | | (366 | ) | Net issue/(repayment) of
Government Stock | |
Net (issue)/repayment of other New Zealand-dollar borrowing | | 6,693 | | (1 | ) | 6,692 | | | | | | (825 | ) | (359 | ) | 1 | | 5,509 | | Net issue/(repayment) of
other New Zealand
dollar borrowing | |
Net (issue)/repayment of foreign currency borrowing | | (272 | ) | | | (272 | ) | | | | | (204 | ) | 272 | | — | | (204 | ) | Net issue/(repayment) of
foreign currency
borrowing | |
| | | | | | | | | | | | | | | | | | | | | |
Net cash flows from financing activities | | 6,565 | | — | | 6,565 | | — | | — | | (1,267 | ) | (87 | ) | 1 | | 5,212 | | Net cash flows from
financing activities | |
| | | | | | | | | | | | | | | | | | | | | |
Net movement in cash | | (686 | ) | — | | (686 | ) | 36 | | — | | 310 | | — | | (246 | ) | (586 | ) | Net
(decrease)/increase in
cash and cash
equivalents | |
| | | | | | | | | | | | | | | | | | | | | |
Opening Cash Balance | | 4,168 | | | | 4,168 | | (36 | ) | | | (310 | ) | | | (146 | ) | 3,676 | | Opening cash and
cash equivalents | |
Foreign exchange gains/(losses) on opening cash | | (4 | ) | | | (4 | ) | | | | | | | | | 21 | | 17 | | Foreign exchange
gains/(losses) on
opening cash | |
Closing Cash Balance | | 3,478 | | — | | 3,478 | | — | | — | | — | | — | | (371 | ) | 3,107 | | Closing cash and cash
equivalents | |
Forecast Statement of Financial Position
for the year ended 30 June 2007
Old format | | | | | | New format | |
($ million) | | Old
GAAP
2007
Forecast | | Format
changes
note
(i) | | Old
GAAP
2007
Forecast | | GSF
note
(ii) | | ACC
note
(iii) | | NPF
note
(vi) | | Receivables
note
(vii) | | LINZ
prop
reval
note
(viii) | | Fin
Inst
note
(iv) | | Other
note
(x) | | New
GAAP
2007
Forecast | | ($ million) | |
| | | | | | | | | | | | | | | | | | | | | | | | | |
Assets | | | | | | | | | | | | | | | | | | | | | | | | Assets | |
Cash and bank balances | | 3,478 | | | | 3,478 | | | | | | | | | | | | | | (371 | ) | 3,107 | | Cash and cash
equivalents | |
Receivables | | 12,246 | | (274 | ) | 11,972 | | (349 | ) | 1,441 | | (268 | ) | (306 | ) | | | (143 | ) | (18 | ) | 12,329 | | Receivables | |
Marketable securities, deposits and equity instruments | | 52,015 | | (16,715 | ) | 35,300 | | (1,700 | ) | | | | | | | | | 153 | | (3,023 | ) | 30,730 | | Marketable securities
and derivatives | |
| | | | 16,783 | | 16,783 | | (2,412 | ) | | | | | | | | | | | (250 | ) | 14,121 | | Share investments | |
Advances | | 10,195 | | 221 | | 10,416 | | | | | | | | | | | | | | 3,423 | | 13,839 | | Advances | |
Inventories | | 1,101 | | | | 1,101 | | | | | | | | | | | | | | (160 | ) | 941 | | Inventory | |
| | | | 1,241 | | 1,241 | | | | | | | | | | (378 | ) | | | 319 | | 1,182 | | Prepayments and
other assets | |
Commercial forests | | 550 | | (550 | ) | — | | | | | | | | | | | | | | — | | — | | | |
Property, plant and equipment | | 93,259 | | (417 | ) | 92,842 | | | | | | | | | | 694 | | | | (866 | ) | 92,670 | | Property, plant and
equipment | |
TEI investment | | 5,586 | | | | 5,586 | | | | | | | | | | | | | | 896 | | 6,482 | | Equity accounted
investments
(including TEIs) | |
Intangible assets (including goodwill) | | 594 | | | | 594 | | | | | | | | | | | | | | 975 | | 1,569 | | Intangible assets and
goodwill | |
Top-down capital adjustment | | (200 | ) | | | (200 | ) | | | | | | | | | | | | | — | | (200 | ) | Top-down capital
adjustment | |
Other investments | | 289 | | (289 | ) | — | | | | | | | | | | | | | | — | | — | | | |
| | | | | | | | | | | | | | | | | | | | | | | | | |
Total Assets | | 179,113 | | — | | 179,113 | | (4,461 | ) | 1,441 | | (268 | ) | (306 | ) | 316 | | 10 | | 925 | | 176,770 | | Total Assets | |
| | | | | | | | | | | | | | | | | | | | | | | | | |
Liabilities | | | | | | | | | | | | | | | | | | | | | | | | Liabilities | |
Currency issued | | 3,551 | | | | 3,551 | | | | | | | | | | | | | | 1 | | 3,552 | | Issued currency | |
Payables and provisions | | 14,728 | | (3,607 | ) | 11,121 | | (537 | ) | (139 | ) | | | | | | | (394 | ) | (1,139 | ) | 8,912 | | Payables | |
| | | | | | — | | | | | | | | | | | | | | 845 | | 845 | | Deferred revenue | |
| | | | | | — | | | | | | | | | | | | 377 | | (377 | ) | — | | Derivatives in loss | |
| | | | 7,523 | | 7,523 | | | | | | | | | | | | | | — | | 7,523 | | Settlement deposits
with the Reserve
Bank | |
| | | | 34,844 | | 34,844 | | 84 | | | | | | | | | | 241 | | 863 | | 36,033 | | Other borrowings | |
Borrowings - sovereign guaranteed | | 30,819 | | (30,819 | ) | — | | | | | | | | | | | | | | — | | — | | | |
Borrowings - non-sovereign guaranteed | | 11,548 | | (11,548 | ) | — | | | | | | | | | | | | | | — | | — | | | |
Provision for ACC outstanding claims liability | | 14,457 | | | | 14,457 | | | | 3,465 | | | | | | | | | | 76 | | 17,998 | | Insurance liabilities | |
Provision for GSF pension liability | | 15,554 | | | | 15,554 | | (7,203 | ) | | | | | | | | | | | 12 | | 8,363 | | Defined benefit
retirement plan
liabilities | |
| | | | 3,607 | | 3,607 | | | | | | | | | | | | | | 241 | | 3,848 | | Provisions | |
| | | | | | | | | | | | | | | | | | | | | | | | | |
Total Liabilities | | 90,657 | | — | | 90,657 | | (7,656 | ) | 3,326 | | — | | — | | — | | 224 | | 522 | | 87,074 | | Total Liabilities | |
| | | | | | | | | | | | | | | | | | | | | | | | | |
Total Assets less Total Liabilities | | 88,456 | | — | | 88,456 | | 3,195 | | (1,885 | ) | (268 | ) | (306 | ) | 316 | | (214 | ) | 403 | | 89,696 | | Total Assets less
Total Liabilities | |
| | | | | | | | | | | | | | | | | | | | | | | | | |
Net Worth | | | | | | | | | | | | | | | | | | | | | | | | Net Worth | |
Taxpayer funds | | 40,018 | | | | 40,018 | | 3,195 | | (1,885 | ) | (268 | ) | (306 | ) | 316 | | (214 | ) | 996 | | 41,852 | | Taxpayer funds | |
Revaluation reserve | | 48,145 | | | | 48,145 | | | | | | | | | | | | | | (686 | ) | 47,459 | | Revaluation reserve | |
| | | | | | — | | | | | | | | | | | | | | 62 | | 62 | | Cashflow hedge
reserve | |
| | | | | | — | | | | | | | | | | | | | | 13 | | 13 | | Available for sale
financial asset
reserve | |
| | | | | | — | | | | | | | | | | | | | | 17 | | 17 | | Foreign exchange
translation reserve | |
Total Net Worth attributable to the Crown | | 88,163 | | — | | 88,163 | | 3,195 | | (1,885 | ) | (268 | ) | (306 | ) | 316 | | (214 | ) | 402 | | 89,403 | | Total Net Worth
attributable to the
Crown | |
Minority interest | | 293 | | | | 293 | | | | | | | | | | | | | | — | | 293 | | Net Worth
attributable to
minority interest in Air
NZ | |
Net Worth | | 88,456 | | — | | 88,456 | | 3,195 | | (1,885 | ) | (268 | ) | (306 | ) | 316 | | (214 | ) | 402 | | 89,696 | | Total Net Worth | |
Notes to the NZ IFRS Transition
i. Changes to the format to enhance comparability. Major reclassifications are:
a. depreciation and amortisation previously classified under operating expenses now separately disclosed
b. share investments previously classified under marketable securities now separately disclosed
c. settlement deposits with the Reserve Bank previously classified under borrowings – sovereign guaranteed now separately disclosed
d. separation of borrowings between sovereign guaranteed and non-sovereign guaranteed no longer in the statement of financial position (transferred to notes to the financial statements), and
e. payables and provisions previously classified as one category now split.
ii. The reporting of the Government Superannuation Fund (GSF) has changed due to applying a specific standard for employee benefits, including pension schemes, under New GAAP. The main changes to the financial statements are:
a. a reduction of $3.2 billion in the net liability of GSF due to valuing the liability on the basis that the Government meets its obligation on a pay-as-needed basis (rather than the amount to be invested today to fully fund future contributions under Old GAAP). This latter approach assumes the Fund would invest in assets that would generate revenue on which there would be an additional obligation to pay tax
b. a netting of GSF plan assets of $4 billion against the pension liability (nil impact on net worth), and
c. the way the GSF is consolidated in the Statement of Financial Performance and the Statement of Cash Flows. Under New GAAP pension expense (the net of the expected current service cost, expected interest cost and the expected investment return on GSF assets) is reported as expenses, and actuarial gains and losses (experience adjustments and changes in valuation assumptions) are reported in gains and losses section of the Statement of Financial Performance. Under Old GAAP actual investment returns on GSF assets are reported as revenue; benefit payments to members are reported as personnel expenses; and other changes in the valuation of GSF are reported as the movement in GSF liability in the Statement of Financial Performance. Under New GAAP investment taxes actually paid by GSF are no longer eliminated in the consolidated financial statements.
iii. The reporting of the ACC liability has changed owing to the new requirements under New GAAP. The main changes to the financial statements are:
a. the ACC liability has increased by $1.9 billion ($1.6 billion on transition to New GAAP at 1 July 2006 plus $0.3 billion impact in 2006/07) due to adding an additional risk premium and liability adequacy test. The actuarially calculated liability under Old GAAP represents a mid-point estimate – that is, equal chance of actual payouts being greater than or less than the estimate. To that extent, it represents the most likely outcome. Introducing an additional risk premium and liability adequacy test under New GAAP does not change the relative risk of ACC’s activities; rather it simply changes how this risk is reported
b. amounts separately reported as accounts receivable and payable (eg, levy prepayments and arrears) to be netted against the liability (nil impact on net worth).
iv. Reclassification of the New Zealand Superannuation Fund (NZS Fund) into additional reporting lines.
v. Cumulative effect of reclassifications of financial liabilities and assets, separate recognition of derivatives and impact of fair valuing some government stock. This includes the separation of gains and losses in the statement of financial performance.
vi. Tax effect of valuing the National Provident Fund (NPF) liability on the basis of present valuing the possible payments to this scheme under the current arrangements, rather than the current approach which determines what payment would be required today to settle all future obligations.
vii. Write down of receivables from taxes and fines due to accounting for time value of money and collection costs.
viii. Some properties held by Land Information New Zealand (LINZ) have been reclassified from assets for sale to property, plant and equipment and as a result have been fair valued.
ix. Significant reclassifications between reporting lines. Major items are:
a. interest and dividend income, interest expense and gains/losses on financial instruments
b. sales of goods and services and other revenue, and
c. official development assistance and operating expenses.
x. Residual changes. Includes impact of:
a. reclassification from cash to advances due to a change of definition of cash and cash equivalents under New GAAP (including resulting cash flows)
b. reclassification of items previously reported as marketable securities and share investments to advances and equity accounted investments
c. reclassification of software assets from property, plant and equipment to intangibles
d. reclassification of items previously reported as payables and provisions mainly to deferred revenue but some borrowings and provisions, and
e. deemed cost adjustment on transition to New GAAP, re-setting some revaluation reserve to taxpayers funds.
Glossary of Terms
ACC unfunded liability
The future cost of past ACC claims, less the asset reserves held to meet these claims. The ACC outstanding claims liability is the gross liability of the future cost of past ACC claims.
Baselines
The level of funding approved for any given spending area (eg, Education). All amounts within baselines are included in the forecasts.
Contingent liability
Contingent liabilities are costs, which the Crown will have to face if a particular event occurs. Typically, contingent liabilities consist of guarantees and indemnities, and legal disputes and claims.
Core Crown
The core Crown represents the revenues, expenses, assets and liabilities of the Crown, departments, Offices of Parliament, the Reserve Bank, GSF and the NZS Fund.
Corporate tax
The sum of net company tax, non-resident withholding tax (NRWT), foreign dividend withholding payments (FDWP) and withholding tax on resident dividend income (DWT).
Current account (Balance of payments)
A measure of the flows of income between New Zealand and the rest of the world. A net inflow to New Zealand is a current account surplus, while a net outflow is a deficit. The current account balance is commonly expressed as a percentage of GDP.
Customs duty
Duty levied on the imports of certain goods.
Cyclically adjusted or structural fiscal balance
An estimate of the fiscal balance (eg, OBEGAL) adjusted for short-term fluctuations of actual GDP around trend GDP. The estimate provides a picture of the underlying trend fiscal position and an indication of the effects of policy decisions. Because it is based on a number of assumptions and is sensitive to new information, the estimate is subject to some uncertainty.
Demographic changes
Changes to the structure of the population, for example the age, sex or ethnic make-up of the population.
Domestic bond programme
The amount of new government stock expected to be issued over the financial year.
Excise duties
Tax levied on the domestic production of alcohol, tobacco and light petroleum products (CNG, LPG and petrol).
Financial assets
Cash, or shares (equity), a right to receive cash or shares (equity), or a right to exchange a financial asset or liability on favourable terms.
Fiscal impulse
A summary measure of how changes in fiscal policy affect aggregate demand. To isolate discretionary changes, fiscal impulse is calculated on a cyclically-adjusted basis and excluding net interest payments To better capture the role of capital spending the indicator is derived from cash flow information.
Fiscal intentions (short-term)
Under the Public Finance Act 1989, the Government must indicate explicitly its intentions for operating expenses, operating revenues, the operating balance, debt and net worth over (at least) the next three years.
Fiscal objectives (long-term)
The Government’s long-term goals for operating expenses, operating revenue, the operating balance, debt and net worth, as required by the Public Finance Act 1989. The objectives must be consistent with the principles of responsible fiscal management outlined in the Act and cover a period of 10 or more years.
Forecast new capital spending
An amount provided in the forecasts to represent the balance sheet impact of capital initiatives expected to be introduced over the forecast period.
Forecast new operating spending
An amount included in the forecasts to provide for the operating balance impact of policy initiatives and changes to demographics and other forecasting changes expected to occur over the forecast period.
Gross Crown debt
The total borrowings (both sovereign-guaranteed and non-sovereign guaranteed and including derivatives in loss) of the total Crown. This is the amount in the total Crown Statement of Financial Position for Reserve Bank settlement deposits plus other borrowings. It represents the complete picture of whole-of-Crown debt obligations to external parties, excluding payables.
Gross domestic product (GDP)
A measure of the value of all goods and services produced in New Zealand; changes in GDP measure growth in economic activity or output. GDP can be measured as the actual dollar value of goods and services measured at today’s prices (nominal GDP), or excluding the effects of price changes over time (real GDP).
Gross domestic product (expenditure)
This is the sum of total final expenditures on goods and services in the economy.
Gross national expenditure (GNE)
Measures total expenditure on goods and services by New Zealand residents.
Gross Sovereign-Issued Debt (GSID)
Debt issued by the sovereign (ie, Core Crown) and includes Government stock held by the NZS Fund, ACC or EQC. The gross sovereign-issued debt indicator does not eliminate any internal cross-holdings.
Labour force participation rate
Measures the percentage of the working-age population in work or actively looking for and available for work.
Labour productivity
Measures output per input of labour (where labour inputs might be measured as hours worked or people).
Line-by-line consolidation
This is a term used to refer to the general approach to the presentation of the Crown financial statements. It means that the revenues, expenses, assets and liabilities of all departments, Offices of Parliament, the Reserve Bank, SOEs, Crown entities, and other entities controlled by the Government are included in the Crown financial statements.
Marketable securities
Assets held with financial institutions. These assets are held for both cash flow and investment purposes, and include any funds the Government has invested in the International Monetary Fund.
Monetary conditions
The combination of interest rates and the exchange rate.
Monetary policy
Action taken by the Reserve Bank to affect interest rates and the exchange rate in order to control inflation. Tightening monetary policy refers to actions taken by the Reserve Bank to raise interest rates (which can influence the exchange rate) in order to moderate aggregate demand pressures and so reduce inflationary pressures.
Net Core Crown debt
Debt after deducting financial assets of the Core Crown (comprising cash equivalents, marketable securities, derivatives in gain, advances and some share investments) from gross sovereign-issued debt. Share investments in supranational organisations, such as the International Bank for Reconstruction and Development & Bank for International Settlements, are excluded from the net Core Crown debt measure.
Net worth
Total assets less total liabilities (also referred to as Crown balance).
New GAAP
New set of accounting standards incorporating NZ IFRS. These new standards will be part of Generally Accepted Accouting Practice (GAAP) for financial statements relating to periods commencing after 1 January 2007.
NZ IFRS
New Zealand equivalents to International Financial Reporting Standards. These standards are approved by the Accounting Standards Review Board in New Zealand and are based on the
requirements of the international financial reporting standards issued by the International Accounting Standards Board.
Old GAAP
Current accounting standards. These standards will be replaced by new standards (New GAAP) for financial statements relating to periods commencing after 1 January 2007.
Operating allowance
The amount included in the Fiscal Strategy Report projections for new initiatives, including spending and cost pressures. The allowance is a projection assumption. The projections in the Fiscal Strategy Report also include an allowance for capital spending.
Operating balance
The operating balance is the residual of revenues less expenses plus surpluses from state-owned enterprises and Crown entities. It includes gains and losses.
Operating balance excluding revaluation and accounting policy changes (OBERAC)
The OBERAC is the operating balance adjusted for revaluation movements and accounting policy changes. It provides a measure of underlying stewardship. As a result of the change to New GAAP this fiscal indicator is being replaced by OBEGAL (refer below).
Operating balance before gains and losses (OBEGAL)
The OBEGAL is the operating balance excluding gains and losses. It replaces OBERAC under New GAAP.
Projections
Projections of the key fiscal indicators beyond the five-year forecast period. The projections are based on long-run economic and fiscal assumptions. For example, the projections assume no economic cycle and constant long-run interest, inflation and unemployment rates.
Provisional tax
A thrice-yearly payment of tax on income that has not been taxed, or been under-taxed, at source (relates only to company tax and other persons’ tax).
Source deductions
Tax withheld on wages, salaries, social welfare benefits, bonuses, lump-sum payments and superannuation fund contributions. About 80% of source deductions come from PAYE on wages and salaries. Source deductions is the biggest single tax type.
Specific fiscal risks
These are a category of Government decisions or circumstances which may have a material impact on the fiscal position (excluding contingent liabilities). They are not included in the main forecasts because their fiscal impact cannot be reasonably quantified, the likelihood of realisation is uncertain and/or the timing is uncertain.
Stock change
The change in the value of stocks (raw materials, work in progress, and finished goods) during a given period.
System of National Accounts (SNA)
SNA is a comprehensive, consistent and flexible set of macroeconomic accounts to meet the needs of government and private sector analysts, policy-makers, and decision-takers.
Tax revenue
The accrual, rather than the cash (“tax receipts”) measure of taxation. It is a measure of tax due, regardless of whether or not it has actually been paid.
Trade weighted index (TWI)
A measure of movements in the New Zealand dollar against the currencies of our major trading partners. The currencies comprise the US dollar, the Australian dollar, the Japanese yen, the euro and the UK pound.
Unit labour costs
The wages and other costs associated with employment per unit of output.
Year ended
Graphs and tables use different expressions of the timeframe. For example, 2006/07 or 2007 will generally mean “year ended 30 June” unless otherwise stated.