Item 1: Report to Shareholders| New Era Fund | December 31, 2005 |
The views and opinions in this report were current as of December 31, 2005. They are not guarantees of performance or investment results and should not be taken as investment advice. Investment decisions reflect a variety of factors, and the managers reserve the right to change their views about individual stocks, sectors, and the markets at any time. As a result, the views expressed should not be relied upon as a forecast of the fund’s future investment intent. The report is certified under the Sarbanes-Oxley Act of 2002, which requires mutual funds and other public companies to affirm that, to the best of their knowledge, the information in their financial reports is fairly and accurately stated in all material respects.
REPORTS ON THE WEB
Sign up for our E-mail Program, and you can begin to receive updated fund reports and prospectuses online rather than through the mail. Log in to your account at troweprice.com for more information.
Fellow Shareholders
The stock market recovered in the second half of 2005, but the result was a meager 4.9% one-year increase for the S&P 500 Stock Index, despite healthy economic growth. Corporate profit growth was generally strong, and consumer spending remained healthy, though below the growth rate of 2004. Consumers continue to be confident, backed by an improving employment picture, but spending, particularly over Christmas, was not very strong as consumers feared that heating bills would weigh on their budgets. Nominally, oil, natural gas, and copper prices reached record high levels while several other metals climbed to multi-decade highs.
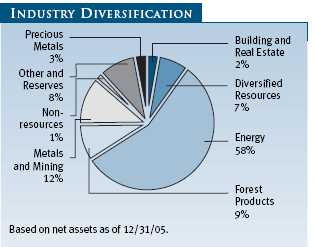
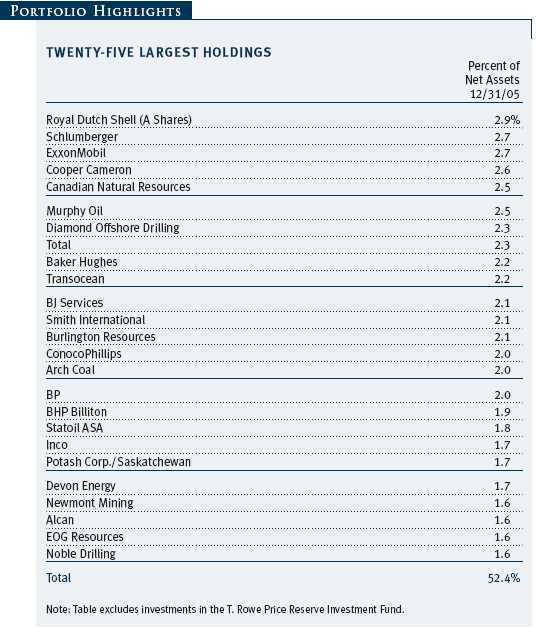
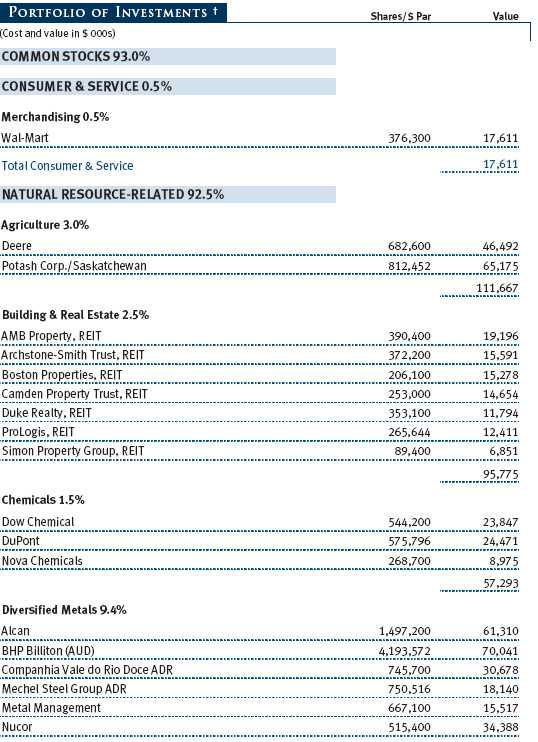
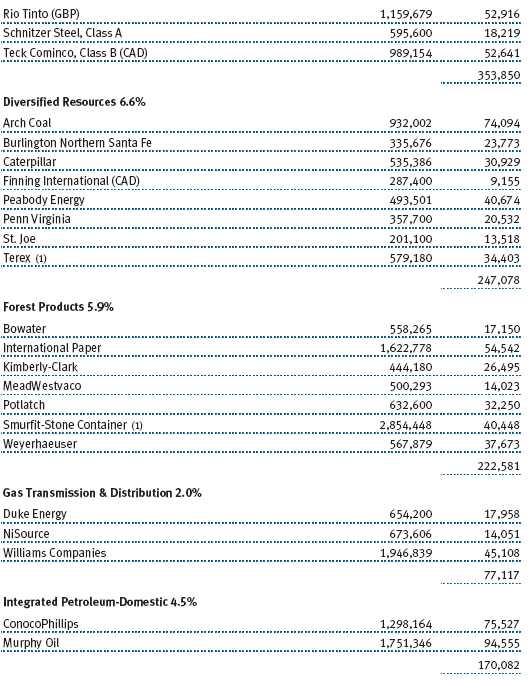
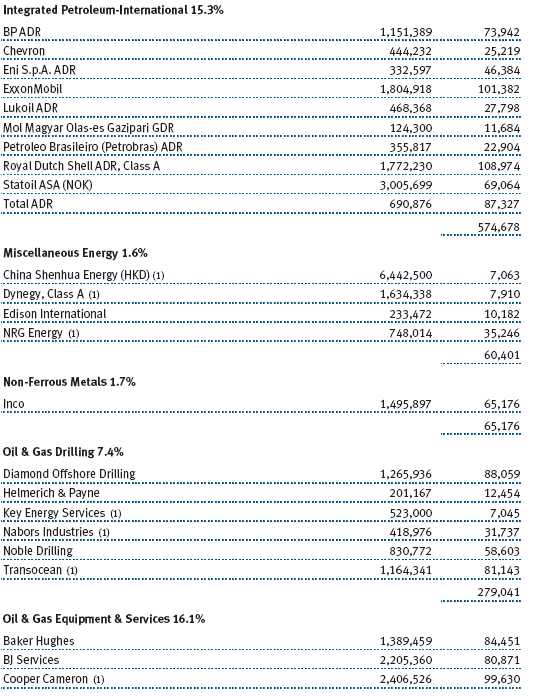
 Your fund significantly outperformed the broad stock market in 2005, underpinned by strong energy and other resource markets. Results lagged the Lipper index of comparable funds, however, as shown in the table. For the most recent six months, the fund finished well ahead of the broad market but again trailed its average competitor. Over the six-month period, most resource categories outperformed the market, but our holdings in Wal-Mart and industries outside of metals and energy caused us to trail our competition. For the year as a whole, chemicals, forest products and paper, and agriculture underperformed the S&P 500, and our emphasis on these industries and our lower energy weighting, particularly among volatile exploration companies, hurt results relative to our peers. (Please see the portfolio of investments for a complete listing of the fund’s holdings and the amount each represents in the portfolio.)
YEAR-END DISTRIBUTIONS
On December 12, 2005, your Board of Directors declared an income dividend of $0.37 per share, payable on December 14, 2005. On the same day, a $2.32 per share capital gain distribution was declared; $2.11 of this distribution was long-term capital gains. You should have received your check or statement reflecting these distributions as well as Form 1099-DIV summarizing this information for 2005 tax purposes.ECONOMIC AND MARKET ENVIRONMENT
Inflation picked up during the year as higher energy prices began to flow through the economy, with rising chemical and transportation fuel prices being passed on to corporations and consumers. There was a significant increase in the consumer price index due to the Gulf Coast hurricanes, but this has abated somewhat with a seasonally adjusted annual rate of 3.8% for the year through November versus 3.3% for all of 2004. The rate of inflation was aggravated by the loss of production and refining capacity caused by the devastating hurricanes entering the Gulf of Mexico, resulting in a spike in gasoline and natural gas prices. In addition, higher steel and chemicals prices, combined with a shortage of engineers, have triggered inflation in the oil patch, other steel-intensive products, and in construction. Toward the end of the year, labor demands began to show in parts of the economy not subject to global competition. Wages rose slightly more than 3% for the year, higher than in 200 4. The Federal Reserve has recognized the dangers of inflation as the economy approaches full employment and has raised short-term rates 13 times over the past 18 months, lifting its fed funds target rate from 1.00% to 4.25%.
The global economic underpinnings for natural resources demand remain solid. Economic growth continued to be strong domestically, though below 2004’s impressive performance. Corporate profit growth accelerated in 2005 despite rising cost pressures and declining productivity. Capital spending picked up as business investment took over from the flagging trend in consumer spending. European economies also began to recover late in the year, and the leading economic indicators portend further improvement. This recovery is reflected in demand for nickel as stainless steel manufacturing is gearing back up from a summer lull. Japan has been in recovery mode since late 2004. Emerging markets are strong, though China slowed a bit during the summer before reaccelerating late in the year. With gross domestic product growth in the low teens last year, the slowdown was only perceptible in oil demand due to substitution of coal. However, steel prices have yet to recover from the capacity-building binge of 2005 in that country. Gold reached a 25-year high in dollars and has even strengthened in euros, reflecting eroding concern over Western currencies, strong investment demand, and production deficits. The inflationary pressures of energy and metals pushed the producer price index for crude materials to a record high at the end of 2005 following one of the five sharpest increases ever in the month of November.
Oil and natural gas prices were very strong during the year, driven by low product inventories and the hurricanes’ impact on refineries and production in the Gulf of Mexico. About three million barrels per day of refining capacity was down for weeks, and a significant portion of the oil and natural gas produced in the Gulf was shut down due to undersea and onshore damage to pipelines. Some producing structures were completely destroyed, and about 4% of the production in the area will not return to service. About 27% of the Gulf’s oil and 19% of the natural gas production remained closed at the end of the year. We lost over 20% of the annual oil production and nearly 16% of the natural gas production for the year. Furthermore, much of the equipment and manpower that were bringing on new production was diverted to restoration operations, delaying new facilities. The refinery shutdowns pressured inventories, but temporary regulatory changes and the release of government stocks , both in the U.S. and Europe, balanced some of the shortfall, allowing a recovery in inventories and a decline in the product prices, notably gasoline. Chinese demand growth was 15% in 2004, dropped to 3% last year, but should recover to 6% this year.The strong performance of most metals was once again largely due to Chinese demand. Copper was expected to weaken with new capacity coming on, but delays in mine projects due to labor strife and a lack of engineers and equipment kept the markets tight, and the price rose to a record high. Zinc prices stayed high, rising close to a record at year-end. Nickel strengthened toward year-end as European stainless steel smelters restarted after stainless inventories had been drawn down and in anticipation that Chinese demand will recover. Aluminum also reached a 17-year high despite new smelting capacity in China. The Chinese, while running below capacity, did not want to export finished aluminum since they are short domestically the inputs of alumina and power. Steel is priced at opposite extremes now in two markets, and the coming year will determine which will prevail. The low price is in China, again due to overcapacity, but their exports have been relatively restrained. The U.S. price remain s high, in line with the strong domestic market.
PORTFOLIO REVIEW
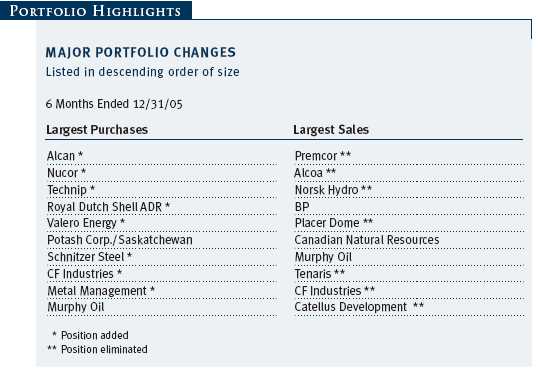
Acquisition activity continued in the natural resources sector in spite of exceptional stock performance, reinforcing the premise that higher resource prices support higher private market values. In the energy industry the competition from strategic buyers representing China and India further stirred the pot. Fund holding ConocoPhillips, an integrated oil company, made a premium offer for Burlington Resources, a largely domestic oil and gas producer, making Burlington one of our top performers. Gold producer Barrick Gold made a premium bid for another holding, Placer Dome. We exited the position given the unfriendly nature of the offer and concerns over Placer’s potential reaction to the offer. In the real estate sector Prologis purchased holding Catellus Development, a developer in the California area.
Our positions in oil services were the greatest contributors during the most recent six months, with Cooper Cameron, a major producer of valves and subsea equipment for production operations, BJ Services, a leading pressure pumping company, and two deepwater offshore drilling companies, Transocean and Diamond Offshore Drilling, among the top 10 contributors. Grant Prideco, a premium drill pipe and connections manufacturer, and Schlumberger, a leading diversified oil services company, were also major contributors. In this segment we also added Technip, a French manufacturer of flexible tubing for subsea connections and a leading engineering and const ruction company serving the energy industry. We also purchased shares in Dresser-Rand, a major producer of compressors and turbines, and Halliburton, a leading pressure pumping and engineering and construction company. We made these additions to beef up our exposure to the construction cycle for major energy projects such as liquefied natural gas (LNG) and gas-to-liquid facilities being built worldwide. While we were underweight petroleum exploration and production companies relative to our peers, our holdings were significant contributors. In addition to the previously mentioned Burlington Resources, Canadian Natural Resources, which is developing a major area for tar sands production, was the top contributor for both the six months and year. Arch Coal, a domesti c clean coal producer, and Teck Cominco, a Canadian zinc producer, were also in the top 10 for both periods.
Major detractors in the second half included Wal-Mart, though the effect was diminished since we have dramatically reduced our low-cost position, along with the chemical companies and agriculture stocks, which suffered from high energy feedstock costs. Notably, CF Industries, an inexpensively priced ammonia producer, declined as natural gas prices spiked; we sold the position. Potash Corporation of Saskatchewan fell as Chinese potash inventories grew and negotiations for a price increase have been difficult. We added to the position on weakness, however, as we feel very confident in the long-term future of the company. We sold our Norsk Hydro position after it made an ill-advised acquisition in the Gulf of Mexico. We also traded Alcoa for Alcan, believin g that we would have better leverage in the aluminum rally by holding the low-cost provider that lacks significant downstream operations. Finning International, the exclusive distributor of Caterpillar equipment for the tar sands developments in Canada and mining projects in South America, was a significant detractor, but we believe the position holds promise.
Other new names include Schnitzer Steel and Metals Management, both in the steel scrap business, which should see improvement as the steel cycle progresses since the mills in China and the mini-mills in the U.S. are competing for a diminishing supply of scrap. We also added Mol Magyar, a very sophisticated Hungarian refinery complex in the growing markets of Eastern Europe.
OUTLOOK
The economic outlook for the first part of 2006 looks strong, with positive trends in the Purchasing Managers Index (PMI) and leading economic indicators for Europe and Japan. China also appears to have another good year ahead. Based on the PMI and the flat yield curve, the domestic outlook appears to be softening from 2005’s strong pace, though this is unlikely to become apparent until the second half of the year. Inflation from raw materials should be more benign this year, but tightening labor markets and slowing productivity gains will pressure wage and benefits inflation, especially given the increase in energy costs. Most resources are now experiencing capacity growth, but to this point they are only able to keep up with the growth in demand. The risks in commodity prices, especially for energy and gold, remain to the upside as events such as a serious confrontation with Iran over its nuclear ambitions outweigh the fundamentals of an increase in global spare oil production capacity. Nigeria is also proving disruptive to oil markets due to attacks by militants on oil facilities in advance of the 2007 presidential election.
We continue to be selective in making investments in our fund, emphasizing companies that can grow low-cost production and exhibit financial discipline. In addition, there are some value opportunities as we do not believe that the major oil stocks reflect the strong long-term pricing environment. We are also emphasizing companies that will benefit from the capital spending required to develop new resources, whether it be for mine capacity expansions, extracting oil from tar sand, or building LNG facilities.
Respectfully submitted,

Charles M. Ober
President and chairman of the Investment Advisory Committee
January 20, 2006
The committee chairman has day-to-day responsibility for managing the portfolio and works with committee members in developing and executing the fund’s investment program.
RISKS OF STOCK INVESTING
The fund’s share price can fall because of weakness in the stock markets, a particular industry, or specific holdings. Stock markets can decline for many reasons, including adverse political or economic developments, changes in investor psychology, or heavy institutional selling. The prospects for an industry or company may deteriorate because of a variety of factors, including disappointing earnings or changes in the competitive environment. In addition, the investment manager’s assessment of companies held in a fund may prove incorrect, resulting in losses or poor performance even in rising markets. Funds that invest only in specific industries will experience greater volatility than funds investing in a broad range of industries. The rate of earnings growth of natural resources companies may be irregular since these companies are strongly affected by natural forces, global economic cycles, and international politics. For example, stock prices of energy companies ca n fall sharply when oil prices fall.
GLOSSARY
Lipper indexes: Fund benchmarks that consist of a small number of the largest mutual funds in a particular category as tracked by Lipper Inc.
S&P 500 Stock Index: An unmanaged index that tracks the stocks of 500 primarily large-cap U.S. companies.
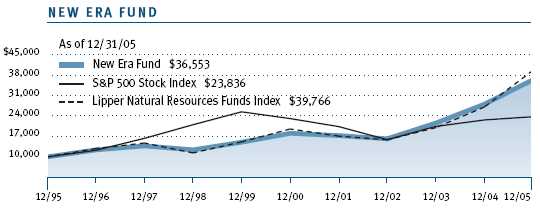
This chart shows the value of a hypothetical $10,000 investment in the fund over the past 10 fiscal year periods or since inception (for funds lacking 10-year records). The result is compared with benchmarks, which may include a broad-based market index and a peer group average or index. Market indexes do not include expenses, which are deducted from fund returns as well as mutual fund averages and indexes.
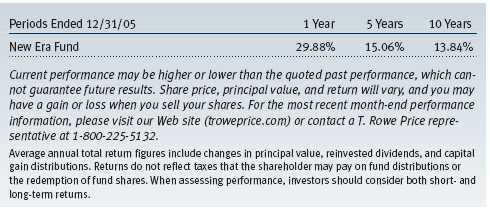
| AVERAGE ANNUAL COMPOUND TOTAL RETURN |
This table shows how the fund would have performed each year if its actual (or cumulative) returns for the periods shown had been earned at a constant rate.
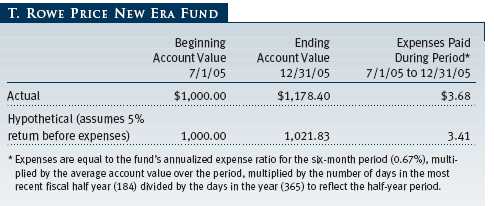
 As a mutual fund shareholder, you may incur two types of costs: (1) transaction costs such as redemption fees or sales loads and (2) ongoing costs, including management fees, distribution and service (12b-1) fees, and other fund expenses. The following example is intended to help you understand your ongoing costs (in dollars) of investing in the fund and to compare these costs with the ongoing costs of investing in other mutual funds. The example is based on an investment of $1,000 invested at the beginning of the most recent six-month period and held for the entire period.
Actual Expenses
The first line of the following table (“Actual”) provides information about actual account values and actual expenses. You may use the information in this line, together with your account balance, to estimate the expenses that you paid over the period. Simply divide your account value by $1,000 (for example, an $8,600 account value divided by $1,000 = 8.6), then multiply the result by the number in the first line under the heading “Expenses Paid During Period” to estimate the expenses you paid on your account during this period.
Hypothetical Example for Comparison Purposes
The information on the second line of the table (“Hypothetical”) is based on hypothetical account values and expenses derived from the fund’s actual expense ratio and an assumed 5% per year rate of return before expenses (not the fund’s actual return). You may compare the ongoing costs of investing in the fund with other funds by contrasting this 5% hypothetical example and the 5% hypothetical examples that appear in the shareholder reports of the other funds. The hypothetical account values and expenses may not be used to estimate the actual ending account balance or expenses you paid for the period.
Note: T. Rowe Price charges an annual small-account maintenance fee of $10, generally for accounts with less than $2,000 ($500 for UGMA/UTMA). The fee is waived for any investor whose T. Rowe Price mutual fund accounts total $25,000 or more, accounts employing automatic investing, and IRAs and other retirement plan accounts that utilize a prototype plan sponsored by T. Rowe Price (although a separate custodial or administrative fee may apply to such accounts). This fee is not included in the accompanying table. If you are subject to the fee, keep it in mind when you are estimating the ongoing expenses of investing in the fund and when comparing the expenses of this fund with other funds.
You should also be aware that the expenses shown in the table highlight only your ongoing costs and do not reflect any transaction costs, such as redemption fees or sales loads. Therefore, the second line of the table is useful in comparing ongoing costs only and will not help you determine the relative total costs of owning different funds. To the extent a fund charges transaction costs, however, the total cost of owning that fund is higher.
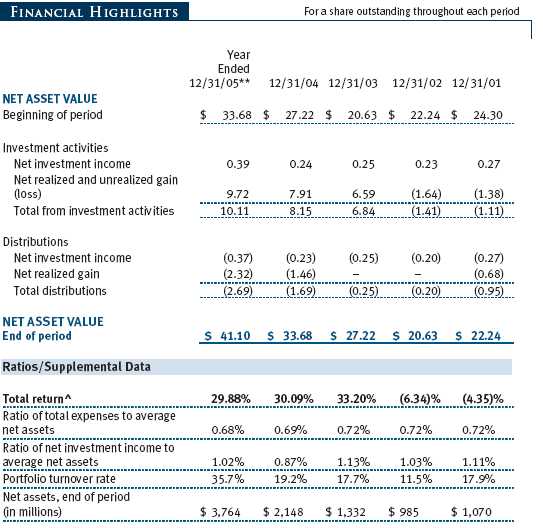
| ** | Per share amounts calculated using average shares outstanding method. |
| ^ | Total return reflects the rate that an investor would have earned on an investment in the fund |
| | during each period, assuming reinvestment of all distributions. |
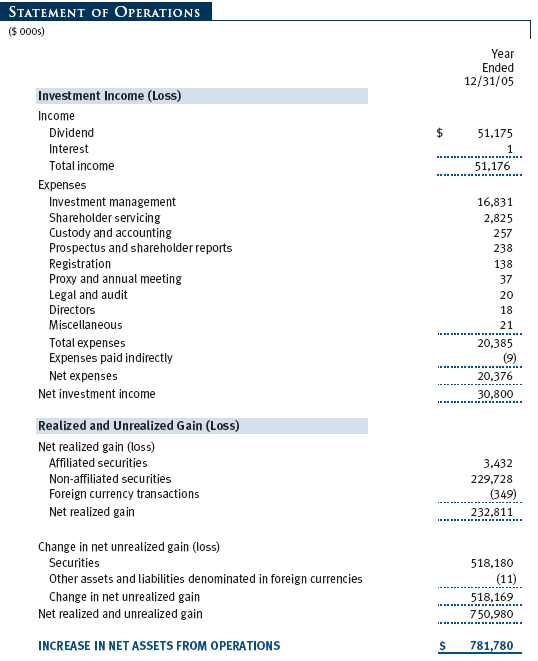
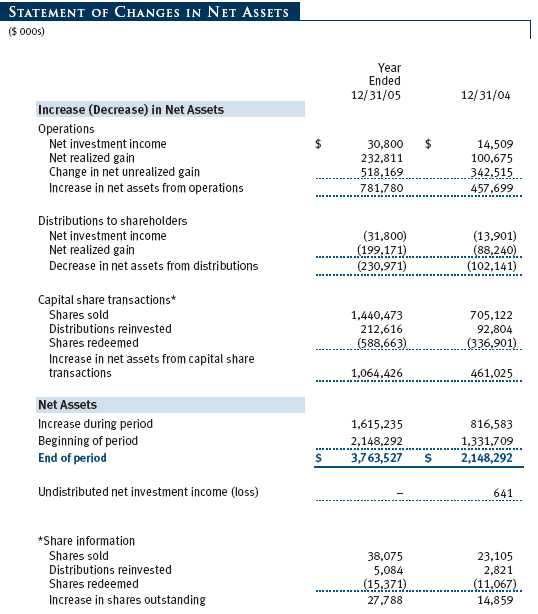
The accompanying notes are an integral part of these financial statements.

 The accompanying notes are an integral part of these financial statements.
 The accompanying notes are an integral part of these financial statements.
The accompanying notes are an integral part of these financial statements.
The accompanying notes are an integral part of these financial statements.
| NOTES TO FINANCIAL STATEMENTS |
NOTE 1 - SIGNIFICANT ACCOUNTING POLICIES
T. Rowe Price New Era Fund, Inc. (the fund) is registered under the Investment Company Act of 1940 (the 1940 Act) as a diversified, open-end management investment company. The fund commenced operations on January 20, 1969. The fund seeks to provide long-term capital growth primarily through the common stocks of companies that own or develop natural resources and other basic commodities, and also through the stocks of selected nonresource growth companies.
The accompanying financial statements were prepared in accordance with accounting principles generally accepted in the United States of America, which require the use of estimates made by fund management. Fund management believes that estimates and security valuations are appropriate; however actual results may differ from those estimates, and the security valuations reflected in the financial statements may differ from the value the fund ultimately realizes upon sale of the securities.
Valuation The fund values its investments and computes its net asset value per share at the close of the New York Stock Exchange (NYSE), normally 4 p.m. ET, each day that the NYSE is open for business. Equity securities listed or regularly traded on a securities exchange or in the over-the-counter market are valued at the last quoted sale price or, for certain markets, the official closing price at the time the valuations are made, except for OTC Bulletin Board securities, which are valued at the mean of the latest bid and asked prices. A security that is listed or traded on more than one exchange is valued at the quotation on the exchange determined to be the primary market for such security. Listed securities not traded on a particular day are valued at the mean of the latest bid and asked prices for domestic securities and the last quoted sale price for international securities.
Debt securities are generally traded in the over-the-counter market. Securities with original maturities of one year or more are valued at prices furnished by dealers who make markets in such securities or by an independent pricing service, which considers yield or price of bonds of comparable quality, coupon, maturity, and type, as well as prices quoted by dealers who make markets in such securities. Securities with original maturities of less than one year are valued at amortized cost in local currency, which approximates fair value when combined with accrued interest.
Investments in mutual funds are valued at the mutual fund’s closing net asset value per share on the day of valuation.
Other investments, including restricted securities, and those for which the above valuation procedures are inappropriate or are deemed not to reflect fair value are stated at fair value as determined in good faith by the T. Rowe Price Valuation Committee, established by the fund’s Board of Directors.
Most foreign markets close before the close of trading on the NYSE. If the fund determines that developments between the close of a foreign market and the close of the NYSE will, in its judgment, materially affect the value of some or all of its portfolio securities, which in turn will affect the fund’s share price, the fund will adjust the previous closing prices to reflect the fair value of the securities as of the close of the NYSE, as determined in good faith by the T. Rowe Price Valuation Committee, established by the fund’s Board of Directors. A fund may also fair value securities in other situations, such as when a particular foreign market is closed but the fund is open. In deciding whether to make fair value adjustments, the fund reviews a variety of factors, including developments in foreign markets, the performance of U.S. securities markets, and the performance of instruments trading in U. S. markets that represent foreign securities and baskets of foreign secur ities. The fund uses outside pricing services to provide it with closing market prices and information used for adjusting those prices. The fund cannot predict when and how often it will use closing prices and when it will adjust those prices to reflect fair value. As a means of evaluating its fair value process, the fund routinely compares closing market prices, the next day’s opening prices in the same markets, and adjusted prices.
Currency Translation Assets, including investments, and liabilities denominated in foreign currencies are translated into U.S. dollar values each day at the prevailing exchange rate, using the mean of the bid and asked prices of such currencies against U.S. dollars as quoted by a major bank. Purchases and sales of securities, income, and expenses are translated into U.S. dollars at the prevailing exchange rate on the date of the transaction. The effect of changes in foreign currency exchange rates on realized and unrealized security gains and losses is reflected as a component of security gains and losses.
Rebates and Credits Subject to best execution, the fund may direct certain security trades to brokers who have agreed to rebate a portion of the related brokerage commission to the fund in cash. Commission rebates are reflected as realized gain on securities in the accompanying financial statements and totaled $156,000 for the year ended December 31, 2005. Additionally, the fund earns credits on temporarily uninvested cash balances at the custodian that reduce the fund’s custody charges. Custody expense in the accompanying financial statements is presented before reduction for credits, which are reflected as expenses paid indirectly.
Investment Transactions, Investment Income, and Distributions Income and expenses are recorded on the accrual basis. Dividends received from mutual fund investments are reflected as dividend income; capital gain distributions are reflected as realized gain/loss. Dividend income and capital gain distributions are recorded on the ex-dividend date. Investment transactions are accounted for on the trade date. Realized gains and losses are reported on the identified cost basis. Distributions to shareholders are recorded on the ex-dividend date. Income distributions are declared and paid on an annual basis. Capital gain distributions, if any, are declared and paid by the fund, typically on an annual basis.
NOTE 2 - INVESTMENT TRANSACTIONS
Consistent with its investment objective, the fund engages in the following practices to manage exposure to certain risks or enhance performance. The investment objective, policies, program, and risk factors of the fund are described more fully in the fund’s prospectus and Statement of Additional Information.
Restricted Securities The fund may invest in securities that are subject to legal or contractual restrictions on resale. Although certain of these securities may be readily sold, for example, under Rule 144A, others may be illiquid, their sale may involve substantial delays and additional costs, and prompt sale at an acceptable price may be difficult.
Other Purchases and sales of portfolio securities, other than short-term securities, aggregated $1,725,005,000 and $976,835,000, respectively, for the year ended December 31, 2005.
NOTE 3 - FEDERAL INCOME TAXES
No provision for federal income taxes is required since the fund intends to continue to qualify as a regulated investment company under Subchapter M of the Internal Revenue Code and distribute to shareholders all of its taxable income and gains. Federal income tax regulations differ from generally accepted accounting principles; therefore, distributions determined in accordance with tax regulations may differ significantly in amount or character from net investment income and realized gains for financial reporting purposes. Financial reporting records are adjusted for permanent book/tax differences to reflect tax character. Financial records are not adjusted for temporary differences.
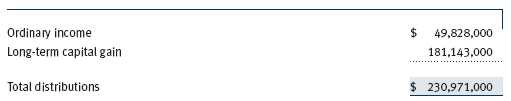
Distributions during the year ended December 31, 2005 were characterized as follows for tax purposes:
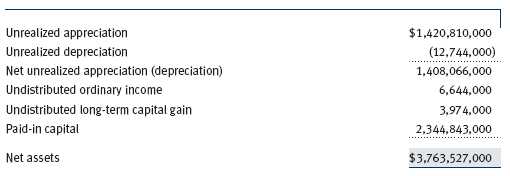
At December 31, 2005, the tax-basis components of net assets were as follows:
 For the year ended December 31, 2005, the fund recorded the following permanent reclassifications to reflect tax character. Reclassifications to paid-in capital relate primarily to a tax practice that treats a portion of the proceeds from each redemption of capital shares as a distribution of taxable net investment income and/or realized capital gain. Results of operations and net assets were not affected by these reclassifications.

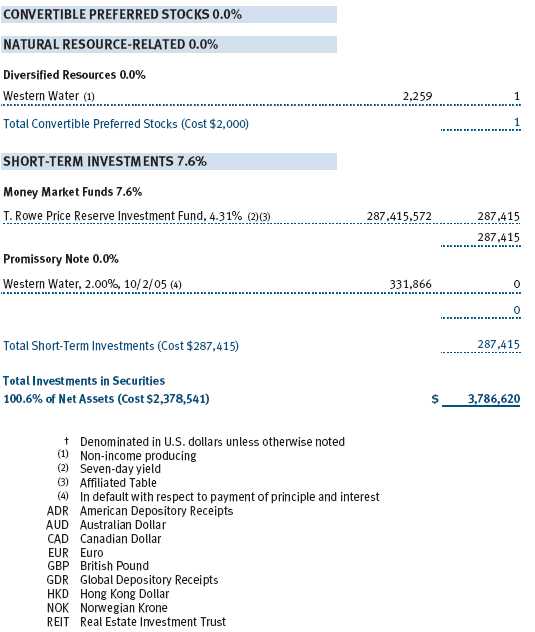
At December 31, 2005, the cost of investments for federal income tax purposes was $2,378,549,000.
NOTE 4 - RELATED PARTY TRANSACTIONS
The fund is managed by T. Rowe Price Associates, Inc. (the manager or Price Associates), a wholly owned subsidiary of T. Rowe Price Group, Inc. The investment management agreement between the fund and the manager provides for an annual investment management fee, which is computed daily and paid monthly. The fee consists of an individual fund fee, equal to 0.25% of the fund’s average daily net assets, and a group fee. The group fee rate is calculated based on the combined net assets of certain mutual funds sponsored by Price Associates (the group) applied to a graduated fee schedule, with rates ranging from 0.48% for the first $1 billion of assets to 0.29% for assets in excess of $160 billion. Prior to May 1, 2005, the maximum group fee rate in the graduated fee schedule had been 0.295% for assets in excess of $120 billion. The fund’s group fee is determined by applying the group fee rate to the fund’s average daily net assets. At December 31, 2005, the effective annual group fee rate was 0.31%.
In addition, the fund has entered into service agreements with Price Associates and two wholly owned subsidiaries of Price Associates (collectively, Price). Price Associates computes the daily share price and maintains the financial records of the fund. T. Rowe Price Services, Inc., provides shareholder and administrative services in its capacity as the fund’s transfer and dividend disbursing agent. T. Rowe Price Retirement Plan Services, Inc., provides subaccounting and recordkeeping services for certain retirement accounts invested in the fund. For the year ended December 31, 2005, expenses incurred pursuant to these service agreements were $64,000 for Price Associates, $1,526,000 for T. Rowe Price Services, Inc., and $467,000 for T. Rowe Price Retirement Plan Services, Inc. The total amount payable at period end pursuant to these service agreements is reflected as Due to Affiliates in the accompanying financial statements.
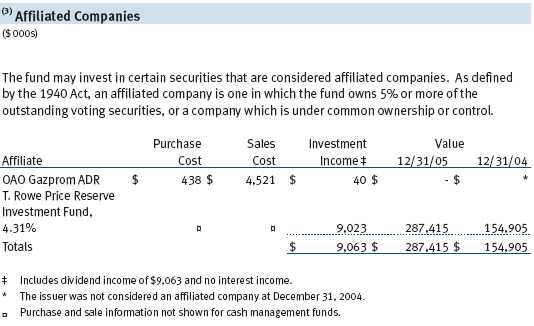
The fund may invest in the T. Rowe Price Reserve Investment Fund and the T. Rowe Price Government Reserve Investment Fund (collectively, the T. Rowe Price Reserve Funds), open-end management investment companies managed by Price Associates and affiliates of the fund. The T. Rowe Price Reserve Funds are offered as cash management options to mutual funds, trusts, and other accounts managed by Price Associates and/or its affiliates, and are not available for direct purchase by members of the public. The T. Rowe Price Reserve Funds pay no investment management fees.
As of December 31, 2005, T. Rowe Price Group, Inc. and/or its wholly owned subsidiaries owned 312,320 shares of the fund, representing less than 1% of the fund’s net assets.
| REPORT OF INDEPENDENT REGISTERED PUBLIC ACCOUNTING FIRM |
To the Board of Directors and Shareholders of T. Rowe Price New Era Fund, Inc.
In our opinion, the accompanying statement of assets and liabilities, including the portfolio of investments, and the related statements of operations and of changes in net assets and the financial highlights present fairly, in all material respects, the financial position of T. Rowe Price New Era Fund, Inc. (the “Fund”) at December 31, 2005, the results of its operations for the year then ended, the changes in its net assets for each of the two years in the period then ended and the financial highlights for each of the five years in the period then ended, in conformity with accounting principles generally accepted in the United States of America. These financial statements and financial highlights (hereafter referred to as “financial statements”) are the responsibility of the Fund’s management; our responsibility is to express an opinion on these financial statements based on our audits. We conducted our audits of these financial statements in accordance with the standards of the Public Company Accounting Oversight Board (United States). Those standards require that we plan and perform the audit to obtain reasonable assurance about whether the financial statements are free of material misstatement. An audit includes examining, on a test basis, evidence supporting the amounts and disclosures in the financial statements, assessing the accounting principles used and significant estimates made by management, and evaluating the overall financial statement presentation. We believe that our audits, which included confirmation of securities at December 31, 2005 by correspondence with the custodian and by agreement to the underlying ownership records for T. Rowe Price Reserve Investment Fund, provide a reasonable basis for our opinion.
PricewaterhouseCoopers LLP
Baltimore, Maryland
February 13, 2006
| TAX INFORMATION (UNAUDITED) FOR THE TAX YEAR ENDED 12/31/05 |
We are providing this information as required by the Internal Revenue Code. The amounts shown may differ from those elsewhere in this report because of differences between tax and financial reporting requirements. The fund’s distributions to shareholders included: - $24,061,000 from short-term capital gains
- $200,956,000 from long-term capital gains, subject to the 15% rate gains category
For taxable non-corporate shareholders, $41,261,000 of the fund’s income represents qualified dividend income subject to the 15% rate category. For corporate shareholders, $19,090,000 of the fund’s income qualifies for the dividends-received deduction.
| INFORMATION ON PROXY VOTING POLICIES, PROCEDURES, AND RECORDS |
A description of the policies and procedures used by T. Rowe Price funds and portfolios to determine how to vote proxies relating to portfolio securities is available in each fund’s Statement of Additional Information, which you may request by calling 1-800-225-5132 or by accessing the SEC’s Web site, www.sec.gov. The description of our proxy voting policies and procedures is also available on our Web site, www.troweprice.com. To access it, click on the words “Company Info” at the top of our homepage for individual investors. Then, in the window that appears, click on the “Proxy Voting Policy” navigation button in the top left corner.
Each fund’s most recent annual proxy voting record is available on our Web site and through the SEC’s Web site. To access it through our Web site, follow the directions above, then click on the words “Proxy Voting Record” at the bottom of the Proxy Voting Policy page.
| HOW TO OBTAIN QUARTERLY PORTFOLIO HOLDINGS |
The fund files a complete schedule of portfolio holdings with the Securities and Exchange Commission for the first and third quarters of each fiscal year on Form N-Q. The fund’s Form N-Q is available electronically on the SEC’s Web site (www.sec.gov); hard copies may be reviewed and copied at the SEC’s Public Reference Room, 450 Fifth St. N.W., Washington, DC 20549. For more information on the Public Reference Room, call 1-800-SEC-0330.
| ABOUT THE FUND’S DIRECTORS AND OFFICERS |
Your fund is governed by a Board of Directors that meets regularly to review investments, performance, compliance matters, advisory fees, expenses, and other business affairs, and is responsible for protecting the interests of shareholders. The majority of the fund’s directors are independent of T. Rowe Price Associates, Inc. (T. Rowe Price); “inside” directors are officers of T. Rowe Price. The Board of Directors elects the fund’s officers, who are listed in the final table. The business address of each director and officer is 100 East Pratt Street, Baltimore, MD 21202. The Statement of Additional Information includes additional information about the fund directors and is available without charge by calling a T. Rowe Price representative at 1-800-225-5132.
| Independent Directors | |
| |
| Name | |
| (Year of Birth) | |
| Year Elected * | |
| [Number of T. Rowe Price | Principal Occupation(s) During Past 5 Years and Directorships of |
| Portfolios Overseen] | Other Public Companies |
| |
| Jeremiah E. Casey ** | Director, National Life Insurance (2001 to 8/05); Director, The Rouse |
| (1940) | Company, real estate developers (1990 to 2004) |
| 2005 | |
| [59] | |
| |
| Anthony W. Deering | Chairman, Exeter Capital, LLC, a private investment firm (2004 to pres- |
| (1945) | ent); Director, Chairman of the Board, and Chief Executive Officer, The |
| 2001 | Rouse Company, real estate developers (1997 to 2004); Director, |
| [113] | Mercantile Bank (4/03 to present) |
| |
| Donald W. Dick, Jr. | Principal, EuroCapital Advisors, LLC, an acquisition and management |
| (1943) | advisory firm; Chairman, President, and Chief Executive Officer, The |
| 1994 | Haven Group, a custom manufacturer of modular homes (1/04 to |
| [113] | present) |
| |
| David K. Fagin | Chairman and President, Nye Corporation (6/88 to present); Director, |
| (1938) | Canyon Resources Corp. and Golden Star Resources Ltd. (5/00 to |
| 1988 | present) and Pacific Rim Mining Corp. (2/02 to present) |
| [113] | |
| |
| Karen N. Horn | Managing Director and President, Global Private Client Services, |
| (1943) | Marsh Inc. (1999 to 2003); Managing Director and Head of |
| 2003 | International Private Banking, Bankers Trust (1996 to 1999); Director, |
| [113] | Eli Lilly and Company and Georgia Pacific |
| F. Pierce Linaweaver | President, F. Pierce Linaweaver & Associates, Inc., consulting environ- |
| (1934) | mental and civil engineers |
| 2001 | |
| [113] | |
| |
| Theo C. Rodgers *** | President, A&R Development Corporation |
| (1941) | |
| 2005 | |
| [97] | |
| |
| John G. Schreiber | Owner/President, Centaur Capital Partners, Inc., a real estate invest- |
| (1946) | ment company; Partner, Blackstone Real Estate Advisors, L.P.; |
| 2001 | Director, AMLI Residential Properties Trust |
| [113] | |
| * | Each independent director serves until retirement, resignation, or election of a successor. |
| ** | Elected effective October 19, 2005. |
| *** | Elected effective April 1, 2005. |
| Inside Directors | |
| |
| Name | |
| (Year of Birth) | |
| Year Elected * | |
| [Number of T. Rowe Price | Principal Occupation(s) During Past 5 Years and Directorships of |
| Portfolios Overseen] | Other Public Companies |
| |
| James A.C. Kennedy, CFA | Director and Vice President, T. Rowe Price and T. Rowe Price Group, |
| (1953) | Inc.; Director, T. Rowe Price Global Asset Management Limited, |
| 1997 | T. Rowe Price Global Investment Services Limited, and T. Rowe Price |
| [45] | International, Inc. |
| |
| James S. Riepe | Director and Vice President, T. Rowe Price; Vice Chairman of the Board, |
| (1943) | Director, and Vice President, T. Rowe Price Group, Inc.; Chairman of the |
| 1994 | Board and Director, T. Rowe Price Global Asset Management Limited, |
| [113] | T. Rowe Price Global Investment Services Limited, T. Rowe Price |
| | Investment Services, Inc., T. Rowe Price Retirement Plan Services, Inc., |
| | and T. Rowe Price Services, Inc.; Chairman of the Board, Director, |
| | President, and Trust Officer, T. Rowe Price Trust Company; Director, |
| | T. Rowe Price International, Inc.; Chairman of the Board, all funds |
| *Each inside director serves until retirement, resignation, or election of a successor. |
| Officers | |
| |
| Name (Year of Birth) | |
| Title and Fund(s) Served | Principal Occupation(s) |
| |
| Joseph A. Carrier, CPA (1960) | Vice President, T. Rowe Price, T. Rowe Price |
| Treasurer, New Era Fund | Group, Inc., T. Rowe Price Investment Services, |
| | Inc., and T. Rowe Price Trust Company |
| |
| Roger L. Fiery III, CPA (1959) | Vice President, T. Rowe Price, T. Rowe Price |
| Vice President, New Era Fund | Group, Inc., T. Rowe Price International, Inc., |
| | and T. Rowe Price Trust Company |
| |
| Mark S. Finn, CFA, CPA (1963) | Vice President, T. Rowe Price and T. Rowe Price |
| Vice President, New Era Fund | Group, Inc. |
| |
| John R. Gilner (1961) | Chief Compliance Officer and Vice President, |
| Chief Compliance Officer, New Era Fund | T. Rowe Price; Vice President, T. Rowe Price |
| | Group, Inc., and T. Rowe Price Investment |
| | Services, Inc. |
| |
| Gregory S. Golczewski (1966) | Vice President, T. Rowe Price and T. Rowe Price |
| Vice President, New Era Fund | Trust Company |
| |
| Henry H. Hopkins (1942) | Director and Vice President, T. Rowe Price |
| Vice President, New Era Fund | Investment Services, Inc., T. Rowe Price |
| | Services, Inc., and T. Rowe Price Trust Company; |
| | Vice President, T. Rowe Price, T. Rowe Price |
| | Group, Inc., T. Rowe Price International, Inc., |
| | and T. Rowe Price Retirement Plan Services, Inc. |
| |
| Lewis M. Johnson (1969) | Vice President, T. Rowe Price and T. Rowe Price |
| Vice President, New Era Fund | Group, Inc. |
| |
| Susan J. Klein (1950) | Vice President, T. Rowe Price |
| Vice President, New Era Fund | |
| |
| David M. Lee, CFA (1962) | Vice President, T. Rowe Price and T. Rowe Price |
| Vice President, New Era Fund | Group, Inc. |
| |
| John D. Linehan, CFA (1965) | Vice President, T. Rowe Price, T. Rowe Price |
| Vice President, New Era Fund | Group, Inc., and T. Rowe Price International, Inc. |
| |
| Patricia B. Lippert (1953) | Assistant Vice President, T. Rowe Price and |
| Secretary, New Era Fund | T. Rowe Price Investment Services, Inc. |
| Heather K. McPherson, CPA (1967) | Vice President, T. Rowe Price and T. Rowe Price |
| Vice President, New Era Fund | Group, Inc.; formerly intern, Salomon Smith |
| | Barney (2001) |
| |
| Charles M. Ober, CFA (1950) | Vice President, T. Rowe Price and T. Rowe Price |
| President, New Era Fund | Group, Inc. |
| |
| Timothy E. Parker (1974) | Vice President, T. Rowe Price and T. Rowe Price |
| Vice President, New Era Fund | Group, Inc.; formerly student, Darden Graduate |
| | School, University of Virginia (to 2001) |
| |
| David J. Wallack (1960) | Vice President, T. Rowe Price and T. Rowe Price |
| Vice President, New Era Fund | Group, Inc. |
| |
| Julie L. Waples (1970) | Vice President, T. Rowe Price |
| Vice President, New Era Fund | |
| Unless otherwise noted, officers have been employees of T. Rowe Price or T. Rowe Price International for at |
| least five years. |
Item 2. Code of Ethics.The registrant has adopted a code of ethics, as defined in Item 2 of Form N-CSR, applicable to its principal executive officer, principal financial officer, principal accounting officer or controller, or persons performing similar functions. A copy of this code of ethics is filed as an exhibit to this Form N-CSR. No substantive amendments were approved or waivers were granted to this code of ethics during the period covered by this report.
Item 3. Audit Committee Financial Expert.
The registrant’s Board of Directors/Trustees has determined that Mr. Donald W. Dick Jr. qualifies as an audit committee financial expert, as defined in Item 3 of Form N-CSR. Mr. Dick is considered independent for purposes of Item 3 of Form N-CSR.
Item 4. Principal Accountant Fees and Services.
(a) – (d) Aggregate fees billed to the registrant for the last two fiscal years for professional services rendered by the registrant’s principal accountant were as follows:
| | 2005 | 2004 |
| Audit Fees | $10,573 | $8,564 |
| Audit-Related Fees | 680 | 1,207 |
| Tax Fees | 3,003 | 2,322 |
| All Other Fees | 393 | - |
Audit fees include amounts related to the audit of the registrant’s annual financial statements and services normally provided by the accountant in connection with statutory and regulatory filings. Audit-related fees include amounts reasonably related to the performance of the audit of the registrant’s financial statements and specifically include the issuance of a report on internal controls. Tax fees include amounts related to services for tax compliance, tax planning, and tax advice. The nature of these services specifically includes the review of distribution calculations and the preparation of Federal, state, and excise tax returns. All other fees include the registrant’s pro-rata share of amounts for agreed-upon procedures in conjunction with service contract approvals by the registrant’s Board of Directors/Trustees.
(e)(1) The registrant’s audit committee has adopted a policy whereby audit and non-audit services performed by the registrant’s principal accountant for the registrant, its investment adviser, and any entity controlling, controlled by, or under common control with the investment adviser that provides ongoing services to the registrant require pre-approval in advance at regularly scheduled audit committee meetings. If such a service is required between regularly scheduled audit committee meetings, pre-approval may be authorized by one audit committee member with ratification at the next scheduled audit committee meeting. Waiver of pre-approval for audit or non-audit services requiring fees of a de minimis amount is not permitted.
(2) No services included in (b) – (d) above were approved pursuant to paragraph (c)(7)(i)(C) of Rule 2-01 of Regulation S-X.
(f) Less than 50 percent of the hours expended on the principal accountant’s engagement to audit the registrant’s financial statements for the most recent fiscal year were attributed to work performed by persons other than the principal accountant’s full-time, permanent employees.
(g) The aggregate fees billed for the most recent fiscal year and the preceding fiscal year by the registrant’s principal accountant for non-audit services rendered to the registrant, its investment adviser, and any entity controlling, controlled by, or under common control with the investment adviser that provides ongoing services to the registrant were $1,008,000 and $903,000, respectively, and were less than the aggregate fees billed for those same periods by the registrant’s principal accountant for audit services rendered to the T. Rowe Price Funds.
(h) All non-audit services rendered in (g) above were pre-approved by the registrant’s audit committee. Accordingly, these services were considered by the registrant’s audit committee in maintaining the principal accountant’s independence.
Item 5. Audit Committee of Listed Registrants.
Not applicable.
Item 6. Schedule of Investments.
Not applicable. The complete schedule of investments is included in Item 1 of this Form N-CSR.
Item 7. Disclosure of Proxy Voting Policies and Procedures for Closed-End Management Investment Companies.
Not applicable.
Item 8. Portfolio Managers of Closed-End Management Investment Companies.
Not applicable.
Item 9. Purchases of Equity Securities by Closed-End Management Investment Company and Affiliated Purchasers.
Not applicable.
Item 10. Submission of Matters to a Vote of Security Holders.
Not applicable.
Item 11. Controls and Procedures.
(a) The registrant’s principal executive officer and principal financial officer have evaluated the registrant’s disclosure controls and procedures within 90 days of this filing and have concluded that the registrant’s disclosure controls and procedures were effective, as of that date, in ensuring that information required to be disclosed by the registrant in this Form N-CSR was recorded, processed, summarized, and reported timely.
(b) The registrant’s principal executive officer and principal financial officer are aware of no change in the registrant’s internal control over financial reporting that occurred during the registrant’s second fiscal quarter covered by this report that has materially affected, or is reasonably likely to materially affect, the registrant’s internal control over financial reporting.
Item 12. Exhibits.
(a)(1) The registrant’s code of ethics pursuant to Item 2 of Form N-CSR is attached.
(2) Separate certifications by the registrant's principal executive officer and principal financial officer, pursuant to Section 302 of the Sarbanes-Oxley Act of 2002 and required by Rule 30a-2(a) under the Investment Company Act of 1940, are attached.
(3) Written solicitation to repurchase securities issued by closed-end companies: not applicable.
(b) A certification by the registrant's principal executive officer and principal financial officer, pursuant to Section 906 of the Sarbanes-Oxley Act of 2002 and required by Rule 30a-2(b) under the Investment Company Act of 1940, is attached.
SIGNATURES |
|
| |
| | Pursuant to the requirements of the Securities Exchange Act of 1934 and the Investment |
| Company Act of 1940, the registrant has duly caused this report to be signed on its behalf by the |
| undersigned, thereunto duly authorized. |
| |
| T. Rowe Price New Era Fund, Inc. |
| |
| |
| By | /s/ James S. Riepe |
| | James S. Riepe |
| | Principal Executive Officer |
| |
| Date | February 21, 2006 |
| |
| |
| | Pursuant to the requirements of the Securities Exchange Act of 1934 and the Investment |
| Company Act of 1940, this report has been signed below by the following persons on behalf of |
| the registrant and in the capacities and on the dates indicated. |
| |
| |
| By | /s/ James S. Riepe |
| | James S. Riepe |
| | Principal Executive Officer |
| |
| Date | February 21, 2006 |
| |
| |
| |
| By | /s/ Joseph A. Carrier |
| | Joseph A. Carrier |
| | Principal Financial Officer |
| |
| Date | February 21, 2006 |