Item 1: Report to Shareholders| New Era Fund | December 31, 2007 |
The views and opinions in this report were current as of December 31, 2007. They are not guarantees of performance or investment results and should not be taken as investment advice. Investment decisions reflect a variety of factors, and the managers reserve the right to change their views about individual stocks, sectors, and the markets at any time. As a result, the views expressed should not be relied upon as a forecast of the fund’s future investment intent. The report is certified under the Sarbanes-Oxley Act, which requires mutual funds and other public companies to affirm that, to the best of their knowledge, the information in their financial reports is fairly and accurately stated in all material respects.
REPORTS ON THE WEB
Sign up for our E-mail Program, and you can begin to receive updated fund reports and prospectuses online rather than through the mail. Log in to your account at troweprice.com for more information.
Manager’s Letter
Fellow Shareholders
Thomas Rowe Price, Jr., once said that change is the investor’s only certainty, and the past six months bear him out. Six months ago, we were consumed by events in the Middle East, with conditions in Iraq deteriorating and an apparent showdown with Iran looming. Now those situations have improved, but Pakistan has become the new hotspot. At the same time, subprime mortgage problems have undermined the domestic and European banking systems, and the stock market weakened amid the storm of write-offs at most of the major commercial and investment banks invested in mortgage instruments. Prior to the collapse of the subprime market, excess liquidity encouraged banks and other investors to chase higher yields without properly pricing in the risk of default. The domestic financial problems caused the U.S. dollar to weaken and heightened concerns of a recession. The market finished the year with a modest gain, but struggled in the second half.
Of direct importance to the natural resources sector, stronger-than-expected demand combined with higher marginal costs and the increasing seriousness of problems in Pakistan drove the price of oil 57% higher, challenging $100 per barrel. Gold finished the year up 32% and went to record highs in the new year. Some of the strength in both commodities was due to the weak dollar, but the industrial metals were mostly weaker, especially in the last quarter of the year.
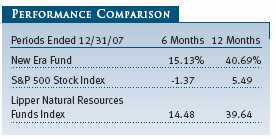
With energy and resource markets strong, your fund outpaced the broad S&P 500 Stock Index in the second half and year, as shown in the table on page 1. Your fund has now outperformed the S&P 500 for nine consecutive years—a noteworthy achievement, although it’s a pattern that we should acknowledge will not last forever. In both periods, New Era compared favorably with its Lipper index as the positive impact of the fund’s diversification served to offset the more heavily energy-weighted funds among our Lipper peer group. Our positions in agriculture, diversified metals, and precious metals were particularly advantageous.
HIGHLIGHTS
• Natural resource stocks continued to perform well in 2007, even as the broader market struggled in the face of a collapse in the subprime mortgage market.
• The New Era Fund outpaced the broader market and its Lipper index of similar funds for both the six and 12 months ended December 31, 2007, aided by our broad diversification among natural resource industries.
• We continued to find value among coal producers, and the group rallied strongly as awareness of the surge in exports of domestic coal became evident and coal prices rose.
• The leading global economic indicators are pointing to a downturn in economic activity. The year ahead will be more challenging for your fund, but we will selectively concentrate on the best opportunities in natural resources.
YEAR-END DISTRIBUTIONS
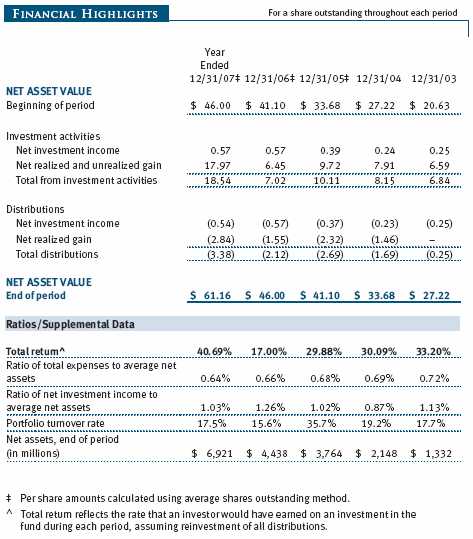
On December 17, 2007, your Board of Directors declared an income dividend of $0.54 per share, payable on December 19, 2007. On the same day, a $2.84 per share capital gain distribution was declared; $2.55 of this distribution was long-term capital gains. You should have received your check or statement reflecting these distributions as well as Form 1099-DIV summarizing this information for 2007 tax purposes.
ECONOMIC AND MARKET ENVIRONMENT
In retrospect, the Federal Reserve provided too much liquidity to the marketplace by keeping interest rates low for far too long during the early part of this decade. Domestically, this easy availability of credit sowed the seeds of speculative activity in the housing market, making it easier for low-income borrowers to finance home purchases with deceptively low-cost loans. This also encouraged individuals to buy and sell houses as if they were trading stocks that could only go up. The subprime mortgages for low-income buyers were packaged and resold with higher-quality mortgages to banks and investors seeking higher yields than those available in pure high-quality instruments. The excess liquidity also offered low-cost financing for private-equity partnerships to make leveraged buy-outs (LBOs) of companies that they would restructure and subsequently flip into the equity markets. This excess liquidity was a worldwide phenomenon and created the opportunity for speculative investing in equities and commodities across global markets.
Subprime, adjustable rate mortgages typically came with low initial "teaser" rates, and once rates started to reset higher, delinquencies rose and turnover in the housing market came to a virtual halt, pricking the bubble of inflated home values. With declining home prices, attempts to refinance these mortgages became impossible, and both homeowners and speculators began defaulting. The delinquency problems rippled through the economy from homebuilders to investment banks and investors caught holding these securitized mortgages. We have now seen homebuilder bankruptcies and major write-offs at mortgage brokers, commercial banks, investment banks, and funds that had been using these instruments to improve overall yields in their portfolios. The excessive liquidity caused investors to chase any yield advantage without fully accounting for the additional risk they were taking. Numerous CEOs and top managers at these institutions have been let go—albeit with generous exit packages—ostensibly to atone for the poor judgment displayed by their institutions.
The Federal Reserve and European central banks stepped in to extend emergency liquidity to help banks through this period, but ultimately these large write-offs have forced institutions to raise capital by selling assets and shares to Middle Eastern and Asian investors. With credit availability suddenly restricted, several LBOs have been canceled and private-equity deals curtailed. There is concern that the limited availability of commercial paper and loans will also restrain the capital spending needed to move the economy forward. Easy money is likely to continue in order to protect these institutions. Obviously, with their capital bases impaired, these institutions will not be providing much in the way of lending to the marketplace.
With the negative impact on consumers’ pocketbooks of higher food and energy prices and the reduction in wealth that comes with the decline in home prices, retail spending has weakened. There is concern that the weaker consumer will lead to a rise in credit card defaults as well. Inflation, however, is largely contained to food and energy and is not rampant in other elements of the economy, allowing the Fed some leeway to reduce rates. Unemployment has risen in the financial, homebuilding, and forest product industries, and it is uncertain whether hiring by the rest of the economy will help to offset these job losses. One positive irony is that corporations were particularly cautious in hiring, building inventory, and capital spending during this cycle and, thus, any weakness is likely to be moderate.
As the financial contagion spread to European institutions invested in these U.S. mortgage instruments, growth in the euro zone slowed, although problems there don’t seem as pervasive. Europe’s primary problem has been the strength of the euro, pound, and other currencies, which has stifled export growth. Japan has had a change in leadership and its economy has also slowed, as its central bank has proved more concerned about inflation than stimulus. China and other emerging markets continue to show solid growth, although food price inflation is becoming a serious problem in China. Chinese officials are also expressing concern—genuine or not—about the size of the country’s trade surplus. Russia has taken a more dominant position on the world stage, supported by tremendous oil export revenues. Both countries continue to make overtures to poor but resource-endowed countries such as Nigeria to gain access at the expense of the major oil companies.
Oil prices were very strong until late summer as it appeared that the conditions in Iraq and Iran were worsening. Subsequently, the situation in the Middle East seems to have eased, at least temporarily. The "surge" of U.S. troops in Iraq has for now reduced the violence and casualties. Moreover, U.S. intelligence agencies have now concluded that Iran curtailed its nuclear weapons program several years ago, staving off a dangerous face-off with that country. The present powder keg is Pakistan, where former Prime Minister Bhutto was assassinated in December. She had been seeking to work with General Musharraf to create a democracy that would try to reduce the extremist contingent in the country and work with the U.S. to restrict al-Qaeda’s movements and security in the north. With al-Qaeda now explicitly targeting oil installations, that threat must be reduced or eliminated before oil prices can truly reflect fundamentals.
Reports from the International Energy Agency and the National Petroleum Council paint a bleak picture for additions to new oil production capacity. Perhaps the most serious problems causing the escalation in the price of oil are access and inflation. Venezuela has set unreasonable terms for foreign oil companies, while Russia has unilaterally forced the sale of overseas interests in major projects. Most of the Middle East is off-limits to the major oil firms, except as service companies or developers of liquefied natural gas (LNG) projects. In many parts of the world, the royalties and taxes have escalated as host governments reach for a larger share of the action. Project costs and oil service inflation have led to rapidly rising marginal costs for the majors. As an example, it is now widely believed that at least $60 per barrel is required to get a reasonable rate of return on a tar sands mining project in Canada. This is why we are focused on find ing the service and material bottlenecks that continue to have pricing power in this inflationary environment. As marginal costs rise, so do prices, as long as demand continues to grow more than capacity.
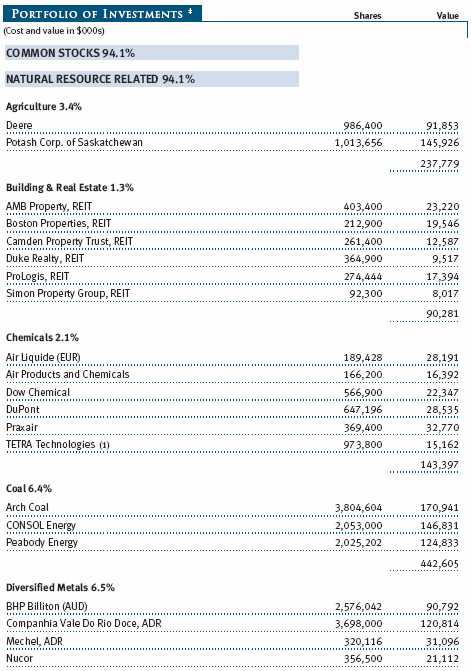
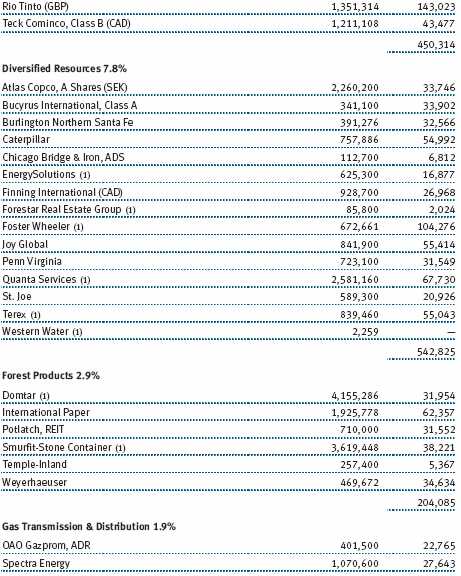
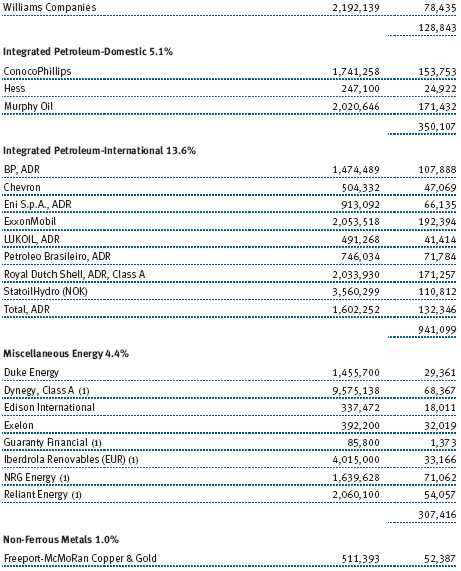
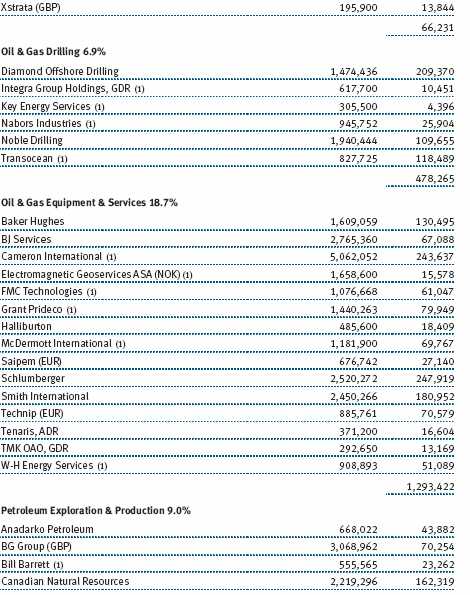
Metals prices weakened significantly, mostly in the second half of the year, due to fears that demand would slacken if there were a recession in U.S. New sources of zinc within China caused the price to collapse by 44% on the year, while the introduction of a new stainless steel manufacturing process using low-grade nickel forced high-grade nickel ore prices down 21%. Copper was only down 6% on the year, with most of the decline in the second half, also on fears of a slowdown in the domestic economy. However, the U.S. now consumes only about half as much copper as does China, so our demand decline may be cushioned by growth in China. In fact, China consumes over 20% of most metals and is heavily reliant on iron ore from Australia and Brazil. Consequently, iron ore and metallurgical coal remain strong, benefiting portfolio holdings Companhia Vale do Rio Doce (CVRD), Rio Tinto, and BHP Billiton. These are also the companies that can expand production at low cost using deposits near their existing facilities. (Please see the portfolio of investments for a complete listing of the fund’s holdings and the amount each represents in the portfolio.)
China is becoming an importer of coal, and India’s power generation plans indicate that it will also become a significant factor in the seaborne demand for coal. With the weaker dollar and China attracting coal sources that might otherwise serve Europe, demand for Appalachian coal to serve that continent has led to strong spot price increases. This trend is apt to continue while the U.S. sorts out clean coal technologies and carbon credits before domestic demand begins to grow more rapidly. We have invested in various parts of the chain that we believe will ultimately benefit from the greater use of clean coal.
PORTFOLIO REVIEW
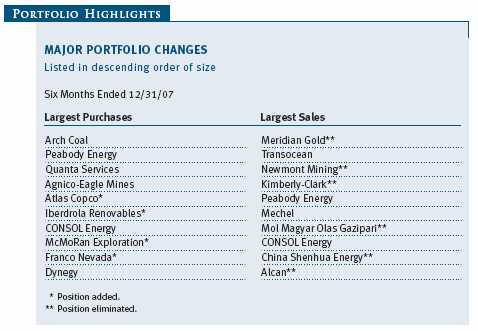
During the second half of the year, we added several new positions and redoubled our position in coal during the weakness in July and August. By far the largest purchases were of domestic coal producers, including Arch Coal, a large surface miner in Wyoming’s Powder River Basin; Peabody Energy, a Northern Appalachia, Wyoming, and Australia producer; and CONSOL Energy, an Illinois Basin producer. The group rallied strongly into the fall as investors became aware of the surge in exports of domestic coal. These three companies were among the 10 largest contributors to performance over the last six months.
We also added to our position in Quanta Services, as it swallowed up another position in the portfolio, Infrasource—two of only a handful of companies that can provide high-voltage power-line construction domestically. With the need for new power plants to solve our growing demand for electricity, to improve reliability of the existing system, and the long-distance requirements of solar and wind installations, demand for their unique services should show considerable growth over the next five years or more. We initiated a position in Iberdrola Renovables, a Spanish company specializing in the development and operation of wind farms.
With the elimination of gold miners Newmont Mining, Meridian Gold, and Yamana Gold due to corporate performance and merger issues, we purchased Agnico-Eagle Mines, a primarily North American gold producer with a good growth portfolio. We also bought Franco Nevada, a royalty company with revenue interests in precious metals, energy, and a few other basic materials. Unfortunately, we did not have as large a precious metals position as we would have liked, since most producers suffer from cost inflation and lack production growth. As a result, we did not fully benefit from the year-end rally.
We eliminated several positions that had reached our price targets during the period. Mol Magyar, a Hungarian refiner, became embroiled in a “save our company at any cost” defense against a hostile takeover, and we sold our shares back to the company at a significant premium. We also took profits, albeit a bit too early, in China Shenhua Energy, a coal and independent power producer, which had participated in a strong rally in the Chinese market. A long-term holding, Kimberly-Clark, was eliminated as it had become far too much of a consumer products company and was being pressured by raw materials prices.

Our biggest contributor for the second half was Potash Corp. of Saskatchewan, one of the world’s leading producers of potash, a vital soil nutrient in great demand partly due to the inflationary impact of ethanol on corn prices and, consequently, higher crop plantings. Three of the top 10 contributors were again oil service names: Cameron International, a global manufacturer of oil and gas pressure control and separation equipment benefiting from the trend toward subsea completions; Diamond Offshore Drilling, a well-run offshore drilling rig company that is paying out its excess cash in the form of large special dividends; and Smith International, a leading global supplier of fluid drilling systems and drill-bit manufacturer. These and most of the holdings in the oil service area are global providers, benefiting not only from demand by the publicly traded major oil companies, but from the host government oil companies as well, since they control almost 90% of the world’s reserves and play an increasing role in developing their own resources.
There was also an informal offer made by portfolio holding BHP Billiton for Rio Tinto, another holding. While BHP slipped modestly, Rio was one of the largest contributors for the six months. If the combination takes place, there could be tremendous synergies gained. Murphy Oil, a large holding, was one of the top contributors as it contemplated exiting the refining segment and began to show sharp production gains during the period. It is testing, successfully thus far, the services of Electromagnetic Geoservices ASA, one of the biggest detractors in the quarter. The problem for that company seems not to be in the technology, but in poor guidance to the market and too few vessels to serve the widespread global needs of its clients. The steaming time from job to job led to poor utilization, but the company is in the process of adding vessels to improve the efficiency of its fleet. Continued success by Murphy would add to the attraction of the stock. Terex suffered from concerns about the slowdown in the domestic economy, although this company is far more globally diversified and serves certain markets likely to remain strong. Four paper and forest product stocks were in the top detractor category including International Paper, Smurfit Stone Container, Domtar, and Temple-Inland. The industry is suffering from inflating raw materials costs and the rising Canadian dollar.
OUTLOOK
The Federal Reserve is currently in a box, with inflation toward the high end of its desired range and an economy in need of lower rates to stimulate growth. Lower rates are likely to prevail with the hope that greater liquidity can shore up financial institutions and provide some relief to homeowners unable to keep their mortgages current. At the present time, however, it is extremely difficult to force the institutions owning these mortgages not to foreclose instead of working out the loans. The financial damage will continue as another large tranche of mortgages resets in 2008.
The leading economic indicators across the U.S., Europe, and Japan are pointing to a downturn in economic activity. That weakness may offset the growth we are continuing to see in the emerging markets. Demand for industrial metals may respond but with the Fed likely to continue to lower rates, we may see further dollar weakness and strength in precious metals. With a modest demand decline for gasoline in the U.S. and an unusually large addition to non-OPEC production capacity, oil prices may finally weaken. Still, we do not expect prices to fall much below the mid-$80 per barrel level, given the other forces at work and the poor long-term picture for new capacity additions.
The year ahead will be more challenging for your fund than the last few years, but we will selectively concentrate on the best opportunities in natural resources.
Respectfully submitted,

Charles M. Ober
President and chairman of the Investment Advisory Committee
January 18, 2008
The committee chairman has day-to-day responsibility for managing the portfolio and works with committee members in developing and executing the fund’s investment program.
RISKS OF STOCK INVESTING
The fund’s share price can fall because of weakness in the stock markets, a particular industry, or specific holdings. Stock markets can decline for many reasons, including adverse political or economic developments, changes in investor psychology, or heavy institutional selling. The prospects for an industry or company may deteriorate because of a variety of factors, including disappointing earnings or changes in the competitive environment. In addition, the investment manager’s assessment of companies held in a fund may prove incorrect, resulting in losses or poor performance even in rising markets. Funds that invest only in specific industries will experience greater volatility than funds investing in a broad range of industries. The rate of earnings growth of natural resources companies may be irregular since these companies are strongly affected by natural forces, global economic cycles, and international politics. For example, stock prices of energy companies can fall sharply when oil prices fall.
GLOSSARY
Lipper indexes: Fund benchmarks that consist of a small number of the largest mutual funds in a particular category as tracked by Lipper Inc.
S&P 500 Stock Index: An unmanaged index that tracks the stocks of 500 primarily large-cap U.S. companies.

Performance and Expenses
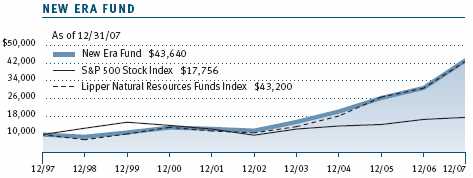
This chart shows the value of a hypothetical $10,000 investment in the fund over the past 10 fiscal year periods or since inception (for funds lacking 10-year records). The result is compared with benchmarks, which may include a broad-based market index and a peer group average or index. Market indexes do not include expenses, which are deducted from fund returns as well as mutual fund averages and indexes.
| AVERAGE ANNUAL COMPOUND TOTAL RETURN |
This table shows how the fund would have performed each year if its actual (or cumulative) returns for the periods shown had been earned at a constant rate.

As a mutual fund shareholder, you may incur two types of costs: (1) transaction costs, such as redemption fees or sales loads, and (2) ongoing costs, including management fees, distribution and service (12b-1) fees, and other fund expenses. The following example is intended to help you understand your ongoing costs (in dollars) of investing in the fund and to compare these costs with the ongoing costs of investing in other mutual funds. The example is based on an investment of $1,000 invested at the beginning of the most recent six-month period and held for the entire period.
Actual Expenses
The first line of the following table (“Actual”) provides information about actual account values and expenses based on the fund’s actual returns. You may use the information in this line, together with your account balance, to estimate the expenses that you paid over the period. Simply divide your account value by $1,000 (for example, an $8,600 account value divided by $1,000 = 8.6), then multiply the result by the number in the first line under the heading “Expenses Paid During Period” to estimate the expenses you paid on your account during this period.
Hypothetical Example for Comparison Purposes
The information on the second line of the table (“Hypothetical”) is based on hypothetical account values and expenses derived from the fund’s actual expense ratio and an assumed 5% per year rate of return before expenses (not the fund’s actual return). You may compare the ongoing costs of investing in the fund with other funds by contrasting this 5% hypothetical example and the 5% hypothetical examples that appear in the shareholder reports of the other funds. The hypothetical account values and expenses may not be used to estimate the actual ending account balance or expenses you paid for the period.
Note: T. Rowe Price charges an annual small-account maintenance fee of $10, generally for accounts with less than $2,000 ($500 for UGMA/UTMA). The fee is waived for any investor whose T. Rowe Price mutual fund accounts total $25,000 or more, accounts employing automatic investing, and IRAs and other retirement plan accounts that utilize a prototype plan sponsored by T. Rowe Price (although a separate custodial or administrative fee may apply to such accounts). This fee is not included in the accompanying table. If you are subject to the fee, keep it in mind when you are estimating the ongoing expenses of investing in the fund and when comparing the expenses of this fund with other funds.
You should also be aware that the expenses shown in the table highlight only your ongoing costs and do not reflect any transaction costs, such as redemption fees or sales loads. Therefore, the second line of the table is useful in comparing ongoing costs only and will not help you determine the relative total costs of owning different funds. To the extent a fund charges transaction costs, however, the total cost of owning that fund is higher.

The accompanying notes are an integral part of these financial statements.


The accompanying notes are an integral part of these financial statements.

The accompanying notes are an integral part of these financial statements.

The accompanying notes are an integral part of these financial statements.
The accompanying notes are an integral part of these financial statements.
| NOTES TO FINANCIAL STATEMENTS |
NOTE 1 – SIGNIFICANT ACCOUNTING POLICIES
T. Rowe Price New Era Fund, Inc. (the fund), is registered under the Investment Company Act of 1940 (the 1940 Act) as a diversified, open-end management investment company. The fund commenced operations on January 20, 1969. The fund seeks to provide long-term capital growth primarily through the common stocks of companies that own or develop natural resources and other basic commodities, and also through the stocks of selected nonresource growth companies.
The accompanying financial statements were prepared in accordance with accounting principles generally accepted in the United States of America, which require the use of estimates made by fund management. Fund management believes that estimates and security valuations are appropriate; however, actual results may differ from those estimates, and the security valuations reflected in the financial statements may differ from the value the fund ultimately realizes upon sale of the securities.
Valuation The fund values its investments and computes its net asset value per share at the close of the New York Stock Exchange (NYSE), normally 4 p.m. ET, each day that the NYSE is open for business. Equity securities listed or regularly traded on a securities exchange or in the over-the-counter (OTC) market are valued at the last quoted sale price or, for certain markets, the official closing price at the time the valuations are made, except for OTC Bulletin Board securities, which are valued at the mean of the latest bid and asked prices. A security that is listed or traded on more than one exchange is valued at the quotation on the exchange determined to be the primary market for such security. Listed securities not traded on a particular day are valued at the mean of the latest bid and asked prices for domestic securities and the last quoted sale price for international securities.
Investments in mutual funds are valued at the mutual fund’s closing net asset value per share on the day of valuation.
Other investments, including restricted securities, and those for which the above valuation procedures are inappropriate or are deemed not to reflect fair value are stated at fair value as determined in good faith by the T. Rowe Price Valuation Committee, established by the fund’s Board of Directors.
Most foreign markets close before the close of trading on the NYSE. If the fund determines that developments between the close of a foreign market and the close of the NYSE will, in its judgment, materially affect the value of some or all of its portfolio securities, which in turn will affect the fund’s share price, the fund will adjust the previous closing prices to reflect the fair value of the securities as of the close of the NYSE, as determined in good faith by the T. Rowe Price Valuation Committee, established by the fund’s Board of Directors. A fund may also fair value securities in other situations, such as when a particular foreign market is closed but the fund is open. In deciding whether to make fair value adjustments, the fund reviews a variety of factors, including developments in foreign markets, the performance of U.S. securities markets, and the performance of instruments trading in U.S. markets that represent foreign securities and baskets of foreign securities. The fund uses outside pricing services to provide it with closing market prices and information used for adjusting those prices. The fund cannot predict when and how often it will use closing prices and when it will adjust those prices to reflect fair value. As a means of evaluating its fair value process, the fund routinely compares closing market prices, the next day’s opening prices in the same markets, and adjusted prices.
Currency Translation Assets, including investments, and liabilities denominated in foreign currencies are translated into U.S. dollar values each day at the prevailing exchange rate, using the mean of the bid and asked prices of such currencies against U.S. dollars as quoted by a major bank. Purchases and sales of securities, income, and expenses are translated into U.S. dollars at the prevailing exchange rate on the date of the transaction. The effect of changes in foreign currency exchange rates on realized and unrealized security gains and losses is reflected as a component of security gains and losses.
Rebates and Credits Subject to best execution, the fund may direct certain security trades to brokers who have agreed to rebate a portion of the related brokerage commission to the fund in cash. Commission rebates are reflected as realized gain on securities in the accompanying financial statements and totaled $77,000 for the year ended December 31, 2007. Additionally, the fund earns credits on temporarily uninvested cash balances at the custodian that reduce the fund’s custody charges. Custody expense in the accompanying financial statements is presented before reduction for credits, which are reflected as expenses paid indirectly.
Investment Transactions, Investment Income, and Distributions Income and expenses are recorded on the accrual basis. Dividends received from mutual fund investments are reflected as dividend income; capital gain distributions are reflected as realized gain/loss. Dividend income and capital gain distributions are recorded on the ex-dividend date. Income tax-related interest and penalties, if incurred, would be recorded as income tax expense. Investment transactions are accounted for on the trade date. Realized gains and losses are reported on the identified cost basis. Distributions to shareholders are recorded on the ex-dividend date. Income distributions are declared and paid on an annual basis. Capital gain distributions, if any, are declared and paid by the fund, typically on an annual basis.
New Accounting Pronouncements Effective June 29, 2007, the fund adopted Financial Accounting Standards Board (FASB) Interpretation No. 48 (FIN 48), Accounting for Uncertainty in Income Taxes, a clarification of FASB Statement No. 109, Accounting for Income Taxes. FIN 48 establishes financial accounting and disclosure requirements for recognition and measurement of tax positions taken or expected to be taken on an income tax return. The adoption of FIN 48 had no impact on the fund’s net assets or results of operations.
In September 2006, the FASB released the Statement of Financial Accounting Standard No. 157 (FAS 157), Fair Value Measurements. FAS 157 clarifies the definition of fair value and establishes the framework for measuring fair value, as well as proper disclosure of this methodology in the financial statements. It will be effective for the fund’s fiscal year beginning January 1, 2008. Management is evaluating the effects of FAS 157; however, it is not expected to have a material impact on the fund’s net assets or results of operations.
NOTE 2 - INVESTMENT TRANSACTIONS
Consistent with its investment objective, the fund engages in the following practices to manage exposure to certain risks or to enhance performance. The investment objective, policies, program, and risk factors of the fund are described more fully in the fund’s prospectus and Statement of Additional Information.
Securities Lending The fund lends its securities to approved brokers to earn additional income. It receives as collateral cash and U.S. government securities valued at 102% to 105% of the value of the securities on loan. Cash collateral is invested in a money market pooled trust managed by the fund’s lending agent in accordance with investment guidelines approved by fund management. Collateral is maintained over the life of the loan in an amount not less than the value of loaned securities, as determined at the close of fund business each day; any additional collateral required due to changes in security values is delivered to the fund the next business day. Although risk is mitigated by the collateral, the fund could experience a delay in recovering its securities and a possible loss of income or value if the borrower fails to return the securities. Securities lending revenue recognized by the fund consists of earnings on invested collateral and borrowing fees, net of any rebates to the borrower and compensation to the lending agent. At December 31, 2007, there were no securities on loan.
Other Purchases and sales of portfolio securities, other than short-term securities, aggregated $1,250,003,000 and $932,497,000, respectively, for the year ended December 31, 2007.
NOTE 3 - FEDERAL INCOME TAXES
No provision for federal income taxes is required since the fund intends to continue to qualify as a regulated investment company under Subchapter M of the Internal Revenue Code and distribute to shareholders all of its taxable income and gains. Federal income tax regulations differ from generally accepted accounting principles; therefore, distributions determined in accordance with tax regulations may differ significantly in amount or character from net investment income and realized gains for financial reporting purposes. Financial reporting records are adjusted for permanent book/tax differences to reflect tax character. Financial records are not adjusted for temporary differences.
Distributions during the year ended December 31, 2007, were characterized as follows for tax purposes:

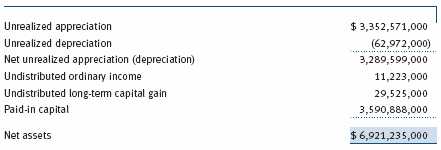
At December 31, 2007, the tax-basis components of net assets were as follows:
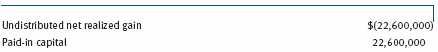
For the year ended December 31, 2007, the fund recorded the following permanent reclassifications to reflect tax character. Reclassifications to paid-in capital relate primarily to a tax practice that treats a portion of the proceeds from each redemption of capital shares as a distribution of taxable net investment income and/or realized capital gain. Results of operations and net assets were not affected by these reclassifications.
At December 31, 2007, the cost of investments for federal income tax purposes was $3,612,727,000.
NOTE 4 - RELATED PARTY TRANSACTIONS
The fund is managed by T. Rowe Price Associates, Inc. (the manager or Price Associates), a wholly owned subsidiary of T. Rowe Price Group, Inc. The investment management agreement between the fund and the manager provides for an annual investment management fee, which is computed daily and paid monthly. The fee consists of an individual fund fee, equal to 0.25% of the fund’s average daily net assets, and a group fee. The group fee rate is calculated based on the combined net assets of certain mutual funds sponsored by Price Associates (the group) applied to a graduated fee schedule, with rates ranging from 0.48% for the first $1 billion of assets to 0.285% for assets in excess of $220 billion. The fund’s group fee is determined by applying the group fee rate to the fund’s average daily net assets. At December 31, 2007, the effective annual group fee rate was 0.30%.
In addition, the fund has entered into service agreements with Price Associates and two wholly owned subsidiaries of Price Associates (collectively, Price). Price Associates computes the daily share price and provides certain other administrative services to the fund. T. Rowe Price Services, Inc., provides shareholder and administrative services in its capacity as the fund’s transfer and dividend disbursing agent. T. Rowe Price Retirement Plan Services, Inc., provides subaccounting and recordkeeping services for certain retirement accounts invested in the fund. For the year ended December 31, 2007, expenses incurred pursuant to these service agreements were $96,000 for Price Associates, $2,355,000 for T. Rowe Price Services, Inc., and $305,000 for T. Rowe Price Retirement Plan Services, Inc. The total amount payable at period-end pursuant to these service agreements is reflected as Due to Affiliates in the accompanying financial statements.
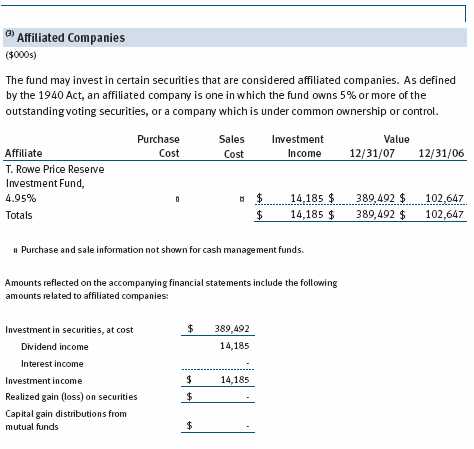
The fund may invest in the T. Rowe Price Reserve Investment Fund and the T. Rowe Price Government Reserve Investment Fund (collectively, the T. Rowe Price Reserve Investment Funds), open-end management investment companies managed by Price Associates and affiliates of the fund. The T. Rowe Price Reserve Investment Funds are offered as cash management options to mutual funds, trusts, and other accounts managed by Price Associates and/or its affiliates, and are not available for direct purchase by members of the public. The T. Rowe Price Reserve Investment Funds pay no investment management fees.
As of December 31, 2007, T. Rowe Price Group, Inc., and/or its wholly owned subsidiaries owned 573,241 shares of the fund, representing less than 1% of the fund’s net assets.
| REPORT OF INDEPENDENT REGISTERED PUBLIC ACCOUNTING FIRM |
To the Board of Directors and Shareholders of T. Rowe Price New Era Fund, Inc.
In our opinion, the accompanying statement of assets and liabilities, including the portfolio of investments, and the related statements of operations and of changes in net assets and the financial highlights present fairly, in all material respects, the financial position of T. Rowe Price New Era Fund, Inc. (the “Fund”) at December 31, 2007, the results of its operations for the year then ended, the changes in its net assets for each of the two years in the period then ended and the financial highlights for each of the five years in the period then ended, in conformity with accounting principles generally accepted in the United States of America. These financial statements and financial highlights (hereafter referred to as “financial statements”) are the responsibility of the Fund’s management; our responsibility is to express an opinion on these financial statements based on our audits. We conducted our audits of these financial statements in accordance with the auditing standards of the Public Company Accounting Oversight Board (United States). Those standards require that we plan and perform the audit to obtain reasonable assurance about whether the financial statements are free of material misstatement. An audit includes examining, on a test basis, evidence supporting the amounts and disclosures in the financial statements, assessing the accounting principles used and significant estimates made by management, and evaluating the overall financial statement presentation. We believe that our audits, which included confirmation of securities at December 31, 2007, by correspondence with the custodian and by agreement to the underlying records for T. Rowe Price Reserve Investment Fund, provide a reasonable basis for our opinion.
PricewaterhouseCoopers LLP
Baltimore, Maryland
February 12, 2008
| TAX INFORMATION (UNAUDITED) FOR THE TAX YEAR ENDED 12/31/07 |
We are providing this information as required by the Internal Revenue Code. The amounts shown may differ from those elsewhere in this report because of differences between tax and financial reporting requirements.
The fund’s distributions to shareholders included:
• $36,751,000 from short-term capital gains,
• $289,507,000 from long-term capital gains, of which $289,134,000 was subject to the 15% rate gains category, and $373,000 to the 25% rate gains category.
For taxable non-corporate shareholders, $69,757,000 of the fund’s income represents qualified dividend income subject to the 15% rate category.
For corporate shareholders, $41,290,000 of the fund’s income qualifies for the dividends-received deduction.
| INFORMATION ON PROXY VOTING POLICIES, PROCEDURES, AND RECORDS |
A description of the policies and procedures used by T. Rowe Price funds and portfolios to determine how to vote proxies relating to portfolio securities is available in each fund’s Statement of Additional Information, which you may request by calling 1-800-225-5132 or by accessing the SEC’s Web site, www.sec.gov. The description of our proxy voting policies and procedures is also available on our Web site, www.troweprice.com. To access it, click on the words "Company Info" at the top of our homepage for individual investors. Then, in the window that appears, click on the "Proxy Voting Policy" navigation button in the top left corner.
Each fund’s most recent annual proxy voting record is available on our Web site and through the SEC’s Web site. To access it through our Web site, follow the directions above, then click on the words "Proxy Voting Record" at the bottom of the Proxy Voting Policy page.
| HOW TO OBTAIN QUARTERLY PORTFOLIO HOLDINGS |
The fund files a complete schedule of portfolio holdings with the Securities and Exchange Commission for the first and third quarters of each fiscal year on Form N-Q. The fund’s Form N-Q is available electronically on the SEC’s Web site (www.sec.gov); hard copies may be reviewed and copied at the SEC’s Public Reference Room, 450 Fifth St. N.W., Washington, DC 20549. For more information on the Public Reference Room, call 1-800-SEC-0330.
| ABOUT THE FUND’S DIRECTORS AND OFFICERS |
Your fund is governed by a Board of Directors (Board) that meets regularly to review a wide variety of matters affecting the fund, including performance, investment programs, compliance matters, advisory fees and expenses, service providers, and other business affairs. The Board elects the fund’s officers, who are listed in the final table. At least 75% of Board members are independent of T. Rowe Price Associates, Inc. (T. Rowe Price), and T. Rowe Price International, Inc. (T. Rowe Price International); "inside" or "interested" directors are employees or officers of T. Rowe Price. The business address of each director and officer is 100 East Pratt Street, Baltimore, Maryland 21202. The Statement of Additional Information includes additional information about the directors and is available without charge by calling a T. Rowe Price representative at 1-800-225-5132.
| Independent Directors | |
| |
| Name | |
| (Year of Birth) | Principal Occupation(s) During Past 5 Years and Directorships of |
| Year Elected* | Other Public Companies |
| |
| Jeremiah E. Casey | Director, National Life Insurance (2001 to 2005); Director, The Rouse |
| (1940) | Company, real estate developers (1990 to 2004); Director, Allfirst |
| 2005 | Financial Inc. (previously First Maryland Bancorp) (1983 to 2002) |
| |
| Anthony W. Deering | Chairman, Exeter Capital, LLC, a private investment firm (2004 to pres- |
| (1945) | ent); Director, Vornado Real Estate Investment Trust (3/04 to present); |
| 2001 | Member, Advisory Board, Deutsche Bank North America (2004 to pres- |
| | ent); Director, Chairman of the Board, and Chief Executive Officer, The |
| | Rouse Company, real estate developers (1997 to 2004) |
| |
| Donald W. Dick, Jr. | Principal, EuroCapital Advisors, LLC, an acquisition and management |
| (1943) | advisory firm; Chairman, The Haven Group, a custom manufacturer of |
| 1994 | modular homes (1/04 to present) |
| |
| David K. Fagin | Chairman and President, Nye Corporation (6/88 to present); Chairman, |
| (1938) | Canyon Resources Corp. (8/07 to present); Director, Golden Star |
| 1988 | Resources Ltd. (5/92 to present); Director, Pacific Rim Mining Corp. |
| | (2/02 to present) |
| |
| Karen N. Horn | Director, Federal National Mortgage Association (9/06 to present); |
| (1943) | Managing Director and President, Global Private Client Services, Marsh |
| 2003 | Inc. (1999 to 2003); Director, Georgia Pacific (5/04 to 12/05), Eli Lilly |
| | and Company, and Simon Property Group |
| |
| Theo C. Rodgers | President, A&R Development Corporation (1977 to present) |
| (1941) | |
| 2005 | |
| | |
| John G. Schreiber | Owner/President, Centaur Capital Partners, Inc., a real estate invest- |
| (1946) | ment company; Partner, Blackstone Real Estate Advisors, L.P. |
| 2001 | |
| | |
| *Each independent director oversees 121 T. Rowe Price portfolios and serves until retirement, resignation, or |
| election of a successor. | |
| Inside Directors | |
| |
| Name | |
| (Year of Birth) | |
| Year Elected* | |
| [Number of T. Rowe Price | Principal Occupation(s) During Past 5 Years and Directorships of |
| Portfolios Overseen] | Other Public Companies |
| |
| Edward C. Bernard | Director and Vice President, T. Rowe Price; Vice Chairman of the Board, |
| (1956) | Director, and Vice President, T. Rowe Price Group, Inc.; Chairman of the |
| 2006 | Board, Director, and President, T. Rowe Price Investment Services, |
| [121] | Inc.; Chairman of the Board and Director, T. Rowe Price Global Asset |
| | Management Limited, T. Rowe Price Global Investment Services Limited, |
| | T. Rowe Price Retirement Plan Services, Inc., T. Rowe Price Savings Bank, |
| | and T. Rowe Price Services, Inc.; Director, T. Rowe Price International, |
| | Inc.; Chief Executive Officer, Chairman of the Board, Director, and |
| | President, T. Rowe Price Trust Company; Chairman of the Board, all funds |
| |
| Brian C. Rogers, CFA, CIC | Chief Investment Officer, Director, and Vice President, T. Rowe Price; |
| (1955) | Chairman of the Board, Chief Investment Officer, Director, and Vice |
| 2006 | President, T. Rowe Price Group, Inc.; Vice President, T. Rowe Price |
| [68] | Trust Company |
| |
| *Each inside director serves until retirement, resignation, or election of a successor. |
| Officers | |
| |
| Name (Year of Birth) | |
| Title and Fund(s) Served | Principal Occupation(s) |
| |
| Joseph A. Carrier, CPA (1960) | Vice President, T. Rowe Price, T. Rowe Price |
| Treasurer, New Era Fund | Group, Inc., T. Rowe Price Investment Services, |
| | Inc., and T. Rowe Price Trust Company |
| |
| Richard de los Reyes (1975) | Vice President, T. Rowe Price; formerly Analyst, |
| Vice President, New Era Fund | Soros Fund Management (to 2006) |
| |
| Shawn T. Driscoll (1975) | Employee, T. Rowe Price; formerly Equity |
| Vice President, New Era Fund | Research Analyst, MTB Investment Advisors (to |
| | 2006); student, New York University (to 2003); |
| | Information Technology Project Manager, |
| | Mpower Communications (to 2001) |
| |
| Roger L. Fiery III, CPA (1959) | Vice President, T. Rowe Price, T. Rowe Price |
| Vice President, New Era Fund | Group, Inc., T. Rowe Price International, Inc., |
| | and T. Rowe Price Trust Company |
| |
| Mark S. Finn, CFA, CPA (1963) | Vice President, T. Rowe Price and T. Rowe Price |
| Vice President, New Era Fund | Group, Inc. |
| |
| John R. Gilner (1961) | Chief Compliance Officer and Vice President, |
| Chief Compliance Officer, New Era Fund | T. Rowe Price; Vice President, T. Rowe Price |
| | Group, Inc., and T. Rowe Price Investment |
| | Services, Inc. |
| |
| Gregory S. Golczewski (1966) | Vice President, T. Rowe Price and T. Rowe Price |
| Vice President, New Era Fund | Trust Company |
| |
| Henry H. Hopkins (1942) | Director and Vice President, T. Rowe Price |
| Vice President, New Era Fund | Investment Services, Inc., T. Rowe Price Services, |
| | Inc., and T. Rowe Price Trust Company; Vice |
| | President, T. Rowe Price, T. Rowe Price Group, |
| | Inc., T. Rowe Price International, Inc., and |
| | T. Rowe Price Retirement Plan Services, Inc. |
| |
| Susan J. Klein (1950) | Vice President, T. Rowe Price |
| Vice President, New Era Fund | |
| |
| David M. Lee, CFA (1962) | Vice President, T. Rowe Price and T. Rowe Price |
| Vice President, New Era Fund | Group, Inc. |
| |
| John D. Linehan, CFA (1965) | Vice President, T. Rowe Price and T. Rowe Price |
| Vice President, New Era Fund | Group, Inc. |
| | |
| Patricia B. Lippert (1953) | Assistant Vice President, T. Rowe Price and |
| Secretary, New Era Fund | T. Rowe Price Investment Services, Inc. |
| | |
| Heather K. McPherson, CPA (1967) | Vice President, T. Rowe Price and T. Rowe Price |
| Vice President, New Era Fund | Group, Inc. |
| | |
| Charles M. Ober, CFA (1950) | Vice President, T. Rowe Price and T. Rowe Price |
| President, New Era Fund | Group, Inc. |
| | |
| Christian M. O’Neill (1969) | Vice President, T. Rowe Price; formerly Equity |
| Vice President, New Era Fund | Research Analyst, Morgan Stanley and Trader |
| and Operations Scheduler, ExxonMobil |
| Corporation (to 2006) |
| |
| | |
| Timothy E. Parker (1974) | Vice President, T. Rowe Price and T. Rowe Price |
| Vice President, New Era Fund | Group, Inc. |
| | |
| David J. Wallack (1960) | Vice President, T. Rowe Price and T. Rowe Price |
| Vice President, New Era Fund | Group, Inc. |
| | |
| Julie L. Waples (1970) | Vice President, T. Rowe Price |
| Vice President, New Era Fund | |
| | |
| Unless otherwise noted, officers have been employees of T. Rowe Price or T. Rowe Price International for at least |
| five years. | |
Item 2. Code of Ethics.
The registrant has adopted a code of ethics, as defined in Item 2 of Form N-CSR, applicable to its principal executive officer, principal financial officer, principal accounting officer or controller, or persons performing similar functions. A copy of this code of ethics is filed as an exhibit to this Form N-CSR. No substantive amendments were approved or waivers were granted to this code of ethics during the period covered by this report.
Item 3. Audit Committee Financial Expert.
The registrant’s Board of Directors/Trustees has determined that Ms. Karen N. Horn qualifies as an audit committee financial expert, as defined in Item 3 of Form N-CSR. Ms. Horn is considered independent for purposes of Item 3 of Form N-CSR.
Item 4. Principal Accountant Fees and Services.
(a) – (d) Aggregate fees billed to the registrant for the last two fiscal years for professional services rendered by the registrant’s principal accountant were as follows:
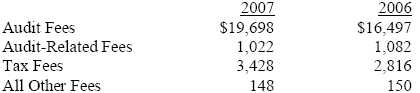
Audit fees include amounts related to the audit of the registrant’s annual financial statements and services normally provided by the accountant in connection with statutory and regulatory filings. Audit-related fees include amounts reasonably related to the performance of the audit of the registrant’s financial statements and specifically include the issuance of a report on internal controls and, if applicable, agreed-upon procedures related to fund acquisitions. Tax fees include amounts related to services for tax compliance, tax planning, and tax advice. The nature of these services specifically includes the review of distribution calculations and the preparation of Federal, state, and excise tax returns. All other fees include the registrant’s pro-rata share of amounts for agreed-upon procedures in conjunction with service contract approvals by the registrant’s Board of Directors/Trustees.
(e)(1) The registrant’s audit committee has adopted a policy whereby audit and non-audit services performed by the registrant’s principal accountant for the registrant, its investment adviser, and any entity controlling, controlled by, or under common control with the investment adviser that provides ongoing services to the registrant require pre-approval in advance at regularly scheduled audit committee meetings. If such a service is required between regularly scheduled audit committee meetings, pre-approval may be authorized by one audit committee member with ratification at the next scheduled audit committee meeting. Waiver of pre-approval for audit or non-audit services requiring fees of a de minimis amount is not permitted.
(2) No services included in (b) – (d) above were approved pursuant to paragraph (c)(7)(i)(C) of Rule 2-01 of Regulation S-X.
(f) Less than 50 percent of the hours expended on the principal accountant’s engagement to audit the registrant’s financial statements for the most recent fiscal year were attributed to work performed by persons other than the principal accountant’s full-time, permanent employees.
(g) The aggregate fees billed for the most recent fiscal year and the preceding fiscal year by the registrant’s principal accountant for non-audit services rendered to the registrant, its investment adviser, and any entity controlling, controlled by, or under common control with the investment adviser that provides ongoing services to the registrant were $1,486,000 and $1,401,000, respectively, and were less than the aggregate fees billed for those same periods by the registrant’s principal accountant for audit services rendered to the T. Rowe Price Funds.
(h) All non-audit services rendered in (g) above were pre-approved by the registrant’s audit committee. Accordingly, these services were considered by the registrant’s audit committee in maintaining the principal accountant’s independence.
Item 5. Audit Committee of Listed Registrants.
Not applicable.
Item 6. Schedule of Investments.
Not applicable. The complete schedule of investments is included in Item 1 of this Form N-CSR.
Item 7. Disclosure of Proxy Voting Policies and Procedures for Closed-End Management Investment Companies.
Not applicable.
Item 8. Portfolio Managers of Closed-End Management Investment Companies.
Not applicable.
Item 9. Purchases of Equity Securities by Closed-End Management Investment Company and Affiliated Purchasers.
Not applicable.
Item 10. Submission of Matters to a Vote of Security Holders.
Not applicable.
Item 11. Controls and Procedures.
(a) The registrant’s principal executive officer and principal financial officer have evaluated the registrant’s disclosure controls and procedures within 90 days of this filing and have concluded that the registrant’s disclosure controls and procedures were effective, as of that date, in ensuring that information required to be disclosed by the registrant in this Form N-CSR was recorded, processed, summarized, and reported timely.
(b) The registrant’s principal executive officer and principal financial officer are aware of no change in the registrant’s internal control over financial reporting that occurred during the registrant’s second fiscal quarter covered by this report that has materially affected, or is reasonably likely to materially affect, the registrant’s internal control over financial reporting.
Item 12. Exhibits.
(a)(1) The registrant’s code of ethics pursuant to Item 2 of Form N-CSR is attached.
(2) Separate certifications by the registrant's principal executive officer and principal financial officer, pursuant to Section 302 of the Sarbanes-Oxley Act of 2002 and required by Rule 30a-2(a) under the Investment Company Act of 1940, are attached.
(3) Written solicitation to repurchase securities issued by closed-end companies: not applicable.
(b) A certification by the registrant's principal executive officer and principal financial officer, pursuant to Section 906 of the Sarbanes-Oxley Act of 2002 and required by Rule 30a-2(b) under the Investment Company Act of 1940, is attached.
| | |
SIGNATURES |
| |
| | Pursuant to the requirements of the Securities Exchange Act of 1934 and the Investment |
| Company Act of 1940, the registrant has duly caused this report to be signed on its behalf by the |
| undersigned, thereunto duly authorized. |
| |
| T. Rowe Price New Era Fund, Inc. |
| |
| |
| By | /s/ Edward C. Bernard |
| | Edward C. Bernard |
| | Principal Executive Officer |
| |
| Date | February 19, 2008 |
| |
| |
| |
| | Pursuant to the requirements of the Securities Exchange Act of 1934 and the Investment |
| Company Act of 1940, this report has been signed below by the following persons on behalf of |
| the registrant and in the capacities and on the dates indicated. |
| |
| |
| By | /s/ Edward C. Bernard |
| | Edward C. Bernard |
| | Principal Executive Officer |
| |
| Date | February 19, 2008 |
| |
| |
| |
| By | /s/ Joseph A. Carrier |
| | Joseph A. Carrier |
| | Principal Financial Officer |
| |
| Date | February 19, 2008 |