UNITED STATES
SECURITIES AND EXCHANGE COMMISSION
Washington, D.C. 20549
FORM N-CSR
CERTIFIED SHAREHOLDER REPORT OF REGISTERED
MANAGEMENT INVESTMENT COMPANIES
Investment Company Act file number: (811- 02742 )
Exact name of registrant as specified in charter: Putnam Equity Income Fund
Address of principal executive offices: One Post Office Square, Boston, Massachusetts 02109
| Name and address of agent for service: | Beth S. Mazor, Vice President |
| One Post Office Square | |
| Boston, Massachusetts 02109 | |
| Copy to: | John W. Gerstmayr, Esq. |
| Ropes & Gray LLP | |
| One International Place | |
| Boston, Massachusetts 02110 | |
Registrant’s telephone number, including area code: (617) 292-1000
Date of fiscal year end: November 30, 2006
Date of reporting period: December 1, 2005—November 30, 2006
Item 1. Report to Stockholders:
The following is a copy of the report transmitted to stockholders pursuant to Rule 30e-1 under the Investment Company Act of 1940:
What makes
Putnam different?
A time-honored tradition in
money management
Since 1937, our values have been rooted in a profound sense of responsibility for the money entrusted to us.
A prudent approach to investing
We use a research-driven team approach to seek consistent, dependable, superior investment results over time, although there is no guarantee a fund will meet its objectives.
Funds for every investment goal
We offer a broad range of mutual funds and other financial products so investors and their financial representatives can build diversified portfolios.
A commitment to doing what’s right
for investors
We have below-average expenses and stringent investor protections, and provide a wealth of information about the Putnam funds.
Industry-leading service
We help investors, along with their financial representatives, make informed investment decisions with confidence.

In 1830, Massachusetts Supreme Judicial Court Justice Samuel Putnam established The Prudent Man Rule, a legal foundation for responsible money management.
THE PRUDENT MAN RULE
All that can be required of a trustee to invest is that he shall conduct himself faithfully and exercise a sound discretion. He is to observe how men of prudence, discretion, and intelligence manage their own affairs, not in regard to speculation, but in regard to the permanent disposition of their funds, considering the probable income, as well as the probable safety of the capital to be invested.

Putnam
Equity Income
Fund
11| 30| 06
Annual Report
| Message from the Trustees | 1 |
| About the fund | 2 |
| Report from the fund managers | 5 |
| Performance | 10 |
| Expenses | 12 |
| Portfolio turnover | 14 |
| Risk | 14 |
| Your fund’s management | 15 |
| Terms and definitions | 17 |
| Trustee approval of management contract | 18 |
| Other information for shareholders | 21 |
| Financial statements | 22 |
| Federal tax information | 38 |
| Brokerage commissions | 38 |
| About the Trustees | 39 |
| Officers | 43 |
Cover photograph: © White-Packert Photography
Message from the Trustees
Dear Fellow Shareholder:
Looking back on the last few months of 2006, it appears that certain sectors of the economy may have slowed somewhat. The impact of declines in the housing sector and slower auto sales has spread to suppliers, and cautious manufacturers have curtailed production as a result. We consequently consider slower job growth and perhaps a rise in the unemployment rate as possible developments for 2007. On the other hand, since the Federal Reserve (the Fed) stopped raising interest rates, financial markets have begun to adjust in a way that may help revive the economy. Stock prices have moved higher, bond yields have moved down, and the dollar has declined somewhat against foreign currencies. With the benefit of this financial cushion, the new year could also bring the potential for a renewed economic expansion.
We would like to take this opportunity to announce that a new independent Trustee, Kenneth R. Leibler, has joined your fund’s Board of Trustees. Mr. Leibler has had a distinguished career as a leader in the investment management industry. He is the founding Chairman of the Boston Options Exchange, the nation’s newest electronic marketplace for the trading of derivative securities. He currently serves as a Trustee of Beth Israel Deaconess Hospital in Boston; a lead director of Ruder Finn Group, a global communications and advertising firm; and a director of the Optimum Funds group.
We would also like to announce the retirement of one of your fund’s Trustees, John Mullin, an independent Trustee of the Putnam funds since 1997. We thank him for his service.
In the following pages, members of your fund’s management team discuss the fund’s performance and strategies for the fiscal period ended November 30, 2006, and provide their outlook for the months ahead. We thank you for your support of the Putnam funds in 2006 and extend our best wishes for a happy and prosperous 2007.
Respectfully yours,

Putnam Equity Income Fund:
seeking to harness the power of dividends

When a company is in a building phase, profits are generally reinvested in areas such as research or infrastructure. However, a large mature company that has progressed beyond the growth stage will often use a portion of its profits for dividends, paid directly to its shareholders. Putnam Equity Income Fund is composed stocks of large and midsize companies that pay dividends to their shareholders.
The issuance of dividends can be a positive indicator, often signaling that a company is profitable and has excess funds after its expenses are paid. It also represents management’s confidence in continued financial corporate health. Dividends can act as tangible evidence of a company’s ability and commitment to create shareholder value. In addition, dividends can also act as an incentive for investors to hold stock in a stable company that is not experiencing a great deal of growth.
Investors have historically turned to dividend-paying stocks for several reasons. They can offer a cash-in-hand return (versus future capital appreciation that may or may not occur), even in a bear market. They can also be reinvested, allowing an investor to take advantage of the power of compounding, which can serve as a valuable wealth-building benefit. In addition, should individual stocks decline in price, their dividend-paying counterparts can provide a cushion for portfolio returns, lessening the impact of other holdings’ losses. Dividend-paying stocks have traditionally played an important part in retirement planning by offering an income stream for investors on fixed incomes.
By targeting undervalued stocks of dividend-paying companies, Putnam Equity Income Fund’s management team seeks to construct a portfolio of stocks whose issuing companies are undervalued and poised for positive change. The goal is to uncover stocks that will appreciate in value as the market recognizes their long-term worth. From the universe of U.S. mid- and large-capitalization value stocks, the team, together with Putnam’s equity analysts, seeks companies that are not only well established with solid fundamentals, but that continue to find ways to grow and remain profitable — and offer above-average dividends or dividend growth potential.
This fund may invest a portion of its assets in small and/or midsize companies. Such investments increase the risk of greater price fluctuations. Value investing seeks underpriced stocks, but there is no guarantee that a stock’s price will rise.
In-depth analysis is key to
successful stock selection.
Drawing on the expertise of a dedicated team of stock analysts, the fund’s management team seeks attractive value stocks. Once a stock is selected for the portfolio, it is regularly assessed by members of the team to ensure that it continues to meet their criteria, including:
Valuation They carefully consider how each stock is valued, seeking stocks whose valuations are attractive relative to the company’s profit potential.
Change They focus on company fundamentals against the broader context of industry trends to identify whether individual companies possess a catalyst for positive change.
Quality They look for high-quality companies, seeking characteristics such as sound balance sheets, profitable business models, and competent management.
Dividends can bolster price appreciation
or help offset share price declines.

Putnam Equity Income Fund seeks to invest in undervalued stocks of mid- and large-cap companies that are poised to experience positive change that may improve financial performance. The fund targets stocks of mature companies that pay above-average dividend yields, and it may be appropriate for conservative investors who seek capital appreciation and current income.
Highlights
• For the 12 months ended November 30, 2006, Putnam Equity Income Fund’s class A shares returned 17.73% without sales charges.
• Over the same period, the fund’s benchmark, the Russell 1000 Value Index, returned 20.30% .
• The average return for the fund’s Lipper category, Equity Income Funds, was 17.02% .
• Additional fund performance, comparative performance, and Lipper data can be found in the performance section beginning on page 10.
Performance
Total return for class A shares for periods ended 11/30/06
Since the fund’s inception (6/15/77), average annual return is 11.15% at NAV and 10.95% at POP.
| Average annual return | Cumulative return | |||
| NAV | POP | NAV | POP | |
| 10 years | 9.31% | 8.72% | 143.55% | 130.71% |
| 5 years | 9.35 | 8.18 | 56.34 | 48.13 |
| 3 years | 13.82 | 11.80 | 47.46 | 39.74 |
| 1 year | 17.73 | 11.53 | 17.73 | 11.53 |
Data is historical. Past performance does not guarantee future results. More recent returns may be less or more than those shown. Investment return and principal value will fluctuate, and you may have a gain or a loss when you sell your shares. Performance assumes reinvestment of distributions and does not account for taxes. Returns at POP reflect a sales charge of 5.25% . For the most recent month-end performance, visit www.putnam.com. For a portion of the period, this fund limited expenses, without which returns would have been lower. A 1% short-term trading fee may apply.
4
Report from the fund managers
The year in review
Stock and bond indexes posted gains for the 12 months ended November 30, 2006. During the period, value stocks, which are the focus of your fund, enjoyed continued strong performance. Substantial gains from several key holdings enabled your fund to modestly outpace the average for its Lipper peer group. However, the fund’s underweight positions in real estate investment trusts (REITs) and certain communications services stocks contributed to its underperformance of the benchmark. We limited exposure to REITs because, in our view, they had become overvalued. Additionally, the fund did not own shares of BellSouth, a benchmark component when it appreciated sharply on news that the company would be acquired by rival AT&T. Both BellSouth’s and AT&T’s stock continued to gain value following the merger announcement as investors anticipated the synergies likely to result from the combination of these two powerful companies.
Market overview
A number of themes influenced financial markets during your fund’s 2006 fiscal year. Energy prices peaked at record high levels and then tumbled over the final months of the year. Commodities prices, in general, began to fall back as global inventories grew. The housing market continued to soften, and as a result, retailers in the housing-related industries suffered. Investors were somewhat wary of the uncertainties surrounding the instability in Iraq and the mid-term elections held in November. Because equity risk aversion had risen, stocks from sectors such as consumer staples, utilities, defense contractors, and REITs, which are generally considered defensive investments, continued to appreciate.
Around the globe, interest rates were on the rise. However, in the United States, the Fed has kept short-term interest rates steady at 5.25% since August, following 17 consecutive increases of a quarter point each. Economic growth in the United States appears to be decelerating, while inflation has remained largely in check. It is widely believed that the Fed’s next move will be to lower interest rates, although the timing of such a shift in monetary policy is not clear.
Market sector performance
These indexes provide an overview of performance in different market sectors for the 12 months ended 11/30/06.
| Equities | |
| Russell 1000 Value Index | |
| (large-company value stocks) | 20.30% |
| S&P 500 Index | |
| (broad stock market) | 14.23% |
| MSCI EAFE Index | |
| (international stocks) | 28.20% |
| Russell Midcap Growth Index | |
| (midsize-company growth stocks) | 12.88% |
| Bonds | |
| Lehman Government Bond Index | |
| (U.S. Treasury and agency securities) | 5.16% |
| JPMorgan Global High Yield Index | |
| (global high-yield corporate bonds) | 11.22% |
| Lehman Credit Index | |
| (corporate bonds) | 6.20% |
5
Financial markets produced positive returns, overall, for the year. Stocks outperformed bonds. International stocks outshone domestic stocks. Value stocks extended their lead over growth stocks, and investors continued to prefer mid-capitalization stocks to large caps.
Strategy overview
Your fund invests in a broadly diversified portfolio of undervalued large-capitalization stocks, targeting those we believe offer both attractive dividend income and the potential for long-term capital appreciation. We regularly review the criteria used to rank the stocks in the fund’s investment universe. In the last quarter of this fiscal year, we made some significant modifications in our stock-ranking model. Going forward, we will be placing greater emphasis on yield and redefining it to include not only dividend payouts but also shareholder-friendly actions such as share repurchases and debt retirement. Companies that take such steps are more likely to increase their long-term value for shareholders, in our opinion, and will rank higher in our revised model. Over time, we believe that the use of this revised model will help increase the portfolio’s value in terms of dividend income while maintaining its appreciation potential, and consequently, improve the fund’s relative performance. Since the change occurred late in the period, it had limited impact on performance for this fiscal year, but preliminary indications lead us to believe that it will prove valuable in fiscal 2007.
Typically, we focus our efforts on selecting individual stocks and we make only slight shifts in sector weightings in an effort to enhance absolute and relative returns. Relative to the benchmark index, the portfolio was somewhat overweighted in the technology, capital goods, health-care, and conglomerates sectors. By contrast, it was underweighted in the energy, consumer staples, financials, utilities, and communications services sectors.
During the period, the difference in valuations between traditional value stocks — stocks that are undervalued by the market but poised for positive change — and other stocks that we characterize as “growth at a reasonable price” (GARP) stocks was so small as to make GARP stocks a more suitable choice for the portfolio. As value managers, we have been able to buy GARP stocks without stepping outside our value-focused style. GARP stocks often have a slightly higher growth rate than value stocks, and company earnings tend to be less sensitive to cyclical downturns. For these reasons, GARP stocks tend to improve the quality of the portfolio. We continue to believe GARP stocks offer attractive investment characteristics in the near term.
Comparison of top industry weightings
This chart shows how the fund’s top weightings have changed over the last six months. Weightings are shown as a percentage of net assets. Holdings will vary over time.

6
Your fund’s holdings
Marathon Oil continued to be a top contributor to fund returns during the period. This diversified energy company searches for, extracts, refines, transports, and markets petroleum products. Marathon significantly increased its revenues and earnings during the period. It also executed fundamental improvements in production growth, and the management team is focused on providing shareholders with higher returns. As the share price appreciated, we trimmed the position somewhat to realize profits.
Lockheed Martin was also among the top-performing holdings for the period. This aerospace and defense contractor benefited from the U.S. government’s ongoing expenditures for national defense. We believe Lockheed’s management does a good job of handling cash flow to create long-term value for shareholders. In addition, the company has several advantages over its competitors, such as economies of scale, a more seasoned staff, and a more effective research and development effort. We trimmed the position by a small amount during the period to realize profits.
Goldman Sachs, which we consider a GARP stock rather than a traditional value stock, is Wall Street’s elite investment-banking firm as well as a highly regarded manager and broker of mutual funds. The company has also been successful reaping profits on its own investmentand trading portfolio. The stock has appreciated dramatically since mid-year and was among the largest contributors to the fund’s returns.
Inevitably, some holdings did not perform as well as we had hoped, and these included two other GARP stocks. Intel’s stock declined in value during the period. This company manufactures semiconductors and is known for its Pentium processors. It lost market share to Advanced Micro Devices, which was able to sell a more competitive product more cheaply. Intel introduced its newest technology too late in the product cycle, by which time many investors had lost faith and sold the stock. We trimmed the fund’s position a bit, but we believe there may be potential for a share price rally over time.
Stock of Capital One also detracted from portfolio returns. The credit card company recently purchased two relatively large banks, Hibernia and North Fork, in order to execute a new funding strategy. The share price dropped precipitously following these acquisitions, perhaps because of the company’s increased exposure to banking and interest margin risk. The stock no longer scored attractively under our revised stock-ranking model, so we have been reducing this position, although it is still overweight relative to the benchmark.
Top holdings
This table shows the fund’s top holdings, and the percentage of the fund’s net assets that each represented, as of 11/30/06. The fund’s holdings will change over time.
| Holding | Percent of fund’s net assets | Industry |
| Exxon Mobil Corp. | 5.1% | Oil and gas |
| Bank of America Corp. | 4.9% | Banking |
| Citigroup, Inc. | 4.9% | Financial |
| Verizon Communications, Inc. | 3.5% | Regional Bells |
| Pfizer, Inc. | 3.4% | Pharmaceuticals |
| Tyco International, Ltd. (Bermuda) | 2.8% | Conglomerates |
| IBM Corp. | 2.5% | Computers |
| Marathon Oil Corp. | 2.3% | Oil and gas |
| Allied Capital Corp. | 1.9% | Investment banking/brokerage |
| FirstEnergy Corp. | 1.9% | Electric utilities |
7
Another detractor from performance was the stock of Masco, a manufacturer of building materials and paints. The company ran into trouble when raw materials prices surged, and it was not able to pass these costs along to its customers. Subsequently, weakness in the housing market translated into weaker retail sales. The company’s management revised earnings estimates downward twice during the period, and the stock price fell. We have been trimming the position, in line with the stock’s lower ranking by our revised model, but still had an overweight position as of the end of the period. Finally, as noted previously, not owning BellSouth and AT&T at the time of the merger announcement hurt the fund’s relative performance.
Please note that the holdings discussed in this report may not have been held by the fund for the entire period. Portfolio composition is subject to review in accordance with the fund’s investment strategy and may vary in the future.
8
The outlook for your fund
The following commentary reflects anticipated developments that could affect your fund over the next six months, as well as your management team’s plans for responding to them.
In the past six months, inventories of oil and other commodities have been increasing. Going forward, we anticipate an inventory-driven price correction that may exert some influence over growth rates in the commodities market. The fund is positioned for a deceleration in this area. In addition, if the overall economy decelerates, the Fed will likely continue to weigh factors that support cutting interest rates. We will be vigilant in seeking opportunities to benefit from that transition. We are encouraged that even after a six-year run-up in value stocks, valuations do not appear to have reached a level that indicates it is time to sell value stocks.
We anticipate that we will continue to favor a broadly diversified portfolio of “GARP” stocks of large companies, as we discussed earlier, that offer attractive dividends. We continue to believe, as we have for four years, that larger-cap stocks offer better value than mid and smaller caps.
As always, your fund targets stocks of well-managed companies offering higher-than-average equity income. This type of stock is well represented in the fund’s portfolio, and we believe such stocks offer strong potential for attractive returns over time. We remain committed to helping you pursue your investment goals, and we believe the fund can serve as the core fund in a diversified portfolio.
The views expressed in this report are exclusively those of Putnam Management. They are not meant as investment advice.
The fund may invest a portion of its assets in small and/or midsize companies. Such investments increase the risk of greater price fluctuations. Value investing seeks underpriced stocks, but there is no guarantee that a stock’s price will rise.
9
Your fund’s performance
This section shows your fund’s performance for periods ended November 30, 2006, the end of its fiscal year. In accordance with regulatory requirements for mutual funds, we also include performance as of the most recent calendar quarter-end. Performance should always be considered in light of a fund’s investment strategy. Data represents past performance. Past performance does not guarantee future results. More recent returns may be less or more than those shown. Investment
return and principal value will fluctuate, and you may have a gain or a loss when you sell your shares. For the most recent month-end performance, please visit www.putnam.com or call Putnam at 1-800-225-1581. Class Y shares are generally only available to corporate and institutional clients. See the Terms and Definitions section in this report for definitions of the share classes offered by your fund.
Fund performance Total return for periods ended 11/30/06
| Class A | Class B | Class C | Class M | Class R | Class Y | |||||
| (inception dates) | (6/15/77) | (9/13/93) | (2/1/99) | (12/2/94) | (1/21/03) | (10/1/98) | ||||
| NAV | POP | NAV | CDSC | NAV | CDSC | NAV | POP | NAV | NAV | |
| Annual average | ||||||||||
| (life of fund) | 11.15% | 10.95% | 10.20% | 10.20% | 10.32% | 10.32% | 10.47% | 10.35% | 10.87% | 11.23% |
| 10 years | 143.55 | 130.71 | 125.94 | 125.94 | 126.06 | 126.06 | 131.81 | 124.34 | 137.63 | 148.56 |
| Annual average | 9.31 | 8.72 | 8.49 | 8.49 | 8.50 | 8.50 | 8.77 | 8.42 | 9.04 | 9.53 |
| 5 years | 56.34 | 48.13 | 50.61 | 48.61 | 50.68 | 50.68 | 52.56 | 47.58 | 54.44 | 58.35 |
| Annual average | 9.35 | 8.18 | 8.54 | 8.25 | 8.55 | 8.55 | 8.81 | 8.09 | 9.08 | 9.63 |
| 3 years | 47.46 | 39.74 | 44.30 | 41.29 | 44.29 | 44.29 | 45.29 | 40.61 | 46.36 | 48.64 |
| Annual average | 13.82 | 11.80 | 13.00 | 12.21 | 13.00 | 13.00 | 13.26 | 12.03 | 13.54 | 14.12 |
| 1 year | 17.73 | 11.53 | 16.86 | 11.86 | 16.90 | 15.90 | 17.15 | 13.32 | 17.38 | 18.01 |
Performance assumes reinvestment of distributions and does not account for taxes. Returns at public offering price (POP) for class A and M shares reflect a sales charge of 5.25% and 3.25%, respectively. Class B share returns reflect the applicable contingent deferred sales charge (CDSC), which is 5% in the first year, declining to 1% in the sixth year, and is eliminated thereafter. Class C shares reflect a 1% CDSC for the first year and is eliminated thereafter. Class R and Y shares have no initial sales charge or CDSC. Performance for class B, C, M, R, and Y shares before their inception is derived from the historical performance of class A shares, adjusted for the applicable sales charge (or CDSC) and, except for class Y shares, the higher operating expenses for such shares.
For a portion of the period, this fund limited expenses, without which returns would have been lower. A 1% short-term trading fee may be applied to shares exchanged or sold within 7 days of purchase.
Change in the value of a $10,000 investment ($9,475 after sales charge)
Cumulative total return from 11/30/96 to 11/30/06
![]()
Past performance does not indicate future results. At the end of the same time period, a $10,000 investment in the fund’s class B and class C shares would have been valued at $22,594 and $22,606, respectively, and no contingent deferred sales charges would apply. A $10,000 investment in the fund’s class M shares ($9,675 after sales charge) would have been valued at $22,434 at public offering price. A $10,000 investment in the fund’s class R and class Y shares would have been valued at $23,763 and $24,856, respectively.
10
Comparative index returns For periods ended 11/30/06
| Lipper Equity | ||
| Russell 1000 | Income Funds | |
| Value Index | category average* | |
| Annual average | ||
| (life of fund) | —† | 12.05% |
| 10 years | 174.13% | 129.28 |
| Annual average | 10.61 | 8.54 |
| 5 years | 67.64 | 51.81 |
| Annual average | 10.89 | 8.61 |
| 3 years | 58.30 | 47.74 |
| Annual average | 16.54 | 13.85 |
| 1 year | 20.30 | 17.02 |
Index and Lipper results should be compared to fund performance at net asset value.
* Over the 1-, 3-, 5-, and 10-year periods ended 11/30/06, there were 236, 175, 122, and 80 funds, respectively, in this Lipper category. † The inception date of the Russell 1000 Value Index was 12/31/78.
| Fund price and distribution information For the 12-month period ended 11/30/06 | ||||||||
| Distributions | Class A | Class B | Class C | Class M | Class R | Class Y | ||
| Number | 5 | 5 | 5 | 5 | 5 | 5 | ||
| Income | $0.262 | $0.128 | $0.133 | $0.175 | $0.222 | $0.305 | ||
| Capital gains | ||||||||
| Long-term | 1.738 | 1.738 | 1.738 | 1.738 | 1.738 | 1.738 | ||
| Short-term | 0.287 | 0.287 | 0.287 | 0.287 | 0.287 | 0.287 | ||
| Total | $2.287 | $2.153 | $2.158 | $2.200 | $2.247 | $2.330 | ||
| Share value: | NAV | POP | NAV | NAV | NAV | POP | NAV | NAV |
| 11/30/05 | $16.71 | $17.64 | $16.56 | $16.61 | $16.59 | $17.15 | $16.67 | $16.72 |
| 11/30/06 | 17.35 | 18.31 | 17.18 | 17.24 | 17.21 | 17.79 | 17.29 | 17.36 |
| Current return (end of period) | ||||||||
| Current dividend rate1 | 1.57% | 1.49% | 0.79% | 0.81% | 1.07% | 1.03% | 1.34% | 1.82% |
| Current 30-day SEC yield2 | 1.88 | 1.78 | 1.09 | 1.09 | 1.35 | 1.31 | 1.61 | 2.14 |
1 Most recent distribution, excluding capital gains, annualized and divided by NAV or POP at end of period. 2 Based only on investment income, calculated using SEC guidelines.
Fund performance as of most recent calendar quarter Total return for periods ended 12/31/06
| Class A | Class B | Class C | Class M | Class R | Class Y | |||||
| (inception dates) | (6/15/77) | (9/13/93) | (2/1/99) | (12/2/94) | (1/21/03) | (10/1/98) | ||||
| NAV | POP | NAV | CDSC | NAV | CDSC | NAV | POP | NAV | NAV | |
| Annual average | ||||||||||
| (life of fund) | 11.19% | 10.99% | 10.24% | 10.24% | 10.36% | 10.36% | 10.51% | 10.39% | 10.92% | 11.27% |
| 10 years | 150.25 | 137.06 | 132.23 | 132.23 | 132.28 | 132.28 | 138.13 | 130.37 | 144.17 | 155.39 |
| Annual average | 9.61 | 9.01 | 8.79 | 8.79 | 8.79 | 8.79 | 9.06 | 8.70 | 9.34 | 9.83 |
| 5 years | 55.99 | 47.75 | 50.25 | 48.25 | 50.22 | 50.22 | 52.18 | 47.24 | 54.14 | 57.90 |
| Annual average | 9.30 | 8.12 | 8.48 | 8.19 | 8.48 | 8.48 | 8.76 | 8.05 | 9.04 | 9.57 |
| 3 years | 41.41 | 34.00 | 38.29 | 35.29 | 38.23 | 38.23 | 39.27 | 34.71 | 40.34 | 42.44 |
| Annual average | 12.24 | 10.25 | 11.41 | 10.60 | 11.40 | 11.40 | 11.67 | 10.44 | 11.96 | 12.52 |
| 1 year | 19.27 | 13.00 | 18.47 | 13.47 | 18.37 | 17.37 | 18.69 | 14.83 | 19.01 | 19.56 |
11
Your fund’s expenses
As a mutual fund investor, you pay ongoing expenses, such as management fees, distribution fees (12b-1 fees), and other expenses. In the most recent six-month period, your fund limited these expenses; had it not done so, expenses would have been higher. Using the information below, you can estimate how these expenses affect your investment and compare them with the expenses of other funds. You may also pay one-time transaction expenses, including sales charges (loads) and redemption fees, which are not shown in this section and would have resulted in higher total expenses. For more information, see your fund’s prospectus or talk to your financial advisor.
Review your fund’s expenses
The table below shows the expenses you would have paid on a $1,000 investment in Putnam Equity Income Fund from June 1, 2006, to November 30, 2006. It also shows how much a $1,000 investment would be worth at the close of the period, assuming actual returns and expenses.
| Class A | Class B | Class C | Class M | Class R | Class Y | |
| Expenses paid per $1,000* | $ 5.16 | $ 9.14 | $ 9.14 | $ 7.82 | $ 6.49 | $ 3.84 |
| Ending value (after expenses) | $1,123.70 | $1,119.80 | $1,120.20 | $1,121.20 | $1,122.10 | $1,125.70 |
* Expenses for each share class are calculated using the fund’s annualized expense ratio for each class, which represents the ongoing expenses as a percentage of average net assets for the six months ended 11/30/06. The expense ratio may differ for each share class (see the last table in this section). Expenses are calculated by multiplying the expense ratio by the average account value for the period; then multiplying the result by the number of days in the period; and then dividing that result by the number of days in the year. Does not reflect the effect of a non-recurring reimbursement by Putnam. If this amount had been reflected in the table above, expenses for each share class would have been lower.
Estimate the expenses you paid
To estimate the ongoing expenses you paid for the six months ended November 30, 2006, use the calculation method below. To find the value of your investment on June 1, 2006, go to www.putnam.com and log on to your account. Click on the “Transaction History” tab in your Daily Statement and enter 06/01/2006 in both the “from” and “to” fields. Alternatively, call Putnam at 1-800-225-1581.

Compare expenses using the SEC’s method
The Securities and Exchange Commission (SEC) has established guidelines to help investors assess fund expenses. Per these guidelines, the table below shows your fund’s expenses based on a $1,000 investment, assuming a hypothetical 5% annualized return. You can use this information to compare the ongoing expenses (but not transaction expenses or total costs) of investing in the fund with those of other funds. All mutual fund shareholder reports will provide this information to help you make this comparison. Please note that you cannot use this information to estimate your actual ending account balance and expenses paid during the period.
| Class A | Class B | Class C | Class M | Class R | Class Y | |
| Expenses paid per $1,000* | $ 4.91 | $ 8.69 | $ 8.69 | $ 7.44 | $ 6.17 | $ 3.65 |
| Ending value (after expenses) | $1,020.21 | $1,016.44 | $1,016.44 | $1,017.70 | $1,018.95 | $1,021.46 |
* Expenses for each share class are calculated using the fund’s annualized expense ratio for each class, which represents the ongoing expenses as a percentage of average net assets for the six months ended 11/30/06. The expense ratio may differ for each share class (see the last table in this section). Expenses are calculated by multiplying the expense ratio by the average account value for the period; then multiplying the result by the number of days in the period; and then dividing that result by the number of days in the year. Does not reflect the effect of a non-recurring reimbursement by Putnam. If this amount had been reflected in the table above, expenses for each share class would have been lower.
12
Compare expenses using industry averages
You can also compare your fund’s expenses with the average of its peer group, as defined by Lipper, an independent fund-rating agency that ranks funds relative to others that Lipper considers to have similar investment styles or objectives. The expense ratio for each share class shown below indicates how much of your fund’s average net assets have been used to pay ongoing expenses during the period.
| Class A | Class B | Class C | Class M | Class R | Class Y | |
| Your fund’s annualized expense ratio* | 0.97% | 1.72% | 1.72% | 1.47% | 1.22% | 0.72% |
| Average annualized expense ratio for Lipper peer group† | 1.17% | 1.92% | 1.92% | 1.67% | 1.42% | 0.92% |
* For the fund’s most recent fiscal half year; may differ from expense ratios based on one-year data in the financial highlights. Does not reflect the effect of a non-recurring reimbursement by Putnam. If this amount had been reflected in the table above, the expense ratio for each share class would have been lower.
† Simple average of the expenses of all front-end load funds in the fund’s Lipper peer group, calculated in accordance with Lipper’s standard method for comparing fund expenses (excluding 12b-1 fees and without giving effect to any expense offset and brokerage service arrangements that may reduce fund expenses). This average reflects each fund’s expenses for its most recent fiscal year available to Lipper as of 9/30/06. To facilitate comparison, Putnam has adjusted this average to reflect the 12b-1 fees carried by each class of shares. The peer group may include funds that are significantly smaller or larger than the fund, which may limit the comparability of the fund’s expenses to the simple average, which typically is higher than the asset-weighted average.
13
Your fund’s portfolio turnover
and Morningstar® Risk
Putnam funds are actively managed by teams of experts who buy and sell securities based on intensive analysis of companies, industries, economies, and markets. Portfolio turnover is a measure of how often a fund’s managers buy and sell securities for your fund. A portfolio turnover of 100%, for example, means that the managers sold and replaced securities valued at 100% of a fund’s assets within a one-year period. Funds with high turnover may be more likely to generate capital gains and dividends that must be distributed to shareholders as taxable income. High turnover may also cause a fund to pay more brokerage commissions and other transaction costs, which may detract from performance.
Turnover comparisons
Percentage of holdings that change every year
| 2006 | 2005 | 2004 | 2003 | 2002 | |
| Putnam Equity Income Fund | 77% | 52% | 46% | 65% | 59%* |
| Lipper Equity Income Funds category average | 43% | 45% | 46% | 51% | 53% |
Turnover data for the fund is calculated based on the fund’s fiscal-year period, which ends on November 30. Turnover data for the fund’s Lipper category is calculated based on the average of the turnover of each fund in the category for its fiscal year ended during the indicated year. Fiscal years vary across funds in the Lipper category, which may limit the comparability of the fund’s portfolio turnover rate to the Lipper average. Comparative data for 2006 is based on information available as of 11/30/06.
* Portfolio turnover excludes certain Treasury note transactions executed in connection with a short-term trading strategy.
Your fund’s Morningstar® Risk
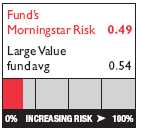
This risk comparison is designed to help you understand how your fund compares with other funds. The comparison utilizes a risk measure developed by Morningstar, an independent fund-rating agency. This risk measure is referred to as the fund’s Morningstar Risk.
Your fund’s Morningstar Risk is shown alongside that of the average fund in its Morningstar category. The risk bar broadens the comparison by translating the fund’s Morningstar Risk into a percentile, which is based on the fund’s ranking among all funds rated by Morningstar as of December 31, 2006. A higher Morningstar Risk generally indicates that a fund’s monthly returns have varied more widely.
Morningstar determines a fund’s Morningstar Risk by assessing variations in the fund’s monthly returns — with an emphasis on downside variations — over a 3-year period, if available. Those measures are weighted and averaged to produce the fund’s Morningstar Risk. The information shown is provided for the fund’s class A shares only; information for other classes may vary. Morningstar Risk is based on historical data and does not indicate future results. Morningstar does not purport to measure the risk associated with a current investment in a fund, either on an absolute basis or on a relative basis. Low Morningstar Risk does not mean that you cannot lose money on an investment in a fund. Copyright 2007 Morningstar, Inc. All Rights Reserved. The information contained herein (1) is proprietary to Morningstar and/or its content providers; (2) may not be copied or distributed; and (3) is not warranted to be accurate, complete, or timely. Nei ther Morningstar nor its content providers are responsible for any damages or losses arising from any use of this information.
14
Your fund’s management
Your fund is managed by the members of the Putnam Large-Cap Value and Core Fixed-Income teams. Bartlett Geer is the Portfolio Leader and Kevin Cronin and Austin Kairnes are Portfolio Members of your fund. The Portfolio Leader and Portfolio Members coordinate the teams’ management of the fund.
For a complete listing of the members of the Putnam Large-Cap Value and Core Fixed-Income teams, including those who are not Portfolio Leaders or Portfolio Members of your fund, visit Putnam’s Individual Investor Web site at www.putnam.com.
Investment team fund ownership
The table below shows how much the fund’s current Portfolio Leader and Portfolio Members have invested in the fund and in all Putnam mutual funds (in dollar ranges). Information shown is as of November 30, 2006, and November 30, 2005.

N/A indicates the individual was not a Portfolio Leader or Portfolio Member as of 11/30/05.
Trustee and Putnam employee fund ownership
As of November 30, 2006, all of the Trustees on the Board of the Putnam funds owned fund shares. The table below shows the approximate value of investments in the fund and all Putnam funds as of that date by the Trustees and Putnam employees. These amounts include investments by the Trustees’ and employees’ immediate family members and investments through retirement and deferred compensation plans.
| Total assets in | ||
| Assets in the fund | all Putnam funds | |
| Trustees | $ 689,000 | $ 93,000,000 |
| Putnam employees | $11,815,000 | $437,000,000 |
Fund manager compensation
The total 2005 fund manager compensation that is attributable to your fund is approximately $2,500,000. This amount includes a portion of 2005 compensation paid by Putnam Management to the fund managers listed in this section for their portfolio management responsibilities, calculated based on the fund assets they manage taken as a percentage of the total assets they manage. The compensation amount also includes a portion of the 2005 compensation paid to the Chief Investment Officer of the team and the Group Chief Investment Officers of the fund’s broader investment categories for their oversight responsibilities, calculated based on the fund assets they oversee taken as a percentage of the total assets they oversee. This amount does not include compensation of other personnel involved in research, trading, administration, systems, compliance, or fund operations; nor does it include non-compensation costs. These percentages a re determined as of the fund’s fiscal period-end. For personnel who joined Putnam Management during or after 2005, the calculation reflects annualized 2005 compensation or an estimate of 2006 compensation, as applicable.
15
Other Putnam funds managed by the Portfolio Leader and Portfolio Members
Kevin Cronin is also a Portfolio Leader of Putnam American Government Income Fund, Putnam Global Income Trust, Putnam Income Fund, Putnam Limited Duration Government Income Fund, and Putnam U.S. Government Income Trust.
Bartlett Geer, Kevin Cronin, and Austin Kairnes may also manage other accounts and variable trust funds advised by Putnam Management or an affiliate.
Changes in your fund’s Portfolio Leader and Portfolio Members
During the year ended November 30, 2006, Austin Kairnes became a Portfolio Member of your fund. Coincident with this appointment, Jeanne Mockard was removed as a Portfolio Member from the fund, but continues in her other fund management roles at Putnam.
Putnam fund ownership by Putnam’s Executive Board
The table below shows how much the members of Putnam’s Executive Board have invested in all Putnam mutual funds (in dollar ranges). Information shown is as of November 30, 2006, and November 30, 2005.
| $1 – | $10,001 – | $50,001 – | $100,001 – | $500,001 – | $1,000,001 | |||
| Year | $0 | $10,000 | $50,000 | $100,000 | $500,000 | $1,000,000 | and over | |
| Philippe Bibi | 2006 | • | ||||||
| Chief Technology Officer | 2005 | • | ||||||
| Joshua Brooks | 2006 | • | ||||||
| Deputy Head of Investments | 2005 | • | ||||||
| William Connolly | 2006 | • | ||||||
| Head of Retail Management | 2005 | • | ||||||
| Kevin Cronin | 2006 | • | ||||||
| Head of Investments | 2005 | • | ||||||
| Charles Haldeman, Jr. | 2006 | • | ||||||
| President and CEO | 2005 | • | ||||||
| Amrit Kanwal | 2006 | • | ||||||
| Chief Financial Officer | 2005 | • | ||||||
| Steven Krichmar | 2006 | • | ||||||
| Chief of Operations | 2005 | • | ||||||
| Francis McNamara, III | 2006 | • | ||||||
| General Counsel | 2005 | • | ||||||
| Jeffrey Peters | 2006 | • | ||||||
| Head of International Business | N/A | |||||||
| Richard Robie, III | 2006 | • | ||||||
| Chief Administrative Officer | 2005 | • | ||||||
| Edward Shadek | 2006 | • | ||||||
| Deputy Head of Investments | 2005 | • | ||||||
| Sandra Whiston | 2006 | • | ||||||
| Head of Institutional Management | 2005 | • | ||||||
N/A indicates the individual was not a member of Putnam’s Executive Board as of 11/30/05.
16
Terms and definitions
Important terms
Total return shows how the value of the fund’s shares changed over time, assuming you held the shares through the entire period and reinvested all distributions in the fund.
Net asset value (NAV) is the price, or value, of one share of a mutual fund, without a sales charge. NAVs fluctuate with market conditions. NAV is calculated by dividing the net assets of each class of shares by the number of outstanding shares in the class.
Public offering price (POP) is the price of a mutual fund share plus the maximum sales charge levied at the time of purchase. POP performance figures shown here assume the 5.25% maximum sales charge for class A shares and 3.25% for class M shares.
Contingent deferred sales charge (CDSC) is generally a charge applied at the time of the redemption of class B or C shares and assumes redemption at the end of the period. Your fund’s class B CDSC declines from a 5% maximum during the first year to 1% during the sixth year. After the sixth year, the CDSC no longer applies. The CDSC for class C shares is 1% for one year after purchase.
Share classes
Class A shares are generally subject to an initial sales charge and no CDSC (except on certain redemptions of shares bought without an initial sales charge).
Class B shares are not subject to an initial sales charge. They may be subject to a CDSC.
Class C shares are not subject to an initial sales charge and are subject to a CDSC only if the shares are redeemed during the first year.
Class M shares have a lower initial sales charge and a higher 12b-1 fee than class A shares and no CDSC (except on certain redemptions of shares bought without an initial sales charge).
Class R shares are not subject to an initial sales charge or CDSC and are available only to certain defined contribution plans. Class Y shares are not subject to an initial sales charge or CDSC, and carry no 12b-1 fee. They are only available to eligible purchasers, including eligible defined contribution plans or corporate IRAs.
Comparative indexes
JPMorgan Global High Yield Index is an unmanaged index of global high-yield fixed-income securities.
Lehman Credit Index is an unmanaged index of investment-grade corporate bonds.
Lehman Government Bond Index is an unmanaged index of U.S. Treasury and agency securities.
Morgan Stanley Capital International (MSCI) EAFE Index is an unmanaged index of equity securities from developed countries in Western Europe, the Far East, and Australasia.
Russell 1000 Value Index is an unmanaged index of those companies in the large-cap Russell 1000 Index chosen for their value orientation.
Russell Midcap Growth Index is an unmanaged index of those companies in the Russell Midcap Index chosen for their growth orientation.
S&P 500 Index is an unmanaged index of common stock performance.
Indexes assume reinvestment of all distributions and do not account for fees. Securities and performance of a fund and an index will differ. You cannot invest directly in an index.
Lipper is a third-party industry-ranking entity that ranks mutual funds. Its rankings do not reflect sales charges. Lipper rankings are based on total return at net asset value relative to other funds that have similar current investment styles or objectives as determined by Lipper. Lipper may change a fund’s category assignment at its discretion. Lipper category averages reflect performance trends for funds within a category.
17
Trustee approval
of management contract
General conclusions
The Board of Trustees of the Putnam funds oversees the management of each fund and, as required by law, determines annually whether to approve the continuance of your fund’s management contract with Putnam Management. In this regard, the Board of Trustees, with the assistance of its Contract Committee consisting solely of Trustees who are not “interested persons” (as such term is defined in the Investment Company Act of 1940, as amended) of the Putnam funds (the “Independent Trustees”), requests and evaluates all information it deems reasonably necessary under the circumstances. Over the course of several months ending in June 2006, the Contract Committee met four times to consider the information provided by Putnam Management and other information developed with the assistance of the Board’s independent counsel and independent staff. The Contract Committee reviewed and discussed key aspects of this information with all of the Independe nt Trustees. Upon completion of this review, the Contract Committee recommended, and the Independent Trustees approved, the continuance of your fund’s management contract, effective July 1, 2006.
This approval was based on the following conclusions:
• That the fee schedule in effect for your fund represents reasonable compensation in light of the nature and quality of the services being provided to the fund, the fees paid by competitive funds and the costs incurred by Putnam Management in providing such services, and
• That such fee schedule represents an appropriate sharing between fund shareholders and Putnam Management of such economies of scale as may exist in the management of the fund at current asset levels.
These conclusions were based on a comprehensive consideration of all information provided to the Trustees and were not the result of any single factor. Some of the factors that figured particularly in the Trustees’ deliberations and how the Trustees considered these factors are described below, although individual Trustees may have evaluated the information presented differently, giving different weights to various factors. It is also important to recognize that the fee arrangements for your fund and the other Putnam funds are the result of many years of review and discussion between the Independent Trustees and Putnam Management, that certain aspects of such arrangements may receive greater scrutiny in some years than others, and that the Trustees’ conclusions may be based, in part, on their consideration of these same arrangements in prior years.
Management fee schedules and categories; total expenses
The Trustees reviewed the management fee schedules in effect for all Putnam funds, including fee levels and breakpoints, and the assignment of funds to particular fee categories. In reviewing fees and expenses, the Trustees generally focused their attention on material changes in circumstances — for example, changes in a fund’s size or investment style, changes in Putnam Management’s operating costs, or changes in competitive practices in the mutual fund industry — that suggest that consideration of fee changes might be warranted. The Trustees concluded that the circumstances did not warrant changes to the management fee structure of your fund, which had been carefully developed over the years, re-examined on many occasions and adjusted where appropriate. The Trustees focused on two areas of particular interest, as discussed further below:
• Competitiveness. The Trustees reviewed comparative fee and expense information for competitive funds, which indicated that, in a custom peer group of competitive funds selected by Lipper Inc., your fund ranked in the 10th percentile in management fees and in the 10th percentile in total expenses (less any applicable 12b-1 fees) as of December 31, 2005 (the first percentile being the least expensive funds and the 100th percentile being the most expensive funds). (Because the fund’s custom peer group is smaller than the fund’s broad Lipper Inc. peer group, this expense information may differ from the Lipper peer expense information found elsewhere in this report.) The Trustees noted that expense ratios for a number of Putnam funds, which show the percentage of fund assets used to pay for management and administrative services, distribution (12b- 1) fees and other expenses, had been increasing recently as a result of declining net assets and the natural operation of fee breakpoints.
The Trustees noted that the expense ratio increases described above were currently being controlled by expense limitations implemented in January 2004 and which Putnam Management, in consultation with the Contract Committee, has committed to maintain at least through 2007. These expense limitations give effect to a commitment by Putnam Management that the expense ratio of each open-end fund would be no higher than the average expense ratio of the competitive funds included in
18
the fund’s relevant Lipper universe (exclusive of any applicable 12b-1 charges in each case). The Trustees observed that this commitment to limit fund expenses has served shareholders well since its inception. In order to ensure that the expenses of the Putnam funds continue to meet evolving competitive standards, the Trustees requested, and Putnam Management agreed, to implement an additional expense limitation for certain funds for the twelve months beginning January 1, 2007 equal to the average expense ratio (exclusive of 12b-1 charges) of a custom peer group of competitive funds selected by Lipper based on the size of the fund. This additional expense limitation will be applied to those open-end funds that had above-average expense ratios (exclusive of 12b-1 charges) based on the Lipper custom peer group data for the period ended December 31, 2005. This additional expense limitation will not be applied to your fund.
• Economies of scale. Your fund currently has the benefit of breakpoints in its management fee that provide shareholders with significant economies of scale, which means that the effective management fee rate of a fund (as a percentage of fund assets) declines as a fund grows in size and crosses specified asset thresholds. Conversely, as a fund shrinks in size — as has been the case for many Putnam funds in recent years — these breakpoints result in increasing fee levels. In recent years, the Trustees have examined the operation of the existing breakpoint structure during periods of both growth and decline in asset levels. The Trustees concluded that the fee schedules in effect for the funds represented an appropriate sharing of economies of scale at current asset levels. In reaching this conclusion, the Trustees considered the Contract Committe e’s stated intent to continue to work with Putnam Management to plan for an eventual resumption in the growth of assets, including a study of potential economies that might be produced under various growth assumptions.
In connection with their review of the management fees and total expenses of the Putnam funds, the Trustees also reviewed the costs of the services to be provided and profits to be realized by Putnam Management and its affiliates from the relationship with the funds. This information included trends in revenues, expenses and profitability of Putnam Management and its affiliates relating to the investment management and distribution services provided to the funds. In this regard, the Trustees also reviewed an analysis of Putnam Management’s revenues, expenses and profitability with respect to the funds’ management contracts, allocated on a fund-by-fund basis. Because many of the costs incurred by Putnam Management in managing the funds are not readily identifiable to particular funds, the Trustees observed that the methodology for allocating costs is an important factor in evaluating Putnam Management’s costs and profitability, both as to the Putnam fu nds in the aggregate and as to individual funds. The Trustees reviewed Putnam Management’s cost allocation methodology with the assistance of independent consultants and concluded that this methodology was reasonable and well-considered.
Investment performance
The quality of the investment process provided by Putnam Management represented a major factor in the Trustees’ evaluation of the quality of services provided by Putnam Management under your fund’s management contract. The Trustees were assisted in their review of the Putnam funds’ investment process and performance by the work of the Investment Process Committee of the Trustees and the Investment Oversight Committee of the Trustees, which meet on a regular monthly basis with the funds’ portfolio teams throughout the year. The Trustees concluded that Putnam Management generally provides a high-quality investment process — as measured by the experience and skills of the individuals assigned to the management of fund portfolios, the resources made available to such personnel, and in general the ability of Putnam Management to attract and retain high-quality personnel — but also recognize that this does not guarantee favorable investment r esults for every fund in every time period. The Trustees considered the investment performance of each fund over multiple time periods and considered information comparing each fund’s performance with various benchmarks and with the performance of competitive funds.
The Trustees noted the satisfactory investment performance of many Putnam funds. They also noted the disappointing investment performance of certain funds in recent years and discussed with senior management of Putnam Management the factors contributing to such underperformance and actions being taken to improve performance. The Trustees recognized that, in recent years, Putnam Management has made significant changes in its investment personnel and processes and in the fund product line to address areas of underperformance. In particular, they noted the important contributions of Putnam Management’s leadership in attracting, retaining and supporting high-quality investment professionals and in systematically implementing an investment process that seeks to merge the best features of fundamental and quantitative analysis. The Trustees indicated their intention to
19
continue to monitor performance trends to assess the effectiveness of these changes and to evaluate whether additional changes to address areas of underperformance are warranted.
In the case of your fund, the Trustees considered that your fund’s class A share cumulative total return performance at net asset value was in the following percentiles of its Lipper Inc. peer group (Lipper Equity Income Funds) for the one-, three- and five-year periods ended March 31, 2006 (the first percentile being the best performing funds and the 100th percentile being the worst performing funds):
| One-year period | Three-year period | Five-year period |
| 59th | 44th | 27th |
(Because of the passage of time, these performance results may differ from the performance results for more recent periods shown elsewhere in this report. Over the one-, three- and five-year periods ended March 31, 2006, there were 223, 156, and 126 funds, respectively, in your fund’s Lipper peer group.* Past performance is no guarantee of future performance.)
As a general matter, the Trustees concluded that cooperative efforts between the Trustees and Putnam Management represent the most effective way to address investment performance problems. The Trustees noted that investors in the Putnam funds have, in effect, placed their trust in the Putnam organization, under the oversight of the funds’ Trustees, to make appropriate decisions regarding the management of the funds. Based on the responsiveness of Putnam Management in the recent past to Trustee concerns about investment performance, the Trustees concluded that it is preferable to seek change within Putnam Management to address performance shortcomings. In the Trustees’ view, the alternative of terminating a management contract and engaging a new investment adviser for an underperforming fund would entail significant disruptions and would not provide any greater assurance of improved investment performance.
Brokerage and soft-dollar allocations; other benefits
The Trustees considered various potential benefits that Putnam Management may receive in connection with the services it provides under the management contract with your fund. These include benefits related to brokerage and soft-dollar allocations, whereby a portion of the commissions paid by a fund for brokerage may be used to acquire research services that may be useful to Putnam Management in managing the assets of the fund and of other clients. The Trustees indicated their continued intent to monitor the potential benefits associated with the allocation of fund brokerage to ensure that the principle of seeking “best price and execution” remains paramount in the portfolio trading process.
The Trustees’ annual review of your fund’s management contract also included the review of its distributor’s contract and distribution plan with Putnam Retail Management Limited Partnership and the custodian agreement and investor servicing agreement with Putnam Fiduciary Trust Company, all of which provide benefits to affiliates of Putnam Management.
Comparison of retail and institutional fee schedules
The information examined by the Trustees as part of their annual contract review has included for many years information regarding fees charged by Putnam Management and its affiliates to institutional clients such as defined benefit pension plans, college endowments, etc. This information included comparison of such fees with fees charged to the funds, as well as a detailed assessment of the differences in the services provided to these two types of clients. The Trustees observed, in this regard, that the differences in fee rates between institutional clients and the mutual funds are by no means uniform when examined by individual asset sectors, suggesting that differences in the pricing of investment management services to these types of clients reflect to a substantial degree historical competitive forces operating in separate market places. The Trustees considered the fact that fee rates across all asset sectors are higher on a verage for mutual funds than for institutional clients, as well as the differences between the services that Putnam Management provides to the Putnam funds and those that it provides to institutional clients of the firm, but did not rely on such comparisons to any significant extent in concluding that the management fees paid by your fund are reasonable.
* The percentile rankings for your fund’s class A share annualized total return performance in the Lipper Equity Income Funds category for the one-, five- and ten-year periods ended December 31, 2006, were 40%, 27%, and 36%, respectively. Over the one-, five- and ten-year periods ended December 31, 2006, the fund ranked 95 out of 237, 34 out of 127, and 29 out of 80 funds, respectively. Note that this more recent information was not available when the Trustees approved the continuance of your fund’s management contract.
20
Other information for shareholders
Putnam’s policy on confidentiality
In order to conduct business with our shareholders, we must obtain certain personal information such as account holders’ addresses, telephone numbers, Social Security numbers, and the names of their financial advisors. We use this information to assign an account number and to help us maintain accurate records of transactions and account balances. It is our policy to protect the confidentiality of your information, whether or not you currently own shares of our funds, and in particular, not to sell information about you or your accounts to outside marketing firms. We have safeguards in place designed to prevent unauthorized access to our computer systems and procedures to protect personal information from unauthorized use. Under certain circumstances, we share this information with outside vendors who provide services to us, such as mailing and proxy solicitation. In those cases, the service providers enter into confidentiali ty agreements with us, and we provide only the information necessary to process transactions and perform other services related to your account. We may also share this information with our Putnam affiliates to service your account or provide you with information about other Putnam products or services. It is also our policy to share account information with your financial advisor, if you’ve listed one on your Putnam account. If you would like clarification about our confidentiality policies or have any questions or concerns, please don’t hesitate to contact us at 1-800-225-1581, Monday through Friday, 8:30 a.m. to 7:00 p.m., or Saturdays from 9:00 a.m. to 5:00 p.m. Eastern Time.
Proxy voting
Putnam is committed to managing our mutual funds in the best interests of our shareholders. The Putnam funds’ proxy voting guidelines and procedures, as well as information regarding how your fund voted proxies relating to portfolio securities during the 12-month period ended June 30, 2006, are available on the Putnam Individual Investor Web site, www.putnam.com/individual, and on the SEC’s Web site, www.sec.gov. If you have questions about finding forms on the SEC’s Web site, you may call the SEC at 1-800-SEC-0330. You may also obtain the Putnam funds’ proxy voting guidelines and procedures at no charge by calling Putnam’s Shareholder Services at 1-800-225-1581.
Fund portfolio holdings
The fund will file a complete schedule of its portfolio holdings with the SEC for the first and third quarters of each fiscal year on Form N-Q. Shareholders may obtain the fund’s Forms N-Q on the SEC’s Web site at www.sec.gov. In addition, the fund’s Forms N-Q may be reviewed and copied at the SEC’s Public Reference Room in Washington, D.C. You may call the SEC at 1-800-SEC-0330 for information about the SEC’s Web site or the operation of the Public Reference Room.
21
Financial statements
These sections of the report, as well as the accompanying Notes, preceded by the Report of Independent Registered Public Accounting Firm, constitute the fund’s financial statements.
The fund’s portfolio lists all the fund’s investments and their values as of the last day of the reporting period. Holdings are organized by asset type and industry sector, country, or state to show areas of concentration and diversification.
Statement of assets and liabilities shows how the fund’s net assets and share price are determined. All investment and non-investment assets are added together. Any unpaid expenses and other liabilities are subtracted from this total. The result is divided by the number of shares to determine the net asset value per share, which is calculated separately for each class of shares. (For funds with preferred shares, the amount subtracted from total assets includes the liquidation preference of preferred shares.)
Statement of operations shows the fund’s net investment gain or loss. This is done by first adding up all the fund’s earnings — from dividends and interest income — and subtracting its operating expenses to determine net investment income (or loss). Then, any net gain or loss the fund realized on the sales of its holdings — as well as any unrealized gains or losses over the period — is added to or subtracted from the net investment result to determine the fund’s net gain or loss for the fiscal year.
Statement of changes in net assets shows how the fund’s net assets were affected by the fund’s net investment gain or loss, by distributions to shareholders, and by changes in the number of the fund’s shares. It lists distributions and their sources (net investment income or realized capital gains) over the current reporting period and the most recent fiscal year-end. The distributions listed here may not match the sources listed in the Statement of operations because the distributions are determined on a tax basis and may be paid in a different period from the one in which they were earned.
Financial highlights provide an overview of the fund’s investment results, per-share distributions, expense ratios, net investment income ratios, and portfolio turnover in one summary table, reflecting the five most recent reporting periods. In a semiannual report, the highlight table also includes the current reporting period.
22
Report of Independent Registered Public Accounting Firm
The Board of Trustees and Shareholders
Putnam Equity Income Fund:
We have audited the accompanying statement of assets and liabilities of Putnam Equity Income Fund, including the fund’s portfolio, as of November 30, 2006, and the related statement of operations for the year then ended, the statements of changes in net assets for each of the two years in the period then ended and the financial highlights for each of the five years or periods in the period then ended. These financial statements and financial highlights are the responsibility of the fund’s management. Our responsibility is to express an opinion on these financial statements and financial highlights based on our audits.
We conducted our audits in accordance with the standards of the Public Company Accounting Oversight Board (United States). Those standards require that we plan and perform our audit to obtain reasonable assurance about whether the financial statements and financial highlights are free of material misstatement. An audit includes examining, on a test basis, evidence supporting the amounts and disclosures in the financial statements. Our procedures included confirmation of securities owned as of November 30, 2006 by correspondence with the custodian and brokers or by other appropriate auditing procedures. An audit also includes assessing the accounting principles used and significant estimates made by management, as well as evaluating the overall financial statement presentation. We believe that our audits provide a reasonable basis for our opinion.
In our opinion, the financial statements and financial highlights referred to above present fairly, in all material respects, the financial position of Putnam Equity Income Fund as of November 30, 2006, the results of its operations for the year then ended, the changes in its net assets for each of the two years in the period then ended, and the financial highlights for each of the five years or periods in the period then ended, in conformity with U.S. generally accepted accounting principles.

Boston, Massachusetts
January 11, 2007
23
| The fund’s portfolio 11/30/06 | |||
| COMMON STOCKS (95.7%)* | |||
| Shares | Value | ||
| Aerospace and Defense (1.8%) | |||
| L-3 Communications Holdings, Inc. | 254,300 | $ | 20,916,175 |
| Lockheed Martin Corp. | 260,900 | 23,598,405 | |
| Raytheon Co. | 442,000 | 22,559,680 | |
| 67,074,260 | |||
| Banking (7.9%) | |||
| Bank of America Corp. | 3,461,100 | 186,380,235 | |
| PNC Financial Services Group | 399,100 | 28,212,379 | |
| U.S. Bancorp | 1,199,600 | 40,354,544 | |
| Washington Mutual, Inc. (S) | 1,029,700 | 44,977,296 | |
| 299,924,454 | |||
| Beverage (1.0%) | |||
| Coca-Cola Enterprises, Inc. | 586,900 | 12,002,105 | |
| Molson Coors Brewing Co. Class B | 241,200 | 17,144,496 | |
| Pepsi Bottling Group, Inc. (The) | 215,800 | 6,758,856 | |
| 35,905,457 | |||
| Broadcasting (0.2%) | |||
| Clear Channel Communications, Inc. | 215,800 | 7,587,528 | |
| Building Materials (3.3%) | |||
| Masco Corp. (S) | 2,058,600 | 59,061,234 | |
| Sherwin-Williams Co. (The) (S) | 1,023,200 | 64,001,160 | |
| 123,062,394 | |||
| Capital Goods (0.2%) | |||
| Eaton Corp. | 98,500 | 7,592,380 | |
| Chemicals (2.6%) | |||
| Dow Chemical Co. (The) | 187,500 | 7,501,875 | |
| E.I. du Pont de Nemours & Co. | 298,700 | 14,017,991 | |
| Lubrizol Corp. (The) (S) | 319,500 | 15,125,130 | |
| Rohm & Haas Co. | 1,163,700 | 60,768,414 | |
| 97,413,410 | |||
| Commercial and Consumer Services (0.2%) | |||
| Realogy Corp. † | 33,060 | 862,535 | |
| Wyndham Worldwide Corp. † | 250,400 | 7,947,696 | |
| 8,810,231 | |||
| Computers (4.1%) | |||
| EMC Corp. † | 2,013,900 | 26,402,229 | |
| Hewlett-Packard Co. | 870,600 | 34,353,876 | |
| IBM Corp. | 1,013,400 | 93,151,728 | |
| 153,907,833 | |||
| Conglomerates (4.1%) | |||
| Honeywell International, Inc. | 931,000 | 40,014,380 | |
| Textron, Inc. | 79,600 | 7,757,020 | |
| Tyco International, Ltd. | |||
| (Bermuda) (S) | 3,505,500 | 106,181,595 | |
| 153,952,995 | |||
| Consumer Finance (2.5%) | |||
| Capital One Financial Corp. (S) | 483,200 | 37,631,616 | |
| Countrywide Financial Corp. (S) | 1,466,600 | 58,253,352 | |
| 95,884,968 | |||
| COMMON STOCKS (95.7%)* continued | |||
| Shares | Value | ||
| Consumer Goods (1.4%) | |||
| Avon Products, Inc. | 68,700 | $ | 2,242,368 |
| Colgate-Palmolive Co. | 473,900 | 30,827,195 | |
| Energizer Holdings, Inc. † | 141,000 | 9,318,690 | |
| Procter & Gamble Co. (The) | 147,600 | 9,267,804 | |
| 51,656,057 | |||
| Electric Utilities (5.6%) | |||
| DTE Energy Co. (S) | 81,900 | 3,856,671 | |
| Edison International | 1,452,165 | 66,770,546 | |
| FirstEnergy Corp. | 1,172,600 | 70,168,384 | |
| Pepco Holdings, Inc. | 174,300 | 4,467,309 | |
| PG&E Corp. (S) | 776,400 | 35,660,052 | |
| Public Service Enterprise | |||
| Group, Inc. | 458,100 | 30,793,482 | |
| 211,716,444 | |||
| Electronics (0.3%) | |||
| Intel Corp. | 476,900 | 10,181,815 | |
| Financial (9.1%) | |||
| Assurant, Inc. (S) | 237,300 | 13,042,008 | |
| Citigroup, Inc. | 3,724,500 | 184,697,955 | |
| Freddie Mac (S) | 131,600 | 8,838,256 | |
| JPMorgan Chase & Co. | 1,488,700 | 68,897,036 | |
| MGIC Investment Corp. (S) | 903,200 | 52,349,472 | |
| PMI Group, Inc. (The) (S) | 411,100 | 17,804,741 | |
| 345,629,468 | |||
| Food (0.8%) | |||
| Del Monte Foods Co. | 335,000 | 3,782,150 | |
| General Mills, Inc. | 483,400 | 27,046,230 | |
| 30,828,380 | |||
| Forest Products and Packaging (—%) | |||
| Sonoco Products Co. | 20,600 | 761,994 | |
| Health Care Services (0.4%) | |||
| Caremark Rx, Inc. | 61,200 | 2,894,760 | |
| McKesson Corp. | 244,100 | 12,058,540 | |
| 14,953,300 | |||
| Homebuilding (0.1%) | |||
| Lennar Corp. (S) | 84,300 | 4,425,750 | |
| Household Furniture and Appliances (0.5%) | |||
| Whirlpool Corp. (S) | 224,900 | 19,183,970 | |
| Insurance (6.2%) | |||
| ACE, Ltd. (Bermuda) | 907,700 | 51,593,668 | |
| AFLAC, Inc. | 175,700 | 7,755,398 | |
| Axis Capital Holdings, Ltd. | |||
| (Bermuda) | 713,104 | 24,409,550 | |
| Berkshire Hathaway, Inc. | |||
| Class B † (S) | 2,259 | 8,030,745 | |
| Chubb Corp. (The) | 450,400 | 23,312,704 | |
| Everest Re Group, Ltd. (Barbados) | 282,800 | 27,830,348 | |
| Fidelity National Title | |||
| Group, Inc. Class A (S) | 836,600 | 18,940,624 | |
24
| COMMON STOCKS (95.7%)* continued | |||
| Shares | Value | ||
| Insurance continued | |||
| PartnerRe, Ltd. (Bermuda) (S) | 343,099 | $ | 23,920,862 |
| Prudential Financial, Inc. | 598,100 | 48,733,188 | |
| 234,527,087 | |||
| Investment Banking/Brokerage (6.0%) | |||
| Allied Capital Corp. (S) | 2,285,300 | 70,250,122 | |
| Bear Stearns Cos., Inc. (The) (S) | 252,800 | 38,546,944 | |
| Goldman Sachs Group, Inc. (The) (S) | 302,300 | 58,888,040 | |
| Legg Mason, Inc. (S) | 76,800 | 7,323,648 | |
| Morgan Stanley | 688,200 | 52,413,312 | |
| 227,422,066 | |||
| Machinery (1.7%) | |||
| Ingersoll-Rand Co., Ltd. Class A | |||
| (Bermuda) | 380,500 | 14,843,305 | |
| Parker-Hannifin Corp. | 606,000 | 50,588,880 | |
| 65,432,185 | |||
| Manufacturing (0.6%) | |||
| Teleflex, Inc. | 349,800 | 22,607,574 | |
| Media (0.3%) | |||
| Time Warner, Inc. (S) | 579,600 | 11,673,144 | |
| Medical Technology (0.8%) | |||
| Becton, Dickinson and Co. | 188,700 | 13,533,564 | |
| PerkinElmer, Inc. | 805,530 | 17,455,835 | |
| 30,989,399 | |||
| Metals (0.3%) | |||
| Freeport-McMoRan Copper & | |||
| Gold, Inc. Class B (S) | 176,700 | 11,109,129 | |
| Natural Gas Utilities (—%) | |||
| Dynegy, Inc. Class A † | 70,614 | 479,469 | |
| Oil & Gas (12.0%) | |||
| BP PLC ADR (United Kingdom) | 222,000 | 15,113,760 | |
| Devon Energy Corp. | 598,100 | 43,882,597 | |
| Exxon Mobil Corp. | 2,499,600 | 191,994,276 | |
| Hess Corp. (S) | 298,700 | 15,015,649 | |
| Marathon Oil Corp. | 924,600 | 87,263,748 | |
| Newfield Exploration Co. † | 238,200 | 11,855,214 | |
| Occidental Petroleum Corp. | 174,000 | 8,759,160 | |
| Total SA (France) (S) | 803,500 | 57,219,869 | |
| Valero Energy Corp. | 431,100 | 23,740,677 | |
| 454,844,950 | |||
| Pharmaceuticals (7.1%) | |||
| Eli Lilly Co. | 348,800 | 18,692,192 | |
| Johnson & Johnson | 895,200 | 59,002,632 | |
| Pfizer, Inc. | 4,667,500 | 128,309,575 | |
| Watson Pharmaceuticals, Inc. † | 942,400 | 24,191,408 | |
| Wyeth | 813,200 | 39,261,296 | |
| 269,457,103 | |||
| COMMON STOCKS (95.7%)* continued | |||
| Shares | Value | ||
| Publishing (0.6%) | |||
| Idearc, Inc. † (S) | 181,630 | $ | 5,002,090 |
| R. R. Donnelley & Sons Co. | 478,000 | 16,859,060 | |
| 21,861,150 | |||
| Railroads (0.4%) | |||
| Norfolk Southern Corp. | 317,000 | 15,612,250 | |
| Regional Bells (4.1%) | |||
| BellSouth Corp. | 538,600 | 24,016,174 | |
| Verizon Communications, Inc. | 3,752,300 | 131,105,362 | |
| 155,121,536 | |||
| Retail (2.4%) | |||
| Barnes & Noble, Inc. | 218,100 | 8,728,362 | |
| Foot Locker, Inc. | 803,100 | 18,390,990 | |
| Home Depot, Inc. (The) | 356,000 | 13,517,320 | |
| OfficeMax, Inc. | 182,600 | 8,594,982 | |
| Supervalu, Inc. | 1,173,300 | 40,197,258 | |
| 89,428,912 | |||
| Software (0.9%) | |||
| McAfee, Inc. † | 183,500 | 5,360,035 | |
| Oracle Corp. † | 560,200 | 10,660,606 | |
| Symantec Corp. † (S) | 873,800 | 18,524,560 | |
| 34,545,201 | |||
| Technology Services (1.0%) | |||
| Computer Sciences Corp. † (S) | 94,400 | 4,927,680 | |
| VeriSign, Inc. † (S) | 1,189,200 | 31,050,012 | |
| 35,977,692 | |||
| Telecommunications (1.9%) | |||
| Citizens Communications Co. (S) | 1,228,000 | 17,400,760 | |
| Embarq Corp. (S) | 335,251 | 17,248,664 | |
| Sprint Nextel Corp. | 1,923,000 | 37,517,730 | |
| 72,167,154 | |||
| Telephone (0.2%) | |||
| Windstream Corp. | 623,900 | 8,697,166 | |
| Tobacco (2.7%) | |||
| Altria Group, Inc. | 559,400 | 47,107,074 | |
| Loews Corp. - Carolina Group | 890,536 | 55,542,730 | |
| 102,649,804 | |||
| Trucks & Parts (0.2%) | |||
| Autoliv, Inc. (Sweden) | 123,600 | 7,244,196 | |
| Waste Management (0.2%) | |||
| Waste Management, Inc. (S) | 257,500 | 9,427,075 | |
| Total common stocks (cost $2,961,398,745) | $3,621,727,330 | ||
25
| CONVERTIBLE PREFERRED STOCKS (3.4%)* | |||
| Shares | Value | ||
| Alleghany Corp. $1.521 cv. pfd. | 68,412 | $ | 21,866,186 |
| Citigroup Funding, Inc. Ser. GNW, | |||
| $1.481 cv. pfd. | 426,500 | 13,221,500 | |
| Conseco, Inc. $1.375 cum. | |||
| cv. pfd. (S) | 813,200 | 19,923,400 | |
| Ford Motor Company Capital Trust | |||
| II $3.25 cum. cv. pfd. | 590,345 | 20,514,489 | |
| General Motors Corp. Ser. A, | |||
| $1.125 cv. pfd. | 342,224 | 8,598,378 | |
| Huntsman Corp. $2.50 cv. pfd. | 340,736 | 13,373,888 | |
| Lehman Brothers Holdings, Inc. | |||
| $1.563 cv. pfd. | 287,400 | 7,831,650 | |
| Platinum Underwriters Holdings, | |||
| Ltd. Ser. A, $1.809 cv. pfd. | |||
| (Bermuda) | 762,128 | 22,863,840 | |
| Total convertible preferred stocks | |||
| (cost $123,267,354) | $ | 128,193,331 | |
| CONVERTIBLE BONDS AND NOTES (0.3%)* (cost $11,240,000) | |||
| Principal amount | Value | ||
| EMC Corp. | |||
| 144A cv. sr. notes 1 3/4s, 2013 | $11,240,000 | $ | 11,619,350 |
| WARRANTS (—%)* † (cost $—) | |||||
| Expiration date | Strike Price | Warrants | Value | ||
| Raytheon Co. | 6/16/11 | $37.5 | 12,063 | $ | 199,040 |
| CORPORATE BONDS AND NOTES (—%)* (cost $8,407) | |||||
| Principal amount | Value | ||||
| York Power Funding 144A notes 12s, | |||||
| 2007 (Cayman Islands) (In default) (F) † | $ | 8,032 | $ | 670 | |
| SHORT-TERM INVESTMENTS (9.7%)* | |||||
| Principal amount/shares | Value | ||||
| Short-term investments held as | |||||
| collateral for loaned securities | |||||
| with yields ranging from 5.26% | |||||
| to 5.44% and due dates ranging | |||||
| from December 1, 2006 to | |||||
| January 19, 2007 (d) | $ 340,996,265 | $ | 340,386,988 | ||
| Putnam Prime Money | |||||
| Market Fund (e) | 26,527,054 | 26,527,054 | |||
| Total short-term investments | |||||
| (cost $366,914,042) | $ | 366,914,042 | |||
| TOTAL INVESTMENTS | |||||
| Total investments (cost $3,462,828,548) | $ | 4,128,653,763 | |||
* Percentages indicated are based on net assets of $3,785,486,320. † Non-income-producing security.
(d) See Note 1 to the financial statements.
(e) See Note 5 to the financial statements regarding investments in Putnam Prime Money Market Fund. (F) Security is valued at fair value following procedures approved by the Trustees.
(S) Securities on loan, in part or in entirety, at November 30, 2006.
144A after the name of an issuer represents securities exempt from registration under Rule 144A under the Securities Act of 1933, as amended. These securities may be resold in transactions exempt from registration, normally to qualified institutional buyers.
The accompanying notes are an integral part of these financial statements.
26
Statement of assets and liabilities 11/30/06
| ASSETS | |
| Investment in securities, at value, including $330,225,618 of securities on loan (Note 1): | |
| Unaffiliated issuers (identified cost $3,436,301,494) | $4,102,126,709 |
| Affiliated issuers (identified cost $26,527,054) (Note 5) | 26,527,054 |
| Cash | 1,126 |
| Dividends, interest and other receivables | 12,403,003 |
| Receivable for shares of the fund sold | 3,756,192 |
| Receivable for securities sold | 100,049,250 |
| Total assets | 4,244,863,334 |
| LIABILITIES | |
| Distributions payable to shareholders | 10,394 |
| Payable for securities purchased | 105,332,129 |
| Payable for shares of the fund repurchased | 6,292,482 |
| Payable for compensation of Manager (Notes 2 and 5) | 4,577,657 |
| Payable for investor servicing and custodian fees (Note 2) | 448,744 |
| Payable for Trustee compensation and expenses (Note 2) | 237,865 |
| Payable for administrative services (Note 2) | 12,555 |
| Payable for distribution fees (Note 2) | 1,731,398 |
| Collateral on securities loaned, at value (Note 1) | 340,386,988 |
| Other accrued expenses | 346,802 |
| Total liabilities | 459,377,014 |
| Net assets | $3,785,486,320 |
| REPRESENTED BY | |
| Paid-in capital (Unlimited shares authorized) (Notes 1 and 4) | $3,047,803,142 |
| Undistributed net investment income (Note 1) | 33,841,742 |
| Accumulated net realized gain on investments and foreign currency transactions (Note 1) | 38,016,221 |
| Net unrealized appreciation of investments | 665,825,215 |
| Total — Representing net assets applicable to capital shares outstanding | $3,785,486,320 |
| COMPUTATION OF NET ASSET VALUE AND OFFERING PRICE | |
| Net asset value and redemption price per class A share ($2,732,861,162 divided by 157,480,154 shares) | $17.35 |
| Offering price per class A share (100/94.75 of $17.35)* | $18.31 |
| Net asset value and offering price per class B share ($598,199,217 divided by 34,820,698 shares)** | $17.18 |
| Net asset value and offering price per class C share ($96,929,210 divided by 5,623,748 shares)** | $17.24 |
| Net asset value and redemption price per class M share ($56,202,780 divided by 3,265,690 shares) | $17.21 |
| Offering price per class M share (100/96.75 of $17.21)* | $17.79 |
| Net asset value, offering price and redemption price per class R share ($3,734,220 divided by 215,921 shares) | $17.29 |
| Net asset value, offering price and redemption price per class Y share ($297,559,731 divided by 17,140,716 shares) | $17.36 |
* On single retail sales of less than $50,000. On sales of $50,000 or more the offering price is reduced.
** Redemption price per share is equal to net asset value less any applicable contingent deferred sales charge.
The accompanying notes are an integral part of these financial statements.
27
| Statement of operations Year ended 11/30/06 | |
| INVESTMENT INCOME | |
| Dividends (net of foreign tax of $134,143) | $ 93,664,653 |
| Interest (including interest income of $1,030,855 from investments in affiliated issuers) (Note 5) | 1,291,245 |
| Securities lending | 1,518,245 |
| Total investment income | 96,474,143 |
| EXPENSES | |
| Compensation of Manager (Note 2) | 18,092,394 |
| Investor servicing fees (Note 2) | 6,951,658 |
| Custodian fees (Note 2) | 245,063 |
| Trustee compensation and expenses (Note 2) | 128,288 |
| Administrative services (Note 2) | 70,361 |
| Distribution fees — Class A (Note 2) | 6,295,427 |
| Distribution fees — Class B (Note 2) | 6,491,792 |
| Distribution fees — Class C (Note 2) | 913,000 |
| Distribution fees — Class M (Note 2) | 397,771 |
| Distribution fees — Class R (Note 2) | 15,131 |
| Other | 730,605 |
| Non-recurring costs (Notes 2 and 6) | 51,893 |
| Costs assumed by Manager (Notes 2 and 6) | (51,893) |
| Fees waived and reimbursed by Manager or affiliate (Notes 5 and 6) | (848,223) |
| Total expenses | 39,483,267 |
| Expense reduction (Note 2) | (779,187) |
| Net expenses | 38,704,080 |
| Net investment income | 57,770,063 |
| Net realized gain on investments (Notes 1 and 3) | 441,592,878 |
| Net increase from payments by affiliates (Note 2) | 46,396 |
| Net realized gain on foreign currency transactions (Note 1) | 191 |
| Net unrealized appreciation of investments during the year | 91,395,200 |
| Net gain on investments | 533,034,665 |
| Net increase in net assets resulting from operations | $590,804,728 |
The accompanying notes are an integral part of these financial statements.
28
Statement of changes in net assets
| INCREASE IN NET ASSETS | ||
| Year ended | Year ended | |
| 11/30/06 | 11/30/05 | |
| Operations: | ||
| Net investment income | $ 57,770,063 | $ 49,697,597 |
| Net realized gain on investments and foreign currency transactions | 441,639,465 | 297,060,997 |
| Net unrealized appreciation (depreciation) of investments | 91,395,200 | (49,275,845) |
| Net increase in net assets resulting from operations | 590,804,728 | 297,482,749 |
| Distributions to shareholders: (Note 1) | ||
| From ordinary income | ||
| From net investment income | ||
| Class A | (37,177,895) | (29,800,660) |
| Class B | (4,877,049) | (4,575,163) |
| Class C | (693,047) | (516,278) |
| Class M | (530,431) | (719,749) |
| Class R | (37,036) | (18,938) |
| Class Y | (5,625,951) | (5,154,098) |
| Net realized short-term gain on investments | ||
| Class A | (40,747,039) | (18,966,797) |
| Class B | (9,010,088) | (5,828,015) |
| Class C | (1,456,828) | (721,600) |
| Class M | (841,613) | (430,882) |
| Class R | (55,338) | (19,070) |
| Class Y | (4,398,015) | (2,465,062) |
| From net realized long-term gain on investments | ||
| Class A | (246,753,846) | (166,456,853) |
| Class B | (54,562,836) | (51,147,964) |
| Class C | (8,822,184) | (6,332,920) |
| Class M | (5,096,594) | (3,781,517) |
| Class R | (335,110) | (167,367) |
| Class Y | (26,633,278) | (21,633,936) |
| Redemption fees (Note 1) | 5,647 | 12,368 |
| Increase from capital share transactions (Note 4) | 71,493,067 | 138,614,189 |
| Total increase in net assets | 214,649,264 | 117,372,437 |
| NET ASSETS | ||
| Beginning of year | 3,570,837,056 | 3,453,464,619 |
| End of year (including undistributed net investment income of $33,841,742 and $25,663,731, respectively) | $3,785,486,320 | $3,570,837,056 |
The accompanying notes are an integral part of these financial statements.
29
| Financial highlights (For a common share outstanding throughout the period) | |||||||||||||||
| INVESTMENT OPERATIONS: | LESS DISTRIBUTIONS: | RATIOS AND SUPPLEMENTAL DATA: | |||||||||||||
| Net | Total | Ratio of net | |||||||||||||
| Net asset | realized and | Total | From | From | Net asset | return | Net | Ratio of | investment | ||||||
| value, | Net | unrealized | from | net | net realized | value, | at net | assets, | expenses to | income (loss) | Portfolio | ||||
| beginning | investment | gain (loss) on | investment | investment | gain on | Total | Redemption | end | asset | end of period | average net | to average | turnover | ||
| Period ended | of period | income (loss)(a) | investments | operations | income | investments | distributions | fees | of period | value (%)(b) | (in thousands) | assets (%)(c) | net assets (%) | (%) | |
| CLASS A | |||||||||||||||
| November 30, 2006 | $16.71 | .31(d,e) | 2.62 | 2.93 | (.26) | (2.03) | (2.29) | —(g) | $17.35 | 17.73 | $2,732,861 | .95(d,e) | 1.74(d,e) | 76.99 | |
| November 30, 2005 | 16.83 | .28(d,f) | 1.23 | 1.51 | (.23) | (1.40) | (1.63) | —(g) | 16.71 | 8.99 | 2,387,387 | .98(d) | 1.58(d,f) | 52.27 | |
| November 30, 2004 | 14.84 | .24(d) | 1.96 | 2.20 | (.21) | — | (.21) | —(g) | 16.83 | 14.93 | 2,033,669 | 1.07(d) | 1.51(d) | 46.07 | |
| November 30, 2003 | 13.15 | .23 | 1.67 | 1.90 | (.21) | — | (.21) | — | 14.84 | 14.64 | 1,757,848 | 1.02 | 1.70 | 65.45 | |
| November 30, 2002 | 14.62 | .23 | (1.30) | (1.07) | (.19) | (.21) | (.40) | — | 13.15 | (7.52) | 1,395,261 | 1.00 | 1.65 | 59.27(h) | |
| CLASS B | |||||||||||||||
| November 30, 2006 | $16.56 | .17(d,e) | 2.61 | 2.78 | (.13) | (2.03) | (2.16) | —(g) | $17.18 | 16.86 | $598,199 | 1.70(d,e) | .96(d,e) | 76.99 | |
| November 30, 2005 | 16.68 | .14(d,f) | 1.24 | 1.38 | (.10) | (1.40) | (1.50) | —(g) | 16.56 | 8.24 | 725,437 | 1.73(d) | .83(d,f) | 52.27 | |
| November 30, 2004 | 14.71 | .12(d) | 1.94 | 2.06 | (.09) | — | (.09) | —(g) | 16.68 | 14.07 | 819,239 | 1.82(d) | .76(d) | 46.07 | |
| November 30, 2003 | 13.05 | .13 | 1.65 | 1.78 | (.12) | — | (.12) | — | 14.71 | 13.72 | 696,081 | 1.77 | .95 | 65.45 | |
| November 30, 2002 | 14.51 | .12 | (1.29) | (1.17) | (.08) | (.21) | (.29) | — | 13.05 | (8.22) | 520,369 | 1.75 | .90 | 59.27(h) | |
| CLASS C | |||||||||||||||
| November 30, 2006 | $16.61 | .17(d,e) | 2.62 | 2.79 | (.13) | (2.03) | (2.16) | —(g) | $17.24 | 16.90 | $96,929 | 1.70(d,e) | .98(d,e) | 76.99 | |
| November 30, 2005 | 16.74 | .14(d,f) | 1.23 | 1.37 | (.10) | (1.40) | (1.50) | —(g) | 16.61 | 8.18 | 90,222 | 1.73(d) | .83(d,f) | 52.27 | |
| November 30, 2004 | 14.76 | .12(d) | 1.95 | 2.07 | (.09) | — | (.09) | —(g) | 16.74 | 14.09 | 80,165 | 1.82(d) | .76(d) | 46.07 | |
| November 30, 2003 | 13.10 | .13 | 1.65 | 1.78 | (.12) | — | (.12) | — | 14.76 | 13.70 | 68,065 | 1.77 | .93 | 65.45 | |
| November 30, 2002 | 14.56 | .12 | (1.28) | (1.16) | (.09) | (.21) | (.30) | — | 13.10 | (8.15) | 40,600 | 1.75 | .90 | 59.27(h) | |
| CLASS M | |||||||||||||||
| November 30, 2006 | $16.59 | .21(d,e) | 2.62 | 2.83 | (.18) | (2.03) | (2.21) | —(g) | $17.21 | 17.15 | $56,203 | 1.45(d,e) | 1.23(d,e) | 76.99 | |
| November 30, 2005 | 16.70 | .19(d,f) | 1.23 | 1.42 | (.13) | (1.40) | (1.53) | —(g) | 16.59 | 8.49 | 53,673 | 1.48(d) | 1.11(d,f) | 52.27 | |
| November 30, 2004 | 14.73 | .16(d) | 1.94 | 2.10 | (.13) | — | (.13) | —(g) | 16.70 | 14.32 | 133,313 | 1.57(d) | 1.01(d) | 46.07 | |
| November 30, 2003 | 13.06 | .14 | 1.68 | 1.82 | (.15) | — | (.15) | — | 14.73 | 14.05 | 132,718 | 1.52 | 1.20 | 65.45 | |
| November 30, 2002 | 14.52 | .25 | (1.38) | (1.13) | (.12) | (.21) | (.33) | — | 13.06 | (7.93) | 99,382 | 1.50 | 1.16 | 59.27(h) | |
| CLASS R | |||||||||||||||
| November 30, 2006 | $16.67 | .27(d,e) | 2.60 | 2.87 | (.22) | (2.03) | (2.25) | —(g) | $17.29 | 17.38 | $3,734 | 1.20(d,e) | 1.51(d,e) | 76.99 | |
| November 30, 2005 | 16.79 | .23(d,f) | 1.24 | 1.47 | (.19) | (1.40) | (1.59) | —(g) | 16.67 | 8.75 | 2,417 | 1.23(d) | 1.33(d,f) | 52.27 | |
| November 30, 2004 | 14.81 | .20(d) | 1.96 | 2.16 | (.18) | — | (.18) | —(g) | 16.79 | 14.65 | 1,280 | 1.32(d) | 1.28(d) | 46.07 | |
| November 30, 2003† | 12.90 | .18 | 1.89 | 2.07 | (.16) | — | (.16) | — | 14.81 | 16.16* | 487 | 1.09* | 1.24* | 65.45 | |
| CLASS Y | |||||||||||||||
| November 30, 2006 | $16.72 | .35(d,e) | 2.63 | 2.98 | (.31) | (2.03) | (2.34) | —(g) | $17.36 | 18.01 | $297,560 | .70(d,e) | 1.97(d,e) | 76.99 | |
| November 30, 2005 | 16.83 | .32(d,f) | 1.24 | 1.56 | (.27) | (1.40) | (1.67) | —(g) | 16.72 | 9.31 | 311,701 | .73(d) | 1.84(d,f) | 52.27 | |
| November 30, 2004 | 14.84 | .28(d) | 1.96 | 2.24 | (.25) | — | (.25) | —(g) | 16.83 | 15.22 | 385,798 | .82(d) | 1.76(d) | 46.07 | |
| November 30, 2003 | 13.16 | .26 | 1.66 | 1.92 | (.24) | — | (.24) | — | 14.84 | 14.83 | 367,653 | .77 | 1.90 | 65.45 | |
| November 30, 2002 | 14.62 | .19 | (1.22) | (1.03) | (.22) | (.21) | (.43) | — | 13.16 | (7.22) | 152,130 | .75 | 1.91 | 59.27(h) | |
| See notes to financial highlights at the end of this section. | |||||||||||||||
The accompanying notes are an integral part of these financial statements.
30 31
Financial highlights (Continued)
* Not annualized
† For the period January 21, 2003 (commencement of operations) to November 30, 2003.
(a) Per share net investment income (loss) has been determined on the basis of the weighted average number of shares outstanding during the period.
(b) Total return assumes dividend reinvestment and does not reflect the effect of sales charges.
(c) Includes amounts paid through expense offset and brokerage service arrangements (Note 2).
(d) Reflects waivers of certain fund expenses in connection with investments in Putnam Prime Market Fund during the period. As a result of such waivers, the expenses of each class, as a percentage of its average net assets, reflect a reduction of the following amounts (Note 5):
| 11/30/06 | 11/30/05 | 11/30/04 | |
| Class A | <0.01% | <0.01% | <0.01% |
| Class B | <0.01 | <0.01 | <0.01 |
| Class C | <0.01 | <0.01 | <0.01 |
| Class M | <0.01 | <0.01 | <0.01 |
| Class R | <0.01 | <0.01 | <0.01 |
| Class Y | <0.01 | <0.01 | <0.01 |
(e) Reflects a non-recurring accrual related to a reimbursement to the fund from Putnam Investments relating to the calculation of certain amounts paid by the fund to Putnam in previous years for transfer agent services, which amounted to less than $0.01 per share and 0.02% of average net assets for the period ended November 30, 2006 (Note 6).
(f) Reflects a non-recurring accrual related to Putnam Management’s settlement with the SEC regarding brokerage allocation practices. As a result, the expenses of each class reflect a reduction of the following amounts (Note 6):
| Percentage | ||
| of average | ||
| Per share | net assets | |
| Class A | <$0.01 | 0.01% |
| Class B | <0.01 | 0.01 |
| Class C | <0.01 | 0.01 |
| Class M | <0.01 | 0.01 |
| Class R | <0.01 | 0.01 |
| Class Y | <0.01 | 0.01 |
(g) Amount represent less than $0.01 per share.
(h) Portfolio turnover excludes certain treasury note transactions executed in connection with a short-term trading strategy.
The accompanying notes are an integral part of these financial statements.
32
Notes to financial statements 11/30/06
Note 1: Significant accounting policies
Putnam Equity Income Fund (the “fund”) is registered under the Investment Company Act of 1940, as amended, as a diversified, open-end management investment company. The objective of the fund is to seek current income by investing primarily in a diversified portfolio of income-producing equity securities. Capital growth is a secondary objective when consistent with seeking current income.
The fund offers class A, class B, class C, class M, class R and class Y shares. Class A and class M shares are sold with a maximum front-end sales charge of 5.25% and 3.25%, respectively, and generally do not pay a contingent deferred sales charge. Class B shares, which convert to class A shares after approximately eight years, do not pay a front-end sales charge and are subject to a contingent deferred sales charge, if those shares are redeemed within six years of purchase. Class C shares have a one-year 1.00% contingent deferred sales charge and do not convert to class A shares. Class R shares, which are offered to qualified employee-benefit plans, are sold without a front-end sales charge or a contingent deferred sales charge. The expenses for class A, class B, class C, class M and class R shares may differ based on the distribution fee of each class, which is identified in Note 2. Class Y shares, which are sold at net asset value, are generally subject to the sa me expenses as class A, class B, class C, class M and class R shares, but do not bear a distribution fee. Class Y shares are sold to certain eligible purchasers including certain defined contribution plans (including corporate IRAs), bank trust departments, trust companies and certain college savings plans.
Effective October 2, 2006, a 1.00% redemption fee may apply on any shares purchased on or after such date that are redeemed (either by selling or exchanging into another fund) within 7 days of purchase. The redemption fee is accounted for as an addition to paid-in-capital. Prior to October 2, 2006, a 2.00% redemption fee applied to any shares that were redeemed (either by selling or exchanging into another fund) within 5 days of purchase.
Investment income, realized and unrealized gains and losses and expenses of the fund are borne pro-rata based on the relative net assets of each class to the total net assets of the fund, except that each class bears expenses unique to that class (including the distribution fees applicable to such classes). Each class votes as a class only with respect to its own distribution plan or other matters on which a class vote is required by law or determined by the Trustees. Shares of each class would receive their pro-rata share of the net assets of the fund, if the fund were liquidated. In addition, the Trustees declare separate dividends on each class of shares.
In the normal course of business, the fund enters into contracts that may include agreements to indemnify another party under given circumstances. The fund’s maximum exposure under these arrangements is unknown as this would involve future claims that may be, but have not yet been, made against the fund. However, the fund expects the risk of material loss to be remote.
The following is a summary of significant accounting policies consistently followed by the fund in the preparation of its financial statements. The preparation of financial statements is in conformity with accounting principles generally accepted in the United States of America and requires management to make estimates and assumptions that affect the reported amounts of assets and liabilities in the financial statements and the reported amounts of increases and decreases in net assets from operations during the reporting period. Actual results could differ from those estimates.
A) Security valuation Investments for which market quotations are readily available are valued at the last reported sales price on their principal exchange, or official closing price for certain markets. If no sales are reported — as in the case of some securities traded over-the-counter — a security is valued at its last reported bid price. Market quotations are not considered to be readily available for certain debt obligations; such investments are valued on the basis of valuations furnished by an independent pricing service approved by the Trustees or dealers selected by Putnam Investment Management, LLC (“Putnam Management”), the fund’s manager, an indirect wholly-owned subsidiary of Putnam, LLC. Such services or dealers determine valuations for normal institutional-size trading units of such securities using methods based on market transactions for comparable securities and various relationships, gen erally recognized by institutional traders, between securities. Many securities markets and exchanges outside the U.S. close prior to the close of the New York Stock Exchange and therefore the closing prices for securities in such markets or on such exchanges may not fully reflect events that occur after such close but before the close of the New York Stock Exchange. Accordingly, on certain days, the fund will fair value foreign equity securities taking into account multiple factors, including movements in the U.S. securities markets. The number of days on which fair value prices will be used will depend on market activity and it is possible that fair value prices will be used by the fund to a significant extent. At November 30, 2006, fair value pricing was used for certain foreign securities in the portfolio. Securities quoted in foreign currencies, if any, are translated into U.S. dollars at the current exchange rate. Certain investments, including certain restricted securities, are also valued at fair val ue following procedures approved by the Trustees. Such valuations and procedures are reviewed periodically by the Trustees. The fair value of securities is generally determined as the amount that the fund could reasonably expect to realize from an orderly disposition of such securities over a reasonable period of time. By its nature, a fair value price is a good faith estimate of the value of a security at a given point in time and does not reflect an actual market price, which may be different by a material amount.
B) Joint trading account Pursuant to an exemptive order from the Securities and Exchange Commission, the fund may transfer uninvested cash balances, including cash collateral received under security lending arrangements, into a joint trading account along with the cash of other registered investment companies and certain other accounts managed by Putnam Investment Management, LLC (“Putnam Management”), the fund’s manager, an indirect wholly-owned subsidiary of Putnam, LLC. These balances may be invested in issues of high-grade short-term investments having maturities of up to 397 days for collateral received under security lending arrangements and up to 90 days for other cash investments.
C) Repurchase agreement The fund, or any joint trading account, through its custodian, receives delivery of the underlying securities, the market value of which at the time of purchase is required to be in an amount at least equal to the resale price, including accrued interest. Collateral for certain tri-party repurchase agreements is held at the counterparty’s custodian in a segregated account for the benefit of the fund and the counterparty. Putnam Management is responsible for determining that the value of these underlying securities is at all times at least equal to the resale price, including accrued interest.
33
D) Security transactions and related investment income Security transactions are recorded on the trade date (the date the order to buy or sell is executed). Gains or losses on securities sold are determined on the identified cost basis.
Interest income is recorded on the accrual basis. Dividend income, net of applicable withholding taxes, is recognized on the ex-dividend date except that certain dividends from foreign securities, if any, are recognized as soon as the fund is informed of the ex-dividend date. Non-cash dividends, if any, are recorded at the fair market value of the securities received. Dividends representing a return of capital or capital gains, if any, are reflected as a reduction of cost and/or as a realized gain. All premiums/discounts are amortized/accreted on a yield-to-maturity basis.
E) Foreign currency translation The accounting records of the fund are maintained in U.S. dollars. The market value of foreign securities, currency holdings, and other assets and liabilities are recorded in the books and records of the fund after translation to U.S. dollars based on the exchange rates on that day. The cost of each security is determined using historical exchange rates. Income and withholding taxes are translated at prevailing exchange rates when earned or incurred. The fund does not isolate that portion of realized or unrealized gains or losses resulting from changes in the foreign exchange rate on investments from fluctuations arising from changes in the market prices of the securities. Such gains and losses are included with the net realized and unrealized gain or loss on investments. Net realized gains and losses on foreign currency transactions represent net realized exchange gains or losses on closed forward currency contracts, disposition of foreign currencies, currency gains and losses realized between the trade and settlement dates on securities transactions and the difference between the amount of investment income and foreign withholding taxes recorded on the fund’s books and the U.S. dollar equivalent amounts actually received or paid. Net unrealized appreciation and depreciation of assets and liabilities in foreign currencies arise from changes in the value of open forward currency contracts and assets and liabilities other than investments at the period end, resulting from changes in the exchange rate. Investments in foreign securities involve certain risks, including those related to economic instability, unfavorable political developments, and currency fluctuations, not present with domestic investments.
F) Securities lending The fund may lend securities, through its agents, to qualified borrowers in order to earn additional income. The loans are collateralized by cash and/or securities in an amount at least equal to the market value of the securities loaned. The market value of securities loaned is determined daily and any additional required collateral is allocated to the fund on the next business day. The risk of borrower default will be borne by the fund’s agents; the fund will bear the risk of loss with respect to the investment of the cash collateral. Income from securities lending is included in investment income on the statement of operations. At November 30, 2006, the value of securities loaned amounted to $330,225,618. Certain of these securities were sold prior to period end and are included in the Receivable for securities sold on the Statement of assets and liabilities. The fund received cash collateral of $340,3 86,988 which is pooled with collateral of other Putnam funds into 49 issues of high grade short-term investments.
G) Federal taxes It is the policy of the fund to distribute all of its taxable income within the prescribed time and otherwise comply with the provisions of the Internal Revenue Code of 1986 (the “Code”) applicable to regulated investment companies. It is also the intention of the fund to distribute an amount sufficient to avoid imposition of any excise tax under Section 4982 of the Code, as amended. Therefore, no provision has been made for federal taxes on income, capital gains or unrealized appreciation on securities held nor for excise tax on income and capital gains.
H) Distributions to shareholders Distributions to shareholders from net investment income are recorded by the fund on the ex-dividend date. Distributions from capital gains, if any, are recorded on the ex-dividend date and paid at least annually. The amount and character of income and gains to be distributed are determined in accordance with income tax regulations, which may differ from generally accepted accounting principles. These differences include temporary and/or permanent differences of losses on wash sale transactions. Reclassifications are made to the fund’s capital accounts to reflect income and gains available for distribution (or available capital loss carryovers) under income tax regulations. For the year ended November 30, 2006, the fund reclassified $650,643 to decrease undistributed net investment income with an increase to accumulated net realized gains of $650,643.
The tax basis components of distributable earnings and the federal tax cost as of November 30, 2006 were as follows:
| Unrealized appreciation | $ 667,338,921 |
| Unrealized depreciation | (20,608,871) |
| ——————————————— | |
| Net unrealized appreciation | 646,730,050 |
| Undistributed ordinary income | 33,459,245 |
| Undistributed short-term gain | 24,944,478 |
| Undistributed long-term gain | 32,562,513 |
| Cost for federal income tax purposes | $3,481,923,713 |
Note 2: Management fee, administrative services and other transactions
Putnam Management is paid for management and investment advisory services quarterly based on the average net assets of the fund. Such fee is based on the following annual rates: 0.65% of the first $500 million of average net assets, 0.55% of the next $500 million, 0.50% of the next $500 million, 0.45% of the next $5 billion, 0.425% of the next $5 billion, 0.405% of the next $5 billion, 0.39% of the next $5 billion and 0.38% thereafter.
Putnam Management has agreed to waive fees and reimburse expenses of the fund through November 30, 2007 to the extent necessary to ensure that the fund’s expenses do not exceed the simple average of the expenses of all front-end load funds viewed by Lipper Inc. as having the same investment classification or objective as the fund. The expense reimbursement is based on a comparison of the fund’s expenses with the average annualized operating expenses of the funds in its Lipper peer group for each calendar quarter during the fund’s last fiscal year, excluding 12b-1 fees and without giving effect to any expense offset and brokerage service arrangements that may reduce fund expenses. For the year ended November 30, 2006, Putnam Management did not waive any of its management fee from the fund.
During the year ended November 30, 2006, Putnam Management voluntarily reimbursed the fund $46,396 for net realized losses incurred from the sale of investment securities that were purchased by the fund in error. The effect of the losses incurred and the reimbursal by Putnam Management of such losses had no impact on total return.
34
For the year ended November 30, 2006, Putnam Management has assumed $51,893 of legal, shareholder servicing and communication, audit and Trustee fees incurred by the fund in connection with certain legal and regulatory matters (including those described in Note 6).
The fund reimburses Putnam Management an allocated amount for the compensation and related expenses of certain officers of the fund and their staff who provide administrative services to the fund. The aggregate amount of all such reimbursements is determined annually by the Trustees.
Custodial functions for the fund’s assets were provided by Putnam Fiduciary Trust Company (“PFTC”), a subsidiary of Putnam, LLC. PFTC received fees for custody services based on the fund’s asset level, the number of its security holdings and transaction volumes. Putnam Investor Services, a division of PFTC, provided investor servicing agent functions to the fund. Putnam Investor Services received fees for investor servicing based on the number of shareholder accounts in the fund and the level of defined contribution plan assets in the fund. During the year ended November 30, 2006, the fund incurred $7,196,721 for these services. State Street Bank and Trust Company, will begin providing custodial functions for the fund’s assets in the subsequent period.
The fund has entered into an arrangement with PFTC whereby credits realized as a result of uninvested cash balances are used to reduce a portion of the fund’s expenses. The fund also reduced expenses through brokerage service arrangements. For the year ended November 30, 2006, the fund’s expenses were reduced by $779,187 under these arrangements.
Each independent Trustee of the fund receives an annual Trustee fee, of which $964, as a quarterly retainer, has been allocated to the fund, and an additional fee for each Trustees meeting attended. Trustees receive additional fees for attendance at certain committee meetings, industry seminars and for certain compliance-related matters. Trustees also are reimbursed for expenses they incur relating to their services as Trustees. George Putnam, III, who is not an independent Trustee, also receives the foregoing fees for his services as Trustee.
The fund has adopted a Trustee Fee Deferral Plan (the “Deferral Plan”) which allows the Trustees to defer the receipt of all or a portion of Trustees fees payable on or after July 1, 1995. The deferred fees remain invested in certain Putnam funds until distribution in accordance with the Deferral Plan.
The fund has adopted an unfunded noncontributory defined benefit pension plan (the “Pension Plan”) covering all Trustees of the fund who have served as a Trustee for at least five years and were first elected prior to 2004. Benefits under the Pension Plan are equal to 50% of the Trustee’s average annual attendance and retainer fees for the three years ended December 31, 2005. The retirement benefit is payable during a Trustee’s lifetime, beginning the year following retirement, for the number of years of service through December 31, 2006. Pension expense for the fund is included in Trustee compensation and expenses in the statement of operations. Accrued pension liability is included in Payable for Trustee compensation and expenses in the statement of assets and liabilities. The Trustees have terminated the Pension Plan with respect to any Trustee first elected after 2003.
The fund has adopted distribution plans (the “Plans”) with respect to its class A, class B, class C, class M and class R shares pursuant to Rule 12b-1 under the Investment Company Act of 1940. The purpose of the Plans is to compensate Putnam Retail Management, a wholly-owned subsidiary of Putnam, LLC and Putnam Retail Management GP, Inc., for services provided and expenses incurred in distributing shares of the fund. The Plans provide for payments by the fund to Putnam Retail Management at an annual rate of up to 0.35%, 1.00%, 1.00%, 1.00% and 1.00% of the average net assets attributable to class A, class B, class C, class M and class R shares, respectively. The Trustees have approved payment by the fund at an annual rate of 0.25%, 1.00%, 1.00%, 0.75% and 0.50% of the average net assets attributable to class A, class B, class C, class M and class R shares, respectively.
For the year ended November 30, 2006, Putnam Retail Management, acting as underwriter, received net commissions of $208,144 and $2,107 from the sale of class A and class M shares, respectively, and received $551,471 and $5,569 in contingent deferred sales charges from redemptions of class B and class C shares, respectively.
A deferred sales charge of up to 1.00% and 0.65% is assessed on certain redemptions of class A and class M shares, respectively. For the year ended November 30, 2006, Putnam Retail Management, acting as underwriter, received $4,598 and no monies on class A and class M redemptions, respectively.
Note 3: Purchases and sales of securities
During the year ended November 30, 2006, cost of purchases and proceeds from sales of investment securities other than short-term investments aggregated $2,777,161,486 and $3,074,287,966, respectively. There were no purchases or sales of U.S. government securities.
Note 4: Capital shares
At November 30, 2006, there was an unlimited number of shares of beneficial interest authorized. Transactions in capital shares were as follows:
| CLASS A | Shares | Amount | |
| Year ended 11/30/06: | |||
| Shares sold | 30,314,981 | $ | 534,589,848 |
| Shares issued in connection with | |||
| reinvestment of distributions | 17,707,816 | 306,737,714 | |
| 48,022,797 | 841,327,562 | ||
| Shares repurchased | (33,394,271) | (588,456,392) | |
| Net increase | 14,628,526 | $ | 252,871,170 |
| Year ended 11/30/05: | |||
| Shares sold | 38,153,409 | $ | 664,887,893 |
| Shares issued in connection with | |||
| reinvestment of distributions | 12,044,529 | 203,370,625 | |
| 50,197,938 | 868,258,518 | ||
| Shares repurchased | (28,211,802) | (493,019,582) | |
| Net increase | 21,986,136 | $ | 375,238,936 |
35
| CLASS B | Shares | Amount |
| Year ended 11/30/06: | ||
| Shares sold | 3,808,212 | $ 66,598,868 |
| Shares issued in connection with | ||
| reinvestment of distributions | 3,652,838 | 62,651,424 |
| 7,461,050 | 129,250,292 | |
| Shares repurchased | (16,451,888) | (286,864,002) |
| Net decrease | (8,990,838) | $(157,613,710) |
| Year ended 11/30/05: | ||
| Shares sold | 8,111,158 | $ 139,876,517 |
| Shares issued in connection with | ||
| reinvestment of distributions | 3,367,089 | 56,185,365 |
| 11,478,247 | 196,061,882 | |
| Shares repurchased | (16,774,090) | (290,554,883) |
| Net decrease | (5,295,843) | $ (94,493,001) |
| CLASS C | Shares | Amount |
| Year ended 11/30/06: | ||
| Shares sold | 773,213 | $ 13,564,362 |
| Shares issued in connection with | ||
| reinvestment of distributions | 559,880 | 9,636,606 |
| 1,333,093 | 23,200,968 | |
| Shares repurchased | (1,140,570) | (19,885,142) |
| Net increase | 192,523 | $ 3,315,826 |
| Year ended 11/30/05: | ||
| Shares sold | 1,399,937 | $ 24,199,210 |
| Shares issued in connection with | ||
| reinvestment of distributions | 396,652 | 6,637,039 |
| 1,796,589 | 30,836,249 | |
| Shares repurchased | (1,155,023) | (20,086,809) |
| Net increase | 641,566 | $ 10,749,440 |
| CLASS M | Shares | Amount |
| Year ended 11/30/06: | ||
| Shares sold | 370,935 | $ 6,577,678 |
| Shares issued in connection with | ||
| reinvestment of distributions | 366,493 | 6,297,477 |
| 737,428 | 12,875,155 | |
| Shares repurchased | (707,125) | (12,358,074) |
| Net increase | 30,303 | $ 517,081 |
| Year ended 11/30/05: | ||
| Shares sold | 731,531 | $ 12,639,675 |
| Shares issued in connection with | ||
| reinvestment of distributions | 285,322 | 4,781,170 |
| 1,016,853 | 17,420,845 | |
| Shares repurchased | (5,764,121) | (96,614,672) |
| Net decrease | (4,747,268) | $(79,193,827) |
| CLASS R | Shares | Amount |
| Year ended 11/30/06: | ||
| Shares sold | 73,457 | $1,293,696 |
| Shares issued in connection with | ||
| reinvestment of distributions | 21,202 | 366,067 |
| 94,659 | 1,659,763 | |
| Shares repurchased | (23,764) | (414,302) |
| Net increase | 70,895 | $1,245,461 |
| Year ended 11/30/05: | ||
| Shares sold | 95,488 | $1,659,230 |
| Shares issued in connection with | ||
| reinvestment of distributions | 9,947 | 167,243 |
| 105,435 | 1,826,473 | |
| Shares repurchased | (36,667) | (636,667) |
| Net increase | 68,768 | $1,189,806 |
| CLASS Y | Shares | Amount |
| Year ended 11/30/06: | ||
| Shares sold | 3,605,122 | $ 63,590,797 |
| Shares issued in connection with | ||
| reinvestment of distributions | 2,115,204 | 36,657,244 |
| 5,720,326 | 100,248,041 | |
| Shares repurchased | (7,225,830) | (129,090,802) |
| Net decrease | (1,505,504) | $ (28,842,761) |
| Year ended 11/30/05: | ||
| Shares sold | 5,349,682 | $ 93,256,809 |
| Shares issued in connection with | ||
| reinvestment of distributions | 1,730,034 | 29,253,096 |
| 7,079,716 | 122,509,905 | |
| Shares repurchased | (11,360,031) | (197,387,070) |
| Net decrease | (4,280,315) | $ (74,877,165) |
Note 5: Investment in Putnam Prime Money Market Fund
The fund invests in Putnam Prime Money Market Fund, an open-end management investment company managed by Putnam Management. Investments in Putnam Prime Money Market Fund are valued at its closing net asset value each business day. Management fees paid by the fund are reduced by an amount equal to the management and administrative services fees paid by Putnam Prime Money Market Fund with respect to assets invested by the fund in Putnam Prime Money Market Fund. For the year ended November 30, 2006, management fees paid were reduced by $25,136 relating to the fund’s investment in Putnam Prime Money Market Fund. Income distributions earned by the fund are recorded as income in the statement of operations and totaled $1,030,855 for the year ended November 30, 2006. During the year ended November 30, 2006, cost of purchases and proceeds of sales of investments in Putnam Prime Money Market Fund aggregated $584,709,869 and $569,866,252, respectively.
36
Note 6: Regulatory matters and litigation
In late 2003 and 2004, Putnam Management settled charges brought by the Securities and Exchange Commission (“SEC”) and the Massachusetts Securities Division (“MSD”) in connection with excessive short-term trading by certain former Putnam employees and, in the case of charges brought by the MSD, excessive short-term trading by participants in some Putnam-administered 401(k) plans. Putnam Management agreed to pay $193.5 million in penalties and restitution, of which $153.5 million will be distributed to certain open-end Putnam funds and their shareholders after the SEC and MSD approve a distribution plan being developed by an independent consultant. The allegations of the SEC and MSD and related matters have served as the general basis for certain lawsuits, including purported class action lawsuits filed against Putnam Management and, in a limited number of cases, against some Putnam funds. Putnam Management believes that these lawsuits will have n o material adverse effect on the funds or on Putnam Management’s ability to provide investment management services. In addition, Putnam Management has agreed to bear any costs incurred by the Putnam funds as a result of these matters.
Pursuant to a settlement with the SEC relating to Putnam Management’s brokerage allocation practices, on October 13, 2005 the fund received $434,247 in proceeds paid by Putnam Management.
In connection with a settlement between Putnam and the fund’s Trustees in September 2006, the fund received $823,087 from Putnam to address issues relating to the calculation of certain amounts paid by the Putnam mutual funds to Putnam for transfer agent services. This amount is included in Fees waived and reimbursed by Manager or affiliate on the Statement of operations.
Putnam Management and Putnam Retail Management are named as defendants in a civil suit in which the plaintiffs allege that the management and distribution fees paid by certain Putnam funds were excessive and seek recovery under the Investment Company Act of 1940. Putnam Management and Putnam Retail Management have contested the plaintiffs’ claims and the matter is currently pending in the U.S. District Court for the District of Massachusetts. Based on currently available information, Putnam Management believes that this action is without merit and that it is unlikely to have a material effect on Putnam Management’s and Putnam Retail Management’s ability to provide services to their clients, including the fund.
Note 7: New accounting pronouncements
In June 2006, the Financial Accounting Standards Board (“FASB”) issued Interpretation No. 48, Accounting for Uncertainty in Income Taxes (the “Interpretation”). The Interpretation prescribes a minimum threshold for financial statement recognition of the benefit of a tax position taken or expected to be taken by a filer in the filer’s tax return. The Interpretation will become effective for fiscal years beginning after December 15, 2006 but will also apply to tax positions reflected in the fund’s financial statements as of that date. No determination has been made whether the adoption of the Interpretation will require the fund to make any adjustments to its net assets or have any other effect on the fund’s financial statements. In September 2006, the FASB issued Statement of Financial Accounting Standards No. 157, Fair Value Measurements (the “Standard”). The Standard defines fair value, sets out a framework for measuring fair value and requires additional disclosures about fair value measurements. The Standard applies to fair value measurements already required or permitted by existing standards. The Standard is effective for financial statements issued for fiscal years beginning after November 15, 2007 and interim periods within those fiscal years. Putnam Management is currently evaluating what impact the adoption of the Standard will have on the fund’s financial statements.
37
Federal tax information and brokerage commissions (Unaudited)
Federal tax information
Pursuant to Section 852 of the Internal Revenue Code, as amended, the fund hereby designates $365,410,279 as long term capital gain, for its taxable year ended November 30, 2006.
The fund designated 64.62% of ordinary income distributions as qualifying for the dividends received deduction for corporations.
For its tax year ended November 30, 2006, the fund hereby designates 70.09%, or the maximum amount allowable, of its taxable ordinary income distributions as qualified dividends taxed at the individual net capital gain rates.
The Form 1099 you receive in January 2007 will show the tax status of all distributions paid to your account in calendar 2006.
Brokerage commissions
Brokerage commissions are paid to firms that execute trades on behalf of your fund. When choosing these firms, Putnam is required by law to seek the best execution of the trades, taking all relevant factors into consideration, including expected quality of execution and commission rate. Listed below are the largest relationships based upon brokerage commissions for your fund and the other funds in Putnam’s Large-Cap Value group for the year ended November 30, 2006. The other Putnam mutual funds in this group are The George Putnam Fund of Boston, Putnam Classic Equity Fund, Putnam Convertible Income-Growth Trust, Putnam Equity Income Fund, The Putnam Fund for Growth and Income, Putnam New Value Fund, Putnam VT Equity Income Fund, Putnam VT The George Putnam Fund of Boston, Putnam VT Growth and Income Fund, and Putnam VT New Value Fund.
The top five firms that received brokerage commissions for trades executed for the Large-Cap Value group are (in descending order) Goldman Sachs, Citigroup Global Markets, Merrill Lynch, UBS Warburg, and Deutsche Bank Securities. Commissions paid to these firms together represented approximately 47% of the total brokerage commissions paid for the year ended November 30, 2006.
Commissions paid to the next 10 firms together represented approximately 35% of the total brokerage commissions paid during the period. These firms are (in alphabetical order) Bank of America, Bear Stearns & Company, Credit Suisse First Boston, JPMorgan Clearing, Lazard Freres & Co., Lehman Brothers, Morgan Stanley Dean Witter, RBC Capital Markets, Sanford Bernstein, and Wachovia Securities.
Additional information about brokerage commissions is available on the Securities and Exchange Commission (SEC) Web site at www.sec.gov. Putnam funds disclose commissions by firm to the SEC in semiannual filings on Form N-SAR.
38
About the Trustees
Jameson A. Baxter (Born 1943), Trustee since 1994, Vice Chairman since 2005
Ms. Baxter is the President of Baxter Associates, Inc., a private investment firm that she founded in 1986.
Ms. Baxter serves as a Director of ASHTA Chemicals, Inc., Banta Corporation (a printing and digital imaging firm), Ryerson Tull, Inc. (a steel service corporation), the Mutual Fund Directors Forum, Advocate Health Care and BoardSource, formerly the National Center for Nonprofit Boards. She is Chairman Emeritus of the Board of Trustees, Mount Holyoke College, having served as Chairman for five years and as a board member for thirteen years. Until 2002, Ms. Baxter was a Director of Intermatic Corporation (a manufacturer of energy control products).
Ms. Baxter has held various positions in investment banking and corporate finance, including Vice President and Principal of the Regency Group, and Vice President of and Consultant to First Boston Corporation. She is a graduate of Mount Holyoke College.
Charles B. Curtis (Born 1940), Trustee since 2001
Mr. Curtis is President and Chief Operating Officer of the Nuclear Threat Initiative (a private foundation dealing with national security issues) and serves as Senior Advisor to the United Nations Foundation.
Mr. Curtis is a member of the Council on Foreign Relations and the Trustee Advisory Council of the Applied Physics Laboratory, Johns Hopkins University. Until 2003, Mr. Curtis was a member of the Electric Power Research Institute Advisory Council and the University of Chicago Board of Governors for Argonne National Laboratory. Prior to 2002, Mr. Curtis was a Member of the Board of Directors of the Gas Technology Institute and the Board of Directors of the Environment and Natural Resources Program Steering Committee, John F. Kennedy School of Government, Harvard University. Until 2001, Mr. Curtis was a member of the Department of Defense Policy Board and Director of EG&G Technical Services, Inc. (a fossil energy research and development support company).
From August 1997 to December 1999, Mr. Curtis was a Partner at Hogan & Hartson L.L.P., a Washington, D.C. law firm. Prior to May 1997, Mr. Curtis was Deputy Secretary of Energy and Under Secretary of the U.S. Department of Energy. He served as Chairman of the Federal Energy Regulatory Commission from 1977 to 1981 and has held positions on the staff of the U.S. House of Representatives, the U.S. Treasury Department, and the SEC.
Myra R. Drucker (Born 1948), Trustee since 2004
Ms. Drucker is Chair of the Board of Trustees of Commonfund (a not-for-profit firm specializing in asset management for educational endowments and foundations), Vice Chair of the Board of Trustees of Sarah Lawrence College, and a member of the Investment Committee of the Kresge Foundation (a charitable trust). She is also a director of New York Stock Exchange LLC, a wholly-owned subsidiary of the publicly-traded NYSE Group, Inc., a director of Interactive Data Corporation (a provider of financial market data, analytics, and related services to financial institutions and individual investors), and an advisor to RCM Capital Management (an investment management firm).
Ms. Drucker is an ex-officio member of the New York Stock Exchange (NYSE) Pension Managers Advisory Committee, having served as Chair for seven years and a member of the Executive Committee of the Committee on Investment of Employee Benefit Assets.
Until August 31, 2004, Ms. Drucker was Managing Director and a member of the Board of Directors of General Motors Asset Management and Chief Investment Officer of General Motors Trust Bank. Ms. Drucker also served as a member of the NYSE Corporate Accountability and Listing Standards Committee and the NYSE/NASD IPO Advisory Committee.
Prior to joining General Motors Asset Management in 2001, Ms. Drucker held various executive positions in the investment management industry. Ms. Drucker served as Chief Investment Officer of Xerox Corporation (a technology and service company in the document industry), where she was responsible for the investment of the company’s pension assets. Ms. Drucker was also Staff Vice President and Director of Trust Investments for International Paper (a paper, paper distribution, packaging and forest products company) and previously served as Manager of Trust Investments for Xerox Corporation. Ms. Drucker received a B.A. degree in Literature and Psychology from Sarah Lawrence College and pursued graduate studies in economics, statistics and portfolio theory at Temple University.
John A. Hill (Born 1942), Trustee since 1985 and Chairman since 2000
Mr. Hill is Vice Chairman of First Reserve Corporation, a private equity buyout firm that specializes in energy investments in the diversified worldwide energy industry.
39
Mr. Hill is a Director of Devon Energy Corporation, TransMontaigne Oil Company and various private companies controlled by First Reserve Corporation, as well as Chairman of TH Lee, Putnam Investment Trust (a closed-end investment company advised by an affiliate of Putnam Management). He is also a Trustee of Sarah Lawrence College. Until 2005, he was a Director of Continuum Health Partners of New York.
Prior to acquiring First Reserve Corporation in 1983, Mr. Hill held executive positions in investment banking and investment management with several firms and with the federal government, including Deputy Associate Director of the Office of Management and Budget and Deputy Director of the Federal Energy Administration. He is active in various business associations, including the Economic Club of New York, and lectures on energy issues in the United States and Europe. Mr. Hill holds a B.A. degree in Economics from Southern Methodist University and pursued graduate studies there as a Woodrow Wilson Fellow.
Paul L. Joskow (Born 1947), Trustee since 1997
Dr. Joskow is the Elizabeth and James Killian Professor of Economics and Management, and Director of the Center for Energy and Environmental Policy Research at the Massachusetts Institute of Technology.
Dr. Joskow serves as a Director of National Grid plc (a UK-based holding company with interests in electric and gas transmission and distribution and telecommunications infrastructure) and TransCanada Corporation (an energy company focused on natural gas transmission and power services). He also serves on the Board of Overseers of the Boston Symphony Orchestra. Prior to February 2005, he served on the board of the Whitehead Institute for Biomedical Research (a non-profit research institution) and has been President of the Yale University Council since 1993. Prior to February 2002, he was a Director of State Farm Indemnity Company (an automobile insurance company), and, prior to March 2000, he was a Director of New England Electric System (a public utility holding company).
Dr. Joskow has published five books and numerous articles on topics in industrial organization, government regulation of industry, and competition policy. He is active in industry restructuring, environmental, energy, competition and privatization policies — serving as an advisor to governments and corporations worldwide. Dr. Joskow holds a Ph.D. and M. Phil from Yale University and a B.A. from Cornell University.
Elizabeth T. Kennan (Born 1938), Trustee since 1992
Dr. Kennan is a Partner of Cambus-Kenneth Farm (thoroughbred horse and cattle breeding). She is President Emeritus of Mount Holyoke College.
Dr. Kennan served as Chairman and is now Lead Director of Northeast Utilities. Until 2005, she was a Director of Talbots, Inc. She has served as Director on a number of other boards, including Bell Atlantic, Chastain Real Estate, Shawmut Bank, Berkshire Life Insurance and Kentucky Home Life Insurance. She is a Trustee of the National Trust for Historic Preservation, of Centre College and of Midway College in Midway, Kentucky. Until 2006, she was a member of The Trustees of Reservations. Dr. Kennan has served on the oversight committee of the Folger Shakespeare Library, as President of Five Colleges Incorporated, as a Trustee of Notre Dame University and is active in various educational and civic associations.
As a member of the faculty of Catholic University for twelve years, until 1978, Dr. Kennan directed the post-doctoral program in Patristic and Medieval Studies, taught history and published numerous articles. Dr. Kennan holds a Ph.D. from the University of Washington in Seattle, an M.S. from St. Hilda’s College at Oxford University and an A.B. from Mount Holyoke College. She holds several honorary doctorates.
Kenneth R. Leibler (Born 1949), Trustee since 2006
Mr. Leibler is founding Chairman of the Boston Options Exchange, the nation’s newest electronic marketplace for the trading of derivative securities.
Mr. Leibler currently serves as a Trustee of Beth Israel Deaconess Hospital in Boston. He is also lead director of Ruder Finn Group, a global communications and advertising firm. Since 2003, he has served as a director of the Optimum Funds group. Prior to October 2006, he served as a director of ISO New England, the organization responsible for the operation of the electric generation system in the New England states. Prior to 2000, Mr. Leibler was a director of the Investment Company Institute in Washington, D.C.
Prior to January 2005, Mr. Leibler served as Chairman and Chief Executive Officer of the Boston Stock Exchange. Prior to January 2000, he served as President and Chief Executive Officer of Liberty Financial Companies, a publicly traded diversified asset management organization. Prior to June 1990, he served as President and Chief Operating Officer of the American Stock Exchange, and is the youngest person in Exchange history to hold
40
the title of President. Prior to serving as Amex President, he held the position of Chief Financial Officer, and headed its management and marketing operations. Mr. Leibler graduated magna cum laude with a degree in economics from Syracuse University, where he was elected Phi Beta Kappa.
Robert E. Patterson (Born 1945), Trustee since 1984
Mr. Patterson is Senior Partner of Cabot Properties, L.P. and Chairman of Cabot Properties, Inc. (a private equity firm investing in commercial real estate).
Mr. Patterson serves as Chairman Emeritus and Trustee of the Joslin Diabetes Center and as a Director of Brandywine Trust Group, LLC. Prior to June 2003, he was a Trustee of Sea Education Association. Prior to December 2001, he was President and Trustee of Cabot Industrial Trust (a publicly traded real estate investment trust). Prior to February 1998, he was Executive Vice President and Director of Acquisitions of Cabot Partners Limited Partnership (a registered investment adviser involved in institutional real estate investments). Prior to 1990, he served as Executive Vice President of Cabot, Cabot & Forbes Realty Advisors, Inc. (the predecessor company of Cabot Partners).
Mr. Patterson practiced law and held various positions in state government and was the founding Executive Director of the Massachusetts Industrial Finance Agency. Mr. Patterson is a graduate of Harvard College and Harvard Law School.
W. Thomas Stephens (Born 1942), Trustee since 1997
Mr. Stephens is Chairman and Chief Executive Officer of Boise Cascade, L.L.C. (a paper, forest products and timberland assets company).
Until 2005, Mr. Stephens was a director of TransCanadaPipelines, Ltd. Until 2004, Mr. Stephens was a Director of Xcel Energy Incorporated (a public utility company), Qwest Communications, and Norske Canada, Inc. (a paper manufacturer). Until 2003, Mr. Stephens was a Director of Mail-Well, Inc. (a diversified printing company). He served as Chairman of Mail-Well until 2001 and as CEO of MacMillan-Bloedel, Ltd. (a forest products company) until 1999.
Prior to 1996, Mr. Stephens was Chairman and Chief Executive Officer of Johns Manville Corporation. He holds B.S. and M.S. degrees from the University of Arkansas.
Richard B. Worley (Born 1945), Trustee since 2004
Mr. Worley is Managing Partner of Permit Capital LLC, an investment management firm.
Mr. Worley serves on the Executive Committee of the University of Pennsylvania Medical Center, is a Trustee of The Robert Wood Johnson Foundation (a philanthropic organization devoted to health care issues) and is a Director of The Colonial Williamsburg Foundation (a historical preservation organization). Mr. Worley also serves on the investment committees of Mount Holyoke College and World Wildlife Fund (a wildlife conservation organization).
Prior to joining Permit Capital LLC in 2002, Mr. Worley served as Chief Strategic Officer of Morgan Stanley Investment Management. He previously served as President, Chief Executive Officer and Chief Investment Officer of Morgan Stanley Dean Witter Investment Management and as a Managing Director of Morgan Stanley, a financial services firm. Mr. Worley also was the Chairman of Miller Anderson & Sherrerd, an investment management firm.
Mr. Worley holds a B.S. degree from University of Tennessee and pursued graduate studies in economics at the University of Texas.
Charles E. Haldeman, Jr.* (Born 1948), Trustee since 2004
Mr. Haldeman is President and Chief Executive Officer of Putnam, LLC (“Putnam Investments”). He is a member of Putnam Investments’ Executive Board of Directors and Advisory Council. Prior to November 2003, Mr. Haldeman served as Co-Head of Putnam Investments’ Investment Division.
Prior to joining Putnam Investments in 2002, Mr. Haldeman held executive positions in the investment management industry. He previously served as Chief Executive Officer of Delaware Investments and President & Chief Operating Officer of United Asset Management. Mr. Haldeman was also a partner and director of Cooke & Bieler, Inc. (an investment management firm).
Mr. Haldeman currently serves on the Board of Governors of the Investment Company Institute and as a Trustee of Dartmouth College, and he is a member of the Partners HealthCare Systems Investment Committee. He is a graduate of Dartmouth College, Harvard Law School and Harvard Business School. Mr. Haldeman is also a Chartered Financial Analyst (CFA) charterholder.
41
George Putnam, III* (Born 1951), Trustee since 1984 and President since 2000
Mr. Putnam is President of New Generation Research, Inc.(a publisher of financial advisory and other research services), and of New Generation Advisers, Inc. (a registered investment advisor to private funds). Mr. Putnam founded the New Generation companies in 1986.
Mr. Putnam is a Director of The Boston Family Office, LLC (a registered investment adviser). He is a Trustee of St. Mark’s School and Shore Country Day School, and until 2002 was a Trustee of the Sea Education Association.
Mr. Putnam previously worked as an attorney with the law firm of Dechert LLP (formerly known as Dechert Price & Rhoads) in Philadelphia. He is a graduate of Harvard College, Harvard Business School and Harvard Law School.
The address of each Trustee is One Post Office Square, Boston, MA 02109.
As of November 30, 2006, there were 107 Putnam Funds. All Trustees serve as Trustees of all Putnam funds. Each Trustee serves for an indefinite term, until his or her resignation, retirement at age 72, death, or removal.
* Trustees who are or may be deemed to be “interested persons” (as defined in the Investment Company Act of 1940) of the fund, Putnam Management, Putnam Retail Management, or Marsh & McLennan Companies, Inc., the parent company of Putnam, LLC and its affiliated companies. Messrs. Haldeman and Putnam, III are deemed “interested persons” by virtue of their positions as officers of the fund, Putnam Management or Putnam Retail Management and as shareholders of Marsh & McLennan Companies, Inc. Mr. Putnam, III is the President of your fund and each of the other Putnam funds. Mr. Haldeman is President and Chief Executive Officer of Putnam Investments.
42
Officers
In addition to George Putnam, III, the other officers of the fund are shown below:
Charles E. Porter (Born 1938)
Executive Vice President, Principal Executive Officer, Associate
Treasurer, and Compliance Liaison
Since 1989
Jonathan S. Horwitz (Born 1955)
Senior Vice President and Treasurer
Since 2004
Prior to 2004, Managing Director,
Putnam Investments
Steven D. Krichmar (Born 1958)
Vice President and Principal Financial Officer
Since 2002
Senior Managing Director, Putnam Investments
Janet C. Smith (Born 1965)
Vice President, Principal Accounting Officer and Assistant Treasurer
Since 2007
Managing Director, Putnam Investments and Putnam Management
Susan G. Malloy (Born 1957)
Vice President and Assistant Treasurer
Since 2007
Managing Director, Putnam Investments
Beth S. Mazor (Born 1958)
Vice President
Since 2002
Managing Director, Putnam Investments
James P. Pappas (Born 1953)
Vice President
Since 2004
Managing Director, Putnam Investments and Putnam Management.
During 2002, Chief Operating Officer, Atalanta/Sosnoff
Management Corporation
Richard S. Robie, III (Born 1960)
Vice President
Since 2004
Senior Managing Director, Putnam Investments, Putnam Management
and Putnam Retail Management. Prior to 2003, Senior Vice President,
United Asset Management Corporation
Francis J. McNamara, III (Born 1955)
Vice President and Chief Legal Officer
Since 2004
Senior Managing Director, Putnam Investments, Putnam Management
and Putnam Retail Management. Prior to 2004, General Counsel,
State Street Research & Management Company
Charles A. Ruys de Perez (Born 1957)
Vice President and Chief Compliance Officer
Since 2004
Managing Director, Putnam Investments
Mark C. Trenchard (Born 1962)
Vice President and BSA Compliance Officer
Since 2002
Managing Director, Putnam Investments
Judith Cohen (Born 1945)
Vice President, Clerk and Assistant Treasurer
Since 1993
Wanda M. McManus (Born 1947)
Vice President, Senior Associate Treasurer and Assistant Clerk
Since 2005
Nancy E. Florek (Born 1957)
Vice President, Assistant Clerk, Assistant Treasurer
and Proxy Manager
Since 2005
The address of each Officer is One Post Office Square, Boston, MA 02109.
43
The Putnam Family of Funds
The following is a list of Putnam’s open-end mutual funds offered to the public. Investors should carefully consider the investment objective, risks, charges, and expenses of a fund before investing. For a prospectus containing this and other information for any Putnam fund or product, call your financial advisor at 1-800-225-1581 and ask for a prospectus. Please read the prospectus carefully before investing.
Growth funds
Discovery Growth Fund
Growth Opportunities Fund
Health Sciences Trust
International New Opportunities Fund*
New Opportunities Fund
OTC & Emerging Growth Fund
Small Cap Growth Fund*
Vista Fund
Voyager Fund
Blend funds
Capital Appreciation Fund
Capital Opportunities Fund*
Europe Equity Fund*
Global Equity Fund*
Global Natural Resources Fund*
International Capital Opportunities Fund*
International Equity Fund*
Investors Fund
Research Fund
Tax Smart Equity Fund®
Utilities Growth and Income Fund
Value funds
Classic Equity Fund
Convertible Income-Growth Trust
Equity Income Fund
The George Putnam Fund of Boston
The Putnam Fund for Growth and Income
International Growth and Income Fund*
Mid Cap Value Fund
New Value Fund
Small Cap Value Fund*†
Income funds
American Government Income Fund
Diversified Income Trust
Floating Rate Income Fund
Global Income Trust*
High Yield Advantage Fund*†
High Yield Trust*
Income Fund
Limited Duration Government Income Fund
Money Market Fund‡
U.S. Government Income Trust
Tax-free income funds
AMT-Free Insured Municipal Fund
Tax Exempt Income Fund
Tax Exempt Money Market Fund§
Tax-Free High Yield Fund
State tax-free income funds:
Arizona, California, Florida, Massachusetts, Michigan, Minnesota, New Jersey, New York, Ohio, and Pennsylvania
Asset allocation funds
Income Strategies Fund
Putnam Asset Allocation Funds — three investment portfolios that spread your money across a variety of stocks, bonds, and money market investments.
The three portfolios:
Asset Allocation: Balanced Portfolio
Asset Allocation: Conservative Portfolio
Asset Allocation: Growth Portfolio
Putnam RetirementReady® Funds
Putnam RetirementReady Funds — ten investment portfolios that offer diversification among stocks, bonds, and money market instruments and adjust to become more conservative over time based on a target date for withdrawing assets.
The ten funds:
Putnam RetirementReady 2050 Fund
Putnam RetirementReady 2045 Fund
Putnam RetirementReady 2040 Fund
Putnam RetirementReady 2035 Fund
Putnam RetirementReady 2030 Fund
Putnam RetirementReady 2025 Fund
Putnam RetirementReady 2020 Fund
Putnam RetirementReady 2015 Fund
Putnam RetirementReady 2010 Fund
Putnam RetirementReady Maturity Fund
* A 1% redemption fee on total assets redeemed or exchanged within 90 days of purchase may be imposed for all share classes of these funds.
† Closed to new investors.
‡ An investment in a money market fund is not insured or guaranteed by the Federal Deposit Insurance Corporation or any other government agency. Although the fund seeks to preserve your investment at $1.00 per share, it is possible to lose money by investing in the fund.
With the exception of money market funds, a 1% redemption fee may be applied to shares exchanged or sold within 7 days of purchase (90 days, for certain funds).
Check your account balances and the most recent month-end performance at www.putnam.com.
44
Fund information
Founded over 65 years ago, Putnam Investments was built around the concept that a balance between risk and reward is the hallmark of a well-rounded financial program. We manage over 100 mutual funds in growth, value, blend, fixed income, and international.
| Investment Manager | Officers | Mark C. Trenchard |
| Putnam Investment | George Putnam, III | Vice President and BSA Compliance Officer |
| Management, LLC | ||
| One Post Office Square | President | Judith Cohen |
| Boston, MA 02109 | Charles E. Porter | Vice President, Clerk and Assistant Treasurer |
| Executive Vice President, Principal | ||
| Marketing Services | Executive Officer, Associate Treasurer | Wanda M. McManus |
| Putnam Retail Management | and Compliance Liaison | Vice President, Senior Associate Treasurer |
| One Post Office Square | and Assistant Clerk | |
| Boston, MA 02109 | Jonathan S. Horwitz | |
| Senior Vice President and Treasurer | Nancy E. Florek | |
| Custodians | Vice President, Assistant Clerk, | |
| Putnam Fiduciary Trust Company, | Steven D. Krichmar | Assistant Treasurer and Proxy Manager |
| State Street Bank and Trust Company | Vice President and Principal Financial Officer | |
| Legal Counsel | Janet C. Smith | |
| Ropes & Gray LLP | Vice President, Principal Accounting Officer | |
| and Assistant Treasurer | ||
| Independent Registered Public | ||
| Accounting Firm | Susan G. Malloy | |
| KPMG LLP | Vice President and Assistant Treasurer | |
| Trustees | Beth S. Mazor | |
| John A. Hill, Chairman | Vice President | |
| Jameson Adkins Baxter, Vice Chairman | ||
| Charles B. Curtis | James P. Pappas | |
| Myra R. Drucker | Vice President | |
| Charles E. Haldeman, Jr. | ||
| Paul L. Joskow | Richard S. Robie, III | |
| Elizabeth T. Kennan | Vice President | |
| Kenneth R. Leibler | ||
| Robert E. Patterson | Francis J. McNamara, III | |
| George Putnam, III | Vice President and Chief Legal Officer | |
| W. Thomas Stephens | ||
| Richard B. Worley | Charles A. Ruys de Perez | |
| Vice President and Chief Compliance Officer |
This report is for the information of shareholders of Putnam Equity Income Fund. It may also be used as sales literature when preceded or accompanied by the current prospectus, the most recent copy of Putnam’s Quarterly Performance Summary, and Putnam’s Quarterly Ranking Summary. For more recent performance, please visit www.putnam.com. Investors should carefully consider the investment objective, risks, charges, and expenses of a fund, which are described in its prospectus. For this and other information or to request a prospectus, call 1-800-225-1581 toll free. Please read the prospectus carefully before investing. The fund’s Statement of Additional Information contains additional information about the fund’s Trustees and is available without charge upon request by calling 1-800-225-1581.

Item 2. Code of Ethics:
(a) The fund’s principal executive, financial and accounting officers are employees of Putnam Investment Management, LLC, the Fund's investment manager. As such they are subject to a comprehensive Code of Ethics adopted and administered by Putnam Investments which is designed to protect the interests of the firm and its clients. The Fund has adopted a Code of Ethics which incorporates the Code of Ethics of Putnam Investments with respect to all of its officers and Trustees who are employees of Putnam Investment Management, LLC. For this reason, the Fund has not adopted a separate code of ethics governing its principal executive, financial and accounting officers.
(c) None
Item 3. Audit Committee Financial Expert:
The Funds' Audit and Compliance Committee is comprised solely of Trustees who are "independent" (as such term has been defined by the Securities and Exchange Commission ("SEC") in regulations implementing Section 407 of the Sarbanes-Oxley Act (the "Regulations")). The Trustees believe that each of the members of the Audit and Compliance Committee also possess a combination of knowledge and experience with respect to financial accounting matters, as well as other attributes, that qualify them for service on the Committee. In addition, the Trustees have determined that each of Mr. Patterson, Mr. Stephens, Mr. Leibler and Mr. Hill meets the financial literacy requirements of the New York Stock Exchange's rules and qualifies as an "audit committee financial expert" (as such term has been defined by the Regulations) based on their review of his pertinent experience and education. Certain other Trustees, although not on the Audit and Compliance Committee, would also quali fy as "audit committee financial experts." The SEC has stated that the designation or identification of a person as an audit committee financial expert pursuant to this Item 3 of Form N-CSR does not impose on such person any duties, obligations or liability that are greater than the duties, obligations and liability imposed on such person as a member of the Audit and Compliance Committee and the Board of Trustees in the absence of such designation or identification.
Item 4. Principal Accountant Fees and Services:
The following table presents fees billed in each of the last two fiscal years for services rendered to the fund by the fund’s independent auditor:
| Fiscal | Audit- | |||
| year | Audit | Related | Tax | All Other |
| ended | Fees | Fees | Fees | Fees |
| November 30, 2006 | $71,824* | $-- | $3,050 | $2,338 |
| November 30, 2005 | $31,578 | $-- | $2,778 | $ - |
* Includes fees of $34,174 billed by the fund’s independent auditor to the fund for audit procedures necessitated by regulatory and litigation matters for the fiscal year ended November 30, 2006. These fees were reimbursed to the fund by Putnam Investment Management, LLC (“Putnam Management”).
For the fiscal years ended November 30, 2006 and November 30, 2005, the fund’s independent auditor billed aggregate non-audit fees in the amounts of $5,388 and $ 2,778 respectively, to the fund, Putnam Management and any entity controlling, controlled by or under common control with Putnam Management that provides ongoing services to the fund.
Audit Fees represent fees billed for the fund’s last two fiscal years.
Audit-Related Fees represent fees billed in the fund’s last two fiscal years for services traditionally performed by the fund’s auditor, including accounting consultation for proposed transactions or concerning financial accounting and reporting standards and other audit or attest services not required by statute or regulation.
Tax Fees represent fees billed in the fund’s last two fiscal years for tax compliance, tax planning and tax advice services. Tax planning and tax advice services include assistance with tax audits, employee benefit plans and requests for rulings or technical advice from taxing authorities.
All Other Fees represent fees billed for for services relating to expense allocation methodology.
Pre-Approval Policies of the Audit and Compliance Committee. The Audit and Compliance Committee of the Putnam funds has determined that, as a matter of policy, all work performed for the funds by the funds’ independent auditors will be pre-approved by the Committee itself and thus will generally not be subject to pre-approval procedures.
The Audit and Compliance Committee also has adopted a policy to pre-approve the engagement by Putnam Management and certain of its affiliates of the funds’ independent auditors, even in circumstances where pre-approval is not required by applicable law. Any such requests by Putnam Management or certain of its affiliates are typically submitted in writing to the Committee and explain, among other things, the nature of the proposed engagement, the estimated fees, and why this work should be performed by that particular audit firm as opposed to another one. In reviewing such requests, the Committee considers, among other things, whether the provision of such services by the audit firm are compatible with the independence of the audit firm.
The following table presents fees billed by the fund’s independent auditor for services required to be approved pursuant to paragraph (c)(7)(ii) of Rule 2-01 of Regulation S-X.
| Fiscal | Audit- | All | Total | |
| year | Related | Tax | Other | Non-Audit |
| ended | Fees | Fees | Fees | Fees |
| November 30, | ||||
| 2006 | $ - | $ - | $ - | $ - |
| November | ||||
| 30, 2005 | $ - | $ - | $ - | $ - |
Item 5. Audit Committee of Listed Registrants
Not applicable
Item 6. Schedule of Investments:
The registrant’s schedule of investments in unaffiliated issuers is included in the report to shareholders in Item 1 above.
Item 7. Disclosure of Proxy Voting Policies and Procedures For Closed-End Management Investment Companies:
Not applicable
Item 8. Portfolio Managers of Closed-End Investment Companies
Not Applicable
Item 9. Purchases of Equity Securities by Closed-End Management Investment Companies and Affiliated Purchasers:
Not applicable
Item 10. Submission of Matters to a Vote of Security Holders:
Not applicable
Item 11. Controls and Procedures:
(a) The registrant's principal executive officer and principal financial officer have concluded, based on their evaluation of the effectiveness of the design and operation of the registrant's disclosure controls and procedures as of a date within 90 days of the filing date of this report, that the design and operation of such procedures are generally effective to provide reasonable assurance that information required to be disclosed by the registrant in this report is recorded, processed, summarized and reported within the time periods specified in the Commission's rules and forms.
(b) Changes in internal control over financial reporting: Not applicable
Item 12. Exhibits:
(a)(1) The Code of Ethics of The Putnam Funds, which incorporates the Code of Ethics of Putnam Investments, is filed herewith.
(a)(2) Separate certifications for the principal executive officer and principal financial officer of the registrant as required by Rule 30a-2(a) under the Investment Company Act of 1940, as amended, are filed herewith.
(b) The certifications required by Rule 30a-2(b) under the Investment Company Act of 1940, as amended, are filed herewith.
SIGNATURES
Pursuant to the requirements of the Securities Exchange Act of 1934 and the Investment Company Act of 1940, the registrant has duly caused this report to be signed on its behalf by the undersigned, thereunto duly authorized.
Putnam Equity Income Fund
By (Signature and Title):
/s/Janet C. Smith
Janet C. Smith
Principal Accounting Officer
Date: January 26, 2007
Pursuant to the requirements of the Securities Exchange Act of 1934 and the Investment Company Act of 1940, this report has been signed below by the following persons on behalf of the registrant and in the capacities and on the dates indicated.
By (Signature and Title):
/s/Charles E. Porter
Charles E. Porter
Principal Executive Officer
Date: January 26, 2007
By (Signature and Title):
/s/Steven D. Krichmar
Steven D. Krichmar
Principal Financial Officer
Date: January 26, 2007